HP Omen 17t (i7-8750H, GTX 1070) Laptop Review

When you think of powerful gaming laptops, what names come to mind? Brands like Asus, MSI, and Alienware dominate this space. While HP is a big player in other notebook markets, they've struggled to gain traction in the high-end gaming segment. That may change with the Omen 17t.
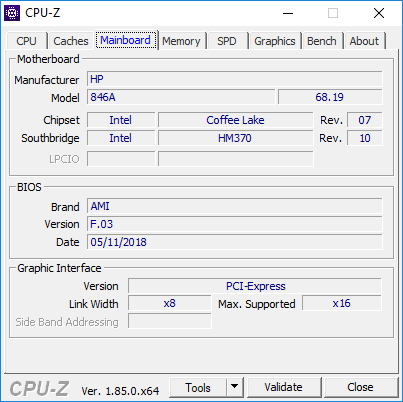
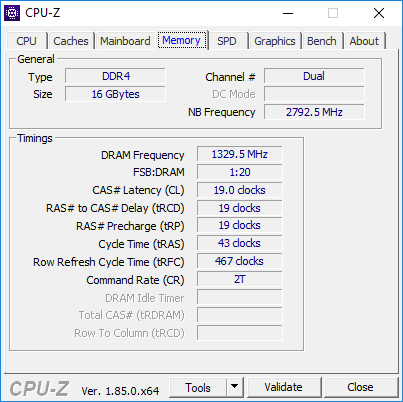
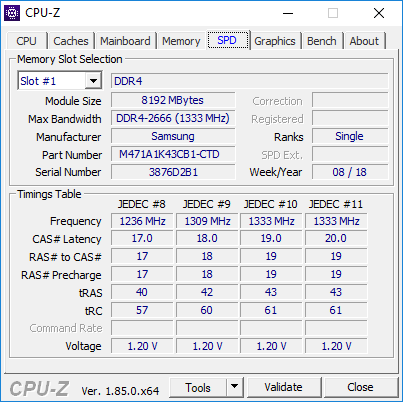
We've seen a few Omen machines in the past, and they usually compete well. However, the brand isn't known for bringing anything new to the table. Rather, HP's gaming line seems more reactive than proactive, choosing to pick up features introduced by other brands. The Omen 17t is no different in that regard, but instead of merely reflecting its competition, the laptop feels like more a refinement of trends we've seen in gaming laptops over the past year. The result is a machine that strikes a good balance in terms of performance, features, heat management, and noise output. To top it off, the Omen 17t is priced aggressively, starting at USD $1530 from Computer Upgrade King. Our review unit is configured with a 512 GB boot SSD and 16 GB of RAM, bringing the price to $1750.
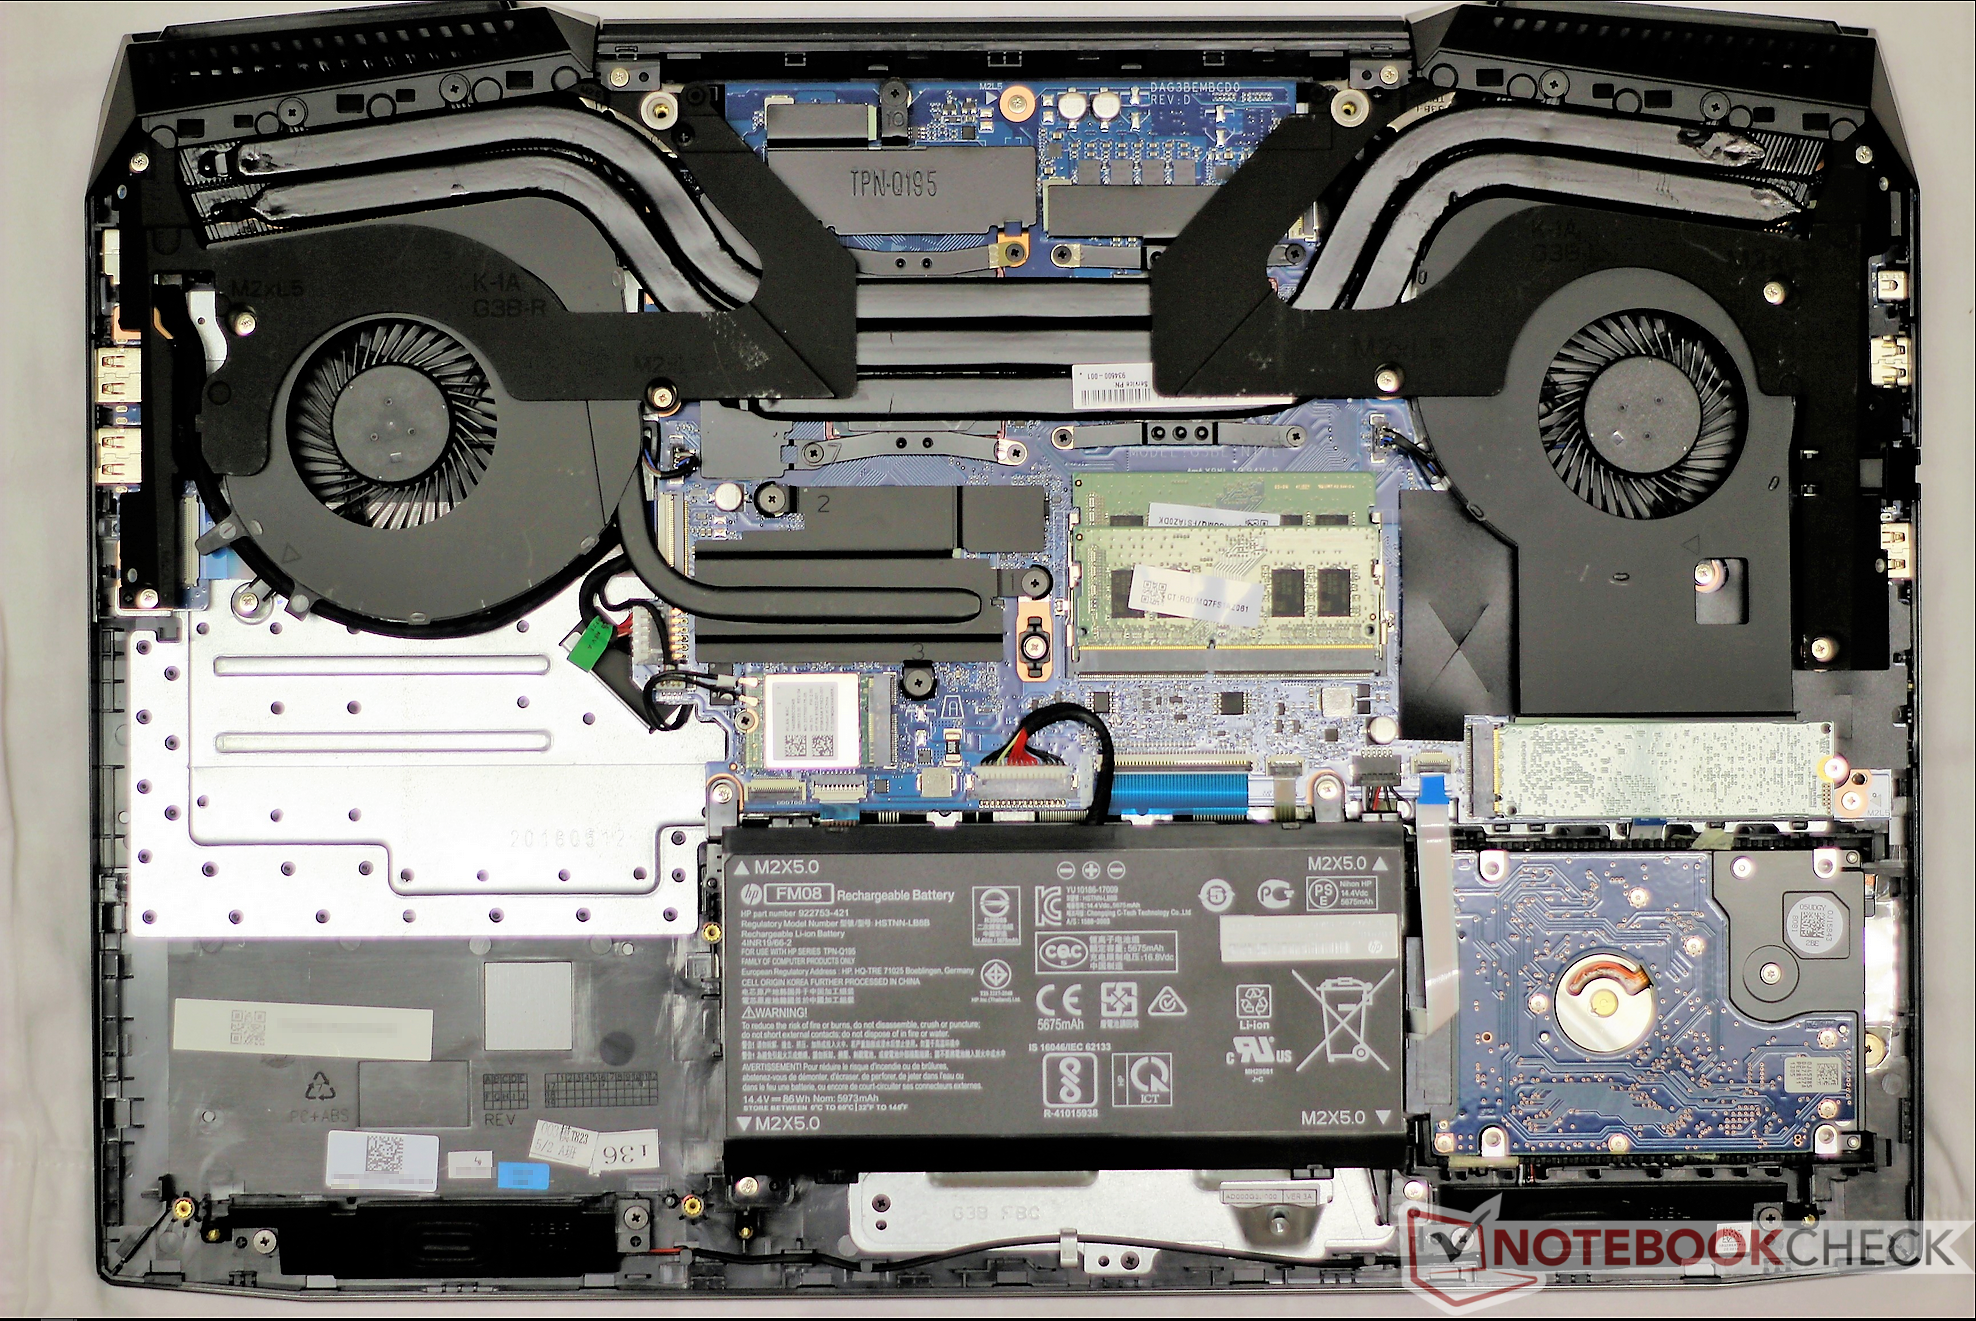
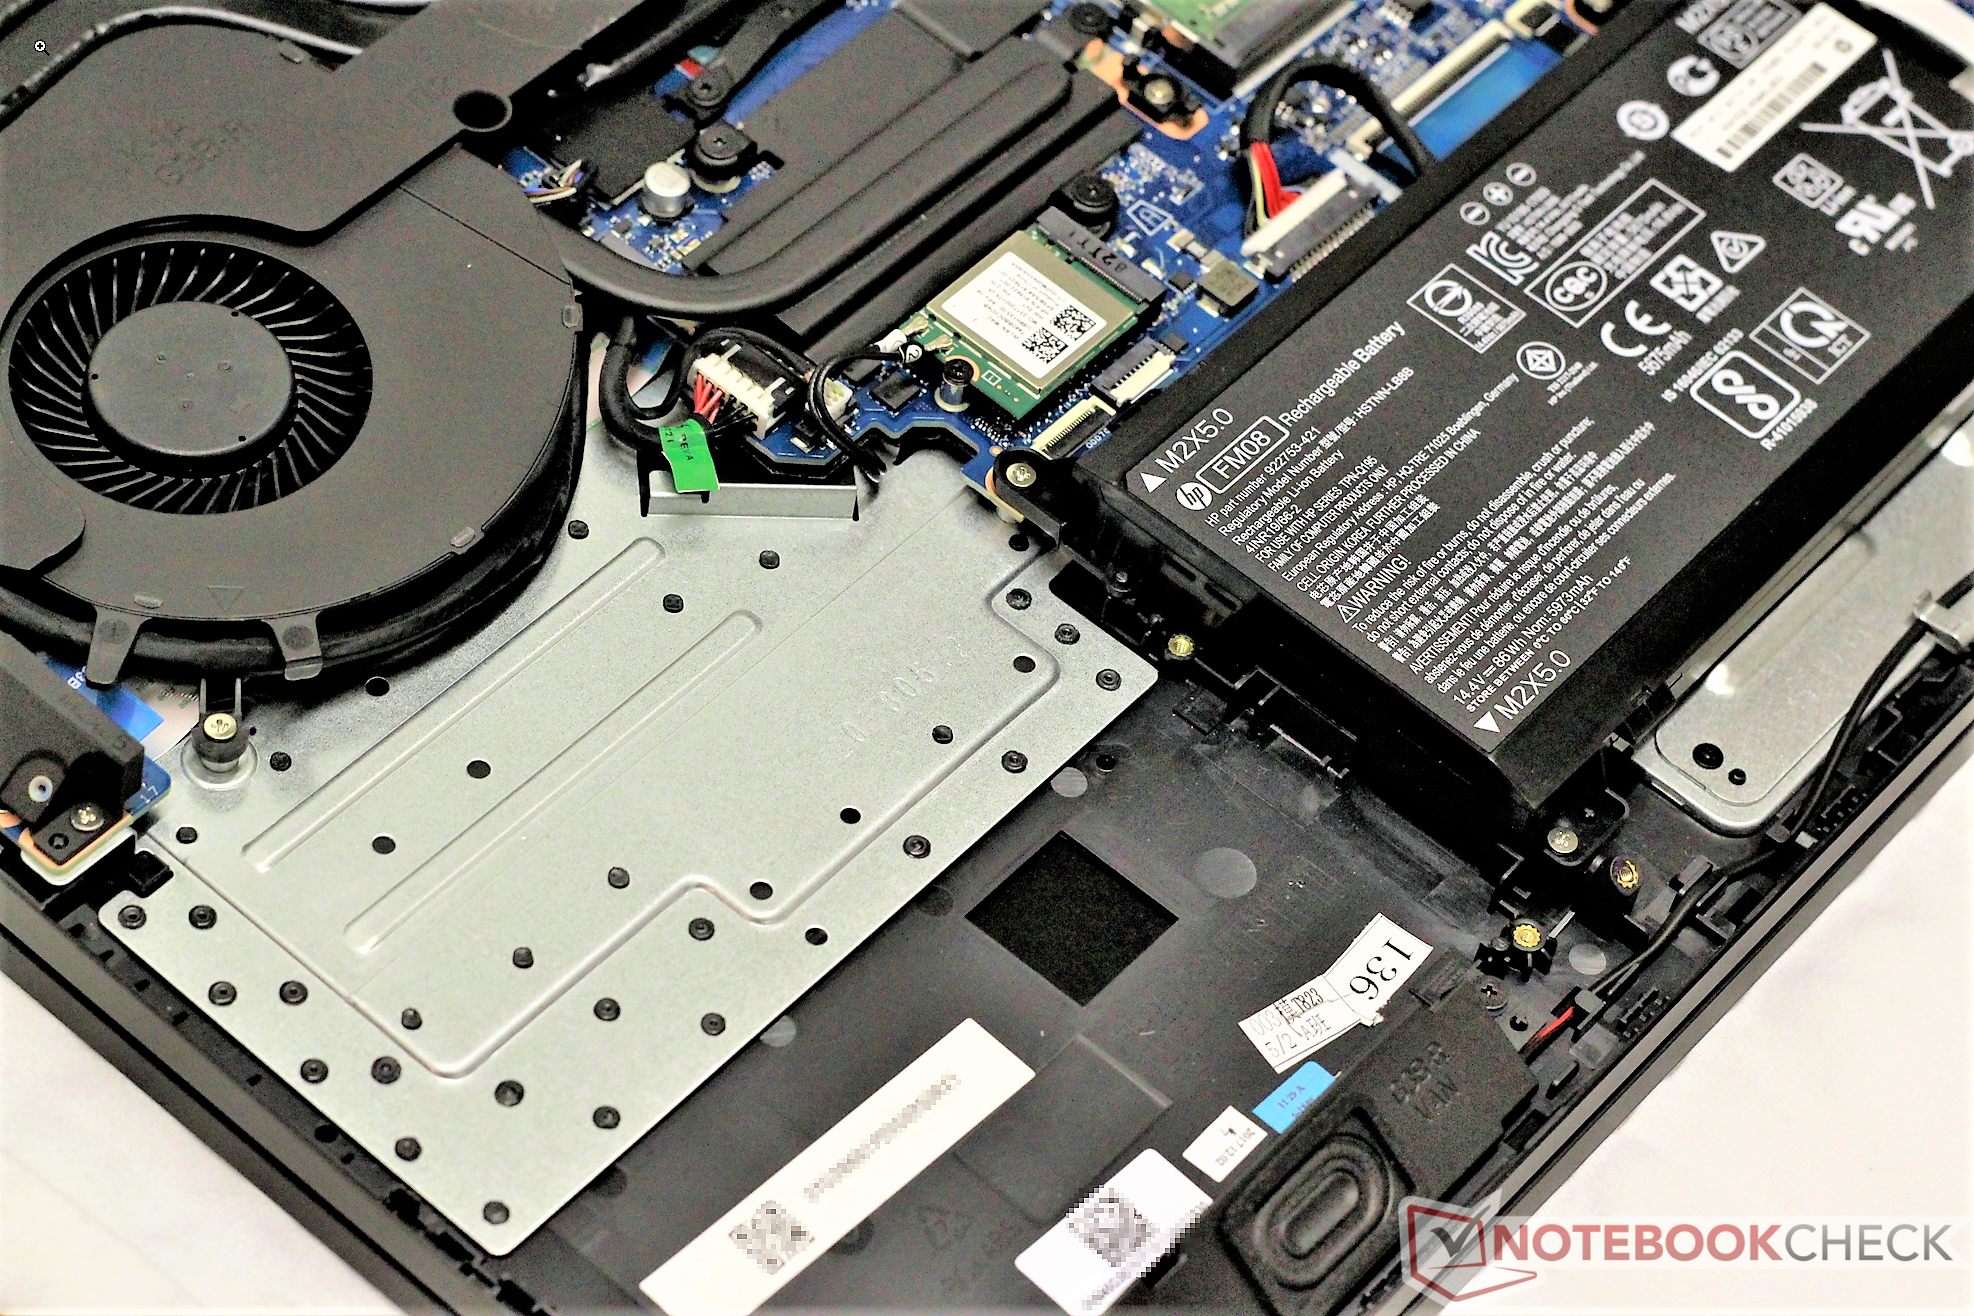
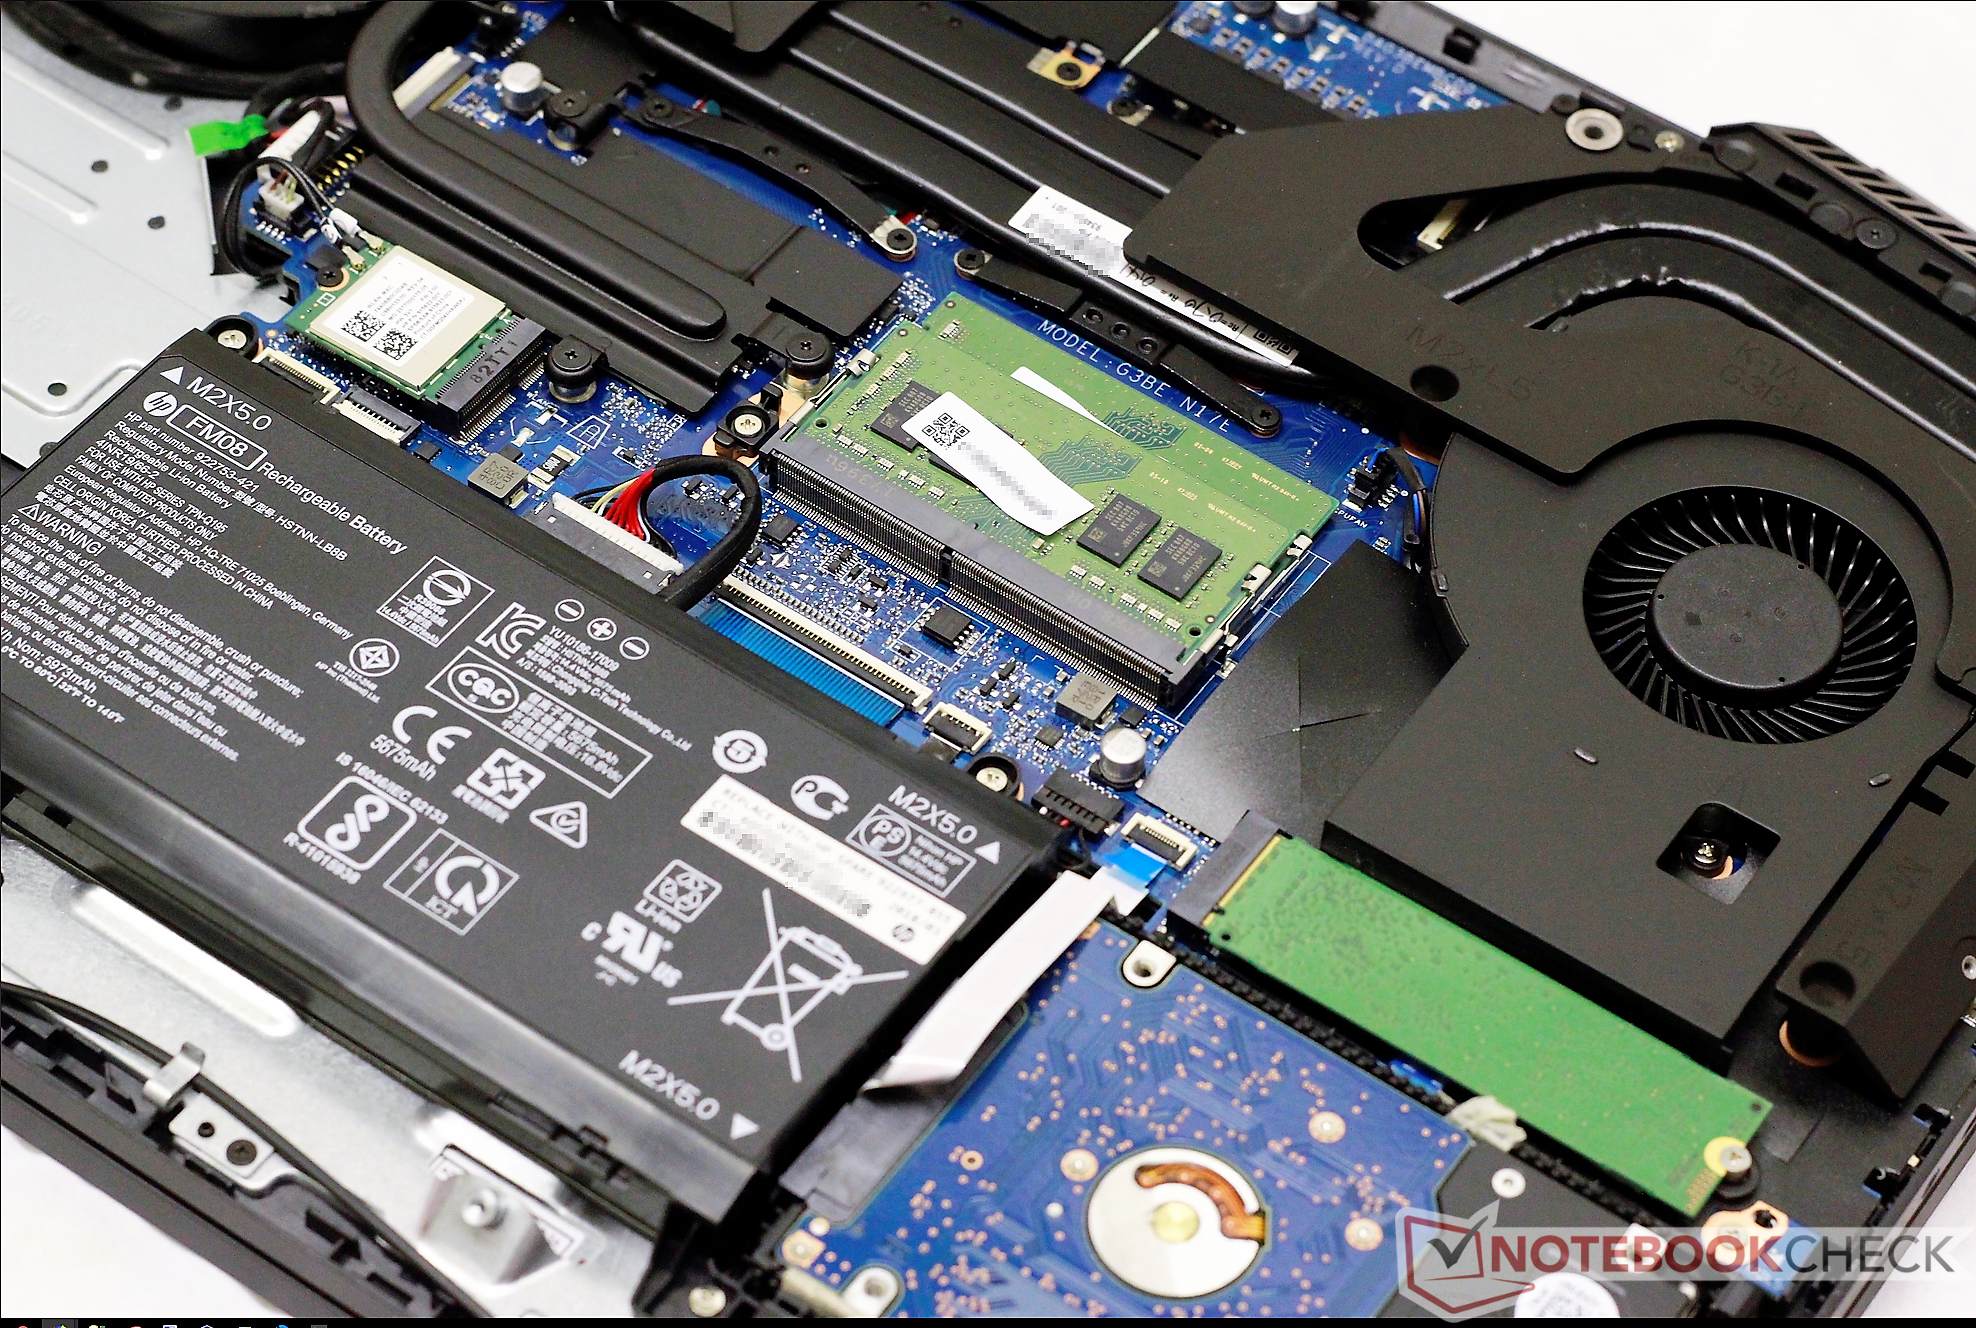
The HP Omen 17t has the same chassis as the HP Omen 17 we reviewed last summer, save for one small difference. The newer Omen 17t has dropped the optical drive, leaving an empty cavity inside the machine's case. Everything else has been carried over from the older device. As such, we will include a few pictures of the restyled internals but will eschew discussion of the exterior case, including the ports, build quality, and input devices. For more details on these pieces of the Omen 17t, please refer to our original HP Omen 17 here.
The Omen 17t sits between behemoths like MSI's GT75 Titan and more affordable machines like the MSI GE73 Raider. As such, there is no shortage of comparable devices. We will see how the Omen 17t stacks up against the Alienware 17 R4, the Asus G752VS, the Acer Predator 17, the Eurocom Q8, and the EVGA SC17. Let's dive in.
| SD Card Reader | |
| average JPG Copy Test (av. of 3 runs) | |
| Aorus X9 DT (Toshiba Exceria Pro SDXC 64 GB UHS-II) | |
| Eurocom Q8 (Toshiba Exceria Pro SDXC 64 GB UHS-II) | |
| Average of class Gaming (20.9 - 210, n=55, last 2 years) | |
| HP Omen 17t-3AW55AV_1 (Toshiba Exceria Pro SDXC 64 GB UHS-II) | |
| Acer Predator 17 G9-793-70PJ (Toshiba Exceria Pro SDXC 64 GB UHS-II) | |
| Asus G752VS-BA338T (Toshiba Exceria Pro SDXC 64 GB UHS-II) | |
| MSI GE73 8RF-008 Raider RGB (Toshiba Exceria Pro SDXC 64 GB UHS-II) | |
| maximum AS SSD Seq Read Test (1GB) | |
| Aorus X9 DT (Toshiba Exceria Pro SDXC 64 GB UHS-II) | |
| Eurocom Q8 (Toshiba Exceria Pro SDXC 64 GB UHS-II) | |
| Average of class Gaming (25.5 - 261, n=52, last 2 years) | |
| Acer Predator 17 G9-793-70PJ (Toshiba Exceria Pro SDXC 64 GB UHS-II) | |
| Asus G752VS-BA338T (Toshiba Exceria Pro SDXC 64 GB UHS-II) | |
| HP Omen 17t-3AW55AV_1 (Toshiba Exceria Pro SDXC 64 GB UHS-II) | |
| MSI GE73 8RF-008 Raider RGB (Toshiba Exceria Pro SDXC 64 GB UHS-II) | |
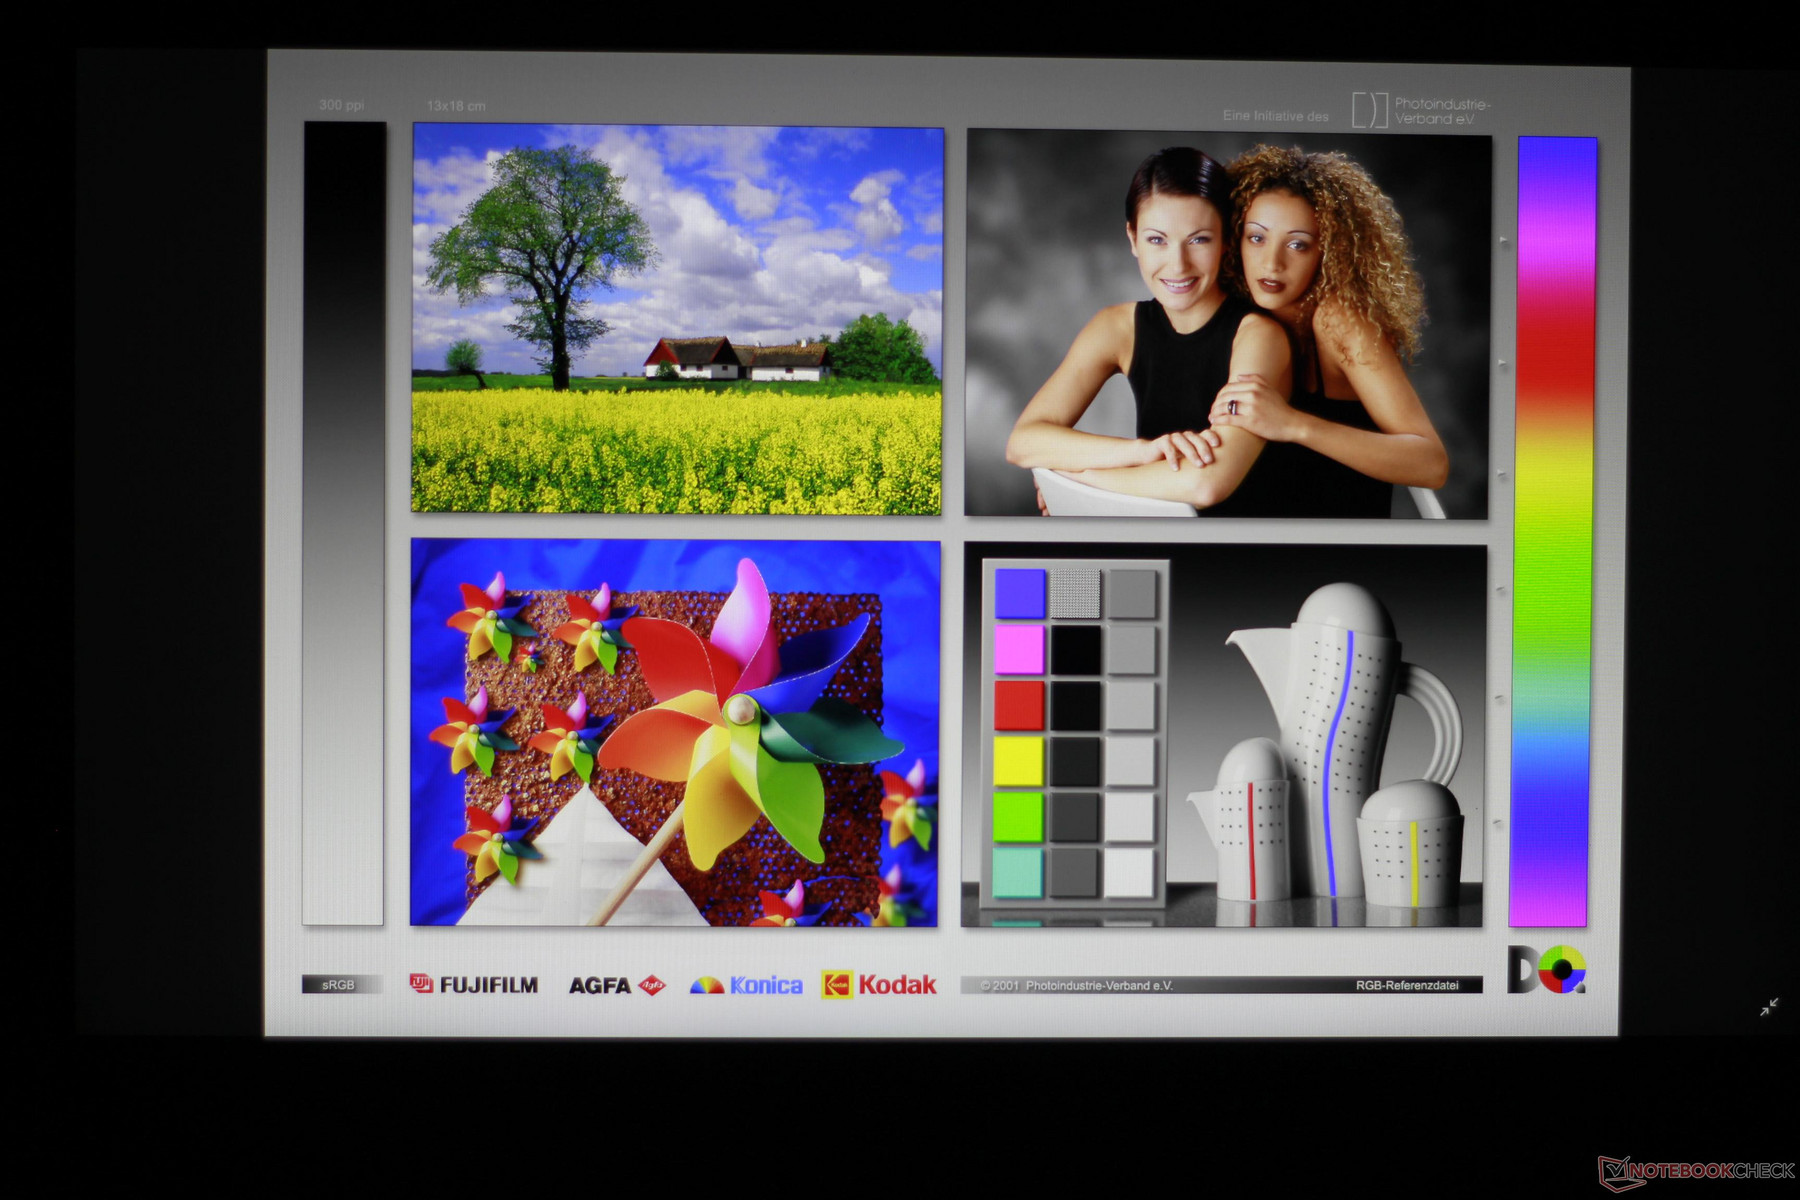
Display
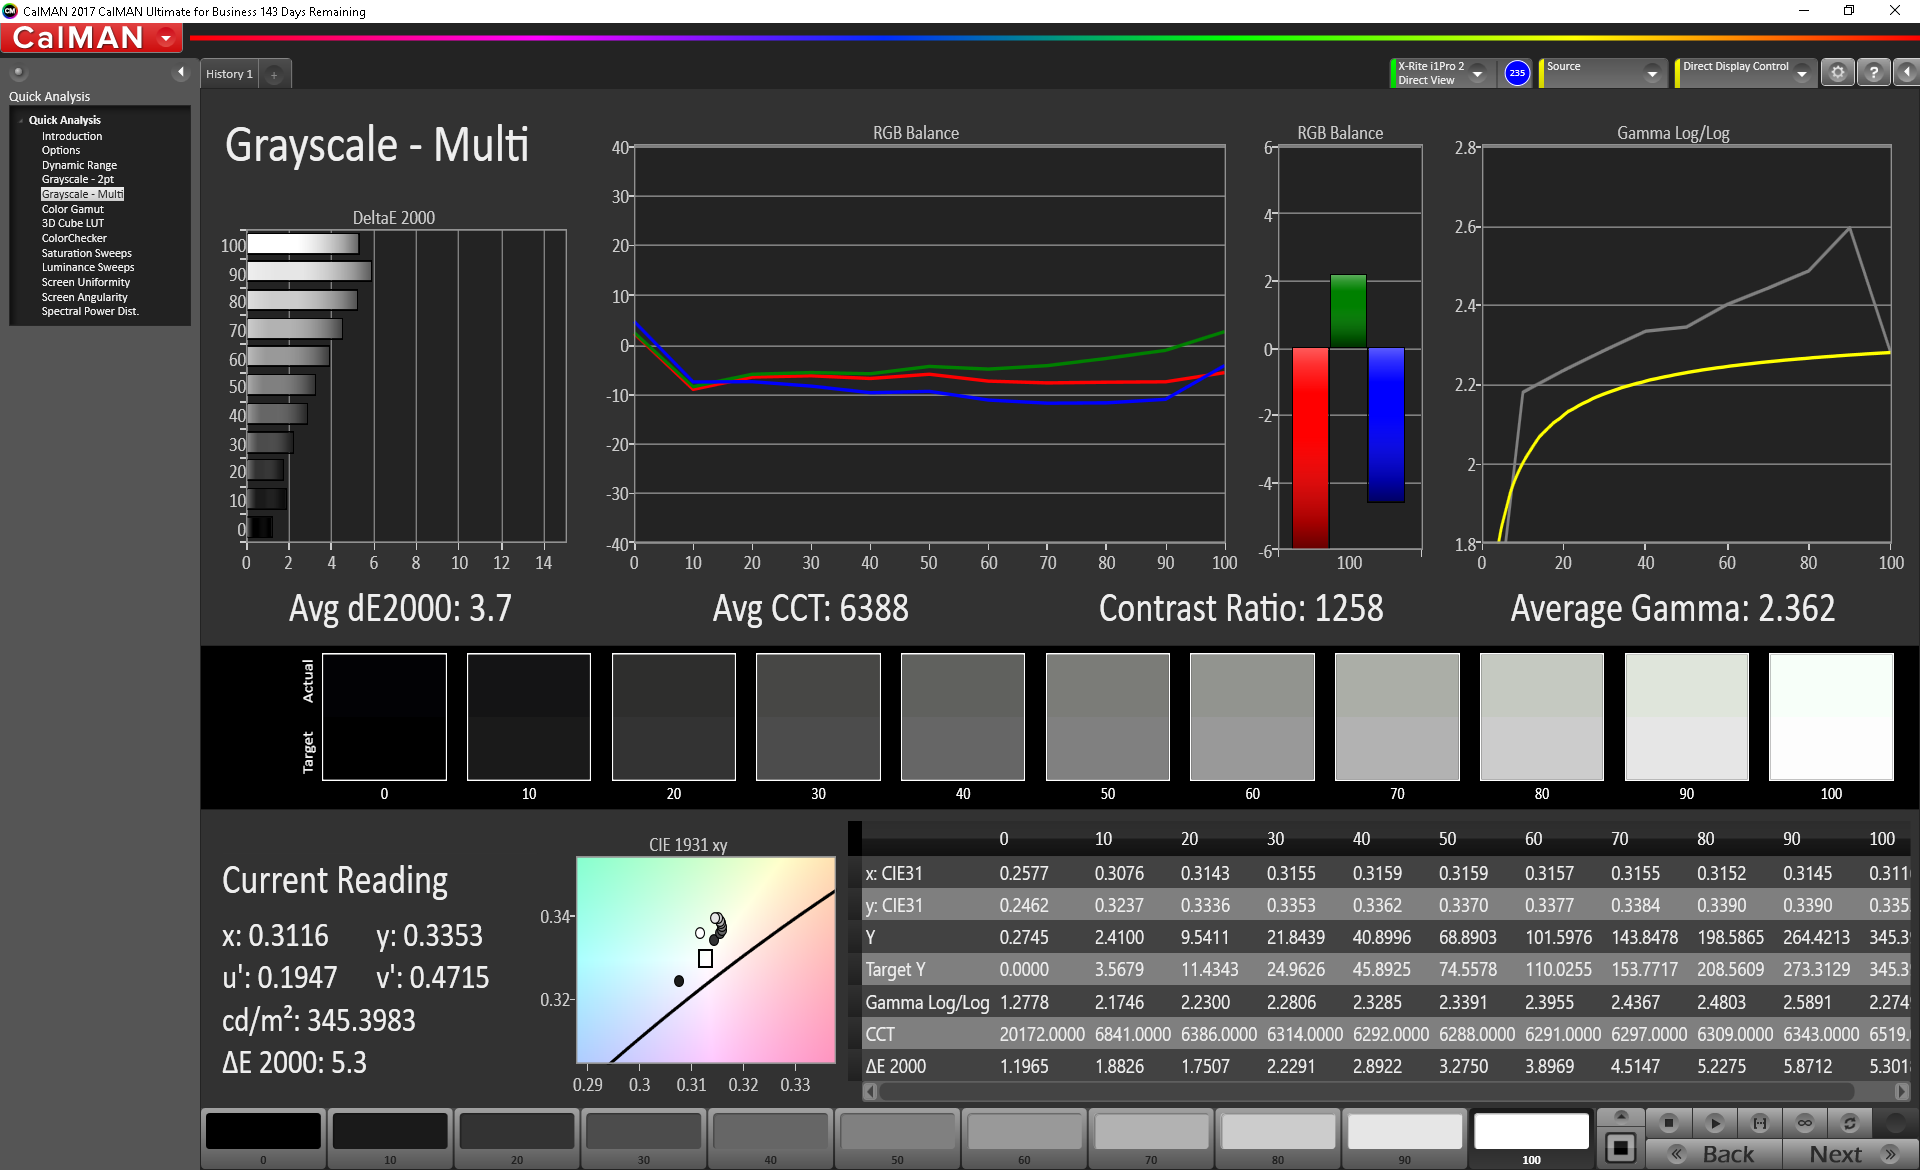
The Omen 17t's screen is one of its greatest strengths. The AU Optronics panel's best feature is undoubtedly its 144 Hz refresh rate with support for Nvidia's G-Sync. In addition, response times are lightning fast, and PWM is absent. Currently, this configuration (144 Hz, IPS, FHD) is the only one available for the Omen 17t. The screen is bright (~320 nits on average) and beats most competitors, which average between 250-300 nits. The backlight is also fairly even (87% distribution). Contrast levels are good; blacks are deep and images look crisp and detailed. All these details, combined with good color reproduction (more on that below), create a great all-around display.
| |||||||||||||||||||||||||
Brightness Distribution: 87 %
Center on Battery: 343.6 cd/m²
Contrast: 1011:1 (Black: 0.34 cd/m²)
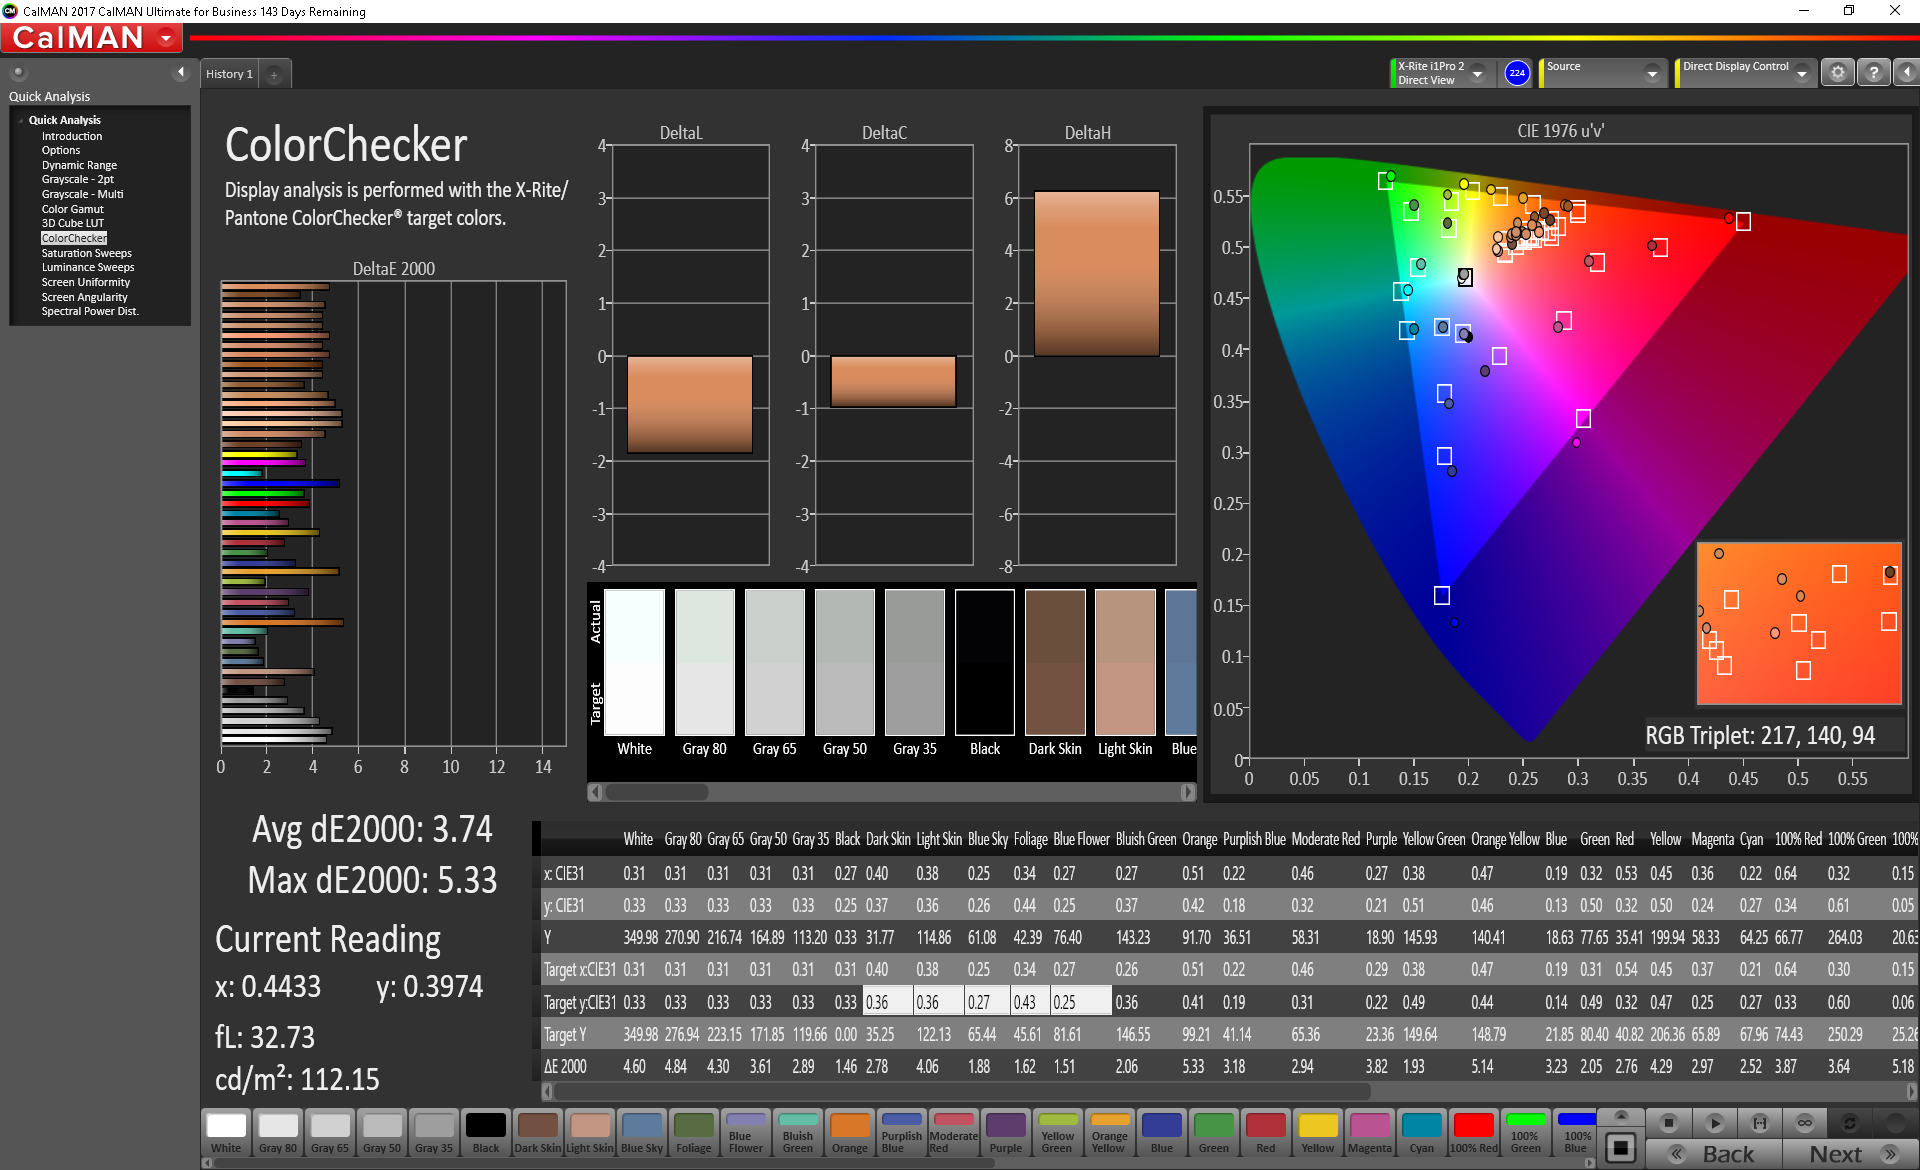
ΔE ColorChecker Calman: 3.74 | ∀{0.5-29.43 Ø4.73}
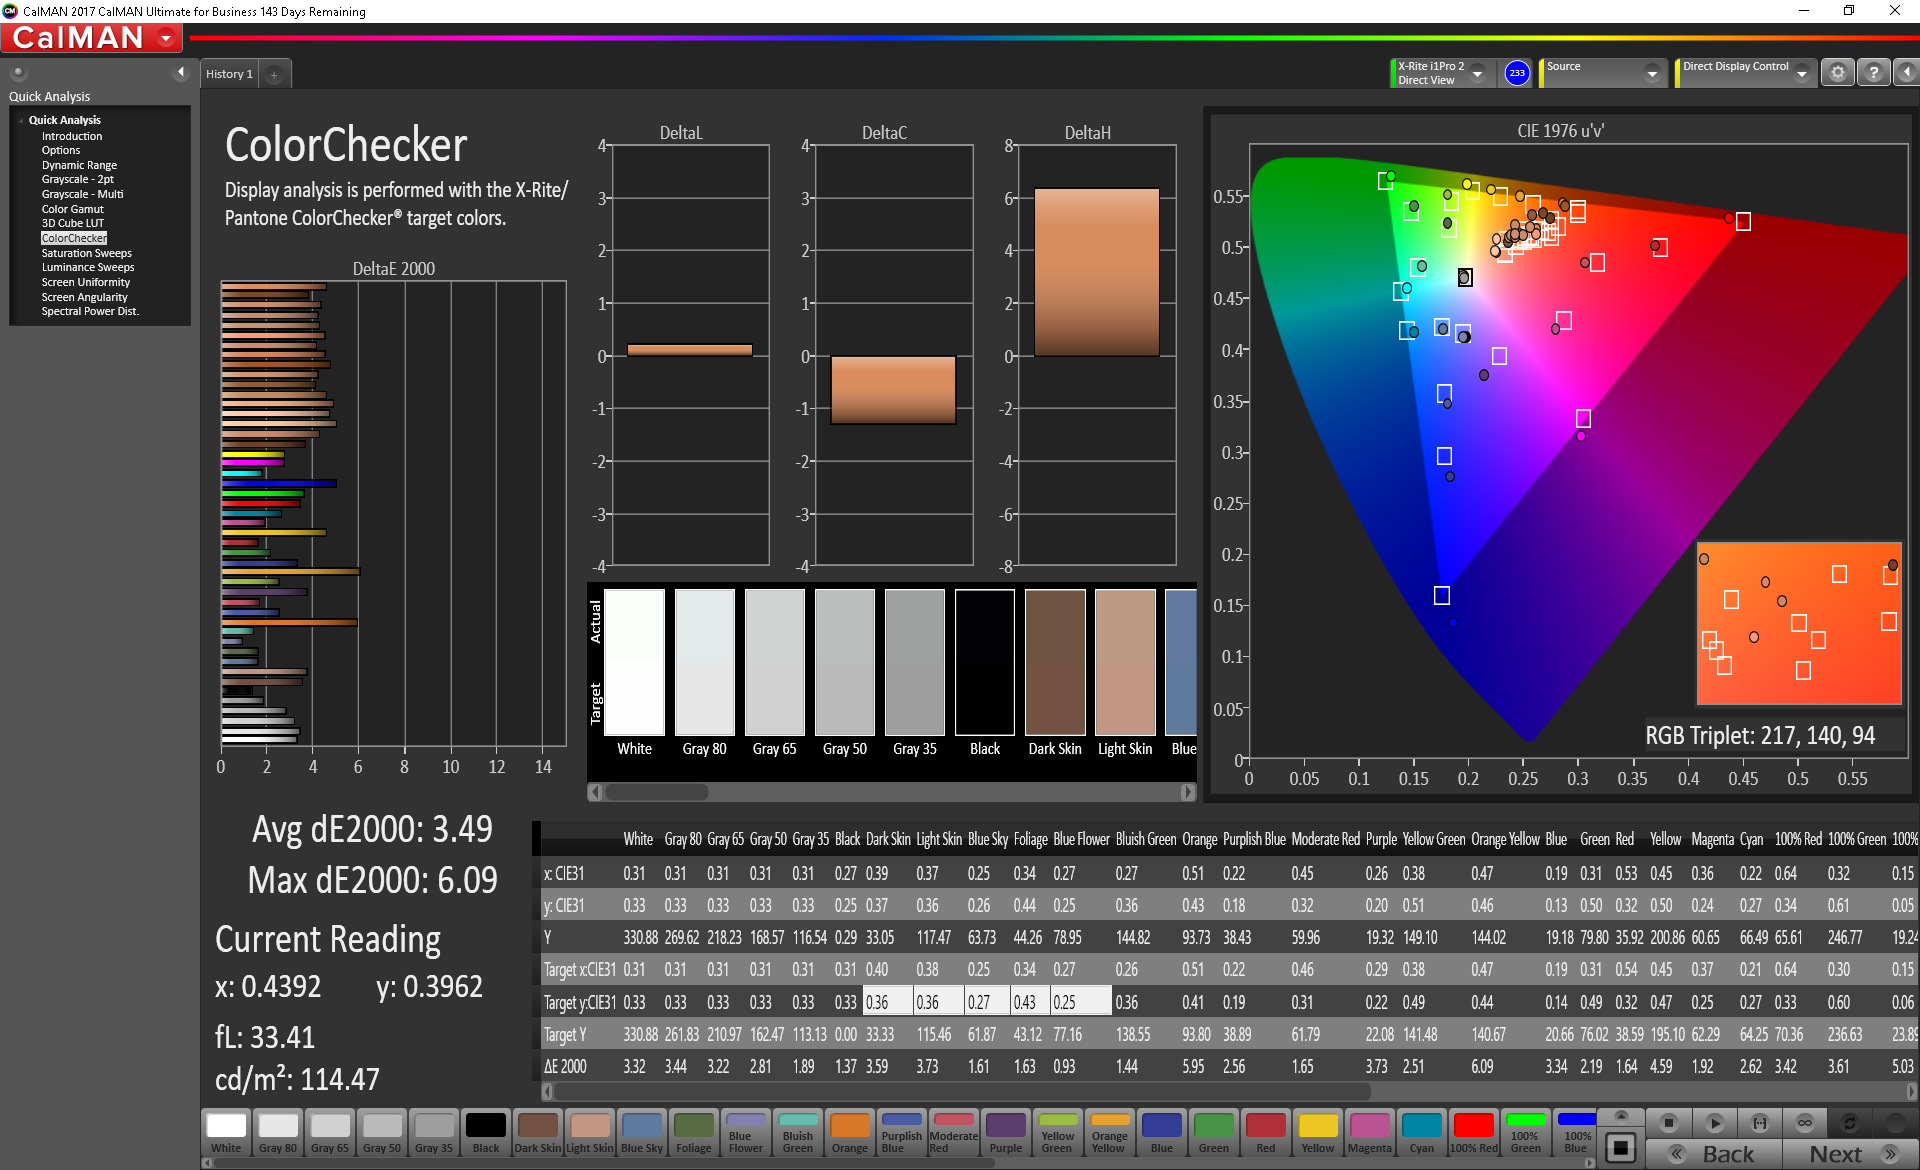
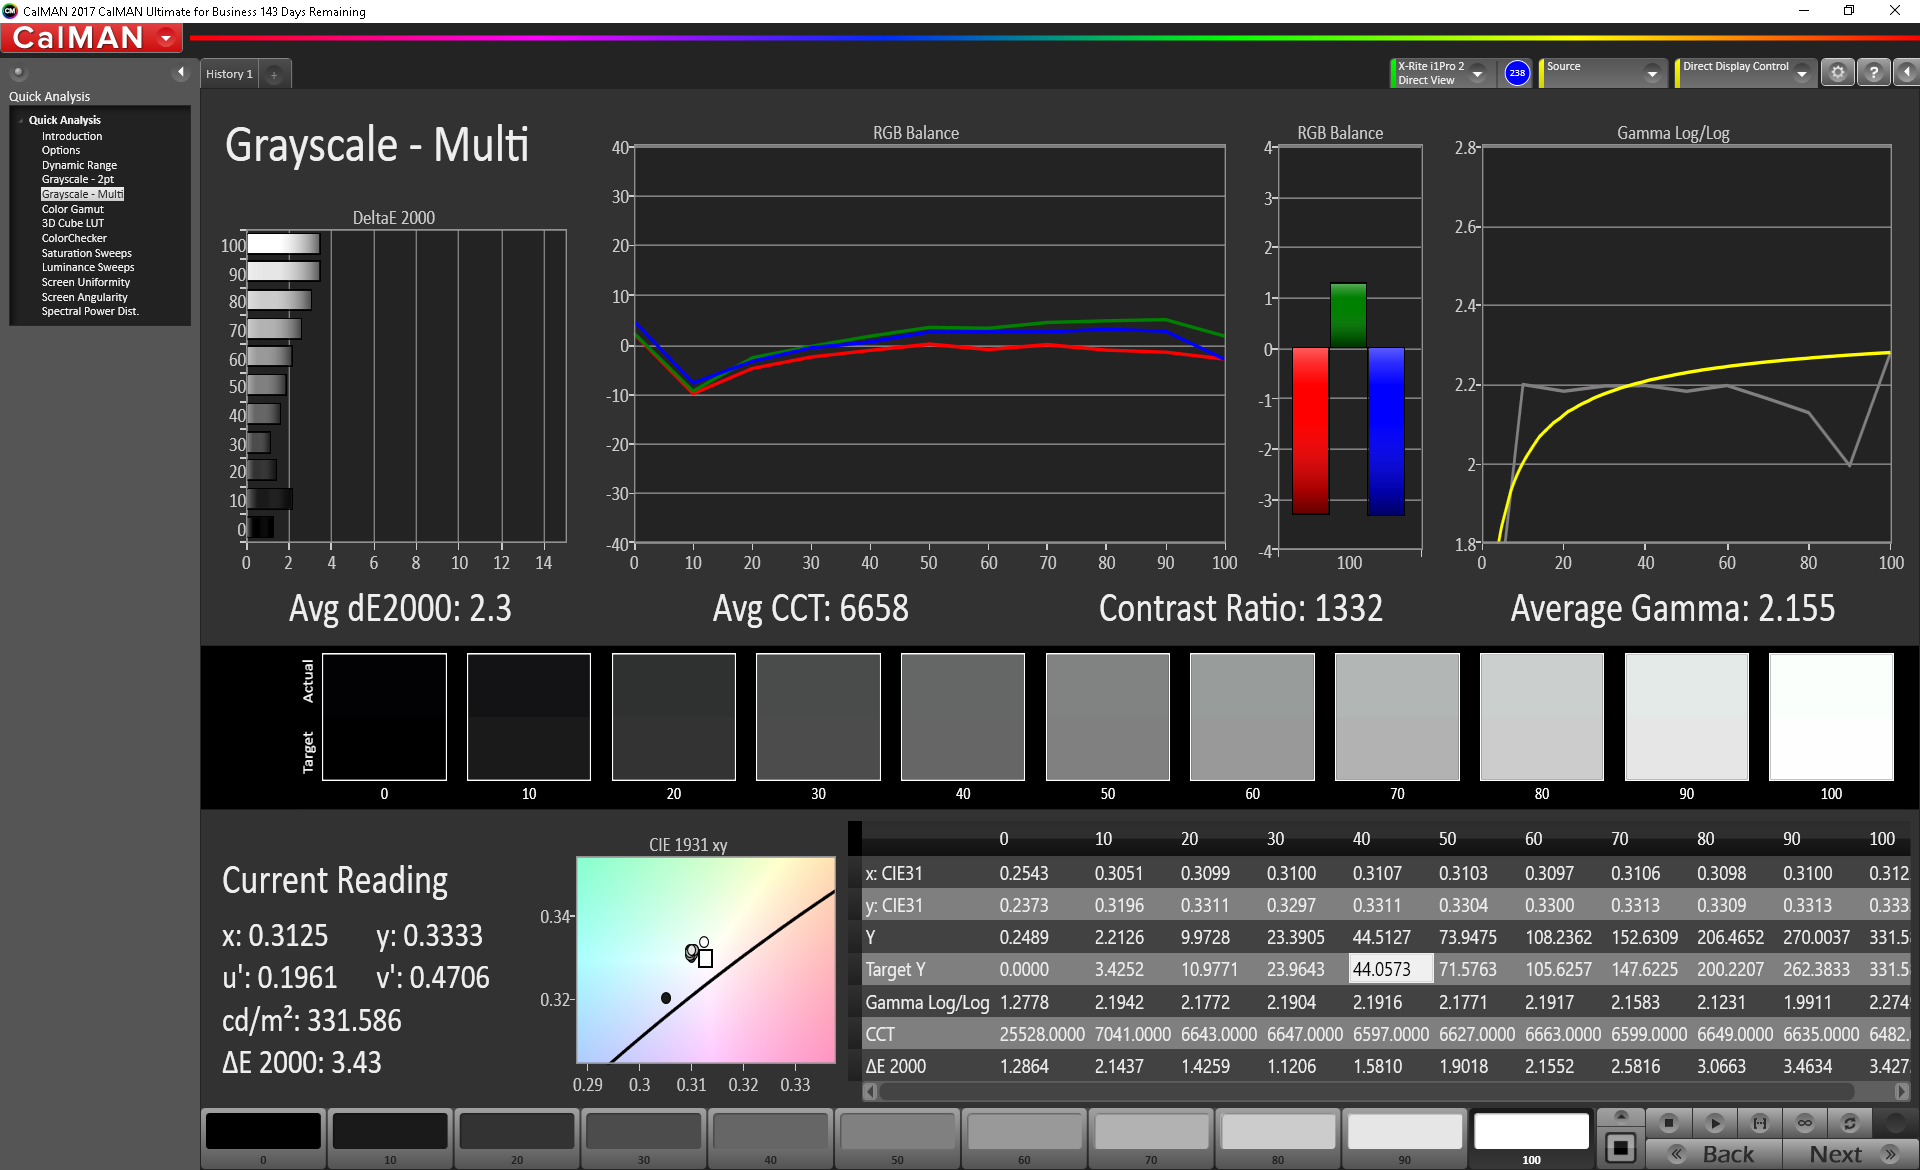
calibrated: 3.49
ΔE Greyscale Calman: 3.7 | ∀{0.09-98 Ø4.97}
90% sRGB (Argyll 1.6.3 3D)
58% AdobeRGB 1998 (Argyll 1.6.3 3D)
65.8% AdobeRGB 1998 (Argyll 3D)
90% sRGB (Argyll 3D)
65.4% Display P3 (Argyll 3D)
Gamma: 2.36
CCT: 6388 K
| HP Omen 17t-3AW55AV_1 AU Optronics AUO309D, IPS, 17.3", 1920x1080 | Alienware 17 R4 TN LED, 17.3", 2560x1440 | Acer Predator 17 G9-793-70PJ AU Optronics B173ZAN01.0 (AUO109B), IPS, 17.3", 3840x2160 | Asus G752VS-BA338T AU Optronics B173HAN01.1 (AUO119D), IPS, 17.3", 1920x1080 | Eurocom Q8 AU Optronics B173QTN01.0, Dell P/N WJGD4, TN LED, 17.3", 2560x1440 | EVGA SC17 GTX 1070 Sharp LQ173D1JW31, IPS, 17.3", 3840x2160 | MSI GE73 8RF-008 Raider RGB Chi Mei N173HHE-G32 (CMN1747), TN WLED, 17.3", 1920x1080 | Aorus X9 DT AUO B173HAN03.0 (AUO309D), IPS, 17.3", 1920x1080 | MSI GT75 8RG-090 Titan CMN N173HHE-G32 (CMN1747), TN, 17.3", 1920x1080 | |
|---|---|---|---|---|---|---|---|---|---|
| Display | -7% | 31% | -4% | -10% | 31% | 27% | 2% | 27% | |
| Display P3 Coverage (%) | 65.4 | 61.2 -6% | 86.4 32% | 61.6 -6% | 58.7 -10% | 87.3 33% | 90.8 39% | 66.8 2% | 90.9 39% |
| sRGB Coverage (%) | 90 | 82.9 -8% | 99.9 11% | 90.3 0% | 81 -10% | 100 11% | 99.9 11% | 92.1 2% | 100 11% |
| AdobeRGB 1998 Coverage (%) | 65.8 | 60.5 -8% | 99.1 51% | 62.8 -5% | 58.9 -10% | 98.8 50% | 85.8 30% | 67.3 2% | 86.2 31% |
| Response Times | -49% | -170% | -133% | -7% | -206% | -48% | -13% | 50% | |
| Response Time Grey 50% / Grey 80% * (ms) | 17.6 ? | 30 ? -70% | 50 ? -184% | 36 ? -105% | 21.6 ? -23% | 45.6 ? -159% | 28 ? -59% | 18.4 ? -5% | 8 ? 55% |
| Response Time Black / White * (ms) | 10 ? | 12.8 ? -28% | 25.6 ? -156% | 26 ? -160% | 9 ? 10% | 35.2 ? -252% | 13.6 ? -36% | 12 ? -20% | 5.6 ? 44% |
| PWM Frequency (Hz) | 1042 ? | 25000 ? | 26000 ? | ||||||
| Screen | -26% | 5% | -27% | -69% | -1% | 7% | 19% | 17% | |
| Brightness middle (cd/m²) | 343.6 | 402.3 17% | 343 0% | 307 -11% | 367.9 7% | 399.1 16% | 273 -21% | 280 -19% | 240 -30% |
| Brightness (cd/m²) | 320 | 372 16% | 328 2% | 300 -6% | 346 8% | 360 13% | 273 -15% | 262 -18% | 248 -22% |
| Brightness Distribution (%) | 87 | 86 -1% | 84 -3% | 88 1% | 84 -3% | 81 -7% | 90 3% | 86 -1% | 83 -5% |
| Black Level * (cd/m²) | 0.34 | 0.62 -82% | 0.29 15% | 0.32 6% | 0.55 -62% | 0.4 -18% | 0.26 24% | 0.22 35% | 0.22 35% |
| Contrast (:1) | 1011 | 649 -36% | 1183 17% | 959 -5% | 669 -34% | 998 -1% | 1050 4% | 1273 26% | 1091 8% |
| Colorchecker dE 2000 * | 3.74 | 5.6 -50% | 4.01 -7% | 5.53 -48% | 9.86 -164% | 4.78 -28% | 3.52 6% | 1.78 52% | 2.14 43% |
| Colorchecker dE 2000 max. * | 5.33 | 9.8 -84% | 6.03 -13% | 11.54 -117% | 17.56 -229% | 7.65 -44% | 6.34 -19% | 3.91 27% | 5.04 5% |
| Colorchecker dE 2000 calibrated * | 3.49 | 4.43 -27% | 2.09 40% | 1.54 56% | |||||
| Greyscale dE 2000 * | 3.7 | 4.7 -27% | 4.7 -27% | 7 -89% | 12.4 -235% | 3.8 -3% | 3.11 16% | 0.74 80% | 1.62 56% |
| Gamma | 2.36 93% | 2.14 103% | 2.4 92% | 2.48 89% | 2.09 105% | 2.03 108% | 2.43 91% | 2.43 91% | 2.28 96% |
| CCT | 6388 102% | 7519 86% | 6451 101% | 8103 80% | 11064 59% | 7288 89% | 6999 93% | 6494 100% | 6846 95% |
| Color Space (Percent of AdobeRGB 1998) (%) | 58 | 53.7 -7% | 88 52% | 58 0% | 52.5 -9% | 86.9 50% | 76 31% | 60 3% | 77 33% |
| Color Space (Percent of sRGB) (%) | 90 | 82.2 -9% | 100 11% | 90 0% | 80.5 -11% | 100 11% | 100 11% | 92 2% | 100 11% |
| Total Average (Program / Settings) | -27% /
-26% | -45% /
-13% | -55% /
-36% | -29% /
-50% | -59% /
-22% | -5% /
4% | 3% /
11% | 31% /
23% |
* ... smaller is better
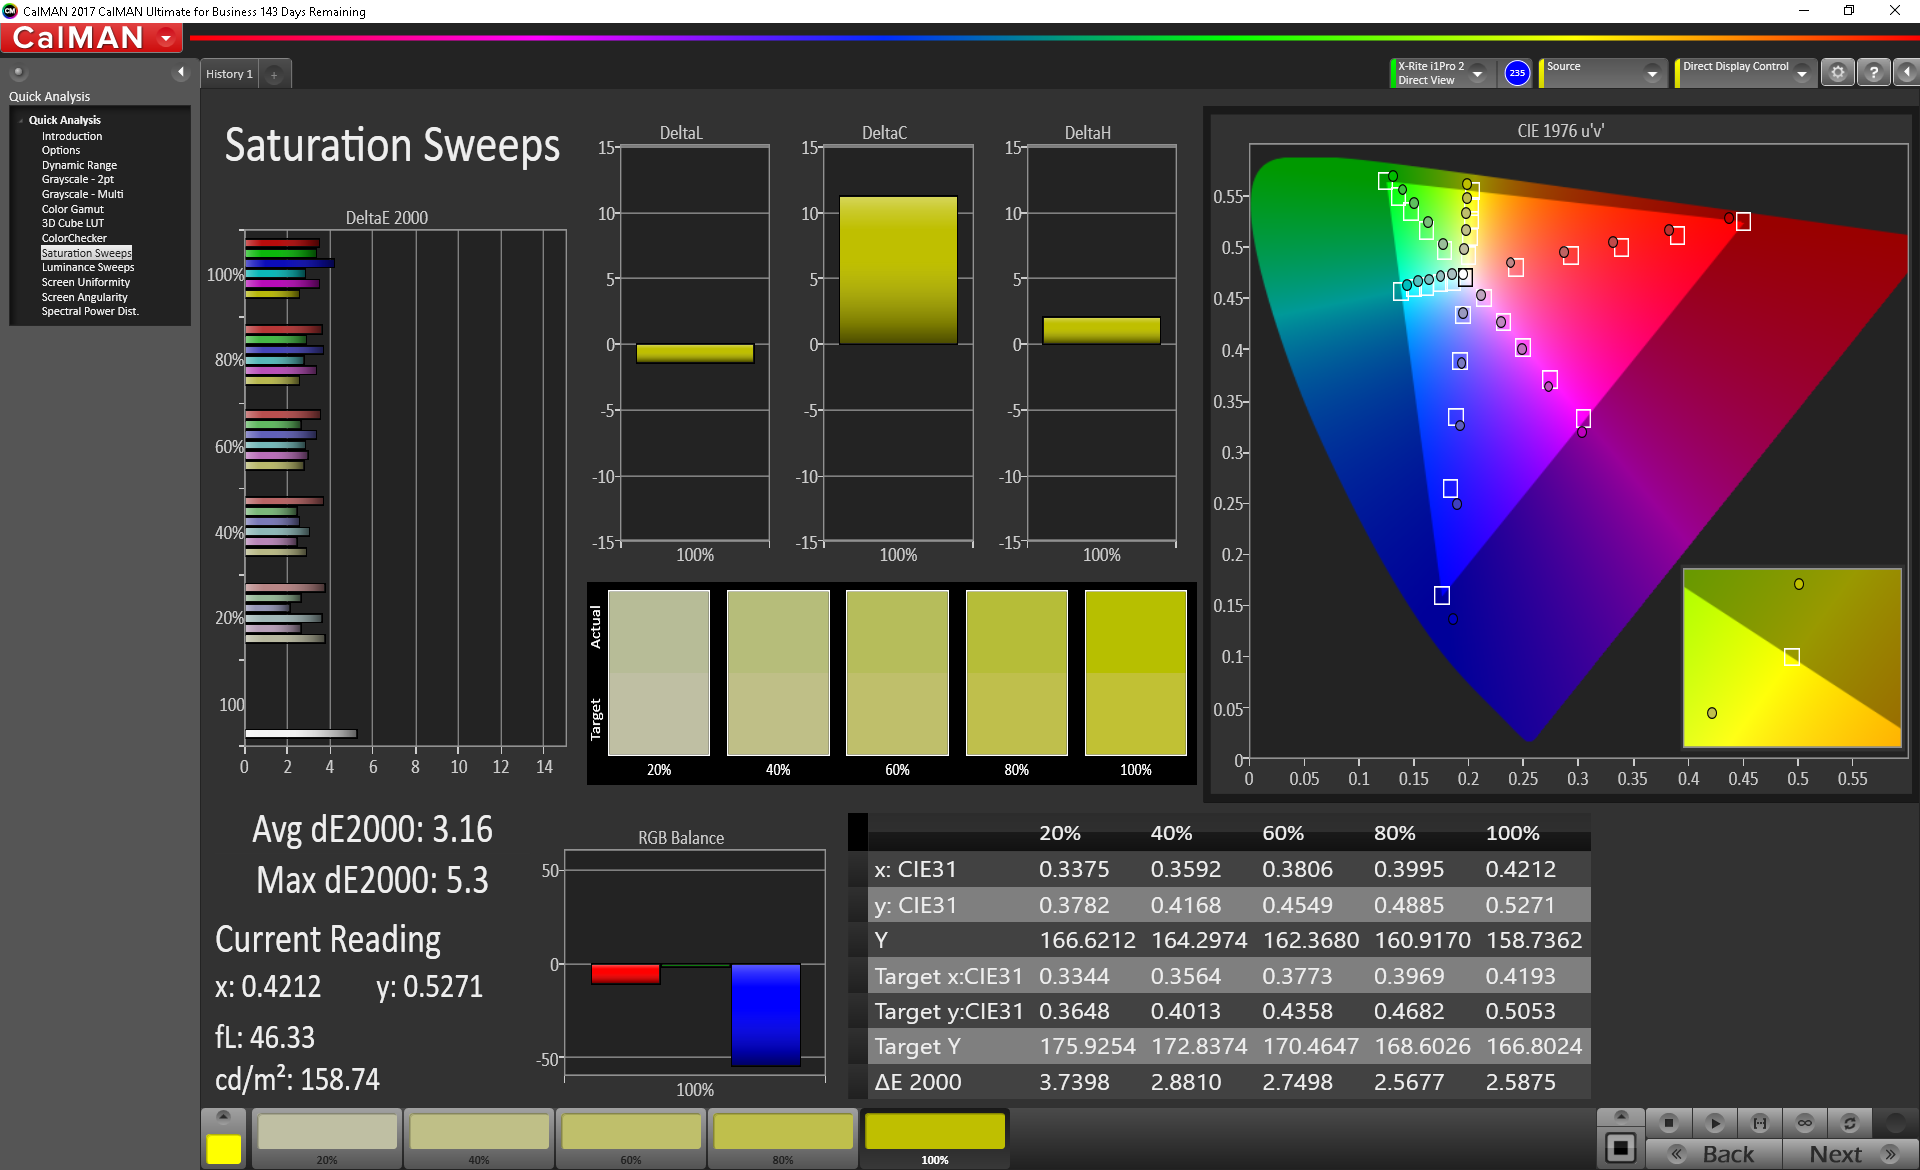
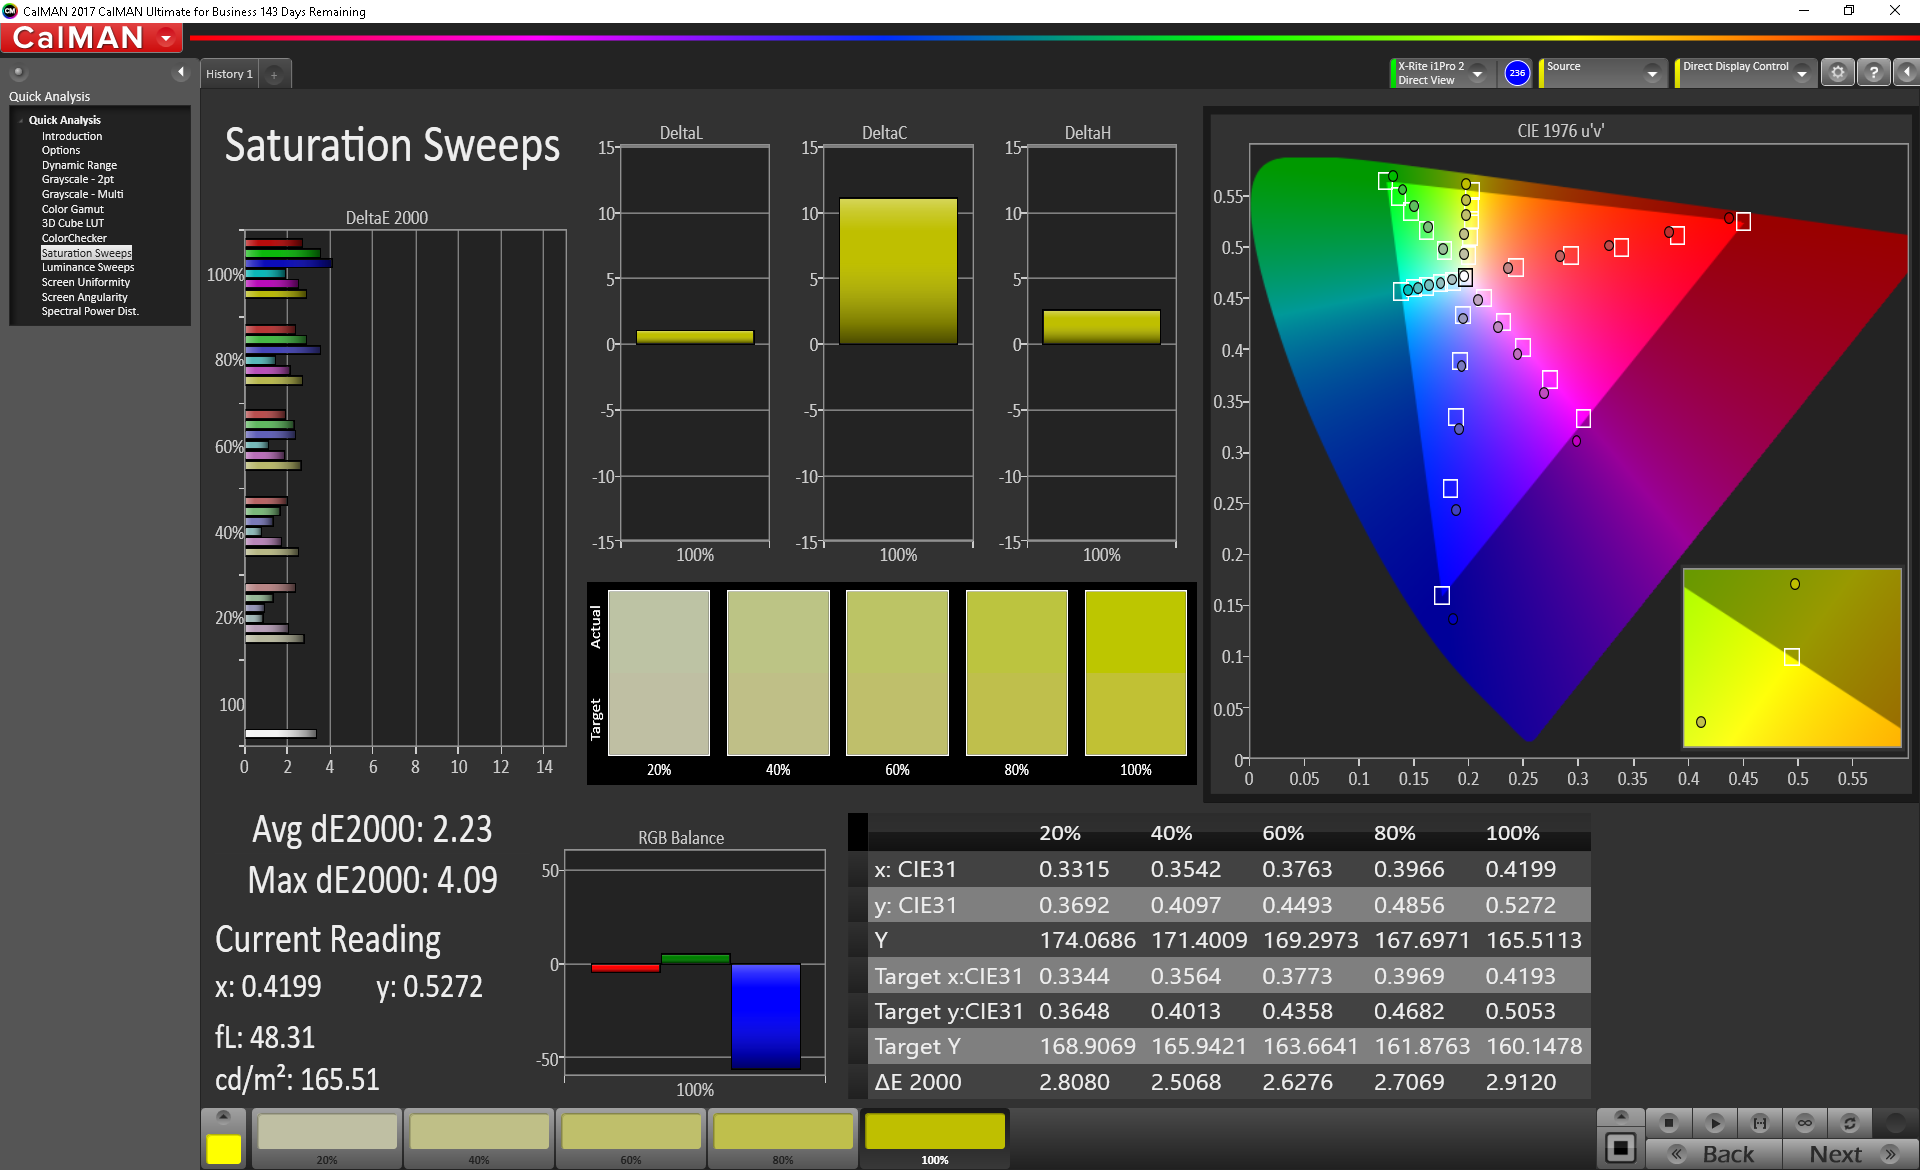
Color space coverage is fairly good. The Omen 17t's panel covers most of the sRGB color space (90%) and a little more than half the AdobeRGB color space (58%), putting it in line with most of its competitors. While professionals may want more colors, the color space is more than adequate for gaming. Those looking for wider color reproduction should look at EVGA's SC17.
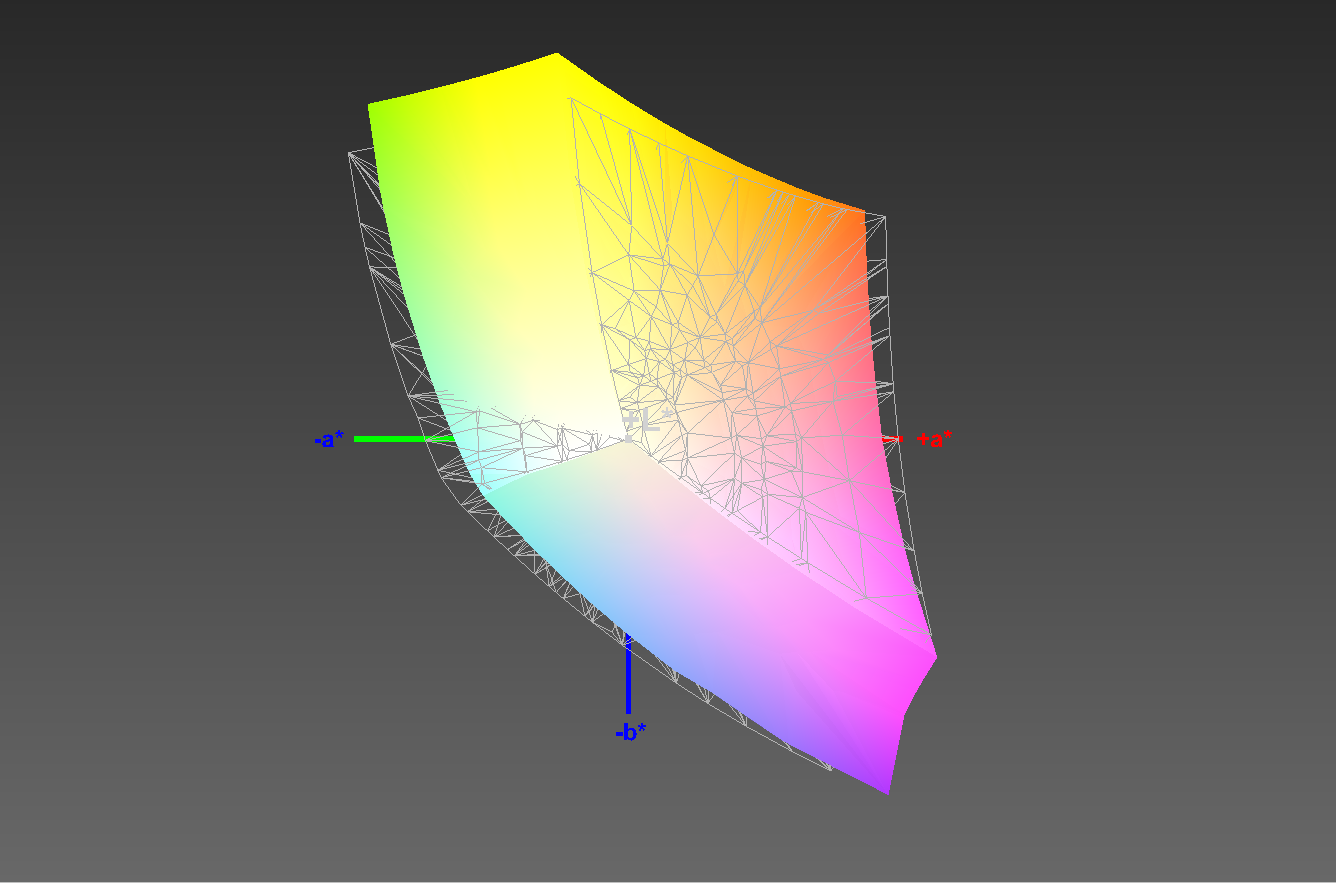
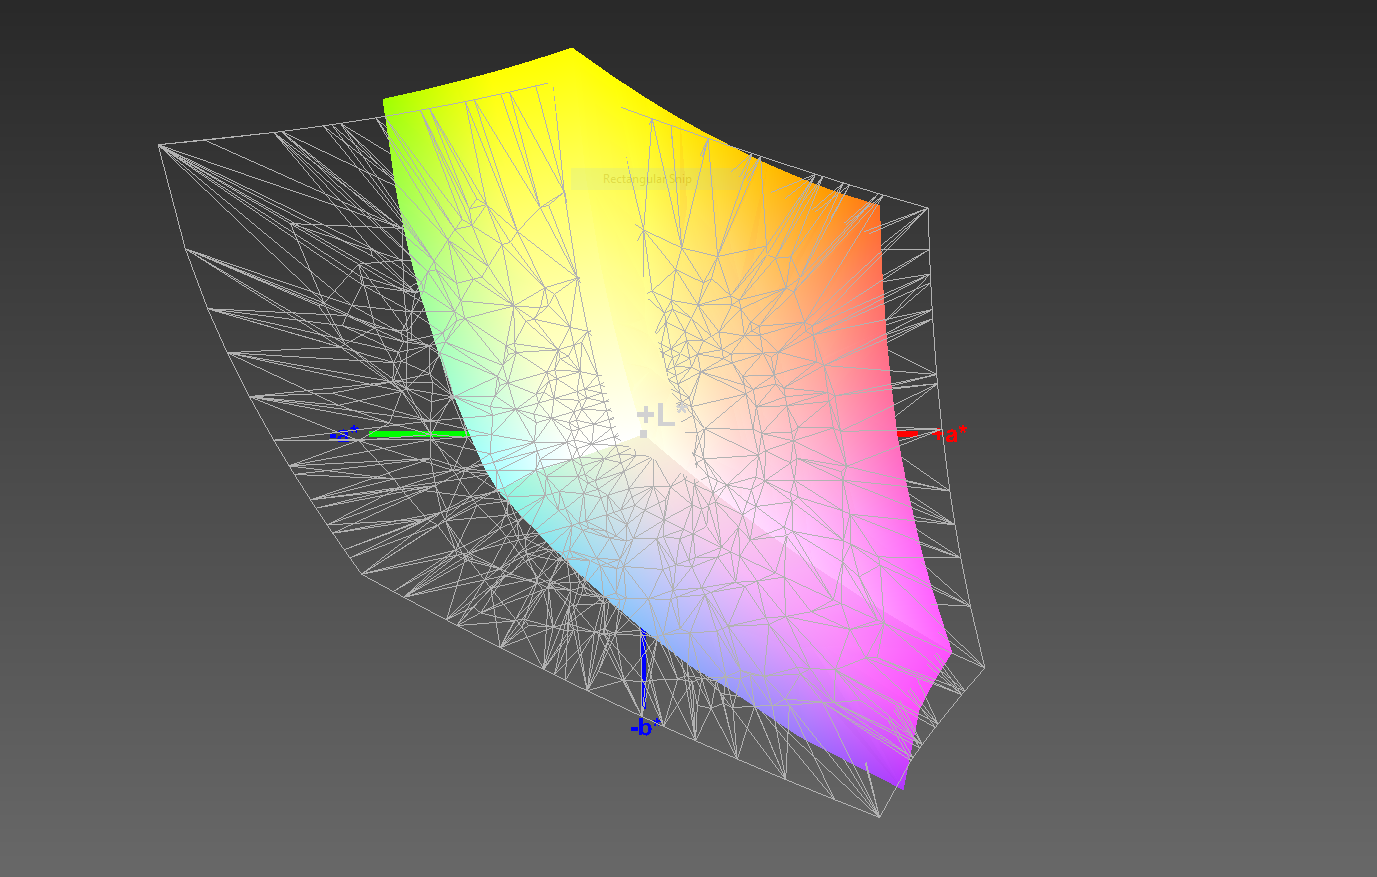
As mentioned, color accuracy is excellent. Out of the box, the DeltaE2000 for colors averages about 3.74. This is on the better side of average for a gaming laptop. The Omen 17t could also be used for some colorwork, though it falls just short what is generally considered acceptable for professionals (DeltaE2000 of 3 or below). Calibration improves this score slightly, suggesting that the display may have been calibrated prior to being sent to us. The Aorus X9 DT, which uses the same AU Optronics panel, shows that there is some room for improvement. Some users may be able to improve the display's color accuracy.
Display Response Times
| ↔ Response Time Black to White | ||
|---|---|---|
| 10 ms ... rise ↗ and fall ↘ combined | ↗ 4.8 ms rise | 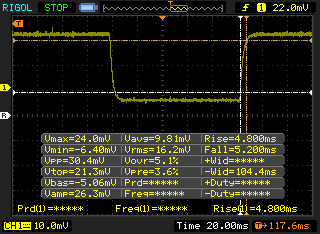 |
| ↘ 5.2 ms fall | ||
| The screen shows good response rates in our tests, but may be too slow for competitive gamers. In comparison, all tested devices range from 0.1 (minimum) to 240 (maximum) ms. » 27 % of all devices are better. This means that the measured response time is better than the average of all tested devices (19.9 ms). | ||
| ↔ Response Time 50% Grey to 80% Grey | ||
| 17.6 ms ... rise ↗ and fall ↘ combined | ↗ 10 ms rise | 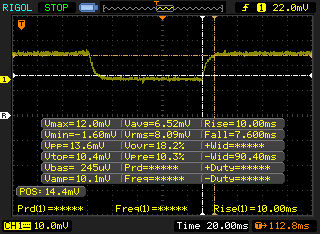 |
| ↘ 7.6 ms fall | ||
| The screen shows good response rates in our tests, but may be too slow for competitive gamers. In comparison, all tested devices range from 0.165 (minimum) to 636 (maximum) ms. » 31 % of all devices are better. This means that the measured response time is better than the average of all tested devices (31.1 ms). | ||
Screen Flickering / PWM (Pulse-Width Modulation)
| Screen flickering / PWM not detected | 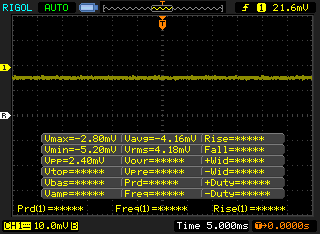 | ||
In comparison: 52 % of all tested devices do not use PWM to dim the display. If PWM was detected, an average of 7798 (minimum: 5 - maximum: 343500) Hz was measured. | |||
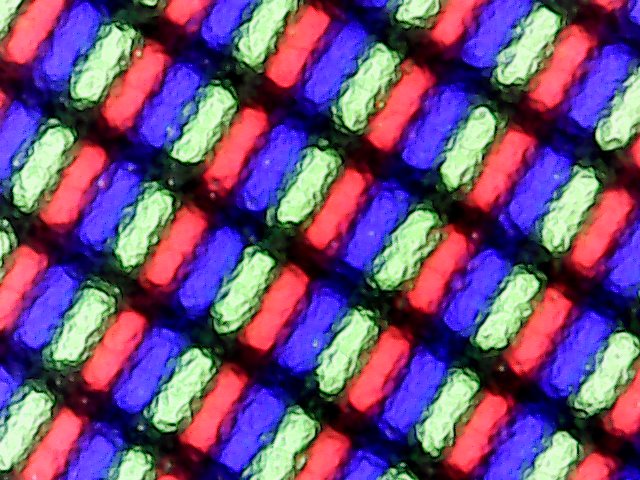
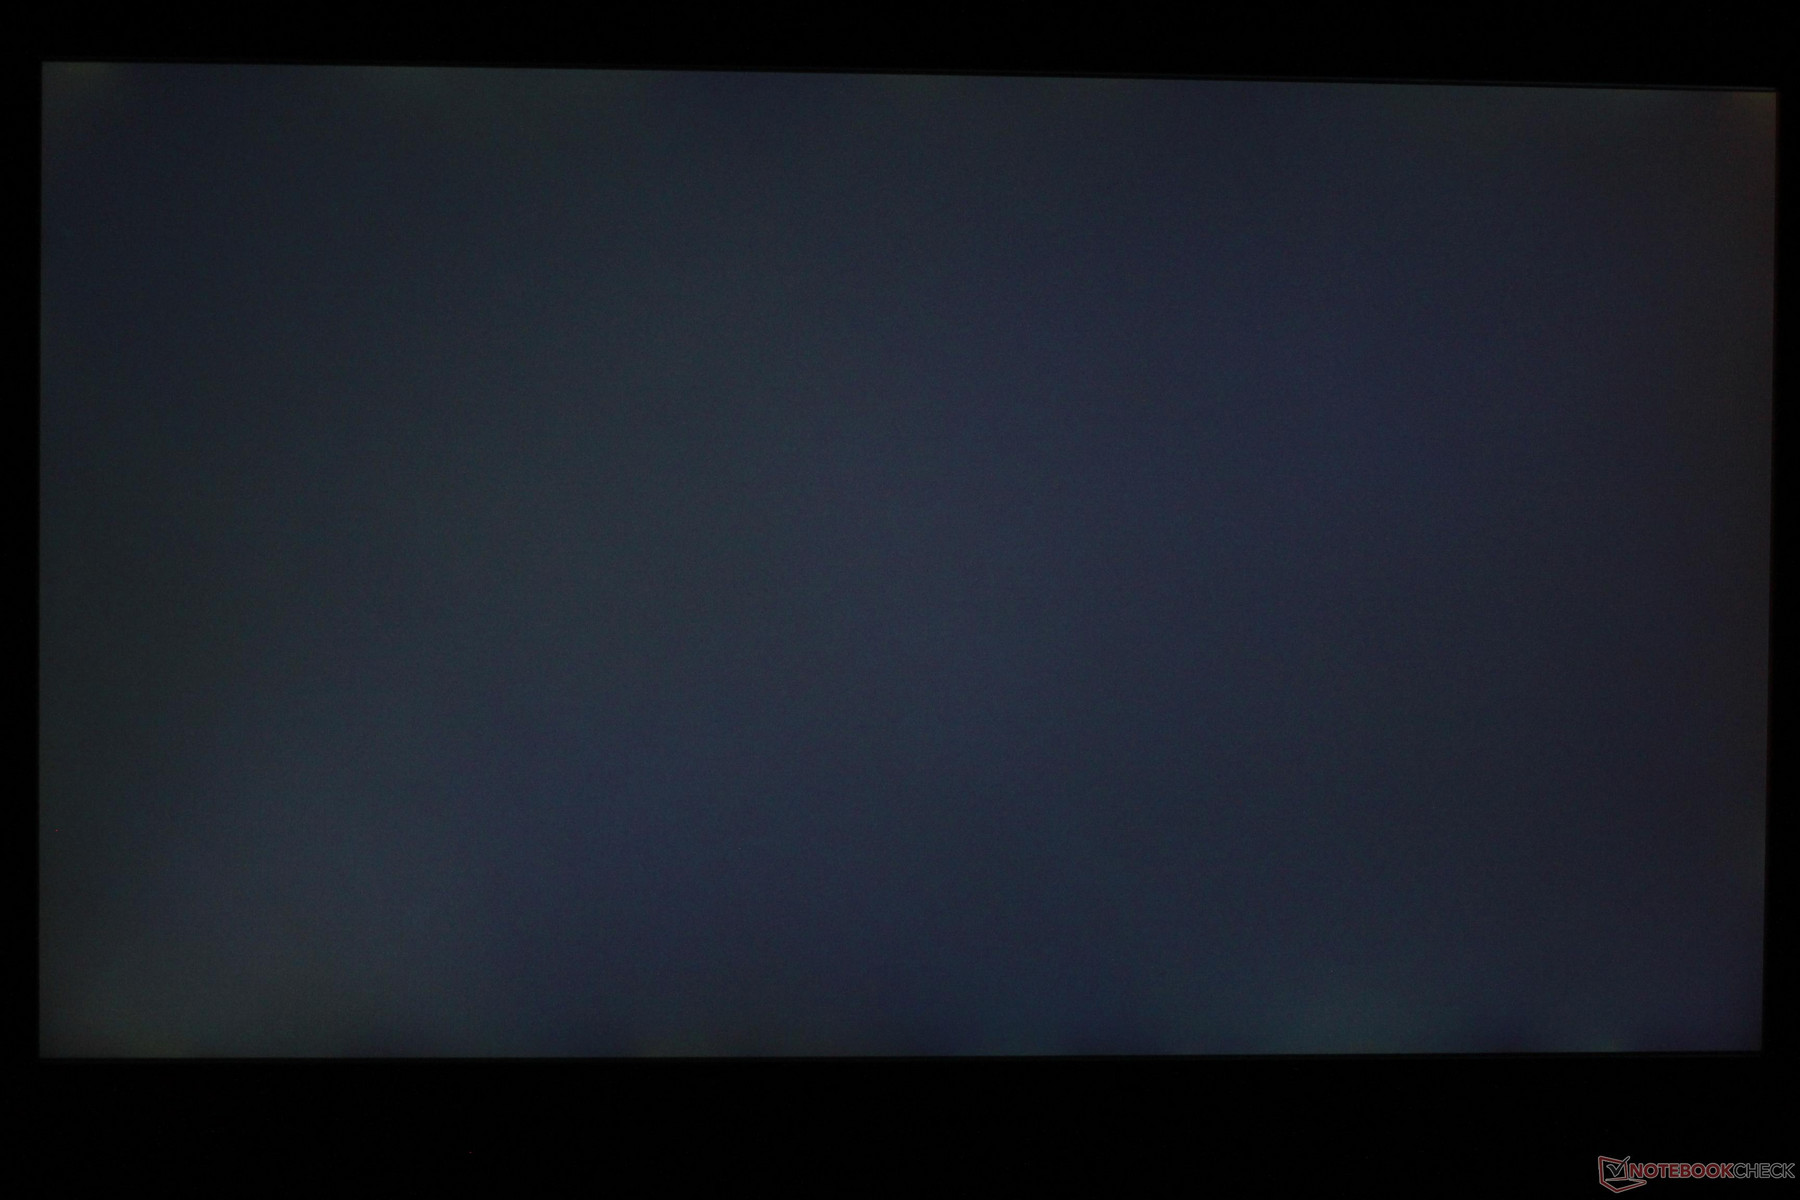
The viewing angles of the display are excellent. Since the Omen 17t uses an IPS panel, this should be expected. There is a slight grain on the matte finish that becomes visible when the screen is viewed off-angle, particularly from above. You can see this in the third viewing angle photo below (down-left). Otherwise, this grain isn't distracting. There is a slight amount of backlight bleed in the upper-left and upper-right corners. This is minuscule and isn't readily noticeable.
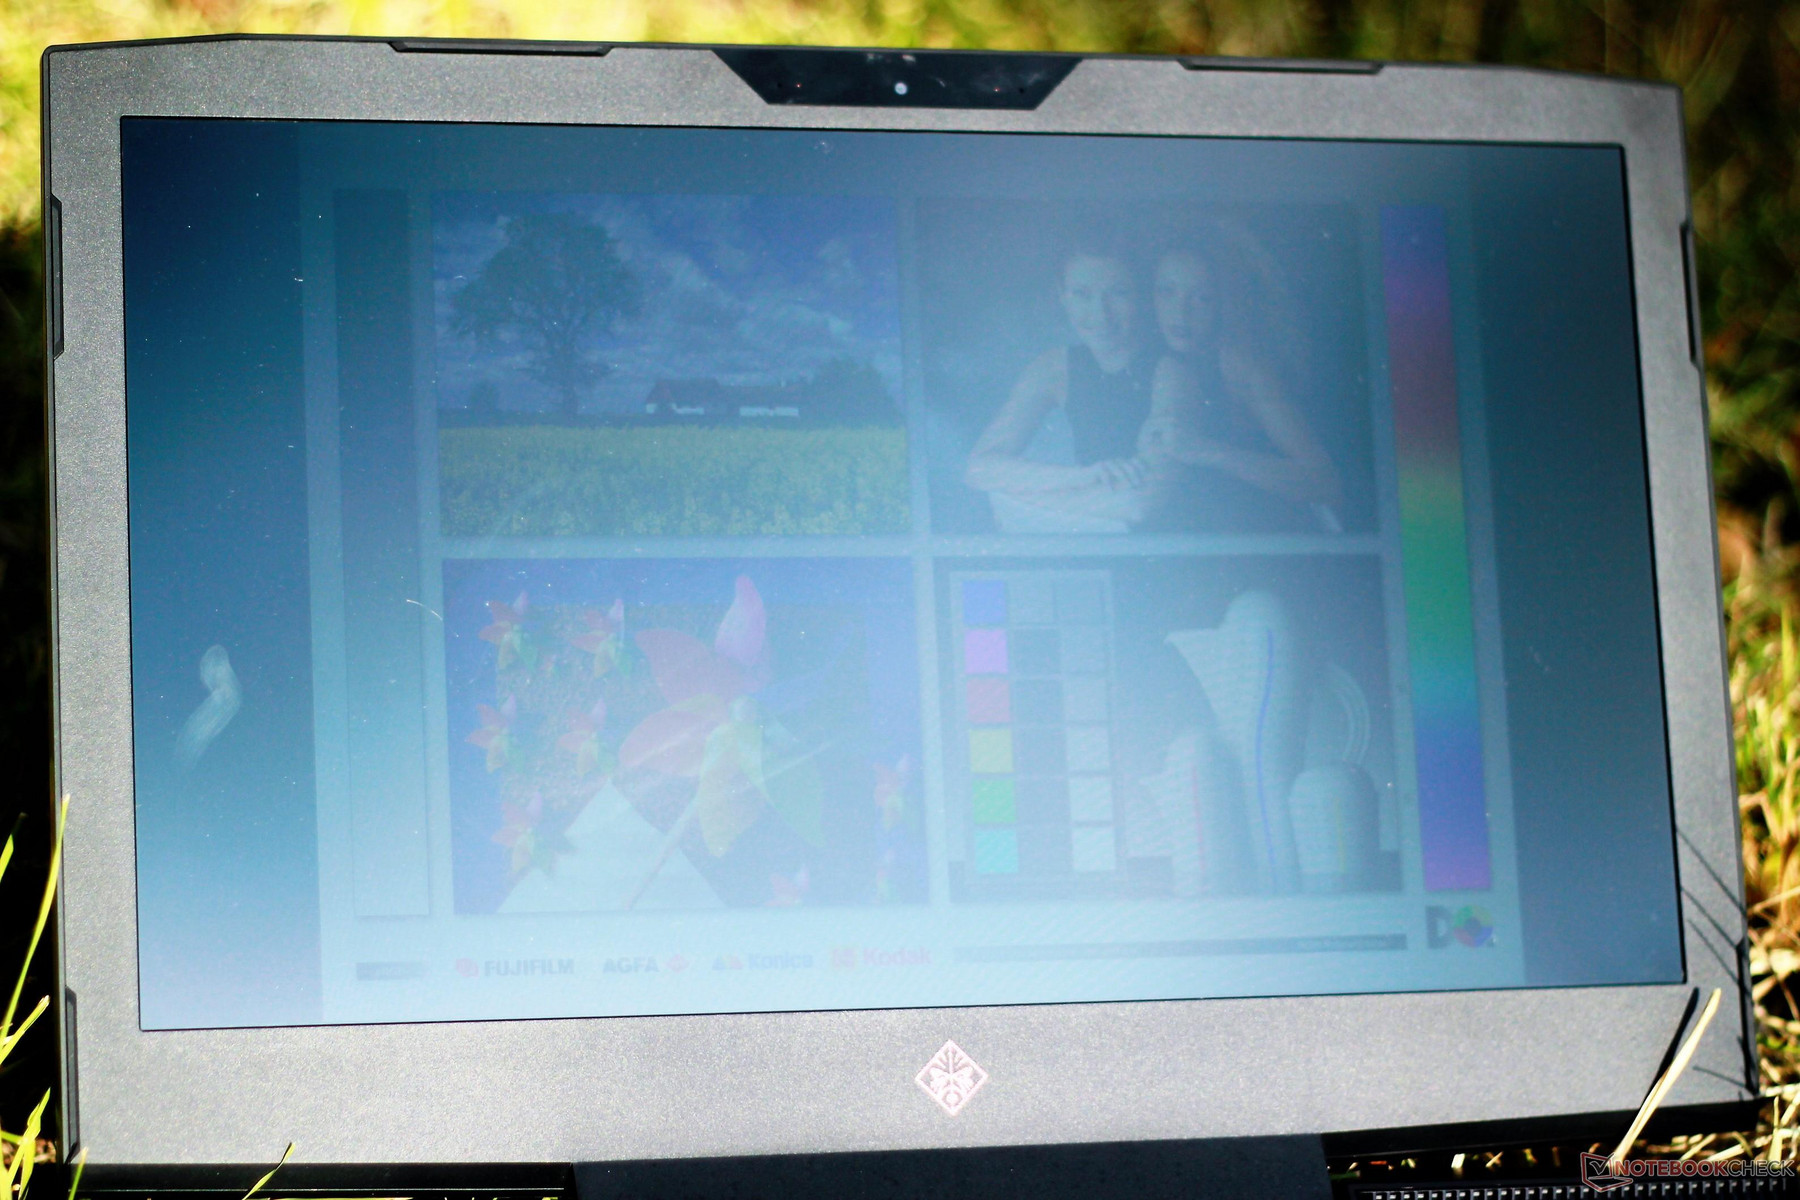
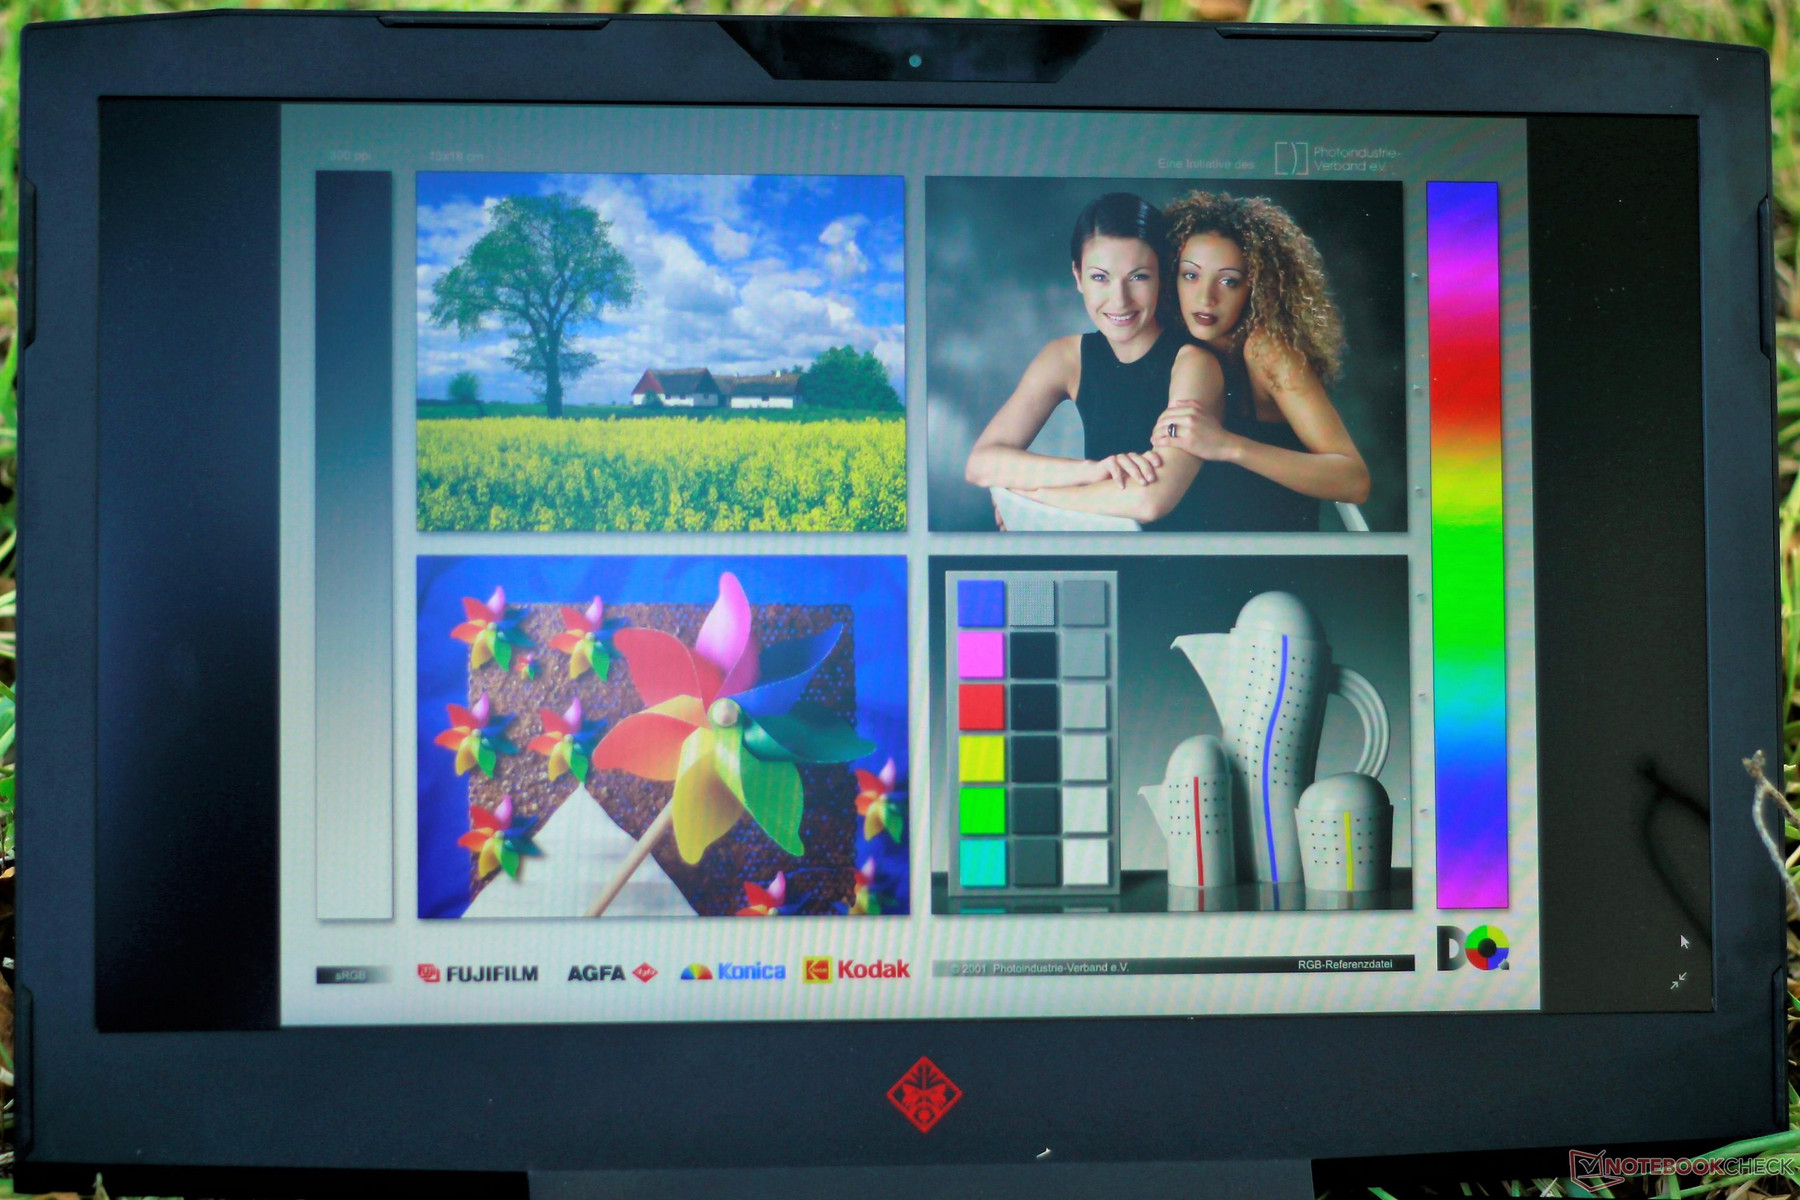
Since the panel gets reasonably bright, outdoor use is possible. Under shade, the display remains visible. Pictures and text look clear and colors look vivid. In direct sunlight, the screen becomes much harder to see. Pictures can be made out, but most users' eyes will strain to see them under the sun.


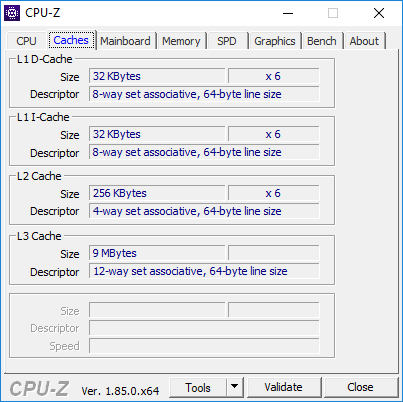
Performance
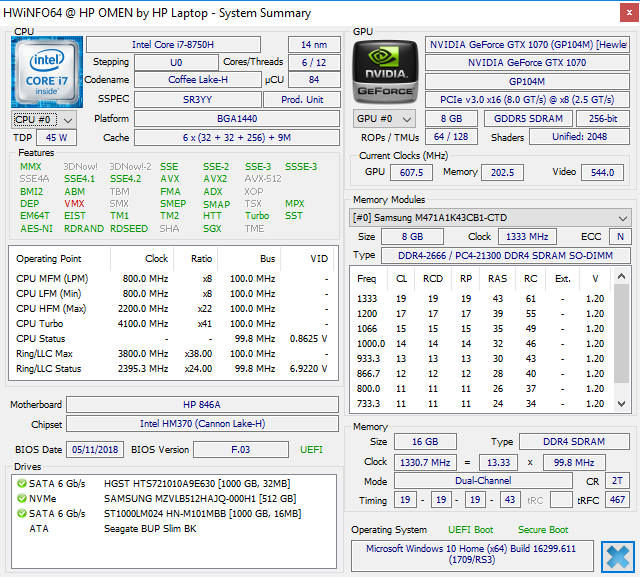
The internals of the Omen 17t are well-balanced. The hexacore Intel Core i7-8750H compliments the Nvidia GeForce GTX 1070 GPU well, resulting in a finely-tuned gaming laptop that can often push enough pixels to take advantage of its high-refresh rate display without generating an exorbitant amount of heat or noise. There is room for improvement, but the overall experience is excellent.
Processor
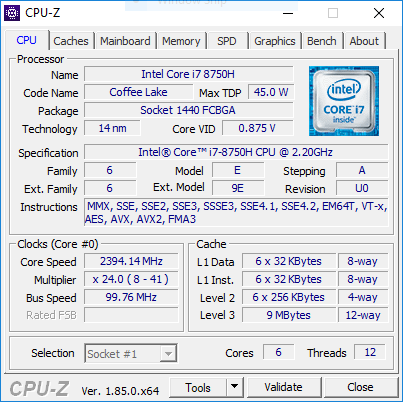
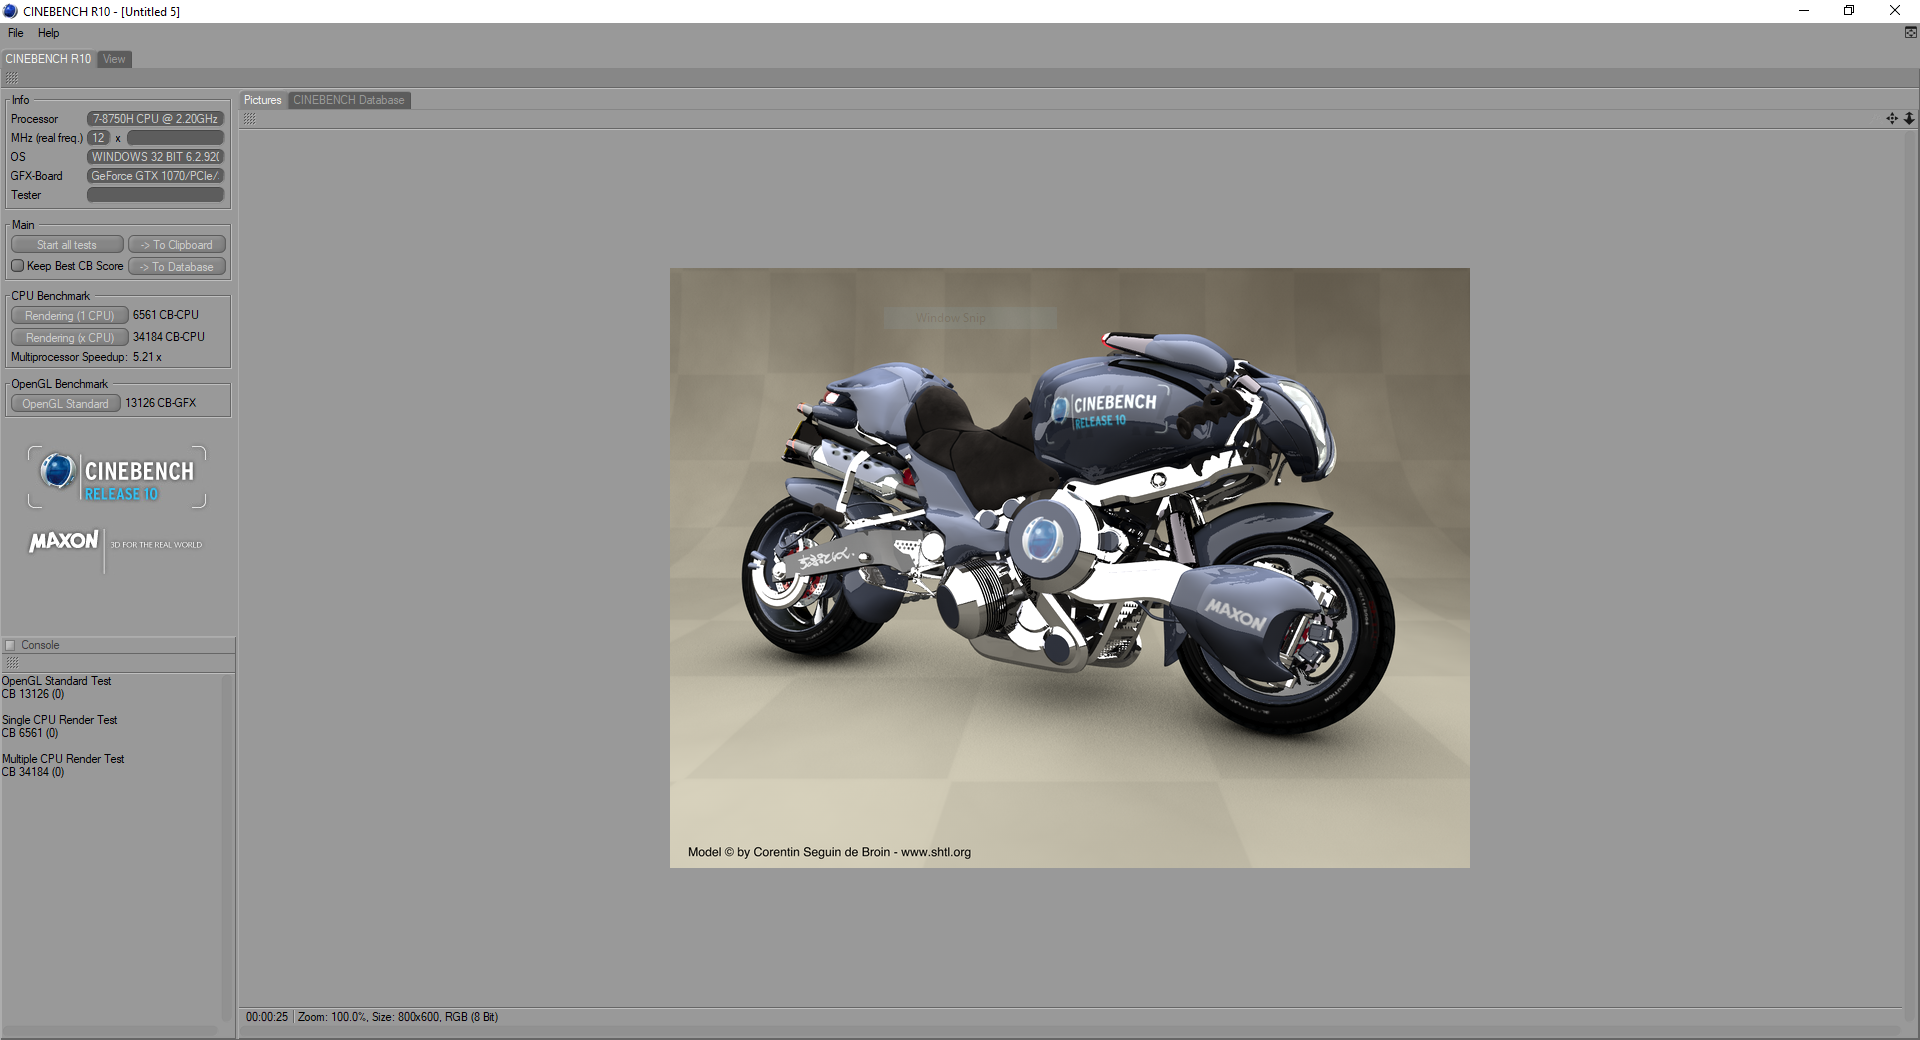
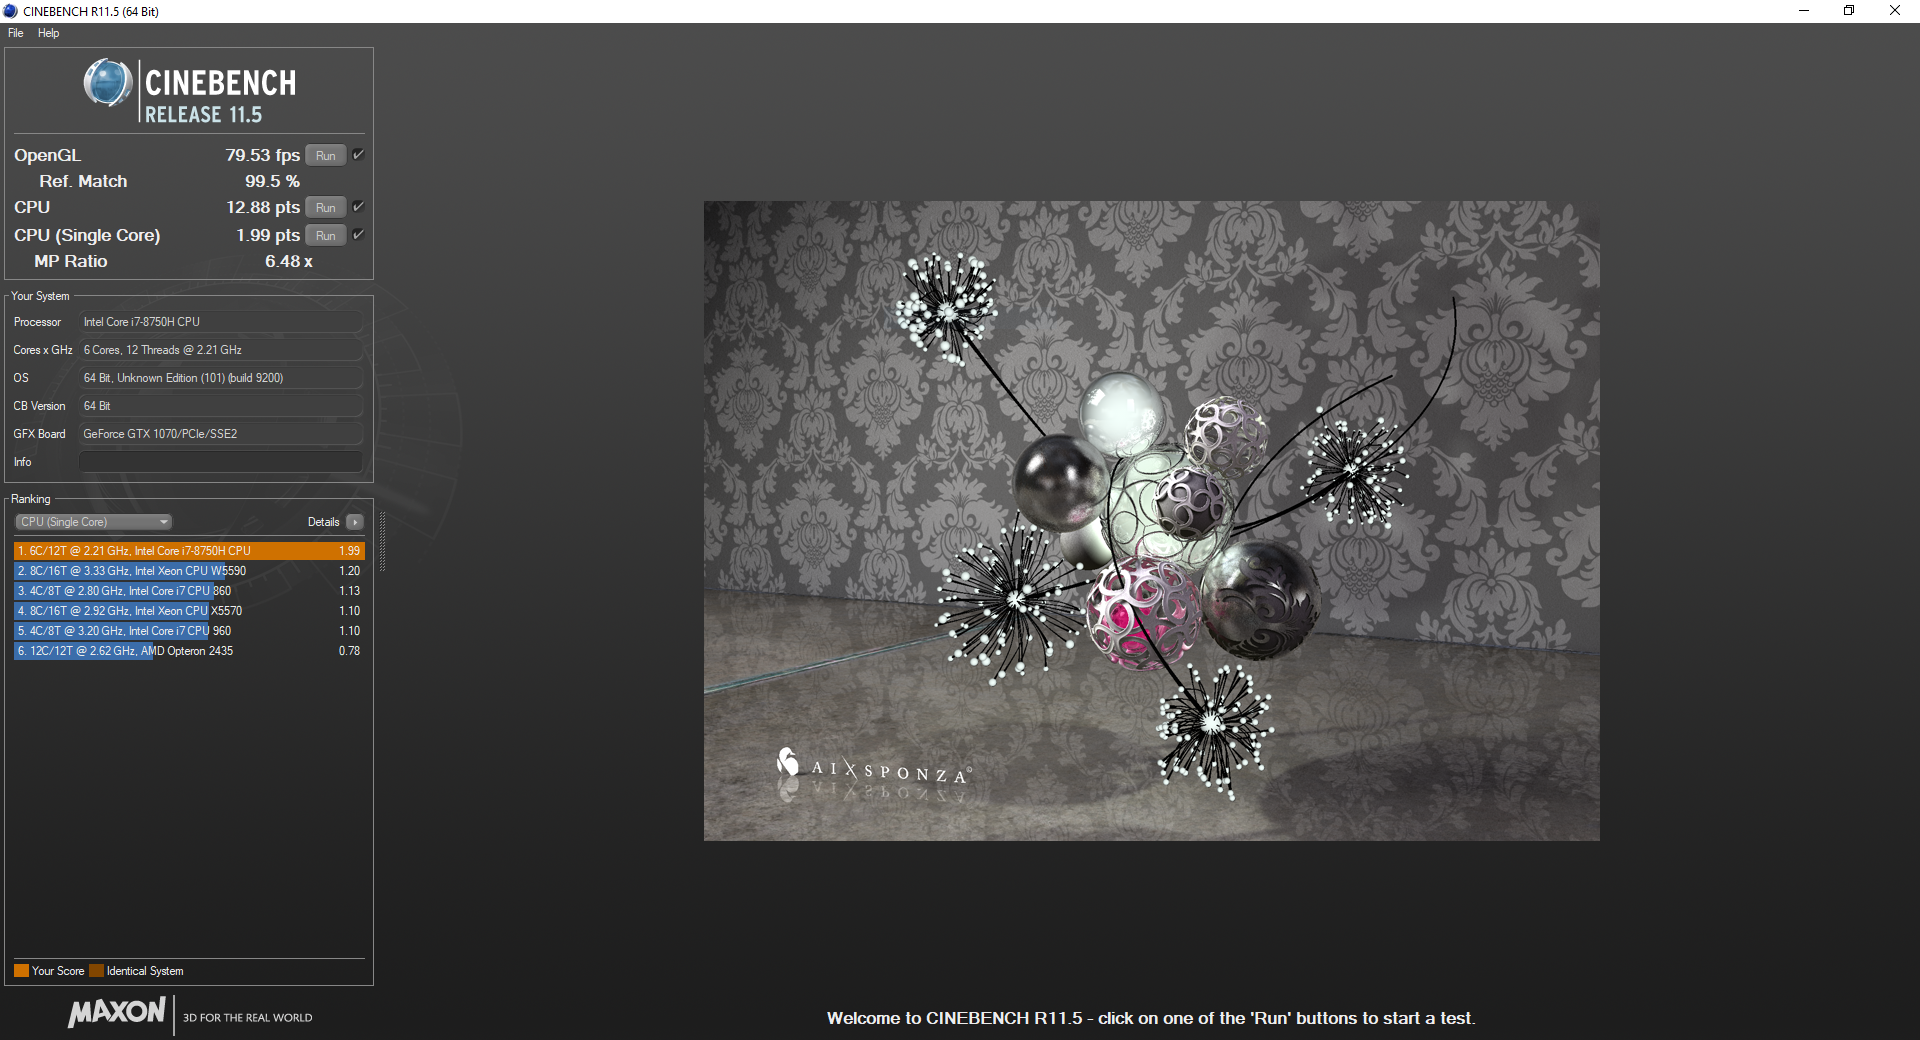
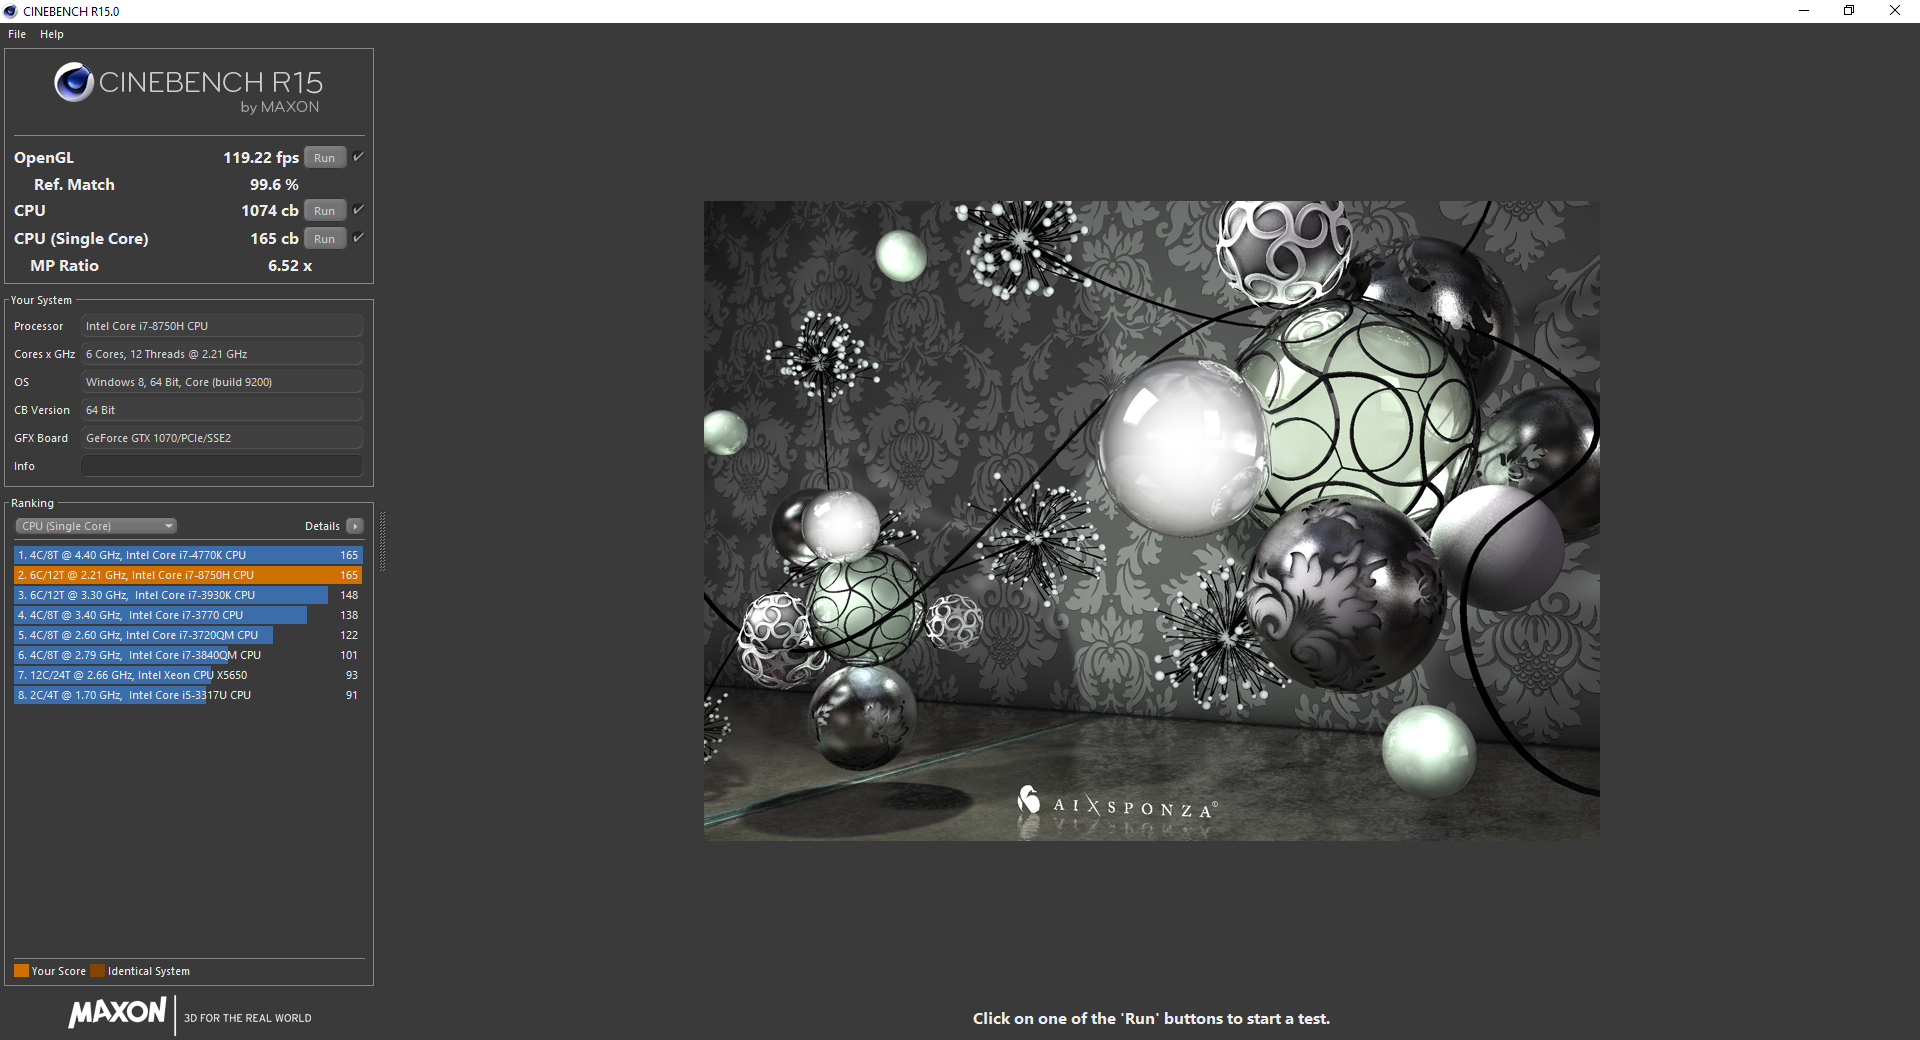
We've seen the Intel Core i7-8750H in several gaming laptops since its release earlier this year, and the processor has proved itself to be a worthy upgrade over last year's Kaby Lake Core i7-7700HQ. The 2 additional cores often improve multithreaded benchmarks by close to 50%, and that is indeed what we see here. Compared to the Asus G752VS, which uses the 7700HQ, the Omen 17t scores 45% better in Cinebench R15's multi-core test. There are more powerful options available, however. Intel's Core i9-8950HK beats the Omen 17t by 28%. AMD's desktop Ryzen 7 1700, which continues to dominate our CPU benchmarks, bests the Omen 17t by 31%. Keep in mind that the Ryzen 7 1700 has a TDP of 65 W compared to the 8750H's 45 W.
Long-term CPU performance is consistent, if a bit subdued. In our Cinebench R15 loop, the Omen 17t settles in at about 980 cb, about 9% lower than its single-pass score. There are some small spikes and dips (+/- 2%), but these shouldn't adversely affect performance. When unplugged, the Omen 17t averages 1020-1035 cb, or about a 5% reduction in performance.
For more information on the Intel Core i7-8750H, please see our dedicated CPU page here.
| wPrime 2.10 - 1024m | |
| Asus ROG Strix GL702ZC-GC204T | |
| HP Omen X 17-ap0xx | |
| Average Intel Core i7-8750H (125.5 - 180.5, n=6) | |
| HP Omen 17t-3AW55AV_1 | |
| Average of class Gaming (33 - 210, n=6, last 2 years) | |
* ... smaller is better
System Performance
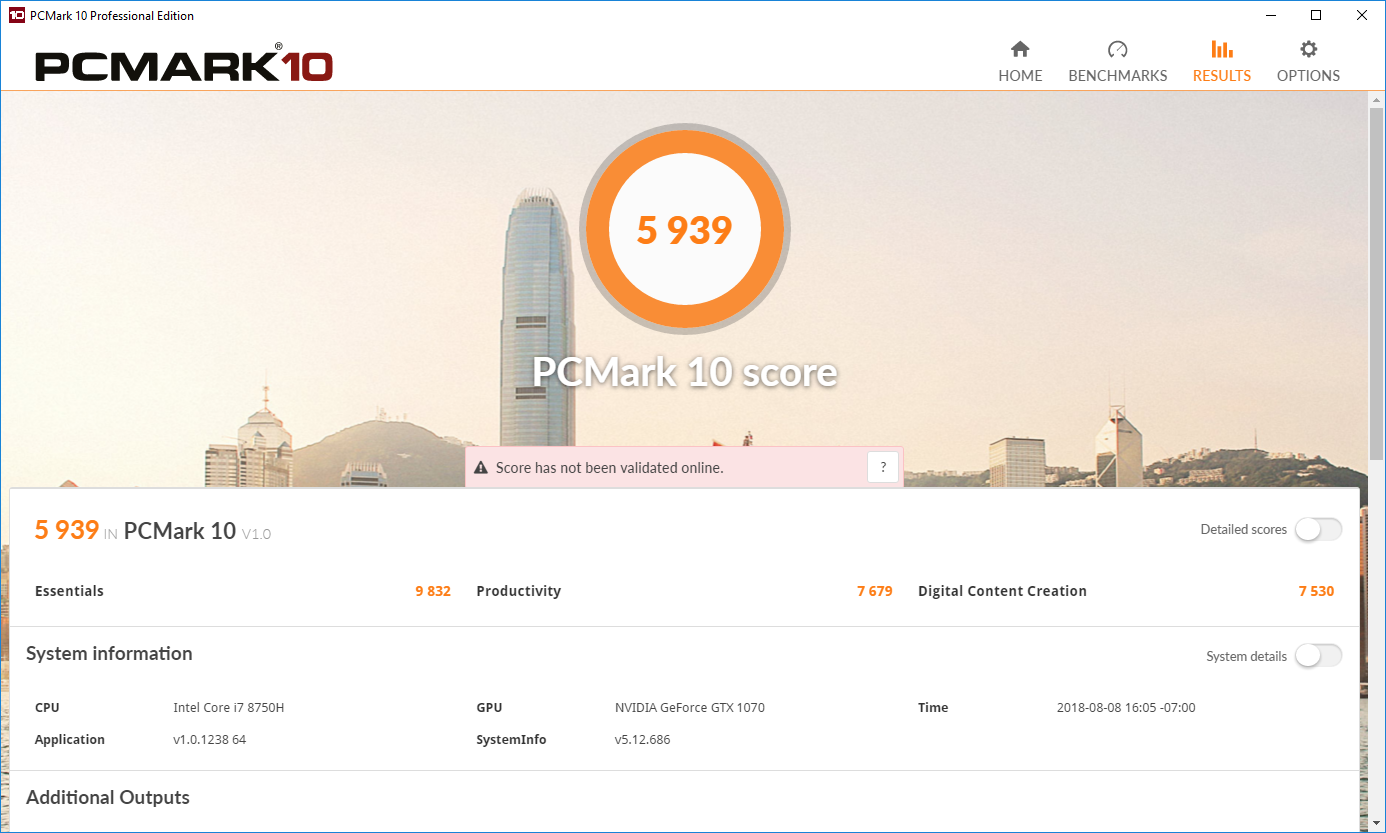
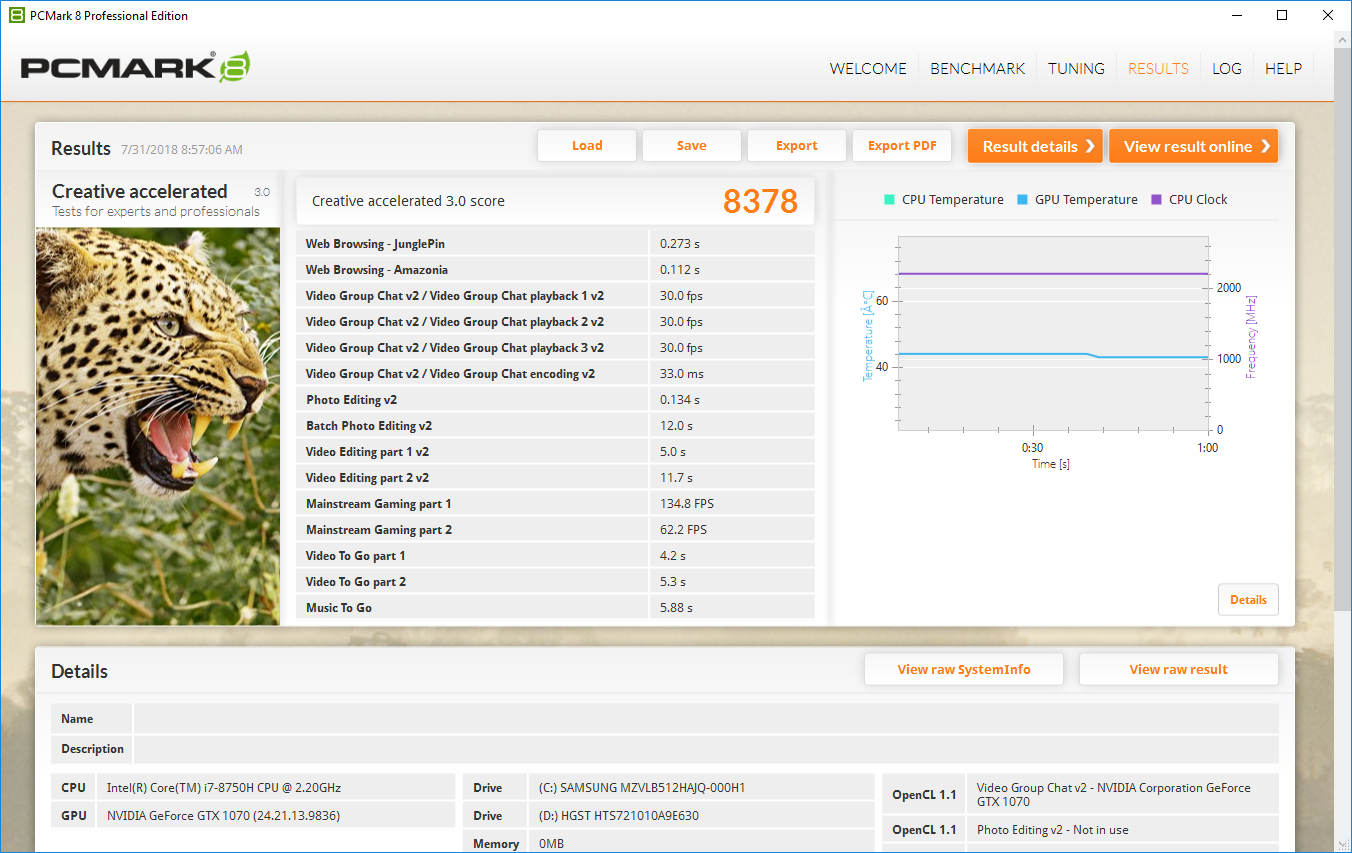
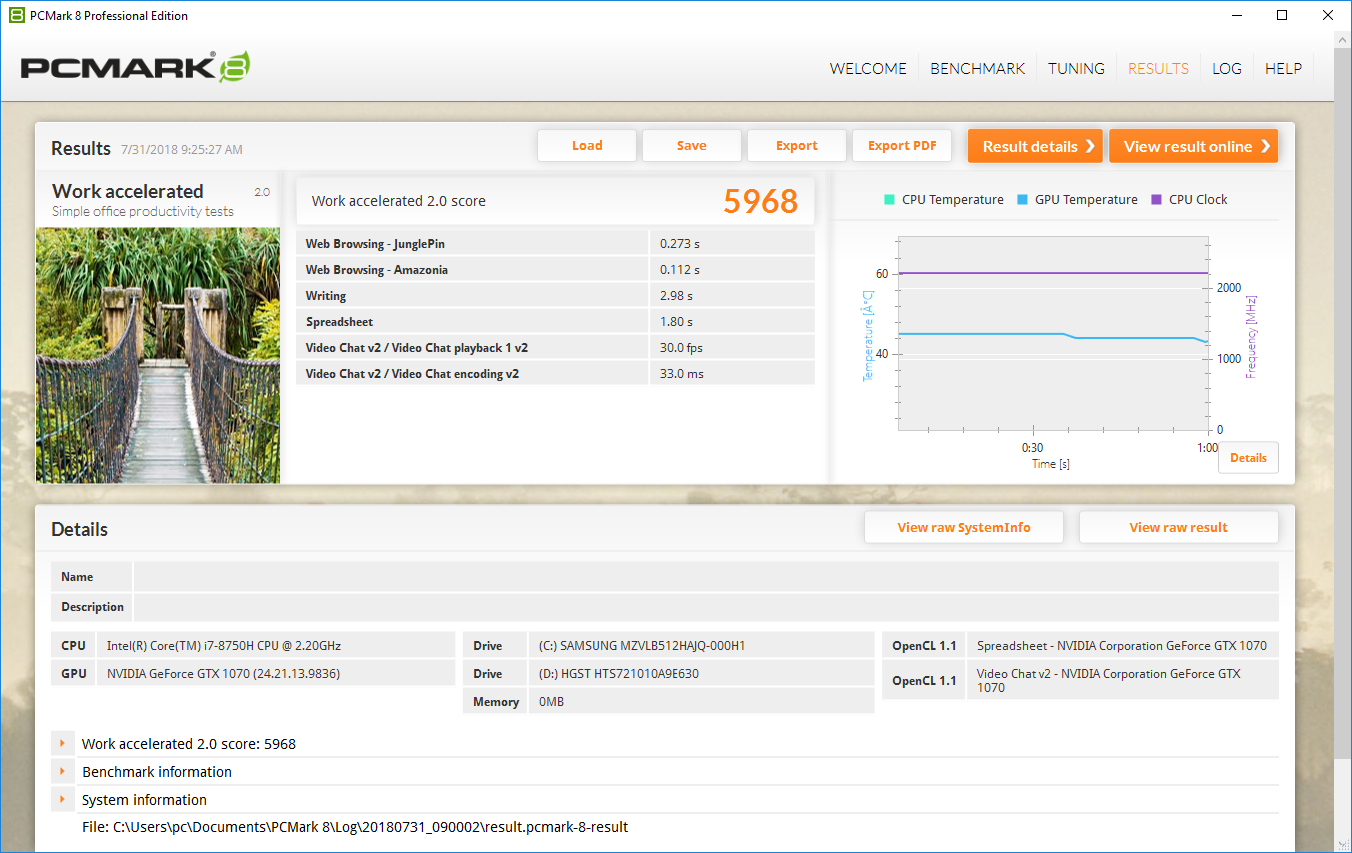
As is to be expected, overall system performance is good. The Omen 17t sits a bit above most of its competitors in PCMark 8's benchmarks. This translates to a highly responsive system in everyday use. Most apps open nearly instantly, navigating Windows is smooth, and web browsing is a snap. The UI flies on the 144 Hz screen and animations are very fluid. The Omen 17t is able to power through most workloads with relative ease.
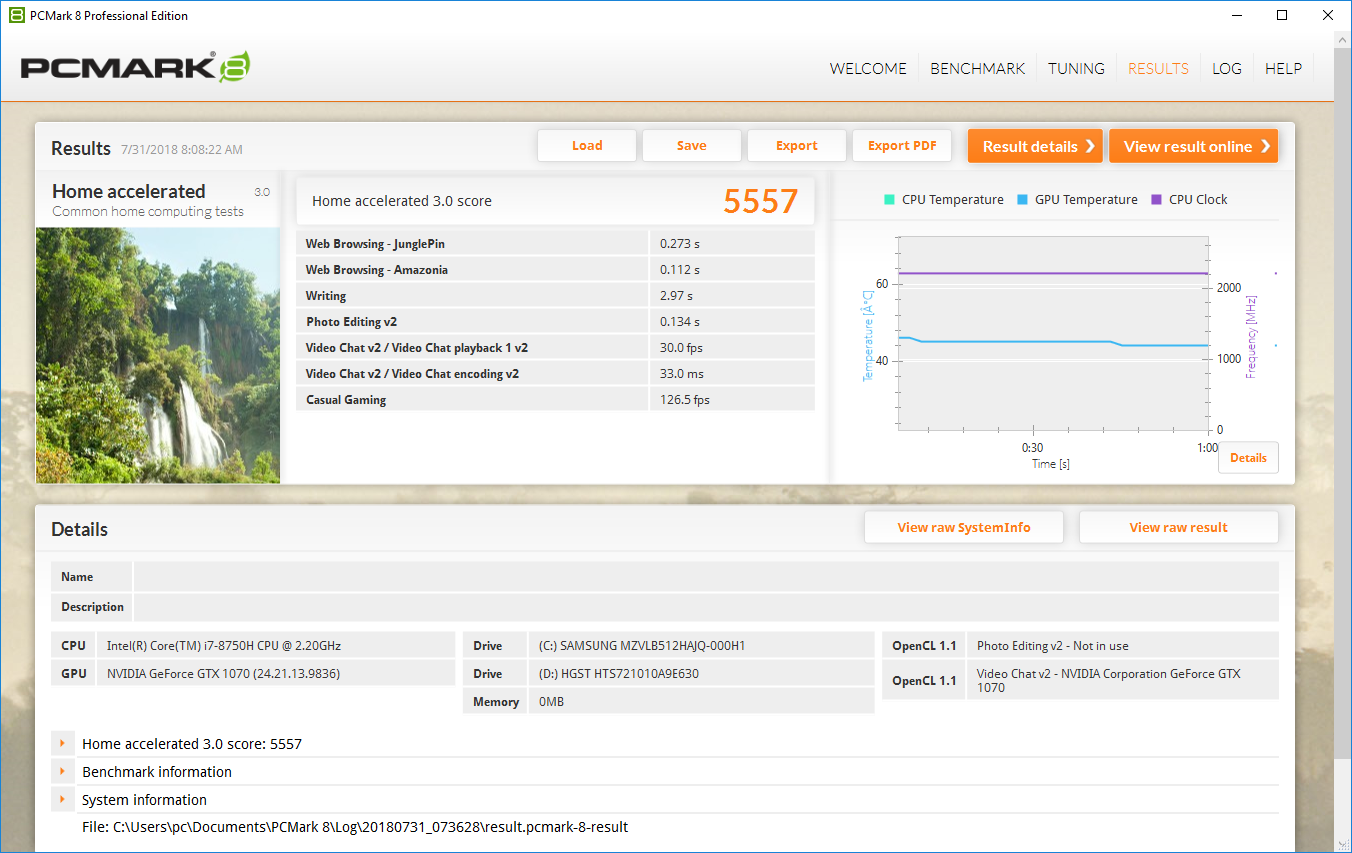
| PCMark 8 Home Score Accelerated v2 | 5557 points | |
| PCMark 8 Creative Score Accelerated v2 | 8378 points | |
| PCMark 8 Work Score Accelerated v2 | 5968 points | |
| PCMark 10 Score | 5939 points | |
Help | ||
Storage Devices
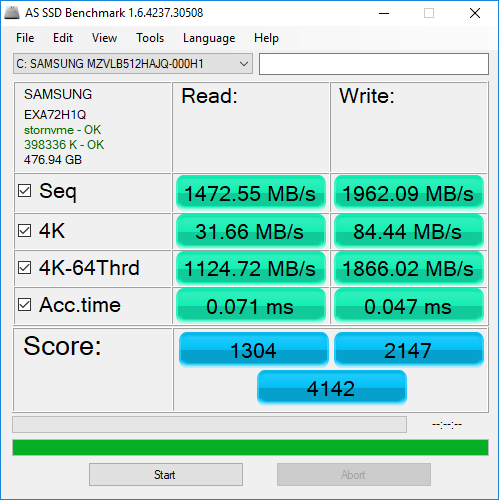
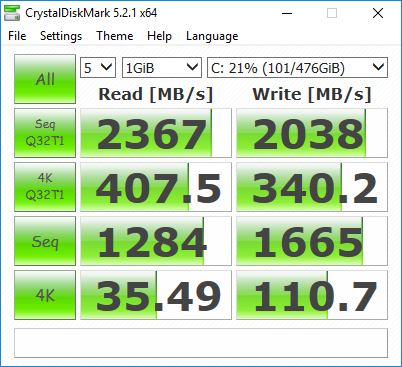
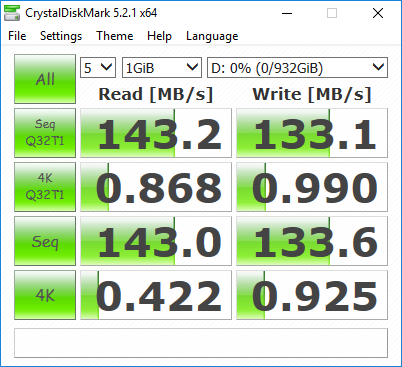
The Omen 17t uses Samsung's PM981 as its boot drive, which is one of the fastest NVMe drives available today. Write speeds are consequently fast, but read speeds are on the slower side. Otherwise, the drive is snappy. Opening heavy apps shouldn't take long, and load times in most games are quick.
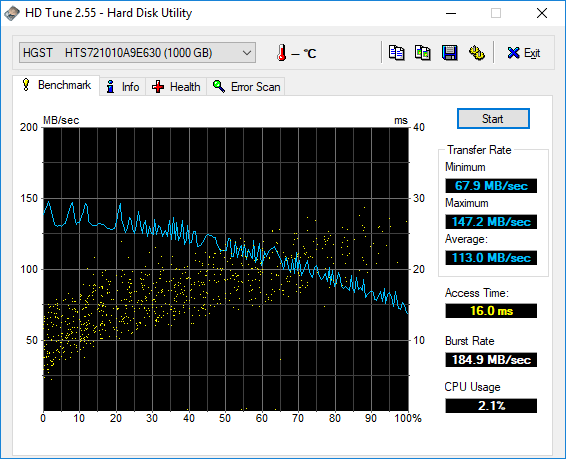
The 1 TB mechanical HDD used for mass storage is about average for a 7200 RPM drive. Both the boot drive and mass storage drive are easily accessible. Unfortunately, the empty space occupied by the optical drive in earlier models cannot be used to house a third drive.
| HP Omen 17t-3AW55AV_1 Samsung SSD PM981 MZVLB512HAJQ | Alienware 17 R4 SK Hynix PC300 NVMe 512 GB | EVGA SC17 GTX 1070 Samsung SM951 MZVPV256 m.2 | Acer Predator 17 G9-793-70PJ Toshiba NVMe THNSN5512GPU7 | Asus G752VS-BA338T Samsung SM961 MZVKW512HMJP m.2 PCI-e | Eurocom Q8 Samsung SSD 960 Pro 512 GB m.2 | MSI GE73 8RF-008 Raider RGB Toshiba HG6 THNSNJ256G8NY | Aorus X9 DT Transcend TS1TMTE850 | Average Samsung SSD PM981 MZVLB512HAJQ | |
|---|---|---|---|---|---|---|---|---|---|
| AS SSD | -29% | -4% | -6% | 17% | 12% | -84% | -22% | 8% | |
| Copy Game MB/s (MB/s) | 875 | 574 -34% | 1034 18% | 1217 39% | 958 9% | 295.5 -66% | 1057 ? 21% | ||
| Copy Program MB/s (MB/s) | 481.1 | 446.1 -7% | 470 -2% | 445.1 -7% | 406.7 -15% | 192.9 -60% | 454 ? -6% | ||
| Copy ISO MB/s (MB/s) | 1080 | 1227 14% | 1337 24% | 2145 99% | 1596 48% | 412.5 -62% | 1755 ? 63% | ||
| Score Total (Points) | 4142 | 2072 -50% | 2328 -44% | 2547 -39% | 3056 -26% | 3840 -7% | 881 -79% | 2145 -48% | 3966 ? -4% |
| Score Write (Points) | 2147 | 858 -60% | 487 -77% | 890 -59% | 1480 -31% | 1579 -26% | 254 -88% | 916 -57% | 1780 ? -17% |
| Score Read (Points) | 1304 | 831 -36% | 1238 -5% | 1112 -15% | 1077 -17% | 1515 16% | 417 -68% | 828 -37% | 1451 ? 11% |
| Access Time Write * (ms) | 0.047 | 0.123 -162% | 0.033 30% | 0.033 30% | 0.027 43% | 0.035 26% | 0.097 -106% | 0.038 19% | 0.08337 ? -77% |
| Access Time Read * (ms) | 0.071 | 0.042 41% | 0.049 31% | 0.052 27% | 0.058 18% | 0.043 39% | 0.235 -231% | 0.042 41% | 0.05092 ? 28% |
| 4K-64 Write (MB/s) | 1866 | 671 -64% | 260.9 -86% | 646 -65% | 1185 -36% | 1285 -31% | 172.7 -91% | 715 -62% | 1504 ? -19% |
| 4K-64 Read (MB/s) | 1125 | 620 -45% | 999 -11% | 851 -24% | 744 -34% | 1232 10% | 351.4 -69% | 654 -42% | 1203 ? 7% |
| 4K Write (MB/s) | 84.4 | 113.4 34% | 112.1 33% | 120.8 43% | 138.9 65% | 107.9 28% | 38.34 -55% | 98.9 17% | 112 ? 33% |
| 4K Read (MB/s) | 31.66 | 35.61 12% | 45.64 44% | 37.51 18% | 49.71 57% | 35.57 12% | 14.07 -56% | 22.23 -30% | 50.5 ? 60% |
| Seq Write (MB/s) | 1962 | 735 -63% | 1144 -42% | 1230 -37% | 1554 -21% | 1869 -5% | 425.7 -78% | 1019 -48% | 1637 ? -17% |
| Seq Read (MB/s) | 1473 | 1752 19% | 1934 31% | 2237 52% | 2824 92% | 2481 68% | 511 -65% | 1518 3% | 1976 ? 34% |
* ... smaller is better

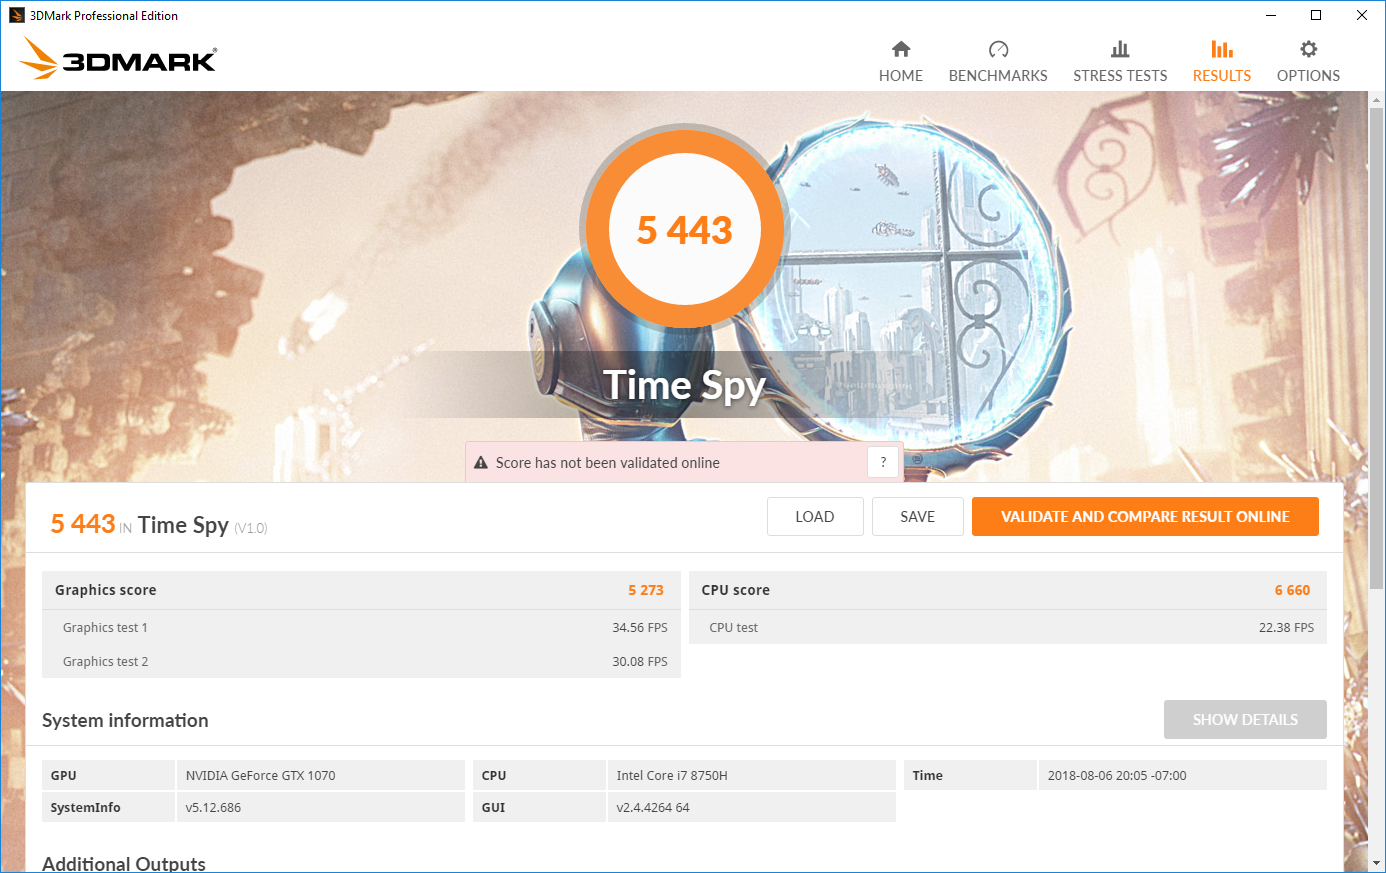
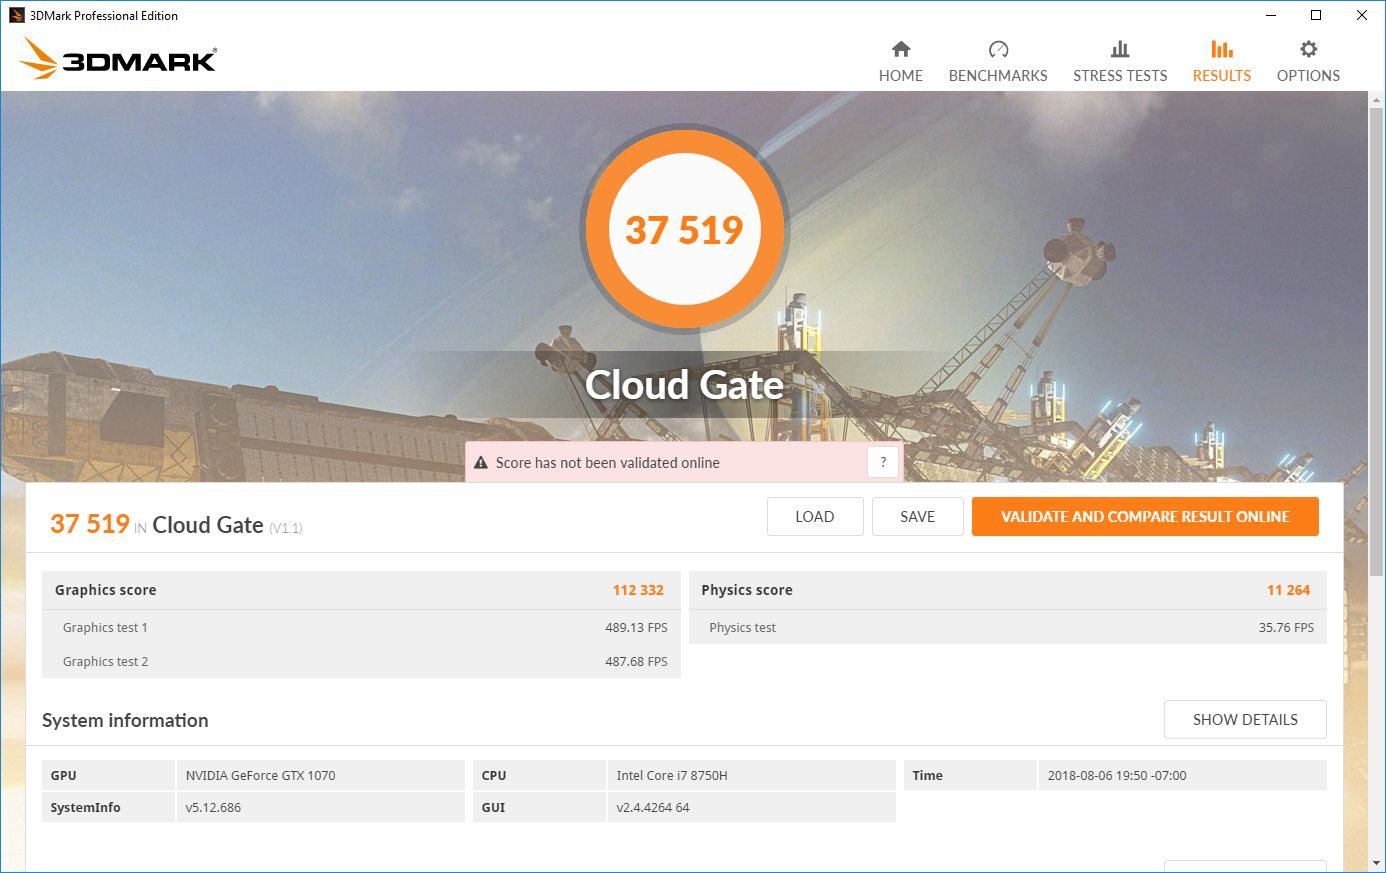
GPU Performance
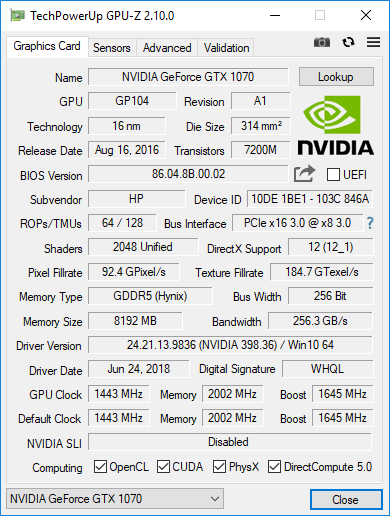
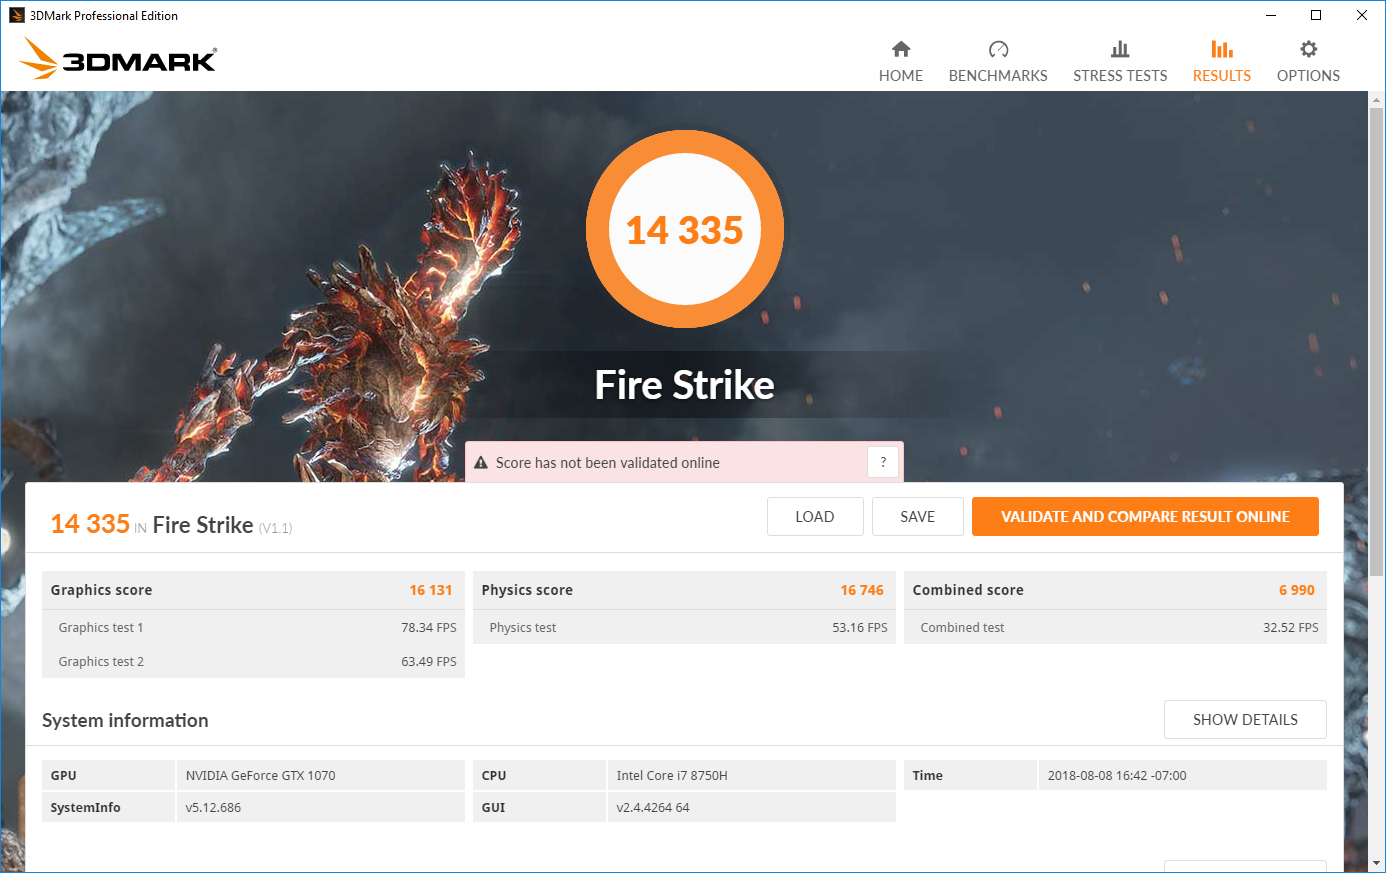
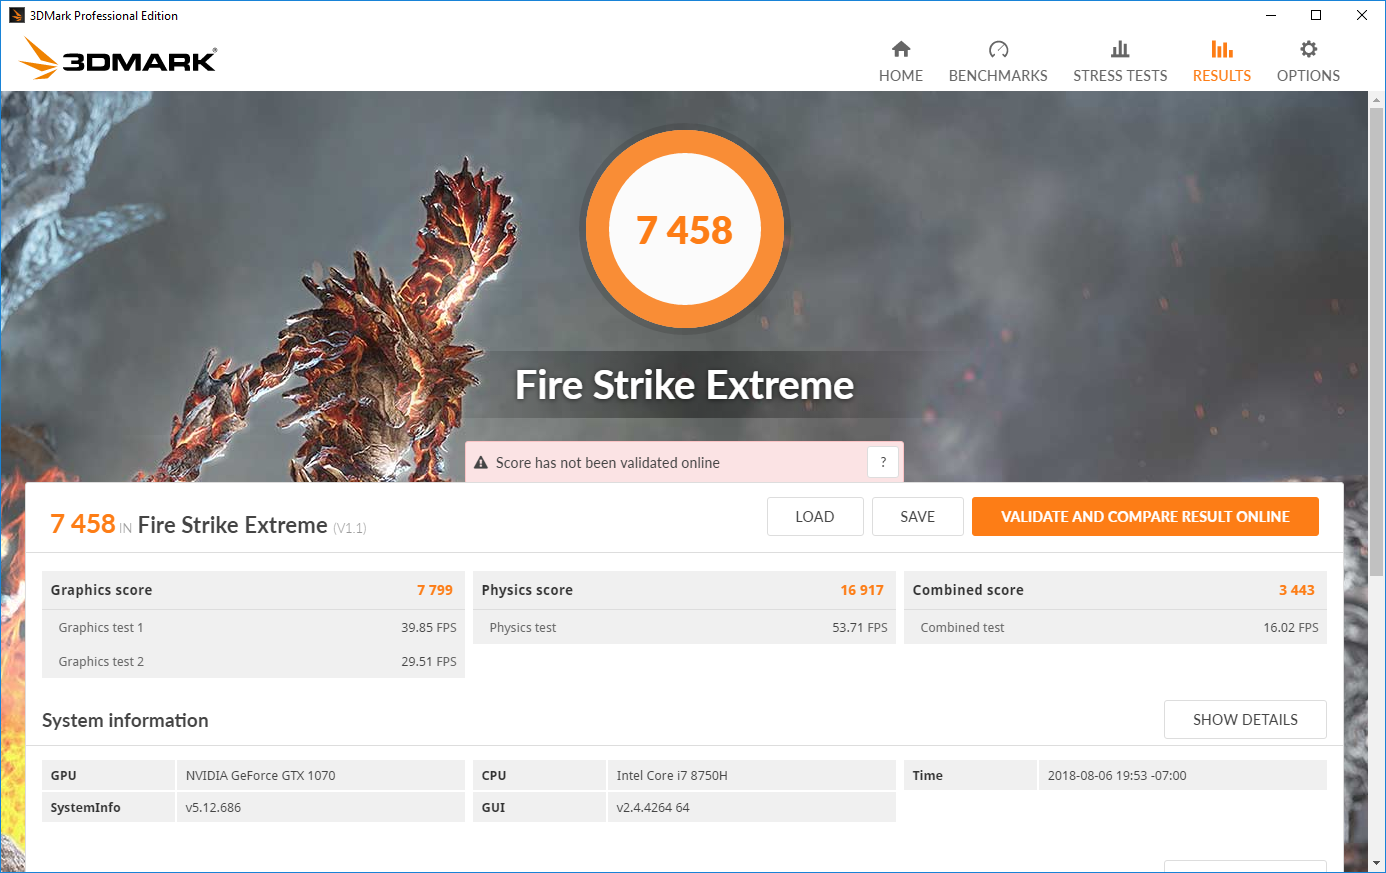
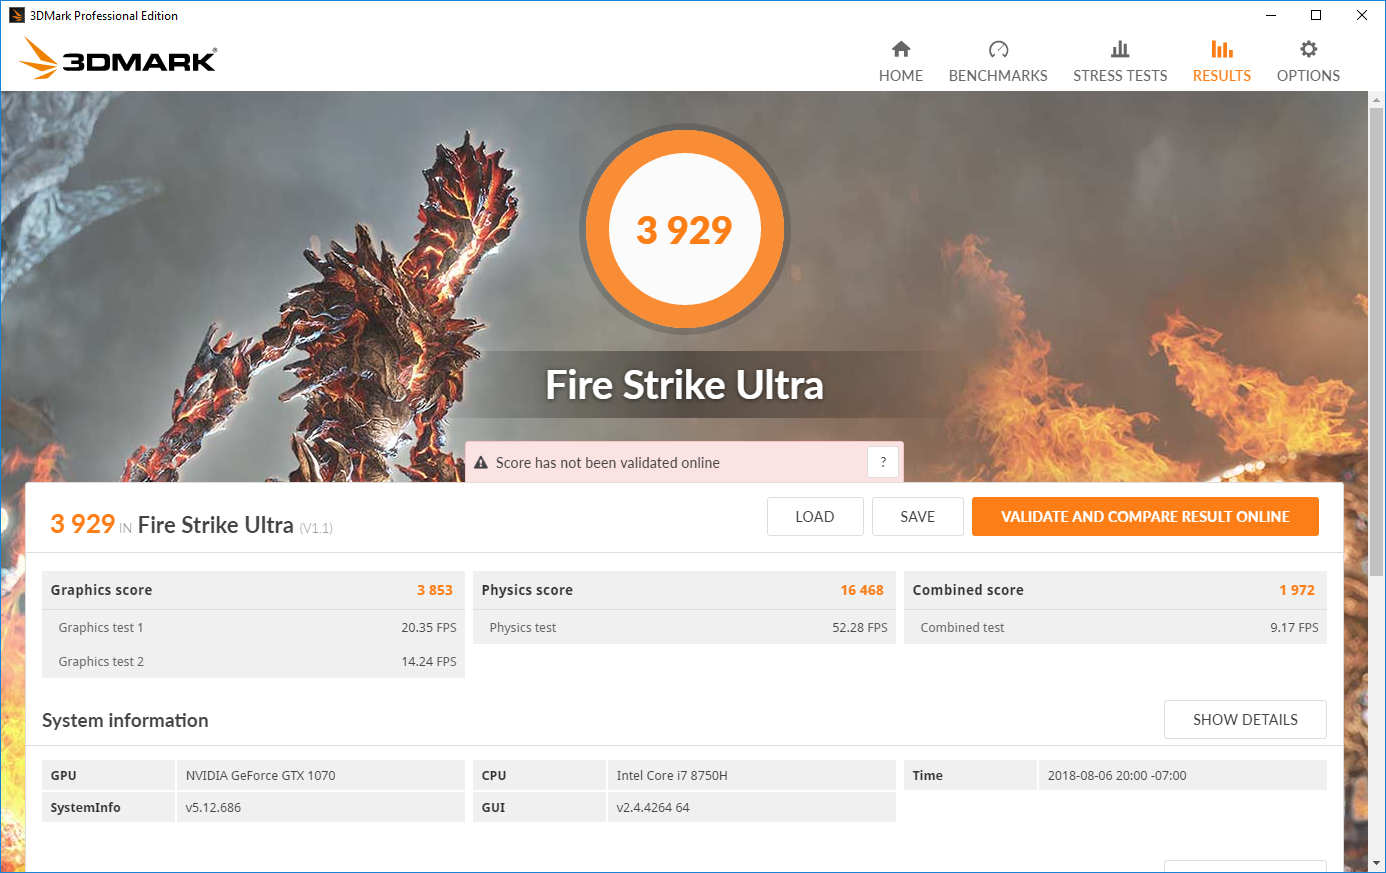
Nvidia's GeForce GTX 1070 is a solid choice for high-end gaming laptops aiming for affordability. While the GTX 1080 is about 35-40% faster (as measured by Fire Strike), it is also much more expensive and comes with the additional cost of increased energy consumption and heat output. Because of its GPU, the Omen 17t can (mostly) take advantage of its high-refresh rate display while keeping heat and fan noise at bay. HP can also price the device more competitively.
That said, the GTX 1070 in our machine is a bit below the average GTX 1070-powered gaming laptop. The GPU cannot be overclocked (at least through any stock software). Still, all but the most graphically intensive tasks should be well-handled by the Omen 17t. Nvidia's GTX 1070 Max-Q falls about 10-12% behind the Omen, and the GTX 1060 manages a little more than two-thirds the 1070's performance. The Aorus X9 DT, with its GTX 1080, is significantly more powerful for 3D rendering, but it is also much louder, hotter, and more expensive.
For more information about the Nvidia GeForce GTX 1070, please see our dedicated GPU page here.
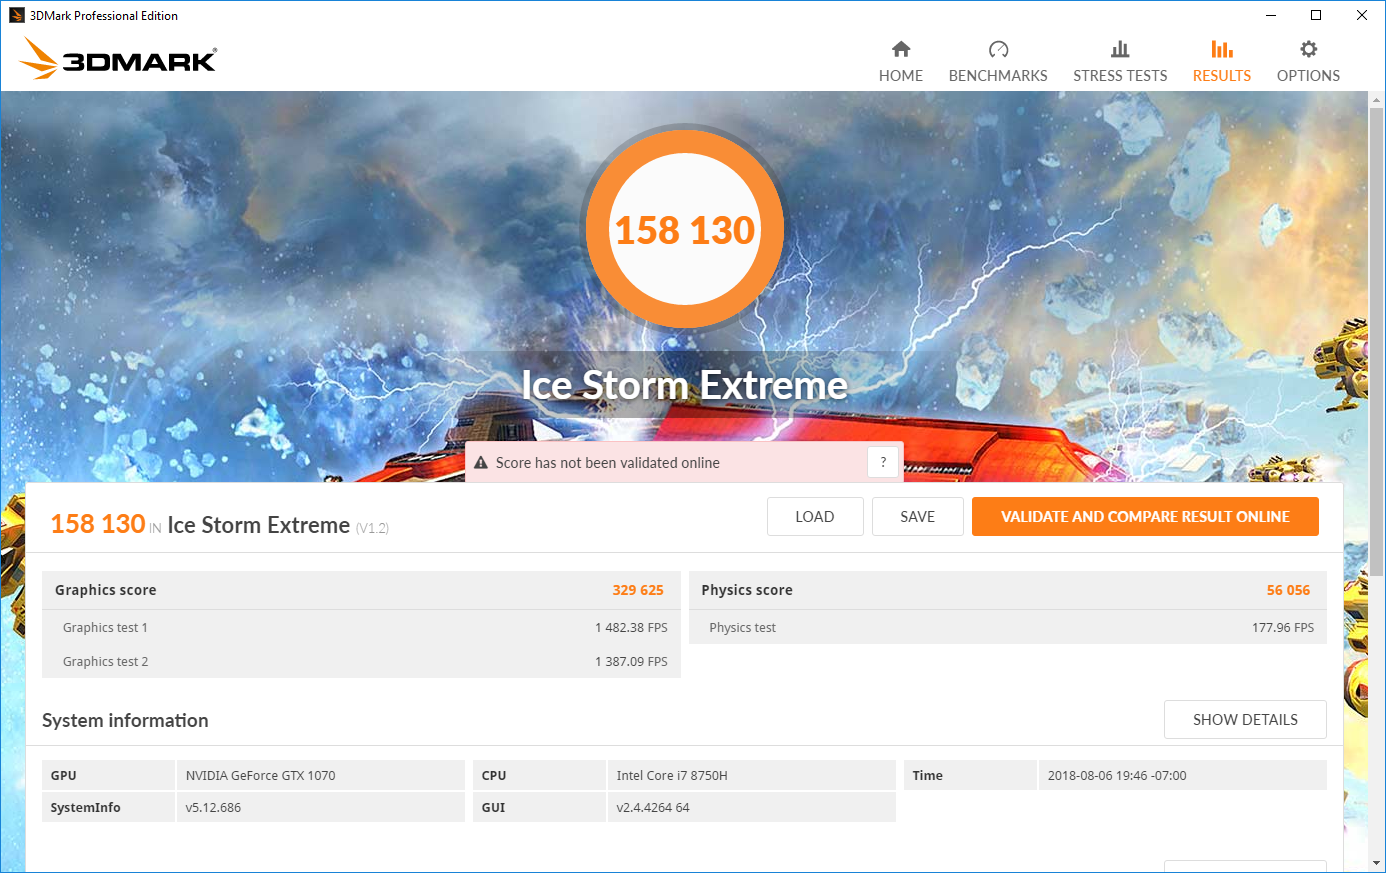
| 3DMark 11 Performance | 17921 points | |
| 3DMark Cloud Gate Standard Score | 37519 points | |
| 3DMark Fire Strike Score | 14335 points | |
Help | ||
Gaming Performance
The Omen 17t fits in well with other Full HD gaming laptops, but its high-refresh rate display sweetens the package. Most modern titles will hit 60-75 FPS at Ultra settings, Full HD. To fully take advantage of the 144 Hz panel, users may want to dial settings back a bit. For example, Rise of the Tomb Raider averages about 100 FPS at FHD/High settings, and gameplay glides across the screen. Lighter and more competitive titles like Rocket League and CS:GO will easily shoot past 144 frames per second, even when settings are turned all the way up. This is good news, as the high refresh rate is best suited for games that require quick reactions.
| The Witcher 3 | |
| 1920x1080 High Graphics & Postprocessing (Nvidia HairWorks Off) | |
| Average of class Gaming (181 - 341, n=3, last 2 years) | |
| Aorus X9 DT | |
| Asus G752VS-BA338T | |
| MSI GE73 8RF-008 Raider RGB | |
| Average NVIDIA GeForce GTX 1070 Mobile (83 - 123, n=30) | |
| Acer Predator 17 G9-793-70PJ | |
| HP Omen 17t-3AW55AV_1 | |
| 1920x1080 Ultra Graphics & Postprocessing (HBAO+) | |
| Average of class Gaming (95 - 240, n=8, last 2 years) | |
| Alienware 17 R4 | |
| Aorus X9 DT | |
| HP Omen X 17-ap0xx | |
| MSI GE73 8RF-008 Raider RGB | |
| Asus G752VS-BA338T | |
| Acer Predator 17 G9-793-70PJ | |
| Average NVIDIA GeForce GTX 1070 Mobile (48.2 - 68.4, n=41) | |
| HP Omen 17t-3AW55AV_1 | |
| Eurocom Q8 | |
| Rise of the Tomb Raider | |
| 1920x1080 High Preset AA:FX AF:4x | |
| Asus G752VS-BA338T | |
| Average NVIDIA GeForce GTX 1070 Mobile (83.2 - 118.8, n=18) | |
| HP Omen 17t-3AW55AV_1 | |
| 1920x1080 Very High Preset AA:FX AF:16x | |
| Alienware 17 R4 | |
| HP Omen X 17-ap0xx | |
| Asus G752VS-BA338T | |
| EVGA SC17 GTX 1070 | |
| Average NVIDIA GeForce GTX 1070 Mobile (79.1 - 102.5, n=25) | |
| HP Omen 17t-3AW55AV_1 | |
| low | med. | high | ultra | 4K | |
|---|---|---|---|---|---|
| The Witcher 3 (2015) | 268 | 191 | 83 | 57 | |
| Rise of the Tomb Raider (2016) | 253 | 174 | 103 | 87 | |
| Rocket League (2017) | 250 | 250 | 231 | 173 | |
| Middle-earth: Shadow of War (2017) | 186 | 127 | 98 | 76 | |
| Final Fantasy XV Benchmark (2018) | 140 | 82 | 63 |
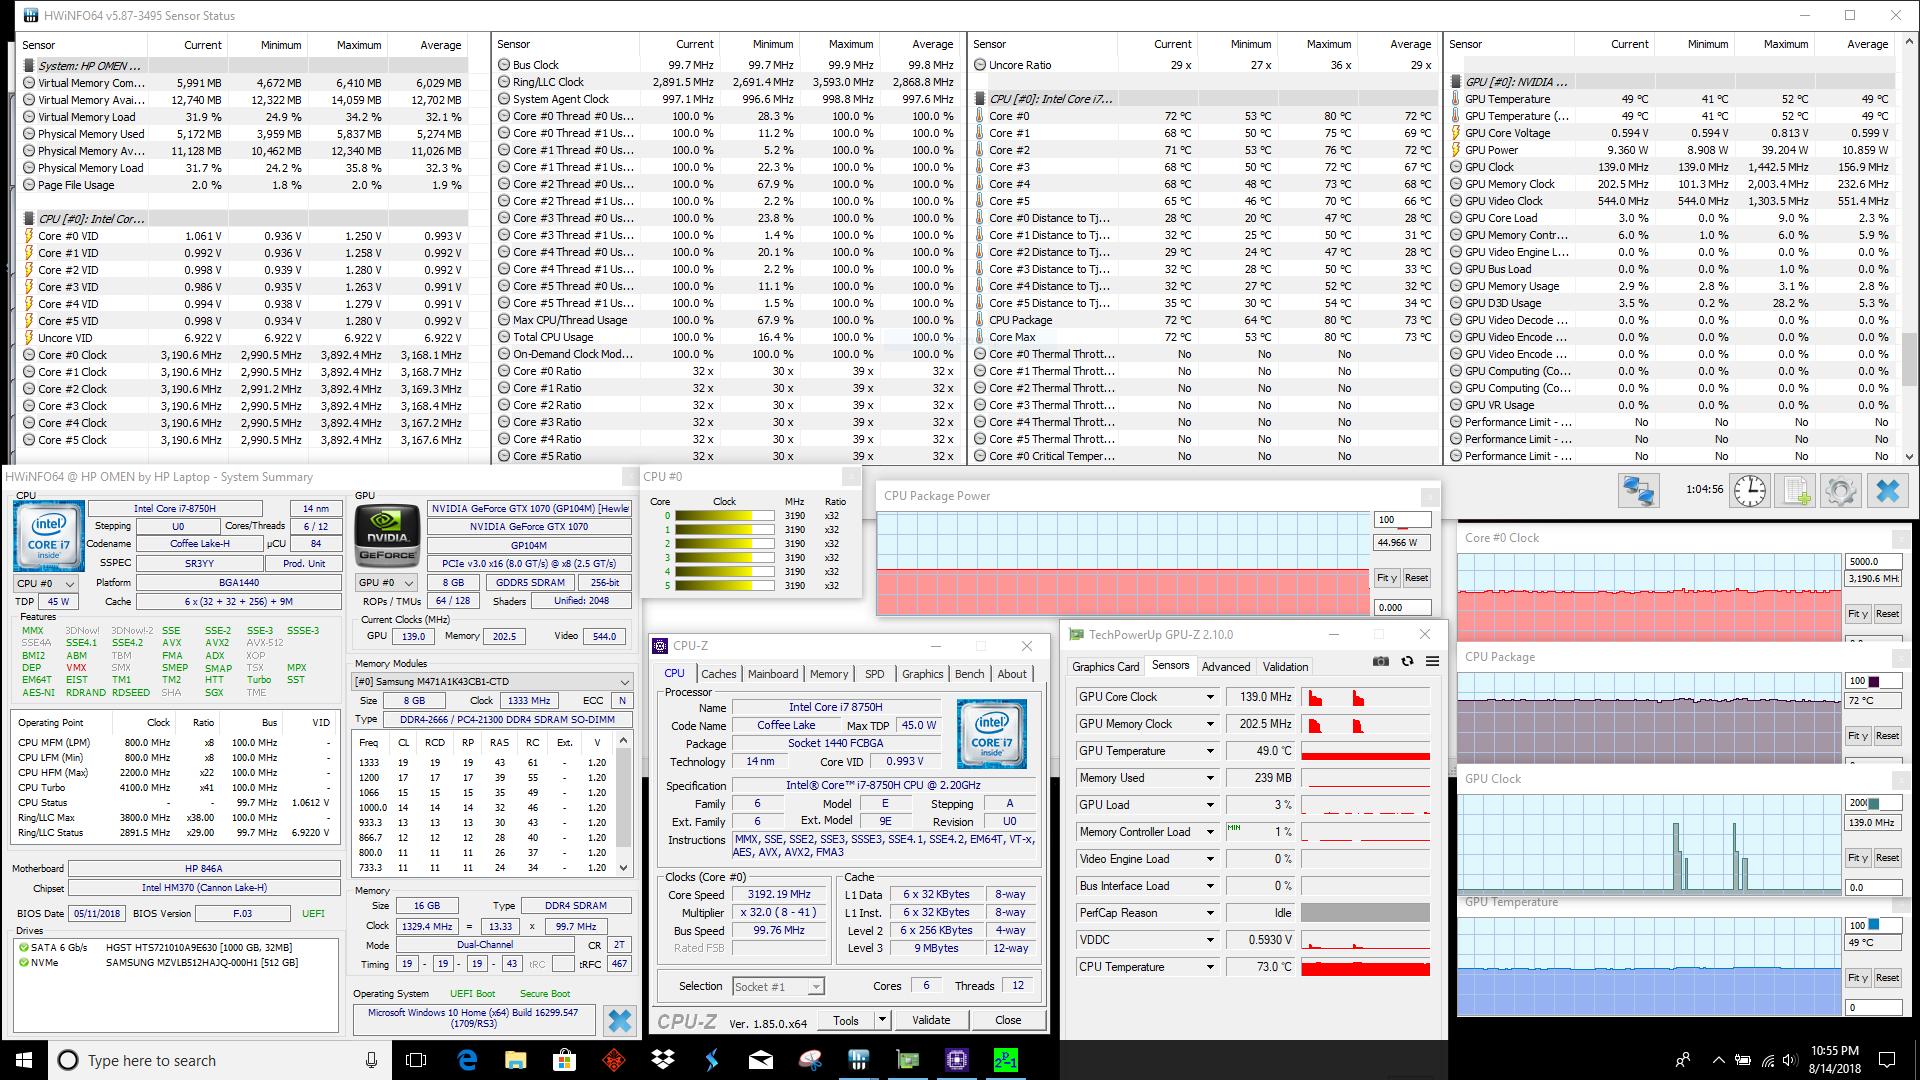
Stress Test
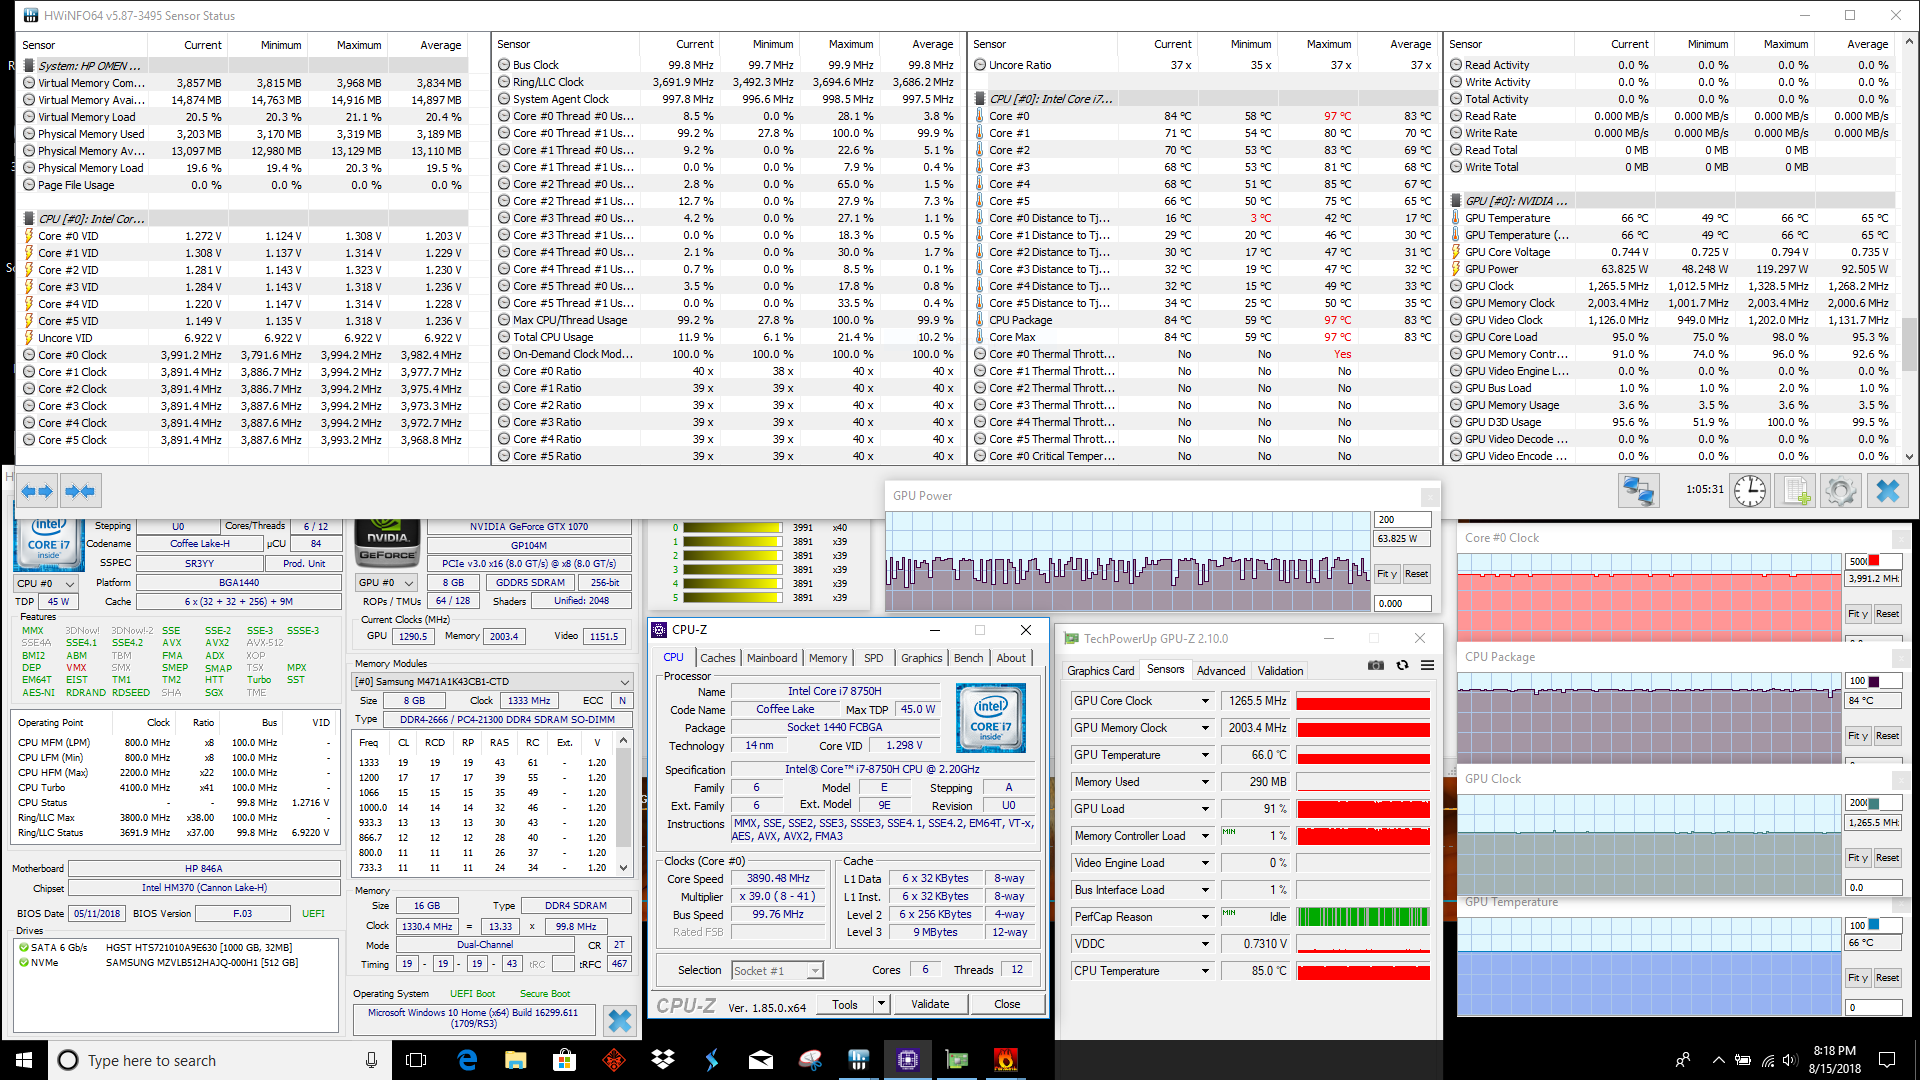
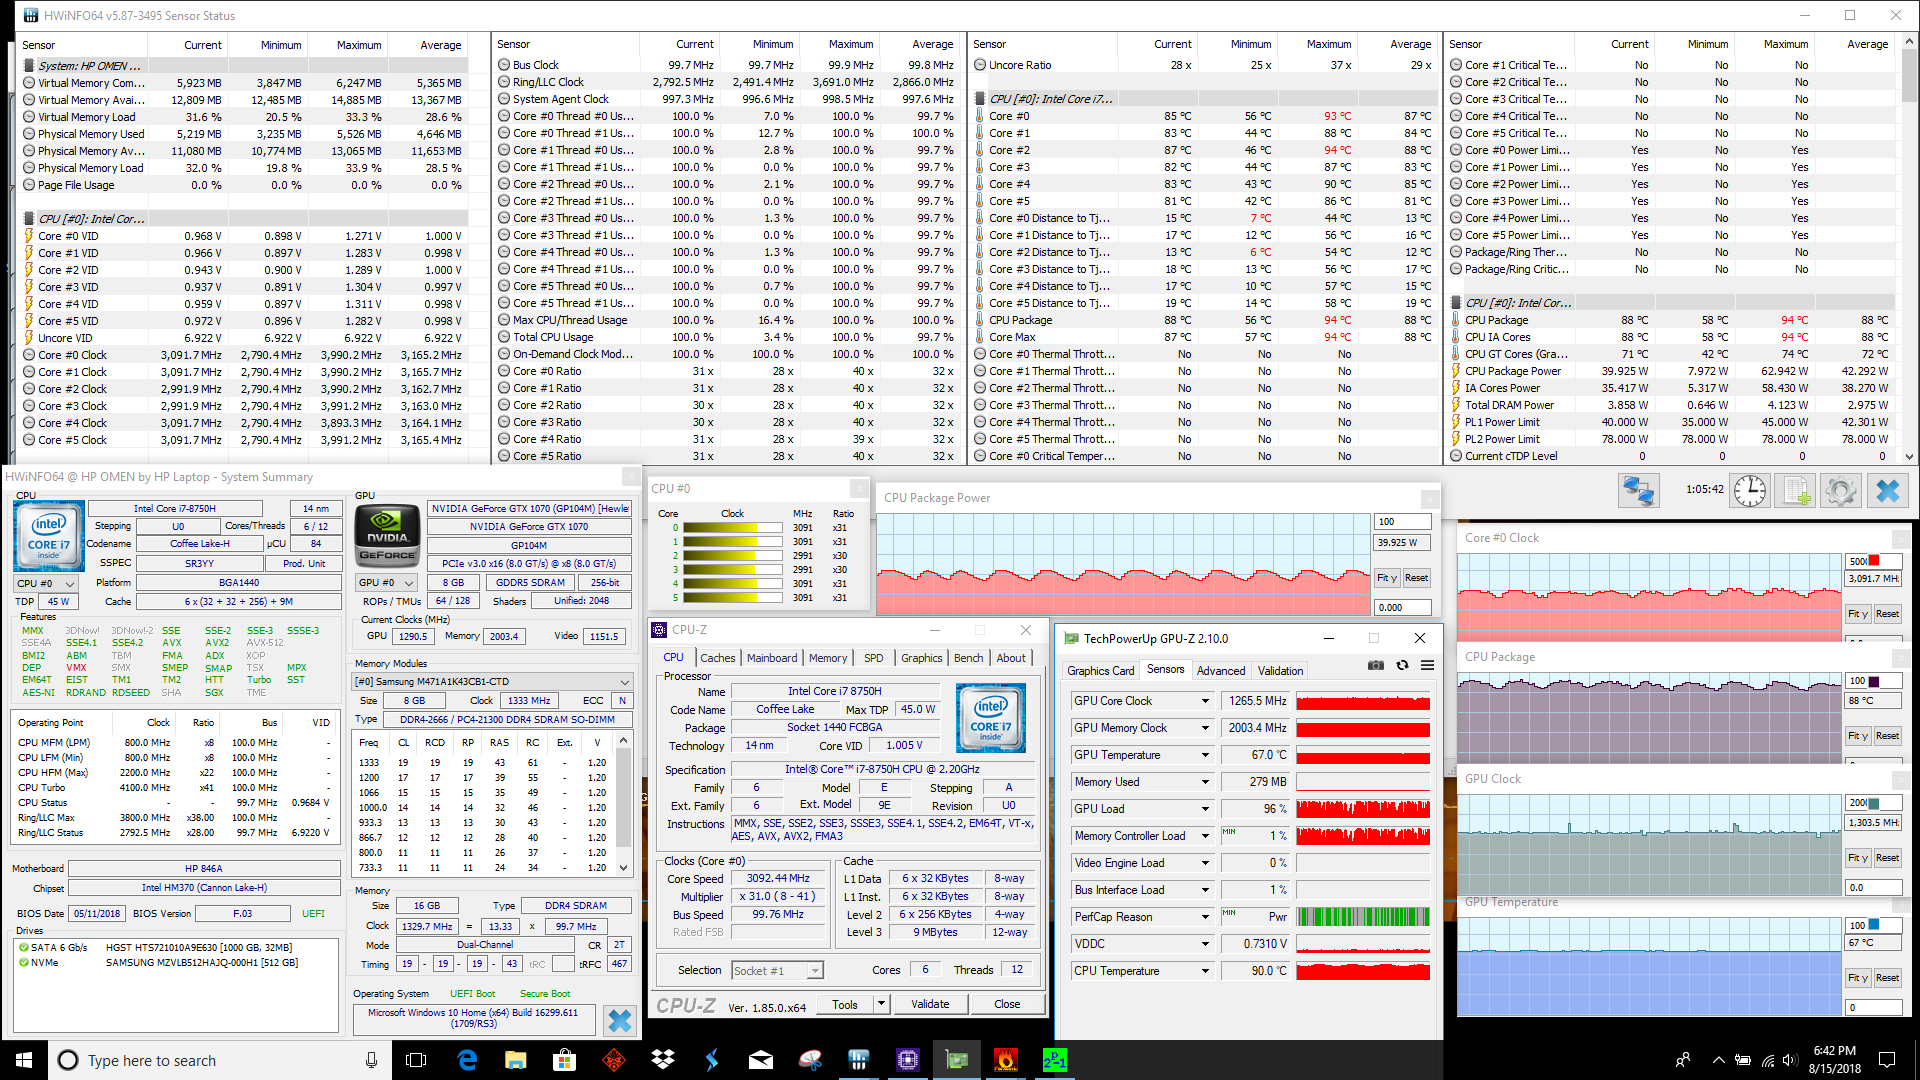
One area where the Omen 17t excels is stress management. When under full synthetic load via Prime95, the CPU remains consistent at 3.2 GHz and 72° C. The story is very similar for the GPU; after running FurMark for an hour, the GPU stayed steady at 1265 MHz and 66° C. Both tests showed impressive internal temperatures, which helped keep fan noise down as well. Loading both the CPU and GPU causes some oscillation in CPU performance; the Core i7-8750H bounces between 3.1-3.2 GHz in a regular pattern, as does its core temperature, which fluctuates between 80-90° C. The GPU pushes on, hitting 1300 MHz and 67° C.
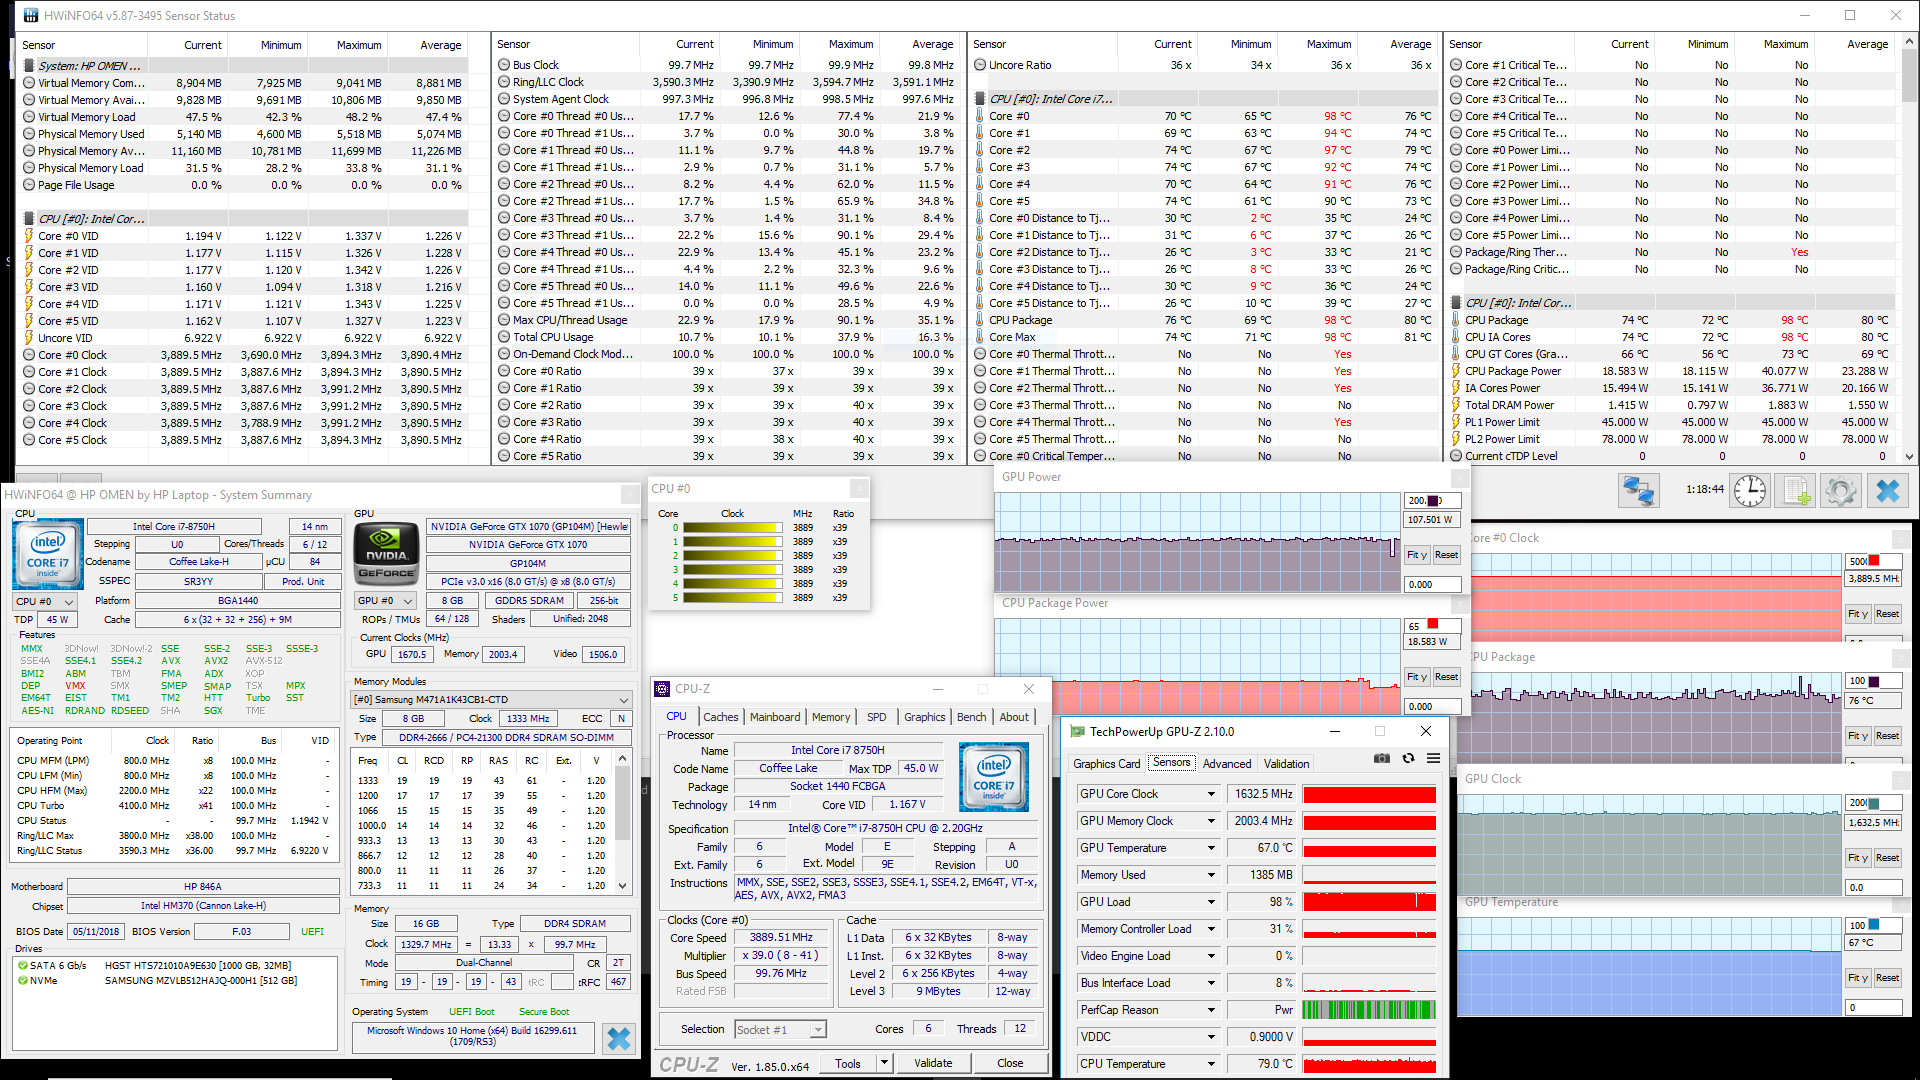
Under a real-world load (e.g., an hour-long playthrough of The Witcher 3), the CPU and GPU show remarkable consistency. Both the processor and graphics card settle in at 3.9 GHz and 1635 MHz, respectively, and refuse to budge. GPU temperature holds steady at 67° C. The CPU's core temperature tends to fluctuate a bit; while the silicon averages about 75-80° C, it spikes to about 95-98° C intermittently before falling back down. Overall, the Omen 17t's consistency under stress is admirable.
| CPU Clock (GHz) | GPU Clock (MHz) | Average CPU Temperature (°C) | Average GPU Temperature (°C) | |
| Prime95 Stress | 3.2 | - | 72 | - |
| FurMark Stress | 4.0 | 1265 | 70 | 66 |
| Prime95 + FurMark Stress | 3.1 | 1300 | 88 | 67 |
| Witcher 3 Stress | 3.9 | 1635 | 80 | 67 |
Emissions
System Noise
One would think that such steady performance under load would generate quite a bit of fan noise, but that is not the case with the Omen 17t. The dual fans can get loud, peaking at about 46.5 dB(A), but average noise when gaming falls between 42-44 dB(A). The fans' level pitch helps them blend in under other noises, including the machine's speakers. The fans can be heard from a normal use distance, but those more than about four feet away from the device won't be able to hear them. Considering most high-end gaming laptops are infamous for their loud, high-pitched fans, this is a definite mark in the Omen 17t's favor. There is no noticeable coil whine or other system noise.
Noise level
| Idle |
| 31.1 / 31.1 / 35 dB(A) |
| Load |
| 42 / 46.5 dB(A) |
 | ||
30 dB silent 40 dB(A) audible 50 dB(A) loud |
||
min: | ||
| HP Omen 17t-3AW55AV_1 GeForce GTX 1070 Mobile, i7-8750H, Samsung SSD PM981 MZVLB512HAJQ | Alienware 17 R4 GeForce GTX 1080 Mobile, i7-7820HK, SK Hynix PC300 NVMe 512 GB | EVGA SC17 GTX 1070 GeForce GTX 1070 Mobile, 6820HK, Samsung SM951 MZVPV256 m.2 | Acer Predator 17 G9-793-70PJ GeForce GTX 1070 Mobile, i7-7700HQ, Toshiba NVMe THNSN5512GPU7 | Asus G752VS-BA338T GeForce GTX 1070 Mobile, i7-7700HQ, Samsung SM961 MZVKW512HMJP m.2 PCI-e | Eurocom Q8 GeForce GTX 1070 Mobile, i9-8950HK, Samsung SSD 960 Pro 512 GB m.2 | MSI GE73 8RF-008 Raider RGB GeForce GTX 1070 Mobile, i7-8750H, Toshiba HG6 THNSNJ256G8NY | Aorus X9 DT GeForce GTX 1080 Mobile, i9-8950HK, Transcend TS1TMTE850 | |
|---|---|---|---|---|---|---|---|---|
| Noise | -10% | -7% | -6% | -2% | -3% | -6% | -21% | |
| off / environment * (dB) | 27.8 | 28.2 -1% | 29.2 -5% | 31 -12% | 30 -8% | 28 -1% | 30 -8% | 30 -8% |
| Idle Minimum * (dB) | 31.1 | 35.6 -14% | 33.9 -9% | 32 -3% | 30 4% | 28.2 9% | 32 -3% | 36 -16% |
| Idle Average * (dB) | 31.1 | 35.6 -14% | 33.9 -9% | 35 -13% | 32 -3% | 31.8 -2% | 33 -6% | 37 -19% |
| Idle Maximum * (dB) | 35 | 35.7 -2% | 33.9 3% | 38 -9% | 36 -3% | 36.3 -4% | 34 3% | 43 -23% |
| Load Average * (dB) | 42 | 50.2 -20% | 43.8 -4% | 42 -0% | 43 -2% | 46.7 -11% | 41 2% | 50 -19% |
| Witcher 3 ultra * (dB) | 44.5 | 50.2 -13% | 44 1% | 43 3% | 46.9 -5% | 50 -12% | 57 -28% | |
| Load Maximum * (dB) | 46.5 | 50.2 -8% | 53.4 -15% | 50 -8% | 49 -5% | 49.7 -7% | 54 -16% | 61 -31% |
* ... smaller is better
Temperature
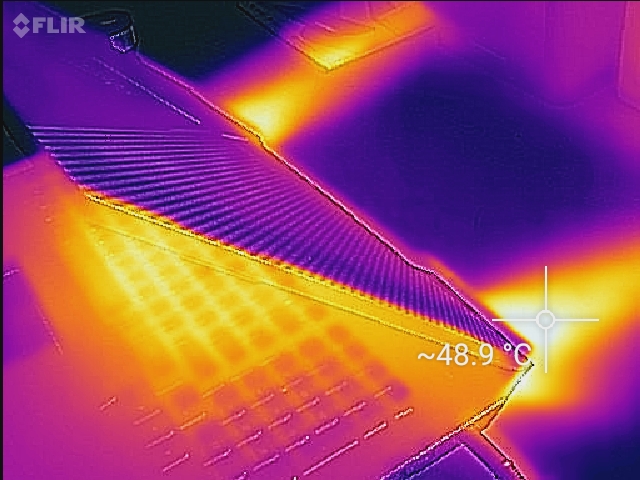
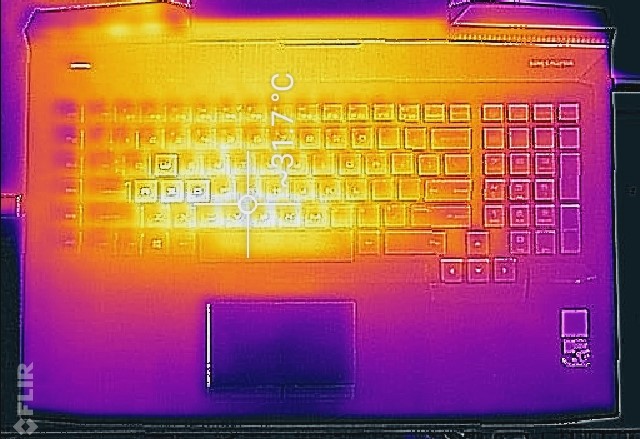
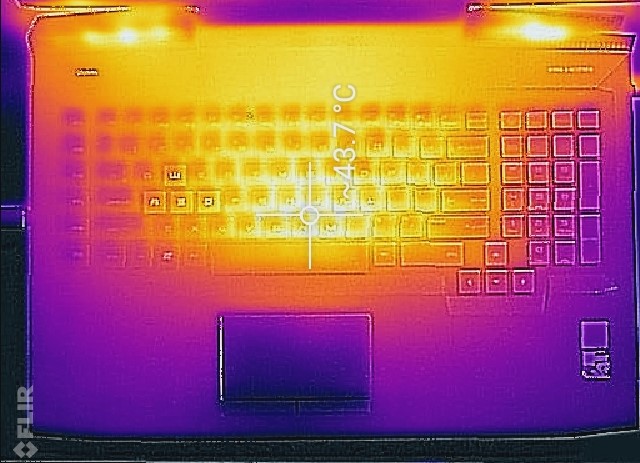
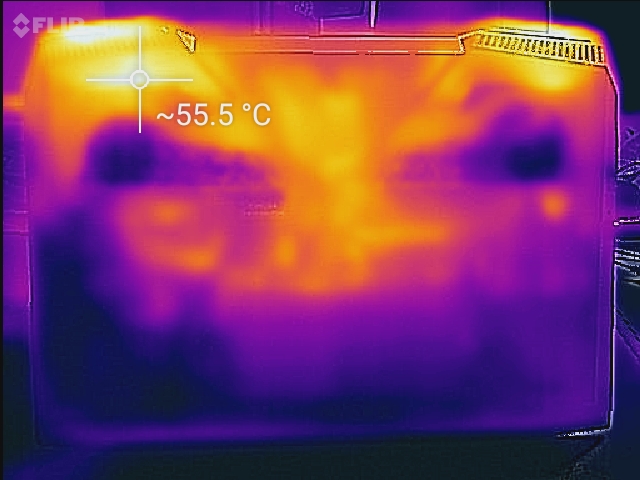
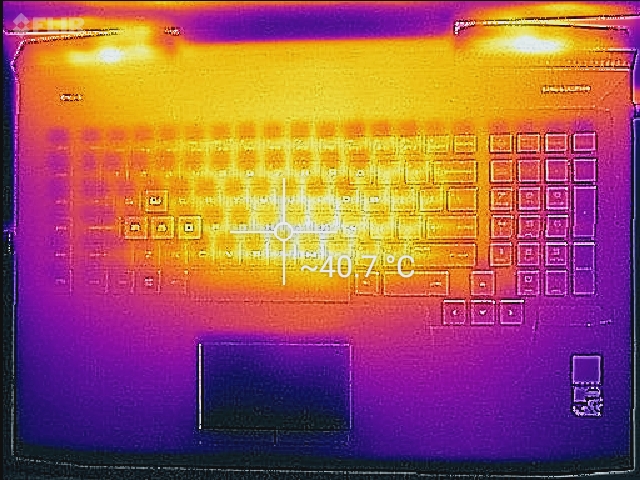
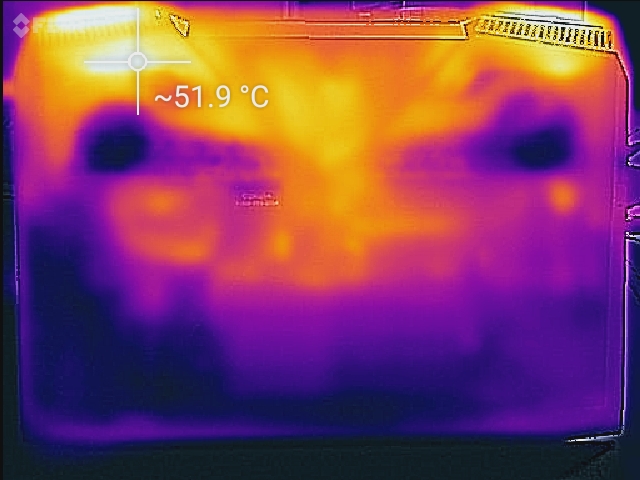
Despite the CPU and GPU maintaining high levels of performance under load and the relatively quiet fans, the surfaces that come into contact with the user do not get hot. Under full load, the keyboard gets warm but never uncomfortable. There is a "hot spot" in the middle of the keyboard (between the H, J, and N keys) which is directly above the CPU and GPU. The back vents along the underside get toasty (~55° C), so lap use should be avoided when pushing the hardware. Under normal gameplay conditions, temperatures across the keyboard stay well-managed, averaging about 35-40° C along the top. The WASD keys, where most gamers' hands will rest, never feel too warm for comfort.
(±) The maximum temperature on the upper side is 44.2 °C / 112 F, compared to the average of 40.4 °C / 105 F, ranging from 21.2 to 68.8 °C for the class Gaming.
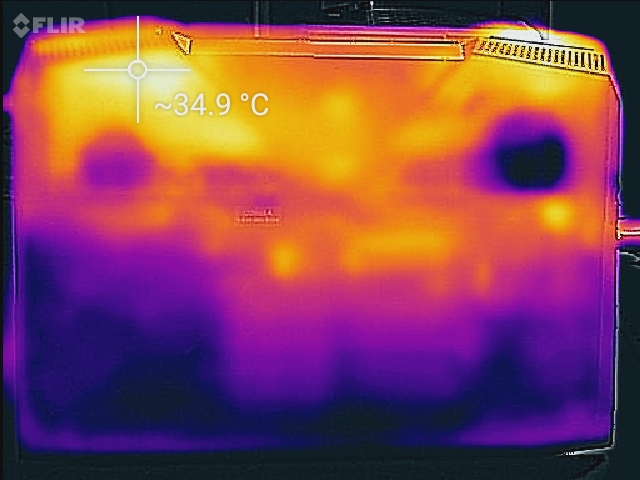
(-) The bottom heats up to a maximum of 55.8 °C / 132 F, compared to the average of 43.2 °C / 110 F
(+) In idle usage, the average temperature for the upper side is 28.5 °C / 83 F, compared to the device average of 33.9 °C / 93 F.
(±) Playing The Witcher 3, the average temperature for the upper side is 32.9 °C / 91 F, compared to the device average of 33.9 °C / 93 F.
(+) The palmrests and touchpad are cooler than skin temperature with a maximum of 28.2 °C / 82.8 F and are therefore cool to the touch.
(±) The average temperature of the palmrest area of similar devices was 28.8 °C / 83.8 F (+0.6 °C / 1 F).
| HP Omen 17t-3AW55AV_1 GeForce GTX 1070 Mobile, i7-8750H, Samsung SSD PM981 MZVLB512HAJQ | Alienware 17 R4 GeForce GTX 1080 Mobile, i7-7820HK, SK Hynix PC300 NVMe 512 GB | EVGA SC17 GTX 1070 GeForce GTX 1070 Mobile, 6820HK, Samsung SM951 MZVPV256 m.2 | Acer Predator 17 G9-793-70PJ GeForce GTX 1070 Mobile, i7-7700HQ, Toshiba NVMe THNSN5512GPU7 | Asus G752VS-BA338T GeForce GTX 1070 Mobile, i7-7700HQ, Samsung SM961 MZVKW512HMJP m.2 PCI-e | Eurocom Q8 GeForce GTX 1070 Mobile, i9-8950HK, Samsung SSD 960 Pro 512 GB m.2 | MSI GE73 8RF-008 Raider RGB GeForce GTX 1070 Mobile, i7-8750H, Toshiba HG6 THNSNJ256G8NY | Aorus X9 DT GeForce GTX 1080 Mobile, i9-8950HK, Transcend TS1TMTE850 | |
|---|---|---|---|---|---|---|---|---|
| Heat | 3% | 7% | 19% | 17% | 5% | 2% | 9% | |
| Maximum Upper Side * (°C) | 44.2 | 49.6 -12% | 47.6 -8% | 39.1 12% | 41 7% | 43.4 2% | 47 -6% | 43 3% |
| Maximum Bottom * (°C) | 55.8 | 56 -0% | 53.2 5% | 42.1 25% | 39.3 30% | 44 21% | 49 12% | 55 1% |
| Idle Upper Side * (°C) | 31.6 | 29.6 6% | 28.2 11% | 27.9 12% | 28.8 9% | 32.8 -4% | 32 -1% | 27 15% |
| Idle Bottom * (°C) | 35 | 29.2 17% | 28.6 18% | 26.1 25% | 27.3 22% | 34.2 2% | 34 3% | 29 17% |
* ... smaller is better
Speakers

The Omen 17t does have some weak points, and the speakers are perhaps the most glaring. The dual drivers situated along the front of the machine get reasonably loud at 73 dB, but there is an unfortunate rattling present when volume goes past 65%. Music and sounds are affected at this level, leaving a bad overall impression. The lack of a subwoofer, something included with some other large gaming laptops, makes the overall sound profile thin and weak. Headphones are highly recommended, but to make a bad taste even worse, the only audio-out port is a headset jack; a dedicated headphone DAC or S/PDIF port would have been a welcome addition.
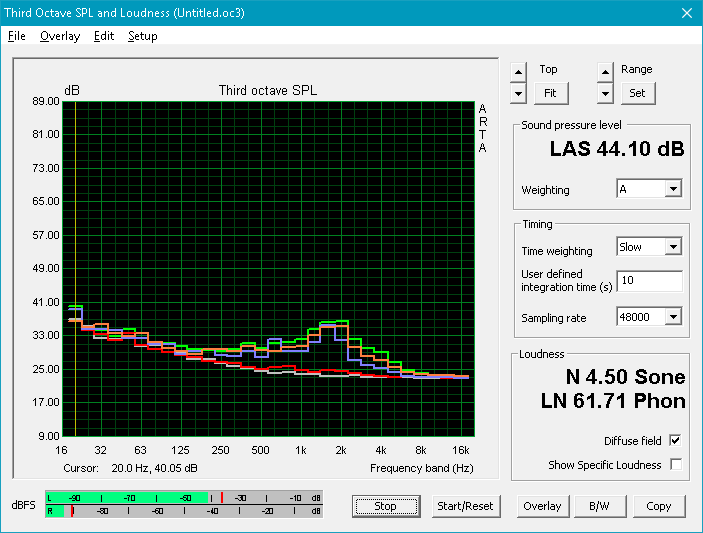
HP Omen 17t-3AW55AV_1 audio analysis
(±) | speaker loudness is average but good (72.8 dB)
Bass 100 - 315 Hz
(-) | nearly no bass - on average 17.6% lower than median
(±) | linearity of bass is average (14.3% delta to prev. frequency)
Mids 400 - 2000 Hz
(+) | balanced mids - only 2% away from median
(+) | mids are linear (5.2% delta to prev. frequency)
Highs 2 - 16 kHz
(+) | balanced highs - only 2.4% away from median
(+) | highs are linear (6.5% delta to prev. frequency)
Overall 100 - 16.000 Hz
(±) | linearity of overall sound is average (16% difference to median)
Compared to same class
» 38% of all tested devices in this class were better, 6% similar, 55% worse
» The best had a delta of 6%, average was 18%, worst was 132%
Compared to all devices tested
» 25% of all tested devices were better, 5% similar, 70% worse
» The best had a delta of 4%, average was 24%, worst was 134%
MSI GE73 8RF-008 Raider RGB audio analysis
(+) | speakers can play relatively loud (93 dB)
Bass 100 - 315 Hz
(±) | reduced bass - on average 7% lower than median
(±) | linearity of bass is average (8.1% delta to prev. frequency)
Mids 400 - 2000 Hz
(+) | balanced mids - only 4.8% away from median
(±) | linearity of mids is average (7.1% delta to prev. frequency)
Highs 2 - 16 kHz
(+) | balanced highs - only 3.6% away from median
(+) | highs are linear (4.6% delta to prev. frequency)
Overall 100 - 16.000 Hz
(+) | overall sound is linear (10.2% difference to median)
Compared to same class
» 5% of all tested devices in this class were better, 2% similar, 93% worse
» The best had a delta of 6%, average was 18%, worst was 132%
Compared to all devices tested
» 5% of all tested devices were better, 1% similar, 94% worse
» The best had a delta of 4%, average was 24%, worst was 134%
Energy Management
Power Consumption
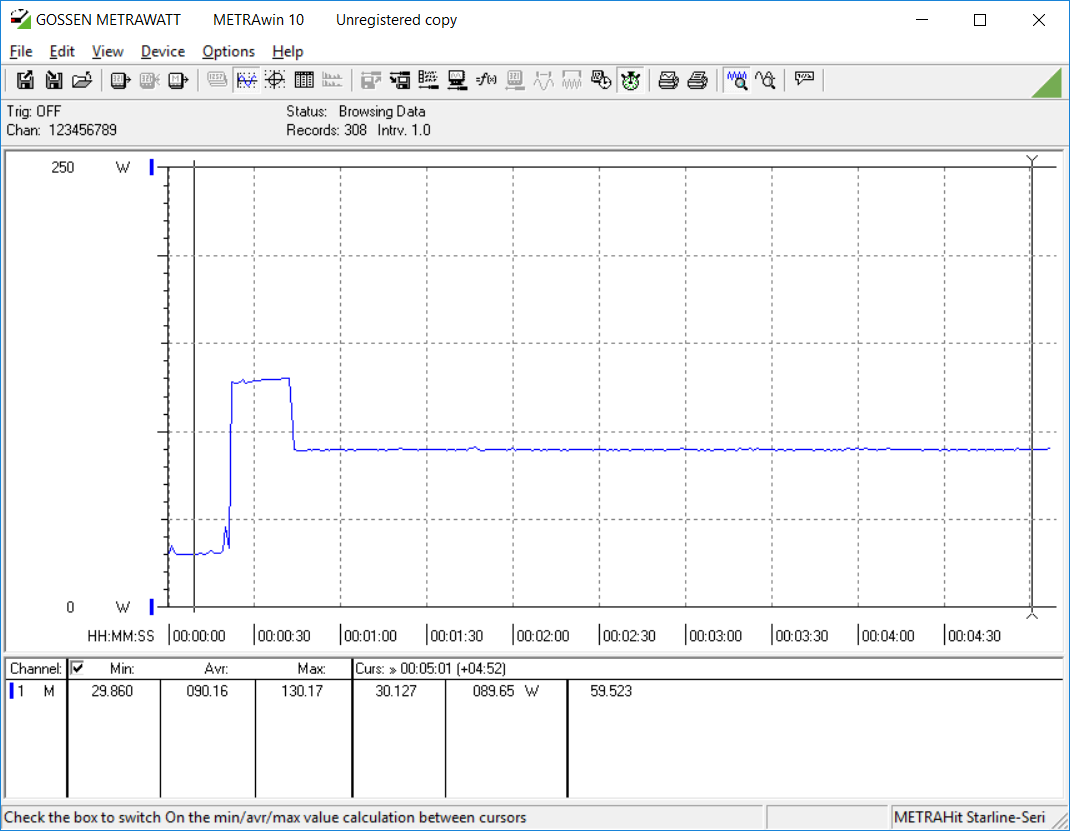
Average power consumption under load is a bit higher than similarly-specced laptops (namely the Asus G752VS and MSI GE73 Raider). Interestingly, the Omen 17t draws less power than these machines when under full load. While gaming, users can expect the Omen 17t to pull about 165-170 Watts from the wall, well within the 220 Watt rating of the included power supply.
| Off / Standby | |
| Idle | |
| Load |
|
Key:
min: | |
| HP Omen 17t-3AW55AV_1 i7-8750H, GeForce GTX 1070 Mobile, Samsung SSD PM981 MZVLB512HAJQ, IPS, 1920x1080, 17.3" | EVGA SC17 GTX 1070 6820HK, GeForce GTX 1070 Mobile, Samsung SM951 MZVPV256 m.2, IPS, 3840x2160, 17.3" | Acer Predator 17 G9-793-70PJ i7-7700HQ, GeForce GTX 1070 Mobile, Toshiba NVMe THNSN5512GPU7, IPS, 3840x2160, 17.3" | Asus G752VS-BA338T i7-7700HQ, GeForce GTX 1070 Mobile, Samsung SM961 MZVKW512HMJP m.2 PCI-e, IPS, 1920x1080, 17.3" | Eurocom Q8 i9-8950HK, GeForce GTX 1070 Mobile, Samsung SSD 960 Pro 512 GB m.2, TN LED, 2560x1440, 17.3" | MSI GE73 8RF-008 Raider RGB i7-8750H, GeForce GTX 1070 Mobile, Toshiba HG6 THNSNJ256G8NY, TN WLED, 1920x1080, 17.3" | Alienware 17 R4 i7-7820HK, GeForce GTX 1080 Mobile, SK Hynix PC300 NVMe 512 GB, TN LED, 2560x1440, 17.3" | HP Omen X 17-ap0xx i7-7820HK, GeForce GTX 1080 Mobile, Samsung PM961 MZVLW256HEHP, IPS, 1920x1080, 17.3" | |
|---|---|---|---|---|---|---|---|---|
| Power Consumption | -37% | -19% | -4% | -10% | 2% | -44% | -8% | |
| Idle Minimum * (Watt) | 17.8 | 27.3 -53% | 23 -29% | 21 -18% | 26.3 -48% | 15 16% | 37.5 -111% | 21.6 -21% |
| Idle Average * (Watt) | 24.7 | 34.9 -41% | 33 -34% | 27 -9% | 29 -17% | 20 19% | 37.6 -52% | 26.4 -7% |
| Idle Maximum * (Watt) | 29.6 | 37.6 -27% | 40 -35% | 32 -8% | 32.3 -9% | 26 12% | 37.6 -27% | 26.6 10% |
| Load Average * (Watt) | 110 | 164.4 -49% | 94 15% | 86 22% | 82.4 25% | 97 12% | 122.4 -11% | 95.6 13% |
| Witcher 3 ultra * (Watt) | 167.8 | 177 -5% | 165 2% | 192 -14% | 186 -11% | 180.3 -7% | 221.7 -32% | |
| Load Maximum * (Watt) | 178.6 | 202.5 -13% | 228 -28% | 206 -15% | 170.2 5% | 239 -34% | 277.4 -55% | 199.6 -12% |
* ... smaller is better
Battery Life
Due to the 144 Hz G-Sync display, Nvidia's Optimus is not available on the Omen 17t. As a result, battery life is a definite weak point of the machine. Under normal use, tested using our WiFi v1.3 battery test, the Omen 17t only manages to last about 4 hours 15 minutes. Even when idle, the Omen gives up the ghost after 4.5 hours. This isn't unexpected for this segment of the market, however; similar machines post similar run times. The 86 Wh battery is able to power through gaming sessions for about 1.5 hours, so the power adapter is a requirement when out and about.
| HP Omen 17t-3AW55AV_1 i7-8750H, GeForce GTX 1070 Mobile, 86 Wh | EVGA SC17 GTX 1070 6820HK, GeForce GTX 1070 Mobile, 74.48 Wh | Acer Predator 17 G9-793-70PJ i7-7700HQ, GeForce GTX 1070 Mobile, 88 Wh | Asus G752VS-BA338T i7-7700HQ, GeForce GTX 1070 Mobile, 90 Wh | Eurocom Q8 i9-8950HK, GeForce GTX 1070 Mobile, 66 Wh | MSI GE73 8RF-008 Raider RGB i7-8750H, GeForce GTX 1070 Mobile, 51 Wh | Alienware 17 R4 i7-7820HK, GeForce GTX 1080 Mobile, 99 Wh | HP Omen X 17-ap0xx i7-7820HK, GeForce GTX 1080 Mobile, 99 Wh | Aorus X9 DT i9-8950HK, GeForce GTX 1080 Mobile, 94.24 Wh | |
|---|---|---|---|---|---|---|---|---|---|
| Battery runtime | -30% | 0% | 27% | -38% | -25% | -17% | 29% | -17% | |
| Reader / Idle (h) | 4.5 | 4 -11% | 5.4 20% | 7.4 64% | 5.1 13% | 4.6 2% | 5.8 29% | 4.2 -7% | |
| WiFi v1.3 (h) | 4.2 | 2.7 -36% | 3.6 -14% | 4.9 17% | 2.6 -38% | 3.1 -26% | 3 -29% | 5.6 33% | 3.2 -24% |
| Load (h) | 1.6 | 0.9 -44% | 1.5 -6% | 1.6 0% | 0.6 -63% | 1.2 -25% | 2 25% | 1.3 -19% |
Pros
Cons
Verdict

The story of the Omen 17t is one of balance. The machine's components compliment each other well, resulting in an overall excellent package with little room for complaint. The display is bright with good color reproduction. The powerful CPU and GPU are well-tuned for gaming at Full HD. The keyboard and build quality are excellent, and the selection of ports is ample. To top it off, heat management and fan noise are both above average for this category.
The standout feature here is the 144 Hz panel. High-refresh rate displays, which were commonly relegated to expensive notebooks in the past, are slowly creeping their way into lower-priced devices, and the Omen 17t is an excellent example of the quality that can be had at this price point. While the Omen 17t is by no means a "budget laptop," it is priced more aggressively than most of its competitors, especially those that boast a high-refresh rate display.
The Omen 17t does have some weaknesses. In particular, battery life is poor (due to the lack of Optimus) and the speakers are abhorrent (thanks to the unpleasant rattle at higher volumes). Also, the Samsung PM981 boot drive exhibits some odd behavior, but this may be specific to our unit. HP also misstepped by not using the additional space made available by the removal of the optical drive. All of these downfalls are not critical for a gaming laptop, however.
In sum, the HP Omen 17t is a well-built package that feels thoughtfully designed. The 144 Hz display is a nice feature at this price point, and the internals are (mostly) able to take advantage of the higher refresh rate and G-Sync. The Omen 17t is a good example of a "jack of all trades, master of some" gaming laptop, and its competitive pricing makes it worth considering.
HP Omen 17t-3AW55AV_1
- 08/21/2018 v6 (old)
Sam Medley
Price comparison
