Asus Strix Hero III G731GV RTX 2060 Laptop Review - Not that Much Better than the G731GU GTX 1660 Ti
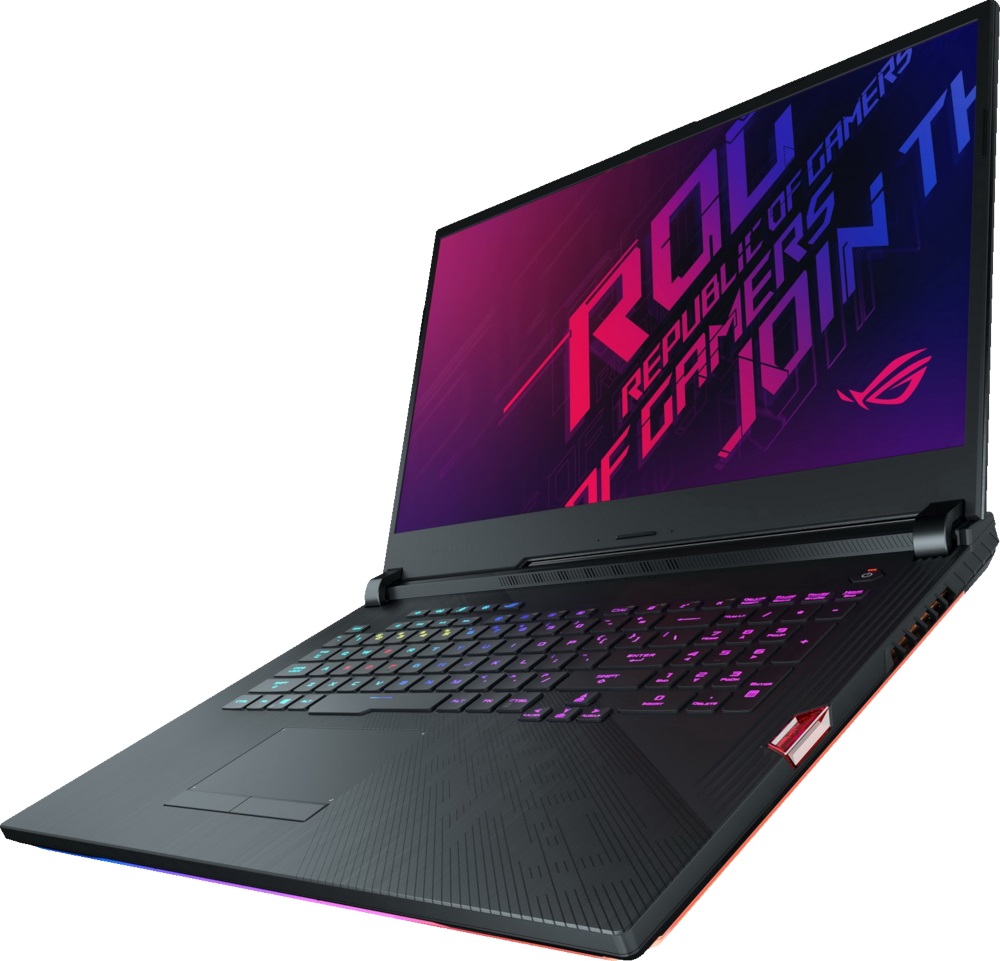
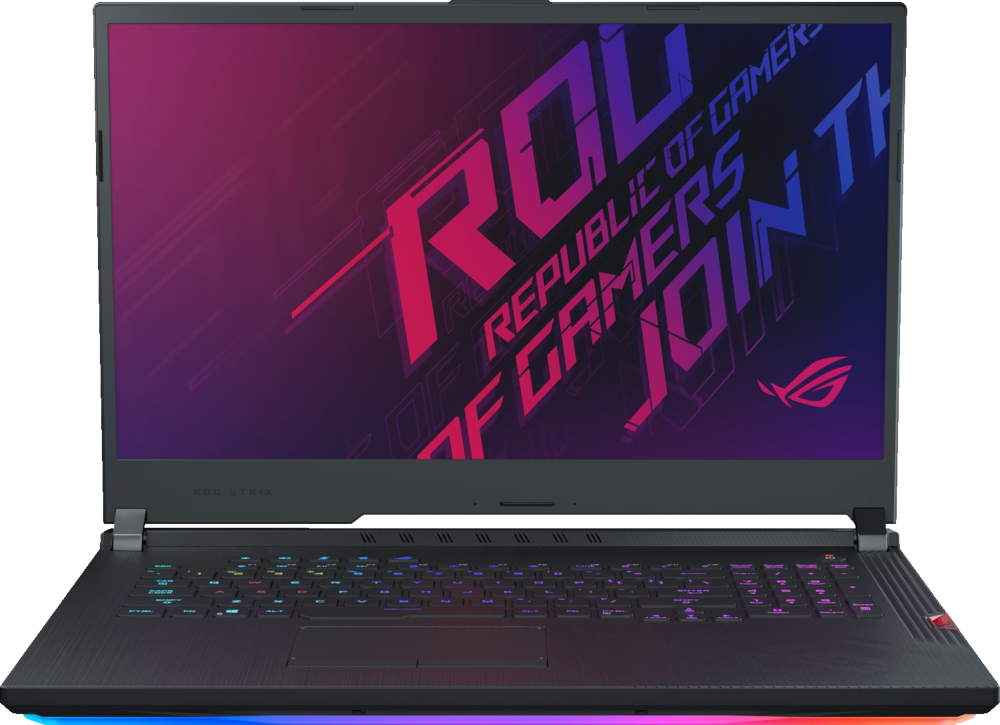
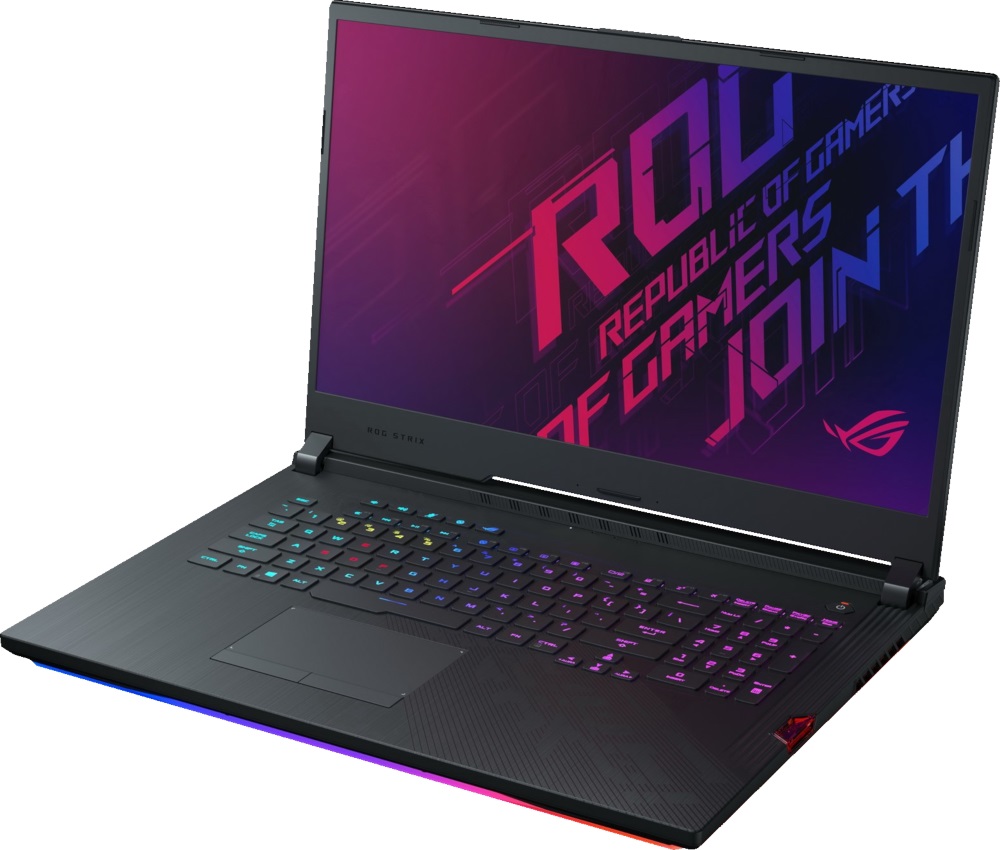
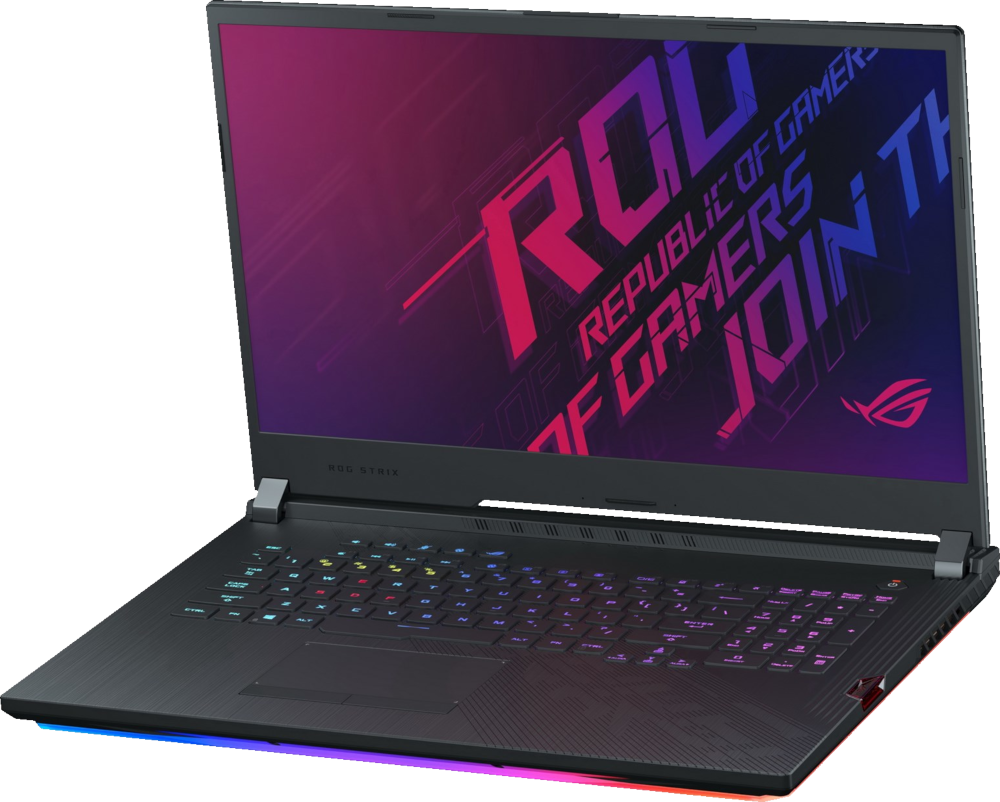
The Asus ROG Strix G731 series is the mid-size alternative to the super-thin Zephyrus S GX701 series and thicker Chimera G703 series. For this review, we'll be looking at the ROG Strix G731GV equipped with a Core i7-9750H CPU, GeForce RTX 2060 GPU, and 144 Hz display. The system competes directly with other mid-size 17.3-inch gaming laptops including the Lenovo Legion Y740-17ICH, MSI GE series, Acer Predator 17, and Gigabyte Aorus 17.
The G731GV is visually identical to the G731GW that we had already checked out a few weeks prior. Thus, we recommend reading up on both our G731GW and GL731GU reviews to learn more about the chassis, ports, keyboard, speakers, and other physical features of the G731GV. We'll instead focus on the performance, temperature, noise, and power consumption of the G731GV to see how its RTX 2060 GPU compares to the RTX 2070 of the G731GW.
More Asus reviews:
Case
Communication
Accessories
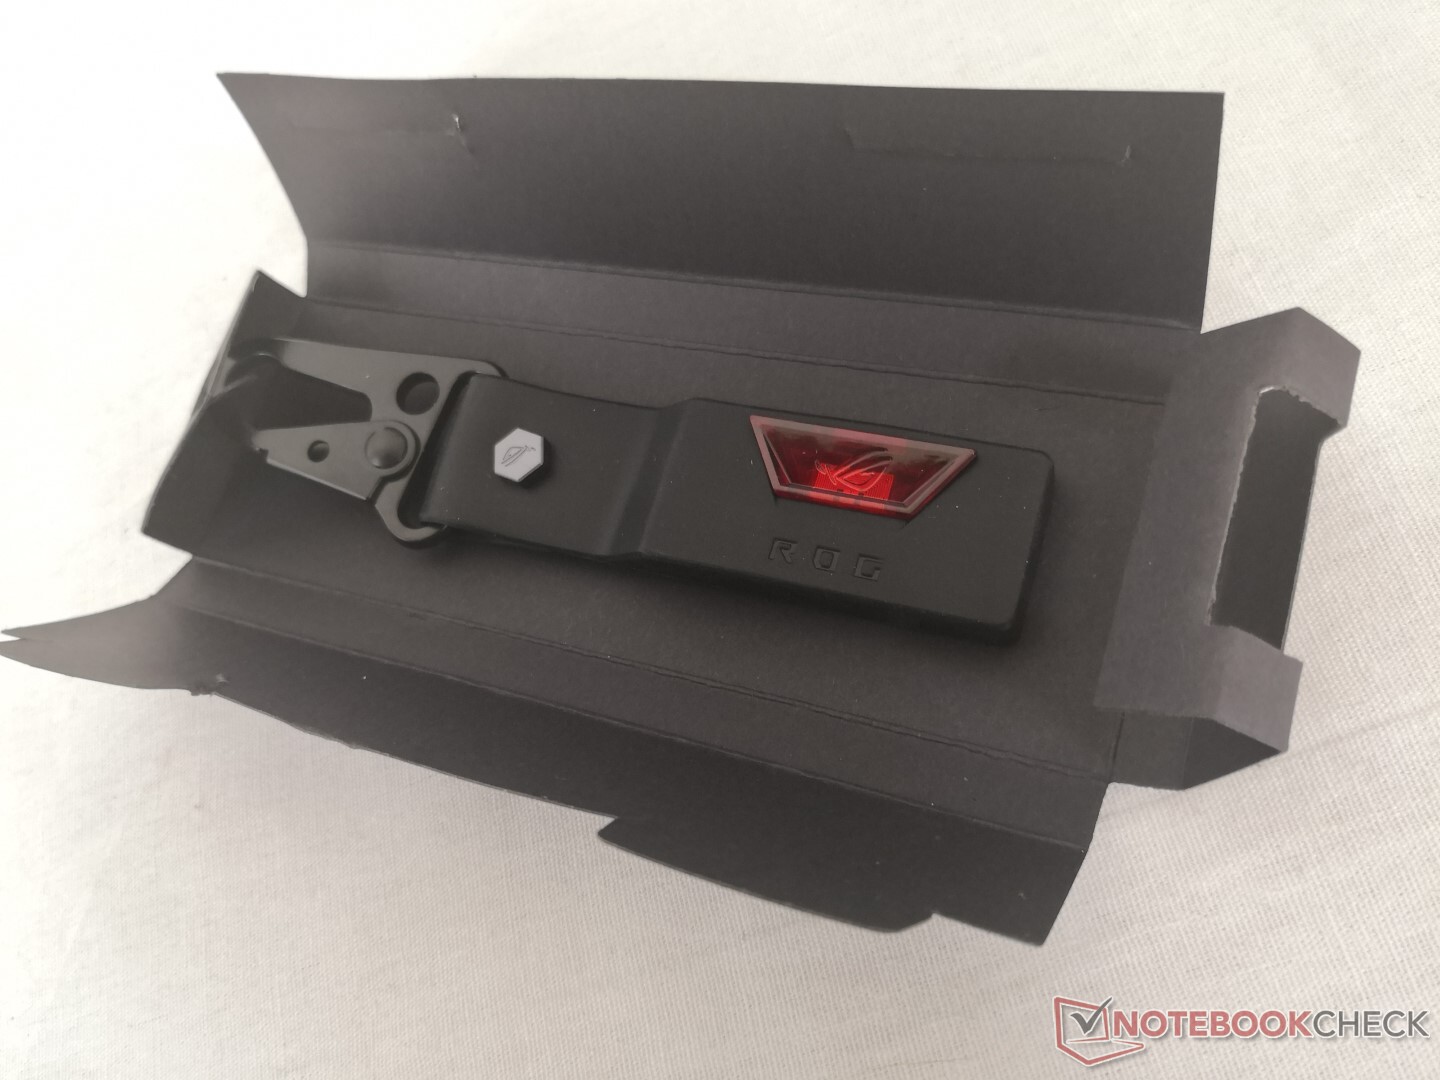
Unlike the GL731 series, the G731 series is compatible with Asus Keystone. This is a special proprietary NFC-enabled LED key that plugs into the laptop for loading personalized Armoury Crate profiles and hidden 'Shadow Drive' local files that only the key owner can access.
Maintenance
Display
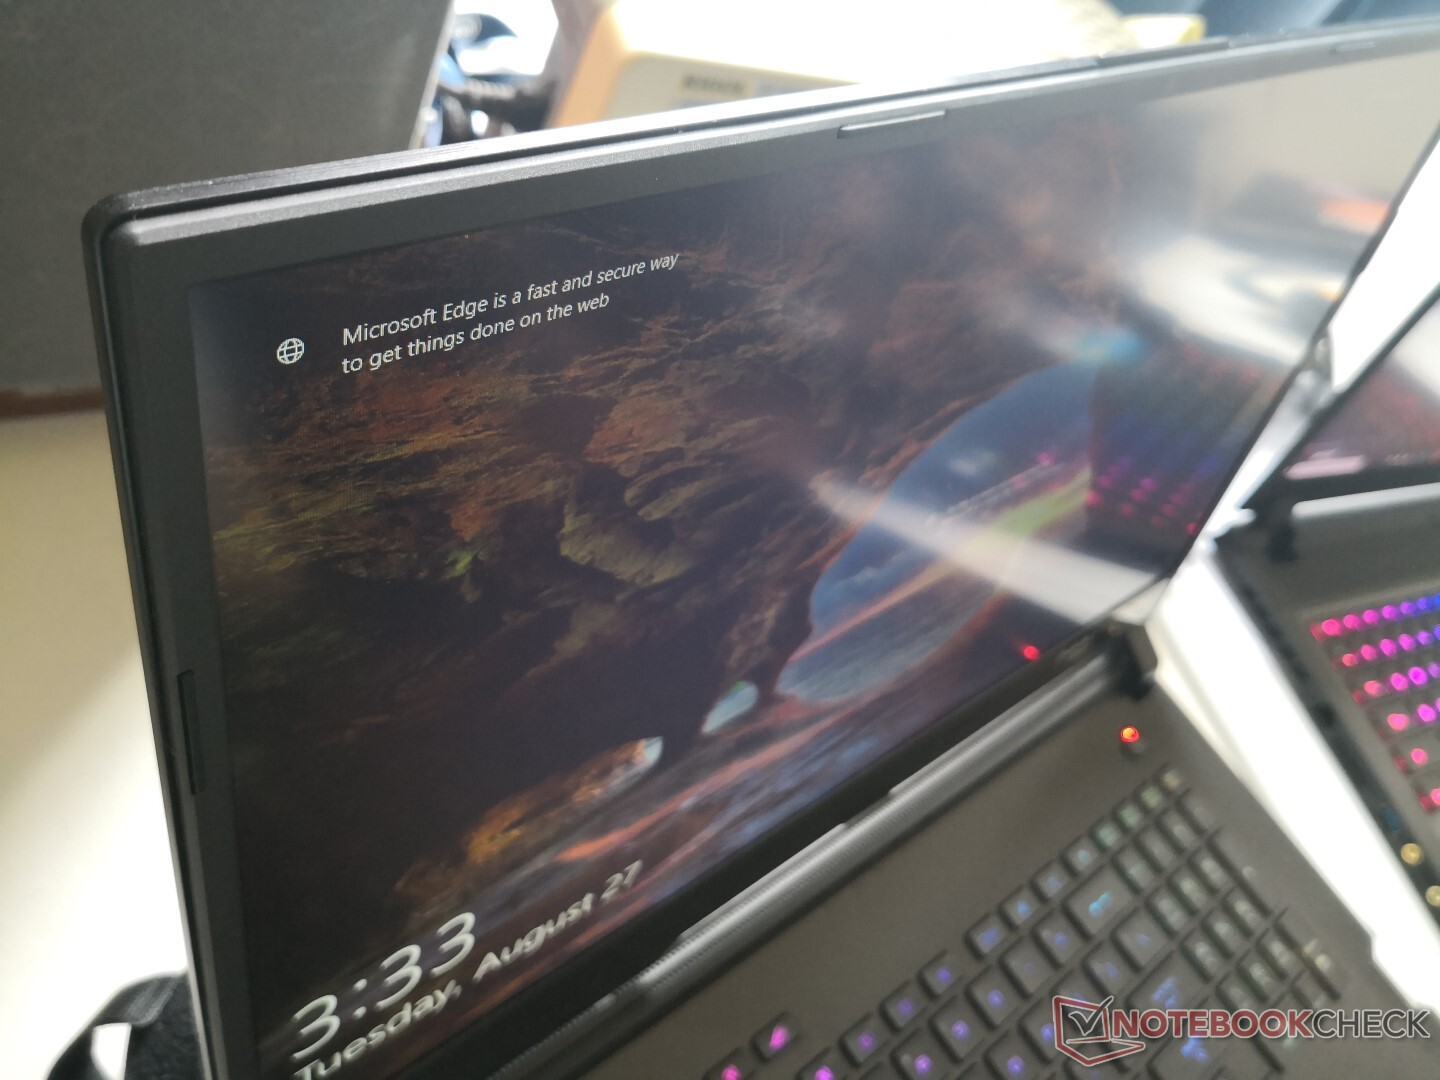
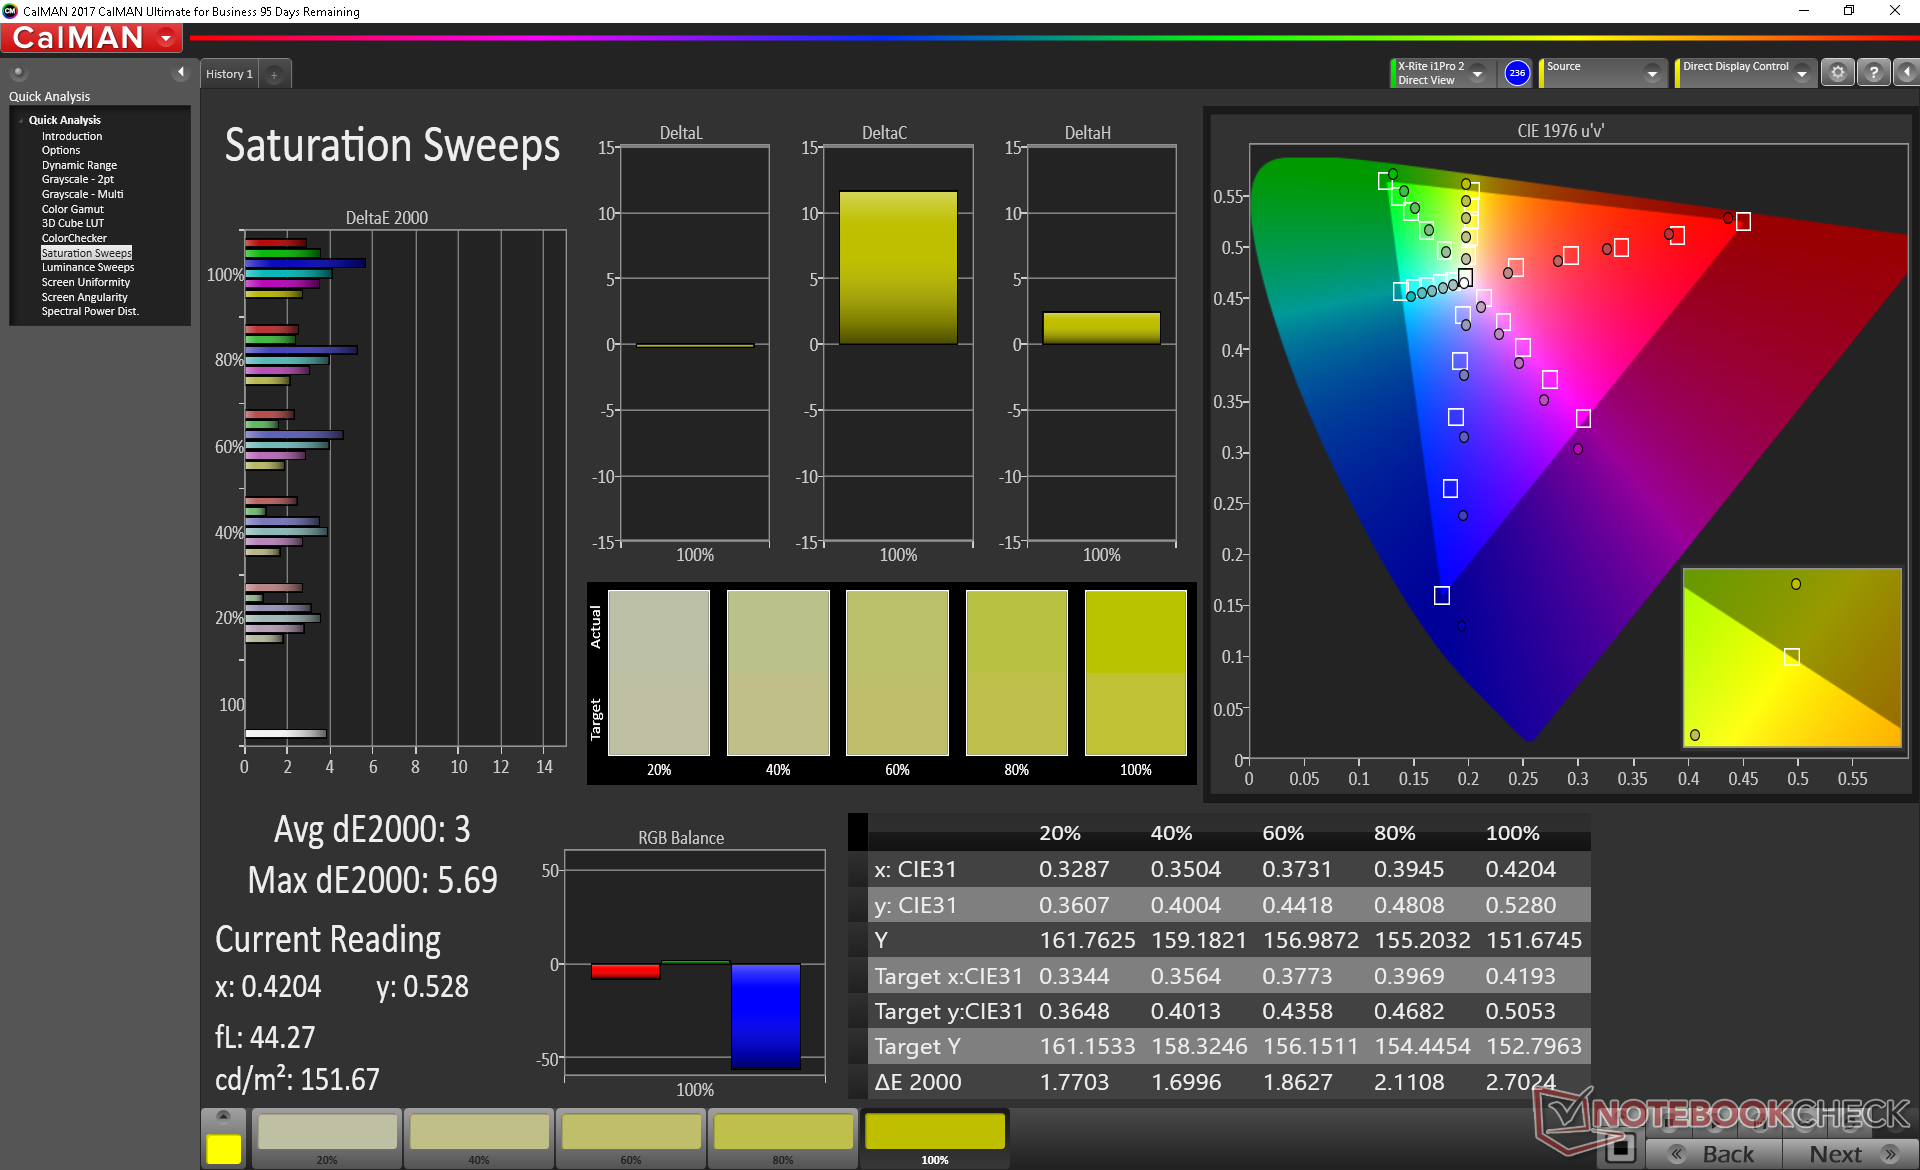
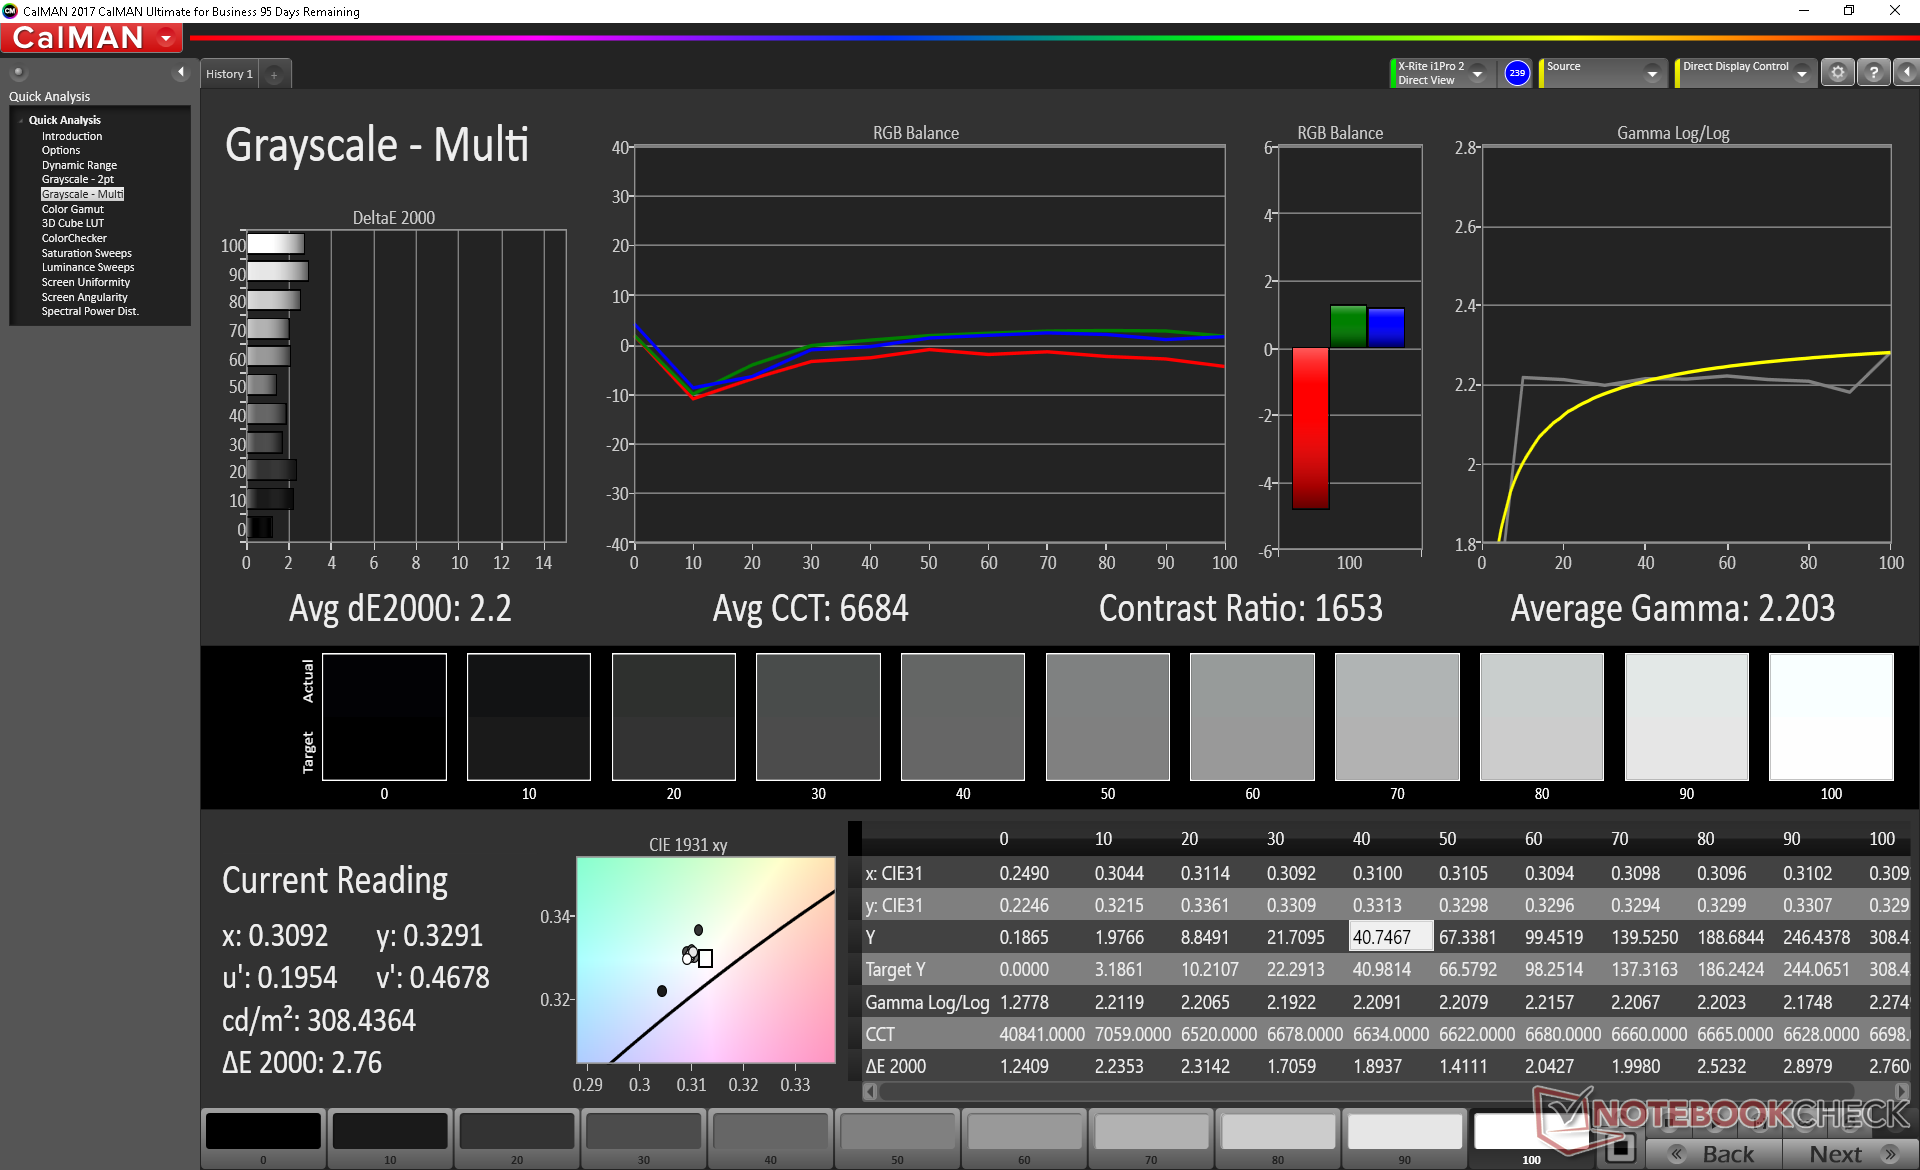
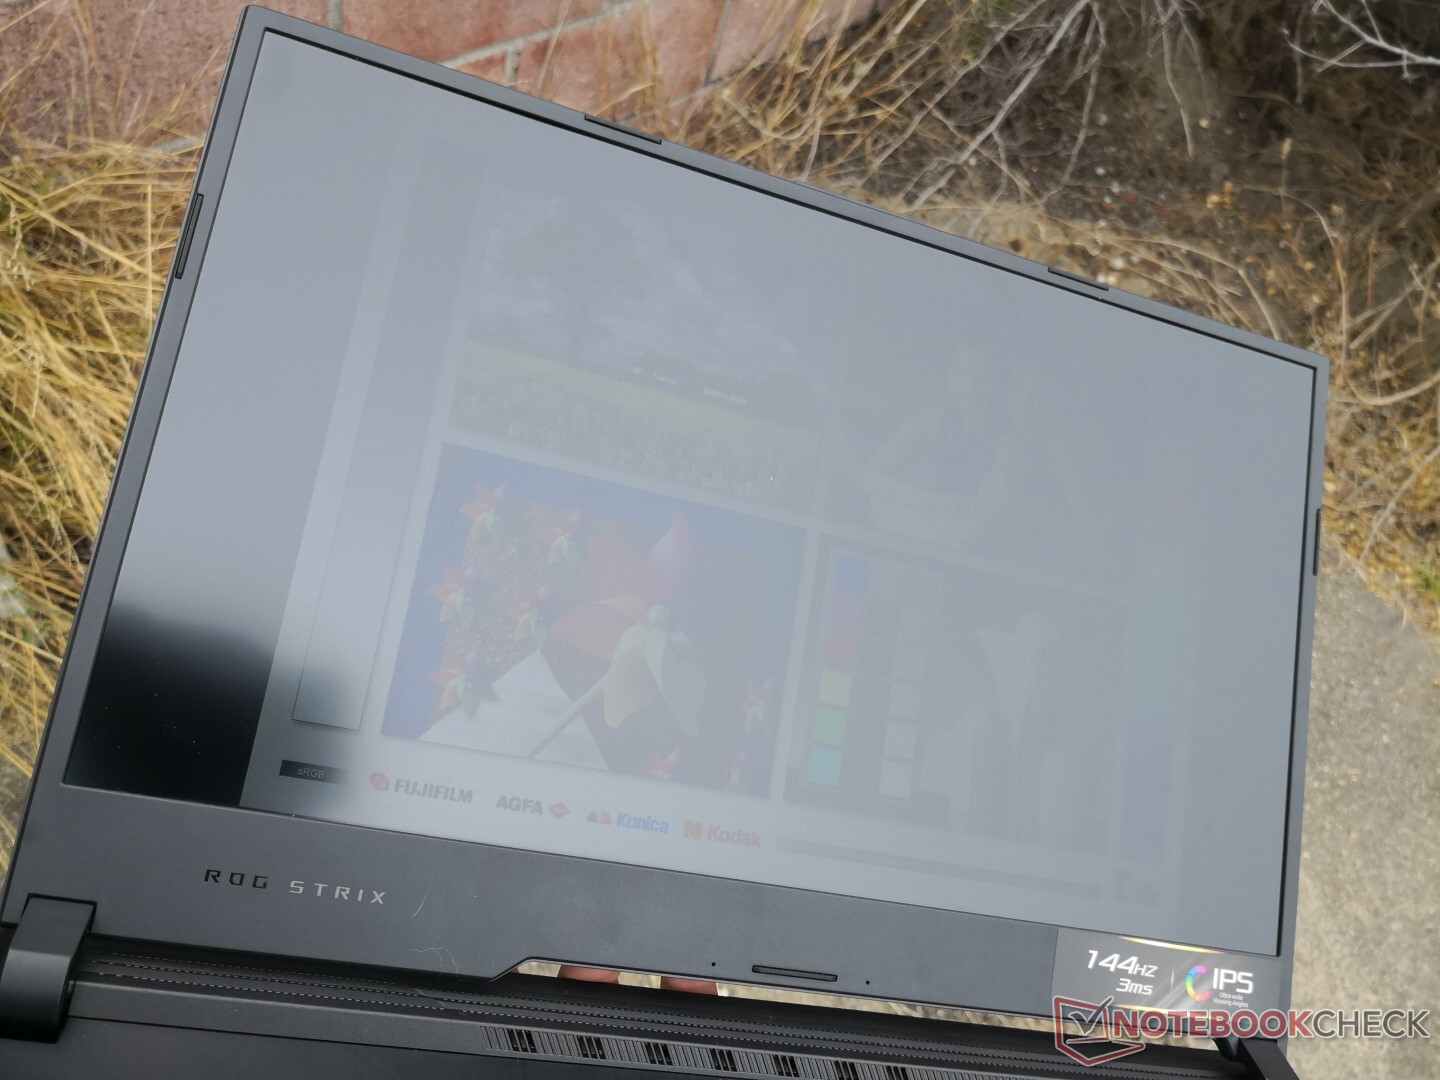
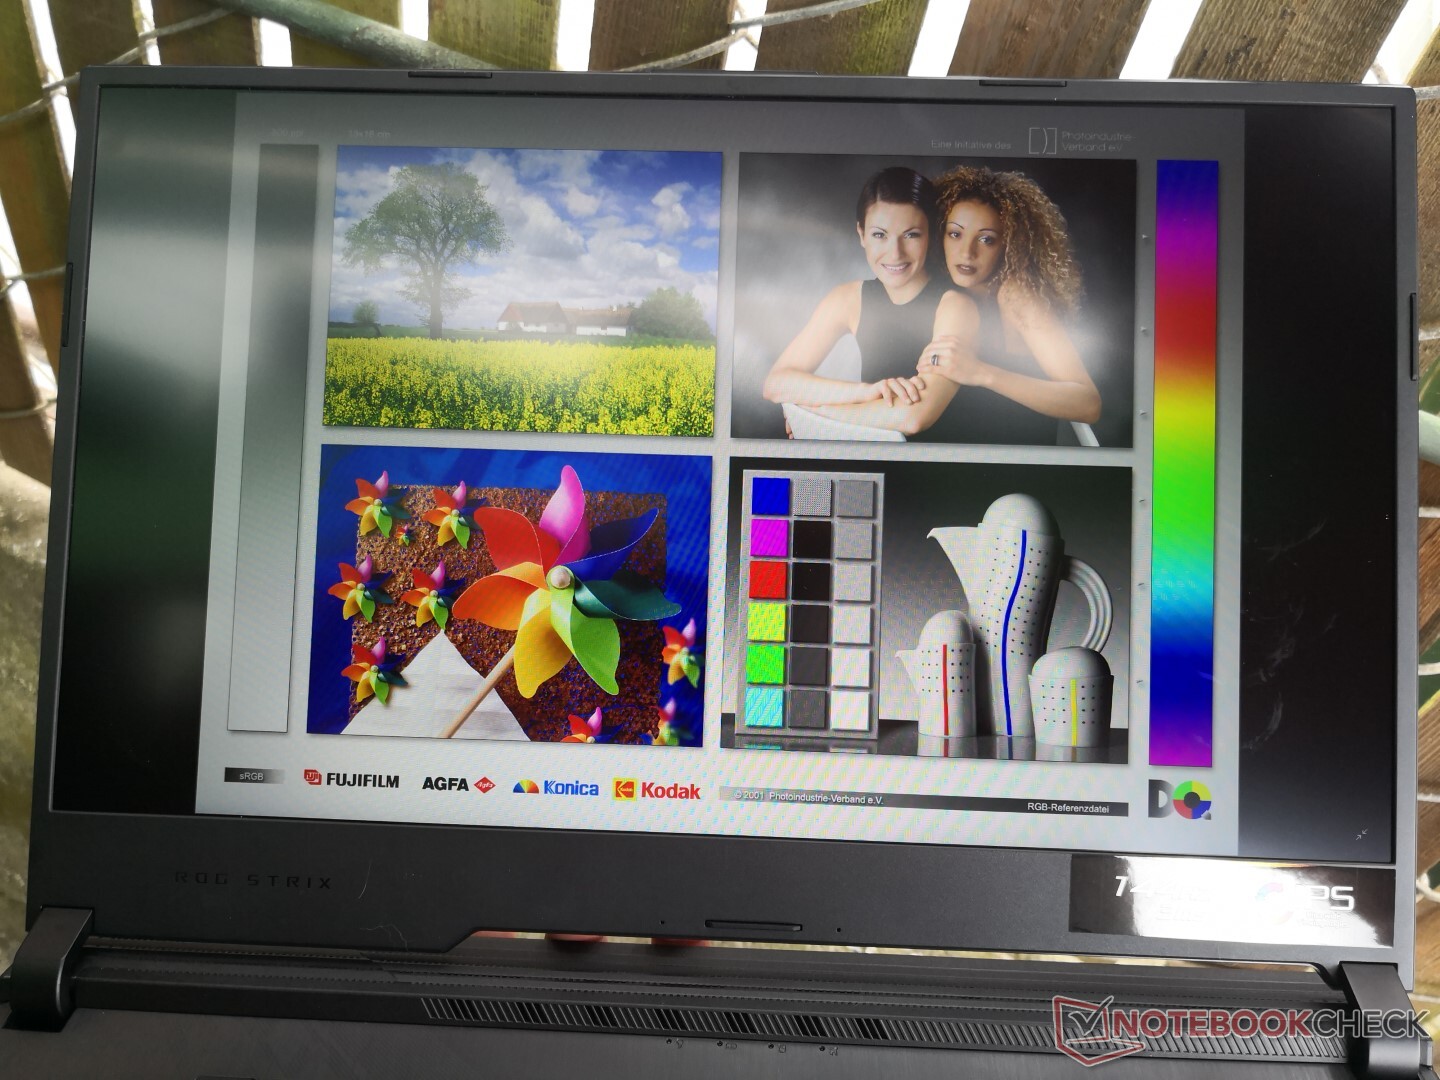
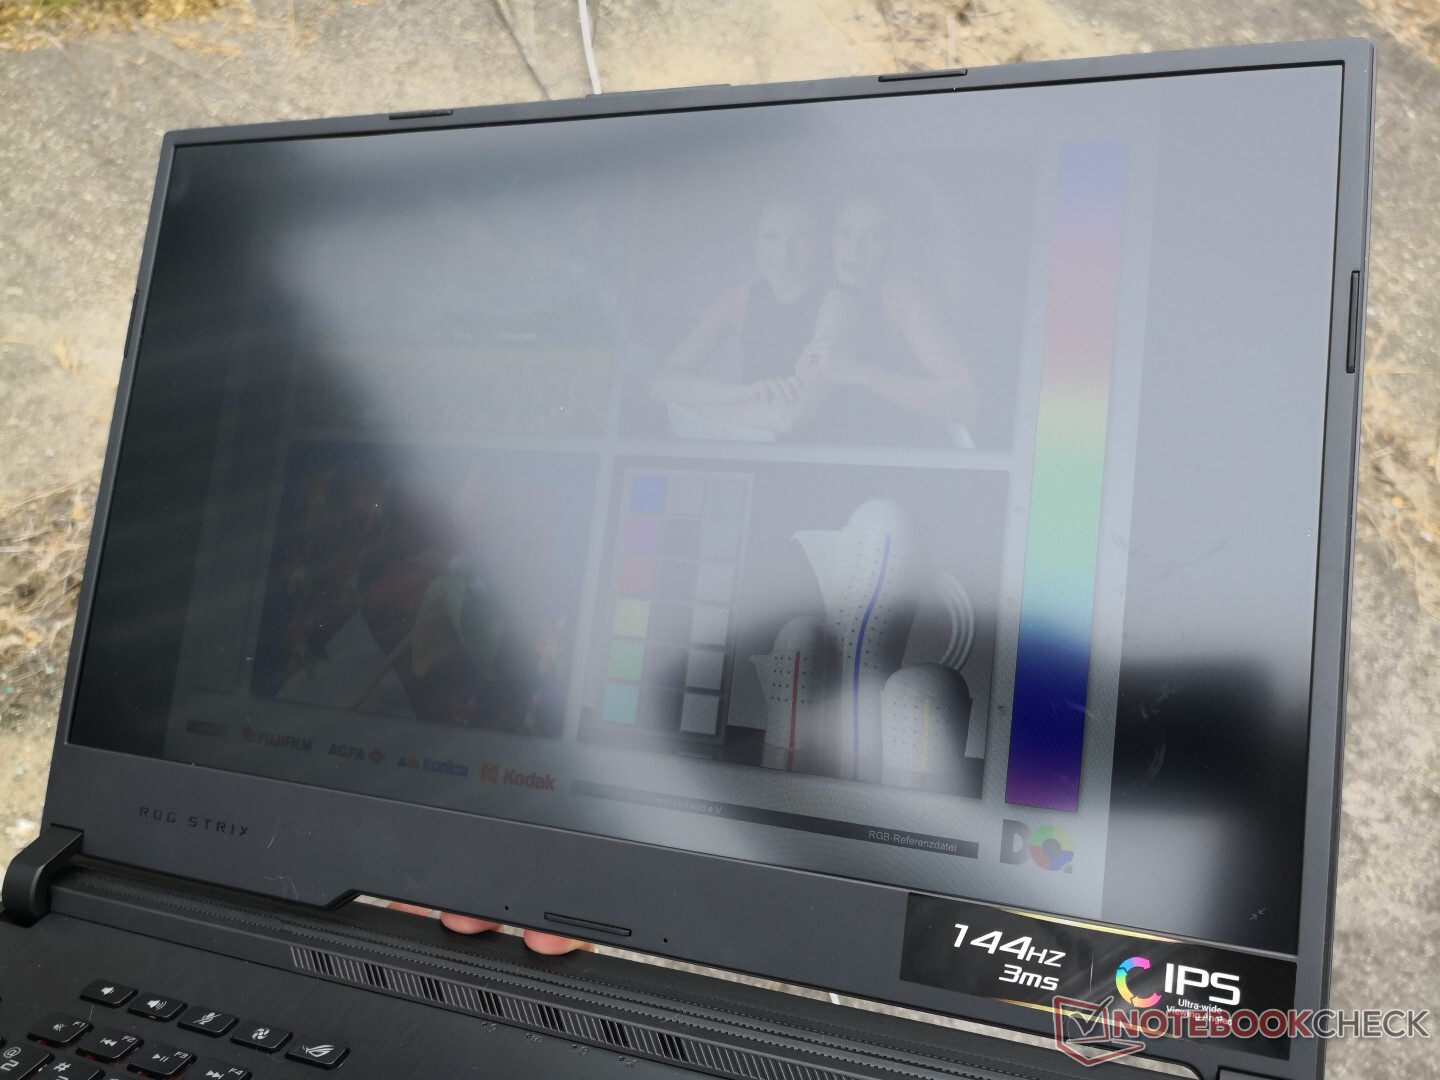
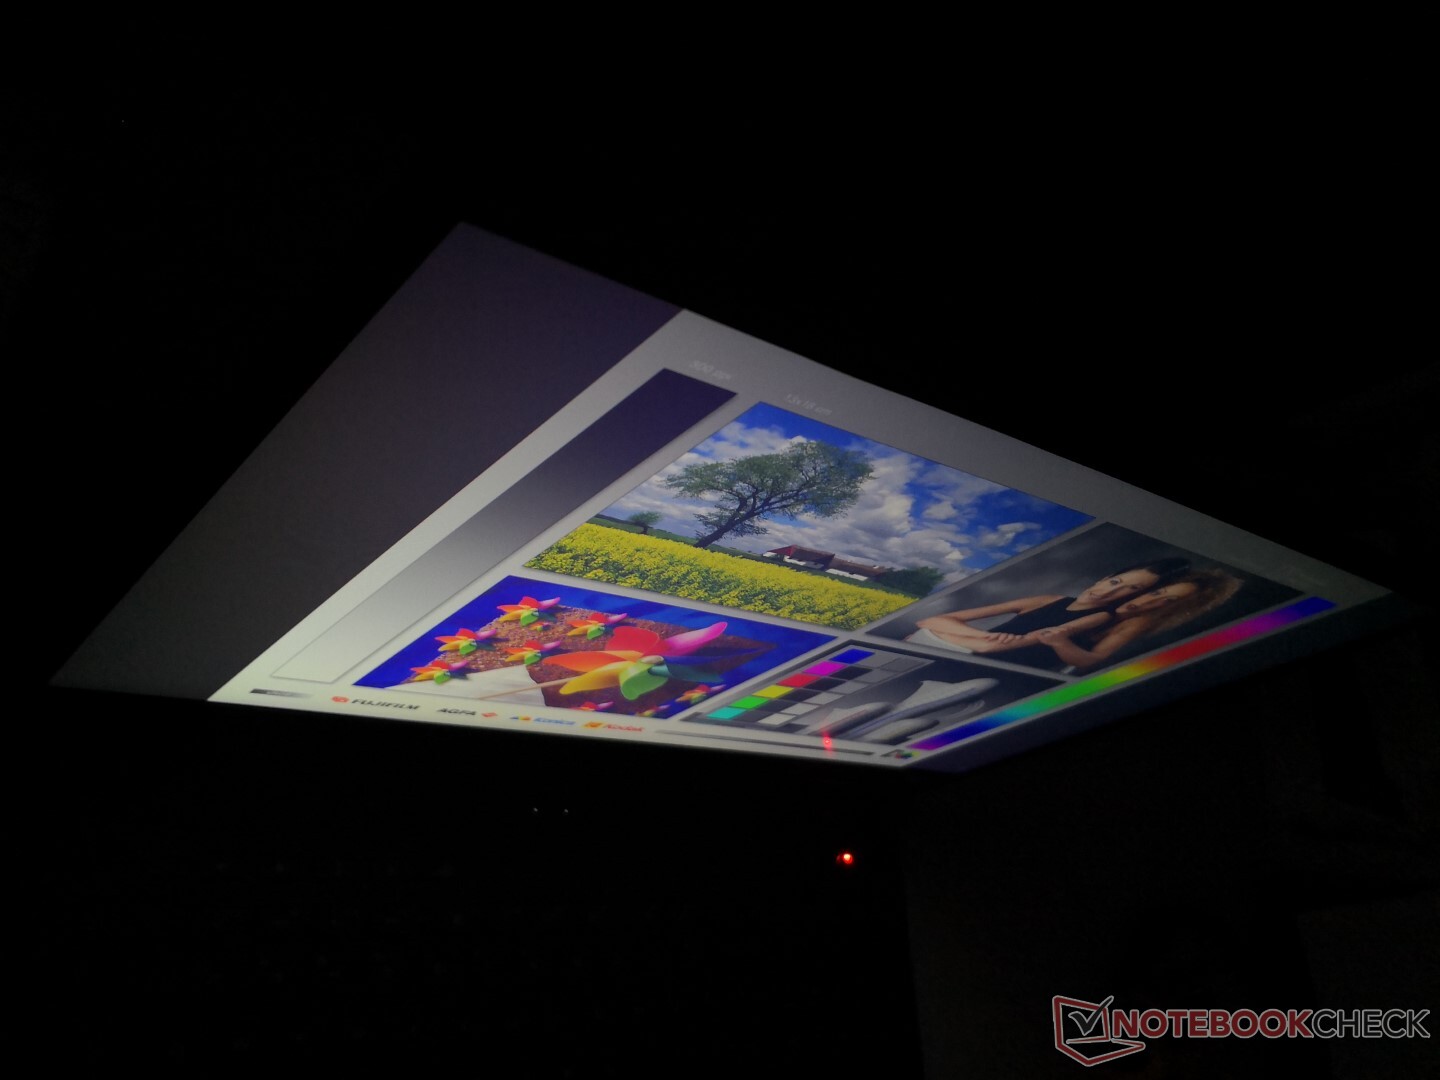
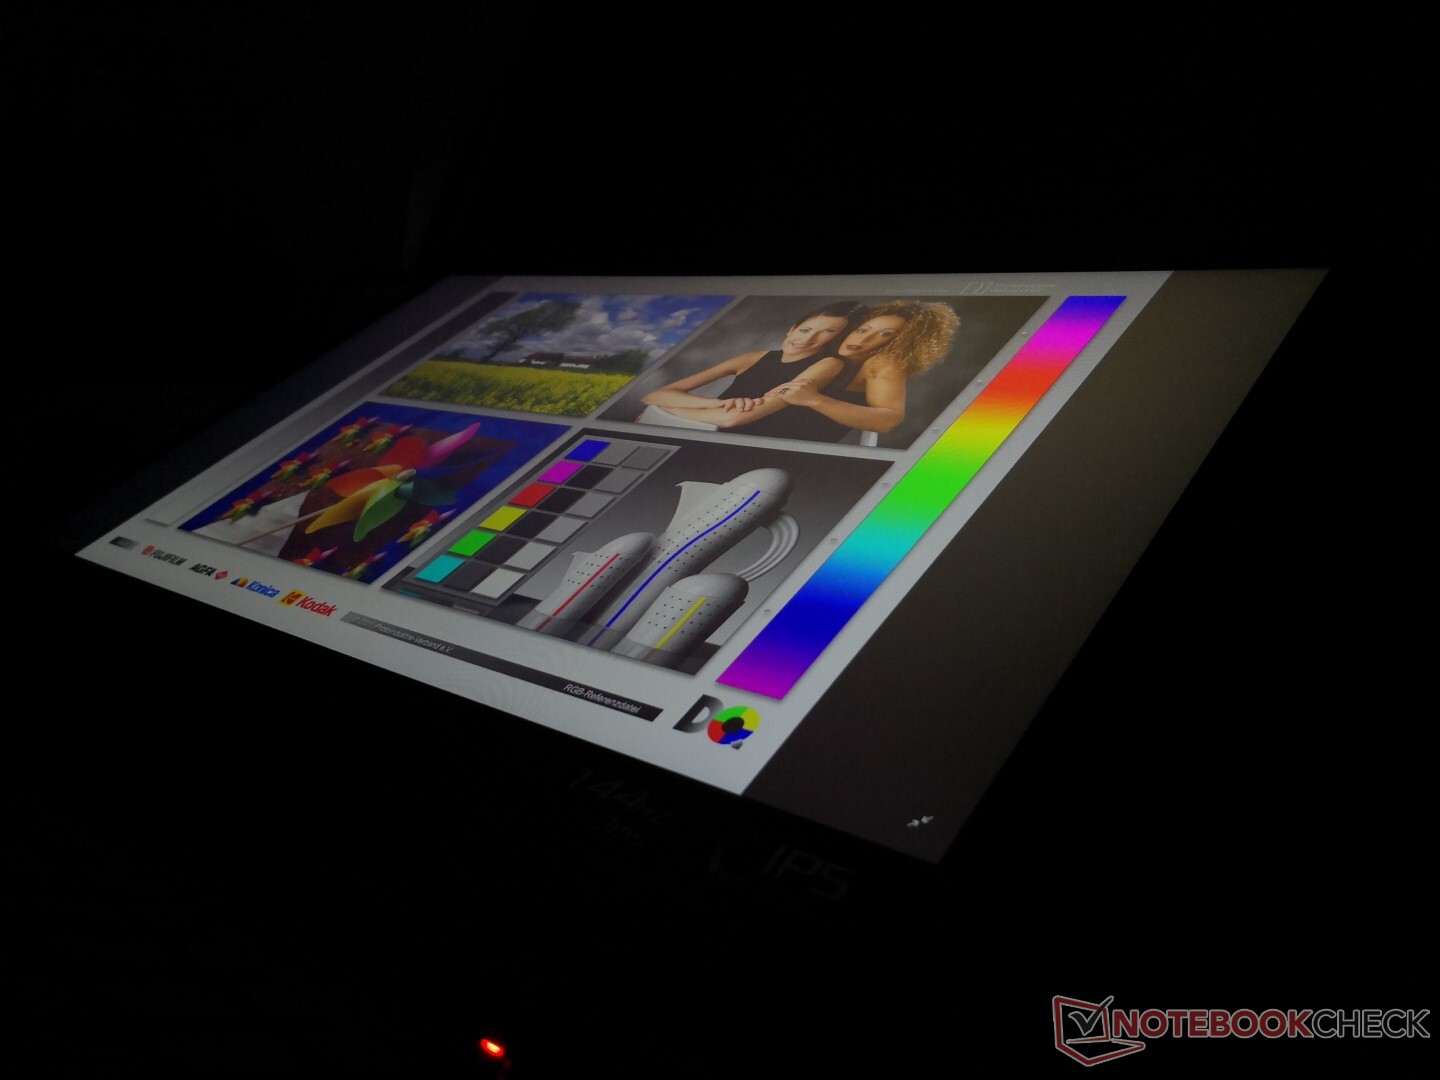
Asus utilizes the same 144 Hz AU Optronics B173HAN04.0 IPS panel for the Zephyrus S GX701, Strix III G731GV, and G731GW. Thus, our display comments about the GX701 and G731GW still apply here including the fast response times, accurate grayscale and colors out of the box, and high contrast ratio of ~1000:1. Both graininess and uneven backlight bleeding are present, but they are thankfully kept to a minimum.
While a 240 Hz IPS panel is available, Asus offers no 4K UHD options for its G731 series which tend to have deeper colors than 144 Hz or 240 Hz IPS displays. Users interested in native 4K will have to look at the Alienware m17 or Gigabyte Aero 17 instead.


| |||||||||||||||||||||||||
Brightness Distribution: 91 %
Center on Battery: 312.3 cd/m²
Contrast: 1487:1 (Black: 0.21 cd/m²)
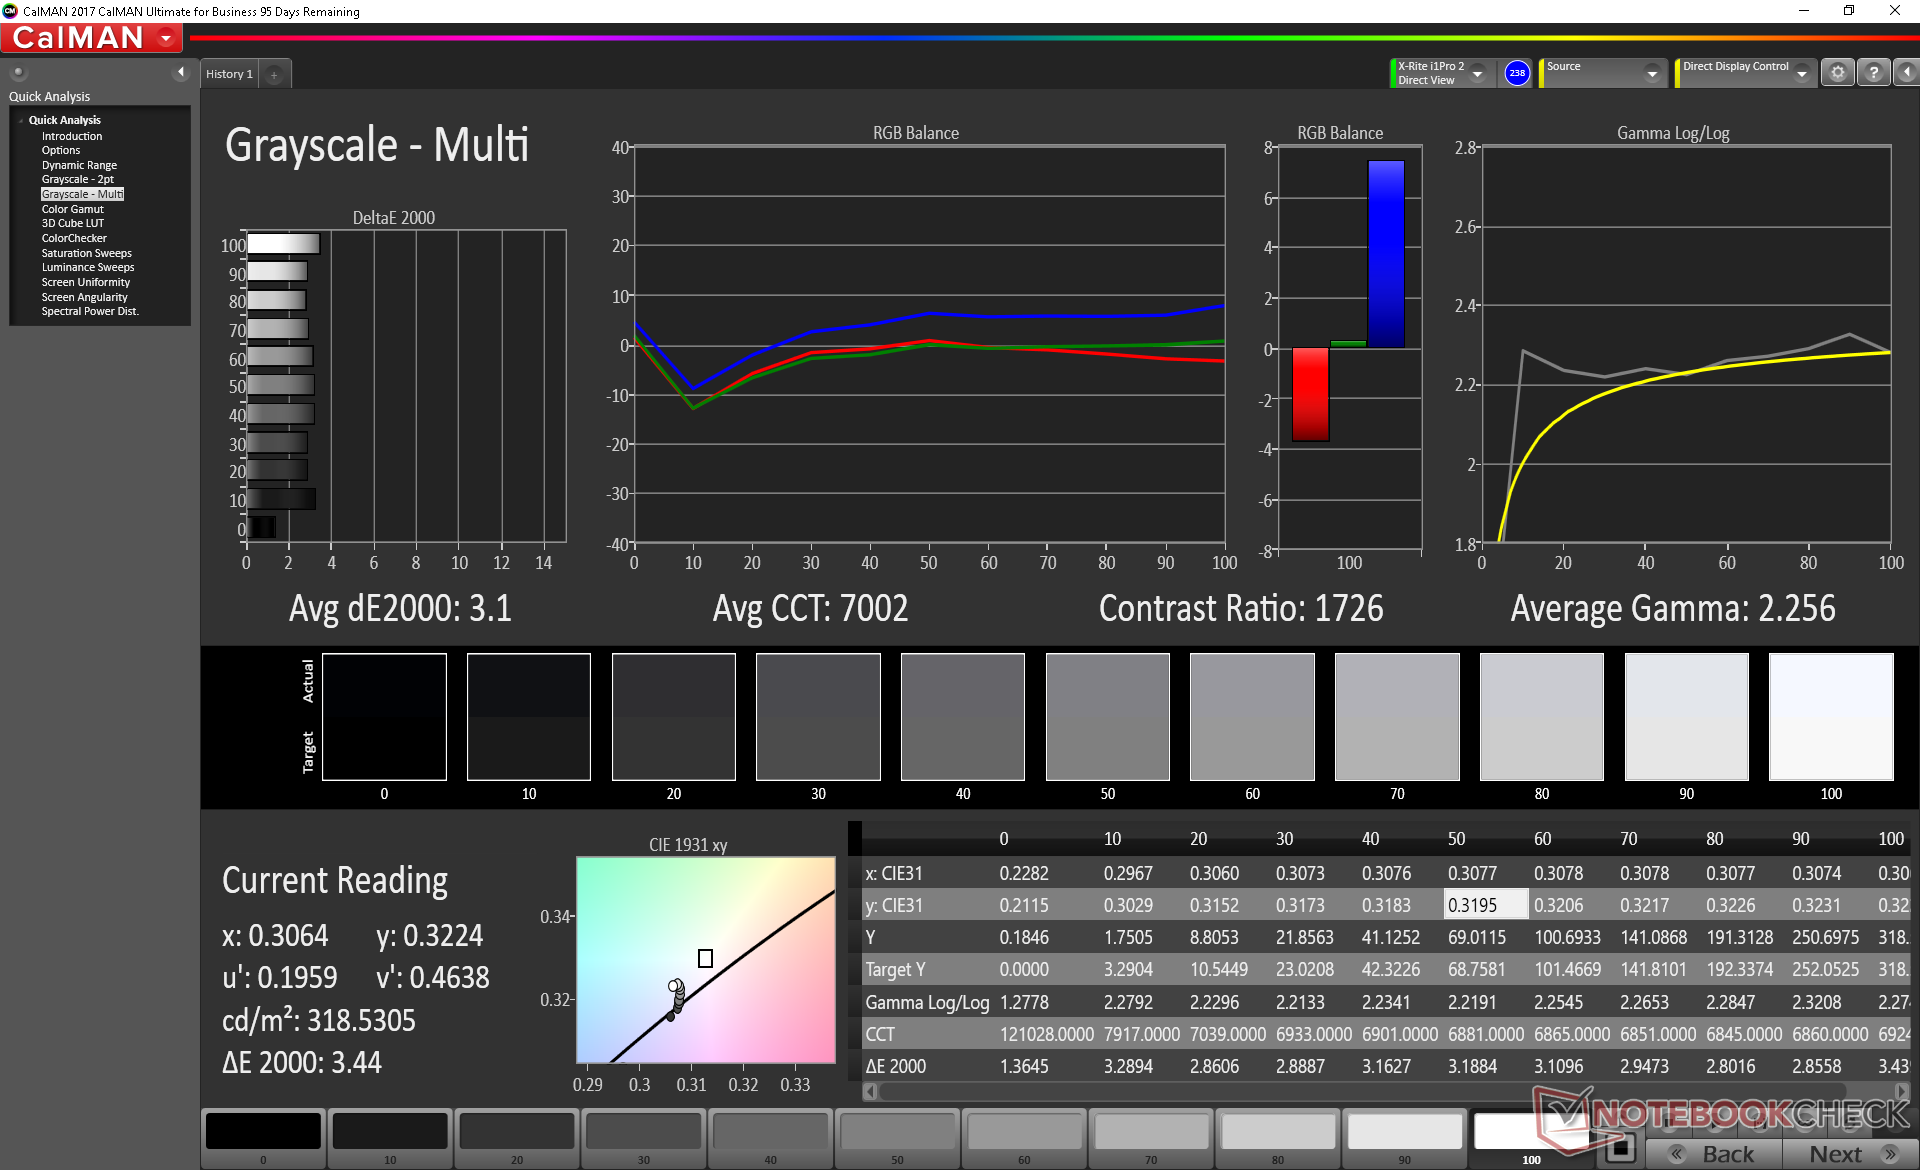
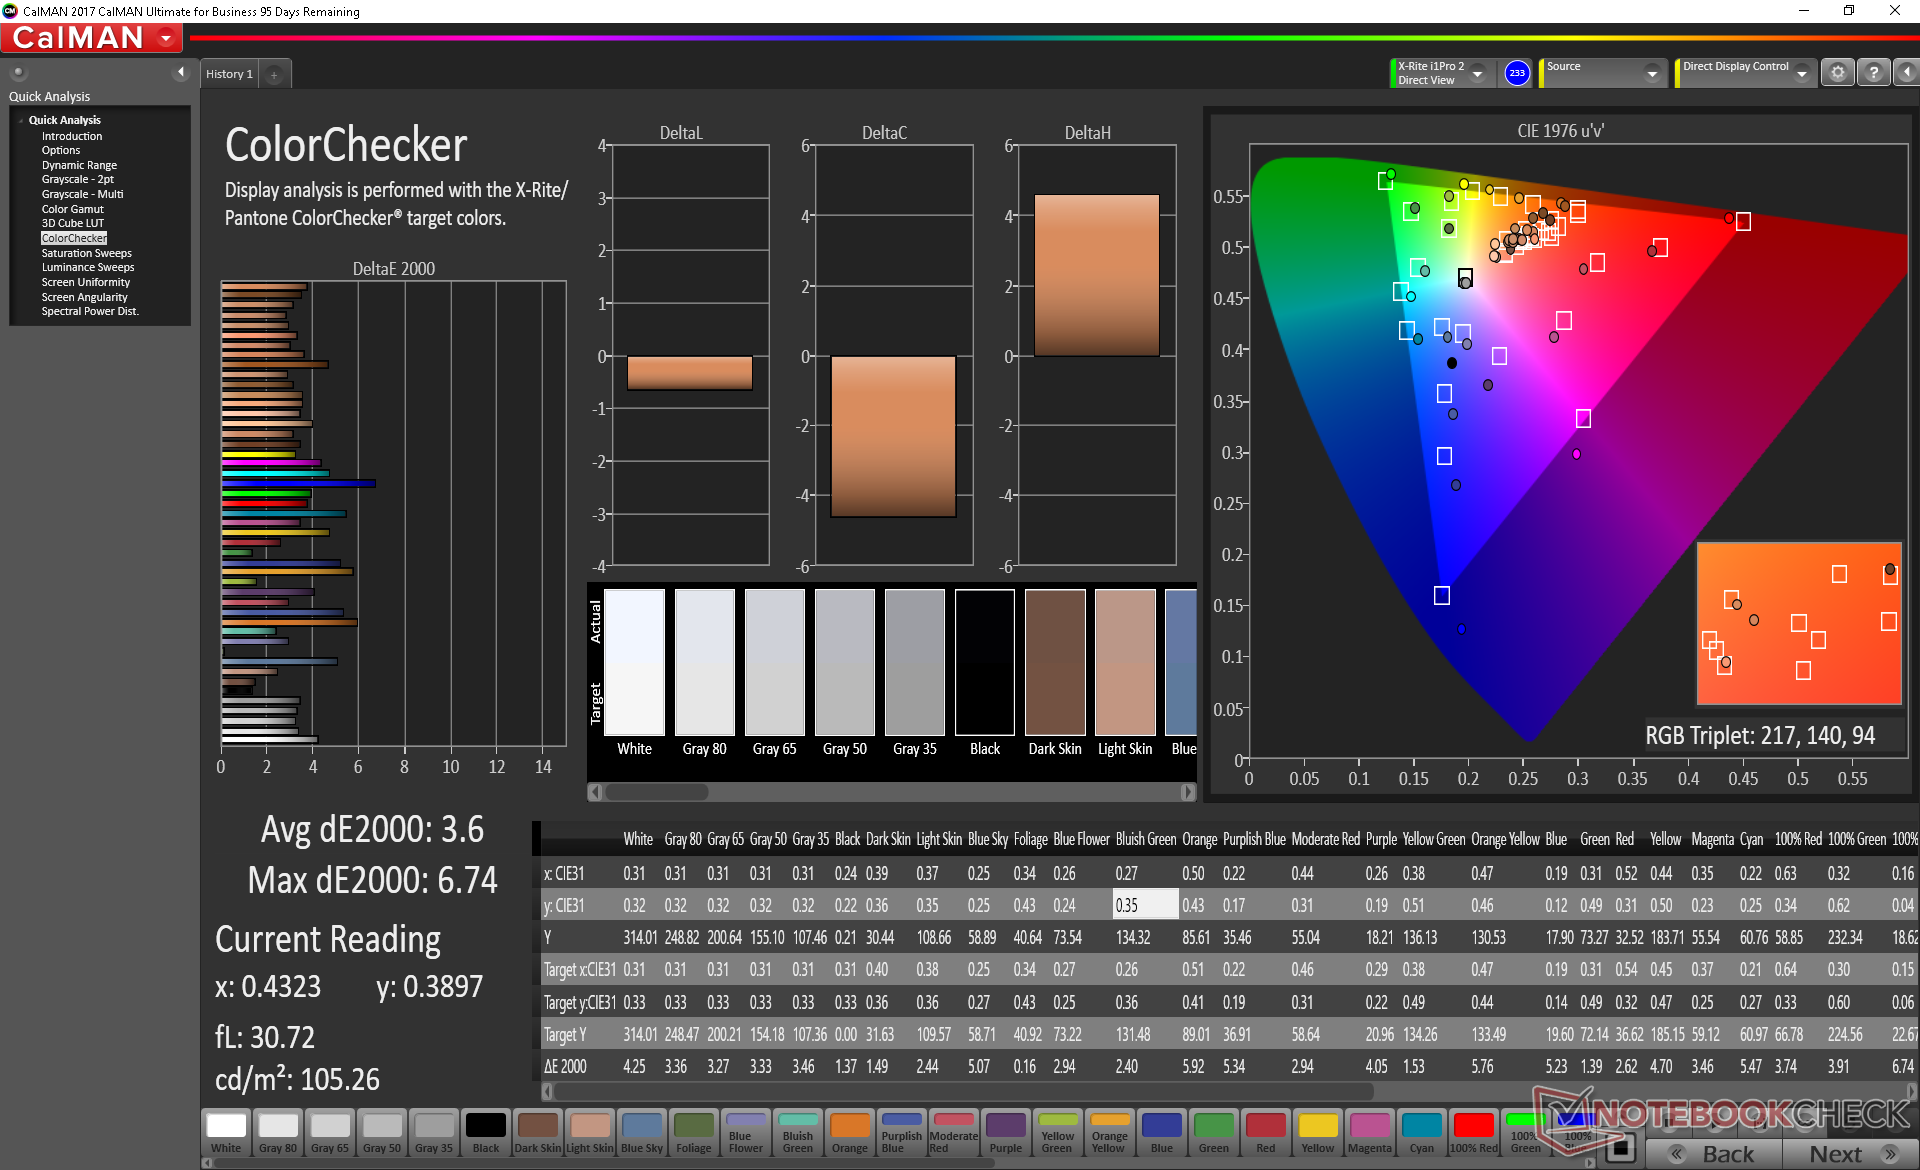
ΔE ColorChecker Calman: 3.6 | ∀{0.5-29.43 Ø4.71}
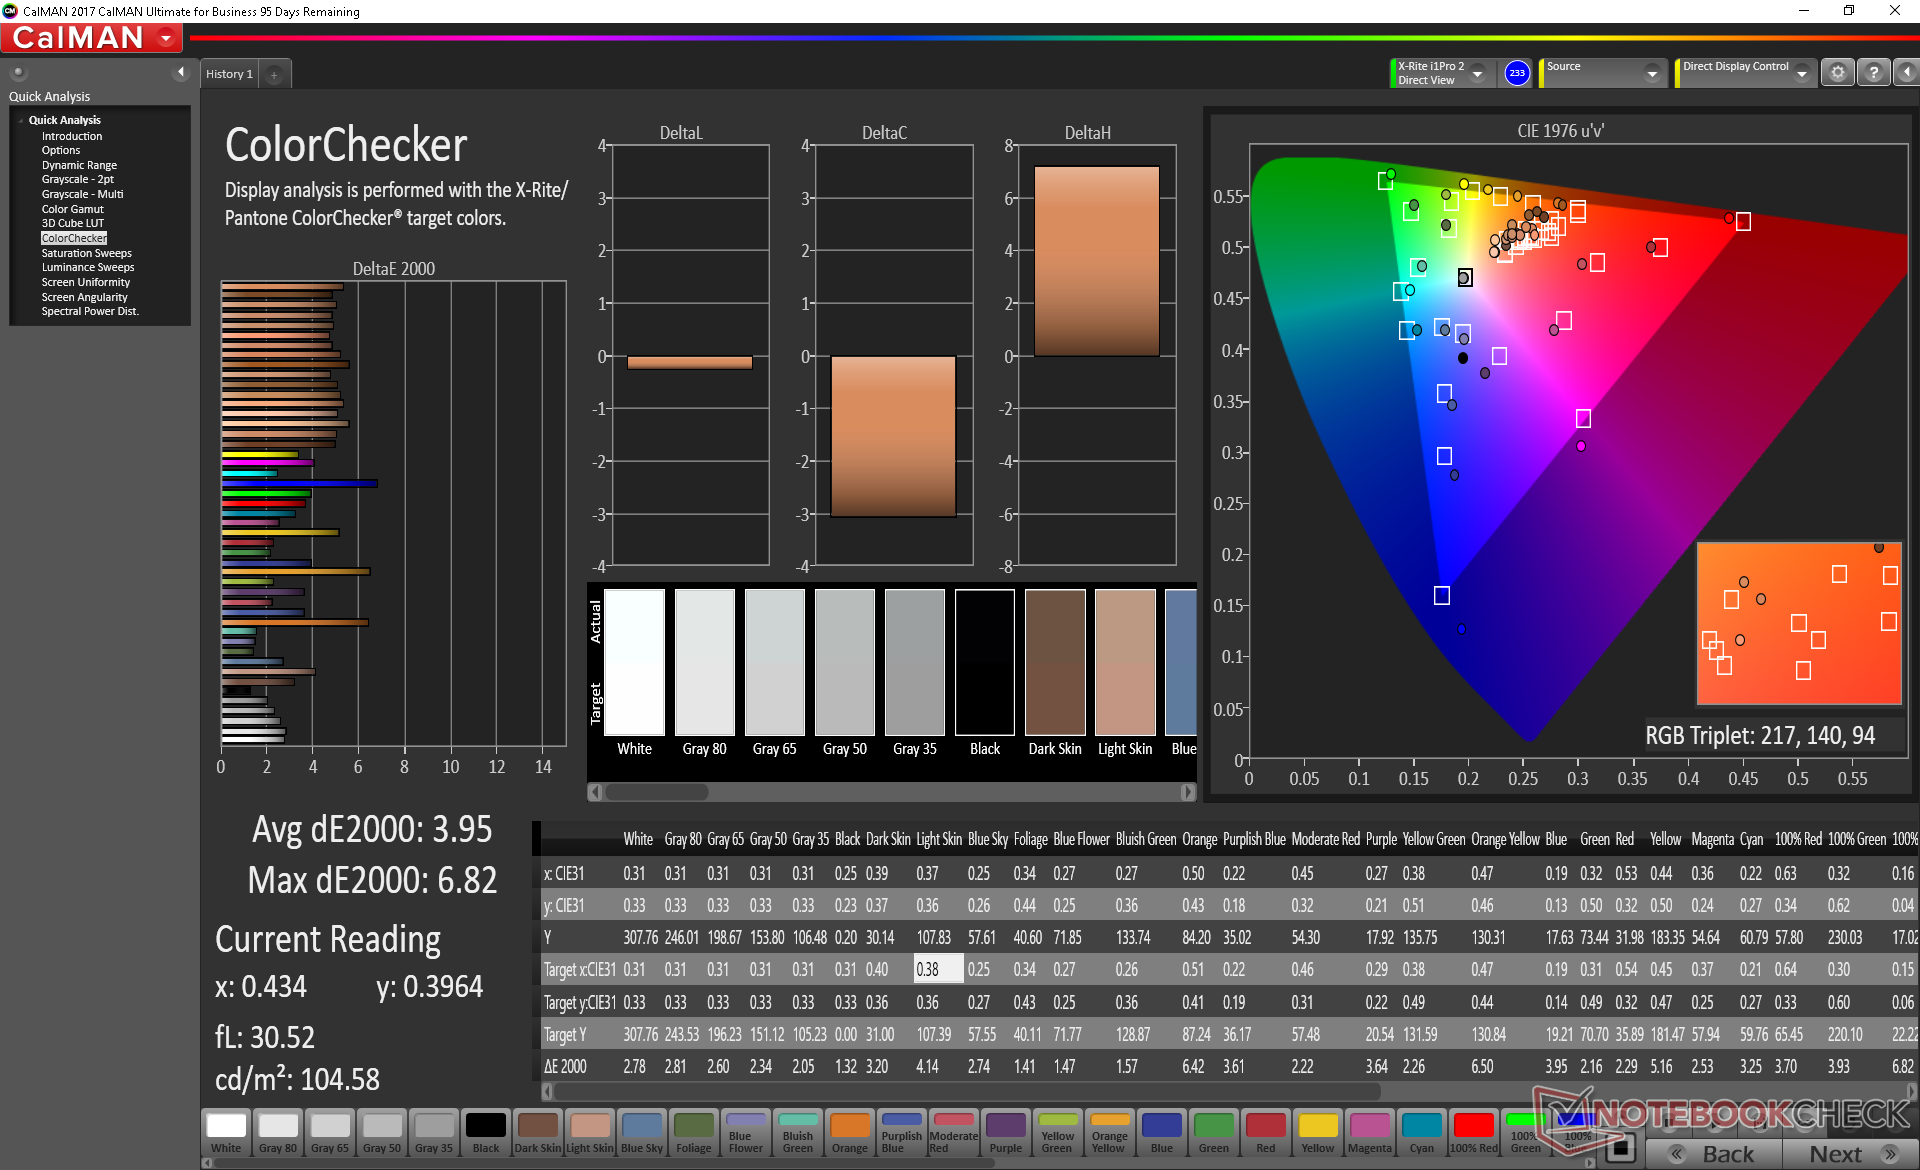
calibrated: 3.95
ΔE Greyscale Calman: 3.1 | ∀{0.09-98 Ø4.96}
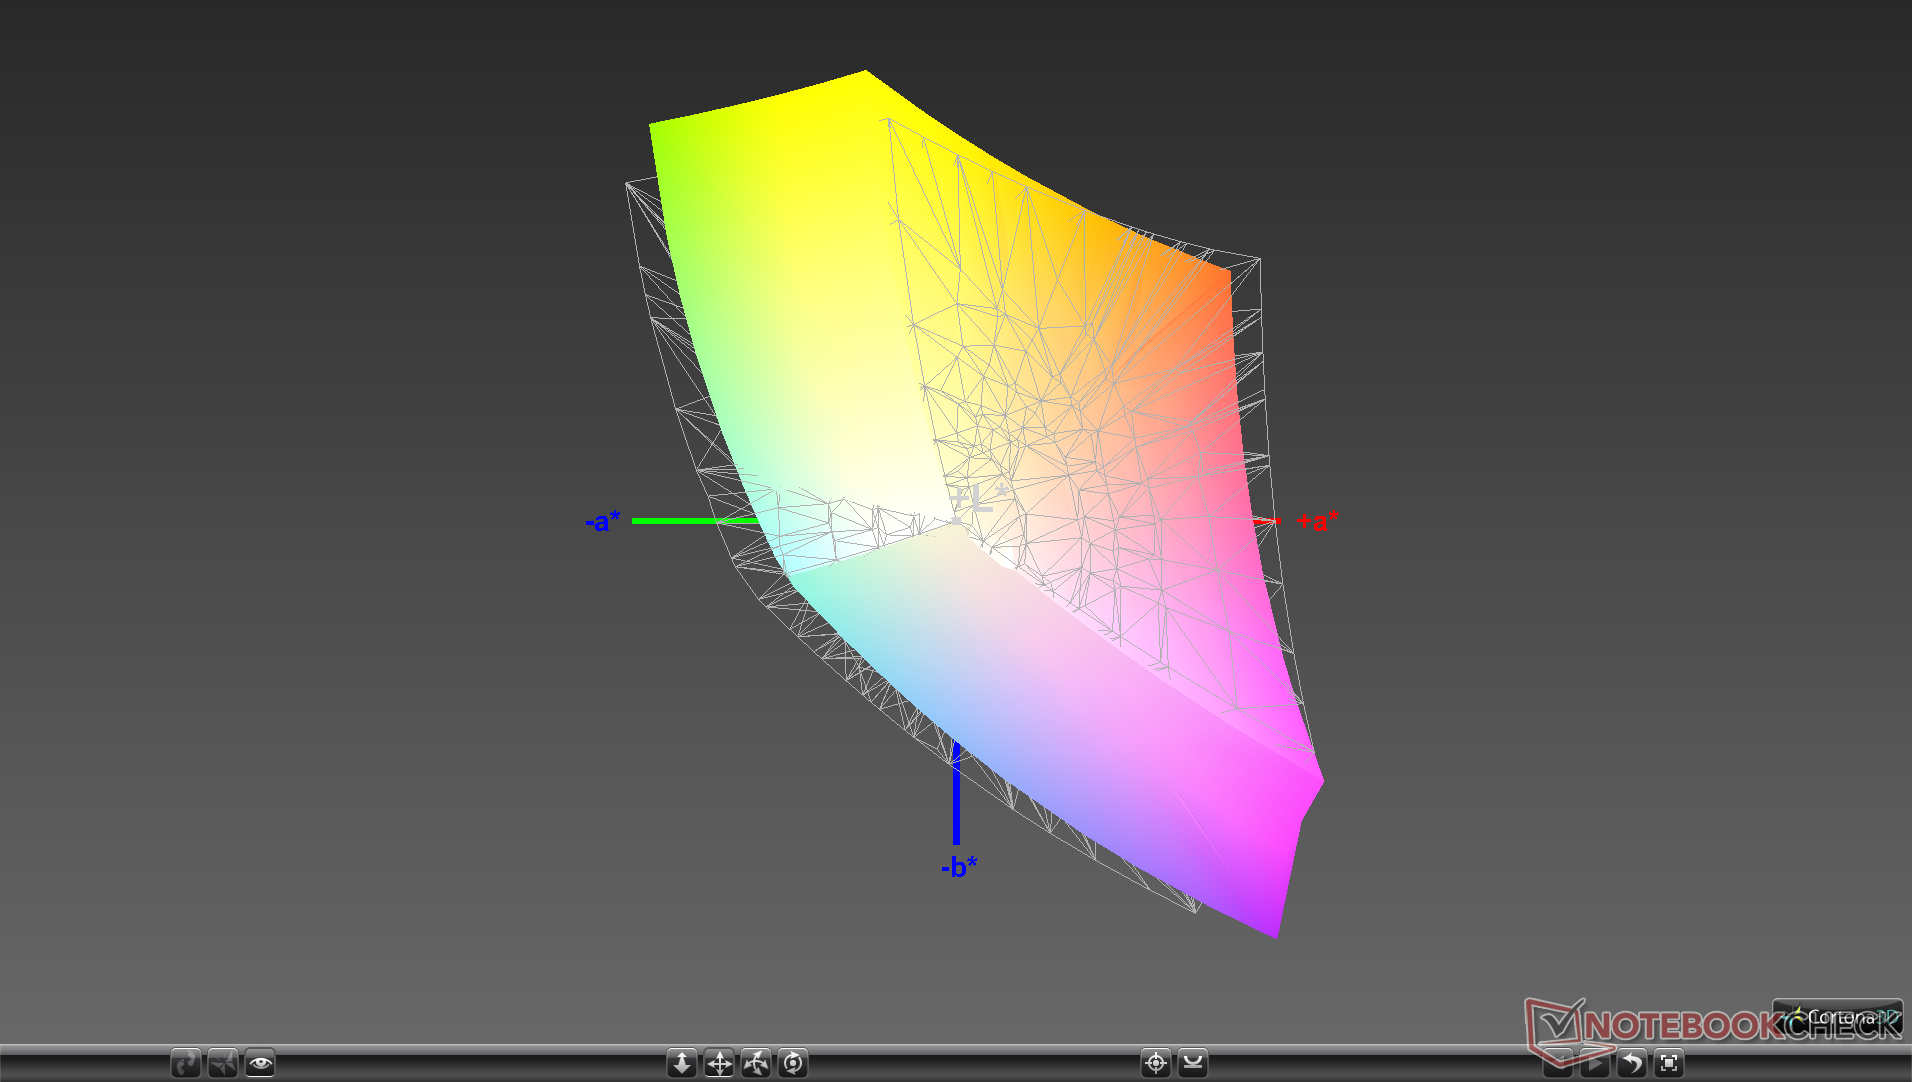
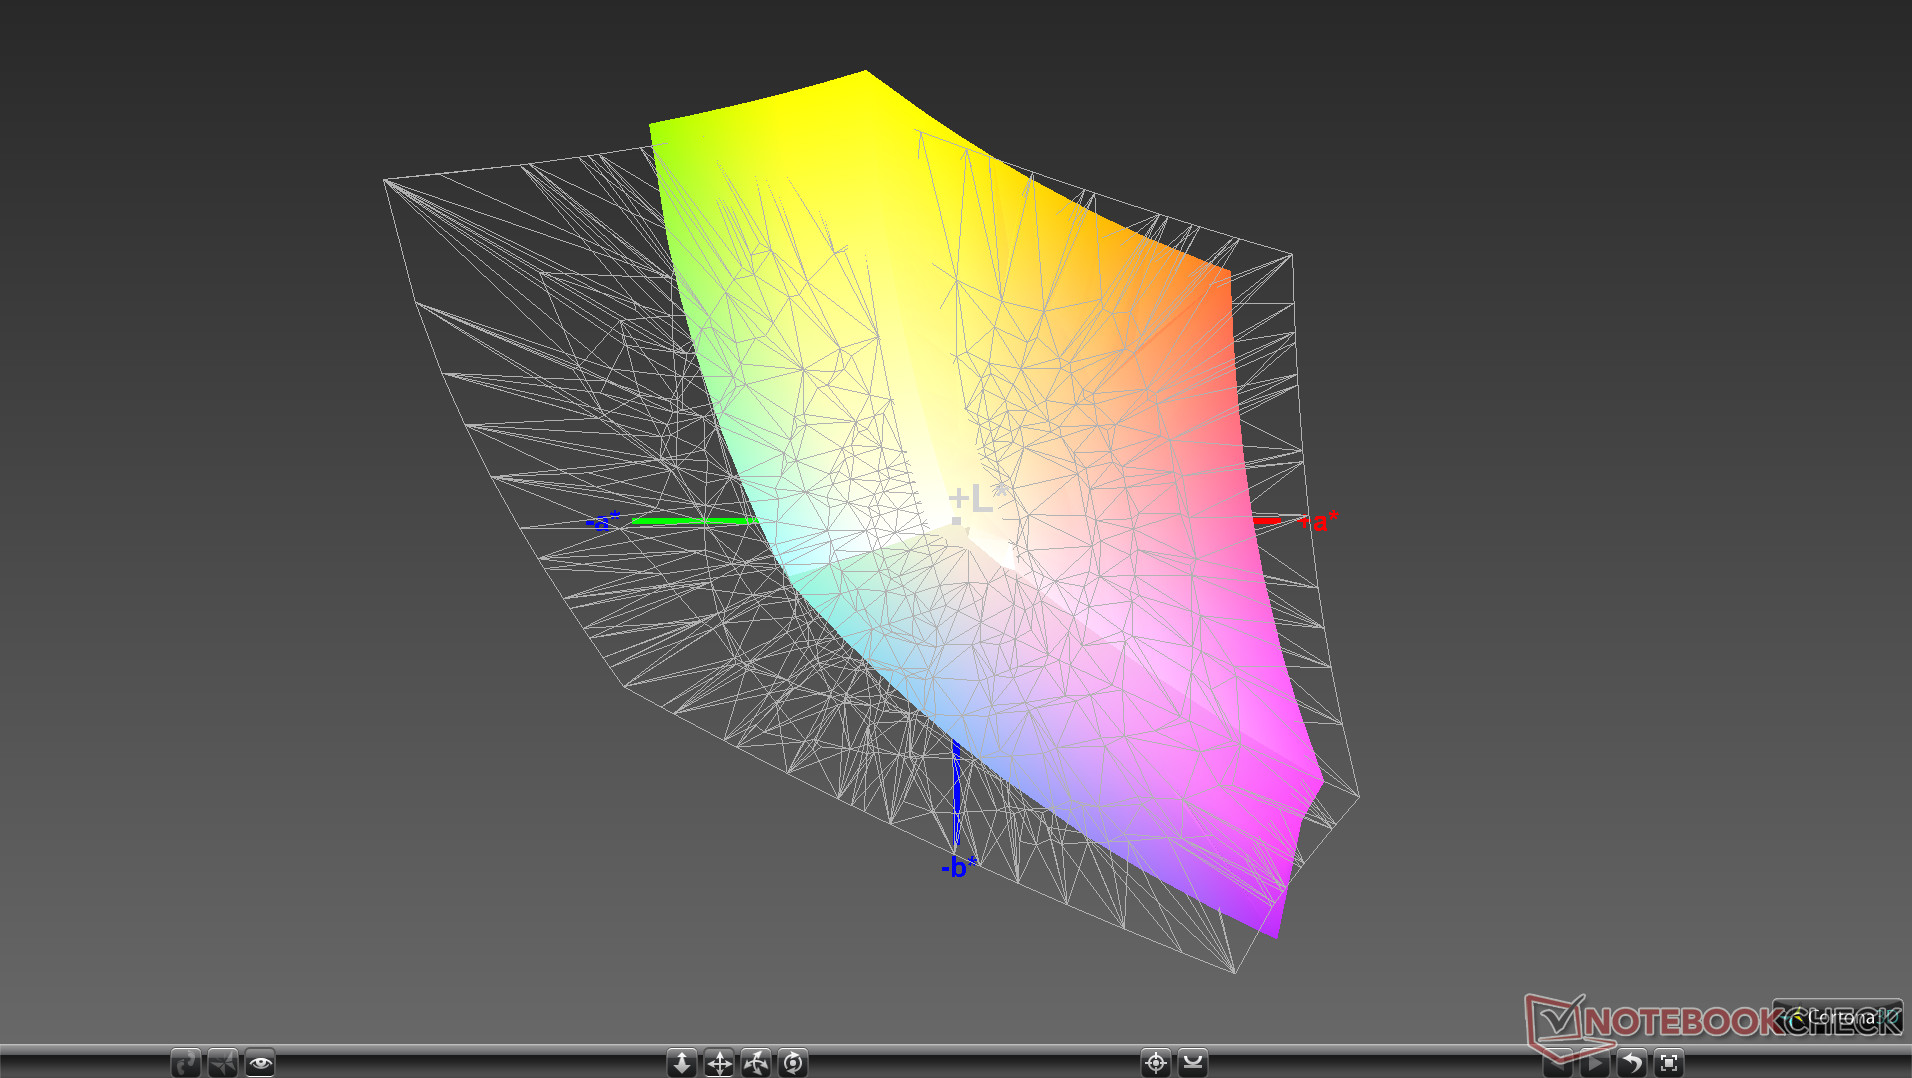
86.6% sRGB (Argyll 1.6.3 3D)
56.6% AdobeRGB 1998 (Argyll 1.6.3 3D)
63.8% AdobeRGB 1998 (Argyll 3D)
87.2% sRGB (Argyll 3D)
62.9% Display P3 (Argyll 3D)
Gamma: 2.26
CCT: 7002 K
| Asus Strix Hero III G731GV AU Optronics AUO B173HAN04.0, IPS, 17.3", 1920x1080 | Lenovo Legion Y740-17ICH AU Optronics B173HAN03.2, IPS, 17.3", 1920x1080 | Alienware m17 P37E AU Optronics B173ZAN01.0, IPS, 17.3", 3840x2160 | Razer Blade Pro 17 RTX 2080 Max-Q AU Optronics B173HAN04.0, IPS, 17.3", 1920x1080 | Asus Zephyrus S GX701GX B173HAN04.0 (AUO409D), IPS, 17.3", 1920x1080 | Asus ASUS ROG Strix SCAR III G731GW-XB74 AU Optronics AUO409D, IPS, 17.3", 1920x1080 | |
|---|---|---|---|---|---|---|
| Display | 3% | 36% | -2% | 0% | -1% | |
| Display P3 Coverage (%) | 62.9 | 64 2% | 86.4 37% | 60.6 -4% | 62.9 0% | 61.9 -2% |
| sRGB Coverage (%) | 87.2 | 90.4 4% | 99.9 15% | 89 2% | 87.8 1% | 86.3 -1% |
| AdobeRGB 1998 Coverage (%) | 63.8 | 64.8 2% | 99.1 55% | 62.1 -3% | 63.9 0% | 62.9 -1% |
| Response Times | -68% | -279% | 10% | 7% | -2% | |
| Response Time Grey 50% / Grey 80% * (ms) | 6.8 ? | 15.6 ? -129% | 35.6 ? -424% | 6.8 ? -0% | 7.2 ? -6% | 7.2 ? -6% |
| Response Time Black / White * (ms) | 12 ? | 12.8 ? -7% | 28 ? -133% | 9.6 ? 20% | 9.6 ? 20% | 11.6 ? 3% |
| PWM Frequency (Hz) | ||||||
| Screen | -25% | -20% | 0% | 14% | -13% | |
| Brightness middle (cd/m²) | 312.3 | 299.1 -4% | 357.9 15% | 299.3 -4% | 288 -8% | 297.4 -5% |
| Brightness (cd/m²) | 297 | 273 -8% | 347 17% | 294 -1% | 287 -3% | 306 3% |
| Brightness Distribution (%) | 91 | 81 -11% | 94 3% | 94 3% | 91 0% | 80 -12% |
| Black Level * (cd/m²) | 0.21 | 0.27 -29% | 0.33 -57% | 0.29 -38% | 0.2 5% | 0.31 -48% |
| Contrast (:1) | 1487 | 1108 -25% | 1085 -27% | 1032 -31% | 1440 -3% | 959 -36% |
| Colorchecker dE 2000 * | 3.6 | 5.07 -41% | 6.57 -83% | 2.55 29% | 2.33 35% | 4.08 -13% |
| Colorchecker dE 2000 max. * | 6.74 | 10.55 -57% | 9.86 -46% | 4.73 30% | 5.34 21% | 6.88 -2% |
| Colorchecker dE 2000 calibrated * | 3.95 | 3.31 16% | 6.74 -71% | 2.9 27% | 2.47 37% | 4 -1% |
| Greyscale dE 2000 * | 3.1 | 6.8 -119% | 4.3 -39% | 3.5 -13% | 1.19 62% | 4 -29% |
| Gamma | 2.26 97% | 2.46 89% | 2.6 85% | 2.28 96% | 2.41 91% | 2.259 97% |
| CCT | 7002 93% | 7805 83% | 6403 102% | 7101 92% | 6710 97% | 7205 90% |
| Color Space (Percent of AdobeRGB 1998) (%) | 56.6 | 58.5 3% | 88.4 56% | 57 1% | 57 1% | 56 -1% |
| Color Space (Percent of sRGB) (%) | 86.6 | 89.9 4% | 100 15% | 88.7 2% | 88 2% | 86 -1% |
| Total Average (Program / Settings) | -30% /
-25% | -88% /
-42% | 3% /
1% | 7% /
10% | -5% /
-10% |
* ... smaller is better

Display Response Times
| ↔ Response Time Black to White | ||
|---|---|---|
| 12 ms ... rise ↗ and fall ↘ combined | ↗ 6.8 ms rise | 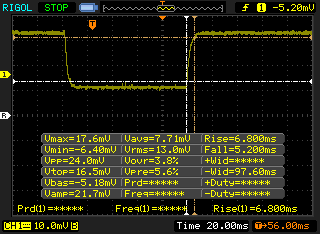 |
| ↘ 5.2 ms fall | ||
| The screen shows good response rates in our tests, but may be too slow for competitive gamers. In comparison, all tested devices range from 0.1 (minimum) to 240 (maximum) ms. » 32 % of all devices are better. This means that the measured response time is better than the average of all tested devices (19.8 ms). | ||
| ↔ Response Time 50% Grey to 80% Grey | ||
| 6.8 ms ... rise ↗ and fall ↘ combined | ↗ 3.4 ms rise | 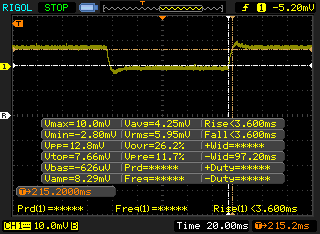 |
| ↘ 3.4 ms fall | ||
| The screen shows very fast response rates in our tests and should be very well suited for fast-paced gaming. In comparison, all tested devices range from 0.165 (minimum) to 636 (maximum) ms. » 20 % of all devices are better. This means that the measured response time is better than the average of all tested devices (30.9 ms). | ||
Screen Flickering / PWM (Pulse-Width Modulation)
| Screen flickering / PWM not detected | 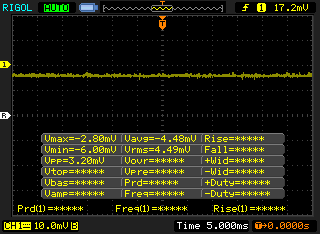 | ||
In comparison: 52 % of all tested devices do not use PWM to dim the display. If PWM was detected, an average of 7741 (minimum: 5 - maximum: 343500) Hz was measured. | |||

Performance
Current G731 SKUs include Intel 9th gen Core i5-9300H, Core i7-9750H, and Core i9-9880H options alongside the GeForce GTX 1660 Ti, RTX 2060, or the RTX 2070 GPU. AMD fans would have to look at the TUF FX series or the Zephyrus G series to get their Radeon fix instead. Optimus is included by default on all configurations to automatically exclude G-Sync.
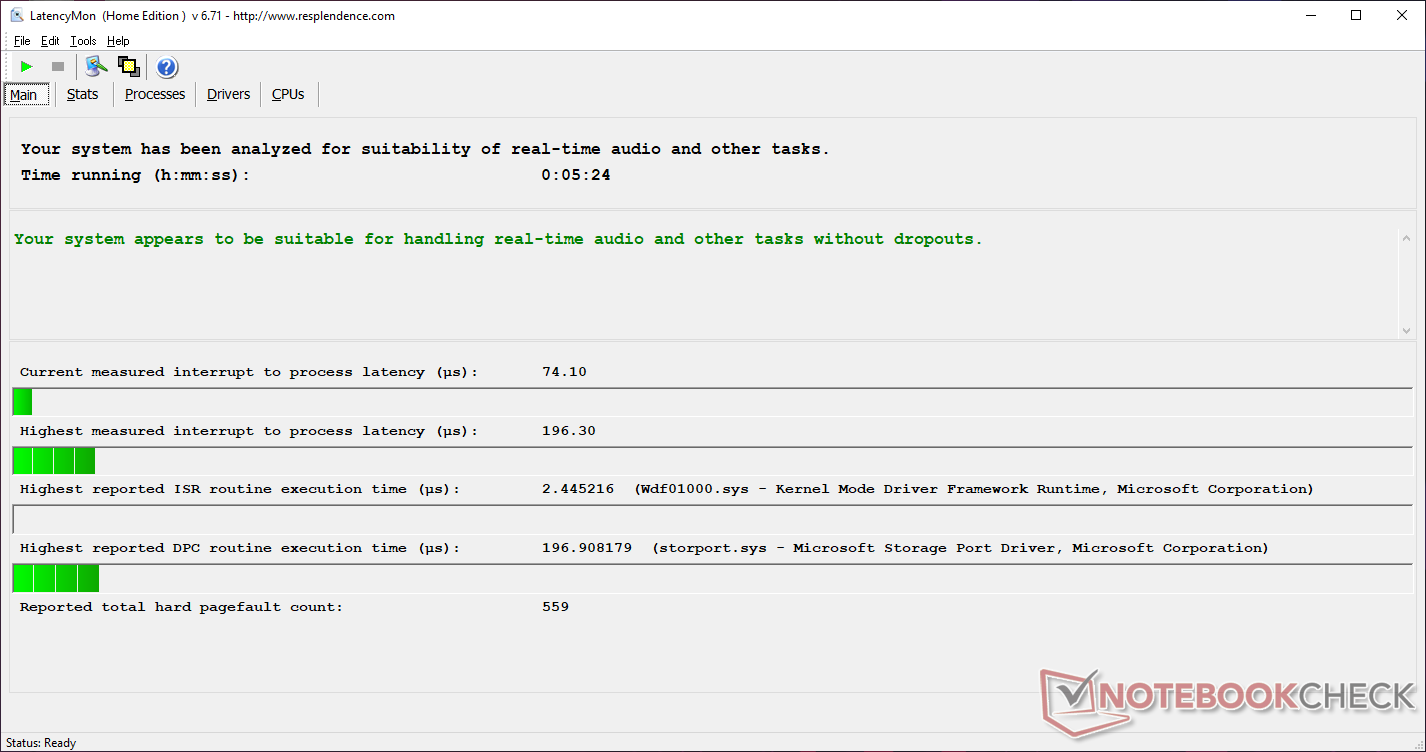
LatencyMon shows DPC latency issues when the wireless is enabled. The problem appears to subside when the wireless is disabled.


Processor
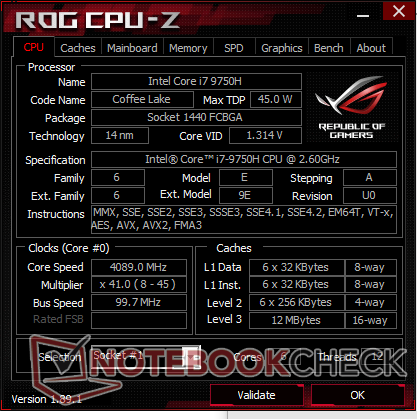
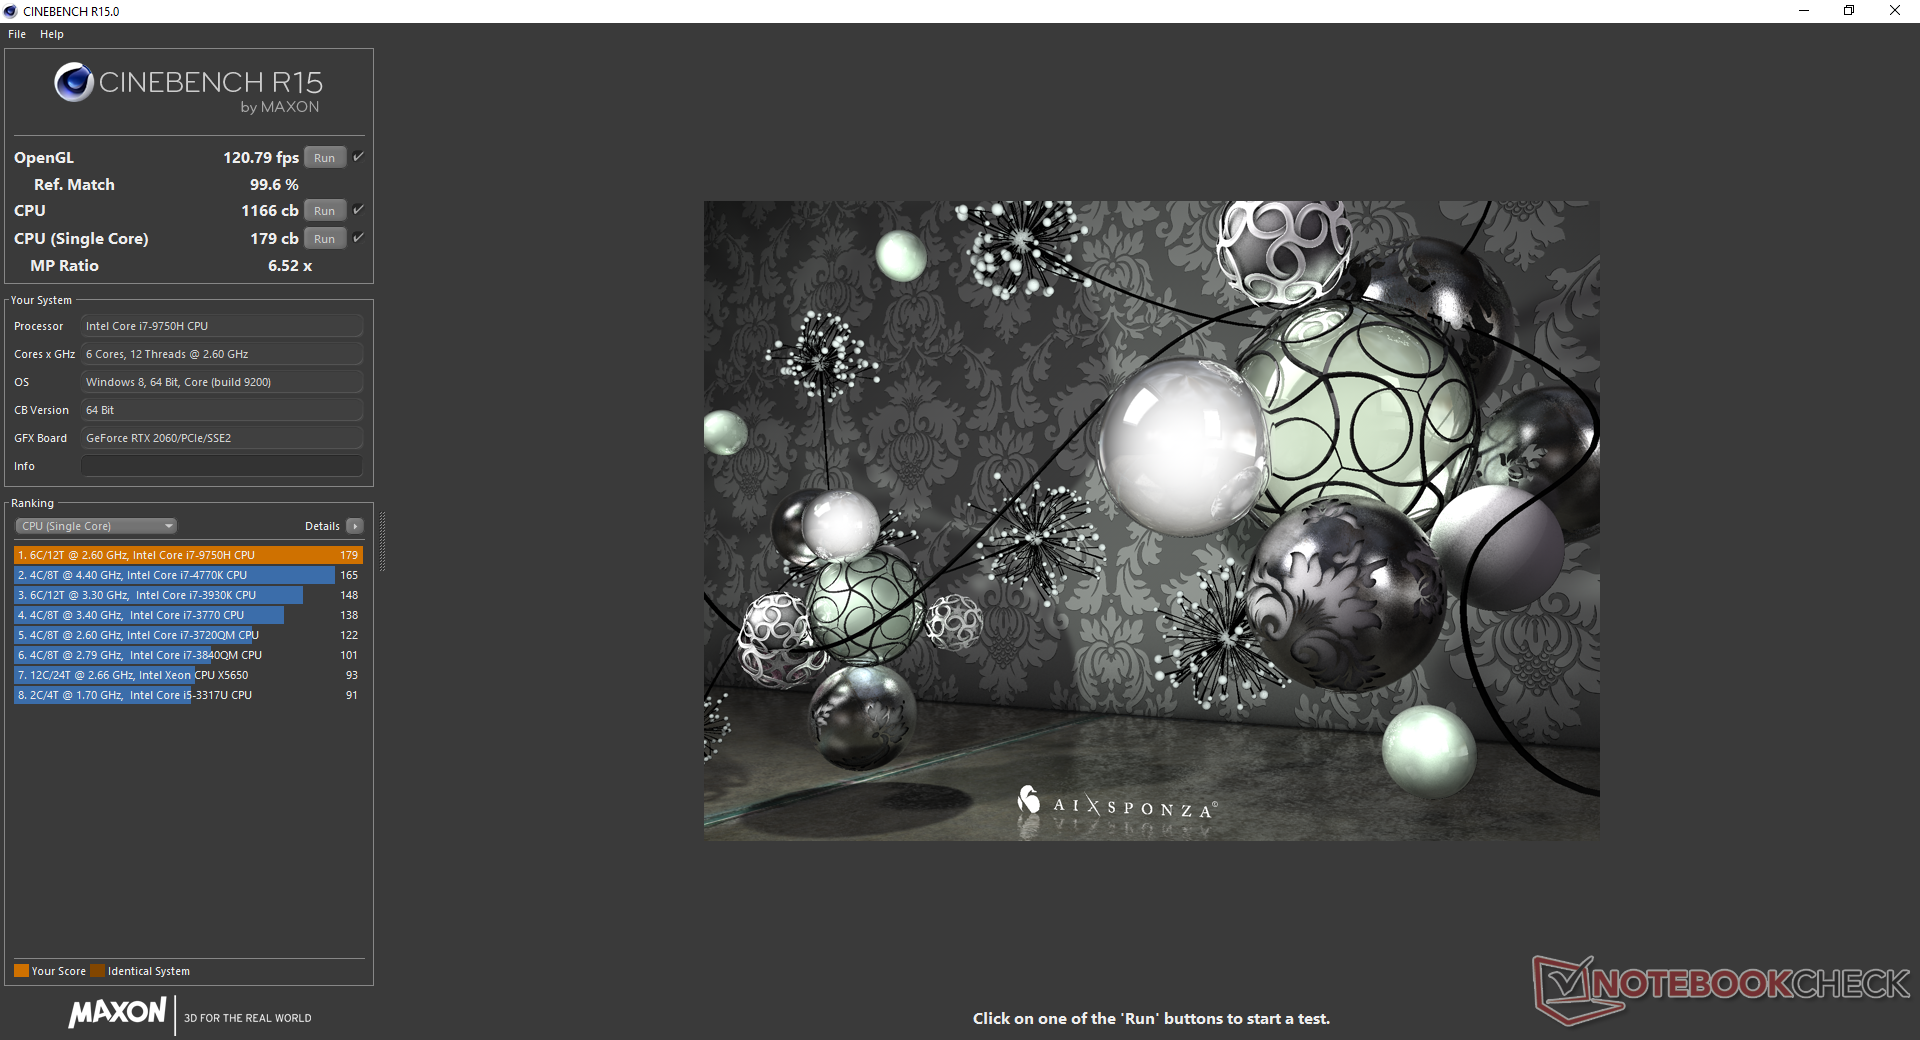
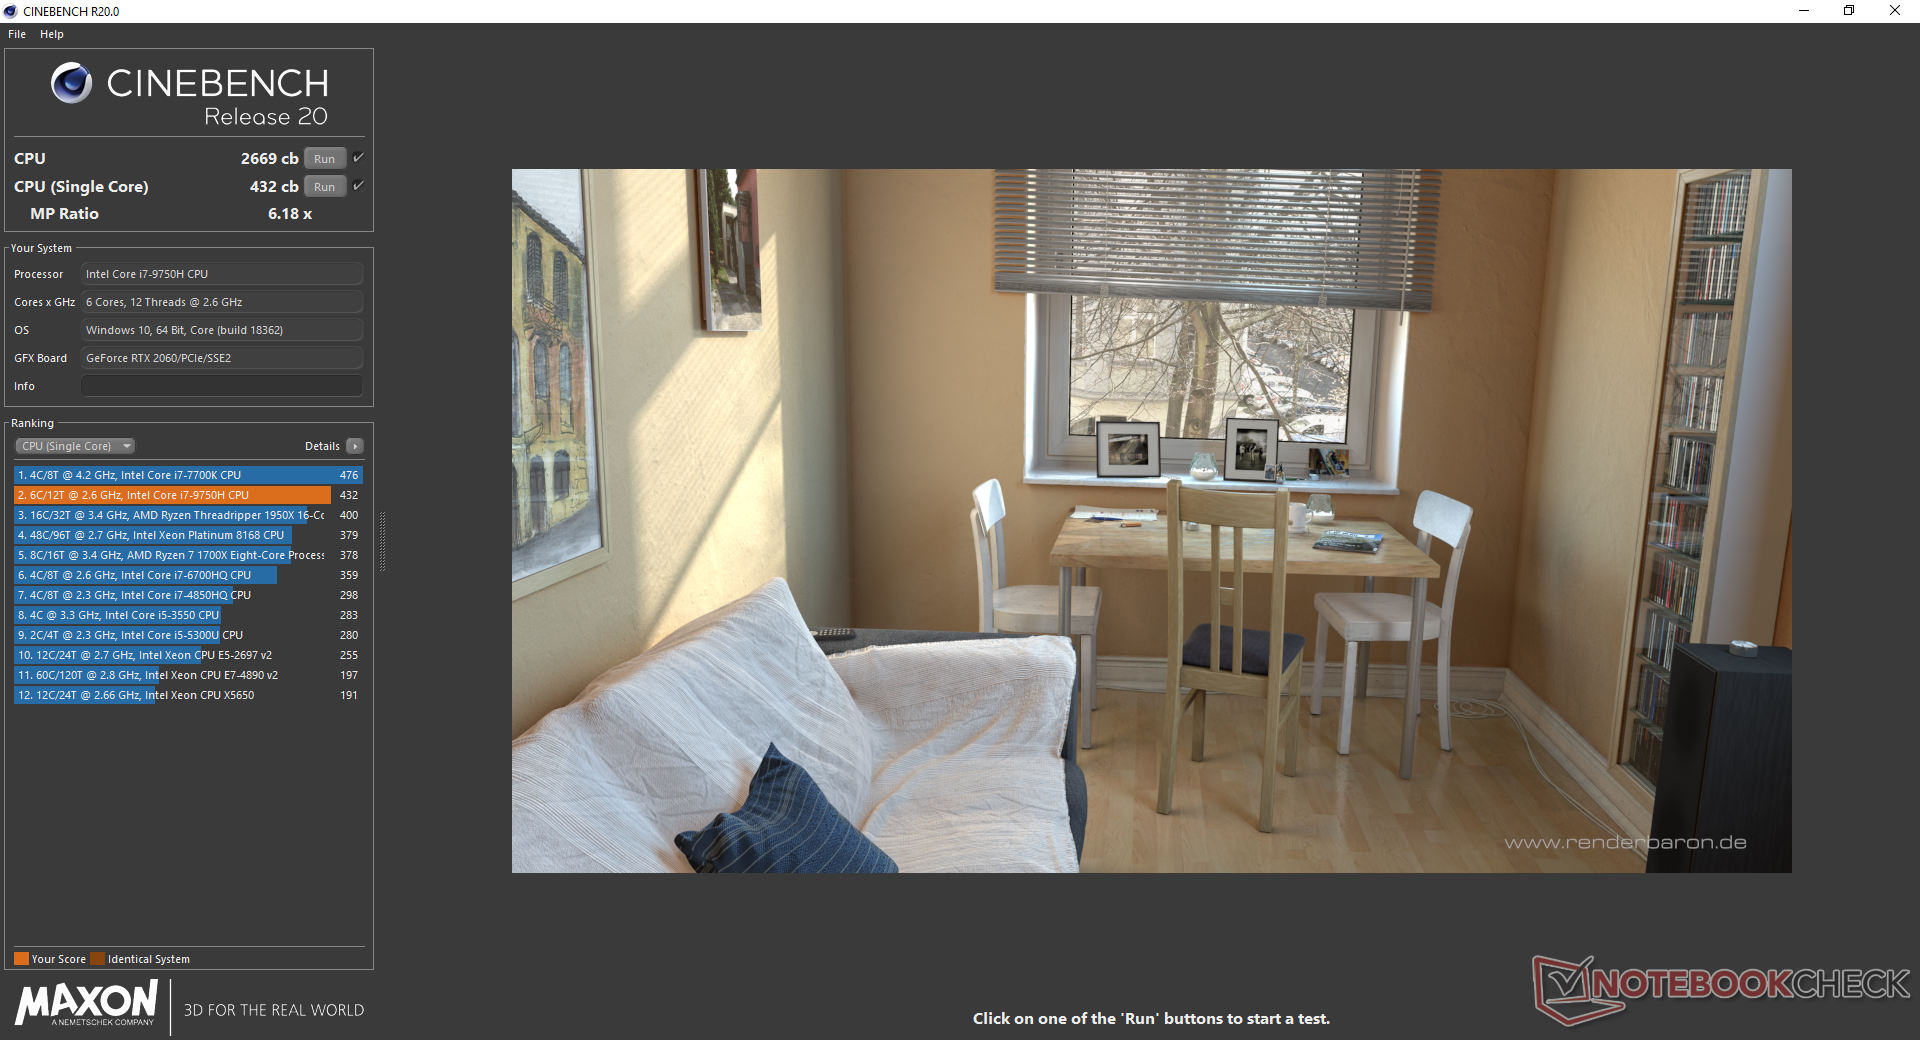
The Core i7-9750H is a familiar sight on most gaming laptops of as 2019. Performance on the Asus G731GV is where we expect it to be at within 2 percent of the average Core i7-9750H in our database taken from 37 other laptops with the same CPU. Opting for the Core i9 SKU will see a multi-thread performance gain of 20 to 50 percent depending on how well the G731 can maintain high Turbo Boost clock rates. In general, however, users upgrading from a Core i5-8300H, i5-9300H, or i7-7700HQ will see more significant performance boosts than those who may upgrading from the Core i7-8750H.
See our dedicated page on the Core i7-9750H for more technical information and benchmark comparisons.
System Performance
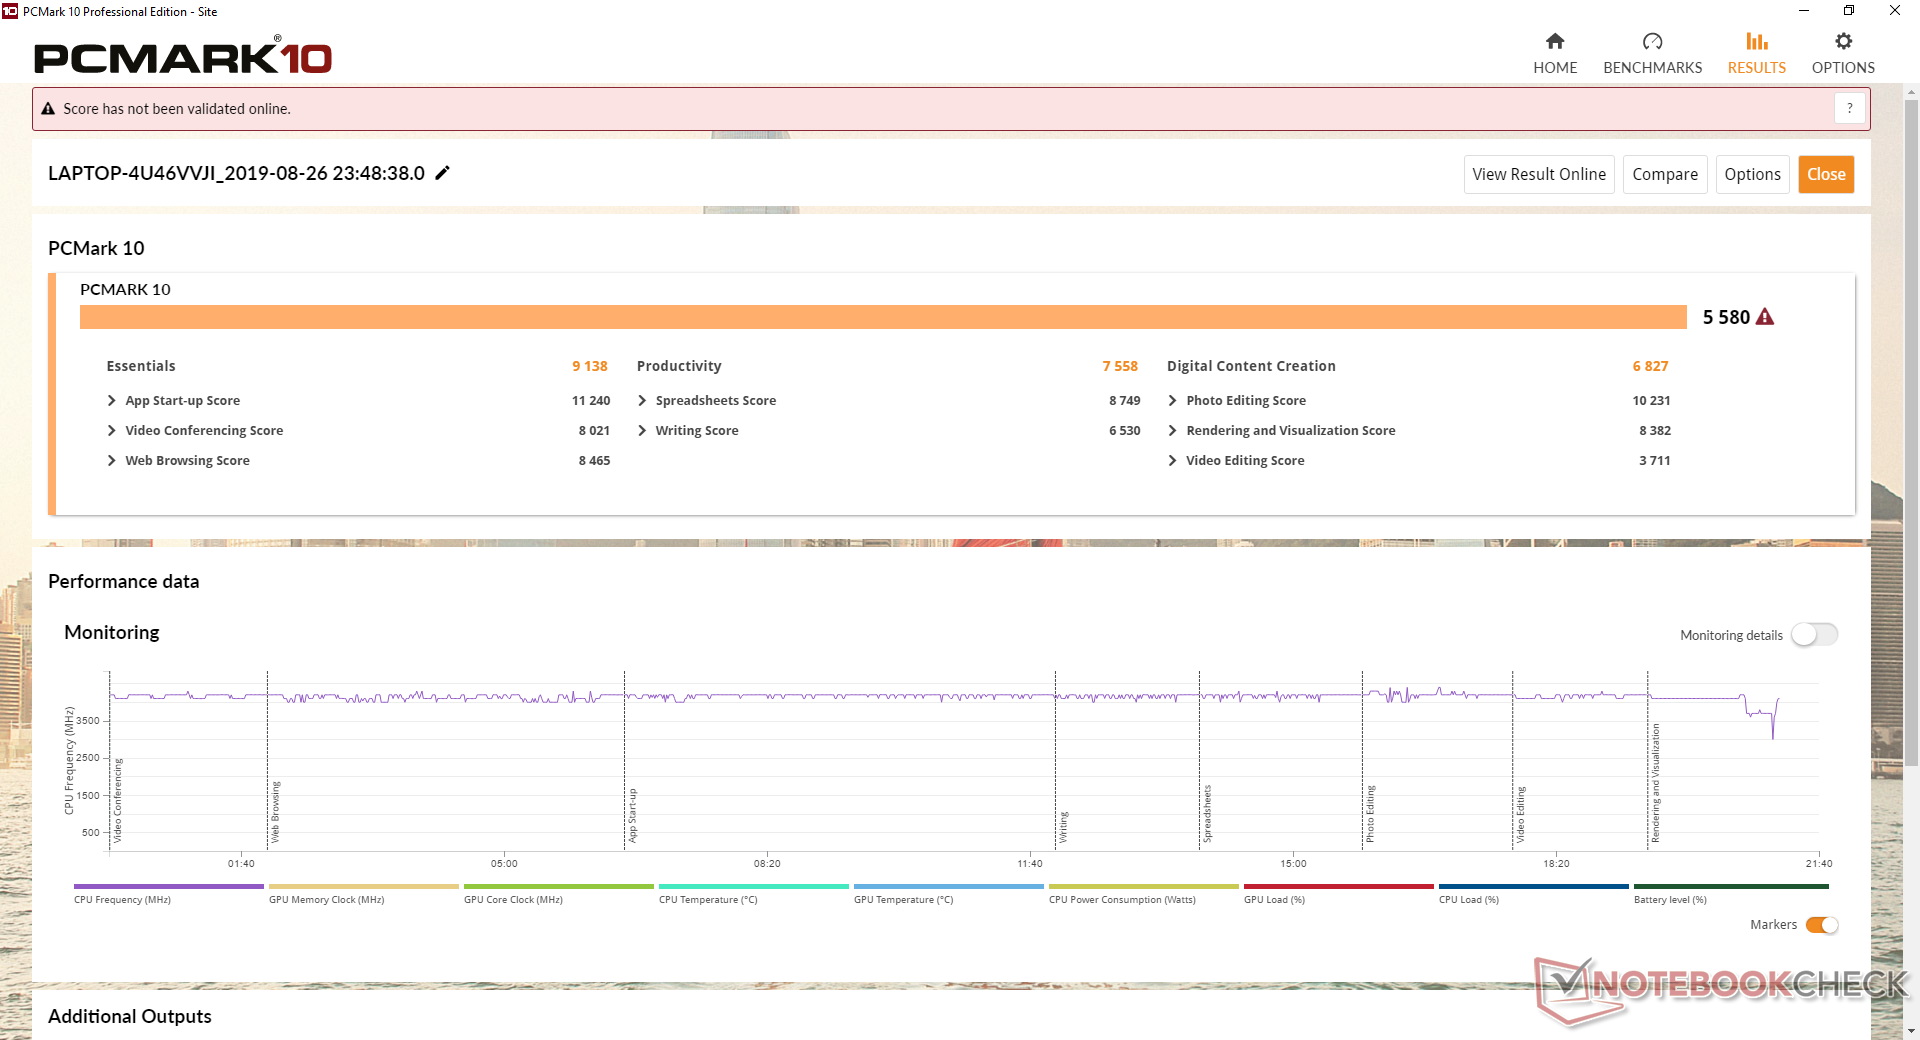
PCMark results are consistently below the G731GW by only just a few percentage points. In other words, day-to-day workloads like browsing or emailing will feel just as fast on the G731GV even though it is equipped with a slower GPU. You're getting a high-end machine no matter which configuration of the G731 you choose.
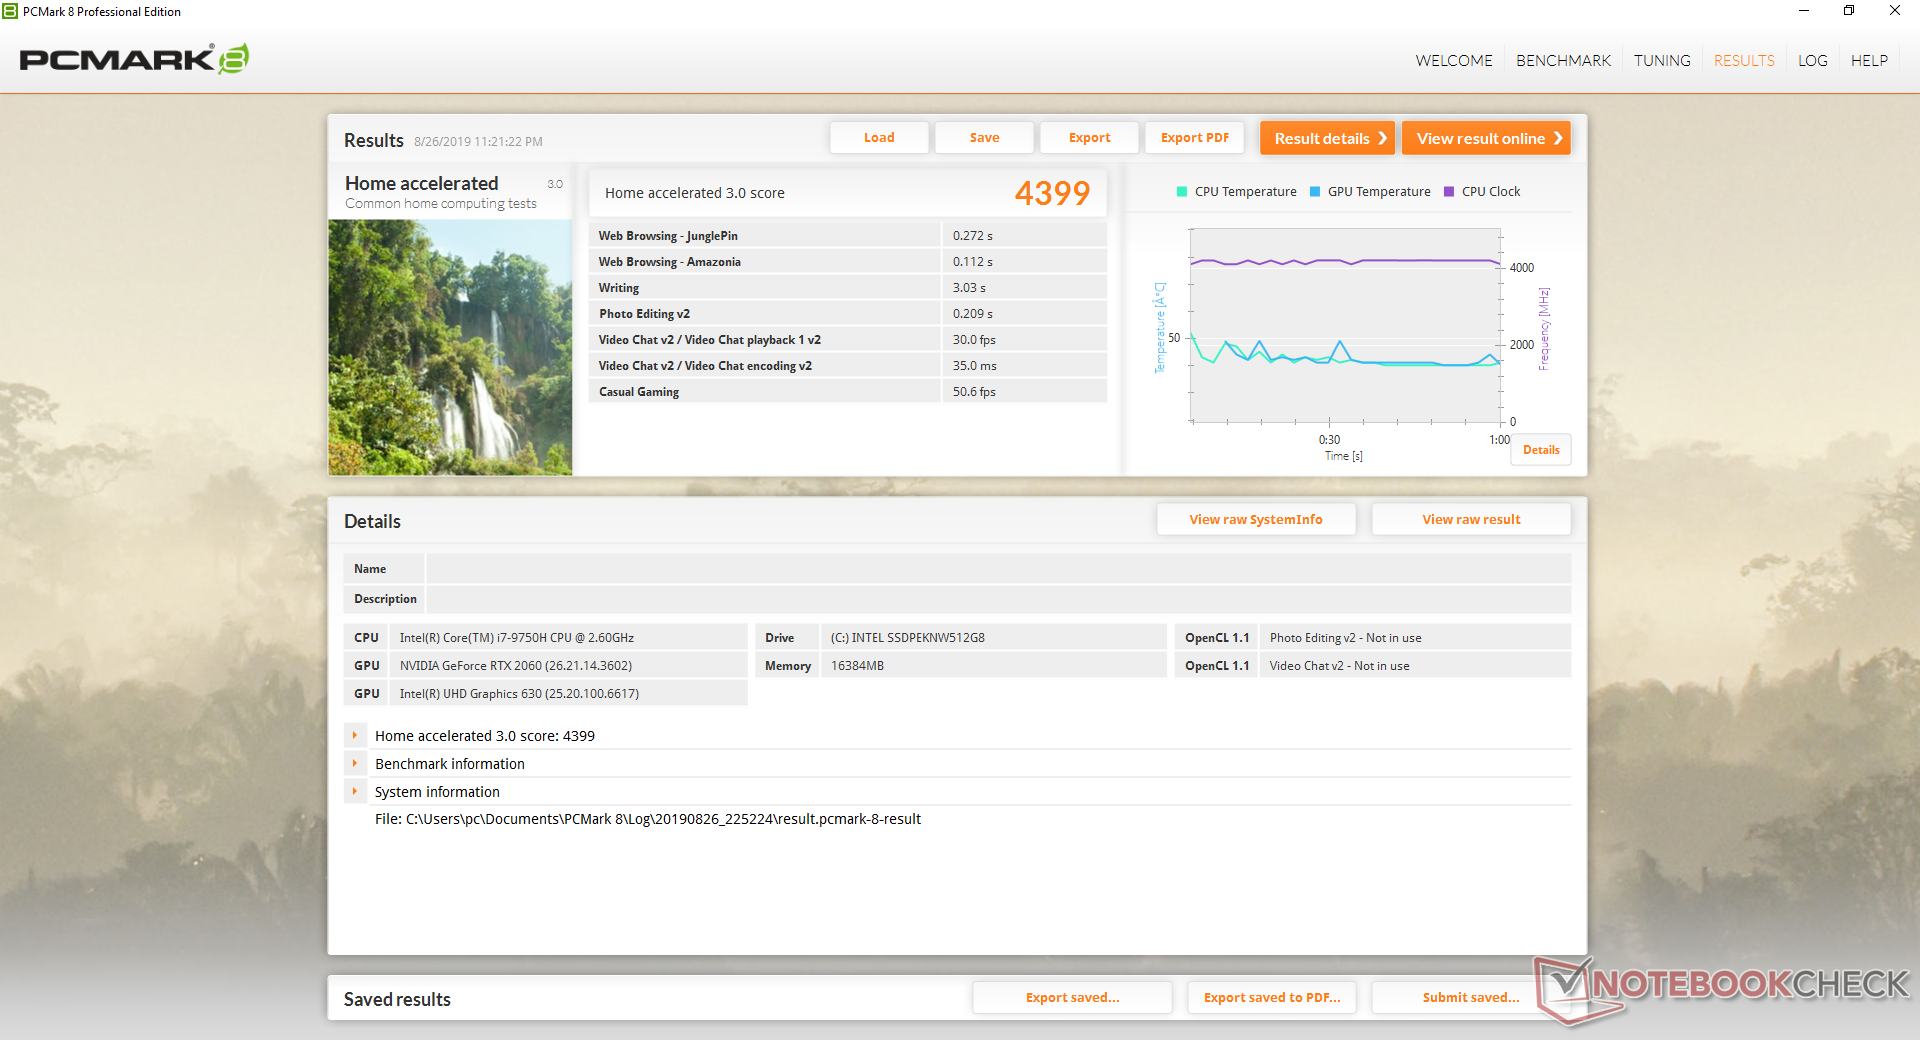

| PCMark 8 Home Score Accelerated v2 | 4399 points | |
| PCMark 8 Work Score Accelerated v2 | 5650 points | |
| PCMark 10 Score | 5580 points | |
Help | ||
Storage Devices
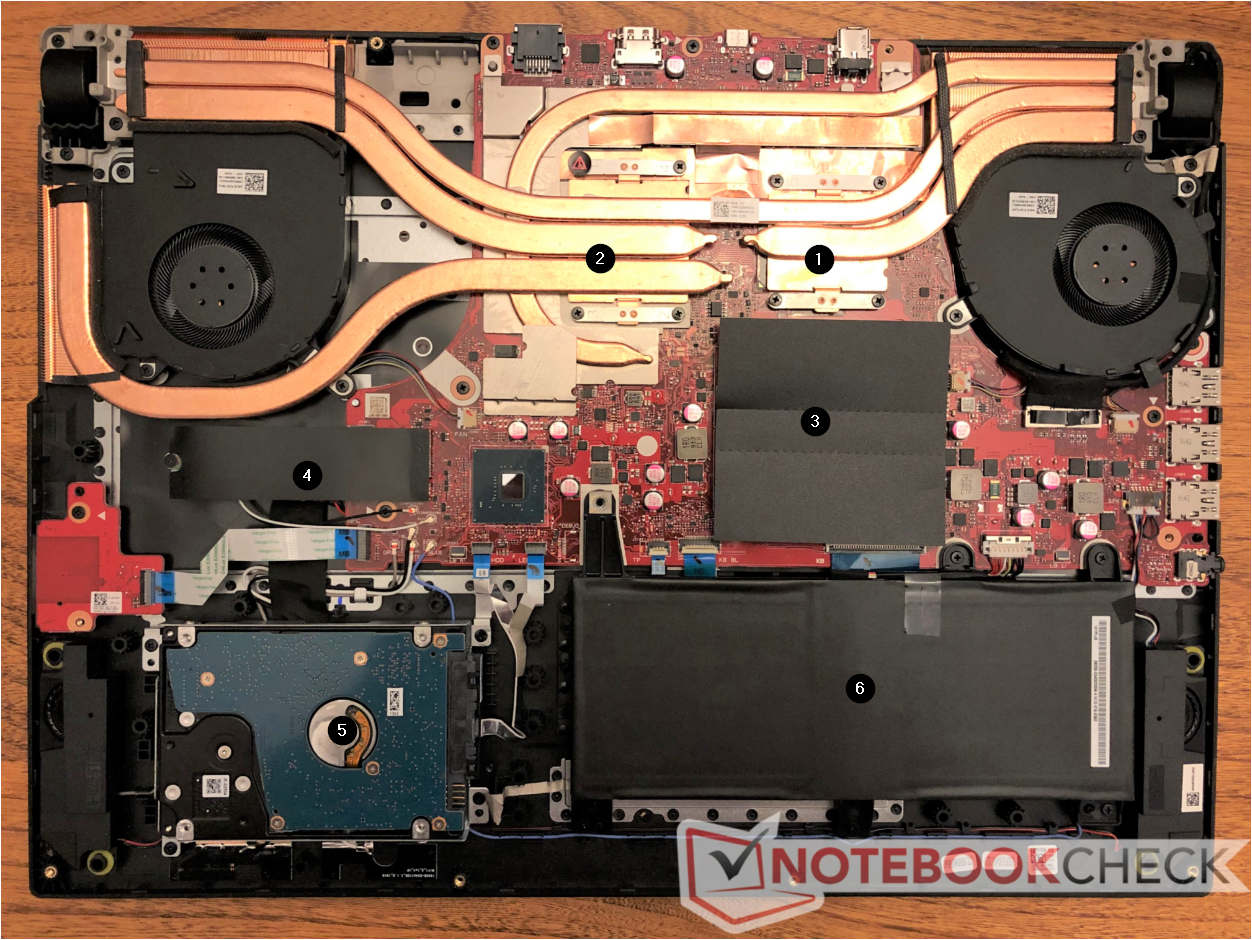
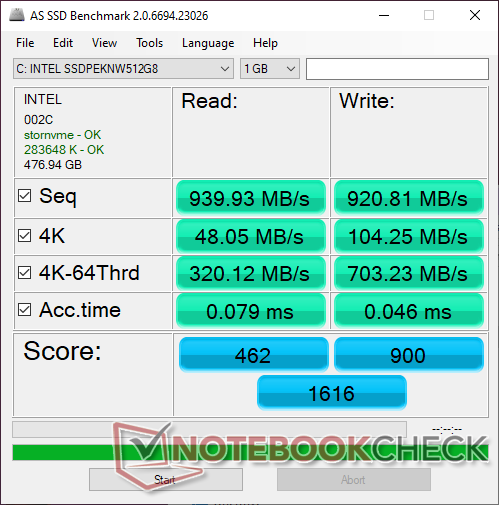
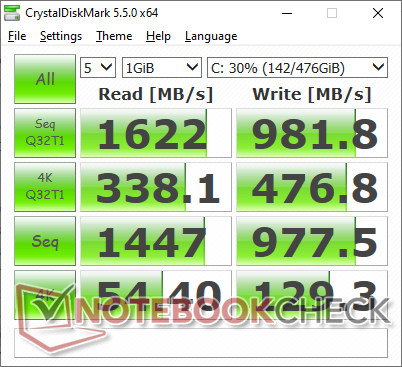
While Xotic PC has outfitted our test unit with a 512 GB Intel 660p NVMe SSD, other resellers will likely offer different capacities and vendors. All configurations have 1x M.2 2280 and 1x 2.5-inch SATA III internal slots.
The Intel 660p is a budget-midrange offering and so sequential transfer rates are merely average for an NVMe SSD at about 900 to 1000 MB/s. Costlier Samsung PM981 or Toshiba XG6 SSDs can reach nearly 2000 MB/s in comparison.
See our table of HDDs and SSDs for more benchmark comparisons. Be careful when servicing the laptop because fragile ribbon cables connect the bottom panel to the motherboard.
| Asus Strix Hero III G731GV Intel SSD 660p SSDPEKNW512G8 | Alienware m17 P37E SK Hynix PC401 512GB M.2 (HFS512GD9TNG) | Razer Blade Pro 17 RTX 2080 Max-Q Samsung SSD PM981 MZVLB512HAJQ | MSI GE75 9SG Samsung SSD PM981 MZVLB1T0HALR | Asus Zephyrus S GX701GX Samsung SSD PM981 MZVLB1T0HALR | Dell XPS 15 7590 9980HK GTX 1650 Toshiba XG6 KXG60ZNV1T02 | |
|---|---|---|---|---|---|---|
| AS SSD | 19% | 80% | 101% | 123% | 85% | |
| Seq Read (MB/s) | 940 | 1835 95% | 1831 95% | 1358 44% | 911 -3% | 1723 83% |
| Seq Write (MB/s) | 921 | 1121 22% | 1744 89% | 2381 159% | 2347 155% | 1386 50% |
| 4K Read (MB/s) | 48.05 | 23.98 -50% | 45.16 -6% | 27.02 -44% | 53 10% | 43.25 -10% |
| 4K Write (MB/s) | 104.3 | 100 -4% | 107.1 3% | 89.2 -14% | 122.5 17% | 98.3 -6% |
| 4K-64 Read (MB/s) | 320.1 | 687 115% | 1240 287% | 1642 413% | 1577 393% | 1078 237% |
| 4K-64 Write (MB/s) | 703 | 776 10% | 1695 141% | 1799 156% | 1734 147% | 1456 107% |
| Access Time Read * (ms) | 0.079 | 0.047 41% | 0.064 19% | 0.067 15% | 0.08 -1% | 0.05 37% |
| Access Time Write * (ms) | 0.046 | 0.053 -15% | 0.037 20% | 0.05 -9% | 0.031 33% | 0.039 15% |
| Score Read (Points) | 462 | 895 94% | 1468 218% | 1805 291% | 1721 273% | 1294 180% |
| Score Write (Points) | 900 | 988 10% | 1977 120% | 2127 136% | 2091 132% | 1693 88% |
| Score Total (Points) | 1616 | 2306 43% | 4197 160% | 4899 203% | 4771 195% | 3638 125% |
| Copy ISO MB/s (MB/s) | 1416 | 773 -45% | 2086 47% | 3193 125% | 3182 125% | |
| Copy Program MB/s (MB/s) | 569 | 493 -13% | 425.5 -25% | 198.2 -65% | 984 73% | |
| Copy Game MB/s (MB/s) | 971 | 647 -33% | 555 -43% | 1054 9% | 1824 88% |
* ... smaller is better

GPU Performance
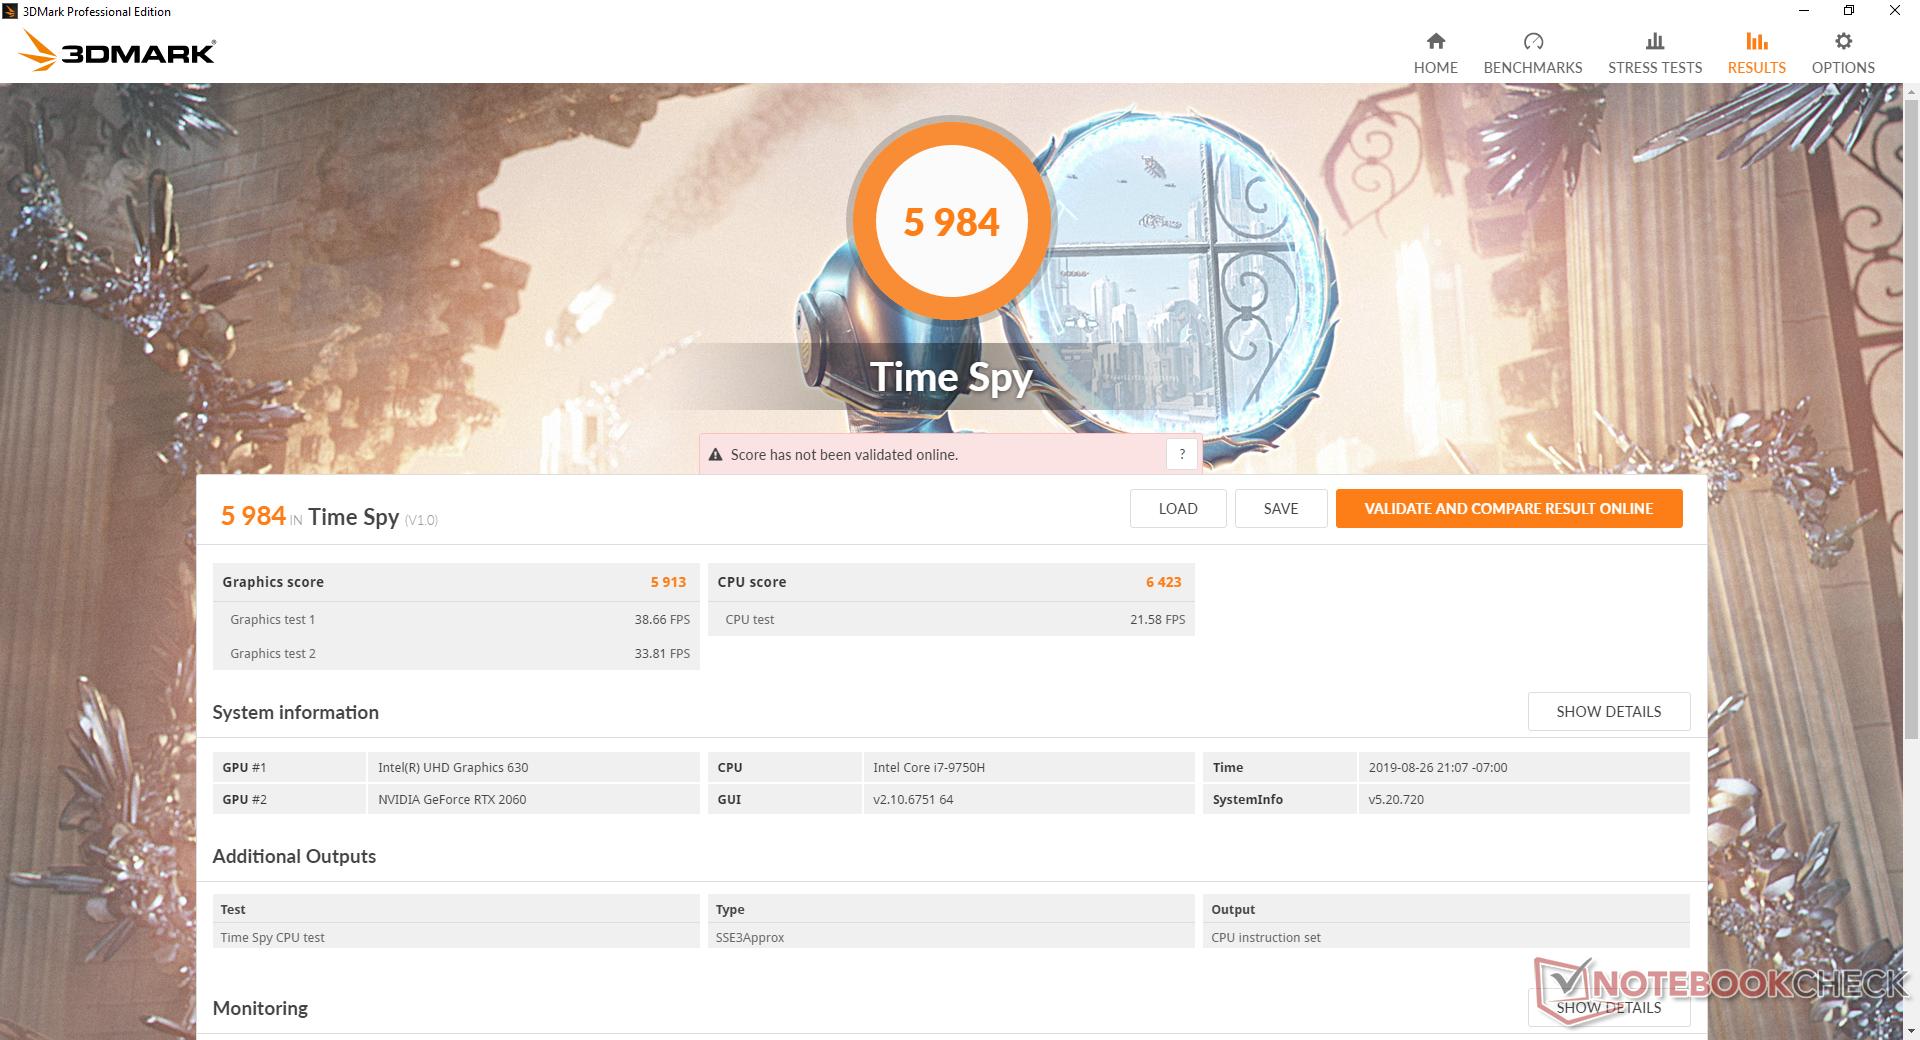
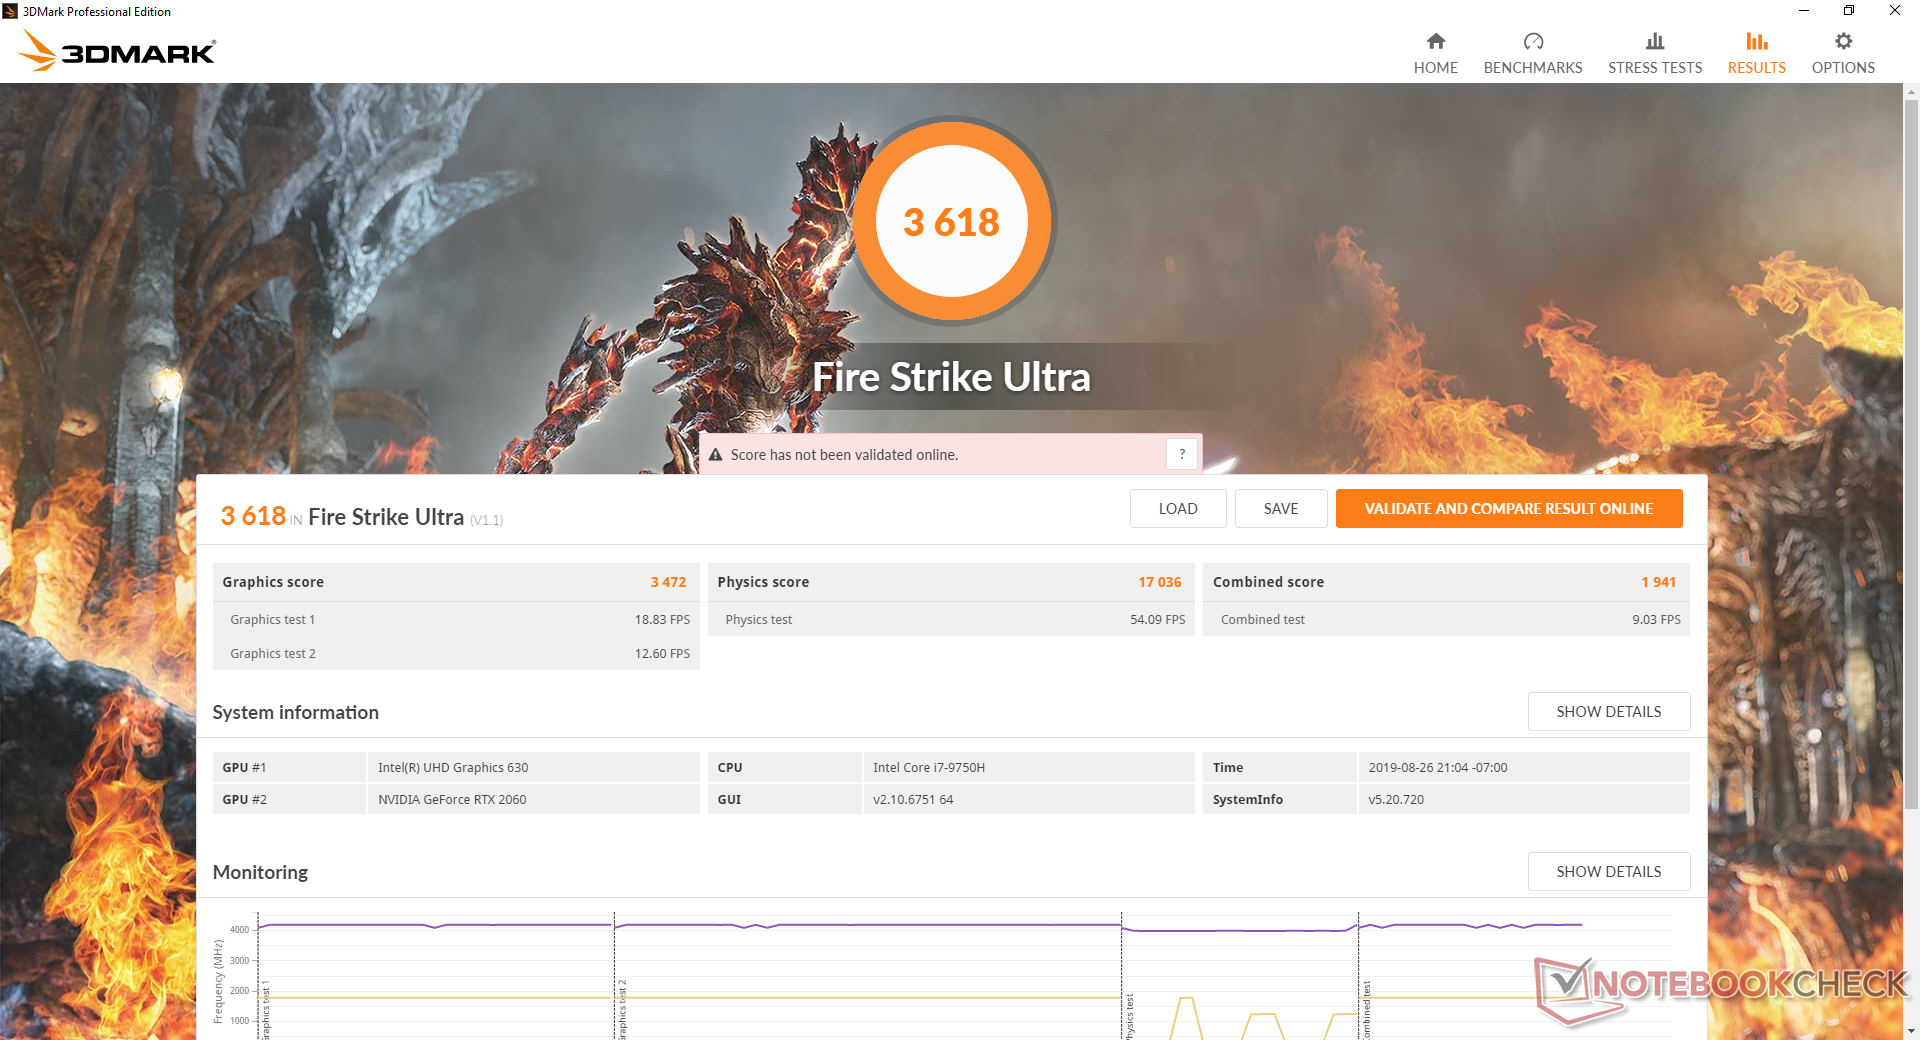
Opting for the RTX 2060 G731GV over the RTX 2070 G731GW will incur a performance drop of 19 percent according to 3DMark benchmarks. When compared to a desktop RTX 2060, the mobile RTX 2060 is about 20 to 25 percent slower. Performance is actually within 5 percent of the GTX 1660 Ti meaning that users on tighter budgets may as well purchase the GTX 1660 Ti G731GU configuration instead especially if they have no intentions of enabling ray-tracing or DLSS. In either case, users upgrading from the older GTX 1060 or GTX 980M will see significant performance gains especially when running DX12 titles.
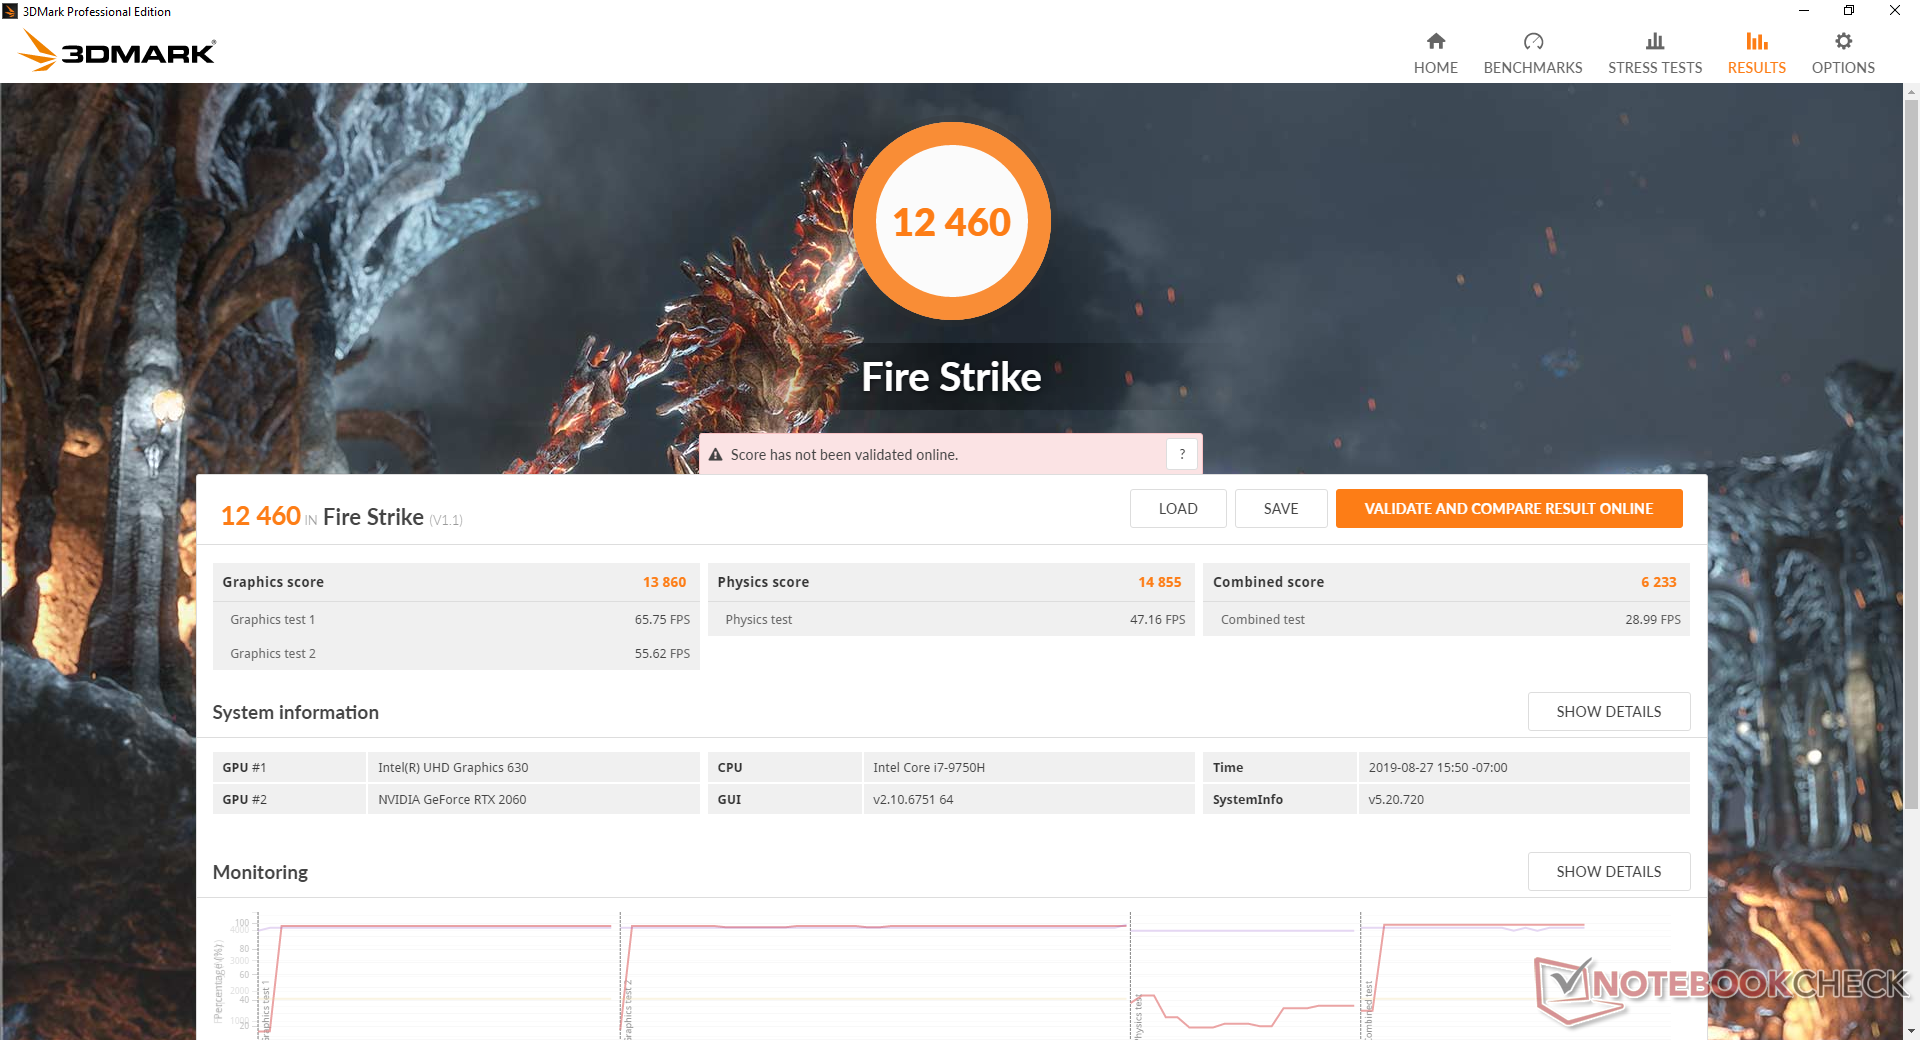
Note that there is a small performance gain when running the system in Turbo Fan mode when compared to the default Performance mode. A 3DMark Fire Strike run on Turbo Fan mode returns Physics and Graphics scores of 17057 and 15696 points, respectively, compared to 14855 and 13860 points when on Performance mode.
See our dedicated page on the mobile GeForce RTX 2060 for more technical information and benchmark comparisons.
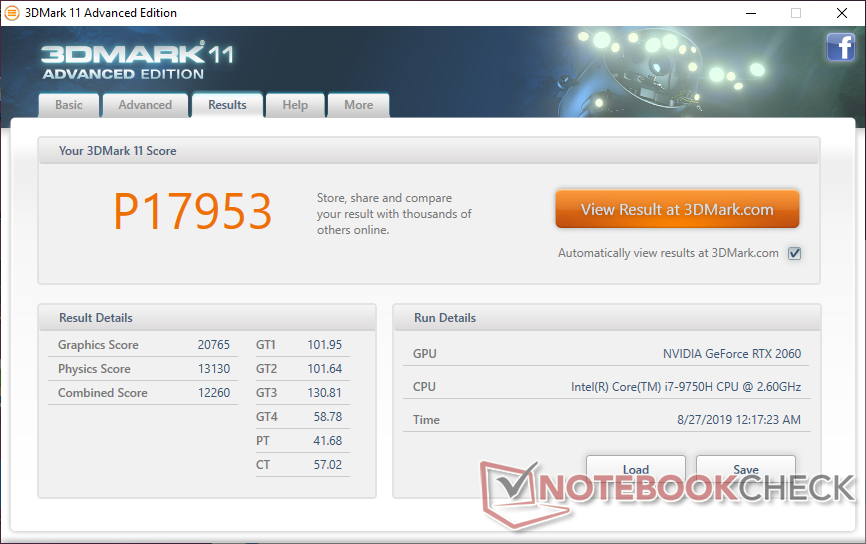
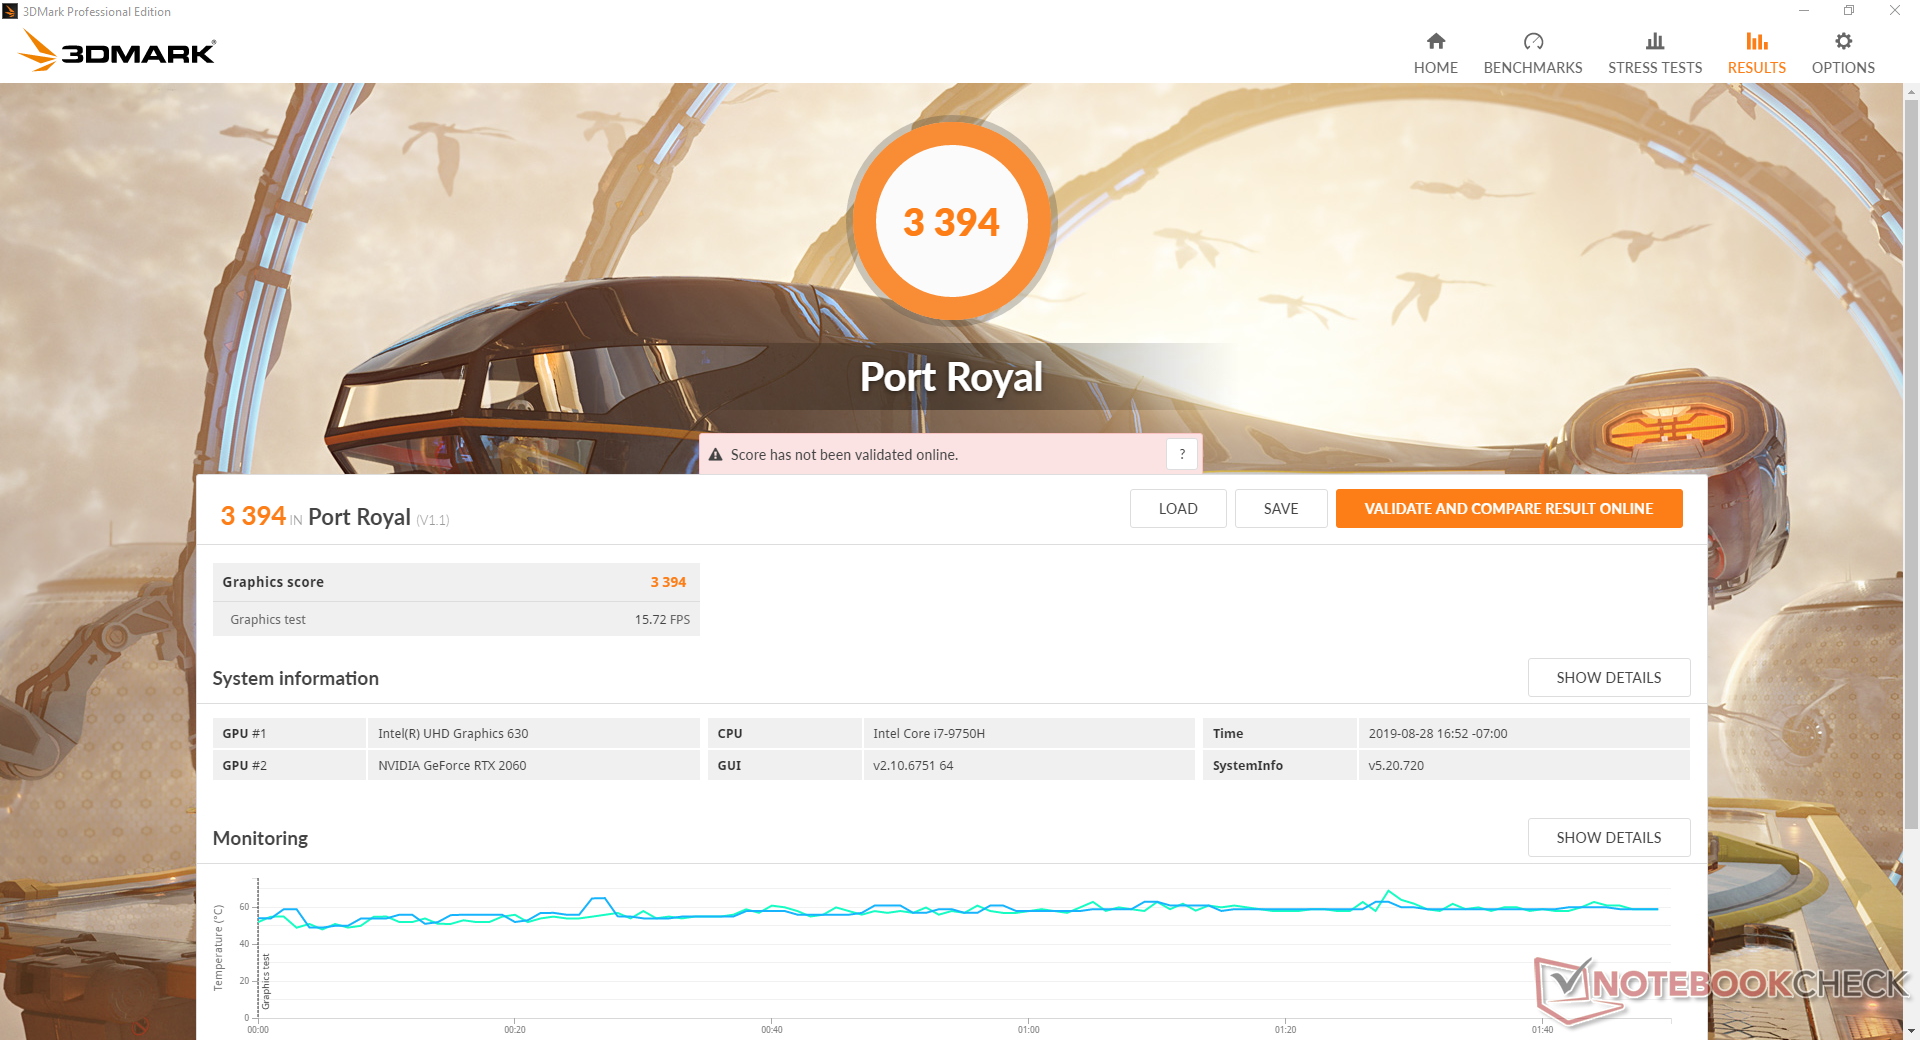

| 3DMark 11 Performance | 17953 points | |
| 3DMark Cloud Gate Standard Score | 34276 points | |
| 3DMark Fire Strike Score | 14298 points | |
| 3DMark Time Spy Score | 5984 points | |
Help | ||
Gaming Performance
| Shadow of the Tomb Raider - 1920x1080 Highest Preset AA:T | |
| Asus ROG G703GX | |
| MSI RTX 2060 Gaming Z 6G | |
| AMD Radeon RX Vega 64 | |
| Asus ASUS ROG Strix SCAR III G731GW-XB74 | |
| Average NVIDIA GeForce RTX 2060 Mobile (54 - 86, n=22) | |
| Eurocom Nightsky Ti15 | |
| Asus Strix Hero III G731GV | |
| MSI GF75 Thin 9SC | |
| Asus G752VY | |
| The Witcher 3 - 1920x1080 Ultra Graphics & Postprocessing (HBAO+) | |
| Asus ROG G703GX | |
| AMD Radeon RX Vega 64 | |
| MSI RTX 2060 Gaming Z 6G | |
| Asus ASUS ROG Strix SCAR III G731GW-XB74 | |
| Average NVIDIA GeForce RTX 2060 Mobile (50.6 - 74, n=40) | |
| Eurocom Nightsky Ti15 | |
| Asus Strix Hero III G731GV | |
| MSI GF75 Thin 9SC | |
| low | med. | high | ultra | |
|---|---|---|---|---|
| BioShock Infinite (2013) | 295.2 | 262.2 | 240.9 | 140.9 |
| The Witcher 3 (2015) | 245.1 | 179.5 | 107.1 | 56 |
| Shadow of the Tomb Raider (2018) | 115 | 88 | 83 | 70 |
Emissions
System Noise
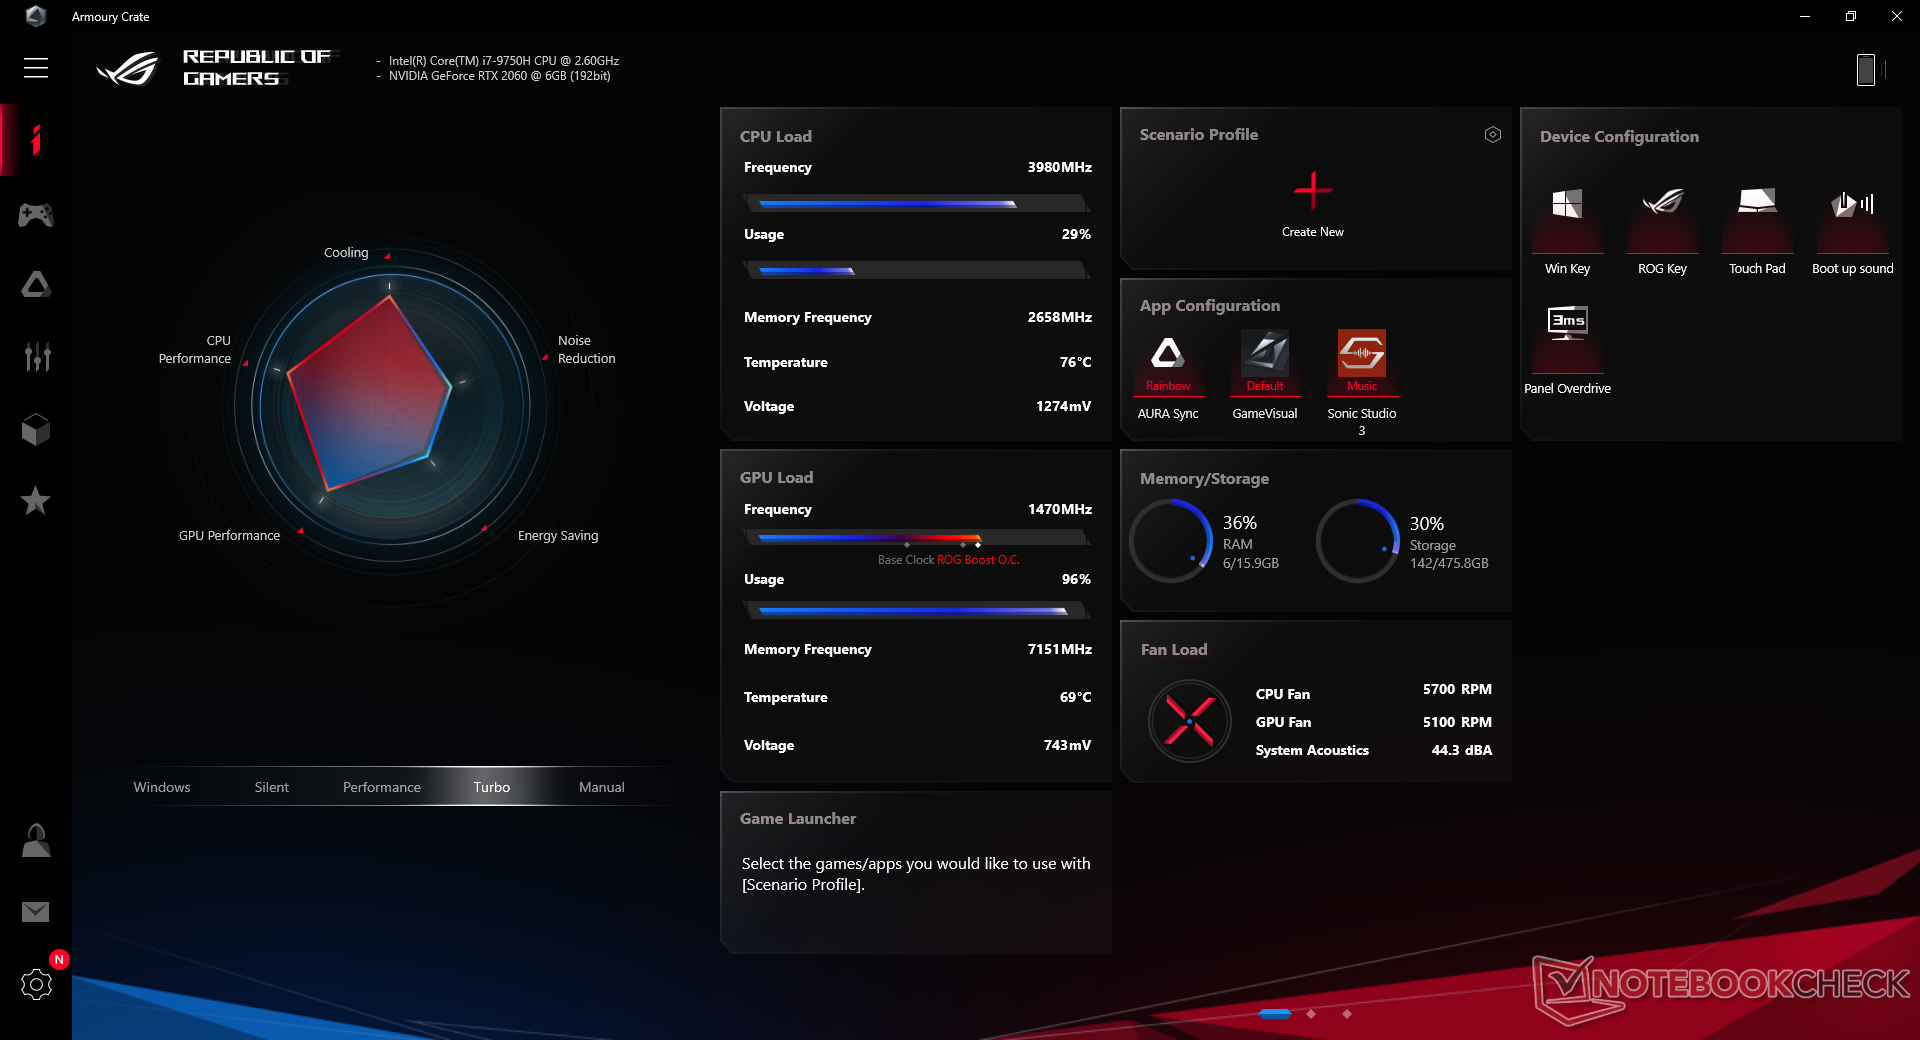
Fan noise when gaming is noticeably quieter than on the G731GW with RTX 2070 graphics. We're able to measure a constant fan noise of about 50 dB(A) when running Witcher 3 compared to 55 dB(A) on the G731GW when both systems are set to Turbo Fan mode. Regardless, both SKUs are still loud when gaming. We always recommend a good pair of headphones for gaming laptops that reach 50 dB(A) or higher in order to mask the whirring fans and to catch minute sound cues like enemy footsteps.
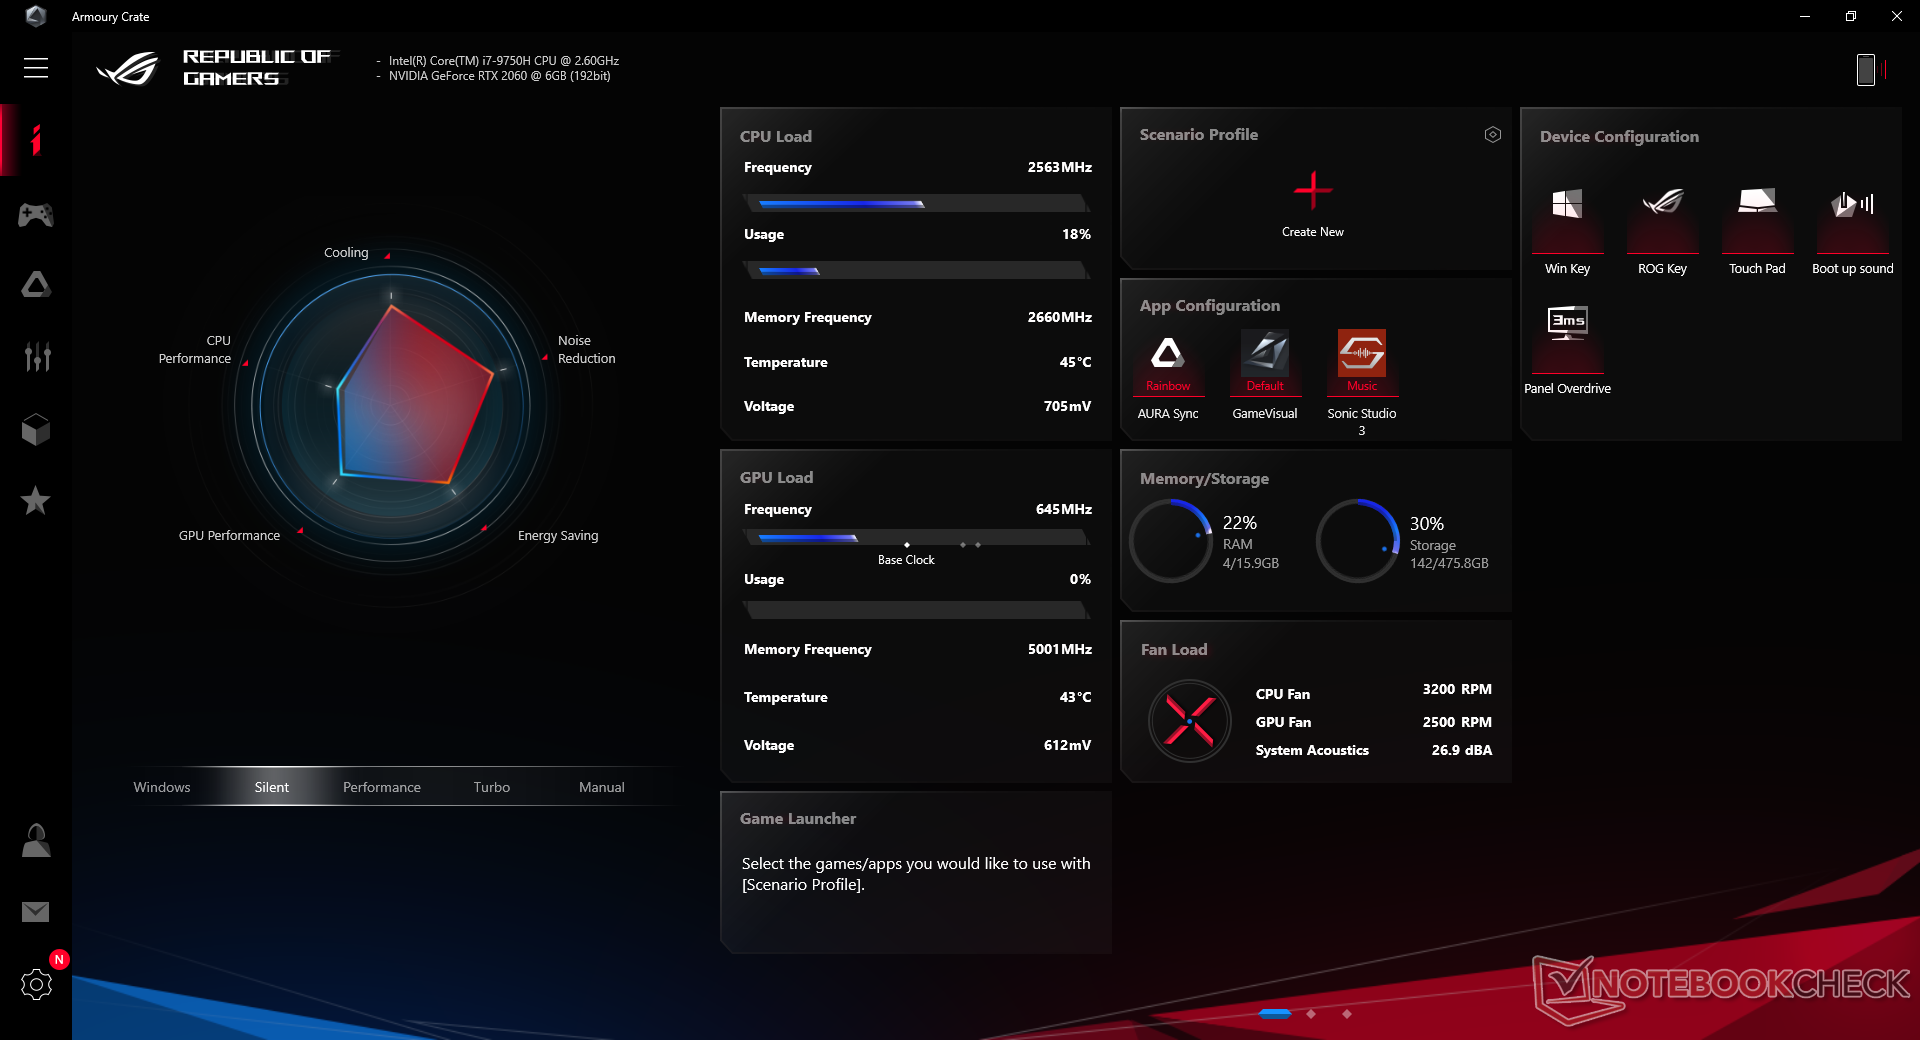
When set to the default Performance mode, fan noise becomes slightly quieter at 48.7 dB(A) when gaming at a small cost to performance as noted in our GPU section above. The fans never idle even when set to Quiet mode, but its low 29.5 to 31.9 dB(A) range is just barely audible under most conditions. It's important to become familiar with Asus' Armoury Crate software since both fan noise and performance are so closely tied to these settings.
We're not able to notice any coil whine or electronic noise from our unit.
| Asus Strix Hero III G731GV GeForce RTX 2060 Mobile, i7-9750H, Intel SSD 660p SSDPEKNW512G8 | Asus ASUS ROG Strix SCAR III G731GW-XB74 GeForce RTX 2070 Mobile, i7-9750H, Intel SSD 660p 1TB SSDPEKNW010T8 | Lenovo Legion Y740-17ICH GeForce RTX 2080 Max-Q, i7-8750H, Samsung SSD PM981 MZVLB256HAHQ | Alienware m17 P37E GeForce RTX 2080 Max-Q, i9-8950HK, SK Hynix PC401 512GB M.2 (HFS512GD9TNG) | Razer Blade Pro 17 RTX 2080 Max-Q GeForce RTX 2080 Max-Q, i7-9750H, Samsung SSD PM981 MZVLB512HAJQ | MSI GE75 9SG GeForce RTX 2080 Mobile, i9-9880H, Samsung SSD PM981 MZVLB1T0HALR | |
|---|---|---|---|---|---|---|
| Noise | -1% | 7% | 2% | 3% | -0% | |
| off / environment * (dB) | 28.2 | 28.2 -0% | 28.3 -0% | 28.2 -0% | 28.2 -0% | 28.2 -0% |
| Idle Minimum * (dB) | 29.5 | 28.2 4% | 31.5 -7% | 28.2 4% | 28.2 4% | 30.4 -3% |
| Idle Average * (dB) | 30.3 | 28.5 6% | 31.6 -4% | 28.2 7% | 28.2 7% | 30.4 -0% |
| Idle Maximum * (dB) | 31.9 | 30 6% | 31.6 1% | 31 3% | 30.8 3% | 33.4 -5% |
| Load Average * (dB) | 50.4 | 51.5 -2% | 32.3 36% | 50.8 -1% | 42 17% | 37.1 26% |
| Witcher 3 ultra * (dB) | 50.1 | 55.3 -10% | 43 14% | 50.8 -1% | 51 -2% | 54.2 -8% |
| Load Maximum * (dB) | 50.1 | 55.3 -10% | 45.5 9% | 50.8 -1% | 53 -6% | 56.4 -13% |
* ... smaller is better
Noise level
| Idle |
| 29.5 / 30.3 / 31.9 dB(A) |
| Load |
| 50.4 / 50.1 dB(A) |
 | ||
30 dB silent 40 dB(A) audible 50 dB(A) loud |
||
min: | ||
Temperature
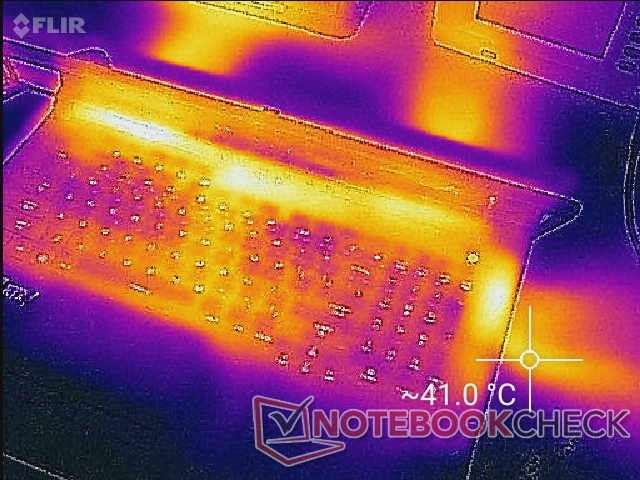
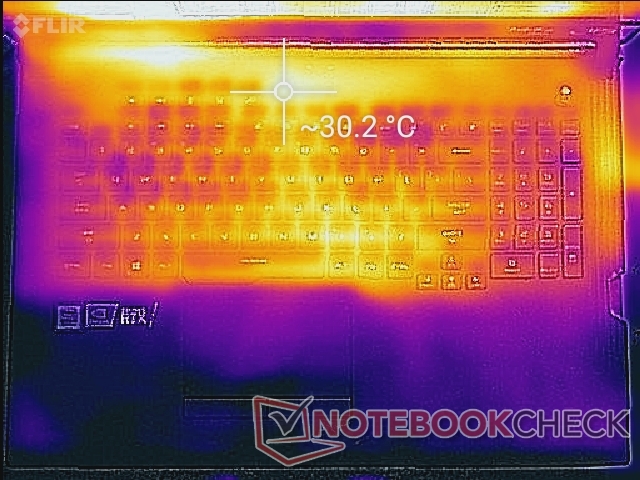
Surface temperatures when gaming are essentially identical to the G731GW despite the GPU differences. The palm rests, trackpad, WASD keys, and NumPad keys remain relatively cool for more comfortable gaming. Hot spots are generally toward the center of the keyboard or the very right edge of the keyboard deck where surfaces can be as warm as 40 C to 44 C. Fortunately, users are less likely to touch these areas frequently when gaming.
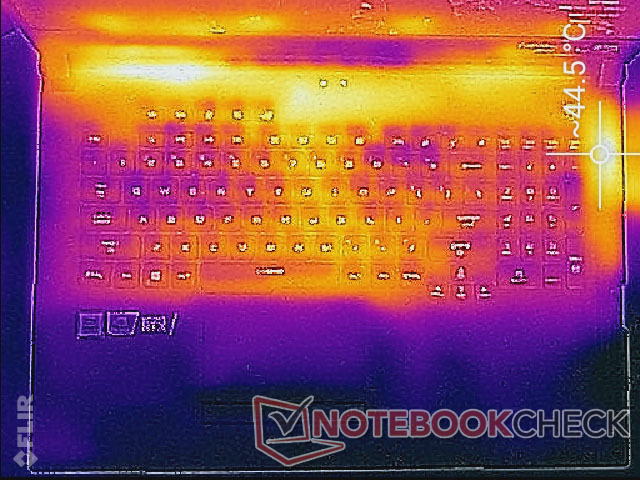

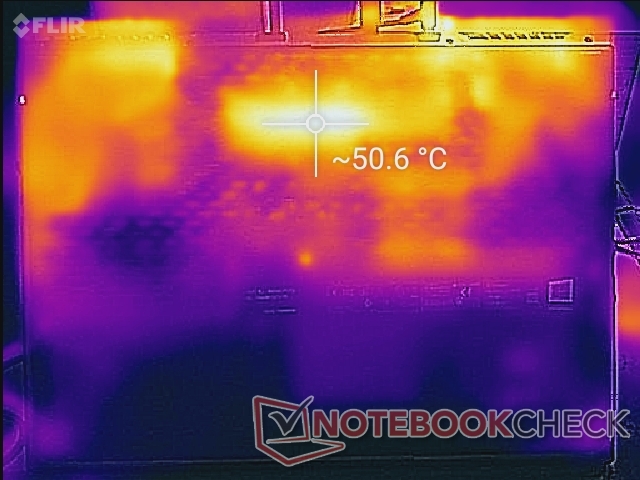
(-) The maximum temperature on the upper side is 47.2 °C / 117 F, compared to the average of 40.4 °C / 105 F, ranging from 21.2 to 68.8 °C for the class Gaming.
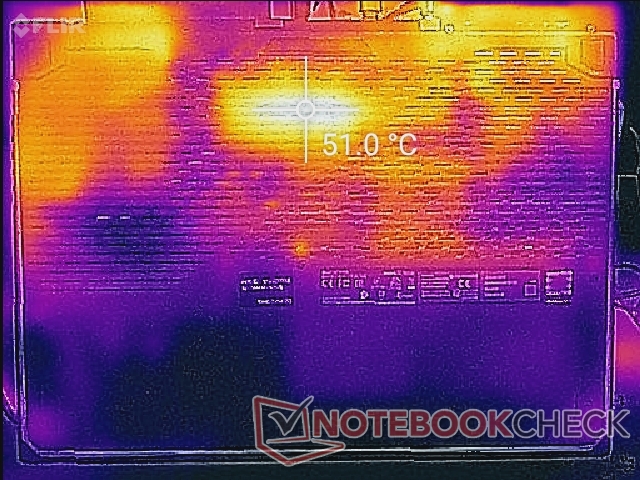
(-) The bottom heats up to a maximum of 51 °C / 124 F, compared to the average of 43.2 °C / 110 F
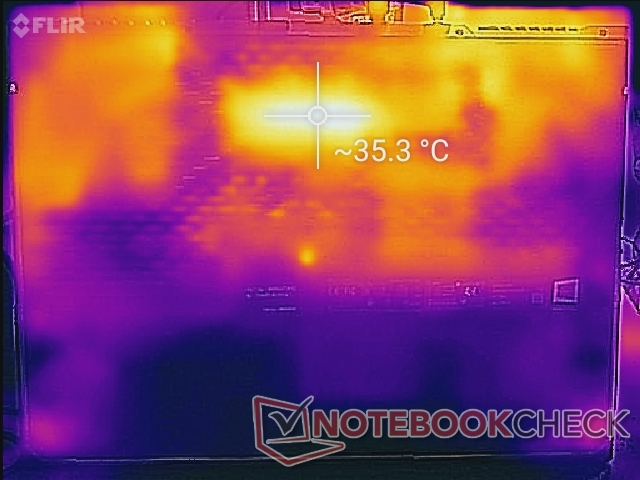
(+) In idle usage, the average temperature for the upper side is 25.6 °C / 78 F, compared to the device average of 33.9 °C / 93 F.
(±) Playing The Witcher 3, the average temperature for the upper side is 35 °C / 95 F, compared to the device average of 33.9 °C / 93 F.
(+) The palmrests and touchpad are cooler than skin temperature with a maximum of 26 °C / 78.8 F and are therefore cool to the touch.
(+) The average temperature of the palmrest area of similar devices was 28.8 °C / 83.8 F (+2.8 °C / 5 F).
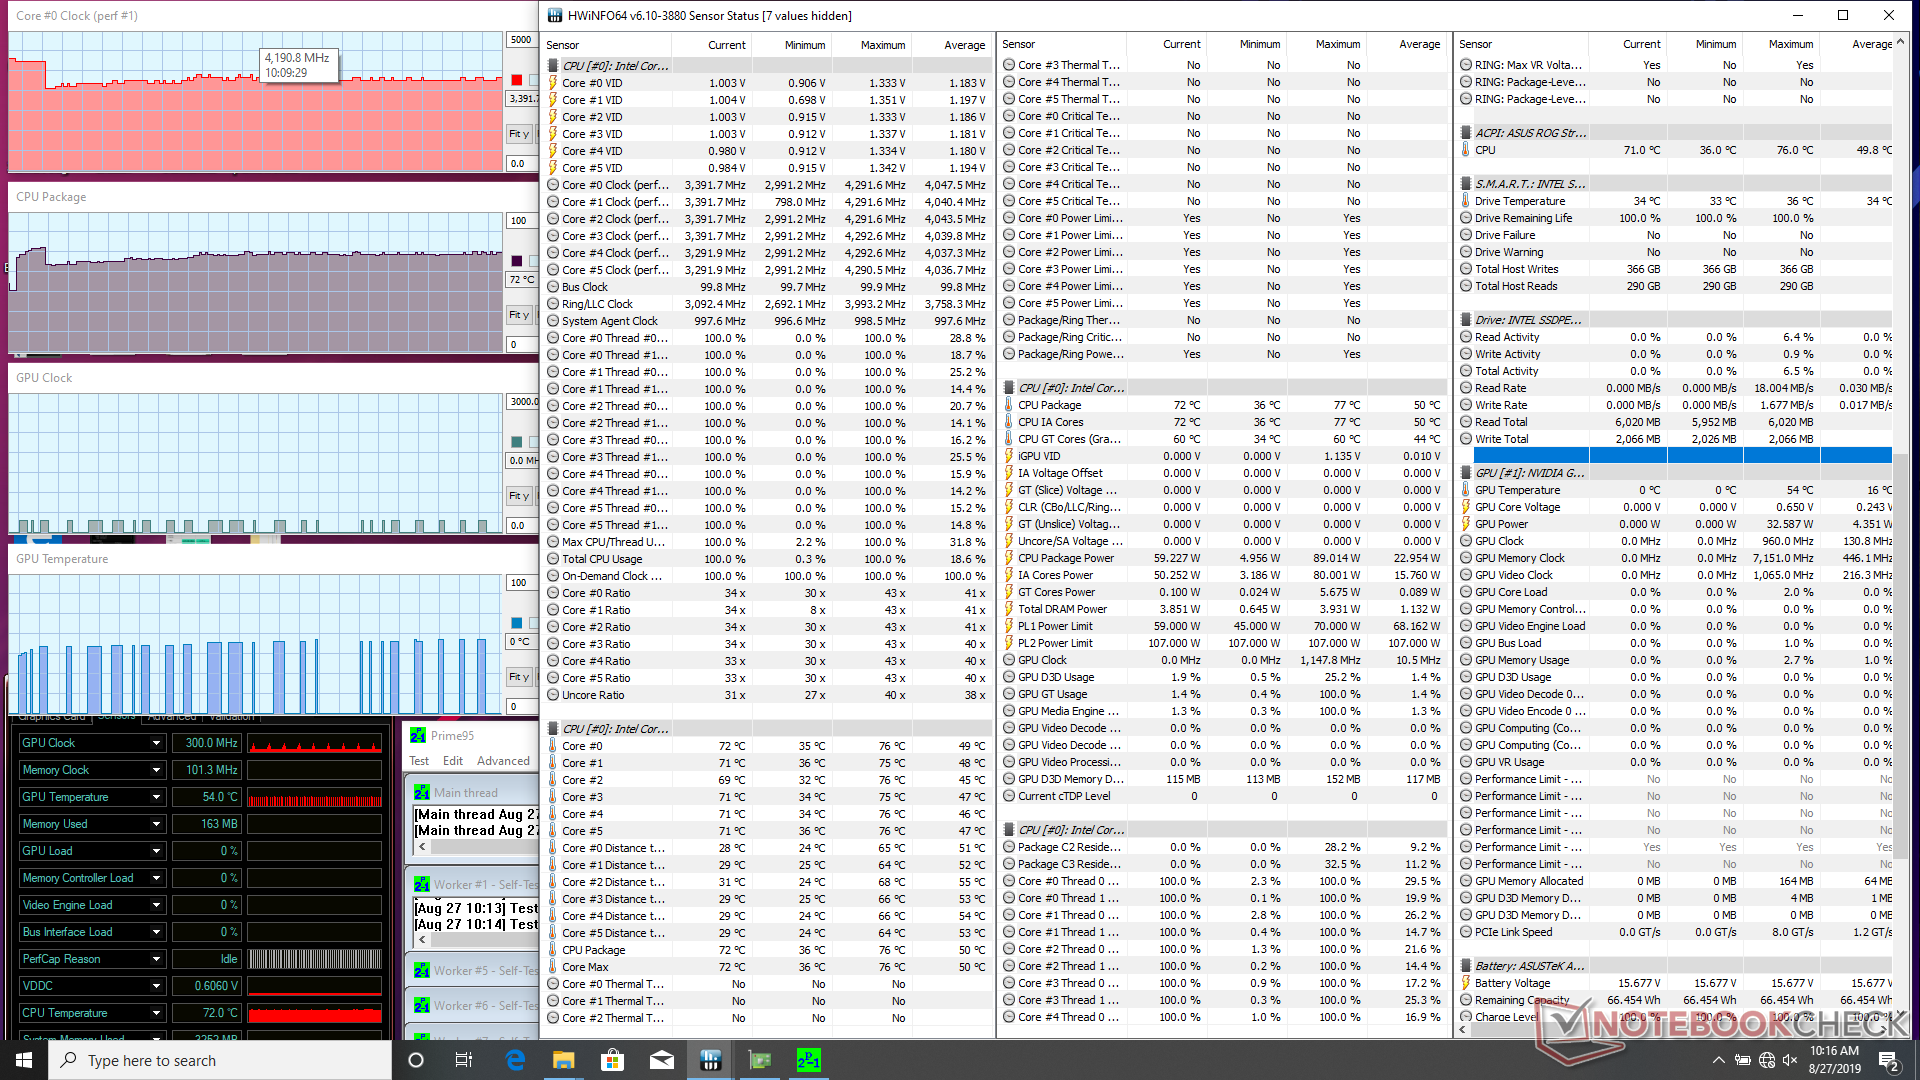
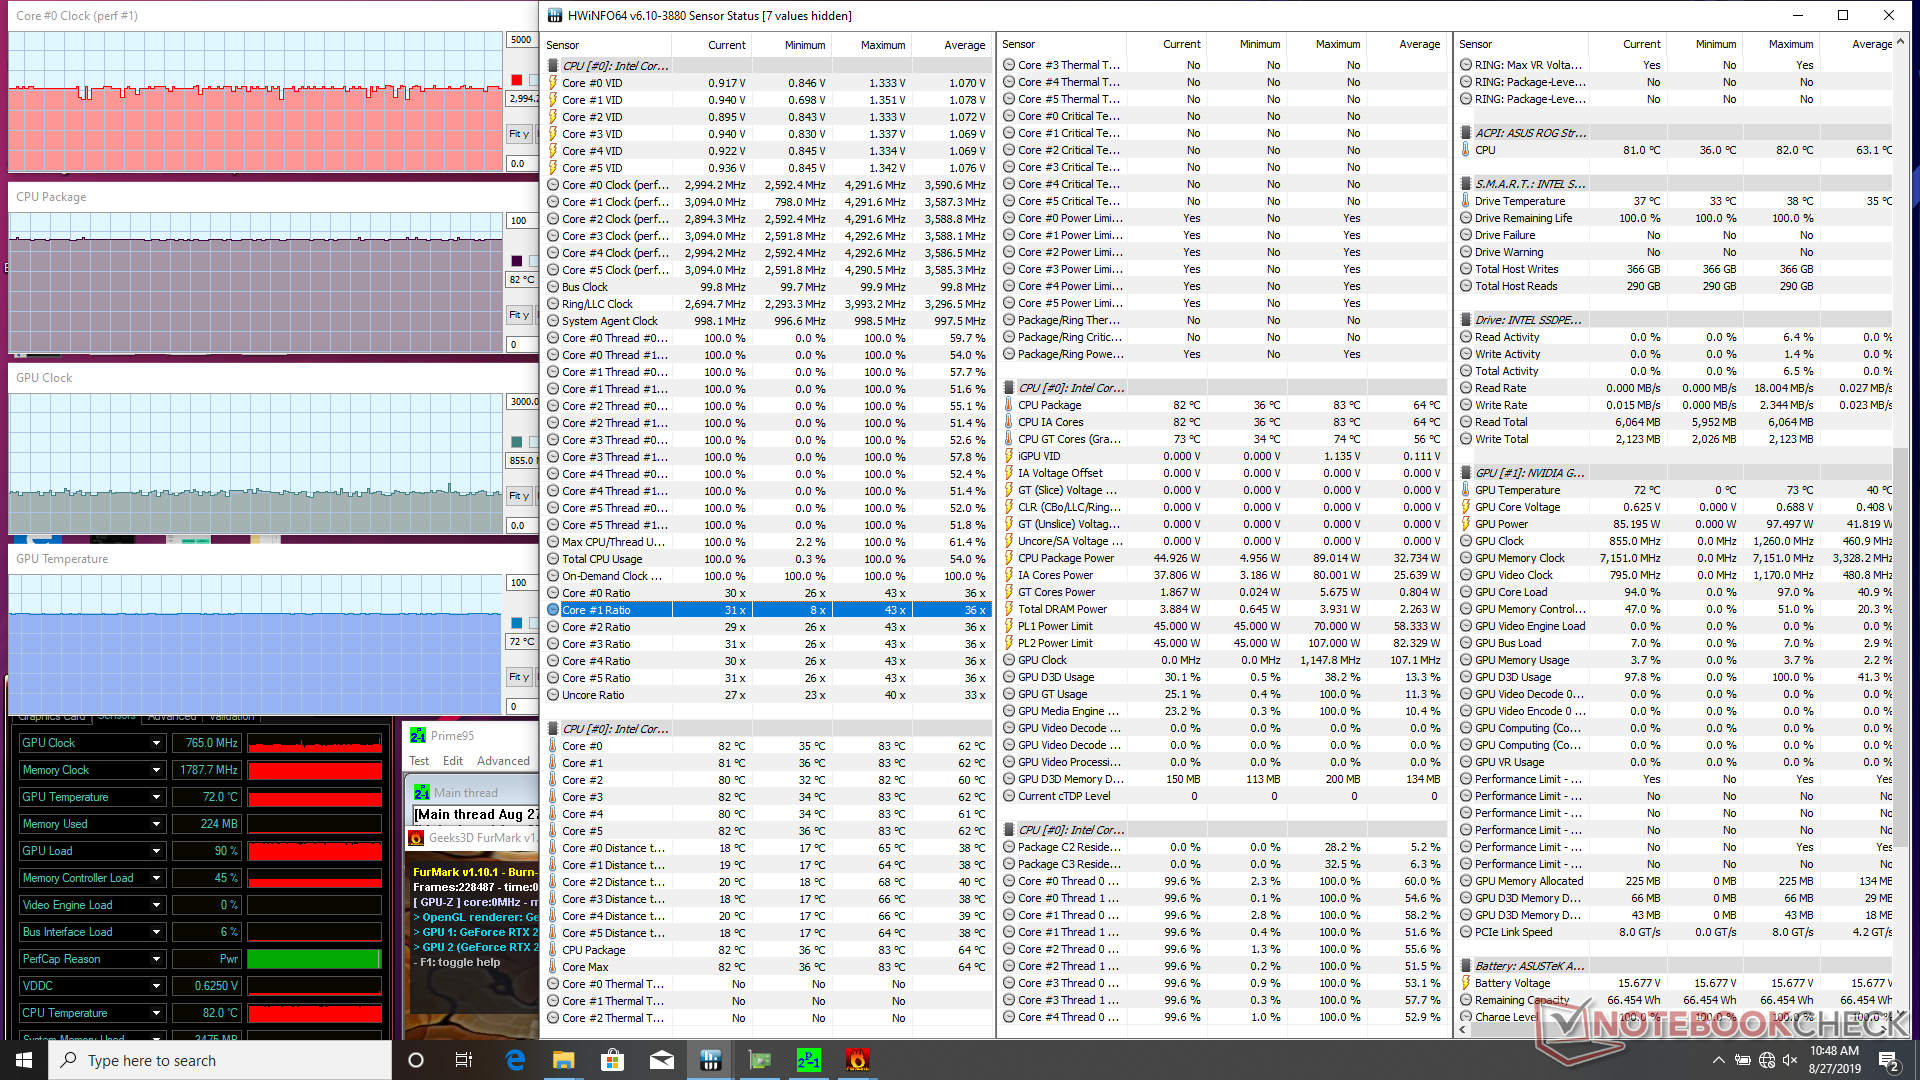
Stress Test
We stress the system with synthetic loads to identify for any potential throttling or stability issues. When running Prime95, clock rates jump to 4.0 GHz for the first few seconds until hitting a core temperature of 76 C. Thereafter, clock rates drop to the slower 3.3 to 3.4 GHz range in order to maintain a slightly cooler core temperature of 72 C. CPU temperature stabilizes at 82 C when running both Prime95 and FurMark simultaneously.
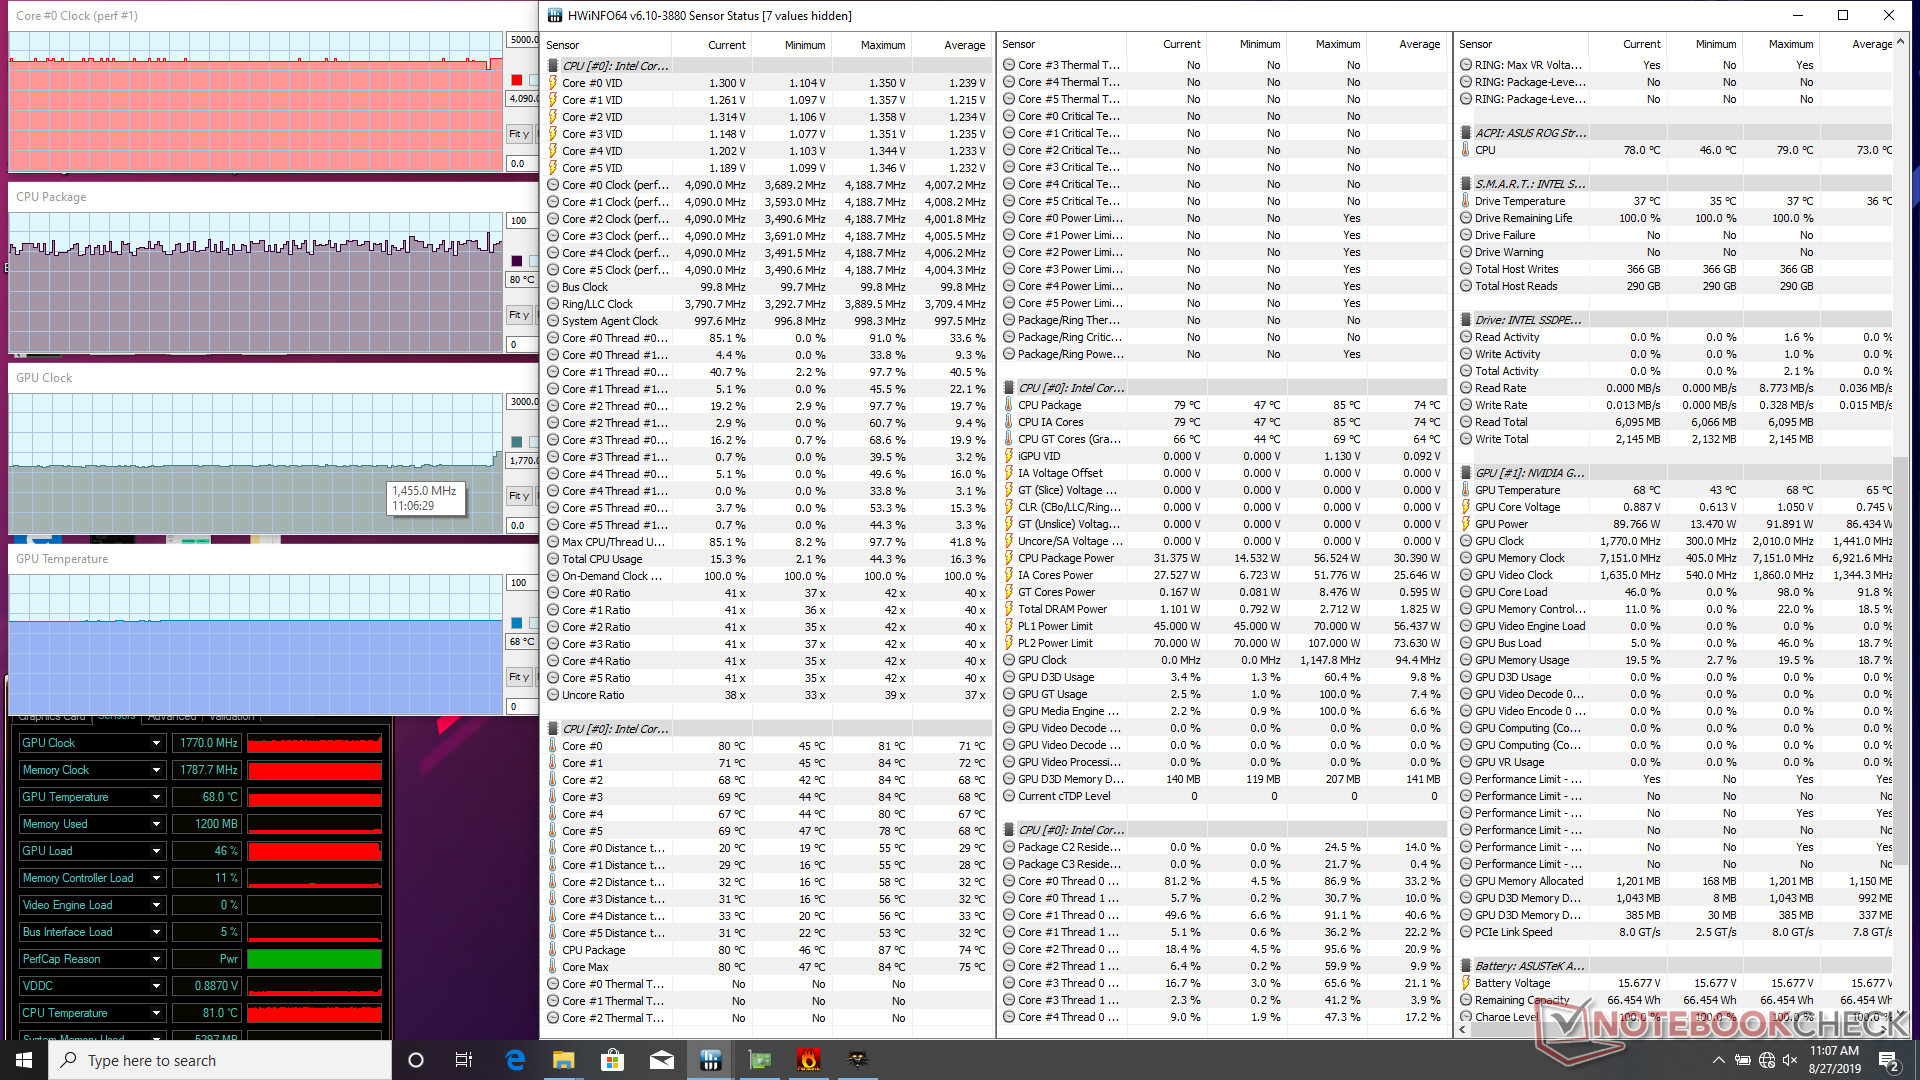
Running Witcher 3 is more representative of real-world gaming loads. CPU and GPU temperatures stabilize at 80 C and 68 C, respectively, compared to 77 C and 70 C on the G731GW. Results are similar between the two tested SKUs to explain the similar surface temperatures recorded above.
Running on battery power will limit performance. A Fire Strike run on batteries returns Physics and Graphics scores of 9747 and 4004, respectively. Note that Turbo Fan mode is disabled when on battery power.
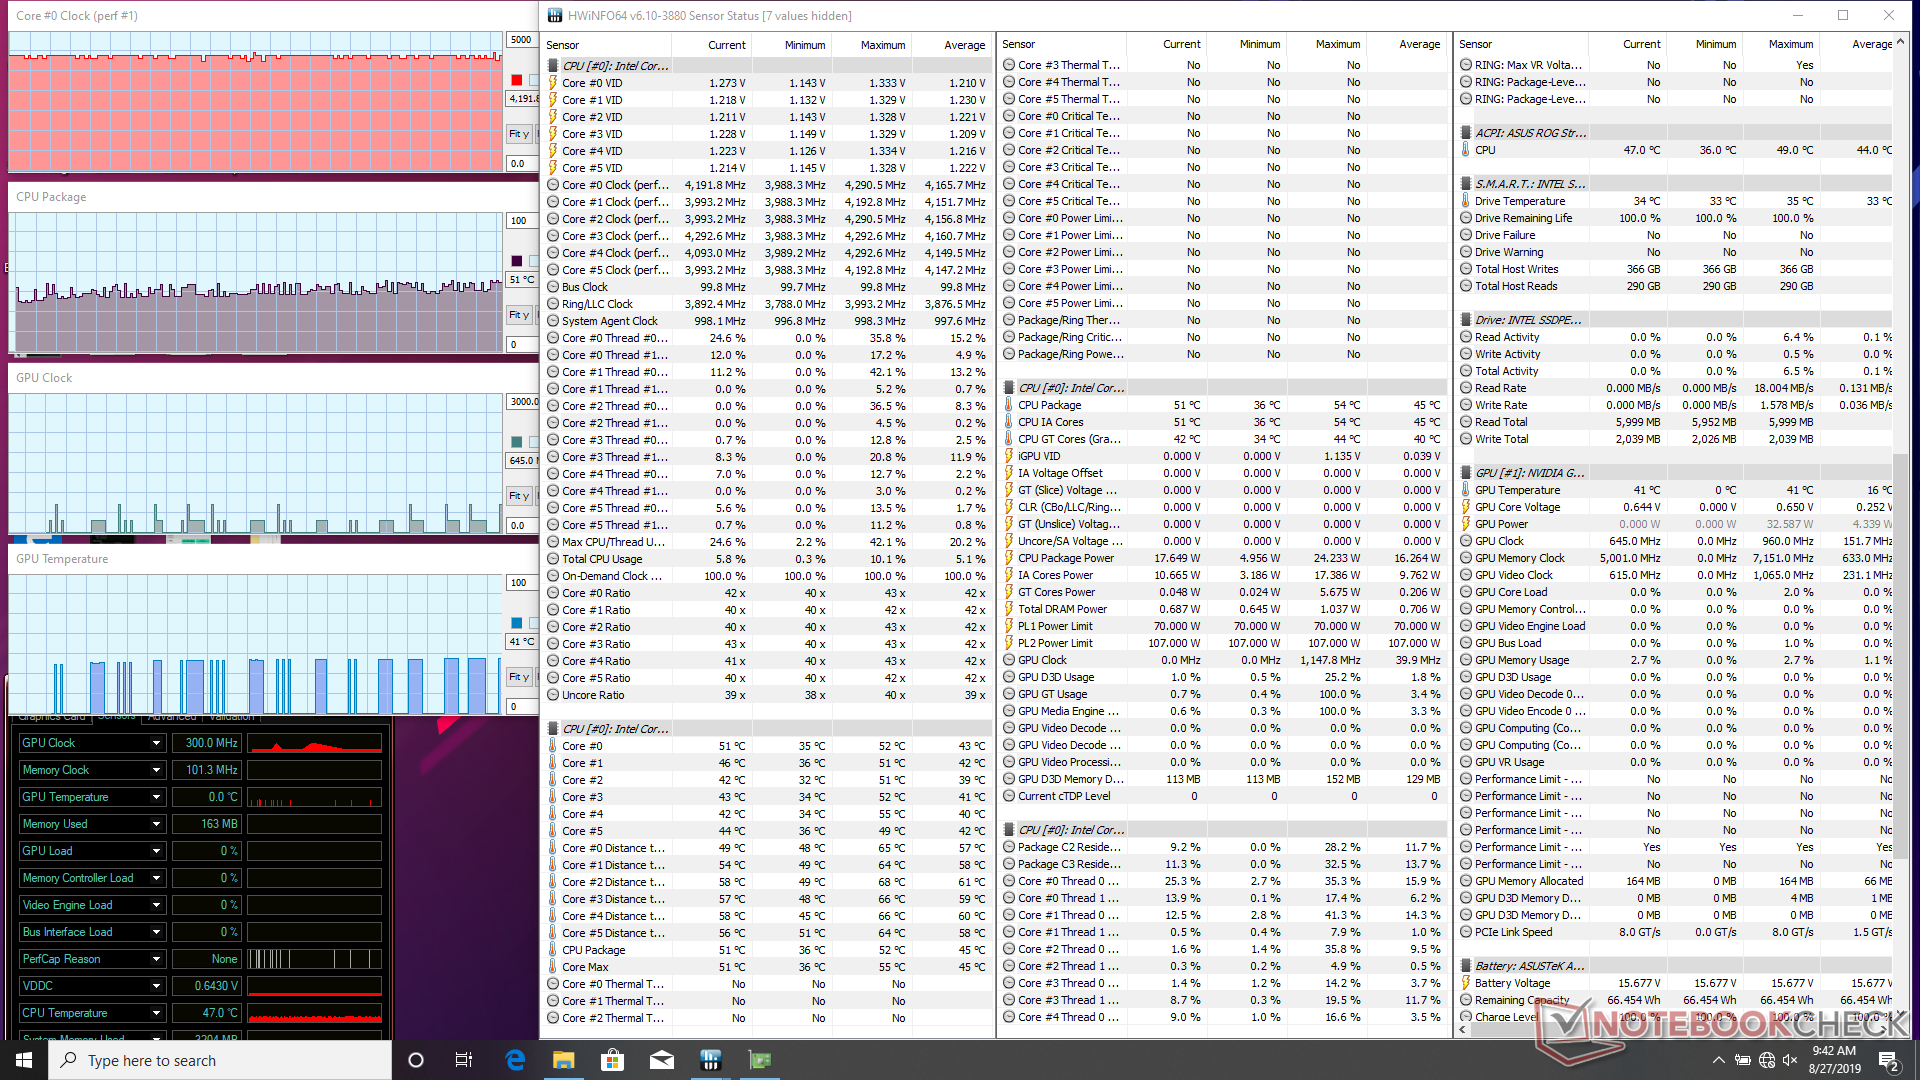
| CPU Clock (GHz) | GPU Clock (MHz) | Average CPU Temperature (°C) | Average GPU Temperature (°C) | |
| System Idle | -- | -- | 51 | 41 |
| Prime95 Stress | 3.3 - 3.4 | -- | 72 | -- |
| Prime95 + FurMark Stress | 3.0 - 3.1 | 765 | 82 | 72 |
| Witcher 3 Stress | 4.0 | 1455 | ~80 | 68 |
Speakers

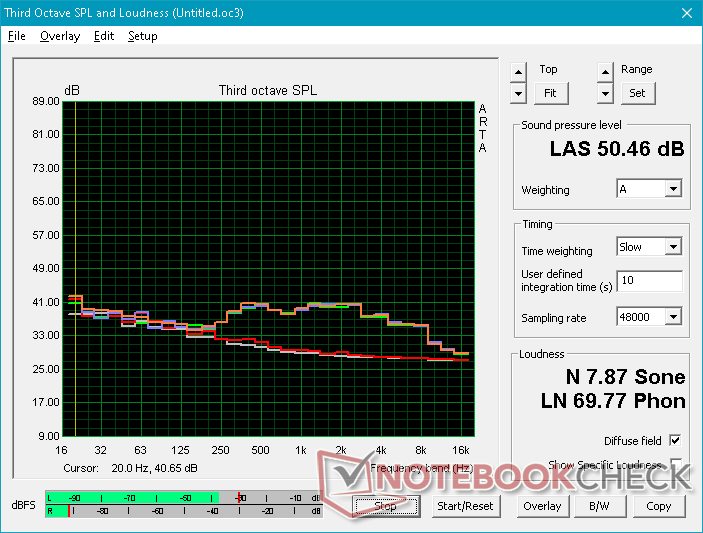
Asus Strix Hero III G731GV audio analysis
(±) | speaker loudness is average but good (81 dB)
Bass 100 - 315 Hz
(±) | reduced bass - on average 6.6% lower than median
(±) | linearity of bass is average (11.8% delta to prev. frequency)
Mids 400 - 2000 Hz
(+) | balanced mids - only 2.8% away from median
(+) | mids are linear (6.7% delta to prev. frequency)
Highs 2 - 16 kHz
(+) | balanced highs - only 1.8% away from median
(+) | highs are linear (5.4% delta to prev. frequency)
Overall 100 - 16.000 Hz
(+) | overall sound is linear (13.4% difference to median)
Compared to same class
» 19% of all tested devices in this class were better, 7% similar, 74% worse
» The best had a delta of 6%, average was 18%, worst was 132%
Compared to all devices tested
» 14% of all tested devices were better, 4% similar, 82% worse
» The best had a delta of 4%, average was 23%, worst was 134%
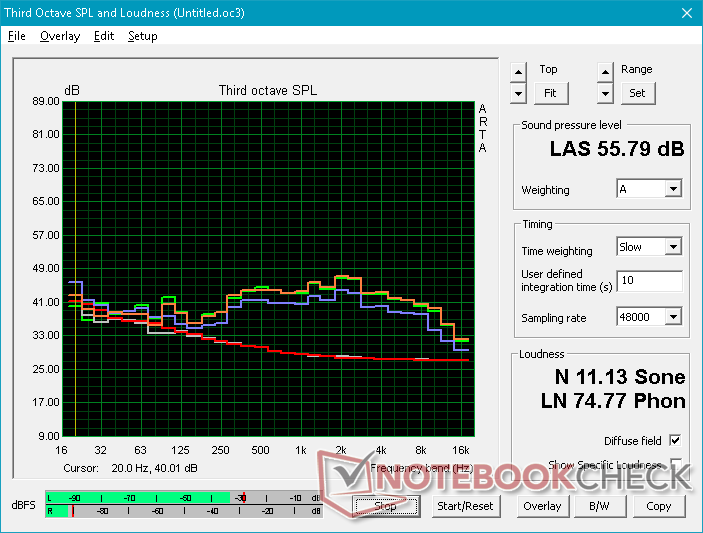
Apple MacBook 12 (Early 2016) 1.1 GHz audio analysis
(+) | speakers can play relatively loud (83.6 dB)
Bass 100 - 315 Hz
(±) | reduced bass - on average 11.3% lower than median
(±) | linearity of bass is average (14.2% delta to prev. frequency)
Mids 400 - 2000 Hz
(+) | balanced mids - only 2.4% away from median
(+) | mids are linear (5.5% delta to prev. frequency)
Highs 2 - 16 kHz
(+) | balanced highs - only 2% away from median
(+) | highs are linear (4.5% delta to prev. frequency)
Overall 100 - 16.000 Hz
(+) | overall sound is linear (10.2% difference to median)
Compared to same class
» 7% of all tested devices in this class were better, 2% similar, 90% worse
» The best had a delta of 5%, average was 18%, worst was 53%
Compared to all devices tested
» 5% of all tested devices were better, 1% similar, 94% worse
» The best had a delta of 4%, average was 23%, worst was 134%
Energy Management
Power Consumption
Running Witcher 3 consumes 147 W compared to 181 W on the RTX 2070-powered G731GW for a power savings of 19 percent. 3DMark benchmarks are also 19 percent slower as noted above meaning that the relationship between power and performance is largely linear when comparing the mobile GeForce RTX 2060 to the mobile RTX 2070.
It's interesting to note that power consumption between RTX 2060 and GTX 1660 Ti laptops are very close to one another when gaming despite their wide MSRPs. This supports our gaming data above where we found these two GPUs to be neck to neck.
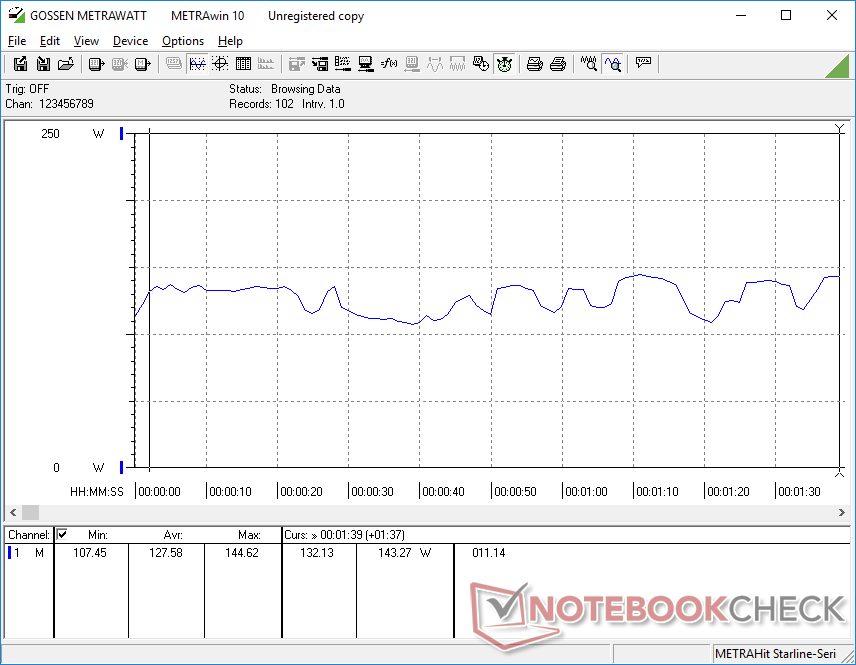
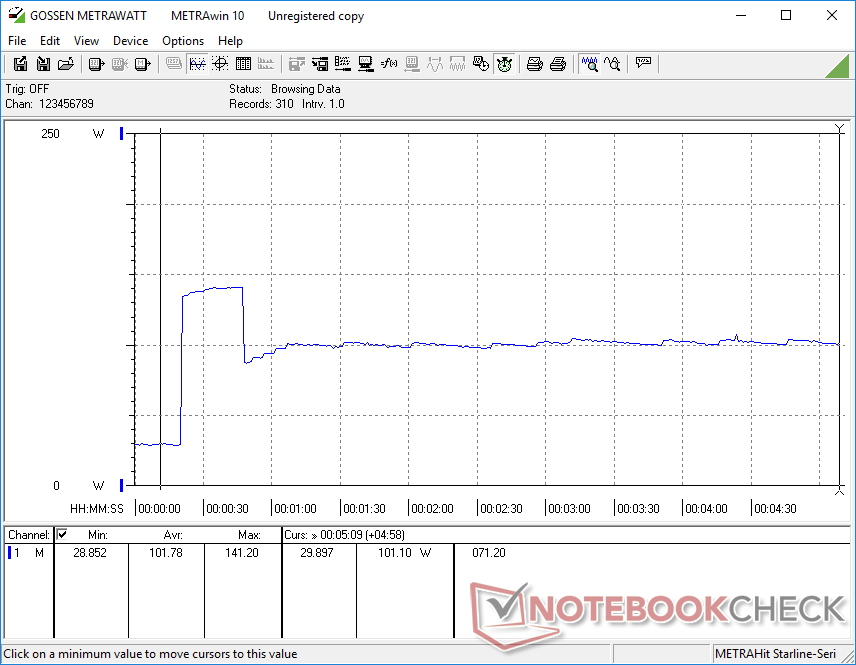
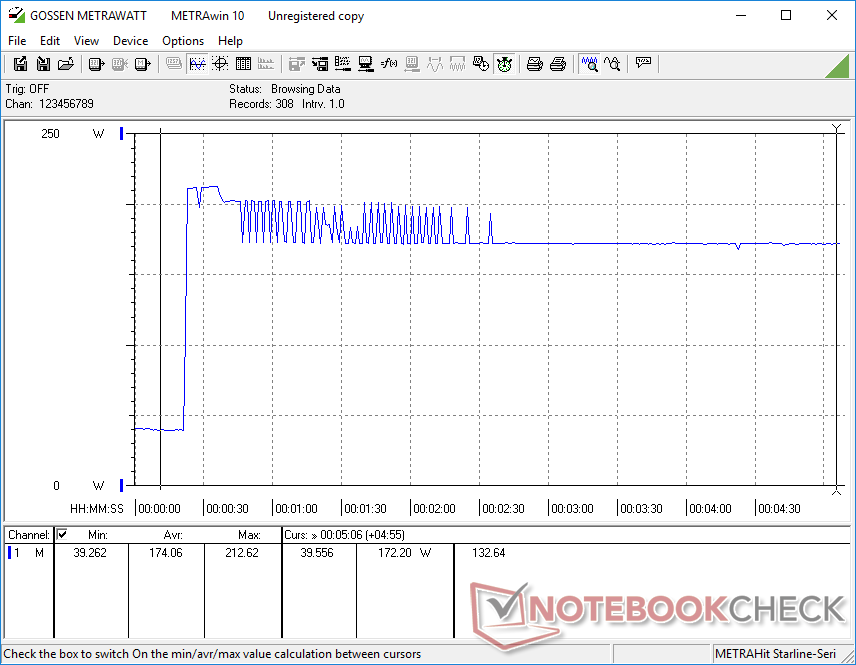
We're able to record a maximum draw of 212.7 W from the medium-sized (~16.5 x 7.5 x 3.3 cm) 230 W AC adapter which Asus also ships with the more demanding G731GW configuration. This high of a consumption is only temporary as shown by our screenshot below due to thermal constraints. When under such extreme stress, power consumption eventually settles at 172 W after just a couple of minutes.

| Off / Standby | |
| Idle | |
| Load |
|
Key:
min: | |
| Asus Strix Hero III G731GV i7-9750H, GeForce RTX 2060 Mobile, Intel SSD 660p SSDPEKNW512G8, IPS, 1920x1080, 17.3" | Asus ASUS ROG Strix SCAR III G731GW-XB74 i7-9750H, GeForce RTX 2070 Mobile, Intel SSD 660p 1TB SSDPEKNW010T8, IPS, 1920x1080, 17.3" | MSI GE75 9SG i9-9880H, GeForce RTX 2080 Mobile, Samsung SSD PM981 MZVLB1T0HALR, AHVA, 1920x1080, 17.3" | Asus Zephyrus S GX701GX i7-8750H, GeForce RTX 2080 Max-Q, Samsung SSD PM981 MZVLB1T0HALR, IPS, 1920x1080, 17.3" | Aorus X7 DT v8 i7-8850H, GeForce GTX 1080 Mobile, Toshiba NVMe THNSN5512GPU7, IPS, 1920x1080, 17.3" | Eurocom Nightsky Ti15 i7-9750H, GeForce GTX 1660 Ti Mobile, Samsung SSD 970 Pro 512GB, IPS, 1920x1080, 15.6" | |
|---|---|---|---|---|---|---|
| Power Consumption | -11% | -4% | -0% | -30% | 3% | |
| Idle Minimum * (Watt) | 16.2 | 18.2 -12% | 13.9 14% | 19 -17% | 23 -42% | 16.8 -4% |
| Idle Average * (Watt) | 24.8 | 23 7% | 18.8 24% | 22 11% | 33 -33% | 29 -17% |
| Idle Maximum * (Watt) | 28.6 | 33.1 -16% | 23.1 19% | 30 -5% | 37 -29% | 30.8 -8% |
| Load Average * (Watt) | 127.6 | 124.8 2% | 112.3 12% | 104 18% | 115 10% | 89.2 30% |
| Witcher 3 ultra * (Watt) | 147.1 | 180.8 -23% | 231 -57% | 167 -14% | 225 -53% | 141.1 4% |
| Load Maximum * (Watt) | 212.7 | 263 -24% | 291.5 -37% | 203 5% | 281 -32% | 192.3 10% |
* ... smaller is better
Battery Life
Runtimes are about half an hour longer than the G731GW for an estimated total of 4.5 hours of real-world WLAN use. In practice, however, runtimes will vary a bit more than usual because of the LED lights of the chassis. Be sure to set the system to Quiet or Power Saver mode and the GPU to integrated graphics or else battery life will be even shorter.
Recharging from empty to full capacity takes two full hours.
| Asus Strix Hero III G731GV i7-9750H, GeForce RTX 2060 Mobile, 66 Wh | Asus ASUS ROG Strix SCAR III G731GW-XB74 i7-9750H, GeForce RTX 2070 Mobile, 66 Wh | Lenovo Legion Y740-17ICH i7-8750H, GeForce RTX 2080 Max-Q, 76 Wh | Alienware m17 P37E i9-8950HK, GeForce RTX 2080 Max-Q, 90 Wh | Razer Blade Pro 17 RTX 2080 Max-Q i7-9750H, GeForce RTX 2080 Max-Q, 70 Wh | MSI GE75 9SG i9-9880H, GeForce RTX 2080 Mobile, 65 Wh | Asus Zephyrus S GX701GX i7-8750H, GeForce RTX 2080 Max-Q, 76 Wh | |
|---|---|---|---|---|---|---|---|
| Battery runtime | -13% | -29% | 9% | 4% | 9% | -16% | |
| WiFi v1.3 (h) | 4.5 | 3.9 -13% | 3.2 -29% | 4.9 9% | 4.7 4% | 4.9 9% | 3.8 -16% |
| Reader / Idle (h) | 4.2 | 9.1 | 4.9 | 5 | |||
| Load (h) | 1.4 | 0.8 | 1.4 | 0.9 |
Pros
Cons
Verdict


Currently, Xotic PC has the following Asus ROG G731 SKUs available:
- Asus ROG Hero III G731GV with 512 GB SSD, GeForce RTX 2060 for $1699
- Asus ROG Strix III G731GW with 1 TB SSD, GeForce RTX 2070 for $1999
After having checked out both configurations, the G731GW consumes about 19 percent more power for 19 percent faster graphics performance and at similar running temperatures than the G731GV. It's also noticeably louder and with slightly shorter battery life. Whether or not these drawbacks and advantages are worth the $300 price premium will depend on the user.
A notable observation is that the RTX 2060 is merely a few percentage points faster than the GTX 1660 Ti in the less expensive G731GU or GL731GU SKU. If you have no interest in RTX-specific features like ray tracing or DLSS, then you can get nearly the same performance for less with GTX 1660 Ti laptops. The G731GU is not yet widely available in the U.S. as of this writing.
Asus Strix Hero III G731GV
- 08/30/2019 v7 (old)
Allen Ngo
Price comparison
