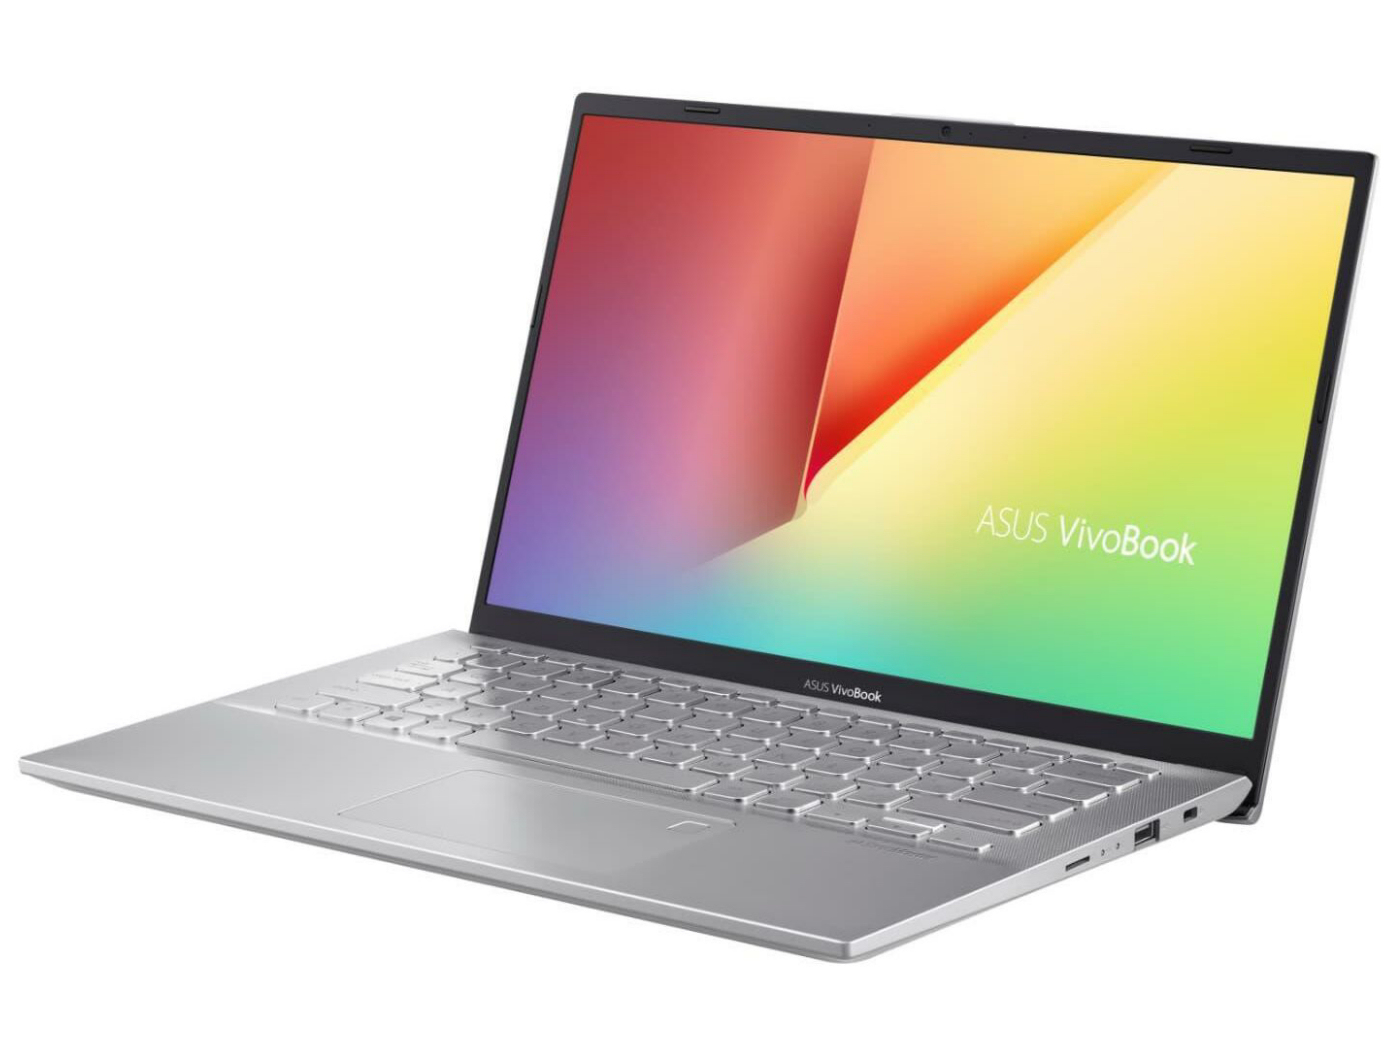
ASUS VivoBook 14 X412FJ Laptop Review: A compact 14-inch machine with performance issues

You may recognise the VivoBook 14 from our previous review, where we tested F412FJ, the sister model of our current review unit. The X412FJ, like its sibling, is powered by a Core i5-8265U processor and a GeForce MX230 GPU along with 8 GB of dual-channel RAM. We will compare the VivoBook 14 against other 14-inch laptops like the HP 14, Honor Magicbook, Huawei MateBook D 14 W00D and Lenovo IdeaPad S340-14IWL. You can also add other laptops to our comparison charts and tables, for reference.
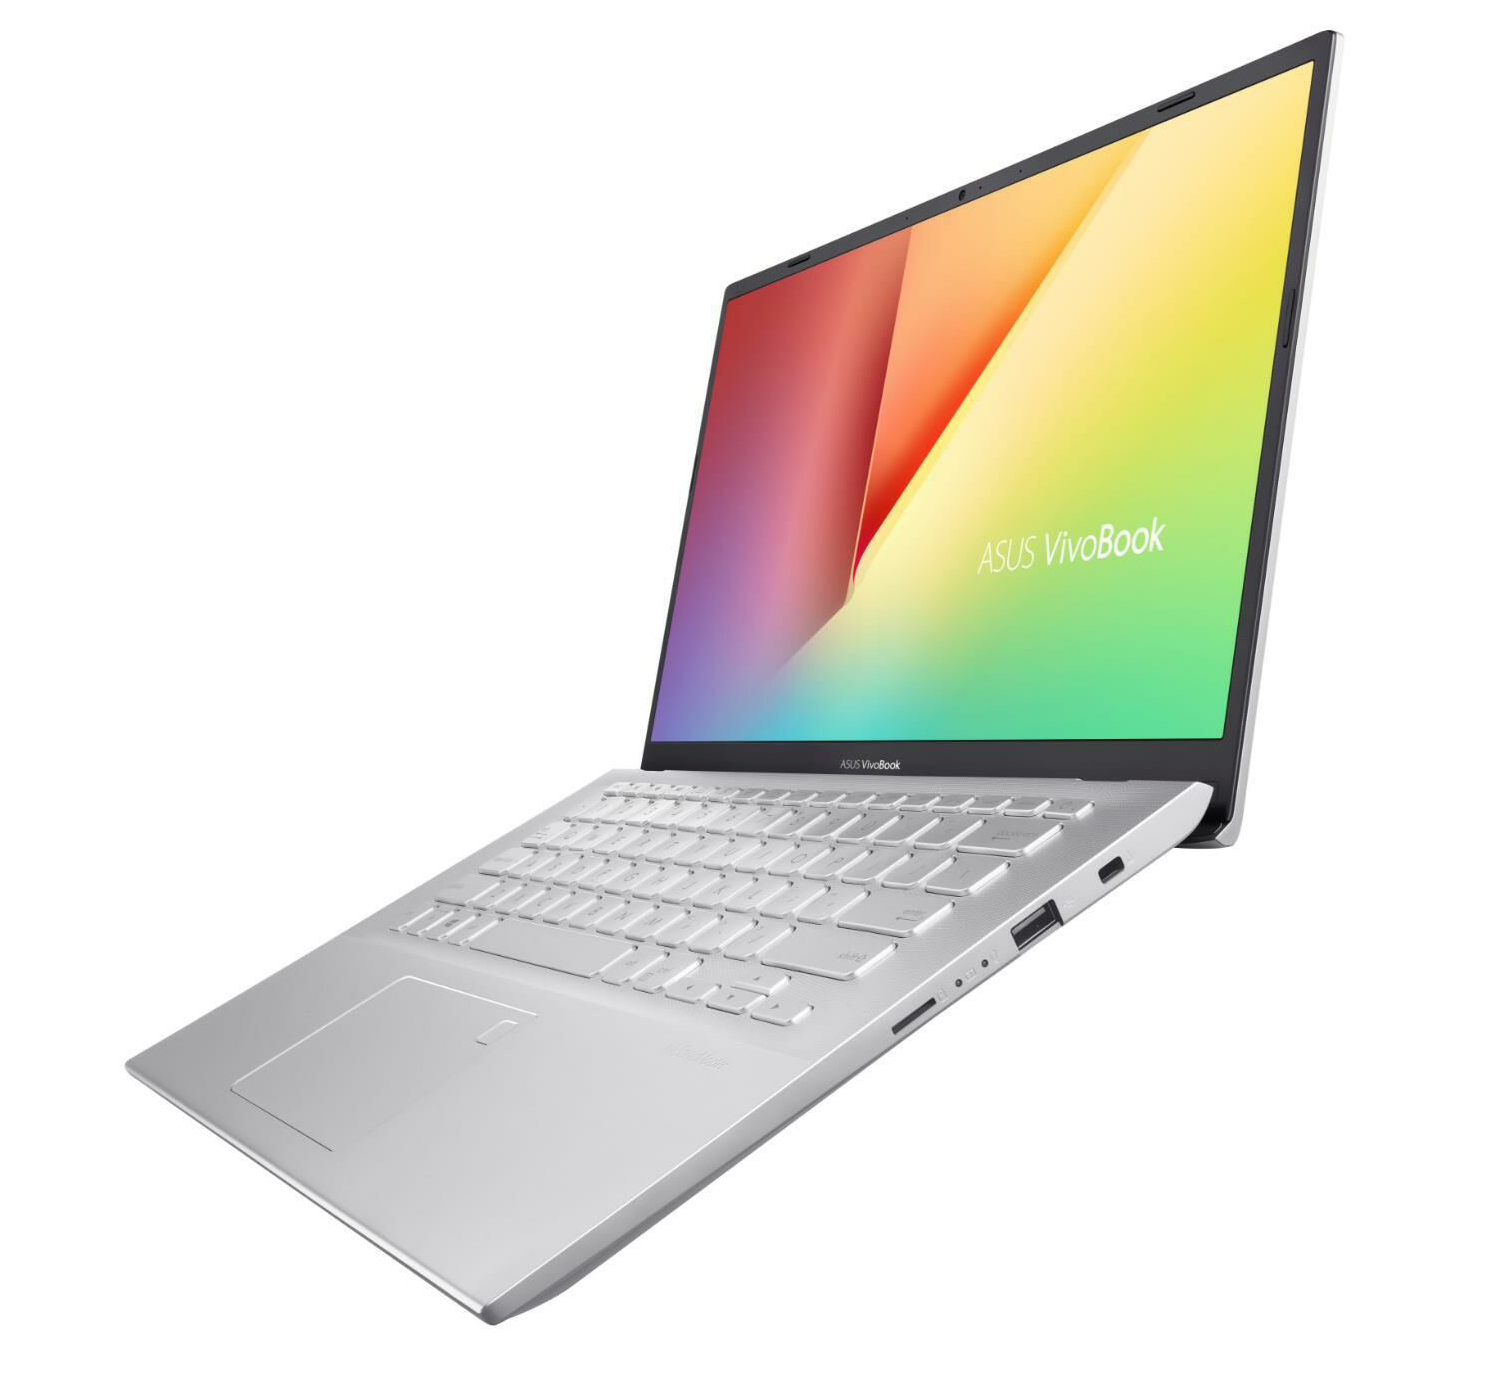
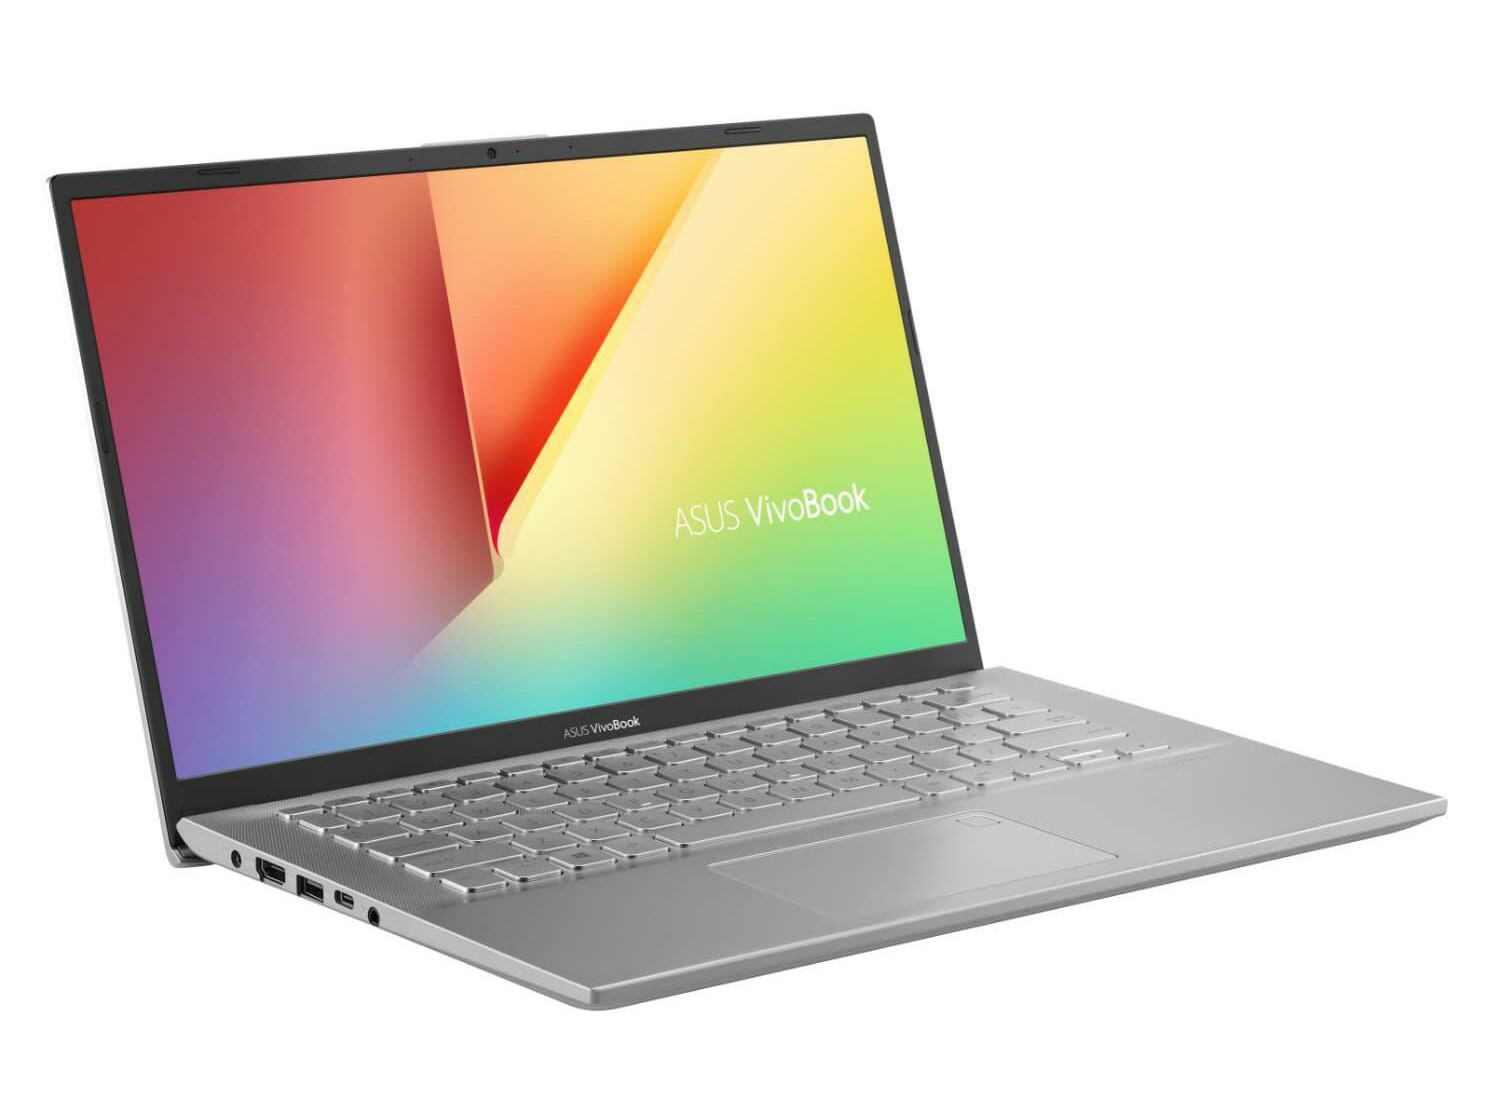
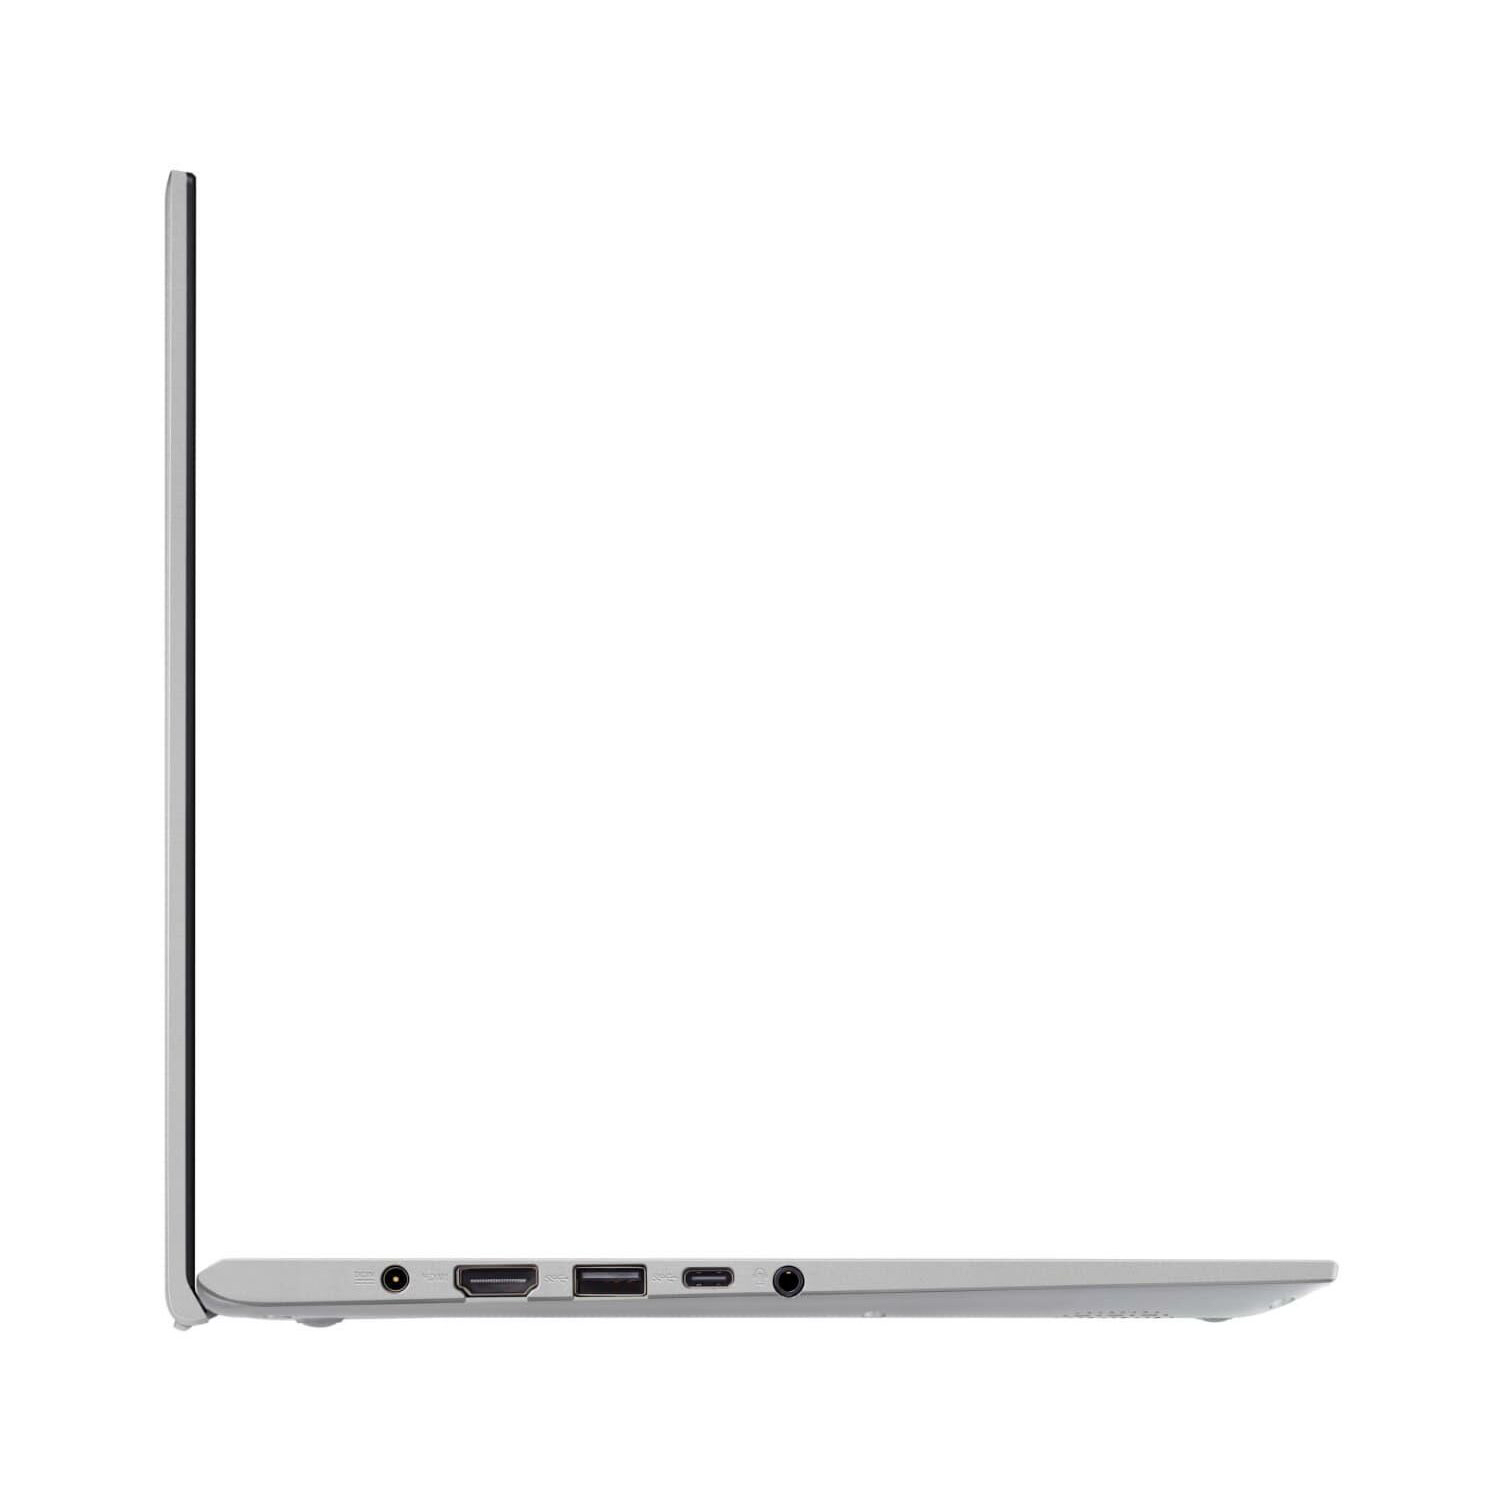
ASUS equips the X412FJ with the same case, connectivity, ports, input devices, display and speakers as the F412FJ. Please see our initial VivoBook 14 review for our full thoughts on these areas.

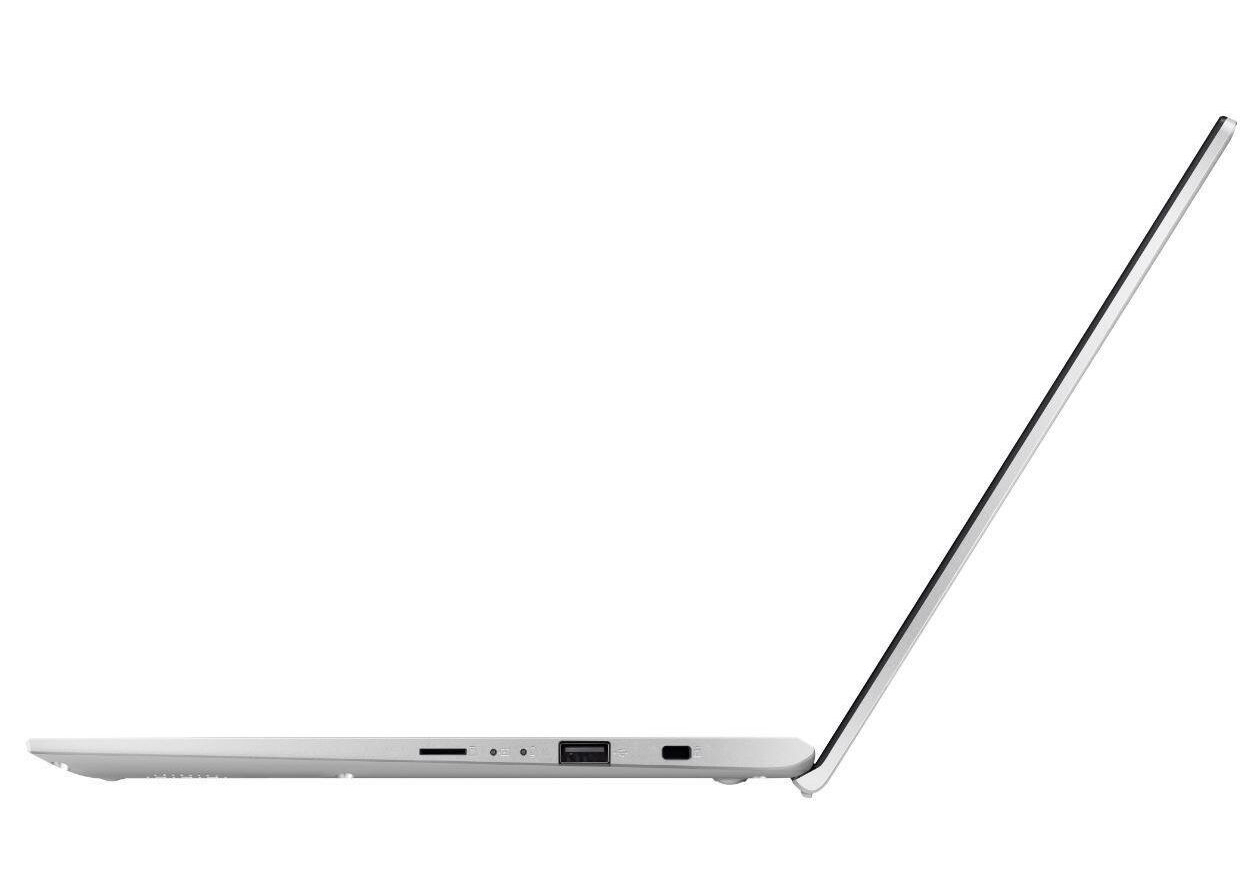
| SD Card Reader | |
| average JPG Copy Test (av. of 3 runs) | |
| Average of class Multimedia (22.3 - 531, n=37, last 2 years) | |
| Lenovo Ideapad S340-14IWL-81N70056GE (Toshiba Exceria Pro SDXC 64 GB UHS-II) | |
| HP 14-dk0008ng (Toshiba Exceria Pro SDXC 64 GB UHS-II) | |
| Asus VivoBook 14 X412FJ-EB023T (Toshiba Exceria Pro M501 microSDXC 64GB) | |
| Asus VivoBook 14 F412FJ-EB084T (Toshiba Exceria Pro M501 microSDXC 64GB) | |
| maximum AS SSD Seq Read Test (1GB) | |
| Average of class Multimedia (37.3 - 1455, n=36, last 2 years) | |
| Lenovo Ideapad S340-14IWL-81N70056GE (Toshiba Exceria Pro SDXC 64 GB UHS-II) | |
| HP 14-dk0008ng (Toshiba Exceria Pro SDXC 64 GB UHS-II) | |
| Asus VivoBook 14 X412FJ-EB023T (Toshiba Exceria Pro M501 microSDXC 64GB) | |
| Asus VivoBook 14 F412FJ-EB084T (Toshiba Exceria Pro M501 microSDXC 64GB) | |
| Networking | |
| iperf3 transmit AX12 | |
| Asus VivoBook 14 F412FJ-EB084T | |
| Honor Magicbook | |
| Honor Magicbook | |
| Asus VivoBook 14 X412FJ-EB023T | |
| Huawei MateBook D 14 W00D-53010GXL | |
| Lenovo Ideapad S340-14IWL-81N70056GE | |
| HP 14-dk0008ng | |
| iperf3 receive AX12 | |
| Huawei MateBook D 14 W00D-53010GXL | |
| Asus VivoBook 14 F412FJ-EB084T | |
| Asus VivoBook 14 X412FJ-EB023T | |
| Honor Magicbook | |
| Honor Magicbook | |
| HP 14-dk0008ng | |
| Lenovo Ideapad S340-14IWL-81N70056GE | |
Display

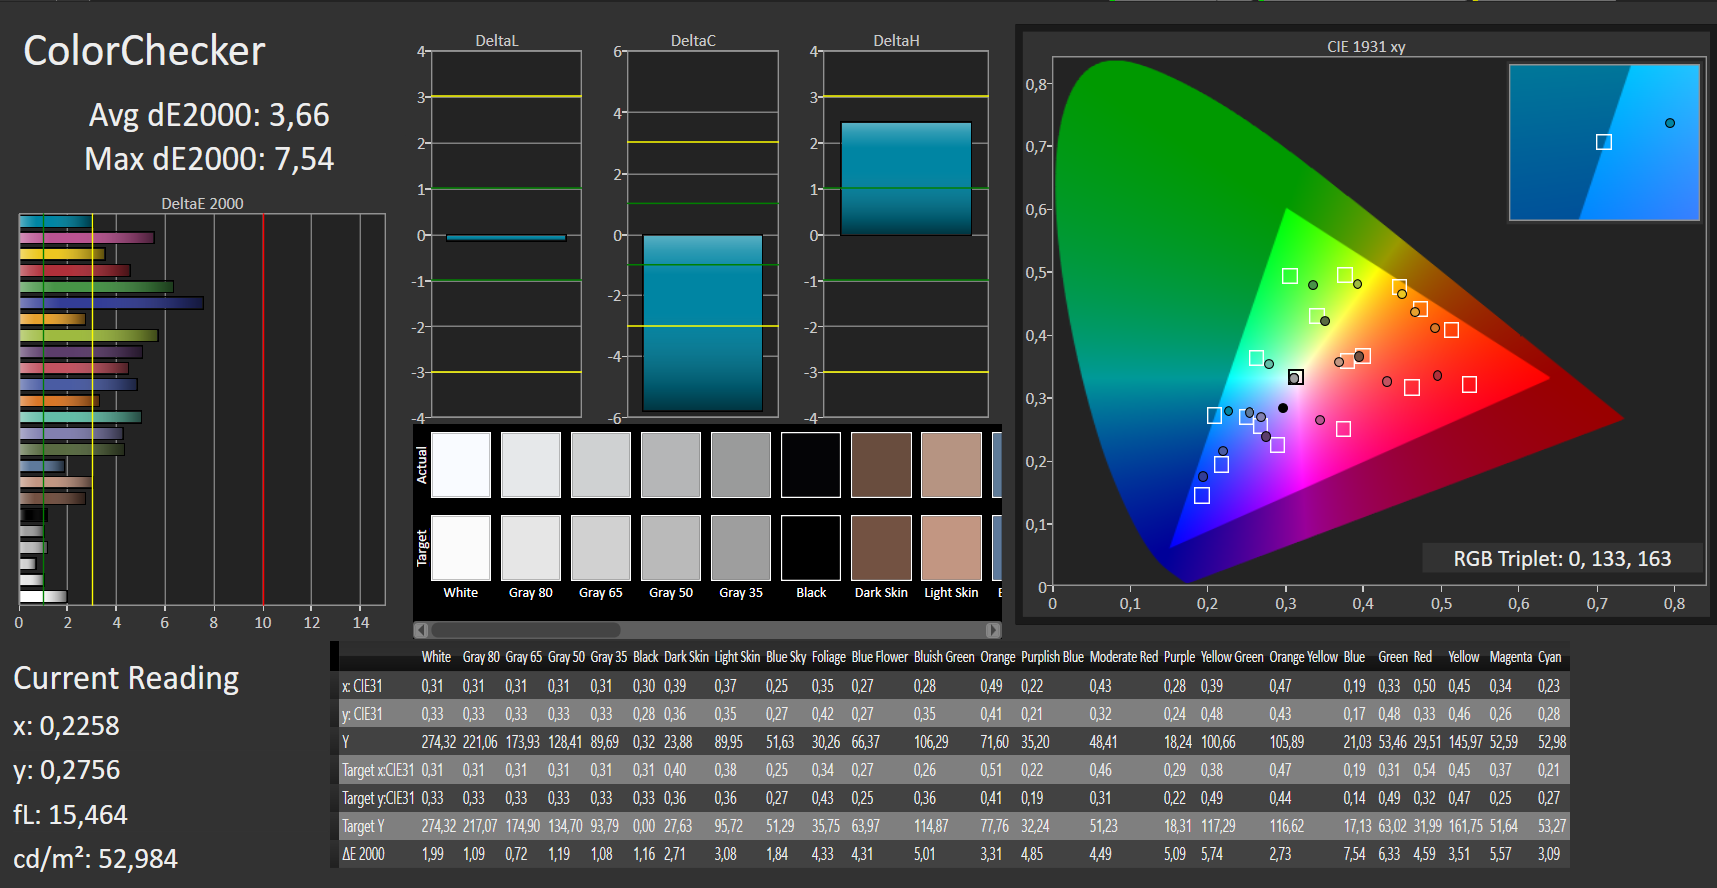
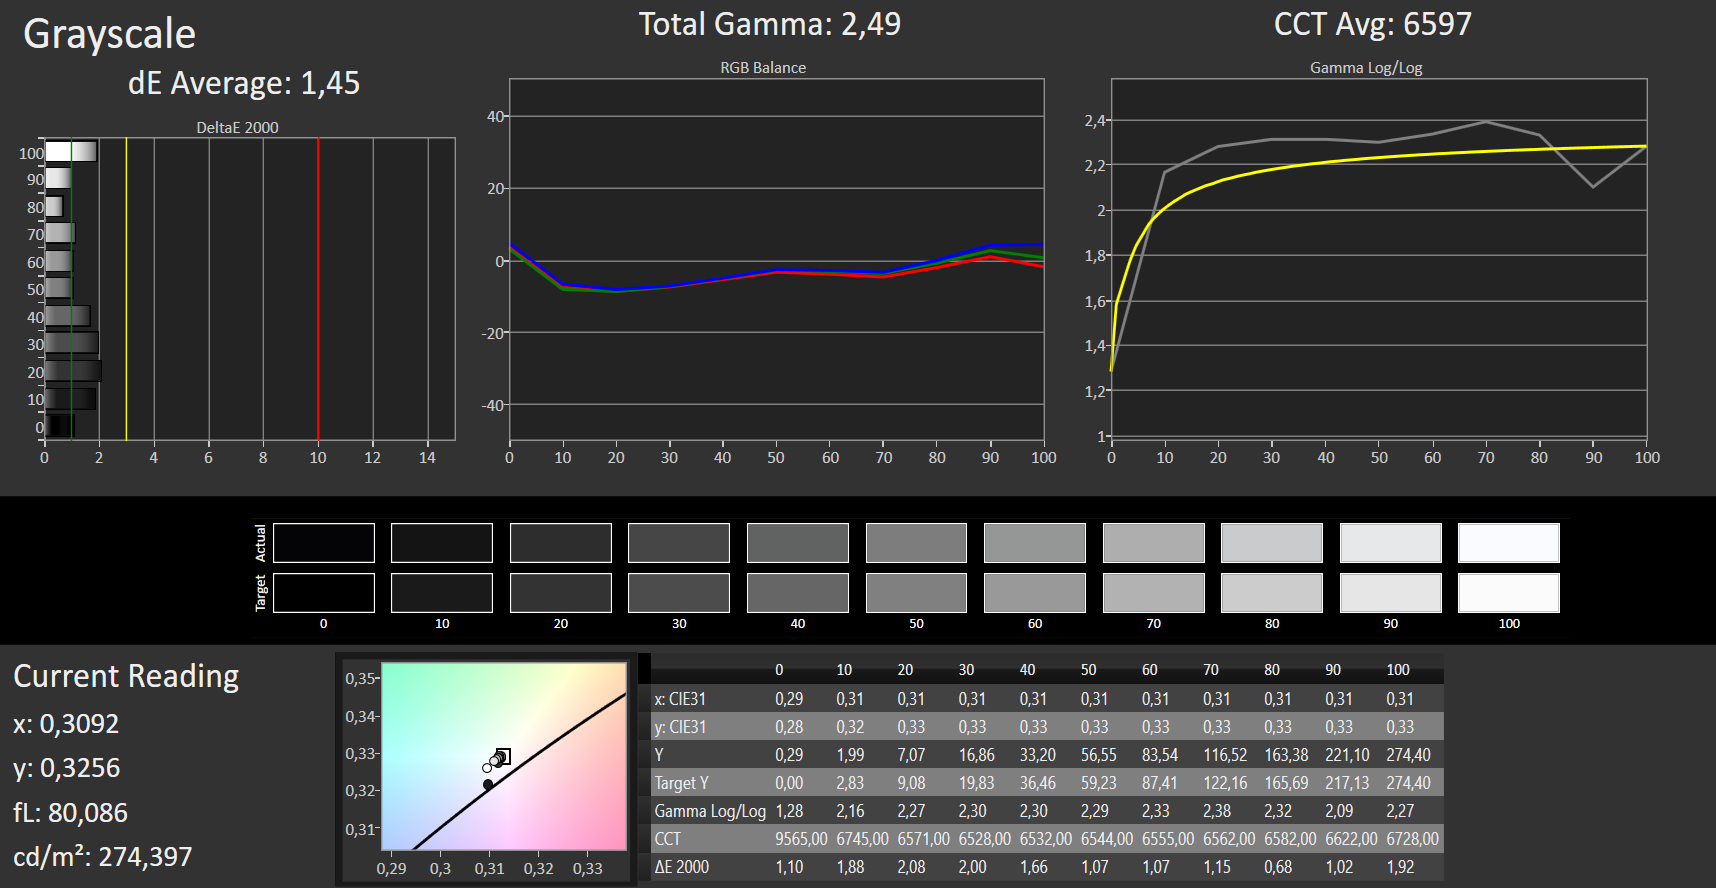
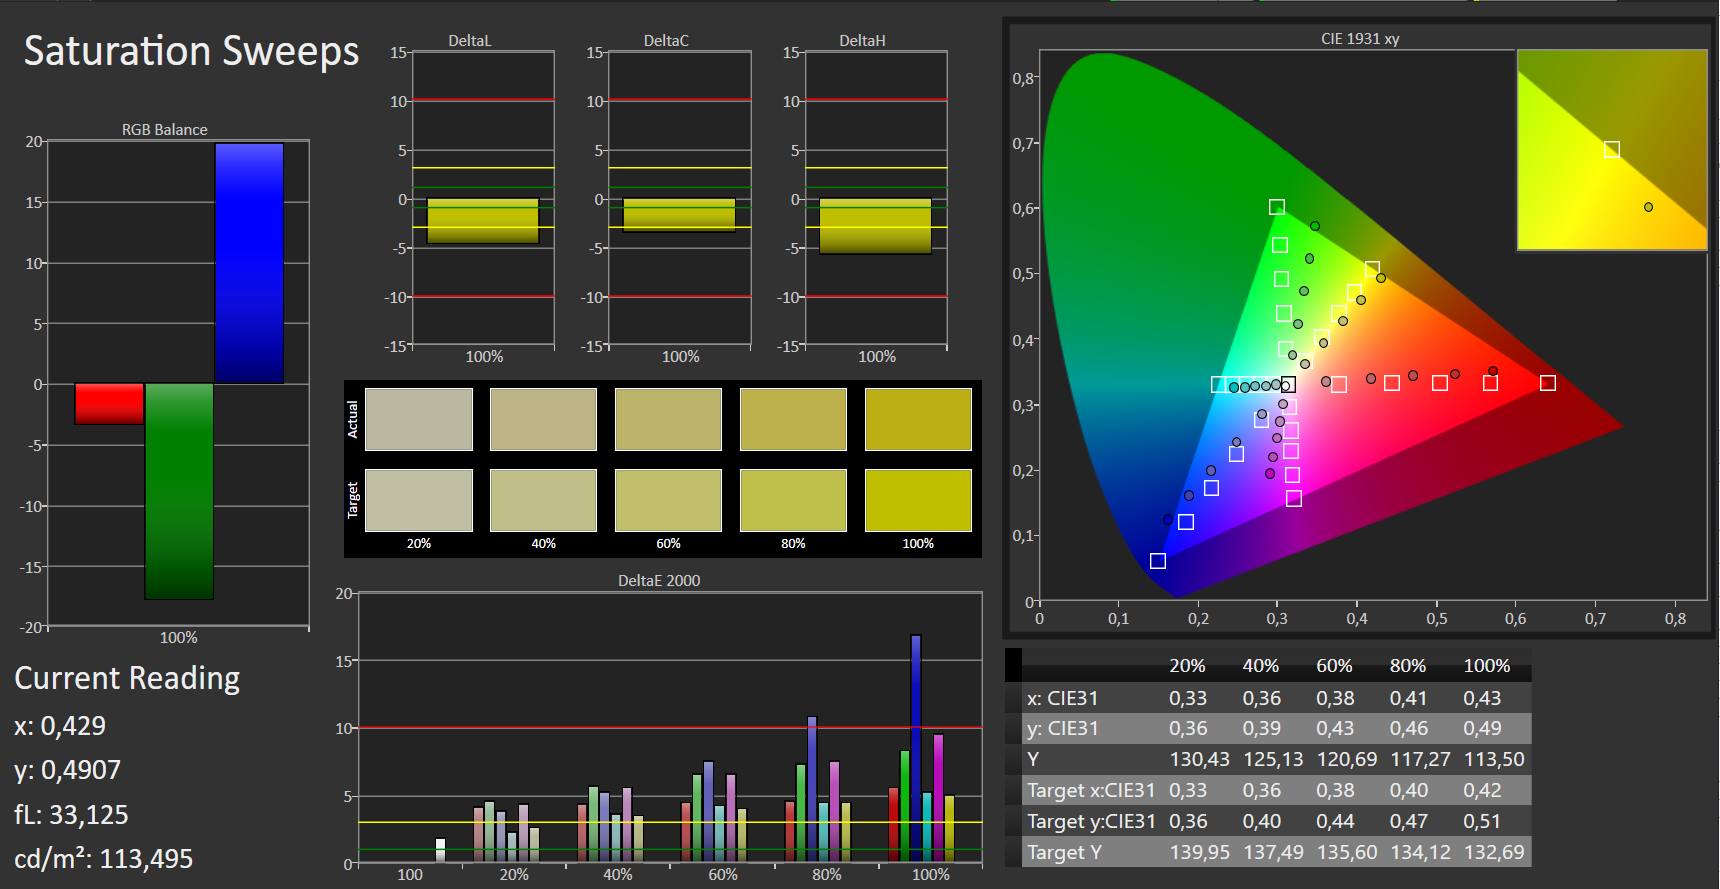
The VivoBook comes with the same 14-inch, matte and 1080p IPS panel as its sibling. Our current review unit achieved an average maximum brightness of 255 cd/m² and an 898:1 contrast ratio according to X-Rite i1Pro 2, both of which are below our expected values of 300 cd/m² and 1,000:1. In short, the VivoBook 14 should do better here. Positively, the display has stable viewing angles and no PWM flicker.
While the X412FJ has the same display as the F412FJ, their panels have different brightness values, black levels and contrast ratios. This is a normal phenomenon as no two panels are identical, even if they are from the same batch.
| |||||||||||||||||||||||||
Brightness Distribution: 89 %
Center on Battery: 274 cd/m²
Contrast: 898:1 (Black: 0.305 cd/m²)
ΔE ColorChecker Calman: 3.66 | ∀{0.5-29.43 Ø4.71}
ΔE Greyscale Calman: 1.45 | ∀{0.09-98 Ø4.96}
59% sRGB (Argyll 1.6.3 3D)
38% AdobeRGB 1998 (Argyll 1.6.3 3D)
40.96% AdobeRGB 1998 (Argyll 3D)
59.5% sRGB (Argyll 3D)
39.65% Display P3 (Argyll 3D)
Gamma: 2.49
CCT: 6597 K
| Asus VivoBook 14 X412FJ-EB023T IPS, 1920x1080, 14" | Asus VivoBook 14 F412FJ-EB084T IPS, 1920x1080, 14" | Lenovo Ideapad S340-14IWL-81N70056GE IPS, 1920x1080, 14" | HP 14-dk0008ng IPS, 1920x1080, 14" | Honor Magicbook 1920x1080, 14" | Honor Magicbook IPS LED, 1920x1080, 14" | Huawei MateBook D 14 W00D-53010GXL IPS, 1920x1080, 14" | |
|---|---|---|---|---|---|---|---|
| Display | 0% | -3% | -0% | 11% | 8% | 11% | |
| Display P3 Coverage (%) | 39.65 | 39.71 0% | 38.41 -3% | 39.53 0% | 44.59 12% | 43.09 9% | 44.26 12% |
| sRGB Coverage (%) | 59.5 | 59.6 0% | 57.8 -3% | 59.1 -1% | 65.7 10% | 63.1 6% | 65.1 9% |
| AdobeRGB 1998 Coverage (%) | 40.96 | 41.04 0% | 39.68 -3% | 40.84 0% | 46.07 12% | 44.52 9% | 45.73 12% |
| Response Times | 0% | 9% | 6% | -13% | -12% | -10% | |
| Response Time Grey 50% / Grey 80% * (ms) | 40 ? | 40 ? -0% | 36 ? 10% | 38 ? 5% | 44.8 ? -12% | 44.4 ? -11% | 42.4 ? -6% |
| Response Time Black / White * (ms) | 29 ? | 29 ? -0% | 27 ? 7% | 27 ? 7% | 32.8 ? -13% | 32.8 ? -13% | 32.8 ? -13% |
| PWM Frequency (Hz) | 200 ? | 200 ? | 198.4 ? | ||||
| Screen | 7% | -40% | 7% | -27% | -19% | -23% | |
| Brightness middle (cd/m²) | 274 | 267 -3% | 260 -5% | 269 -2% | 318 16% | 287 5% | 287 5% |
| Brightness (cd/m²) | 255 | 257 1% | 250 -2% | 257 1% | 308 21% | 273 7% | 276 8% |
| Brightness Distribution (%) | 89 | 91 2% | 87 -2% | 89 0% | 90 1% | 86 -3% | 86 -3% |
| Black Level * (cd/m²) | 0.305 | 0.2 34% | 0.29 5% | 0.2 34% | 0.26 15% | 0.21 31% | 0.25 18% |
| Contrast (:1) | 898 | 1335 49% | 897 0% | 1345 50% | 1223 36% | 1367 52% | 1148 28% |
| Colorchecker dE 2000 * | 3.66 | 3.79 -4% | 6.29 -72% | 3.68 -1% | 5.3 -45% | 5 -37% | 5.4 -48% |
| Colorchecker dE 2000 max. * | 7.54 | 8.18 -8% | 14.77 -96% | 7.36 2% | 19.3 -156% | 20.1 -167% | 18.1 -140% |
| Greyscale dE 2000 * | 1.45 | 1.49 -3% | 4.65 -221% | 1.69 -17% | 4 -176% | 2.7 -86% | 3.1 -114% |
| Gamma | 2.49 88% | 2.48 89% | 2.73 81% | 2.49 88% | 2.23 99% | 2.18 101% | 1.99 111% |
| CCT | 6597 99% | 6659 98% | 7331 89% | 6406 101% | 6991 93% | 6653 98% | 6769 96% |
| Color Space (Percent of AdobeRGB 1998) (%) | 38 | 38 0% | 37 -3% | 38 0% | 42.23 11% | 40.59 7% | 41.8 10% |
| Color Space (Percent of sRGB) (%) | 59 | 59 0% | 58 -2% | 59 0% | 65.31 11% | 62.66 6% | 64.6 9% |
| Colorchecker dE 2000 calibrated * | 4.71 | 4.51 | 4.8 | 4.2 | 4.5 | 5 | |
| Total Average (Program / Settings) | 2% /
5% | -11% /
-26% | 4% /
5% | -10% /
-17% | -8% /
-12% | -7% /
-14% |
* ... smaller is better
Display Response Times
| ↔ Response Time Black to White | ||
|---|---|---|
| 29 ms ... rise ↗ and fall ↘ combined | ↗ 17 ms rise | 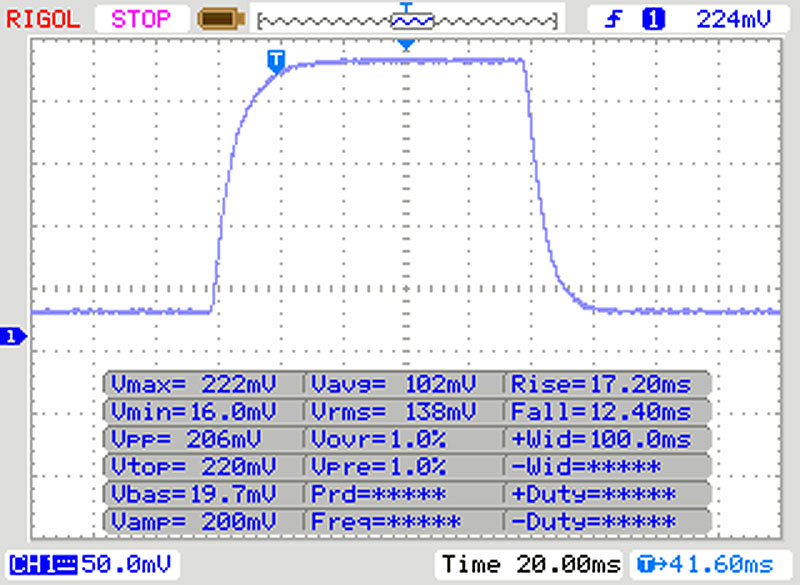 |
| ↘ 12 ms fall | ||
| The screen shows relatively slow response rates in our tests and may be too slow for gamers. In comparison, all tested devices range from 0.1 (minimum) to 240 (maximum) ms. » 77 % of all devices are better. This means that the measured response time is worse than the average of all tested devices (19.8 ms). | ||
| ↔ Response Time 50% Grey to 80% Grey | ||
| 40 ms ... rise ↗ and fall ↘ combined | ↗ 18 ms rise | 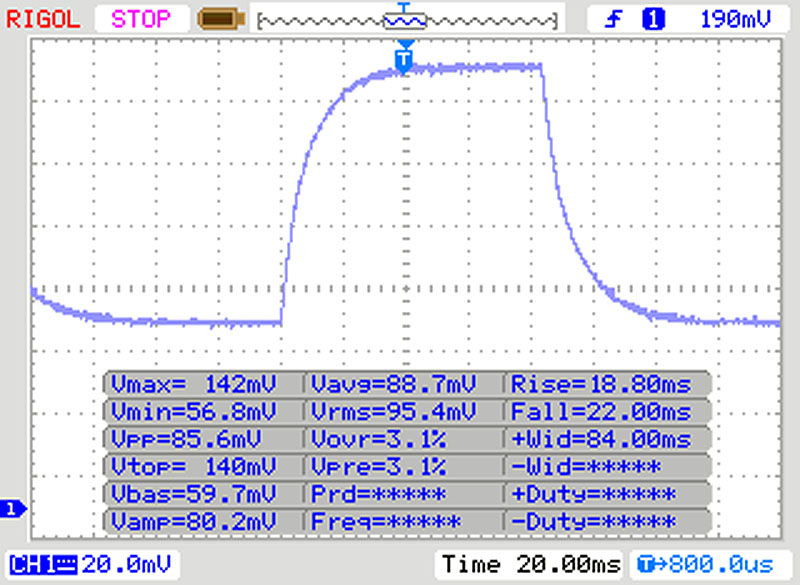 |
| ↘ 22 ms fall | ||
| The screen shows slow response rates in our tests and will be unsatisfactory for gamers. In comparison, all tested devices range from 0.165 (minimum) to 636 (maximum) ms. » 61 % of all devices are better. This means that the measured response time is worse than the average of all tested devices (30.9 ms). | ||
Screen Flickering / PWM (Pulse-Width Modulation)
| Screen flickering / PWM not detected | 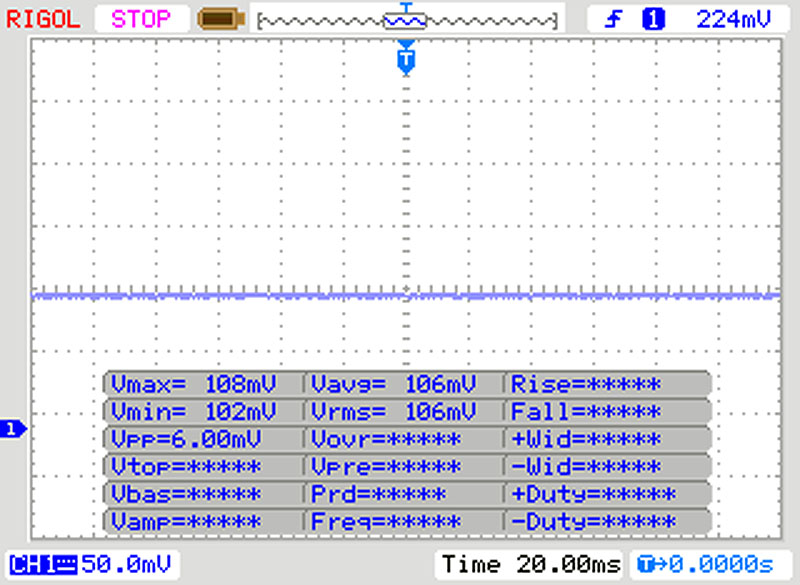 | ||
In comparison: 52 % of all tested devices do not use PWM to dim the display. If PWM was detected, an average of 7741 (minimum: 5 - maximum: 343500) Hz was measured. | |||
Performance
The VivoBook 14 is powerful enough for all common tasks and even some light gaming thanks to its quad-core CPU and dedicated GPU. Our test device currently costs between €700 (~US$782) and €800 (~US$893) online, although ASUS sells other variants should your budget not stretch that far.
Processor
ASUS equips the VivoBook with a Core i5-8265U processor, a quad-core chip based on Intel’s Whiskey Lake architecture. The ultra-low voltage (ULV) CPU has a 15 W thermal design power (TDP) that allows it to temporarily boost its 1.6 GHz base clock to 3.7 GHz across all four cores when required. The Core i5-8265U can also reach 3.8 GHz on two cores and 3.9 GHz during single-core tasks.
Correspondingly, our review unit maintained between 3.7 and 3.9 GHz in Cinebench R15 Single 64Bit on mains or battery power. However, its multicore performance is not as rosy, with the CPU initially fluctuating between 3.3 and 3.6 GHz on mains power before dropping to between 2.8 and 2.9 GHz. However, it can only maintain between 2.8 and 3 GHz on battery power, with it regularly plummeting to 400 MHz too.
In short, the VivoBook 14 has dreadful multicore performance when running on battery power. The device can only score 259 points in CB R15 Multi 64Bit, which is just ahead of the dual-core Pentium Gold 4415U on around 240 points. Hence, we would recommend considering another device if you need peak multicore performance on the go. We doubt that this applies to most people, but it still something to keep in mind before you buy the VivoBook 14. The device can maintain maximum single-threaded performance on battery though.
We also tested whether the system could maintain peak CPU performance under sustained load by running CB R15 Multi 64Bit on a loop for 30 minutes. We expected scores to drop when the CPU exhausts its turbo clock speeds, which is a behaviour we have come to expect from modern laptops. The VivoBook 14 is no different, with it dropping from a peak of 666 points to a low of 522. The CPU still maintained turbo clock speeds of between 2.4 and 2.6 GHz from the sixth pass onwards, with the VivoBook 14 dropping below the Honor Magicbook, MateBook D 14 and IdeaPad S340-14IWL in our comparison chart, which we have included below.
| Cinebench R10 | |
| Rendering Single 32Bit | |
| Average of class Multimedia (3234 - 11576, n=8, last 2 years) | |
| Asus VivoBook 14 X412FJ-EB023T | |
| Average Intel Core i5-8265U (5841 - 6209, n=9) | |
| HP 14-dk0008ng | |
| Rendering Multiple CPUs 32Bit | |
| Average of class Multimedia (17722 - 84729, n=8, last 2 years) | |
| Asus VivoBook 14 X412FJ-EB023T | |
| Average Intel Core i5-8265U (16318 - 22962, n=9) | |
| HP 14-dk0008ng | |
| Geekbench 3 | |
| 32 Bit Multi-Core Score | |
| Asus VivoBook 14 X412FJ-EB023T | |
| Average Intel Core i5-8265U (12198 - 14499, n=6) | |
| HP 14-dk0008ng | |
| 32 Bit Single-Core Score | |
| Asus VivoBook 14 X412FJ-EB023T | |
| Average Intel Core i5-8265U (3470 - 3842, n=6) | |
| HP 14-dk0008ng | |
| Mozilla Kraken 1.1 - Total | |
| Huawei MateBook D 14 W00D-53010GXL | |
| HP 14-dk0008ng (Edge 44) | |
| Asus VivoBook 14 X412FJ-EB023T (Edge 44) | |
| Average Intel Core i5-8265U (851 - 1245, n=25) | |
| Honor Magicbook (Chrome 82) | |
| Lenovo Ideapad S340-14IWL-81N70056GE | |
| Average of class Multimedia (228 - 835, n=66, last 2 years) | |
| JetStream 1.1 - 1.1 Total | |
| Average of class Multimedia (n=1last 2 years) | |
| Lenovo Ideapad S340-14IWL-81N70056GE | |
| Asus VivoBook 14 X412FJ-EB023T (Edge 44) | |
| Average Intel Core i5-8265U (193.7 - 244, n=19) | |
| HP 14-dk0008ng (Edge 44) | |
| Huawei MateBook D 14 W00D-53010GXL | |
* ... smaller is better
System Performance
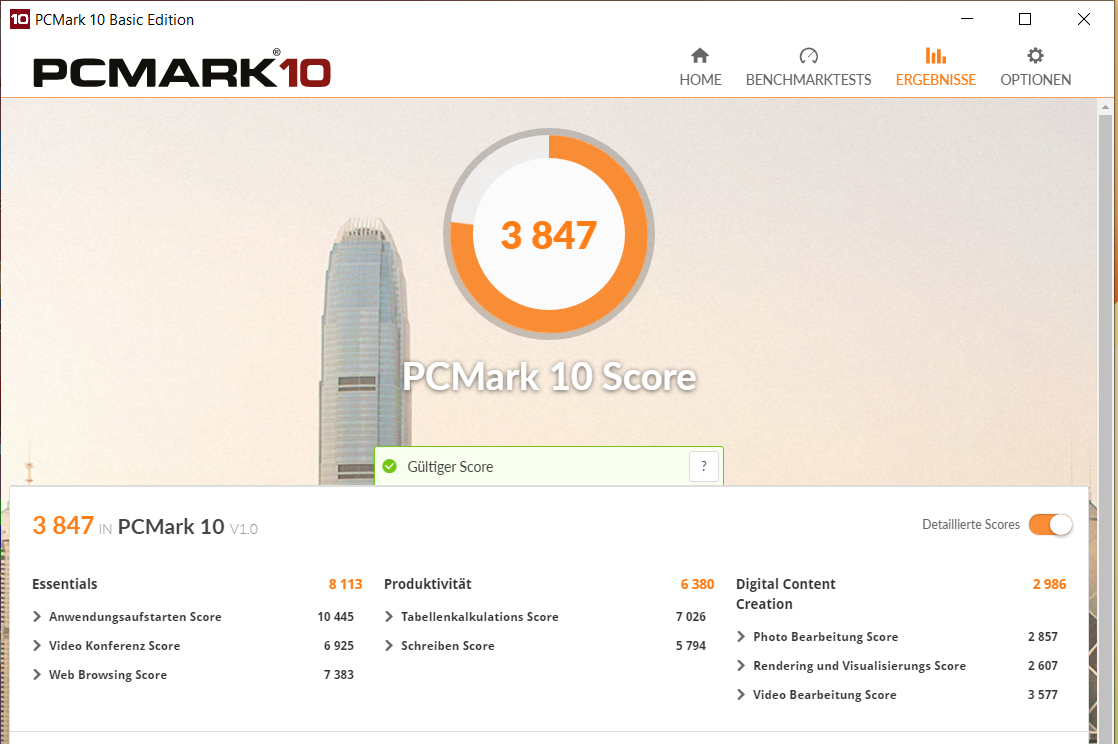
Nonetheless, the VivoBook 14 performed well in system performance benchmarks like PCMark 10. We did not encounter any system stutters or crashes during our tests either, and it should handle most programs that you would want to run on a 14-inch laptop.
| PCMark 8 Home Score Accelerated v2 | 3609 points | |
| PCMark 8 Creative Score Accelerated v2 | 3616 points | |
| PCMark 8 Work Score Accelerated v2 | 4967 points | |
| PCMark 10 Score | 3847 points | |
Help | ||
Storage Devices
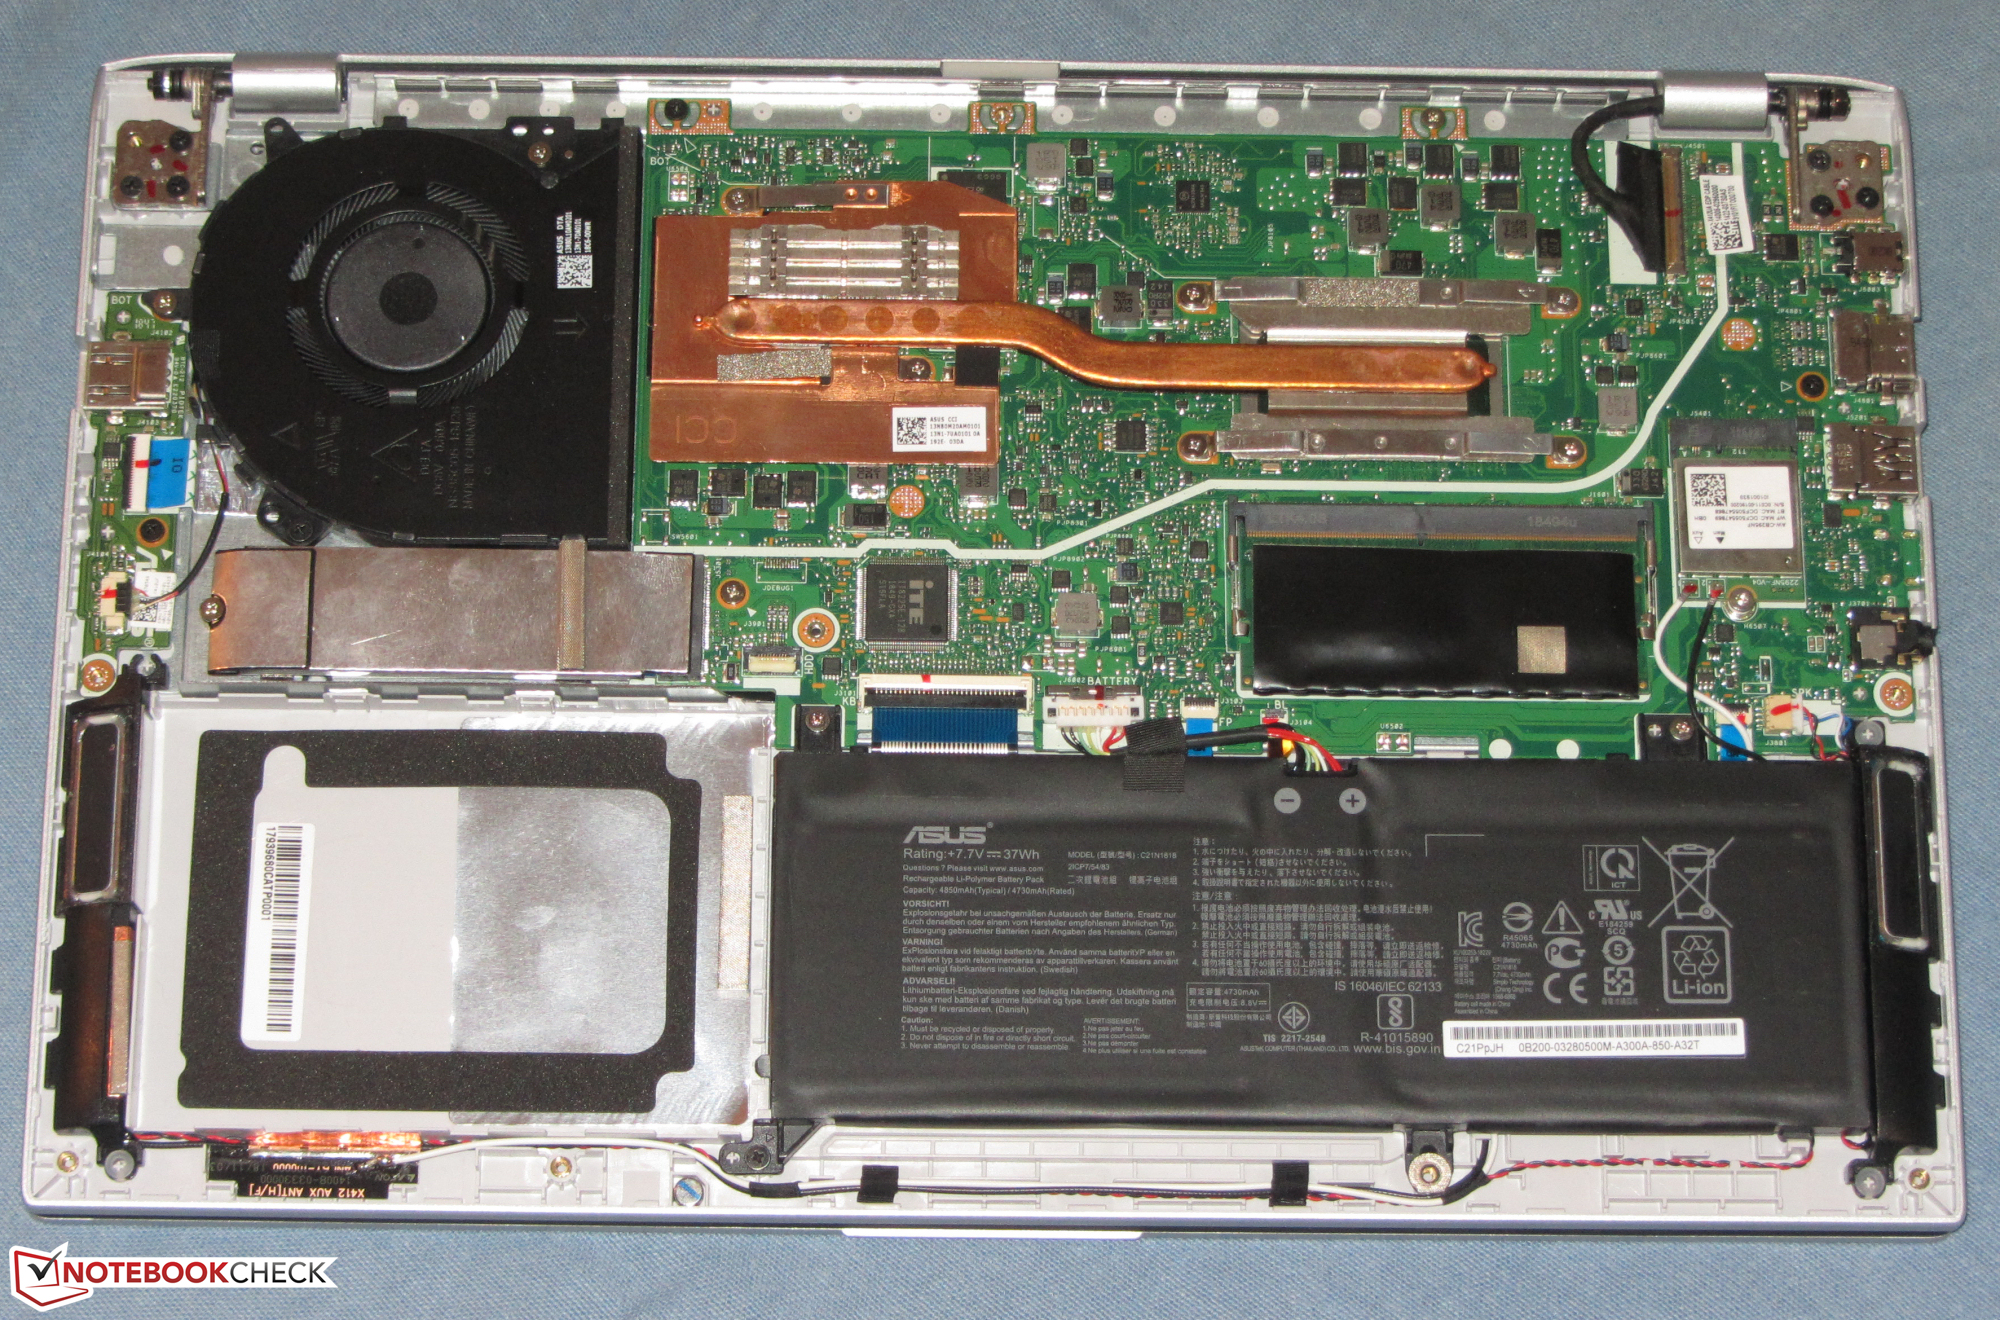
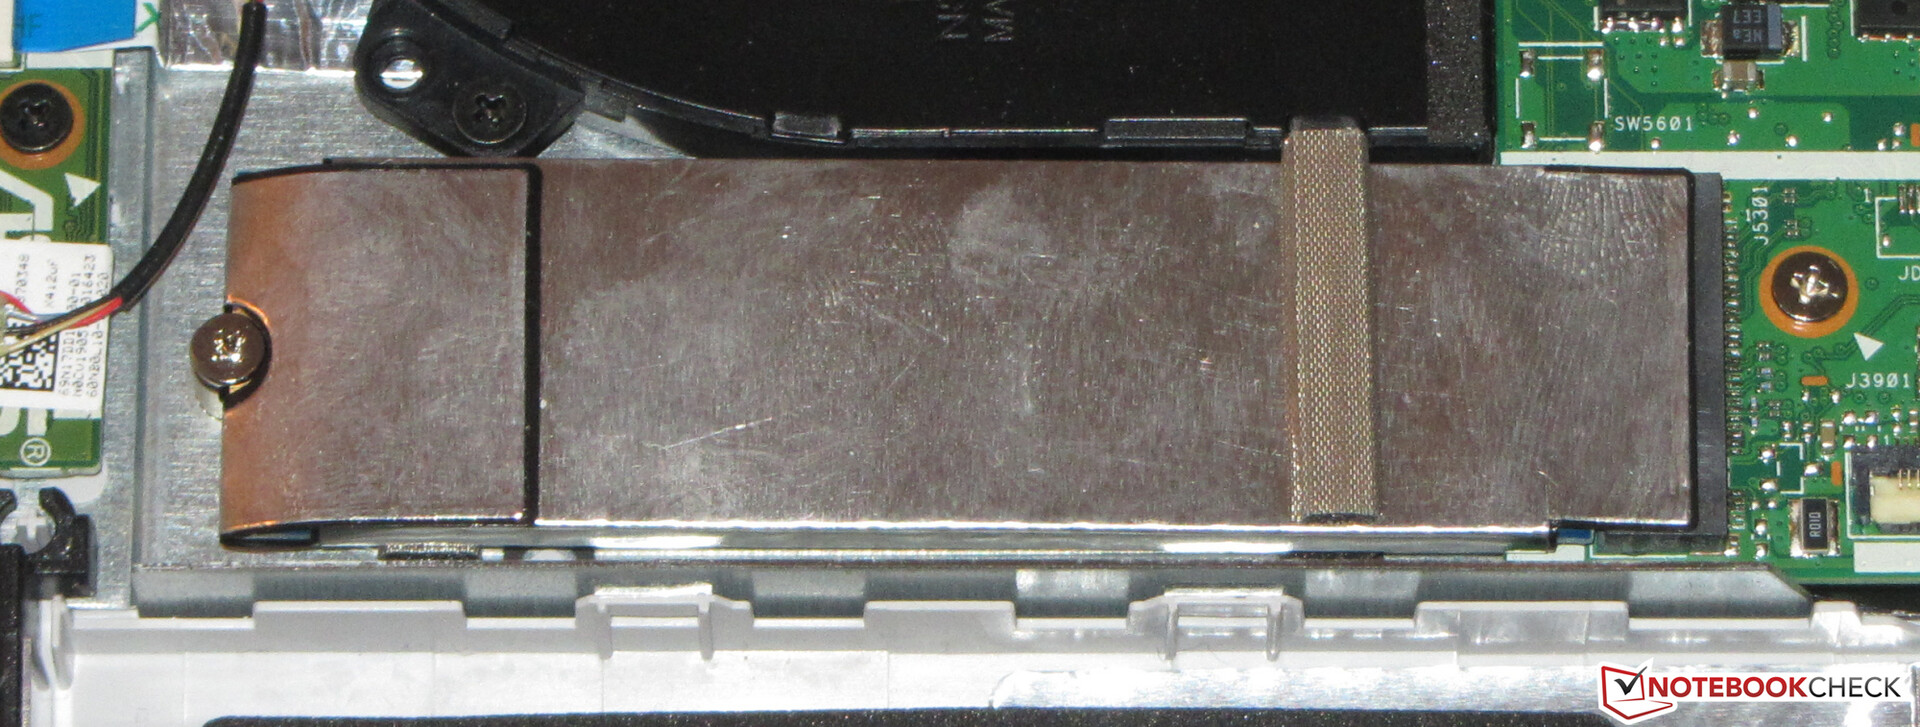
ASUS equips the VivoBook 14 with a 256 GB Kingston SATA III SSD, of which about 207 GB was free when we first switched on our review unit. The M.2-2280 drive has decent transfer speeds for a SATA III SSD, but it falls well short of NVMe drives like the WDC SN520 in the IdeaPad S340-14IWL.
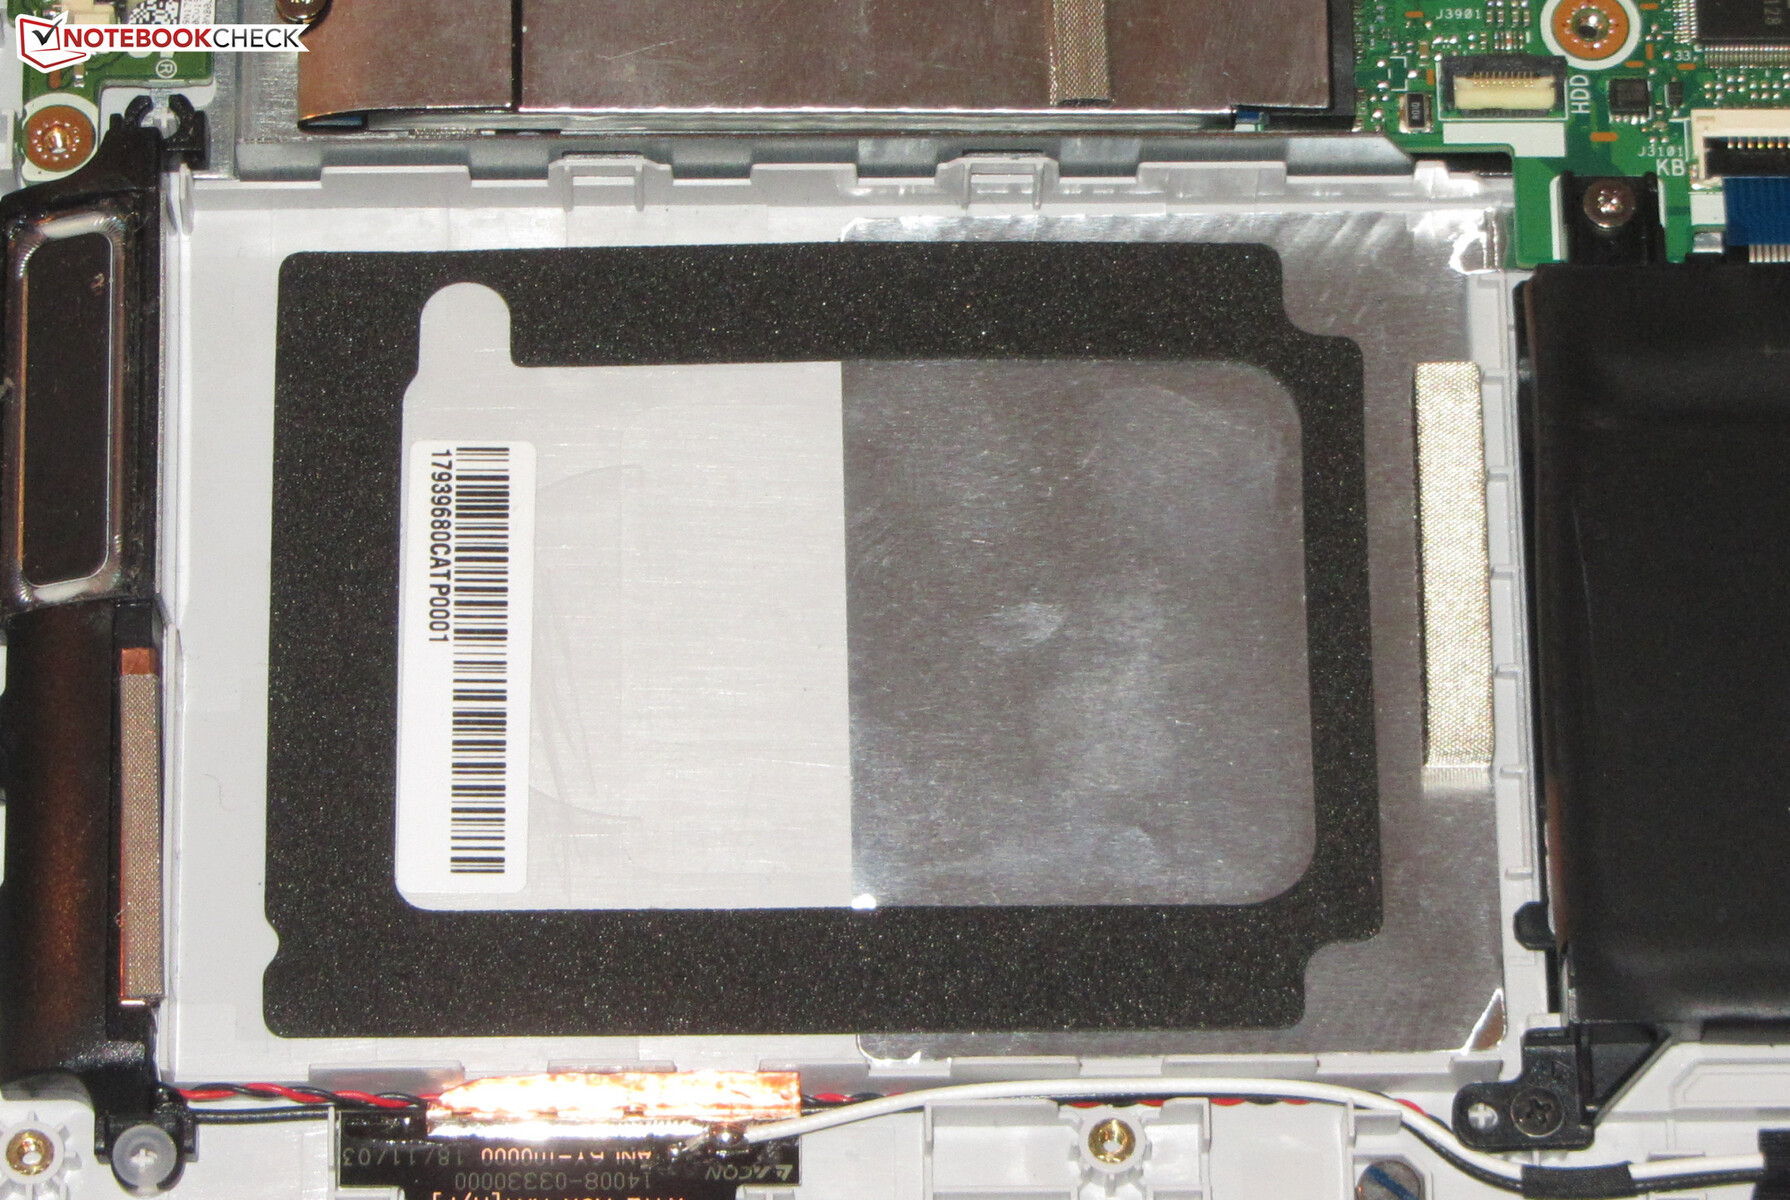
There is also a 2.5-inch drive bay should you need more storage. Oddly, ASUS did not pre-install a SATA cable or mounting screws, nor did it include them in the box. You could also swap the SSD for a higher capacity drive, although you must remove the bottom plate to do so, just as you must to add a 2.5-inch SSD or HDD.

| Asus VivoBook 14 X412FJ-EB023T Kingston RBUSNS8180DS3256GJ | Asus VivoBook 14 F412FJ-EB084T Kingston RBU-SNS8180DS3512GJ | Lenovo Ideapad S340-14IWL-81N70056GE WDC PC SN520 SDAPNUW-512G | HP 14-dk0008ng Samsung PM871b MZNLN128HAHQ | Honor Magicbook Samsung SSD PM871b MZNLN256HAJQ | Honor Magicbook Samsung SSD PM871b MZNLN256HAJQ | Huawei MateBook D 14 W00D-53010GXL SK Hynix SC313 HFS256G39TNF | Average Kingston RBUSNS8180DS3256GJ | Average of class Multimedia | |
|---|---|---|---|---|---|---|---|---|---|
| CrystalDiskMark 5.2 / 6 | -15% | 162% | 6% | 4% | 4% | 4% | -6% | 459% | |
| Write 4K (MB/s) | 79.7 | 55 -31% | 160.8 102% | 90.6 14% | 76.5 -4% | 82.1 3% | 72.3 -9% | 71.8 ? -10% | 166.3 ? 109% |
| Read 4K (MB/s) | 28.14 | 28.79 2% | 50.5 79% | 33.17 18% | 30.02 7% | 21.11 -25% | 30.77 9% | 31.3 ? 11% | 68.5 ? 143% |
| Write Seq (MB/s) | 450.9 | 307.5 -32% | 1458 223% | 483 7% | 461.2 2% | 451.7 0% | 468.1 4% | 412 ? -9% | 2667 ? 491% |
| Read Seq (MB/s) | 434.7 | 430 -1% | 1447 233% | 511 18% | 508 17% | 477.7 10% | 518 19% | 423 ? -3% | 3134 ? 621% |
| Write 4K Q32T1 (MB/s) | 228.5 | 149.5 -35% | 406.5 78% | 170.7 -25% | 212.3 -7% | 242.2 6% | 214.2 -6% | 176.3 ? -23% | 468 ? 105% |
| Read 4K Q32T1 (MB/s) | 244.1 | 207.2 -15% | 476.8 95% | 235 -4% | 239.7 -2% | 257.4 5% | 241.1 -1% | 191.8 ? -21% | 587 ? 140% |
| Write Seq Q32T1 (MB/s) | 478.4 | 389.2 -19% | 1458 205% | 496.5 4% | 482.7 1% | 526 10% | 482 1% | 489 ? 2% | 4667 ? 876% |
| Read Seq Q32T1 (MB/s) | 456.6 | 497.1 9% | 1743 282% | 534 17% | 535 17% | 550 20% | 537 18% | 497 ? 9% | 5884 ? 1189% |
Graphics Card
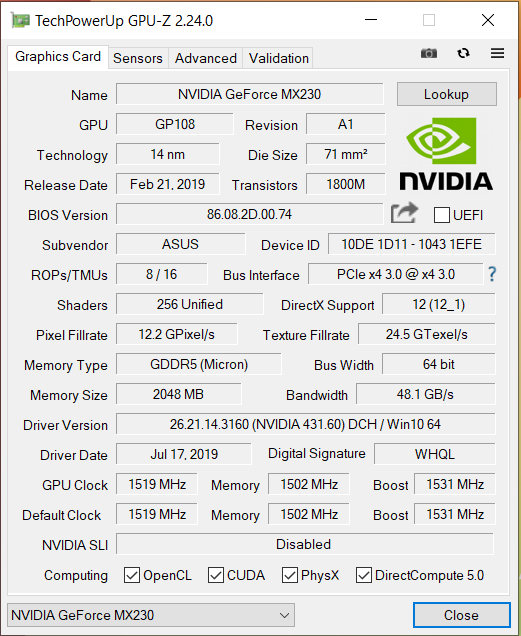
The GeForce MX230 is based on NVIDIA's Pascal architecture and comes with 2 GB of GDDR5 VRAM. The DirectX 12 GPU has a 1,519 MHz base clock that NVIDIA claims it can boost to 1,531 MHz when required.
This boost clock speed is just a guideline, with the one in our review unit able to reach 1,695 MHz in synthetic benchmarks. The GPU can exceed its stated boost clock if it does not hit its power or temperature thresholds though, so it cannot reach 1,695 MHz in all applications. Our review unit only averaged 1,368 MHz during our The Witcher 3 test, for example, which is below its base clock.
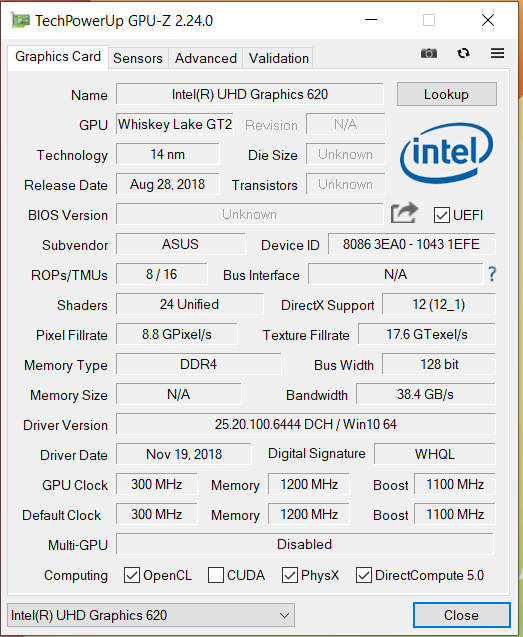
The VivoBook 14 achieved expected results in 3DMark when plugged into the mains. The device can also use NVIDIA Optimus to switch between its NVIDIA GPU and the UHD Graphics 620 GPU integrated on its CPU, which it uses to minimise power consumption.
| 3DMark 11 Performance | 3673 points | |
| 3DMark Ice Storm Standard Score | 64029 points | |
| 3DMark Cloud Gate Standard Score | 10746 points | |
| 3DMark Fire Strike Score | 2395 points | |
| 3DMark Time Spy Score | 882 points | |
Help | ||
Gaming Performance
The VivoBook 14 is powerful enough to play most modern games smoothly in at least 1,366 x 768 pixels at medium graphics. The device will struggle in some triple-A titles like Ashes of the Singularity, Anno 1800 or Rage 2, but you should be able to increase the resolution and graphics settings in older games like BioShock Infinite.
We also subjected our review unit to a prolonged gaming test to see how it managed its performance under sustained load. We left The Witcher 3 running for about 60 minutes at 1,024 x 768 and minimum graphics, during which framerates fluctuated between 24 and 50 FPS. We also did not move the playable character for the entire test, for reference.
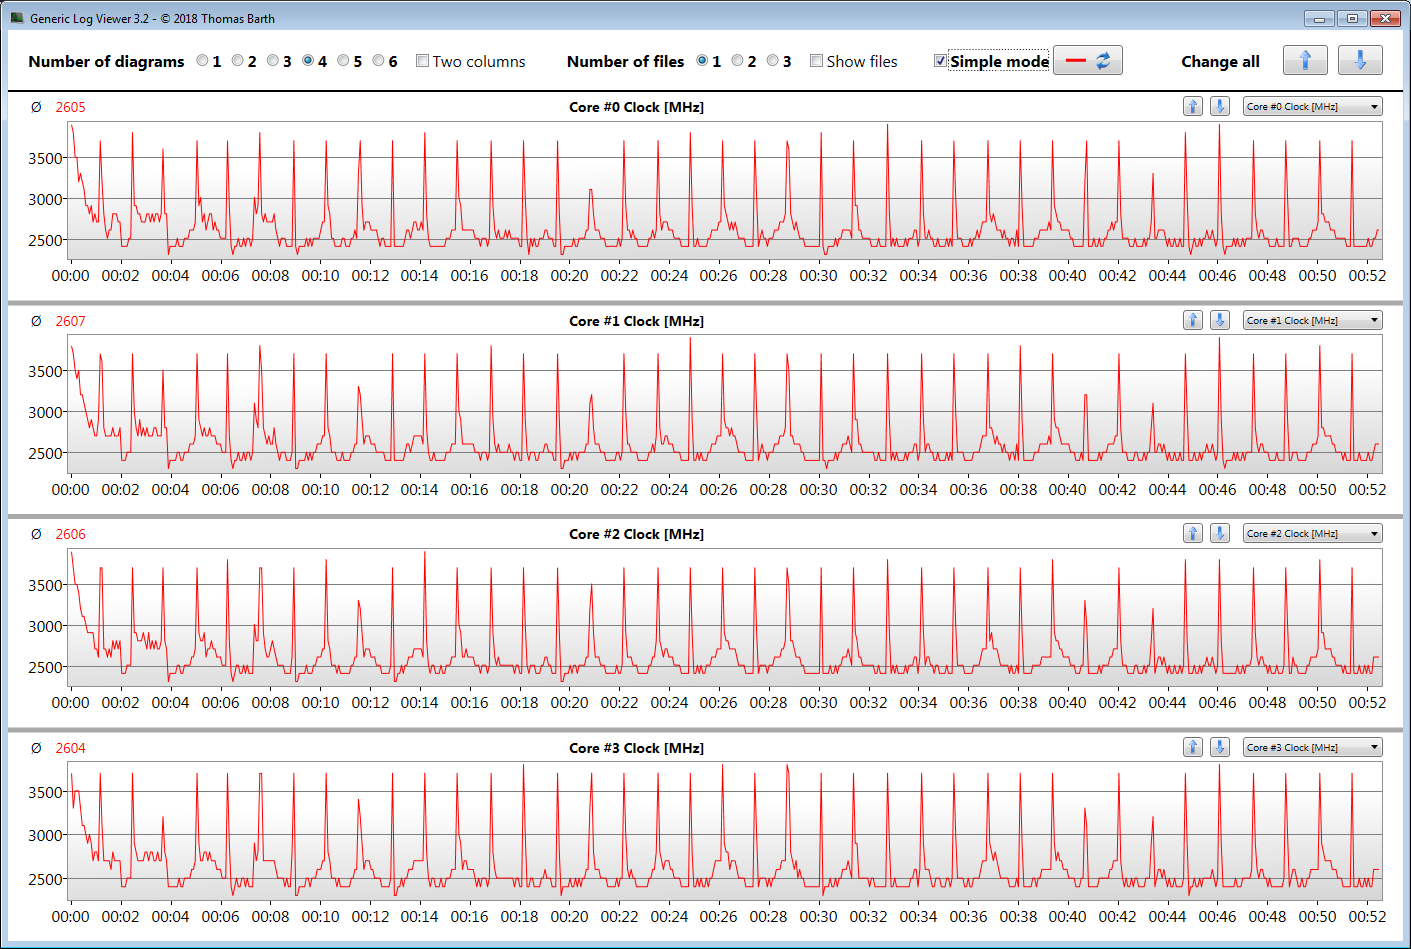
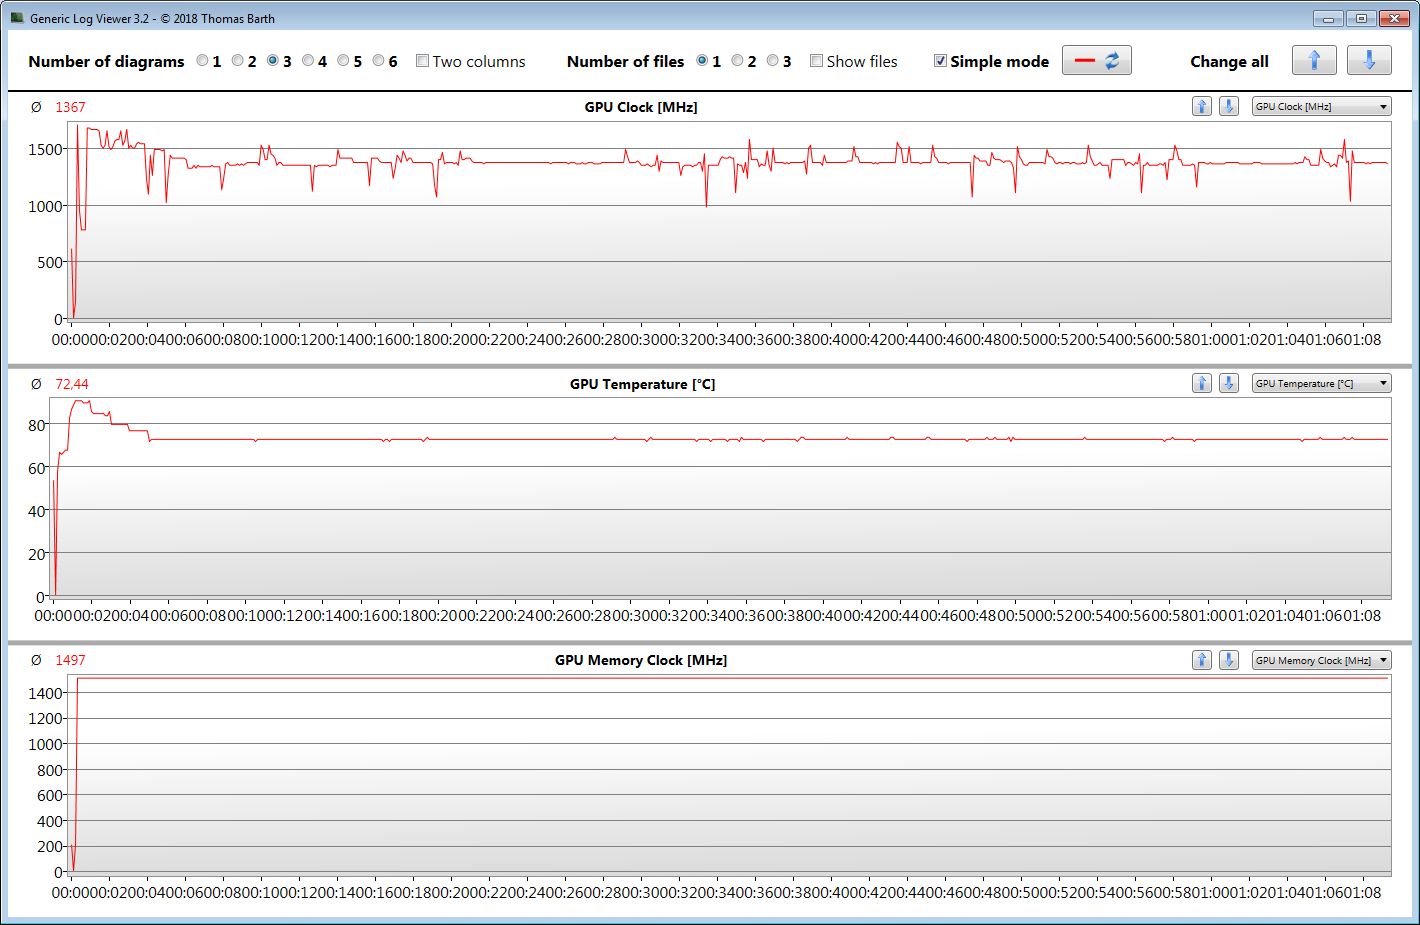
Oddly, FPS nosedive to around 25 FPS after a few minutes before recovering to 50 FPS. This behaviour continued every few minutes before even stabilising between 40 FPS and 45 FPS for most of the test. Examining clock speed behaviour with Generic Log Viewer 3.2 reveals that the GPU can only maintain between 1,350 and 1,360 MHz, which is significantly short of its 1,519 MHz base clock. We ruled out this being a game-based irregularity by re-running the test with Prey, which yielded comparable results. Overall, you can expect an FPS drop of up to 20% by the end of prolonged gaming sessions.
| BioShock Infinite - 1366x768 High Preset | |
| Lenovo Ideapad S340-14IWL-81N70056GE | |
| Asus VivoBook 14 X412FJ-EB023T | |
| Average NVIDIA GeForce MX230 (61.8 - 79.8, n=5) | |
| Asus VivoBook 14 F412FJ-EB084T | |
| HP 14-dk0008ng | |
| F1 2019 - 1280x720 Ultra Low Preset | |
| Honor Magicbook | |
| Asus VivoBook 14 X412FJ-EB023T | |
| Average NVIDIA GeForce MX230 (n=1) | |
| Huawei MateBook D 14 W00D-53010GXL | |
| Total War: Three Kingdoms - 1280x720 Low (incl textures) | |
| Average of class Multimedia (186 - 317, n=2, last 2 years) | |
| Honor Magicbook | |
| Average NVIDIA GeForce MX230 (55.5 - 67.7, n=3) | |
| Asus VivoBook 14 X412FJ-EB023T | |
| Fortnite - 1280x720 Low Preset | |
| Honor Magicbook | |
| Asus VivoBook 14 X412FJ-EB023T | |
| Average NVIDIA GeForce MX230 (n=1) | |
| Honor Magicbook | |
| Team Fortress 2 - 1920x1080 maximum AA:8x MS AF:16x | |
| Asus VivoBook 14 X412FJ-EB023T | |
| Average NVIDIA GeForce MX230 (n=1) | |
| low | med. | high | ultra | |
|---|---|---|---|---|
| StarCraft 2 (2010) | 234.3 | 111.7 | 85.9 | 41.4 |
| Diablo III (2012) | 142.6 | 114.2 | 96.1 | 52.6 |
| Counter-Strike: GO (2012) | 178.1 | 127.1 | 90.7 | 64.9 |
| BioShock Infinite (2013) | 146.4 | 81.4 | 72.7 | 27.4 |
| Sims 4 (2014) | 171.9 | 110 | 60.5 | 48.7 |
| The Witcher 3 (2015) | 45.9 | 26.4 | 13.5 | 7.7 |
| World of Warships (2015) | 101.2 | 84.1 | 52.8 | 33.2 |
| Rainbow Six Siege (2015) | 85.9 | 61.9 | 32.2 | 22.5 |
| Ashes of the Singularity (2016) | 18.4 | 10.6 | 9 | |
| Doom (2016) | 56.4 | 45.9 | 19.3 | 15.6 |
| Civilization 6 (2016) | 86 | 45.6 | 14.7 | 10.6 |
| For Honor (2017) | 63 | 21 | 18.7 | 15 |
| Ghost Recon Wildlands (2017) | 35.5 | 15.2 | 13 | 3.5 |
| Prey (2017) | 90.9 | 34.7 | 25.3 | 21.3 |
| Team Fortress 2 (2017) | 96 | 91.4 | 68.8 | 62.9 |
| Middle-earth: Shadow of War (2017) | 50 | 18 | 12 | 9 |
| Fortnite (2018) | 84.7 | 33.2 | 19.5 | 15.6 |
| X-Plane 11.11 (2018) | 48.4 | 36.3 | 32.9 | |
| World of Tanks enCore (2018) | 235 | 54.4 | 17.9 | |
| Far Cry 5 (2018) | 31 | 15 | 13 | 12 |
| Anno 1800 (2019) | 24.4 | 8.1 | 4.9 | 2.1 |
| Rage 2 (2019) | 24.5 | 10.2 | 8 | 4.1 |
| Total War: Three Kingdoms (2019) | 61 | 16.6 | 7.9 | 4.9 |
| F1 2019 (2019) | 62 | 25 | 20 | 12 |
Emissions
Fan Noise
The VivoBook 14 never gets excessively loud, although its fan does reach a maximum of 30.5 dB(A) at idle. While this is pleasantly quiet, most people will hear the device in a quiet room if it is running under sustained load, with our review unit peaking at 40.7 dB(A).
Noise level
| Idle |
| 30.5 / 30.5 / 30.5 dB(A) |
| Load |
| 38.2 / 40.2 dB(A) |
 | ||
30 dB silent 40 dB(A) audible 50 dB(A) loud |
||
min: | ||
Temperature
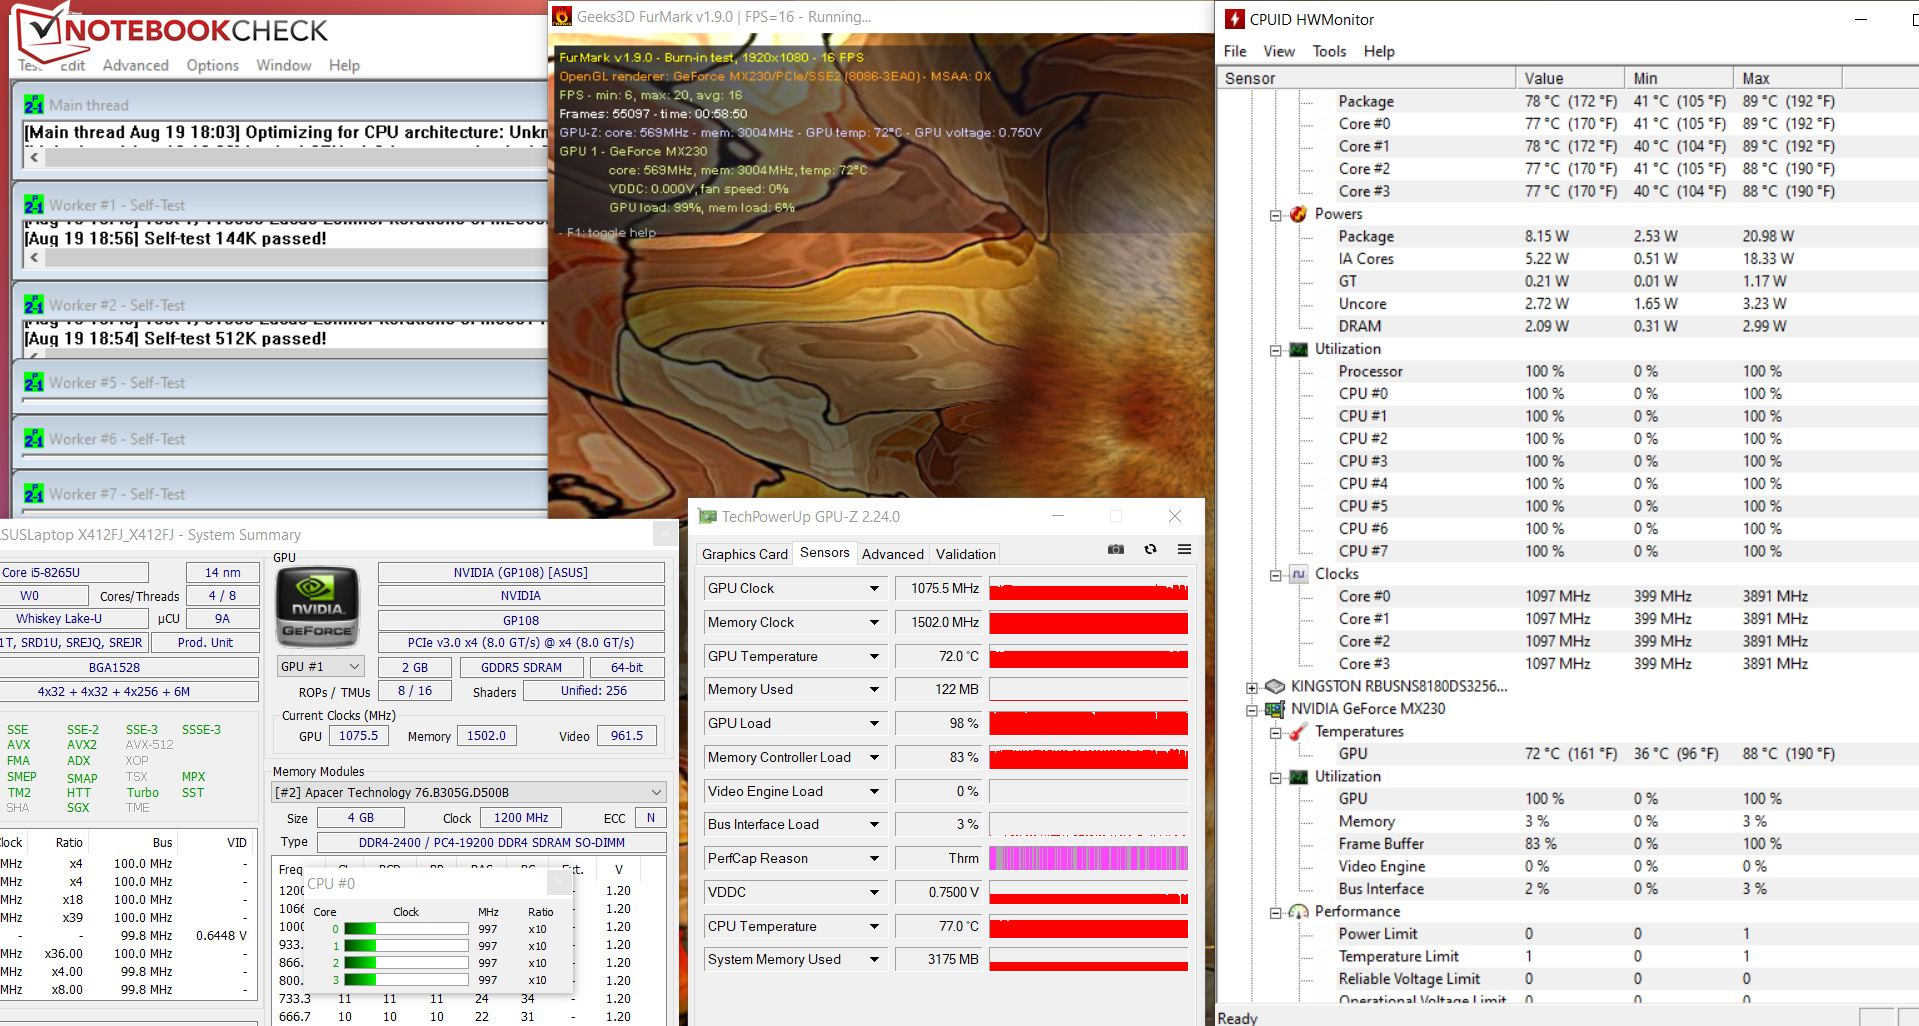
We achieved this maximum fan noise during our stress test, where we ran FurMark and Prime95 simultaneously to see how the system performed under extreme load conditions. CPU and GPU performance in this test depended on whether we had the device connected to the mains, as the system throttles heavily on battery power.
When running our stress test with the VivoBook 14 on mains power, the CPU would initially fluctuate between 1.6 and 2.5 GHz. It eventually downclocked to 1 GHz, but this dropped to 400 MHz when we re-ran our stress test with the machine running on battery power. However, while the GPU fluctuated between 1,000 and 1,100 MHz on mains power, it maintained 1,500 MHz on battery power. Overall, you should not experience such extreme throttling in daily use and even when gaming. Our stress test pushes systems to their limits, which few programs or games also do.
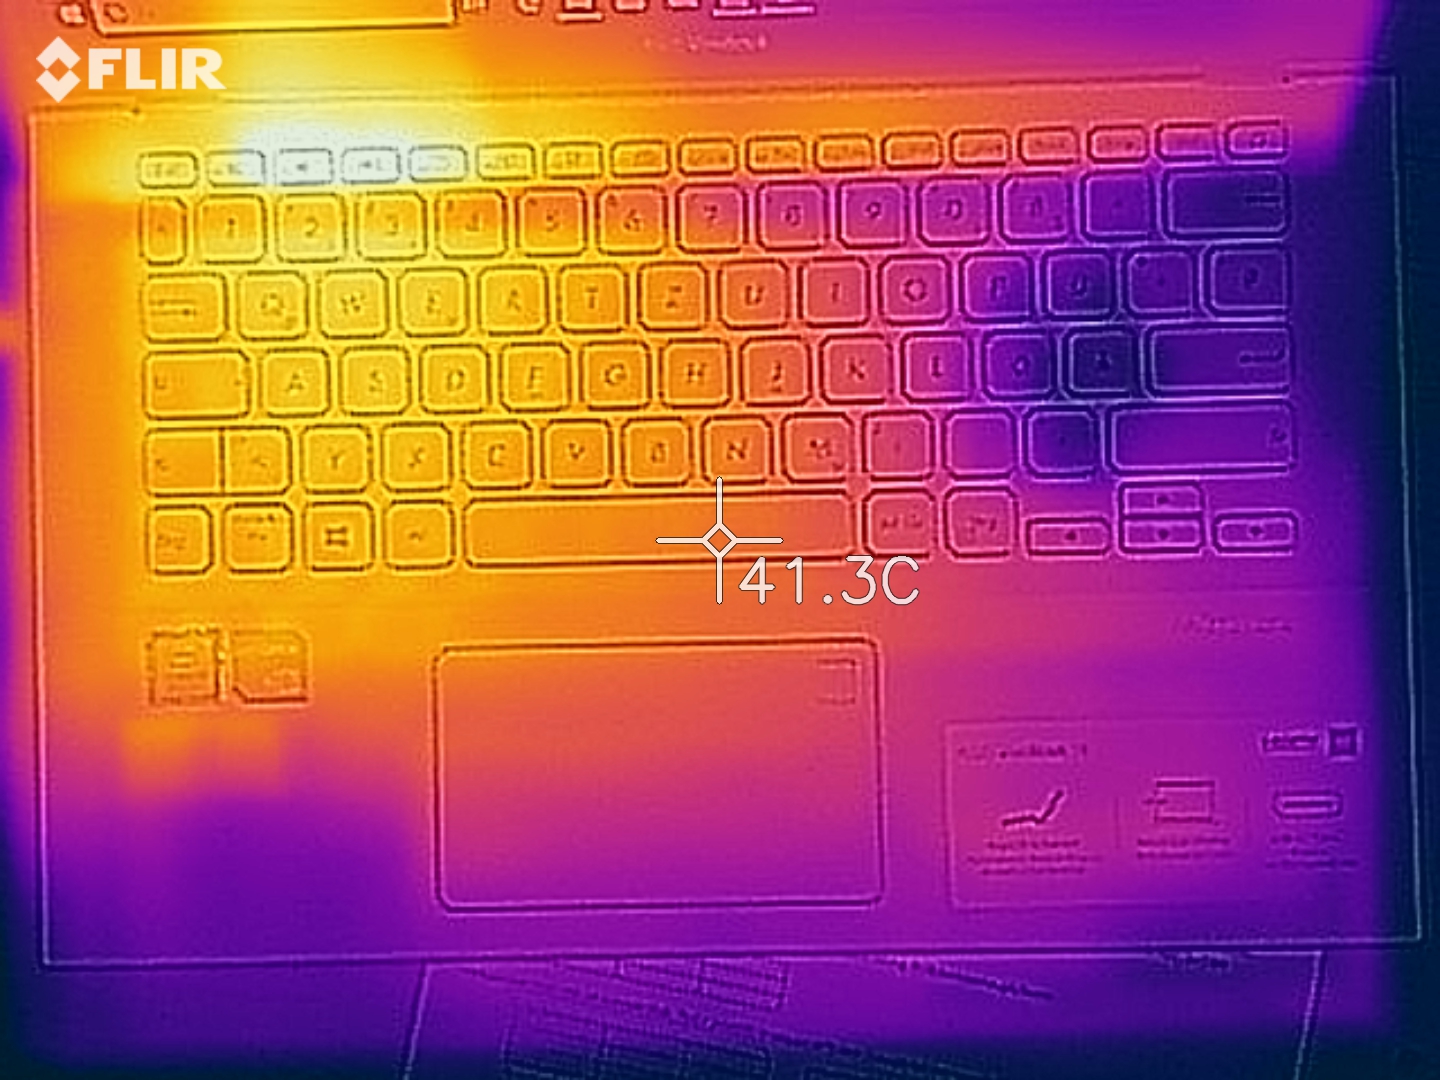
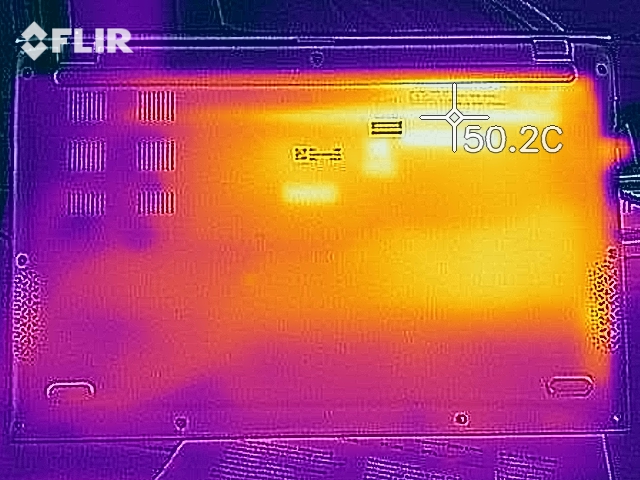
Most of the VivoBook 14 remains pleasantly cool to the touch even under sustained load. A few areas reach 40 °C (104 °F), with one area peaking at 45.2 °C (~113 °F), but most of the device remains below 30 °C (86 °F). Likewise, the device should feel cool to the touch at idle.
(-) The maximum temperature on the upper side is 45.2 °C / 113 F, compared to the average of 36.8 °C / 98 F, ranging from 21 to 71 °C for the class Multimedia.
(±) The bottom heats up to a maximum of 42.7 °C / 109 F, compared to the average of 39.2 °C / 103 F
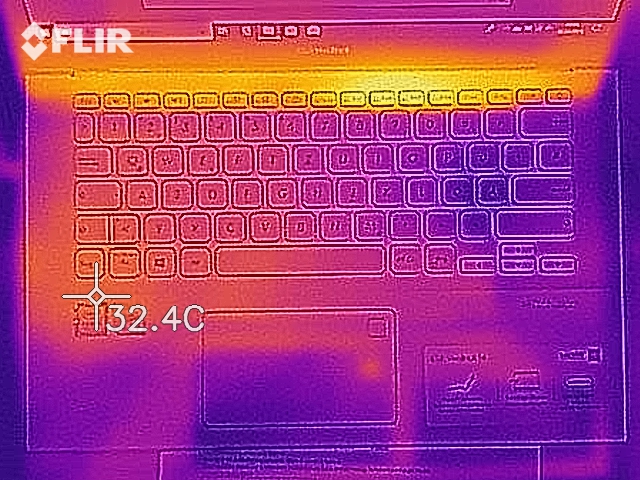
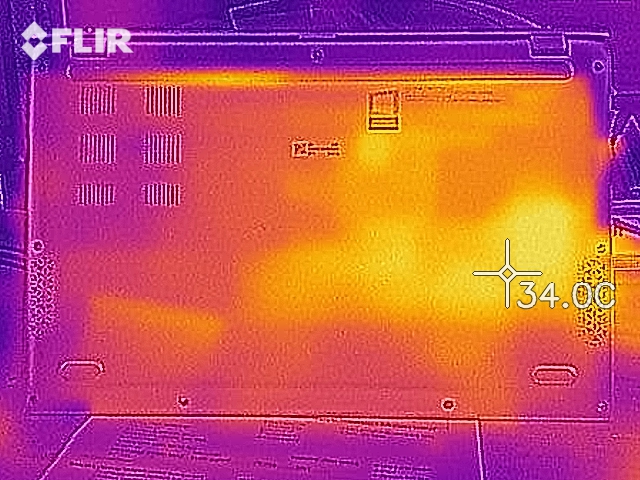
(+) In idle usage, the average temperature for the upper side is 26.4 °C / 80 F, compared to the device average of 31.3 °C / 88 F.
(+) The palmrests and touchpad are cooler than skin temperature with a maximum of 31.6 °C / 88.9 F and are therefore cool to the touch.
(-) The average temperature of the palmrest area of similar devices was 28.7 °C / 83.7 F (-2.9 °C / -5.2 F).
Speakers
Asus VivoBook 14 X412FJ-EB023T audio analysis
(-) | not very loud speakers (60.9 dB)
Bass 100 - 315 Hz
(-) | nearly no bass - on average 19.8% lower than median
(±) | linearity of bass is average (12.5% delta to prev. frequency)
Mids 400 - 2000 Hz
(+) | balanced mids - only 3.7% away from median
(±) | linearity of mids is average (7.1% delta to prev. frequency)
Highs 2 - 16 kHz
(+) | balanced highs - only 2.5% away from median
(±) | linearity of highs is average (7.6% delta to prev. frequency)
Overall 100 - 16.000 Hz
(±) | linearity of overall sound is average (24.4% difference to median)
Compared to same class
» 86% of all tested devices in this class were better, 5% similar, 9% worse
» The best had a delta of 5%, average was 17%, worst was 45%
Compared to all devices tested
» 74% of all tested devices were better, 6% similar, 20% worse
» The best had a delta of 4%, average was 23%, worst was 134%
Power Management
Power Consumption
The VivoBook 14 consumes about as much as we expected from a Core i5-8265U and GeForce MX230 powered laptop. The system consumes a maximum of 7.5 W at idle, which is respectable low, with its power draw peaking at 63 W during our stress tests. ASUS includes a 65 W power supply in the box, which is powerful enough to keep the machine charging even when it is being pushed to its limits.
| Off / Standby | |
| Idle | |
| Load |
|
Key:
min: | |
Battery Life
ASUS equips the VivoBook 14 with a woeful 37 Wh battery that lasted just 5:59 hours in our practical Wi-Fi battery life test. We conduct this test by running a script that simulates the load required to render websites, which we leave on a loop until the machine needs recharging. We also switch off any power-saving features and adjust the display to approximately 150 cd/m².
While all but the F412FJ lasted longer than our review unit in our Wi-Fi battery life test, the latter still matched the class average. You can expect just over 10 hours from the Honor Magicbook though.
Pros
Cons
Verdict
The ASUS VivoBook 14 is a sleek and compact 14-inch laptop that flattered to deceive in our tests. Its quad-core processor and dedicated GPU are powerful enough for all standard applications and even some light gaming, although there are restrictions.
The VivoBook 14 X412FJ is a compact and powerful all-rounder that ASUS has hamstrung on battery power.
Notably, the system throttles heavily when running on battery power, as it does during prolonged periods of stress. Even the GPU falls short of its base clock speed under sustained load, which is disappointing. Likewise, while ASUS has included an SSD, the company has opted for a SATA III drive that is noticeably slower than the PCIe drives found in some of our comparison devices. You could always swap out the SSD should you wish to do so, which would require removing the bottom plate.
Worse still, ASUS has equipped the VivoBook 14 with a pitiful 37 Wh battery, which lasted for under six hours in our practical Wi-Fi battery life test. The display has its positives like its stable viewing angles, matte finish and good colour accuracy, but it is too dim and washed out for our liking.
Moreover, while we always welcome a USB Type-C port, we cannot understand why ASUS chose to omit DisplayPort and Power Delivery support when both would have given the VivoBook 14 added flexibility.
Positively, the VivoBook 14 has a decent keyboard, is comparatively light and has a modern design. Ultimately, the VivoBook 14 X412FJ is a good 14-inch laptop, but there are better alternatives out there, which makes it a tough sell and one that we cannot recommend you buying.
Asus VivoBook 14 X412FJ-EB023T
- 08/25/2019 v6 (old)
Sascha Mölck
Price comparison

