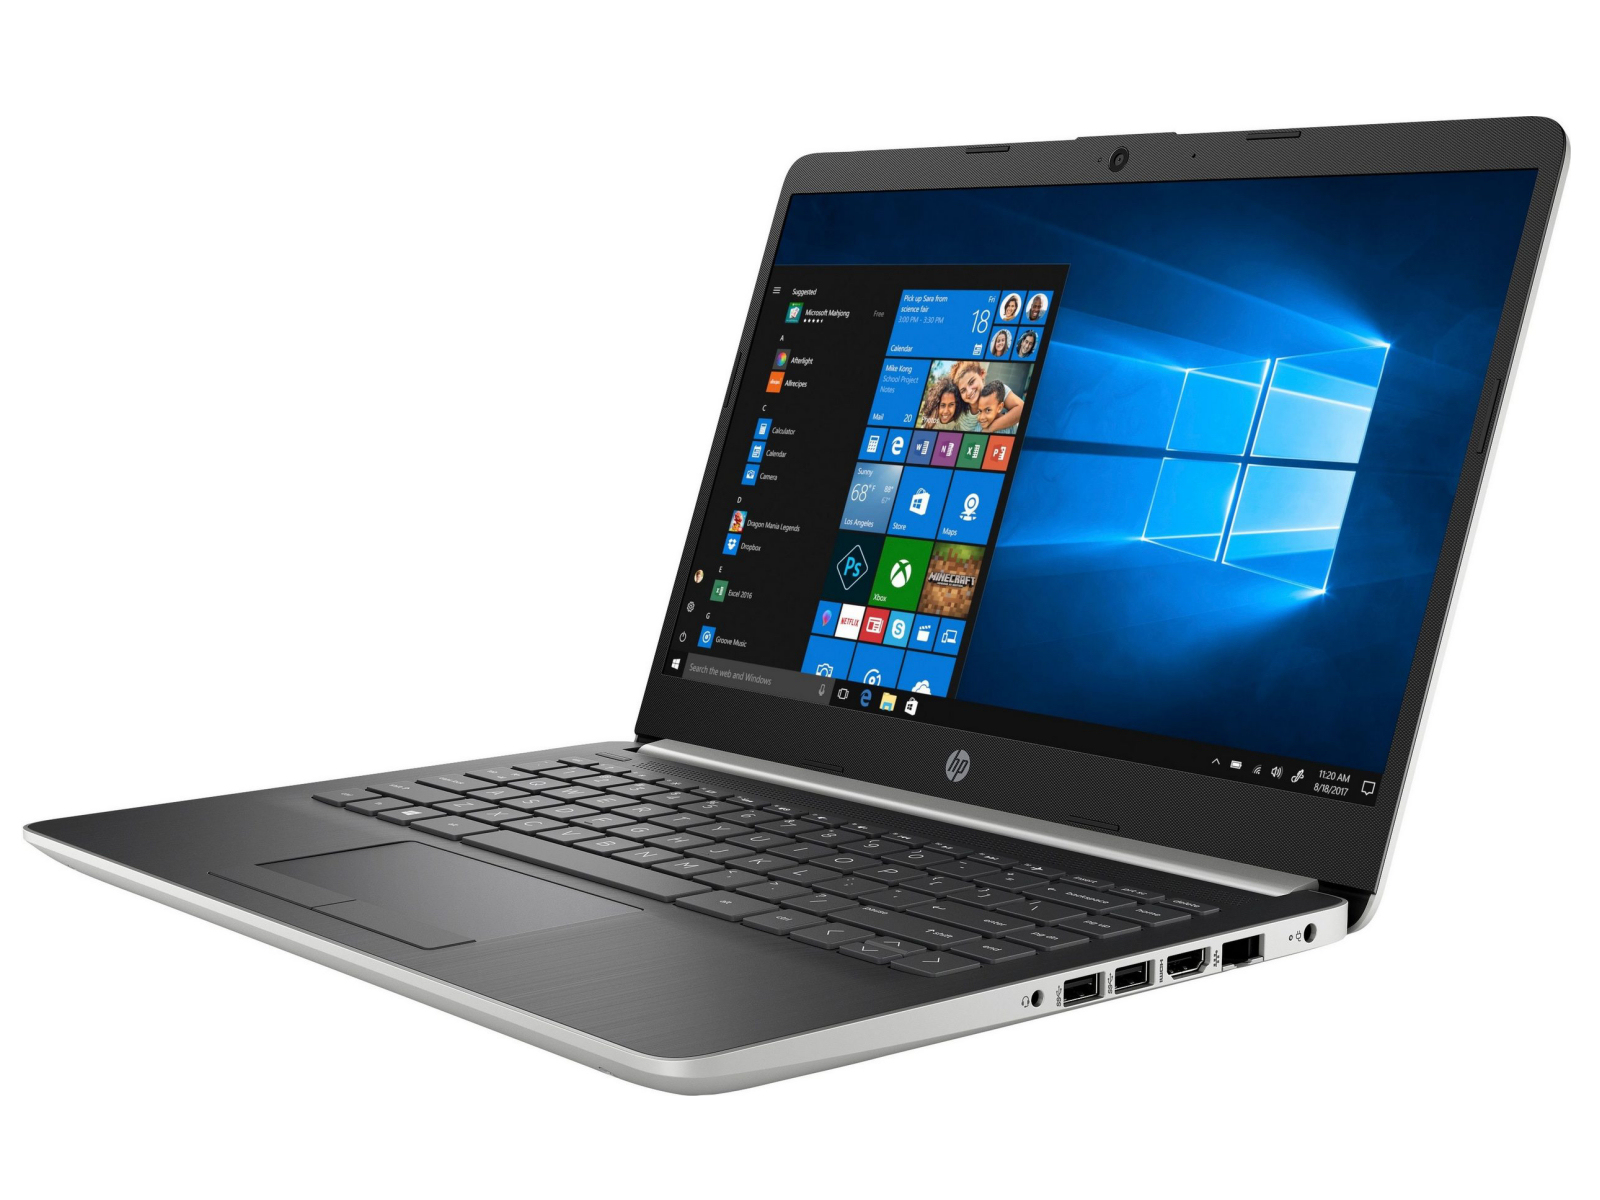
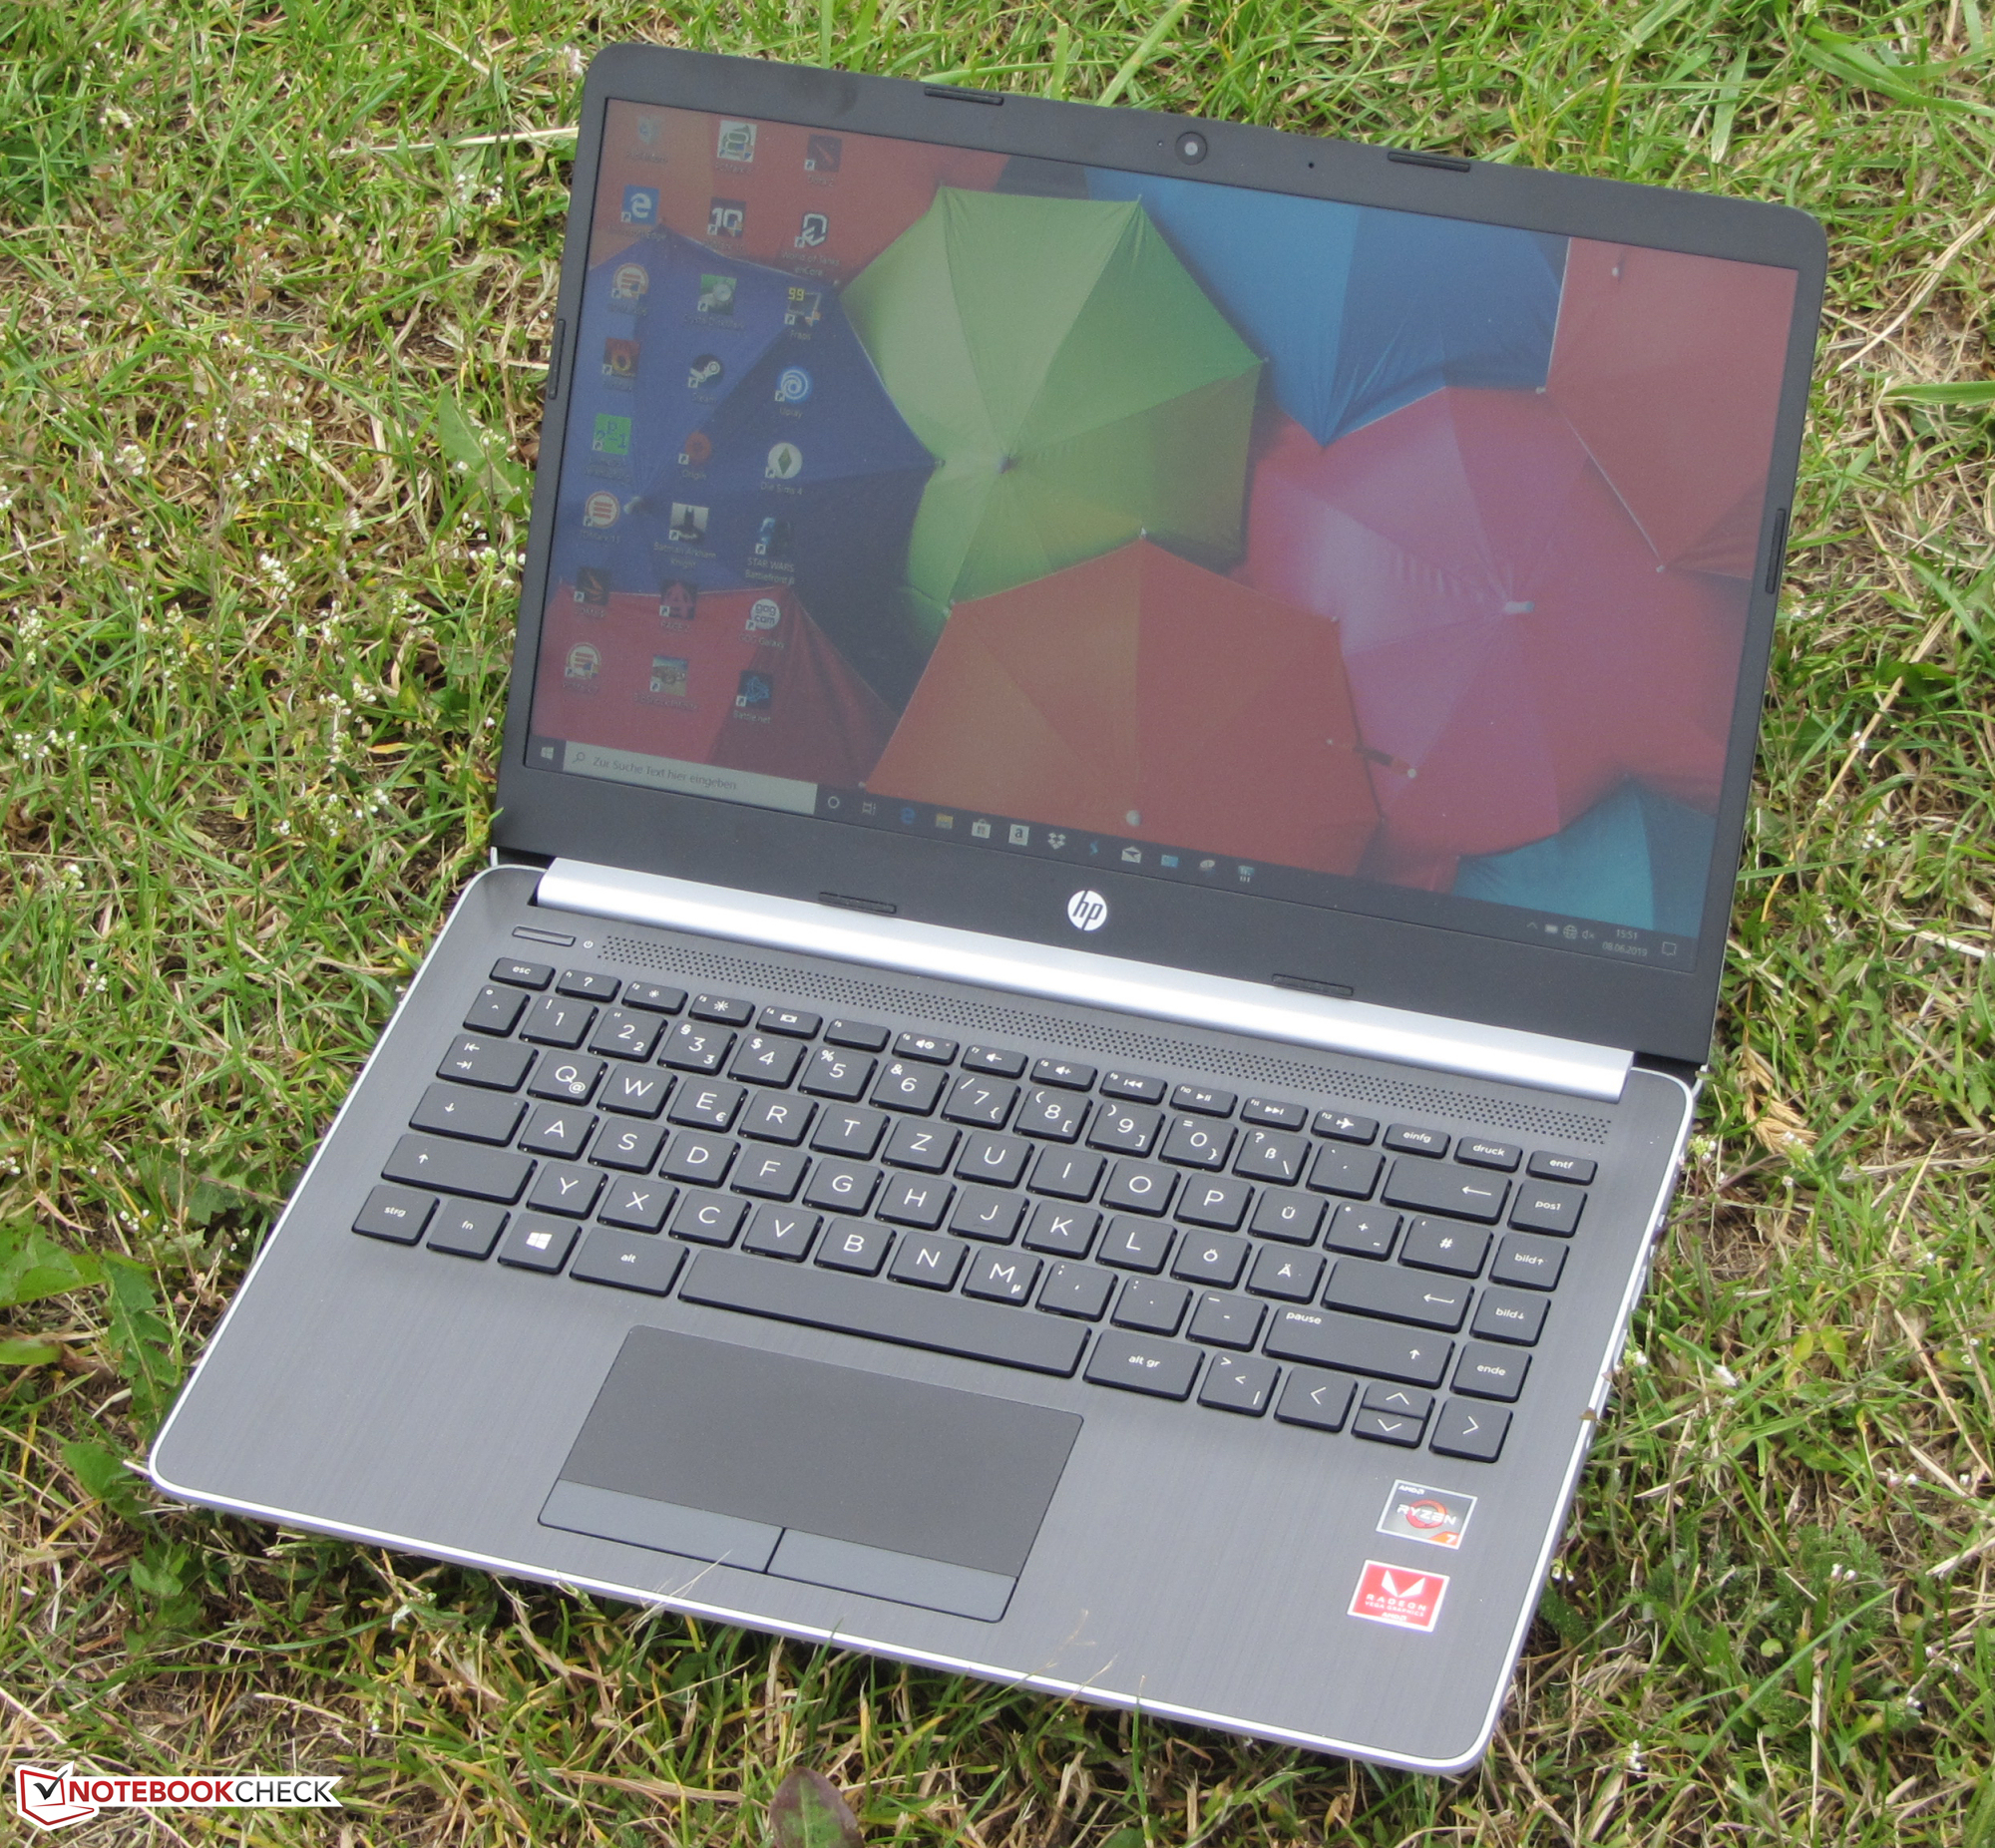
Review of the HP 14: Ryzen 7 3700U-based Laptop with an Engaged Handbrake

The HP 14 product range consists of low-end and mid-tier 14-inch notebooks. Our review model, which retails for 700 Euros (~$783), is one of the most expensive representatives from this series. The device is no stranger to us. We have already reviewed two identically built sibling models. While the other two models were powered by Intel’s CPUs, our current review device comes with an AMD APU. The competing devices include: The Asus VivoBook 14 F412FJ, the Lenovo IdeaPad S340-14IWL, the Huawei MateBook D 14 W00D, and the Acer Swift 3 SF314-55-31N8.
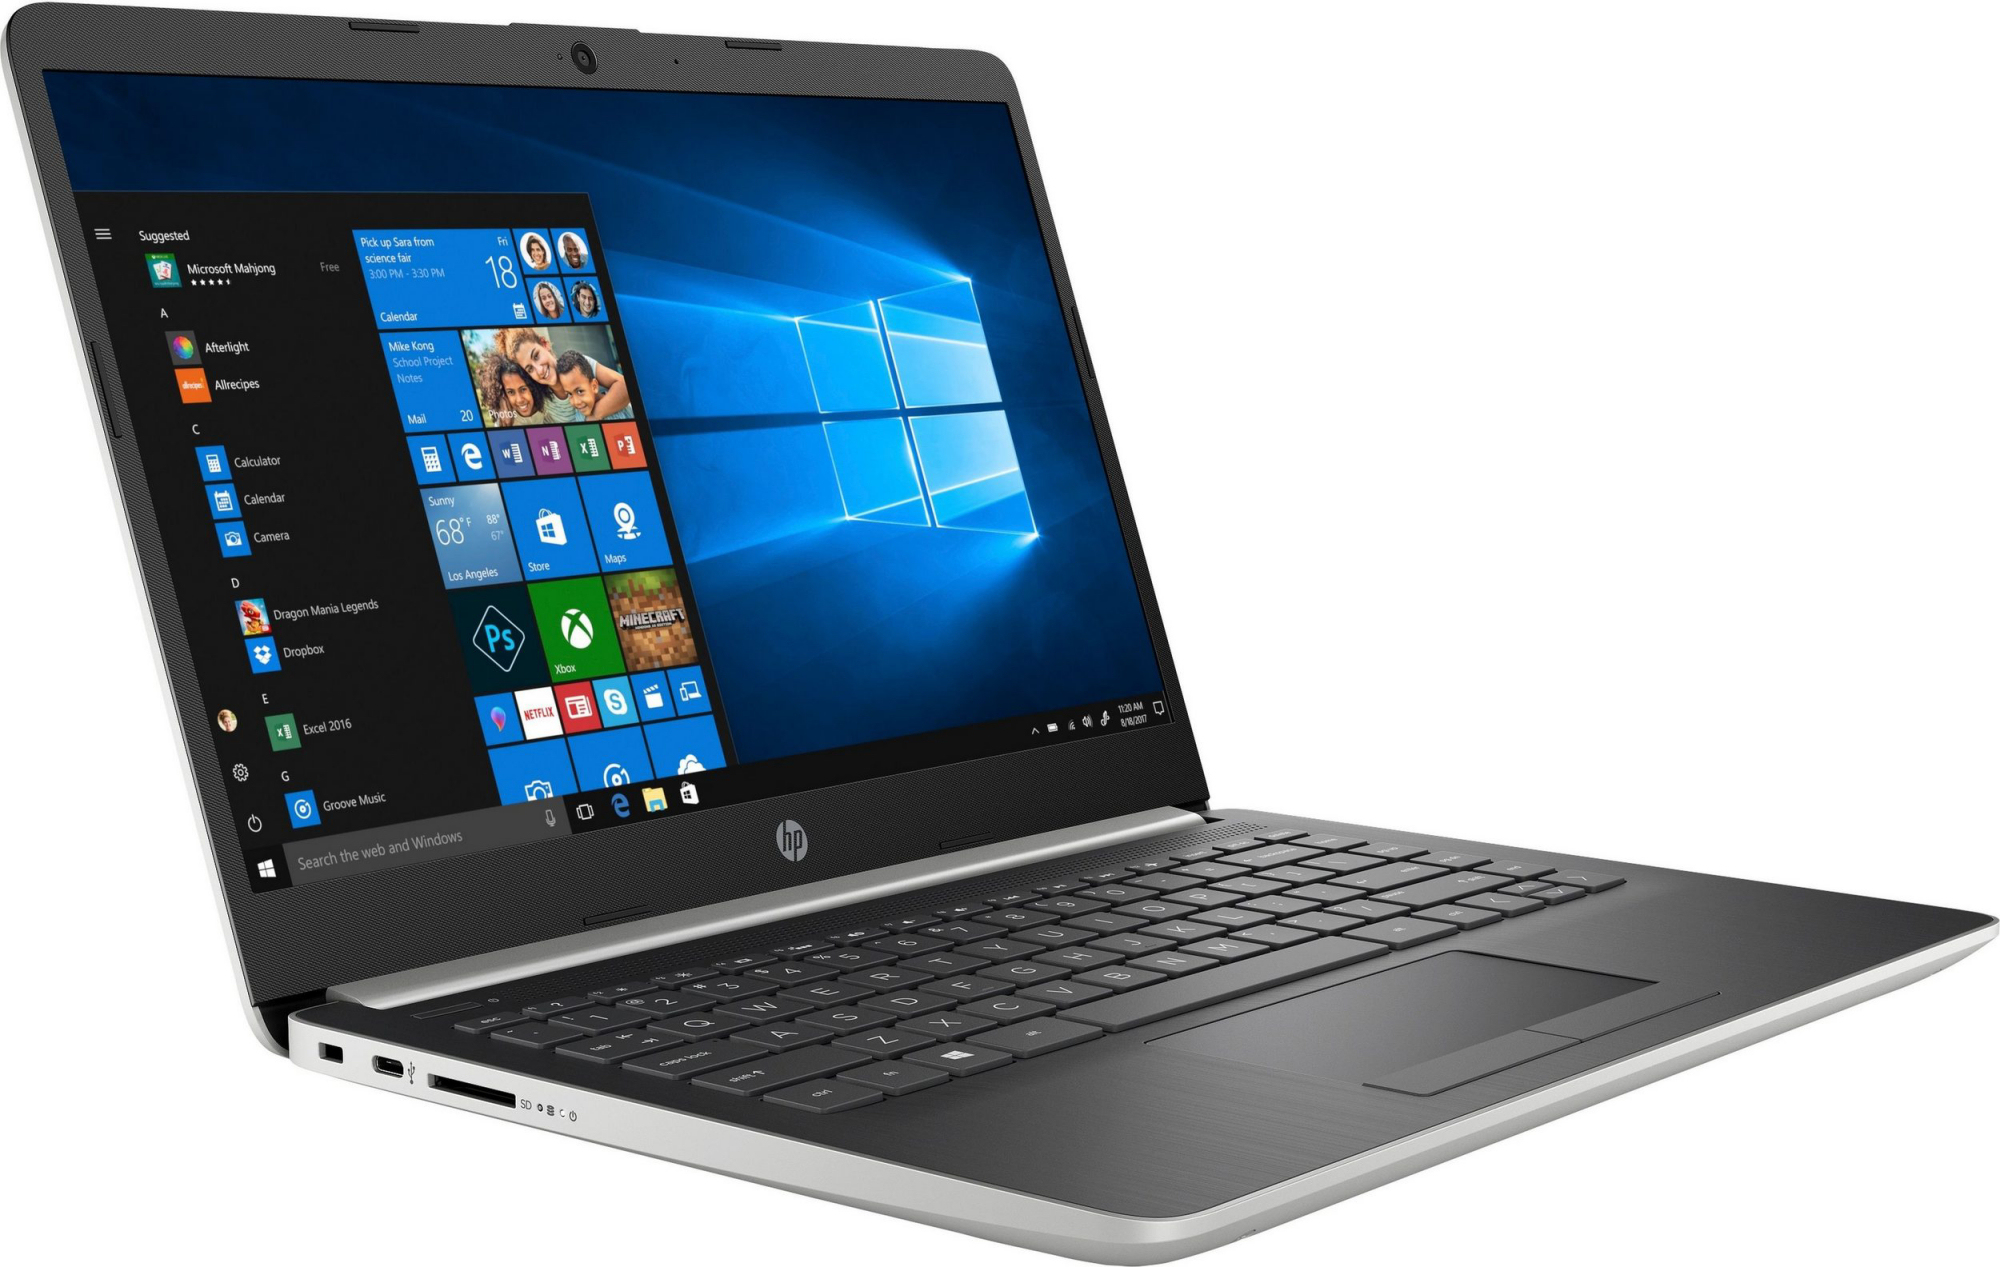
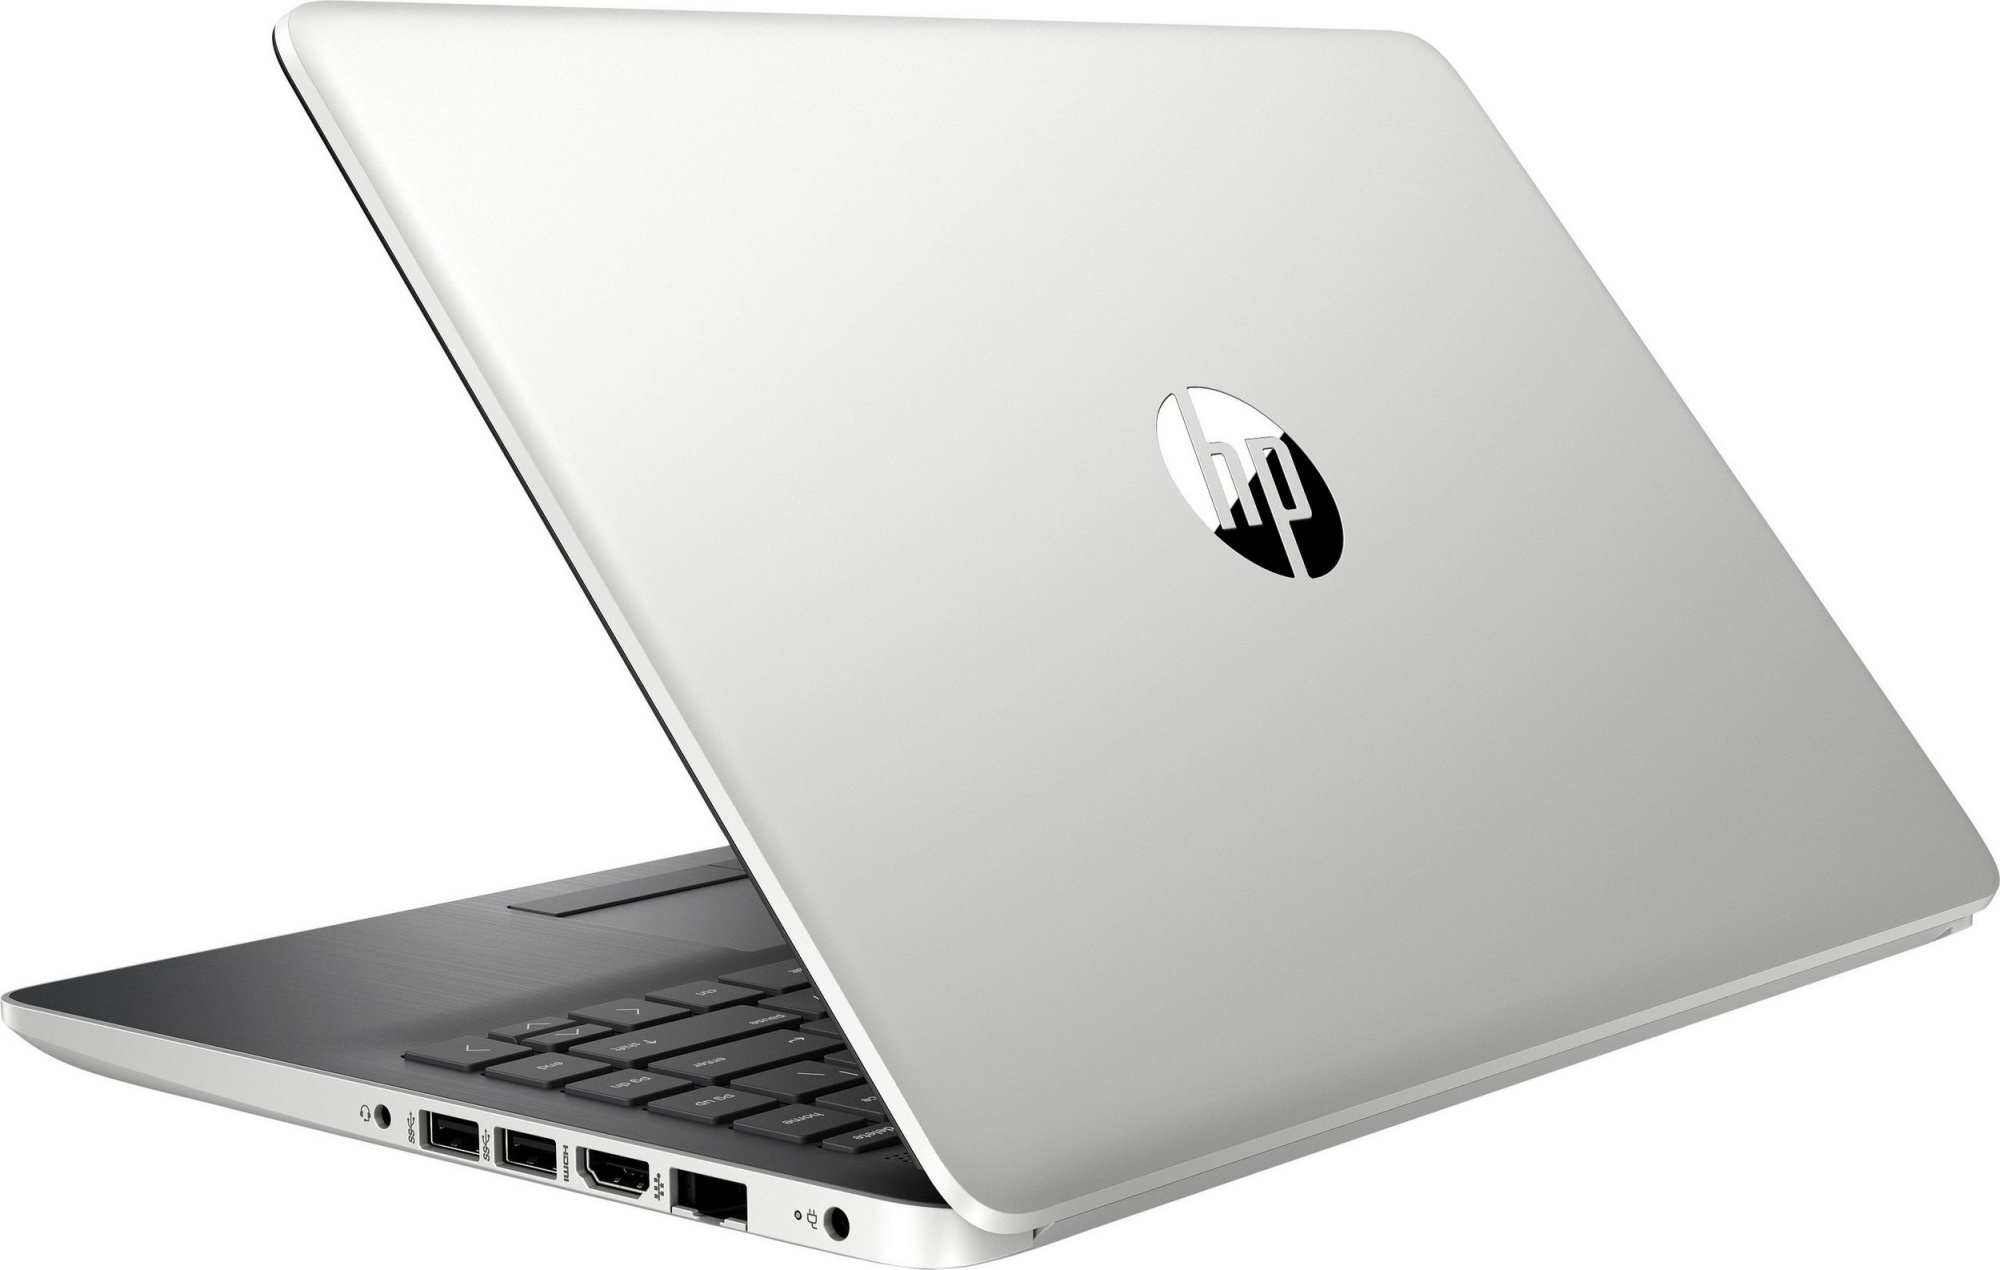
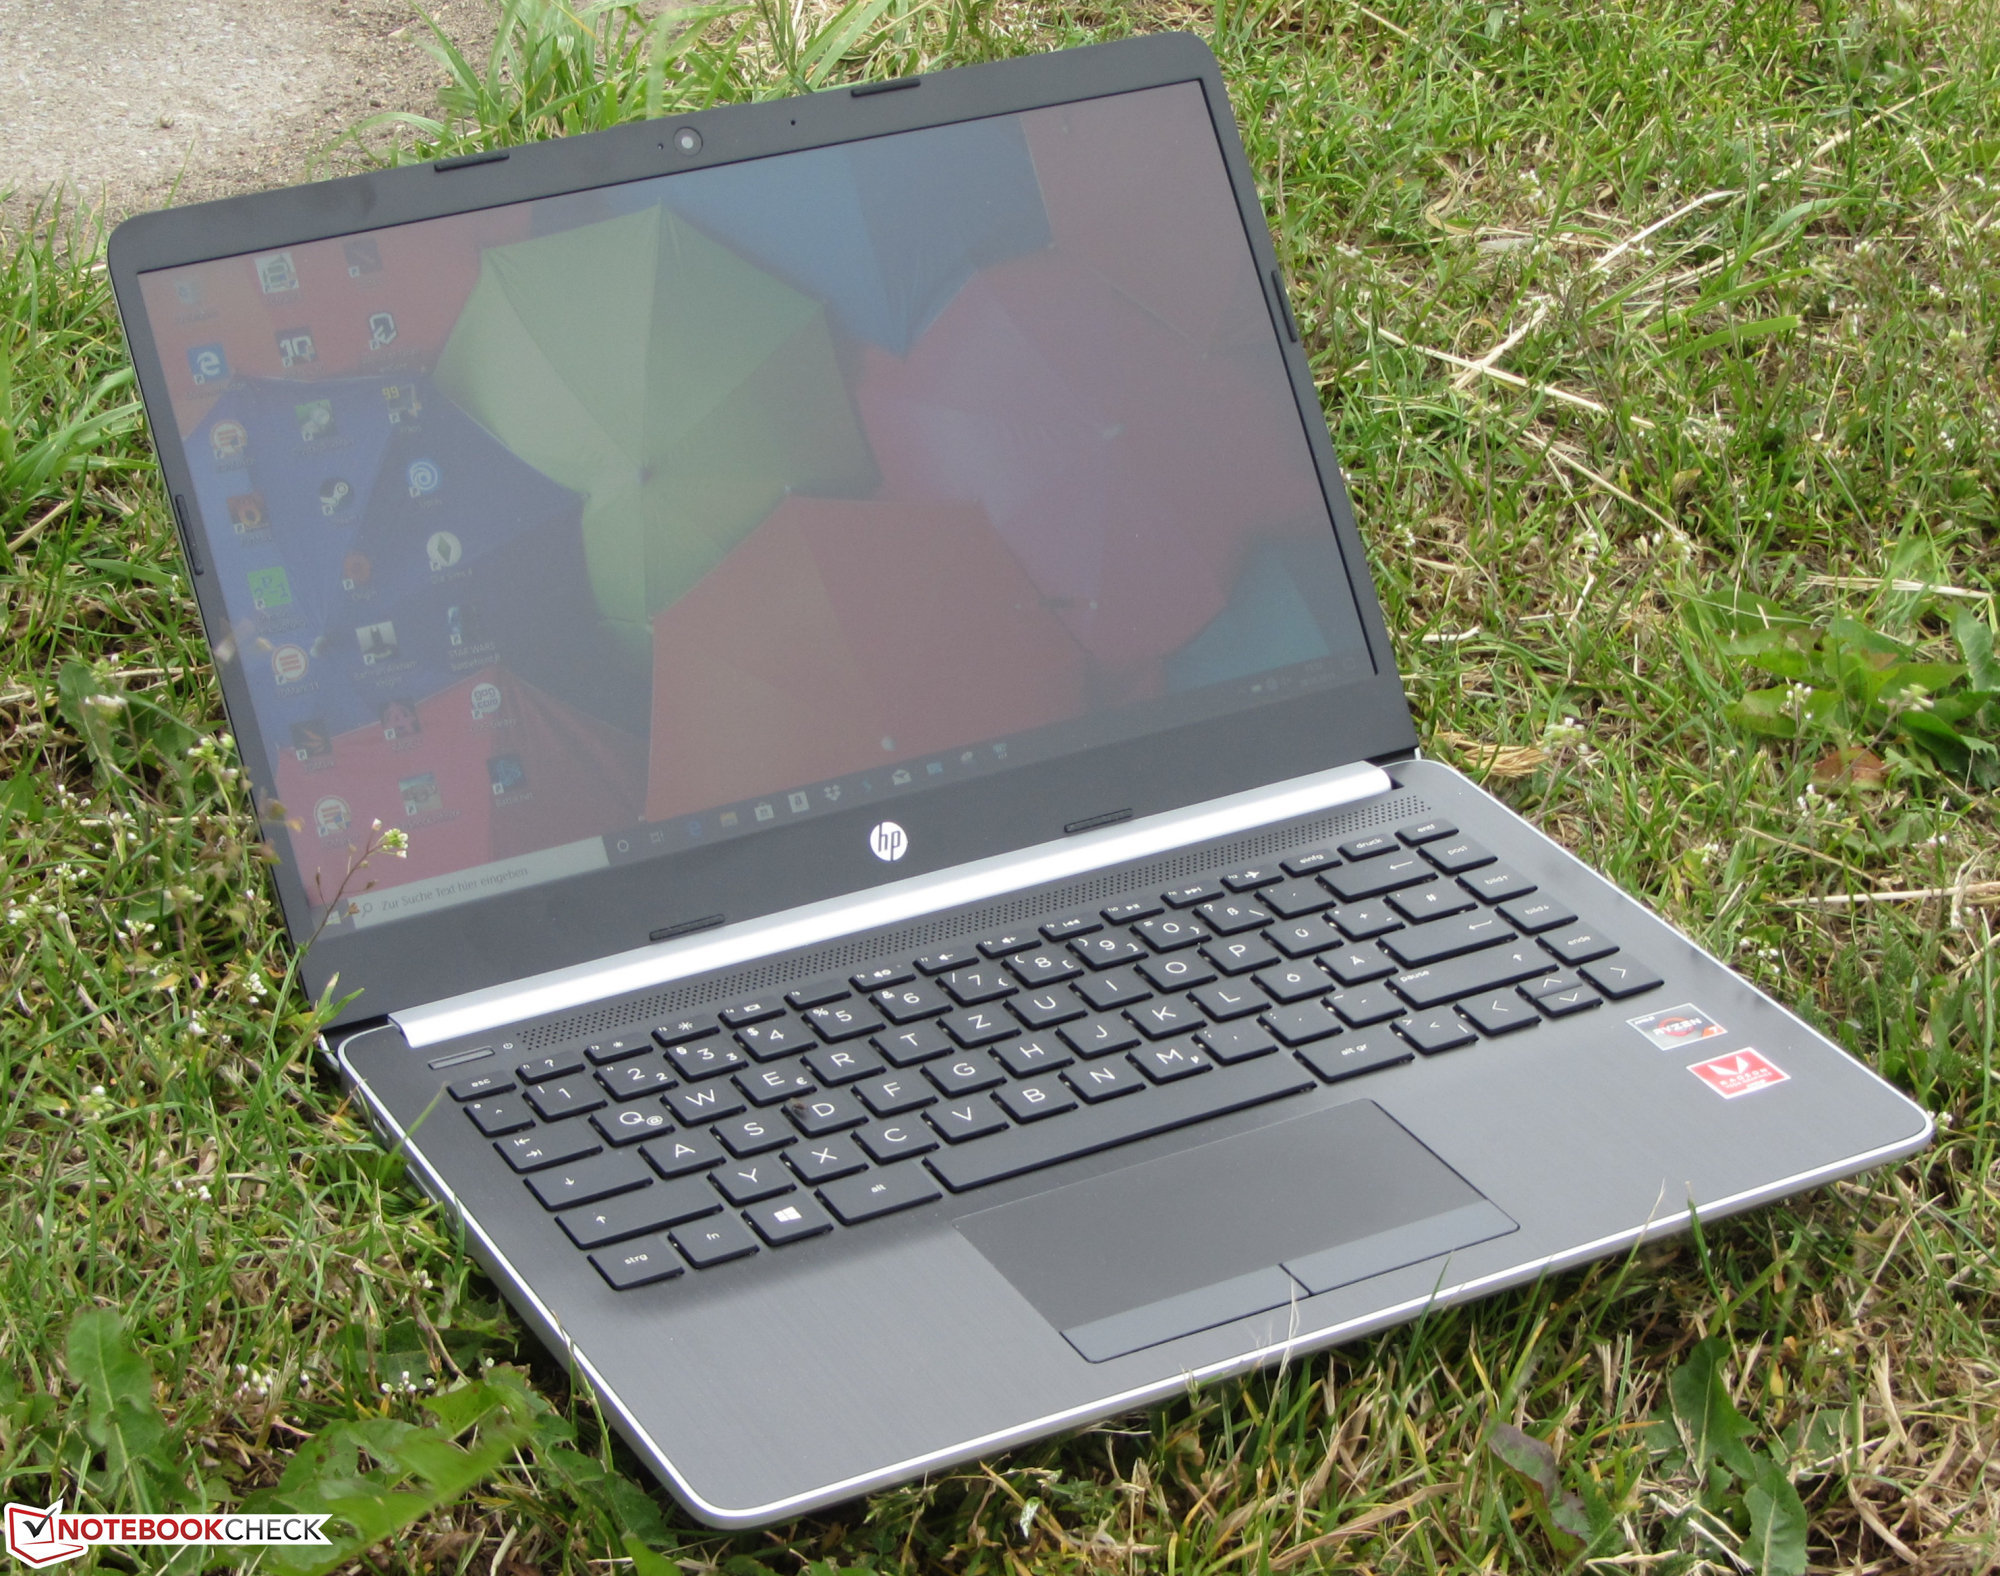
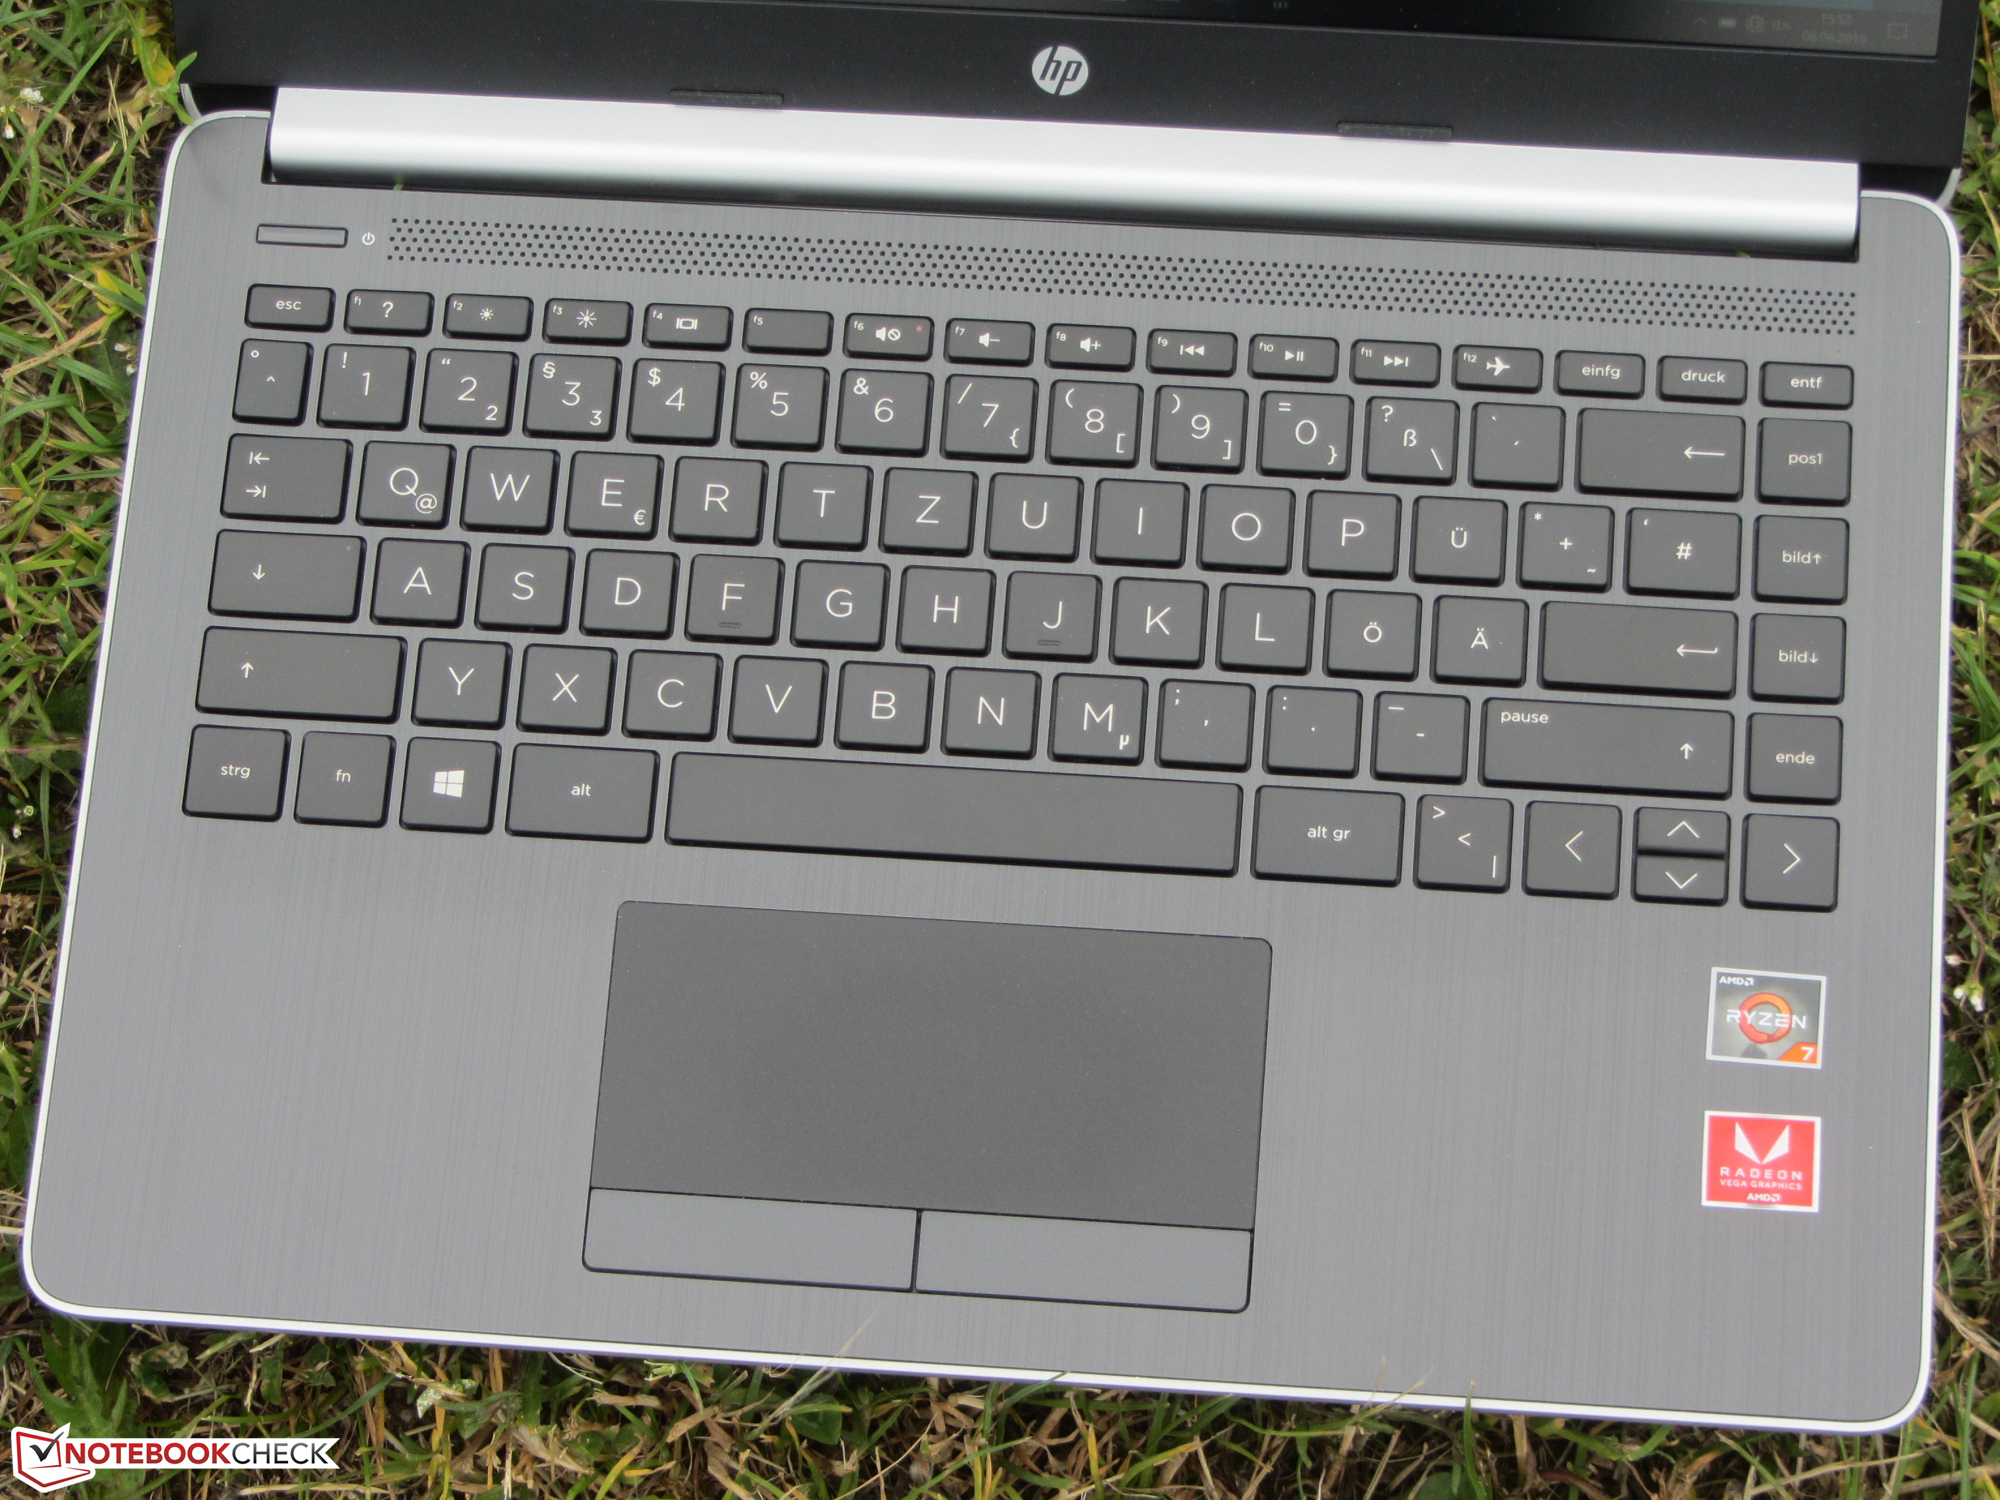
Because all three HP 14 models are identically built, we shall skip the sections that deal with the case, connectivity, input devices and the speakers. You can find all the relevant information in the reviews of the HP 14-bq001ng and the HP 14-ma0312ng.
| SD Card Reader | |
| average JPG Copy Test (av. of 3 runs) | |
| Lenovo Ideapad S340-14IWL-81N70056GE (Toshiba Exceria Pro SDXC 64 GB UHS-II) | |
| Average of class Office (19.8 - 198.5, n=22, last 2 years) | |
| HP 14-dk0008ng (Toshiba Exceria Pro SDXC 64 GB UHS-II) | |
| Acer Swift 3 SF314-55-31N8 (Toshiba Exceria Pro SDXC 64 GB UHS-II) | |
| HP 14-ma0312ng (Toshiba Exceria Pro SDXC 64 GB UHS-II) | |
| Lenovo V330-14IKB-81B0004MGE (Toshiba Exceria Pro SDXC 64 GB UHS-II) | |
| Asus VivoBook 14 F412FJ-EB084T (Toshiba Exceria Pro M501 microSDXC 64GB) | |
| maximum AS SSD Seq Read Test (1GB) | |
| Lenovo Ideapad S340-14IWL-81N70056GE (Toshiba Exceria Pro SDXC 64 GB UHS-II) | |
| Average of class Office (27.4 - 249, n=21, last 2 years) | |
| HP 14-dk0008ng (Toshiba Exceria Pro SDXC 64 GB UHS-II) | |
| Acer Swift 3 SF314-55-31N8 (Toshiba Exceria Pro SDXC 64 GB UHS-II) | |
| Lenovo V330-14IKB-81B0004MGE (Toshiba Exceria Pro SDXC 64 GB UHS-II) | |
| HP 14-ma0312ng (Toshiba Exceria Pro SDXC 64 GB UHS-II) | |
| Asus VivoBook 14 F412FJ-EB084T (Toshiba Exceria Pro M501 microSDXC 64GB) | |
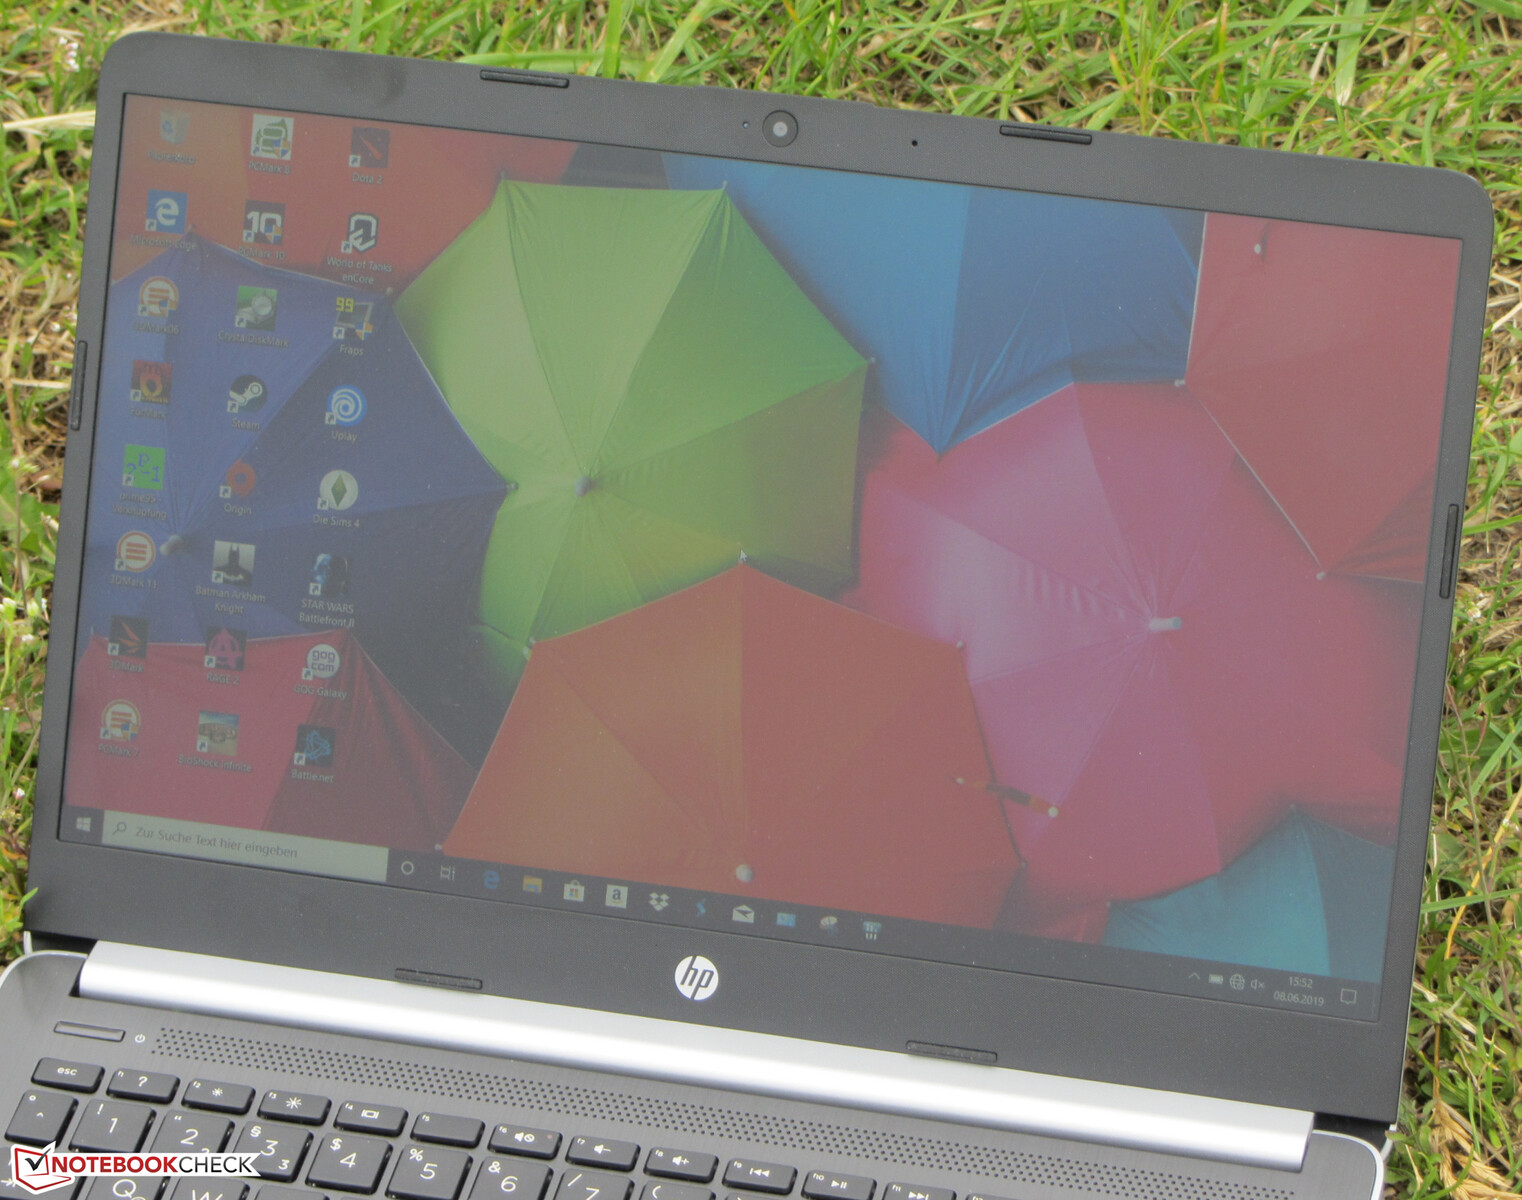
Display - The HP 14 has an IPS screen
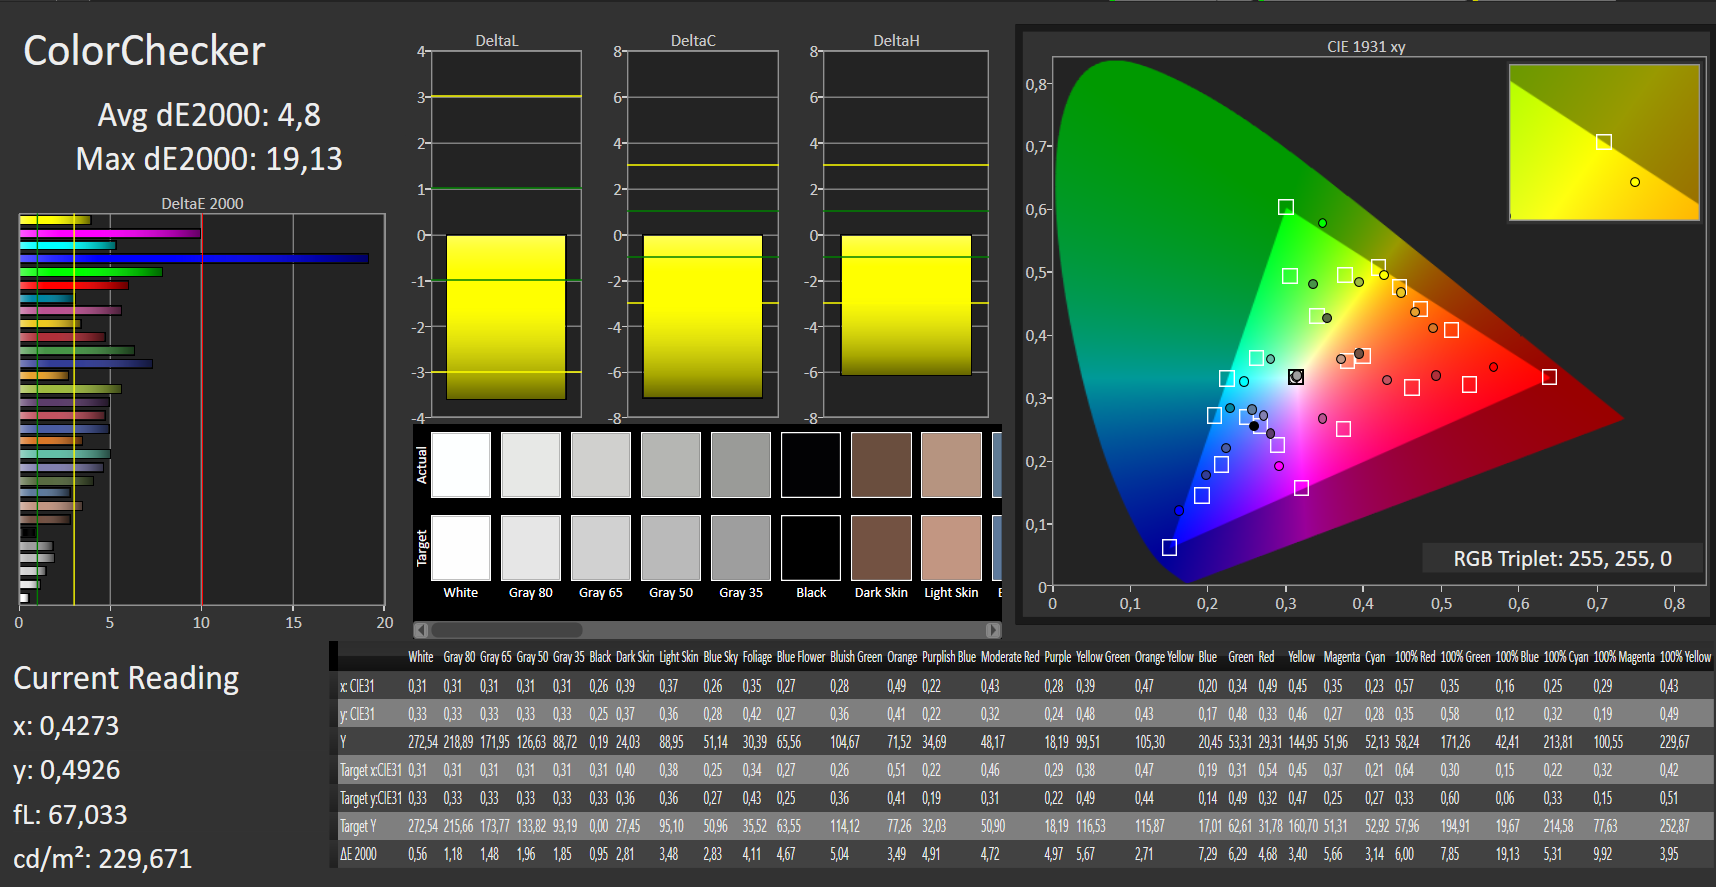
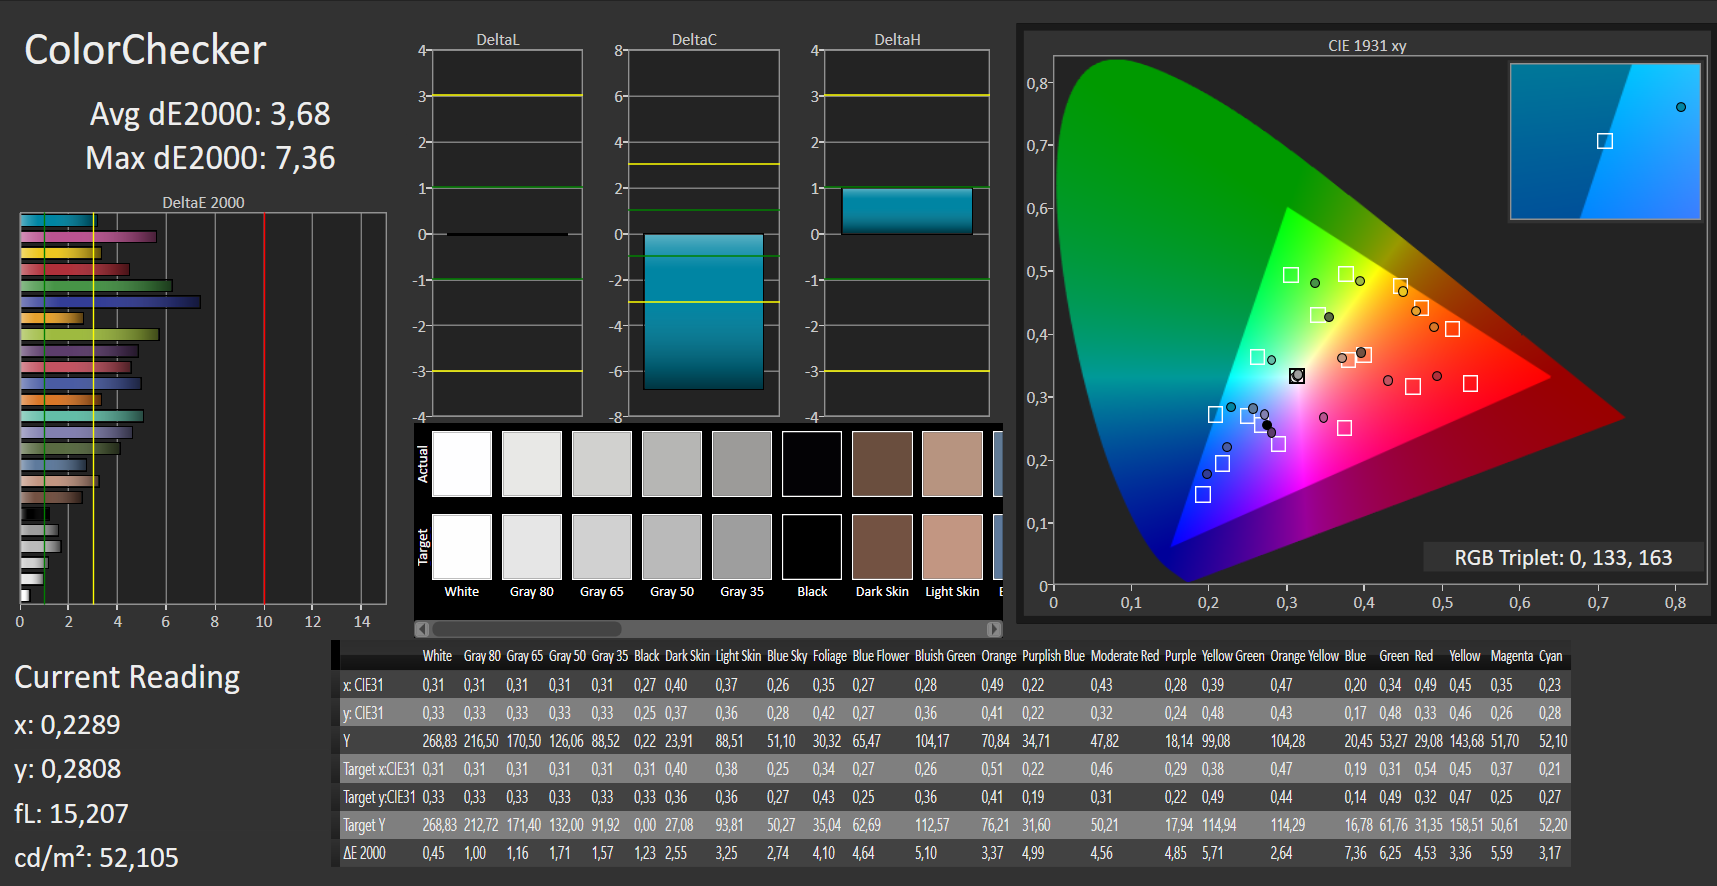
The 14-inch display of our review device has a native resolution of 1920x1080. While the contrast ratio of 1345:1 is quite good, the screen brightness of 256.9 cd/m² is just too low. Here we usually see a screen brightness of at least 300 cd/m² and a contrast ratio of at least 1000:1. That being said, the competitors of the HP 14 do not have very bright displays, either. Positive: The screen does not suffer from PWM flickering.

| |||||||||||||||||||||||||
Brightness Distribution: 89 %
Center on Battery: 269 cd/m²
Contrast: 1345:1 (Black: 0.2 cd/m²)
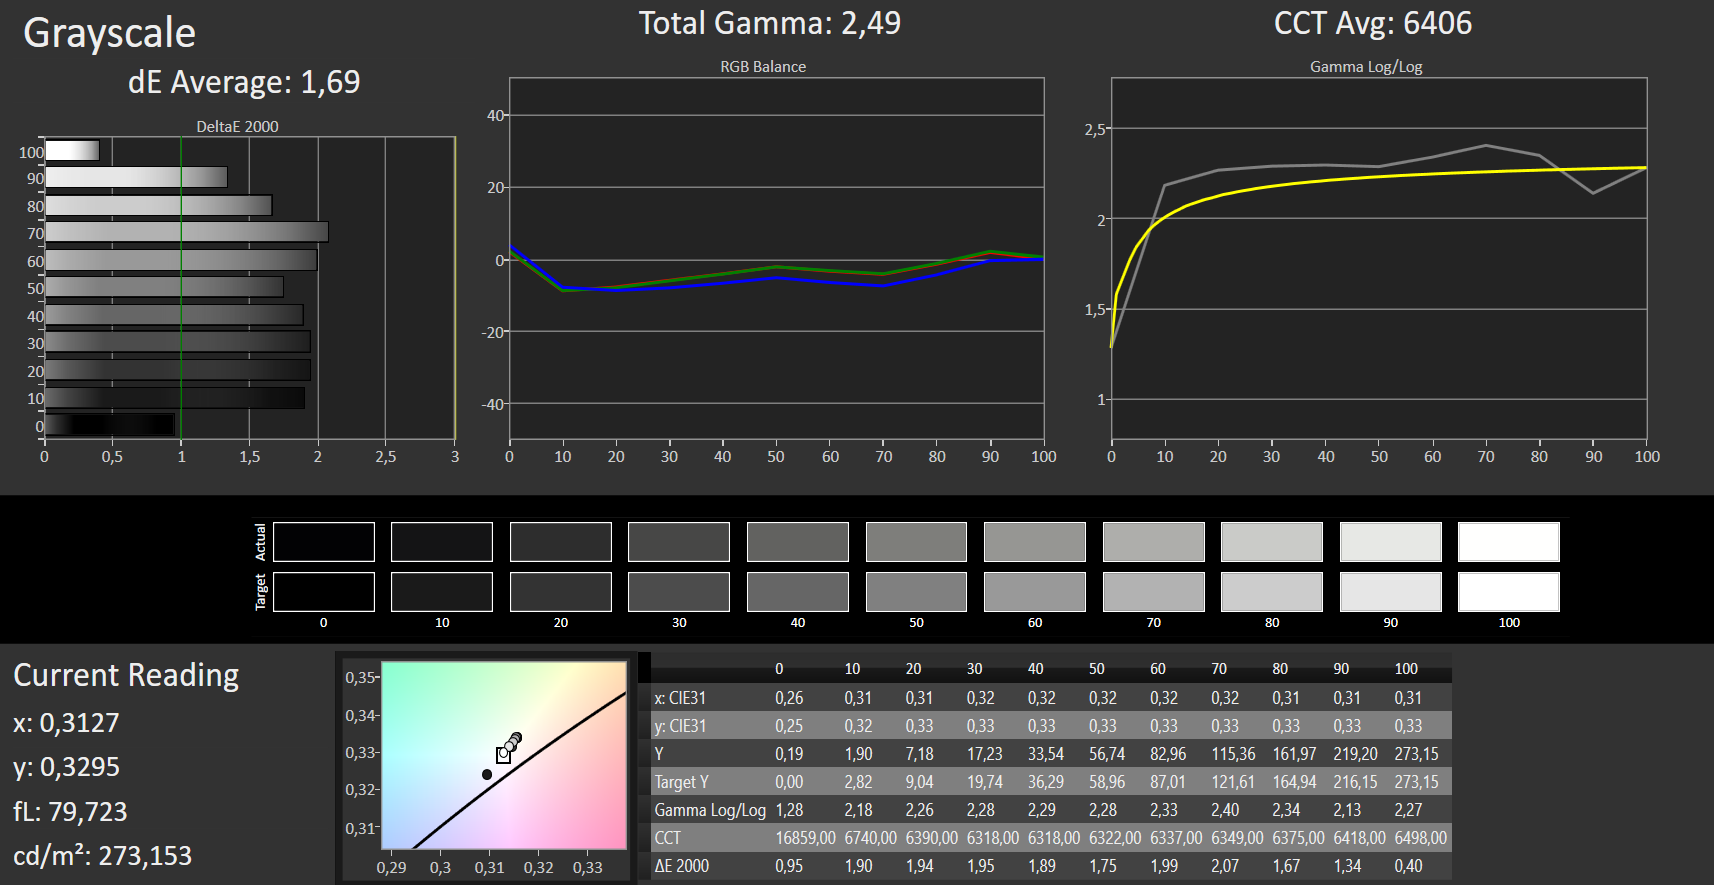
ΔE ColorChecker Calman: 3.68 | ∀{0.5-29.43 Ø4.72}
calibrated: 4.8
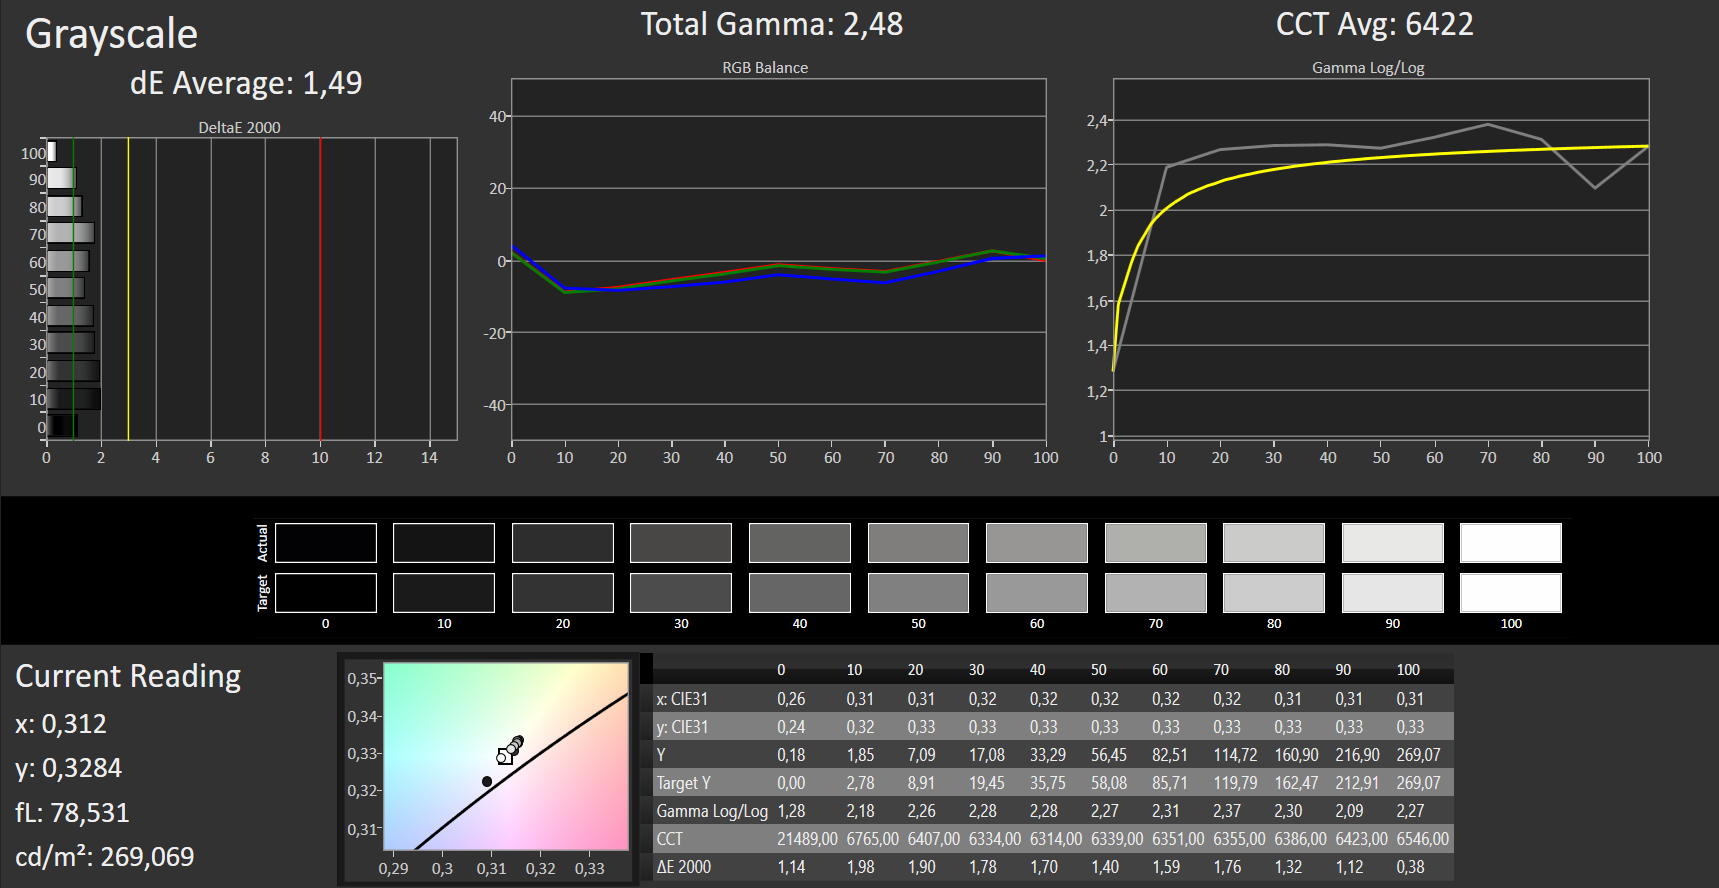
ΔE Greyscale Calman: 1.69 | ∀{0.09-98 Ø4.97}
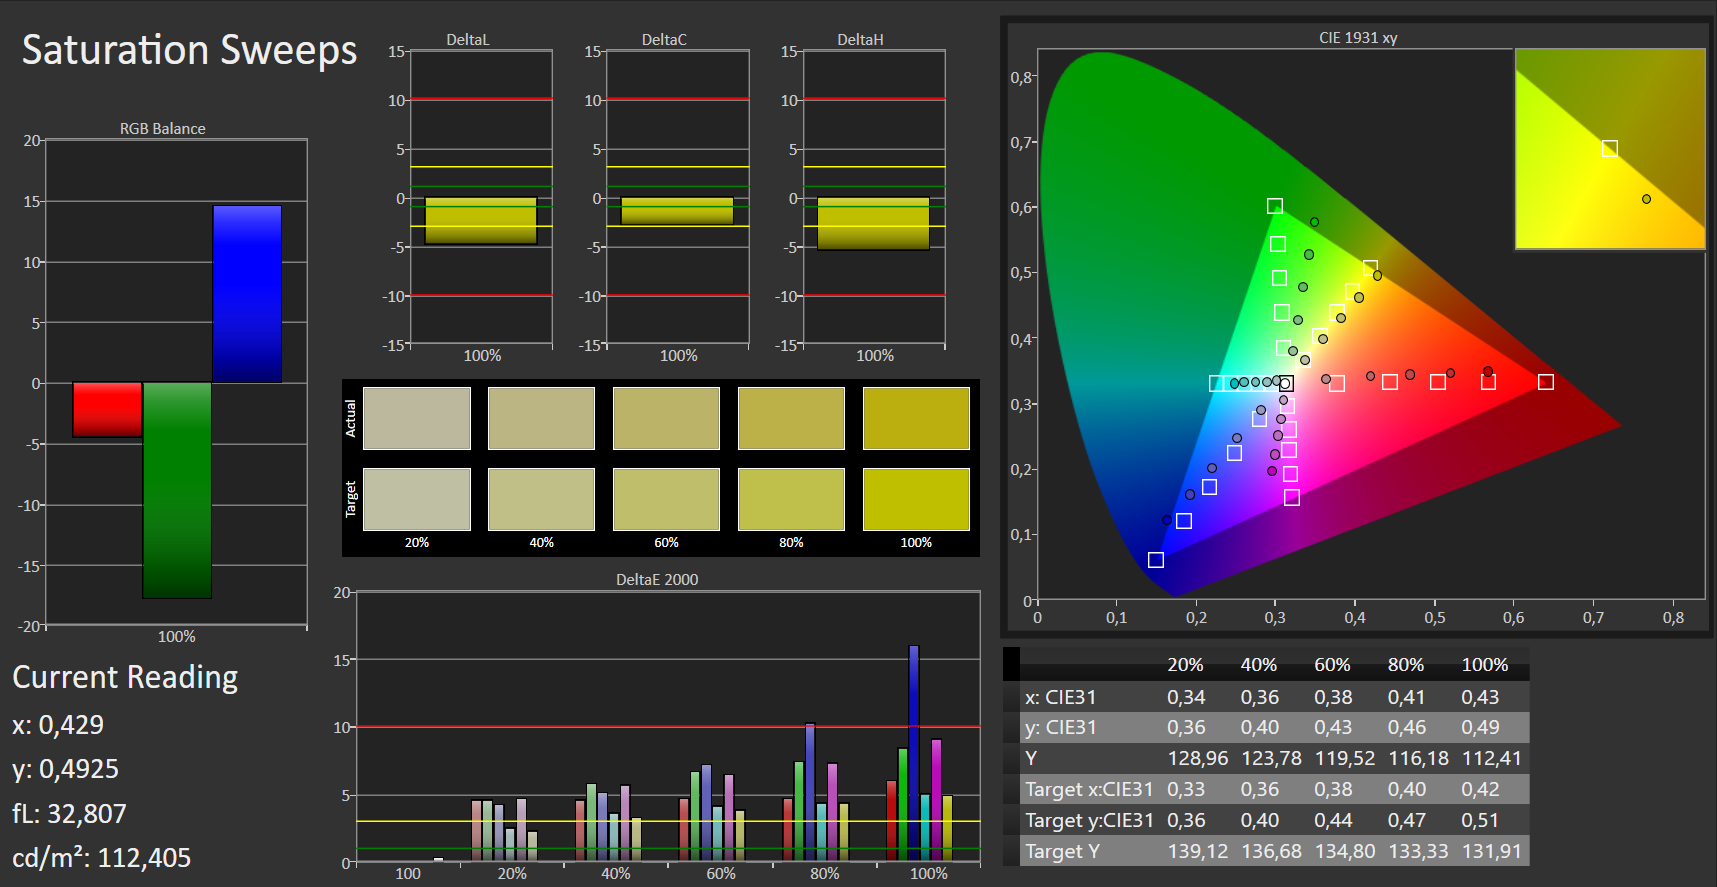
59% sRGB (Argyll 1.6.3 3D)
38% AdobeRGB 1998 (Argyll 1.6.3 3D)
40.84% AdobeRGB 1998 (Argyll 3D)
59.1% sRGB (Argyll 3D)
39.53% Display P3 (Argyll 3D)
Gamma: 2.49
CCT: 6406 K
| HP 14-dk0008ng IPS, 1920x1080, 14" | HP 14-ma0312ng TN LED, 1366x768, 14" | Huawei MateBook D 14 W00D-53010GXL IPS, 1920x1080, 14" | Asus VivoBook 14 F412FJ-EB084T IPS, 1920x1080, 14" | Acer Swift 3 SF314-55-31N8 IPS, 1920x1080, 14" | Lenovo Ideapad S340-14IWL-81N70056GE IPS, 1920x1080, 14" | Lenovo V330-14IKB-81B0004MGE LED, 1920x1080, 14" | |
|---|---|---|---|---|---|---|---|
| Display | -1% | 11% | 0% | 66% | -3% | 5% | |
| Display P3 Coverage (%) | 39.53 | 39.31 -1% | 44.26 12% | 39.71 0% | 66.2 67% | 38.41 -3% | 41.47 5% |
| sRGB Coverage (%) | 59.1 | 59.2 0% | 65.1 10% | 59.6 1% | 98.3 66% | 57.8 -2% | 61.4 4% |
| AdobeRGB 1998 Coverage (%) | 40.84 | 40.61 -1% | 45.73 12% | 41.04 0% | 67.8 66% | 39.68 -3% | 42.98 5% |
| Response Times | 18% | -17% | -6% | -10% | 3% | 24% | |
| Response Time Grey 50% / Grey 80% * (ms) | 38 ? | 40 ? -5% | 42.4 ? -12% | 40 ? -5% | 41 ? -8% | 36 ? 5% | 41 ? -8% |
| Response Time Black / White * (ms) | 27 ? | 16 ? 41% | 32.8 ? -21% | 29 ? -7% | 30 ? -11% | 27 ? -0% | 12 ? 56% |
| PWM Frequency (Hz) | 198.4 ? | 25000 ? | 350 ? | ||||
| Screen | -152% | -26% | 0% | -14% | -39% | -122% | |
| Brightness middle (cd/m²) | 269 | 240 -11% | 287 7% | 267 -1% | 291 8% | 260 -3% | 225 -16% |
| Brightness (cd/m²) | 257 | 216 -16% | 276 7% | 257 0% | 276 7% | 250 -3% | 216 -16% |
| Brightness Distribution (%) | 89 | 84 -6% | 86 -3% | 91 2% | 90 1% | 87 -2% | 79 -11% |
| Black Level * (cd/m²) | 0.2 | 0.56 -180% | 0.25 -25% | 0.2 -0% | 0.27 -35% | 0.29 -45% | 0.52 -160% |
| Contrast (:1) | 1345 | 429 -68% | 1148 -15% | 1335 -1% | 1078 -20% | 897 -33% | 433 -68% |
| Colorchecker dE 2000 * | 3.68 | 13.14 -257% | 5.4 -47% | 3.79 -3% | 3.86 -5% | 6.29 -71% | 10.58 -188% |
| Colorchecker dE 2000 max. * | 7.36 | 21.06 -186% | 18.1 -146% | 8.18 -11% | 8.26 -12% | 14.77 -101% | 18.52 -152% |
| Colorchecker dE 2000 calibrated * | 4.8 | 12.71 -165% | 5 -4% | 4.71 2% | 4.51 6% | ||
| Greyscale dE 2000 * | 1.69 | 14.89 -781% | 3.1 -83% | 1.49 12% | 5.33 -215% | 4.65 -175% | 12.41 -634% |
| Gamma | 2.49 88% | 2.62 84% | 1.99 111% | 2.48 89% | 2.25 98% | 2.73 81% | 2.5 88% |
| CCT | 6406 101% | 19625 33% | 6769 96% | 6659 98% | 7426 88% | 7331 89% | 14034 46% |
| Color Space (Percent of AdobeRGB 1998) (%) | 38 | 38 0% | 41.8 10% | 38 0% | 62 63% | 37 -3% | 43 13% |
| Color Space (Percent of sRGB) (%) | 59 | 59 0% | 64.6 9% | 59 0% | 98 66% | 58 -2% | 68 15% |
| Total Average (Program / Settings) | -45% /
-102% | -11% /
-18% | -2% /
-1% | 14% /
3% | -13% /
-27% | -31% /
-77% |
* ... smaller is better
Right out of the box, the display offers a fairly good color reproduction. With a DeltaE 2000 color deviation of 4.8, it misses the mark slightly (DeltaE less than 3). The display does not suffer from a bluish cast. We managed to somewhat improve the color reproduction through calibration. After calibration, the DeltaE 2000 color deviation sinks to 3.68 and the grayscale appears more balanced. The HP 14 cannot cover both the sRGB color space and the Adobe RGB color space. It can only cover 59% of sRGB and 38% of Adobe RGB.
By means of our color profile, the color reproduction can be improved. However before downloading it, you should make sure that your laptop has the same display model (manufacturer + model number) as our review device, because otherwise our color profile can result in worse color reproduction. Displays from different manufacturers can often be found within notebooks from the same model range.

Display Response Times
| ↔ Response Time Black to White | ||
|---|---|---|
| 27 ms ... rise ↗ and fall ↘ combined | ↗ 15 ms rise | 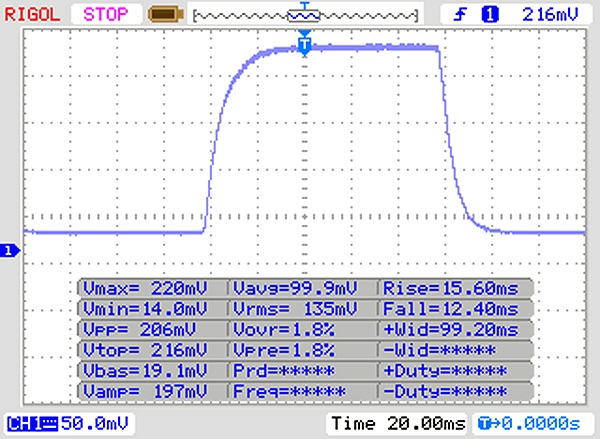 |
| ↘ 12 ms fall | ||
| The screen shows relatively slow response rates in our tests and may be too slow for gamers. In comparison, all tested devices range from 0.1 (minimum) to 240 (maximum) ms. » 67 % of all devices are better. This means that the measured response time is worse than the average of all tested devices (19.8 ms). | ||
| ↔ Response Time 50% Grey to 80% Grey | ||
| 38 ms ... rise ↗ and fall ↘ combined | ↗ 18 ms rise | 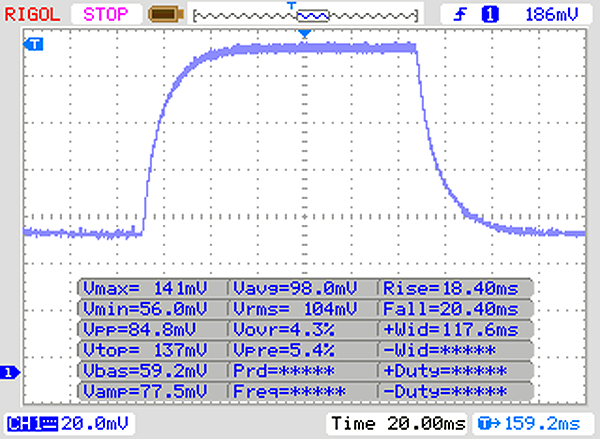 |
| ↘ 20 ms fall | ||
| The screen shows slow response rates in our tests and will be unsatisfactory for gamers. In comparison, all tested devices range from 0.165 (minimum) to 636 (maximum) ms. » 55 % of all devices are better. This means that the measured response time is worse than the average of all tested devices (31 ms). | ||
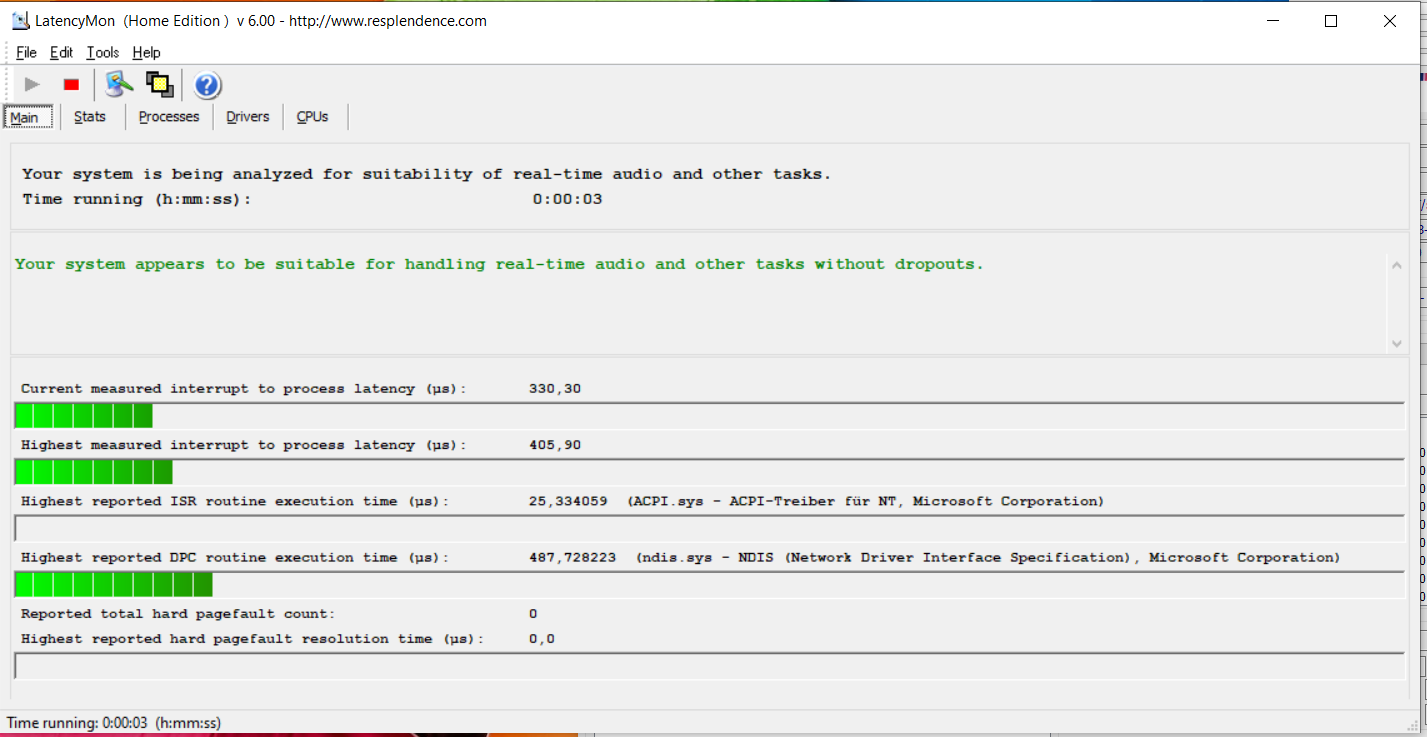
Screen Flickering / PWM (Pulse-Width Modulation)
| Screen flickering / PWM not detected | 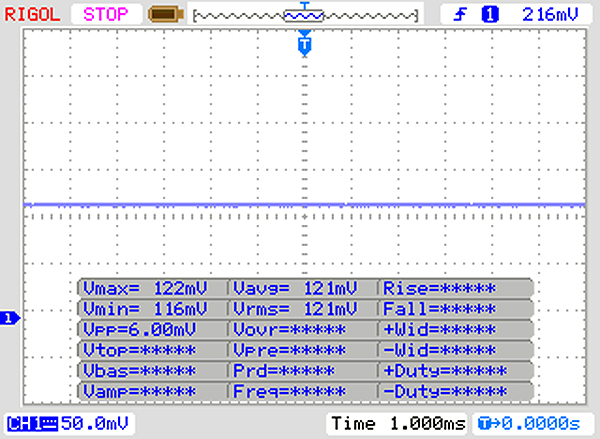 | ||
In comparison: 52 % of all tested devices do not use PWM to dim the display. If PWM was detected, an average of 7769 (minimum: 5 - maximum: 343500) Hz was measured. | |||
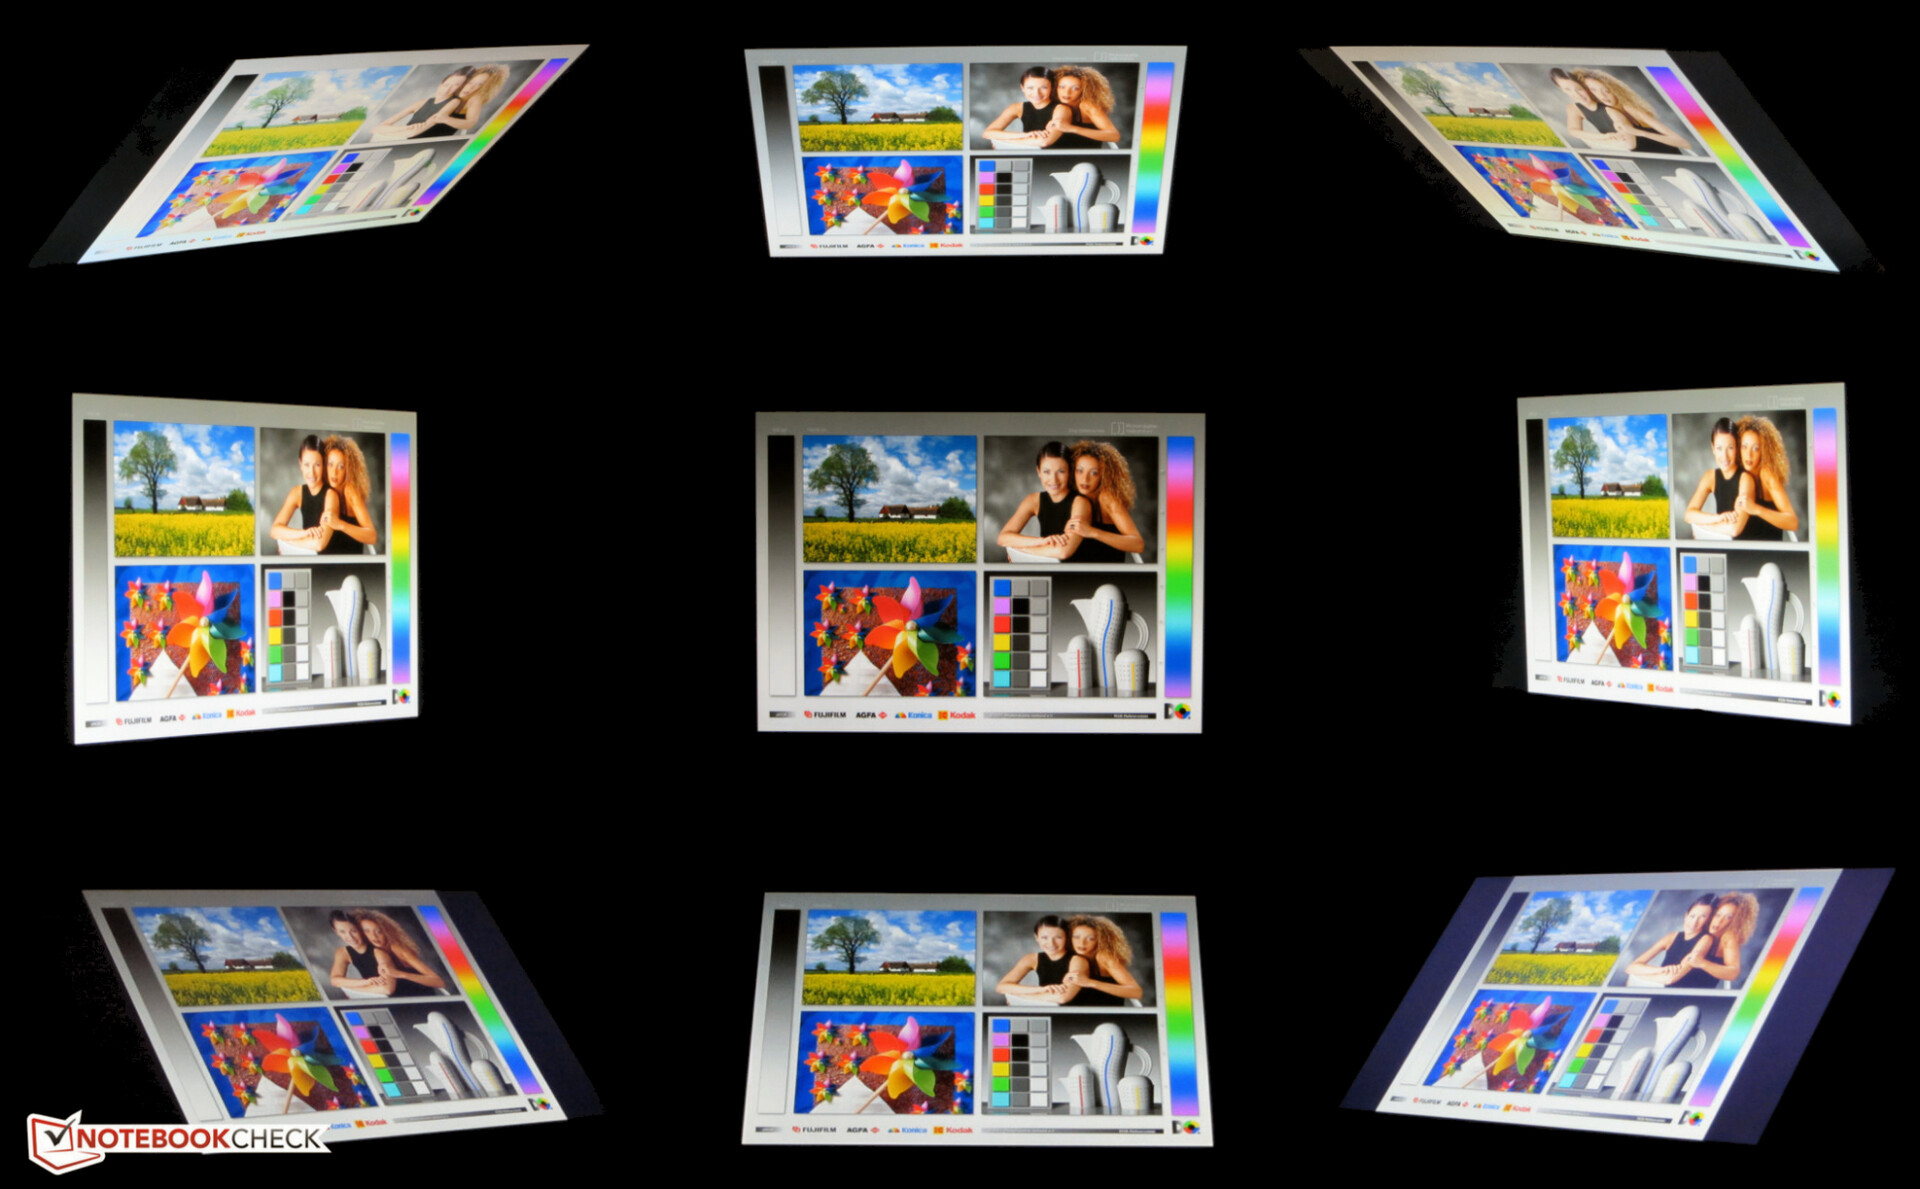
The HP 14 comes with an IPS screen. Therefore, the screen content can be read from any position. Under the open sky, the device can only be used when the sun does not shine too brightly. In broad daylight, the display is simply not bright enough to be legible.
Performance - The CPU is held back
The HP 14 from Hewlett Packard is a 14-inch office notebook. It offers enough performance for web-browsing and office work. Our review device can be had for 700 Euros (~$783). Other hardware configurations are also available. The prices start at 400 Euros (~$447). For this money, buyers can get a laptop with a Ryzen 3 3200U APU and a 256 GB SSD. Windows is not included with our review device.

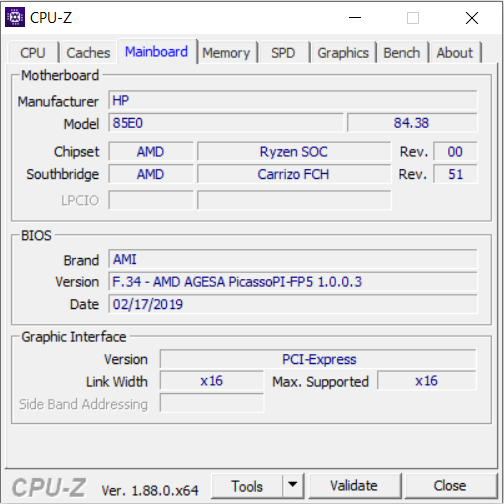

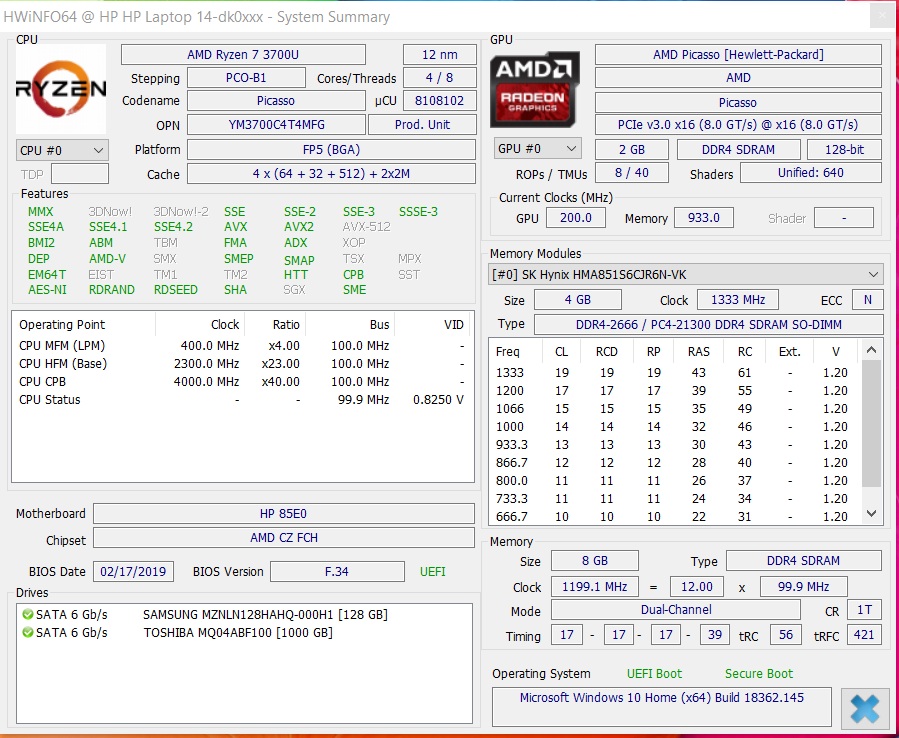
Processor
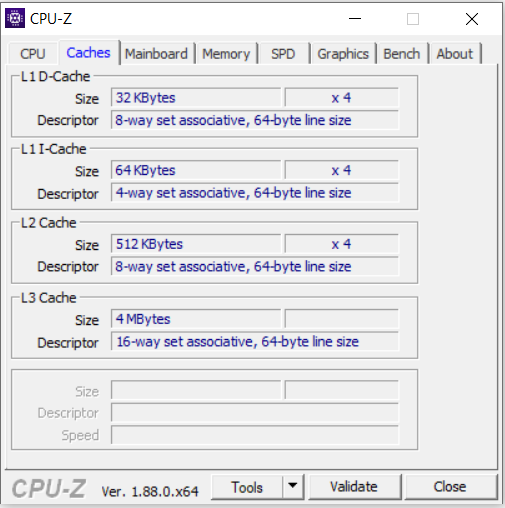
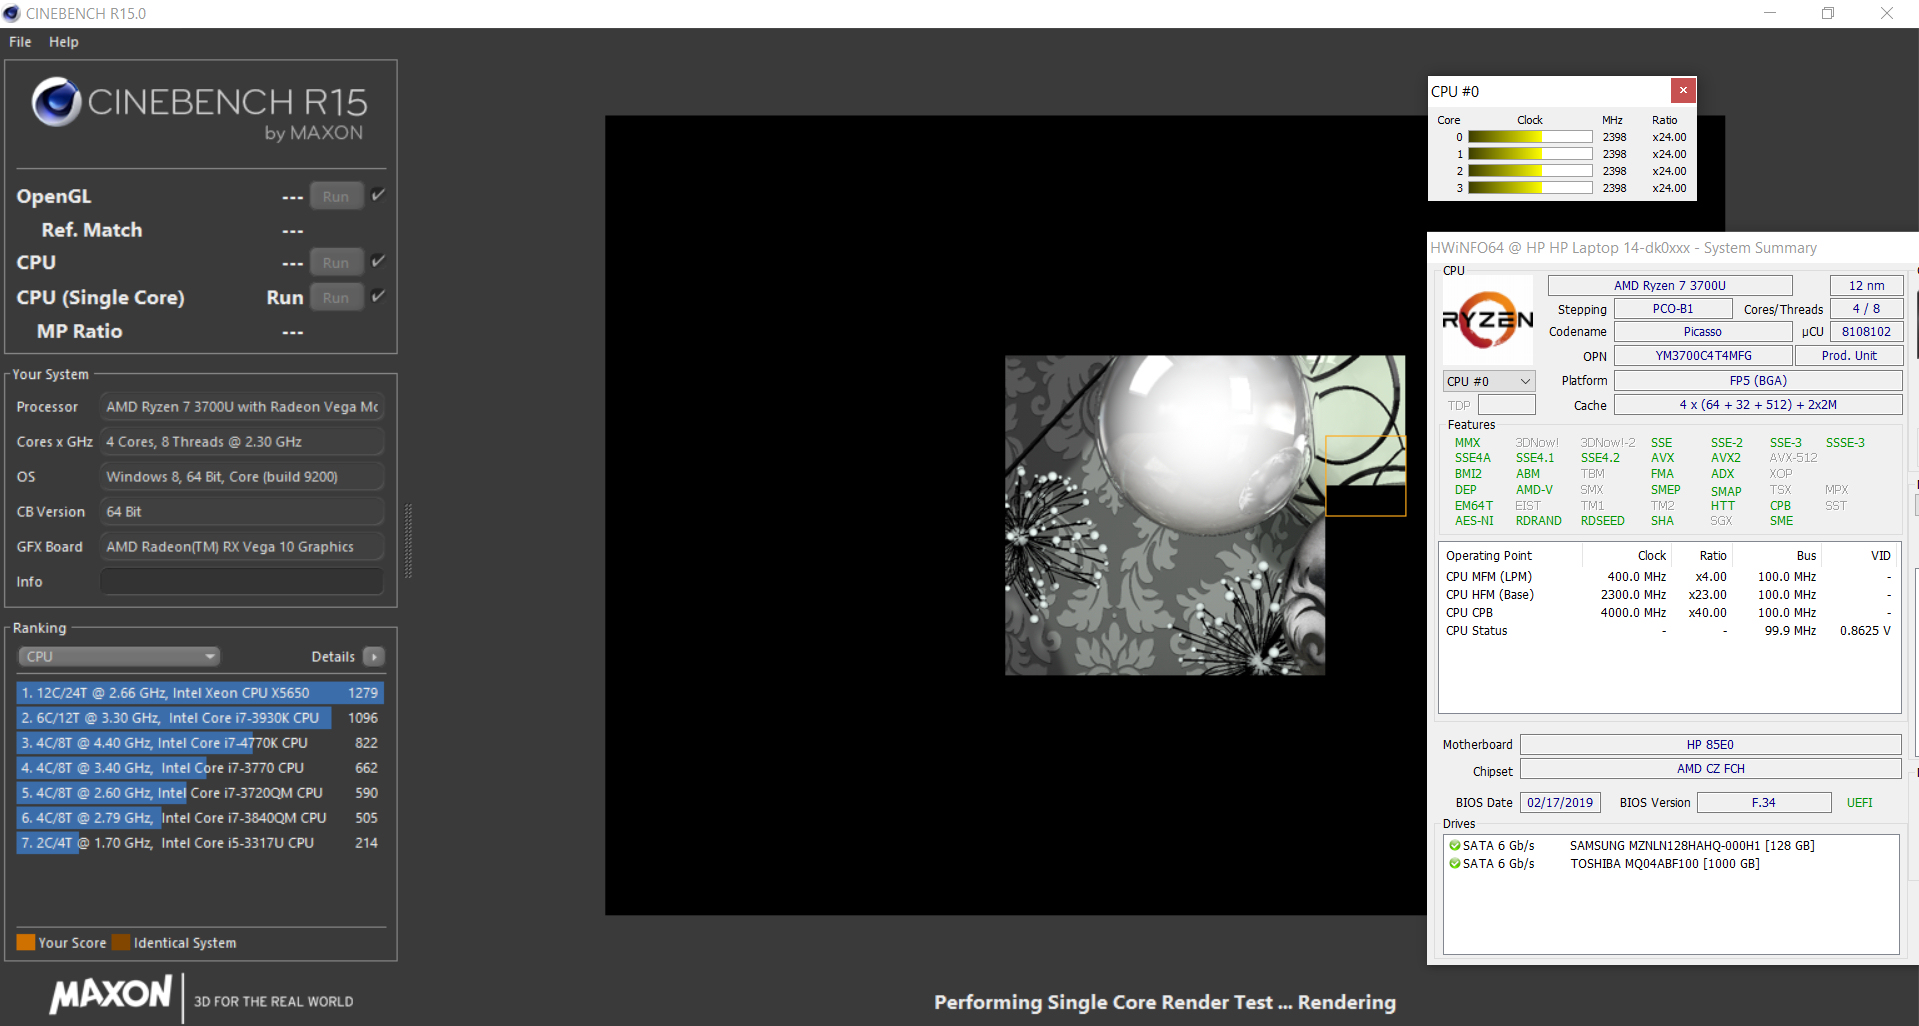
The HP 14 comes with AMD’s Picasso-based Ryzen 7 3700U. The CPU portion of the APU features four cores that operate at 2.3 GHz. By means of the Turbo Boost, the clock rate can be increased up to 4 GHz. The processor supports Simultaneous Multithreading (one core can process two threads at the same time).
The CPU runs for a short time at 3 to 3.3 GHz in the multi-core section of the CineBench R15 benchmark. Then the clock rate sinks to 2 to 3 GHz. The processor operates at 1.5 to 3 GHz in the single-core section of the benchmark. When plugged in, the Ryzen 7 3700U initially runs at 2.4 GHz, then the CPU frequency starts to fluctuate between 2 and 3 GHz. In the single-core section of CineBench R15, the clock speed ranges between 1.4 and 2.4 GHz.
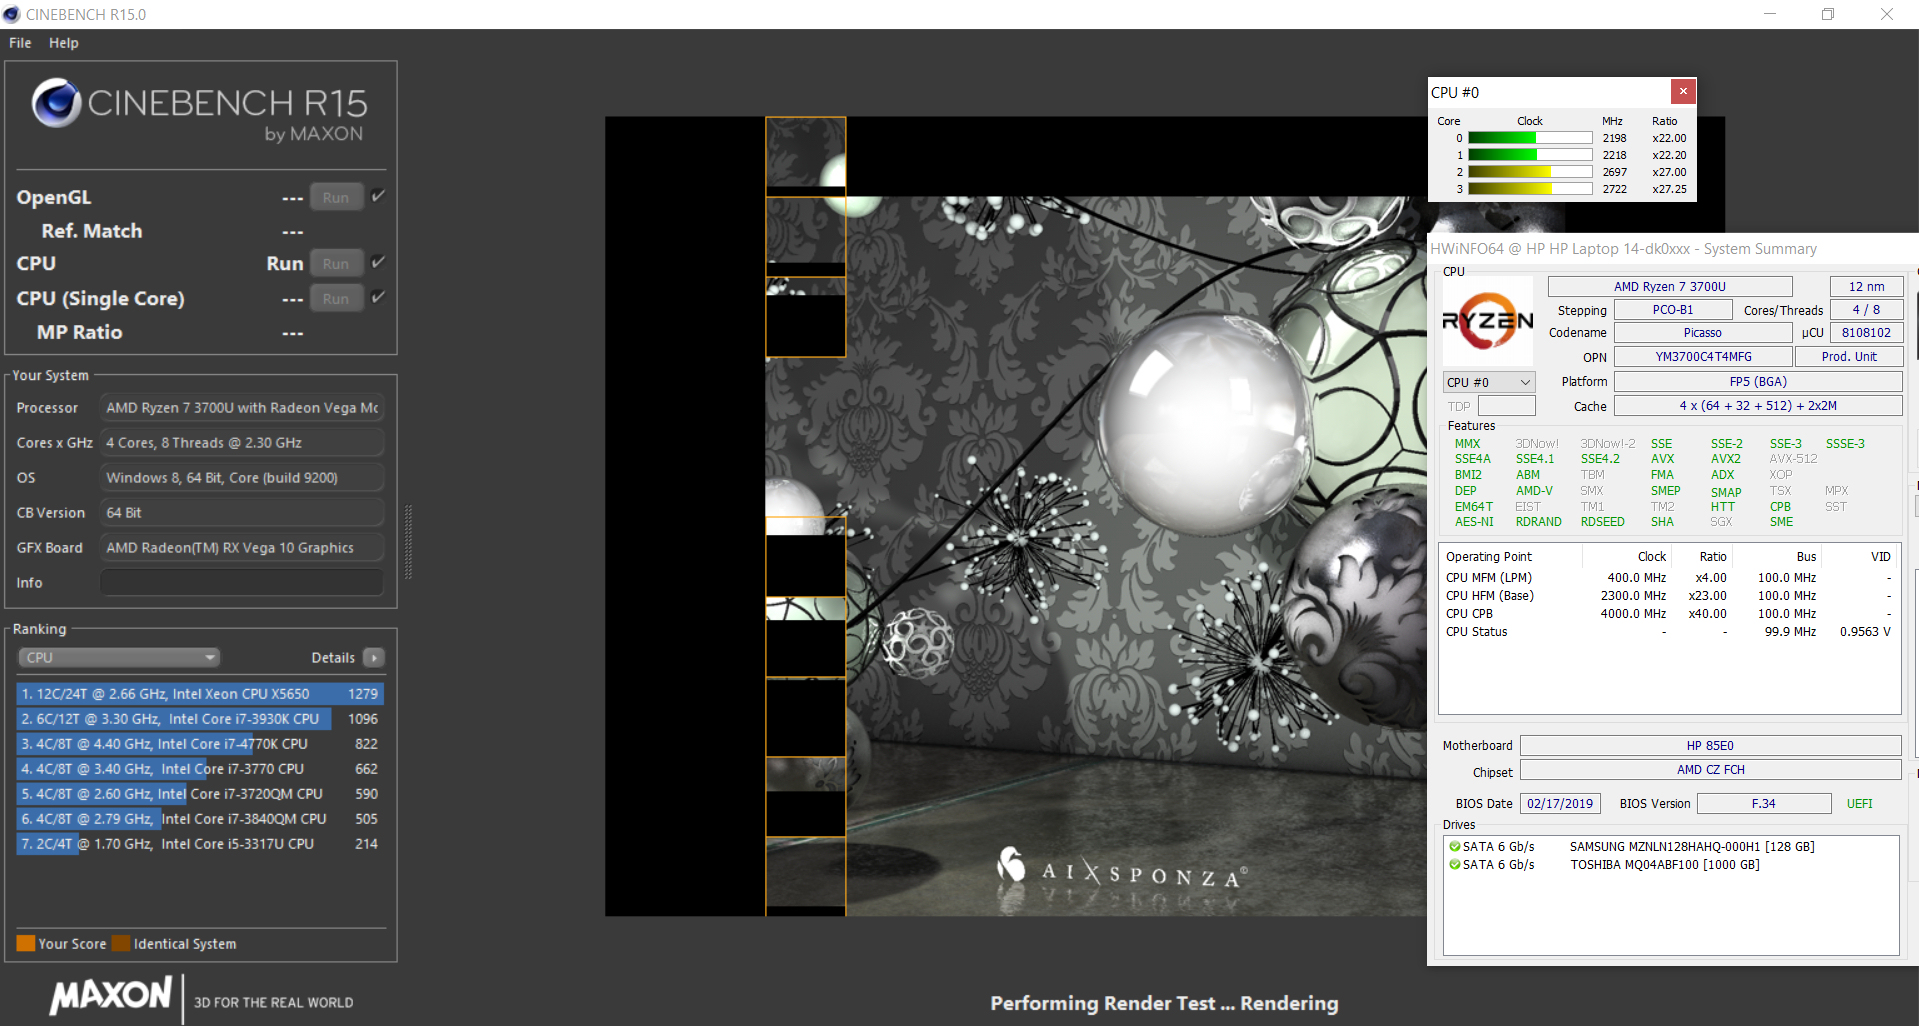
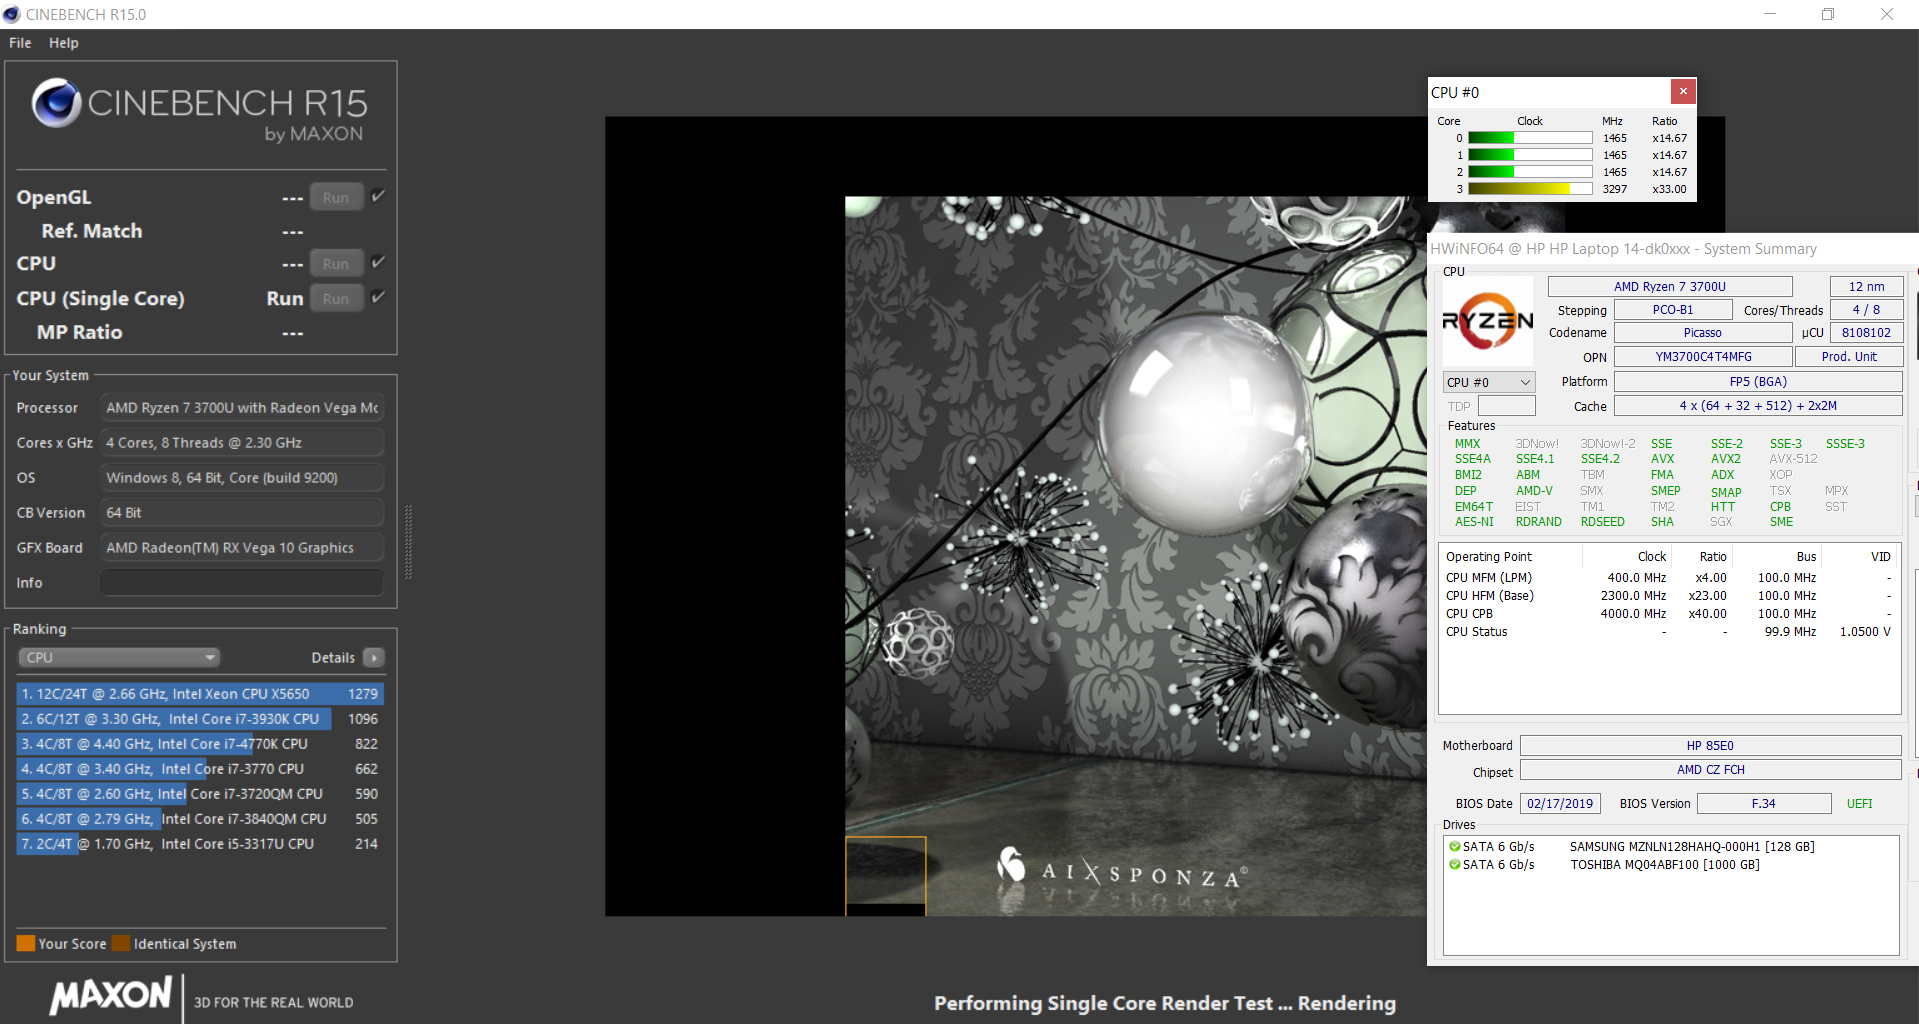
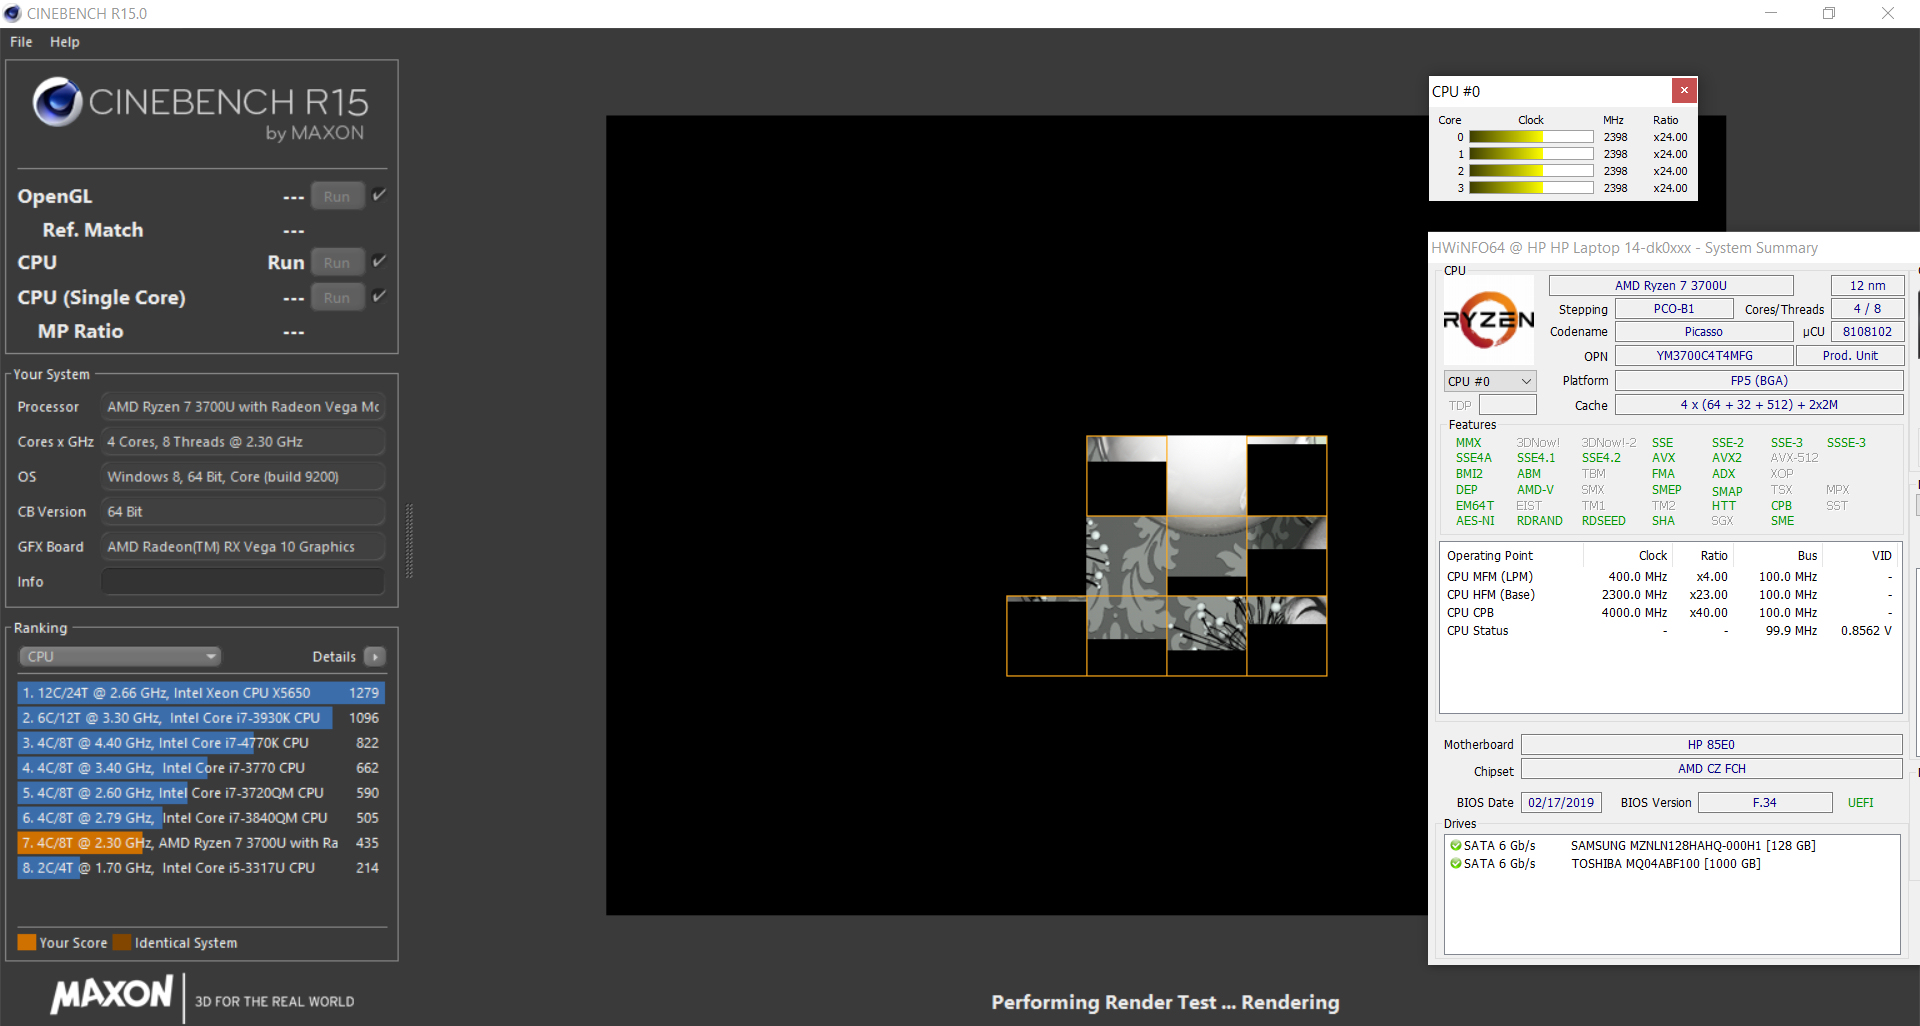
We check whether or not the Turbo Boost technology can be used over an extended period of time by running the multi-core section of the CineBench R15 benchmark for 30 straight minutes in a continuous loop. The results fall precipitously from the first to the sixth benchmark run. From the seventh benchmark run onwards, the precipitous drop in clock rates slows down. Eventually, the clock speeds settle down at 1.5 to 1.8 GHz.
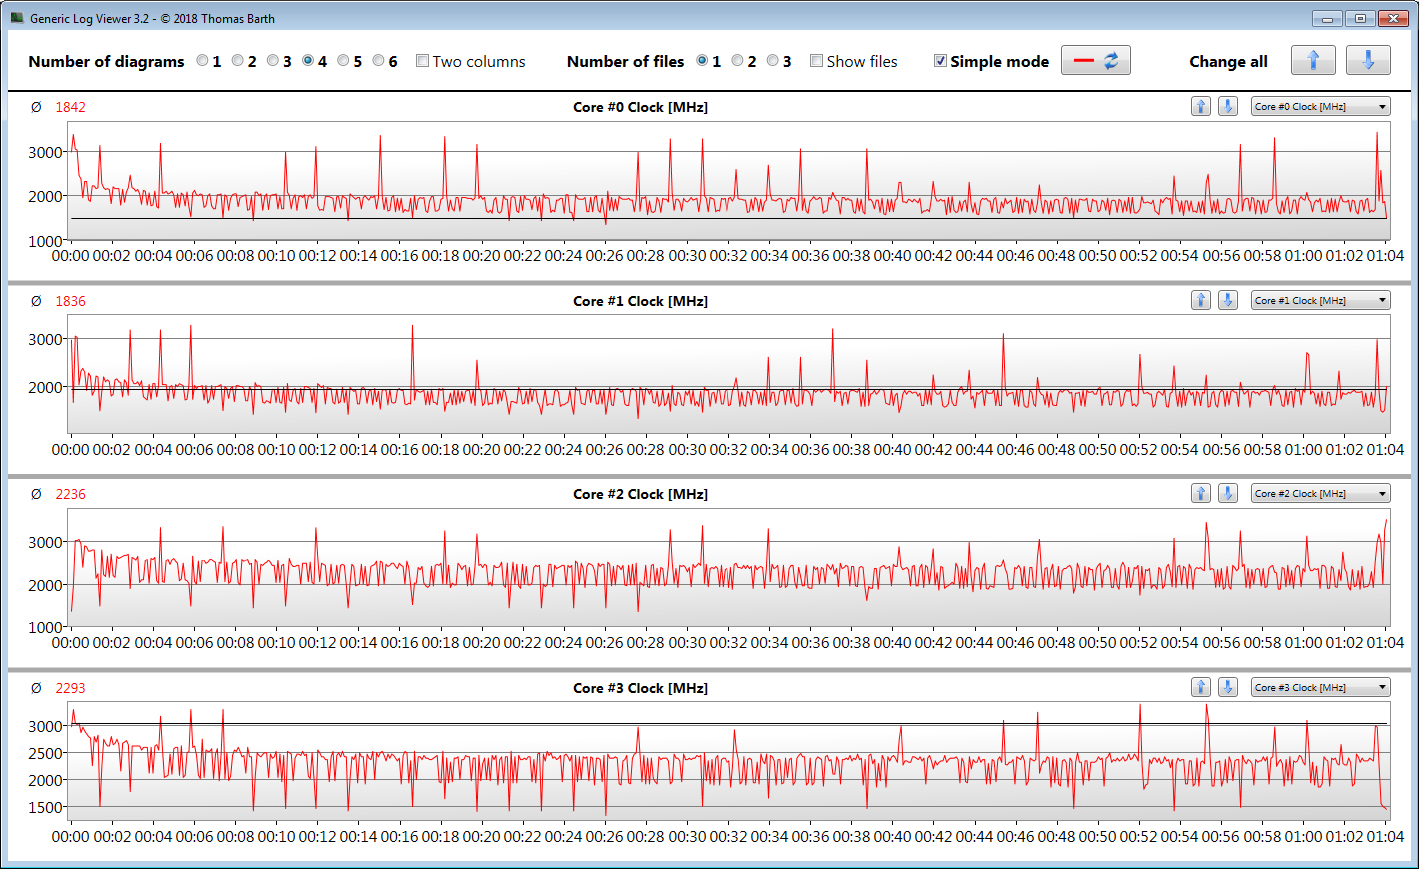
All in all, the CPU benchmarks disappoint. The Ryzen 7 3700U fails to reach its full potential, because it can only run at full speed for a short period of time. According to AMD, the TDP can range anywhere between 12 and 35 watts. It is not unreasonable to assume that HP has chosen a TDP close to the bottom of the available range.
We cannot determine the need for throttling. The HP 14 does not get hot and the fans run at a very low speed. In other words, there is a lot of room for improvement. However, HP appears to place an emphasis on quietness instead of performance, here.
| Cinebench R10 | |
| Rendering Single 32Bit | |
| Average of class Office (4212 - 10817, n=15, last 2 years) | |
| Acer Swift 3 SF314-55-31N8 | |
| HP 14-ma0312ng | |
| Average AMD Ryzen 7 3700U (4045 - 4776, n=2) | |
| HP 14-dk0008ng | |
| Rendering Multiple CPUs 32Bit | |
| Average of class Office (7657 - 60850, n=15, last 2 years) | |
| HP 14-ma0312ng | |
| Average AMD Ryzen 7 3700U (12881 - 18041, n=2) | |
| Acer Swift 3 SF314-55-31N8 | |
| HP 14-dk0008ng | |
| Geekbench 3 | |
| 32 Bit Multi-Core Score | |
| HP 14-ma0312ng | |
| HP 14-dk0008ng | |
| Average AMD Ryzen 7 3700U (n=1) | |
| Acer Swift 3 SF314-55-31N8 | |
| 32 Bit Single-Core Score | |
| HP 14-ma0312ng | |
| Acer Swift 3 SF314-55-31N8 | |
| HP 14-dk0008ng | |
| Average AMD Ryzen 7 3700U (n=1) | |
| Mozilla Kraken 1.1 - Total | |
| Huawei MateBook D 14 W00D-53010GXL | |
| HP 14-dk0008ng (Edge 44) | |
| Lenovo V330-14IKB-81B0004MGE (Edge) | |
| HP 14-ma0312ng (Edge 42) | |
| Average AMD Ryzen 7 3700U (1285 - 1405, n=5) | |
| Acer Swift 3 SF314-55-31N8 (Edge 42) | |
| Honor Magicbook (Chrome 82) | |
| Lenovo Ideapad S340-14IWL-81N70056GE | |
| Average of class Office (391 - 1297, n=76, last 2 years) | |
| Octane V2 - Total Score | |
| Average of class Office (49011 - 122119, n=19, last 2 years) | |
| Lenovo Ideapad S340-14IWL-81N70056GE | |
| HP 14-ma0312ng (Edge 42) | |
| Acer Swift 3 SF314-55-31N8 (Edge 42) | |
| Lenovo V330-14IKB-81B0004MGE (Edge) | |
| Average AMD Ryzen 7 3700U (23657 - 28301, n=5) | |
| HP 14-dk0008ng (Edge 44) | |
| Huawei MateBook D 14 W00D-53010GXL | |
| Speedometer 2.0 - Result 2.0 | |
| Average of class Office (173 - 640, n=17, last 2 years) | |
| HP 14-dk0008ng (Edge 44) | |
| Average AMD Ryzen 7 3700U (n=1) | |
| WebXPRT 3 - Overall | |
| Average of class Office (129.9 - 455, n=74, last 2 years) | |
| Honor Magicbook (Chrome 82) | |
| Average AMD Ryzen 7 3700U (152 - 156, n=2) | |
| HP 14-dk0008ng (Edge 44) | |
| JetStream 1.1 - 1.1 Total | |
| Lenovo Ideapad S340-14IWL-81N70056GE | |
| HP 14-ma0312ng (Edge 42) | |
| Acer Swift 3 SF314-55-31N8 (Edge 42) | |
| Lenovo V330-14IKB-81B0004MGE (Edge) | |
| Average AMD Ryzen 7 3700U (166 - 189.2, n=3) | |
| HP 14-dk0008ng (Edge 44) | |
| Huawei MateBook D 14 W00D-53010GXL | |
* ... smaller is better
System Performance
The system runs smoothly. We did not encounter any problems. The laptop offers more than enough computing power for such usage scenarios as office work and Internet browsing. The notebook achieves rather good results in the PCMark benchmarks. However, because the processor cannot utilize its Turbo Boost capabilities to the full extent, the results fall far behind the true potential of this CPU. This is why the HP 14 is sometimes beaten by the Acer Swift 3, which has a dual-core CPU.
| PCMark 7 Score | 6330 points | |
| PCMark 8 Home Score Accelerated v2 | 3325 points | |
| PCMark 8 Creative Score Accelerated v2 | 3287 points | |
| PCMark 8 Work Score Accelerated v2 | 4418 points | |
| PCMark 10 Score | 3522 points | |
Help | ||
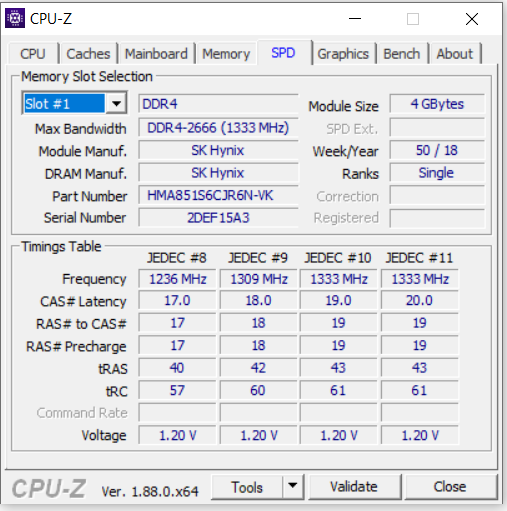
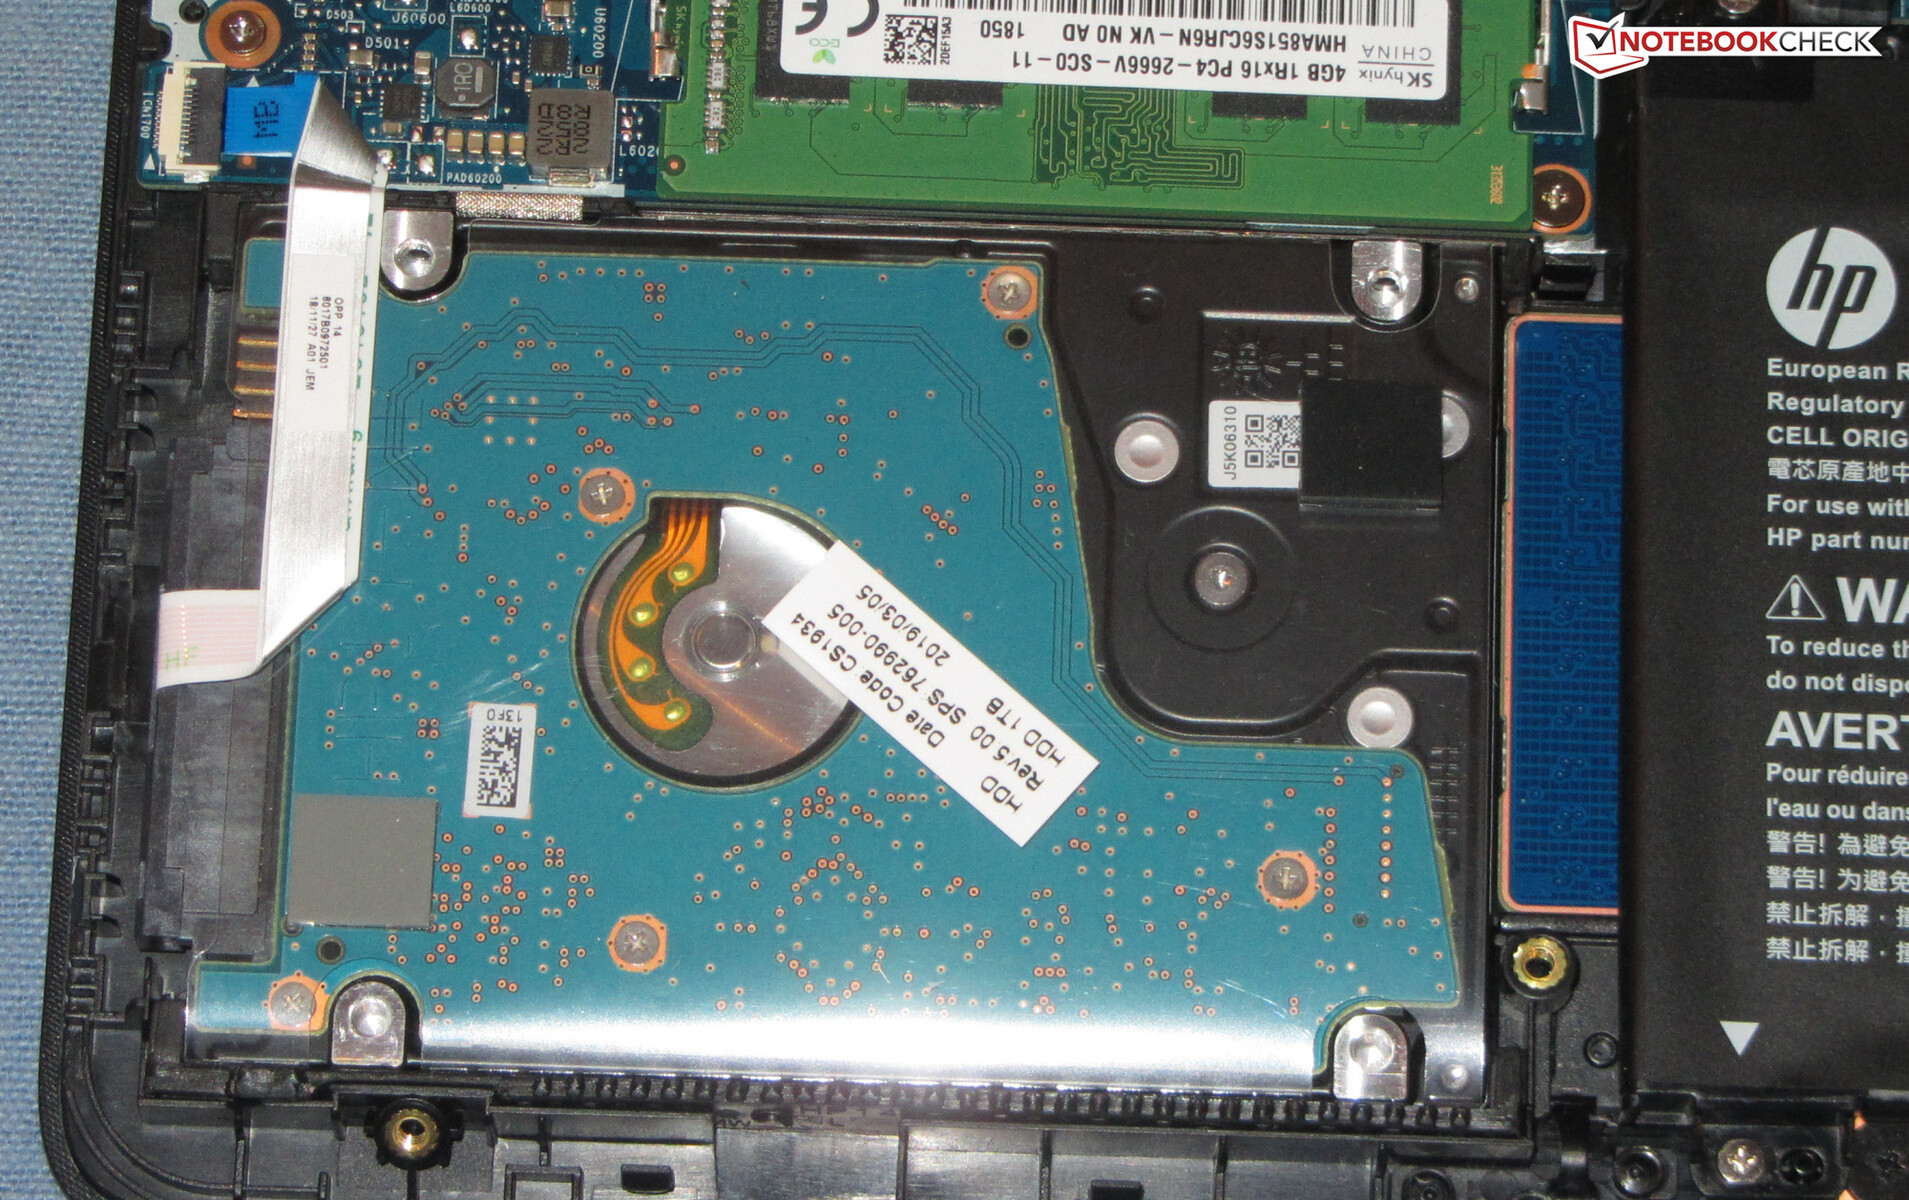
Storage Devices
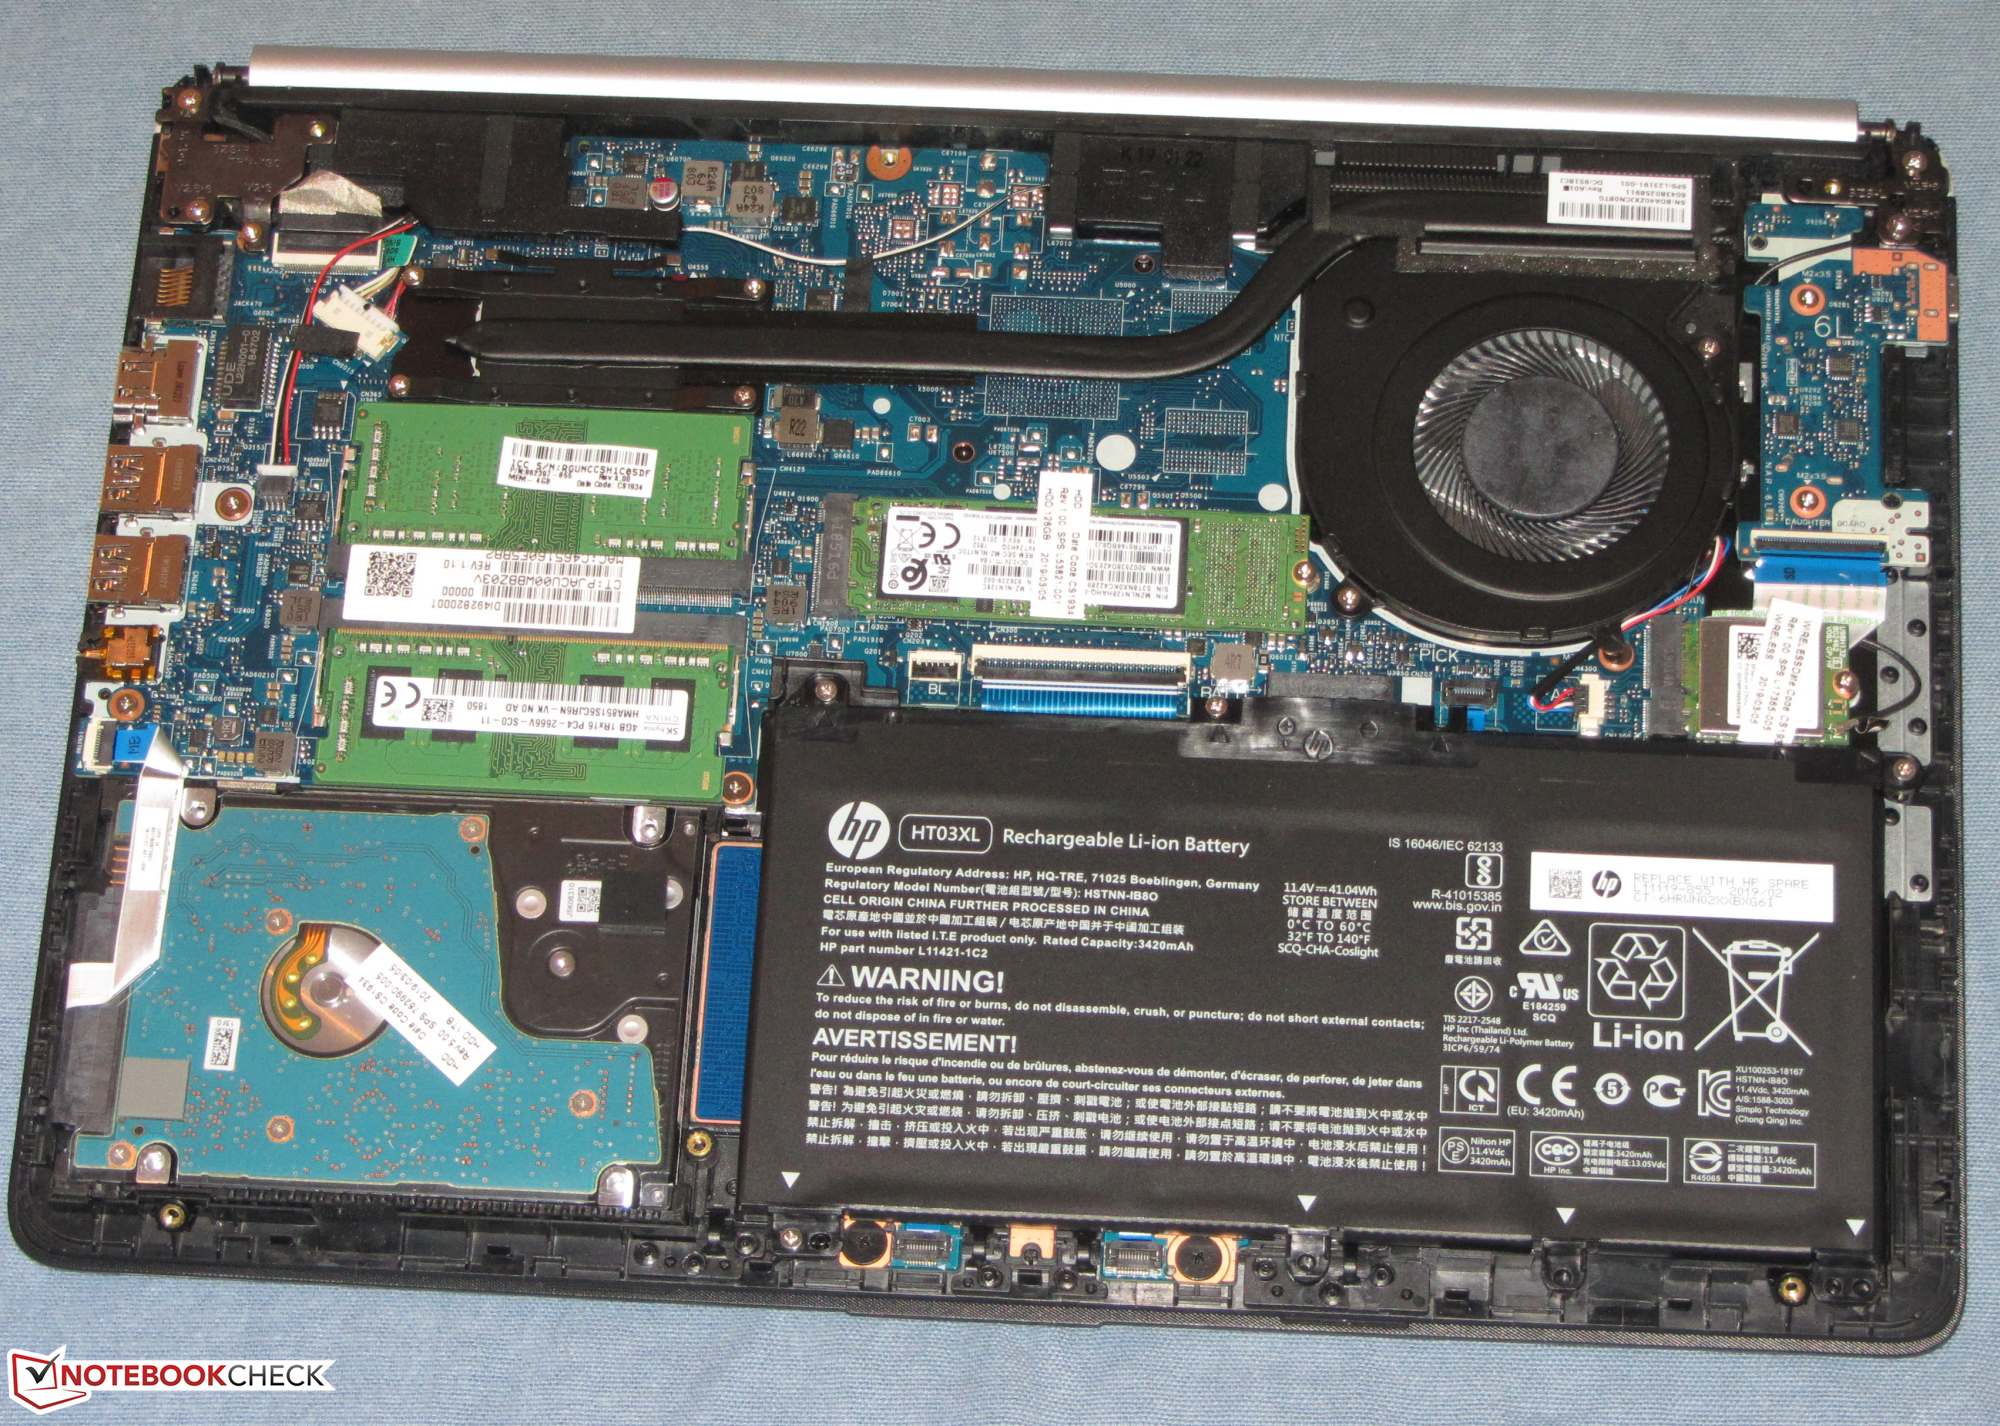
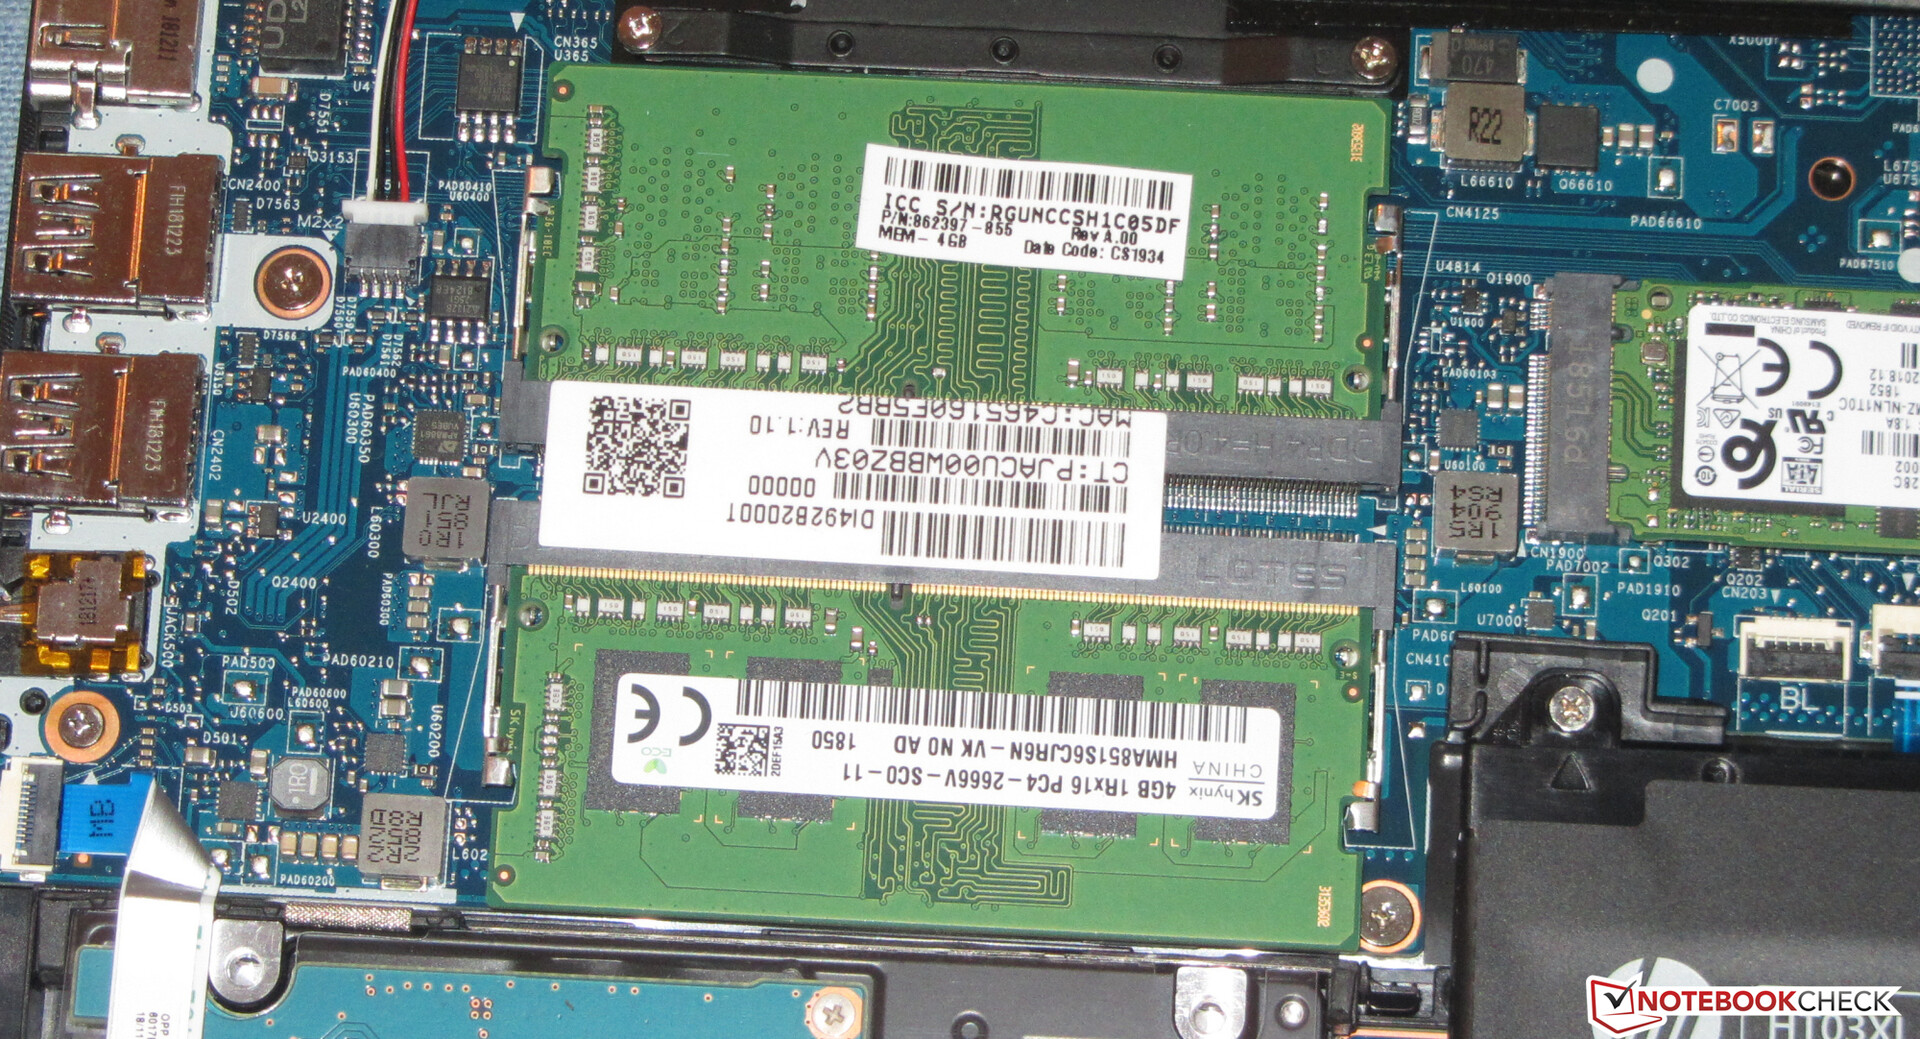
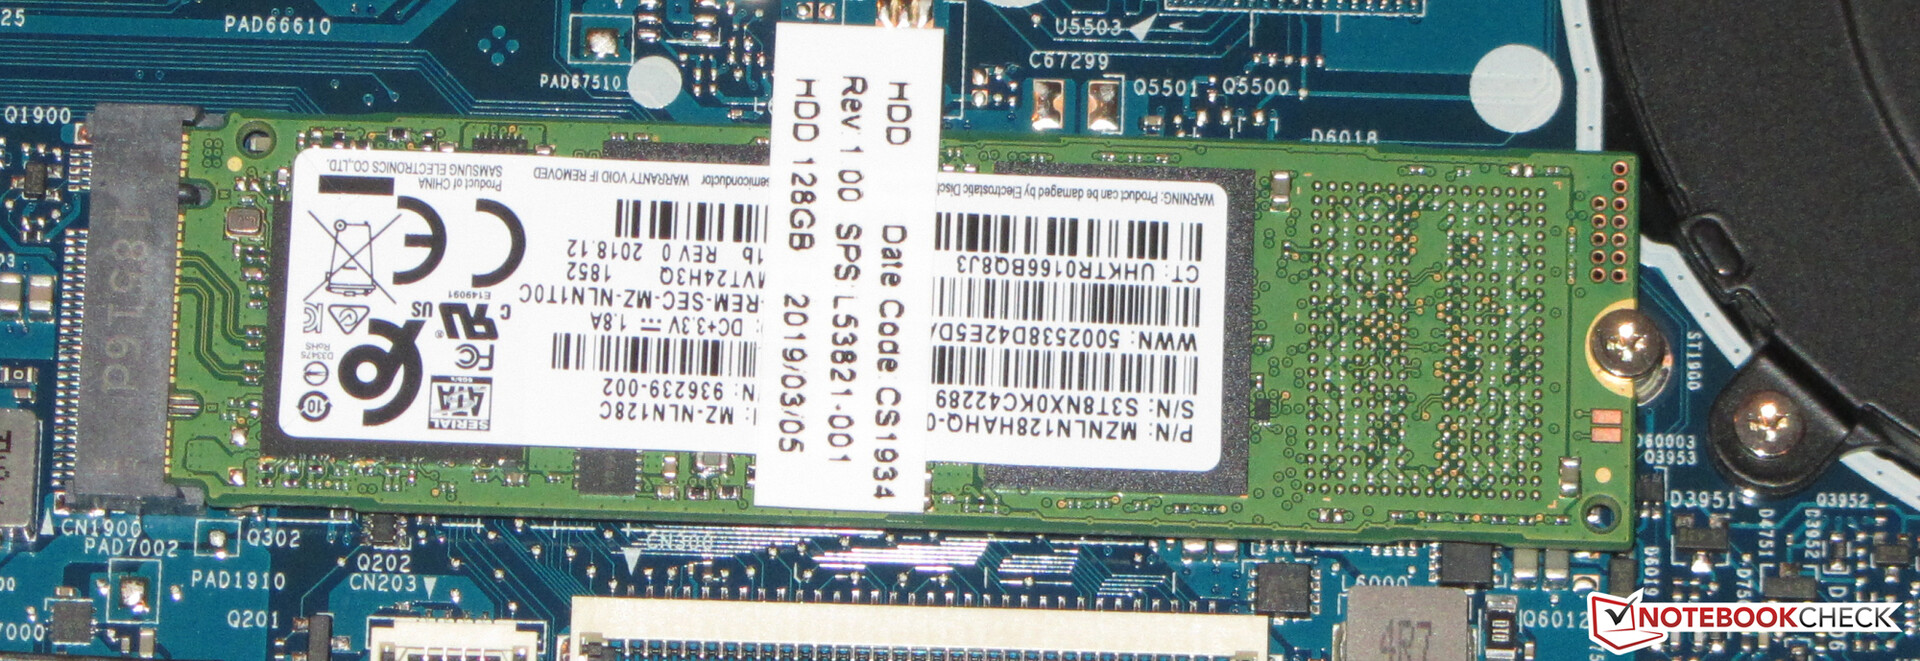
A SATA-III SSD from Samsung serves as the system drive. It comes in the M.2-2280 form-factor and has a capacity of 128 GB. Only 97 GB thereof is available to the user. The rest of the storage space is occupied by the Windows installation files and the recovery partition. The transfer rates are in good order. In addition to the SSD, there is also a 2.5-inch HDD (1 TB, 5400 RPM) inside the notebook. Therefore, users should not run out of storage space for quite a while.

| HP 14-dk0008ng Samsung PM871b MZNLN128HAHQ | Huawei MateBook D 14 W00D-53010GXL SK Hynix SC313 HFS256G39TNF | Asus VivoBook 14 F412FJ-EB084T Kingston RBU-SNS8180DS3512GJ | Lenovo V330-14IKB-81B0004MGE SK hynix PC401 HFS256GD9TNG | Acer Swift 3 SF314-55-31N8 Kingston RBUSNS8154P3128GJ | HP 14-ma0312ng Intel Optane 16 GB MEMPEK1J016GAH + HGST HTS541010B7E610 1 TB HDD | Lenovo Ideapad S340-14IWL-81N70056GE WDC PC SN520 SDAPNUW-512G | Average Samsung PM871b MZNLN128HAHQ | |
|---|---|---|---|---|---|---|---|---|
| CrystalDiskMark 5.2 / 6 | -0% | -20% | 90% | 46% | 65% | 147% | -2% | |
| Write 4K (MB/s) | 90.6 | 72.3 -20% | 55 -39% | 98.5 9% | 96.8 7% | 88.2 -3% | 160.8 77% | 82.8 ? -9% |
| Read 4K (MB/s) | 33.17 | 30.77 -7% | 28.79 -13% | 42.25 27% | 36.99 12% | 166.4 402% | 50.5 52% | 33 ? -1% |
| Write Seq (MB/s) | 483 | 468.1 -3% | 307.5 -36% | 809 67% | 463.1 -4% | 158.4 -67% | 1458 202% | 402 ? -17% |
| Read Seq (MB/s) | 511 | 518 1% | 430 -16% | 1177 130% | 794 55% | 895 75% | 1447 183% | 500 ? -2% |
| Write 4K Q32T1 (MB/s) | 170.7 | 214.2 25% | 149.5 -12% | 225.5 32% | 291.7 71% | 162.1 -5% | 406.5 138% | 192.2 ? 13% |
| Read 4K Q32T1 (MB/s) | 235 | 241.1 3% | 207.2 -12% | 257 9% | 352 50% | 496.8 111% | 476.8 103% | 295 ? 26% |
| Write Seq Q32T1 (MB/s) | 496.5 | 482 -3% | 389.2 -22% | 809 63% | 468.1 -6% | 159.9 -68% | 1458 194% | 392 ? -21% |
| Read Seq Q32T1 (MB/s) | 534 | 537 1% | 497.1 -7% | 2584 384% | 1489 179% | 933 75% | 1743 226% | 491 ? -8% |
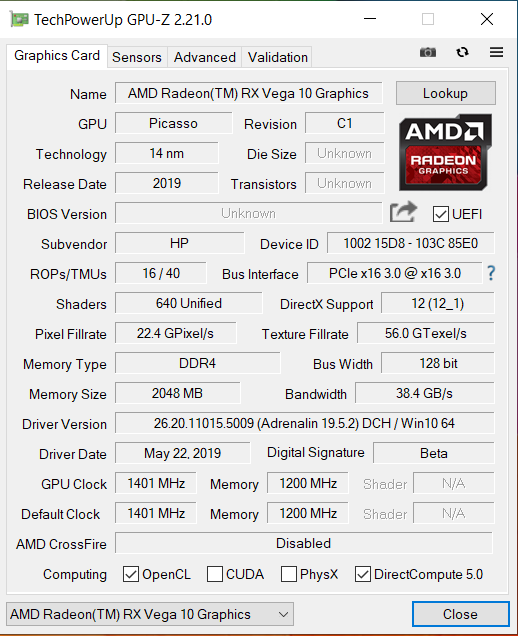
Graphics Card
HP’s laptop has AMD’s integrated Radeon RX Vega 10 GPU. It supports DirectX 12 and can run at up to 1400 MHz. Therefore, the maximum frequency is 100 MHz higher than in the predecessor APU (Ryzen 7 2700U). The results in the 3DMark benchmarks are superb and are the highest that we have ever measured for this GPU. The fact that the graphics adapter has a higher maximum frequency is reflected in the benchmarks. Interestingly enough, while the CPU part of the APU is severely throttled down, the GPU part can operate at full speed.
| 3DMark 06 Standard Score | 13304 points | |
| 3DMark 11 Performance | 3992 points | |
| 3DMark Ice Storm Standard Score | 61290 points | |
| 3DMark Cloud Gate Standard Score | 11751 points | |
| 3DMark Fire Strike Score | 2317 points | |
| 3DMark Time Spy Score | 863 points | |
Help | ||
Gaming Performance
The APU in the HP 14 can run many games in our database smoothly. This mostly applies to the titles that have been around for a few years or that have low system requirements—for instance Dota 2 Reborn
, Diablo 3,
Sims 4
, Starcraft 2
, Team Fortress 2
, and League of Legends
. These games are playable in HD resolution (1366x768) on medium settings, although sometimes higher settings are also possible.
There are even some AAA titles from 2018/2019 that are playable on the HP 14 such as Apex Legends
, Darksiders III
and Dirt Rally 2.0
. However, the aforementioned games are only playable on low settings and at low resolutions.
| low | med. | high | ultra | |
|---|---|---|---|---|
| BioShock Infinite (2013) | 100.2 | 64.7 | 51.3 | 18.5 |
| Sims 4 (2014) | 114.4 | 47.5 | 32 | 29.9 |
| Middle-earth: Shadow of Mordor (2014) | 53.8 | 35.1 | 19.6 | 15.5 |
| Alien: Isolation (2014) | 76.1 | 54.6 | 29.8 | 23.1 |
| The Witcher 3 (2015) | 37.8 | 24.2 | 12.1 | 8 |
| Dota 2 Reborn (2015) | 53 | 36.2 | 28.2 | 26.1 |
| Destiny 2 (2017) | 30.2 | 14.6 | 12.8 | 10.1 |
| Far Cry 5 (2018) | 22 | 11 | 10 | 9 |
| The Witcher 3 - 1024x768 Low Graphics & Postprocessing | |
| Average of class Office (32.2 - 103.7, n=4, last 2 years) | |
| Honor Magicbook | |
| HP 14-dk0008ng | |
| Average AMD Radeon RX Vega 10 (29.7 - 53.8, n=8) | |
| Honor Magicbook | |
| Huawei MateBook D 14 W00D-53010GXL | |
| Lenovo V330-14IKB-81B0004MGE | |
| Dota 2 Reborn - 1280x720 min (0/3) fastest | |
| Lenovo Ideapad S340-14IWL-81N70056GE | |
| Average of class Office (32.2 - 171.3, n=75, last 2 years) | |
| Honor Magicbook | |
| Huawei MateBook D 14 W00D-53010GXL | |
| Average AMD Radeon RX Vega 10 (53 - 73, n=10) | |
| HP 14-dk0008ng | |
| Sims 4 - 1366x768 Medium Preset | |
| HP 14-dk0008ng | |
| Average AMD Radeon RX Vega 10 (44 - 47.5, n=2) | |
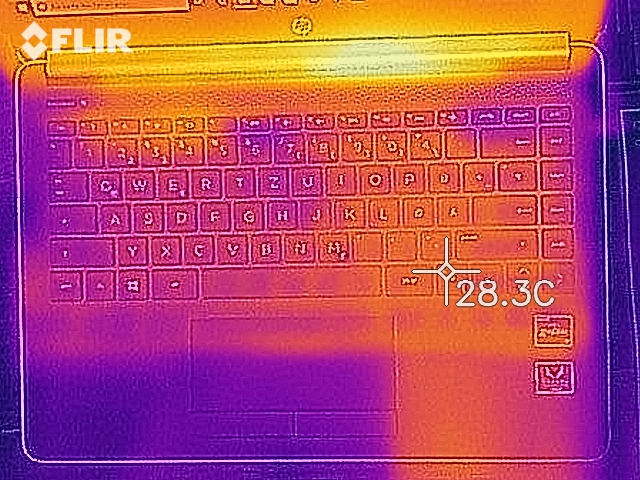
Emissions - Not a lot of heat and noise
System Noise
When idle, the fan always operates at a very low speed. This is because of HP’s BIOS function known as "Fan always on”. If this function is disabled, then the fan usually stands completely still when the device is idle, which leads to silent operation—except when the 2.5-inch hard drive is being accessed. Under load, the fan does not spin very fast. During our stress test, we measured a sound pressure level of 32.5 dB(A).
Noise level
| Idle |
| 31.4 / 31.4 / 31.4 dB(A) |
| Load |
| 32.5 / 32.5 dB(A) |
 | ||
30 dB silent 40 dB(A) audible 50 dB(A) loud |
||
min: | ||
| HP 14-dk0008ng R7 3700U, Vega 10 | HP 14-ma0312ng i5-8250U, UHD Graphics 620 | Huawei MateBook D 14 W00D-53010GXL R5 2500U, Vega 8 | Asus VivoBook 14 F412FJ-EB084T i5-8265U, GeForce MX230 | Lenovo Ideapad S340-14IWL-81N70056GE i7-8565U, GeForce MX230 | Lenovo V330-14IKB-81B0004MGE i5-8250U, UHD Graphics 620 | Acer Swift 3 SF314-55-31N8 i3-8145U, UHD Graphics 620 | Average AMD Radeon RX Vega 10 | Average of class Office | |
|---|---|---|---|---|---|---|---|---|---|
| Noise | -0% | 3% | -1% | -5% | 2% | 4% | -0% | 9% | |
| off / environment * (dB) | 30.6 | 30.25 1% | 29.5 4% | 29.9 2% | 30.6 -0% | 30.4 1% | 30.3 1% | 29.5 ? 4% | 24.2 ? 21% |
| Idle Minimum * (dB) | 31.4 | 31.4 -0% | 29.5 6% | 30 4% | 30.6 3% | 30.4 3% | 30.3 4% | 29.5 ? 6% | 24.4 ? 22% |
| Idle Average * (dB) | 31.4 | 31.4 -0% | 29.5 6% | 30 4% | 30.6 3% | 30.4 3% | 30.3 4% | 29.5 ? 6% | 24.6 ? 22% |
| Idle Maximum * (dB) | 31.4 | 31.6 -1% | 30.4 3% | 30 4% | 31.2 1% | 31 1% | 30.3 4% | 30.1 ? 4% | 25.4 ? 19% |
| Load Average * (dB) | 32.5 | 31.5 3% | 31.5 3% | 33.5 -3% | 36.5 -12% | 32.1 1% | 31 5% | 34.6 ? -6% | 34 ? -5% |
| Load Maximum * (dB) | 32.5 | 33.7 -4% | 33.5 -3% | 38 -17% | 39.7 -22% | 32.3 1% | 31.4 3% | 37.5 ? -15% | 41.1 ? -26% |
* ... smaller is better
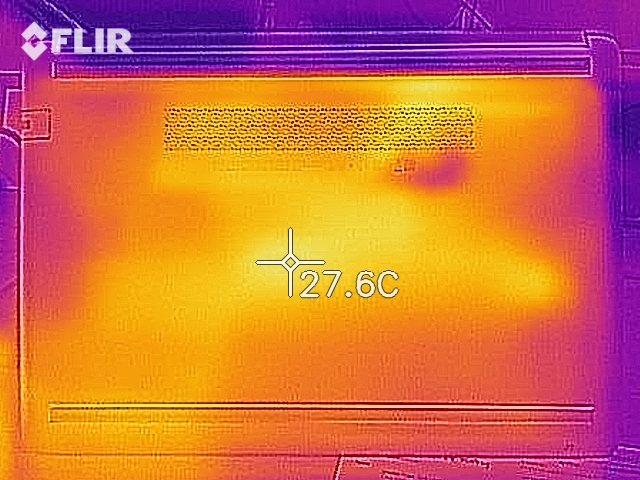
Temperature
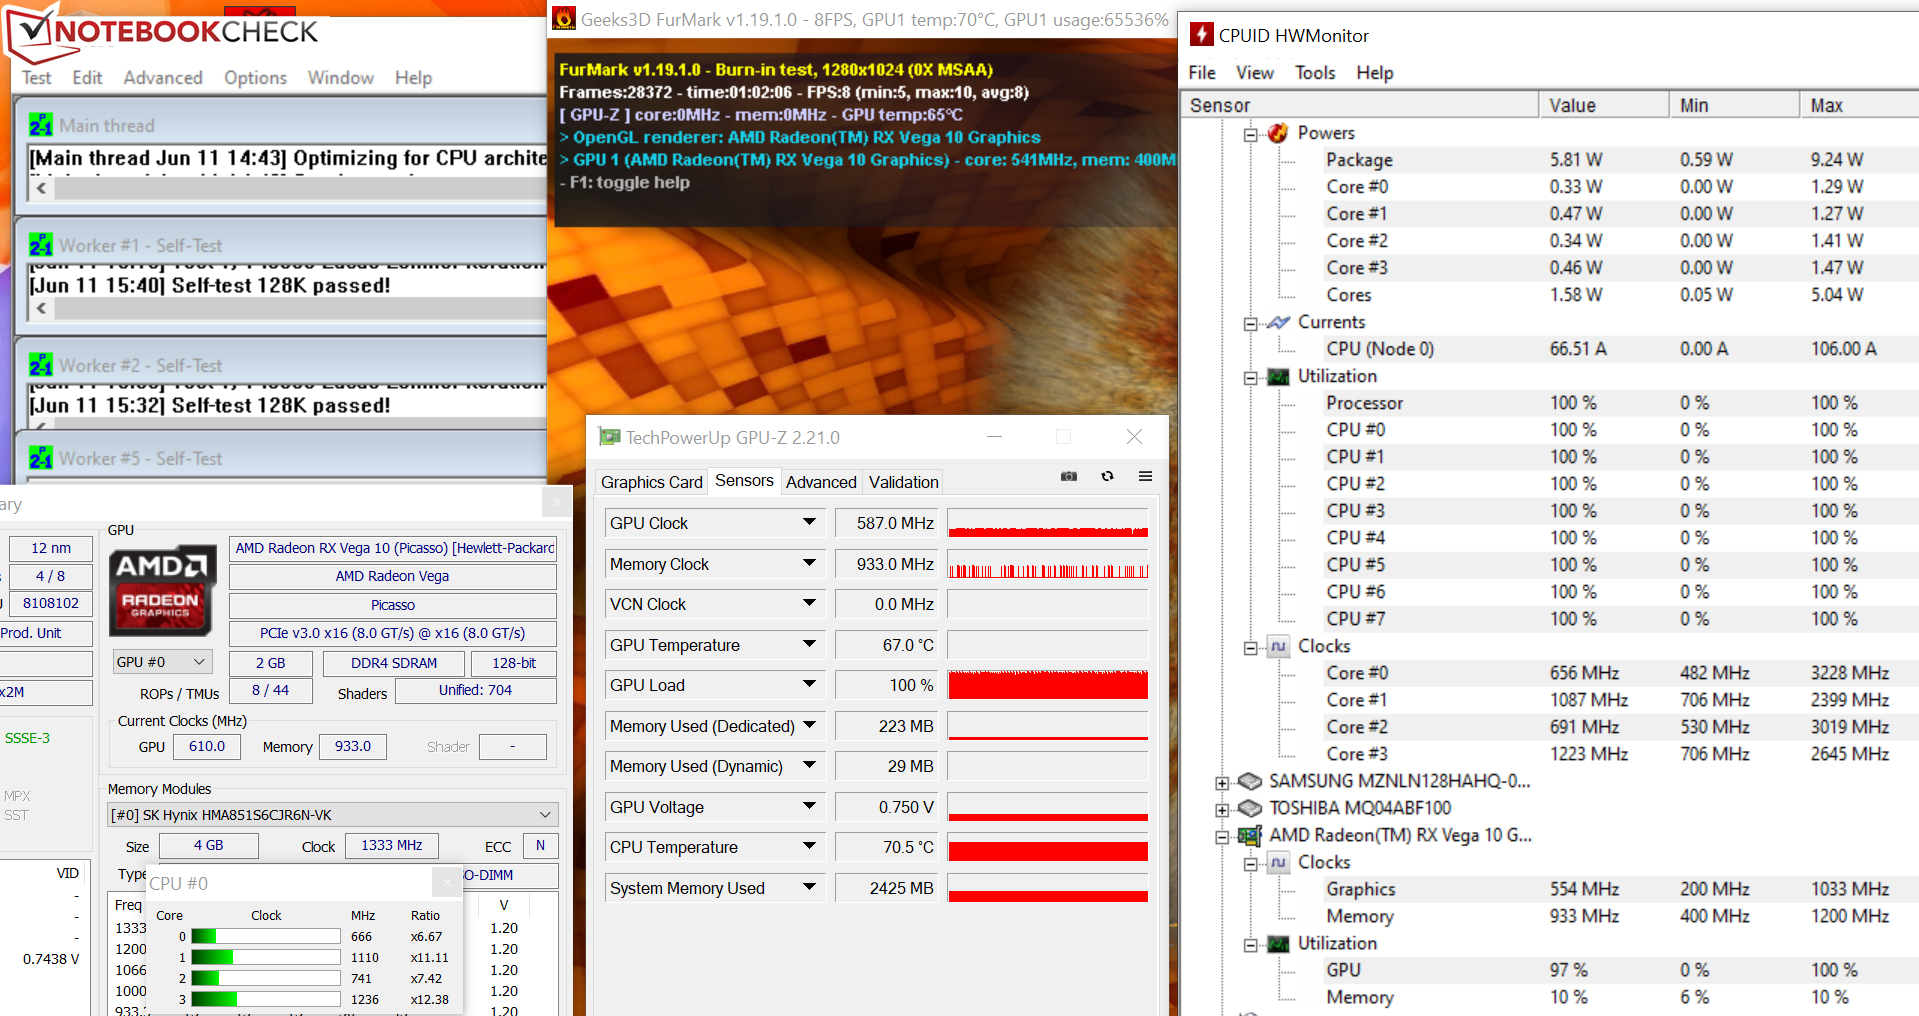
The HP 14 completes our stress test (Prime95 and FurMark running continuously for at least one hour) with similar results, both when plugged in and when running on battery power. The processor operates at full speed for a few seconds. Then the CPU frequency falls down to 1 to 1.7 GHz and after that, it falls down to 0.6 to 1.4 GHz. At the beginning of the stress test, the core clock of the GPU fluctuates between 650 and 700 MHz. Eventually, the GPU frequency stabilizes at a little below 600 MHz. The stress test is an extreme case scenario, which is very unlikely to occur in real life. We use it to test system stability under full load.
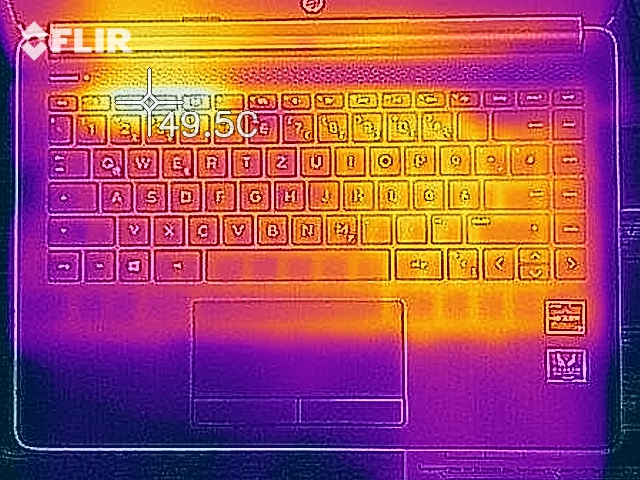
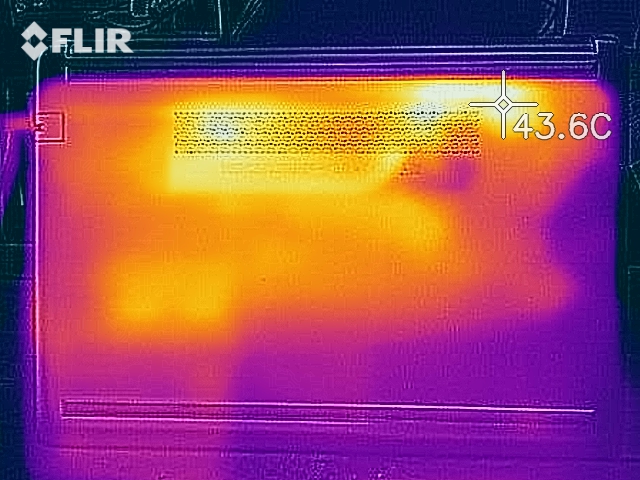
The HP 14 does not become hot. During the stress test, the 40 °C (104 °F) mark is never exceeded. In day-to-day use, the temperatures are always more than acceptable.
(+) The maximum temperature on the upper side is 39.6 °C / 103 F, compared to the average of 34.3 °C / 94 F, ranging from 21.2 to 62.5 °C for the class Office.
(+) The bottom heats up to a maximum of 37.1 °C / 99 F, compared to the average of 36.8 °C / 98 F
(+) In idle usage, the average temperature for the upper side is 25 °C / 77 F, compared to the device average of 29.5 °C / 85 F.
(+) The palmrests and touchpad are cooler than skin temperature with a maximum of 27.8 °C / 82 F and are therefore cool to the touch.
(±) The average temperature of the palmrest area of similar devices was 27.5 °C / 81.5 F (-0.3 °C / -0.5 F).
| HP 14-dk0008ng R7 3700U, Vega 10 | HP 14-ma0312ng i5-8250U, UHD Graphics 620 | Huawei MateBook D 14 W00D-53010GXL R5 2500U, Vega 8 | Asus VivoBook 14 F412FJ-EB084T i5-8265U, GeForce MX230 | Lenovo Ideapad S340-14IWL-81N70056GE i7-8565U, GeForce MX230 | Lenovo V330-14IKB-81B0004MGE i5-8250U, UHD Graphics 620 | Acer Swift 3 SF314-55-31N8 i3-8145U, UHD Graphics 620 | Average AMD Radeon RX Vega 10 | Average of class Office | |
|---|---|---|---|---|---|---|---|---|---|
| Heat | 0% | -5% | -11% | -13% | -6% | 0% | -11% | -9% | |
| Maximum Upper Side * (°C) | 39.6 | 36.6 8% | 44.3 -12% | 45.4 -15% | 45.2 -14% | 36.2 9% | 40.2 -2% | 40.9 ? -3% | 40.7 ? -3% |
| Maximum Bottom * (°C) | 37.1 | 31.8 14% | 45 -21% | 44.4 -20% | 43.8 -18% | 37.5 -1% | 40 -8% | 41.8 ? -13% | 42.8 ? -15% |
| Idle Upper Side * (°C) | 25.8 | 28.4 -10% | 23.9 7% | 26.9 -4% | 27.4 -6% | 28 -9% | 24.4 5% | 28.4 ? -10% | 27.3 ? -6% |
| Idle Bottom * (°C) | 25.3 | 28 -11% | 23.5 7% | 26.5 -5% | 28.7 -13% | 30.6 -21% | 24.1 5% | 29.6 ? -17% | 28.5 ? -13% |
* ... smaller is better
Speakers
HP 14-dk0008ng audio analysis
(-) | not very loud speakers (68.9 dB)
Bass 100 - 315 Hz
(-) | nearly no bass - on average 27% lower than median
(±) | linearity of bass is average (10.5% delta to prev. frequency)
Mids 400 - 2000 Hz
(+) | balanced mids - only 3.2% away from median
(±) | linearity of mids is average (7% delta to prev. frequency)
Highs 2 - 16 kHz
(+) | balanced highs - only 3.3% away from median
(±) | linearity of highs is average (7.8% delta to prev. frequency)
Overall 100 - 16.000 Hz
(±) | linearity of overall sound is average (23.8% difference to median)
Compared to same class
» 68% of all tested devices in this class were better, 8% similar, 24% worse
» The best had a delta of 7%, average was 21%, worst was 53%
Compared to all devices tested
» 71% of all tested devices were better, 6% similar, 22% worse
» The best had a delta of 4%, average was 24%, worst was 134%
Asus VivoBook 14 F412FJ-EB084T audio analysis
(±) | speaker loudness is average but good (77.8 dB)
Bass 100 - 315 Hz
(-) | nearly no bass - on average 22.4% lower than median
(±) | linearity of bass is average (10.8% delta to prev. frequency)
Mids 400 - 2000 Hz
(+) | balanced mids - only 3.6% away from median
(+) | mids are linear (5.4% delta to prev. frequency)
Highs 2 - 16 kHz
(+) | balanced highs - only 2.5% away from median
(+) | highs are linear (2.3% delta to prev. frequency)
Overall 100 - 16.000 Hz
(±) | linearity of overall sound is average (17.7% difference to median)
Compared to same class
» 51% of all tested devices in this class were better, 7% similar, 42% worse
» The best had a delta of 5%, average was 17%, worst was 45%
Compared to all devices tested
» 35% of all tested devices were better, 8% similar, 57% worse
» The best had a delta of 4%, average was 24%, worst was 134%
Acer Swift 3 SF314-55-31N8 audio analysis
(-) | not very loud speakers (64.7 dB)
Bass 100 - 315 Hz
(-) | nearly no bass - on average 17.1% lower than median
(+) | bass is linear (5.3% delta to prev. frequency)
Mids 400 - 2000 Hz
(+) | balanced mids - only 3.1% away from median
(+) | mids are linear (6.8% delta to prev. frequency)
Highs 2 - 16 kHz
(+) | balanced highs - only 1.8% away from median
(+) | highs are linear (3.8% delta to prev. frequency)
Overall 100 - 16.000 Hz
(±) | linearity of overall sound is average (19.4% difference to median)
Compared to same class
» 60% of all tested devices in this class were better, 7% similar, 33% worse
» The best had a delta of 5%, average was 18%, worst was 53%
Compared to all devices tested
» 48% of all tested devices were better, 7% similar, 45% worse
» The best had a delta of 4%, average was 24%, worst was 134%
Energy Management - Okay battery life
Energy Consumption
There are no abnormalities in terms of energy consumption to report. When idle, we measured a maximum power draw of 7.3 watts. During the stress test, the energy consumption reached up to 45 watts. The rated output of the AC adapter is 45 watts.
| Off / Standby | |
| Idle | |
| Load |
|
Key:
min: | |
| HP 14-dk0008ng R7 3700U, Vega 10 | HP 14-ma0312ng i5-8250U, UHD Graphics 620 | Huawei MateBook D 14 W00D-53010GXL R5 2500U, Vega 8 | Asus VivoBook 14 F412FJ-EB084T i5-8265U, GeForce MX230 | Lenovo Ideapad S340-14IWL-81N70056GE i7-8565U, GeForce MX230 | Lenovo V330-14IKB-81B0004MGE i5-8250U, UHD Graphics 620 | Acer Swift 3 SF314-55-31N8 i3-8145U, UHD Graphics 620 | Average AMD Radeon RX Vega 10 | Average of class Office | |
|---|---|---|---|---|---|---|---|---|---|
| Power Consumption | 22% | -11% | -8% | 3% | 17% | 23% | -7% | -17% | |
| Idle Minimum * (Watt) | 4.8 | 4.7 2% | 5.3 -10% | 3.7 23% | 2.5 48% | 2.8 42% | 2.9 40% | 4.73 ? 1% | 4.39 ? 9% |
| Idle Average * (Watt) | 7.1 | 6.3 11% | 7.8 -10% | 6.1 14% | 5.1 28% | 5.8 18% | 5.6 21% | 7.61 ? -7% | 7.35 ? -4% |
| Idle Maximum * (Watt) | 7.3 | 6.8 7% | 8.46 -16% | 8.3 -14% | 5.6 23% | 6.9 5% | 6.1 16% | 9.63 ? -32% | 8.56 ? -17% |
| Load Average * (Watt) | 34 | 15 56% | 36.9 -9% | 43 -26% | 47.5 -40% | 34 -0% | 29 15% | 33.3 ? 2% | 43.3 ? -27% |
| Load Maximum * (Watt) | 45 | 30.4 32% | 49.4 -10% | 61.6 -37% | 64.5 -43% | 35 22% | 35.3 22% | 45.1 ? -0% | 64.6 ? -44% |
* ... smaller is better
Battery Life
In our practically oriented Wi-Fi test, which simulates loads that are consistent with surfing the web, the HP 14 lasted for 7 h 12 m. Here, the “balanced” power plan is selected, the energy-saving functions are turned off and the display brightness is set to 150 cd/m². The 14-inch notebook achieved a battery runtime of 6 h 55 m in our video test. We conduct this test by running the short film Big Buck Bunny (H.264; 1920x1080) in a continuous loop. The “Power saver” plan is selected, the communications modules and the energy-saving functions are disabled, and the display brightness is set to 150 cd/m².
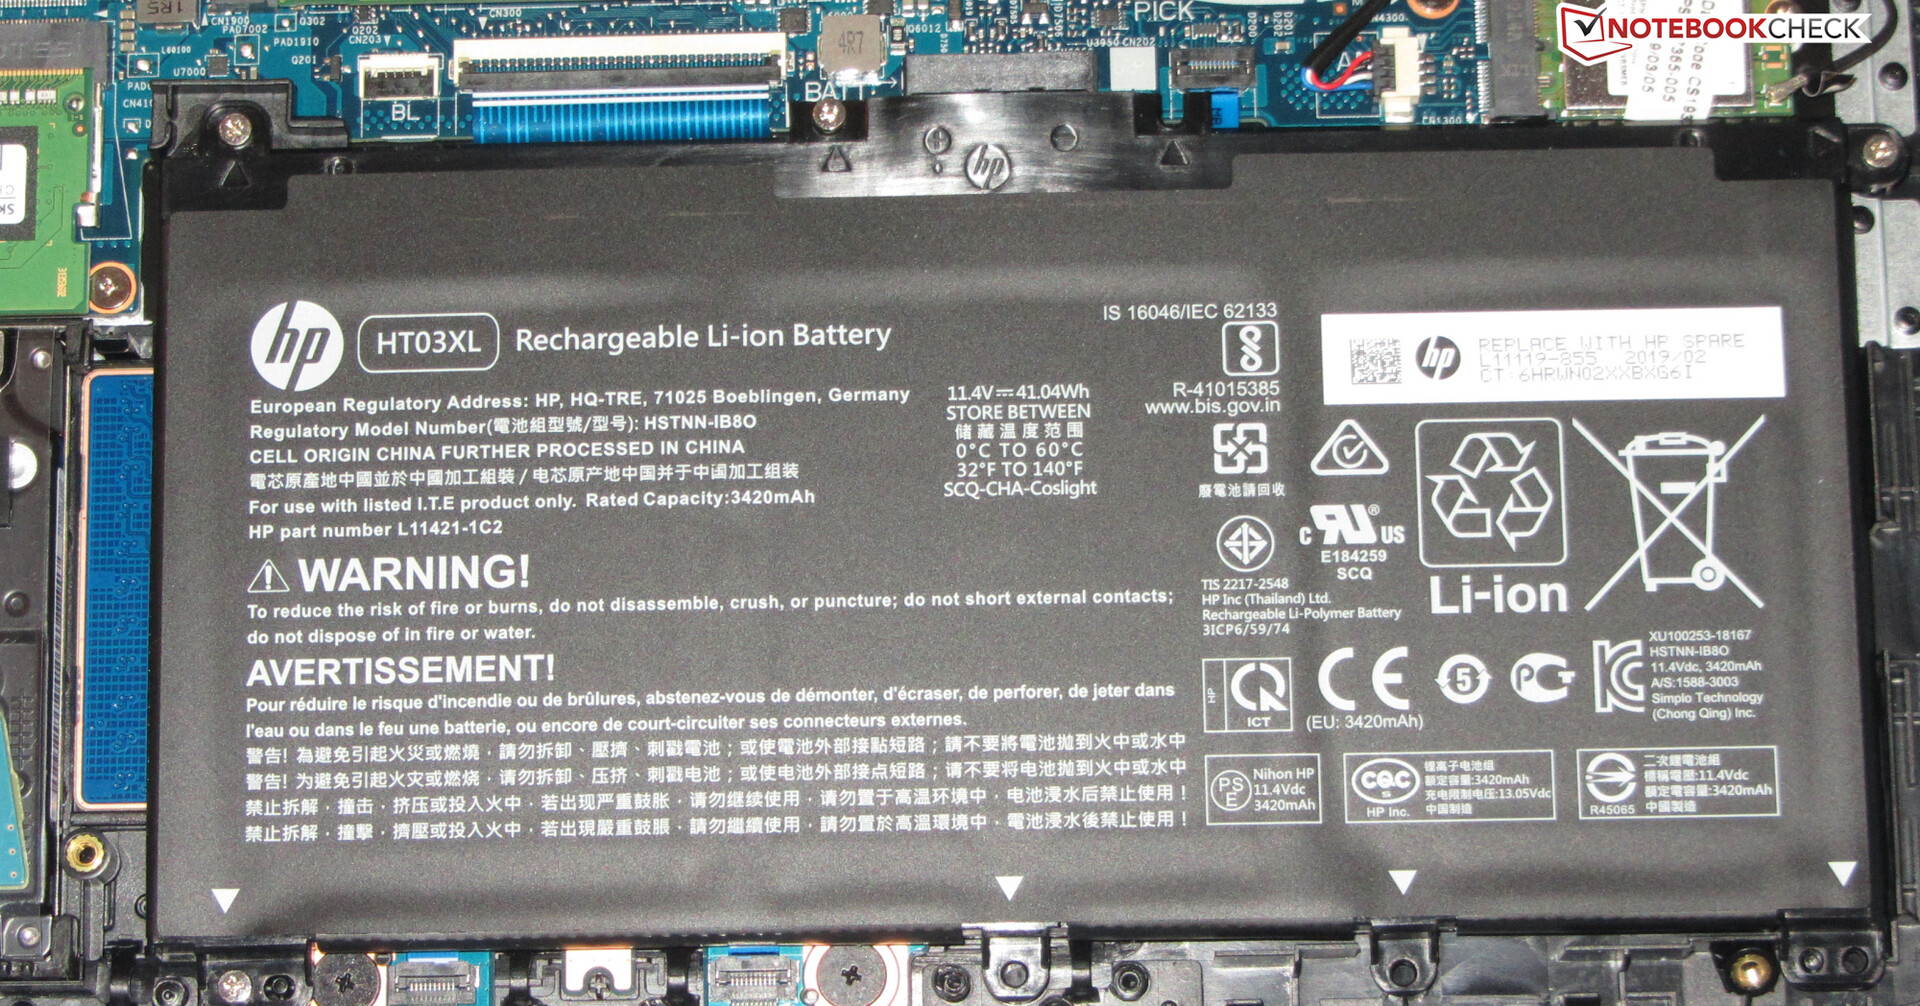
| HP 14-dk0008ng R7 3700U, Vega 10, 41.04 Wh | Huawei MateBook D 14 W00D-53010GXL R5 2500U, Vega 8, 57.4 Wh | Asus VivoBook 14 F412FJ-EB084T i5-8265U, GeForce MX230, 37 Wh | Lenovo V330-14IKB-81B0004MGE i5-8250U, UHD Graphics 620, 30 Wh | Acer Swift 3 SF314-55-31N8 i3-8145U, UHD Graphics 620, 50.7 Wh | HP 14-ma0312ng i5-8250U, UHD Graphics 620, 41.7 Wh | Lenovo Ideapad S340-14IWL-81N70056GE i7-8565U, GeForce MX230, 52.5 Wh | Average of class Office | |
|---|---|---|---|---|---|---|---|---|
| Battery runtime | 66% | -24% | -32% | 42% | 61% | 52% | 105% | |
| Reader / Idle (h) | 11.8 | 19 61% | 15.6 32% | 23.2 97% | 23.7 ? 101% | |||
| H.264 (h) | 6.9 | 6.7 -3% | 15 ? 117% | |||||
| WiFi v1.3 (h) | 7.2 | 9 25% | 5.5 -24% | 4.9 -32% | 10.2 42% | 7.4 3% | 6 -17% | 12.9 ? 79% |
| Load (h) | 0.8 | 1.7 113% | 2.5 213% | 1.4 75% | 1.794 ? 124% |
Pros
Cons
Verdict
Hewlett Packard’s 14-inch office notebook is powered by the newly released Ryzen 7 3700U APU. The APU has left an ambiguous impression. While the GPU part of the APU works at full speed, the CPU part is throttled down. The latter cannot utilize its Turbo Boost capabilities to the full extent and can only operate at high frequencies for a short time. Therefore, it cannot reach its full potential. It is possible that HP has limited the CPU power to ensure quiet operation: The HP 14 is quiet under all sorts of loads and never gets hot.
The HP 14-dk0008ng has left a mostly positive impression. Unfortunately, the Ryzen 7 3700U APU fails to reach its full potential.
A SATA-III SSD creates a very responsive system. Moreover, the HP 14 also has a 2.5-inch HDD, which offers a lot of storage space (1 TB). The keyboard has left a rather good impression. It is quite usable in day-to-day life. The battery runtimes can be described as bordering on good. However, the 14-inch notebook should have lasted one to two more hours in our practically oriented Wi-Fi and video tests.
The matte IPS screen scores some major points with its good contrast ratio and great viewing angles. The HP 14 is only suited for use indoors. The color-space coverage also leaves a lot to be desired.
The HP 14 features a USB 3.2 Gen 1 Type-C port, which can only be used for connecting peripherals. It can neither output a DisplayPort signal nor be used for charging the device. These days, there is really no reason why a compact and mobile device like this cannot be charged via the USB Type-C port. The Wi-Fi module also disappoints with its average data speeds. The one-year warranty deserves criticism as well.
HP 14-dk0008ng
- 06/17/2019 v6 (old)
Sascha Mölck
Price comparison
