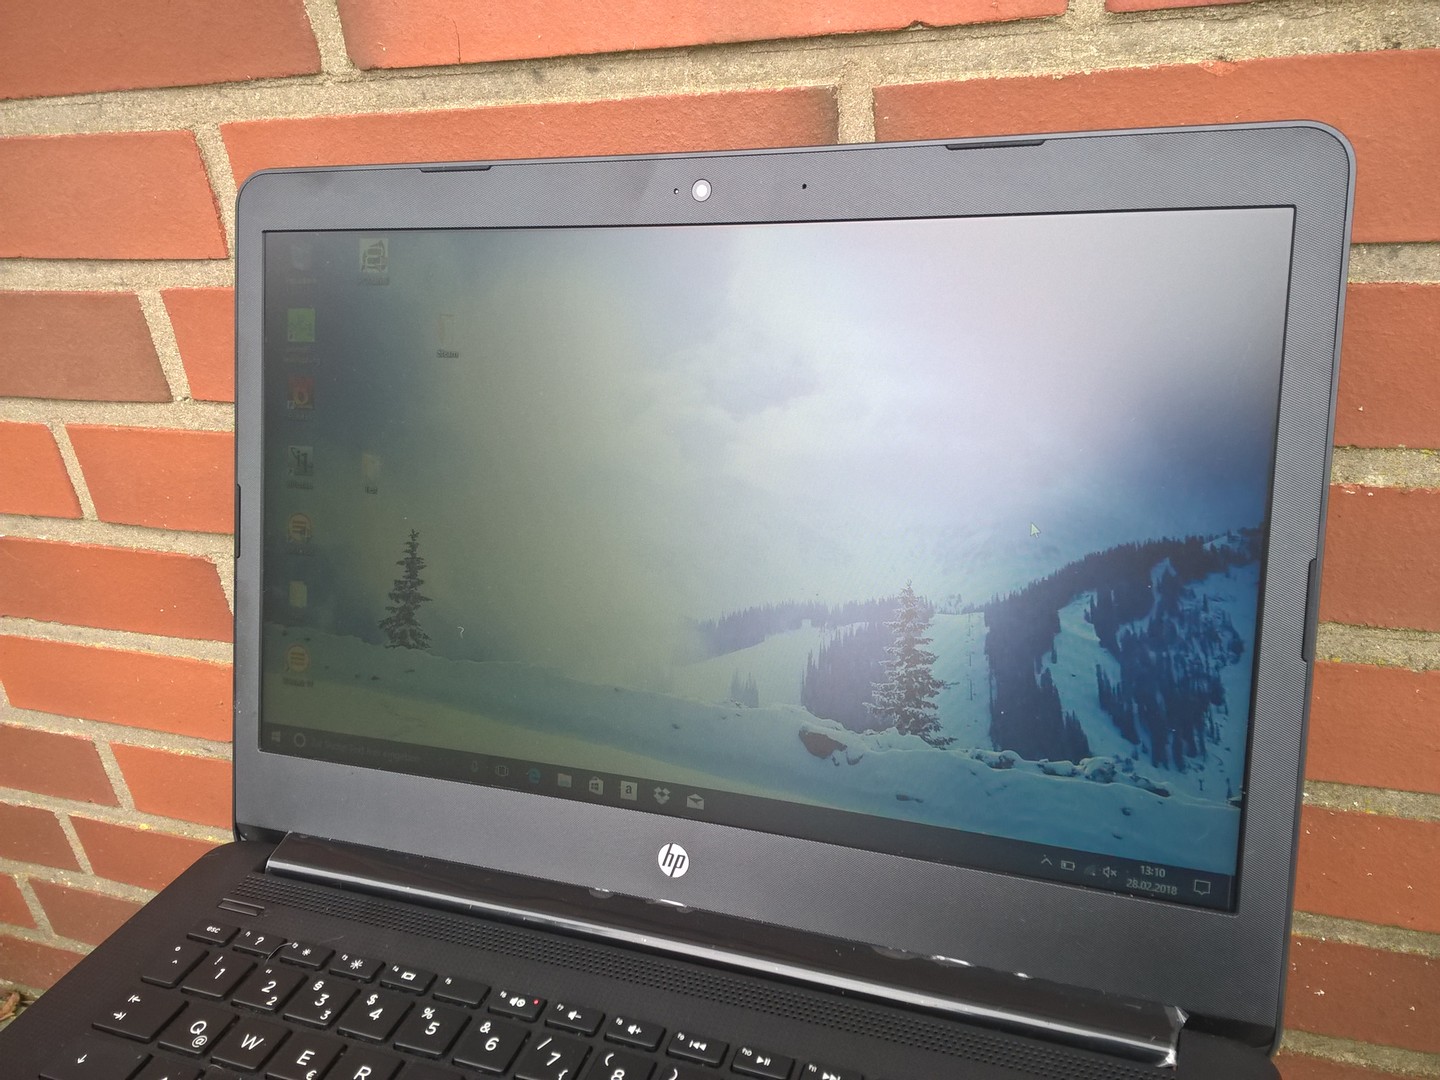
HP 14 (N3710, HD405) Laptop Review
HP-14 laptops have long been characterized by their low-end hardware and their low prices. HP offers different processor and memory combinations with varying degrees of performance. HP describes every variant as an entry-level device, a statement which our previous test results have confirmed.
Our current test device is available for around €350 (~$433) and is equipped with an Intel Pentium N3710 processor, an Intel HD Graphics 405 graphics card, 4 GB of RAM, and a 500 GB HDD. We expect that our test device will have enough power for simple writing and web browsing tasks.
While similar variants are available in the UK, HP is not currently offering this device in the USA.
We have chosen the Acer Swift 1, Chuwi LapBook Air 14.1, Lenovo IdeaPad 120s, and the Jumper EZbook 3 as devices against which we will be comparing the HP 14-bp001ng. All devices are available for under €400 (~$495).
Case and Connectivity - Weak Wi-Fi
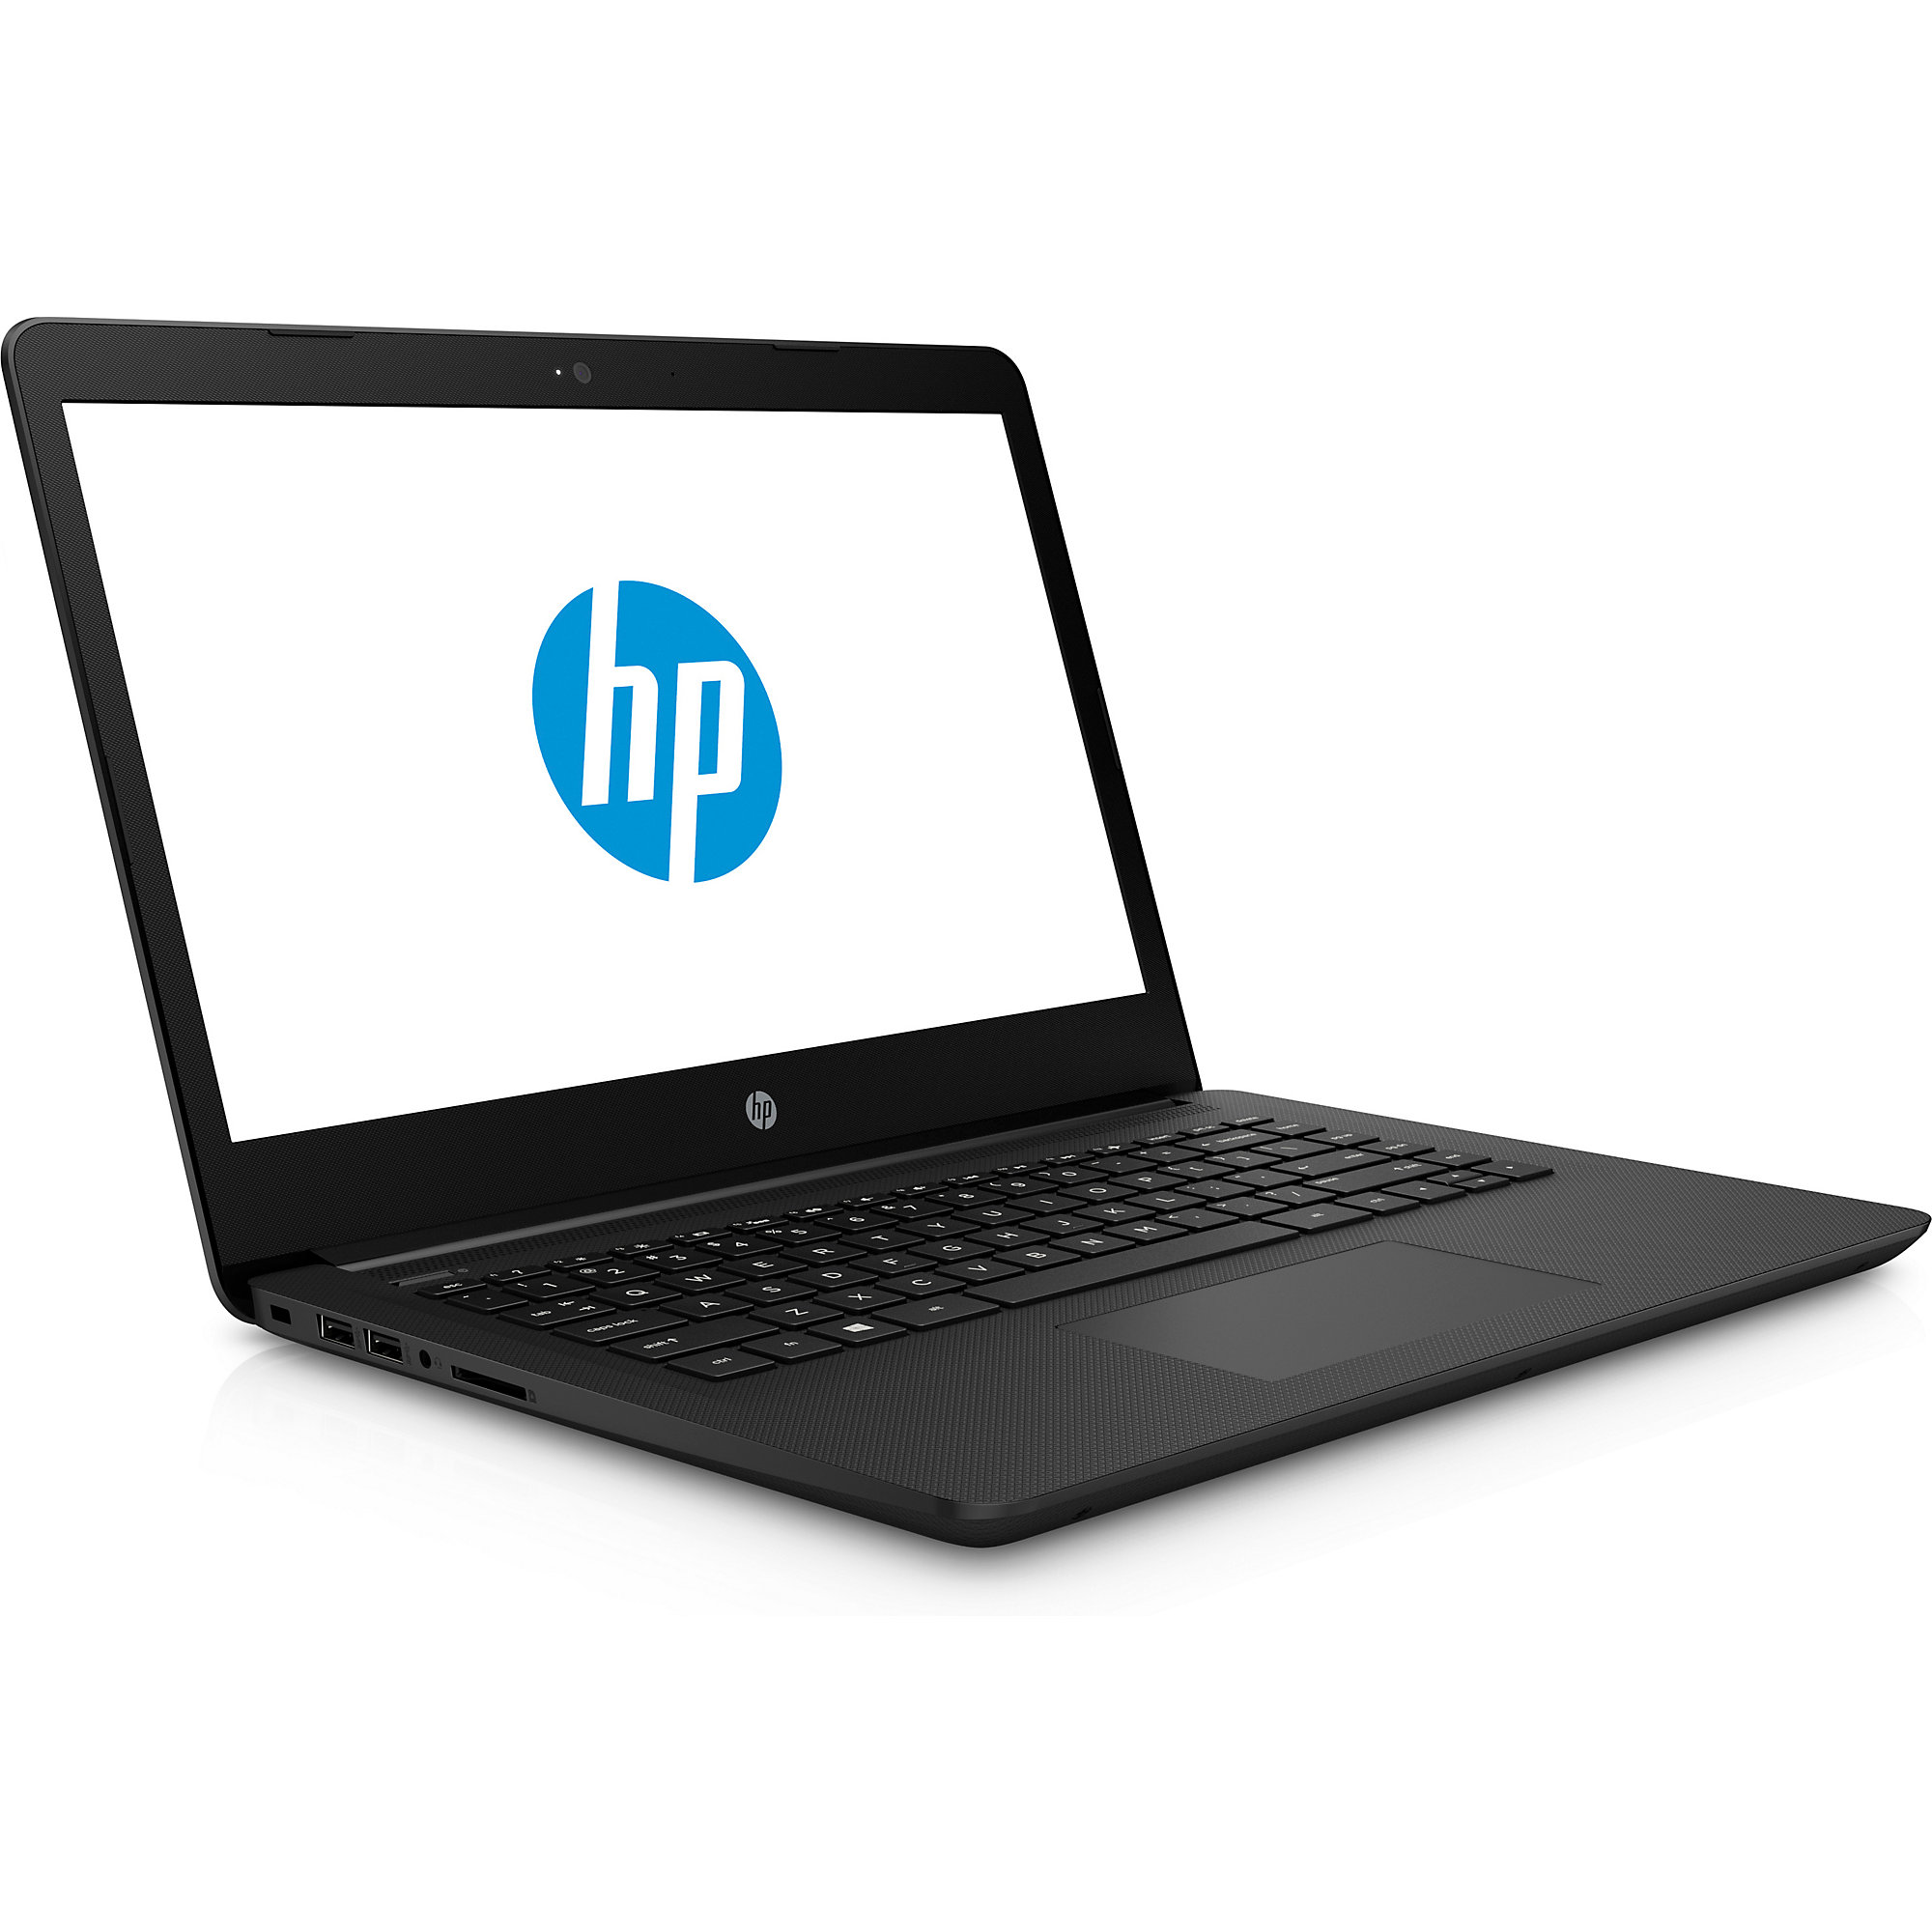
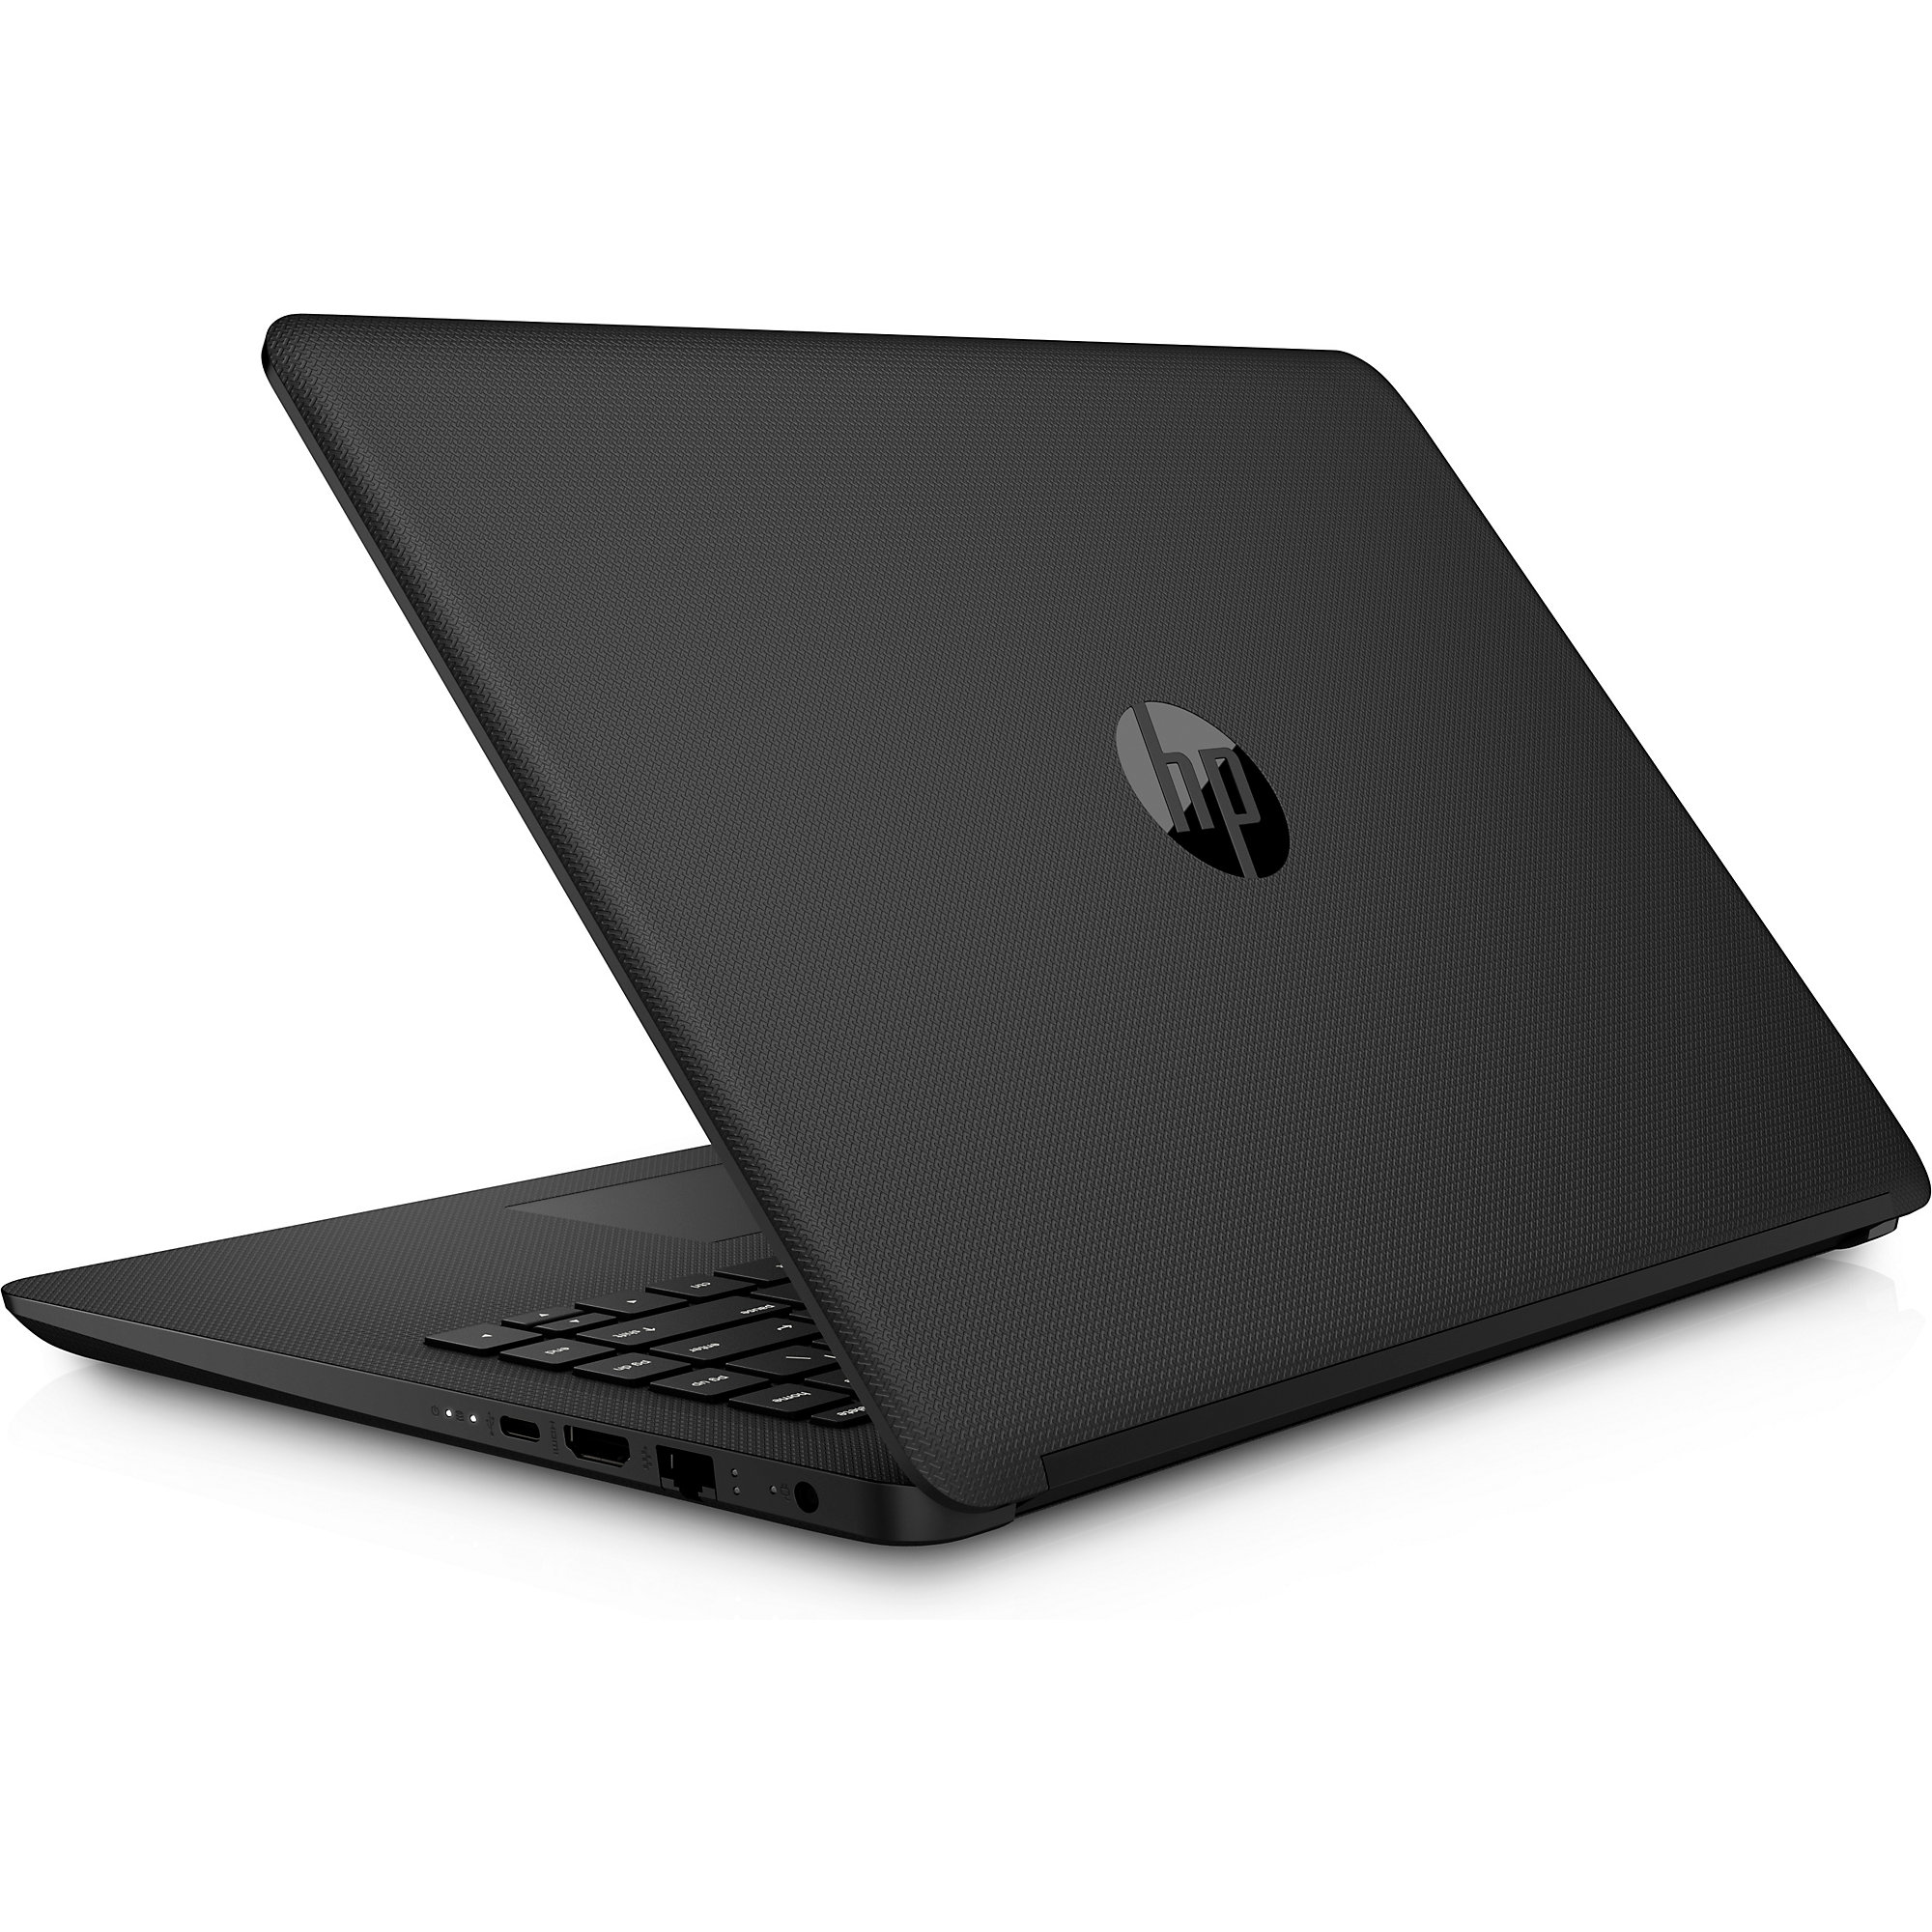
The reasonableness of the 14-bp001ng’s pricing extends to our first impressions of the case. HP have decked the device out in a simple plastic case that is stable and strong, and one which does not deform or give way even when strong physical pressure is applied. The base plate is held in place with three screws, behind which are the internal components including an unoccupied RAM slot.
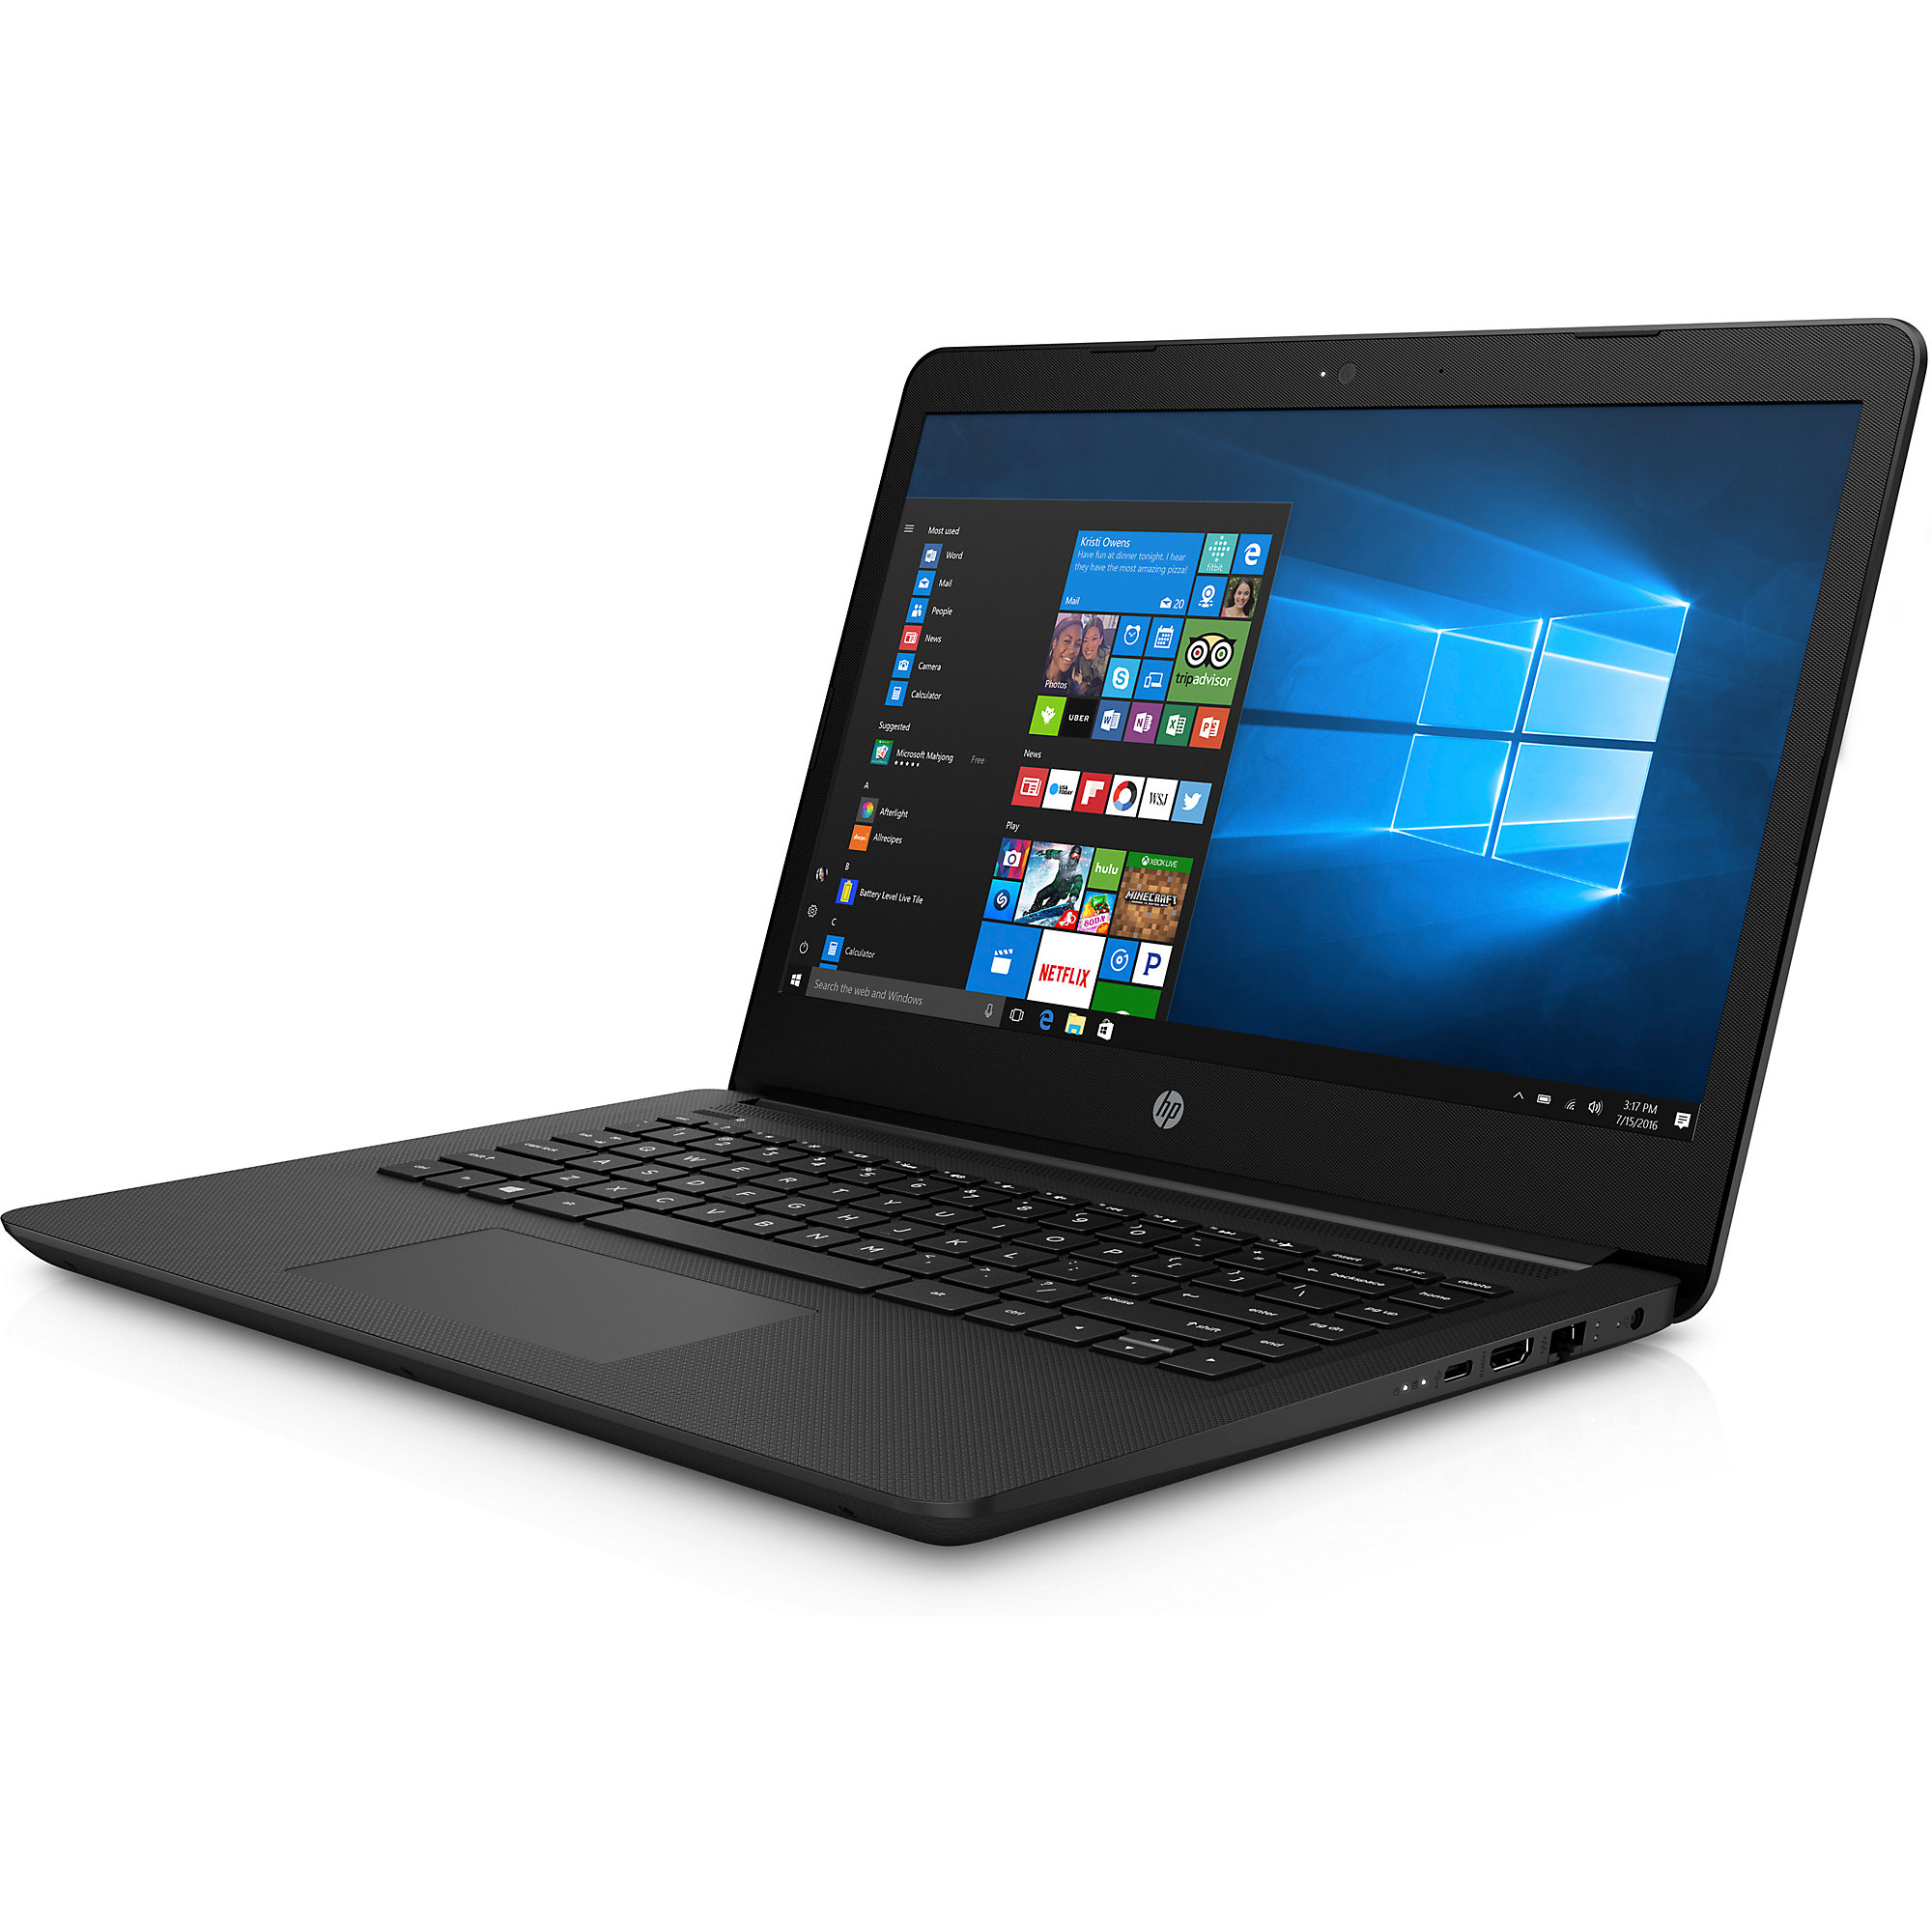
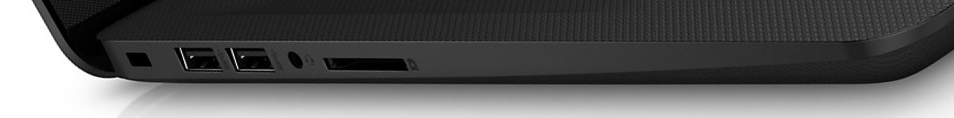
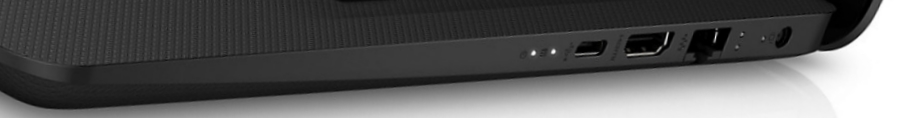
Despite the low price, HP has equipped the 14-bp001ng with a relatively modern selection of ports. There is a USB 3.1 Type-C port, two USB 3.1 Type-A, HDMI, Gigabit LAN, and an SD card reader.
The 14-bp001ng delivers below average read and write speeds using our reference Toshiba Exceria Pro SDXC 64 GB UHS-II card. These results are slightly better than some similarly priced devices, but the IdeaPad 120s' decent results demonstrate that below average performance is not synonymous with entry-level devices.
Unfortunately, Wi-Fi transfer speeds are even worse. Our test device practically failed our reception test, with there being a significant signal loss with our test device at only three meters (~10 ft) from the router. Furthermore, the 14-bp001ng is equipped with Bluetooth 4.2.
The webcam has a very low 640x360 VGA resolution that renders it only useful for occasional video calls.
Connectivity
| SD Card Reader | |
| average JPG Copy Test (av. of 3 runs) | |
| Lenovo Ideapad 120S-14IAP (Toshiba Exceria Pro M401 Reference-Card) | |
| Average of class Office (19.8 - 198.5, n=21, last 2 years) | |
| Chuwi LapBook 14 inch 2017 | |
| HP 14-bp001ng (Toshiba Exceria Pro SDXC 64 GB UHS-II) | |
| Acer Swift 1 SF114-31-P6F6 (Toshiba Exceria Pro SDXC 64 GB UHS-II) | |
| Jumper EZbook 3 | |
| maximum AS SSD Seq Read Test (1GB) | |
| Lenovo Ideapad 120S-14IAP (Toshiba Exceria Pro M401 Reference-Card) | |
| Average of class Office (27.4 - 249, n=20, last 2 years) | |
| Chuwi LapBook 14 inch 2017 | |
| HP 14-bp001ng (Toshiba Exceria Pro SDXC 64 GB UHS-II) | |
| Acer Swift 1 SF114-31-P6F6 (Toshiba Exceria Pro SDXC 64 GB UHS-II) | |
| Jumper EZbook 3 (Toshiba Exceria Pro M401 64 GB) | |
| Networking | |
| iperf3 transmit AX12 | |
| Lenovo Ideapad 120S-14IAP | |
| Chuwi LapBook 14 inch 2017 | |
| Jumper EZbook 3 | |
| Acer Swift 1 SF114-31-P6F6 (jseb) | |
| HP 14-bp001ng | |
| iperf3 receive AX12 | |
| Chuwi LapBook 14 inch 2017 | |
| Lenovo Ideapad 120S-14IAP | |
| Jumper EZbook 3 | |
| Acer Swift 1 SF114-31-P6F6 (jseb) | |
| HP 14-bp001ng | |
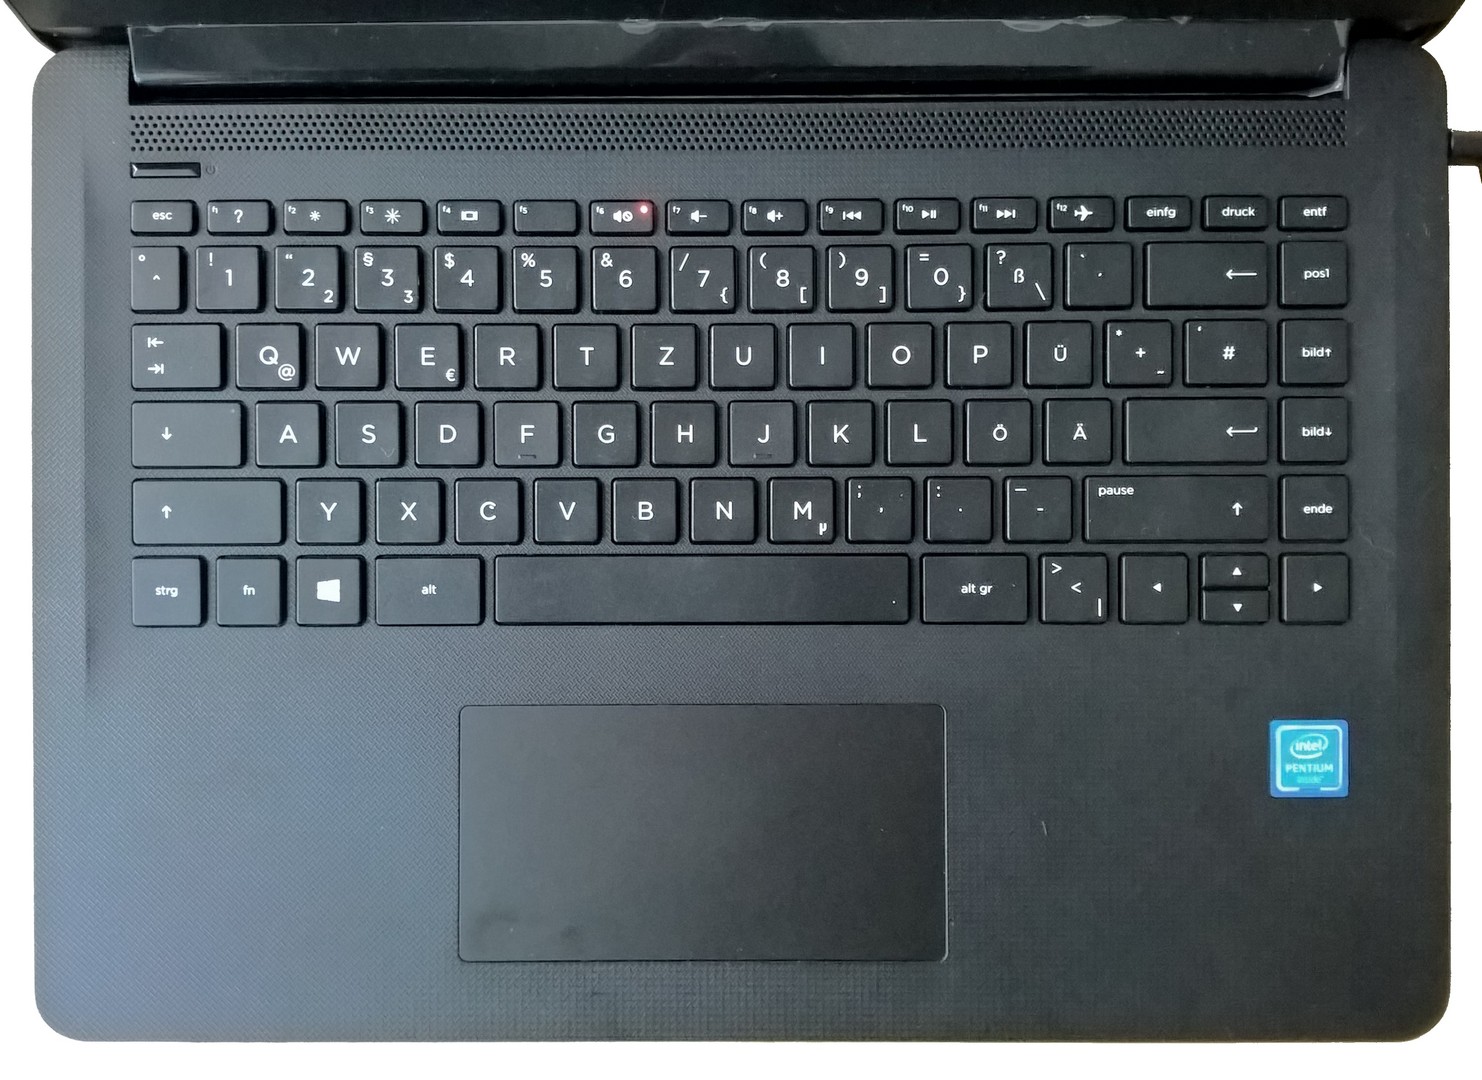
Input devices - Solid and Suitable for Daily Use
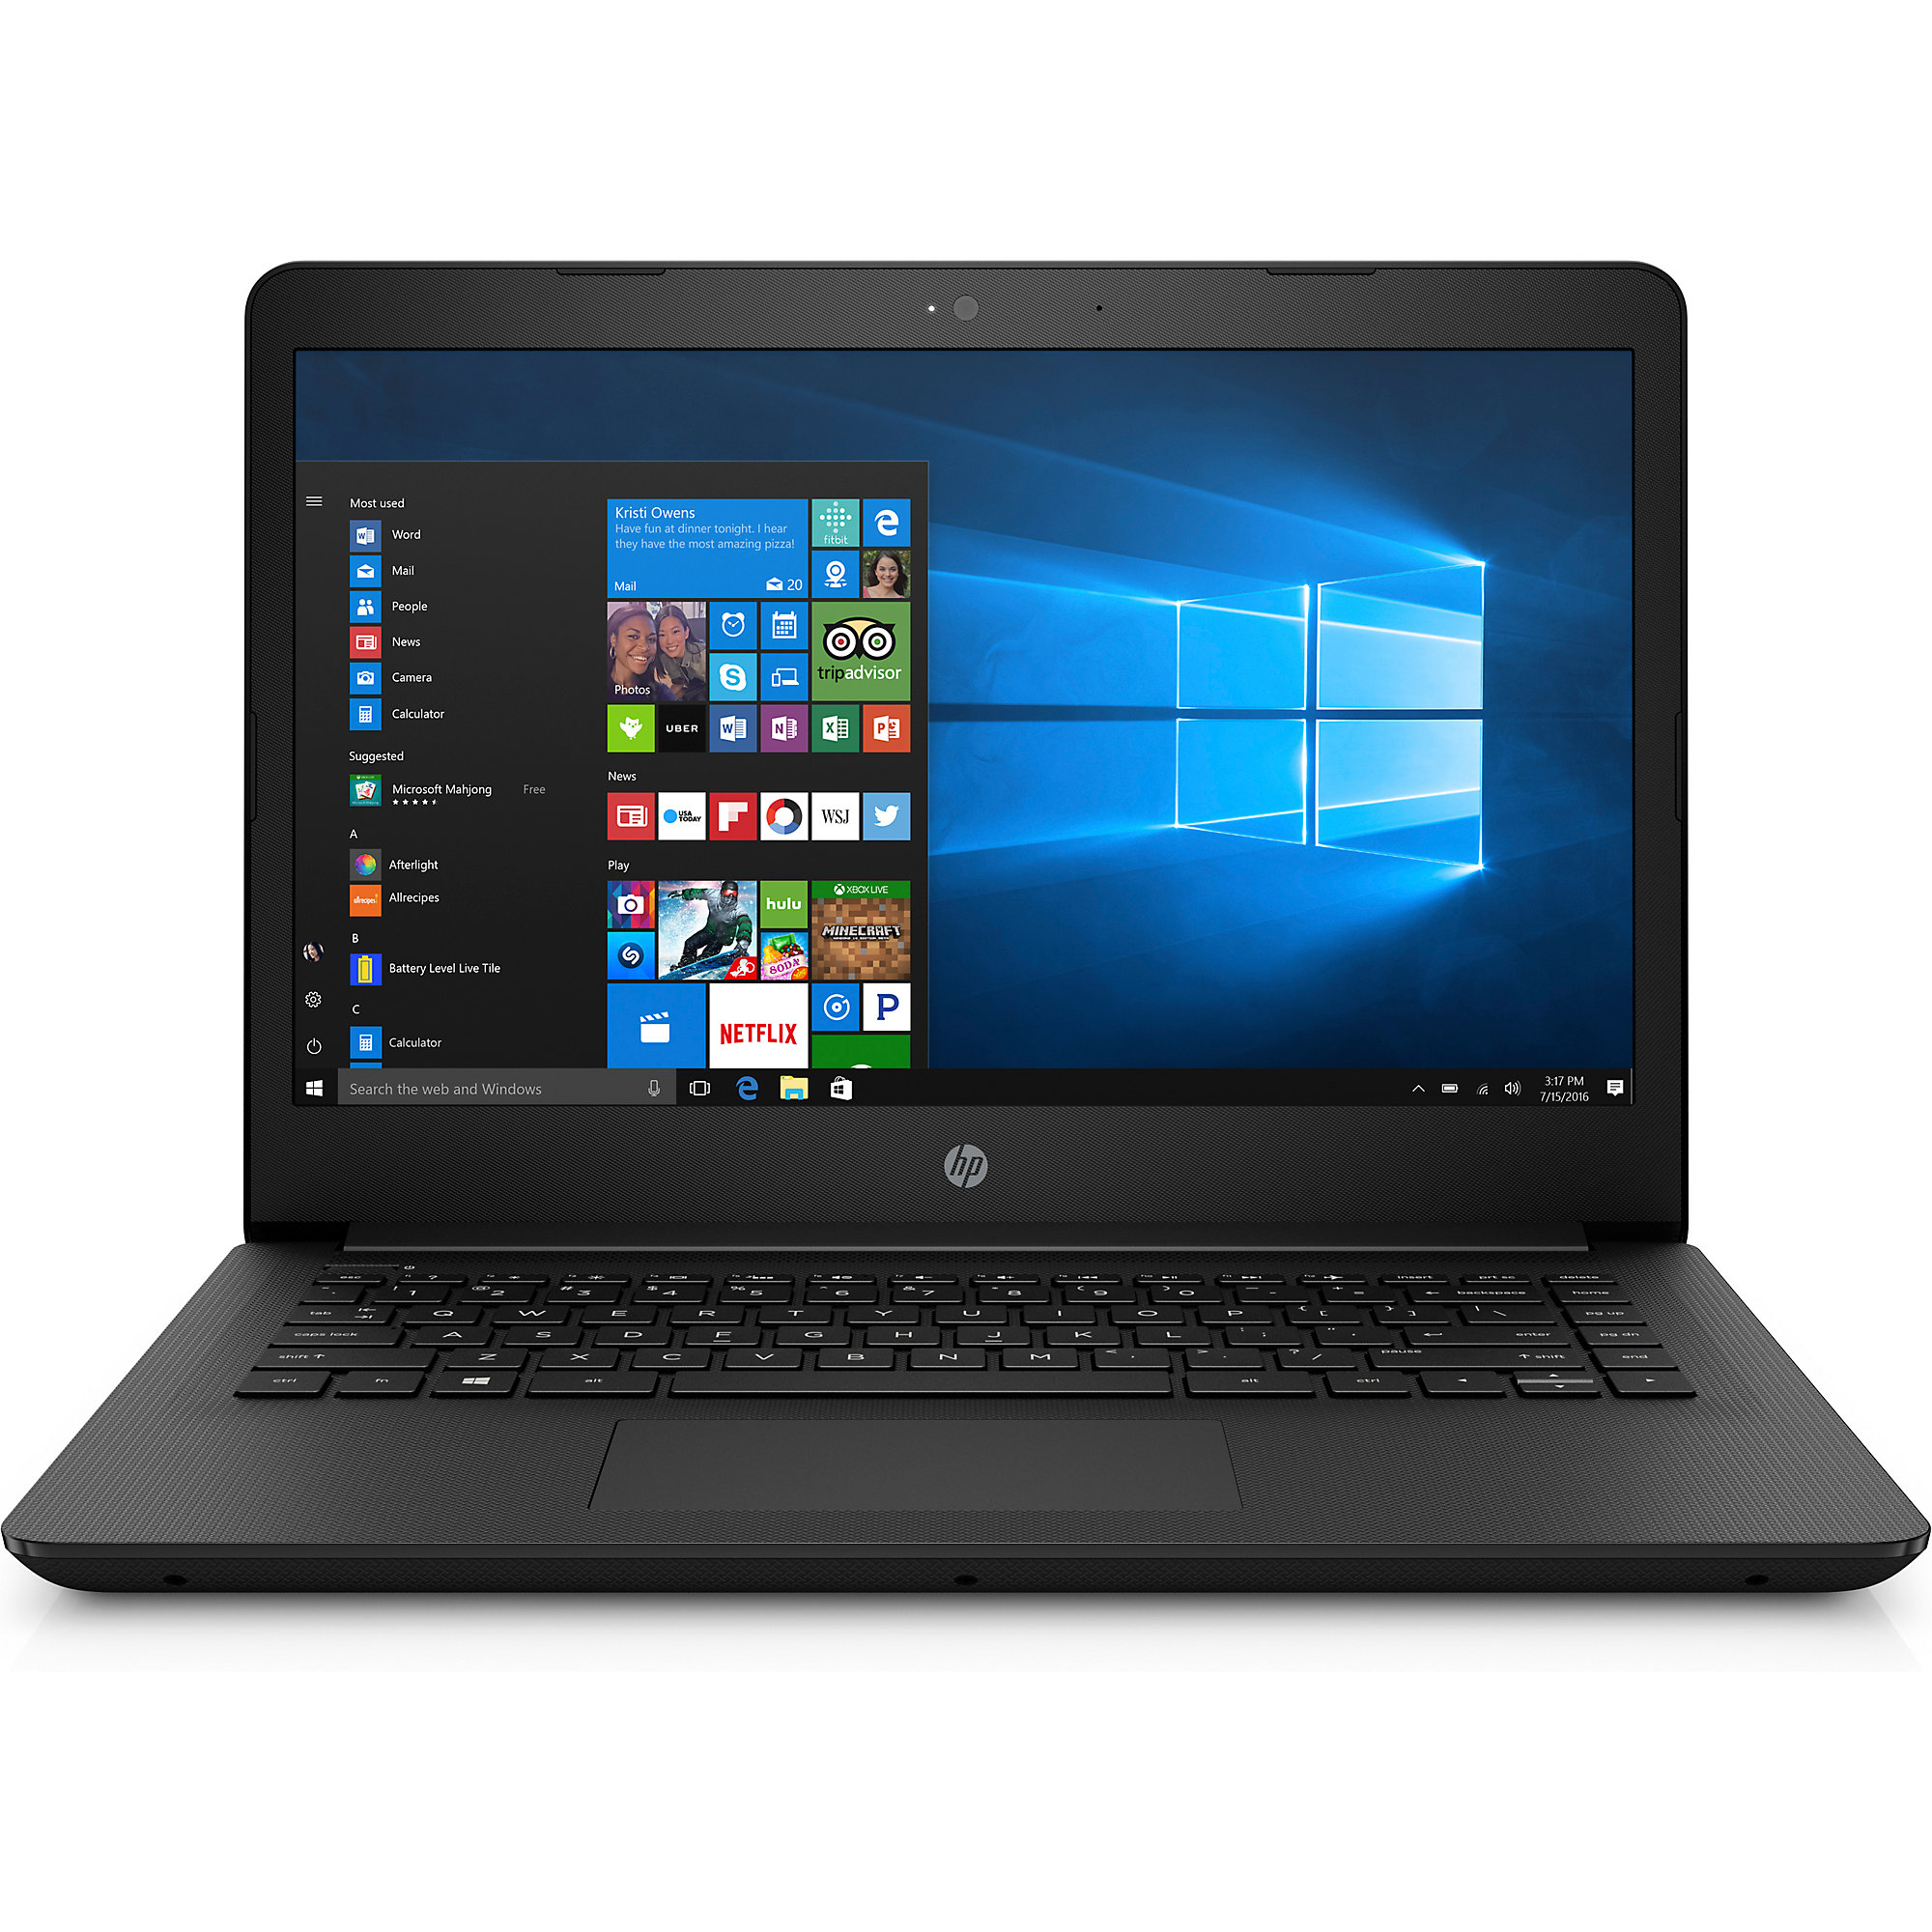
The keyboard keys have a strong pressure point and are clearly audible when typing. The good layout and space between keys provide a comfortable typing experience that we found is good enough to type on uninterrupted for a long time. The only minor gripe is that the special keys on the far right-hand side are close to the Enter key, the placing of which could lead to accidental button presses.
The 14-bp001ng uses a ClickPad as a mouse replacement. This is pleasant to use and is large enough to comfortably move the mouse over a large area without having to lift your finger from the ClickPad. The 'mouse buttons', which are triggered by pressing the ClickPad, are easy to activate. The resistance is high enough so that these buttons should not be accidentally pressed in daily use.
There were no issues with the 14-bp001's input devices during our tests. They were solid and suitable for everyday use.
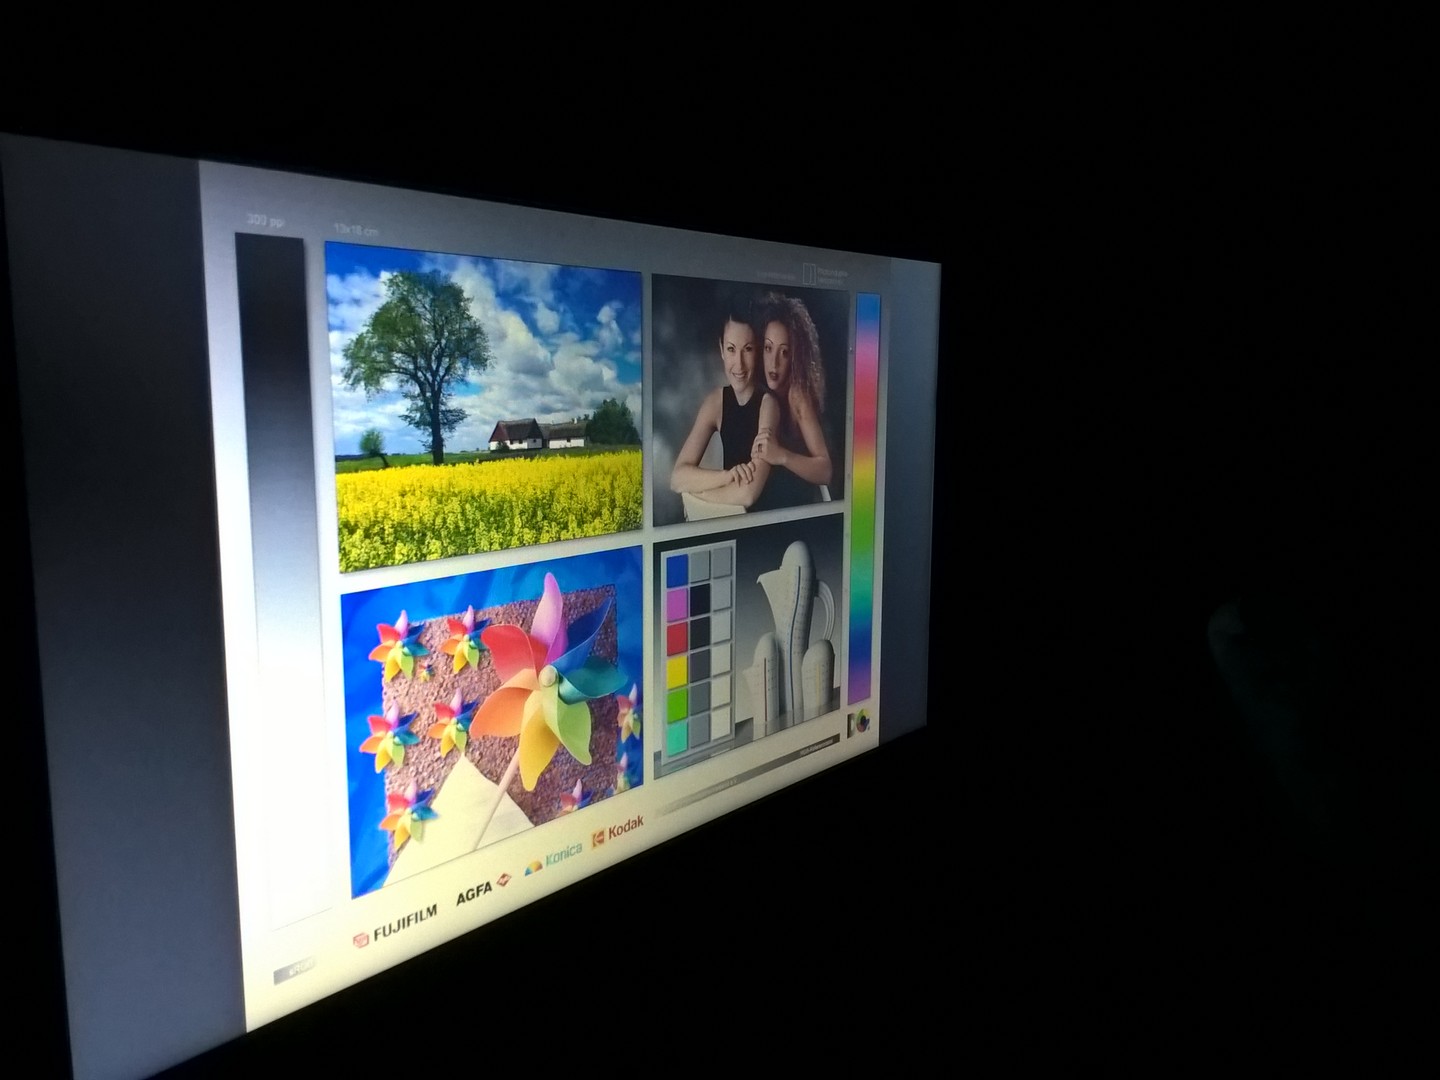
Display - Pale and Dark
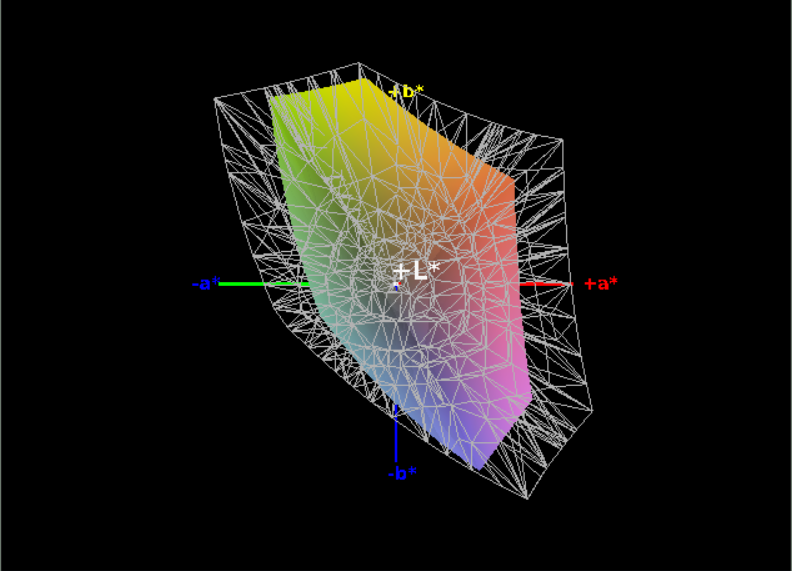
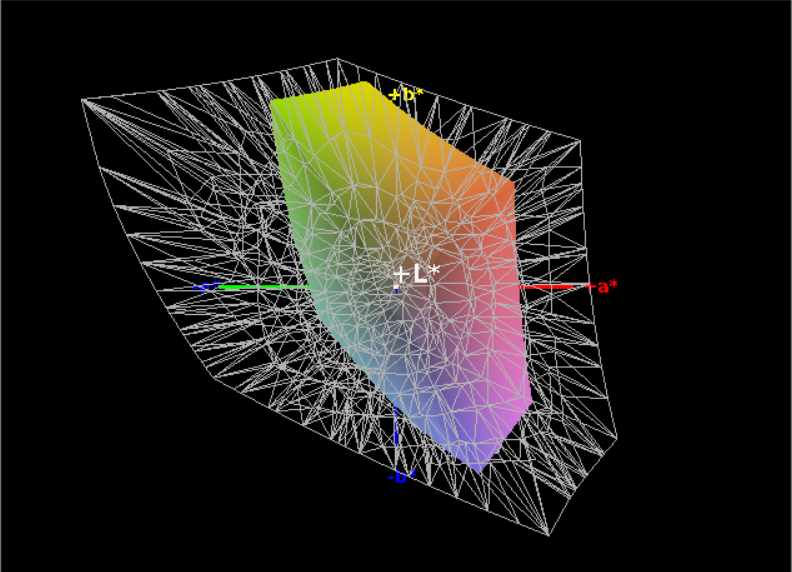
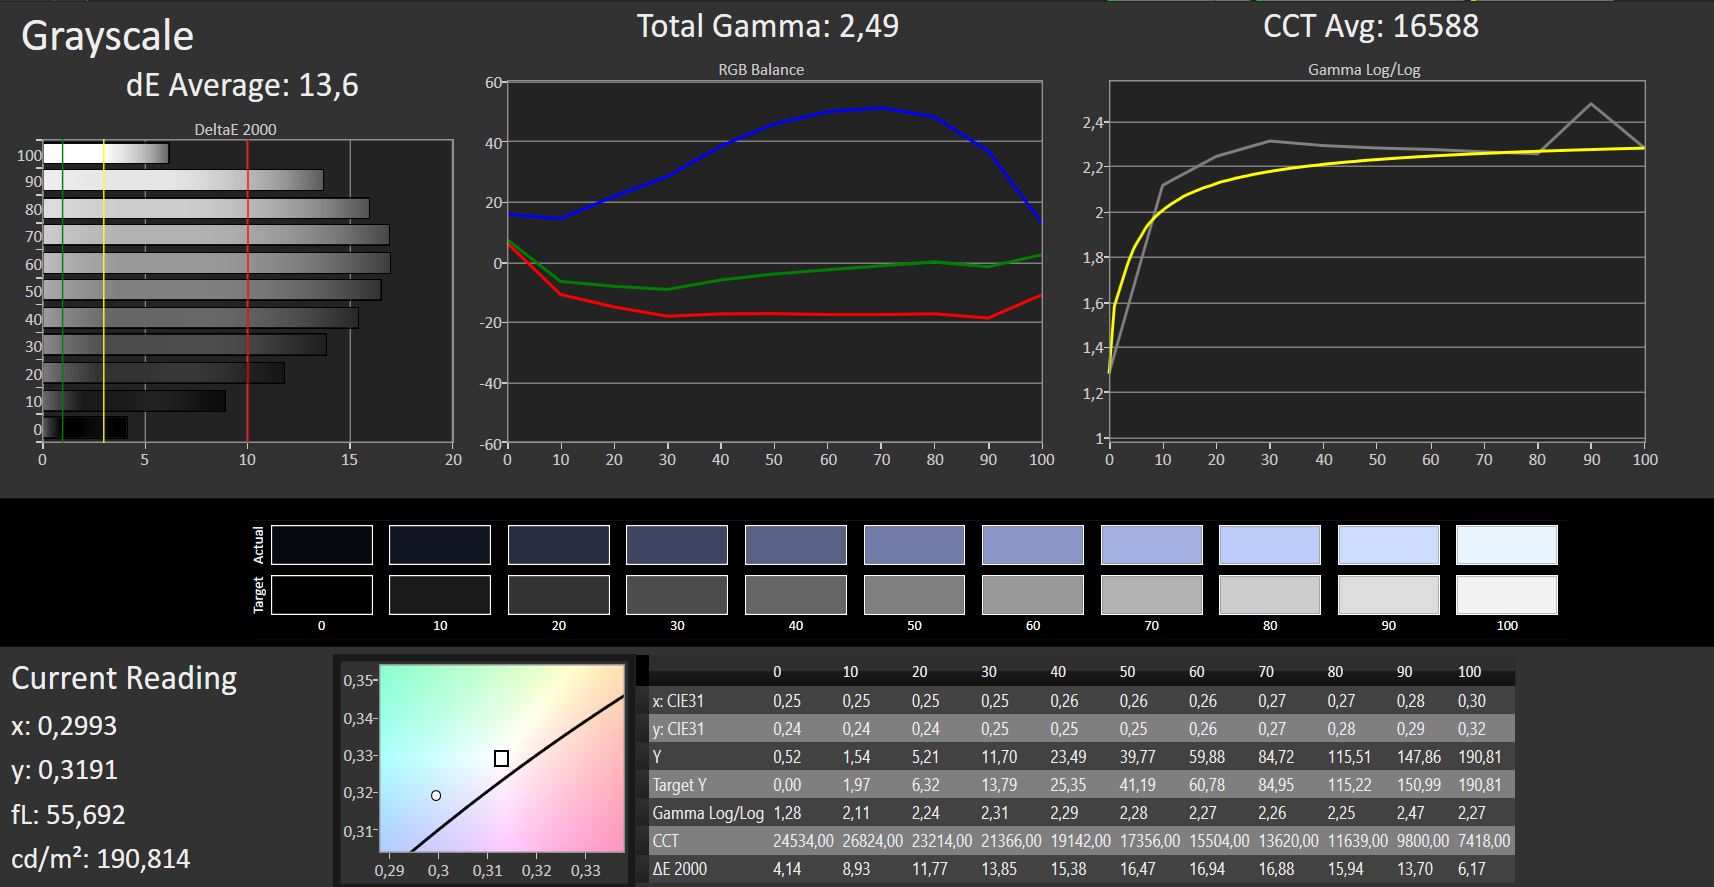
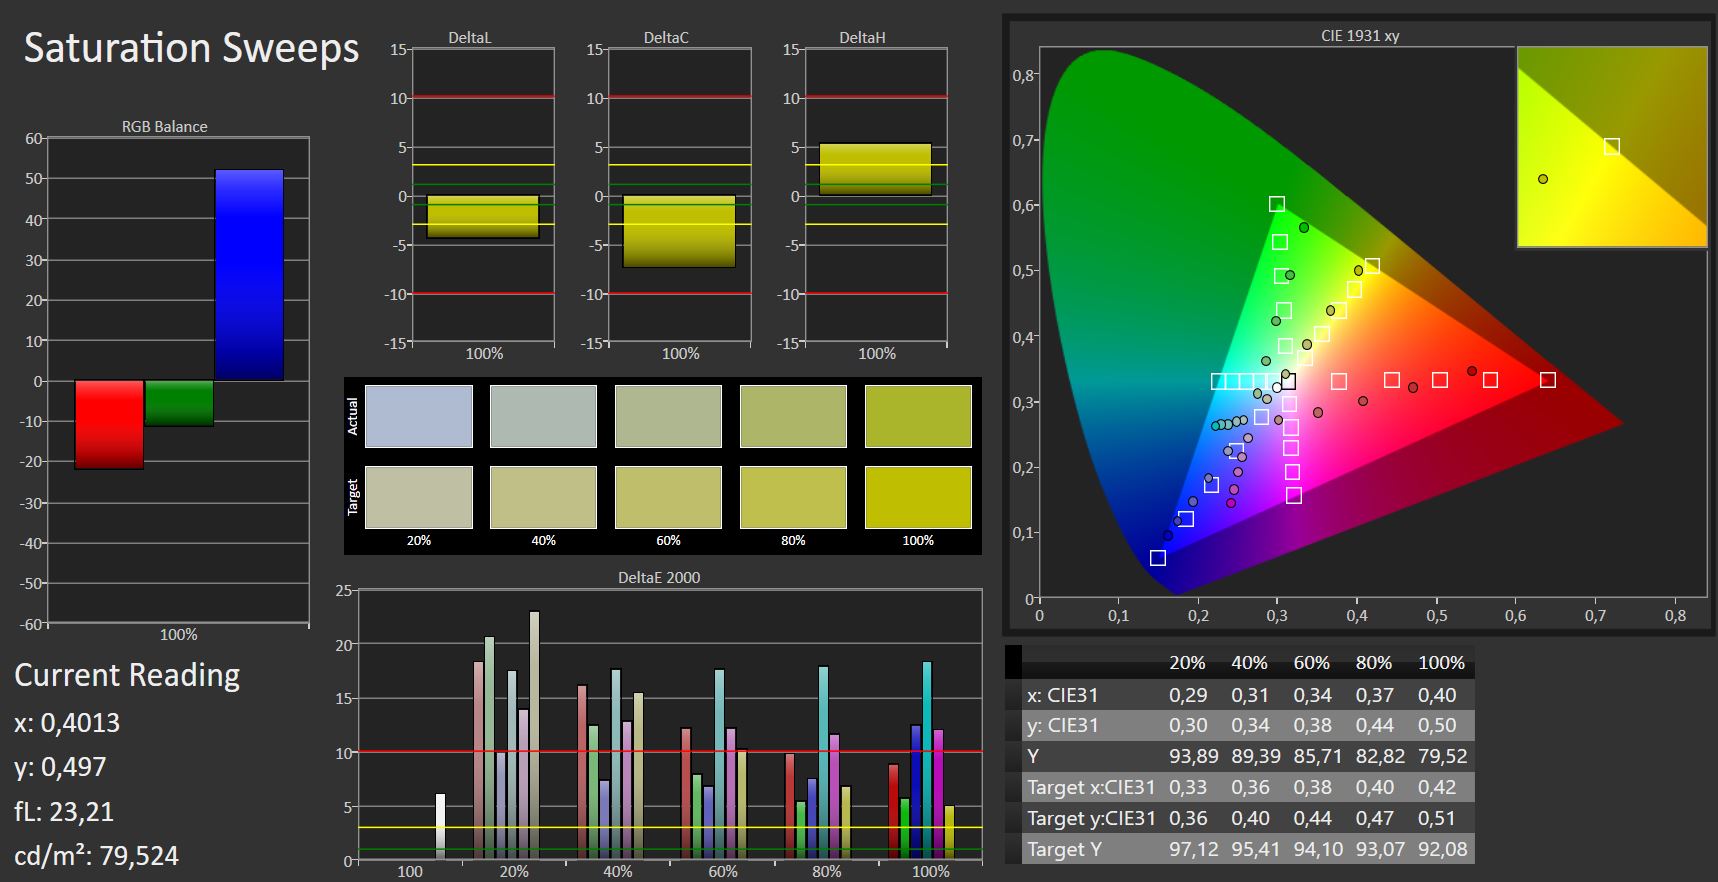
We have major issues with HP’s choice of display. The 14-bp001ng has a 1,366x768 14-inch panel that has poor brightness and produces pale colors. This is the only display that HP offers with this laptop. Almost all the displays in our comparison devices are better than the one in the 14-bp001ng. Our tests revealed that the display has both low brightness and contrast ratio.
| |||||||||||||||||||||||||
Brightness Distribution: 88 %
Center on Battery: 155 cd/m²
Contrast: 357:1 (Black: 0.53 cd/m²)
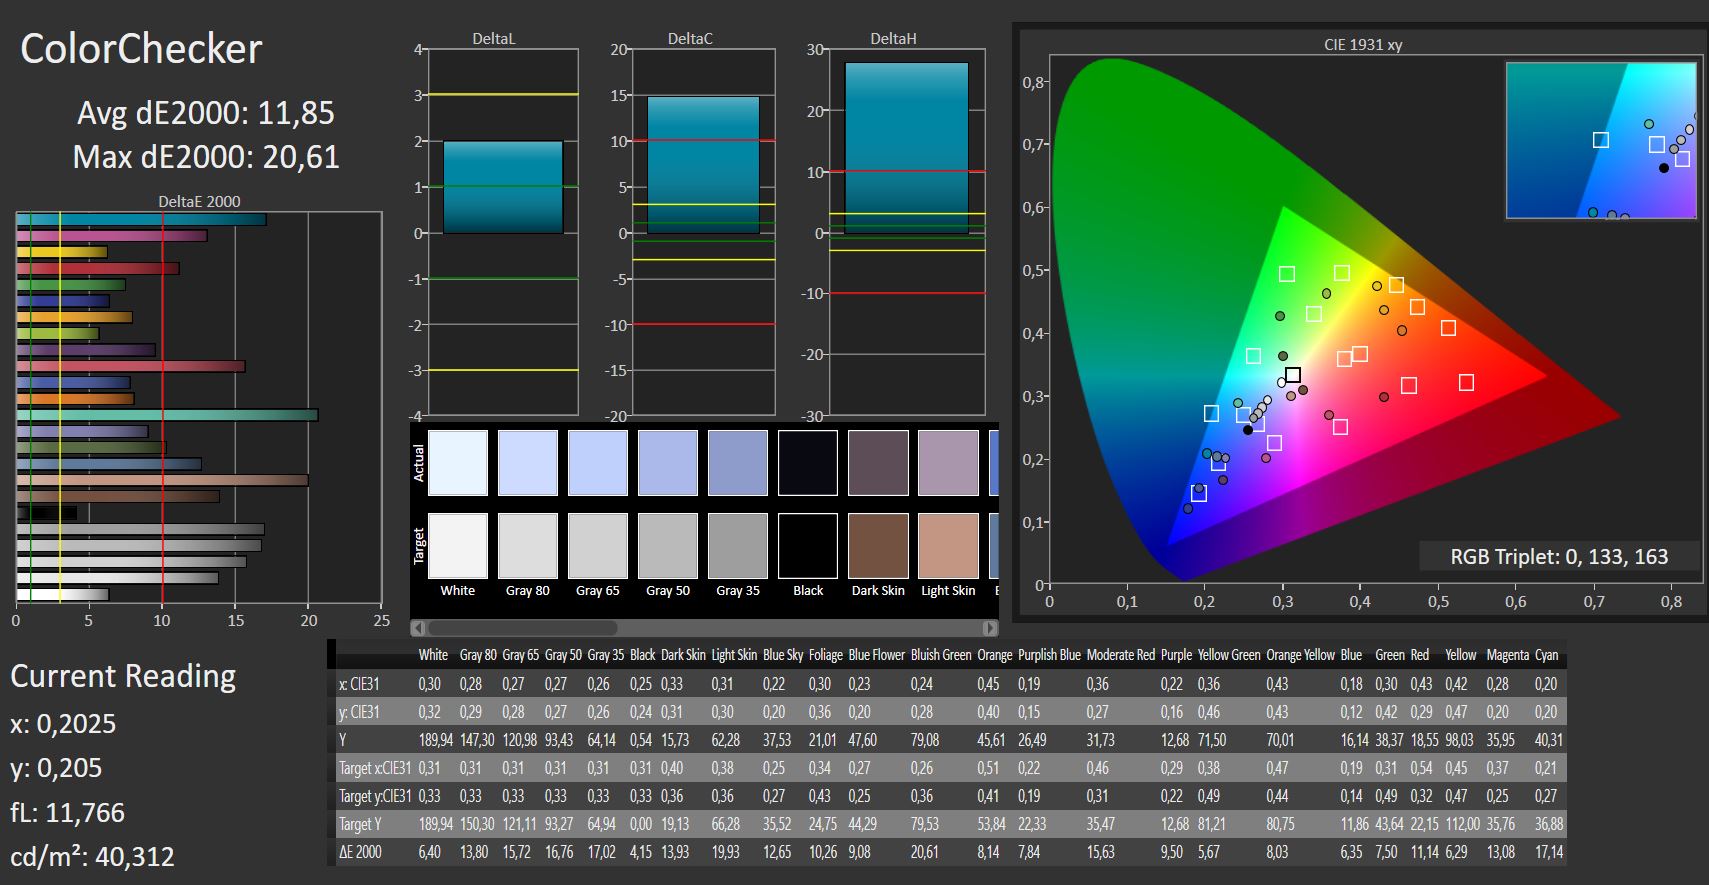
ΔE ColorChecker Calman: 11.85 | ∀{0.5-29.43 Ø4.72}
ΔE Greyscale Calman: 13.6 | ∀{0.09-98 Ø4.97}
61% sRGB (Argyll 1.6.3 3D)
49% AdobeRGB 1998 (Argyll 1.6.3 3D)
41.77% AdobeRGB 1998 (Argyll 3D)
60.8% sRGB (Argyll 3D)
40.43% Display P3 (Argyll 3D)
Gamma: 2.49
CCT: 16588 K
| HP 14-bp001ng BOE0697, , 1366x768, 14" | Lenovo Ideapad 120S-14IAP Chi Mei N140BGA-EA3, , 1366x768, 14" | Jumper EZbook 3 MS_9003, , 1920x1080, 14.1" | Chuwi LapBook 14 inch 2017 Name: BOE06A8, , 1920x1080, 14.1" | Acer Aspire 1 A114-31-C472 CMN N140BGA_EA3, , 1366x768, 14" | |
|---|---|---|---|---|---|
| Display | 2% | 27% | 5% | 2% | |
| Display P3 Coverage (%) | 40.43 | 41.32 2% | 51.6 28% | 42.53 5% | 41.31 2% |
| sRGB Coverage (%) | 60.8 | 62 2% | 77.3 27% | 63.6 5% | 61.7 1% |
| AdobeRGB 1998 Coverage (%) | 41.77 | 42.7 2% | 53 27% | 43.93 5% | 42.72 2% |
| Response Times | -3% | 5% | -43% | -4% | |
| Response Time Grey 50% / Grey 80% * (ms) | 43 ? | 35.2 ? 18% | 46 ? -7% | 32.8 ? 24% | 40 ? 7% |
| Response Time Black / White * (ms) | 14 ? | 17.2 ? -23% | 11.6 ? 17% | 29.2 ? -109% | 16 ? -14% |
| PWM Frequency (Hz) | 200 ? | 495 ? | 200 ? | 200 ? | 1000 ? |
| Screen | 4% | 9% | 30% | 14% | |
| Brightness middle (cd/m²) | 189 | 257.4 36% | 384 103% | 247.7 31% | 206 9% |
| Brightness (cd/m²) | 190 | 239 26% | 341 79% | 243 28% | 187 -2% |
| Brightness Distribution (%) | 88 | 87 -1% | 76 -14% | 92 5% | 82 -7% |
| Black Level * (cd/m²) | 0.53 | 0.54 -2% | 1.28 -142% | 0.32 40% | 0.34 36% |
| Contrast (:1) | 357 | 477 34% | 300 -16% | 774 117% | 606 70% |
| Colorchecker dE 2000 * | 11.85 | 11.8 -0% | 8.7 27% | 6.4 46% | 10.01 16% |
| Colorchecker dE 2000 max. * | 20.61 | 28 -36% | 16.7 19% | 24.3 -18% | 16.72 19% |
| Greyscale dE 2000 * | 13.6 | 13.3 2% | 11.1 18% | 4.5 67% | 11.11 18% |
| Gamma | 2.49 88% | 2.2 100% | 2.2 100% | 2.33 94% | 2.43 91% |
| CCT | 16588 39% | 16811 39% | 12445 52% | 7318 89% | 12726 51% |
| Color Space (Percent of AdobeRGB 1998) (%) | 49 | 39 -20% | 39.8 -19% | 39 -20% | |
| Color Space (Percent of sRGB) (%) | 61 | 62 2% | 62.9 3% | 62 2% | |
| Total Average (Program / Settings) | 1% /
3% | 14% /
13% | -3% /
15% | 4% /
9% |
* ... smaller is better
Display Response Times
| ↔ Response Time Black to White | ||
|---|---|---|
| 14 ms ... rise ↗ and fall ↘ combined | ↗ 8 ms rise | 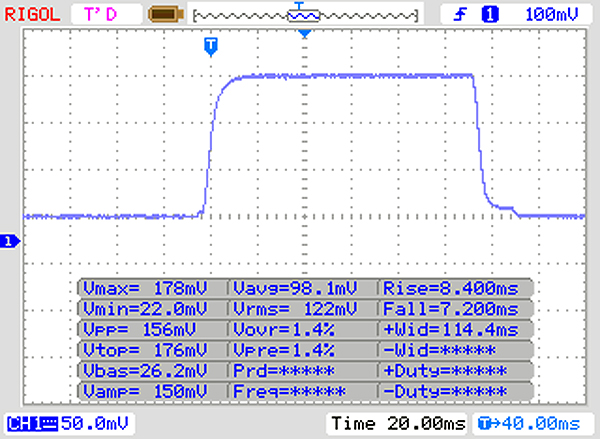 |
| ↘ 7 ms fall | ||
| The screen shows good response rates in our tests, but may be too slow for competitive gamers. In comparison, all tested devices range from 0.1 (minimum) to 240 (maximum) ms. » 34 % of all devices are better. This means that the measured response time is better than the average of all tested devices (19.8 ms). | ||
| ↔ Response Time 50% Grey to 80% Grey | ||
| 43 ms ... rise ↗ and fall ↘ combined | ↗ 23 ms rise | 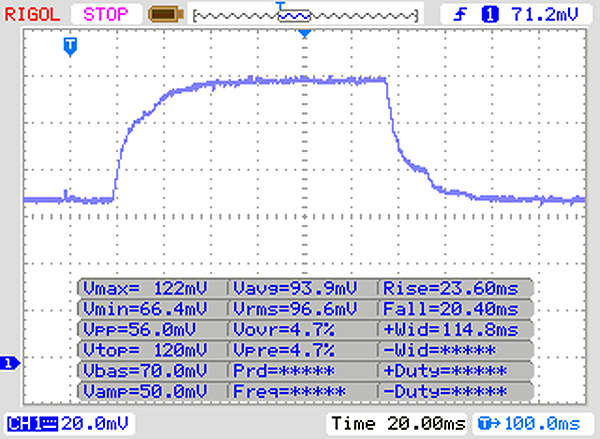 |
| ↘ 20 ms fall | ||
| The screen shows slow response rates in our tests and will be unsatisfactory for gamers. In comparison, all tested devices range from 0.165 (minimum) to 636 (maximum) ms. » 71 % of all devices are better. This means that the measured response time is worse than the average of all tested devices (31 ms). | ||
Screen Flickering / PWM (Pulse-Width Modulation)
| Screen flickering / PWM detected | 200 Hz | ≤ 90 % brightness setting | 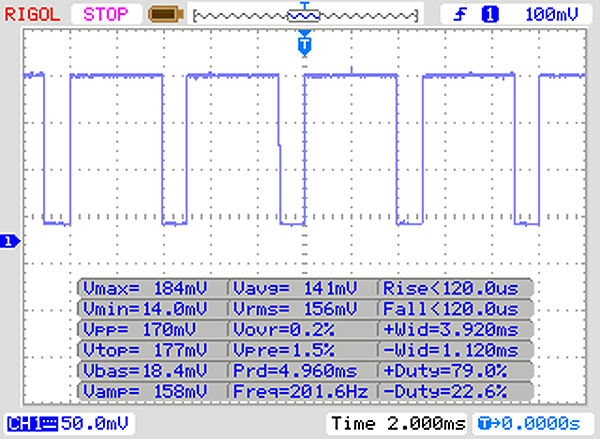 |
The display backlight flickers at 200 Hz (worst case, e.g., utilizing PWM) Flickering detected at a brightness setting of 90 % and below. There should be no flickering or PWM above this brightness setting. The frequency of 200 Hz is relatively low, so sensitive users will likely notice flickering and experience eyestrain at the stated brightness setting and below. In comparison: 52 % of all tested devices do not use PWM to dim the display. If PWM was detected, an average of 7763 (minimum: 5 - maximum: 343500) Hz was measured. | |||
Colors on our test device look cool and somewhat pale. There is a subtle gray haze thanks to the high black value, while the low contrast ratio ensures that color transitions are poor. A further criticizm is the very low PWM frequency that the 14-bp001ng uses to control screen brightness, which we found to quickly irritate even those without sensitive eyes.
Color distortions occur at various viewing angles. The TN-LED panel is not particularly bright, with the screen being difficult to read outside, even in the shade.
Performance - Low, but Stable
Our test device is equipped with an Intel Pentium N3710 CPU with integrated Intel HD Graphics 405. This combination is only suitable for simple tasks such as browsing the internet or using Office. While it should be possible to play music and videos, games are likely to be out of the question unless they are very old or computationally undemanding.
HP offers the HP 14 in a range of variants, all of which are designed for those with simple needs. Unfortunately, we could not confirm whether there is a free RAM slot as HP claim. Despite loosening the screws, the base plate was so tightly held in that we feared that we may damage the device if we tried to pry it from the main case.
Processor
The Intel Pentium N3710 is a quad-core processor mainly used in inexpensive notebooks and in fan-less devices thanks to its low 6 W power consumption. While the CPU can clock up to 2560 MHz, the quality of the cooling affects the degree to which it can maintain its maximum clock speed.
The Cinebench15 benchmark shows that our test device performs at the expected level for a Pentium N3710 device. Throughout our endurance test, the 14-bp001ng provided the CPU's maximum performance. Therefore, you should not expect any performance loss due to insufficient cooling during everyday use.
Our test device performs as expected for a Pentium N3710 equipped device when comparing it with our comparison devices. The 14-bp001ng even managed to perform better than average.
| Cinebench R15 | |
| CPU Single 64Bit | |
| Average of class Office (99.5 - 312, n=73, last 2 years) | |
| Acer Aspire 1 A114-31-C472 | |
| Jumper EZbook 3 | |
| Lenovo Ideapad 120S-14IAP | |
| Acer Swift 1 SF114-31-P6F6 | |
| Average Intel Pentium N3710 (39 - 42, n=6) | |
| HP 14-bp001ng | |
| Chuwi LapBook 14 inch 2017 | |
| CPU Multi 64Bit | |
| Average of class Office (250 - 3380, n=73, last 2 years) | |
| Acer Swift 1 SF114-31-P6F6 | |
| Acer Aspire 1 A114-31-C472 | |
| HP 14-bp001ng | |
| Average Intel Pentium N3710 (105 - 152, n=6) | |
| Chuwi LapBook 14 inch 2017 | |
| Lenovo Ideapad 120S-14IAP | |
| Jumper EZbook 3 | |
System Performance
The 14-bp001ng performs well in daily use. There are short loading times because of longer access speeds associated with a HDD rather than an SSD. These access speeds affect the PCMark 8 Home benchmark result, which is about 100 points lower than the average of our comparison devices that are equipped with a Pentium N3710.
Please see our CPU benchmark page for a more detailed look at the results of other Intel Pentium N3710 laptops.
| PCMark 8 - Home Score Accelerated v2 | |
| Average of class Office (n=1last 2 years) | |
| Acer Swift 1 SF114-31-P6F6 | |
| Acer Aspire 1 A114-31-C472 | |
| Average Intel Pentium N3710, Intel HD Graphics 405 (Braswell) (1651 - 2114, n=6) | |
| Lenovo Ideapad 120S-14IAP | |
| HP 14-bp001ng | |
| Chuwi LapBook 14 inch 2017 | |
| Jumper EZbook 3 | |
| PCMark 8 Home Score Accelerated v2 | 1769 points | |
Help | ||
Storage Devices
The HDD in the 14-bp001ng is clearly inferior by contrast to those in our comparison devices. The HDD is not particularly slow, but eMMC flash memory is much faster than conventional HDDs. Performance is acceptable though, while 500 GB of storage is large enough for personal information.
We have provided the results of the HDD in our test device compared with other drives on our SSD / HDD benchmark page.
| HP 14-bp001ng Toshiba MQ01ABF050 | Jumper EZbook 3 Toshiba 064G93 64 GB eMMC | Acer Swift 1 SF114-31-P6F6 128 GB eMMC Flash | Acer Aspire 1 A114-31-C472 Hynix HBG4a2 32 GB eMMC | Average Toshiba MQ01ABF050 | Average of class Office | |
|---|---|---|---|---|---|---|
| CrystalDiskMark 3.0 | 490% | 1363% | 2223% | 116% | 17566% | |
| Read Seq (MB/s) | 104.4 | 151 45% | 166.5 59% | 275.7 164% | 103 ? -1% | 3104 ? 2873% |
| Write Seq (MB/s) | 99.1 | 50 -50% | 85 -14% | 147.9 49% | 96.4 ? -3% | 2916 ? 2842% |
| Read 512 (MB/s) | 31.74 | 133 319% | 153.8 385% | 233.9 637% | 37.9 ? 19% | 899 ? 2732% |
| Write 512 (MB/s) | 40.27 | 41.3 3% | 75.6 88% | 132.1 228% | 39.5 ? -2% | 2309 ? 5634% |
| Read 4k (MB/s) | 0.384 | 5.07 1220% | 13.2 3338% | 24.06 6166% | 0.895 ? 133% | 54.1 ? 13989% |
| Write 4k (MB/s) | 0.911 | 2.47 171% | 13.04 1331% | 28.62 3042% | 0.862 ? -5% | 114.1 ? 12425% |
| Read 4k QD32 (MB/s) | 0.776 | 16.4 2013% | 35.12 4426% | 29.93 3757% | 6.91 ? 790% | 463 ? 59565% |
| Write 4k QD32 (MB/s) | 0.912 | 2.74 200% | 12.66 1288% | 35.02 3740% | 0.865 ? -5% | 370 ? 40470% |

Graphics Card
The performance of the entry-level GPU should not come as a surprise. The integrated Intel HD Graphics 405 performed solidly in the 3DMark 11 benchmark, even outpacing the Intel HD Graphics 500.
Please see our GPU benchmark page for results from other laptops equipped with Intel HD Graphics 405.
| 3DMark 11 - 1280x720 Performance GPU | |
| Average of class Office (2551 - 18313, n=69, last 2 years) | |
| Acer Swift 1 SF114-31-P6F6 | |
| Average Intel HD Graphics 405 (Braswell) (408 - 496, n=7) | |
| HP 14-bp001ng | |
| Jumper EZbook 3 | |
| Acer Aspire 1 A114-31-C472 | |
| Chuwi LapBook 14 inch 2017 | |
| 3DMark 11 Performance | 509 points | |
Help | ||
Gaming Performance
As the graphics performance tests demonstrated, the 14-bp001ng is not suited for graphically intensive applications. This performance extends to games, with our gaming benchmarks highlighting the 14-bp001ng's limited performance. With the 14-bp001ng you will be limited to playing old or computationally simple games. This is typical for laptops at this price point though.
Please see our gaming benchmark page for more information regarding the gaming performance of the Intel HD Graphics 405.
| low | med. | high | ultra | |
|---|---|---|---|---|
| BioShock Infinite (2013) | 16.39 | 9.32 |
Emissions and Power - No Runtime Miracle
Fan Noise
There are no issues relating to fan noise as our test device is passively cooled. However, the device is not entirely silent. In quiet environments, the HDD and a high-pitched whine can be heard. Fortunately, neither sound can be heard as ambient noise starts to rise.
Noise level
| Idle |
| 31.7 / 31.7 / 32 dB(A) |
| HDD |
| 32.3 dB(A) |
| Load |
| 32 / 32 dB(A) |
 | ||
30 dB silent 40 dB(A) audible 50 dB(A) loud |
||
min: | ||
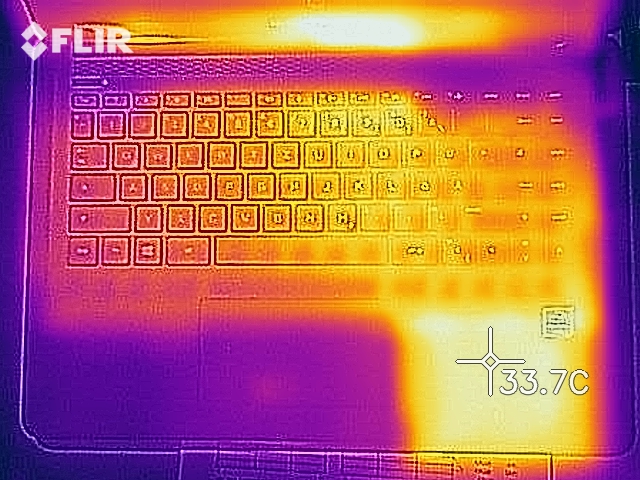
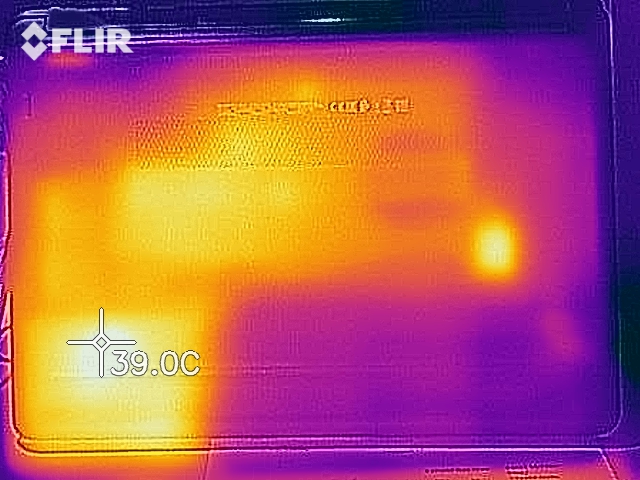
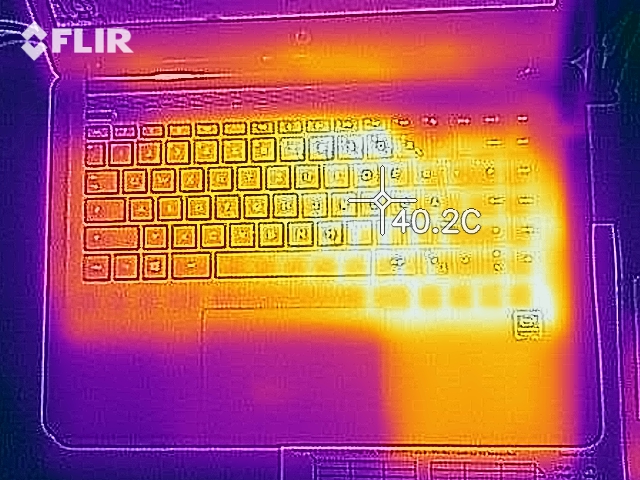
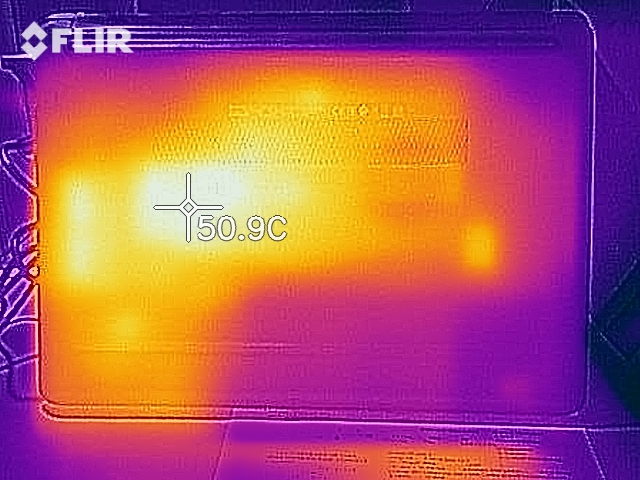
Temperature
Our test device remains cool while idling, with surface temperatures rarely exceeding 40 °C (~104 °F) under load; occasionally reaching just above 50 °C (~122 °F).
During our one-hour stress test we measured core temperatures rising to 80 °C (~176 °F), at which point the clock speed drops to 1.2 GHz. This is 400 MHz lower than the base clock speed of 1.6 GHz. These stress tests simulate the load that is atypical of that which is experienced in everyday use. As a result, there should be no issues with performance degradation and high core temperatures during daily use.
(+) The maximum temperature on the upper side is 35.4 °C / 96 F, compared to the average of 34.3 °C / 94 F, ranging from 21.2 to 62.5 °C for the class Office.
(+) The bottom heats up to a maximum of 39.1 °C / 102 F, compared to the average of 36.8 °C / 98 F
(+) In idle usage, the average temperature for the upper side is 24.3 °C / 76 F, compared to the device average of 29.5 °C / 85 F.
(+) The palmrests and touchpad are reaching skin temperature as a maximum (32.1 °C / 89.8 F) and are therefore not hot.
(-) The average temperature of the palmrest area of similar devices was 27.5 °C / 81.5 F (-4.6 °C / -8.3 F).
Speakers
The speakers are suitable for the occasional audio playback. While the sound lacks bass, high and medium tones are balanced. We did not hear any speaker distortion during our tests either.
HP 14-bp001ng audio analysis
(±) | speaker loudness is average but good (72.1 dB)
Bass 100 - 315 Hz
(-) | nearly no bass - on average 26.9% lower than median
(±) | linearity of bass is average (12% delta to prev. frequency)
Mids 400 - 2000 Hz
(+) | balanced mids - only 3.3% away from median
(+) | mids are linear (6.8% delta to prev. frequency)
Highs 2 - 16 kHz
(+) | balanced highs - only 2.8% away from median
(+) | highs are linear (3.2% delta to prev. frequency)
Overall 100 - 16.000 Hz
(±) | linearity of overall sound is average (20.7% difference to median)
Compared to same class
» 48% of all tested devices in this class were better, 10% similar, 43% worse
» The best had a delta of 7%, average was 21%, worst was 53%
Compared to all devices tested
» 56% of all tested devices were better, 8% similar, 37% worse
» The best had a delta of 4%, average was 23%, worst was 134%
Apple MacBook 12 (Early 2016) 1.1 GHz audio analysis
(+) | speakers can play relatively loud (83.6 dB)
Bass 100 - 315 Hz
(±) | reduced bass - on average 11.3% lower than median
(±) | linearity of bass is average (14.2% delta to prev. frequency)
Mids 400 - 2000 Hz
(+) | balanced mids - only 2.4% away from median
(+) | mids are linear (5.5% delta to prev. frequency)
Highs 2 - 16 kHz
(+) | balanced highs - only 2% away from median
(+) | highs are linear (4.5% delta to prev. frequency)
Overall 100 - 16.000 Hz
(+) | overall sound is linear (10.2% difference to median)
Compared to same class
» 7% of all tested devices in this class were better, 2% similar, 91% worse
» The best had a delta of 5%, average was 18%, worst was 53%
Compared to all devices tested
» 5% of all tested devices were better, 1% similar, 94% worse
» The best had a delta of 4%, average was 23%, worst was 134%
|Frequency diagram in comparison (checkboxes are de/selectable)
Power Consumption
There are more energy efficient laptops than the 14-bp001ng at this price point. That is not to say that it is a power guzzler though, with its maximum 10-W consumption while idling and 20-W consumption under load making for a power efficient device. This maximum consumption can be handled comfortably by the 45-W rated power supply.
| Off / Standby | |
| Idle | |
| Load |
|
Key:
min: | |
Battery Life
The 14-bp001ng has a 41 Wh battery which lasted over six and a half hours in our Wi-Fi battery test. During this test, we kept the display brightness at 100 % because of the low maximum brightness. While this runtime is far lower than HP's claim of eleven hours, it is longer than some of our comparison devices which have smaller battery capacities. It is worth keeping in mind that the Acer Swift 1 achieved a 65% longer runtime with similar hardware thanks to its larger 55 Wh battery capacity.
| Battery Runtime - WiFi Websurfing | |
| Average of class Office (3.83 - 31.5, n=74, last 2 years) | |
| Acer Swift 1 SF114-31-P6F6 | |
| Jumper EZbook 3 | |
| HP 14-bp001ng | |
| Chuwi LapBook 14 inch 2017 | |
| Acer Aspire 1 A114-31-C472 | |
Pros
Cons
Verdict

Our tests demonstrate that the HP 14-bp001ng is a simple but solid laptop suitable for everyday use. The keyboard provides a good typing experience while there is enough performance for simple office applications and Internet browsing. The 500 GB HDD is large enough for personal data, even if it is not particularly fast. The only major criticizm we have is the strongly flickering display, which we found irritating.
The HP 14-bp001ng is a solid laptop suitable for web browsing and word processing. The laptop can be repaired and maintained, but there are some compromises in this respect.
Currently priced at €350 (~$433), HP is offering a laptop suited for simple tasks. If your needs are met by what the HP 14-bp001ng can offer, then you will get a solid device that will be a reliable companion in the long-run. We did find a major hurdle in repairing our test device though, as we could not remove the base plate for fear of damaging the laptop. As such we were unable to confirm HP's claim that there is the option of RAM expansion or battery replacement among other things.
HP 14-bp001ng
- 03/01/2018 v6 (old)
Mike Wobker
Price comparison

