Lenovo ThinkBook 14 Review: Business Laptop with Great Connectivity

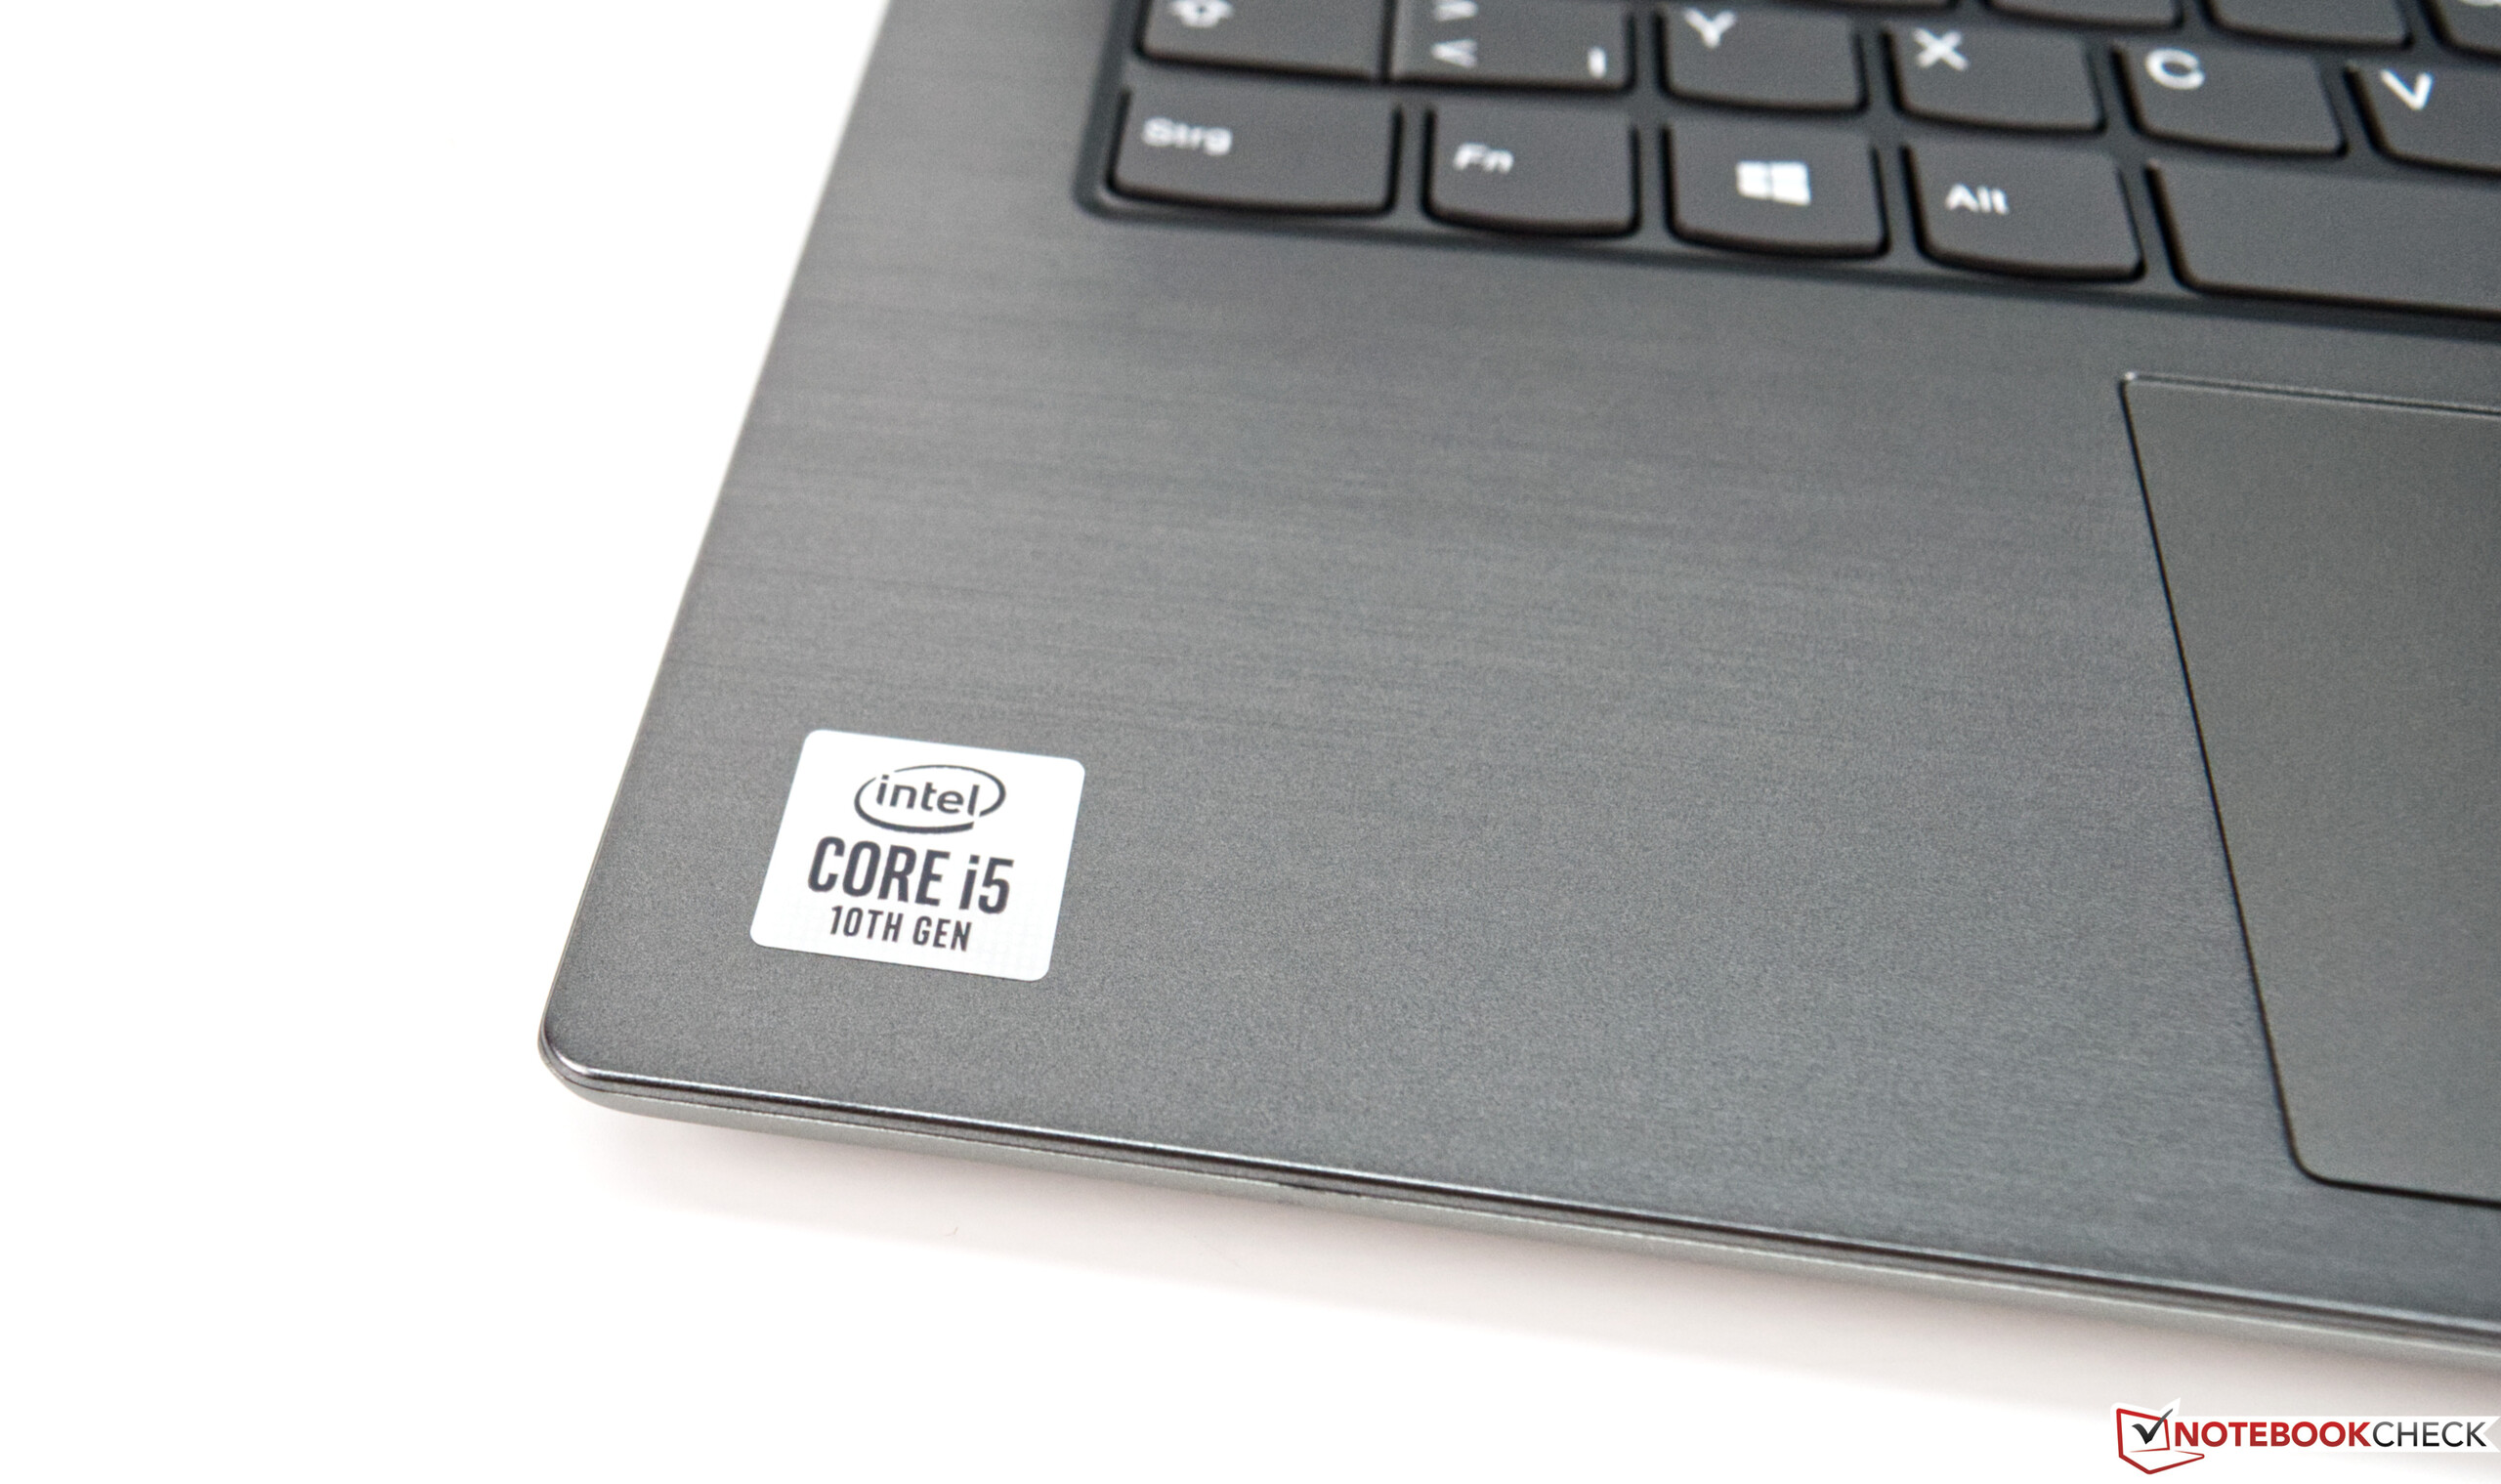
Lenovo’s ThinkBook series is supposed to fill the gap between the consumer-oriented IdeaPad line and the business-centric ThinkPads, and as such it is aimed primarily at business users looking for a durable and long-lasting device for everyday use. The Lenovo ThinkPad 14 is a compact office laptop with modern connectivity. It features Intel’s Comet Lake Core i5-10210U, 8 GB of RAM, and a fast 256 GB NVMe SSD. All of that can be had for less than $800.
Rating | Date | Model | Weight | Height | Size | Resolution | Price |
|---|---|---|---|---|---|---|---|
| 82 % v7 (old) | 03 / 2020 | Lenovo ThinkBook 14-IML-20RV006TGE i5-10210U, UHD Graphics 620 | 1.6 kg | 17.9 mm | 14.00" | 1920x1080 | |
| 81.9 % v6 (old) | 06 / 2019 | HP 14-dk0008ng R7 3700U, Vega 10 | 1.5 kg | 20 mm | 14.00" | 1920x1080 | |
| 83 % v7 (old) | 10 / 2019 | Dell Latitude 3400 i3-8145U, UHD Graphics 620 | 1.7 kg | 18.65 mm | 14.00" | 1920x1080 | |
| 86.4 % v6 (old) | 04 / 2019 | Lenovo ThinkPad E485-20KU000NGE R5 2500U, Vega 8 | 1.8 kg | 21.9 mm | 14.00" | 1920x1080 | |
| 85.9 % v7 (old) | 05 / 2019 | Lenovo ThinkPad E490-20N8000RGE i5-8265U, UHD Graphics 620 | 1.8 kg | 19.9 mm | 14.00" | 1920x1080 |
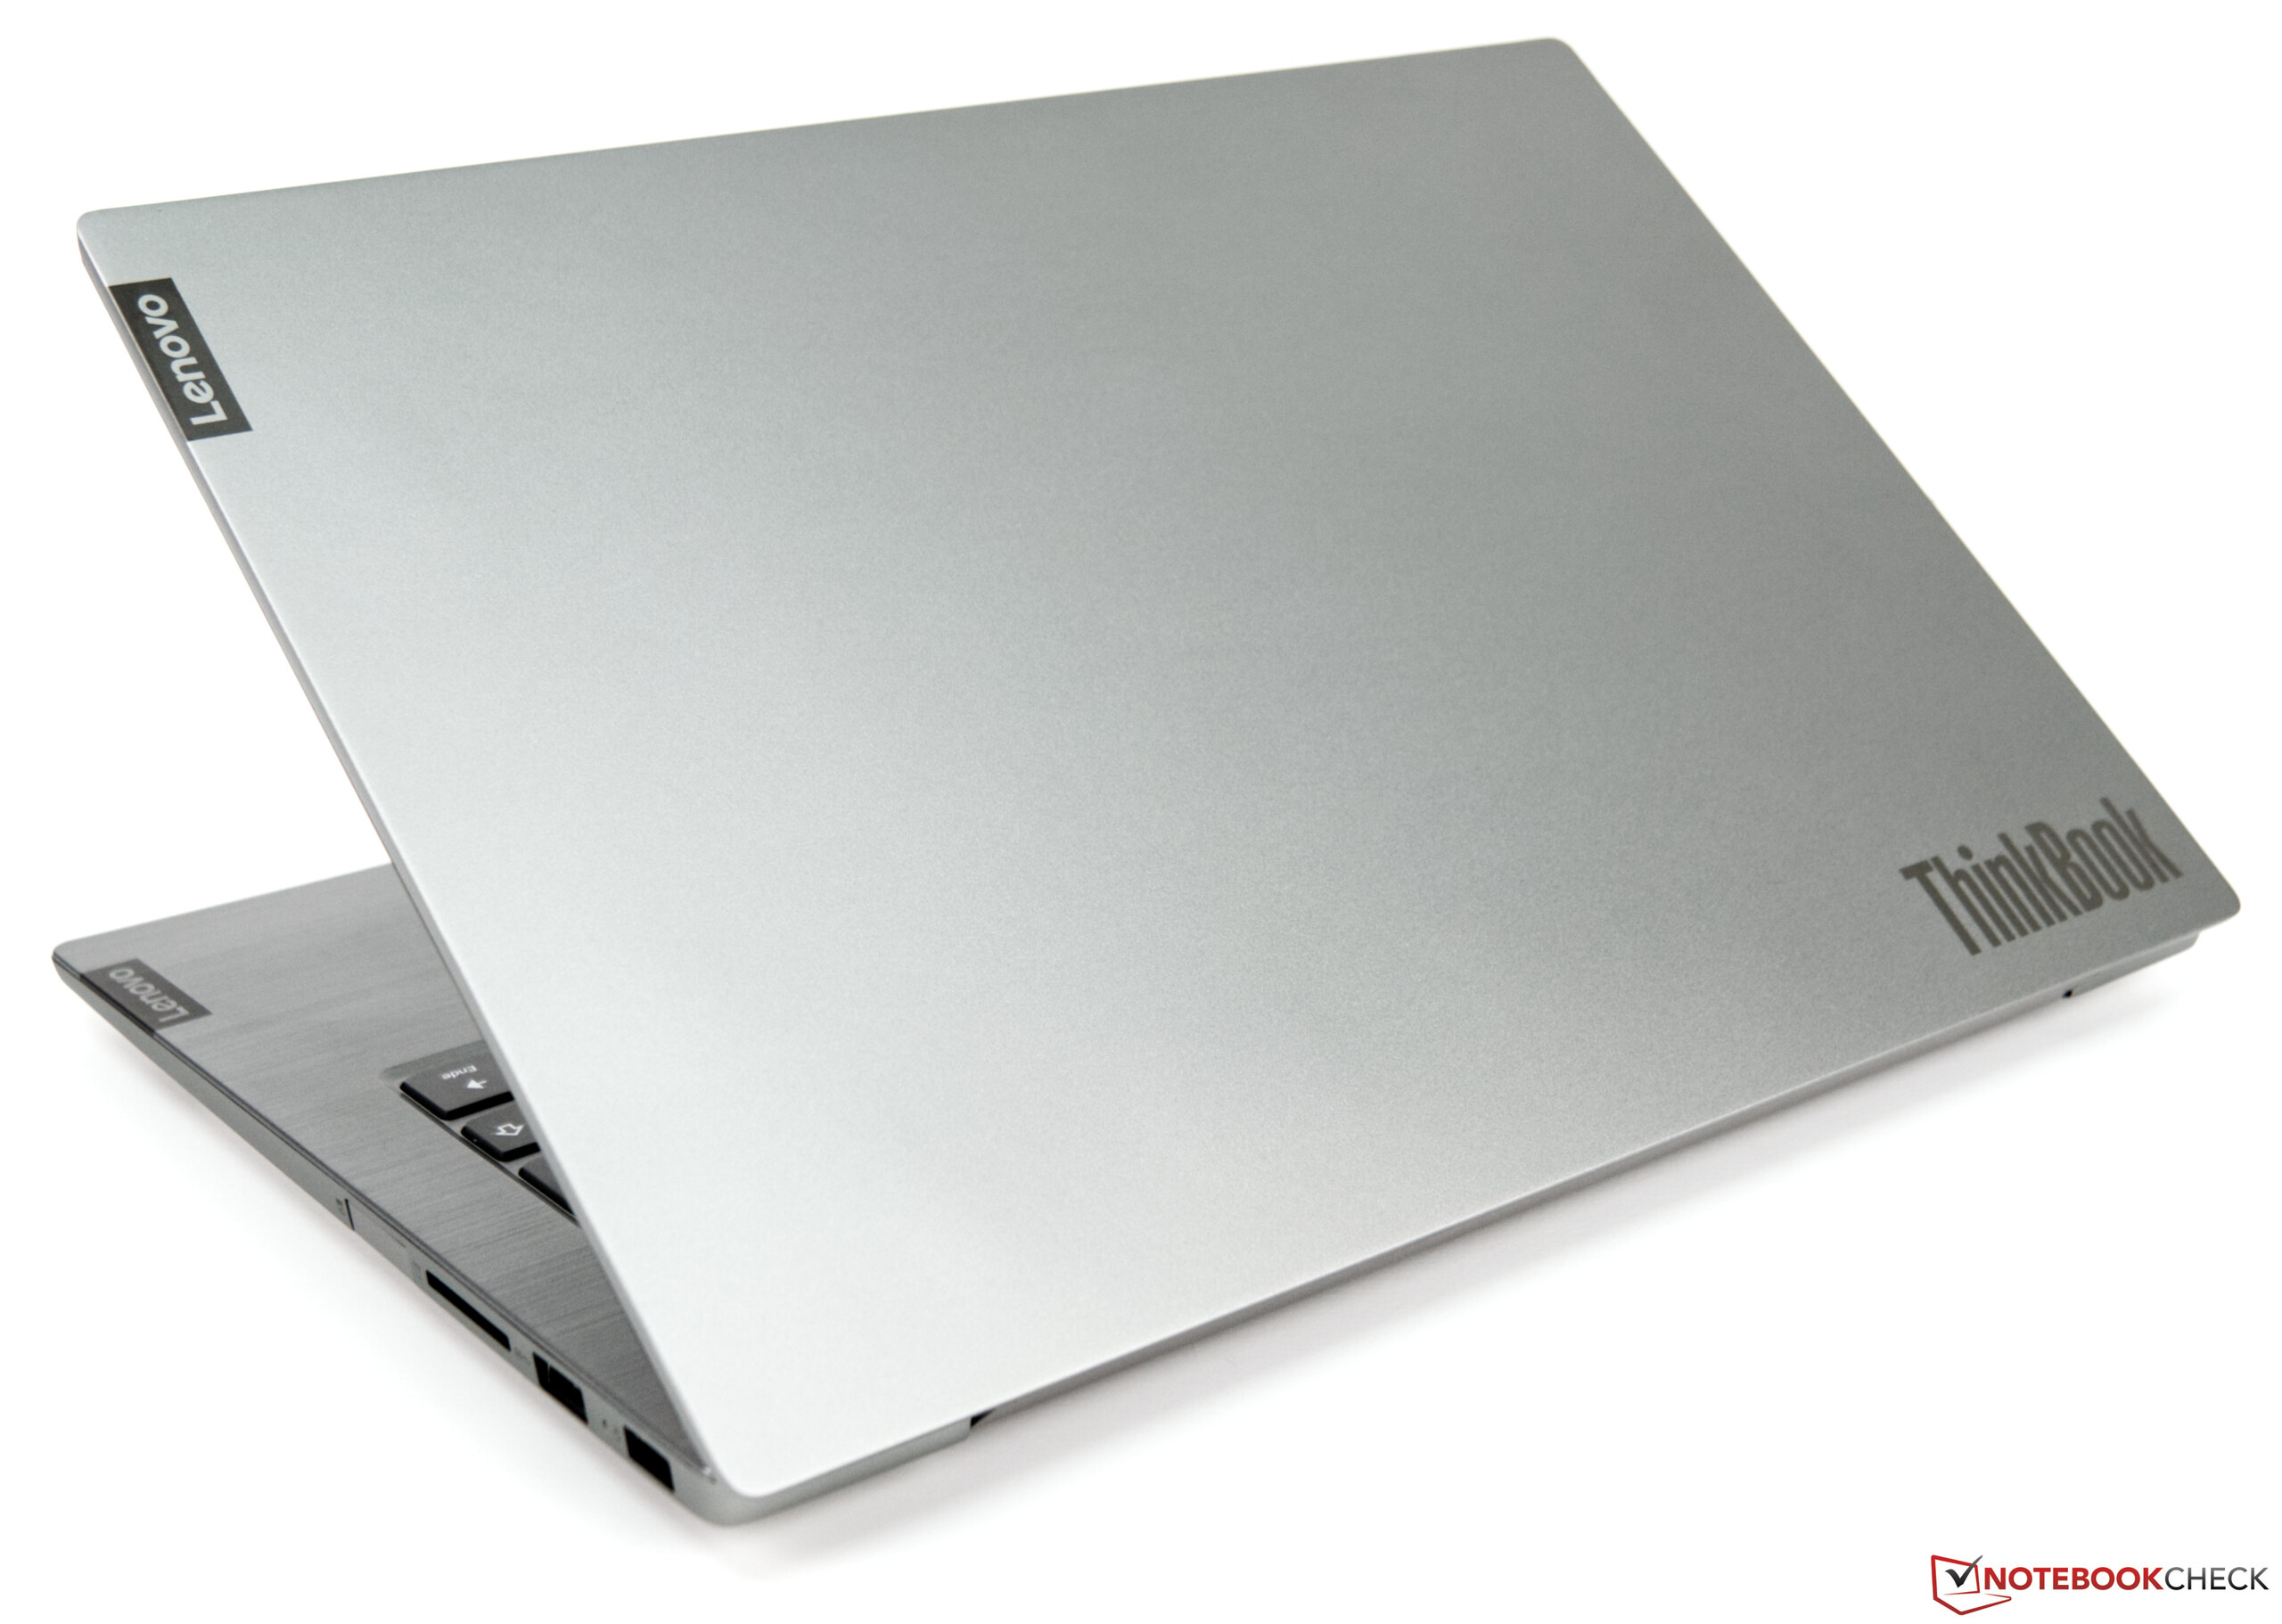
Case and Connectivity – Rigid and with Great Connectivity
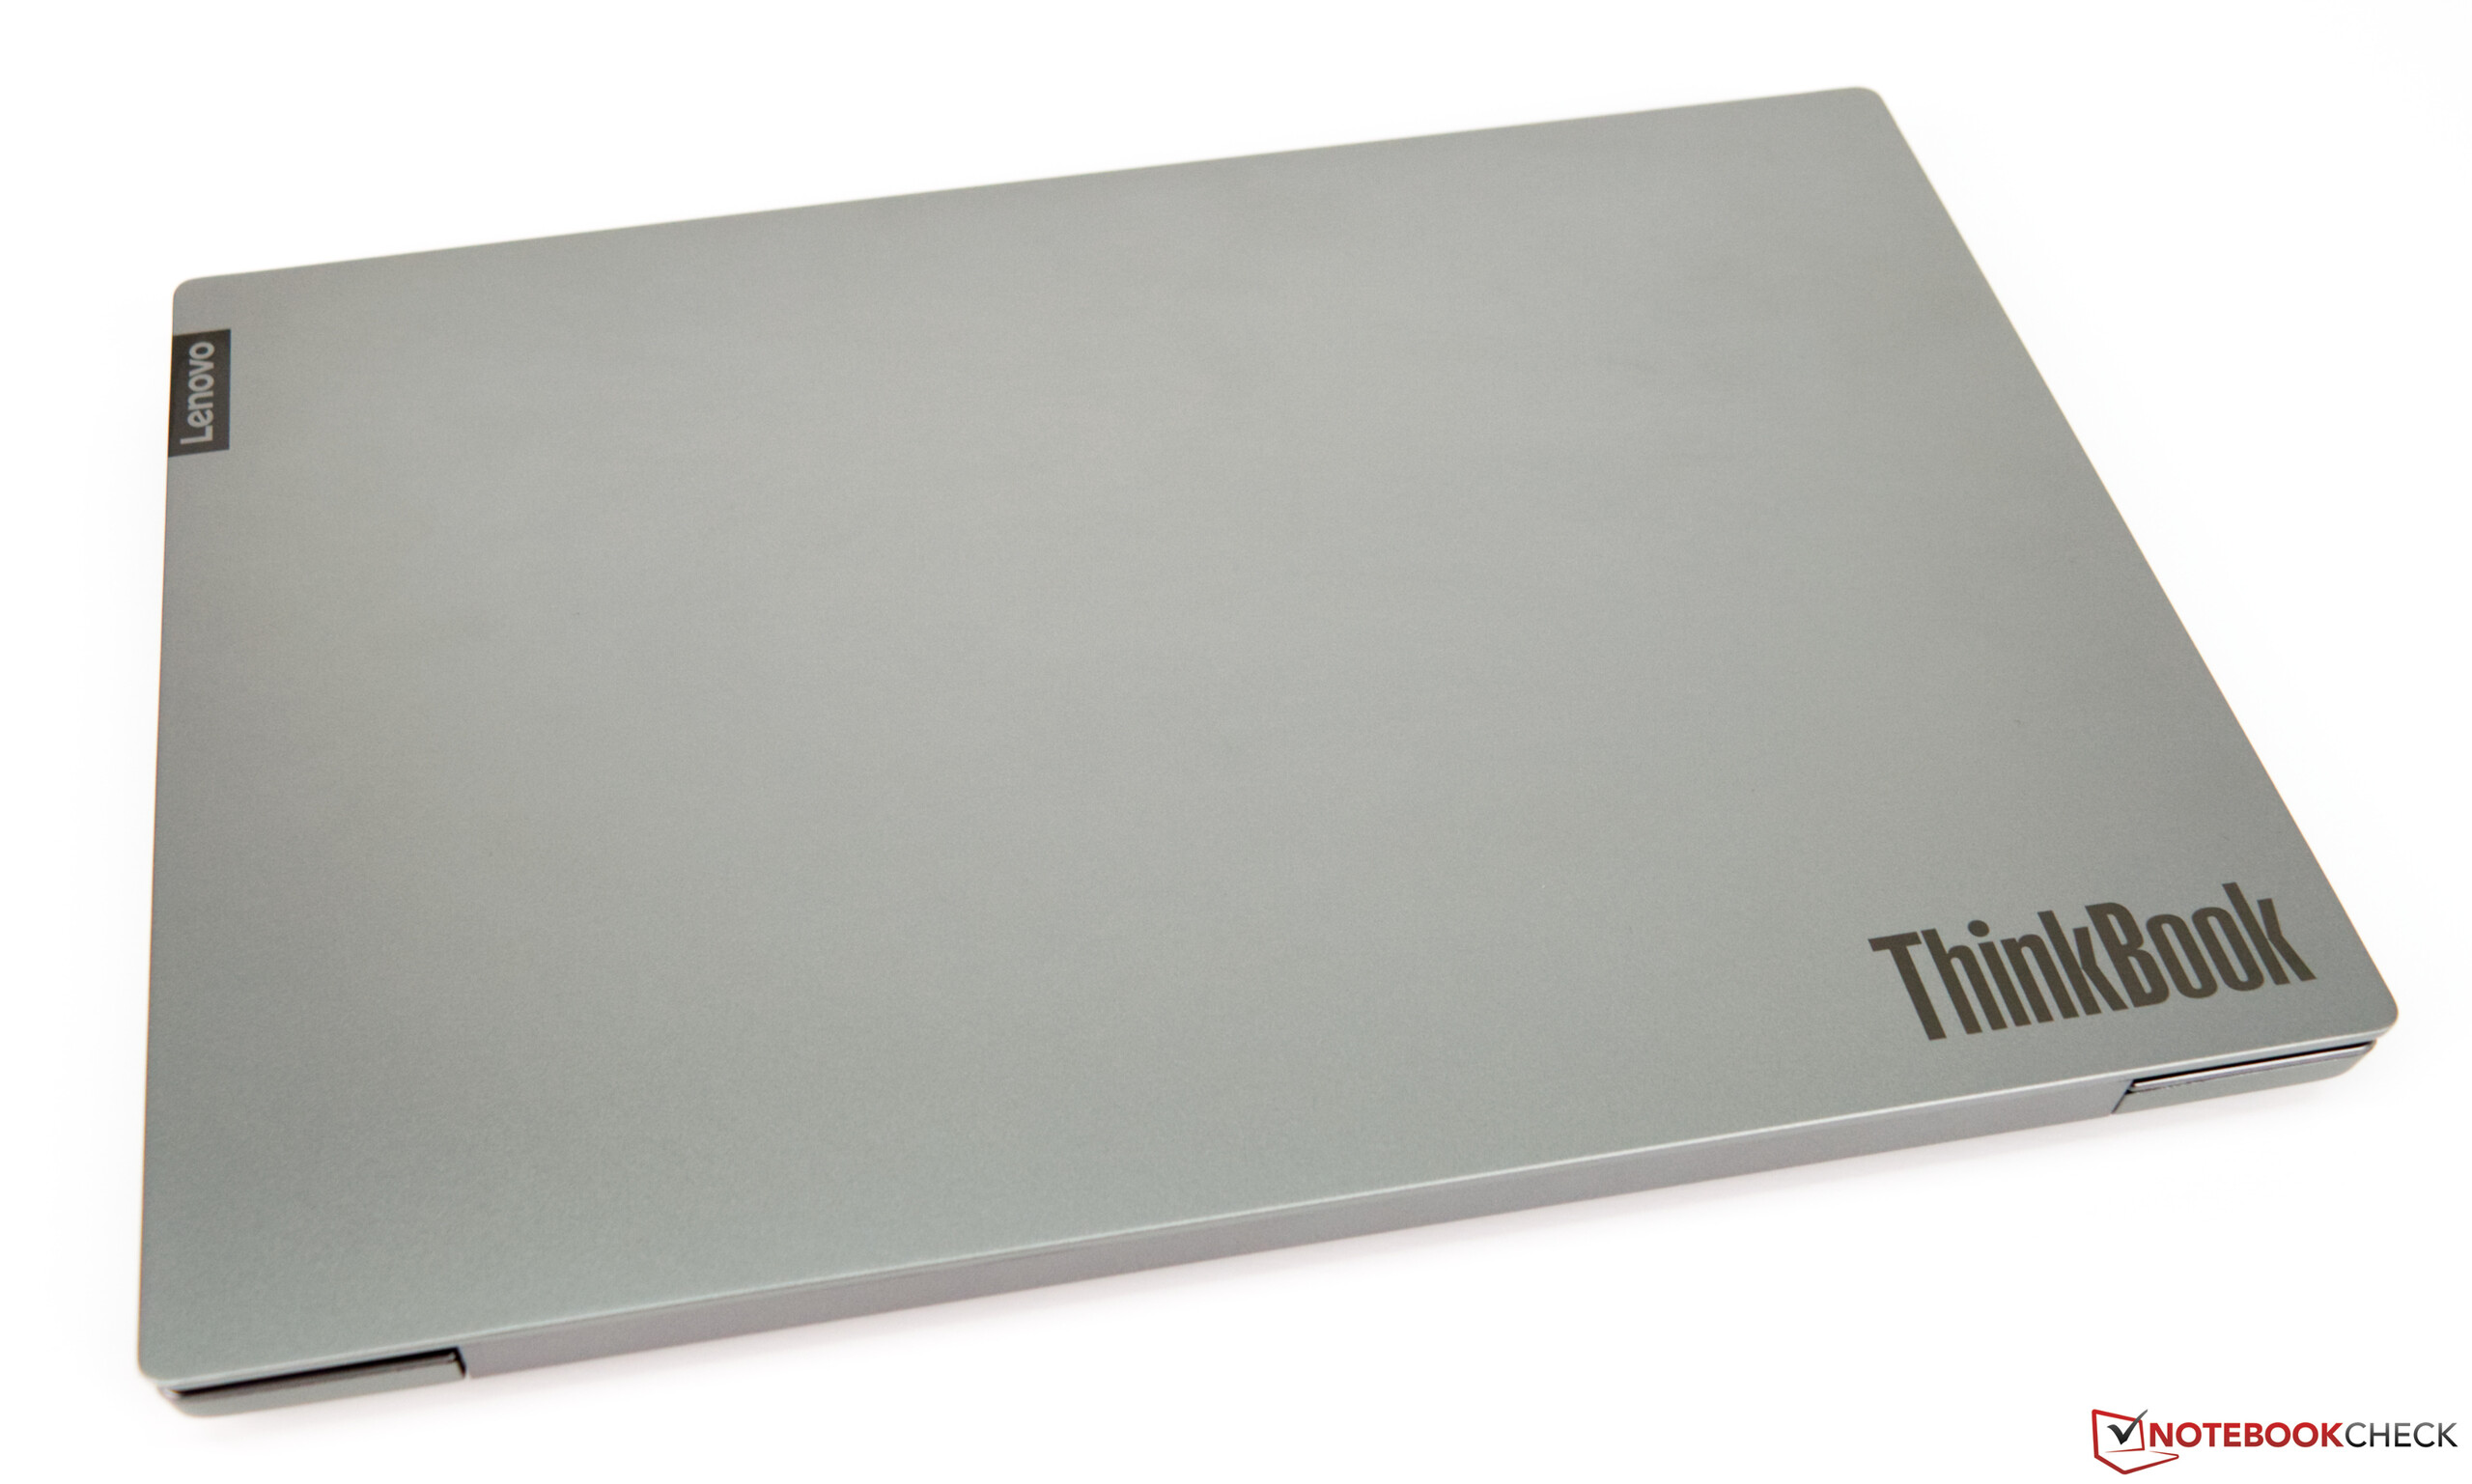
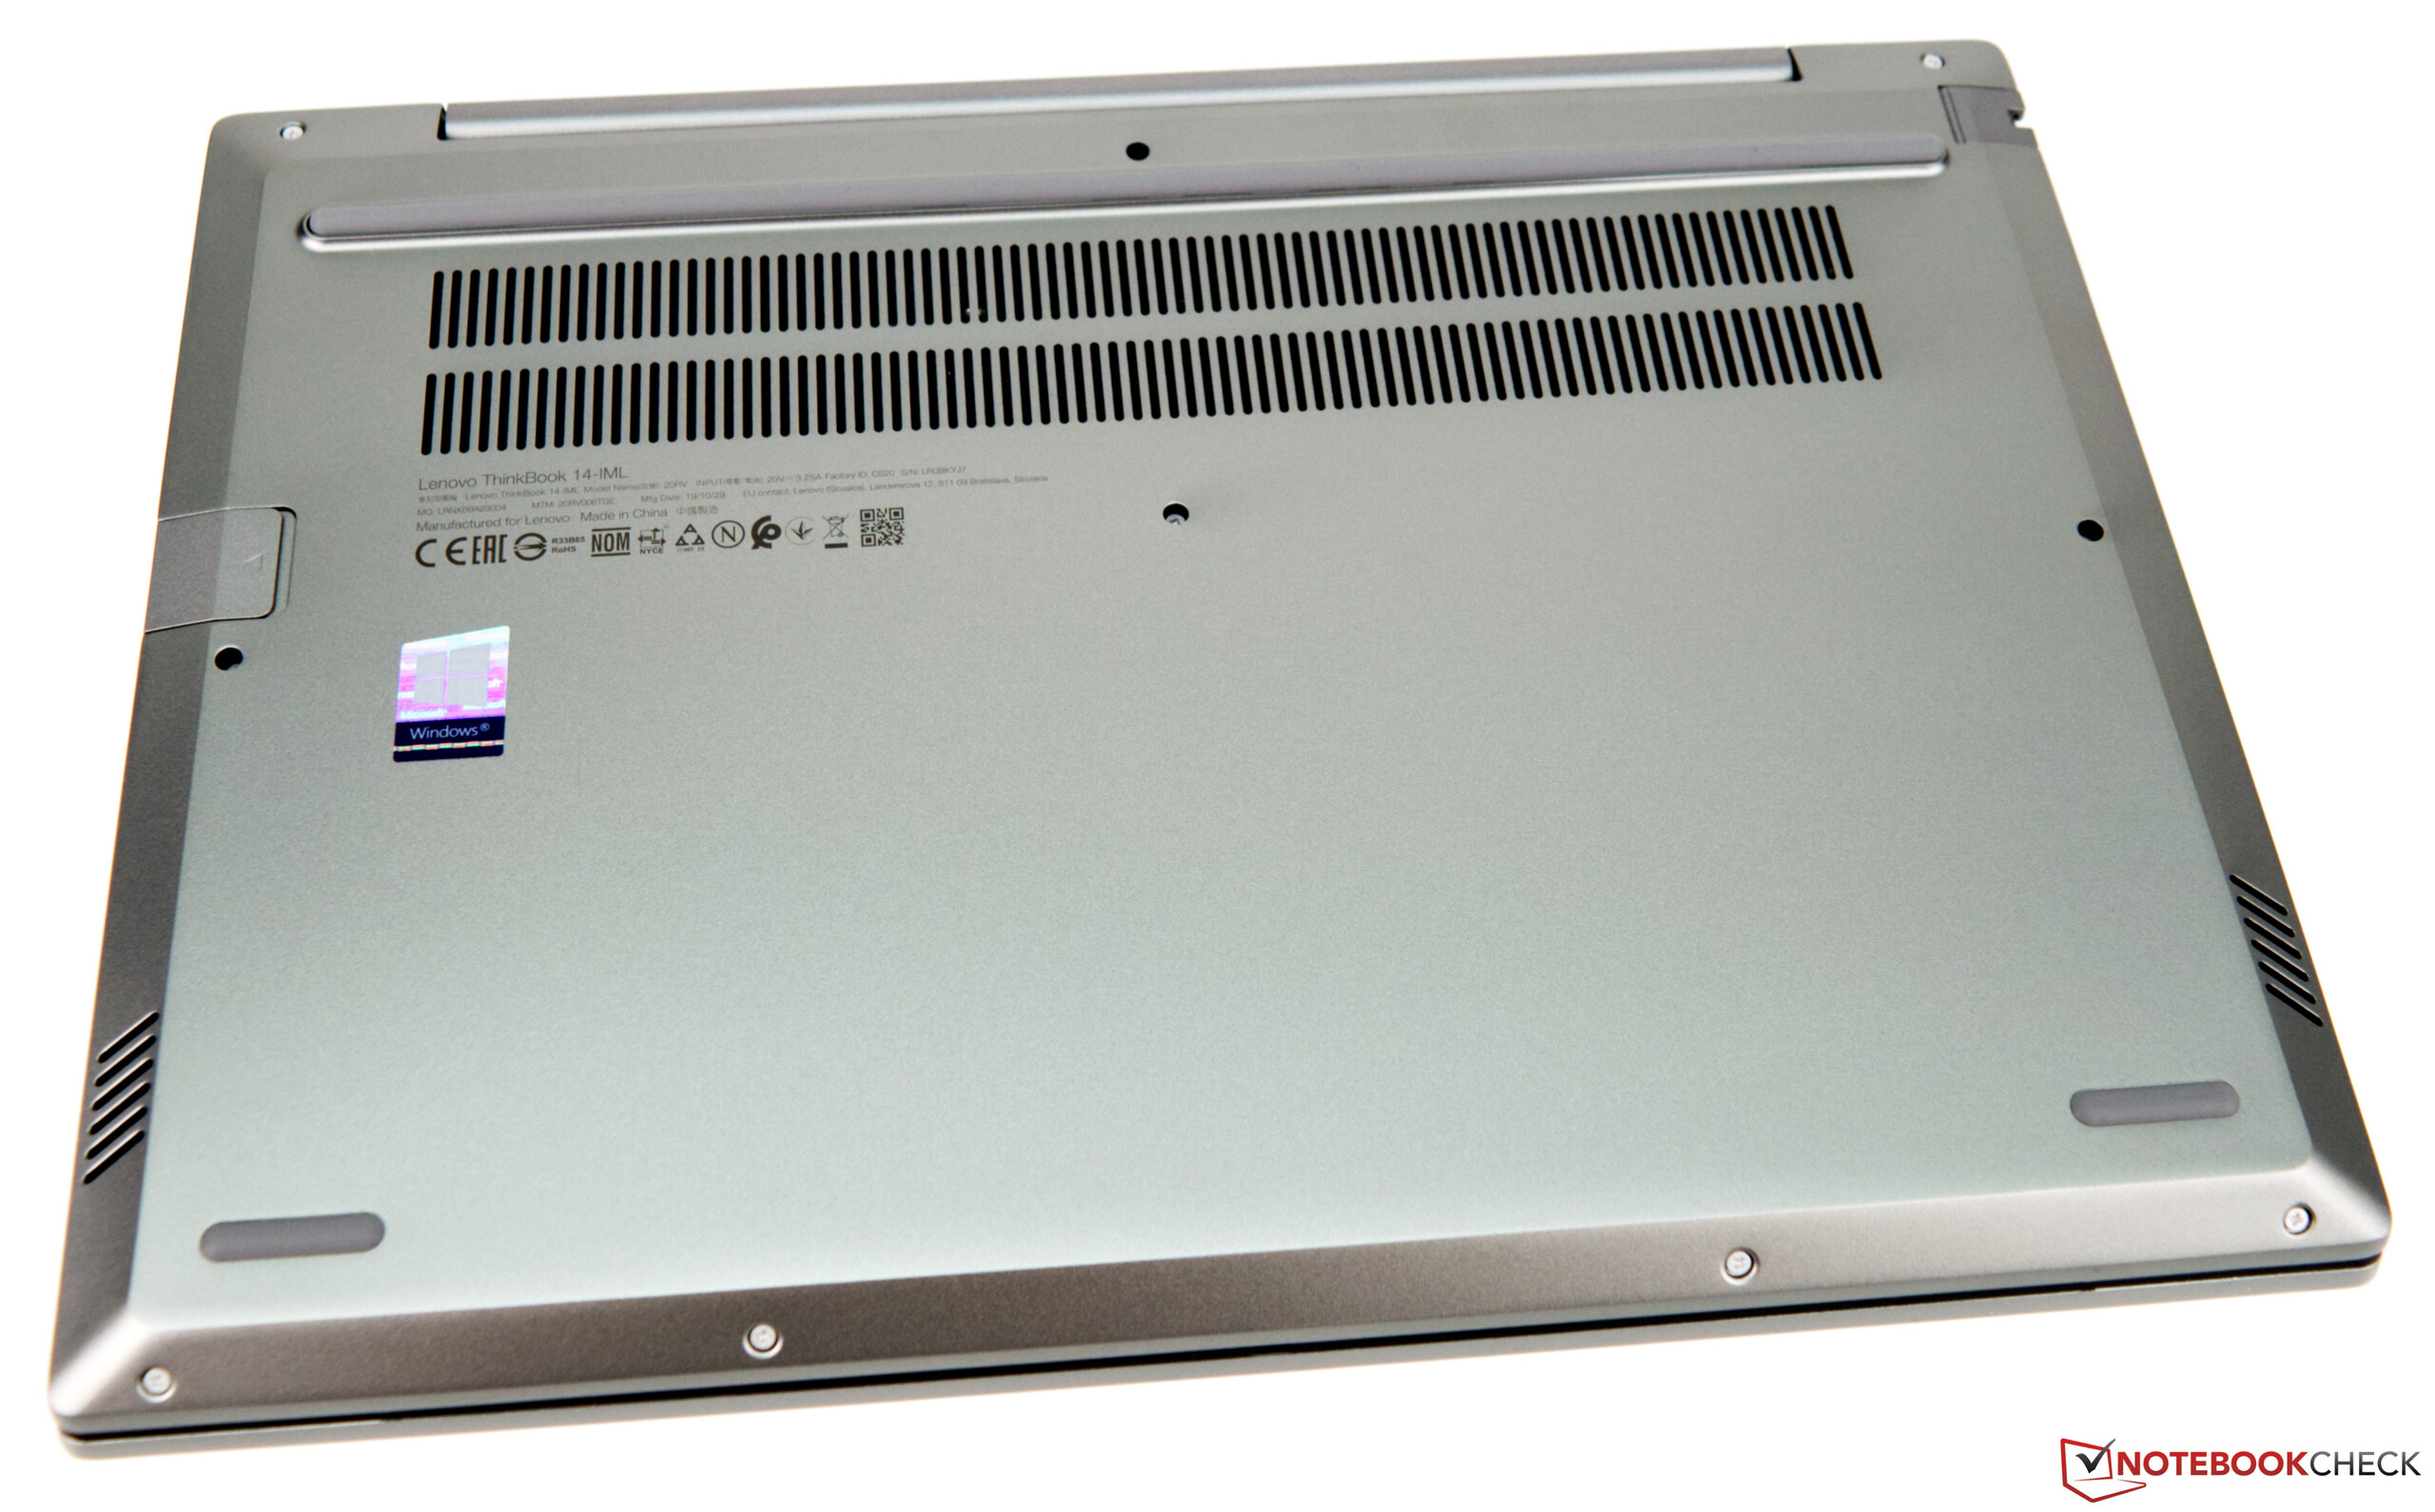
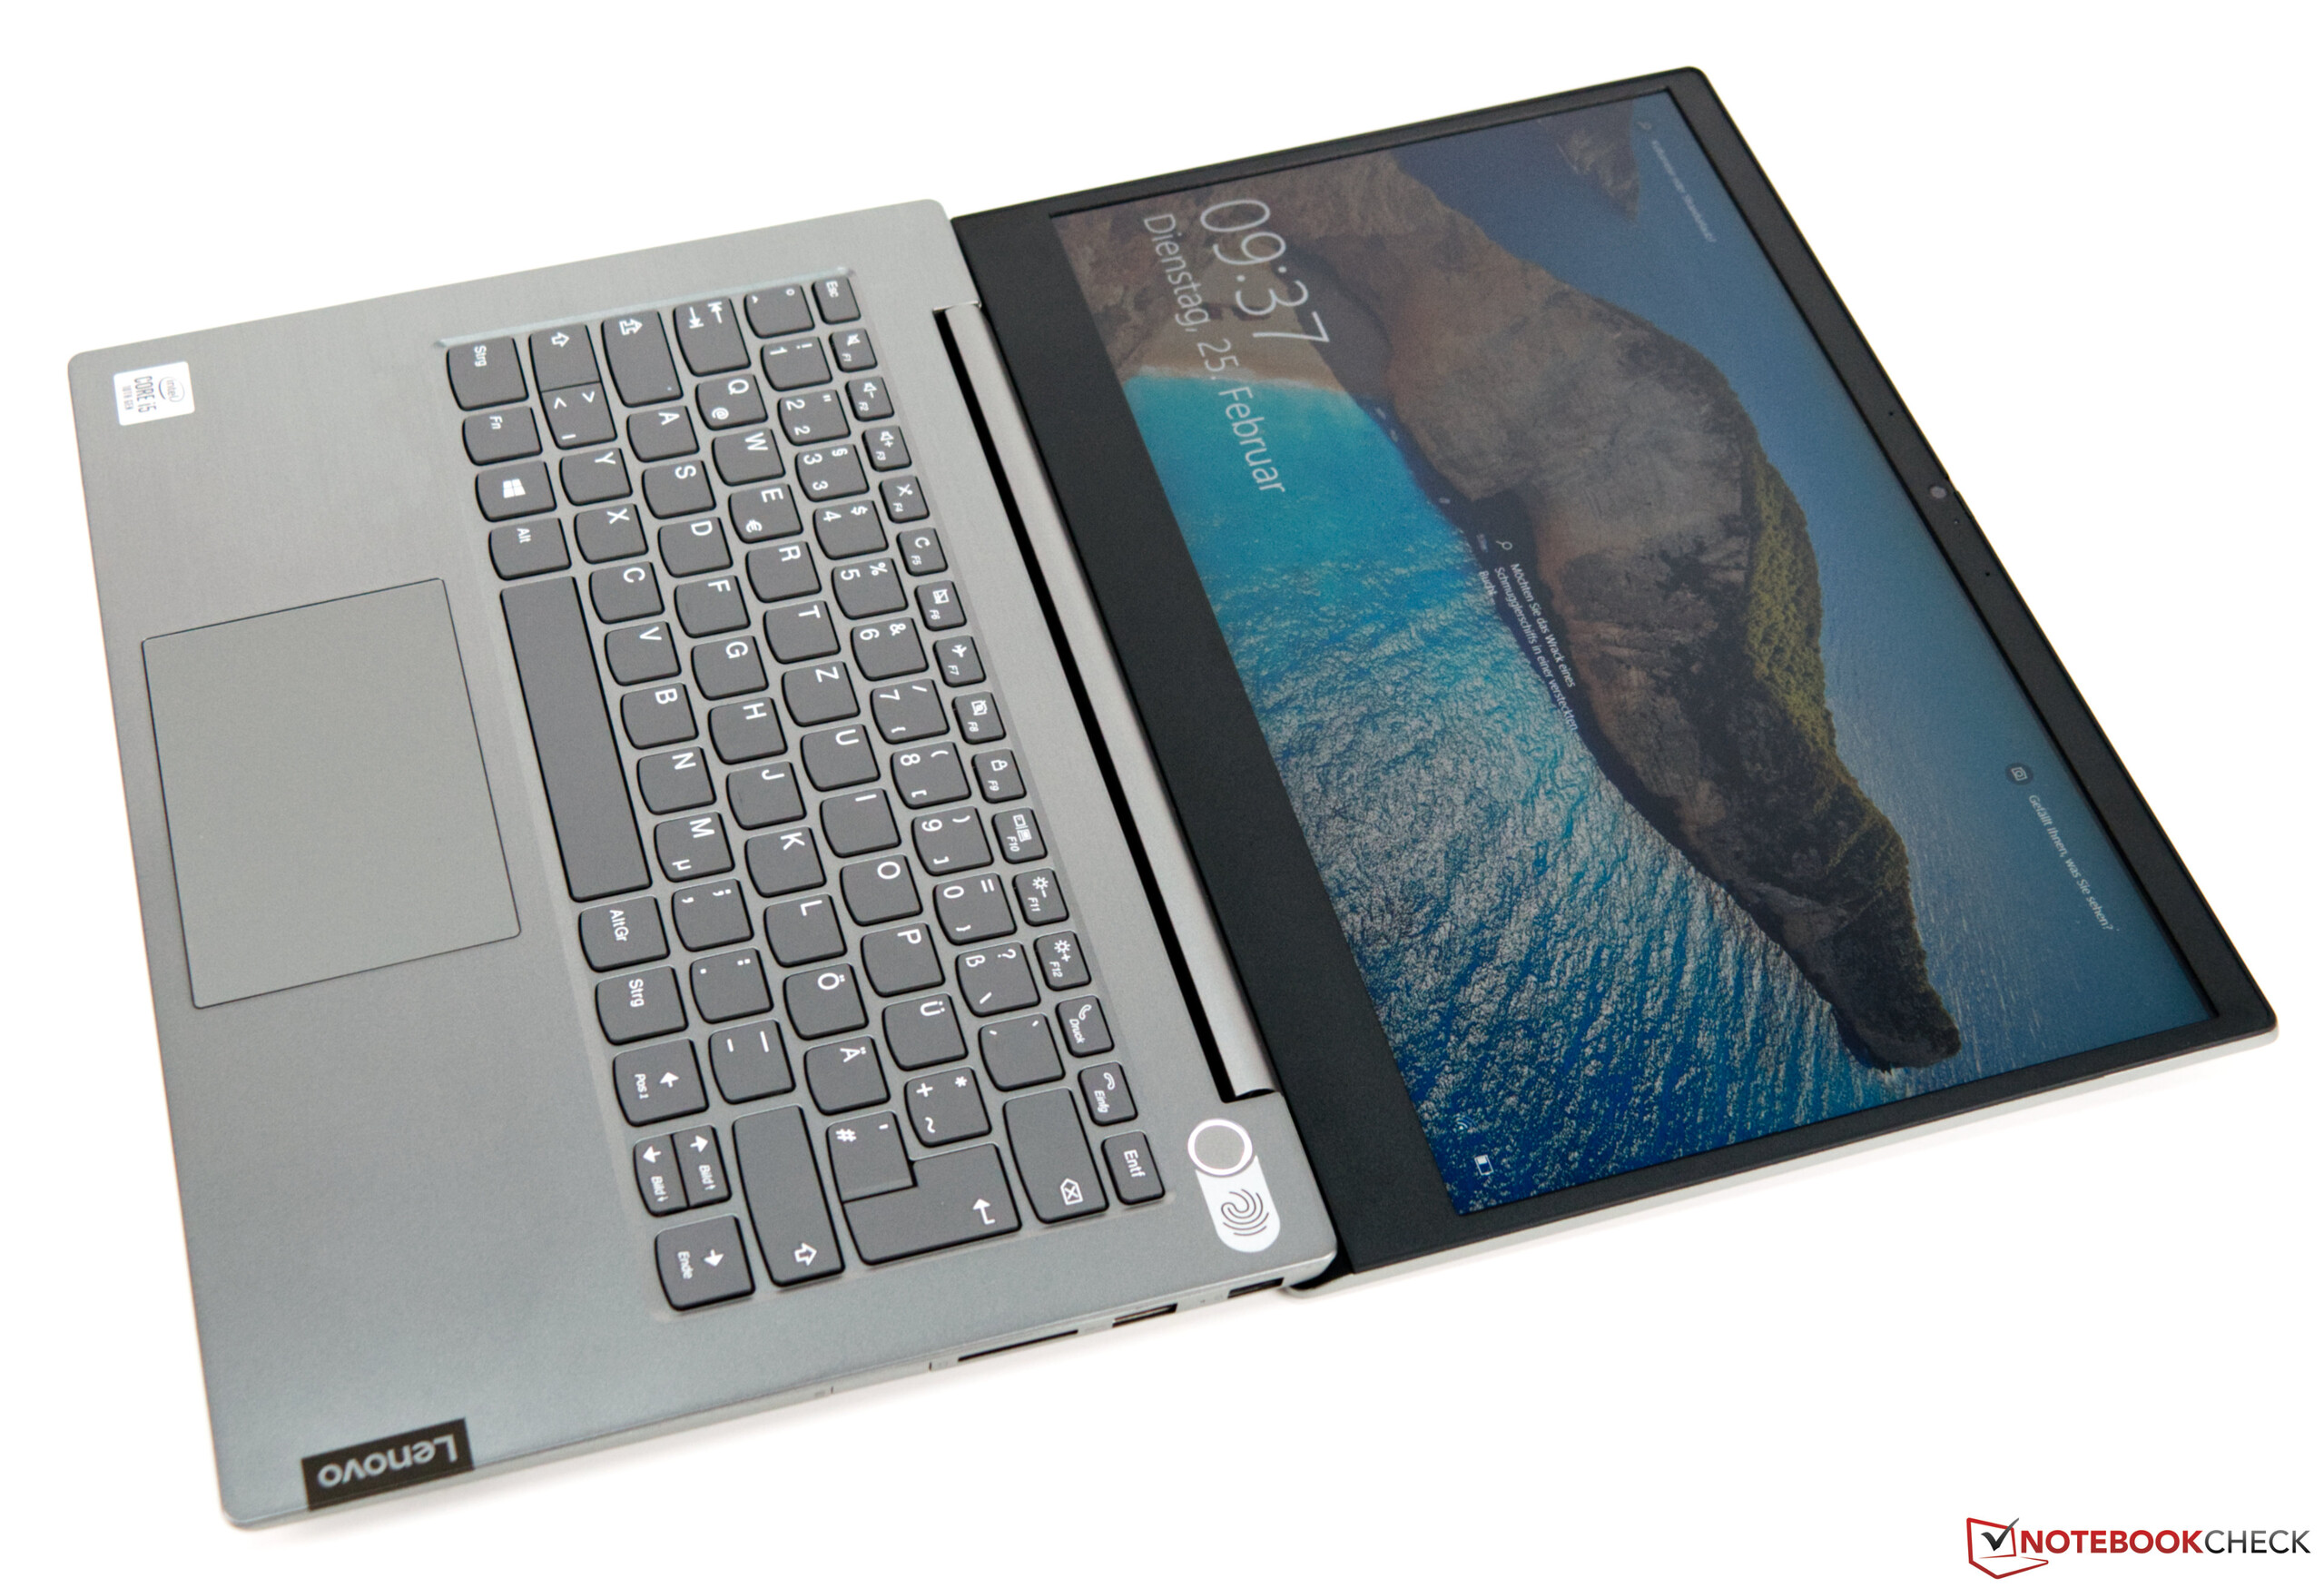
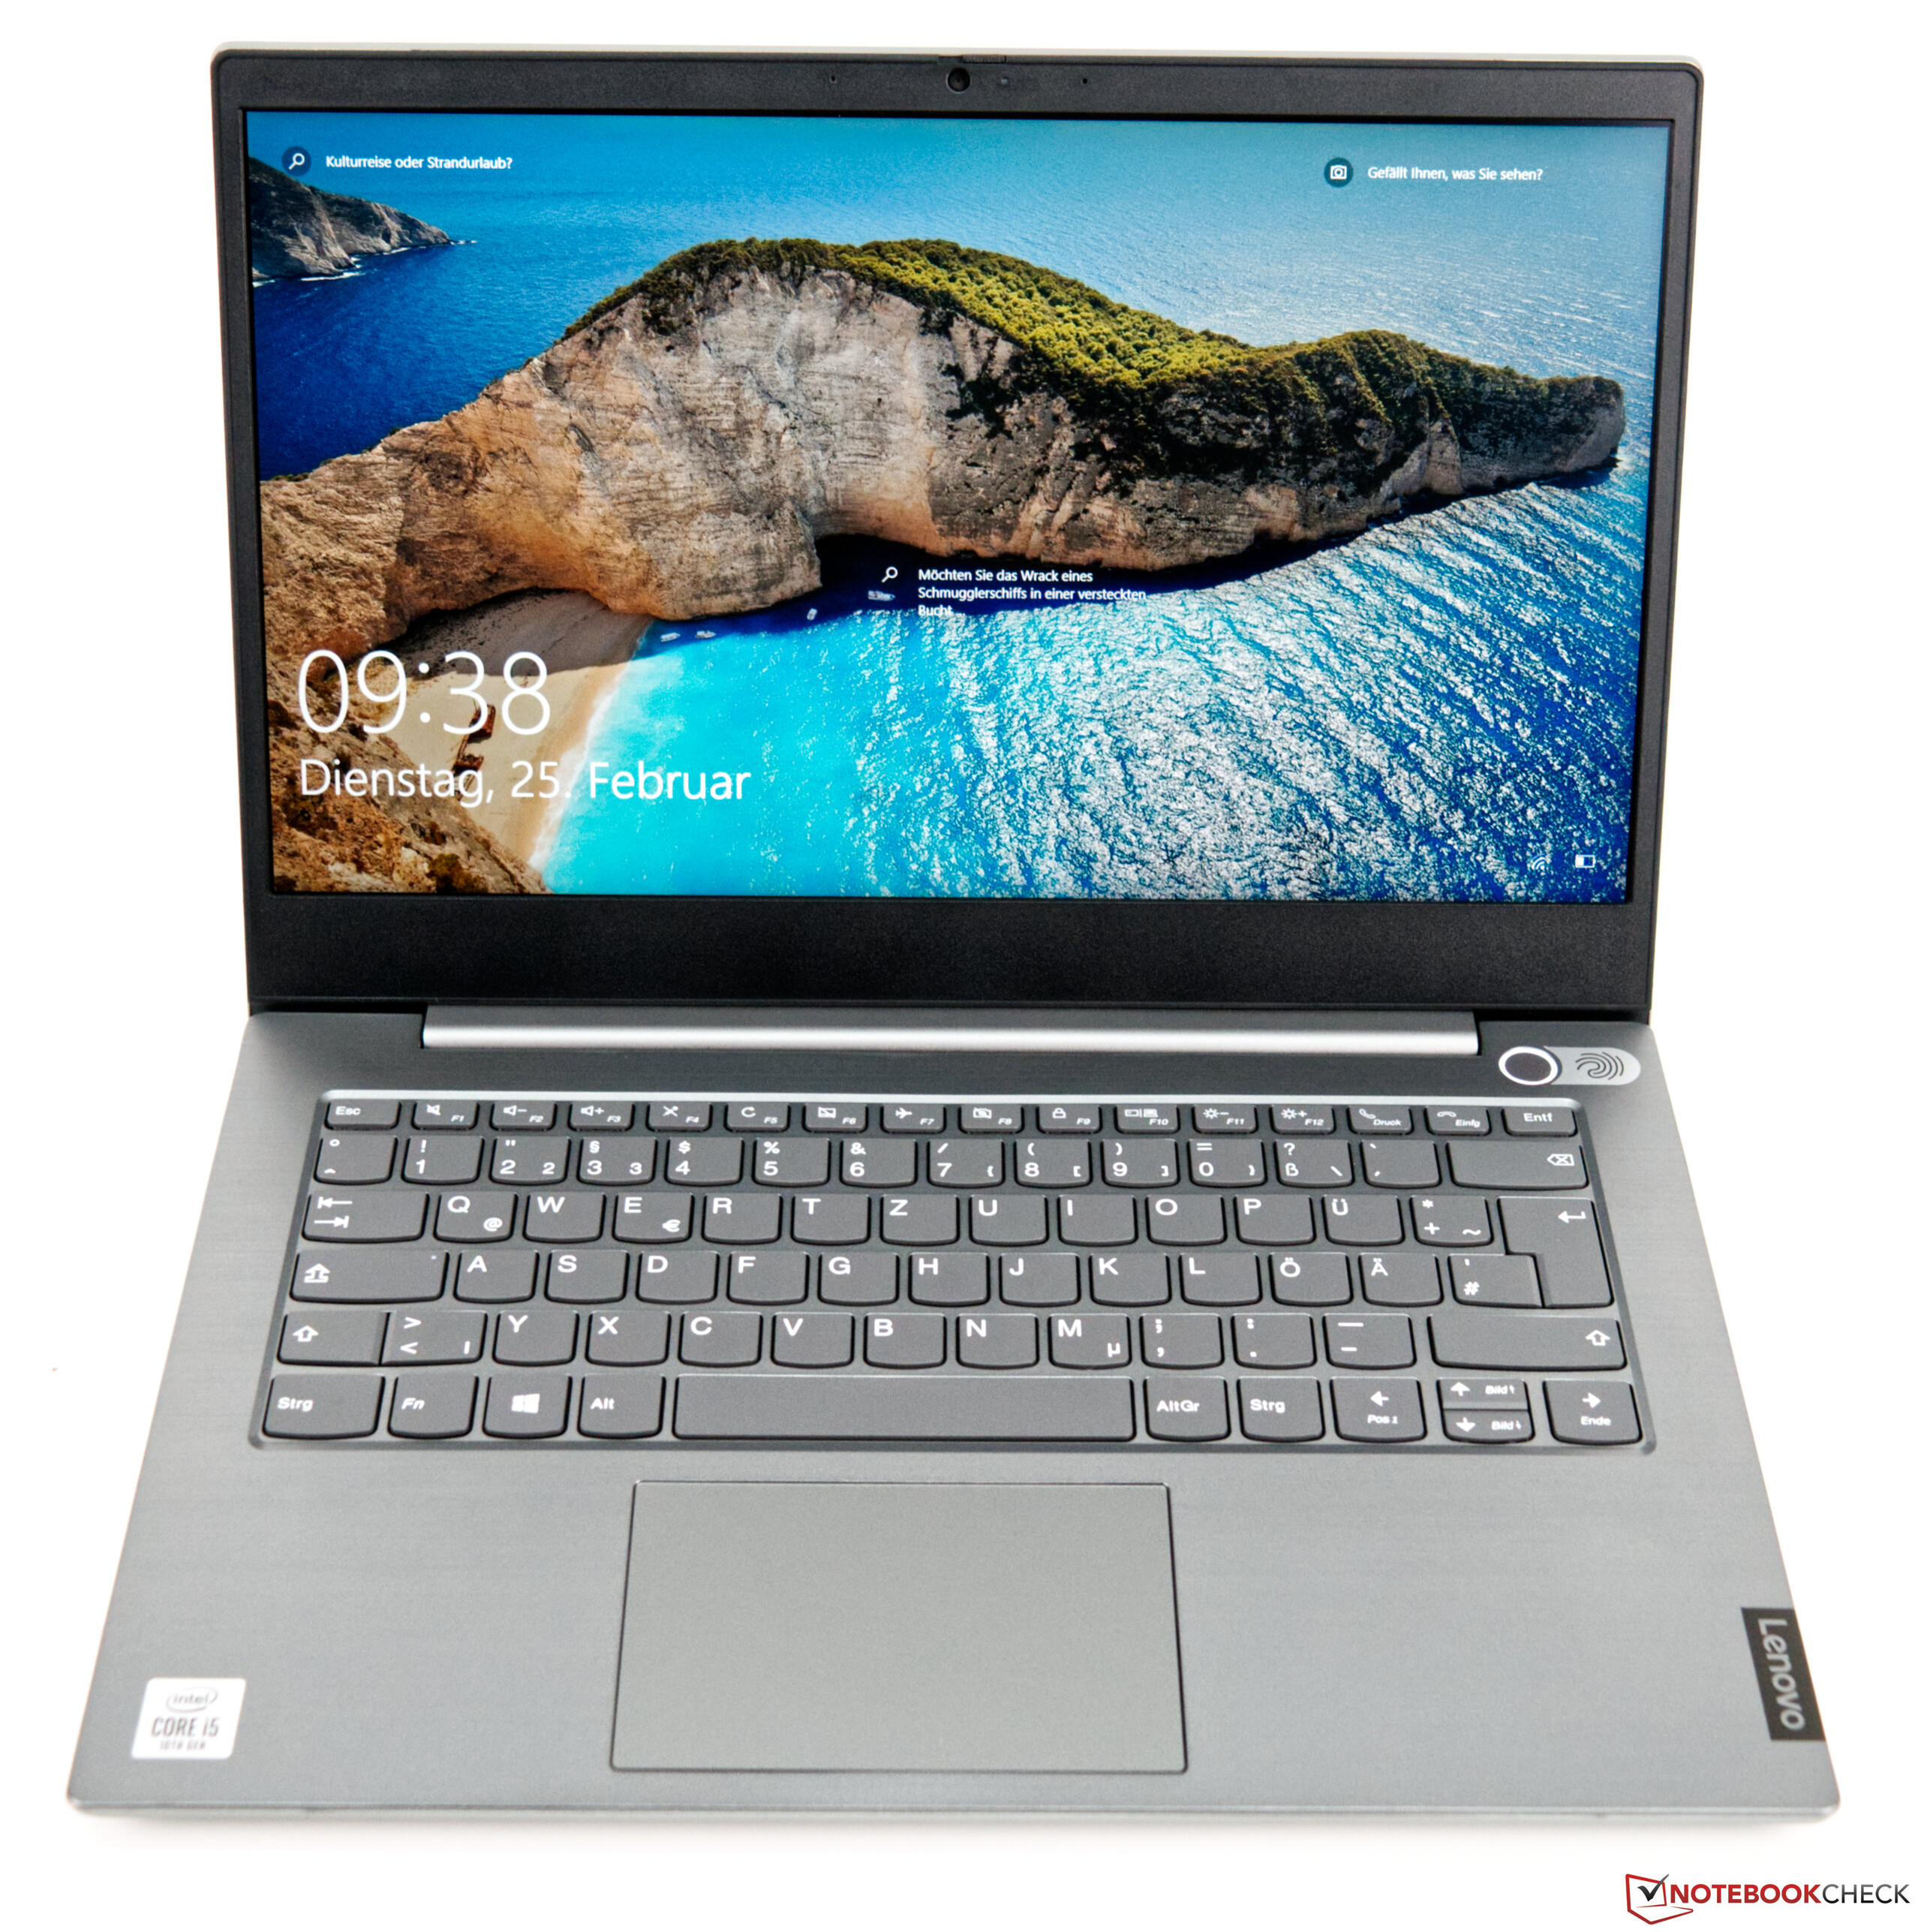
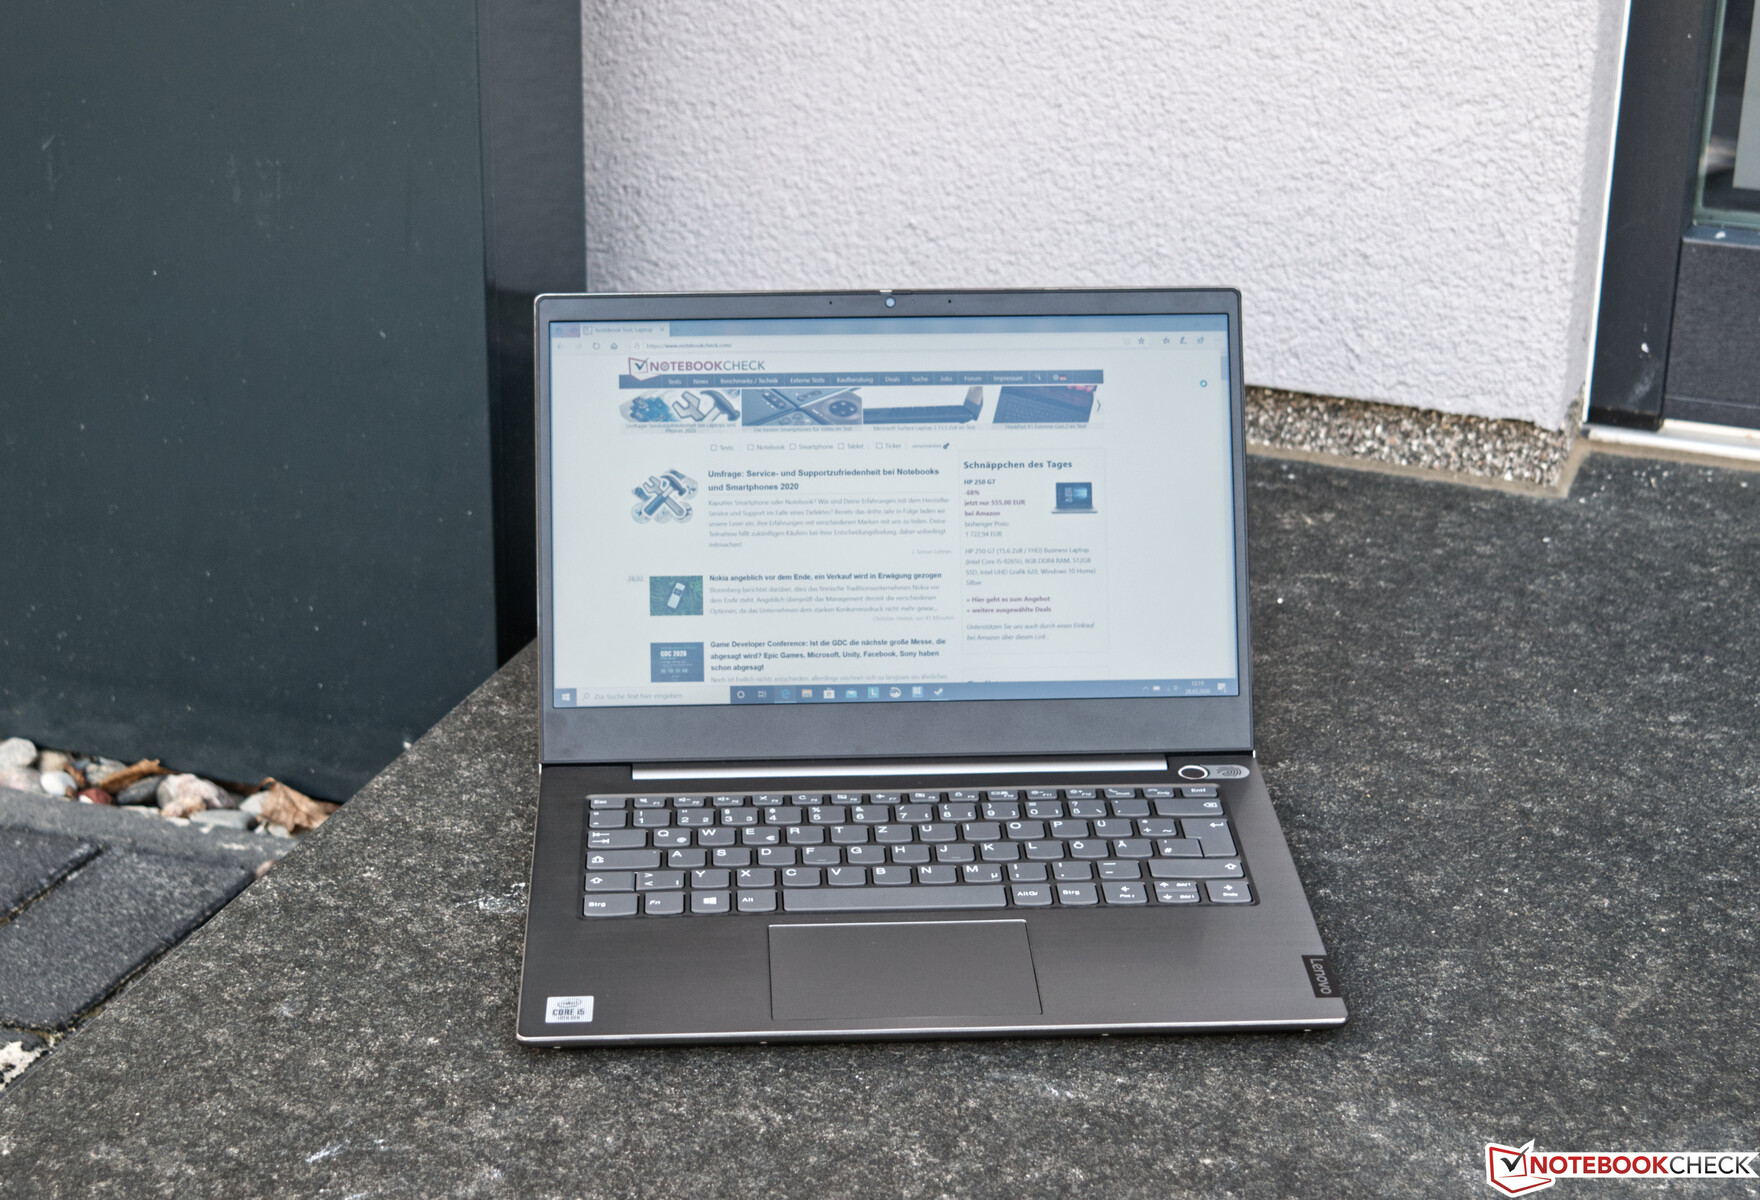
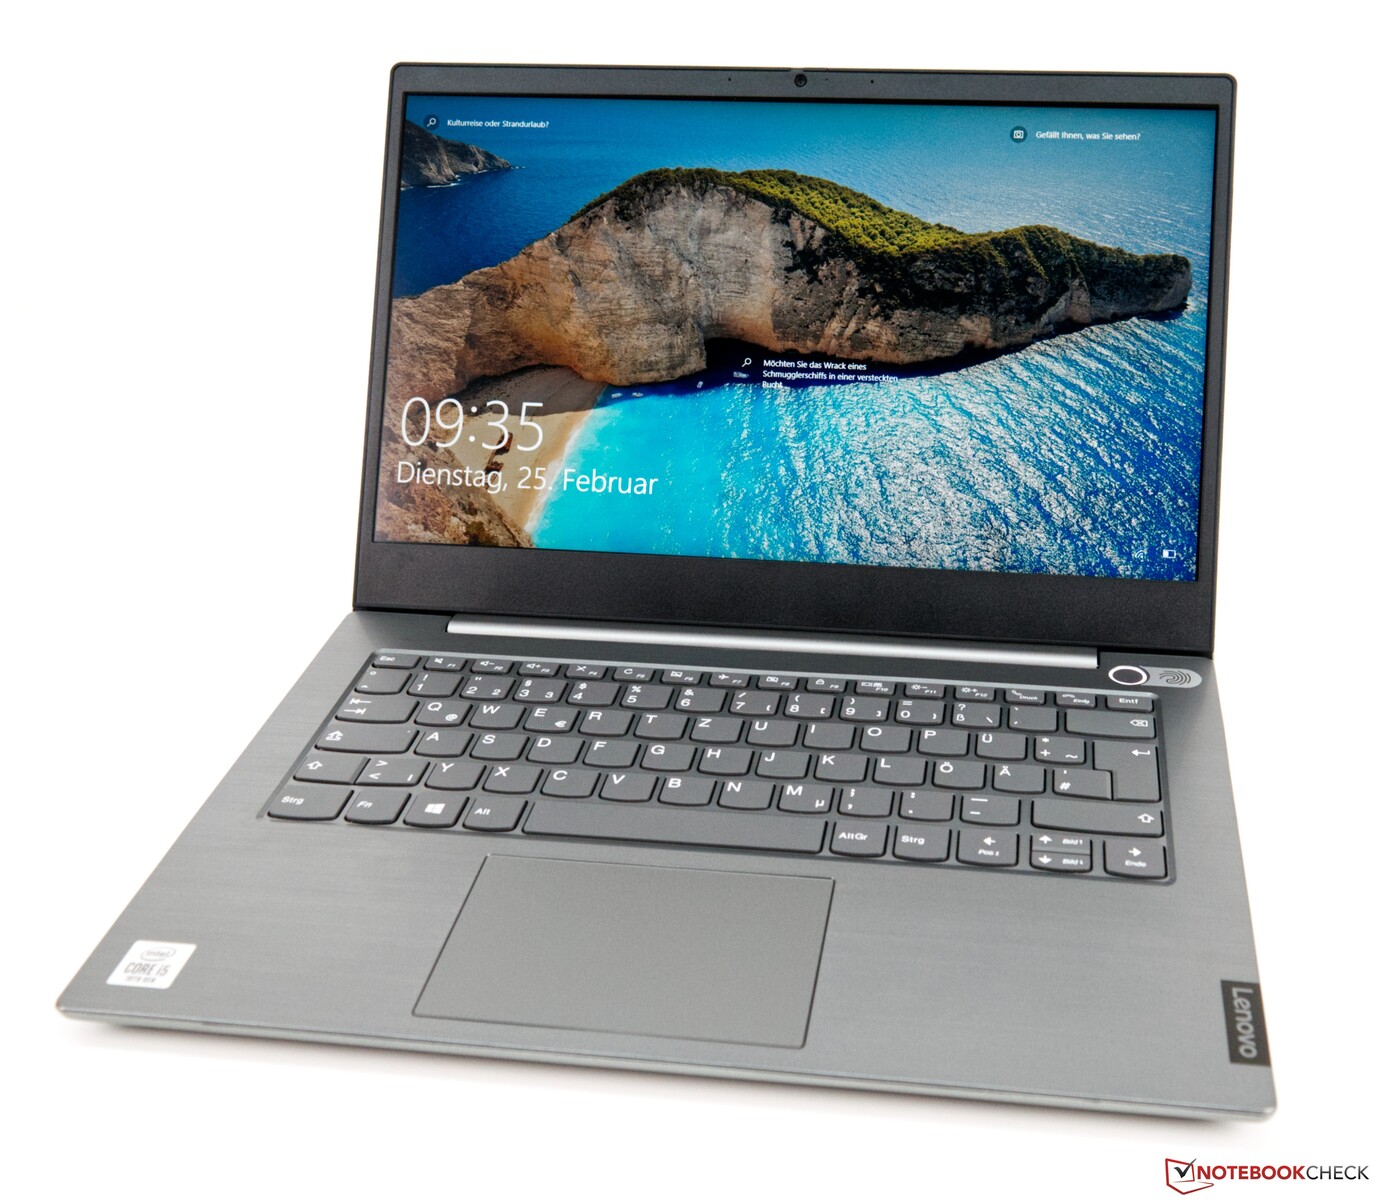
Visually, the ThinkBook 14 comes in a rather discreet gray case without too many bells and whistles. The choice of material is well thought out, and both base and display lid are made of aluminum, providing additional structural support. We were practically unable to warp and twist the case, and you will need a significant amount of force to depress the base or lid. The latter is particularly good at absorbing localized forces thereby avoiding the dreaded ripple effect on the display. The only parts made of plastic are the black bezels around the display. The hinges do a great job of keeping the display firmly in place and offer a maximum opening angle of 180 degrees. Teetering is reduced to an absolute minimum.
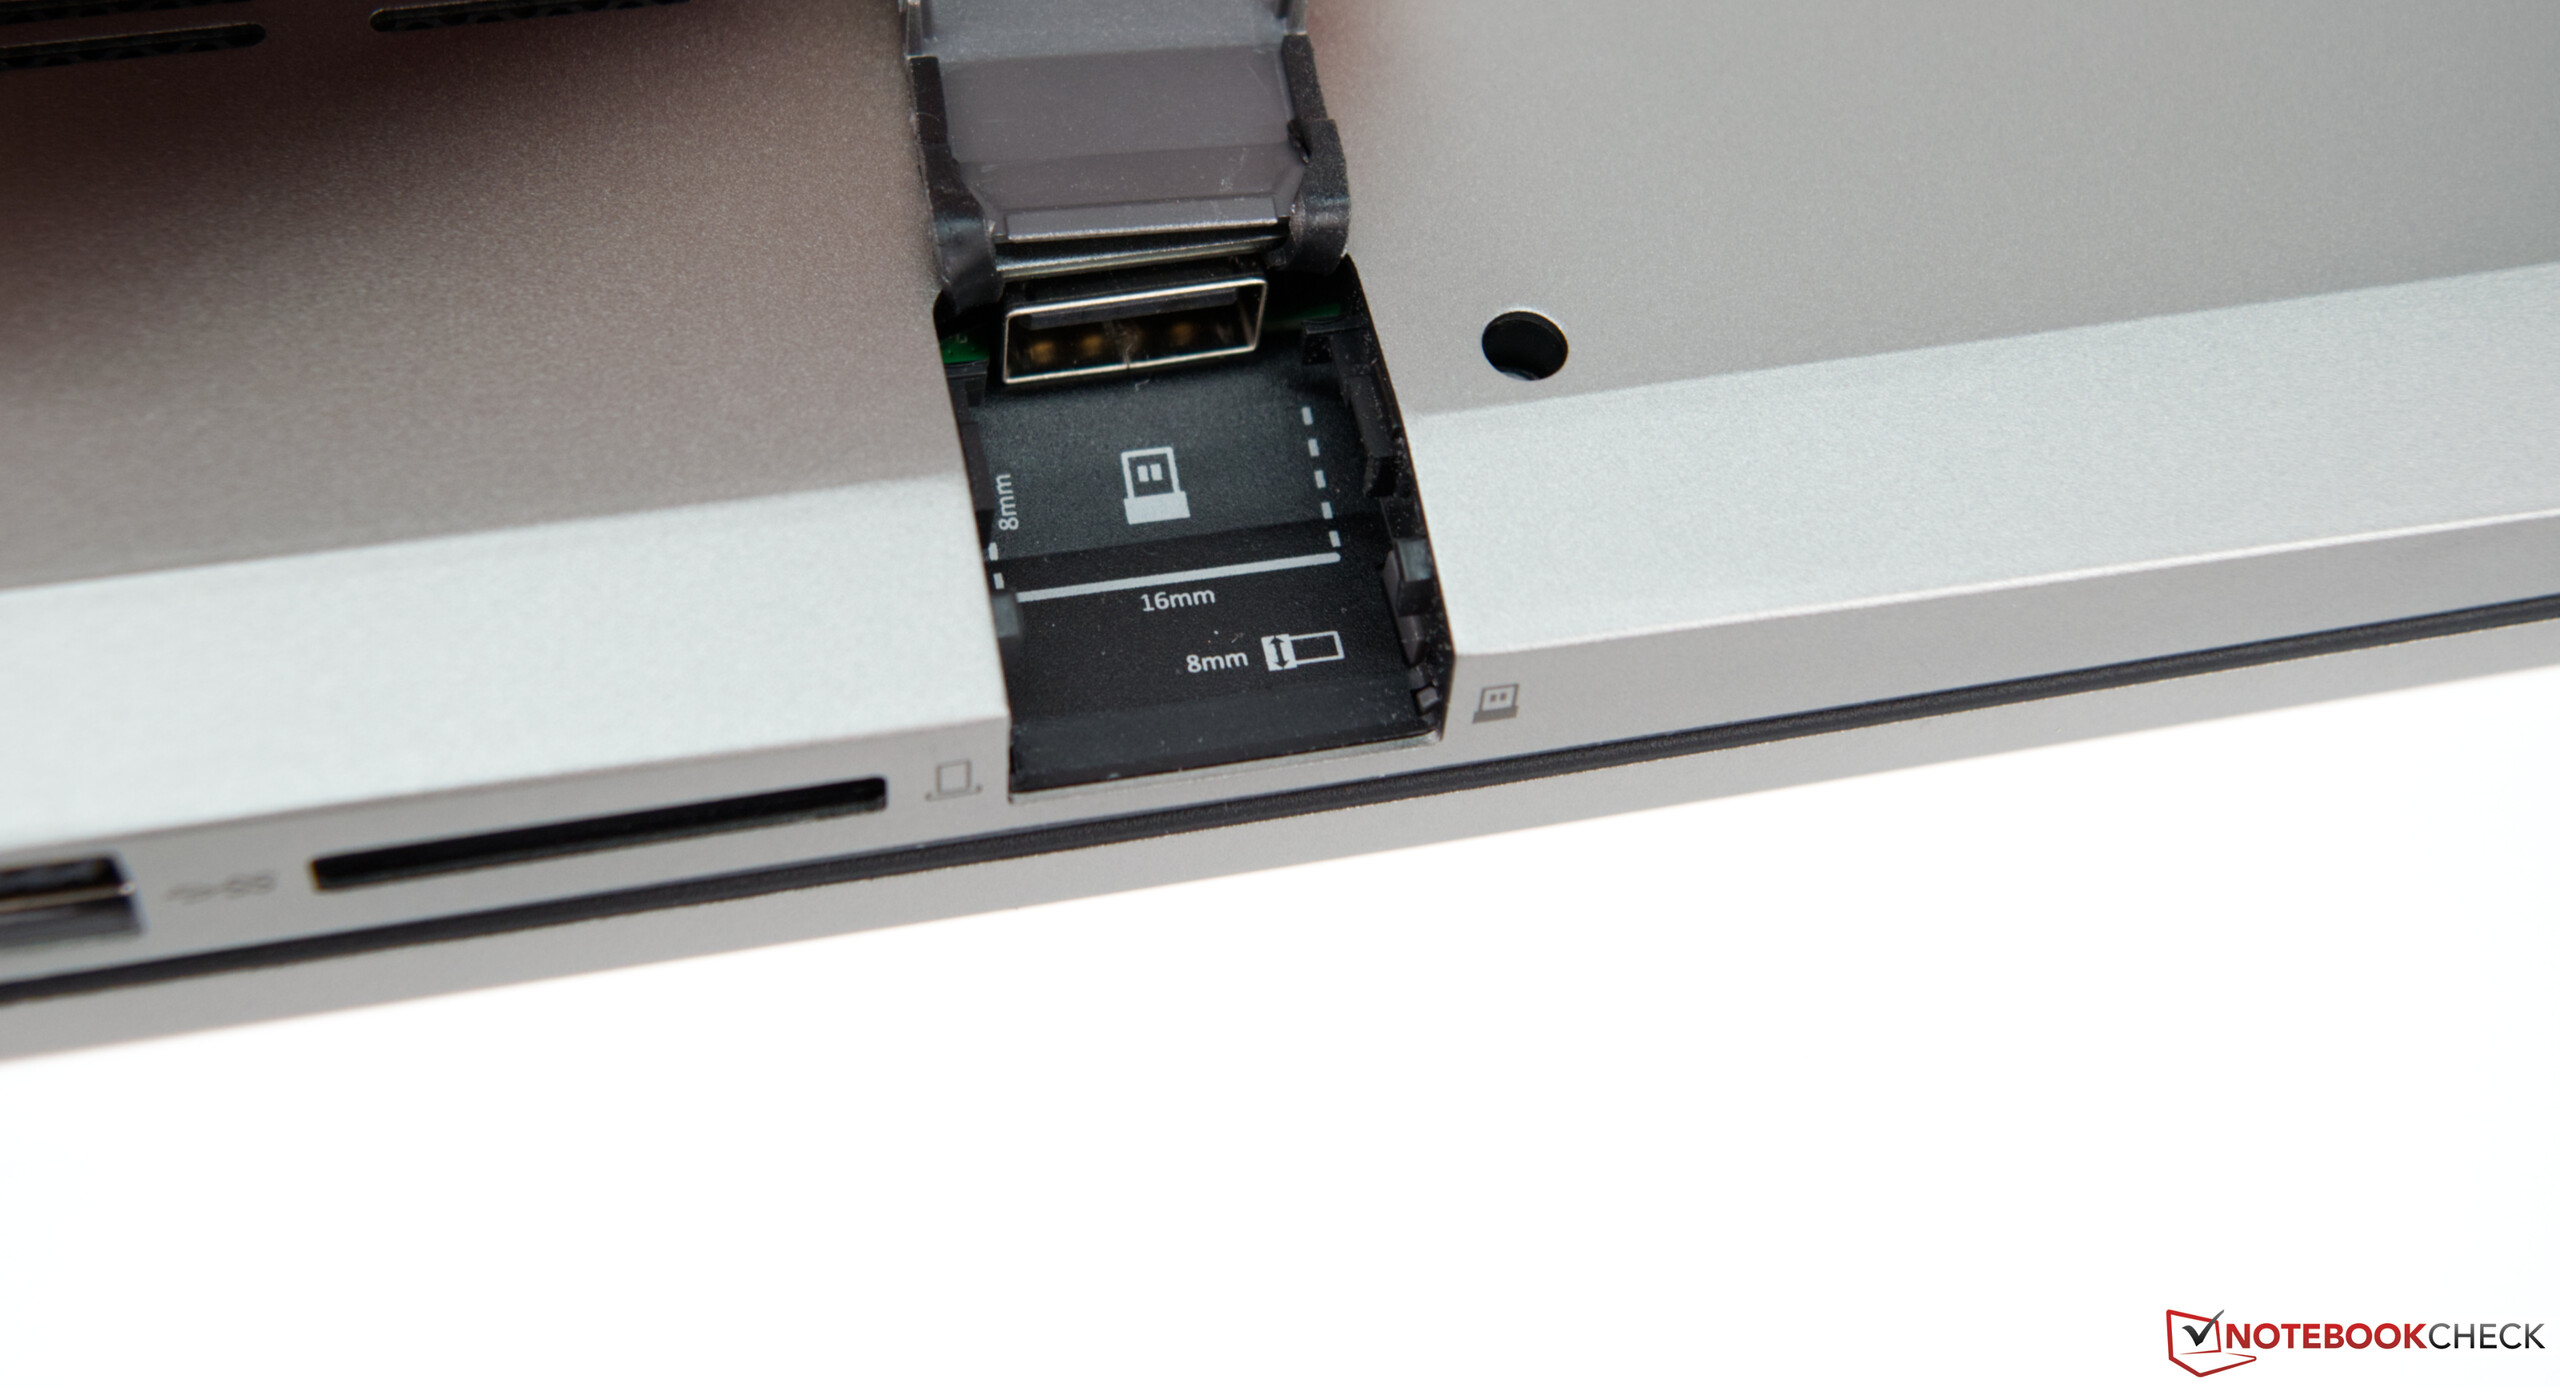
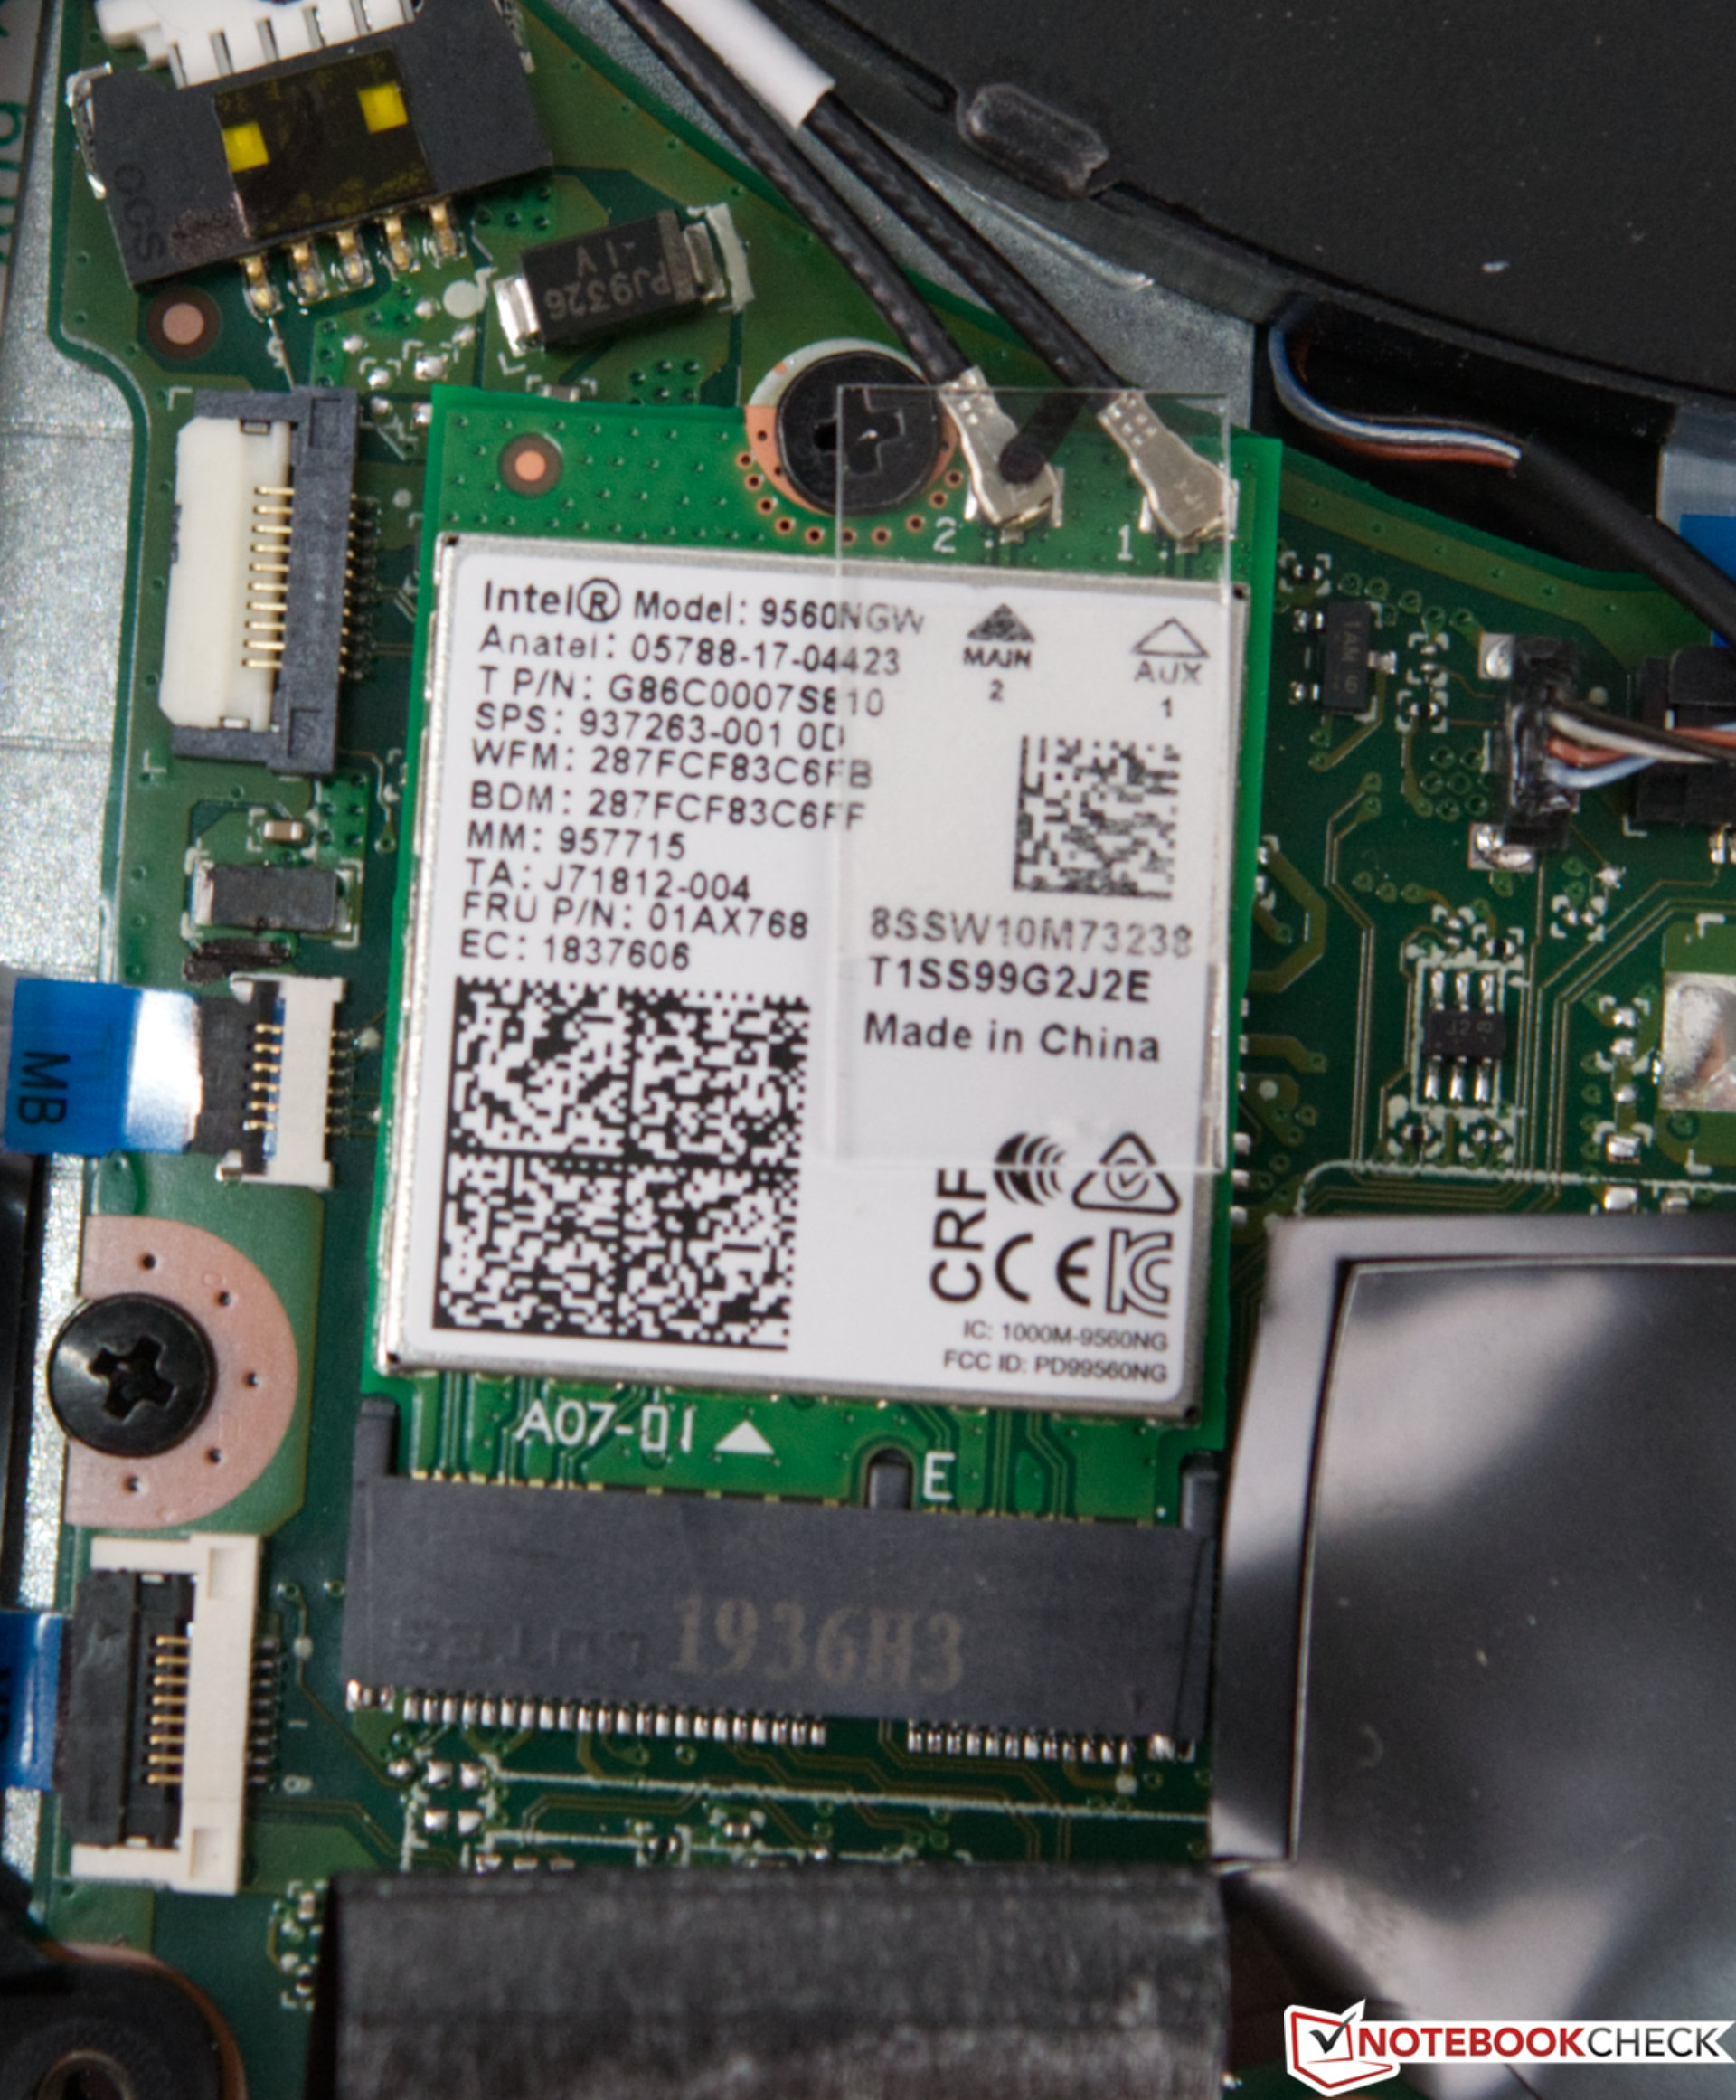
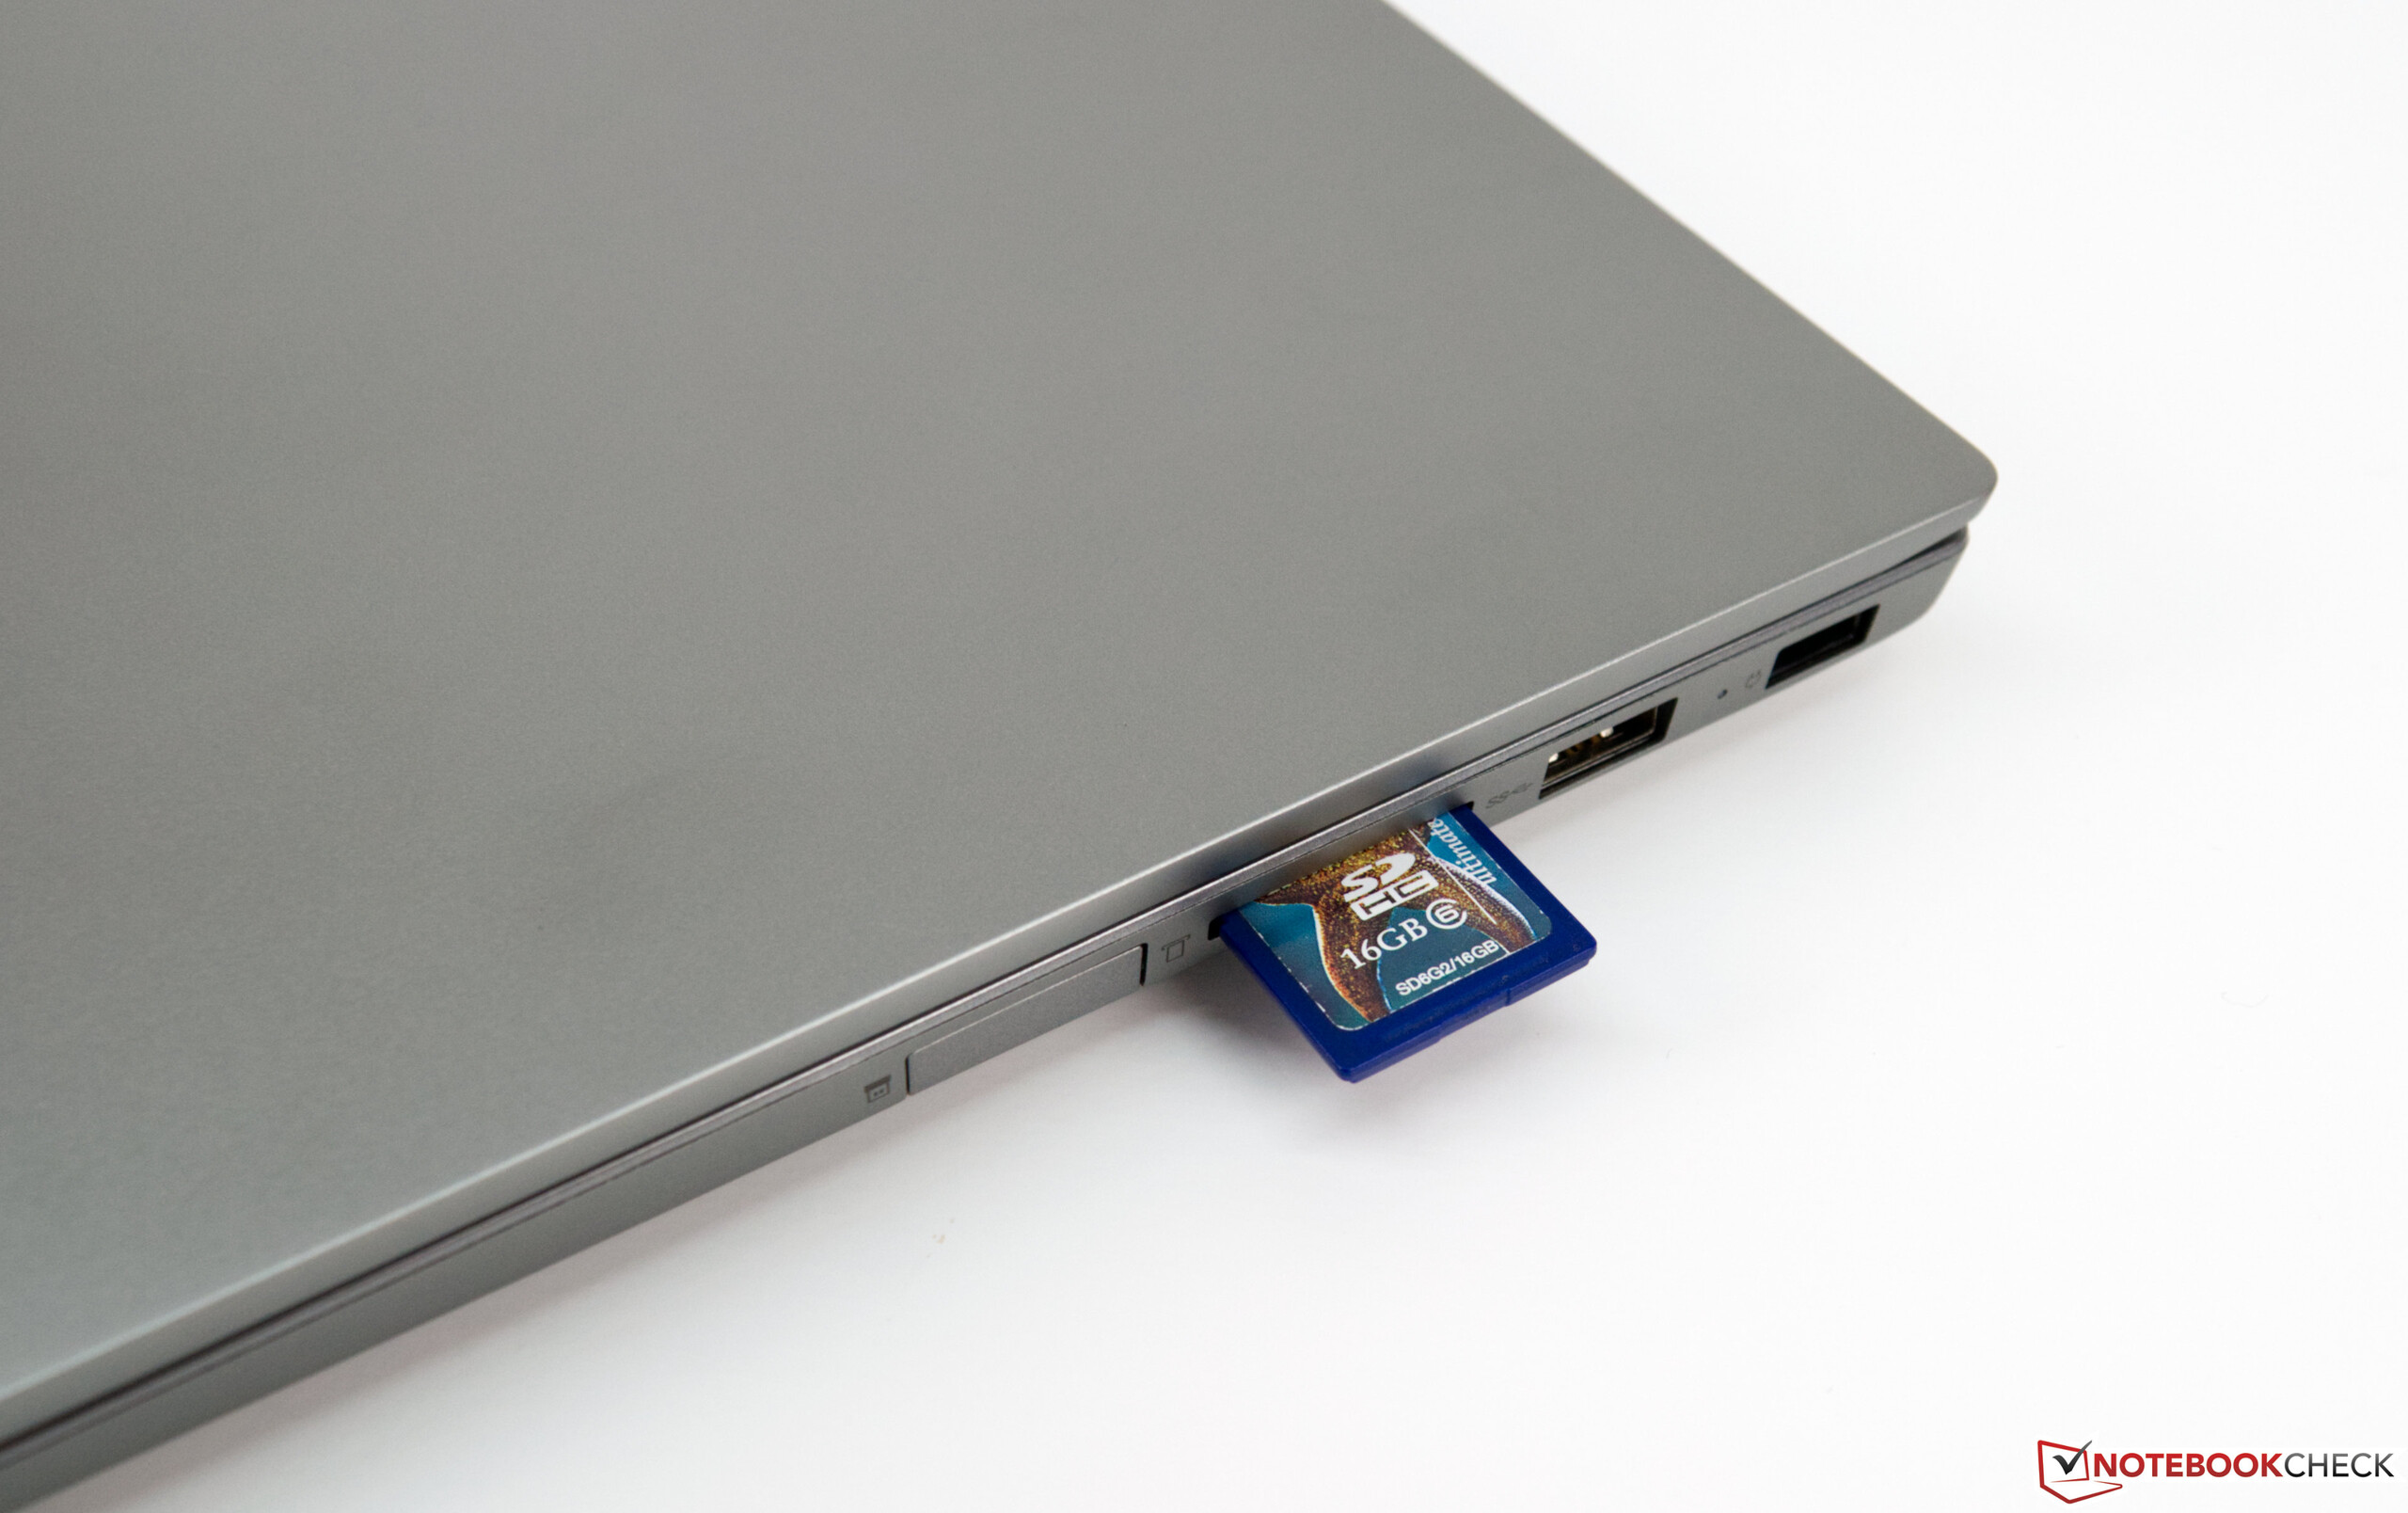
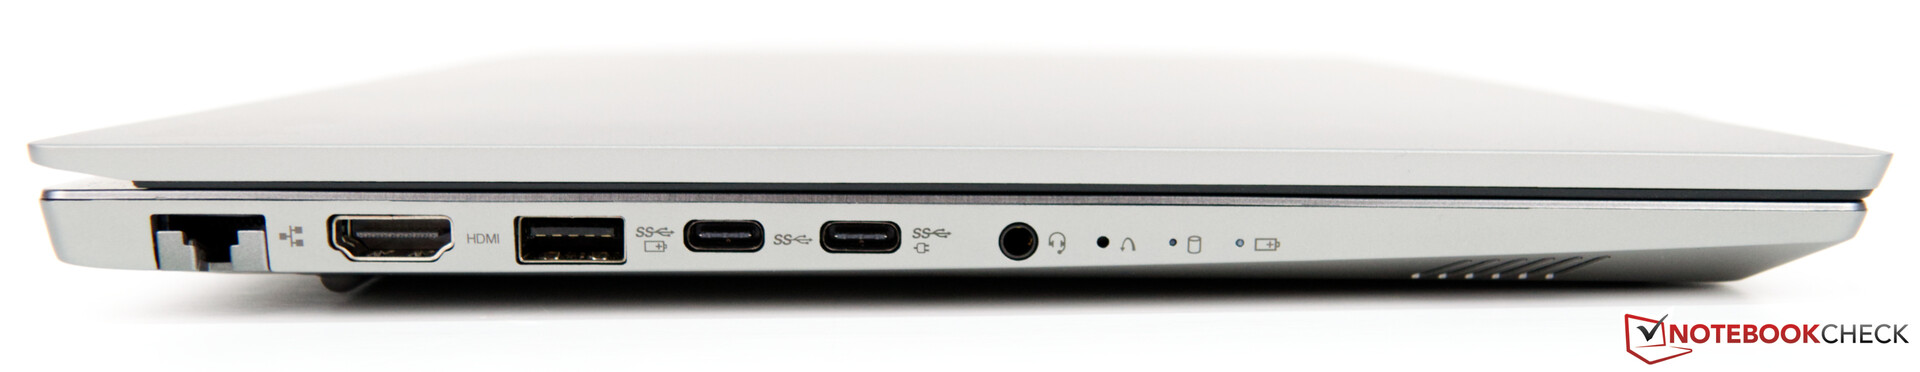
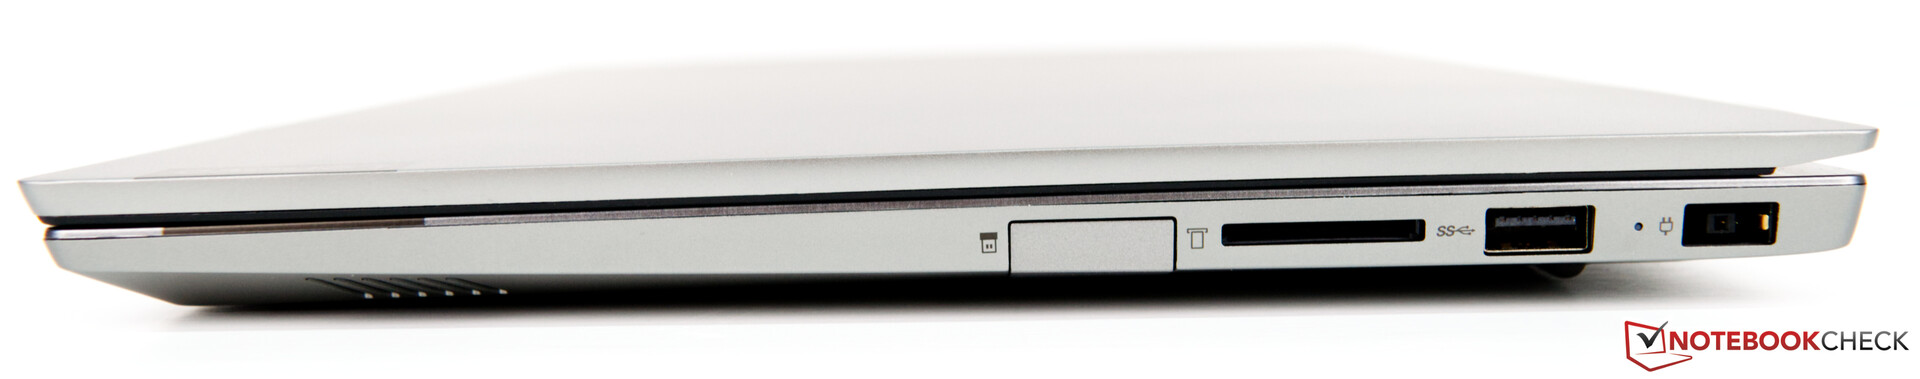
All things considered the ThinkBook 14 is very compact, as can be seen in our size comparison. Our review unit offered the smallest footprint in our test group. With its weight of 1.6 kg it can be found in the middle of the pack. Of particular note is the laptop’s connectivity as it offers a total of five USB ports, two of which are future-proof USB-C ports. The card reader is connected to the USB 3 bus, and it was able to outperform its competitors slightly when benchmarked with our 64 GB Toshiba Exceria Pro SDXC UHS-II reference card. Intel’s Wireless-AC 9560 played nicely with our Netgear Nighthawk RAX120 router, and the laptop also supports wired connectivity.

Connectivity
| SD Card Reader | |
| average JPG Copy Test (av. of 3 runs) | |
| Lenovo ThinkBook 14-IML-20RV006TGE (Toshiba Exceria Pro SDXC 64 GB UHS-II) | |
| Lenovo ThinkPad E490-20N8000RGE (Toshiba Exceria Pro M501) | |
| Lenovo ThinkPad E485-20KU000NGE (Toshiba Exceria Pro M501) | |
| Average of class Office (22.4 - 198.5, n=27, last 2 years) | |
| HP 14-dk0008ng (Toshiba Exceria Pro SDXC 64 GB UHS-II) | |
| Dell Latitude 3400 (Toshiba Exceria Pro SDXC 64 GB UHS-II) | |
| maximum AS SSD Seq Read Test (1GB) | |
| Lenovo ThinkBook 14-IML-20RV006TGE (Toshiba Exceria Pro SDXC 64 GB UHS-II) | |
| Lenovo ThinkPad E490-20N8000RGE (Toshiba Exceria Pro M501) | |
| Lenovo ThinkPad E485-20KU000NGE (Toshiba Exceria Pro M501) | |
| Average of class Office (27.4 - 249, n=25, last 2 years) | |
| HP 14-dk0008ng (Toshiba Exceria Pro SDXC 64 GB UHS-II) | |
| Dell Latitude 3400 (Toshiba Exceria Pro SDXC 64 GB UHS-II) | |
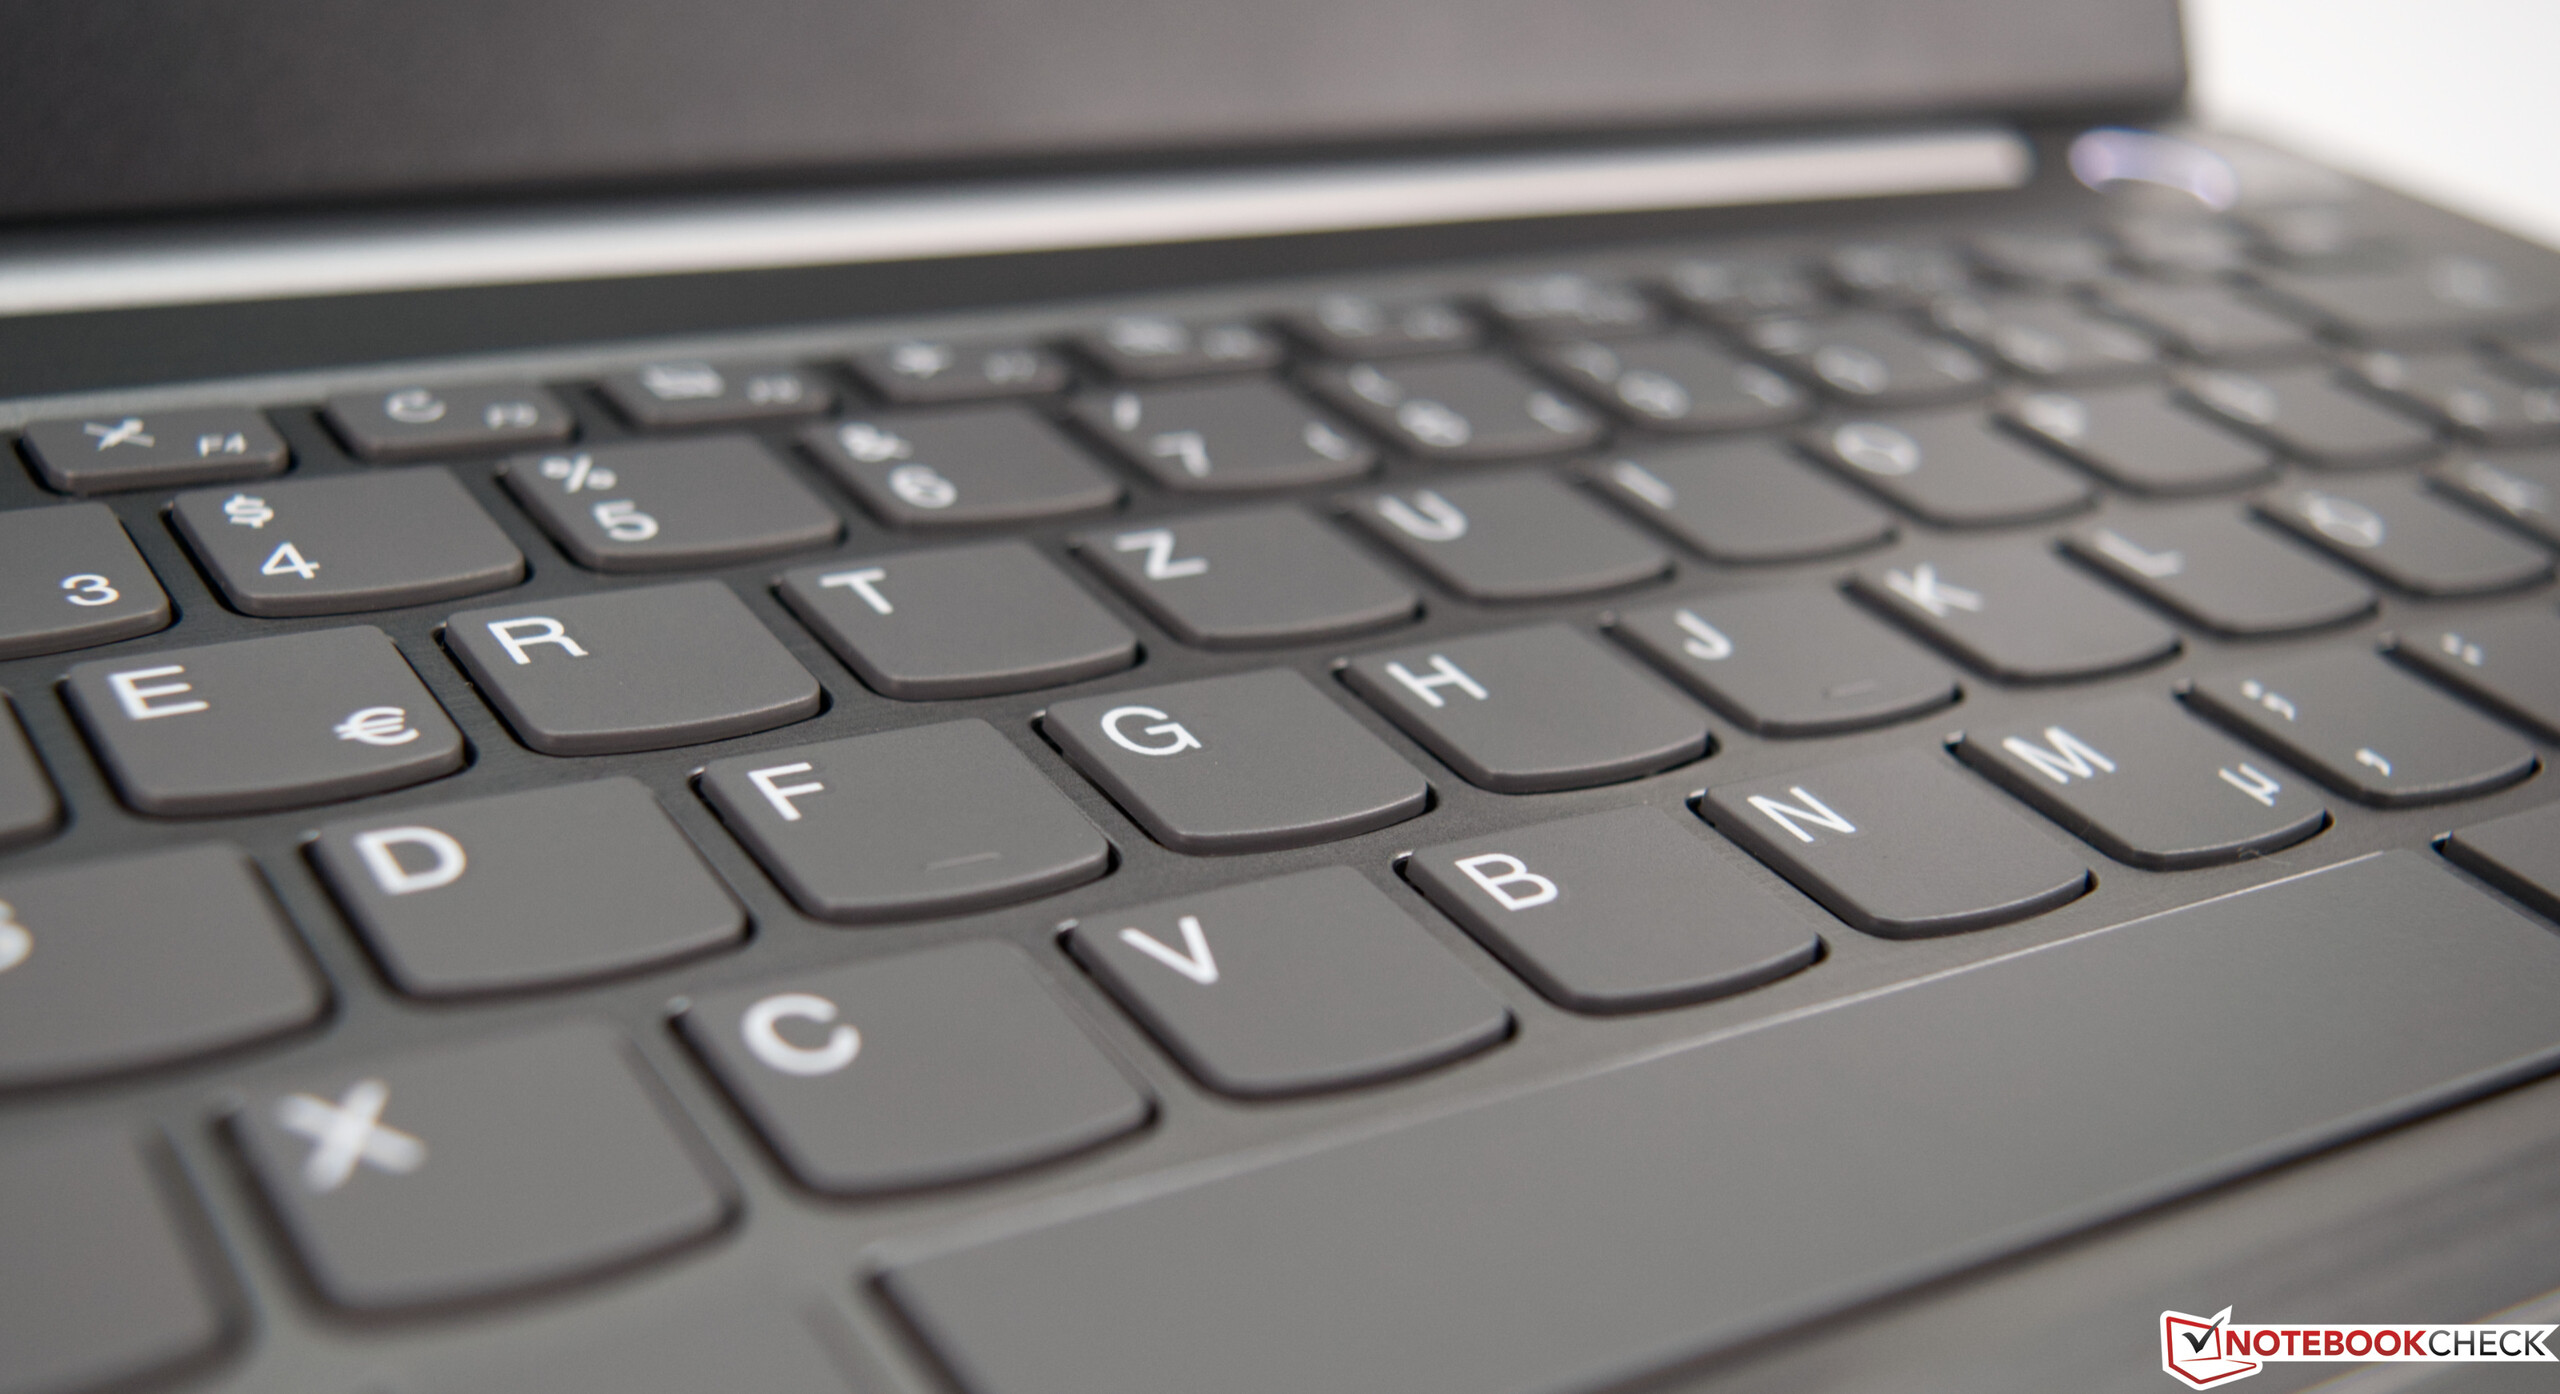
Input Devices
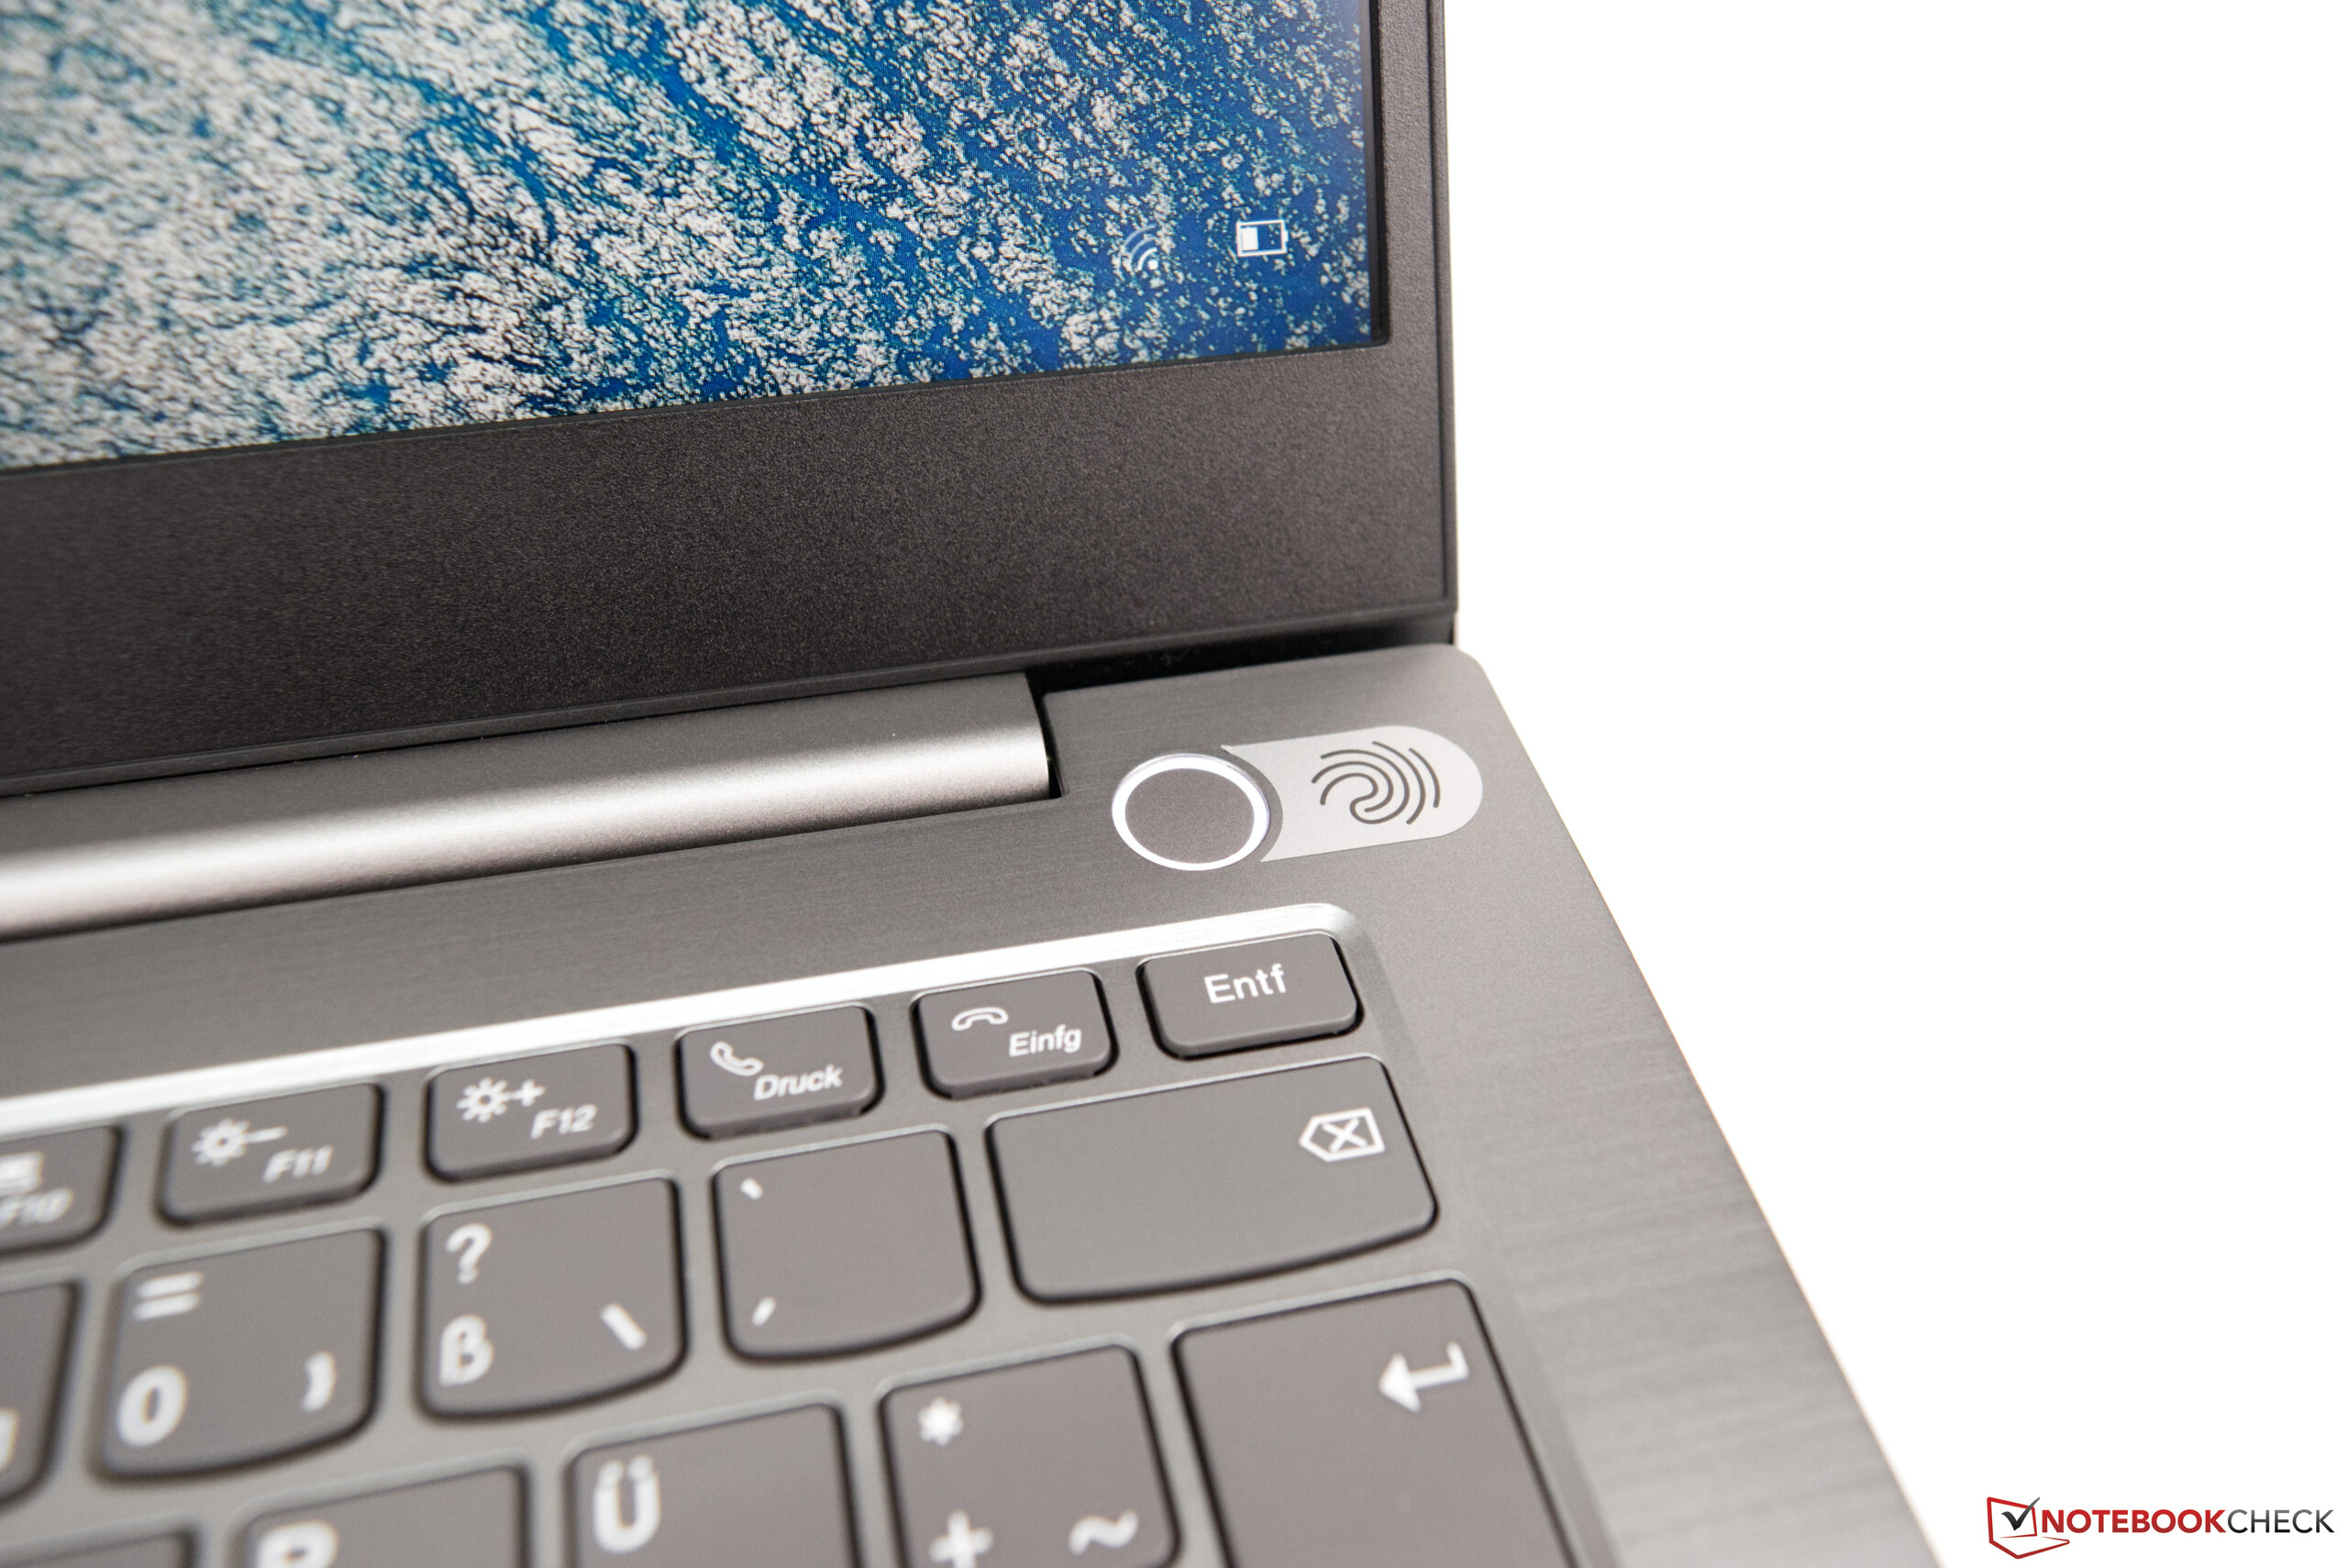
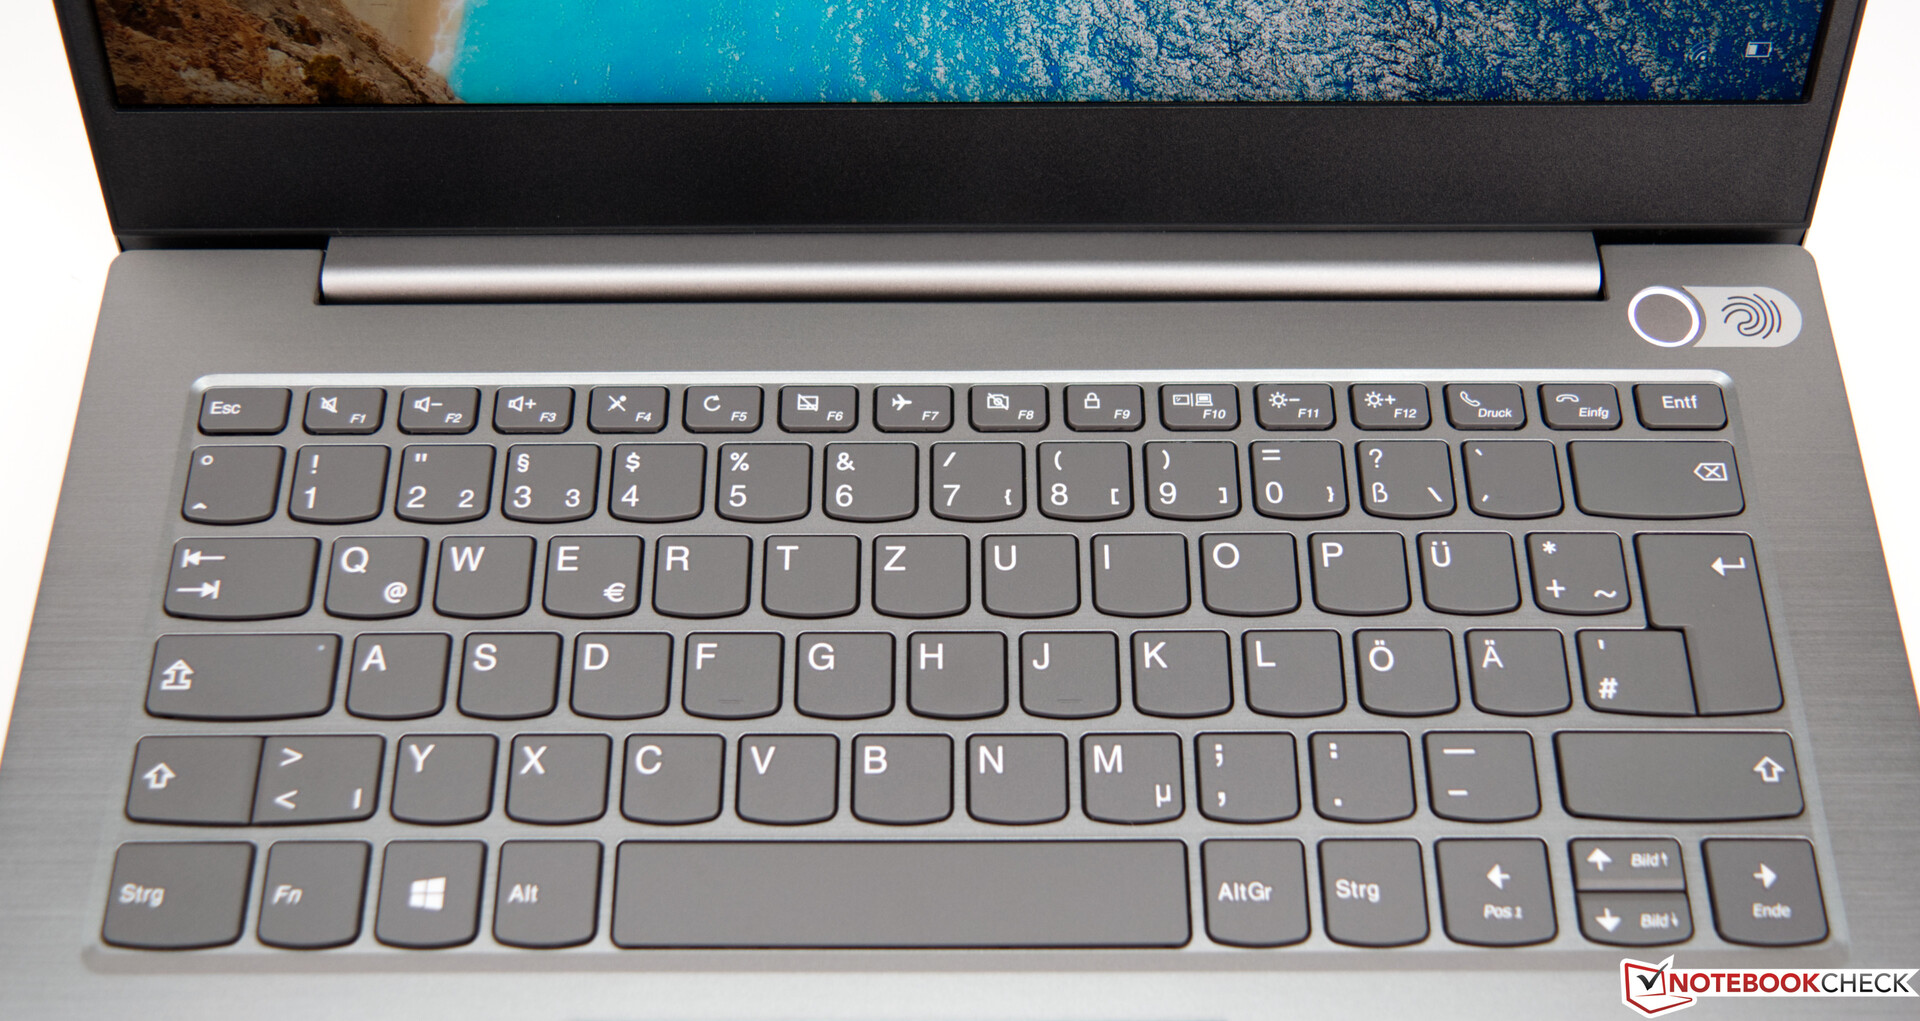
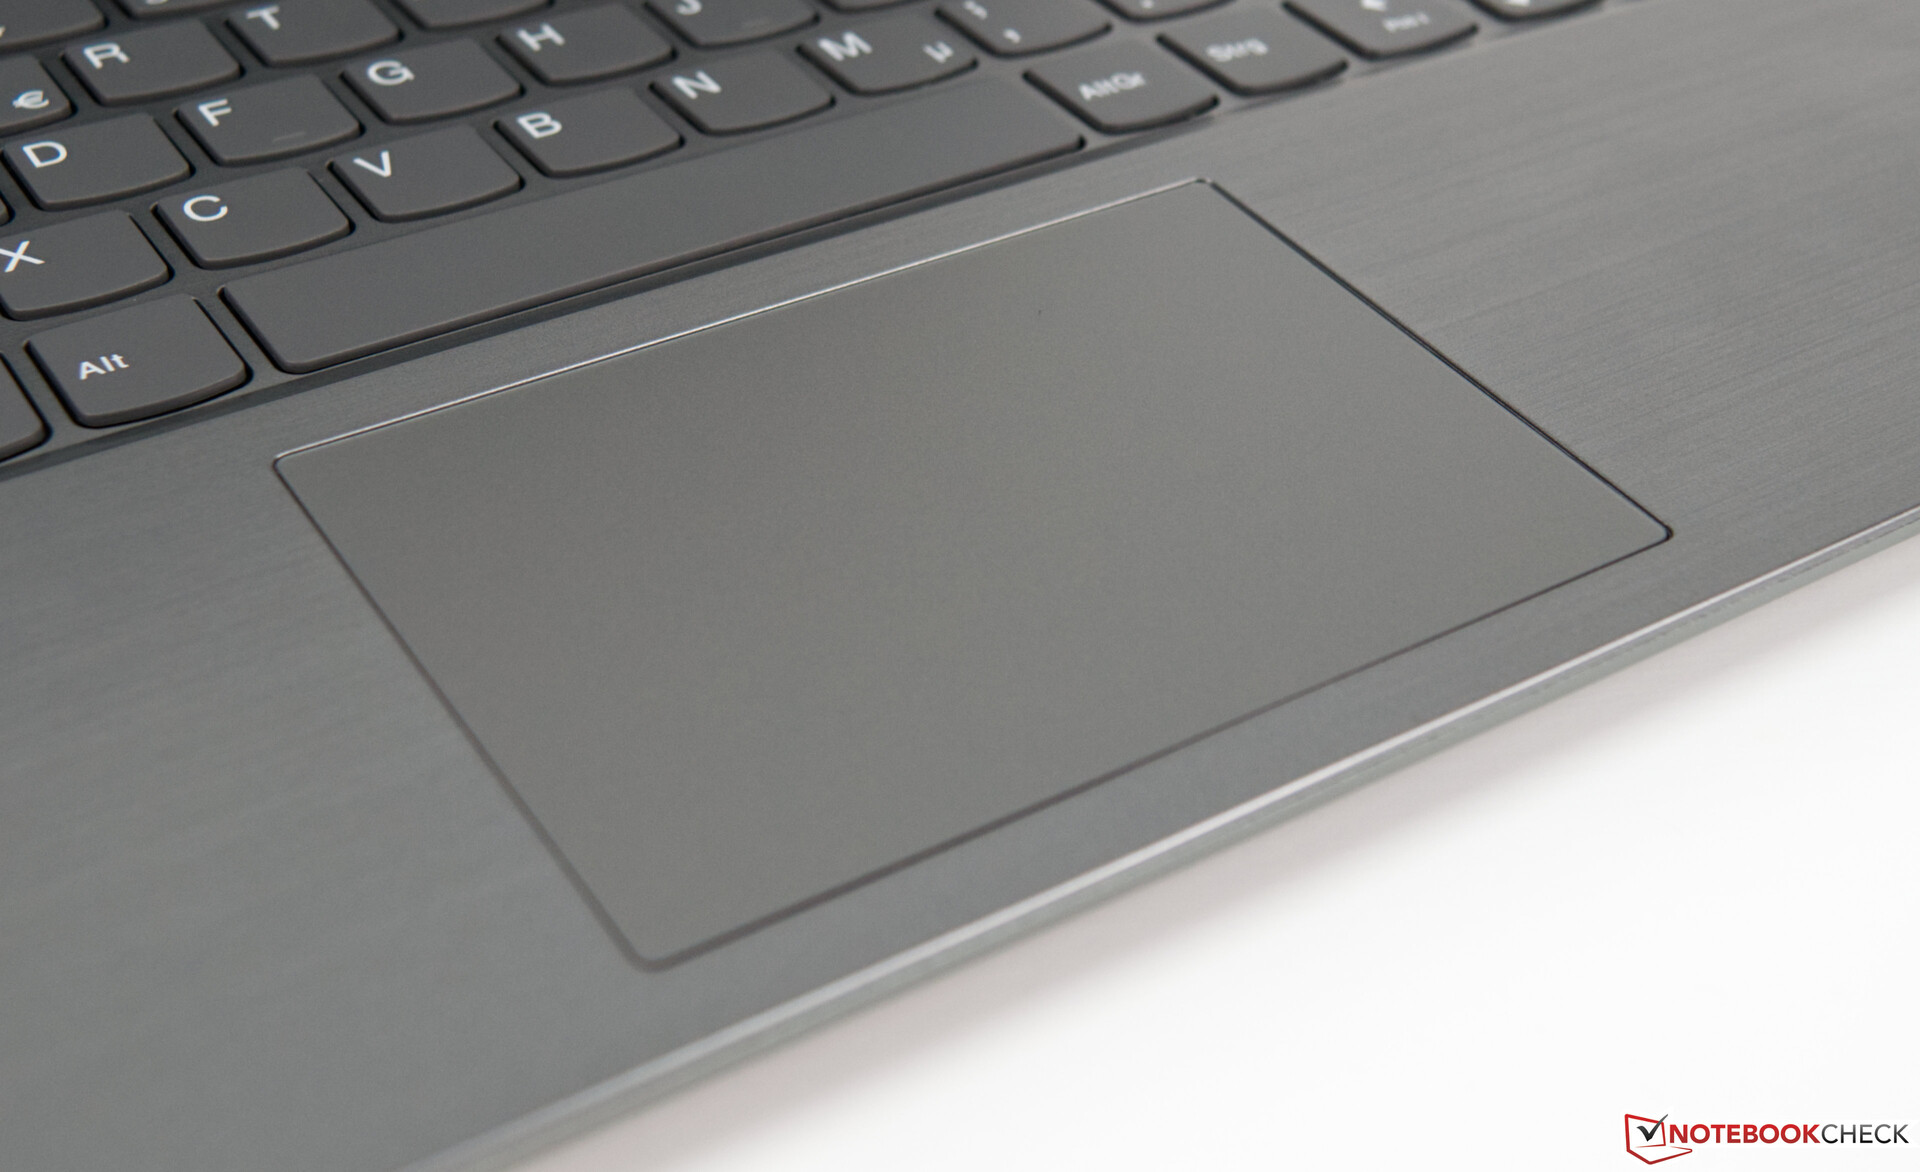
The ThinkBook 14 comes with a chiclet keyboard but lacks a dedicated numpad due to space constraints. The keyboard looks very clean and straightforward overall, and the keycaps are comfortably large and slightly roughened for improved grip. Key travel is fairly short and bottoms out in a very well-pronounced key pressure point. Unfortunately, Lenovo did not include a keyboard backlight, which would have improved readability in the dark.
We have already encountered this particular ClickPad on the Lenovo ThinkBook 15, and our smaller 14-inch notebook is equipped with the exact same model. At 10.5 x 7.1 cm (4.0 x 2.8 inches) it is sufficiently large for comfortable multi-touch input. The buttons located at the bottom edge offer a discreet clicking sensation.
Display – fails to meet its own expectations
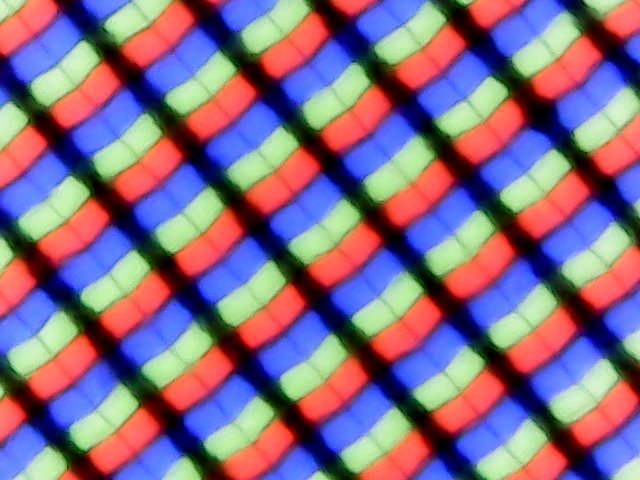
Our ThinkBook 14 SKU came equipped with a matte 14-inch IPS panel with FHD resolution and a pixel density of 157 ppi. According to the spec sheet a Full HD TN panel is also available, albeit with lower maximum brightness and contrast ratio.
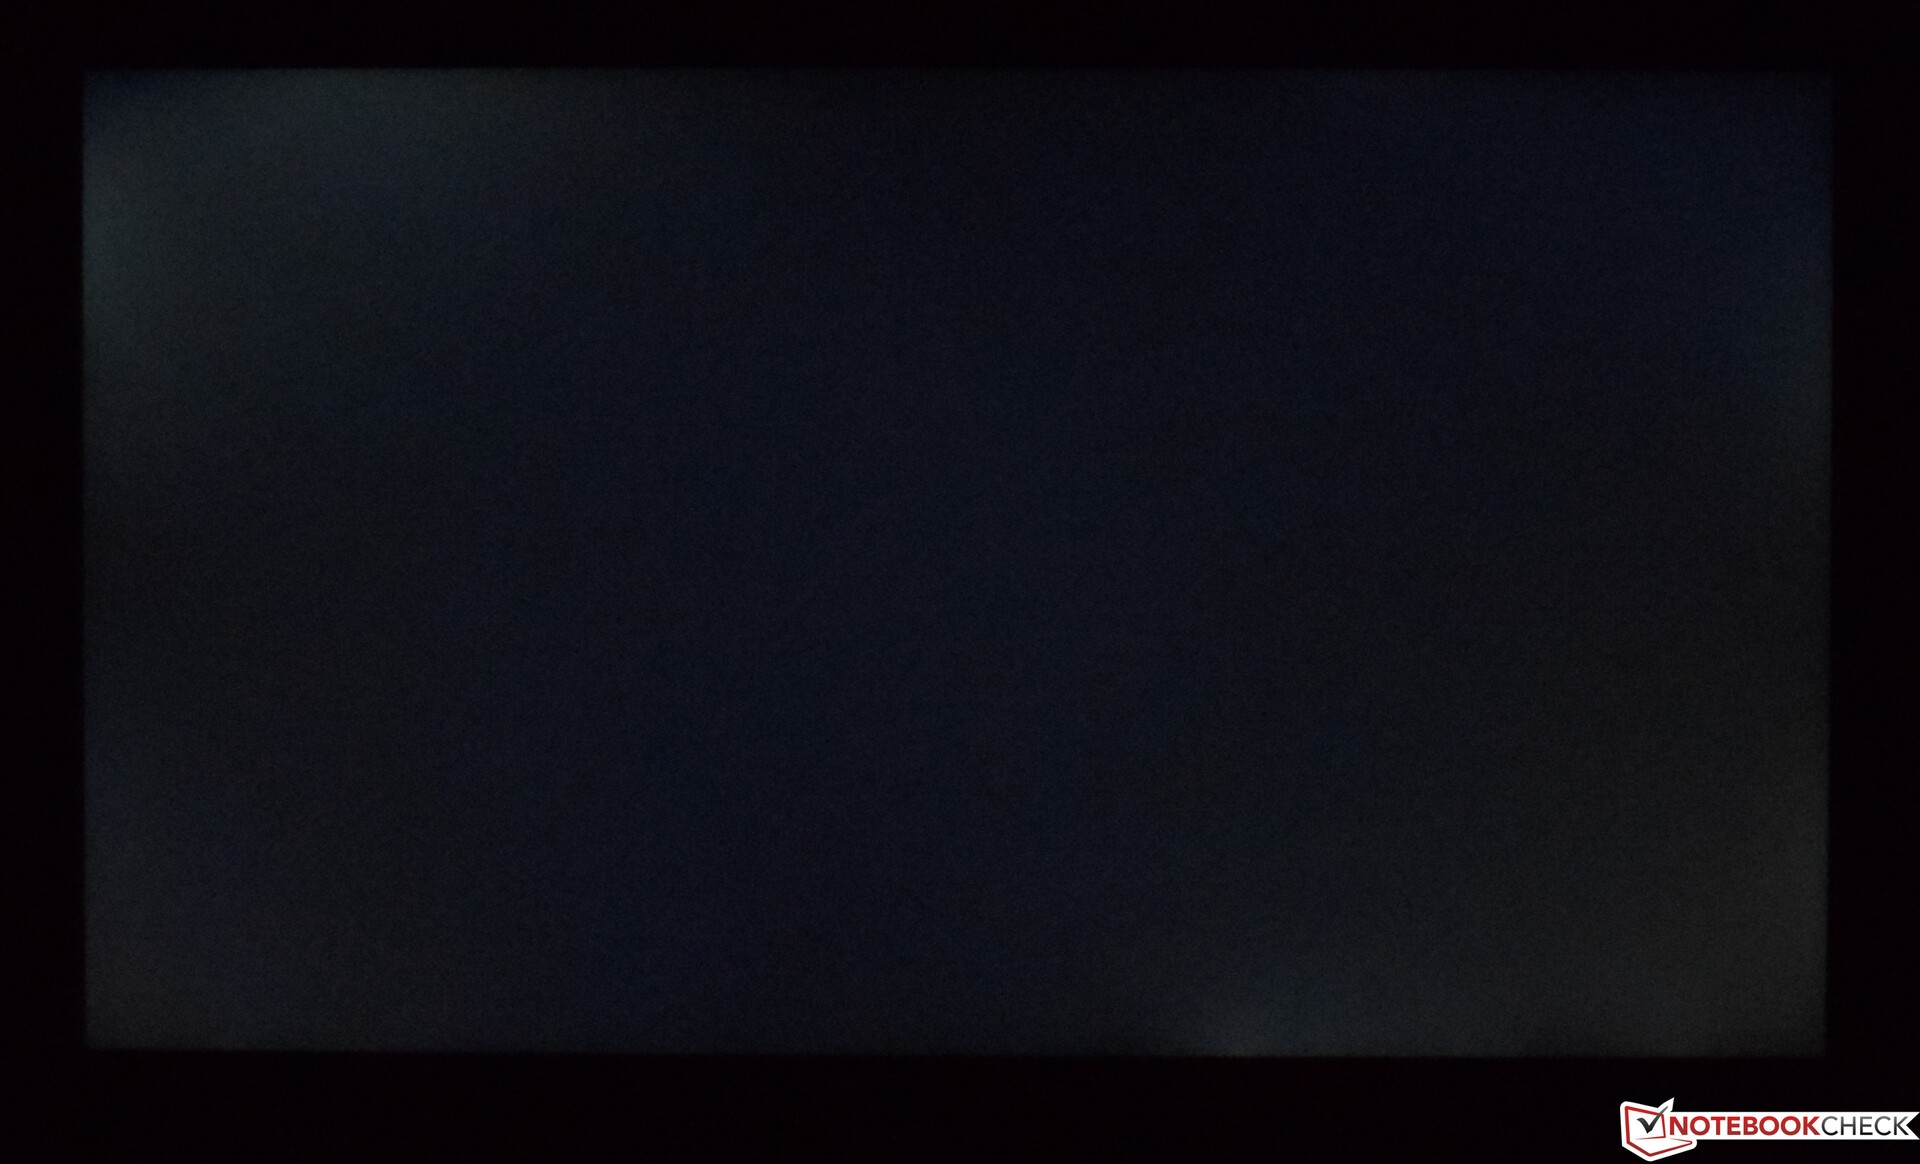
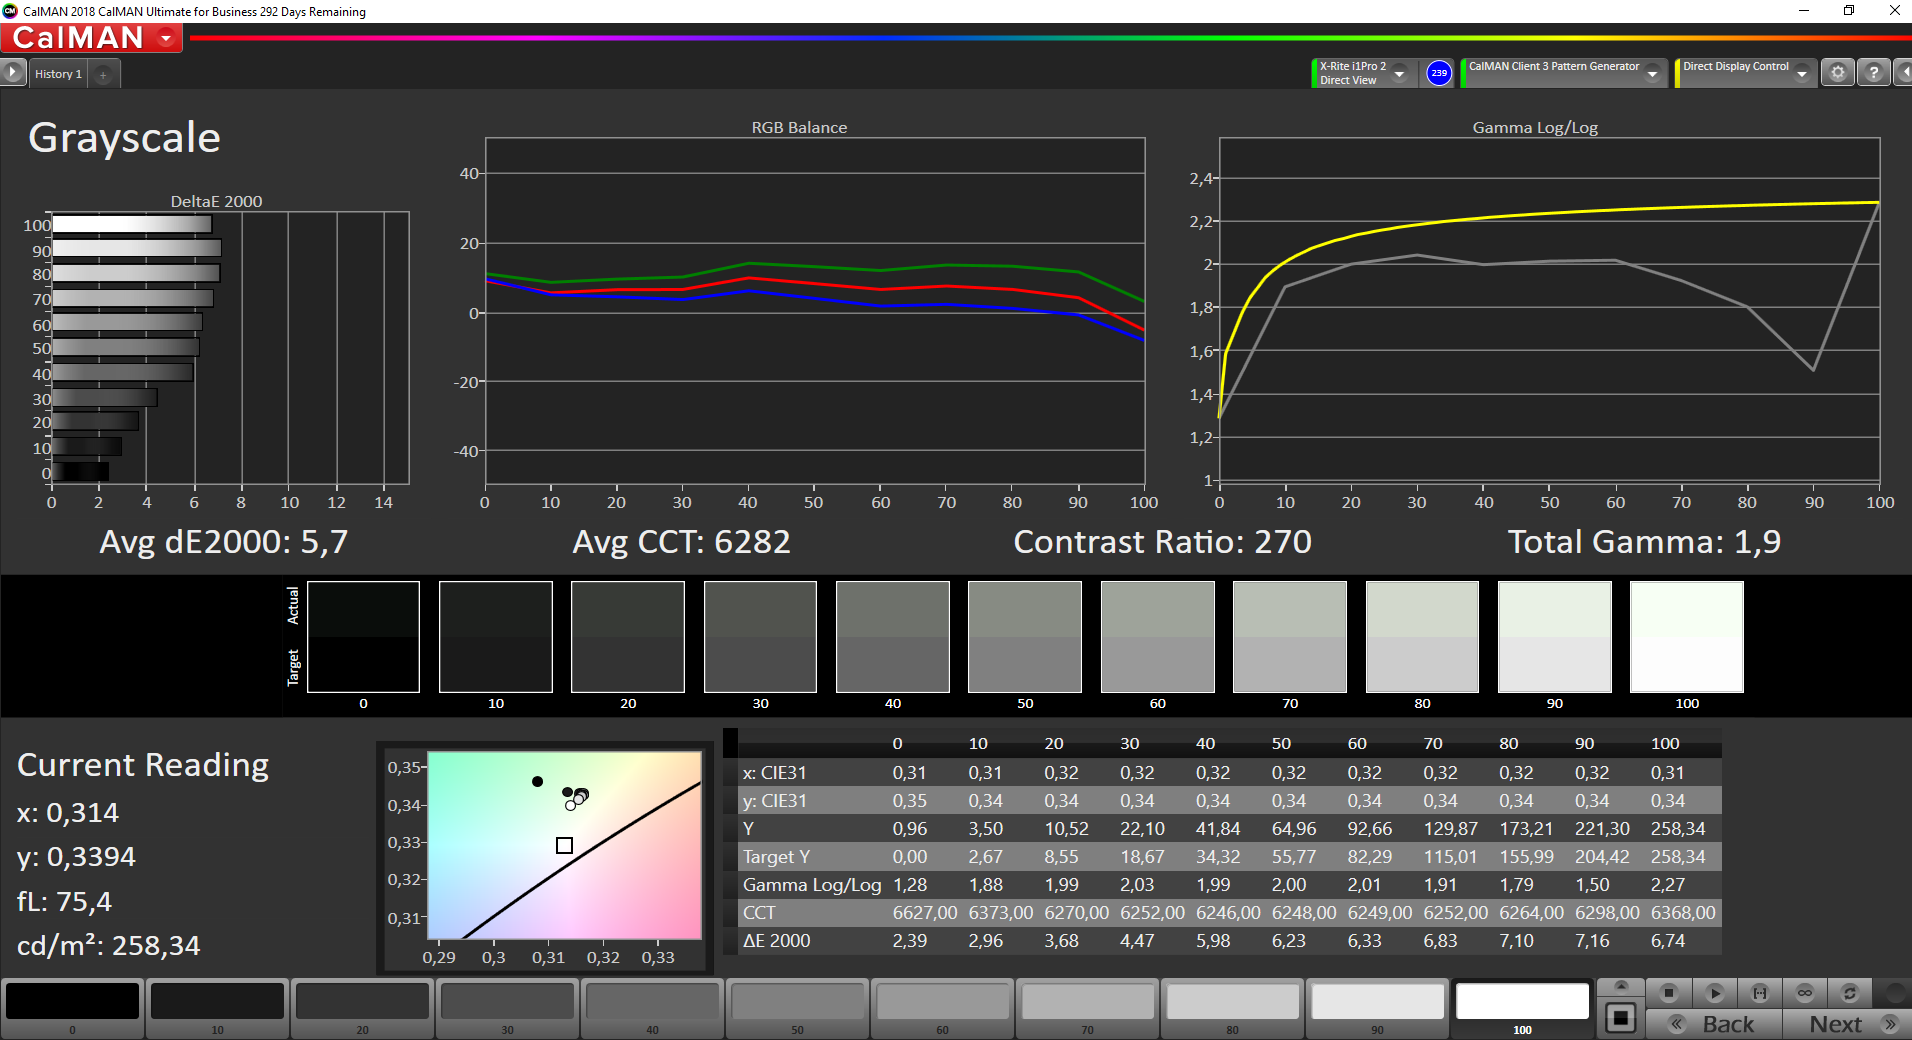
Speaking of which, our review unit only managed a meager 232 nits, and thus failed to achieve its advertised brightness of 250 nits. Its contrast ratio of 267:1 was just as bad due to the combination of low brightness and a very high black point. We could not believe how bad it was and repeated our tests and measurements several times to no avail. Display brightness regulation is achieved through PWM, fortunately at a very high frequency. It should thus not cause any issues even in sensitive users. Minor clouding was visible in dark scenes.
| |||||||||||||||||||||||||
Brightness Distribution: 86 %
Center on Battery: 258 cd/m²
Contrast: 267:1 (Black: 0.96 cd/m²)
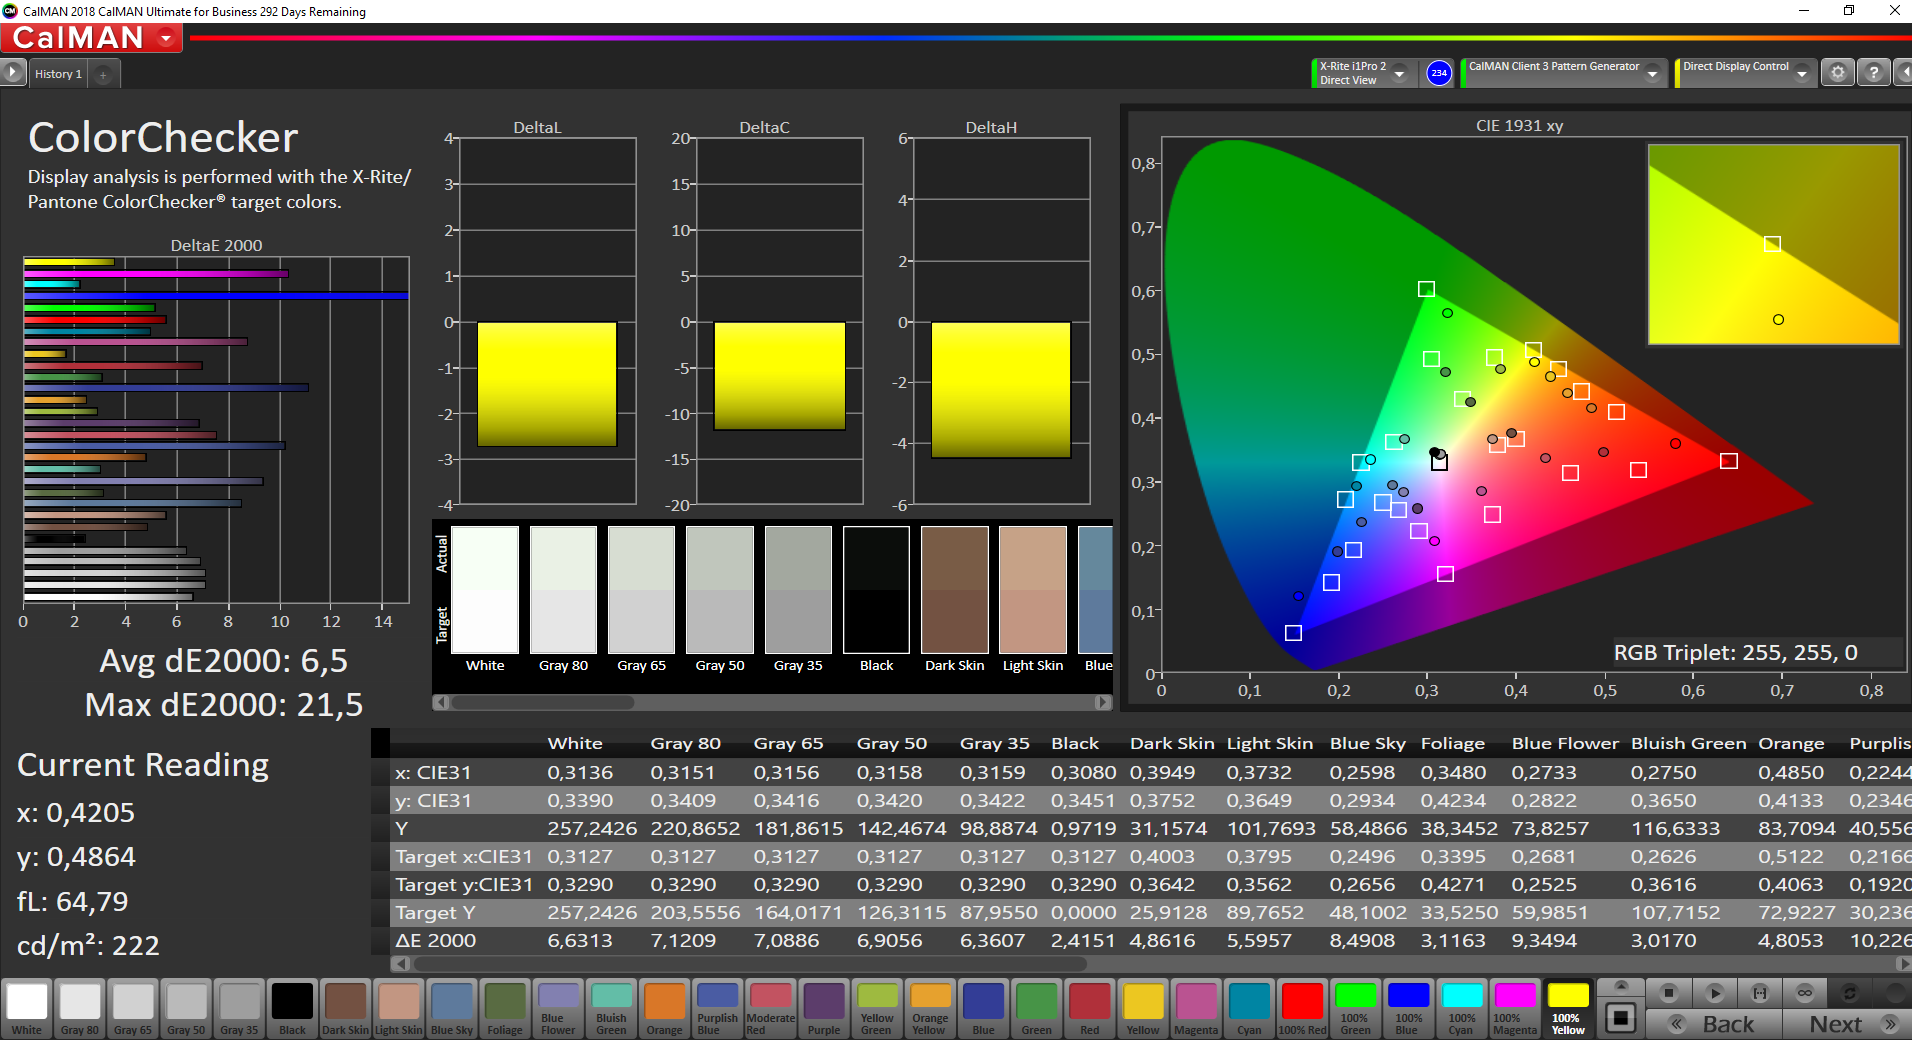
ΔE ColorChecker Calman: 6.5 | ∀{0.5-29.43 Ø4.75}
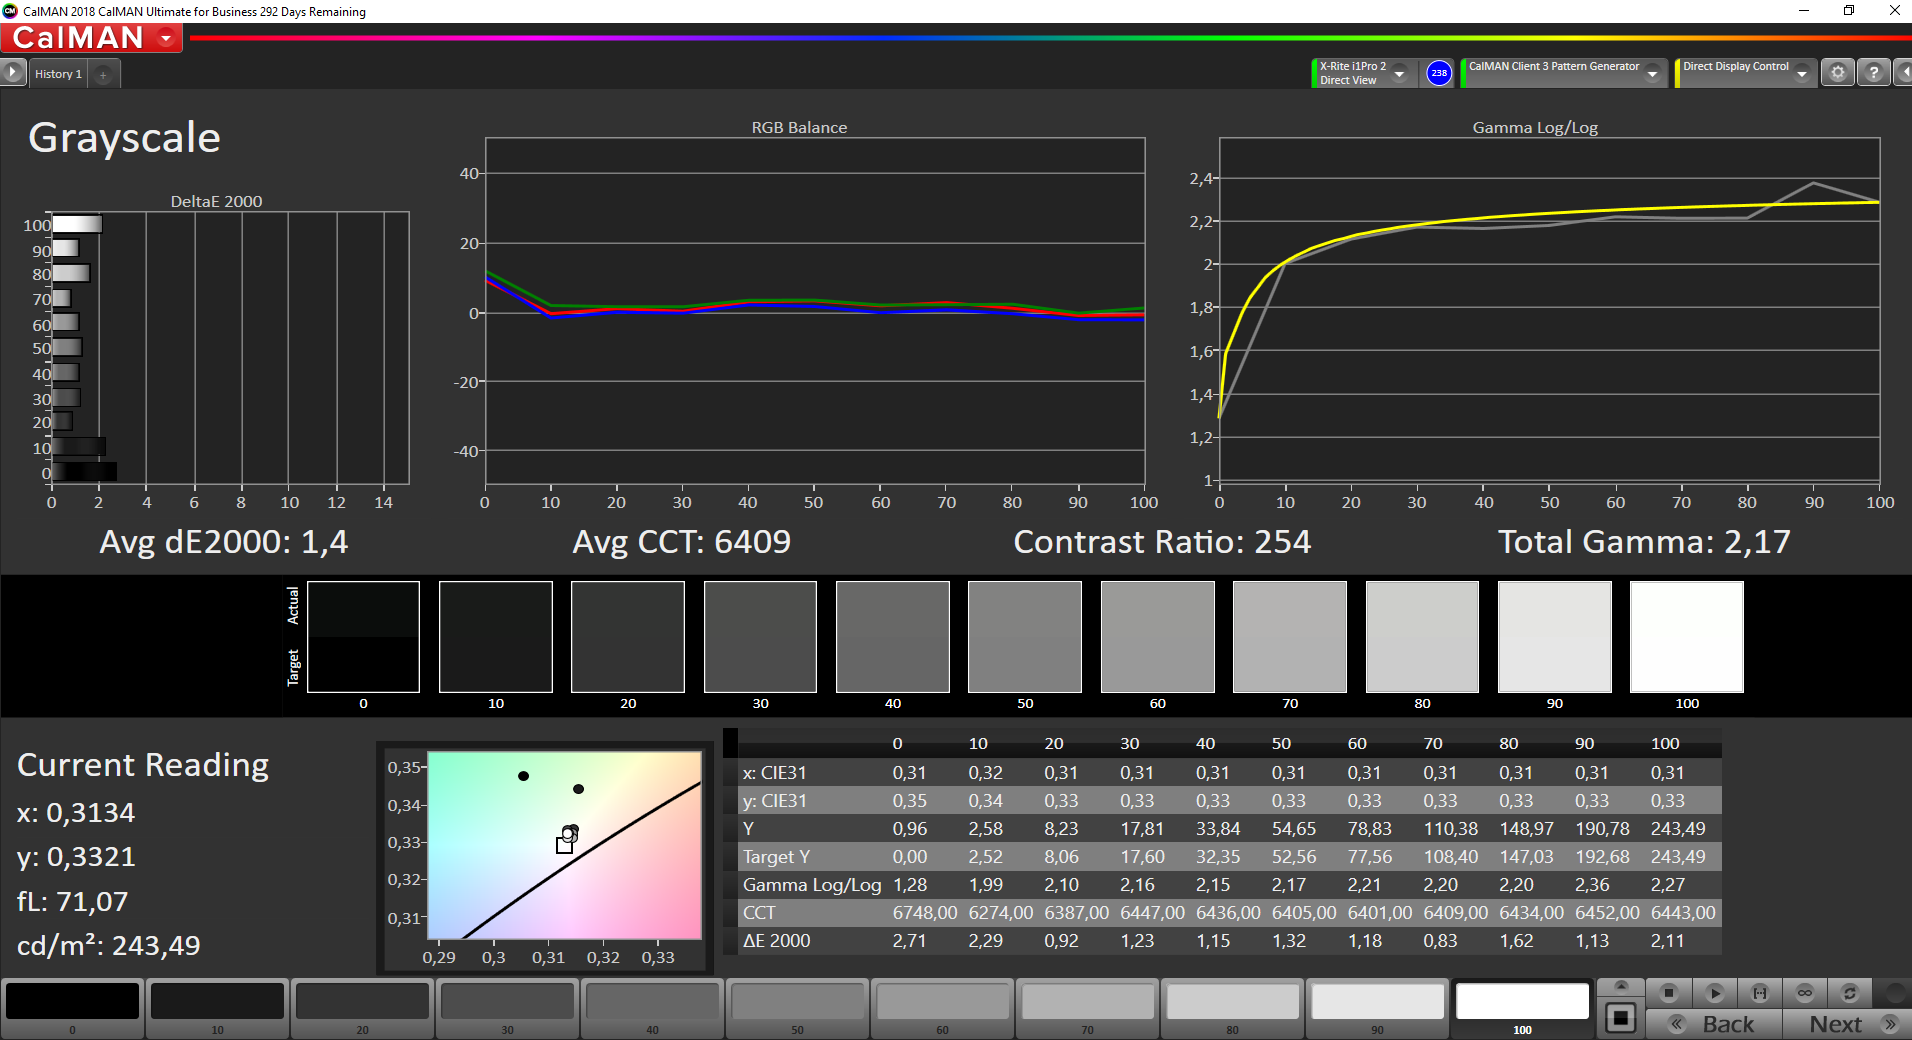
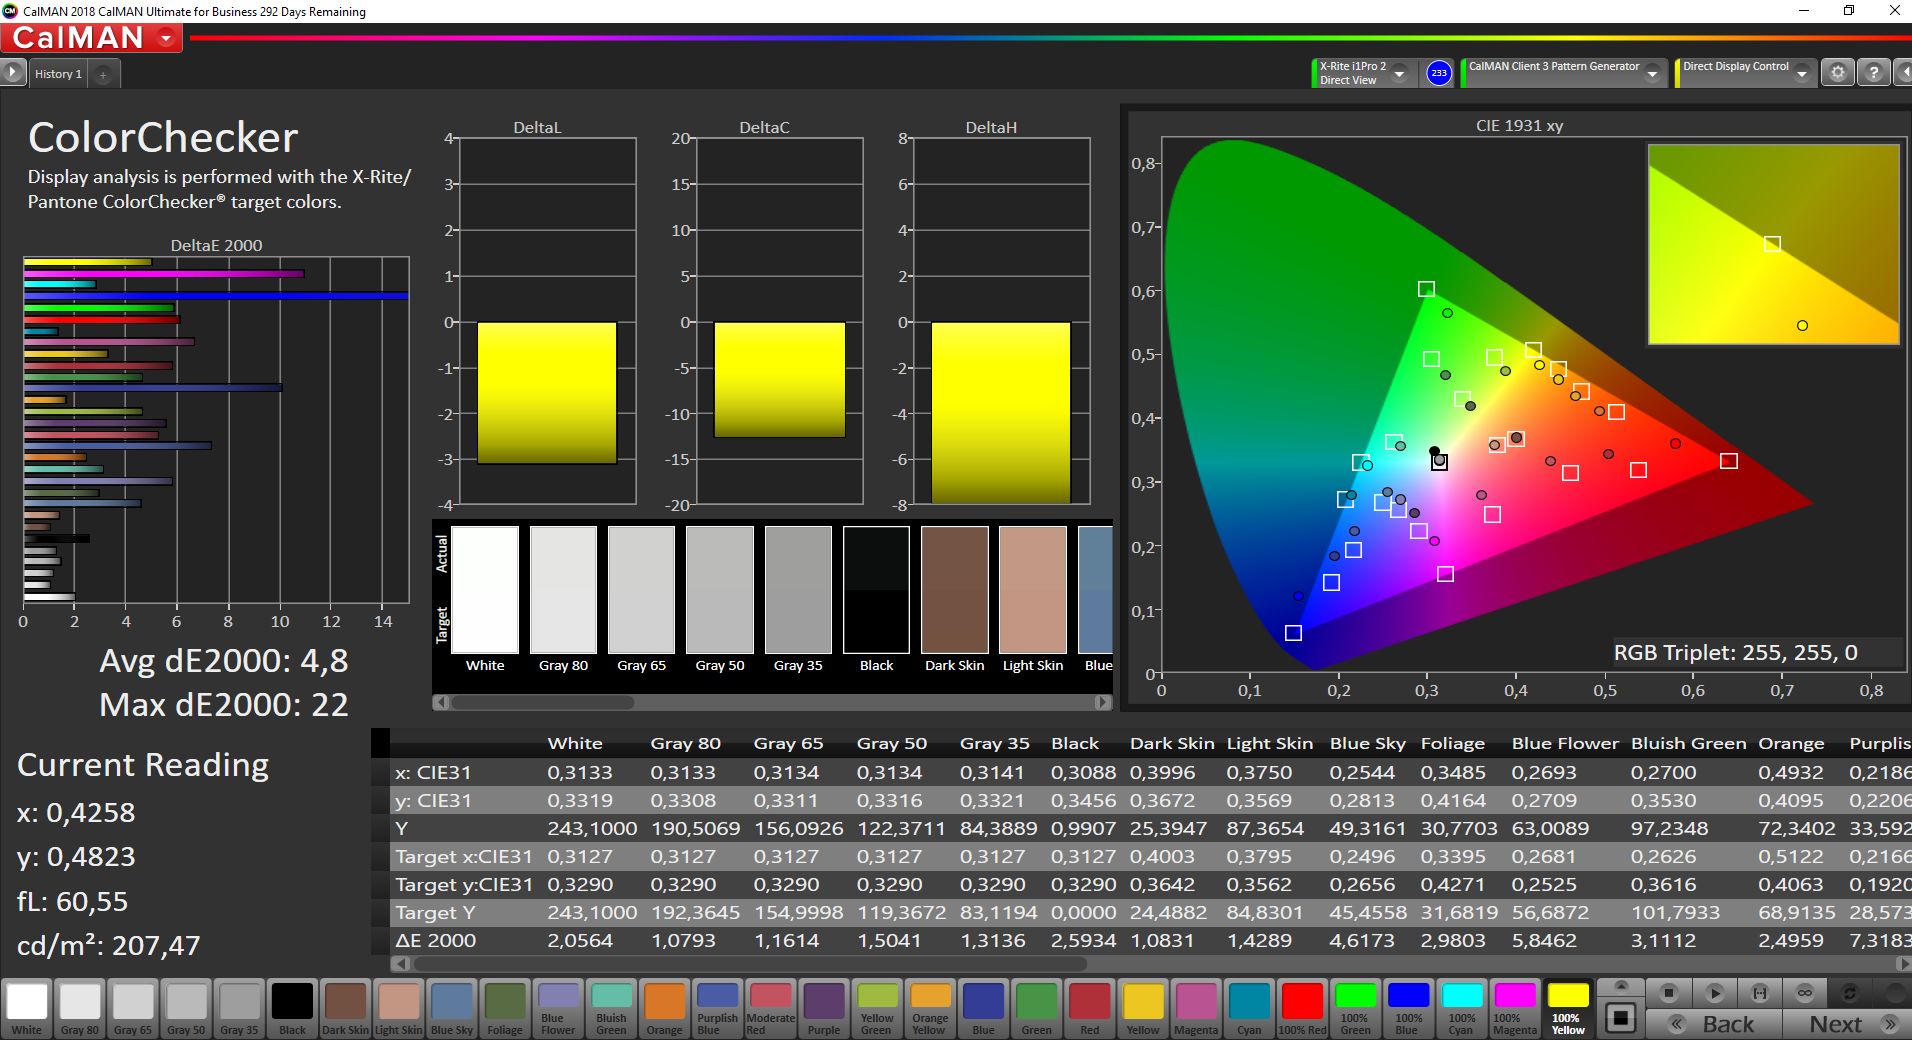
calibrated: 4.8
ΔE Greyscale Calman: 5.7 | ∀{0.09-98 Ø5}
63.7% sRGB (Argyll 1.6.3 3D)
40.9% AdobeRGB 1998 (Argyll 1.6.3 3D)
44.43% AdobeRGB 1998 (Argyll 3D)
64% sRGB (Argyll 3D)
42.93% Display P3 (Argyll 3D)
Gamma: 1.9
CCT: 6282 K
| Lenovo ThinkBook 14-IML-20RV006TGE Chi Mei, CMN14D4, N140HCA-EAC, IPS, 1920x1080, 14" | HP 14-dk0008ng AU Optronics AUO403D, IPS, 1920x1080, 14" | Dell Latitude 3400 BOE NV14N4H, IPS, 1920x1080, 14" | Lenovo ThinkPad E485-20KU000NGE B140HAN04.2, IPS, 1920x1080, 14" | Lenovo ThinkPad E490-20N8000RGE Lenovo NV140FHM-N49, IPS, 1920x1080, 14" | |
|---|---|---|---|---|---|
| Display | -8% | -6% | -10% | -7% | |
| Display P3 Coverage (%) | 42.93 | 39.53 -8% | 40.68 -5% | 39.21 -9% 38.48 -10% | 39.85 -7% |
| sRGB Coverage (%) | 64 | 59.1 -8% | 59.3 -7% | 58.8 -8% 57.9 -10% | 58.6 -8% |
| AdobeRGB 1998 Coverage (%) | 44.43 | 40.84 -8% | 42.03 -5% | 40.52 -9% 39.76 -11% | 41.18 -7% |
| Response Times | 6% | -29% | -15% | -28% | |
| Response Time Grey 50% / Grey 80% * (ms) | 40.8 ? | 38 ? 7% | 44 ? -8% | 44.8 ? -10% | 48.4 ? -19% |
| Response Time Black / White * (ms) | 28 ? | 27 ? 4% | 42 ? -50% | 33.6 ? -20% | 38.4 ? -37% |
| PWM Frequency (Hz) | 25000 ? | 1000 ? | 1250 ? | ||
| Screen | 61% | 28% | 58% | 54% | |
| Brightness middle (cd/m²) | 256 | 269 5% | 240 -6% | 289 13% | 305 19% |
| Brightness (cd/m²) | 232 | 257 11% | 227 -2% | 271 17% | 295 27% |
| Brightness Distribution (%) | 86 | 89 3% | 79 -8% | 87 1% | 90 5% |
| Black Level * (cd/m²) | 0.96 | 0.2 79% | 0.48 50% | 0.19 80% | 0.23 76% |
| Contrast (:1) | 267 | 1345 404% | 500 87% | 1521 470% | 1326 397% |
| Colorchecker dE 2000 * | 6.5 | 3.68 43% | 4.2 35% | 5.6 14% | 5.3 18% |
| Colorchecker dE 2000 max. * | 21.5 | 7.36 66% | 7.16 67% | 20.8 3% | 18.9 12% |
| Colorchecker dE 2000 calibrated * | 4.8 | 4.8 -0% | 4.7 2% | 5 -4% | |
| Greyscale dE 2000 * | 5.7 | 1.69 70% | 1.75 69% | 2.7 53% | 2.3 60% |
| Gamma | 1.9 116% | 2.49 88% | 2.36 93% | 1.96 112% | 2.09 105% |
| CCT | 6282 103% | 6406 101% | 6387 102% | 6506 100% | 6246 104% |
| Color Space (Percent of AdobeRGB 1998) (%) | 40.9 | 38 -7% | 38 -7% | 37.2 -9% | 37.7 -8% |
| Color Space (Percent of sRGB) (%) | 63.7 | 59 -7% | 59 -7% | 58.5 -8% | 58.2 -9% |
| Total Average (Program / Settings) | 20% /
41% | -2% /
14% | 11% /
29% | 6% /
32% |
* ... smaller is better
Display Response Times
| ↔ Response Time Black to White | ||
|---|---|---|
| 28 ms ... rise ↗ and fall ↘ combined | ↗ 15.6 ms rise | 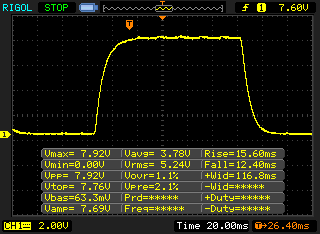 |
| ↘ 12.4 ms fall | ||
| The screen shows relatively slow response rates in our tests and may be too slow for gamers. In comparison, all tested devices range from 0.1 (minimum) to 240 (maximum) ms. » 71 % of all devices are better. This means that the measured response time is worse than the average of all tested devices (20.1 ms). | ||
| ↔ Response Time 50% Grey to 80% Grey | ||
| 40.8 ms ... rise ↗ and fall ↘ combined | ↗ 21.2 ms rise | 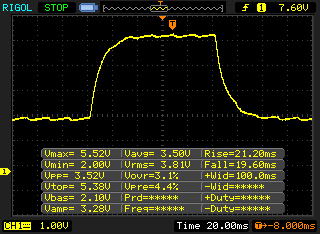 |
| ↘ 19.6 ms fall | ||
| The screen shows slow response rates in our tests and will be unsatisfactory for gamers. In comparison, all tested devices range from 0.165 (minimum) to 636 (maximum) ms. » 63 % of all devices are better. This means that the measured response time is worse than the average of all tested devices (31.4 ms). | ||
Screen Flickering / PWM (Pulse-Width Modulation)
| Screen flickering / PWM detected | 25000 Hz | ≤ 60 % brightness setting | 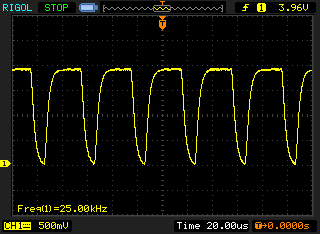 |
The display backlight flickers at 25000 Hz (worst case, e.g., utilizing PWM) Flickering detected at a brightness setting of 60 % and below. There should be no flickering or PWM above this brightness setting. The frequency of 25000 Hz is quite high, so most users sensitive to PWM should not notice any flickering. In comparison: 53 % of all tested devices do not use PWM to dim the display. If PWM was detected, an average of 7986 (minimum: 5 - maximum: 343500) Hz was measured. | |||
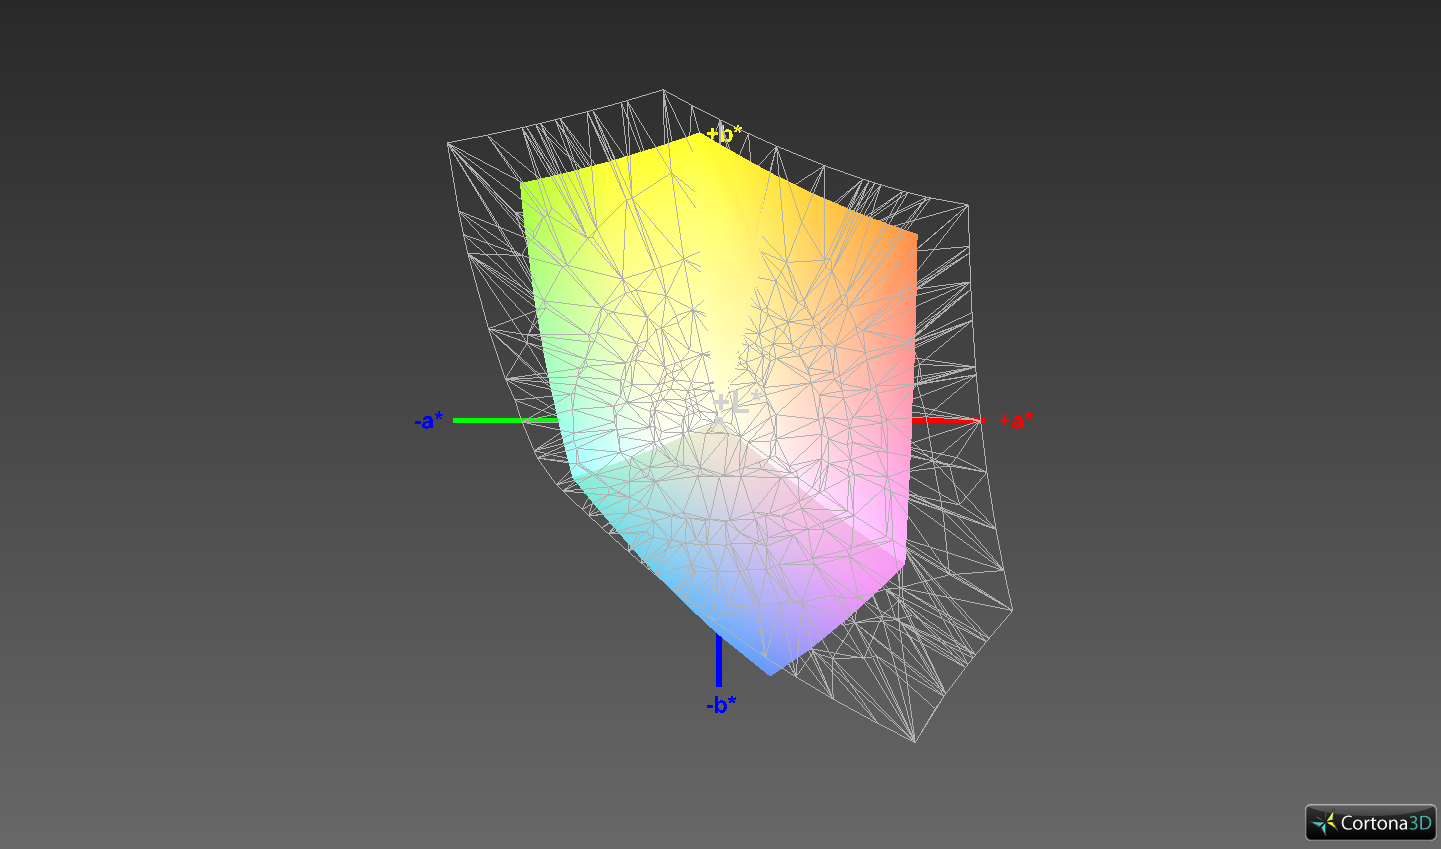
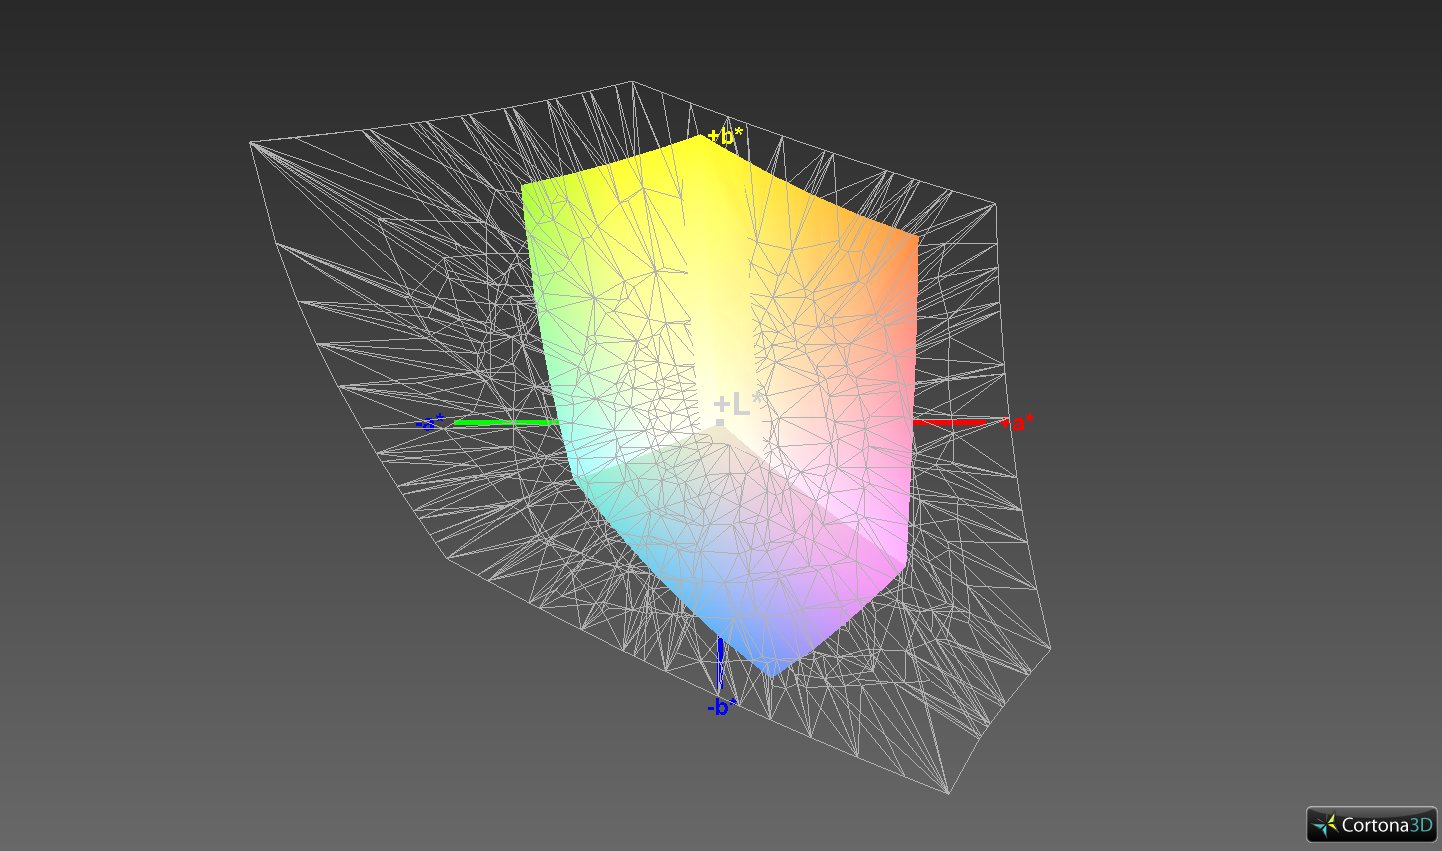
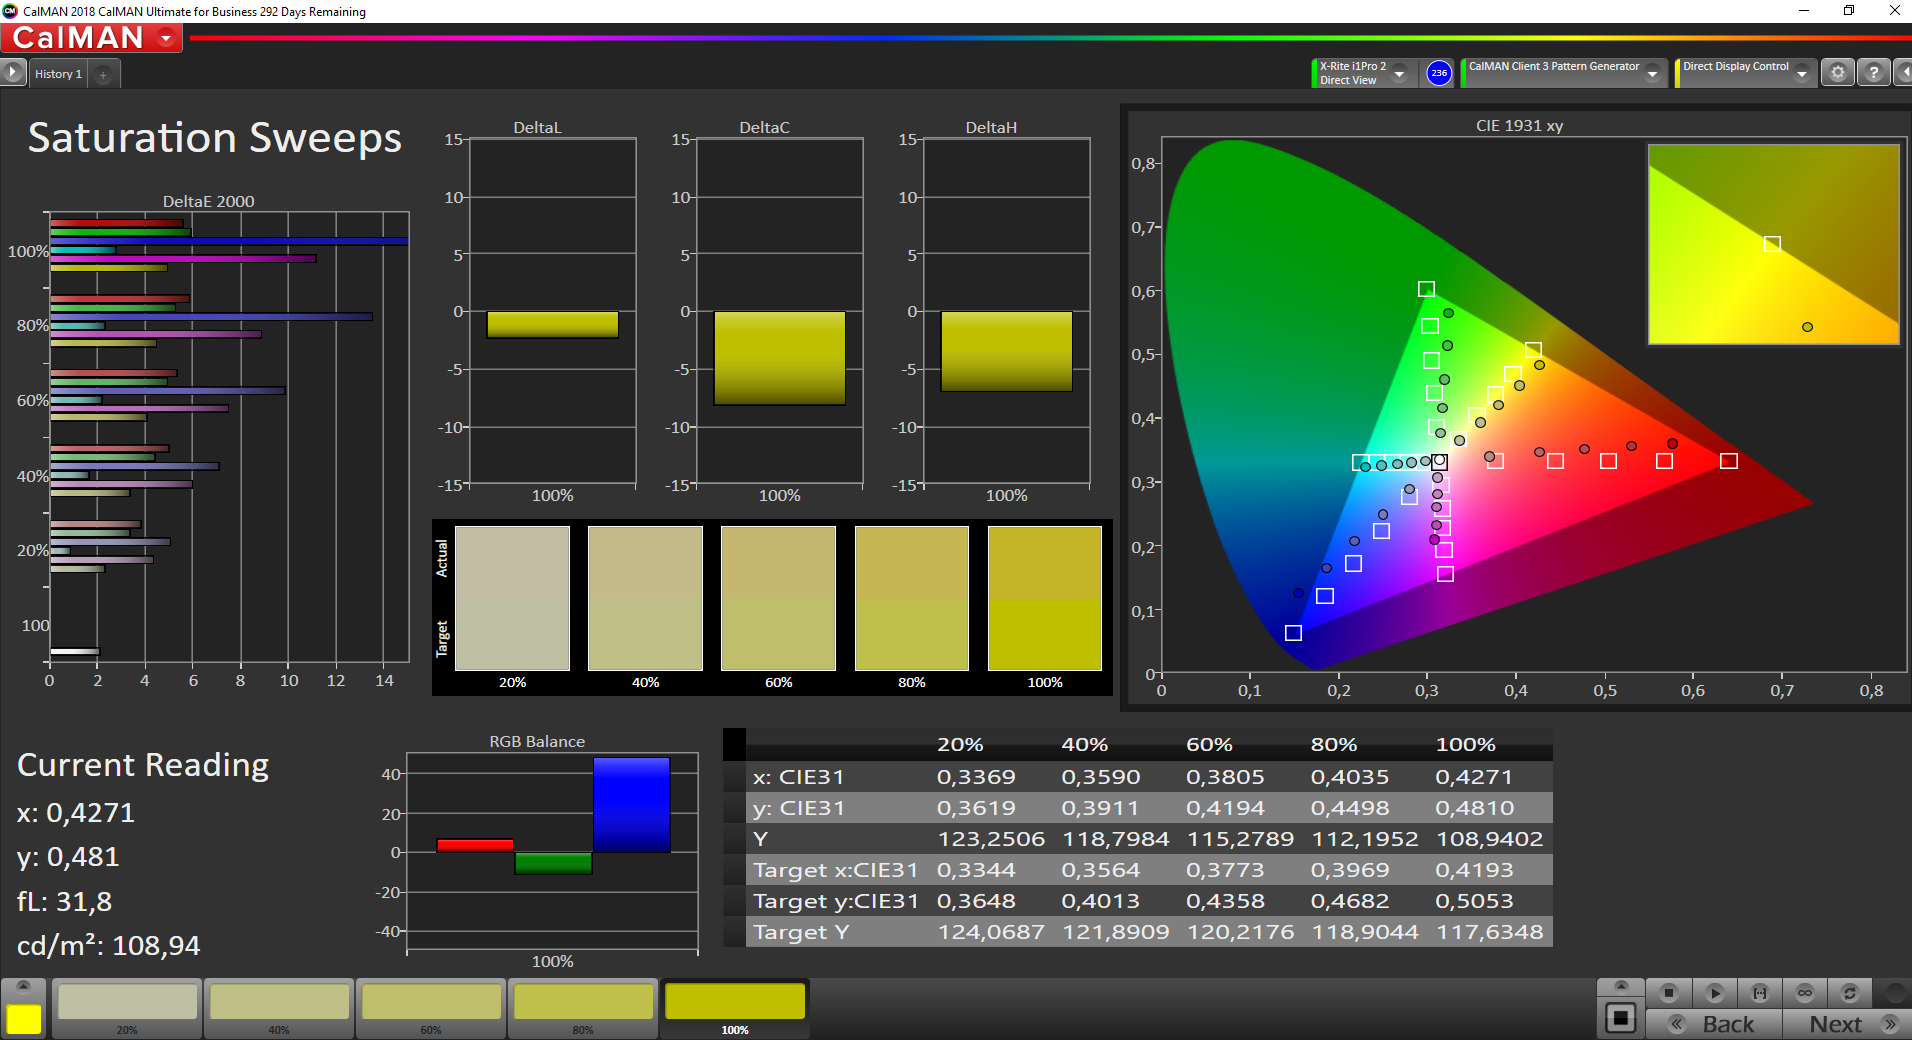
Despite its low contrast ratio, the ThinkBook 14’s display offered a decent image quality in day-to-day situations. We strongly advise you to use our ICC profile in order to lower DeltaE 2000 deviations from their very high out-of-the-box levels as we were particularly successful in improving grayscale accuracy after calibrating the display with an X-Rite i1 Pro 2 spectrophotometer and CalMAN. Colors were only improved slightly, which further shows that the display is at its limits as-is already. Color-space coverage is another sore point, although we should note that at 63.7% sRGB and 40.9% AdobeRGB our review unit did manage to outclass its competitors.
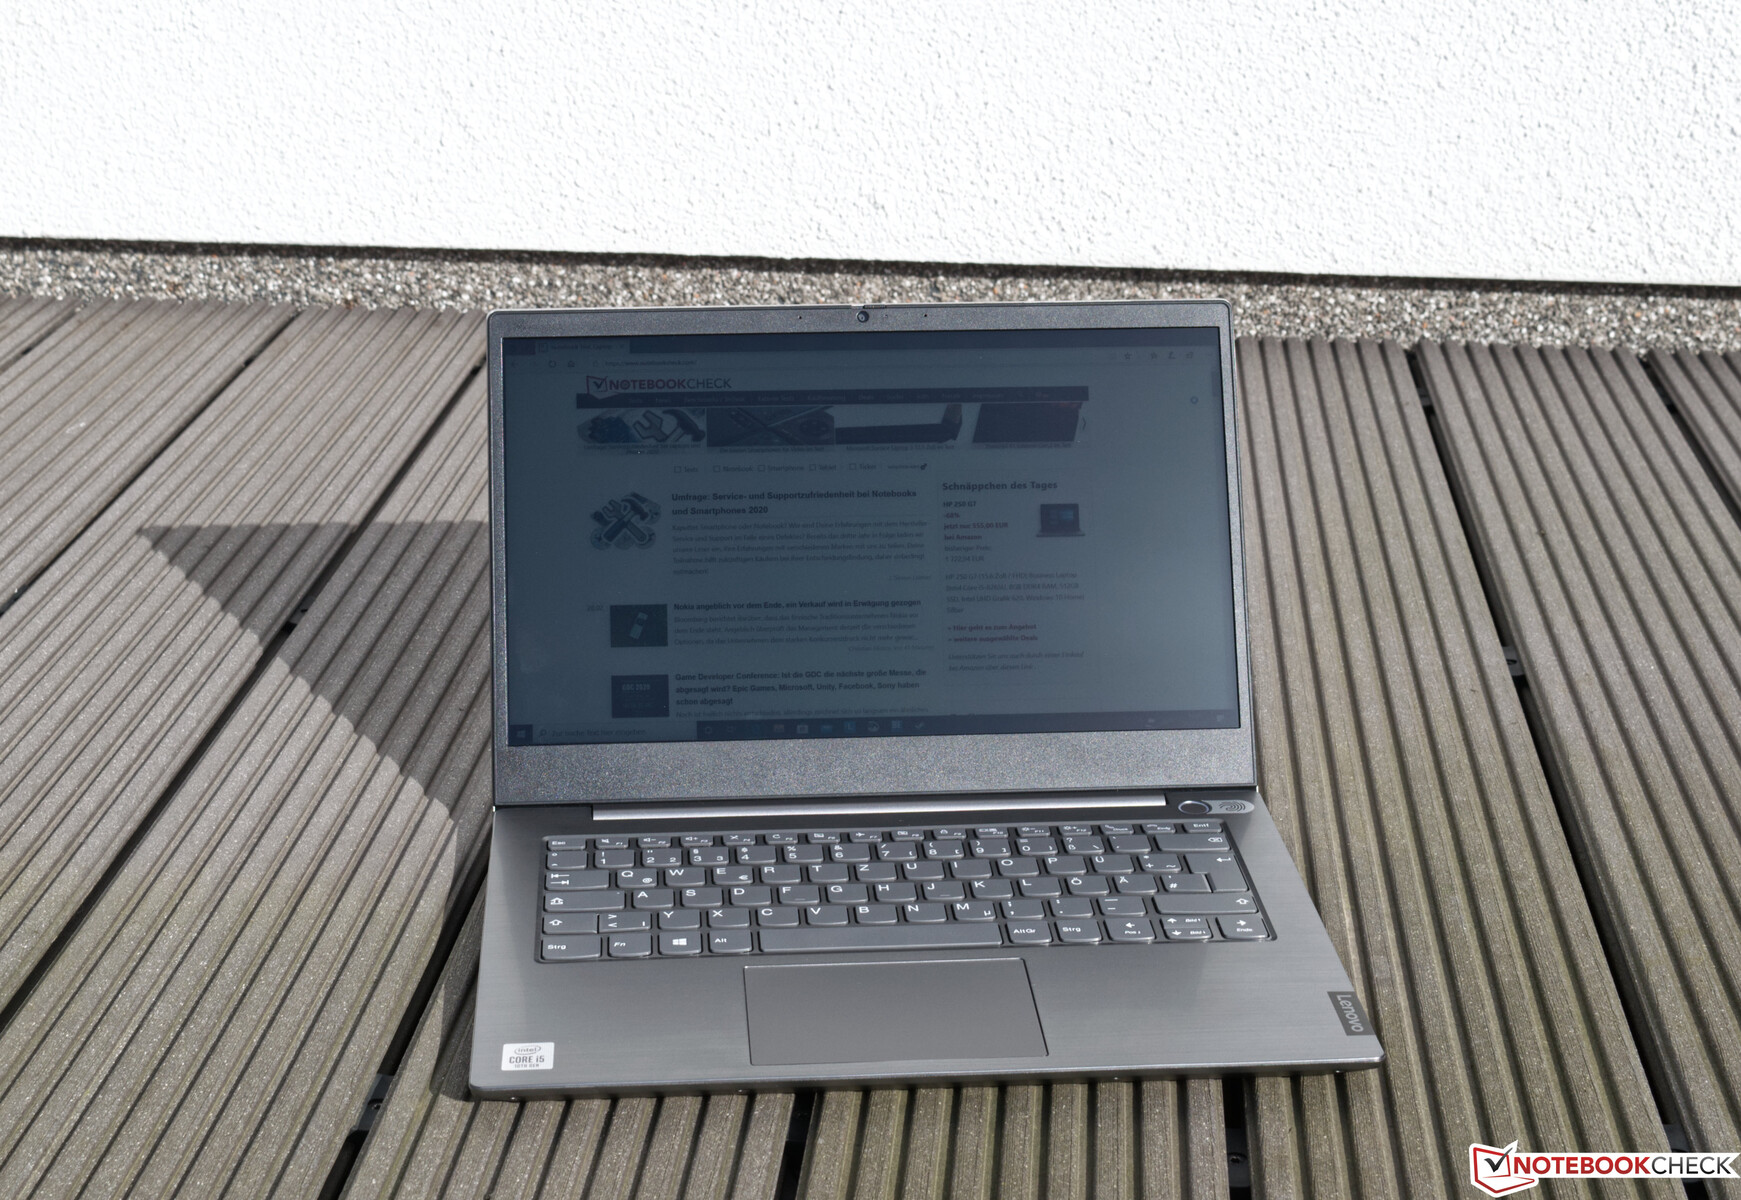
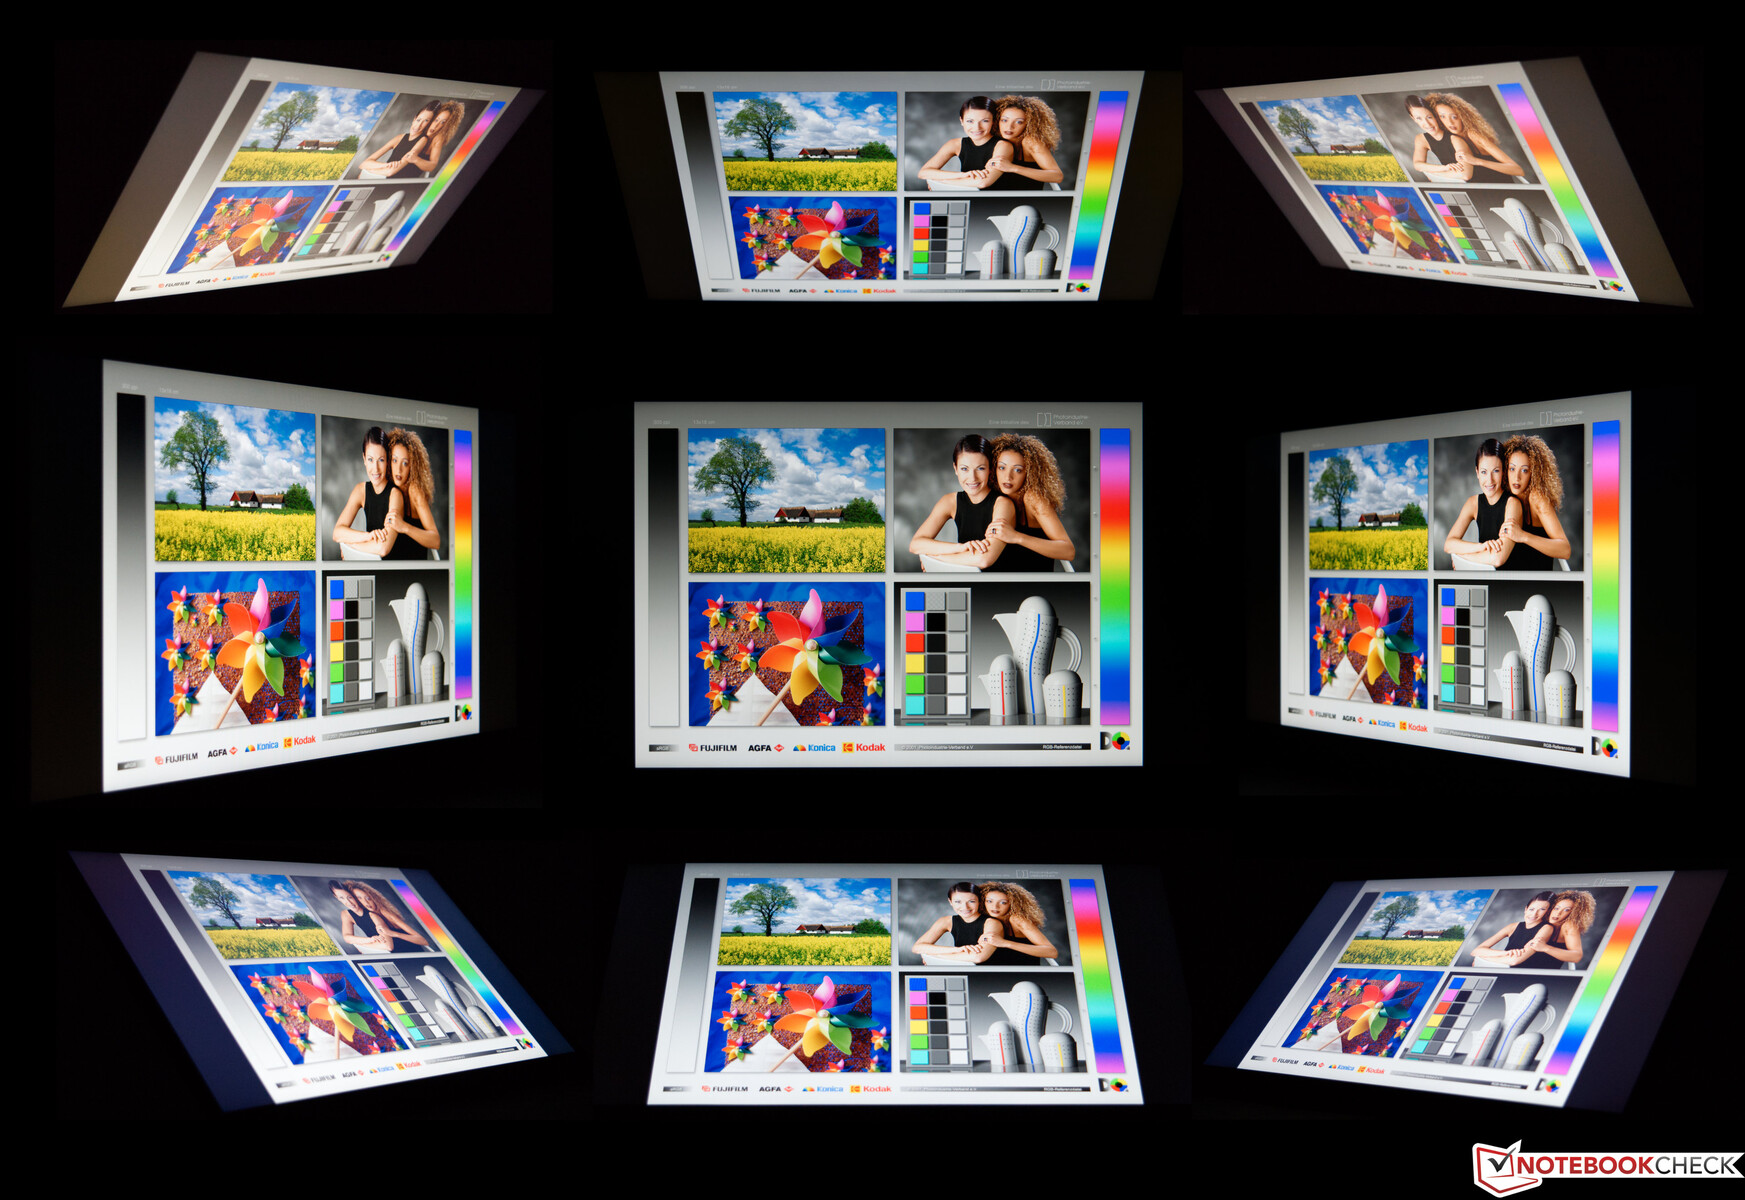
Outdoor usability is limited at best due to its poor display brightness, which is too low to overpower sunlight. We did not encounter any issues in shady spots, though. Viewing angles were also not as wide as expected. When looked at from all four corners we noticed some minor color tint.

Performance – Fast Enough for Most Users
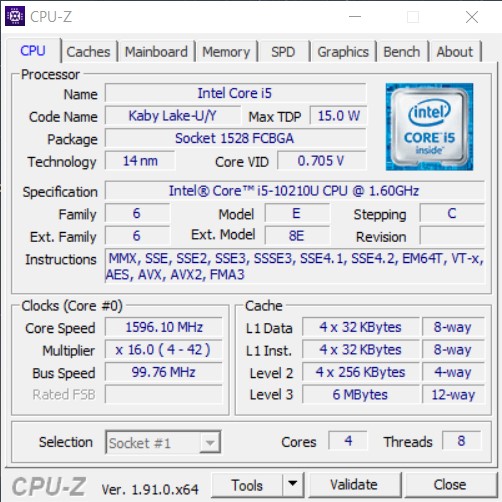
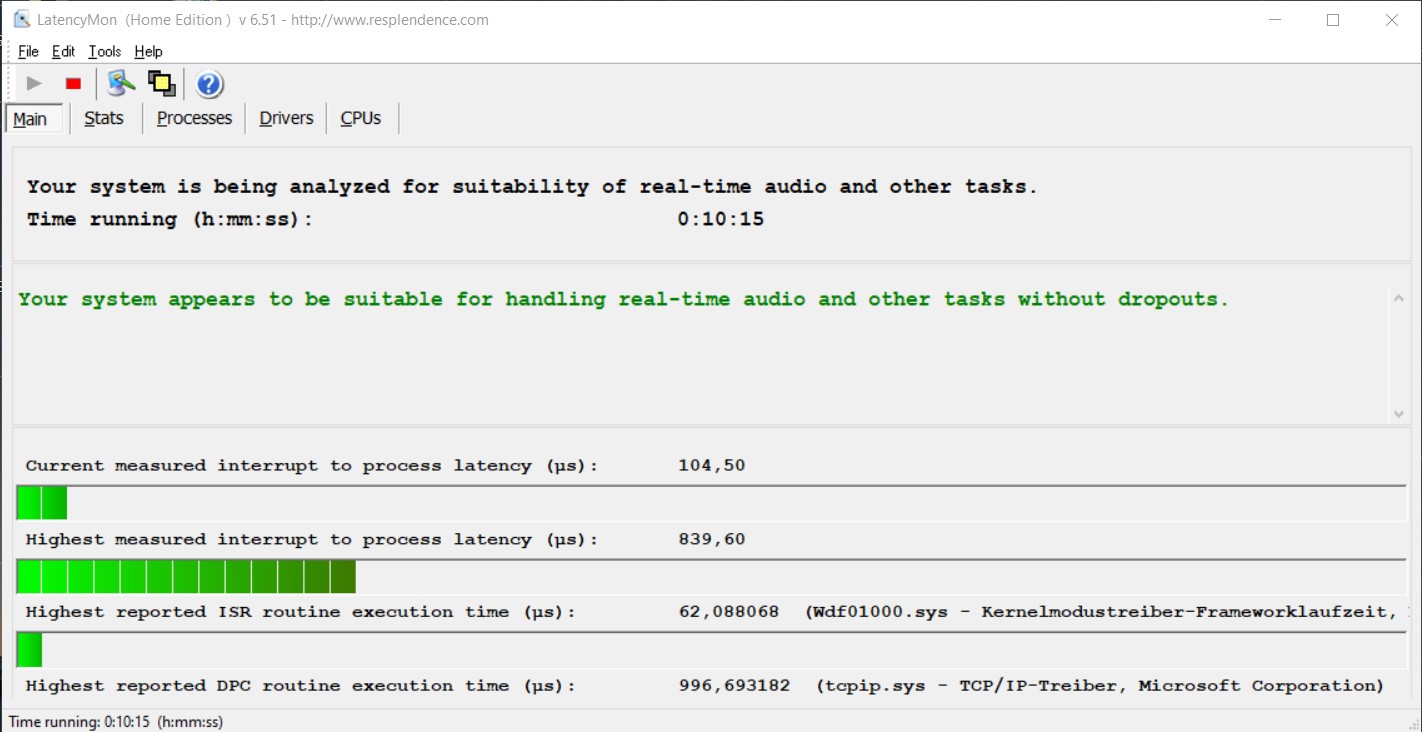
The Lenovo ThinkBook 14 was more than fast enough for everyday office life, and the combination of a modern Comet Lake CPU and the rest of its hardware worked great. We did not encounter any DPC latency issues. Intel’s Core i5-10210U should be fast enough for most users.
Processor
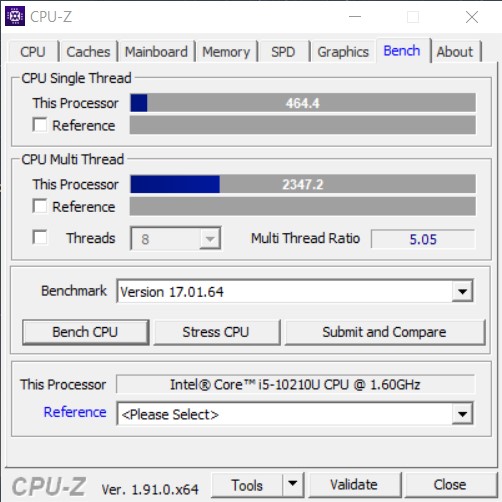
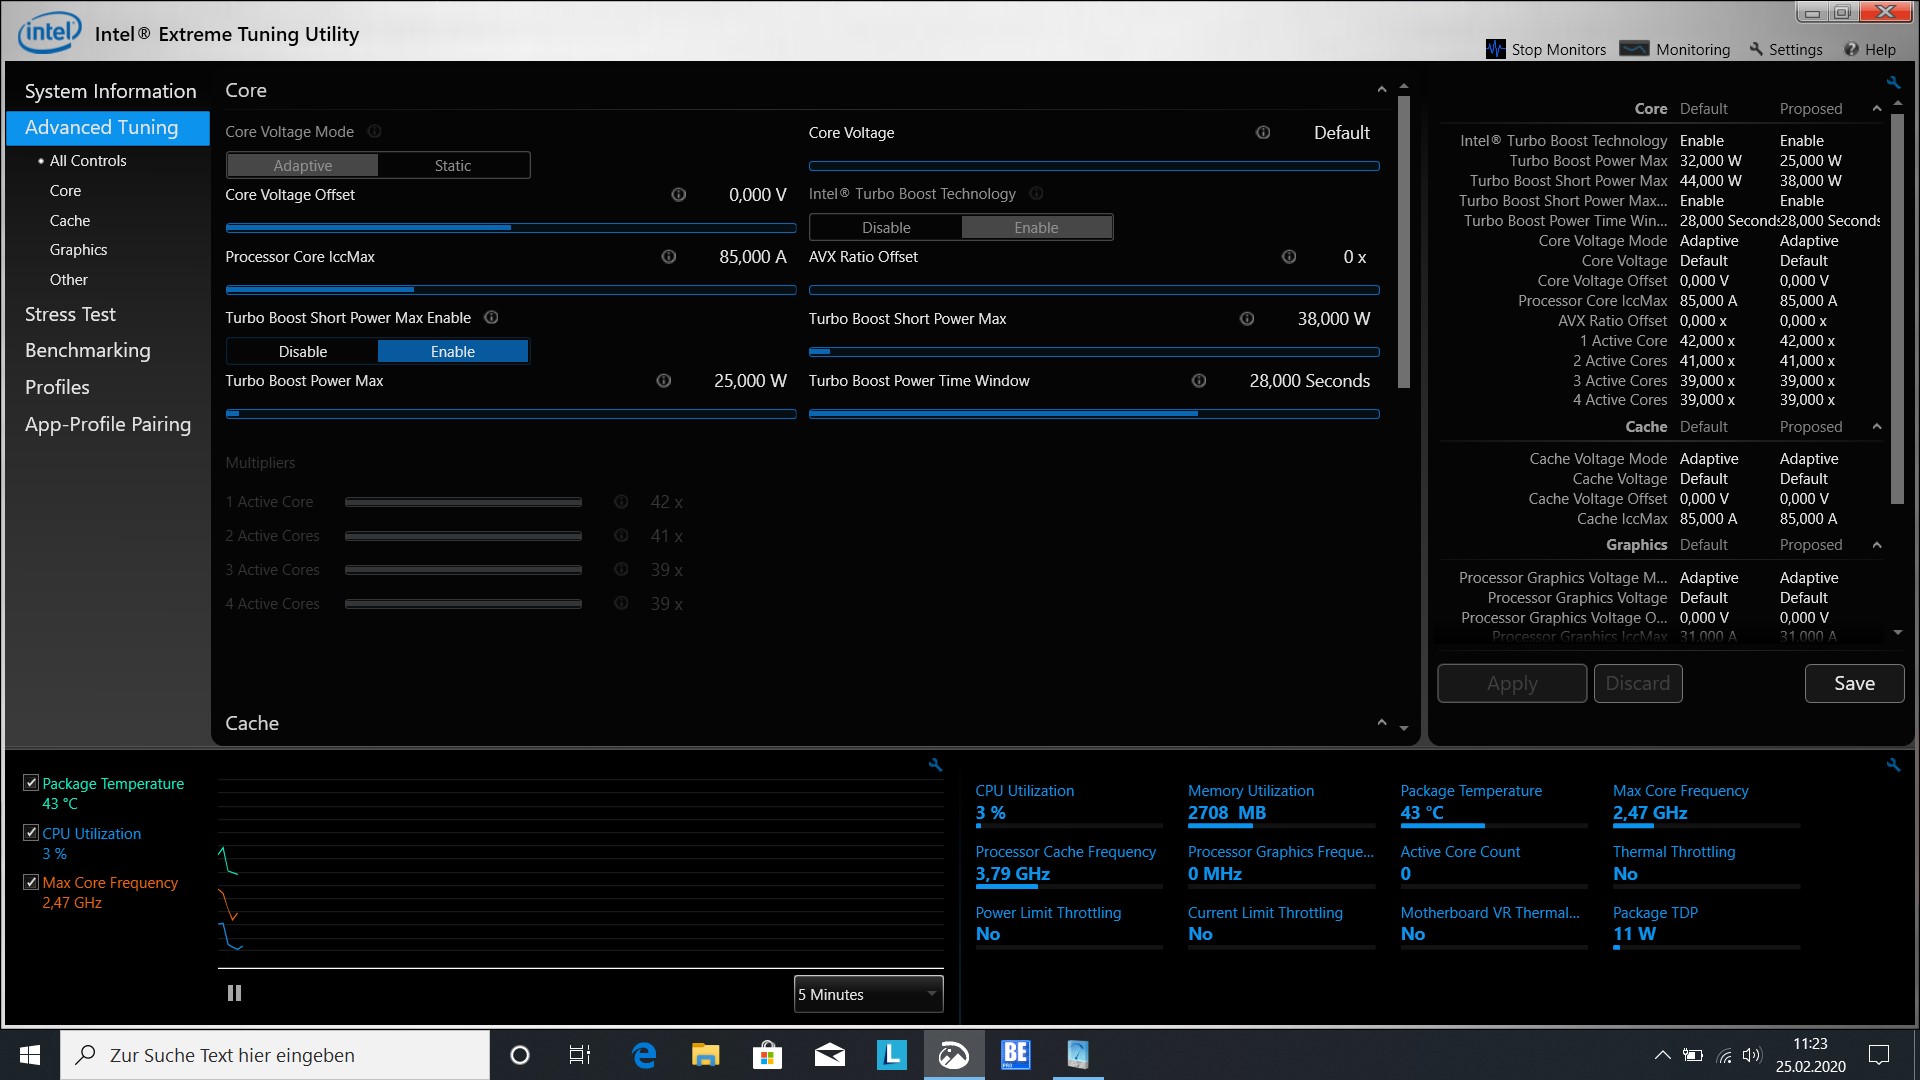
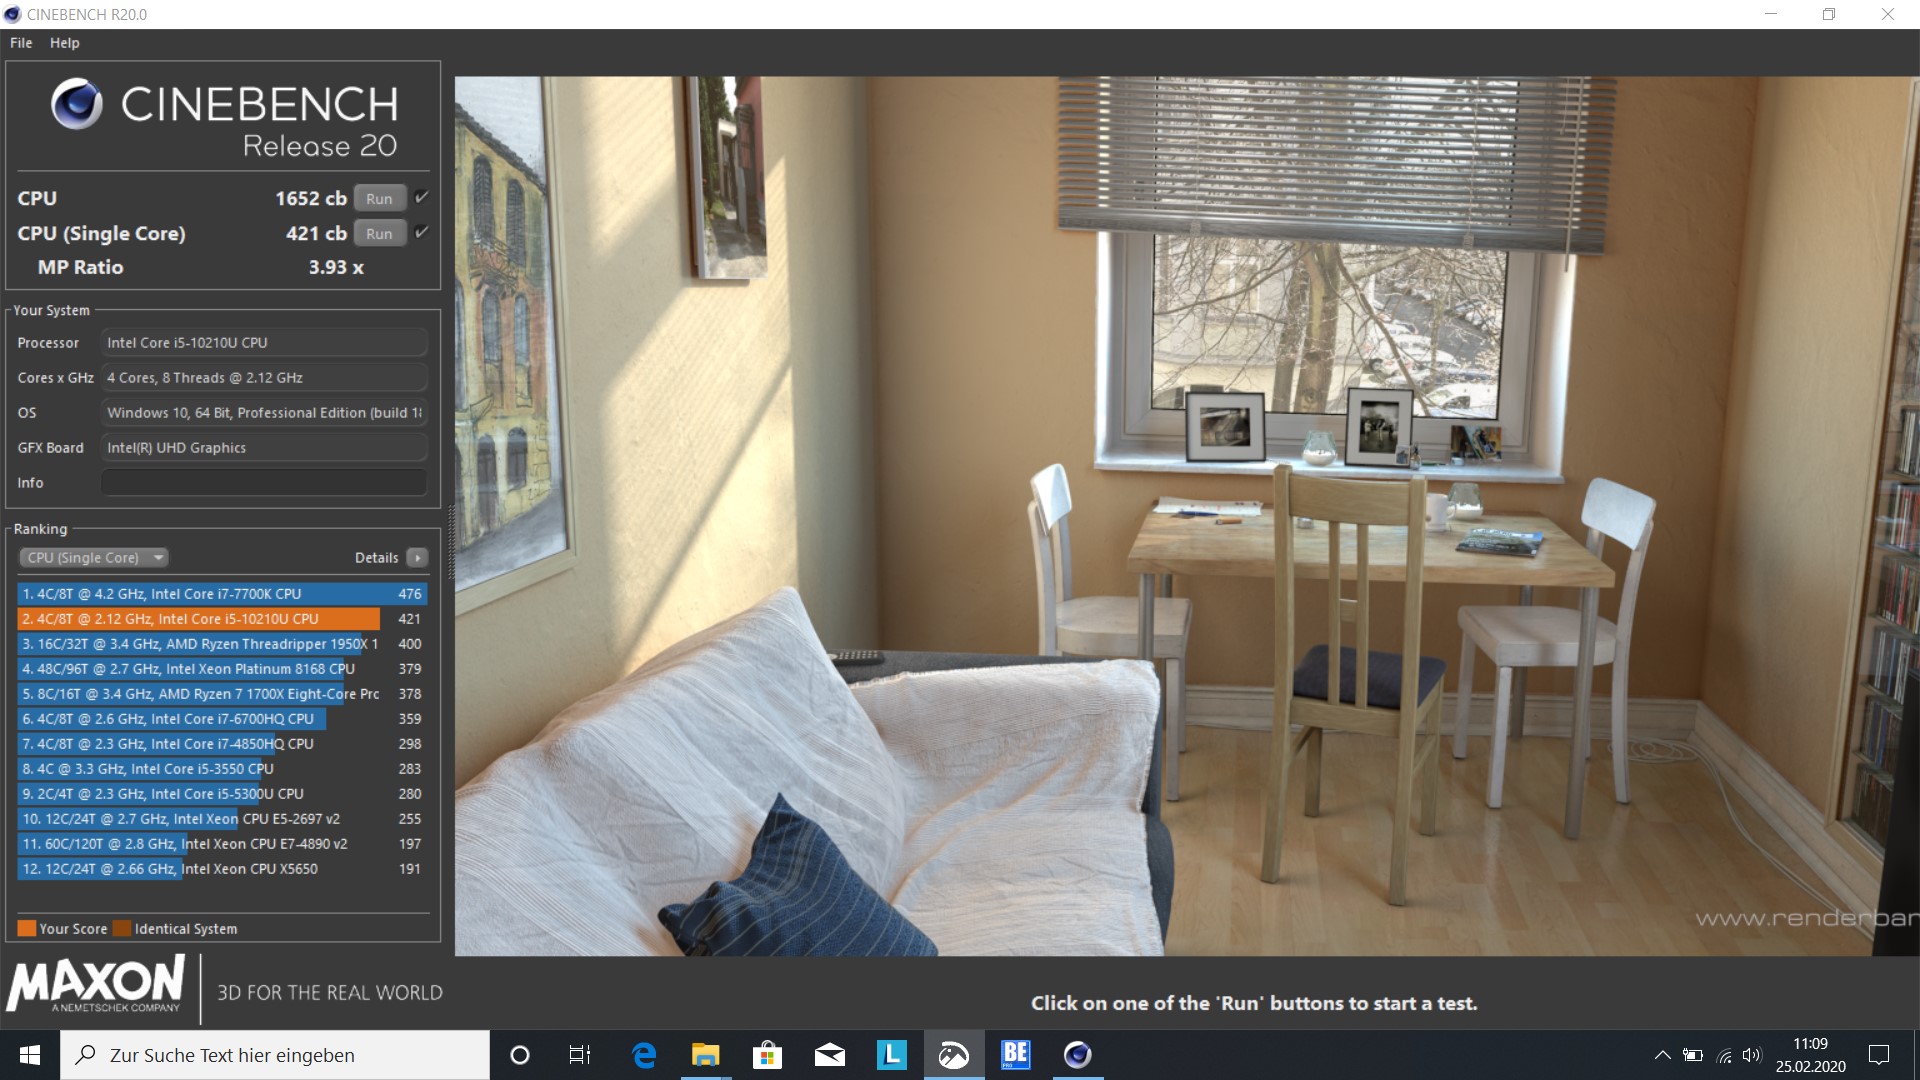
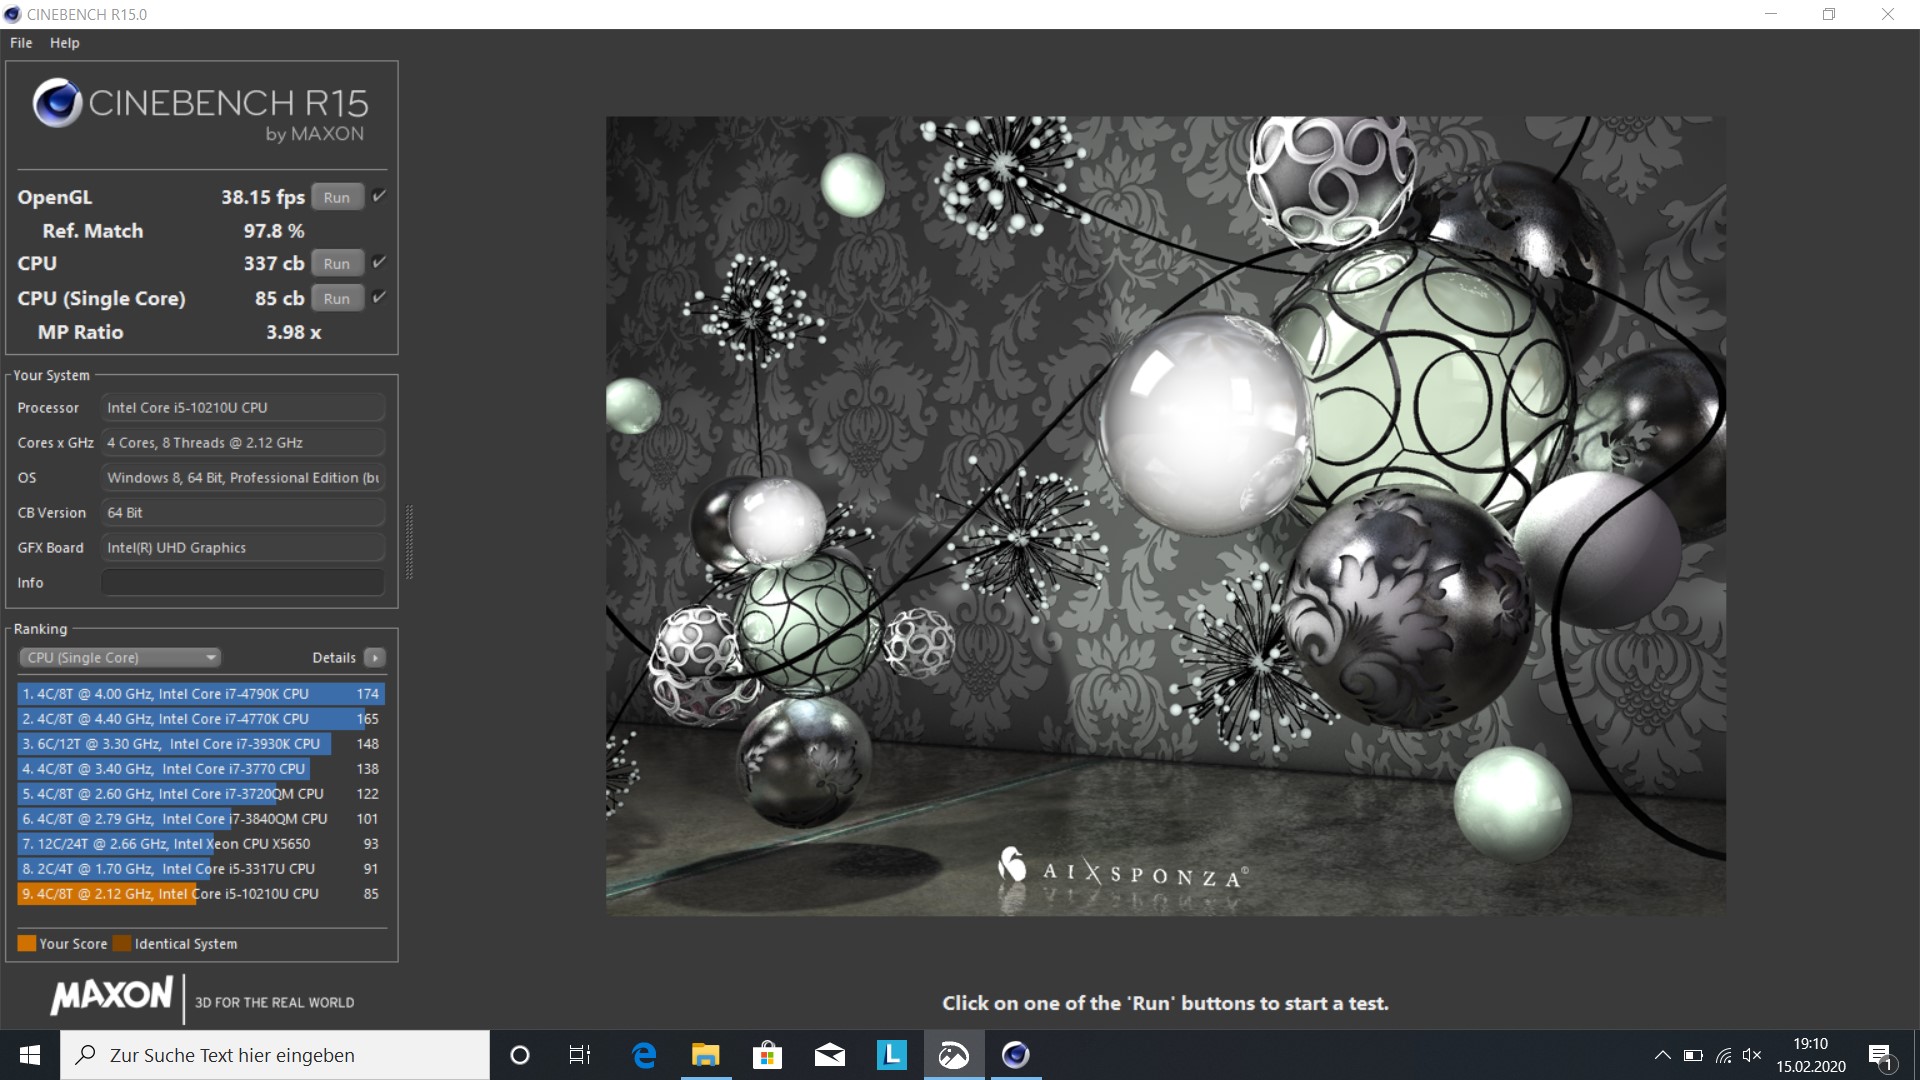
The Core i5-10210U's TDP is configured at 15 W, but the CPU is allowed to consume up to 38 W for short bursts of load. The ThinkBook 14 outclassed its entire competition and consequently placed first in our benchmark. It was also slightly faster than the average for this particular CPU.
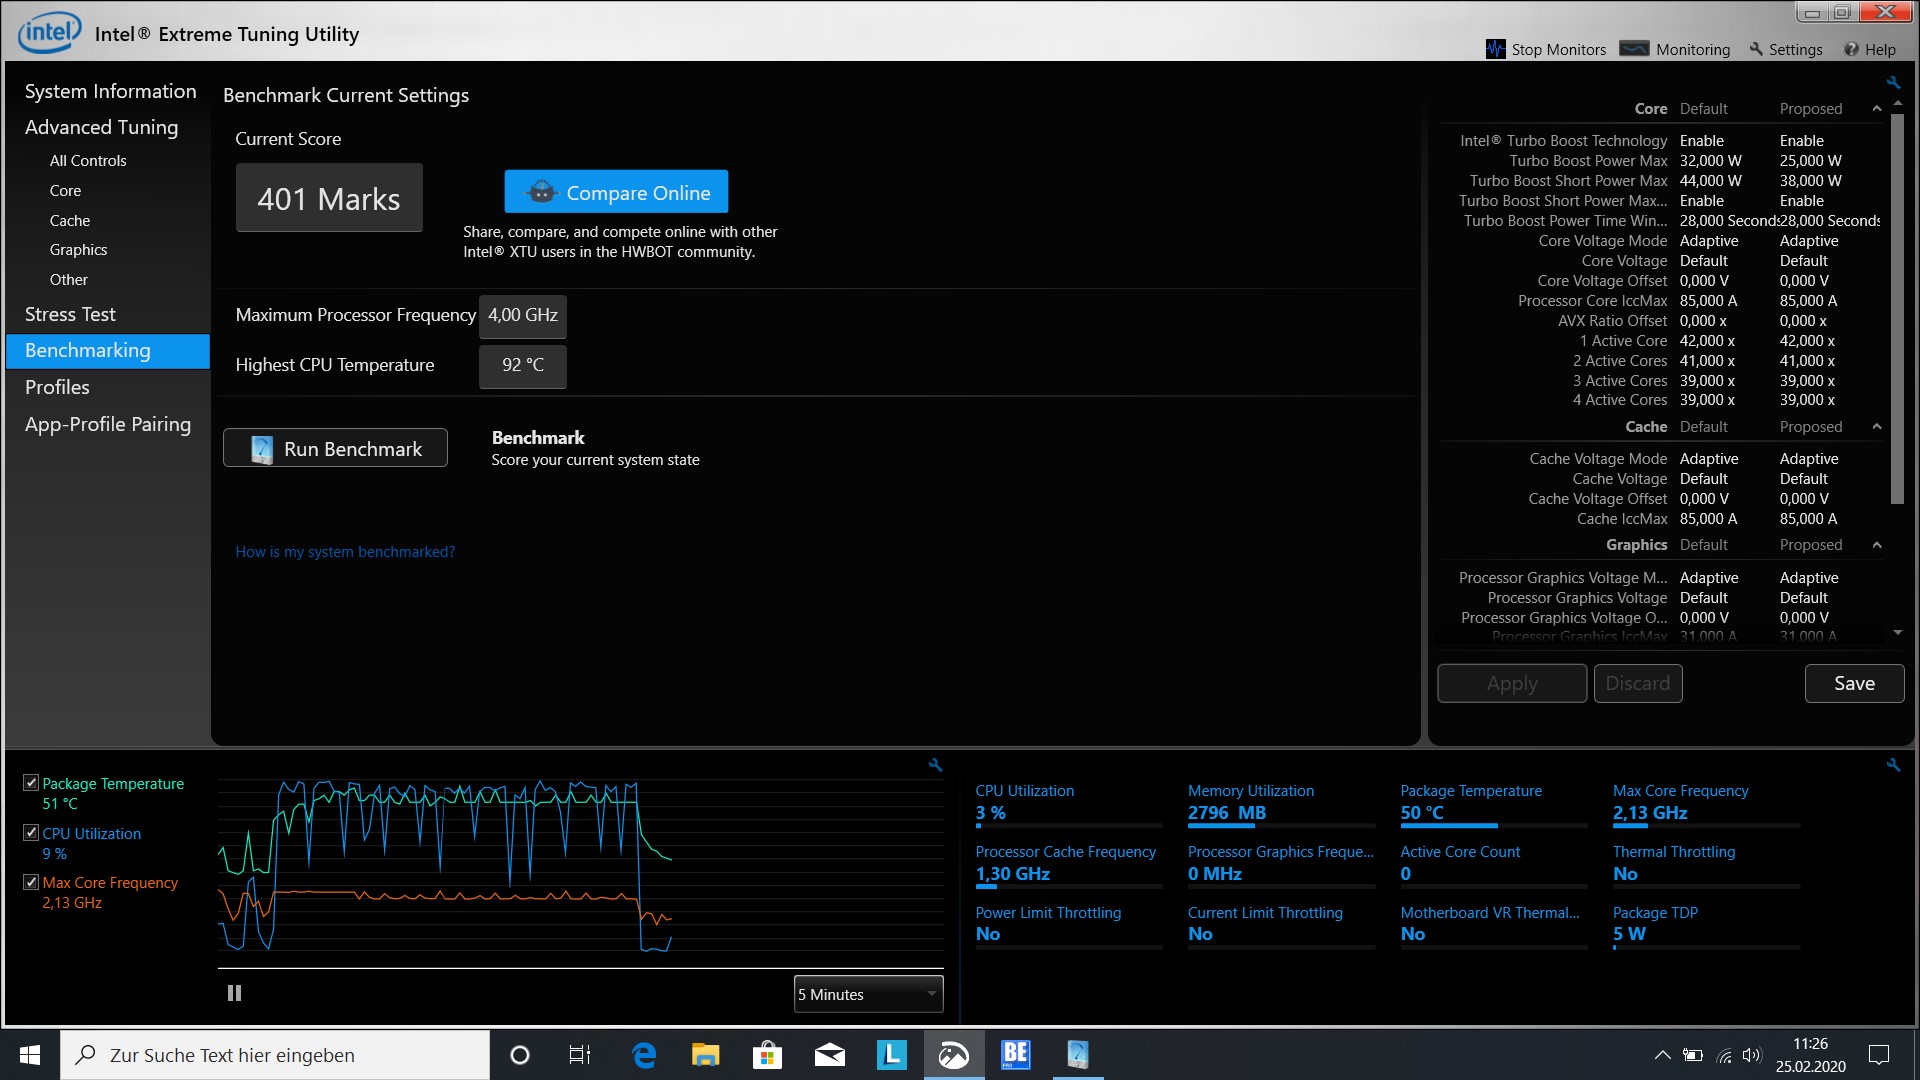
The Core i5-10210U’s overall performance was good. When running our Cinebench R15 multithread loop the ThinkBook 14’s performance dropped slightly after the first run but remained consistent afterwards for a while until it dropped even further, this time more notably.
More details and benchmarks can be found on our CPU comparison page.
| Blender - v2.79 BMW27 CPU | |
| Average Intel Core i5-10210U (585 - 1339, n=24) | |
| Lenovo ThinkPad E485-20KU000NGE | |
| Lenovo ThinkBook 14-IML-20RV006TGE | |
| Average of class Office (158 - 1956, n=82, last 2 years) | |
| HWBOT x265 Benchmark v2.2 - 4k Preset | |
| Average of class Office (1.72 - 26, n=80, last 2 years) | |
| Lenovo ThinkBook 14-IML-20RV006TGE | |
| Average Intel Core i5-10210U (2.36 - 6.28, n=24) | |
| Lenovo ThinkPad E485-20KU000NGE | |
| HP 14-dk0008ng | |
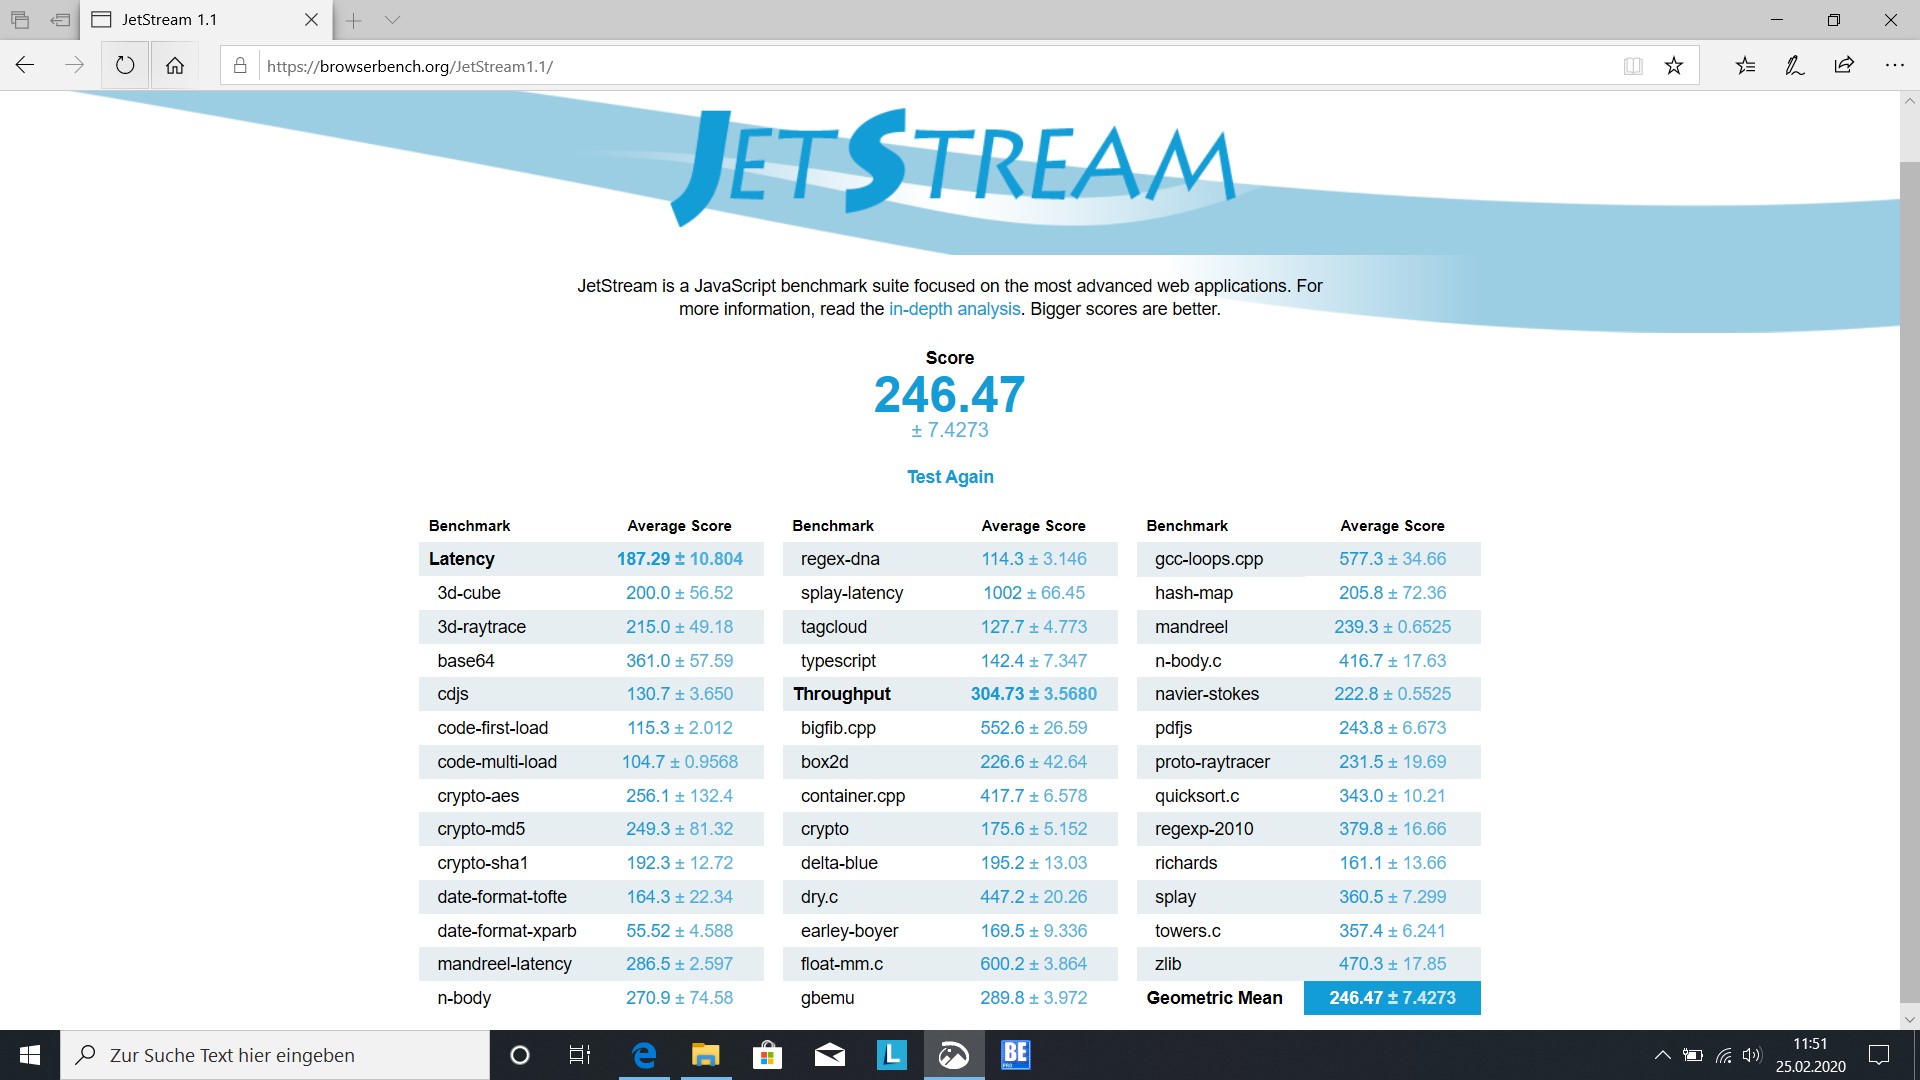
| JetStream 1.1 - Total Score | |
| Lenovo ThinkBook 14-IML-20RV006TGE | |
| Average Intel Core i5-10210U (191.3 - 252, n=14) | |
| Lenovo ThinkPad E490-20N8000RGE | |
| Dell Latitude 3400 | |
| HP 14-dk0008ng | |
* ... smaller is better
System Performance
Thanks to the Intel Core i5-10210U's good overall performance the ThinkBook 14 performed very well in our system performance benchmarks. Most of the time our review unit placed first, and it only had to succumb to the Dell Latitude 3400 once. Our subjective impressions further confirmed these benchmark results.
| PCMark 8 Home Score Accelerated v2 | 3722 points | |
| PCMark 8 Creative Score Accelerated v2 | 4960 points | |
| PCMark 8 Work Score Accelerated v2 | 4922 points | |
| PCMark 10 Score | 3757 points | |
Help | ||
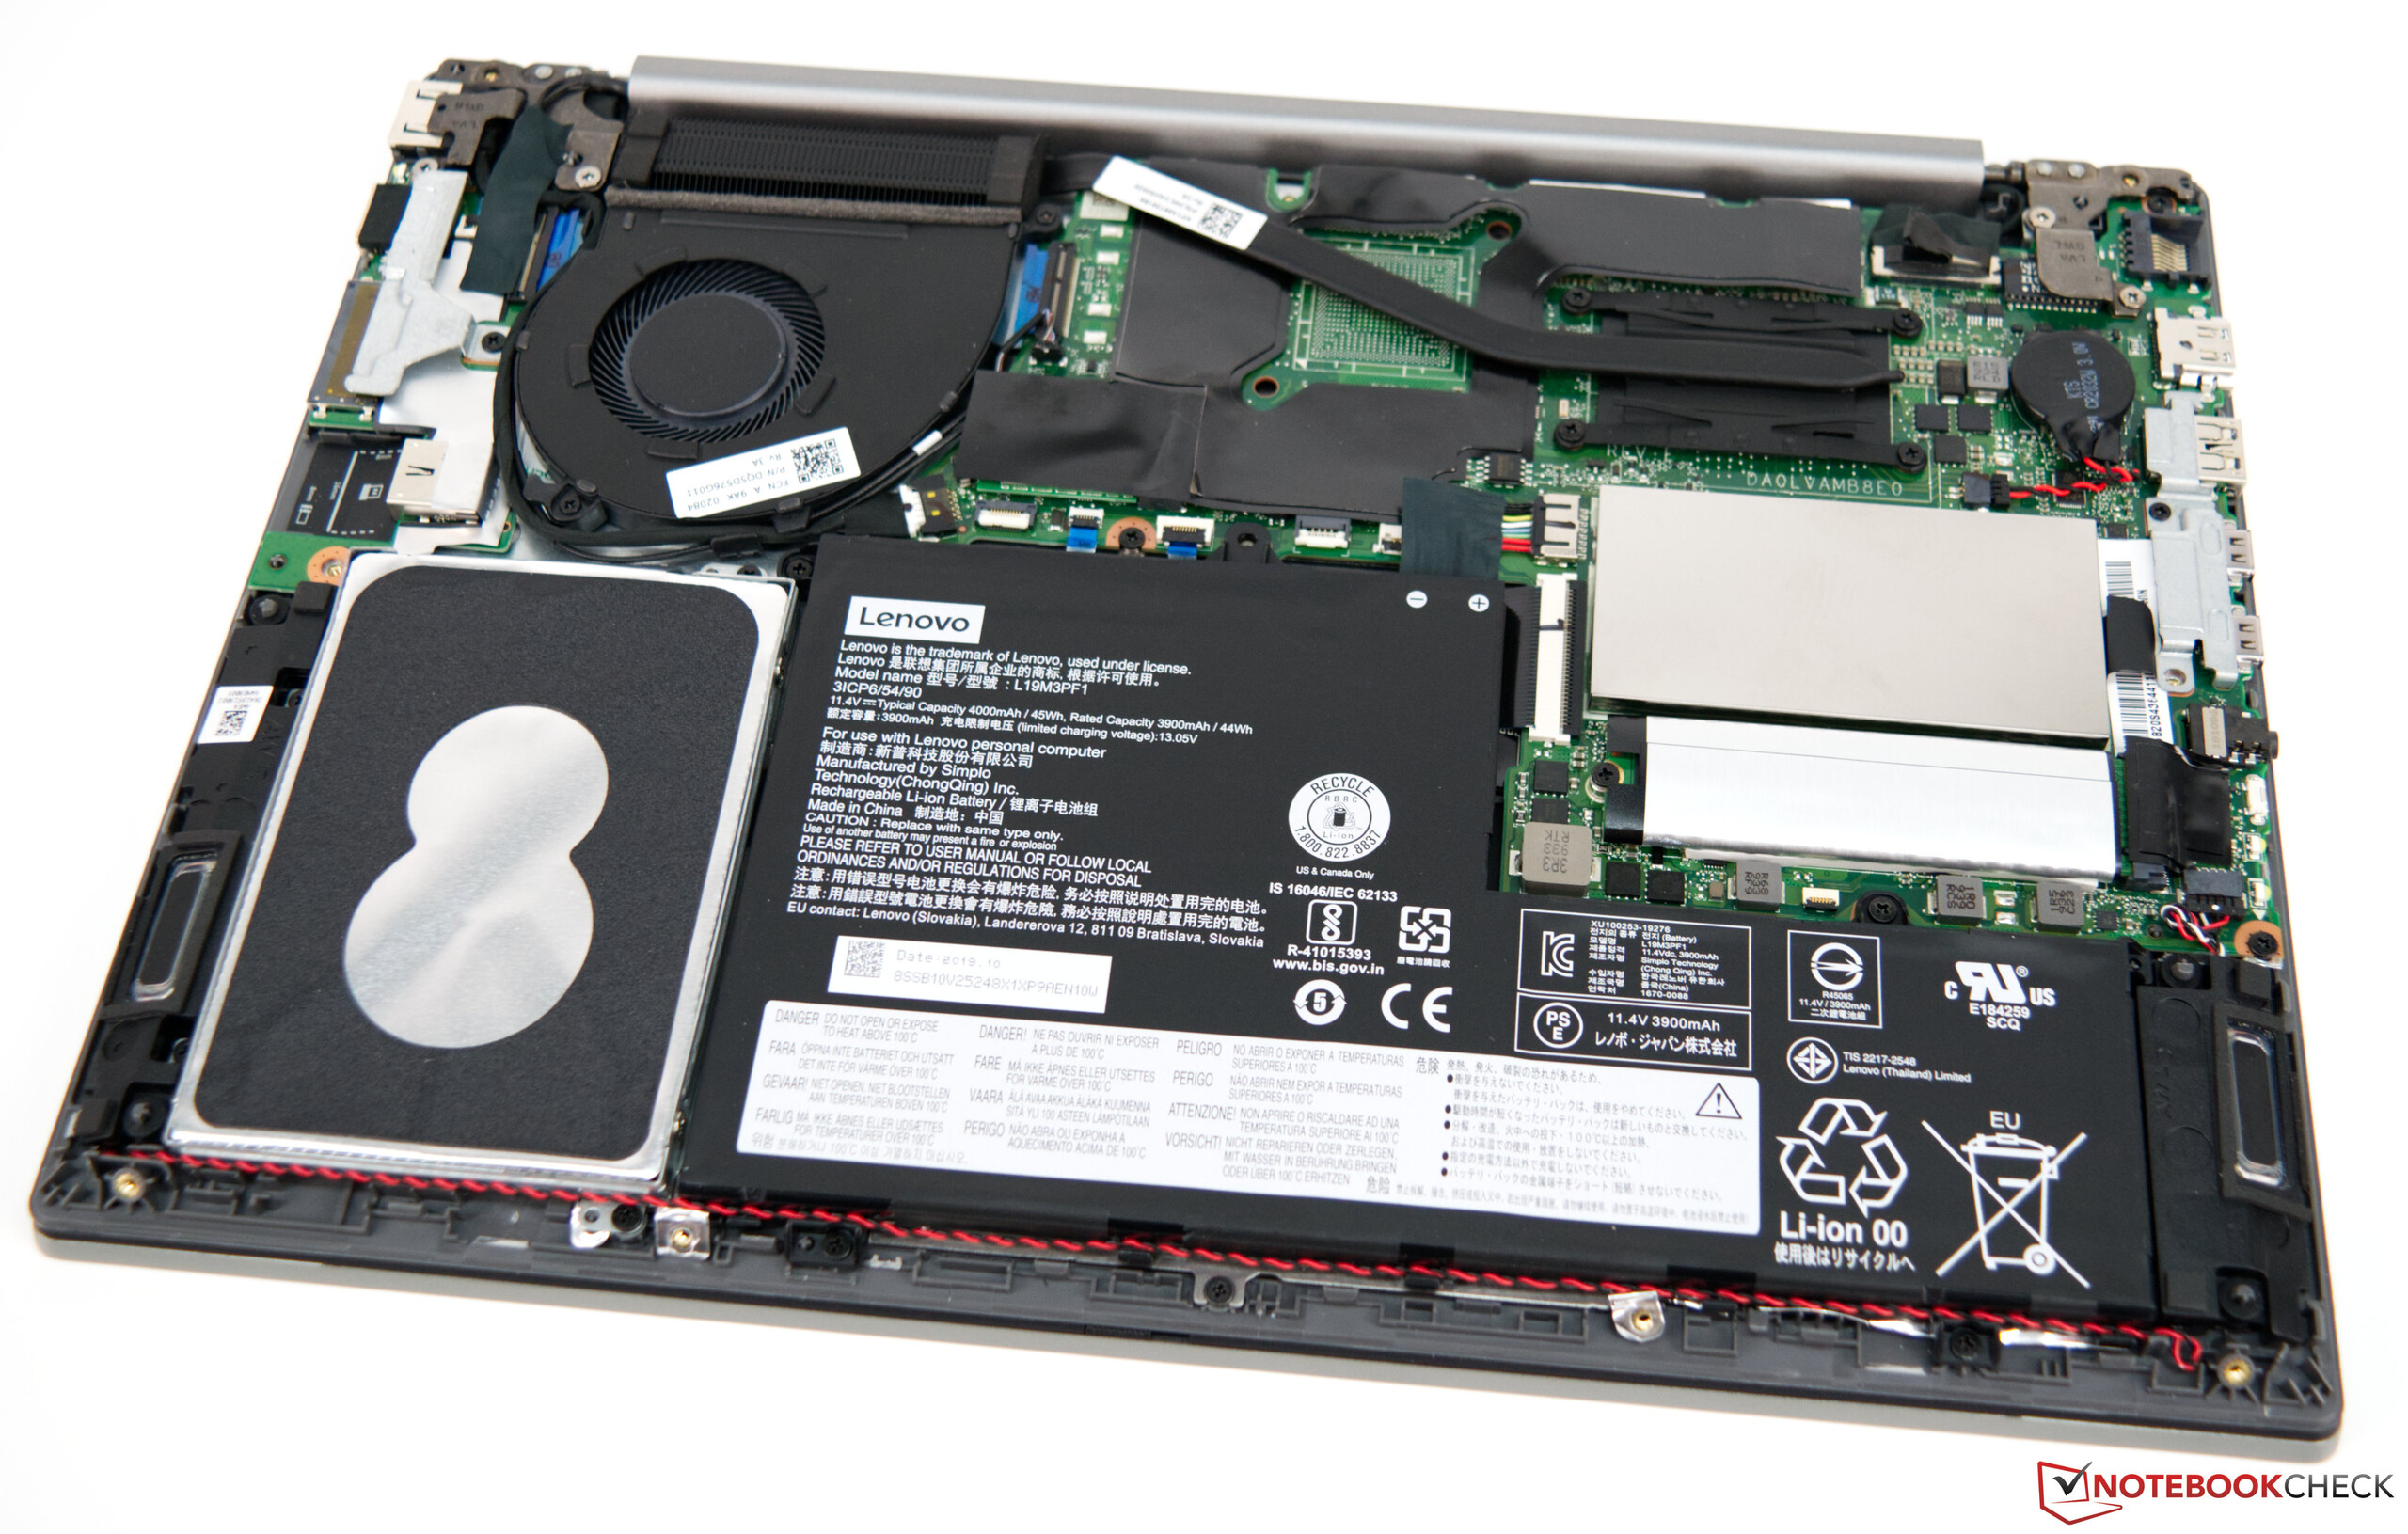
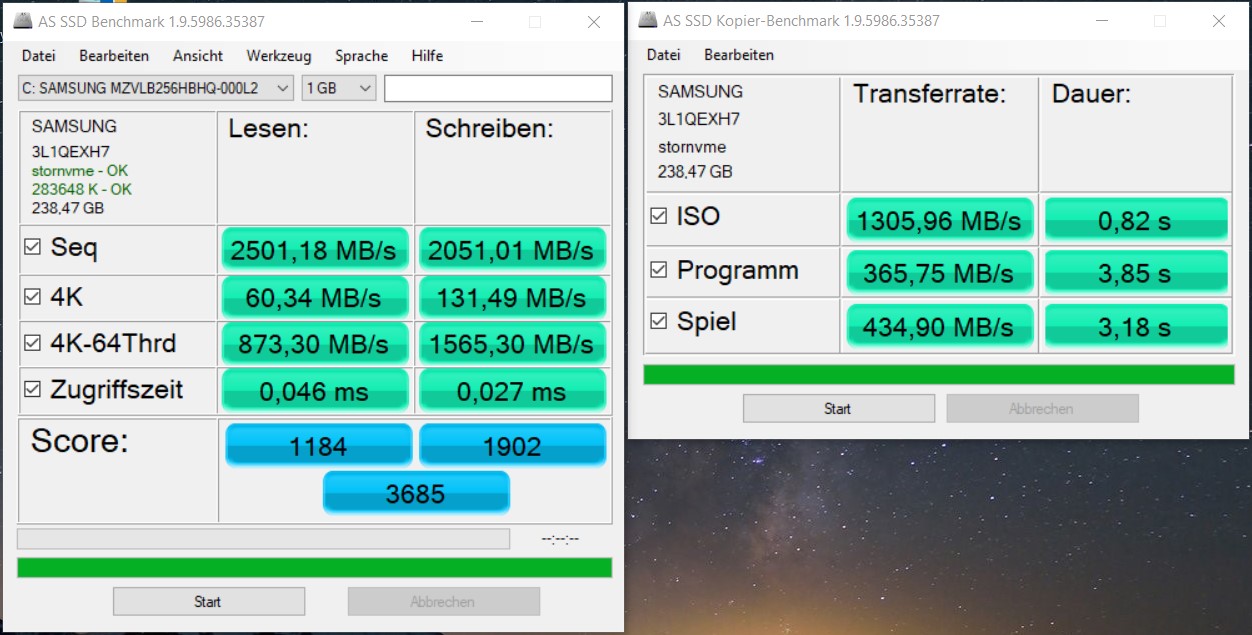
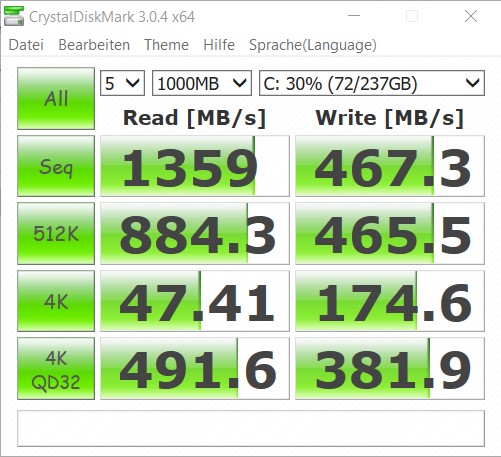
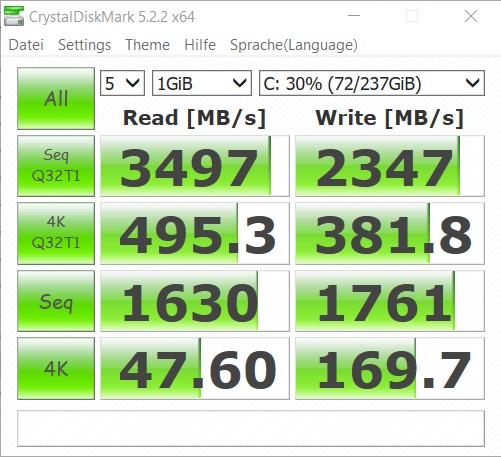
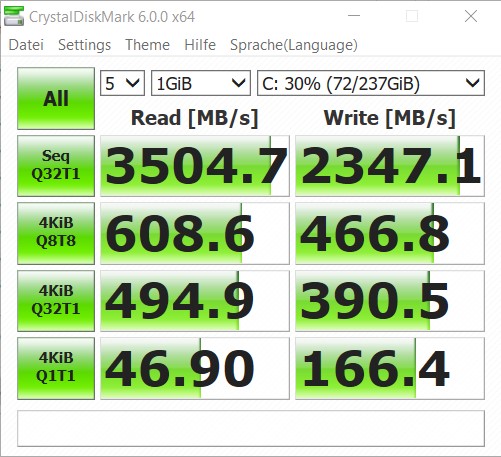
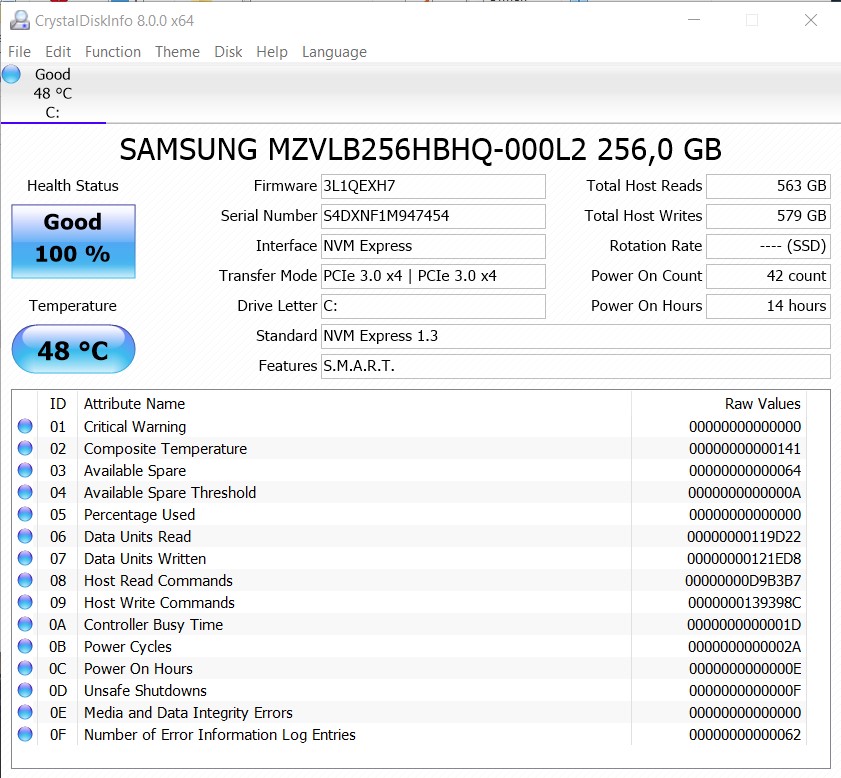
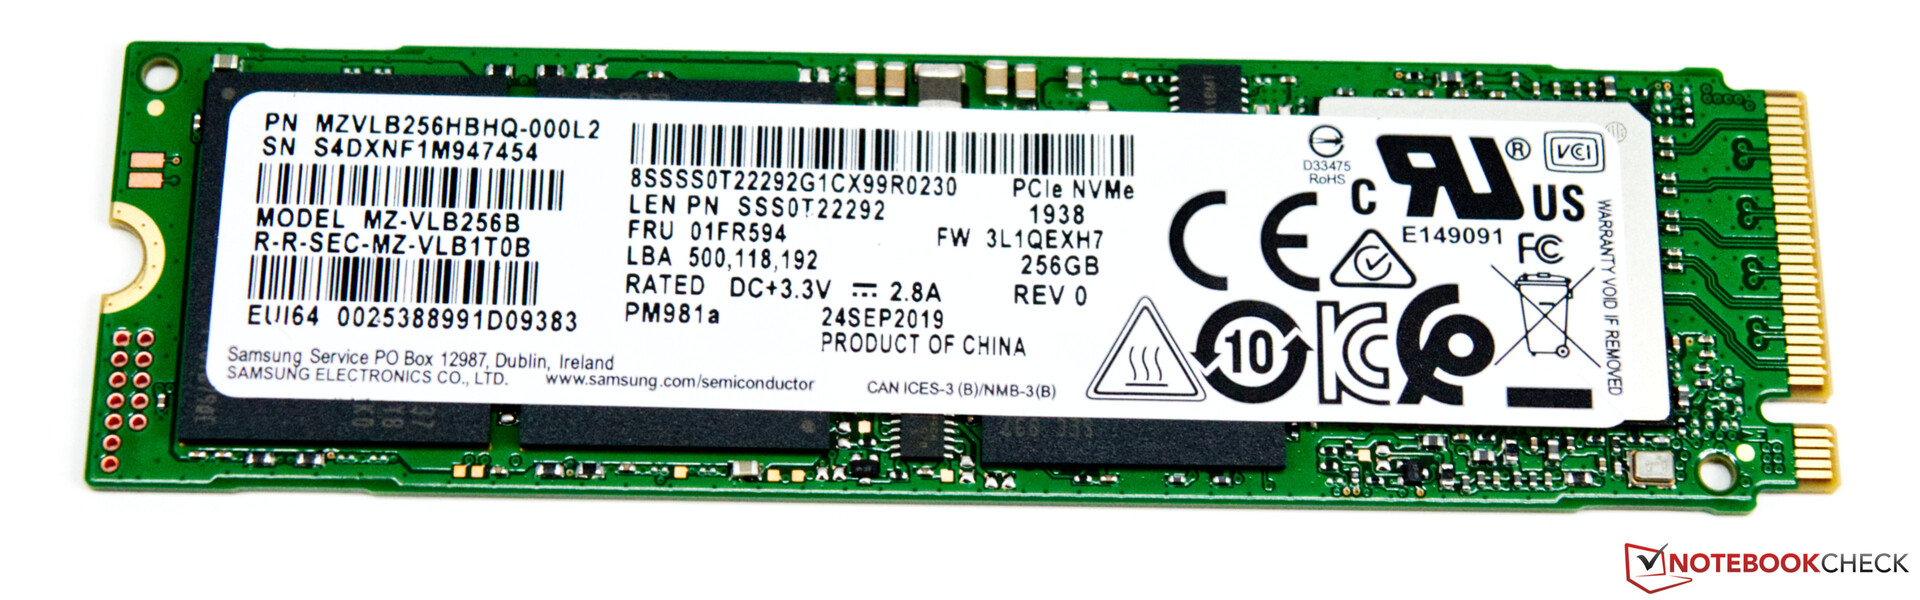
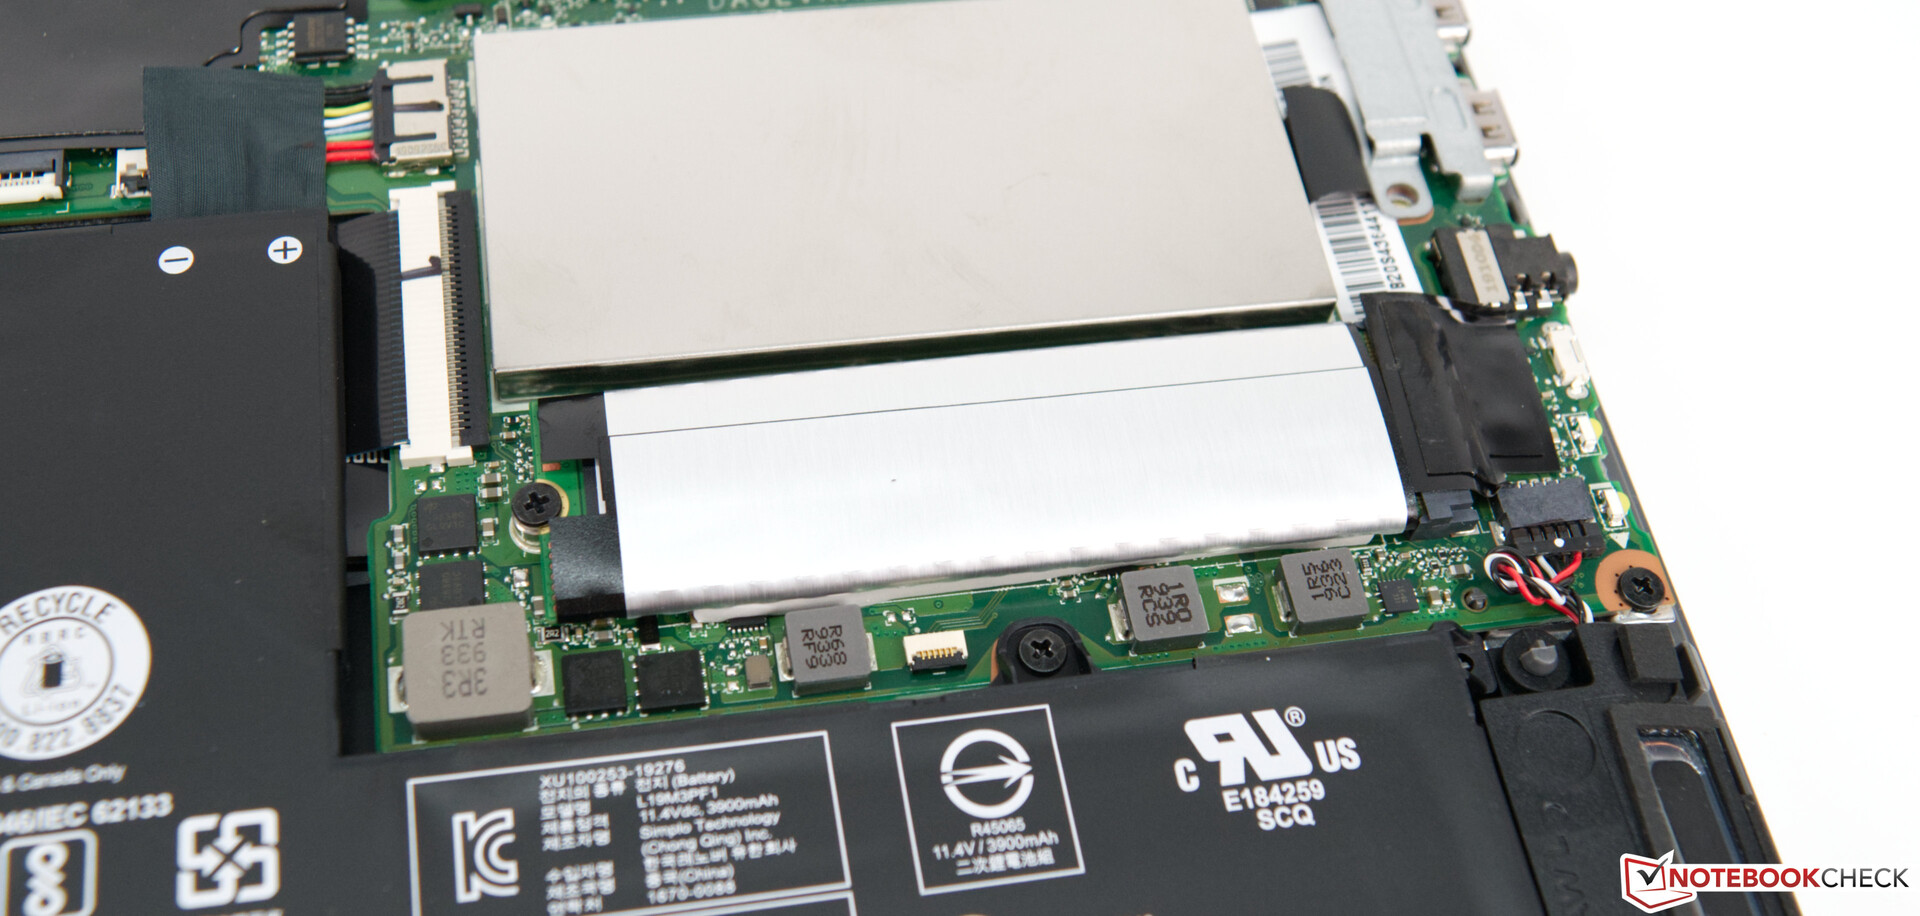
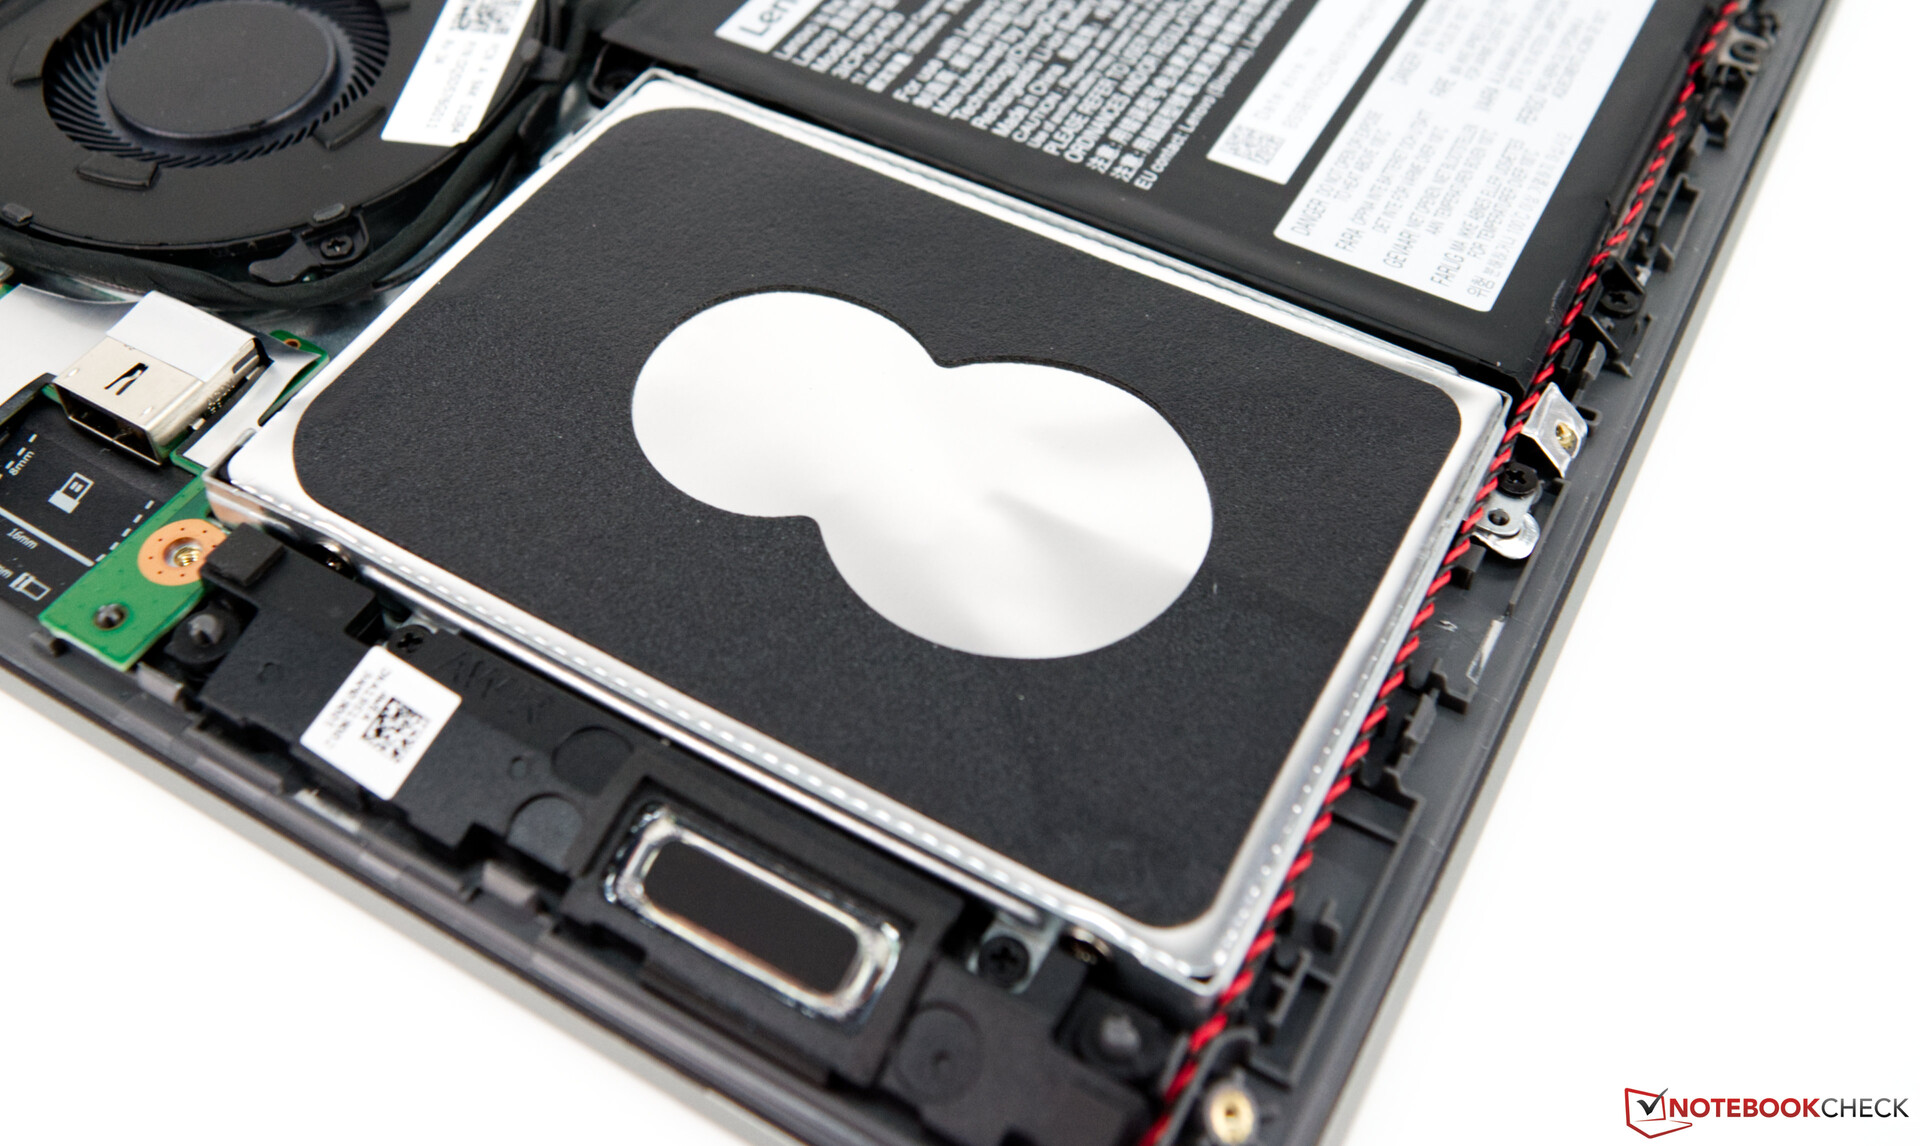
Storage Devices
The sole storage device in our review unit was a very fast 256 GB NVMe SSD made by Samsung. Once again, the ThinkBook 14 outperformed the entire competition. A secondary storage device can be installed in the free 2.5-inch drive bay.
Additional details and benchmarks can be found on our comparison page.
| Lenovo ThinkBook 14-IML-20RV006TGE Samsung SSD PM981a MZVLB256HBHQ | HP 14-dk0008ng Samsung PM871b MZNLN128HAHQ | Dell Latitude 3400 WDC PC SN520 SDAPNUW-256G | Lenovo ThinkPad E485-20KU000NGE Samsung PM961 MZVLW256HEHP | Lenovo ThinkPad E490-20N8000RGE SK hynix BC501 HFM256GDHTNG | Average Samsung SSD PM981a MZVLB256HBHQ | Average of class Office | |
|---|---|---|---|---|---|---|---|
| CrystalDiskMark 5.2 / 6 | -61% | -28% | -37% | -35% | -1% | 42% | |
| Write 4K (MB/s) | 169.7 | 90.6 -47% | 107.9 -36% | 72.2 -57% | 110.7 -35% | 135.2 ? -20% | 156.3 ? -8% |
| Read 4K (MB/s) | 47.6 | 33.17 -30% | 40.27 -15% | 35.25 -26% | 41.02 -14% | 44.6 ? -6% | 72.3 ? 52% |
| Write Seq (MB/s) | 1761 | 483 -73% | 1253 -29% | 1412 -20% | 757 -57% | 2091 ? 19% | 2522 ? 43% |
| Read Seq (MB/s) | 1630 | 511 -69% | 1298 -20% | 1523 -7% | 1037 -36% | 2097 ? 29% | 3262 ? 100% |
| Write 4K Q32T1 (MB/s) | 390.5 | 170.7 -56% | 415 6% | 102.1 -74% | 359 -8% | 370 ? -5% | 423 ? 8% |
| Read 4K Q32T1 (MB/s) | 464.9 | 235 -49% | 313.3 -33% | 170.9 -63% | 402.4 -13% | 372 ? -20% | 521 ? 12% |
| Write Seq Q32T1 (MB/s) | 2347 | 496.5 -79% | 1297 -45% | 1429 -39% | 833 -65% | 2308 ? -2% | 3852 ? 64% |
| Read Seq Q32T1 (MB/s) | 3505 | 534 -85% | 1728 -51% | 3204 -9% | 1635 -53% | 3395 ? -3% | 5727 ? 63% |
| AS SSD | -85% | -40% | -39% | -41% | -16% | 27% | |
| Seq Read (MB/s) | 2501 | 491.6 -80% | 1411 -44% | 2030 -19% | 1420 -43% | 2276 ? -9% | 4153 ? 66% |
| Seq Write (MB/s) | 2051 | 473.9 -77% | 751 -63% | 1395 -32% | 552 -73% | 1486 ? -28% | 2622 ? 28% |
| 4K Read (MB/s) | 60.3 | 26.82 -56% | 41.58 -31% | 38.63 -36% | 42.31 -30% | 49.6 ? -18% | 56.8 ? -6% |
| 4K Write (MB/s) | 131.5 | 57.8 -56% | 117.9 -10% | 63.9 -51% | 112.1 -15% | 129.5 ? -2% | 164.3 ? 25% |
| 4K-64 Read (MB/s) | 873 | 244.3 -72% | 502 -42% | 1035 19% | 510 -42% | 683 ? -22% | 937 ? 7% |
| 4K-64 Write (MB/s) | 1565 | 154.9 -90% | 451.5 -71% | 371.5 -76% | 357.9 -77% | 895 ? -43% | 1599 ? 2% |
| Access Time Read * (ms) | 0.046 | 0.119 -159% | 0.088 -91% | 0.054 -17% | 0.053 -15% | 0.06433 ? -40% | 0.08568 ? -86% |
| Access Time Write * (ms) | 0.027 | 0.062 -130% | 0.03 -11% | 0.059 -119% | 0.032 -19% | 0.04793 ? -78% | 0.06956 ? -158% |
| Score Read (Points) | 1184 | 320 -73% | 685 -42% | 1277 8% | 694 -41% | 960 ? -19% | 1409 ? 19% |
| Score Write (Points) | 1902 | 260 -86% | 645 -66% | 575 -70% | 525 -72% | 1173 ? -38% | 2025 ? 6% |
| Score Total (Points) | 3685 | 753 -80% | 1660 -55% | 2478 -33% | 1544 -58% | 2598 ? -29% | 4091 ? 11% |
| Copy ISO MB/s (MB/s) | 1306 | 171.1 -87% | 843 -35% | 637 -51% | 1474 ? 13% | 2470 ? 89% | |
| Copy Program MB/s (MB/s) | 365.8 | 93.2 -75% | 293.5 -20% | 237 -35% | 426 ? 16% | 761 ? 108% | |
| Copy Game MB/s (MB/s) | 434.9 | 140.6 -68% | 531 22% | 412 -5% | 760 ? 75% | 1584 ? 264% | |
| Total Average (Program / Settings) | -73% /
-76% | -34% /
-36% | -38% /
-38% | -38% /
-39% | -9% /
-10% | 35% /
32% |
* ... smaller is better

GPU Performance
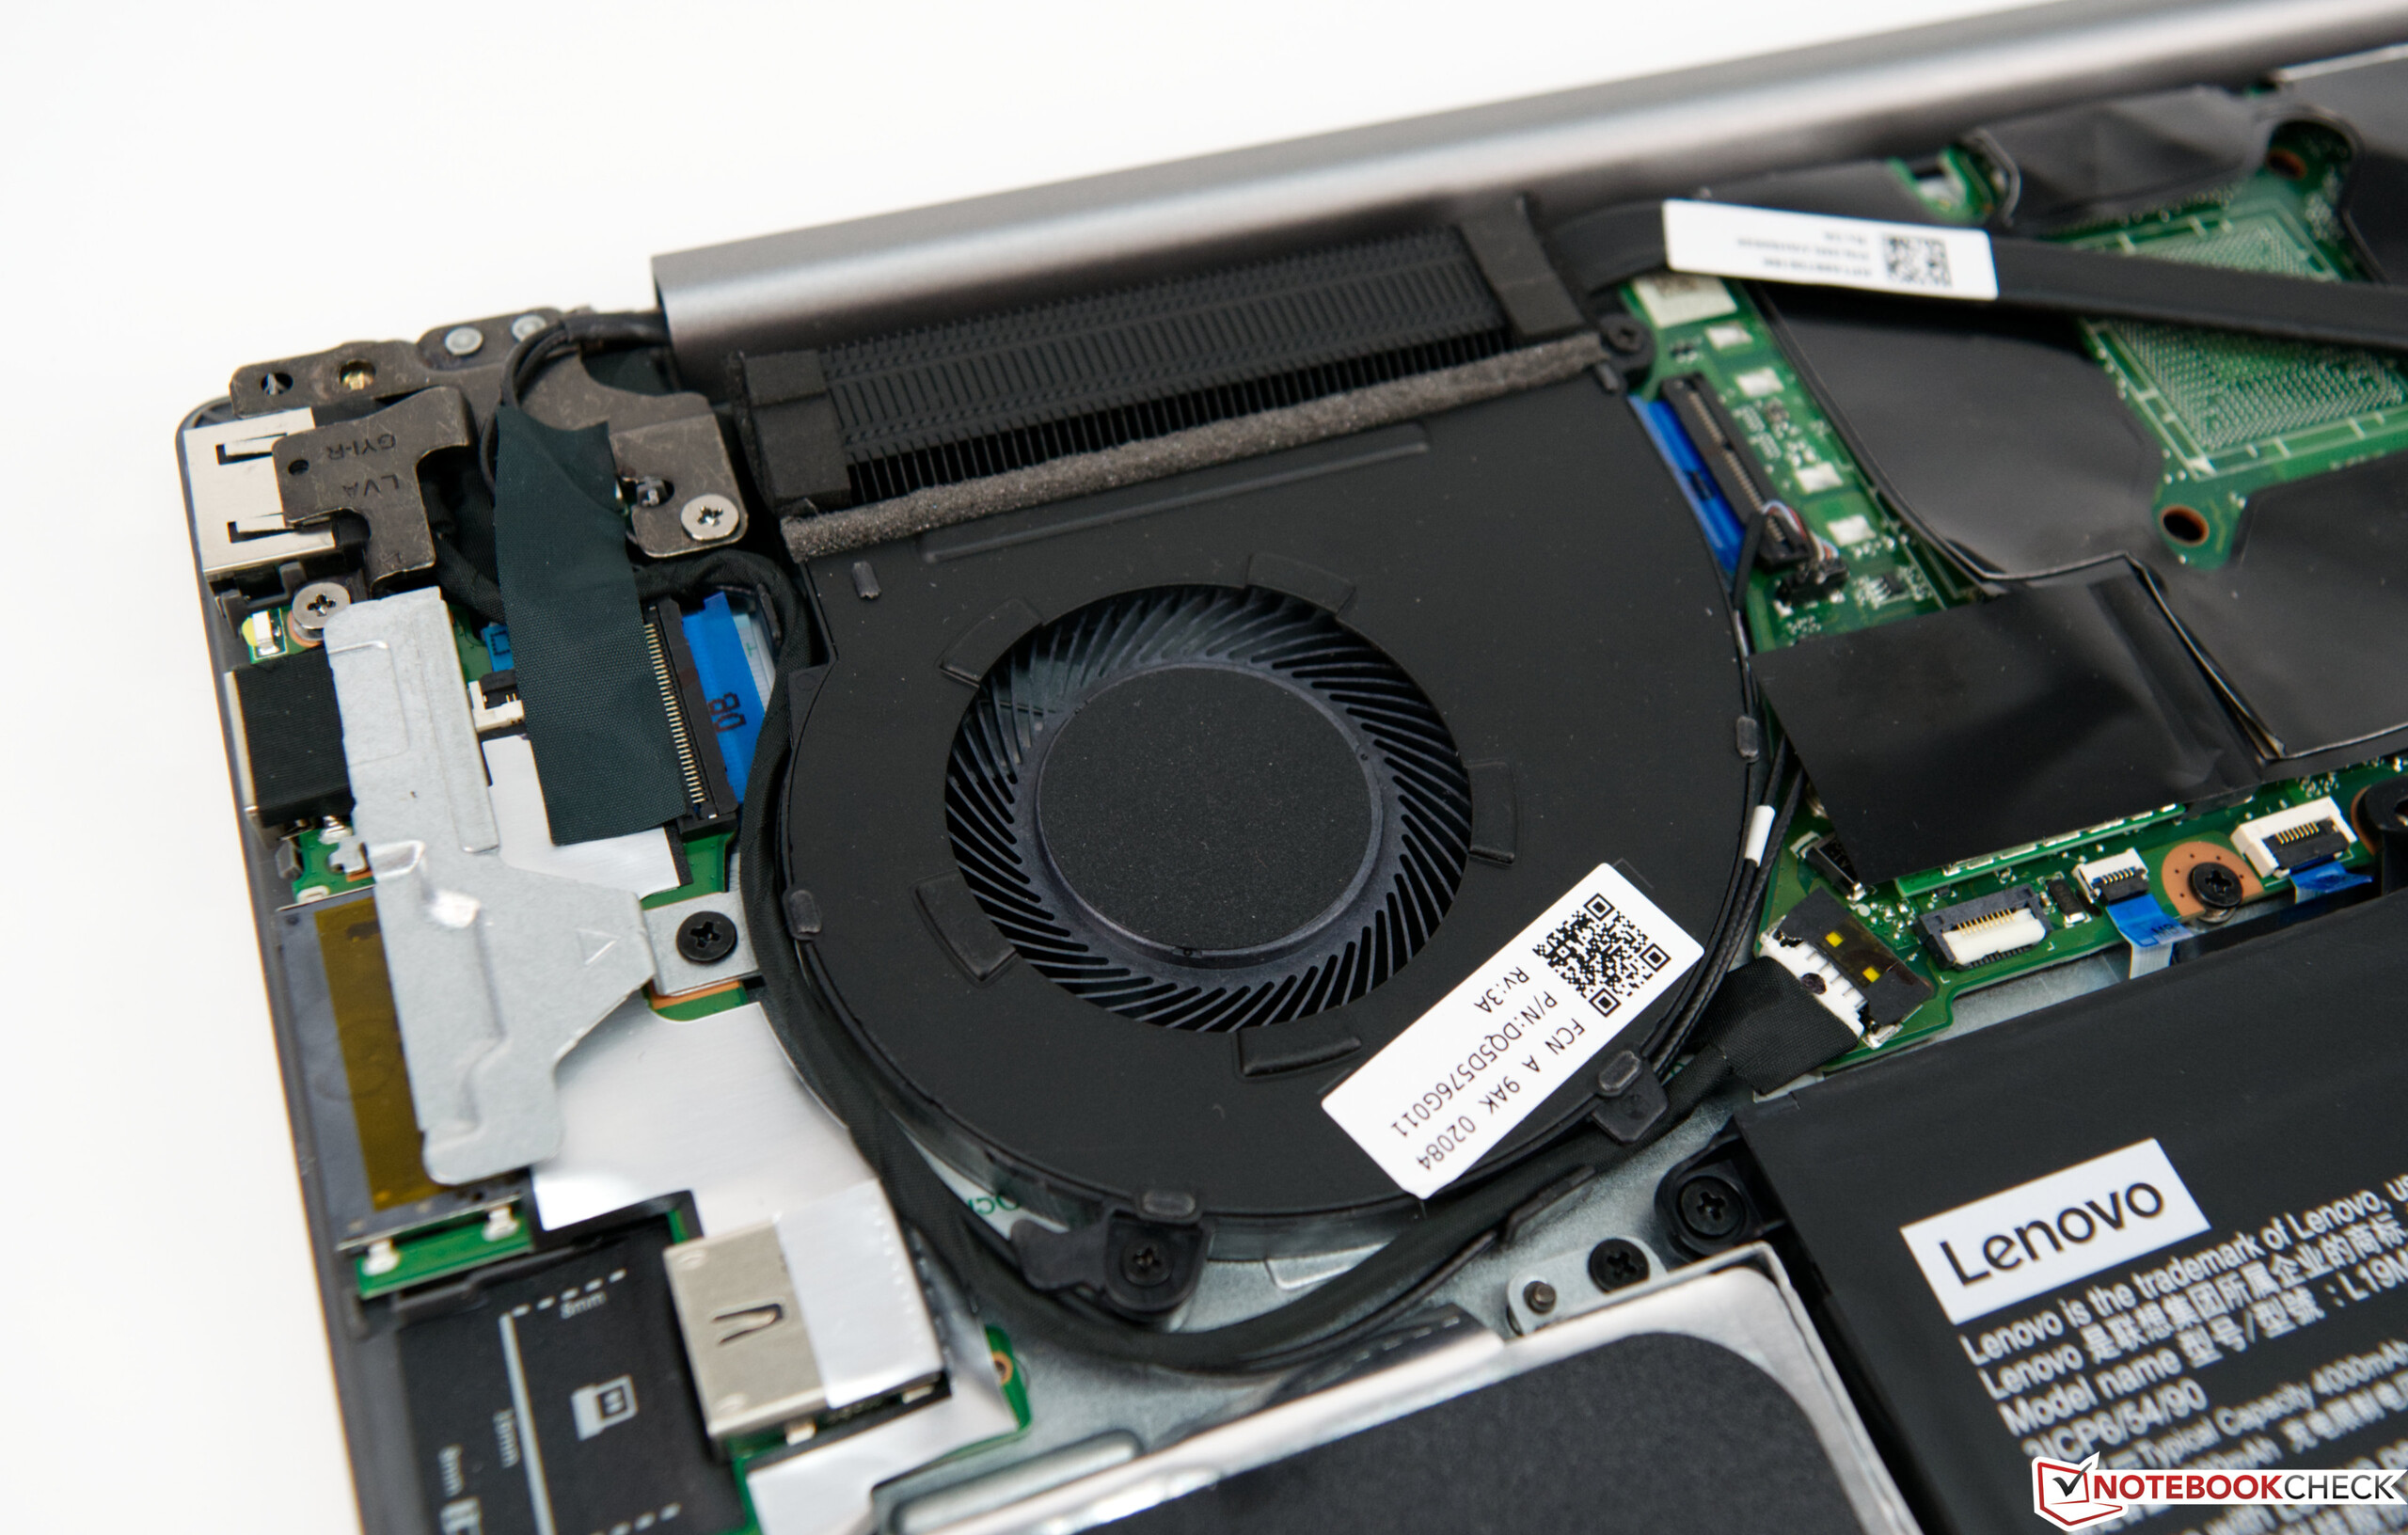
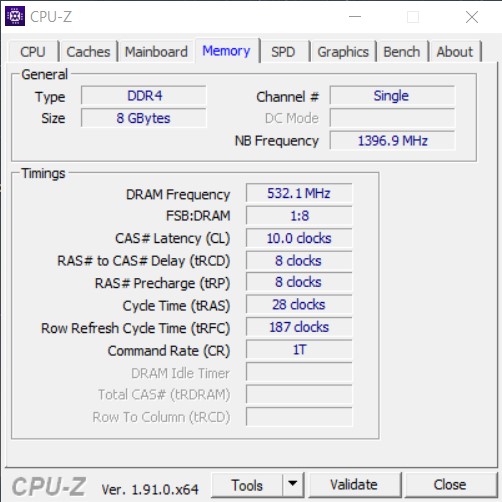
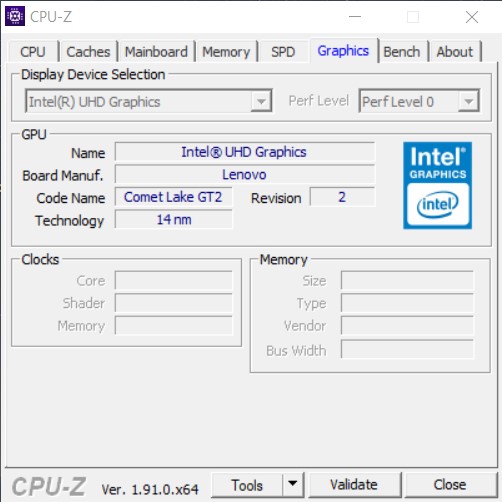
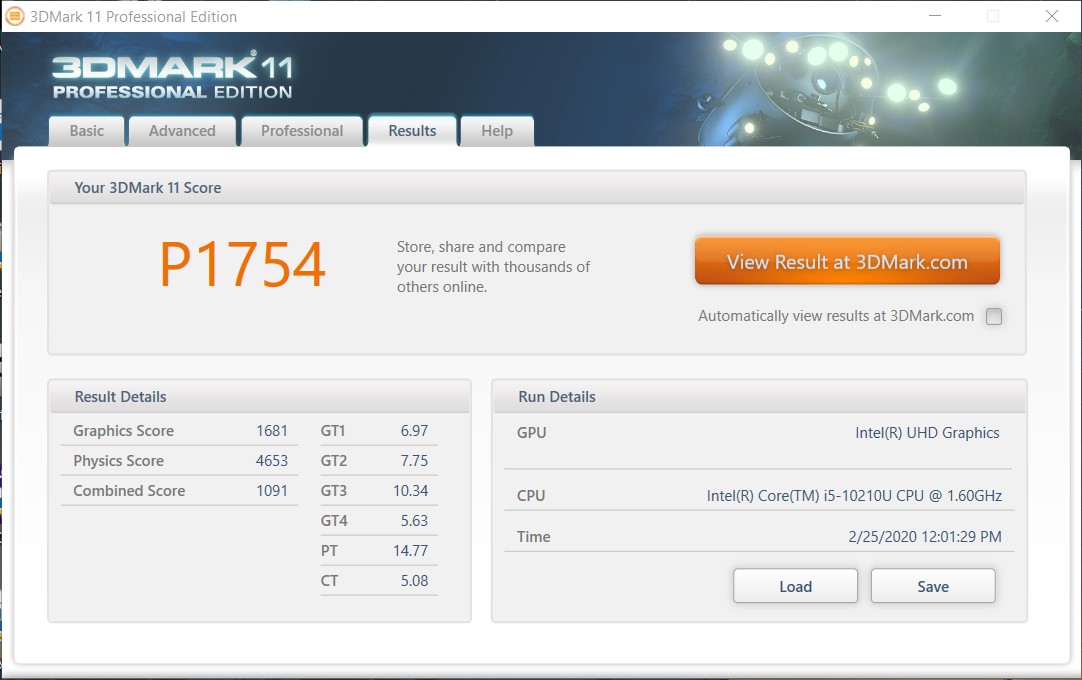
As is the case with all Comet Lake CPUs the integrated GPU is Intel’s UHD Graphics 620. However, the ThinkBook 14 can also be equipped with a dedicated AMD Radeon 620 according to Lenovo’s spec sheet, and we did notice a free solder socket on the motherboard. In our test, the ThinkBook 14 was unable to keep up with its AMD Ryzen 5 and Ryzen 7-equipped rivals as AMD’s integrated Radeon RX Vega GPUs are simply out of Intel’s league when it comes to 3D performance. Particularly so given that Lenovo failed to fully utilize the iGPU’s full performance potential due to our review unit’s single-channel RAM interface. Games can only be played in very low resolutions and on minimum details.
| 3DMark 11 Performance | 1787 points | |
| 3DMark Ice Storm Standard Score | 57910 points | |
| 3DMark Cloud Gate Standard Score | 7978 points | |
| 3DMark Fire Strike Score | 903 points | |
| 3DMark Fire Strike Extreme Score | 430 points | |
| 3DMark Time Spy Score | 398 points | |
Help | ||
Gaming Performance
| low | med. | high | ultra | |
|---|---|---|---|---|
| BioShock Infinite (2013) | 43 | 27 | 22 | 7 |
| Dota 2 Reborn (2015) | 61.7 | 35.4 | 16.1 | 14.2 |
| Rise of the Tomb Raider (2016) | 18.2 | 12.5 | 6.42 | |
| X-Plane 11.11 (2018) | 18.7 | 13 | 12 |
Emissions & Energy
System Noise
The ThinkBook 14 is a very quiet device, and quite often it is even completely silent. Under load, it peaked at a very quiet 31.8 dB(A).
Noise level
| Idle |
| 29.2 / 29.2 / 29.6 dB(A) |
| Load |
| 30.2 / 31.8 dB(A) |
 | ||
30 dB silent 40 dB(A) audible 50 dB(A) loud |
||
min: | ||
Temperature

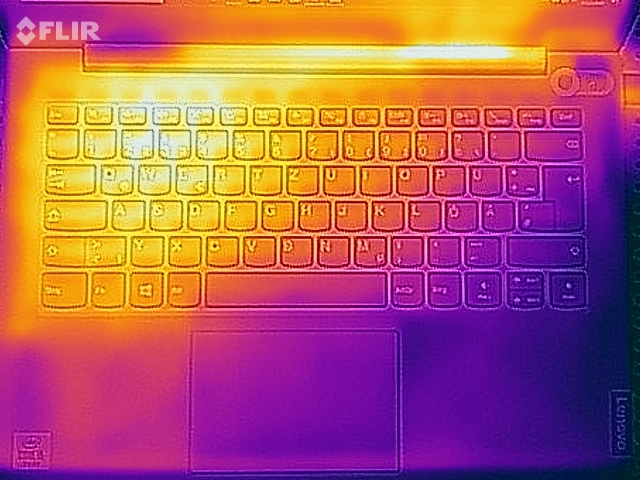
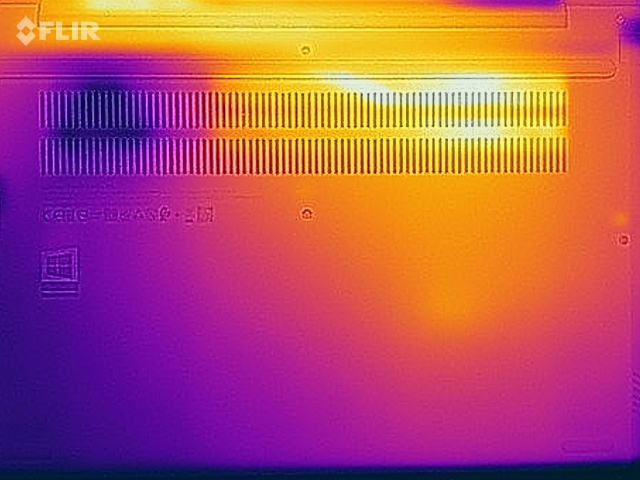
Under load, the case temperatures peaked at 45.9 °C, which is okay overall. After encountering the very quiet fan we did expect higher temperatures to be honest.
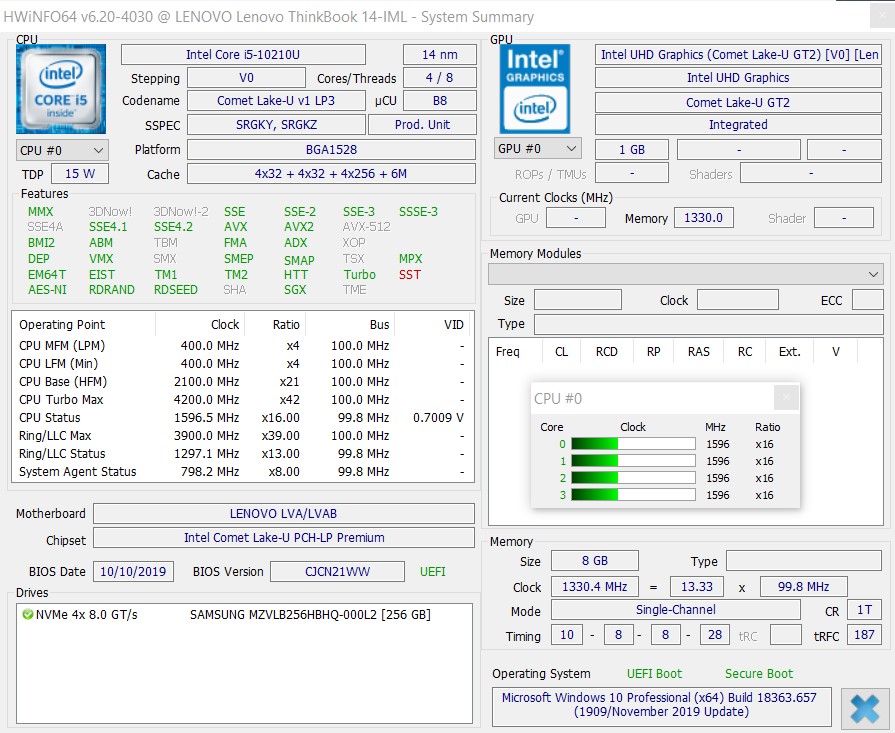
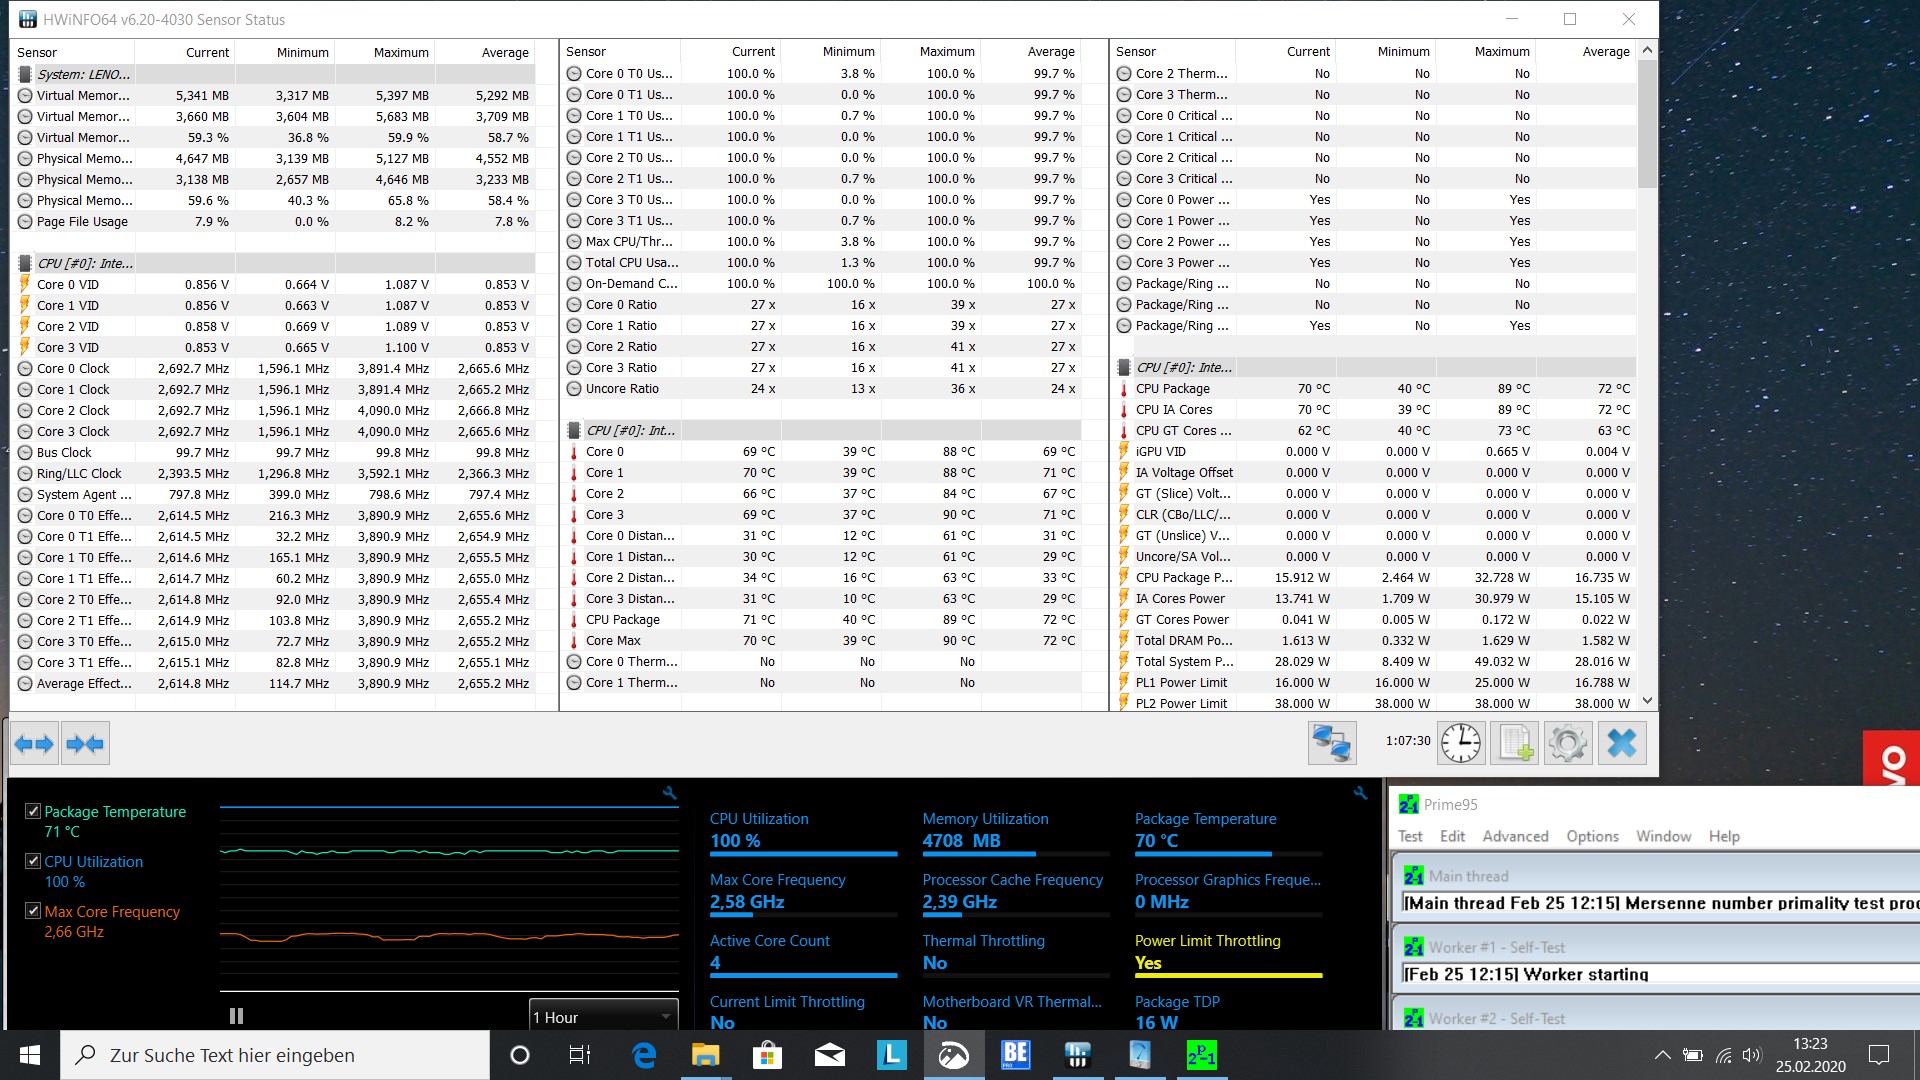
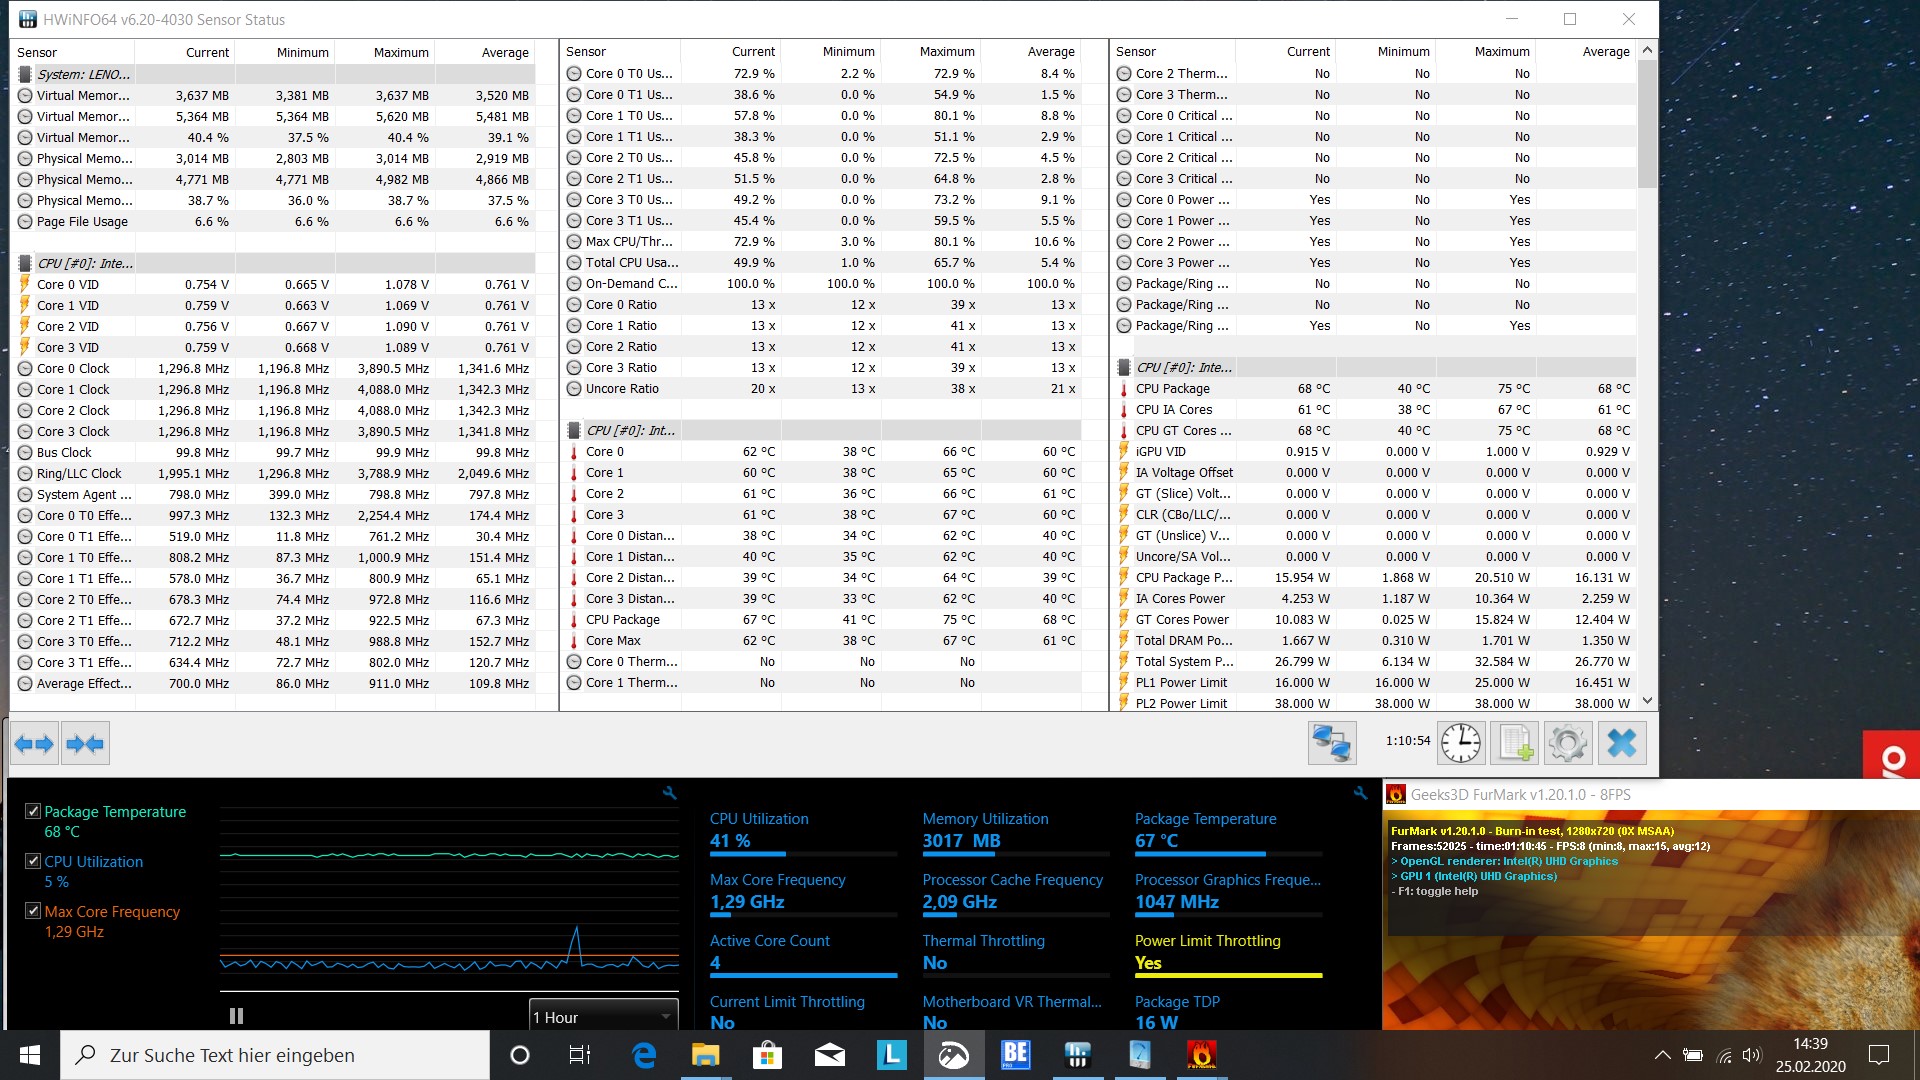
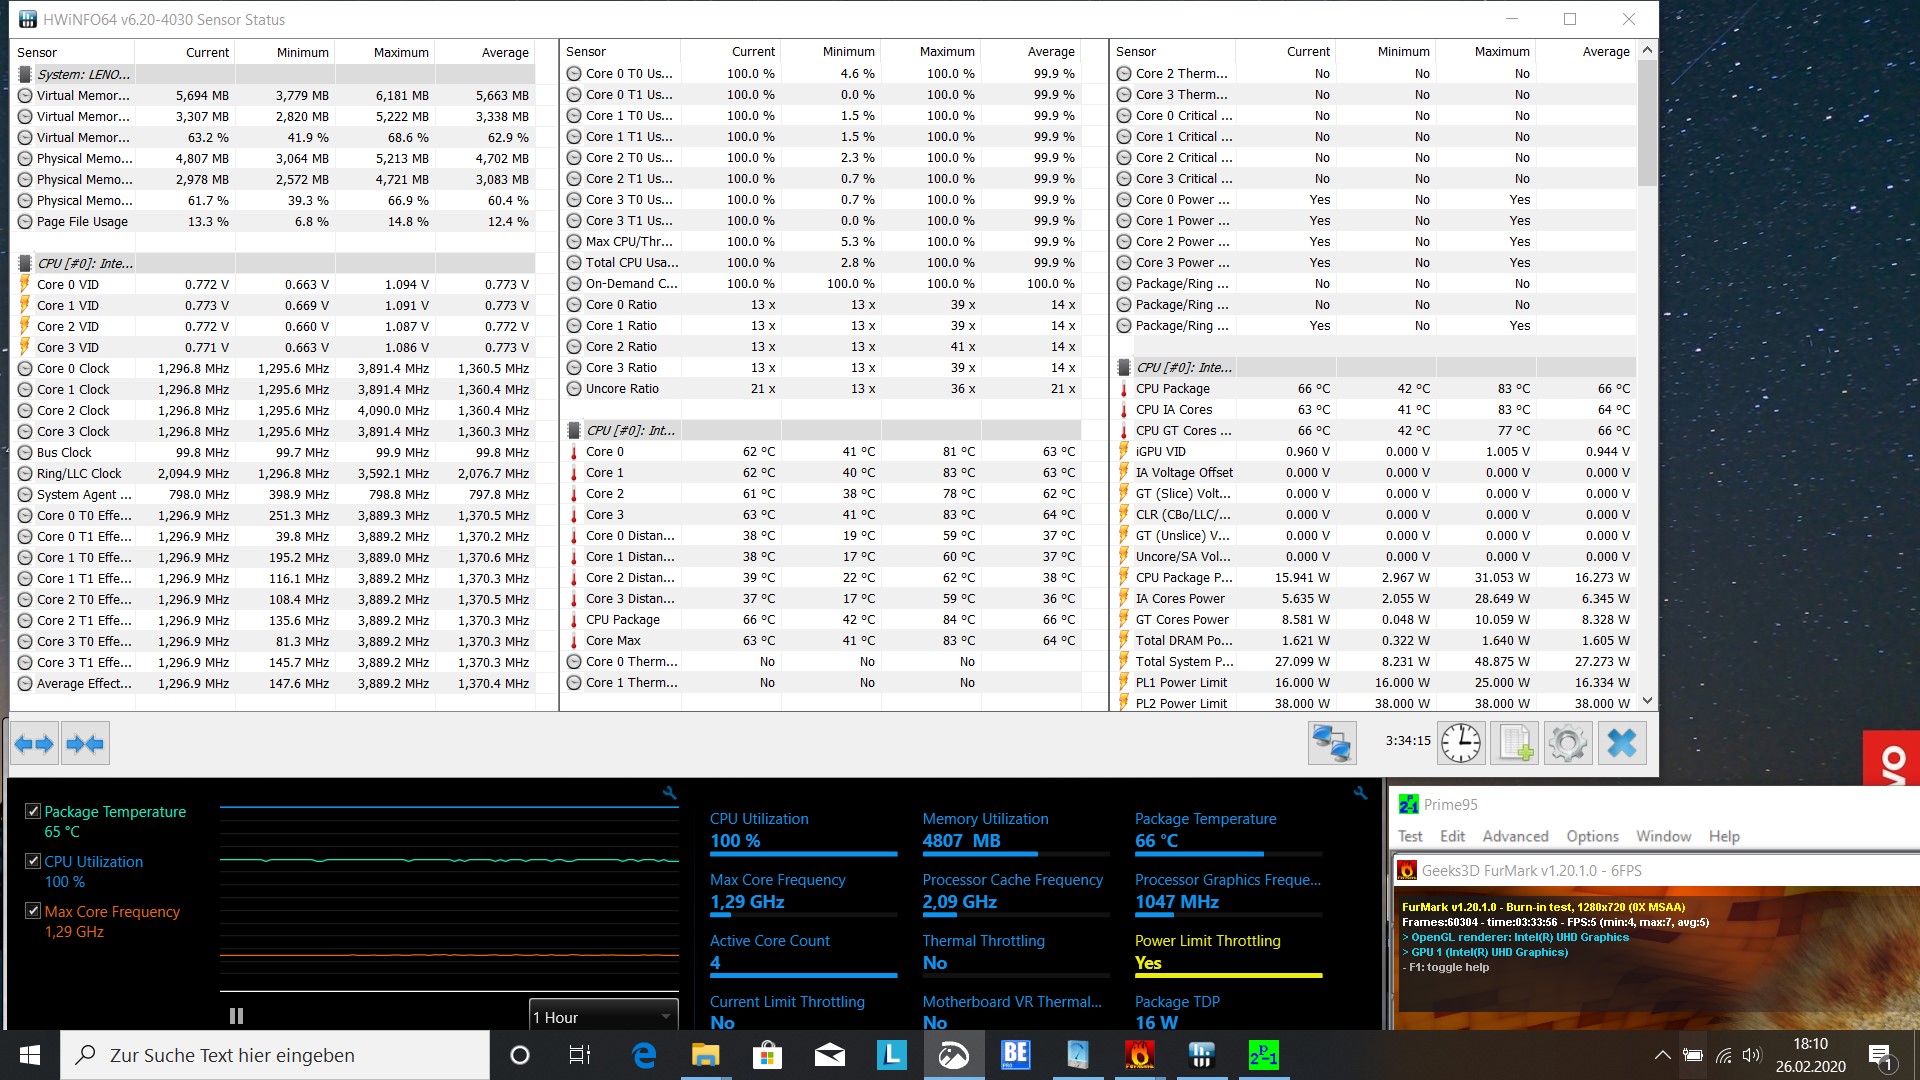
Maximum CPU temperature under full load was measured at 88 °C. This maximum was reached very quickly into the load test while the CPU was still capable of running at its maximum turbo boost speeds. Afterwards, the Intel Core i5-10210U's temperatures settled at between 67 °C and 71 °C. As such it remained cool enough to avoid any thermal throttling issues, and accordingly the CPU ran at 2.6 GHz and thus a full GHz faster than its base clock speed of 1.6 GHz.
(±) The maximum temperature on the upper side is 41.2 °C / 106 F, compared to the average of 34.3 °C / 94 F, ranging from 21.2 to 62.5 °C for the class Office.
(-) The bottom heats up to a maximum of 45.9 °C / 115 F, compared to the average of 36.8 °C / 98 F
(+) In idle usage, the average temperature for the upper side is 22.8 °C / 73 F, compared to the device average of 29.5 °C / 85 F.
(+) The palmrests and touchpad are cooler than skin temperature with a maximum of 29.4 °C / 84.9 F and are therefore cool to the touch.
(±) The average temperature of the palmrest area of similar devices was 27.5 °C / 81.5 F (-1.9 °C / -3.4 F).
Speakers
Both speakers are located at the front right underneath the palm rest. Do not expect too much of them. Voice playback was very good and clear, but music playback lacked depth and bass. External headphones or speakers can be connected via the 3.5-mm headphone jack.
Lenovo ThinkBook 14-IML-20RV006TGE audio analysis
(-) | not very loud speakers (65.3 dB)
Bass 100 - 315 Hz
(-) | nearly no bass - on average 15.4% lower than median
(±) | linearity of bass is average (7.1% delta to prev. frequency)
Mids 400 - 2000 Hz
(±) | higher mids - on average 6.8% higher than median
(±) | linearity of mids is average (11% delta to prev. frequency)
Highs 2 - 16 kHz
(±) | higher highs - on average 5.4% higher than median
(±) | linearity of highs is average (12.9% delta to prev. frequency)
Overall 100 - 16.000 Hz
(-) | overall sound is not linear (35.6% difference to median)
Compared to same class
» 97% of all tested devices in this class were better, 1% similar, 2% worse
» The best had a delta of 7%, average was 21%, worst was 53%
Compared to all devices tested
» 93% of all tested devices were better, 1% similar, 6% worse
» The best had a delta of 4%, average was 24%, worst was 134%
Lenovo ThinkPad E485-20KU000NGE audio analysis
(-) | not very loud speakers (70.5 dB)
Bass 100 - 315 Hz
(-) | nearly no bass - on average 21.5% lower than median
(±) | linearity of bass is average (12.6% delta to prev. frequency)
Mids 400 - 2000 Hz
(+) | balanced mids - only 4.3% away from median
(±) | linearity of mids is average (8.5% delta to prev. frequency)
Highs 2 - 16 kHz
(+) | balanced highs - only 2.8% away from median
(+) | highs are linear (6.2% delta to prev. frequency)
Overall 100 - 16.000 Hz
(±) | linearity of overall sound is average (26.4% difference to median)
Compared to same class
» 81% of all tested devices in this class were better, 7% similar, 13% worse
» The best had a delta of 7%, average was 21%, worst was 53%
Compared to all devices tested
» 81% of all tested devices were better, 4% similar, 15% worse
» The best had a delta of 4%, average was 24%, worst was 134%
Power Consumption
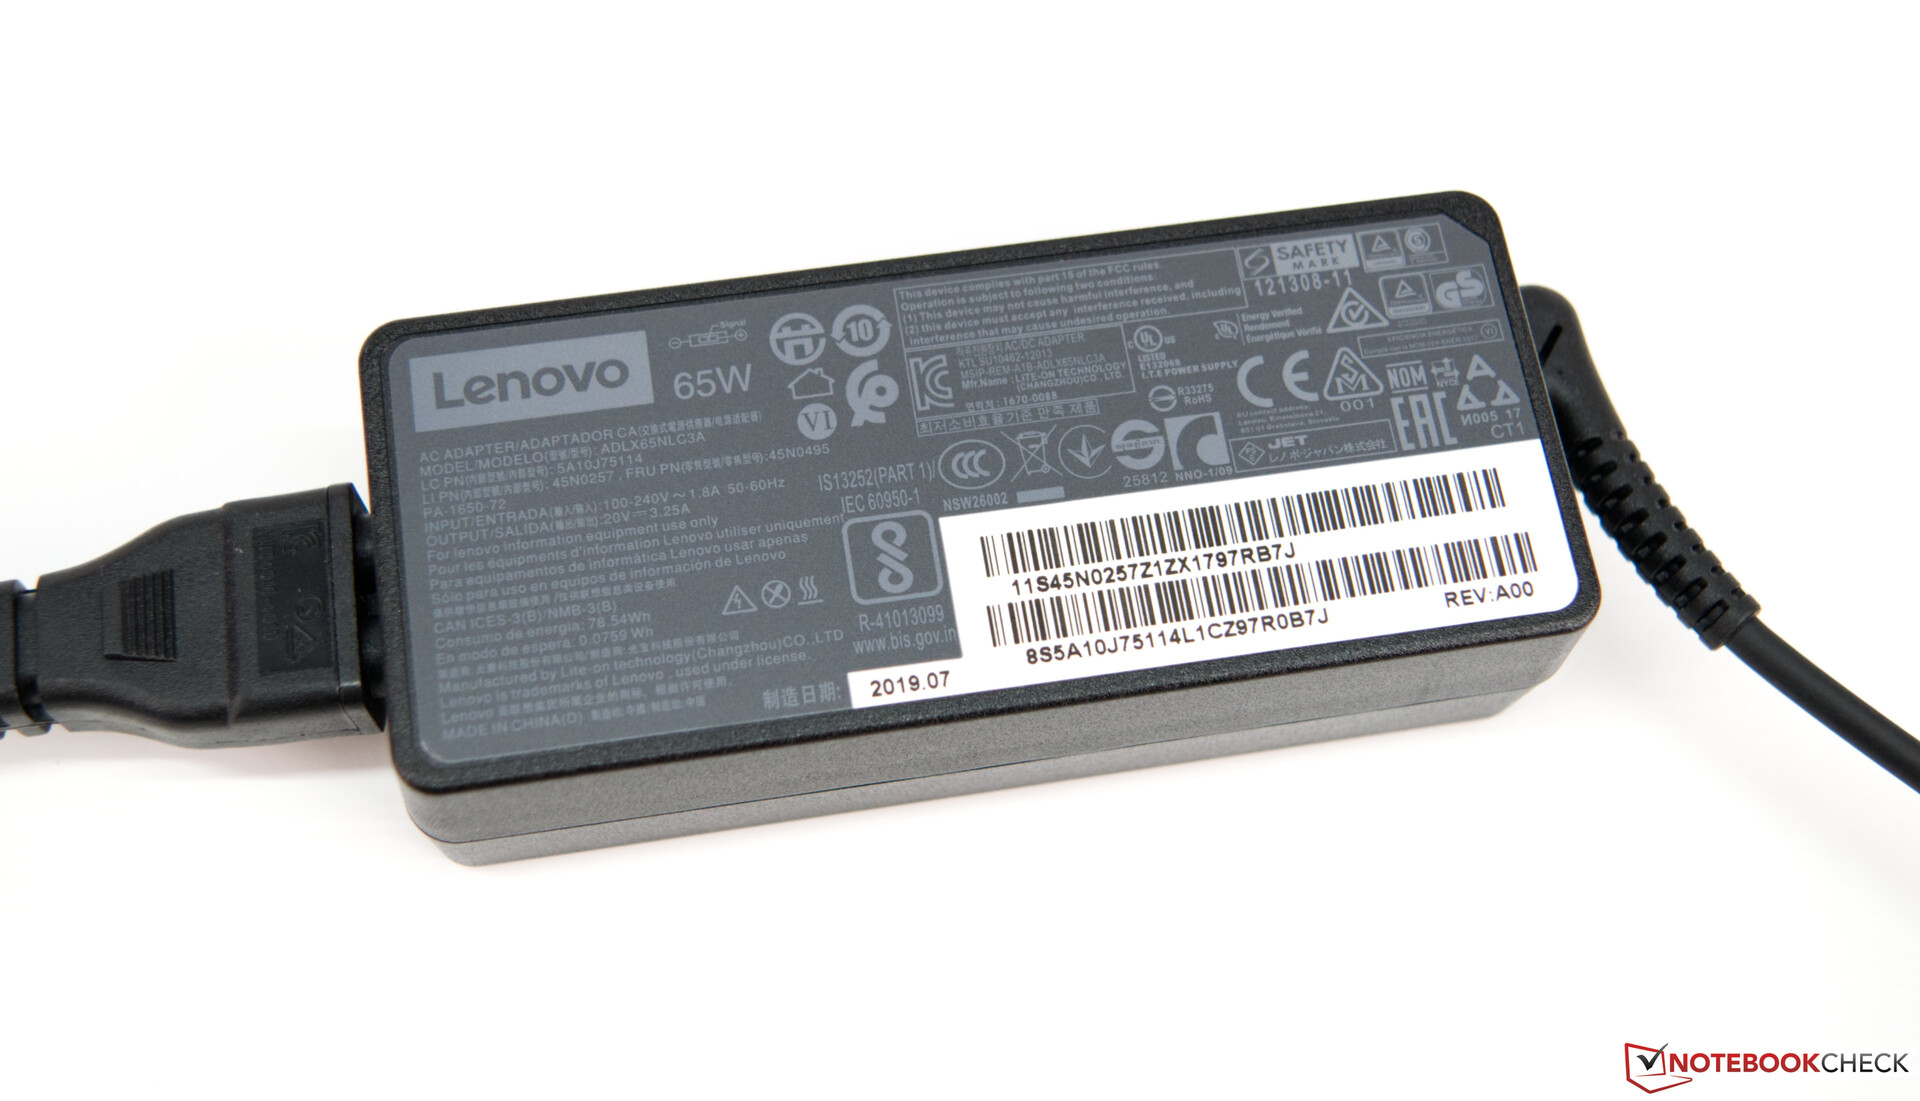
When taking our usual power consumption measurements, we were positively surprised by the ThinkBook 14’s low overall power demands. Under load, it peaked at 62.2 W while the CPU was still able to run at its maximum turbo boost speed. Once it settled down, power consumption decreased to just 43.3 W. The 65 W power supply is thus more than amply dimensioned. Just like its bigger brother, the ThinkBook 15, the ThinkBook 14 can be charged via USB-C.
| Off / Standby | |
| Idle | |
| Load |
|
Key:
min: | |
Battery Life
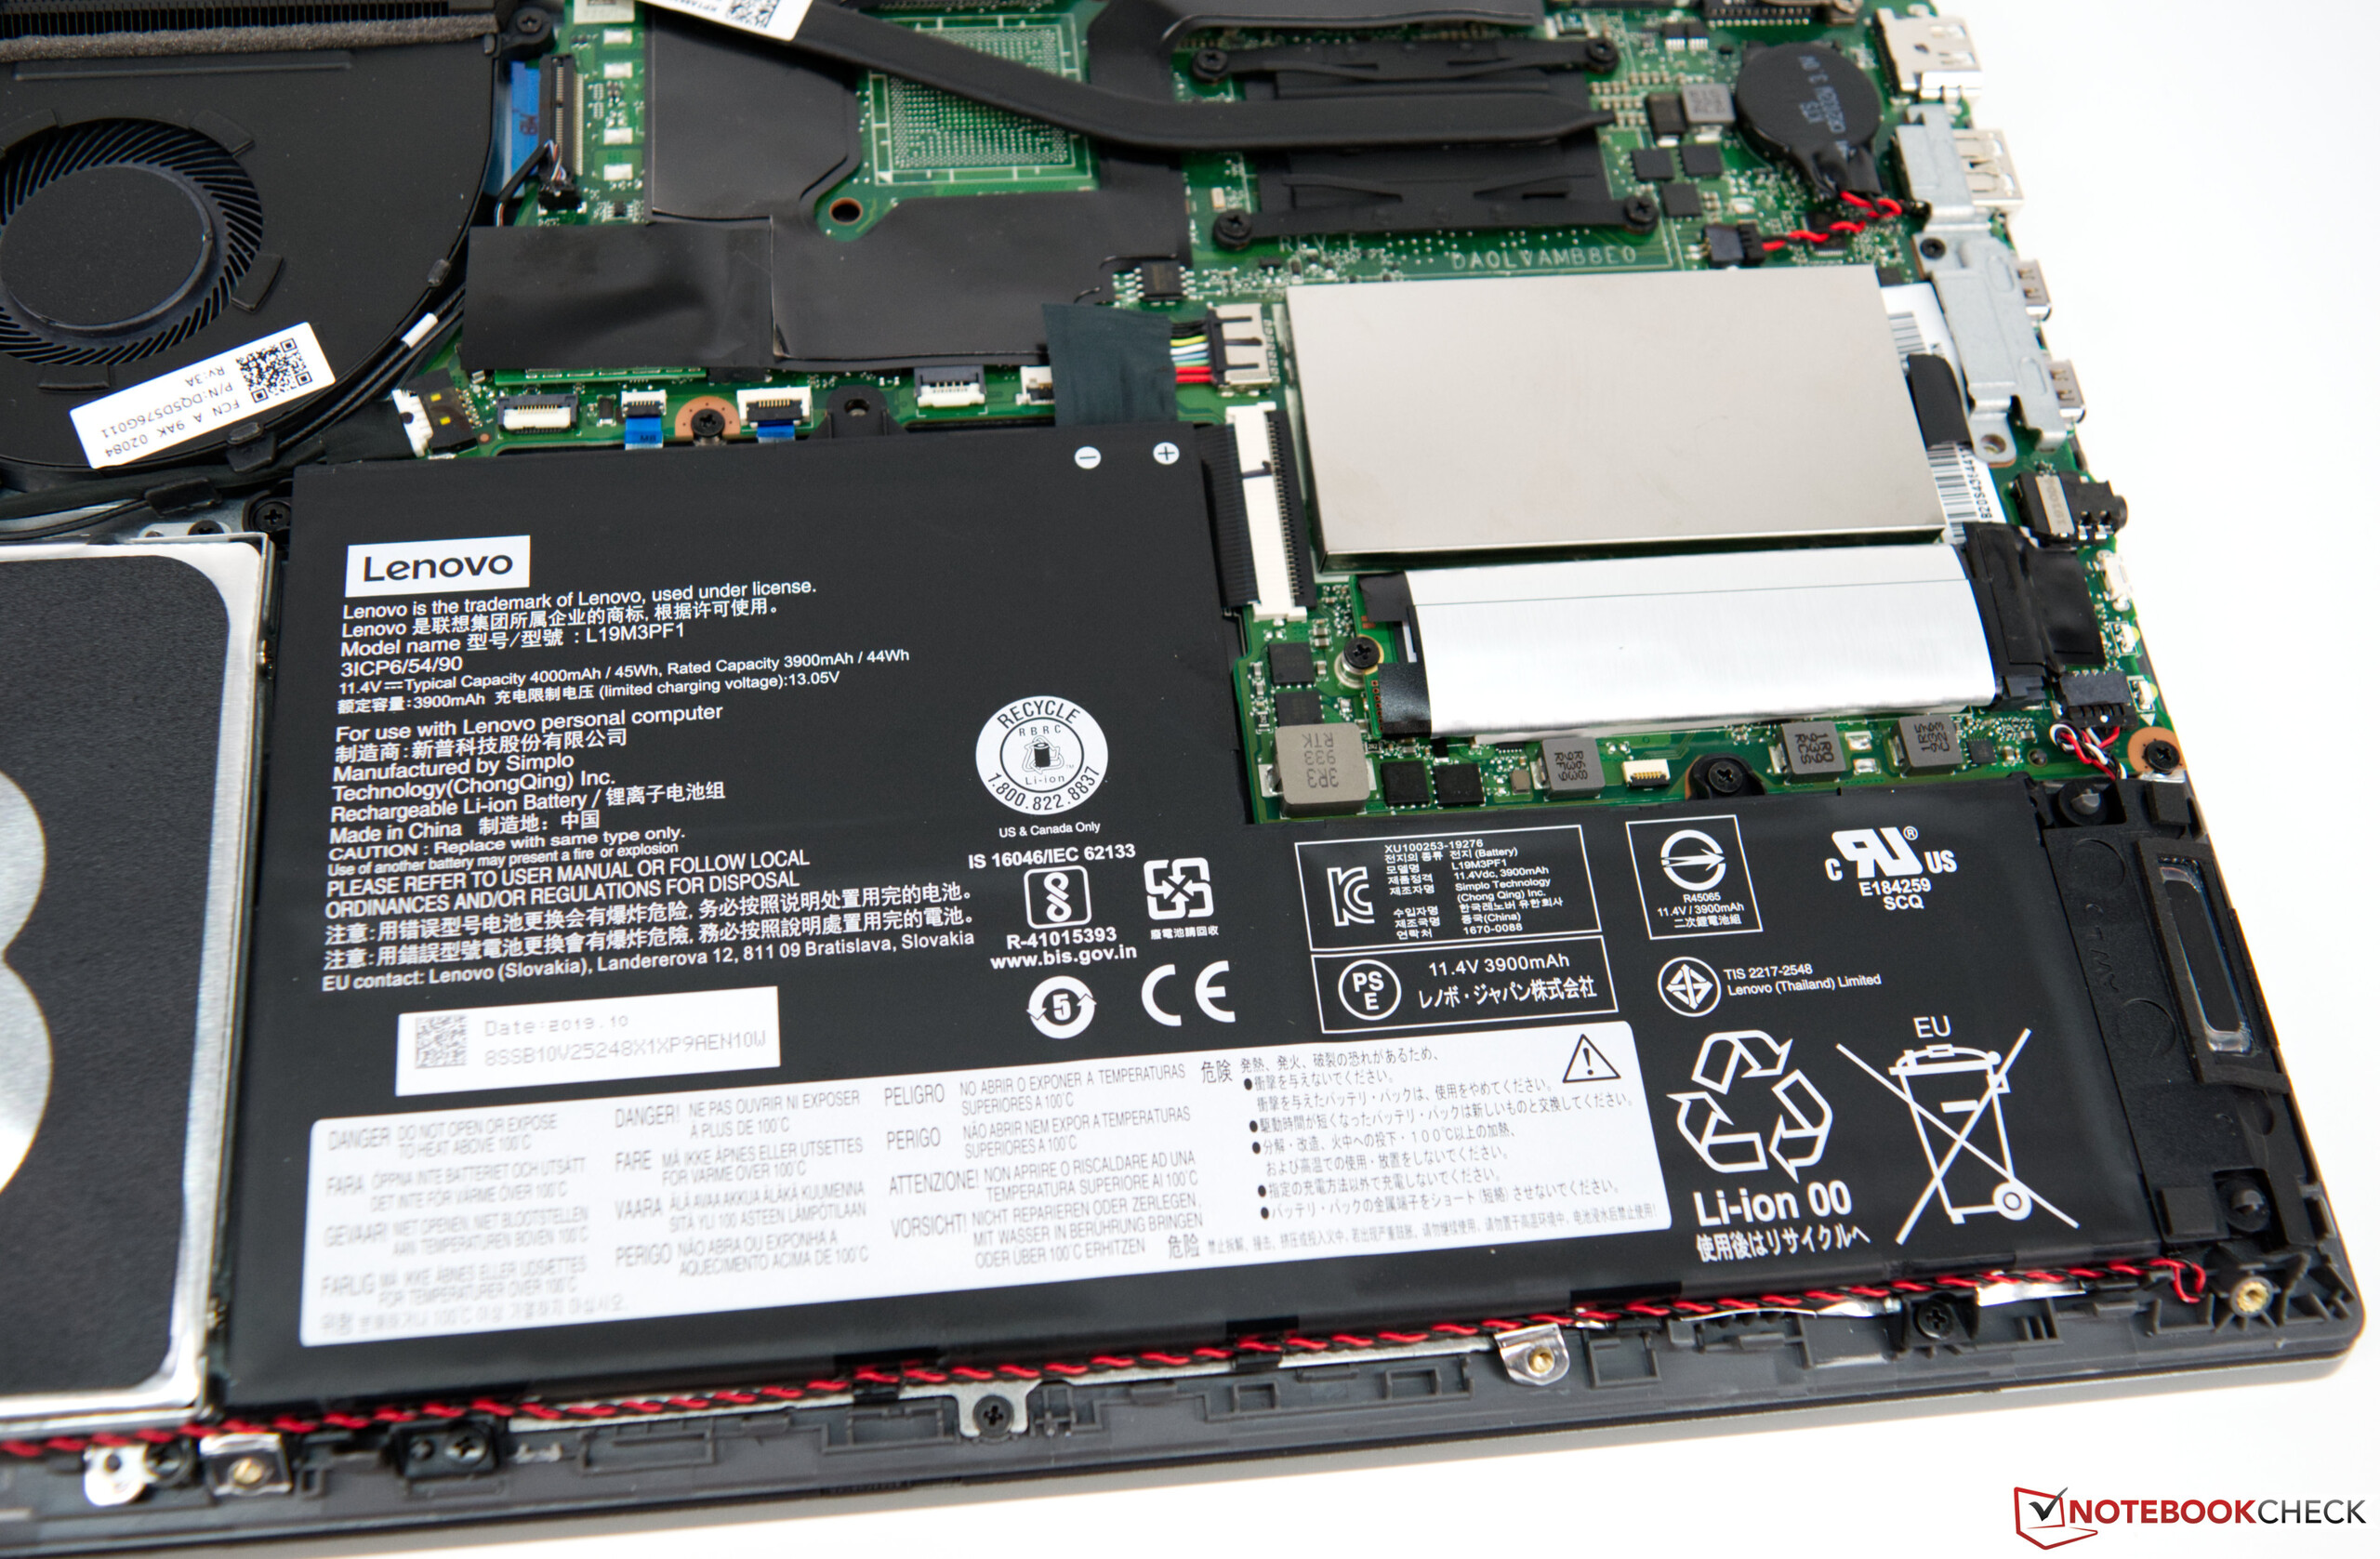
The non-replaceable 45 Wh battery allows for a battery life of around 8.5 hours in our Wi-Fi test. Charging time is relatively short, and the battery reached 80% charge after just 45 minutes and 100% after 90 minutes.


Pros
Cons
Verdict – Well-Equipped Office Device
The Lenovo ThinkBook 14 is a solid office device for business users, and the subnotebook is also very well-suited for everyday office tasks at home. In addition, at its low price of less than $800 it does not leave too big of a hole in your wallet. In return, you get a well-built high-quality device made of well-chosen materials. We also liked its plentiful connectivity, including the card reader which, more often than not, is missing on modern laptops.
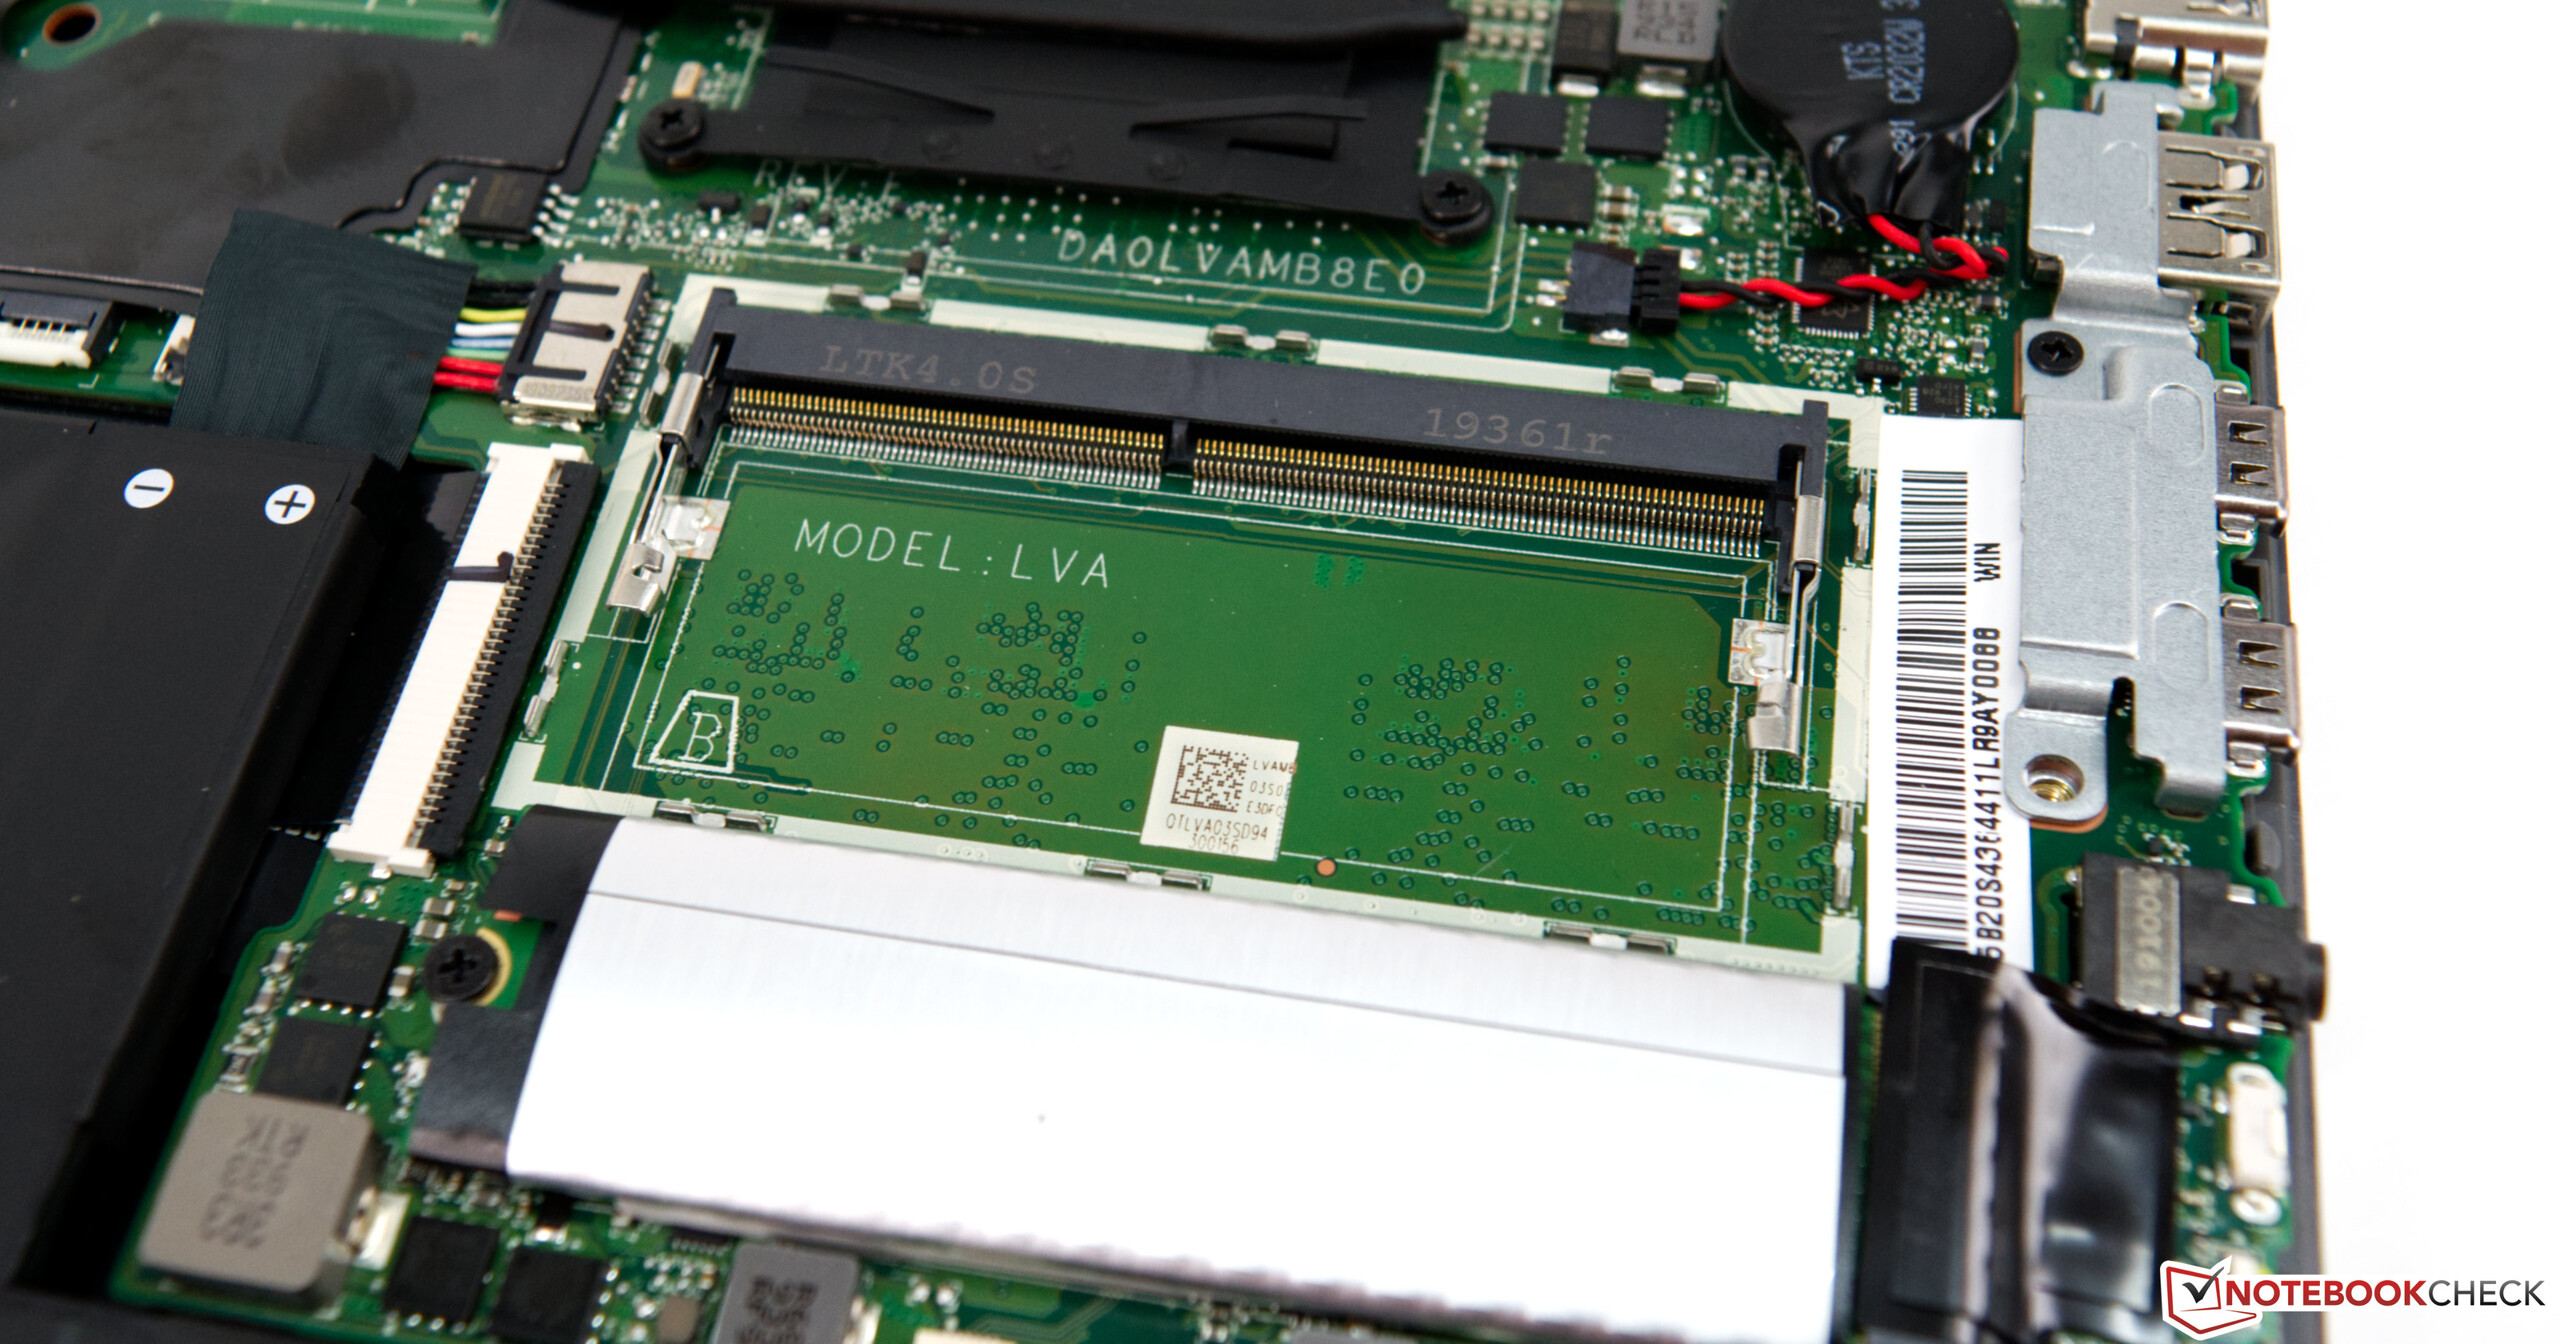
In terms of performance the Lenovo ThinkBook 14 offered an overall good experience. Its Core i5-10210U is a great fit and offers more than enough performance. Its 8 GB of soldered RAM was neither here nor there, and it can be retroactively upgraded by adding a secondary module. Storage space was somewhat limited due to the 256 GB SSD but this, too, can be retroactively upgraded to fit your needs. In other words: You do not need to consider future requirements at the time of purchase just yet and might be able to save quite a bit of money in the long run.
Lenovo’s ThinkBook 14 offers good performance and long battery life at a comparatively low price.
Our biggest point of concern is the display, as it failed to meet its advertised specifications. The differences were much more pronounced than can be expected owing to manufacturing tolerance. We sincerely hope that our review unit was an extreme case with a particularly bad display unit.
Lenovo ThinkBook 14-IML-20RV006TGE
- 03/01/2020 v7 (old)
Sebastian Bade
Price comparison

