Lenovo IdeaPad S340-15 Laptop Review: Cheap Core i7 Ice Lake Comes with a Performance Cost
The budget IdeaPad S340-15 is one of Lenovo's most affordable 15.6-inch laptops in contrast to the mid-range IdeaPad S540 or higher-end IdeaPad S740 or IdeaPad S940. Our test unit here is a higher-end configuration equipped with Intel's latest Core i7-1065G7 Ice Lake CPU, 1080p IPS display, 512 GB SSD, and 8 GB of DDR4 RAM for only about $700 to $800 USD retail. Cheaper SKUs exist with the older Core i3-8145U CPU, 768p TN display, 128 GB SSD, and just 4 GB of RAM for under $400.
Direct competitors to the IdeaPad S340-15 include other budget 15.6-inch multimedia laptops like the Asus VivoBook S15, HP Pavilion 15, Acer Aspire series, and the Dell Inspiron 15. Since the 15.6-inch IdeaPad S340-15 shares physical features with the 14-inch IdeaPad S340-14 and 15.6-inch IdeaPad S540-15, we recommend checking out our review on the 14-inch model as many of our existing comments will apply here as well.
More Lenovo reviews:
Rating | Date | Model | Weight | Height | Size | Resolution | Price |
|---|---|---|---|---|---|---|---|
| 79.4 % v7 (old) | 03 / 2020 | Lenovo Ideapad S340-15IIL i7-1065G7, Iris Plus Graphics G7 (Ice Lake 64 EU) | 1.8 kg | 17.9 mm | 15.60" | 1920x1080 | |
| 86.3 % v7 (old) | 09 / 2019 | Dell XPS 15 7590 i5 iGPU FHD i5-9300H, UHD Graphics 630 | 1.9 kg | 17 mm | 15.60" | 1920x1080 | |
| 83 % v6 (old) | 04 / 2019 | HP Pavilion 15-cs2019ng i5-8265U, GeForce MX250 | 1.9 kg | 18 mm | 15.60" | 1920x1080 | |
| 80.7 % v6 (old) | 05 / 2018 | Asus VivoBook 15 X542UF-DM143T i5-8250U, GeForce MX130 | 2.3 kg | 23 mm | 15.60" | 1920x1080 | |
| 84.1 % v6 (old) | 06 / 2019 | Lenovo Yoga 530-14ARR-81H9000VGE R7 2700U, Vega 10 | 1.7 kg | 17.6 mm | 14.00" | 1920x1080 |
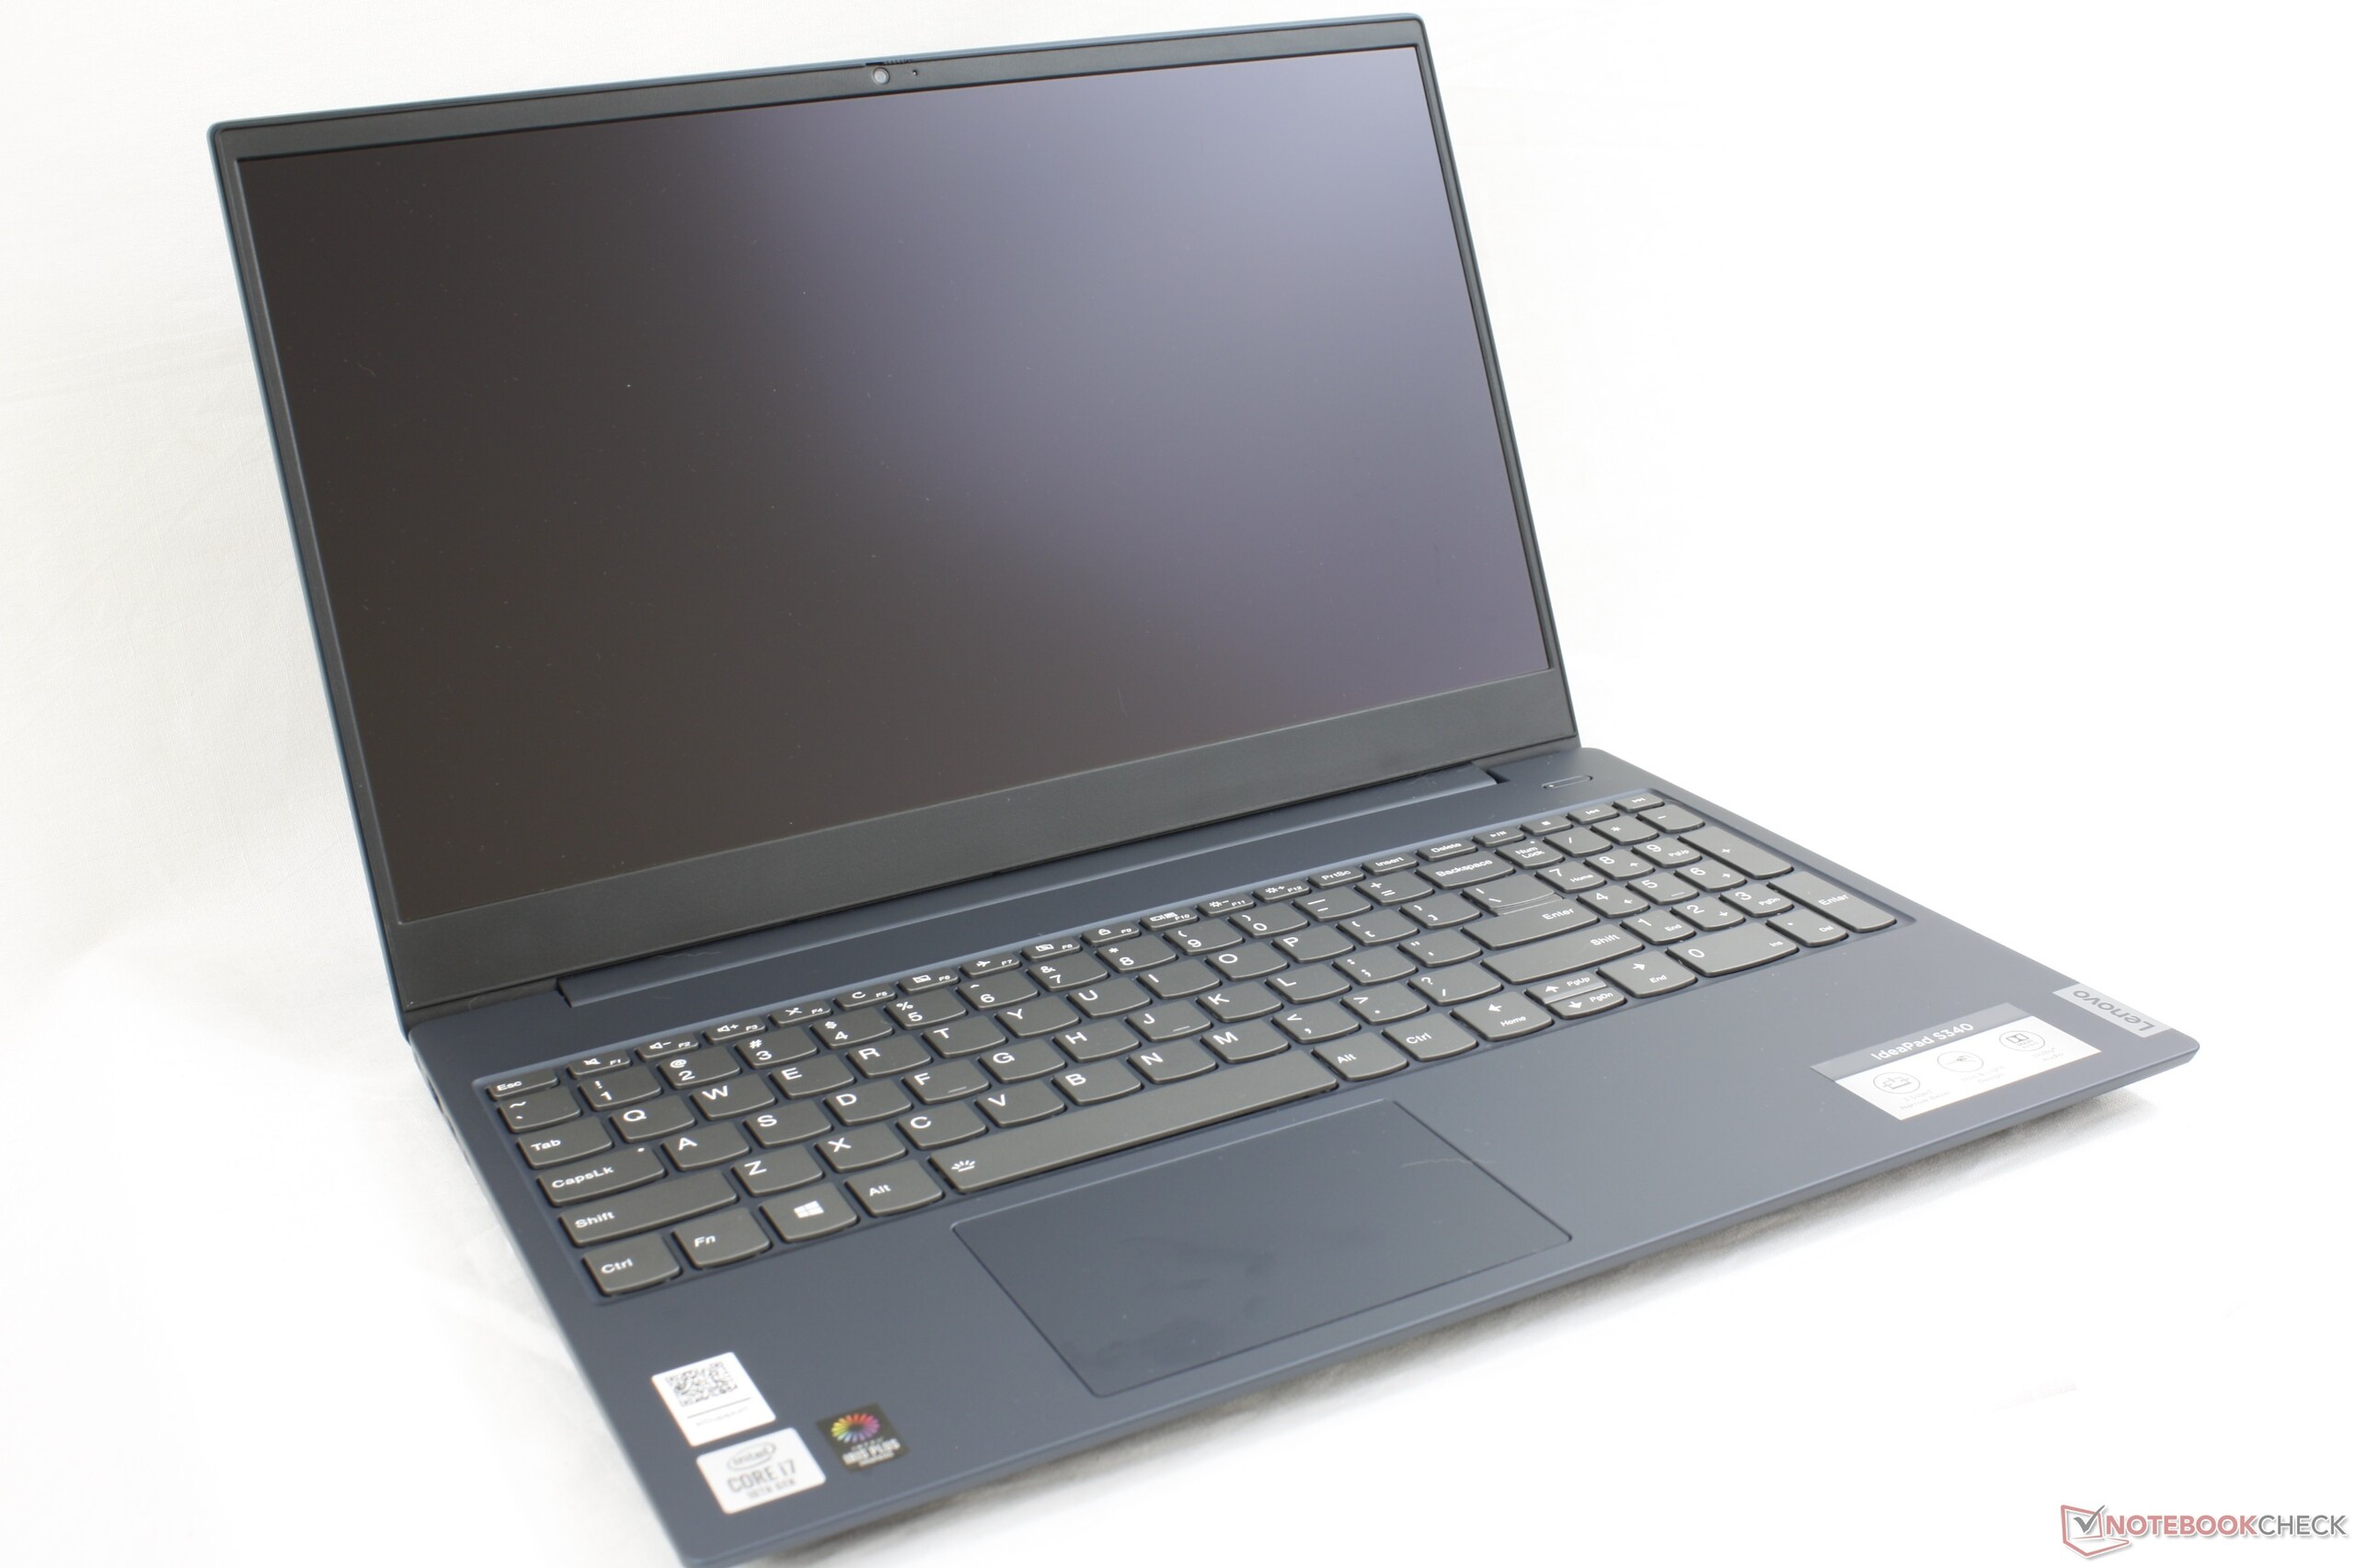
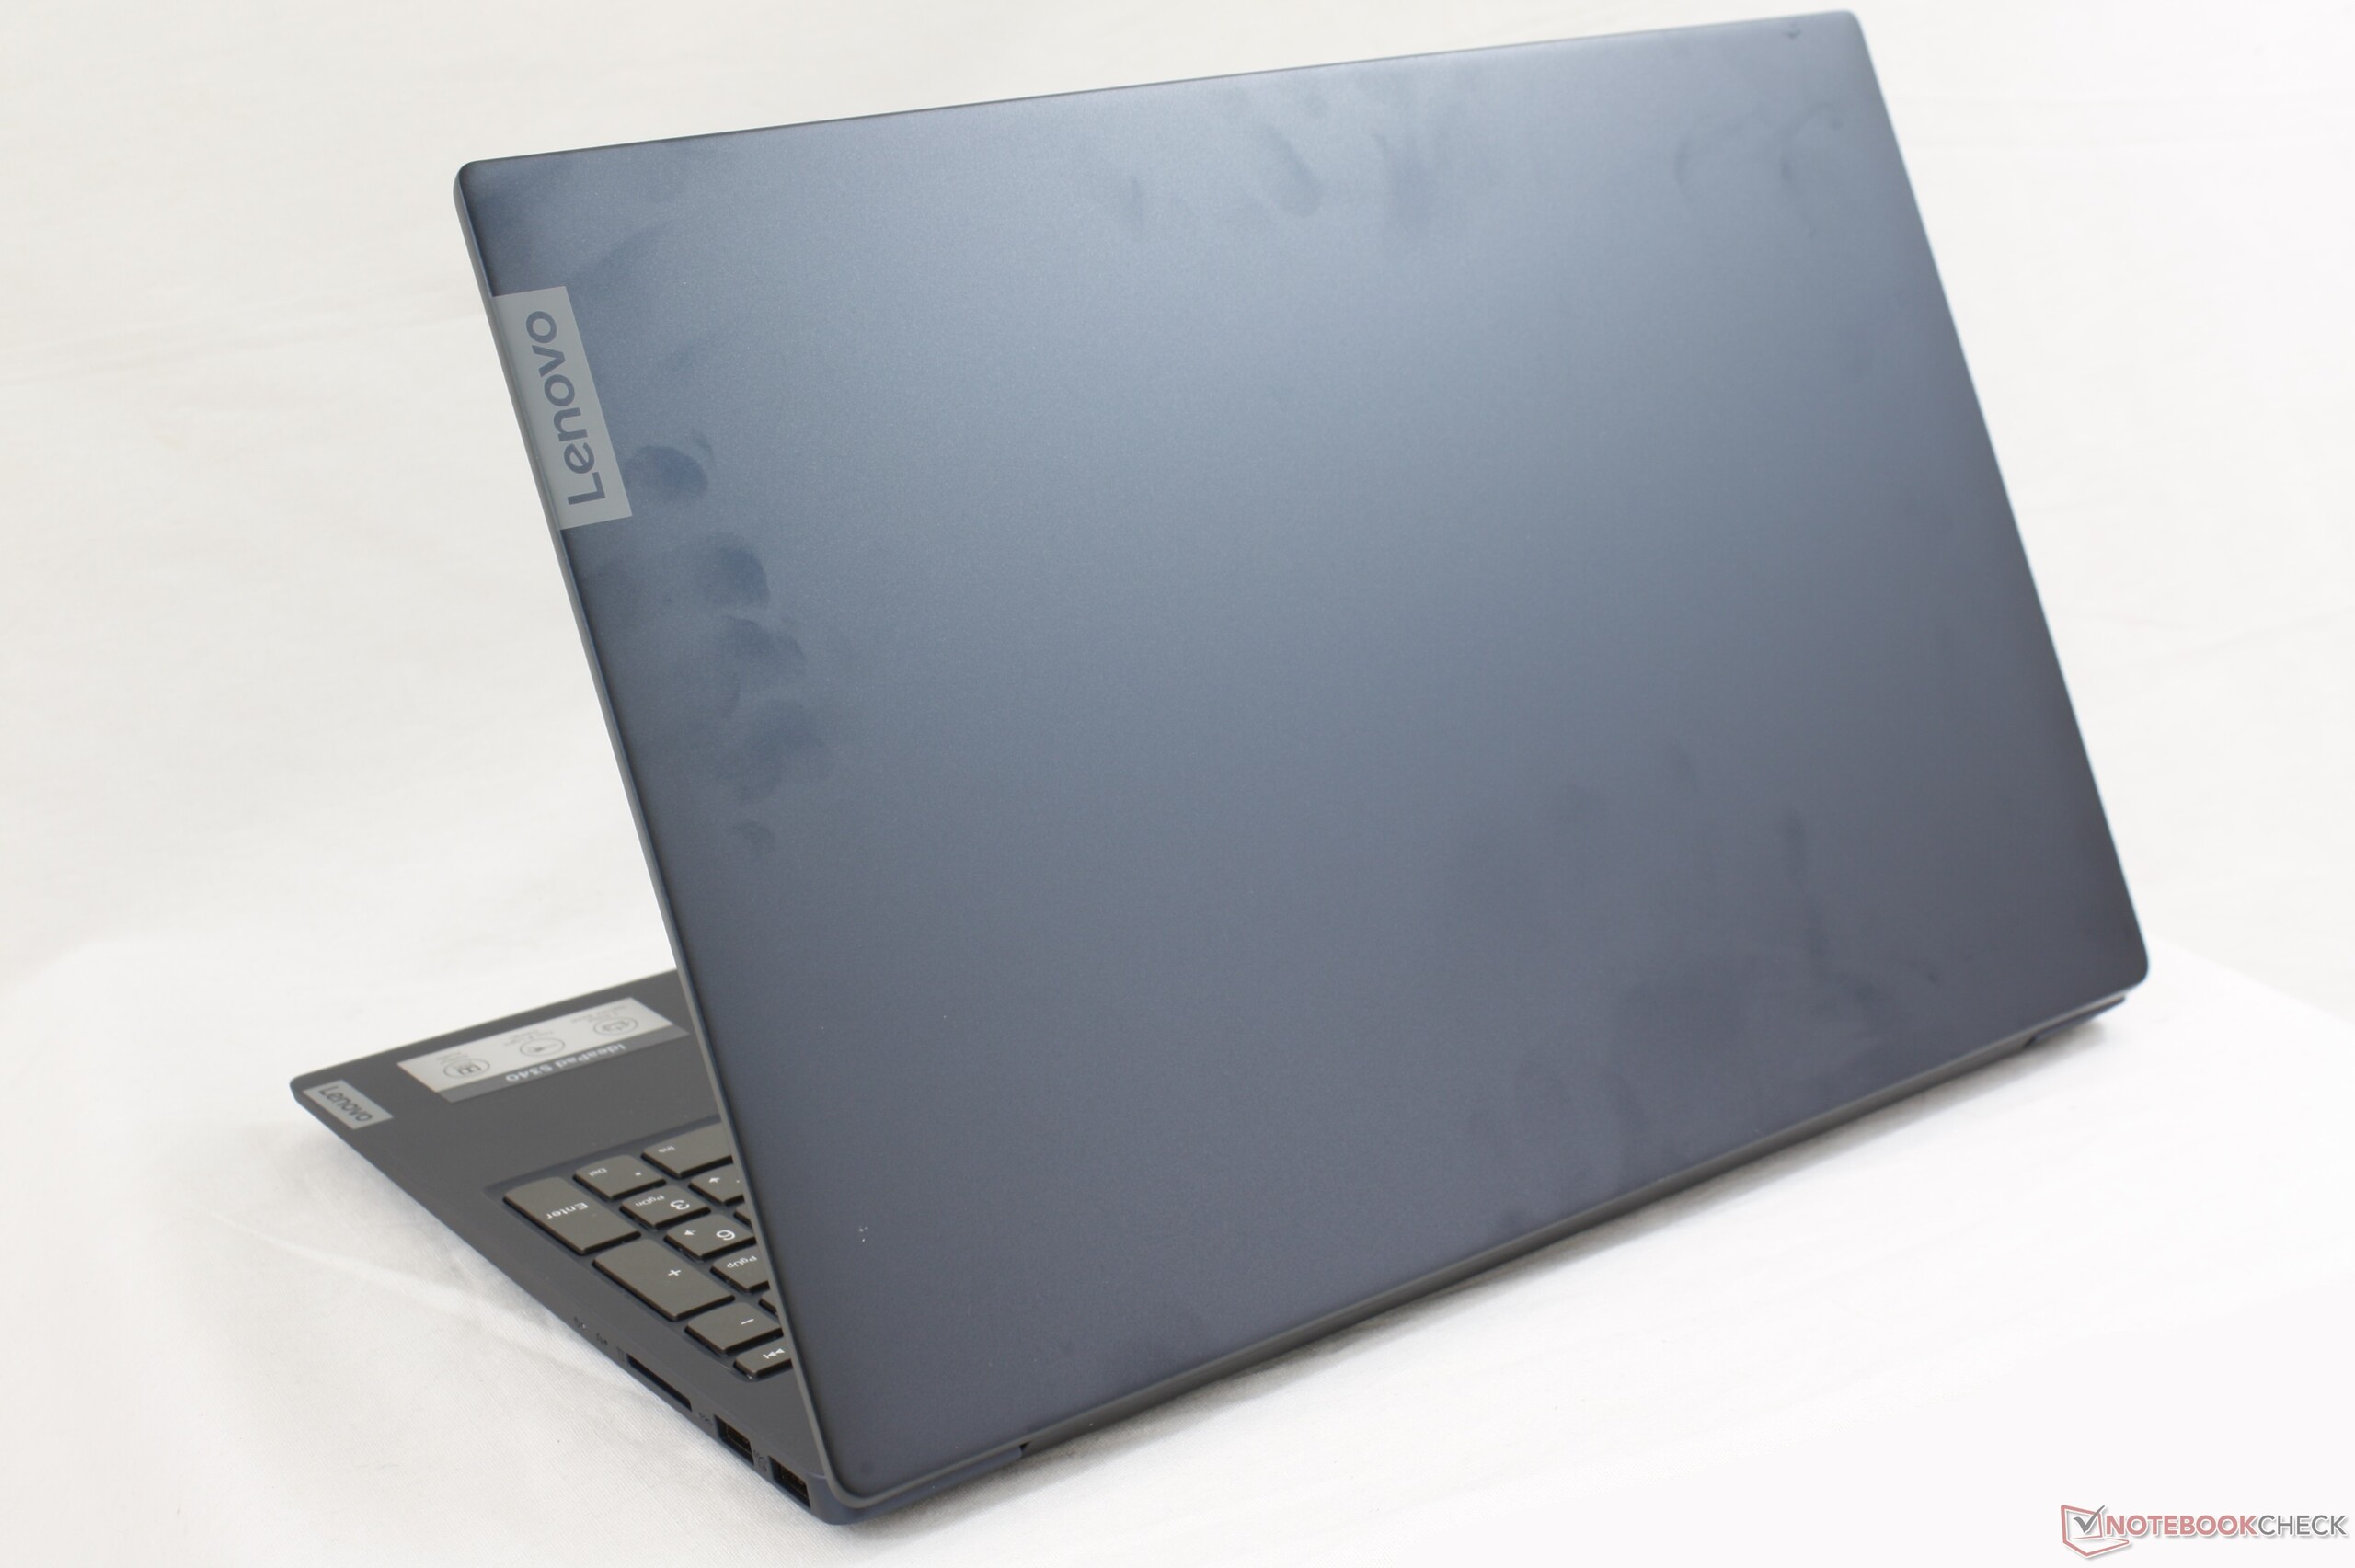
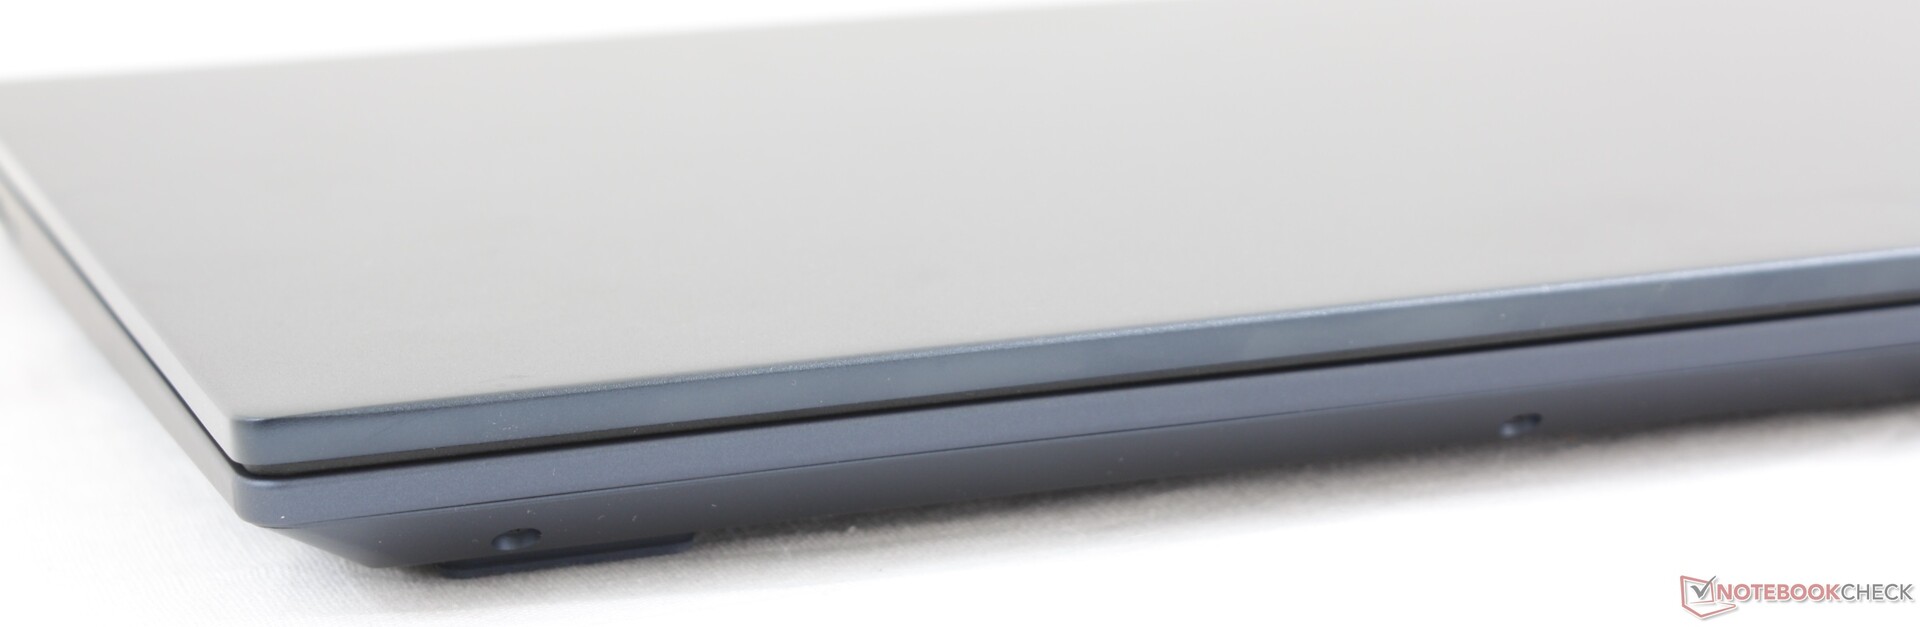
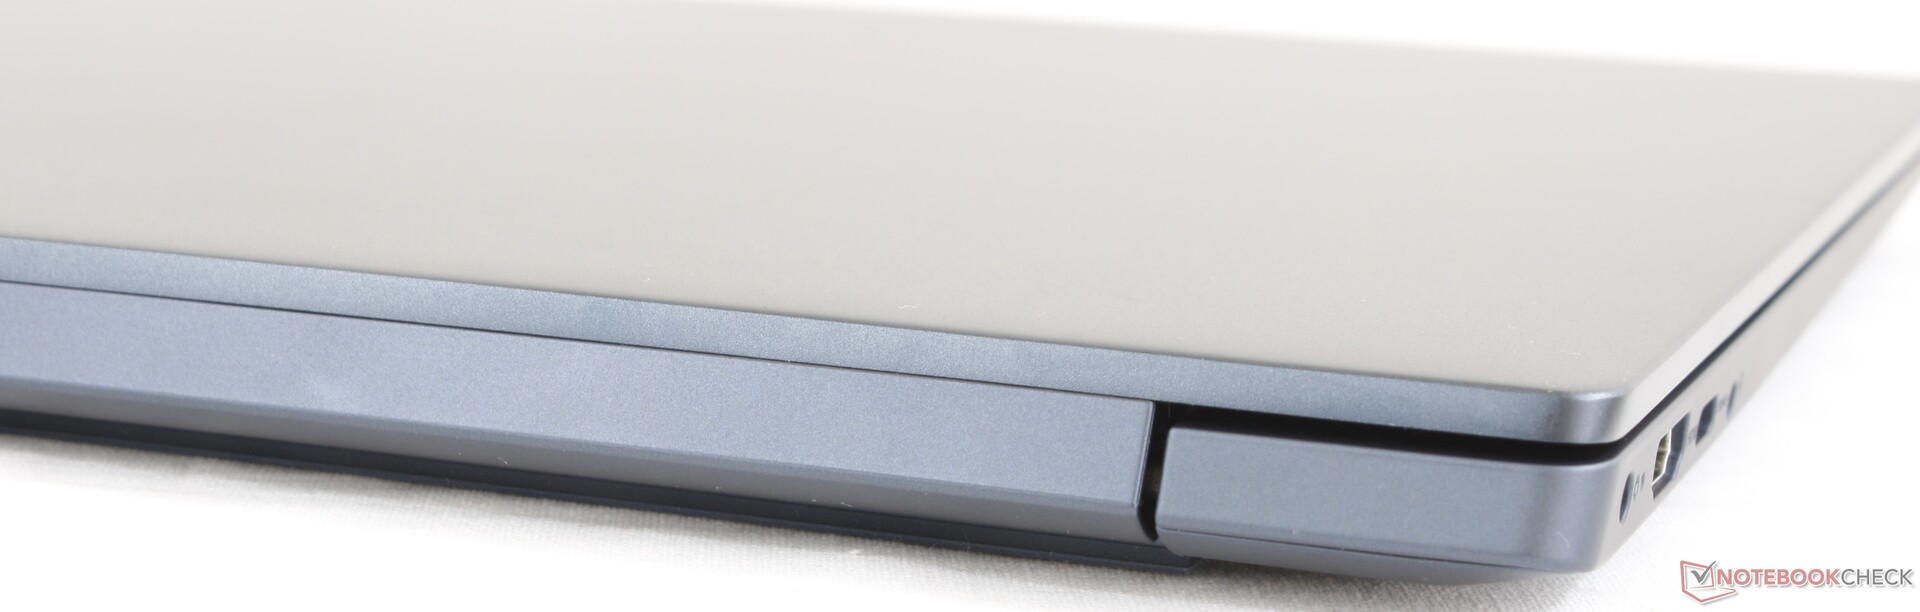
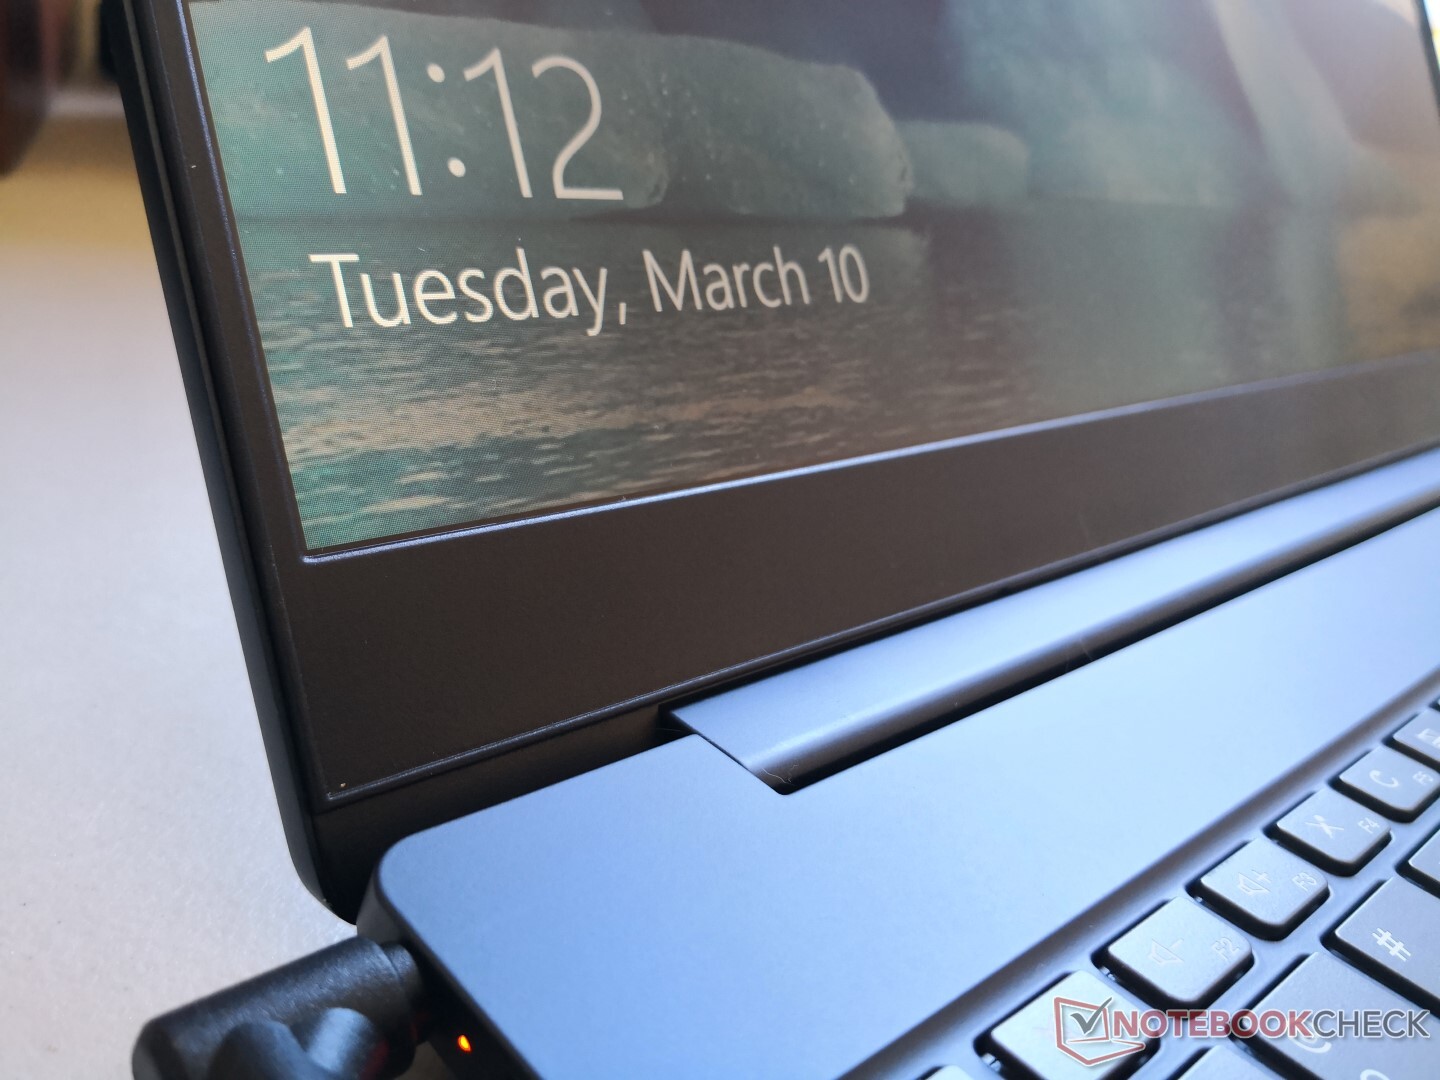
Case
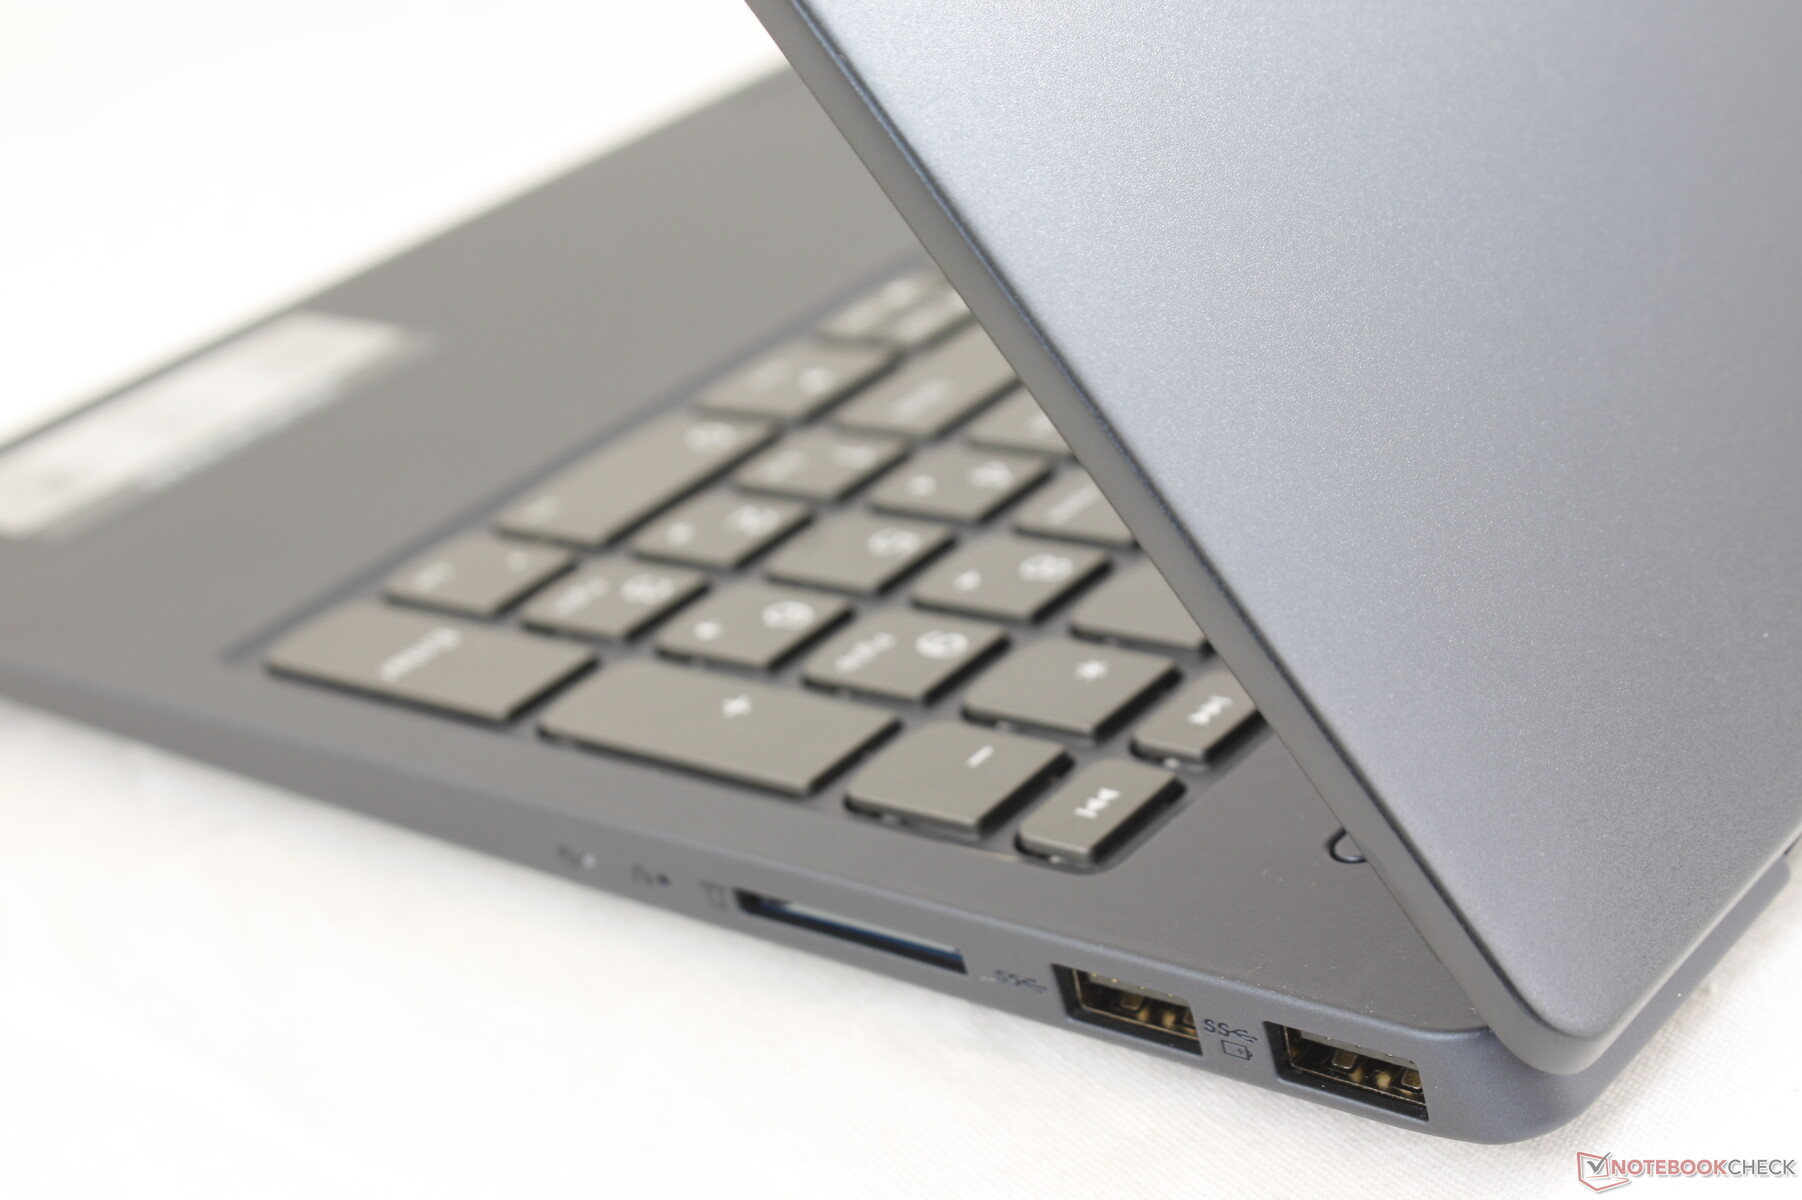
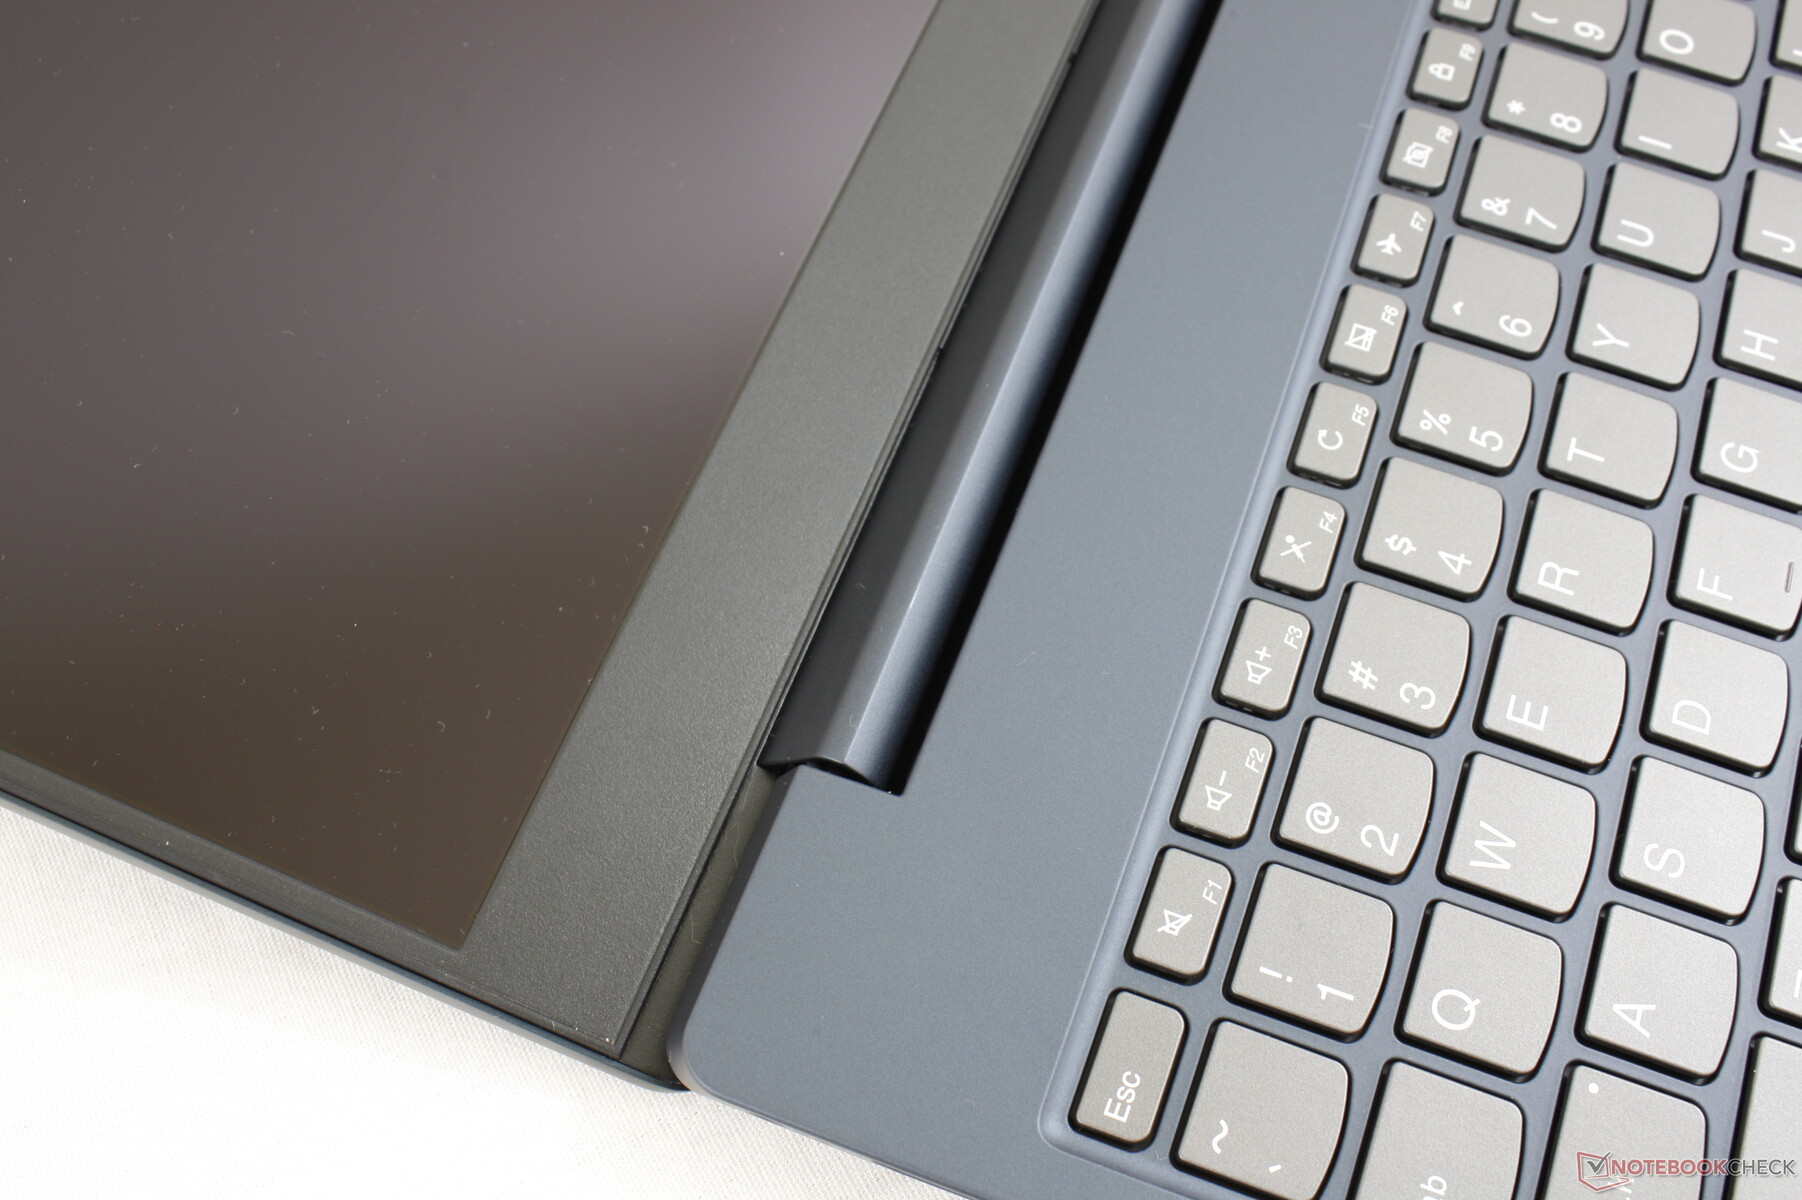
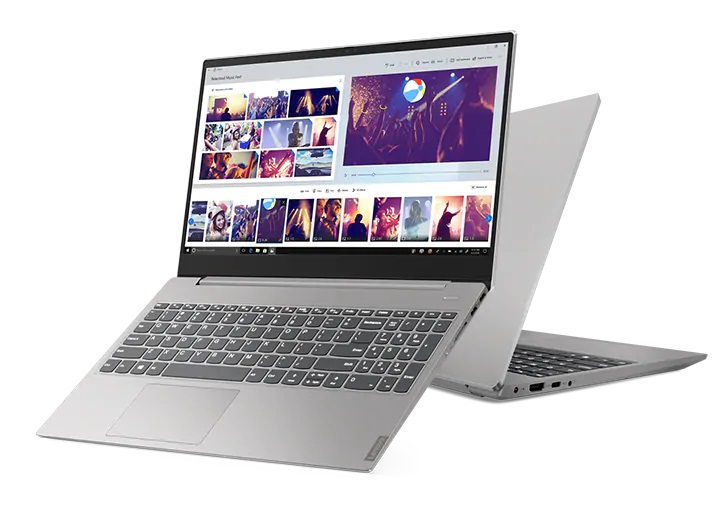
The chassis is visually identical to the IdeaPad S540-15 save for a slight change in thickness. It is primarily aluminum on the outer lid with a slightly rubberized plastic keyboard deck to save on costs in contrast to the almost all-aluminum Yoga S900 series. For a budget laptop, however, the S340 feels smoother and sleeker than say the Dell Inspiron 15 or the overly plastic Asus VivoBook S15 series. Surfaces still warp and creak more than on the Yoga C940 or XPS 15 as one would expect given the price difference.
Dimensions and weight are close to the HP Pavilion 15, Asus VivoBook S15, Dell Inspiron 15, and Lenovo's own IdeaPad S540-15. Thus, you should be more concerned about differences in performance and build quality rather than size and weight if choosing between these budget laptops. If you're upgrading from an older laptop, then the new narrow bezel designs of most newer laptops will help with portability.
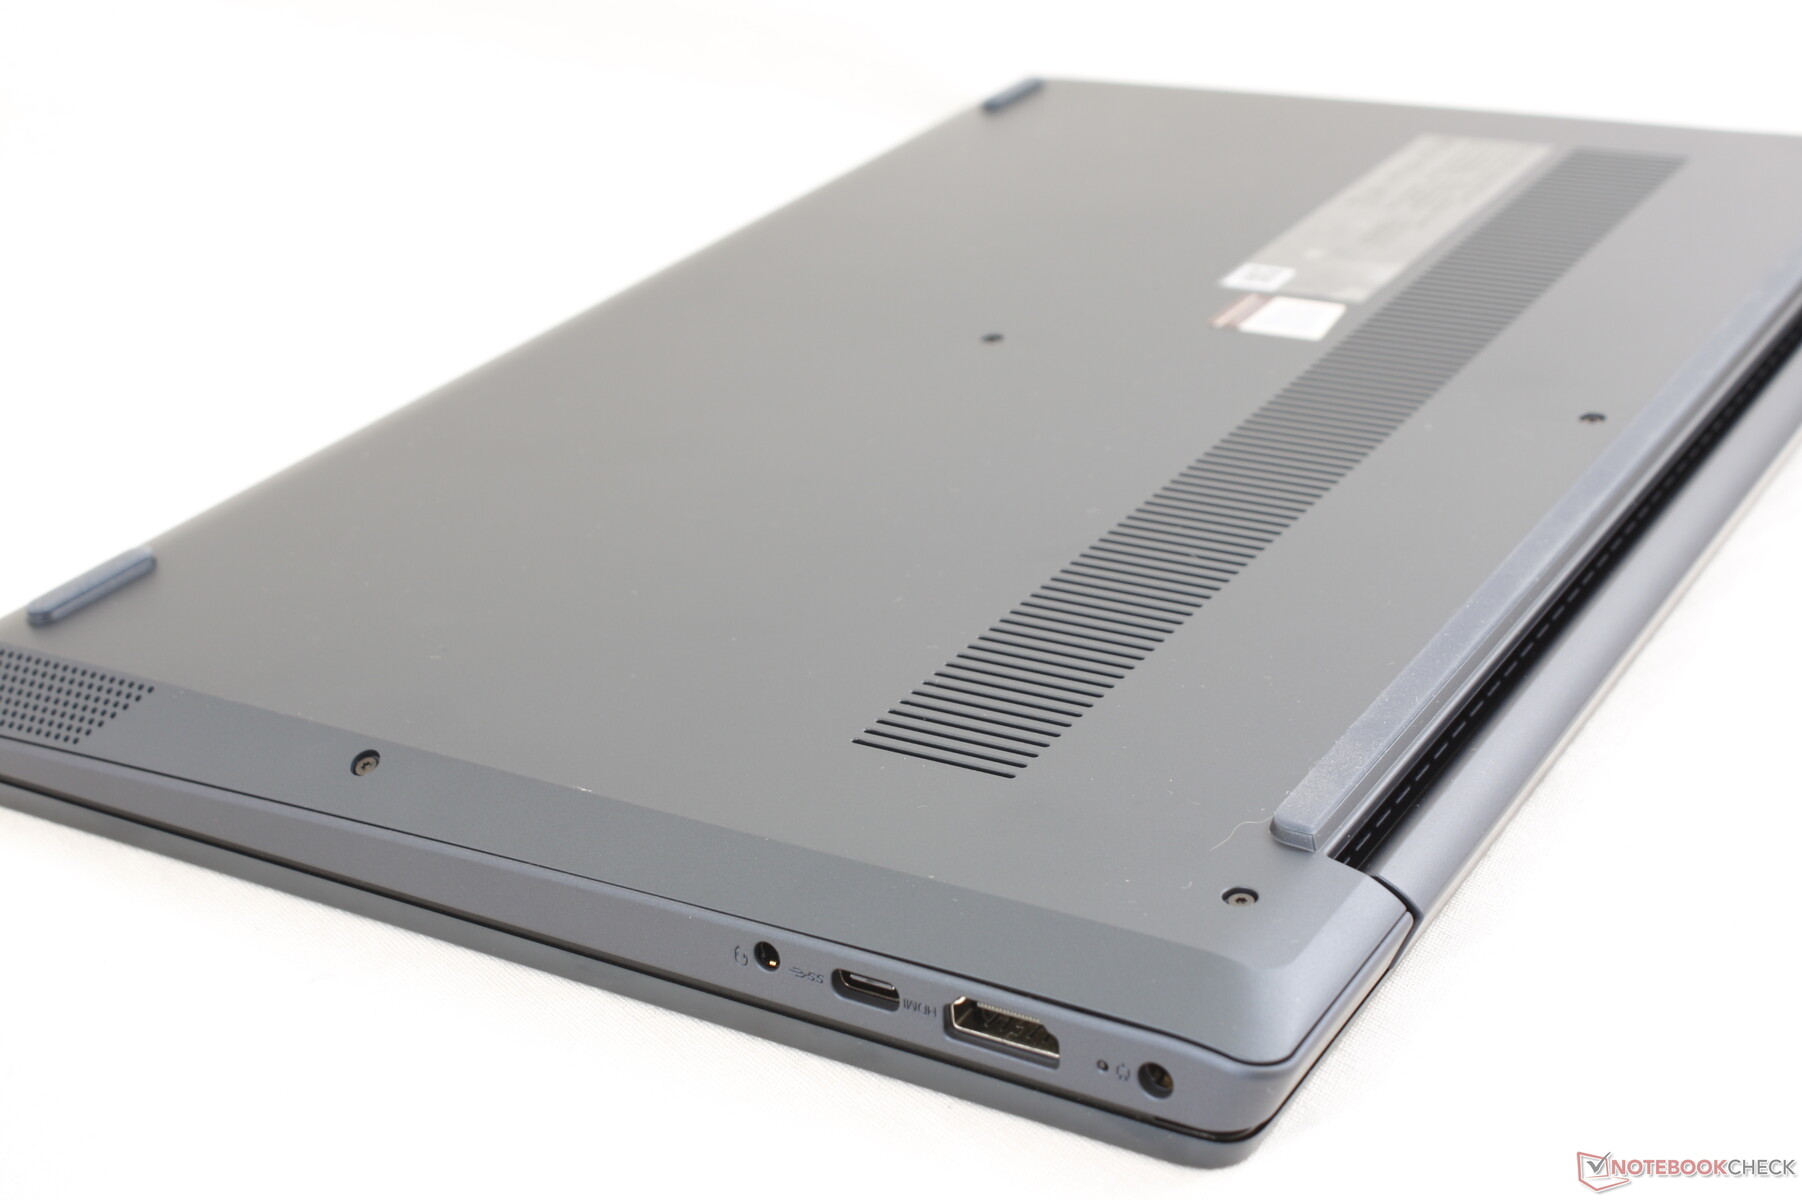
Connectivity
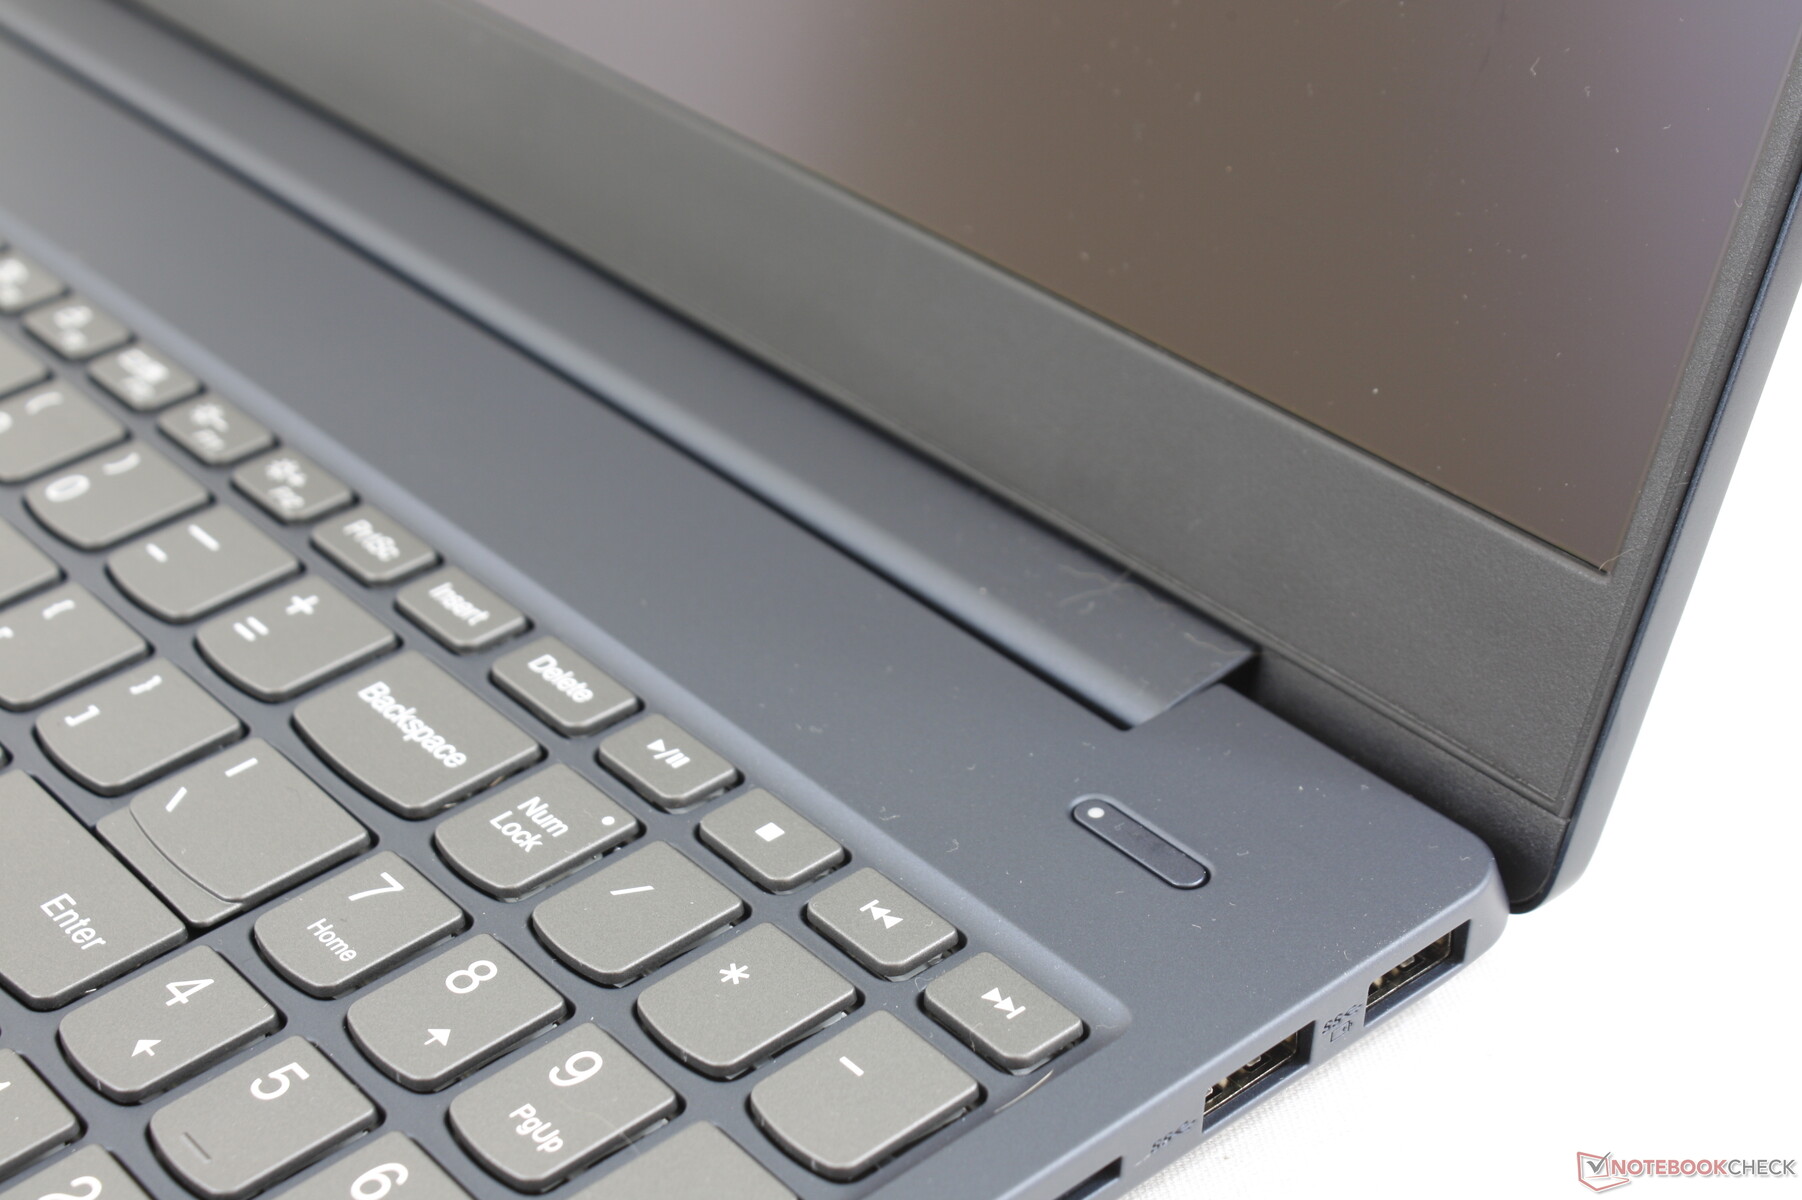
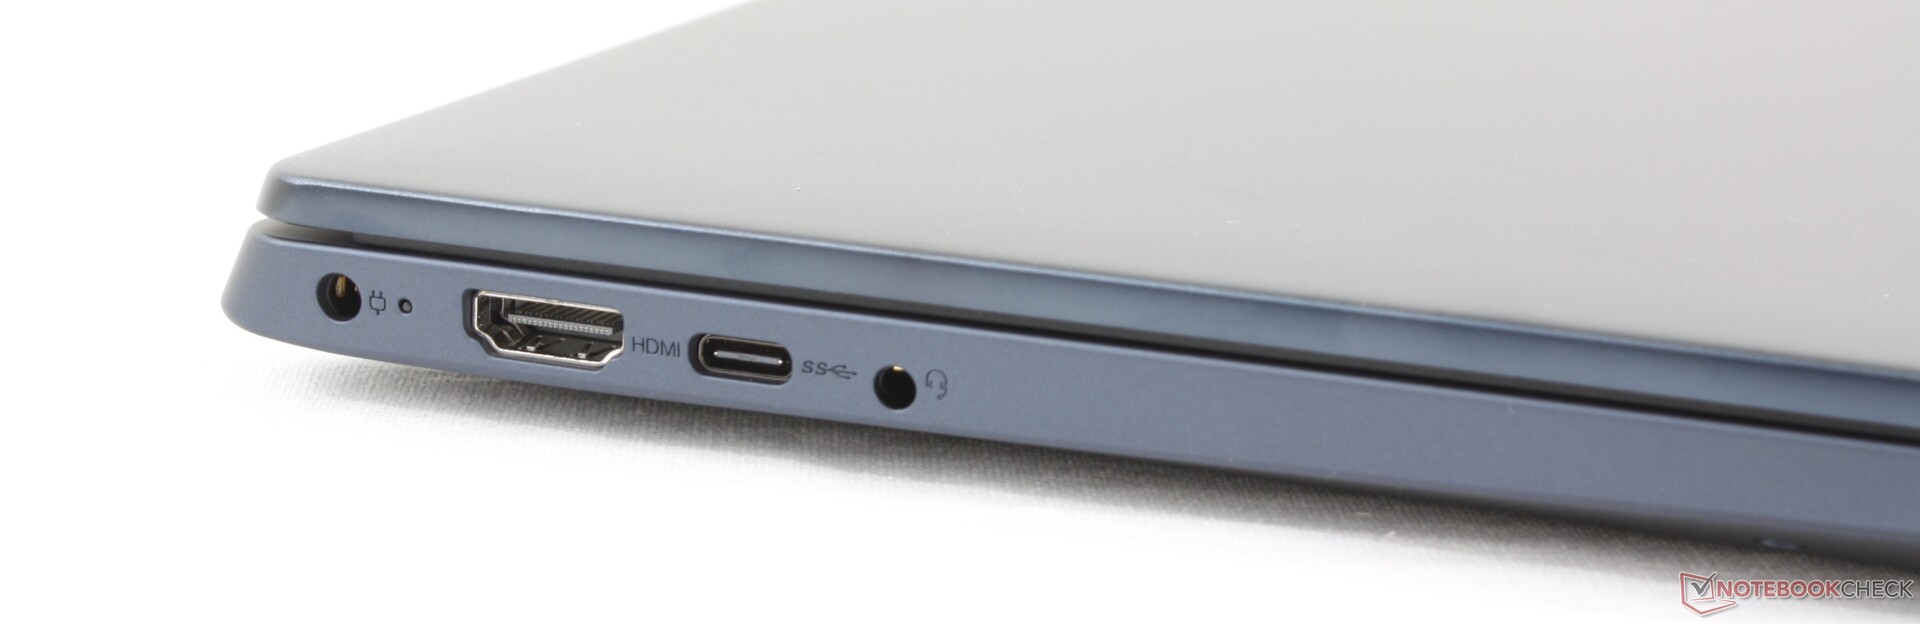
Most of the expected ports are here including USB Type-C, USB Type-A, and HDMI. Port positioning is excellent save for the tightly-packed HDMI port squished in between the AC adapter port and USB Type-C port.
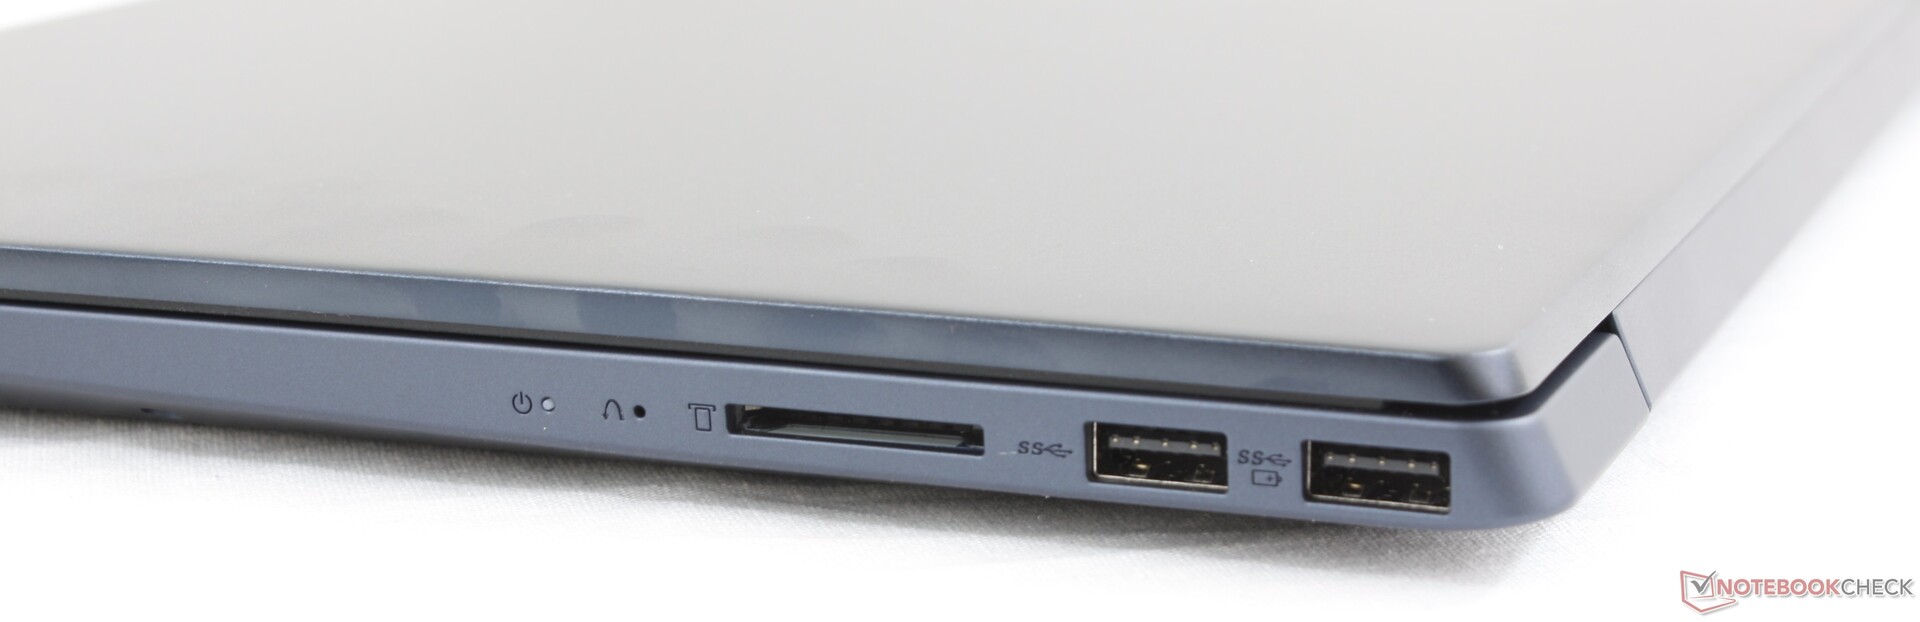
SD Card Reader
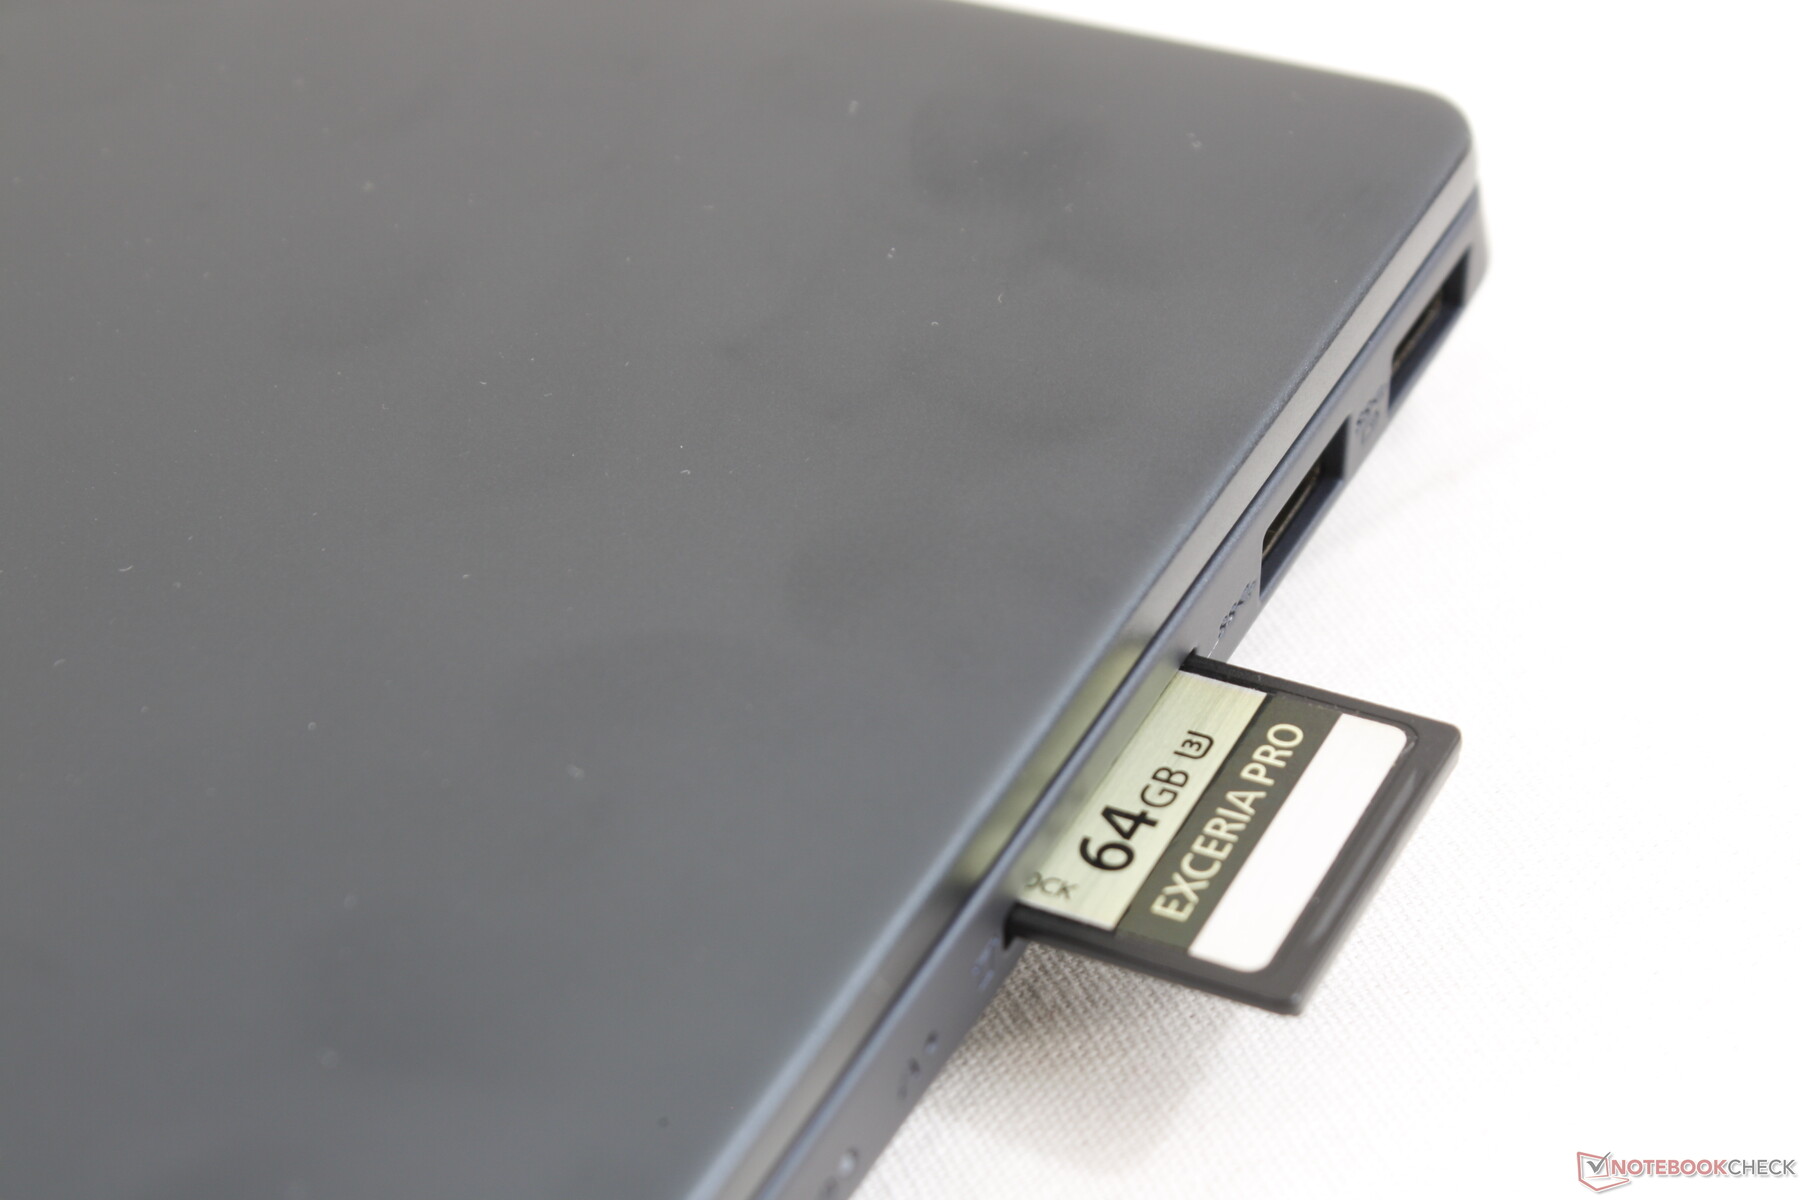
Transfer rates from the integrated SD card reader are nearly identical to what we recorded on the IdeaPad S540. Moving 1 GB of images from our UHS-II test card to desktop takes about 14 seconds compared to half that on the Dell XPS 15.
A fully inserted SD card still protrudes by over half its length to be unsafe for carrying. In comparison, inserted SD cards on other laptops like the ThinkPad T490 sit almost flush against the edge.
| SD Card Reader | |
| average JPG Copy Test (av. of 3 runs) | |
| Dell XPS 15 7590 i5 iGPU FHD (Toshiba Exceria Pro SDXC 64 GB UHS-II) | |
| Lenovo Ideapad S540-15IML (Toshiba Exceria Pro SDXC 64 GB UHS-II) | |
| Lenovo Ideapad S340-15IIL (Toshiba Exceria Pro SDXC 64 GB UHS-II) | |
| Dell Inspiron 15 5000 5585 (Toshiba Exceria Pro SDXC 64 GB UHS-II) | |
| maximum AS SSD Seq Read Test (1GB) | |
| Dell XPS 15 7590 i5 iGPU FHD (Toshiba Exceria Pro SDXC 64 GB UHS-II) | |
| Lenovo Ideapad S340-15IIL (Toshiba Exceria Pro SDXC 64 GB UHS-II) | |
| Lenovo Ideapad S540-15IML (Toshiba Exceria Pro SDXC 64 GB UHS-II) | |
| Dell Inspiron 15 5000 5585 (Toshiba Exceria Pro SDXC 64 GB UHS-II) | |
Communication
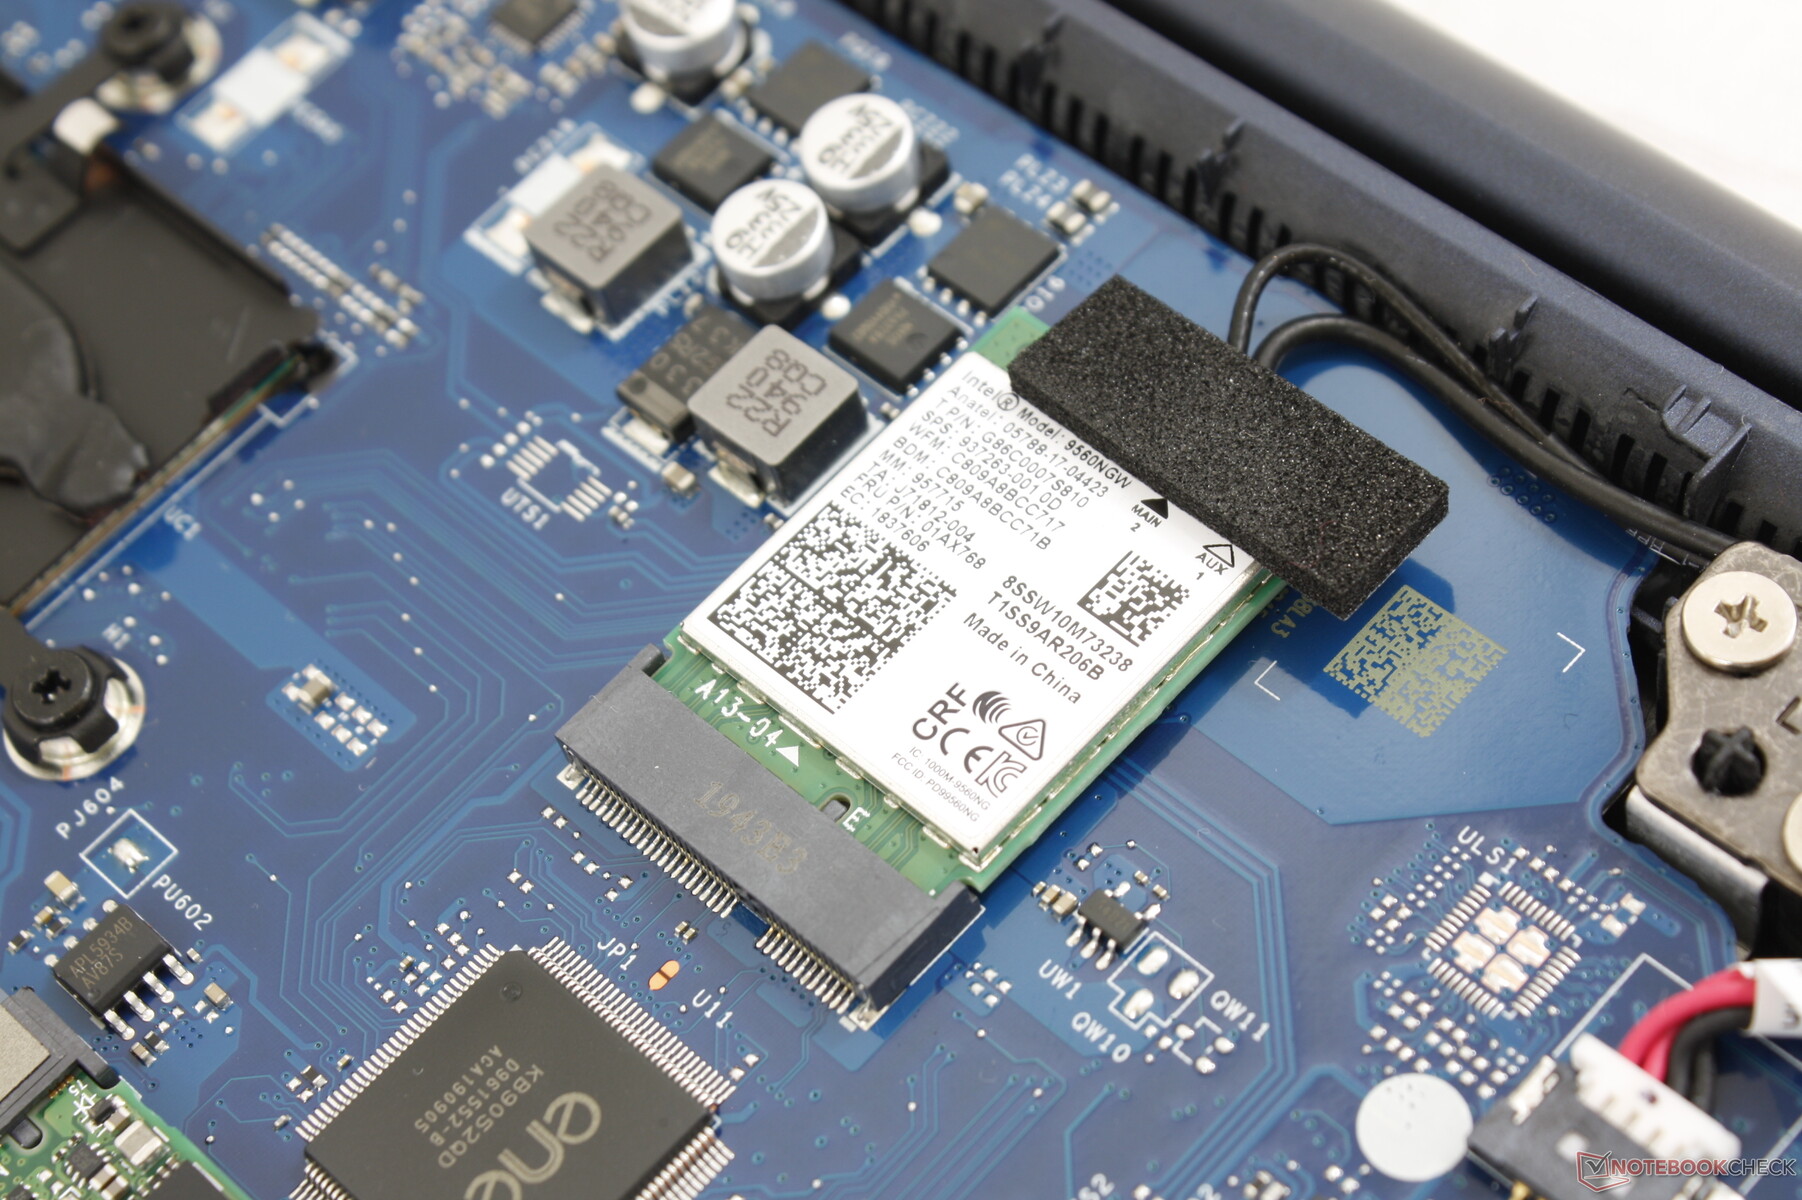
Wireless is provided by an Intel 9560 for Wi-Fi 5 or 802.11ac speeds. We're able to record real-world average transfer rates of approximately 1200 Mbps when standing 1 meter away from our Wi-Fi 6-enabled Netgear RAX200 router. We did not experience any connectivity issues during our time with the test unit.
| Networking | |
| iperf3 transmit AX12 | |
| Lenovo ThinkPad T490 20RY0002US | |
| Lenovo Yoga C740-14IML | |
| Lenovo Ideapad S340-15IIL | |
| Alienware m17 R2 P41E | |
| iperf3 receive AX12 | |
| Lenovo ThinkPad T490 20RY0002US | |
| Lenovo Ideapad S340-15IIL | |
| Lenovo Yoga C740-14IML | |
| Alienware m17 R2 P41E | |
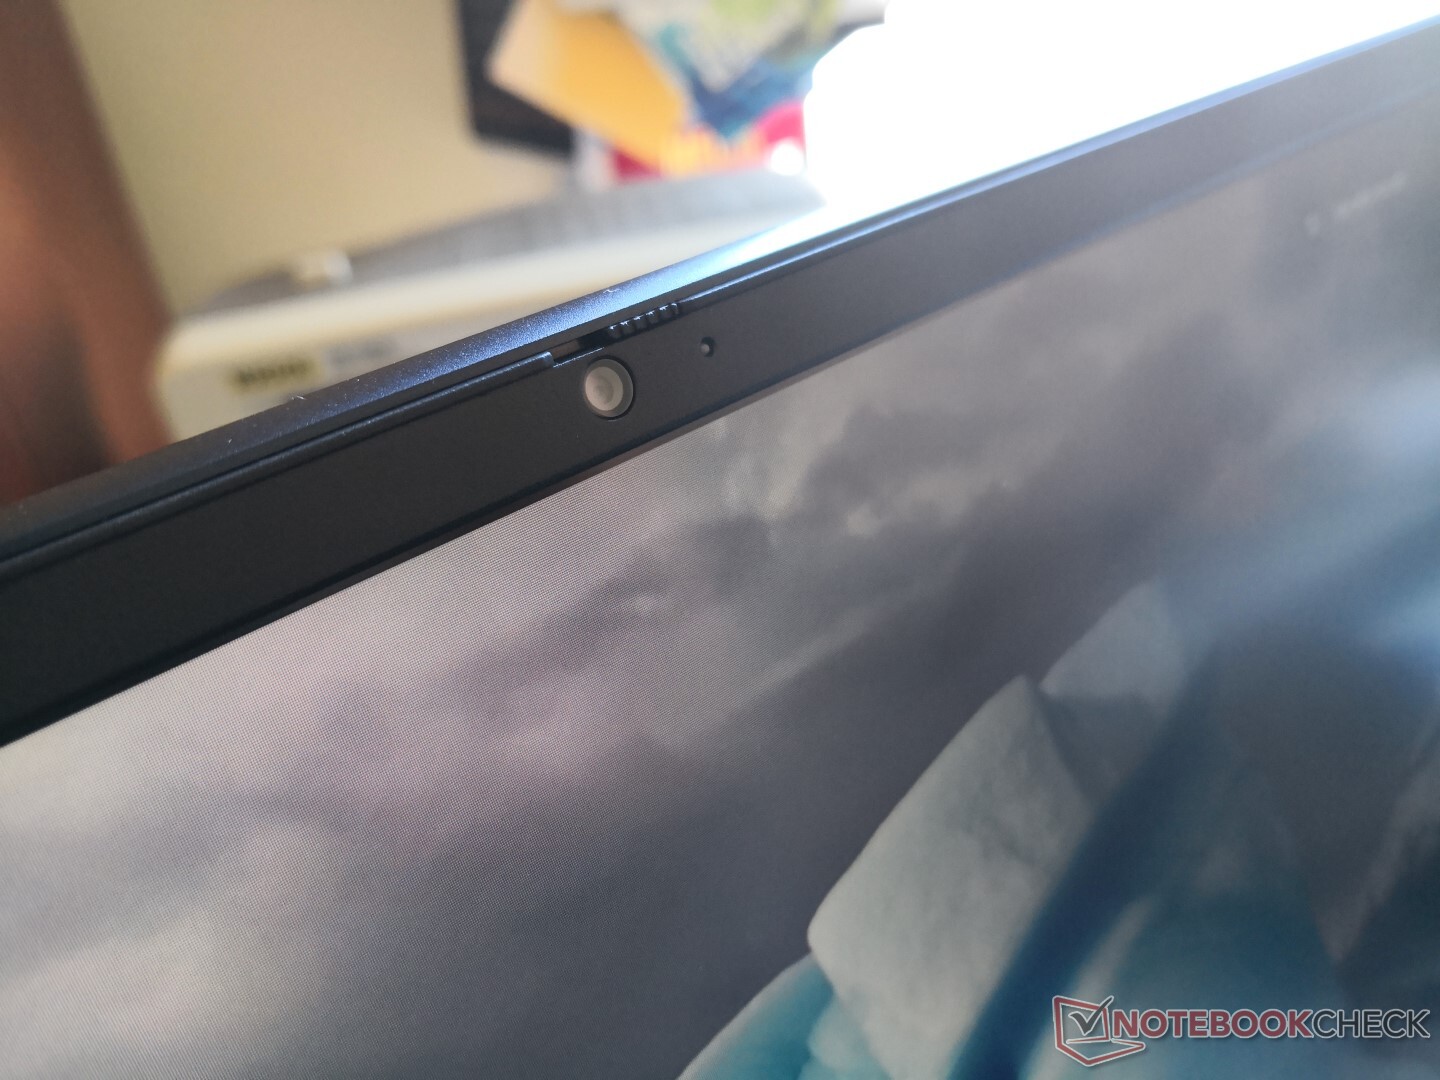
Webcam

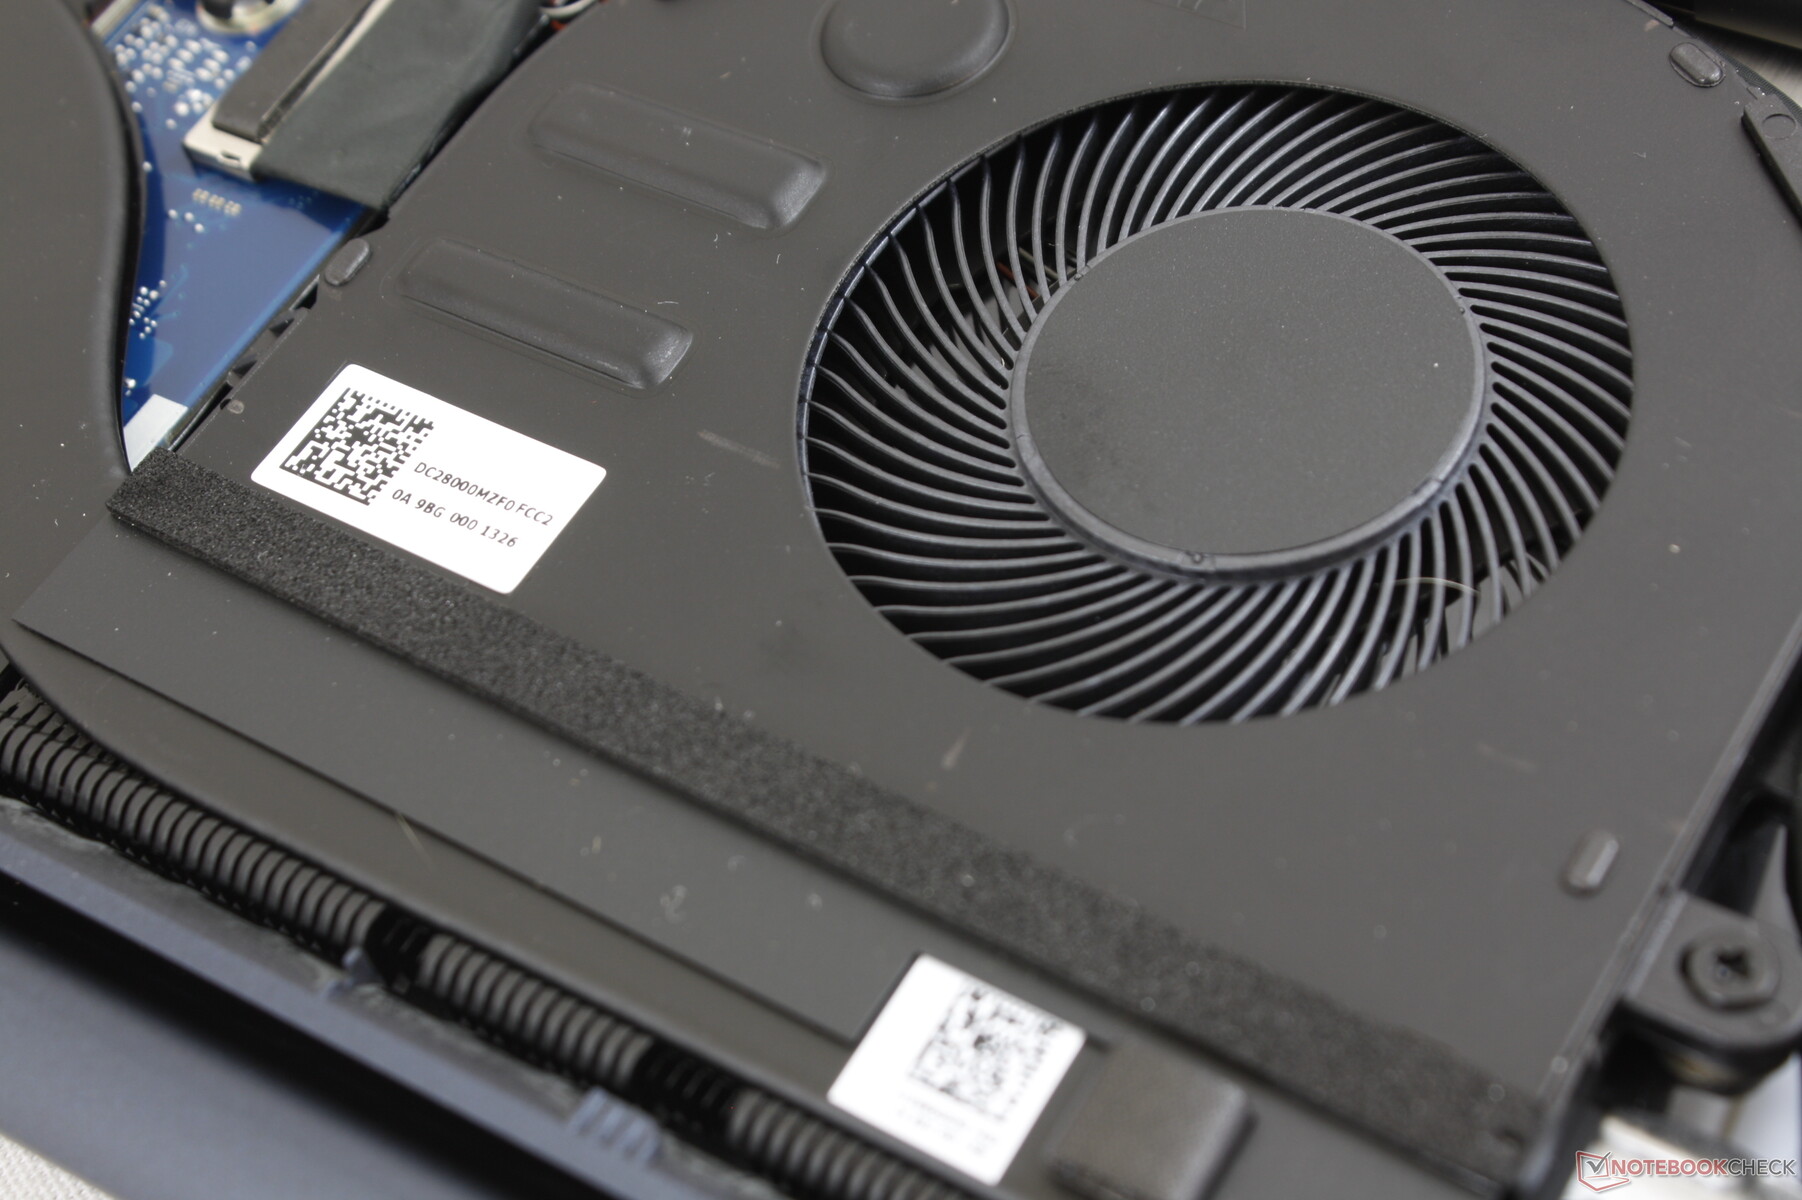
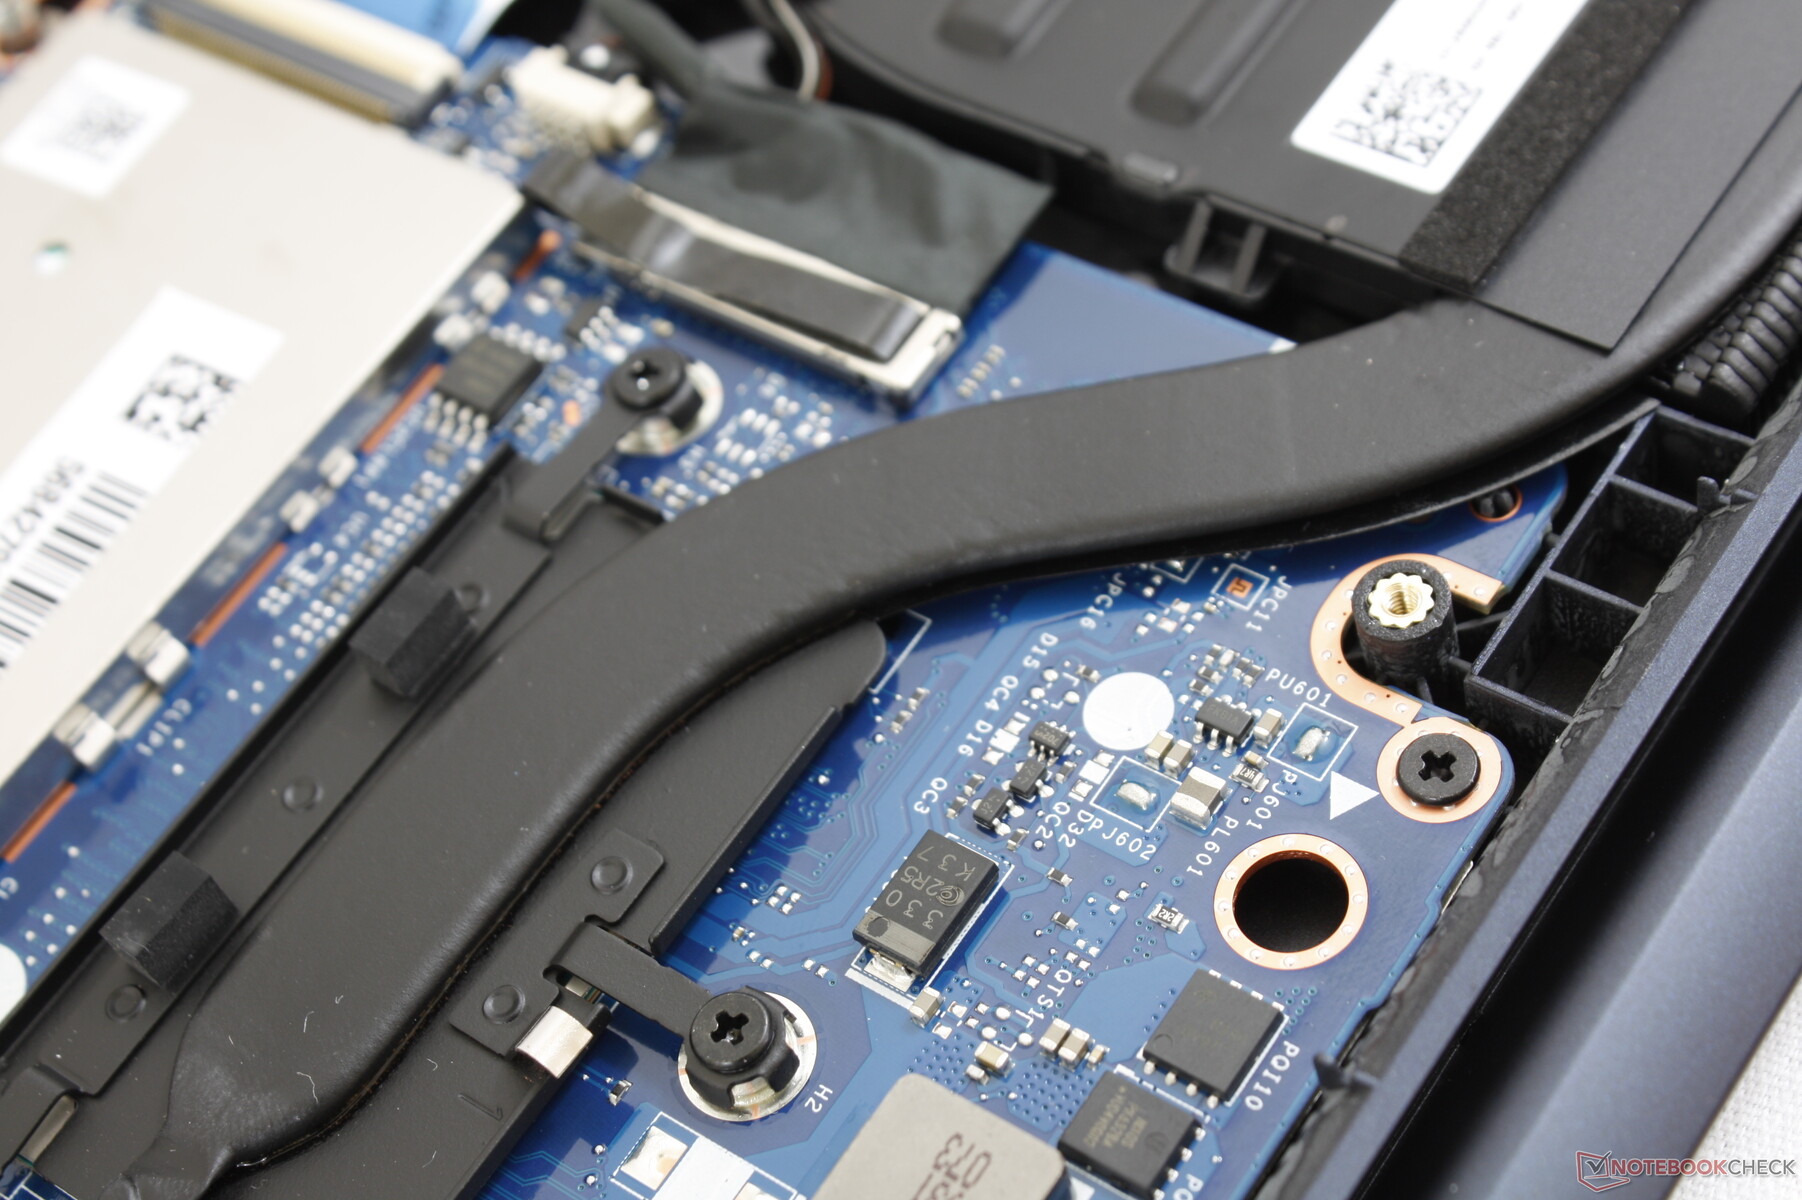
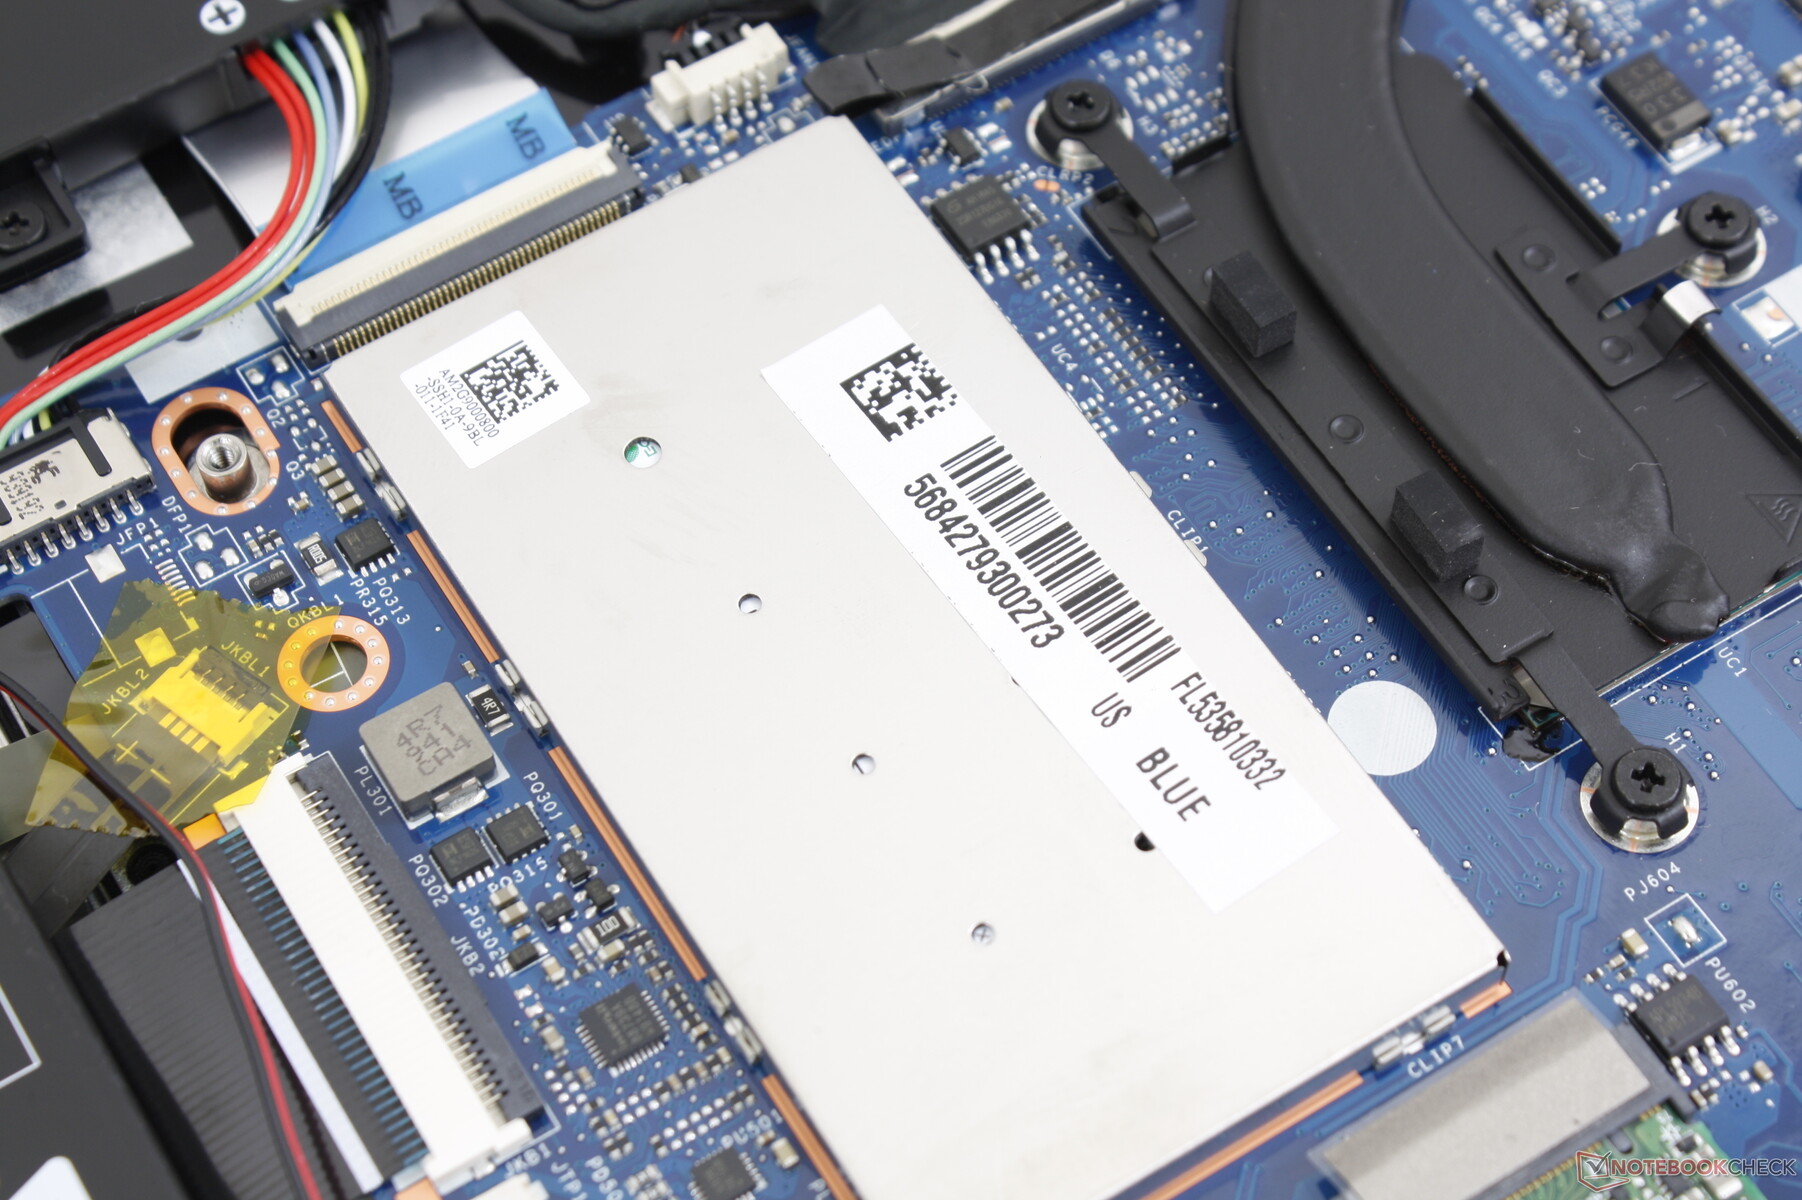
Maintenance
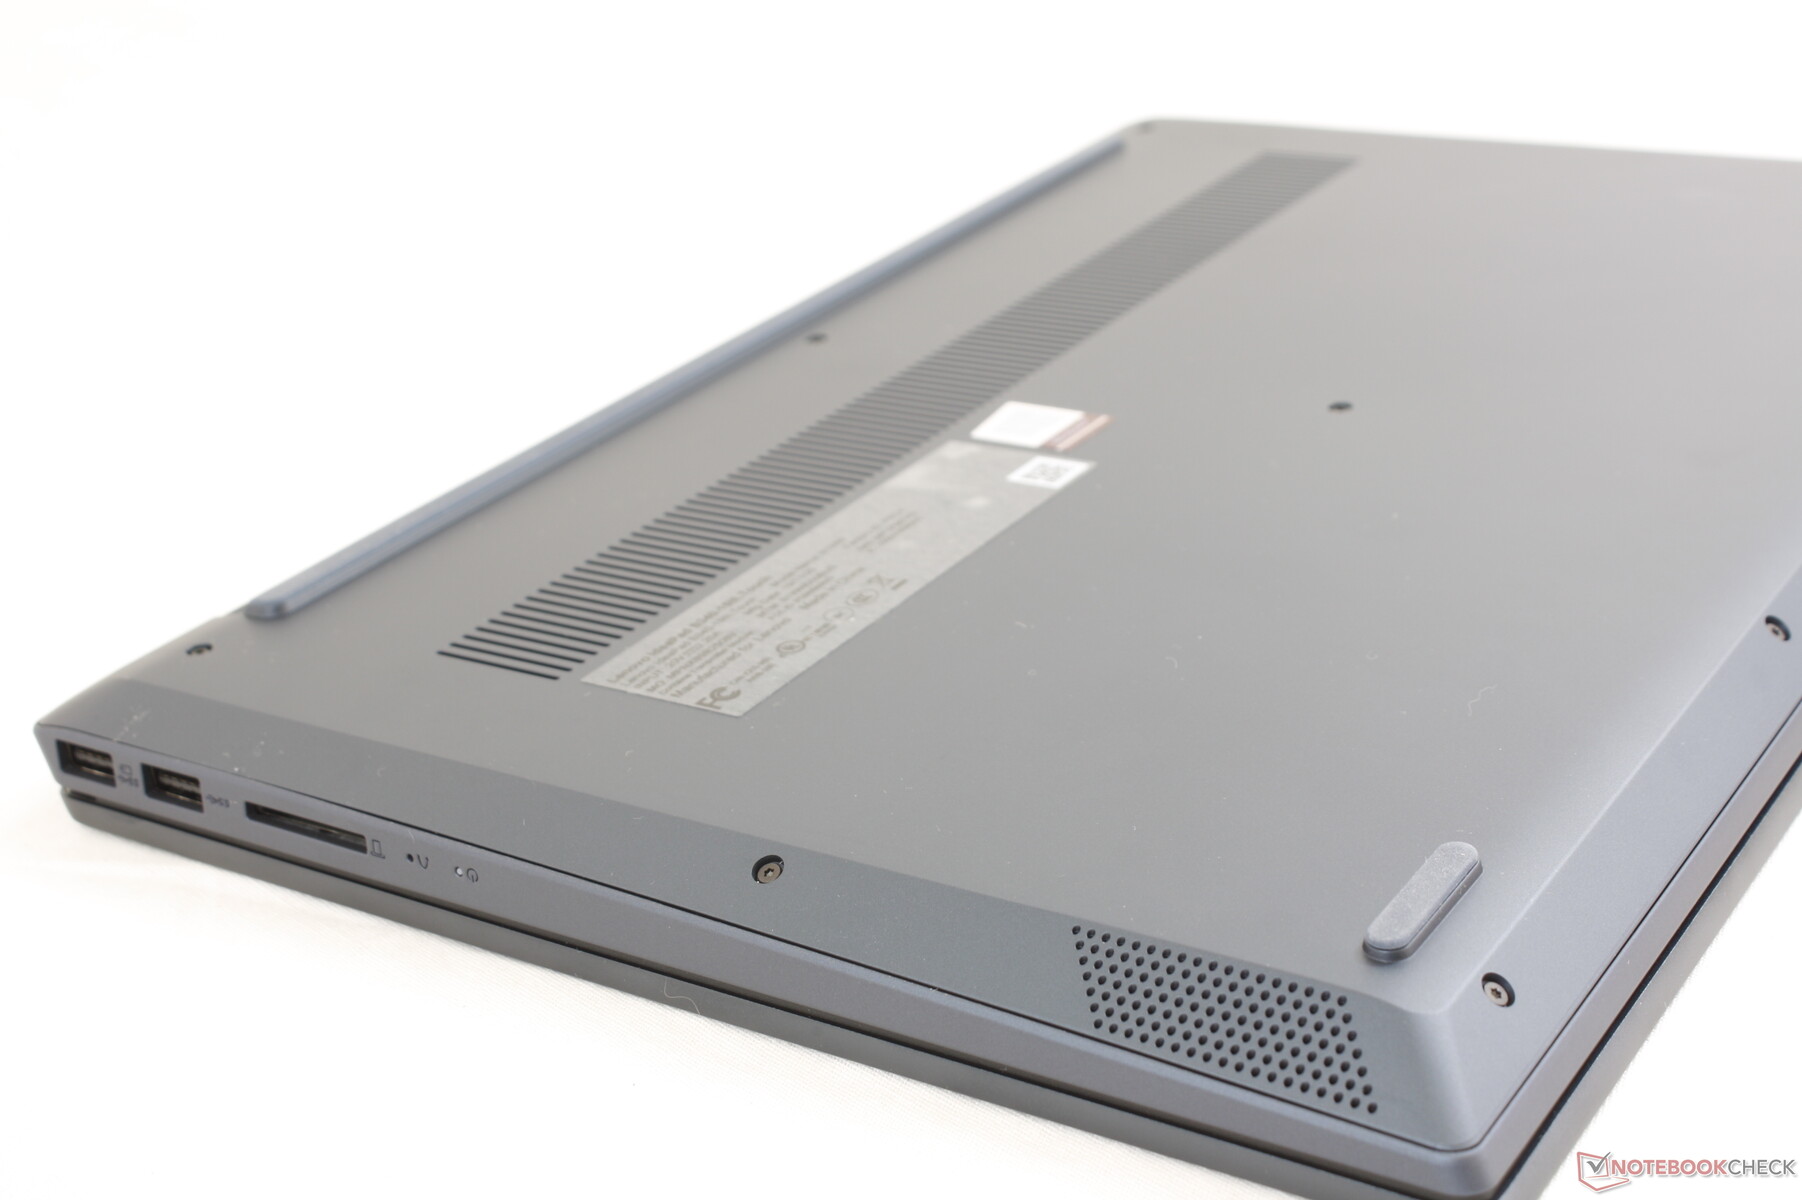
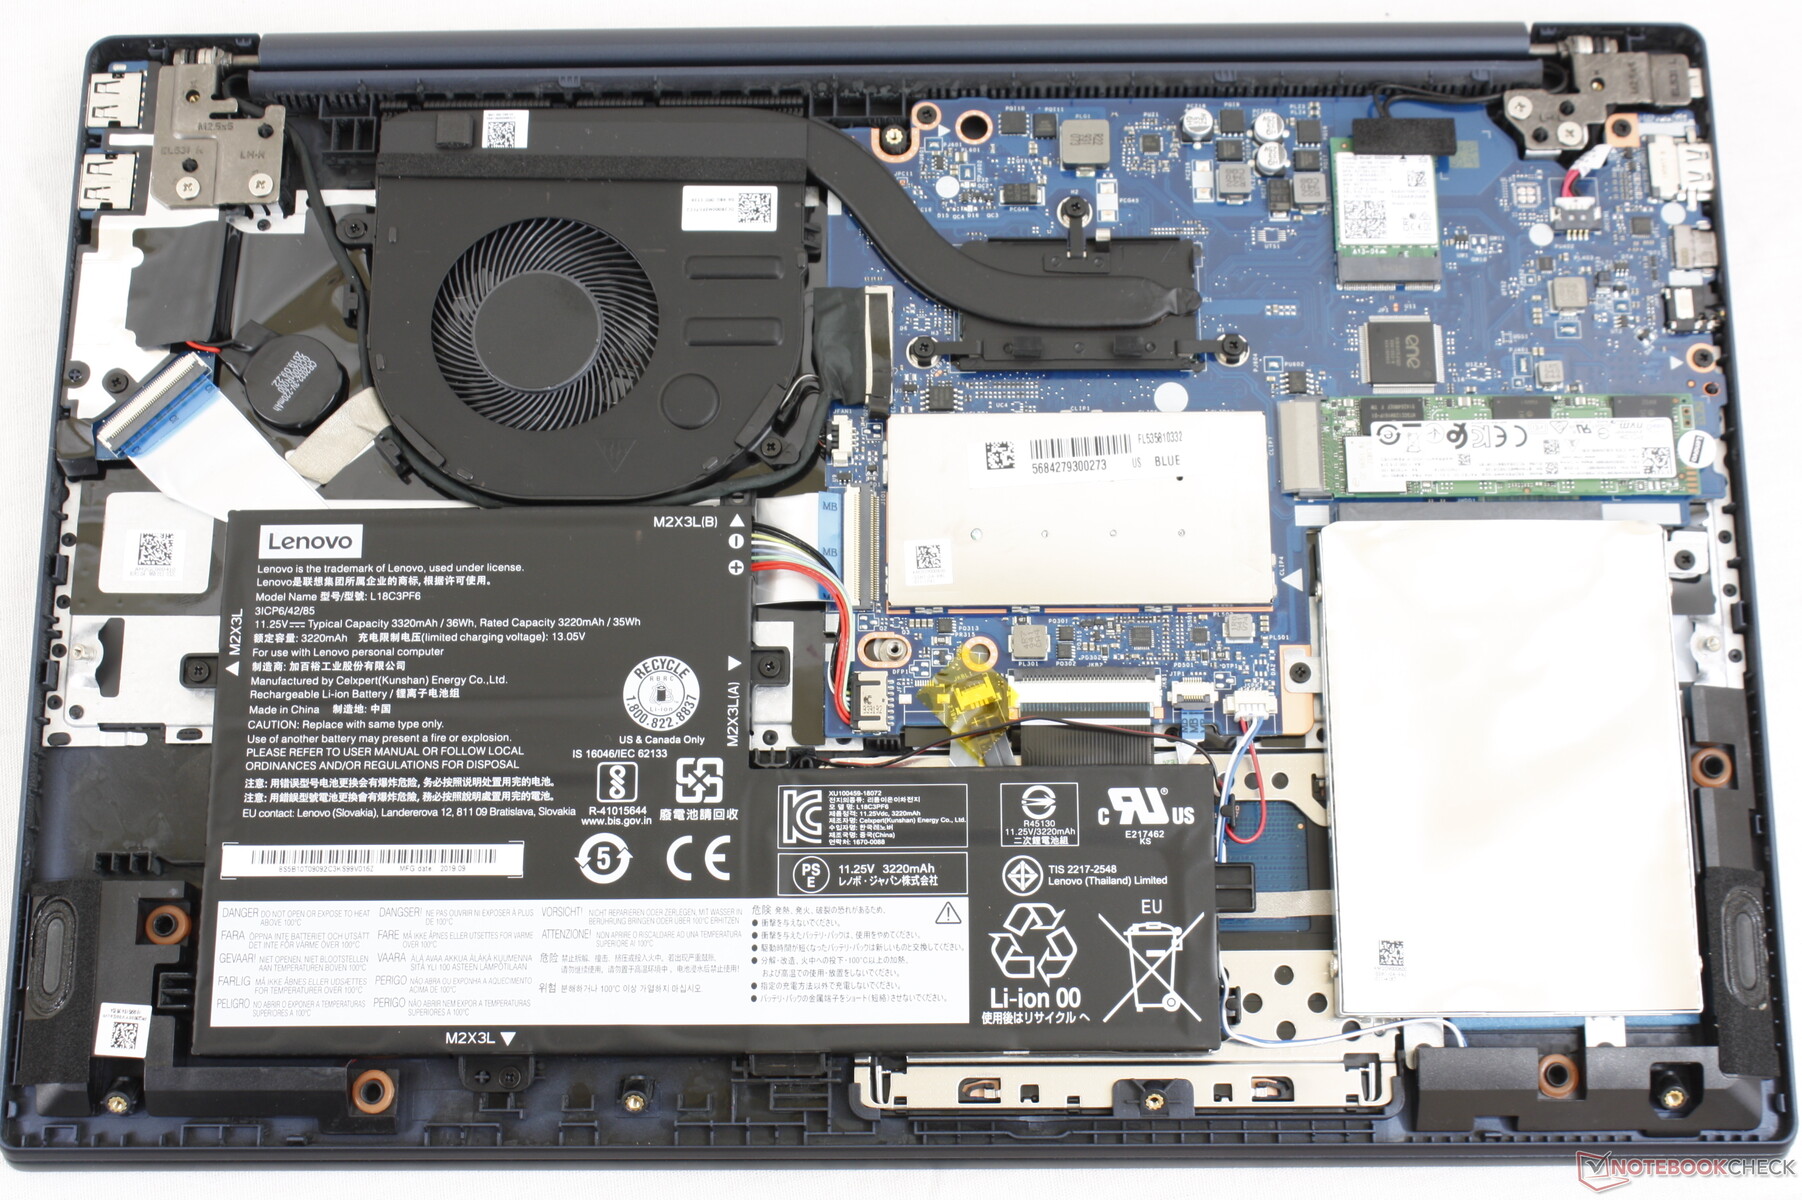
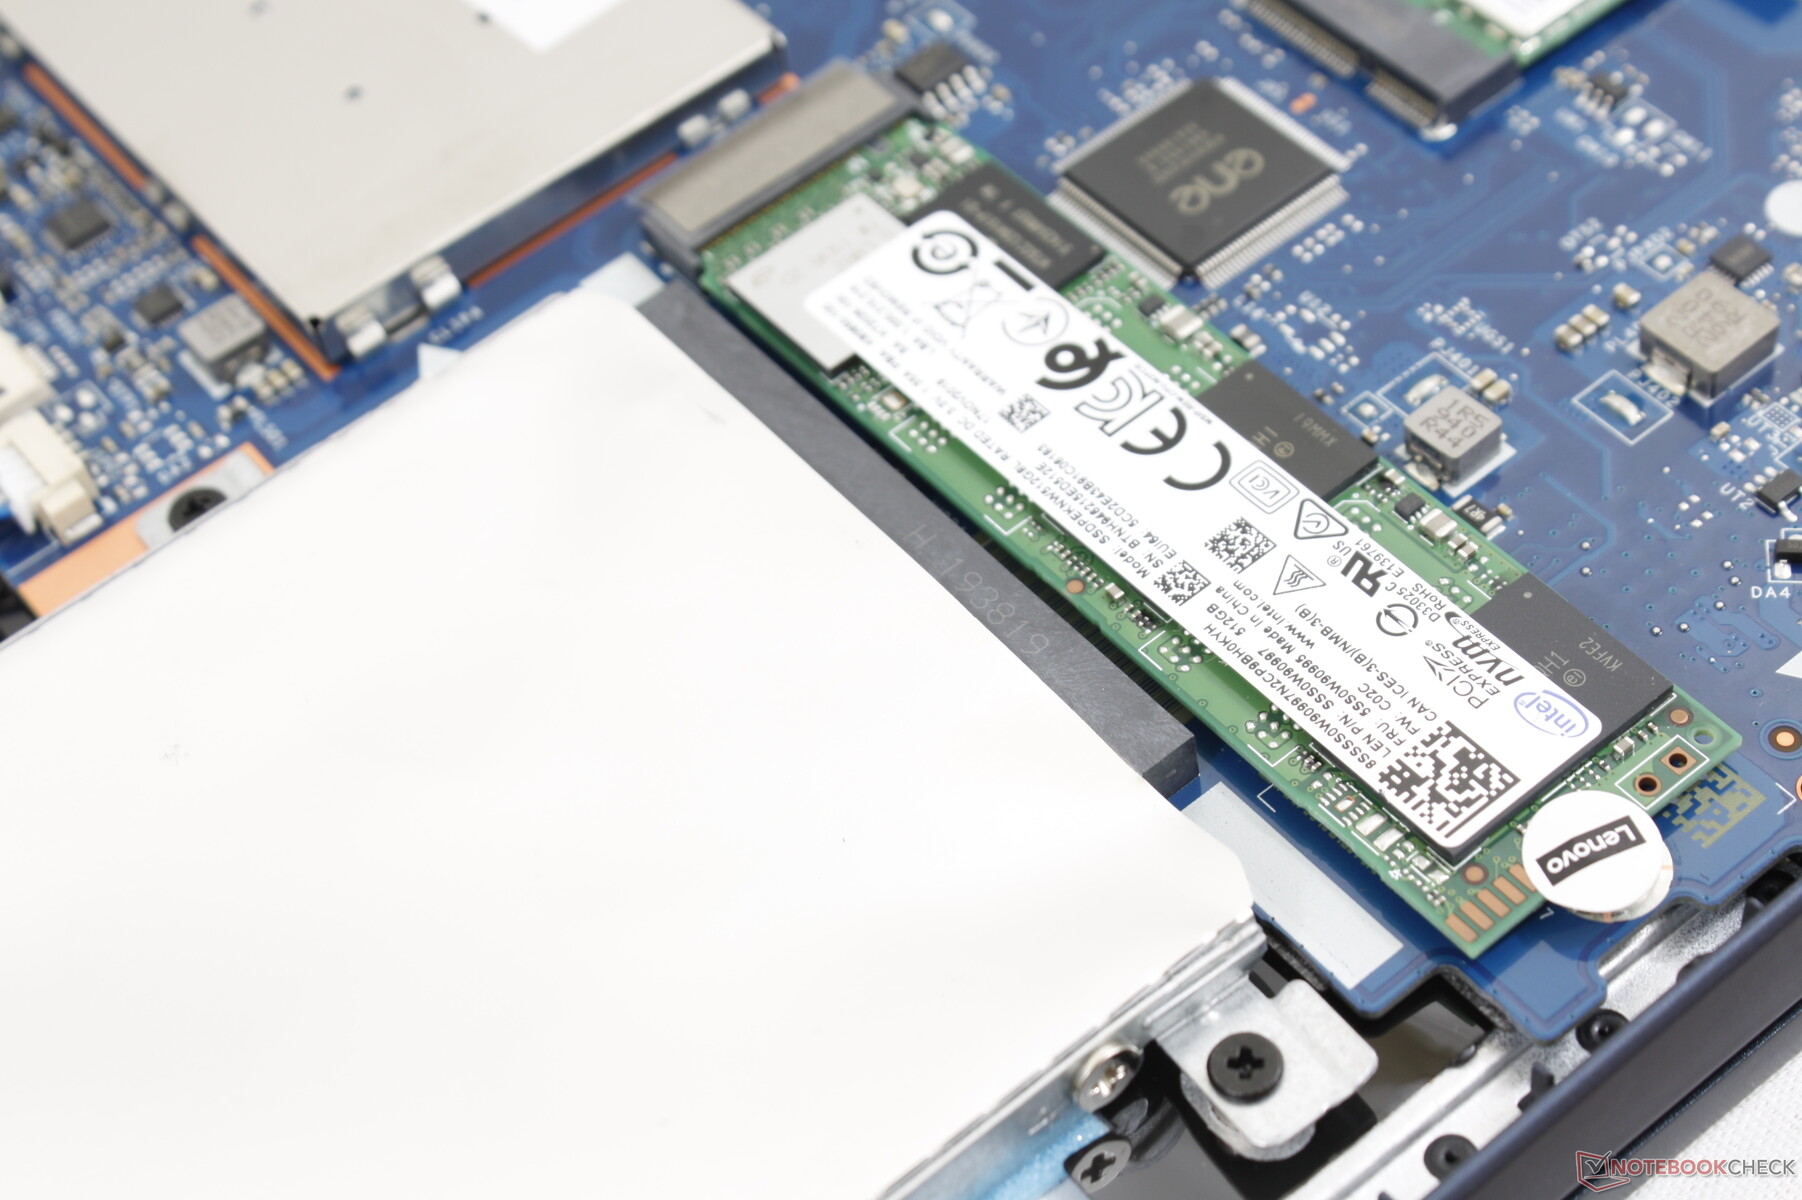
The bottom panel is secured by ten T5 Torx screws. Once removed, users have access to two storage bays and one SODIMM slot underneath the aluminum plate. Servicing is much easier here when compared to the HP Pavilion series.
Accessories and Warranty
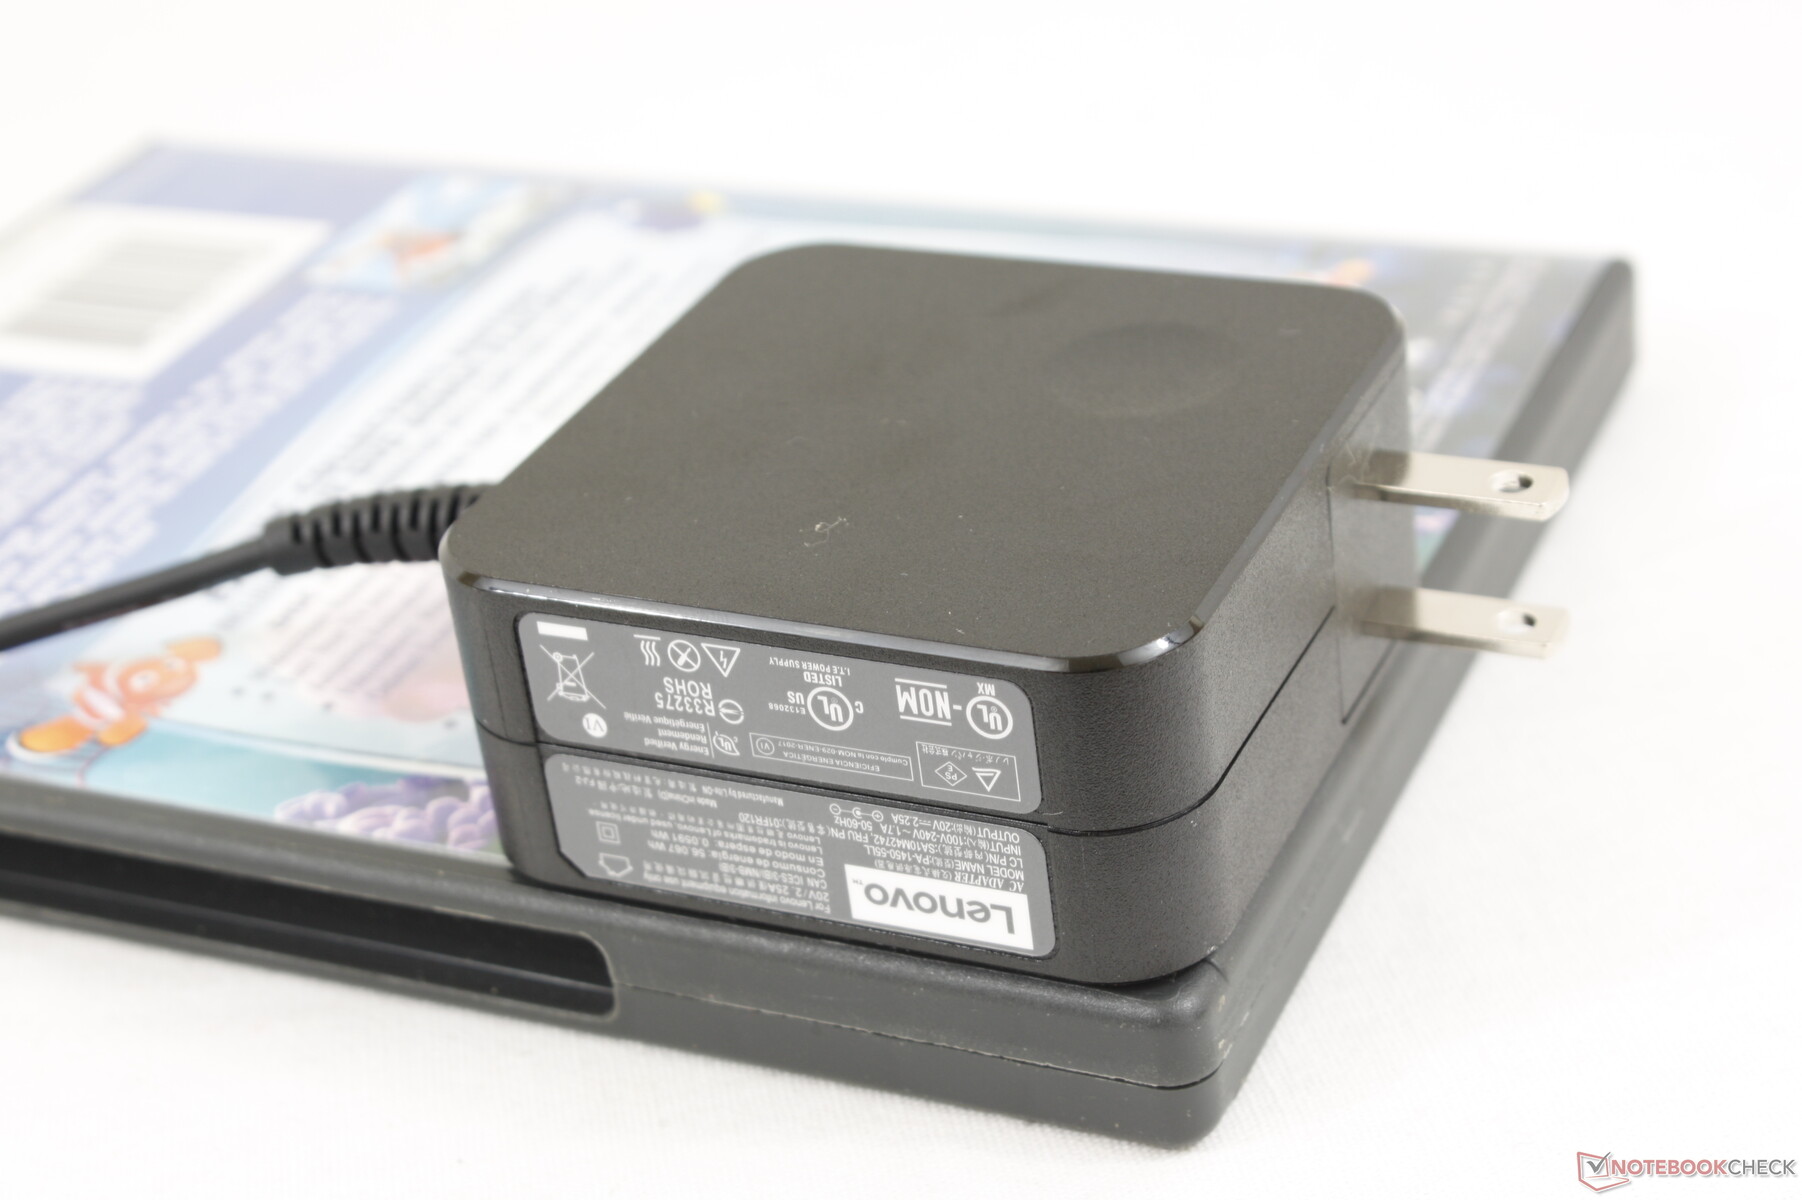
There are no extras in the box other than the paper manuals and AC adapter. The standard one-year limited warranty applies with further options if purchased directly from Lenovo.
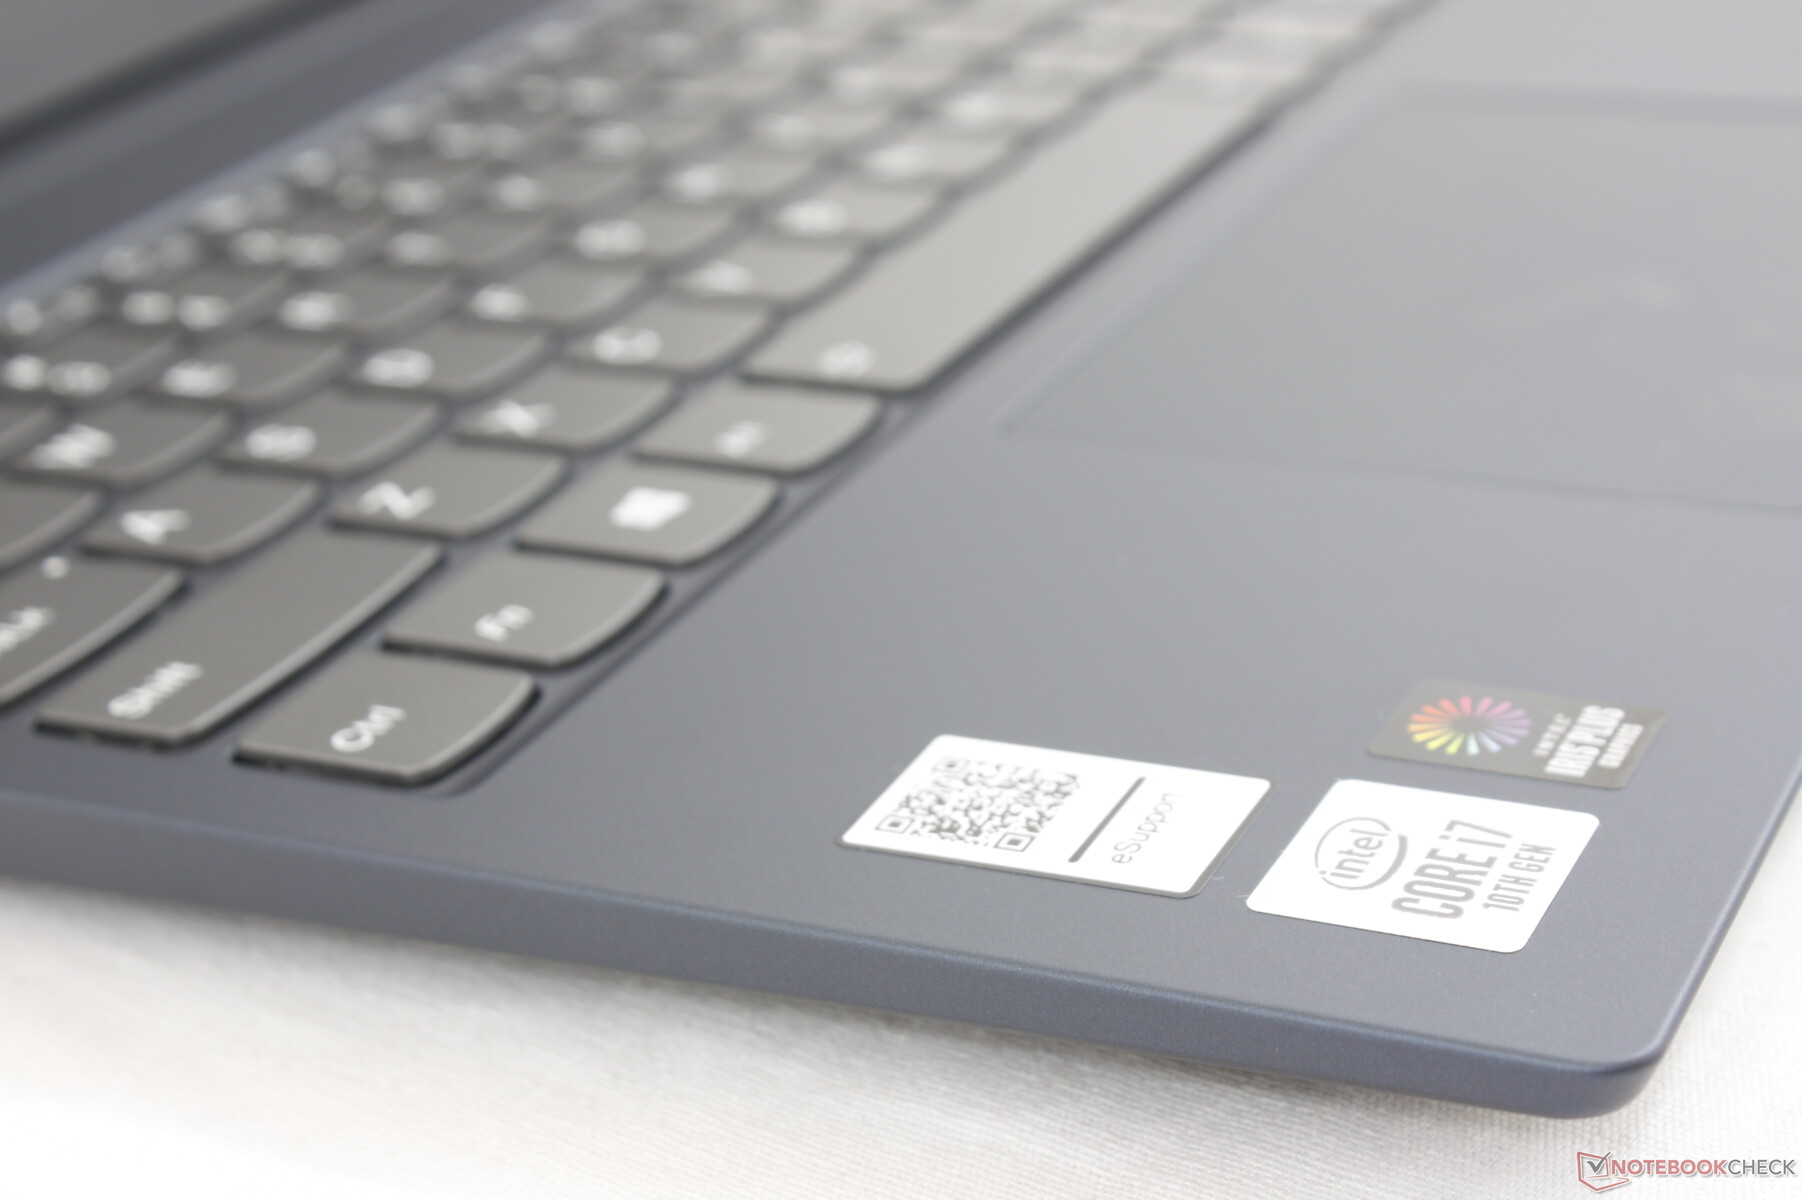
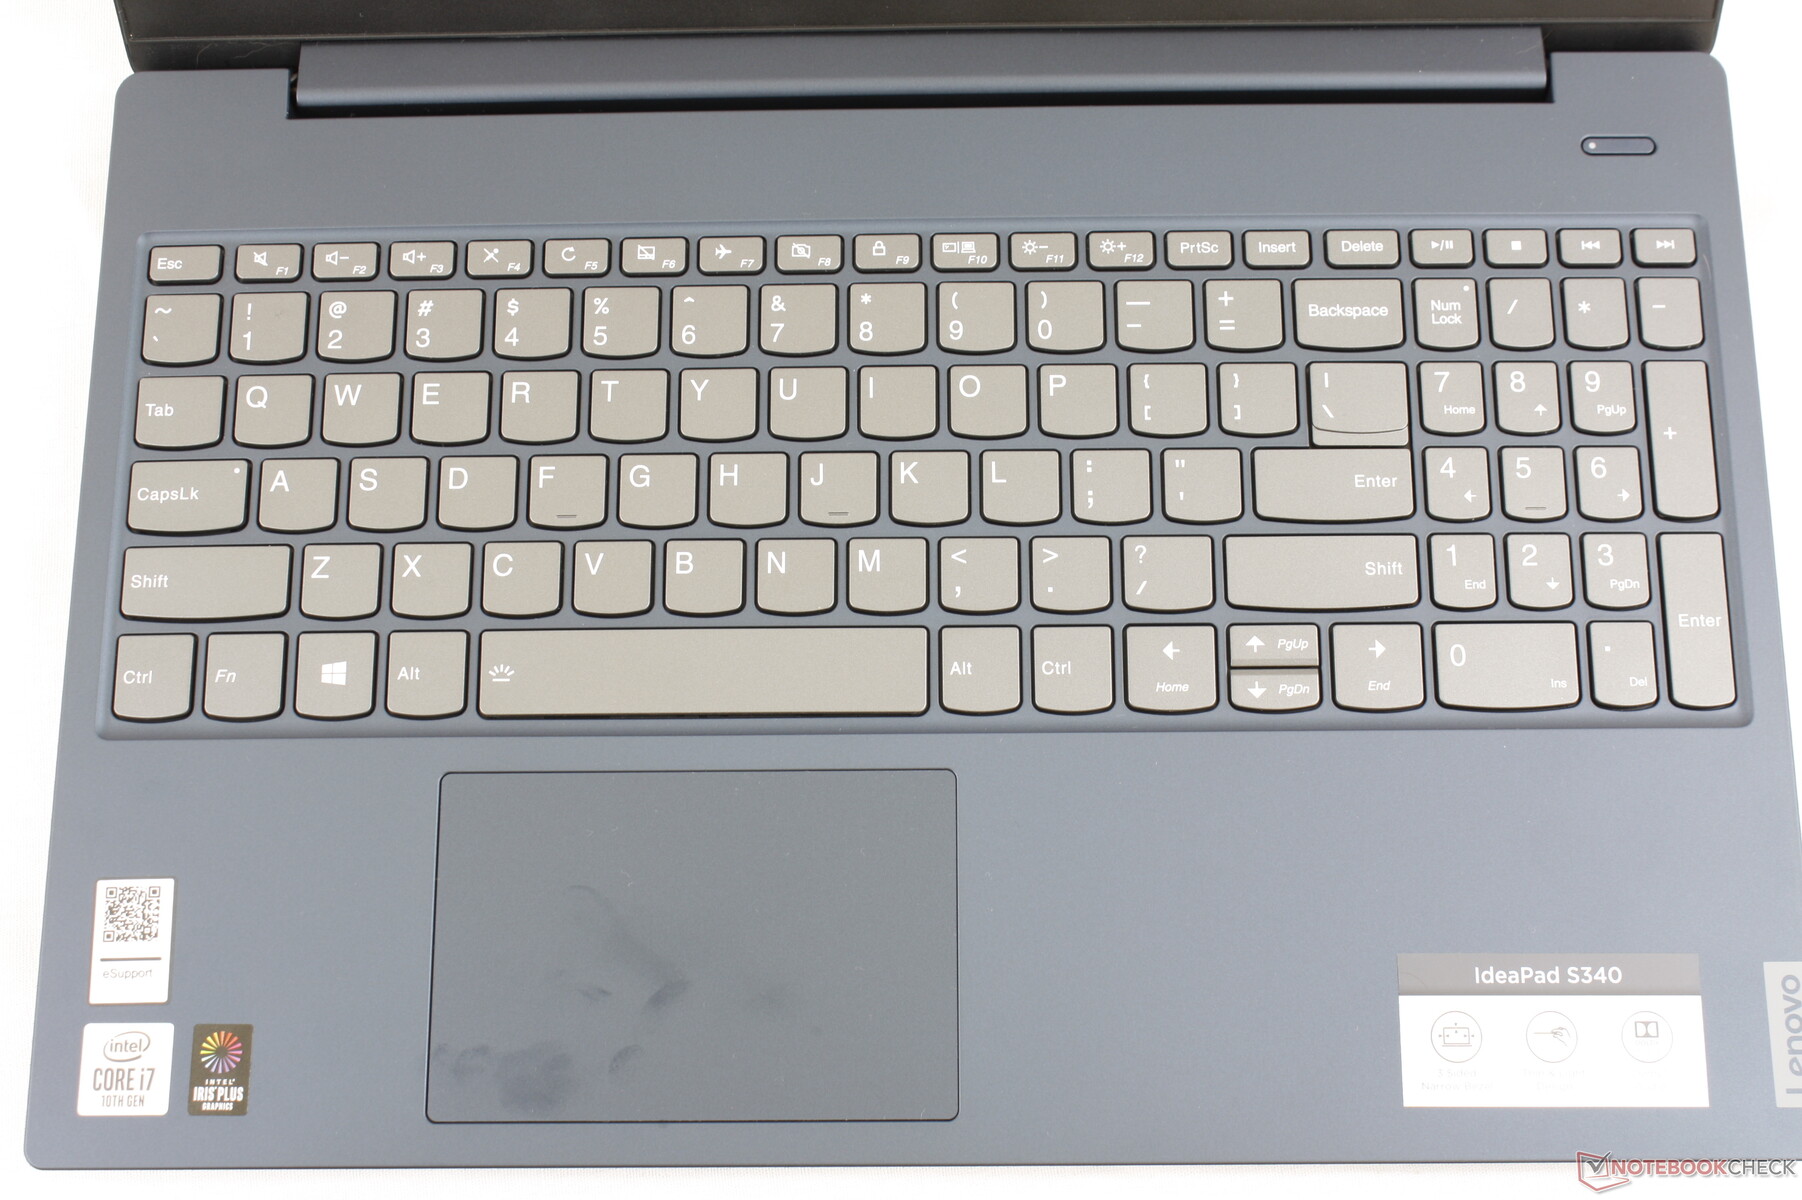
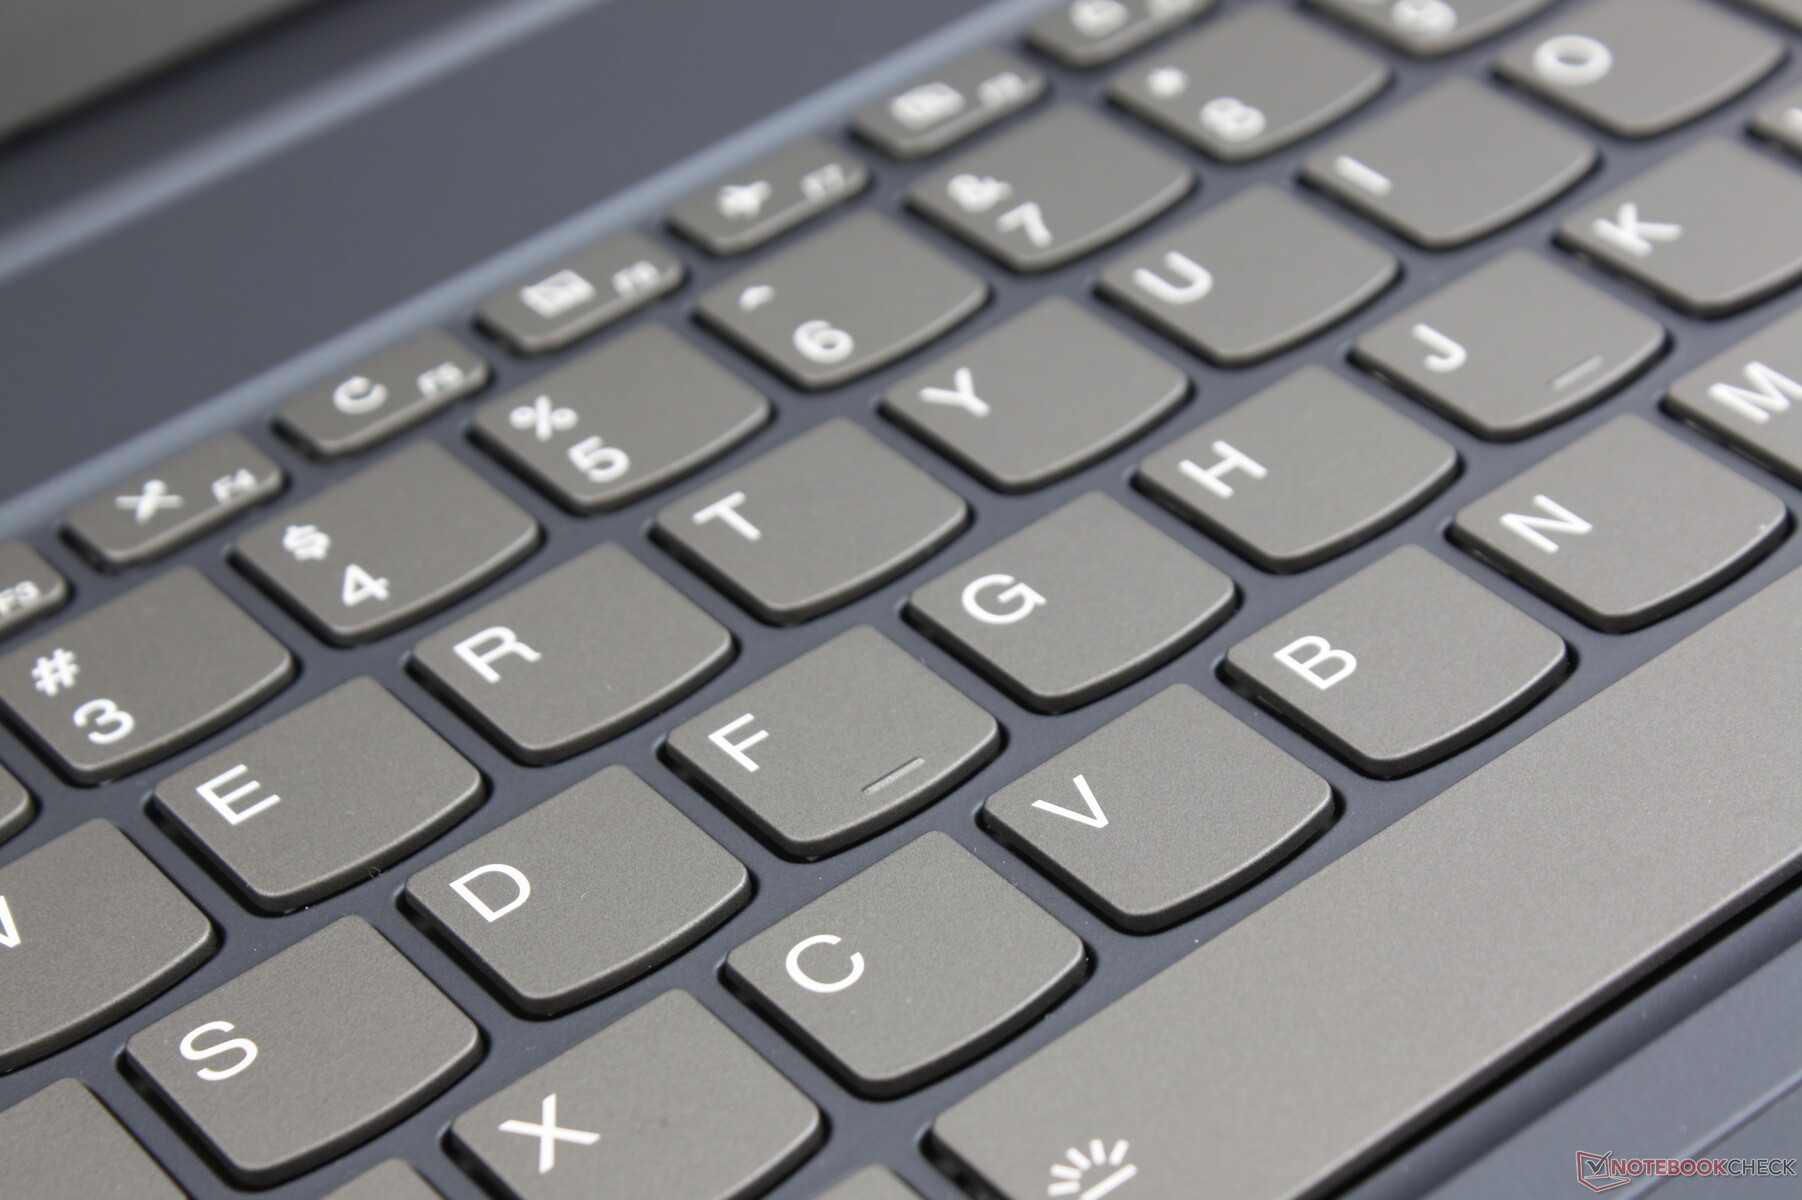
Input Devices
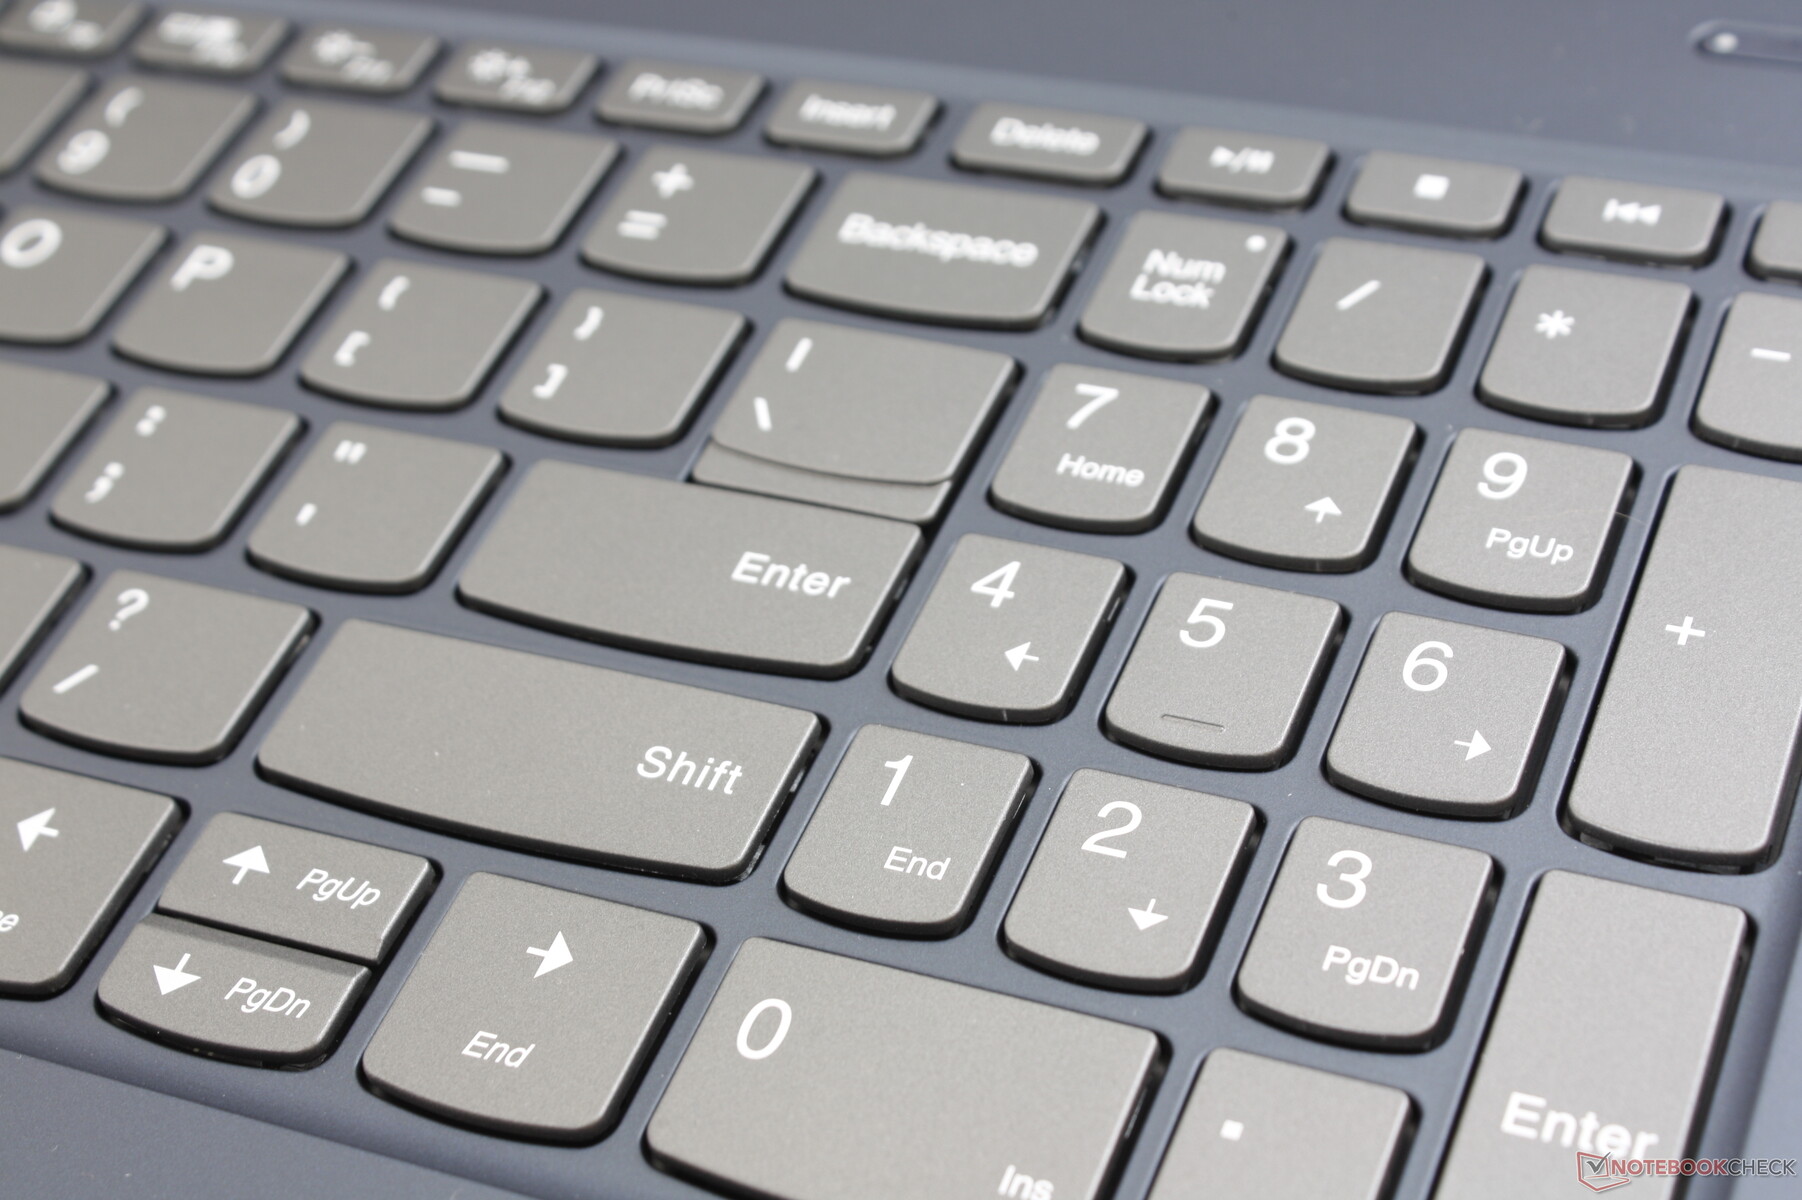
Keyboard and TouchPad
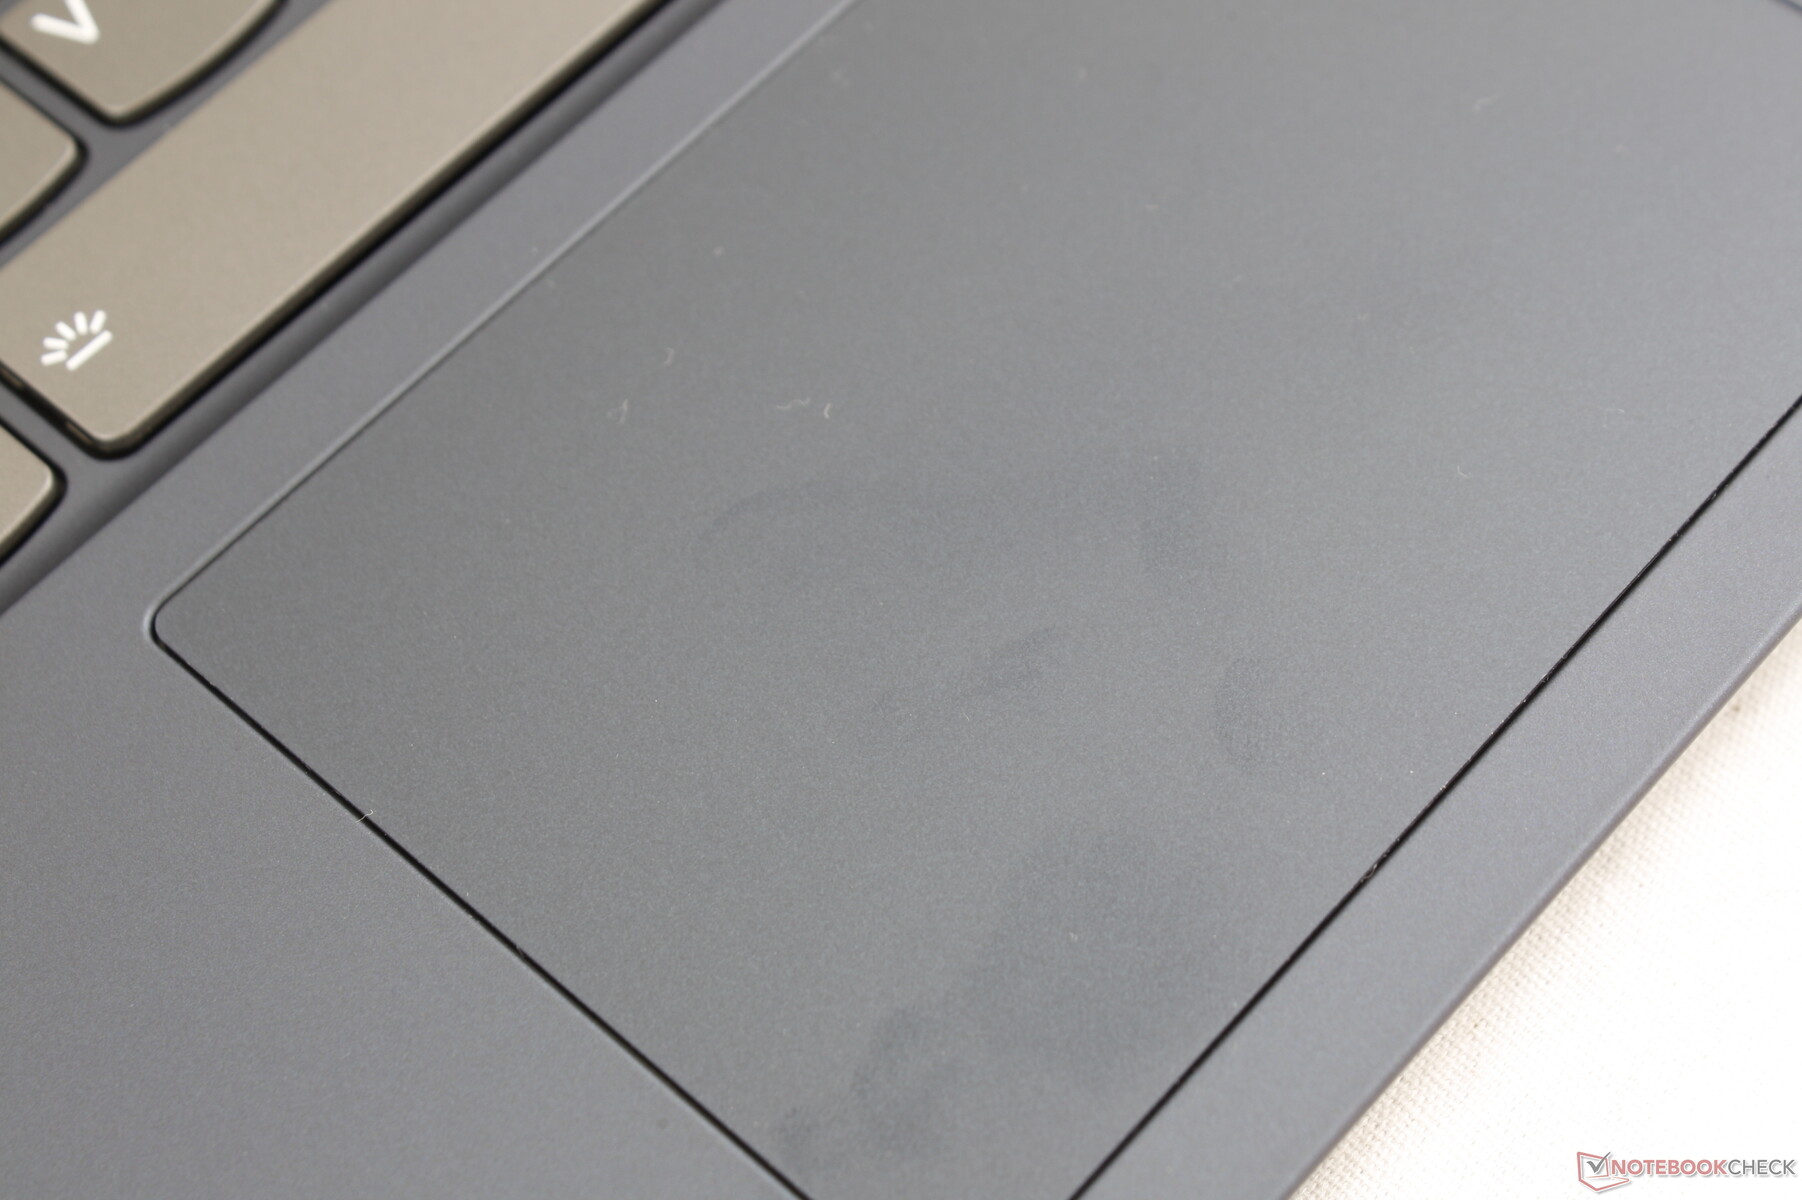
Lenovo uses the same keyboard and touchpad across its IdeaPad S340, S540, and S740 lineup. Thus, our existing comments on the S540 and S740 apply here for the S340. Even the size of the clickpad (10.5 x 7 cm) is identical between all three models.
Unfortunately, this also means that we're less than impressed by the soft feedback of the keyboard keys. Lenovo ThinkPads have some of the best keyboard keys as far as laptops are concerned while the keys on the IdeaPad S340 feel spongier, shallower, and overall cheaper. This won't be a surprise if you're already accustomed to typing on cheap Ultrabooks, but the difference will be noticeable if you're coming from Ultrabooks with firmer keys like the HP Spectre series or the ThinkPad series.
Display
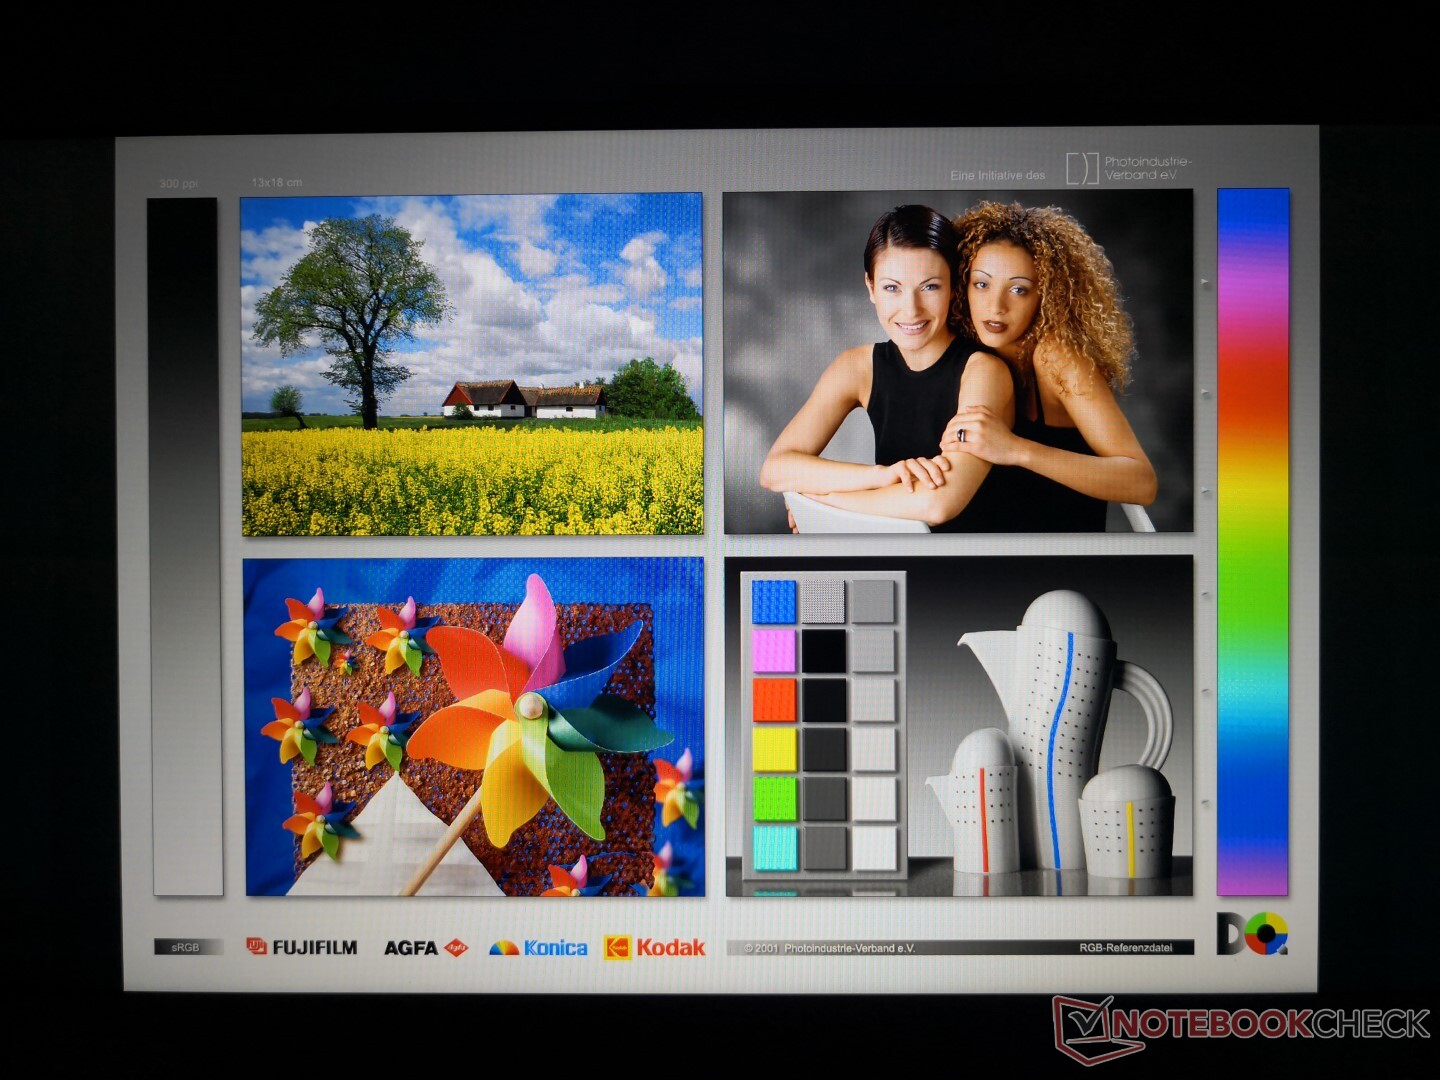
The BOE NV156FHM-T03 panel on our unit can be found on no other laptop in our database as of this writing. Nonetheless, there are a handful of laptops with panels from the BOE NV156FHM family including the Xiaomi Mi Notebook Pro and the Lenovo Legion Y740. To our surprise, graininess is minimal and contrast is better than expected from a matte panel on an inexpensive laptop. On the other hand, the limited color space and and inaccurate colors prevent the panel from being as colorful as the panels found on pricier laptops like the Surface laptop 3 15 or IdeaPad S940.
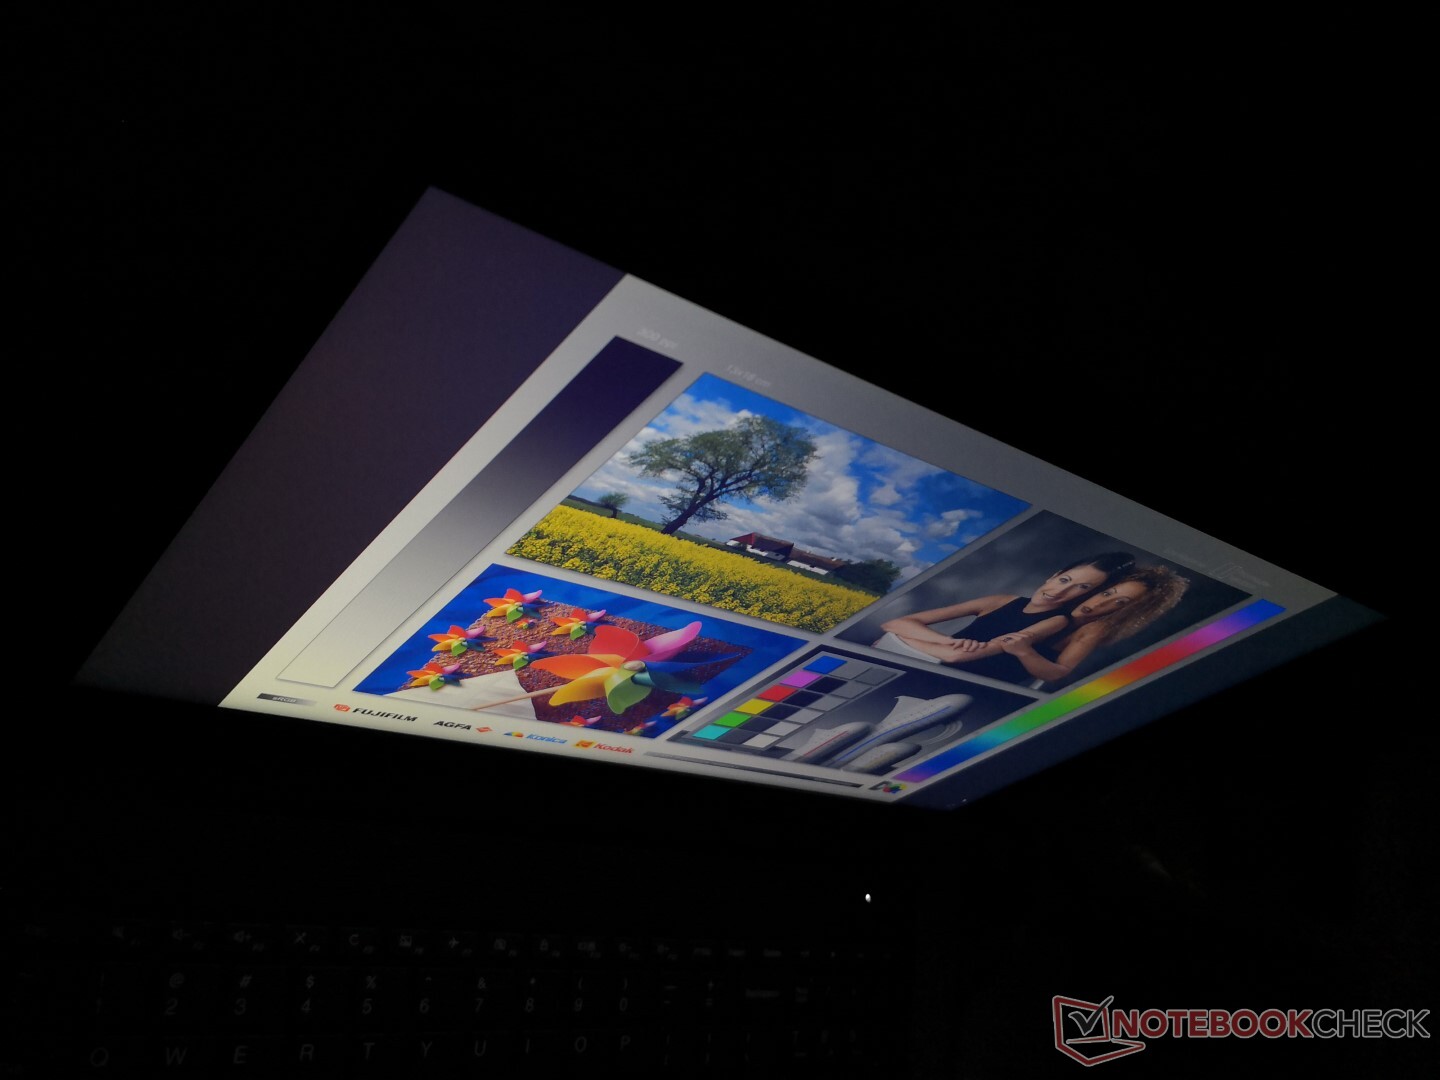
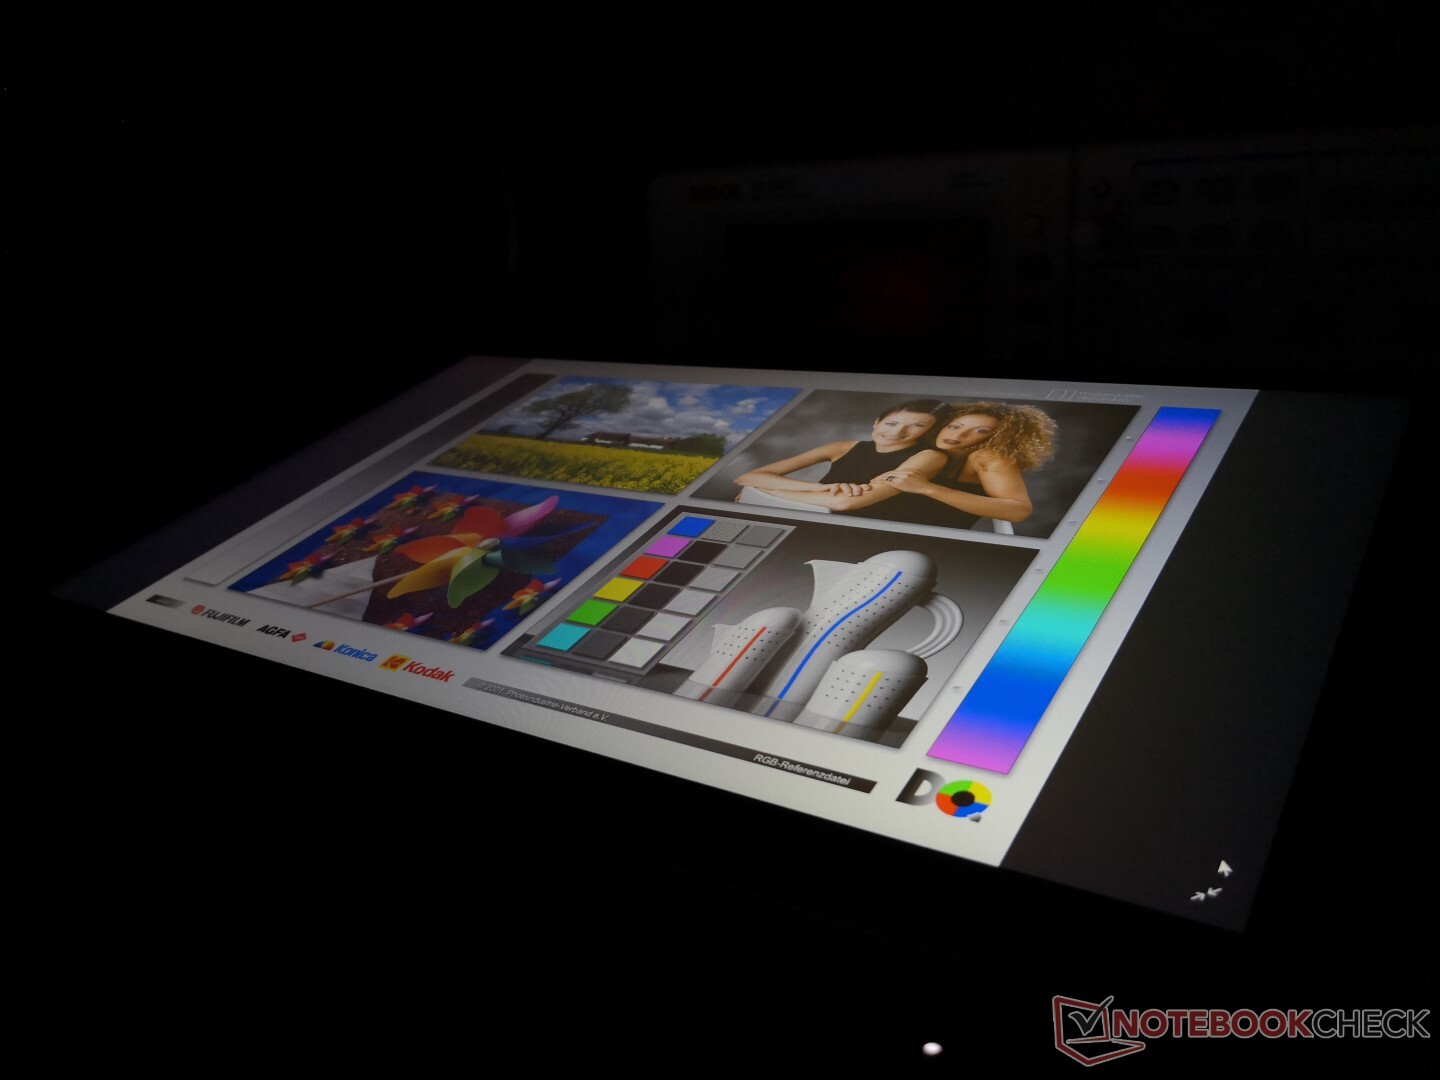
Response times are slow for more noticeable ghosting when gaming and our unit suffers from slight-moderate uneven backlight bleeding along the edges and corners.


| |||||||||||||||||||||||||
Brightness Distribution: 87 %
Center on Battery: 320.8 cd/m²
Contrast: 1188:1 (Black: 0.27 cd/m²)
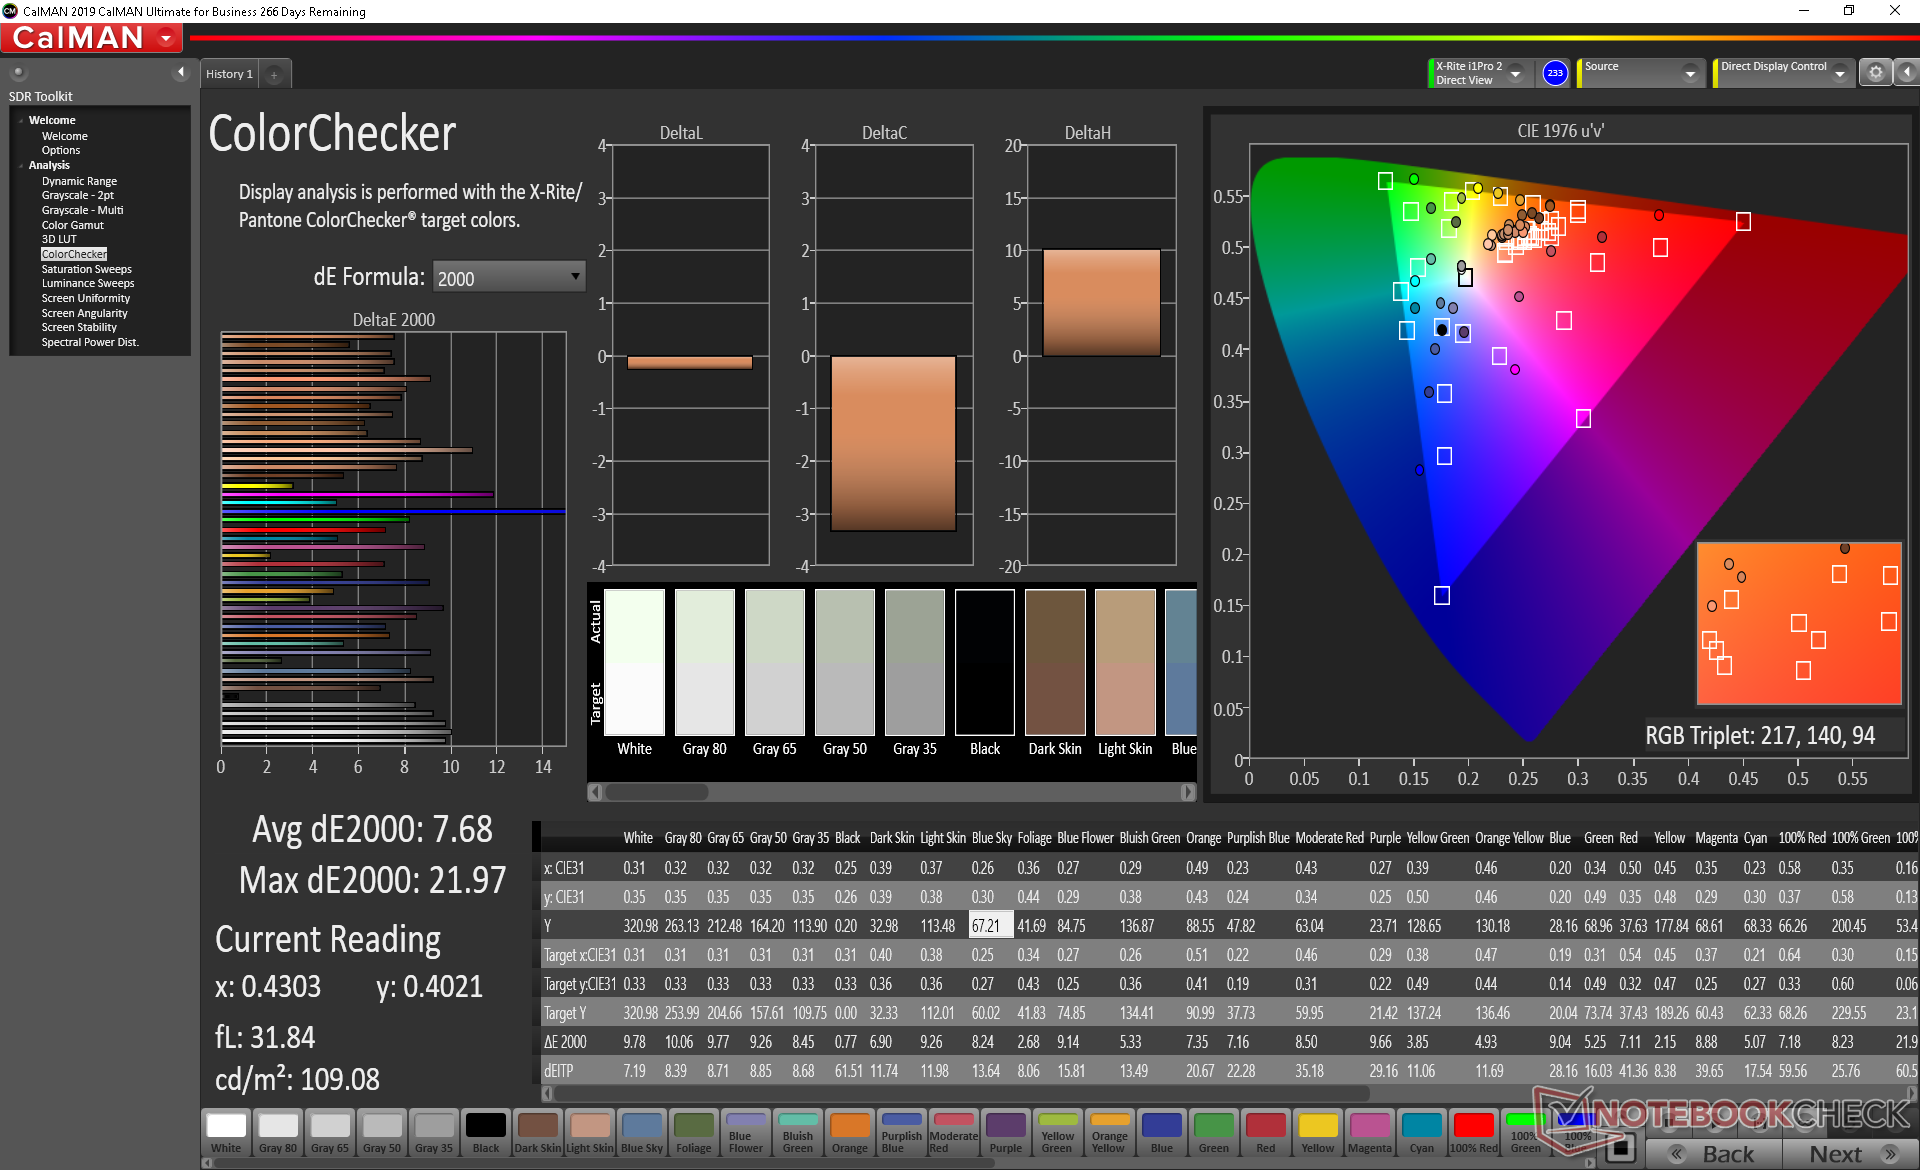
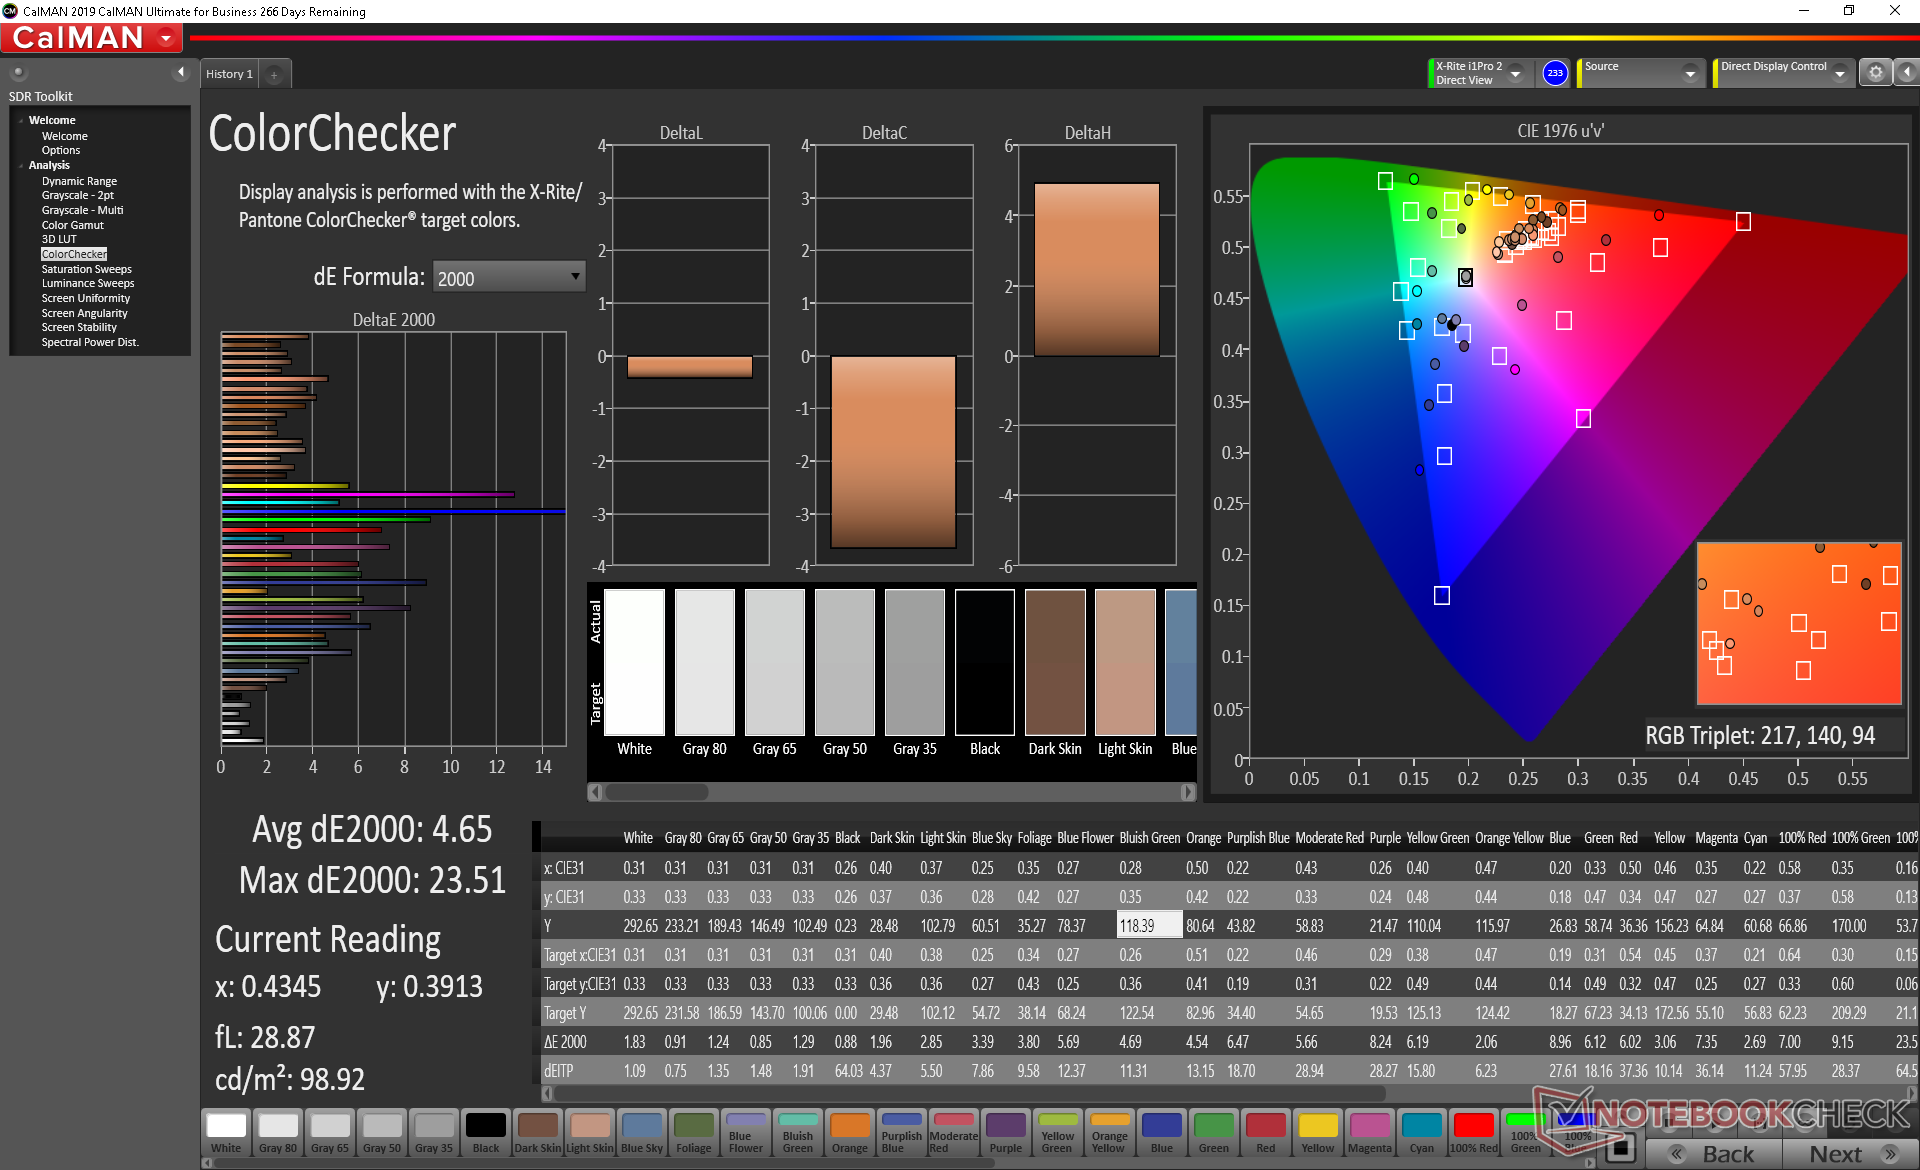
ΔE ColorChecker Calman: 7.68 | ∀{0.5-29.43 Ø4.71}
calibrated: 4.65
ΔE Greyscale Calman: 7.3 | ∀{0.09-98 Ø4.96}
58.3% sRGB (Argyll 1.6.3 3D)
37.8% AdobeRGB 1998 (Argyll 1.6.3 3D)
41.77% AdobeRGB 1998 (Argyll 3D)
58.8% sRGB (Argyll 3D)
40.43% Display P3 (Argyll 3D)
Gamma: 2.12
CCT: 6213 K
| Lenovo Ideapad S340-15IIL BOE CQ NV156FHM-T03, IPS, 15.6", 1920x1080 | Dell XPS 15 7590 i5 iGPU FHD LQ156M1, IPS, 15.6", 1920x1080 | Dell Inspiron 15 5000 5585 LG Philips 156WFC, IPS, 15.6", 1920x1080 | Lenovo Ideapad S540-15IML BOEhydis NV156FHM-N61 (BOE06FB), IPS, 15.6", 1920x1080 | HP Pavilion 15-cs2019ng BOE080D, IPS, 15.6", 1920x1080 | Asus VivoBook 15 X542UF-DM143T BOE CQ NT156FHM-N41, TN LED, 15.6", 1920x1080 | |
|---|---|---|---|---|---|---|
| Display | 65% | -7% | 54% | 57% | -6% | |
| Display P3 Coverage (%) | 40.43 | 66.5 64% | 37.31 -8% | 66.8 65% | 67.2 66% | 37.47 -7% |
| sRGB Coverage (%) | 58.8 | 98 67% | 56.2 -4% | 86.5 47% | 88.1 50% | 56.4 -4% |
| AdobeRGB 1998 Coverage (%) | 41.77 | 68.4 64% | 38.55 -8% | 63.2 51% | 64.4 54% | 38.71 -7% |
| Response Times | -3% | 31% | -3% | 13% | 29% | |
| Response Time Grey 50% / Grey 80% * (ms) | 46.4 ? | 52.8 ? -14% | 28.4 ? 39% | 49.6 ? -7% | 43 ? 7% | 41 ? 12% |
| Response Time Black / White * (ms) | 35.2 ? | 32 ? 9% | 27.2 ? 23% | 34.8 ? 1% | 29 ? 18% | 19 ? 46% |
| PWM Frequency (Hz) | 1020 ? | 202 ? | 208 ? | 7000 ? | ||
| Screen | 49% | 2% | 25% | 24% | 0% | |
| Brightness middle (cd/m²) | 320.8 | 588 83% | 253.6 -21% | 299 -7% | 320 0% | 230 -28% |
| Brightness (cd/m²) | 309 | 555 80% | 227 -27% | 278 -10% | 293 -5% | 221 -28% |
| Brightness Distribution (%) | 87 | 89 2% | 84 -3% | 87 0% | 86 -1% | 91 5% |
| Black Level * (cd/m²) | 0.27 | 0.4 -48% | 0.27 -0% | 0.25 7% | 0.26 4% | 0.45 -67% |
| Contrast (:1) | 1188 | 1470 24% | 939 -21% | 1196 1% | 1231 4% | 511 -57% |
| Colorchecker dE 2000 * | 7.68 | 2.5 67% | 6.05 21% | 4.32 44% | 4.5 41% | 3.6 53% |
| Colorchecker dE 2000 max. * | 21.97 | 6.3 71% | 14.03 36% | 9.3 58% | 8.81 60% | 5.59 75% |
| Colorchecker dE 2000 calibrated * | 4.65 | 0.6 87% | 4.97 -7% | 2.58 45% | ||
| Greyscale dE 2000 * | 7.3 | 4.5 38% | 3.2 56% | 4.21 42% | 4.71 35% | 3.13 57% |
| Gamma | 2.12 104% | 2.2 100% | 2 110% | 2.39 92% | 2.45 90% | 2.45 90% |
| CCT | 6213 105% | 6836 95% | 6820 95% | 6799 96% | 7085 92% | 7244 90% |
| Color Space (Percent of AdobeRGB 1998) (%) | 37.8 | 63.2 67% | 35.5 -6% | 57 51% | 58 53% | 36 -5% |
| Color Space (Percent of sRGB) (%) | 58.3 | 98 68% | 55.6 -5% | 86 48% | 88 51% | 56 -4% |
| Total Average (Program / Settings) | 37% /
46% | 9% /
4% | 25% /
27% | 31% /
29% | 8% /
3% |
* ... smaller is better
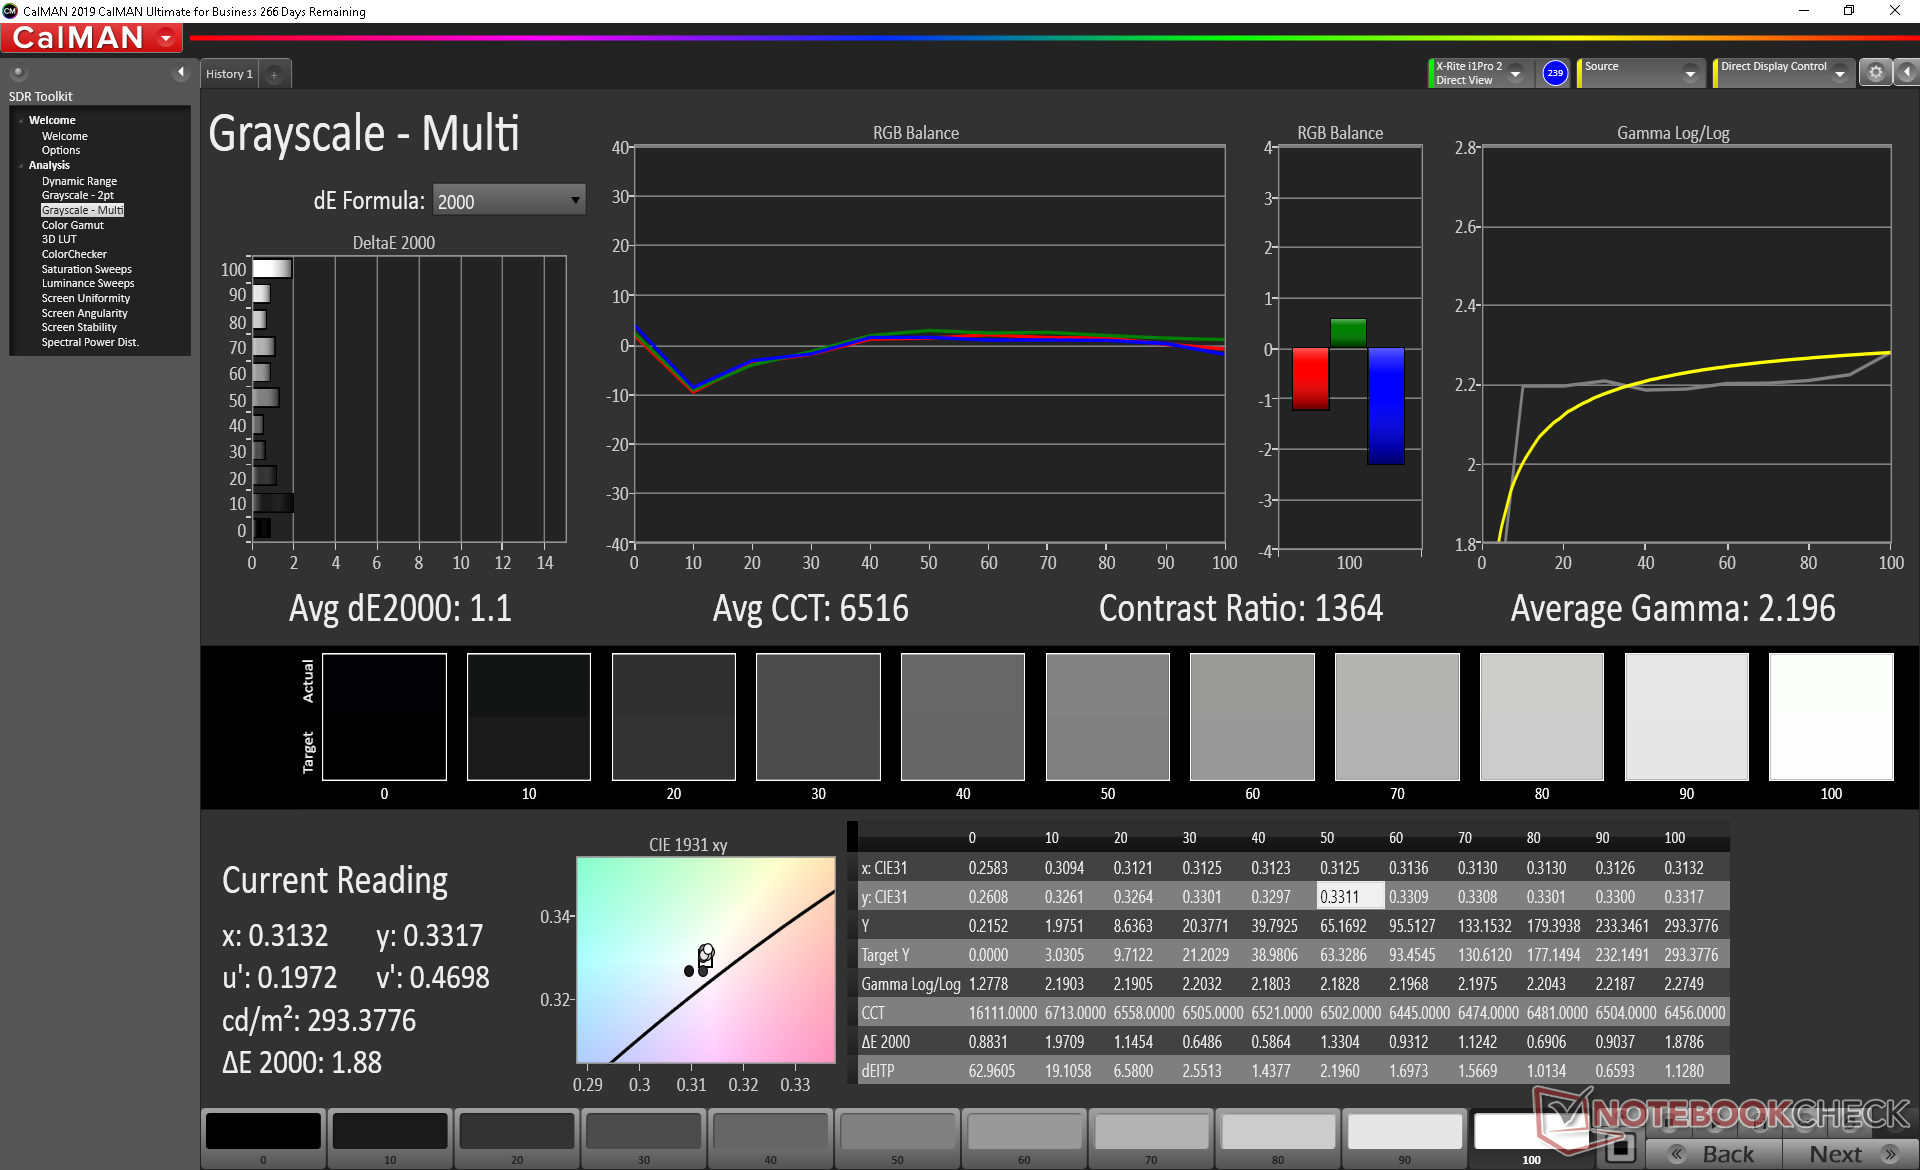
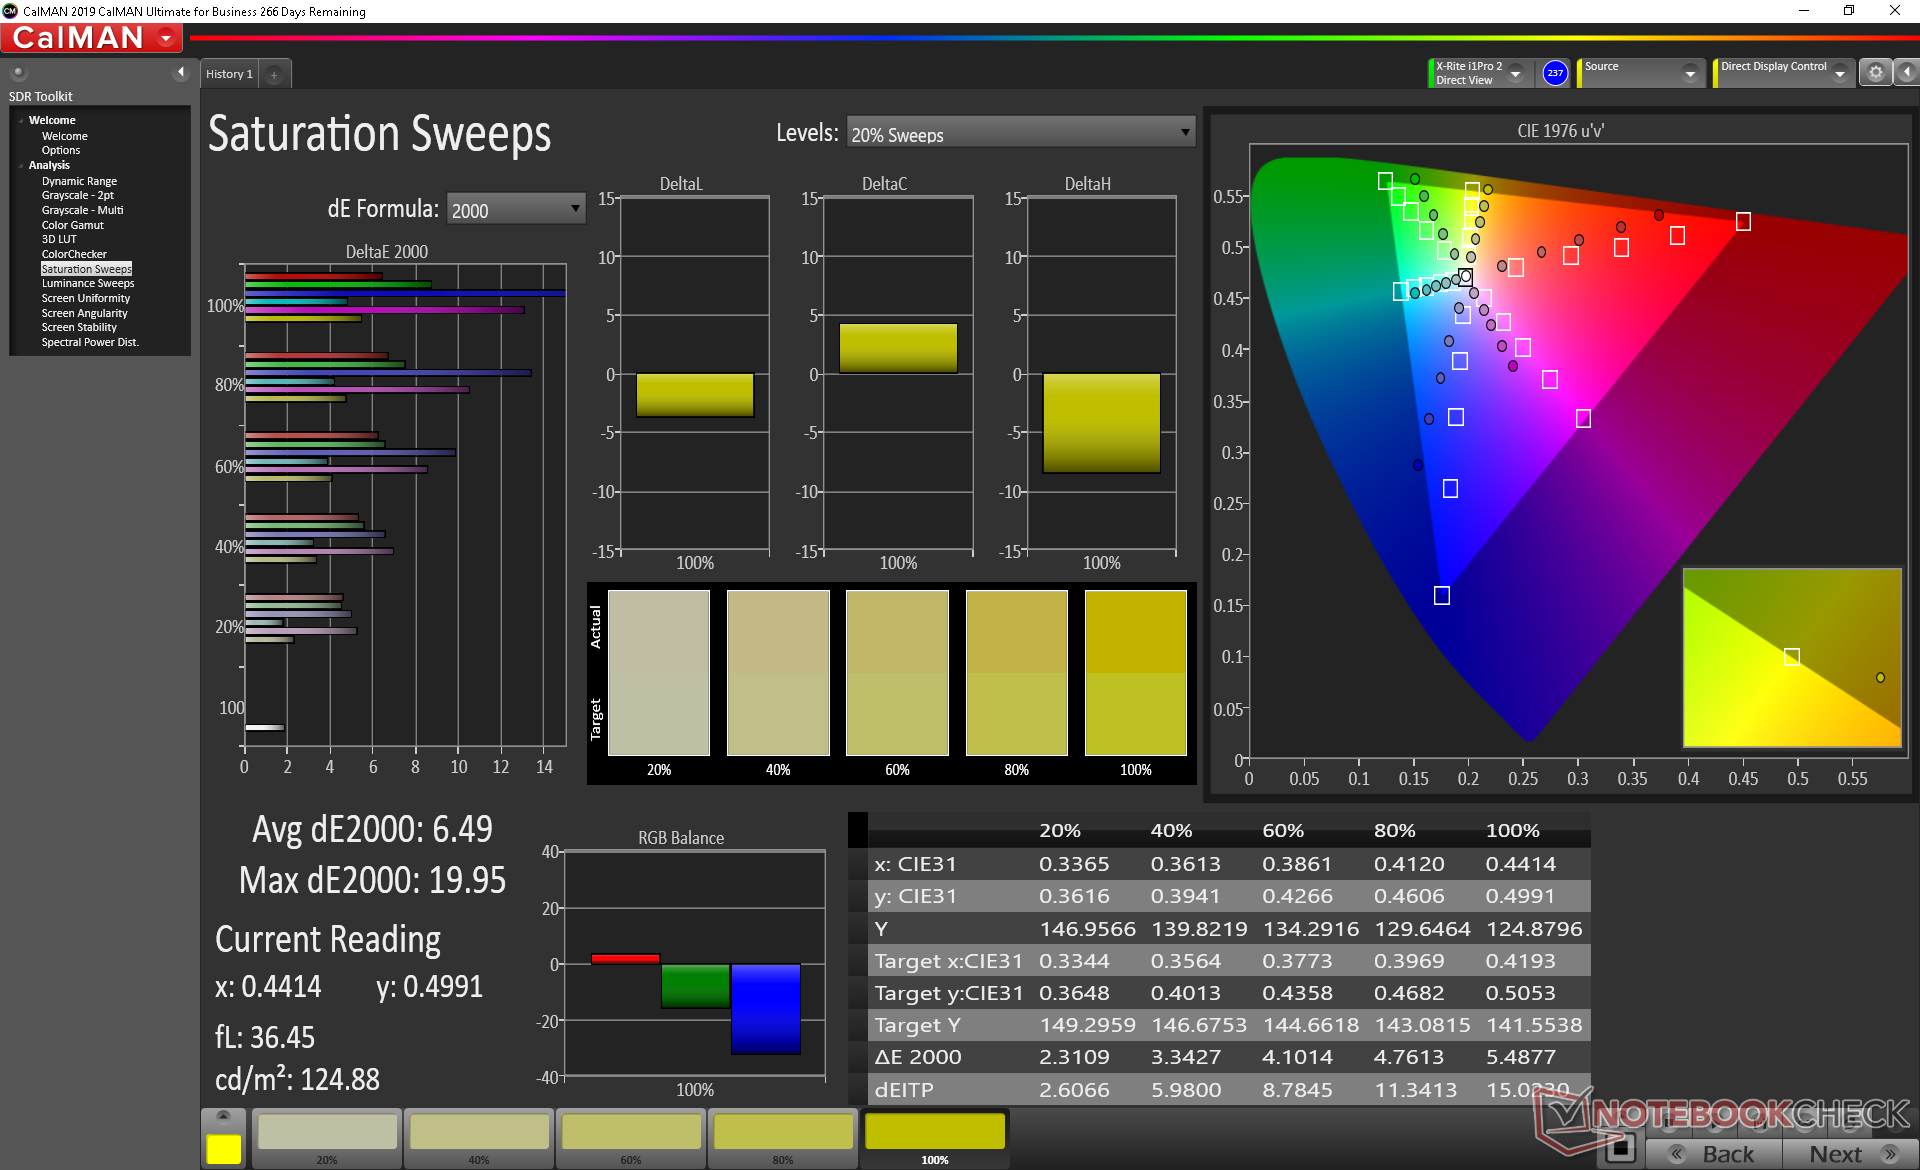
Color space is limited to just 38 percent and 58 percent of AdobeRGB and sRGB standards, respectively, to be indicative of a budget panel. The IdeaPad S540-15, which is one step up from our IdeaPad S340-15, offers deeper and potentially more accurate colors at about 86 percent of sRGB. We recommend calibrating the display yourself or applying our ICM profile above to get the most out of the laptop.
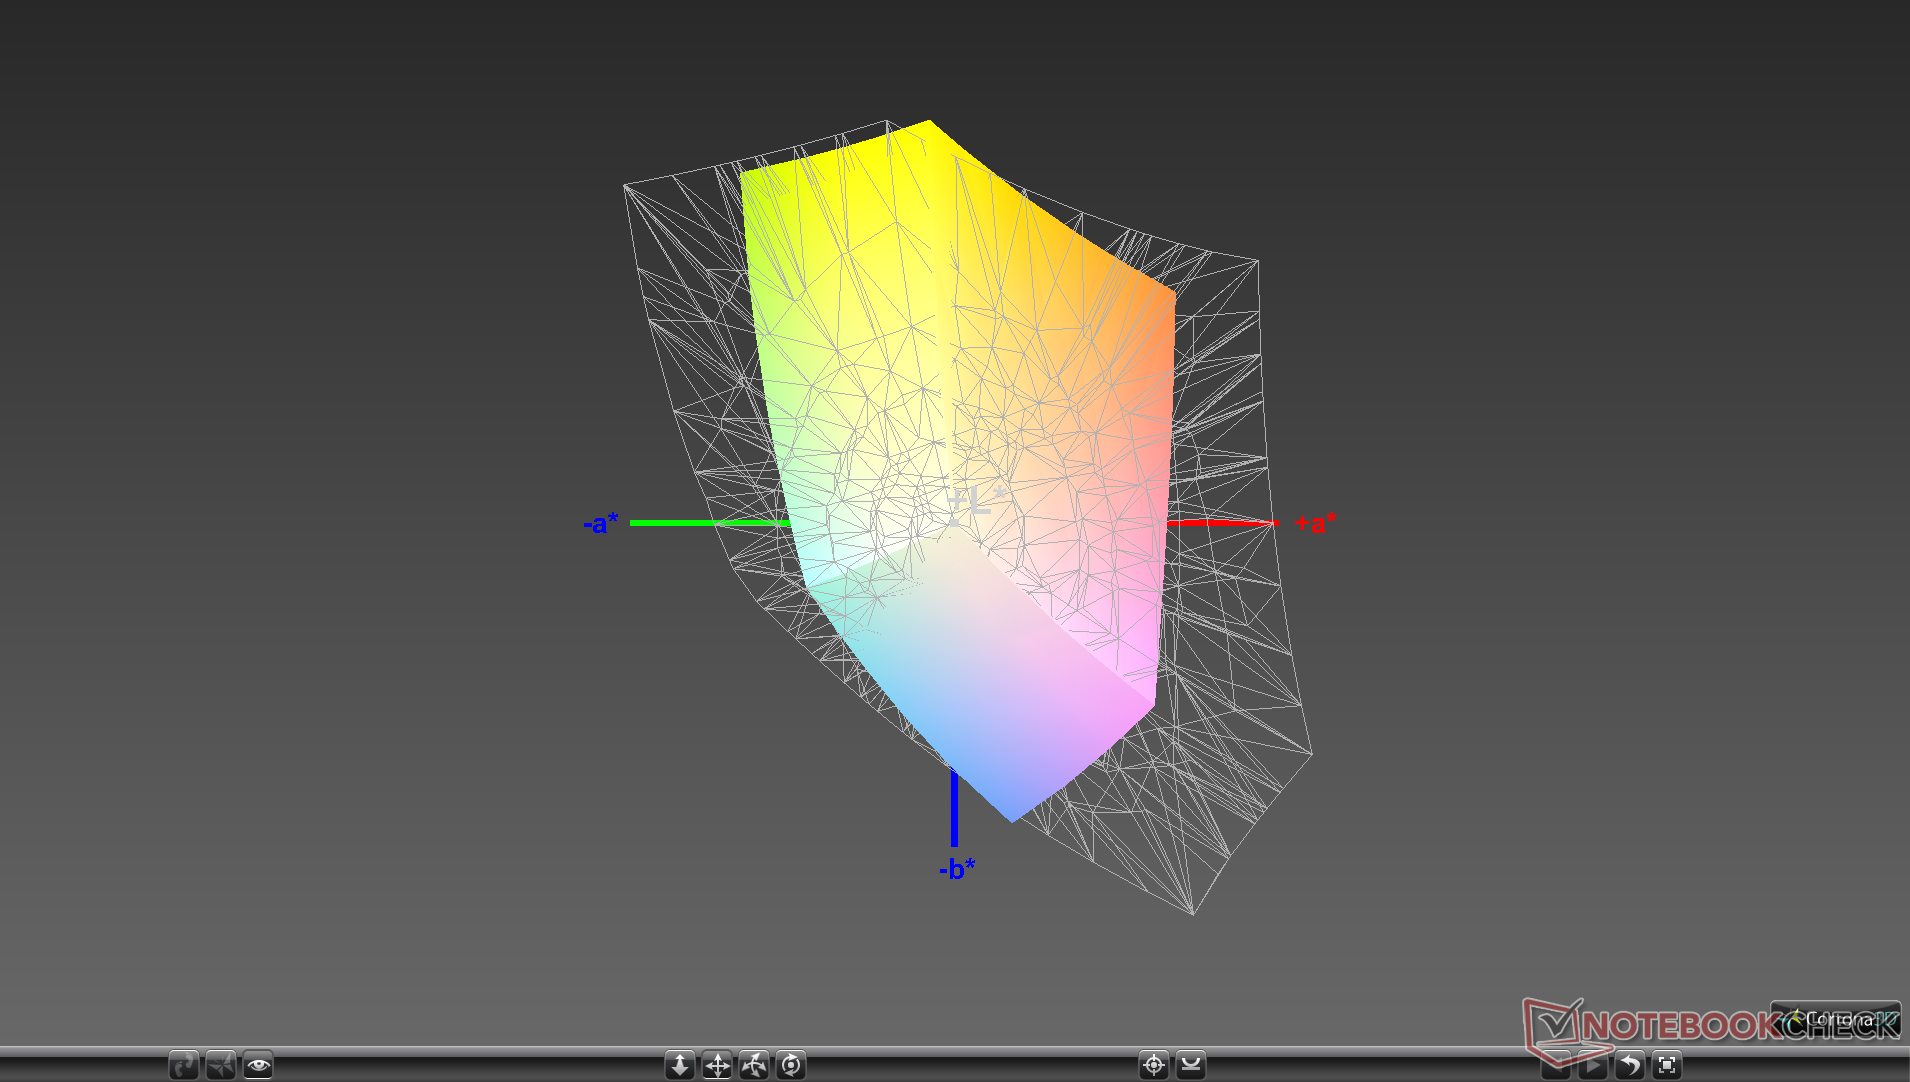
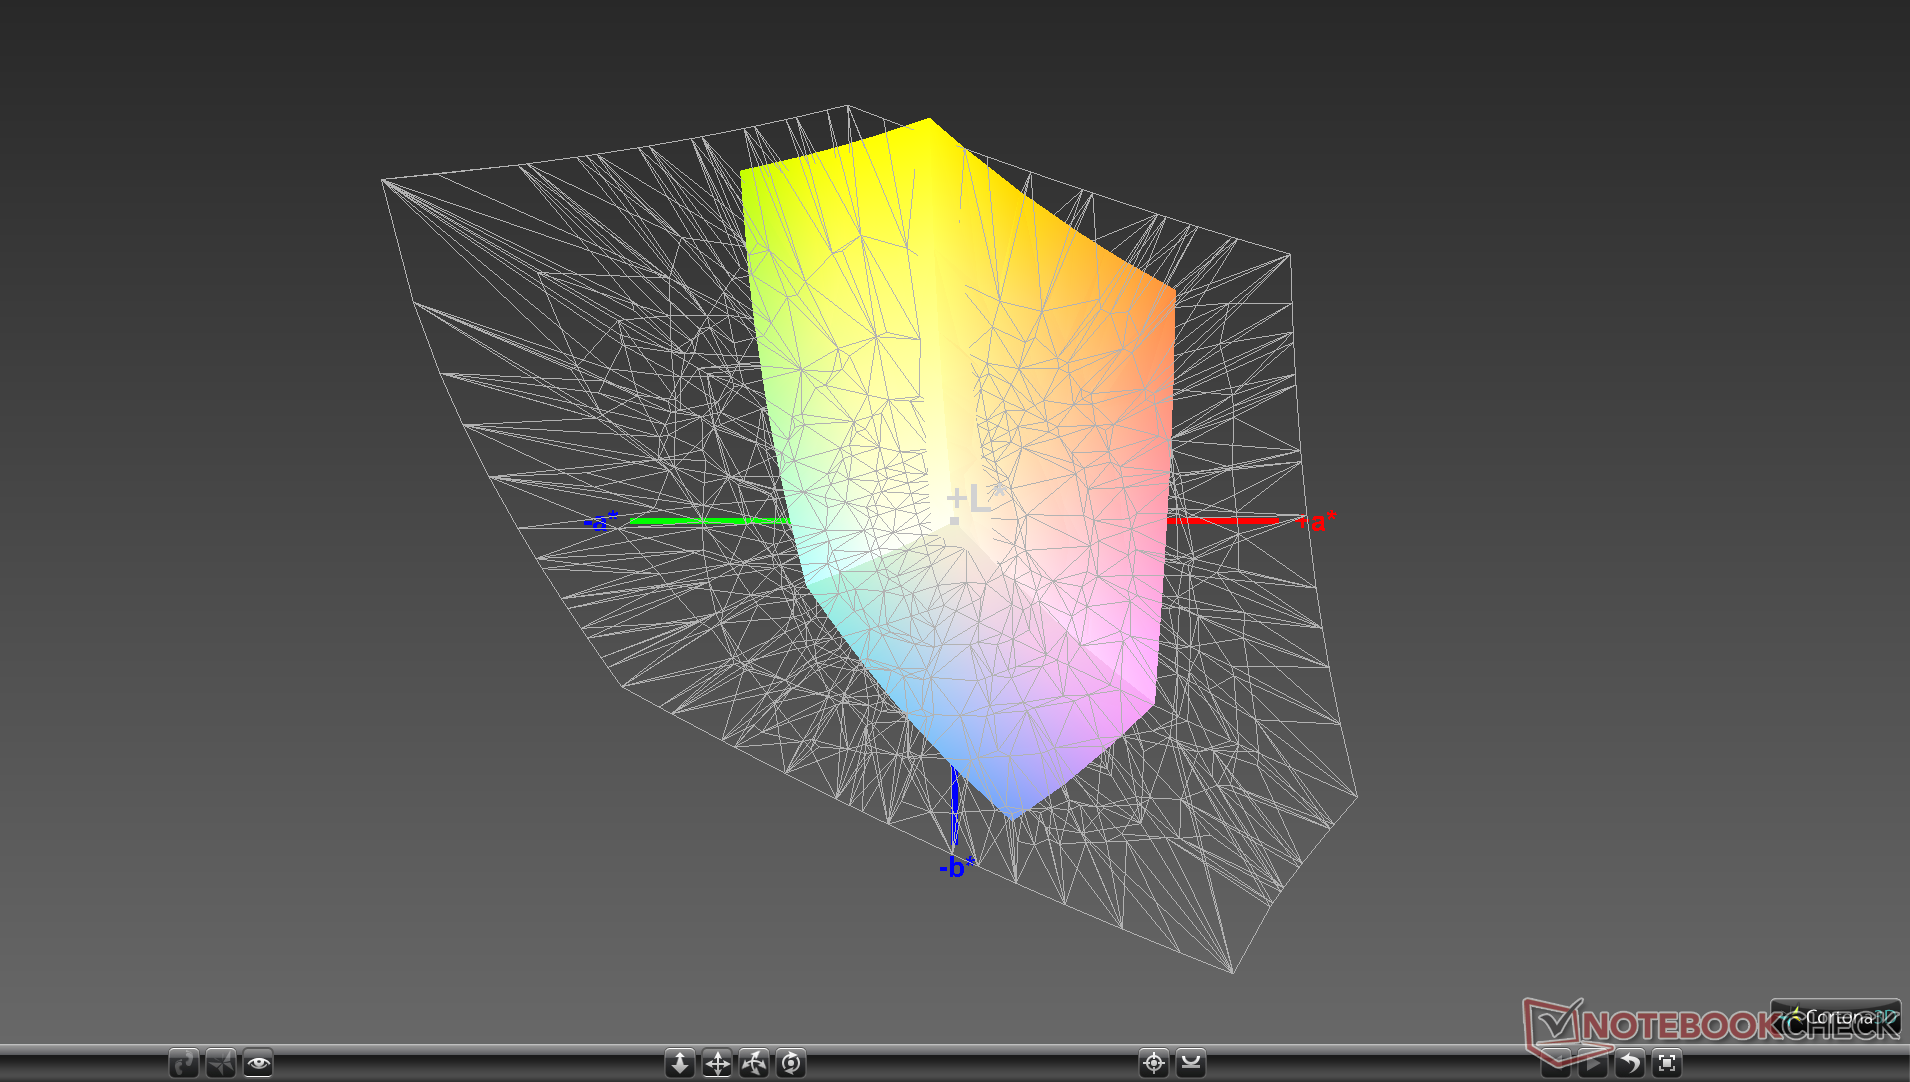
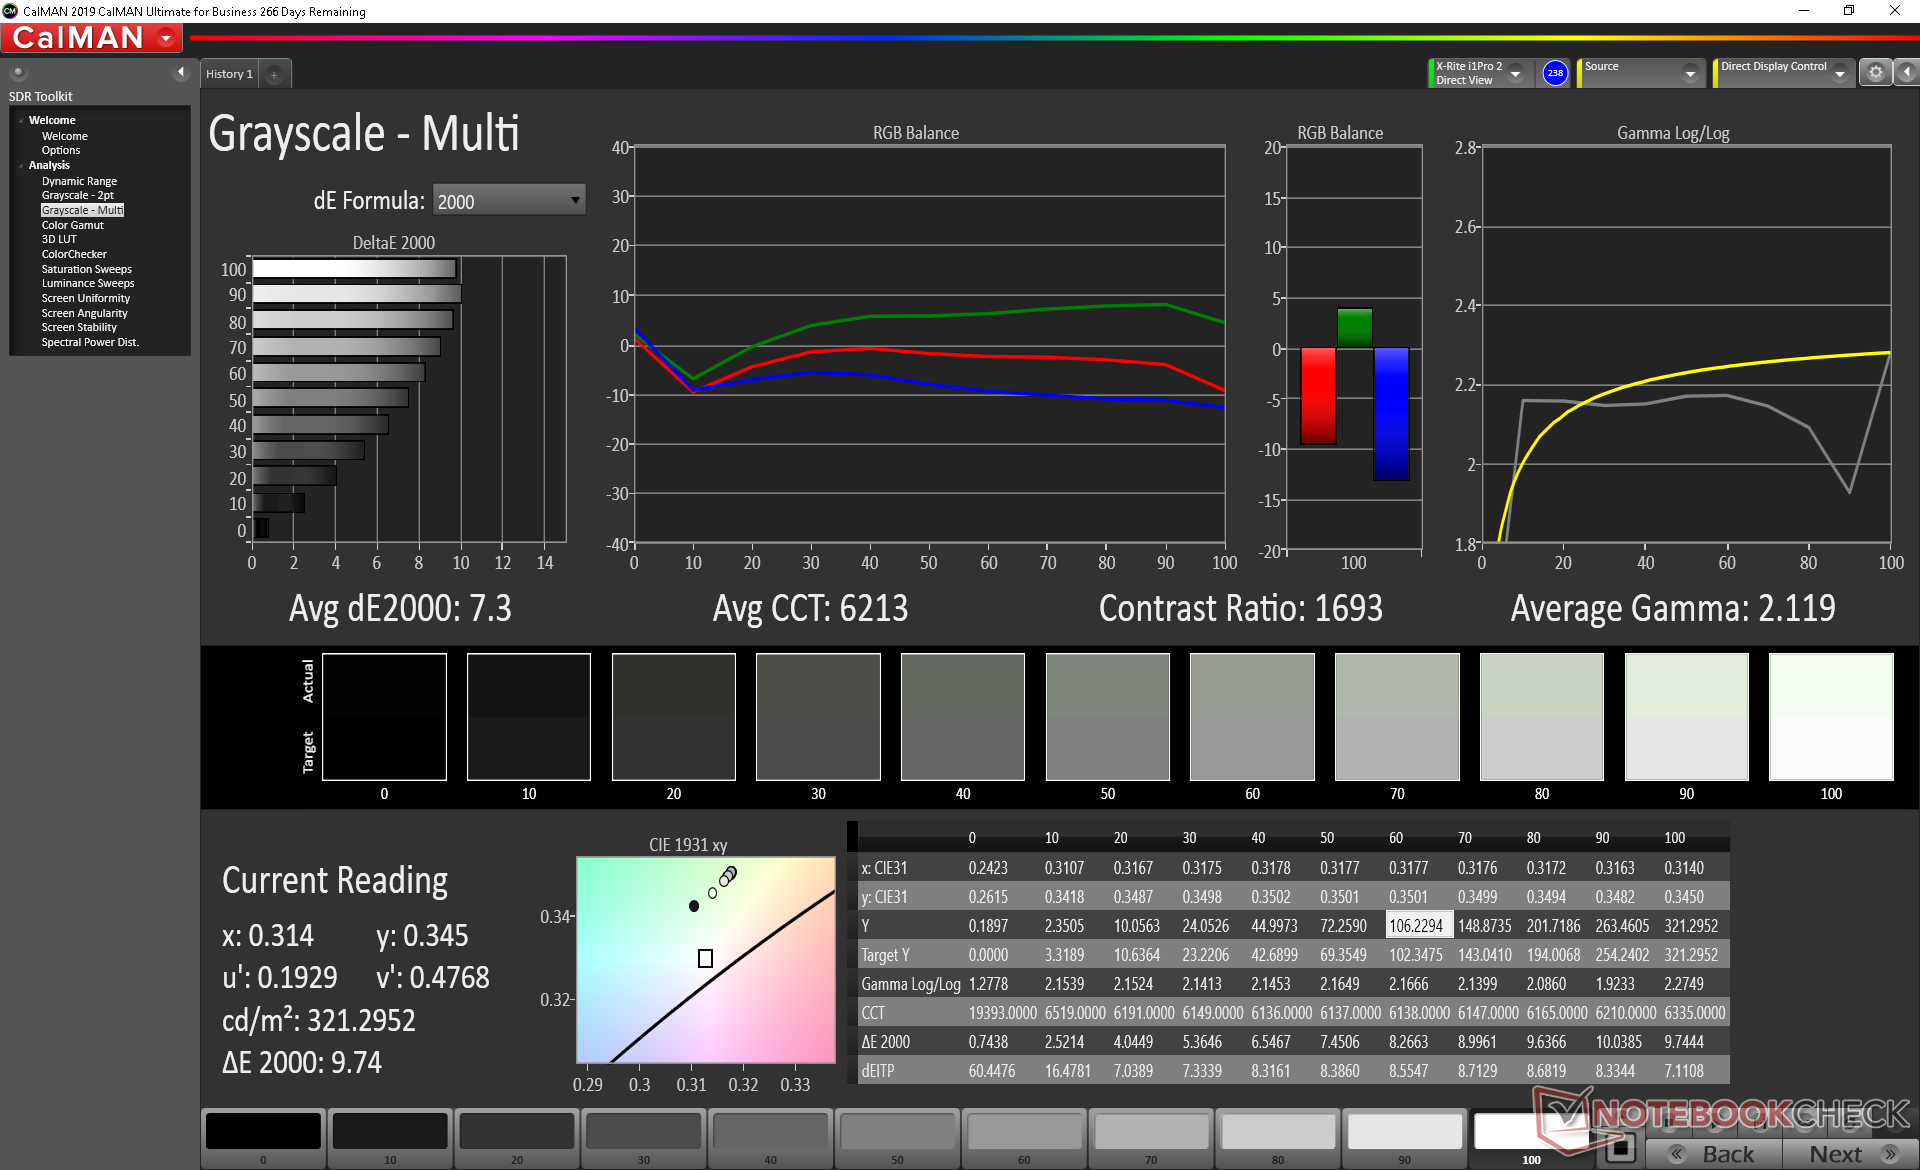
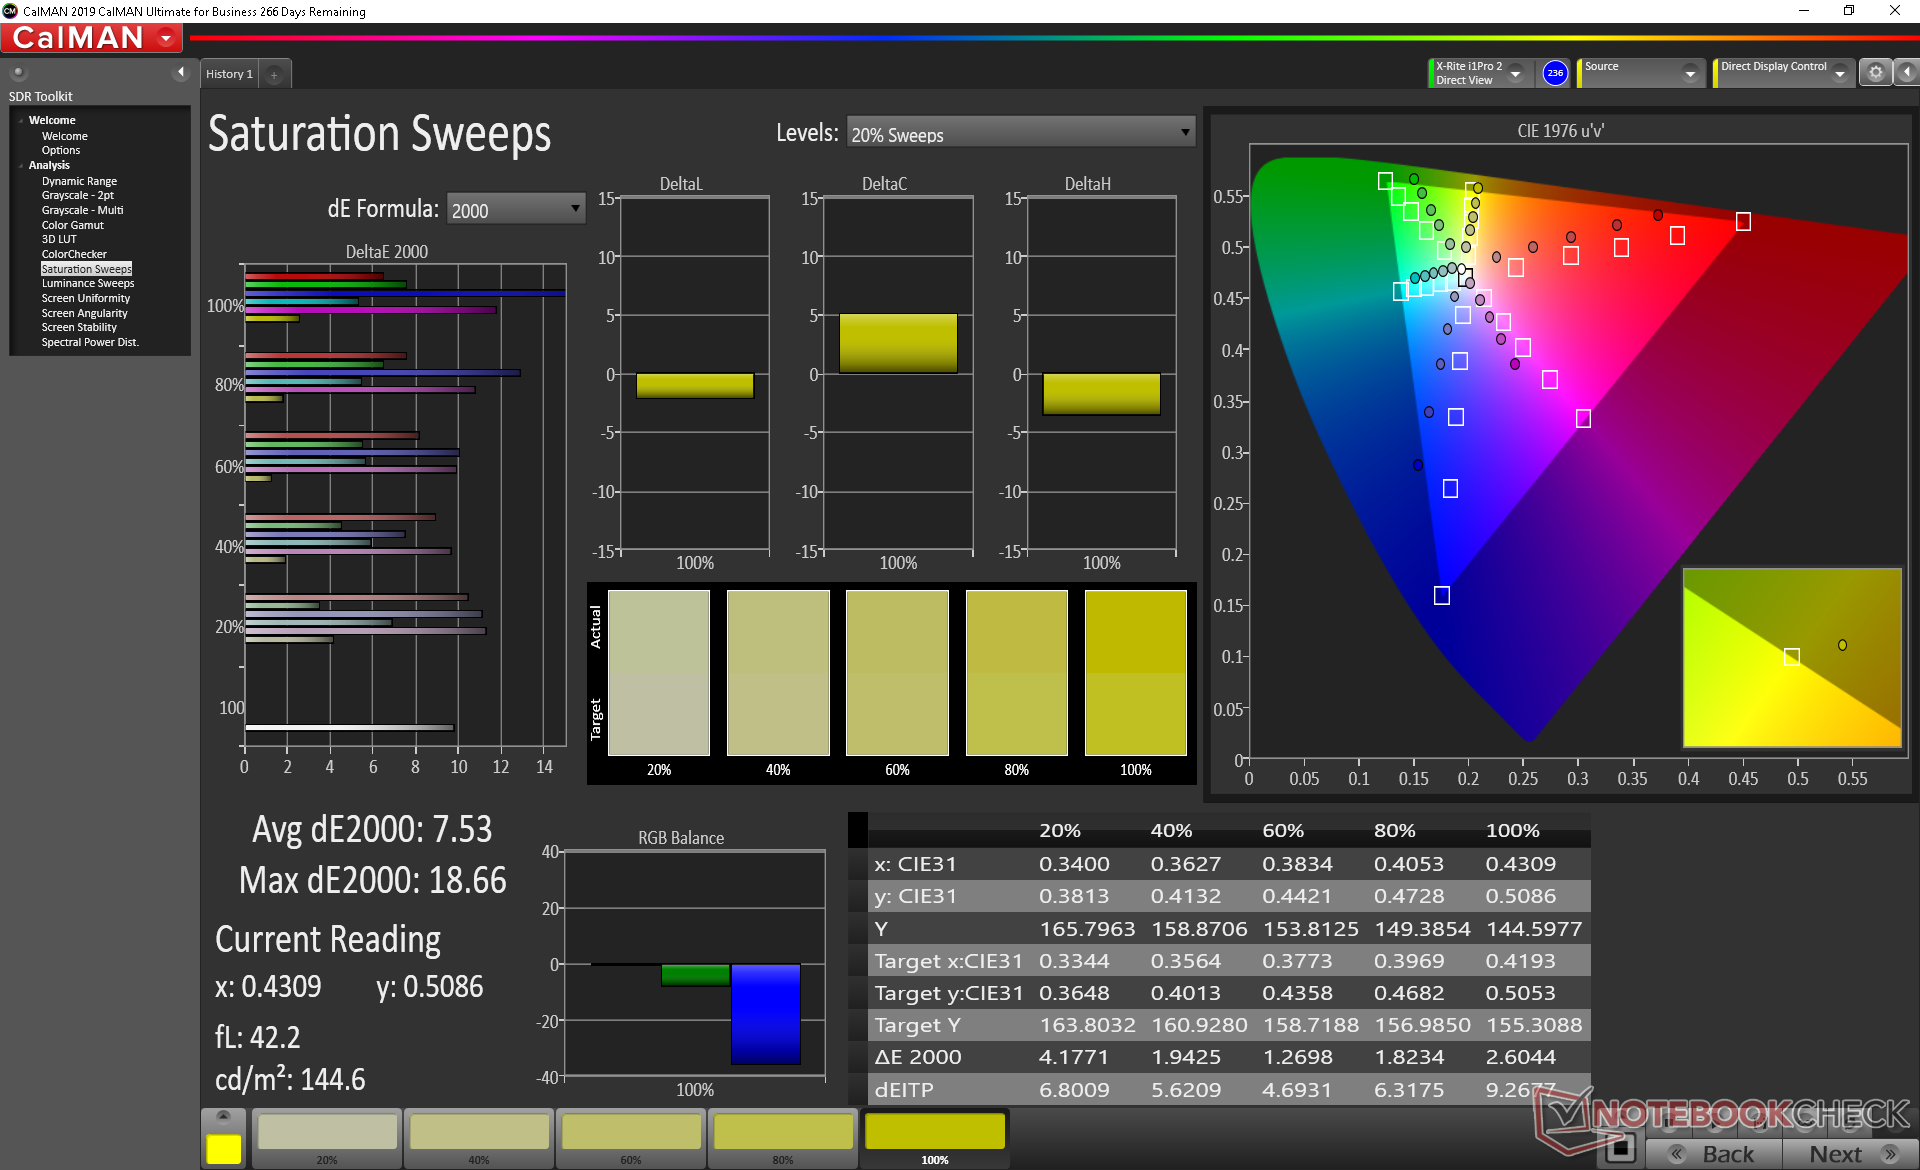
Further measurements with an X-Rite colorimeter reveal a warmer-than-usual color temperature whereas the grayscale on most other budget laptops are typically cooler. Calibrating the display ourselves addresses this drawback directly, but colors still become increasingly inaccurate at higher saturation levels due to the aforementioned narrow gamut.
Display Response Times
| ↔ Response Time Black to White | ||
|---|---|---|
| 35.2 ms ... rise ↗ and fall ↘ combined | ↗ 20.4 ms rise | 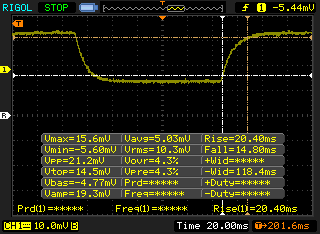 |
| ↘ 14.8 ms fall | ||
| The screen shows slow response rates in our tests and will be unsatisfactory for gamers. In comparison, all tested devices range from 0.1 (minimum) to 240 (maximum) ms. » 93 % of all devices are better. This means that the measured response time is worse than the average of all tested devices (19.8 ms). | ||
| ↔ Response Time 50% Grey to 80% Grey | ||
| 46.4 ms ... rise ↗ and fall ↘ combined | ↗ 26 ms rise | 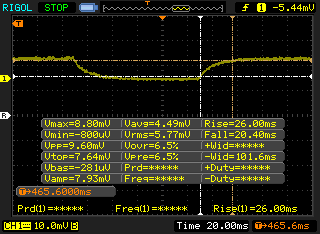 |
| ↘ 20.4 ms fall | ||
| The screen shows slow response rates in our tests and will be unsatisfactory for gamers. In comparison, all tested devices range from 0.165 (minimum) to 636 (maximum) ms. » 80 % of all devices are better. This means that the measured response time is worse than the average of all tested devices (30.9 ms). | ||
Screen Flickering / PWM (Pulse-Width Modulation)
| Screen flickering / PWM not detected | 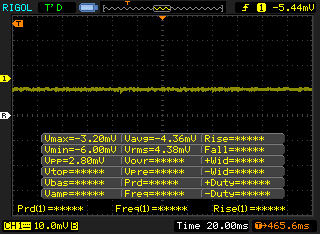 | ||
In comparison: 52 % of all tested devices do not use PWM to dim the display. If PWM was detected, an average of 7744 (minimum: 5 - maximum: 343500) Hz was measured. | |||
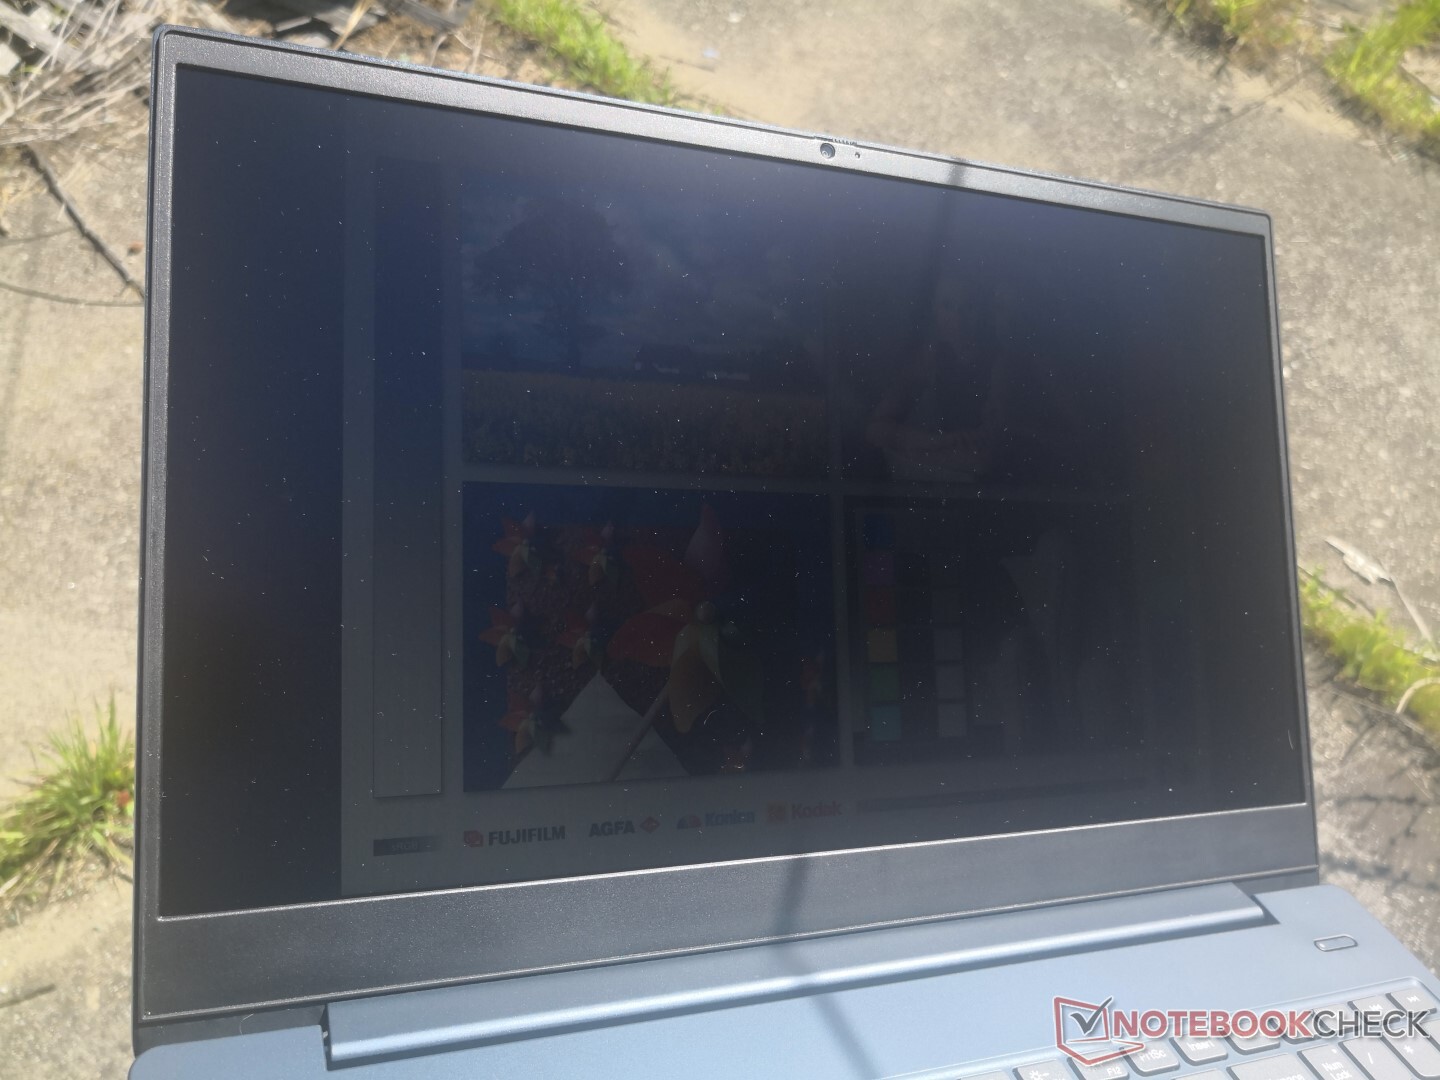
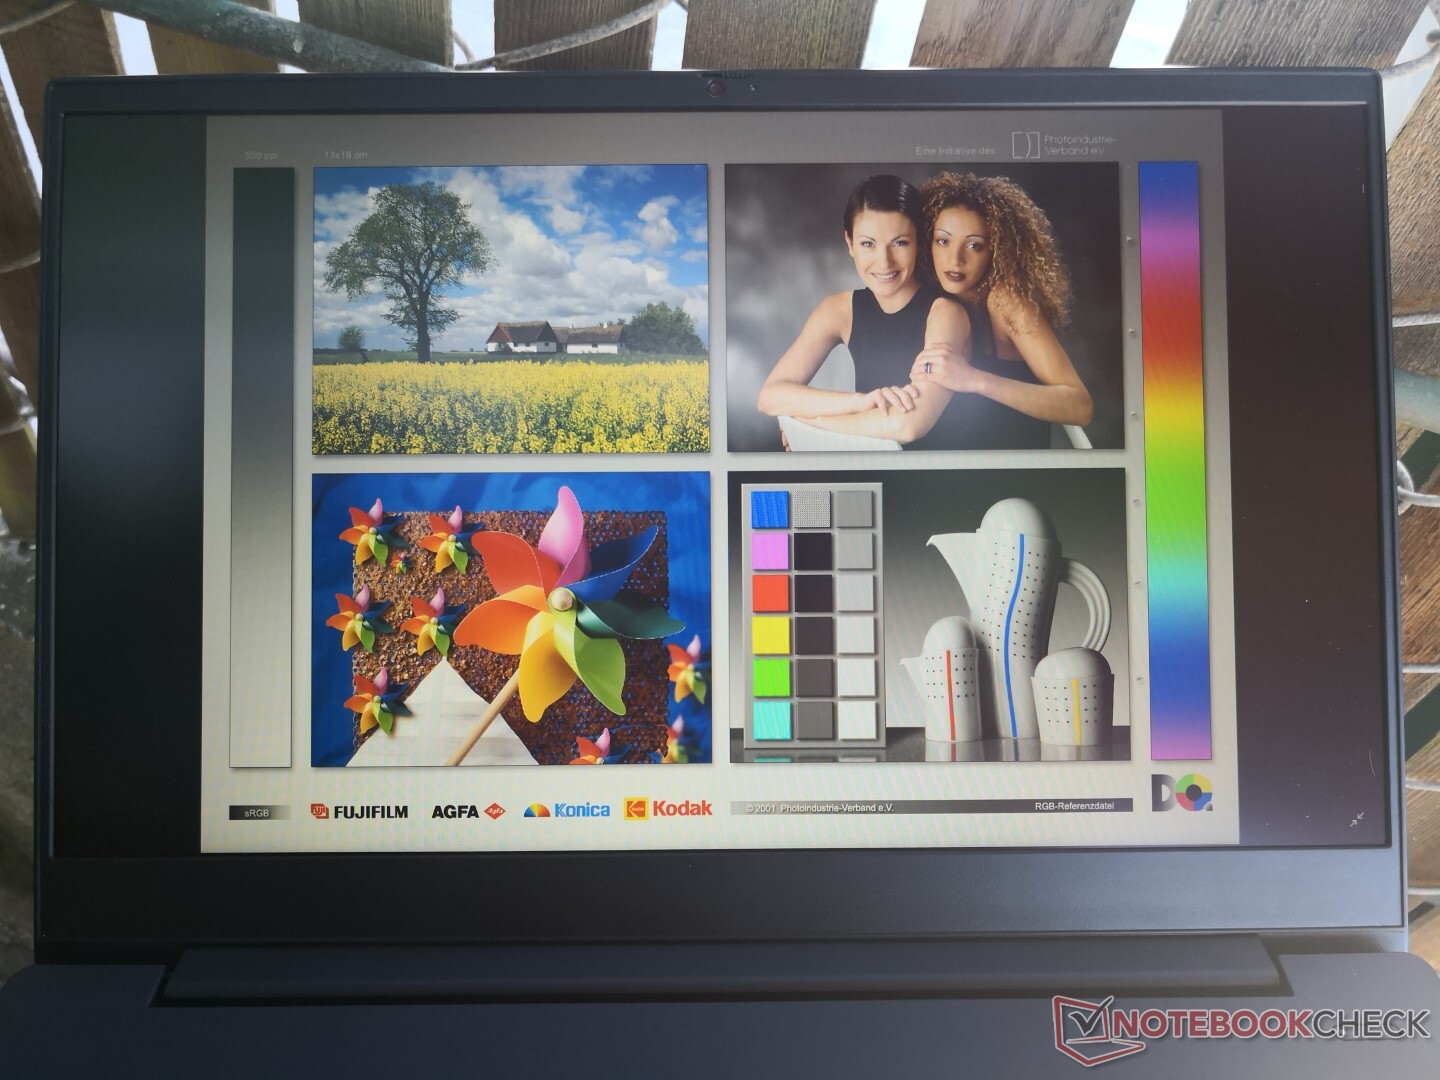
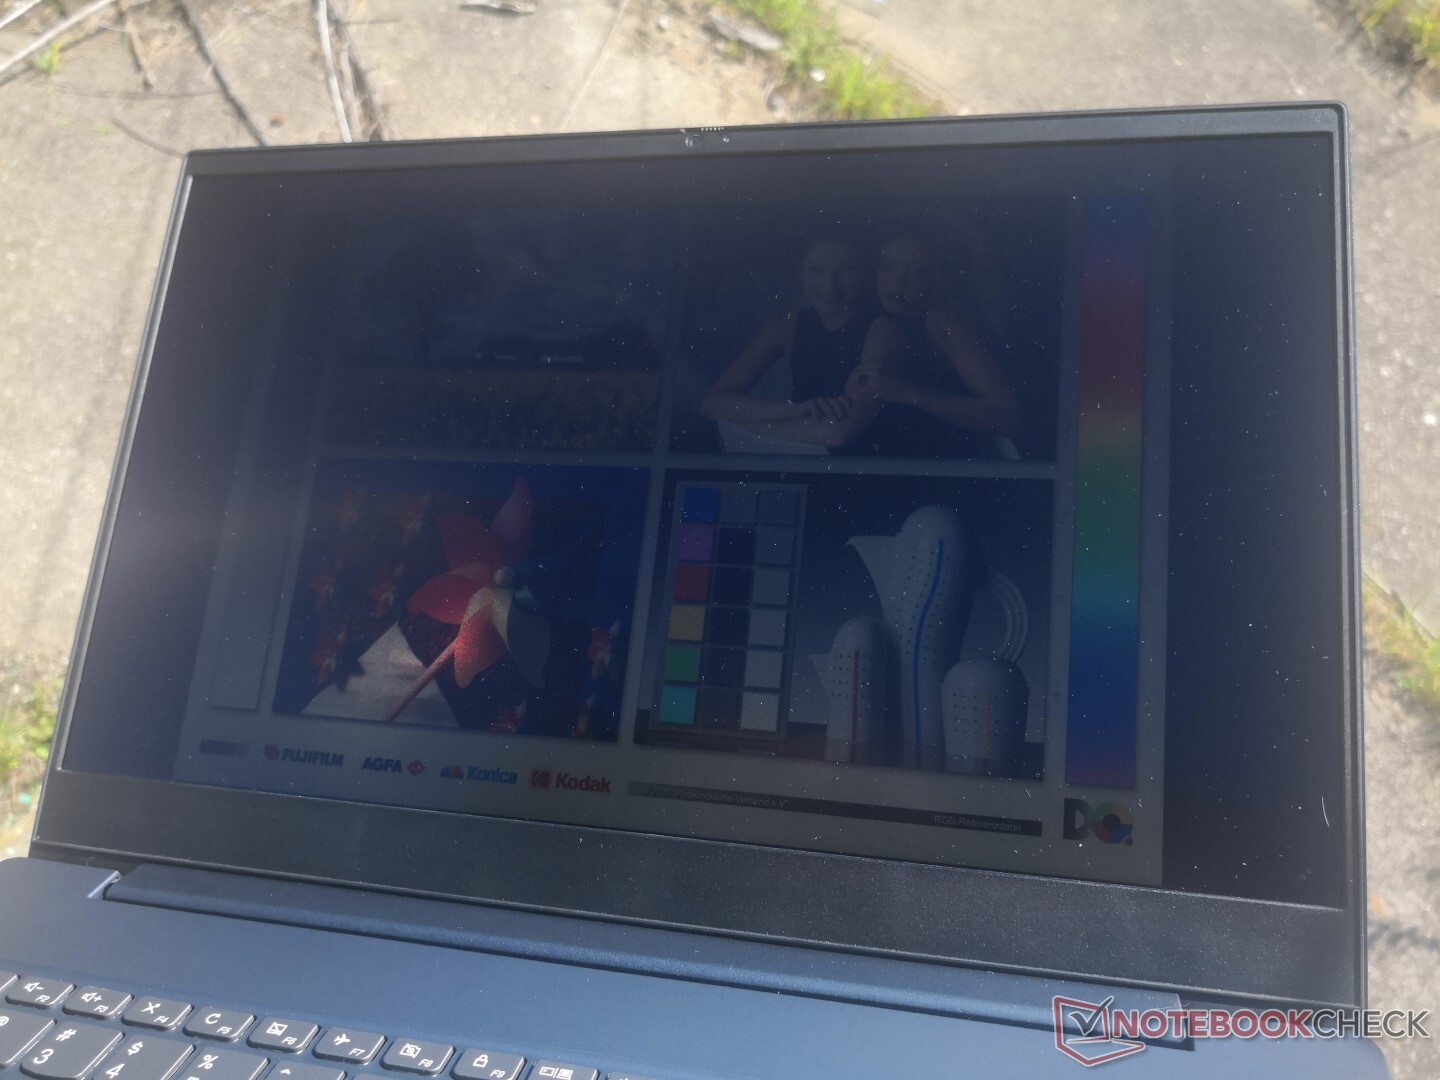
Outdoor visibility is in line with direct competitors like the HP Pavilion or Asus VivoBook meaning that it's just average at best. Sunlight will wash out the screen meaning shade will be your best bet if outdoor use is necessary. Costlier laptops like the XPS 15 or MacBook Pro are almost two times brighter.
Performance
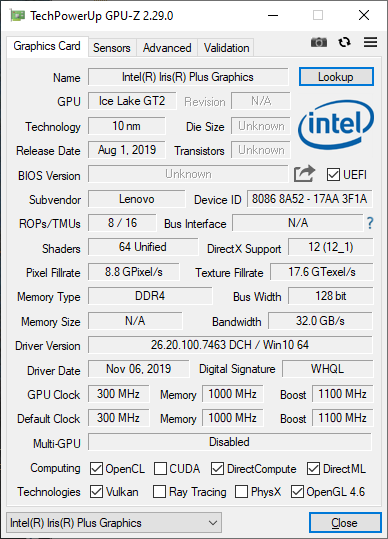
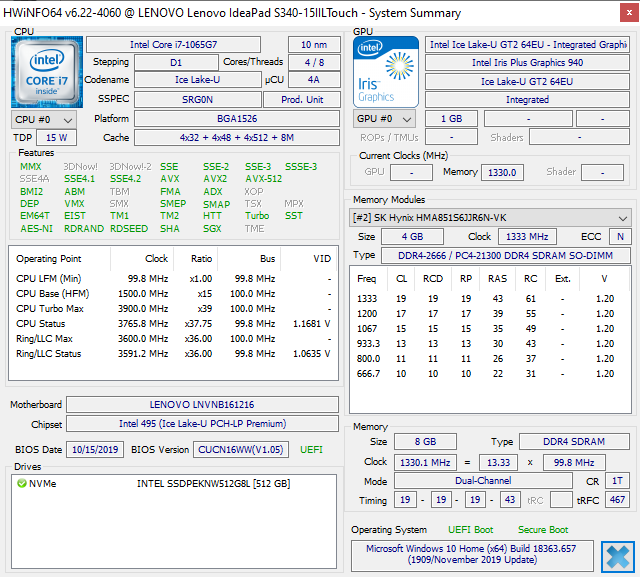
The Intel Core U series targets casual users who primarily browse, stream, and email in contrast to the Intel Core H series which targets power users, video editors, and gamers. The new Intel 10th gen Core i7 Ice Lake CPU offers roughly the same processor performance as last year's Whiskey Lake-U series albeit with much improved graphics potential to boost photo editing and the occasional game of Rocket League or DOTA 2. The IdeaPad S340-15 series offers no dedicated graphics options.
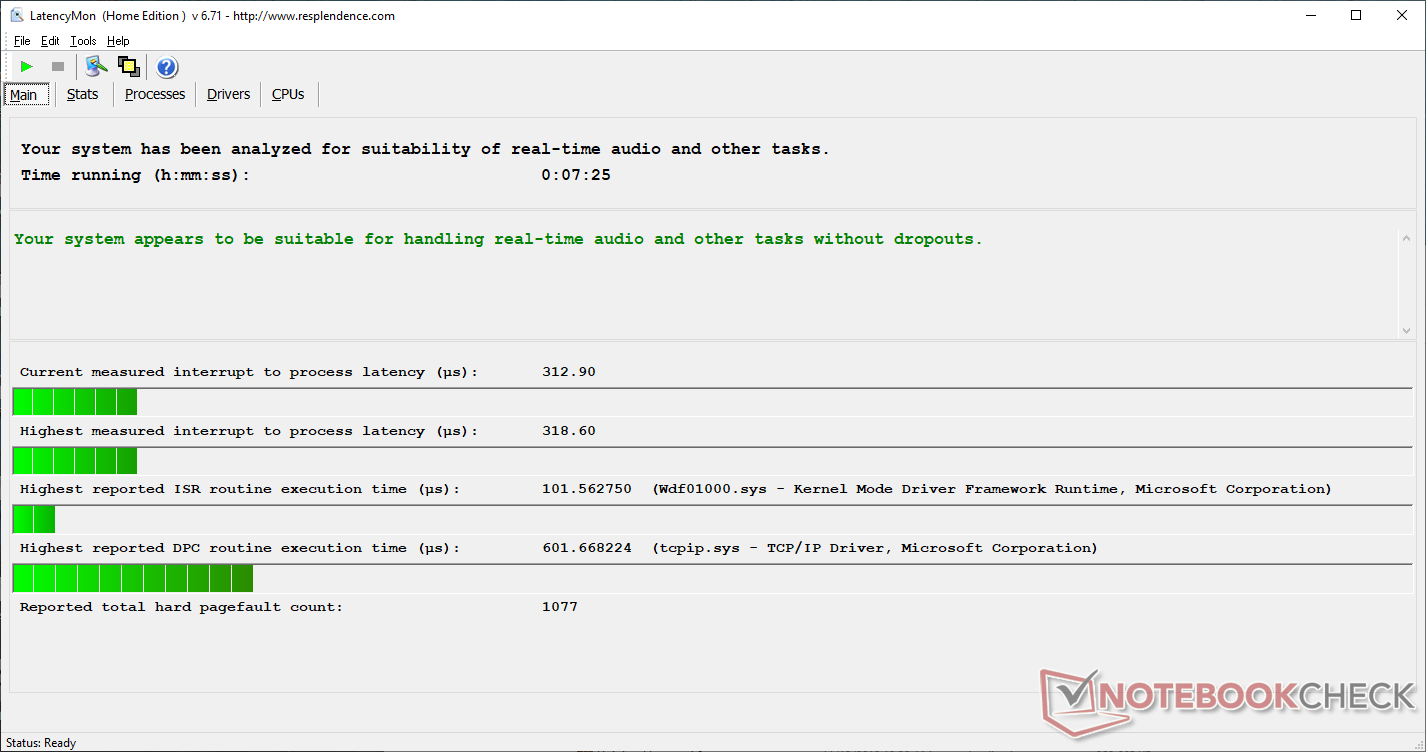
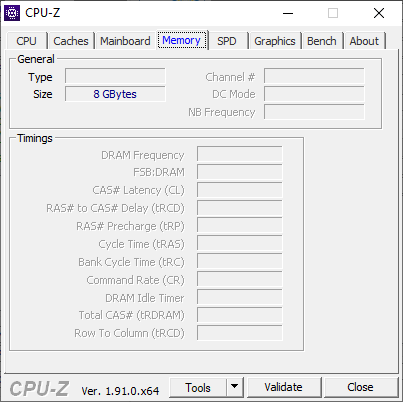
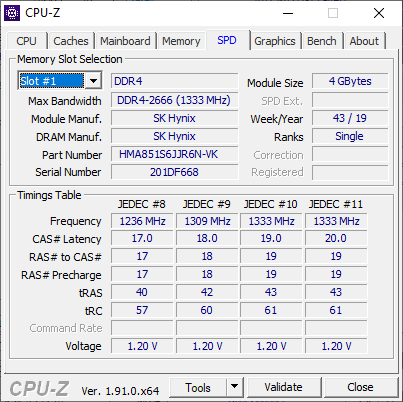
There is 4 GB of soldered RAM with one free DDR4 SODIMM slot for expansion. LatencyMon shows no recurring DPC latency issues even with wireless enabled.
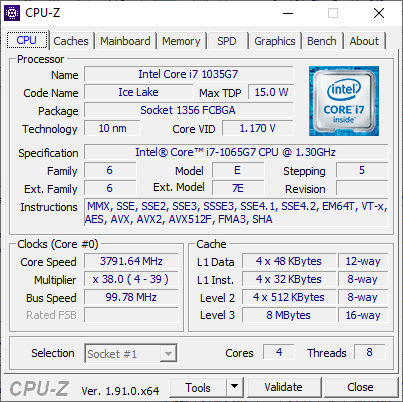
Processor
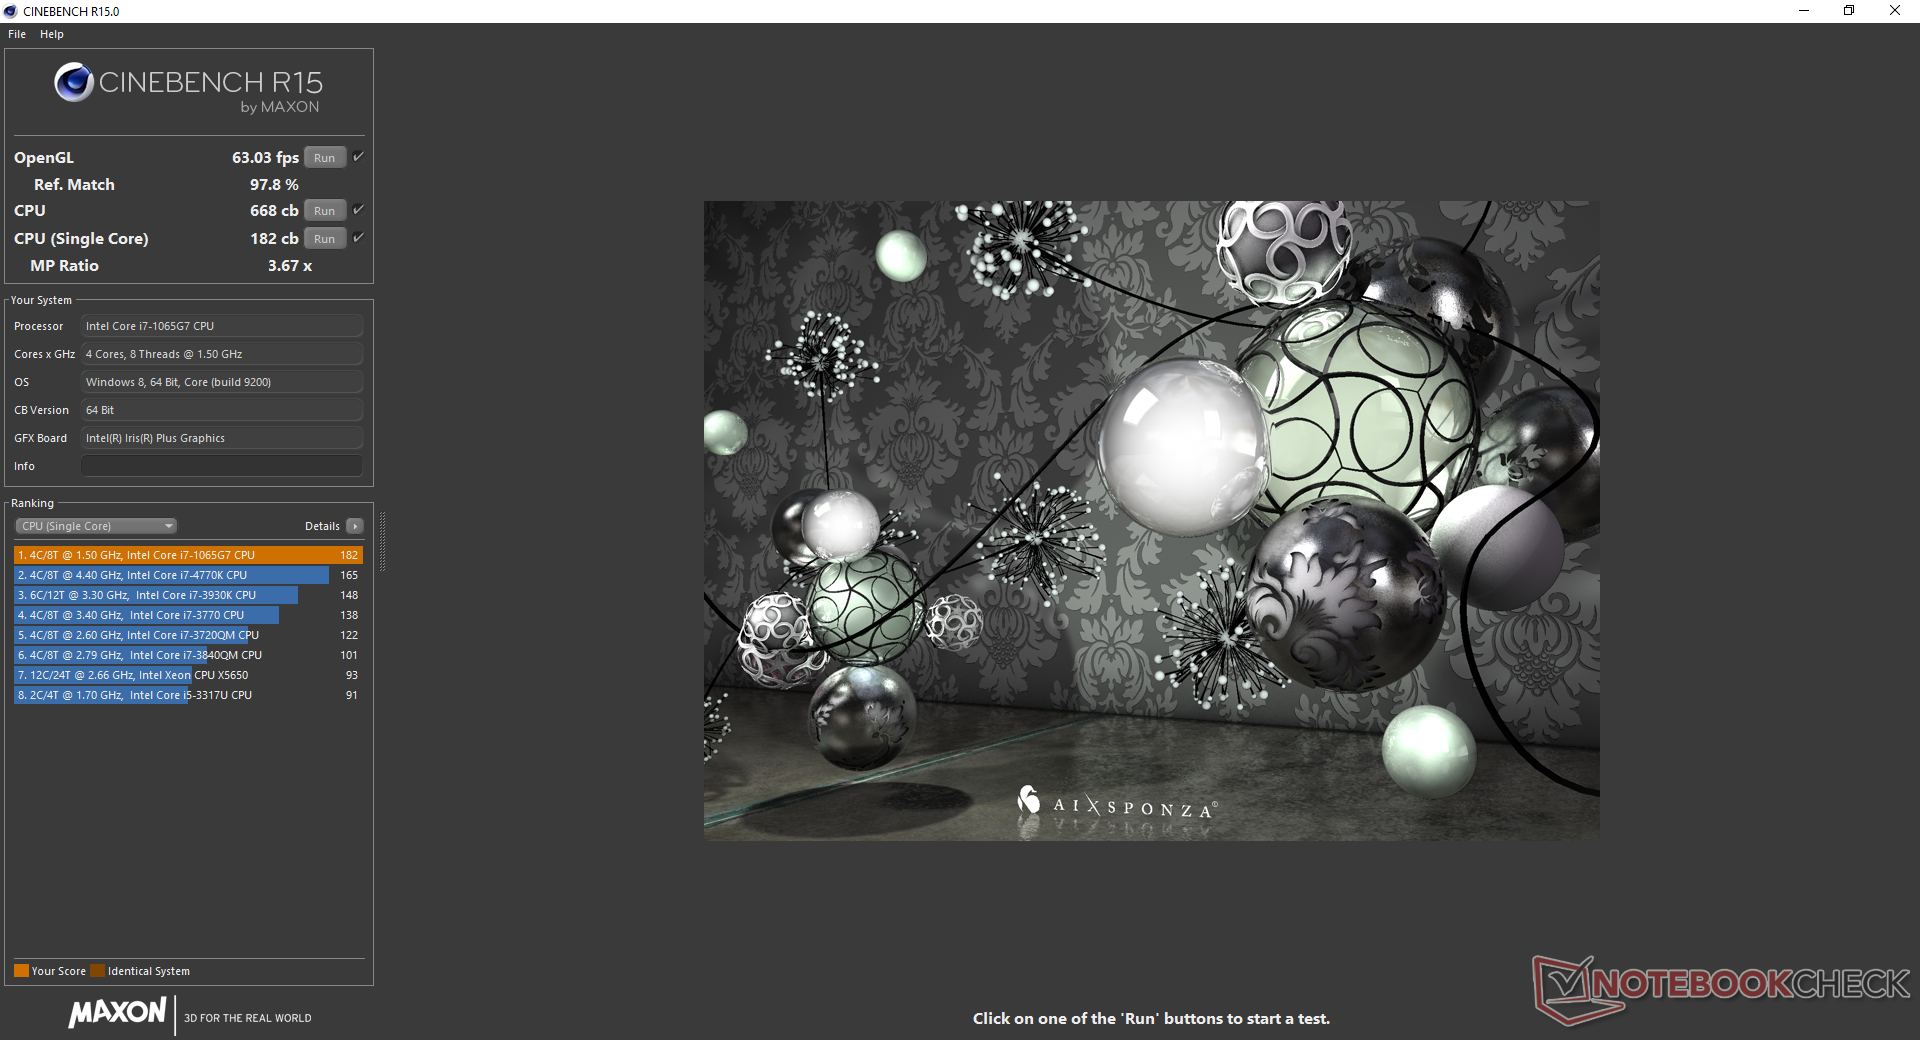
According to CineBench R15 and R20, CPU performance is where we expect it to be at within 5 percent of the average Core i7-1065G7 in our database. The problem arises when running these same benchmarks in an endless loop to test the performance sustainability of the laptop. When running CineBench R15 Multi-Thread in a loop, for example, the initial score of 738 points would drop to as low as 460 points after four complete loops to represent a massive 38 percent decrease in processor performance over time. In contrast, the Surface Laptop 3 15 equipped with the same Core i7-1065G7 CPU would dip by just 6 to 7 percent.
Strangely, CPU performance would occasionally spike back up to normal before dipping back down again as shown by our graph below. This wide performance delta and cycling behavior are unfavorable characteristics for users who want consistent CPU performance when running extreme processing loads.
See our dedicated page on the Core i7-1065G7 for more technical information and benchmark comparisons.
| wPrime 2.10 - 1024m | |
| Average Intel Core i7-1065G7 (233 - 354, n=3) | |
| Microsoft Surface Laptop 3 13 Core i5-1035G7 | |
* ... smaller is better
System Performance
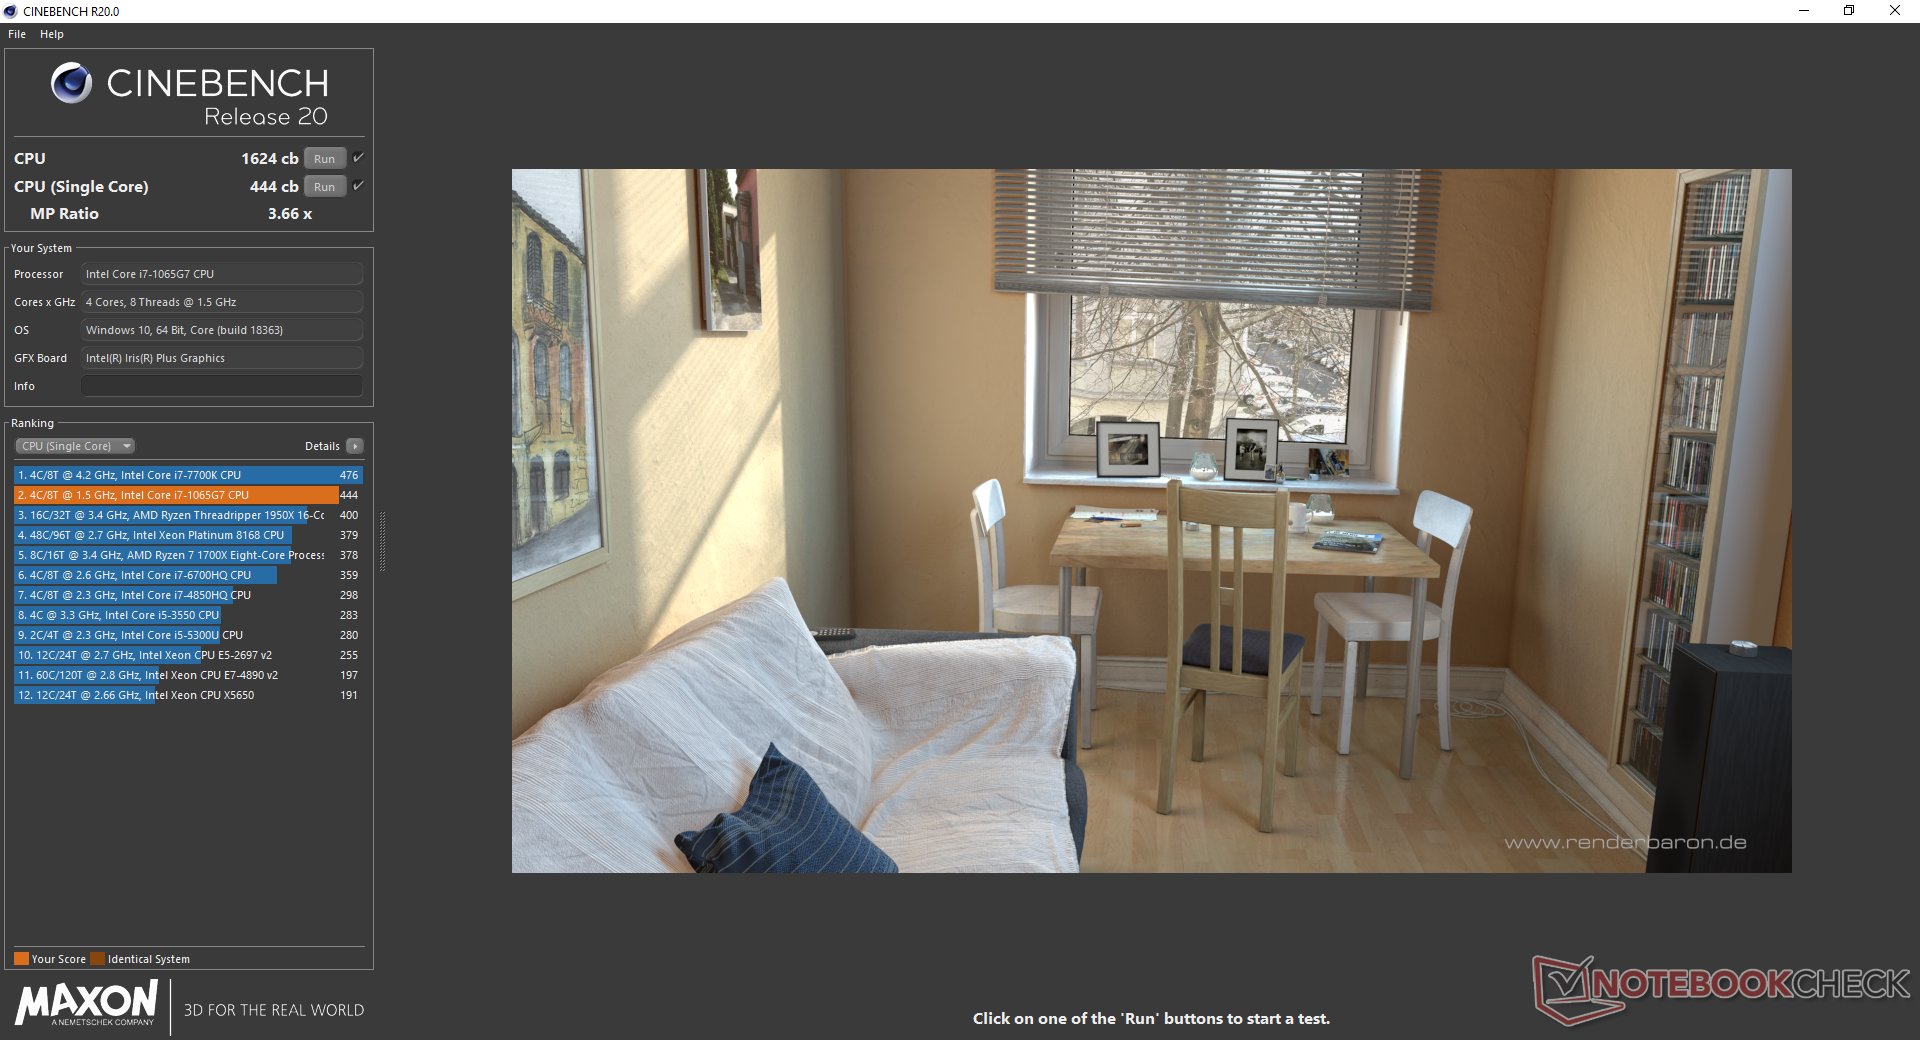
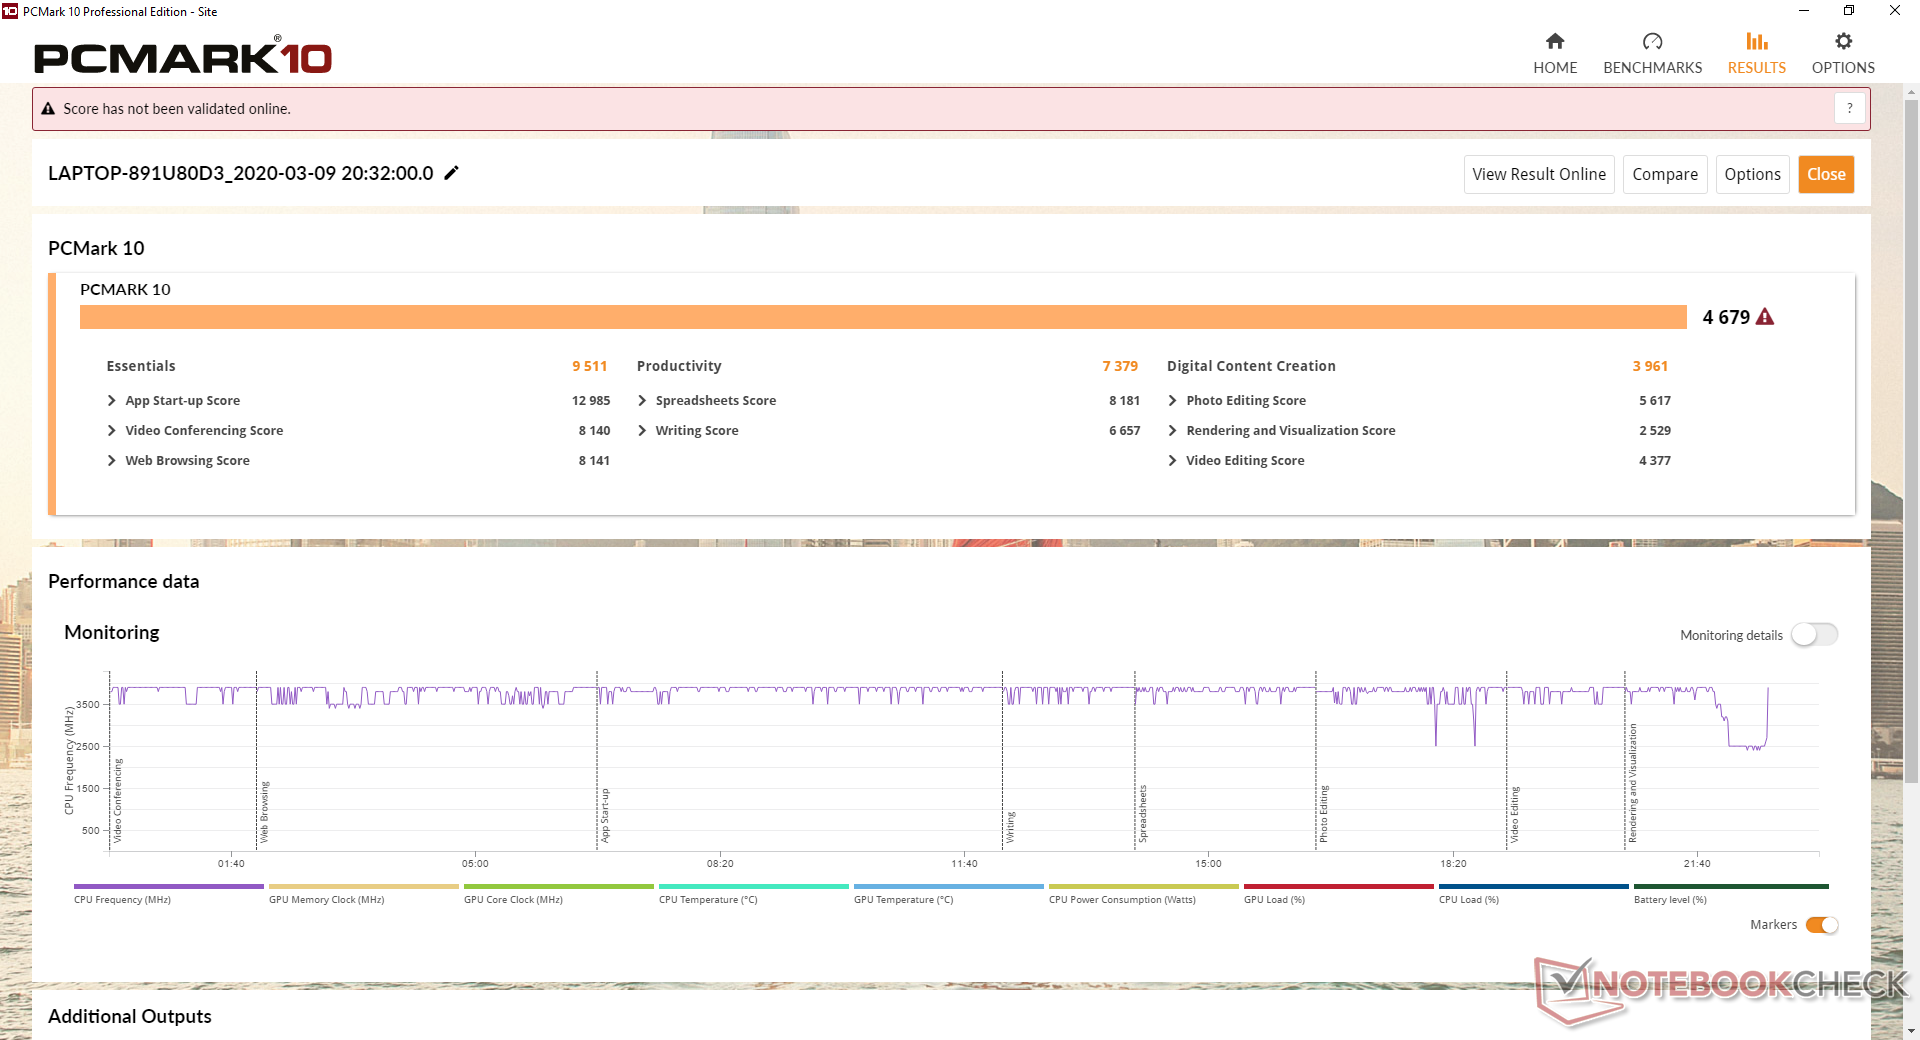
PCMark results are where we expect them to be in relation to other laptops equipped with the same Core i7-1065G7 CPU even though the system buckles under high stress as exemplified by our benchmarks above. This suggests that the system will run normally during day-to-day browsing or streaming loads. Power users who want the most out of the Ice Lake CPU, however, may want to look at the Yoga C940 instead.
We experienced no notable software or hardware hiccups during our time with the test unit.
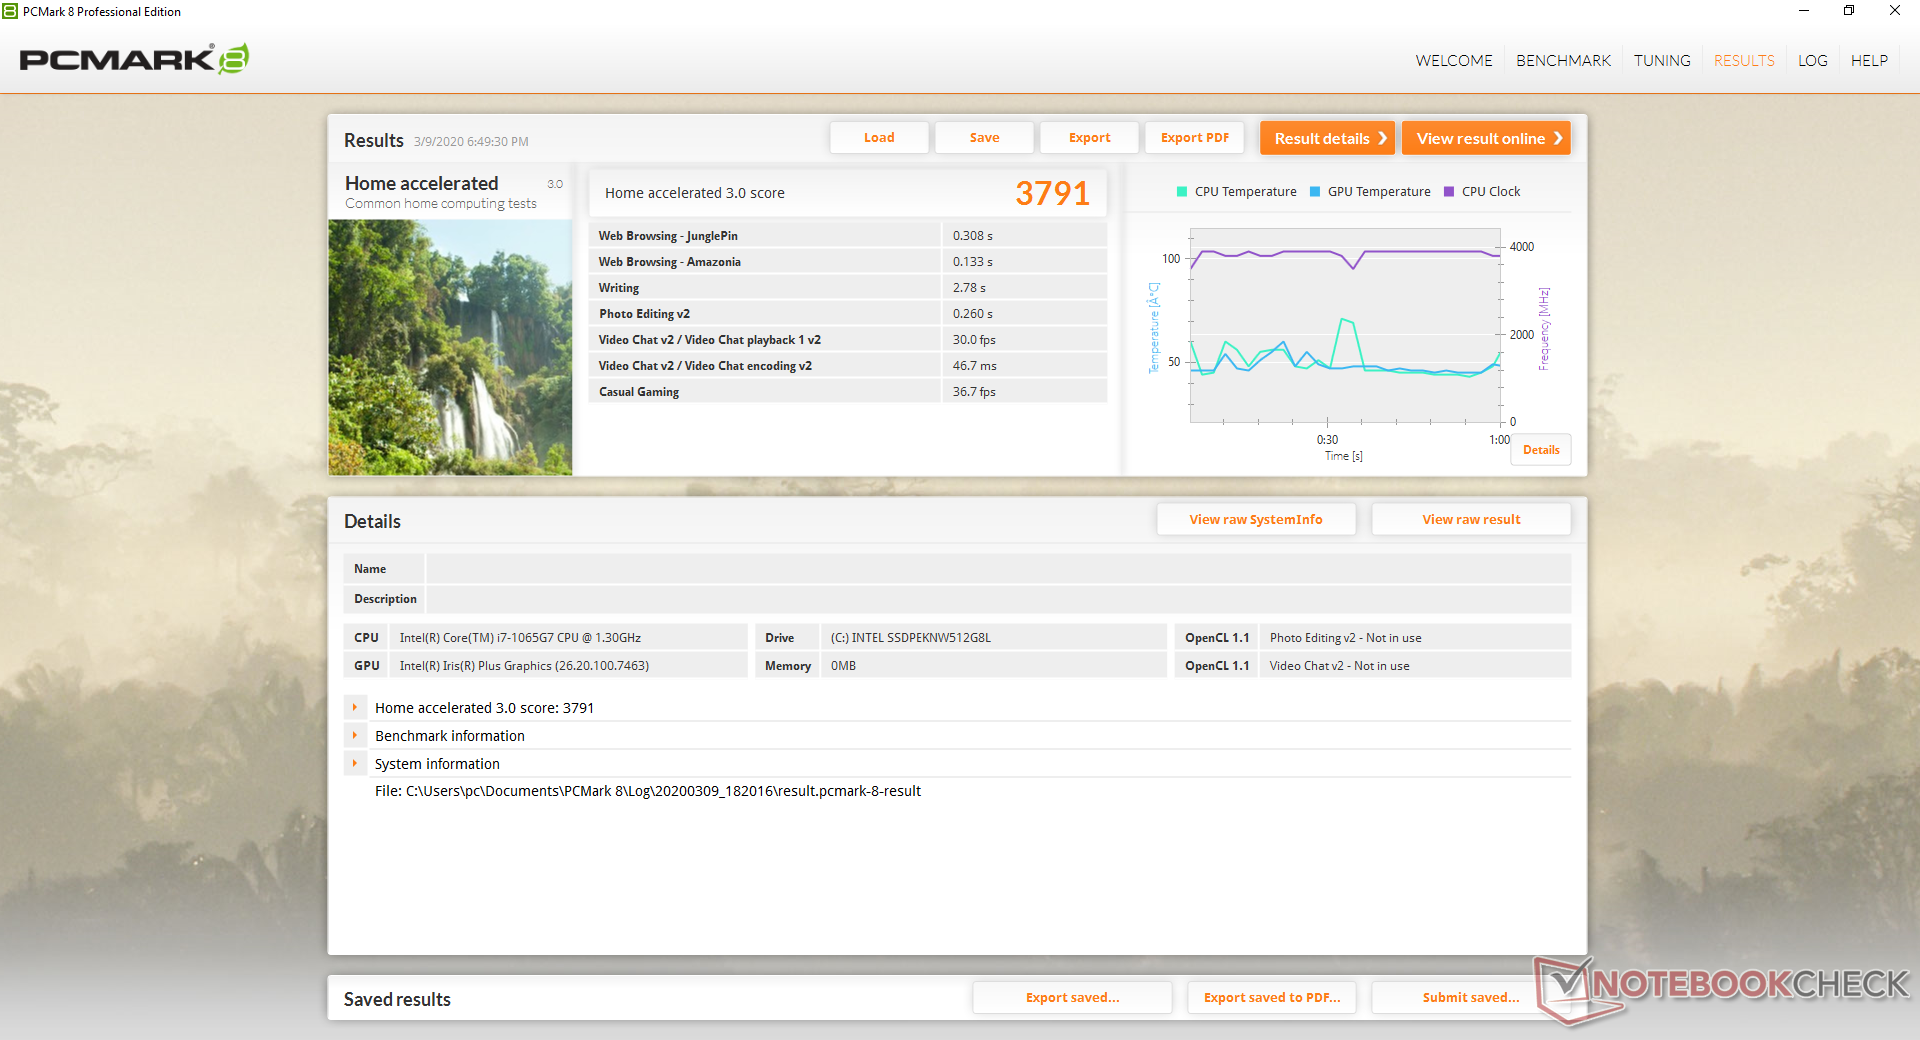
| PCMark 8 | |
| Home Score Accelerated v2 | |
| Dell XPS 15 7590 i5 iGPU FHD | |
| Asus VivoBook 15 X512FL-EJ205T | |
| Lenovo Ideapad S340-15IIL | |
| Average Intel Core i7-1065G7, Intel Iris Plus Graphics G7 (Ice Lake 64 EU) (3305 - 4275, n=17) | |
| Dell Inspiron 15 5000 5585 | |
| HP Pavilion 15-cw1212ng | |
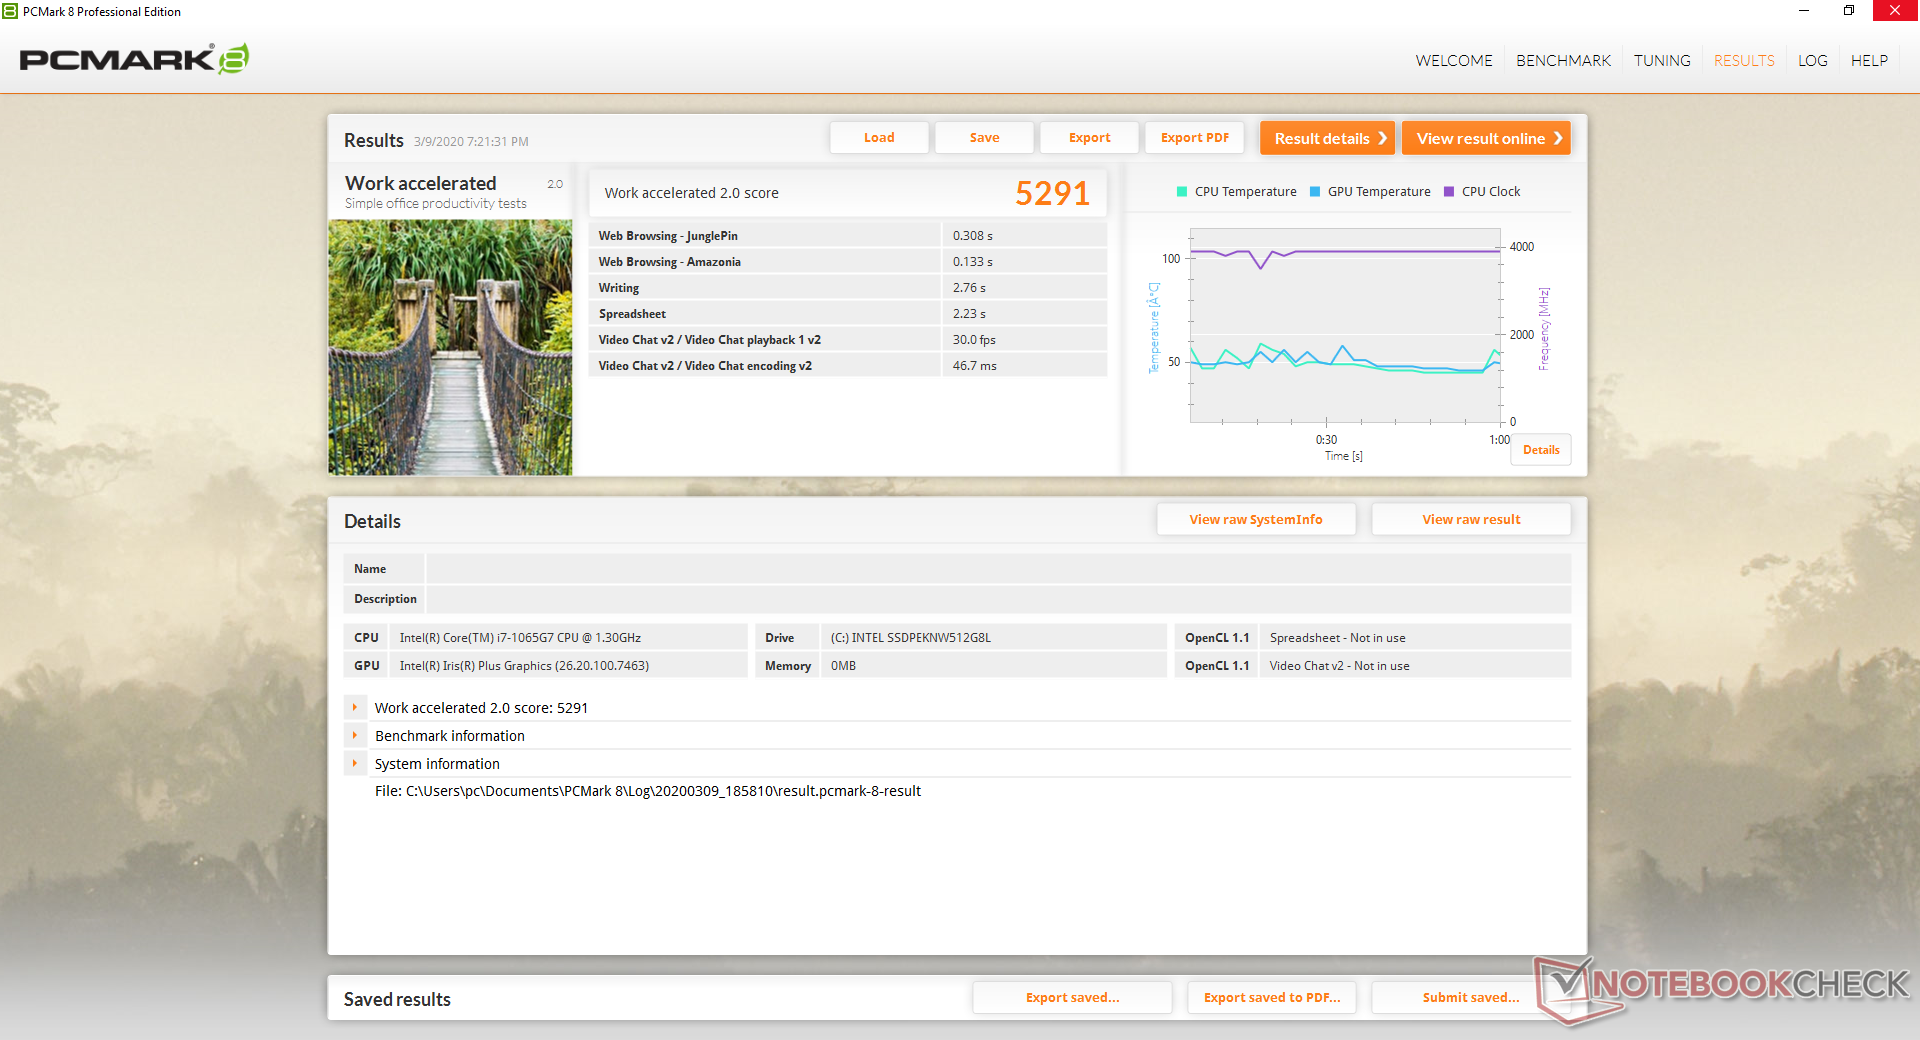
| Work Score Accelerated v2 | |
| Lenovo Ideapad S340-15IIL | |
| Dell XPS 15 7590 i5 iGPU FHD | |
| Asus VivoBook 15 X512FL-EJ205T | |
| HP Pavilion 15-cw1212ng | |
| Dell Inspiron 15 5000 5585 | |
| Average Intel Core i7-1065G7, Intel Iris Plus Graphics G7 (Ice Lake 64 EU) (2460 - 5291, n=17) | |
| PCMark 8 Home Score Accelerated v2 | 3791 points | |
| PCMark 8 Work Score Accelerated v2 | 5291 points | |
| PCMark 10 Score | 4679 points | |
Help | ||
Storage Devices
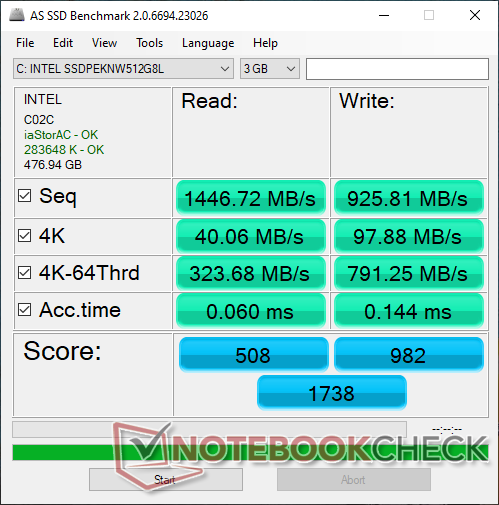
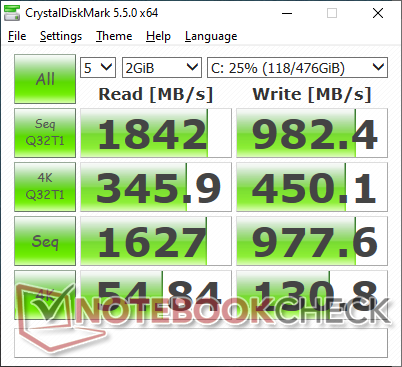
An M.2 2280 PCIe slot and 2.5-inch SATA III bay are available. Our test unit comes with a 512 GB Intel 660p which is a budget NVMe SSD in contrast to the pricier Samsung PM981 series or Intel's newer 760p series. Still, sequential read and write rates are at least two times faster than any SATA III SSD to be more than enough for the target casual home, school, or office user.
| Lenovo Ideapad S340-15IIL Intel SSD 660p SSDPEKNW512G8 | Dell XPS 15 7590 i5 iGPU FHD Toshiba XG6 KXG60ZNV512G | Dell Inspiron 15 5000 5585 WDC PC SN520 SDAPNUW-512G | Asus VivoBook 15 X512FL-EJ205T Kingston RBUSNS8154P3512GJ | Lenovo Ideapad S540-15IML Samsung SSD PM981a MZVLB512HBJQ | |
|---|---|---|---|---|---|
| AS SSD | 71% | 9% | -31% | 128% | |
| Seq Read (MB/s) | 1447 | 2357 63% | 398.9 -72% | 1348 -7% | 2642 83% |
| Seq Write (MB/s) | 926 | 1235 33% | 884 -5% | 685 -26% | 2433 163% |
| 4K Read (MB/s) | 40.06 | 43.29 8% | 34.54 -14% | 29.15 -27% | 58 45% |
| 4K Write (MB/s) | 97.9 | 99.7 2% | 82.1 -16% | 90.3 -8% | 145.3 48% |
| 4K-64 Read (MB/s) | 323.7 | 1020 215% | 647 100% | 650 101% | 1431 342% |
| 4K-64 Write (MB/s) | 791 | 1502 90% | 985 25% | 514 -35% | 1753 122% |
| Access Time Read * (ms) | 0.06 | 0.07 -17% | 0.072 -20% | 0.31 -417% | 0.072 -20% |
| Access Time Write * (ms) | 0.144 | 0.039 73% | 0.047 67% | 0.044 69% | 0.027 81% |
| Score Read (Points) | 508 | 1299 156% | 721 42% | 814 60% | 1753 245% |
| Score Write (Points) | 982 | 1726 76% | 1155 18% | 673 -31% | 2142 118% |
| Score Total (Points) | 1738 | 3640 109% | 2279 31% | 1876 8% | 4790 176% |
| Copy ISO MB/s (MB/s) | 943 | 2145 127% | 862 -9% | 763 -19% | |
| Copy Program MB/s (MB/s) | 612 | 565 -8% | 457 -25% | 350.3 -43% | |
| Copy Game MB/s (MB/s) | 826 | 1320 60% | 902 9% | 310 -62% | |
| CrystalDiskMark 5.2 / 6 | 35% | -24% | -34% | 44% | |
| Write 4K (MB/s) | 130.8 | 93.6 -28% | 105.9 -19% | 63.6 -51% | 170.7 31% |
| Read 4K (MB/s) | 54.8 | 41.87 -24% | 36.56 -33% | 28.58 -48% | 49.51 -10% |
| Write Seq (MB/s) | 978 | 1698 74% | 1165 19% | 688 -30% | 1156 18% |
| Read Seq (MB/s) | 1627 | 1978 22% | 423.2 -74% | 1032 -37% | 1136 -30% |
| Write 4K Q32T1 (MB/s) | 450.1 | 383.1 -15% | 332.1 -26% | 266.7 -41% | 420.5 -7% |
| Read 4K Q32T1 (MB/s) | 345.9 | 326.9 -5% | 229.3 -34% | 321.5 -7% | 527 52% |
| Write Seq Q32T1 (MB/s) | 982 | 2778 183% | 1460 49% | 606 -38% | 2984 204% |
| Read Seq Q32T1 (MB/s) | 1842 | 3119 69% | 472.5 -74% | 1508 -18% | 3550 93% |
| Write 4K Q8T8 (MB/s) | 410.8 | ||||
| Read 4K Q8T8 (MB/s) | 331.4 | ||||
| Total Average (Program / Settings) | 53% /
57% | -8% /
-3% | -33% /
-32% | 86% /
92% |
* ... smaller is better

GPU Performance
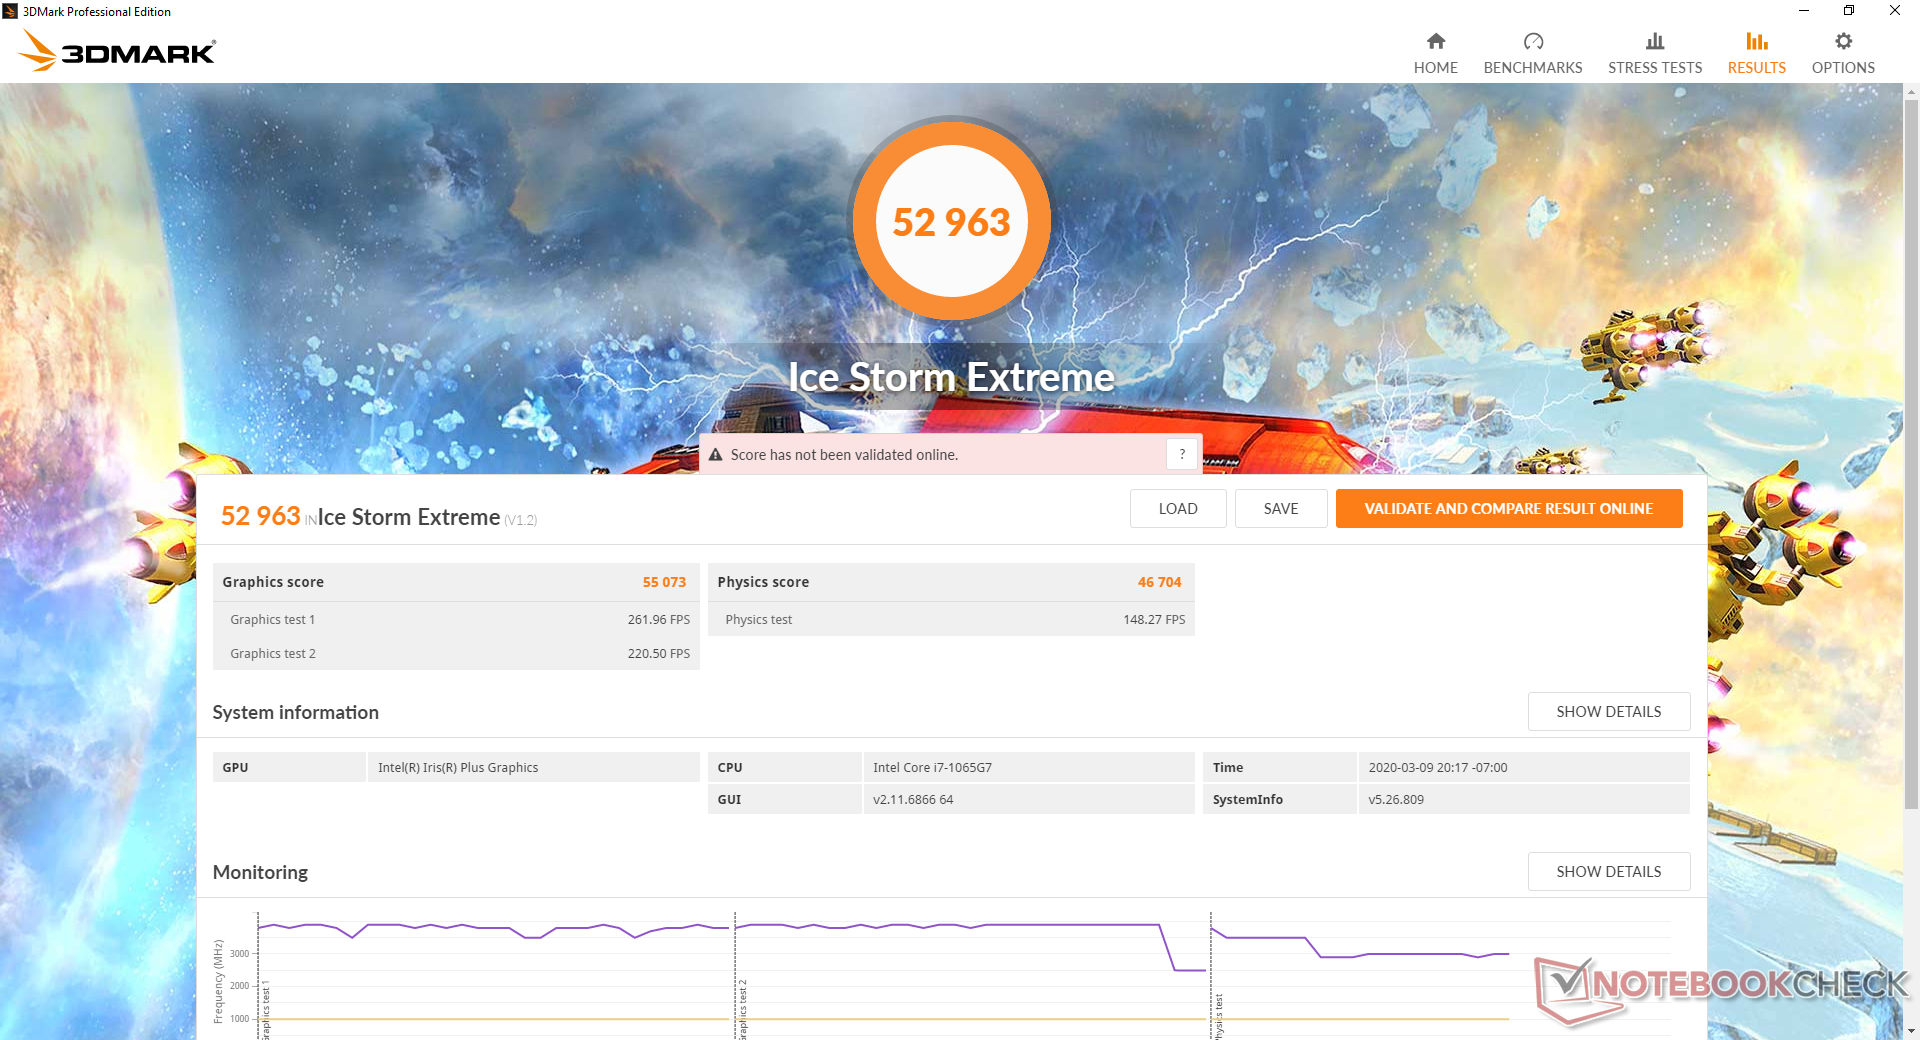
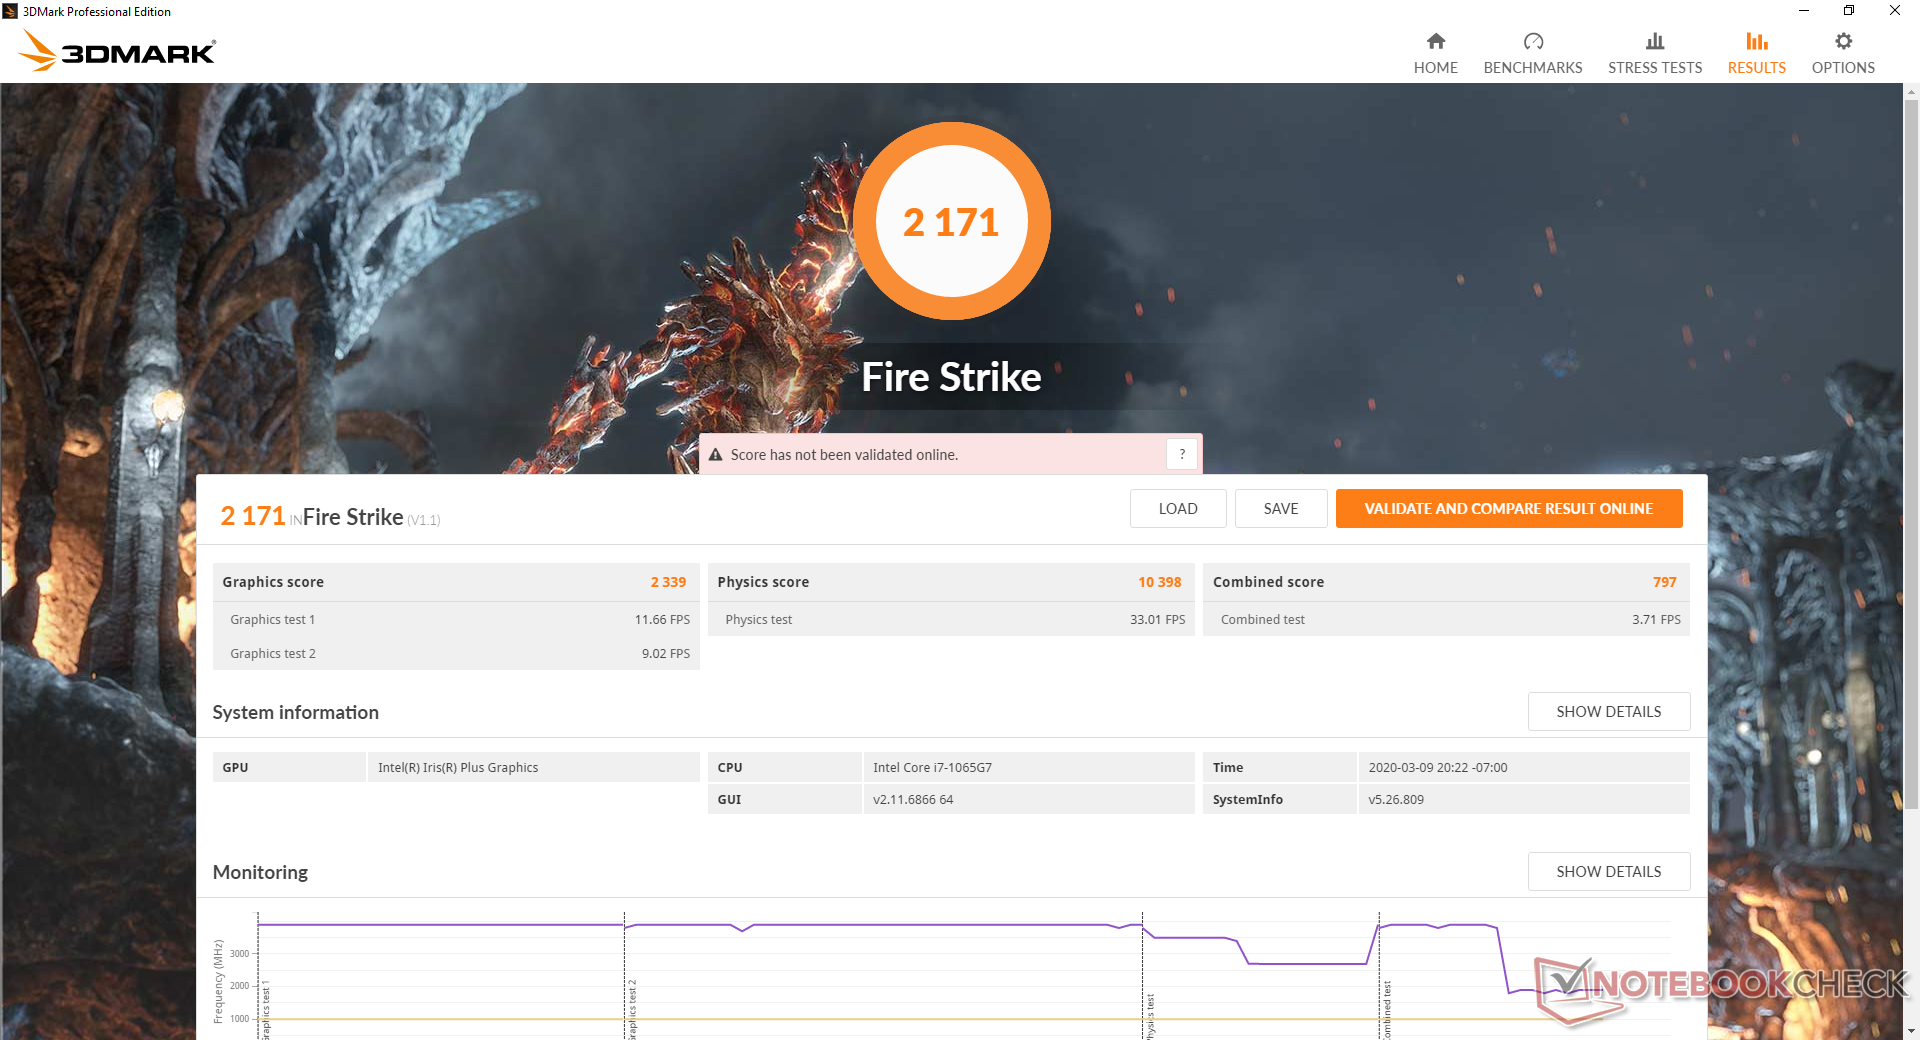
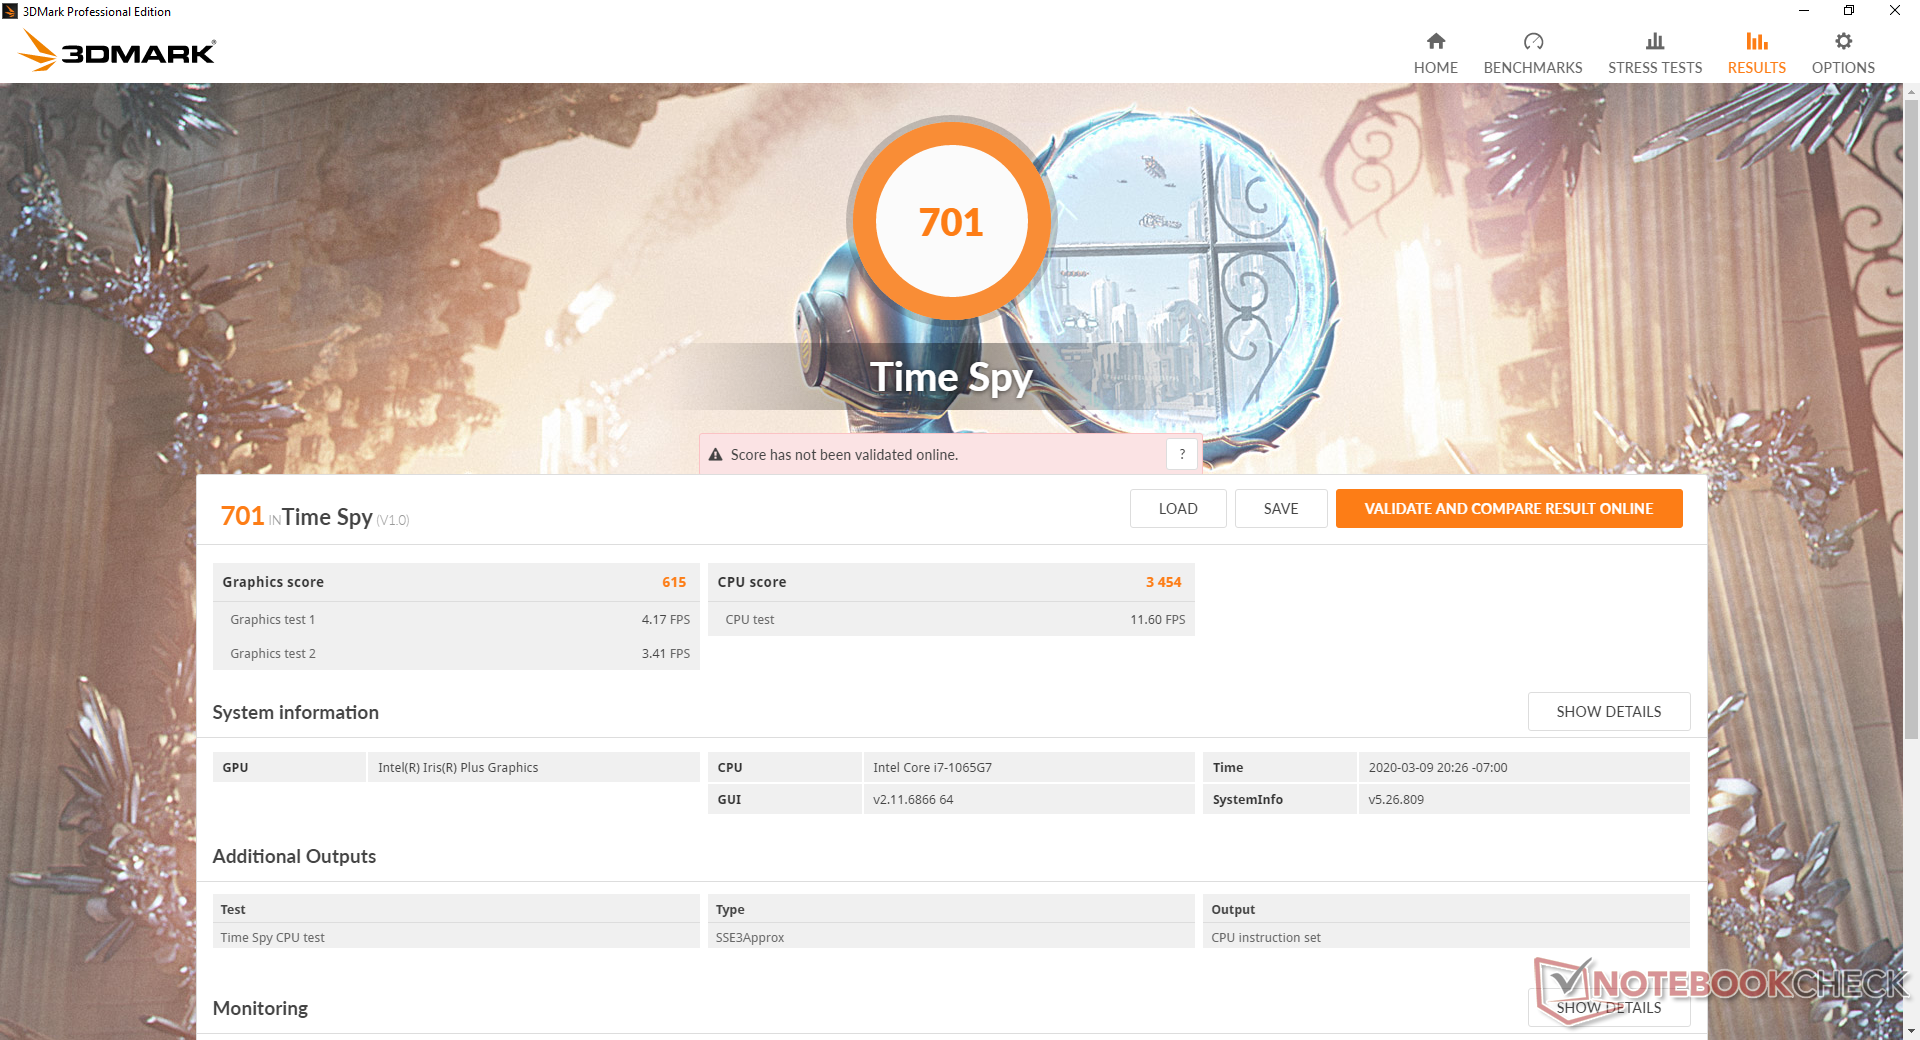
Graphics performance is consistently below the average Iris Plus Graphics G7 in our database in almost every 3DMark benchmark by 15 to 20 percent. Users can expect a performance level between the older UHD Graphics 620 and the GeForce MX150 which is just barely enough to play popular undemanding titles like Rocket League or DOTA 2 at low settings.
Frame rates are some of the lowest we've recorded yet for a Core i7-1065G7 laptop. Running Rocket League on the lowest 720p settings, for example, returns an average of 45 FPS compared to ~114 FPS on the XPS 13 2-in-1. Furthermore, the system is unable to maintain Boost clock rates for very long as exemplified by our Witcher 3 graph below. Standing still in the game starts out at ~45 FPS only to fall and stabilize at ~33 FPS over the course of an hour.
See our dedicated page on the Iris Plus Graphics G7 for more technical information and benchmark comparisons.
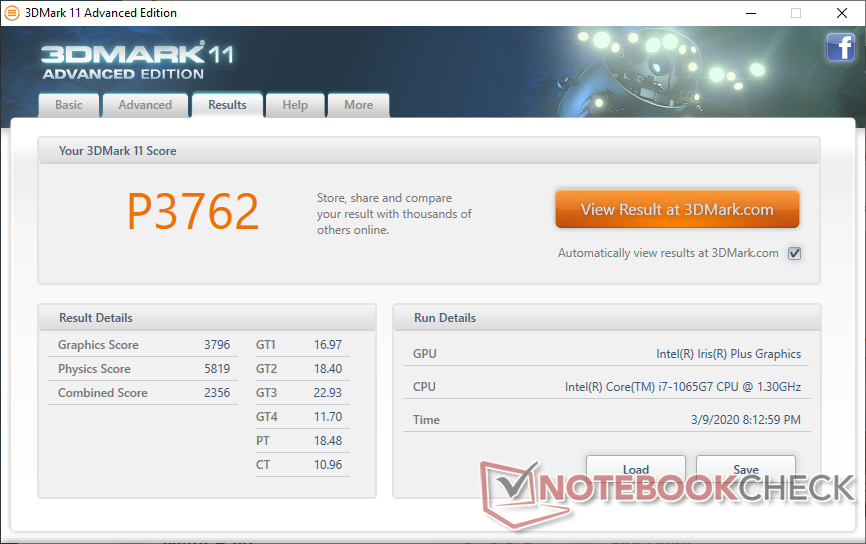

| 3DMark 11 Performance | 3762 points | |
| 3DMark Ice Storm Standard Score | 65852 points | |
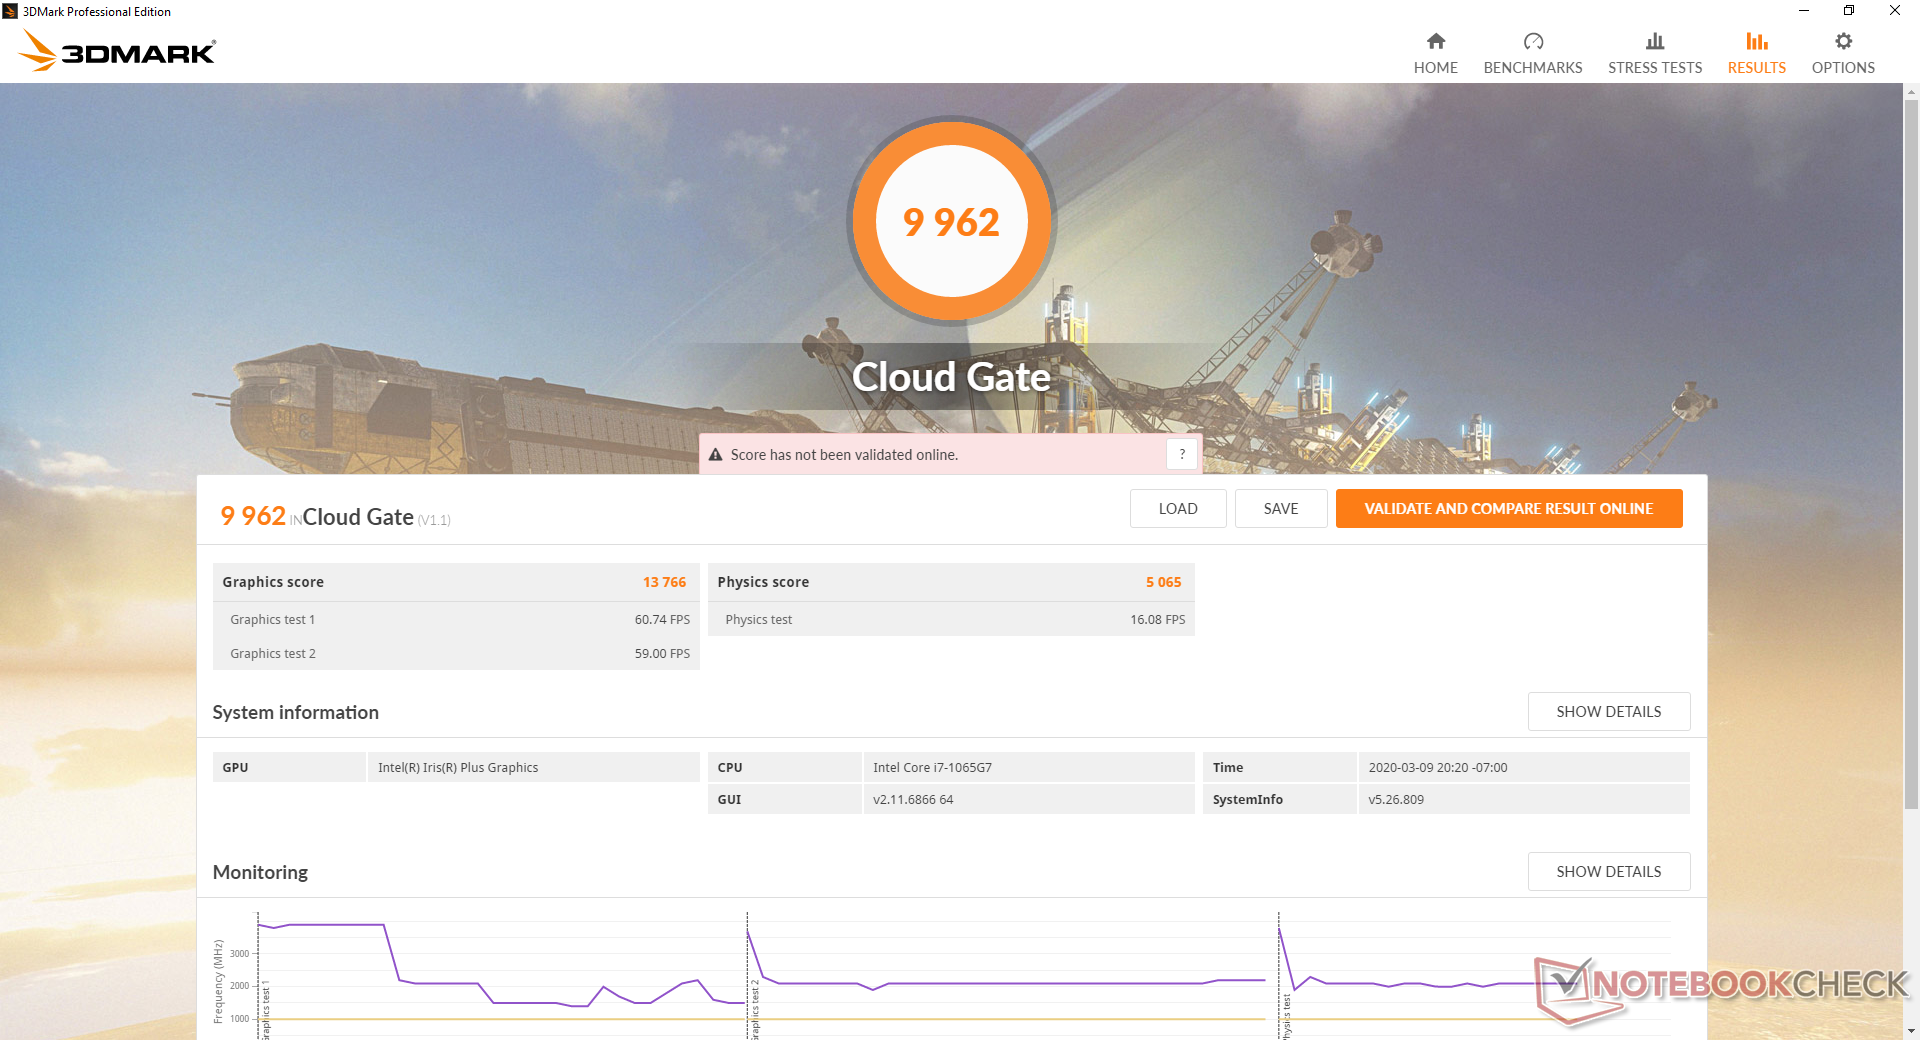
| 3DMark Cloud Gate Standard Score | 9962 points | |
| 3DMark Fire Strike Score | 2171 points | |
| 3DMark Time Spy Score | 701 points | |
Help | ||
| The Witcher 3 - 1024x768 Low Graphics & Postprocessing | |
| Huawei MateBook 13 i7 | |
| MSI Modern 15 A10RB | |
| Dell Inspiron 15 5000 5585 | |
| Microsoft Surface Laptop 3 13 Core i5-1035G7 | |
| Average Intel Iris Plus Graphics G7 (Ice Lake 64 EU) (28.2 - 58, n=20) | |
| Lenovo Ideapad S340-15IIL | |
| low | med. | high | ultra | |
|---|---|---|---|---|
| BioShock Infinite (2013) | 81.9 | 48.9 | 39.9 | 13.5 |
| The Witcher 3 (2015) | 29.9 | 20.8 | 10.9 | 5.9 |
| Rocket League (2017) | 45.5 | 30 | 21.1 | |
| Shadow of the Tomb Raider (2018) | 19 |
Emissions
System Noise
Modern 15-inch laptops running on only ULV U-series CPUs tend to be very quiet and the IdeaPad S340-15 is no exception. Expect no fan noise during low loads like browsing or streaming and only a small increase to ~30 dB(A) when under moderate loads. If gaming, fan noise maxes out at 35.5 dB(A) to be quieter than any Ultrabook with dedicated GeForce MX250 graphics when under similar conditions. In short, fan noise never becomes bothersome no matter the onscreen load.
We're not able to notice any electronic noise or coil whine from our test unit.
| Lenovo Ideapad S340-15IIL Iris Plus Graphics G7 (Ice Lake 64 EU), i7-1065G7, Intel SSD 660p SSDPEKNW512G8 | Dell XPS 15 7590 i5 iGPU FHD UHD Graphics 630, i5-9300H, Toshiba XG6 KXG60ZNV512G | Dell Inspiron 15 5000 5585 Vega 10, R7 3700U, WDC PC SN520 SDAPNUW-512G | Lenovo Ideapad S540-15IML GeForce MX250, i5-10210U, Samsung SSD PM981a MZVLB512HBJQ | HP Pavilion 15-cs2019ng GeForce MX250, i5-8265U, Toshiba KBG30ZMV256G | Asus VivoBook 15 X542UF-DM143T GeForce MX130, i5-8250U, Micron 1100 MTFDDAV256TBN | |
|---|---|---|---|---|---|---|
| Noise | -4% | -3% | -18% | -17% | -11% | |
| off / environment * (dB) | 28.5 | 29.3 -3% | 28.3 1% | 30 -5% | 30.5 -7% | 30 -5% |
| Idle Minimum * (dB) | 28.5 | 29.3 -3% | 28.3 1% | 30 -5% | 31.5 -11% | 30.9 -8% |
| Idle Average * (dB) | 28.5 | 29.3 -3% | 28.3 1% | 32 -12% | 31.5 -11% | 30.9 -8% |
| Idle Maximum * (dB) | 28.5 | 29.8 -5% | 28.3 1% | 37 -30% | 31.5 -11% | 30.9 -8% |
| Load Average * (dB) | 30.3 | 32.4 -7% | 31.4 -4% | 41 -35% | 42.5 -40% | 39 -29% |
| Load Maximum * (dB) | 35.5 | 37.2 -5% | 41.4 -17% | 42 -18% | 42.5 -20% | 38 -7% |
| Witcher 3 ultra * (dB) | 41.4 | 39 |
* ... smaller is better
Noise level
| Idle |
| 28.5 / 28.5 / 28.5 dB(A) |
| Load |
| 30.3 / 35.5 dB(A) |
 | ||
30 dB silent 40 dB(A) audible 50 dB(A) loud |
||
min: | ||
Temperature
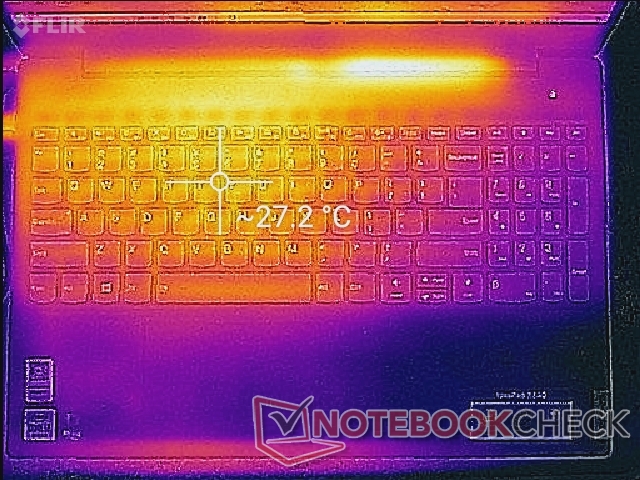
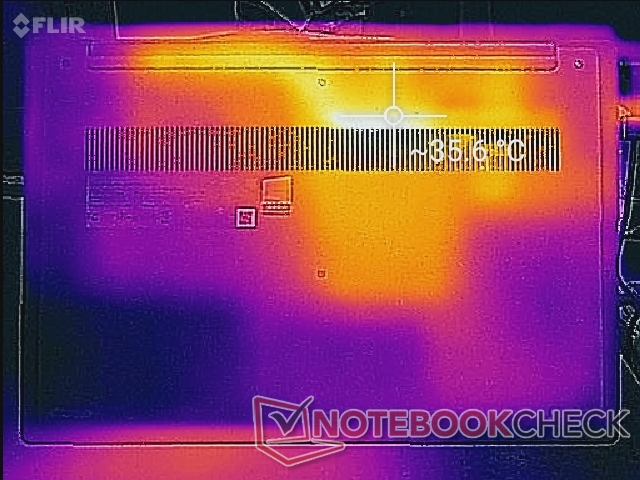
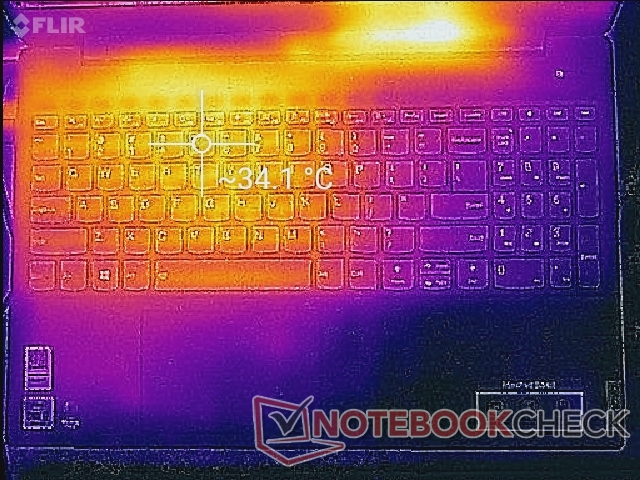
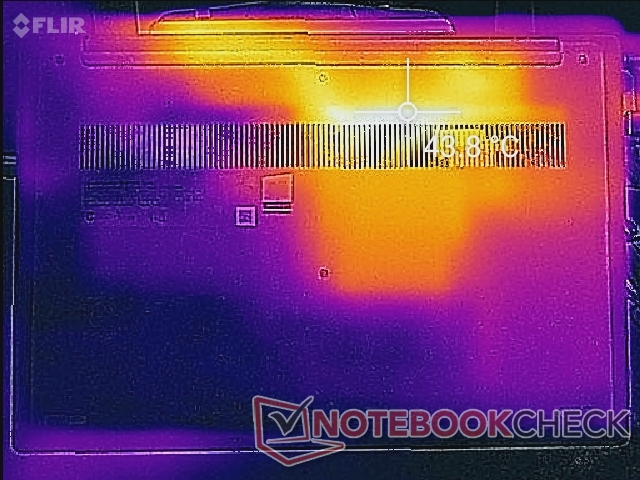
Surface temperatures will always be warmer on the left half of the laptop than the right half due to the positioning of the processor and motherboard within. When under heavy loads, hot spots can range from 34 C on the keyboard to as high as 44 C on the bottom as shown by our temperature maps below. Results are cooler than what we recorded on the Surface Laptop 3 15 or XPS 13 even though they all carry the same Core i7-1065G7 CPU likely because these pricier alternatives have thinner and sleeker designs.
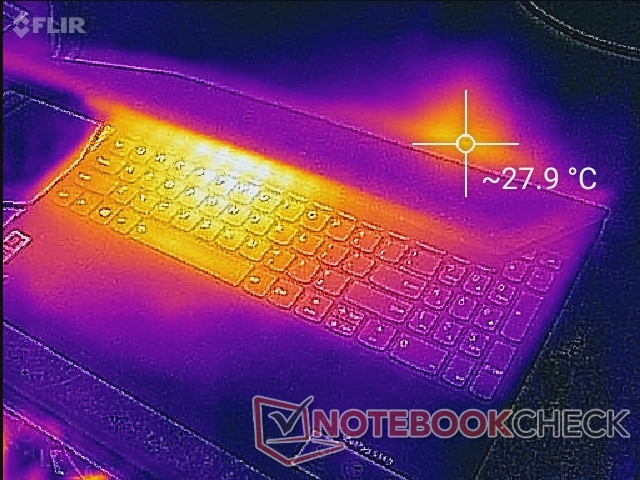
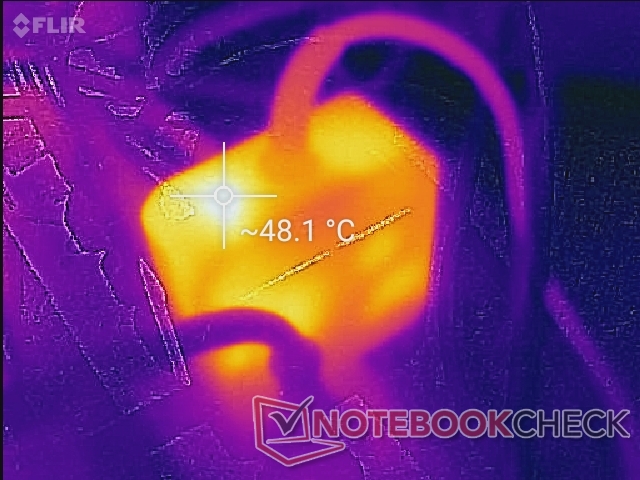
(+) The maximum temperature on the upper side is 35 °C / 95 F, compared to the average of 36.8 °C / 98 F, ranging from 21 to 71 °C for the class Multimedia.
(±) The bottom heats up to a maximum of 44 °C / 111 F, compared to the average of 39.1 °C / 102 F
(+) In idle usage, the average temperature for the upper side is 24.3 °C / 76 F, compared to the device average of 31.3 °C / 88 F.
(+) The palmrests and touchpad are cooler than skin temperature with a maximum of 25 °C / 77 F and are therefore cool to the touch.
(+) The average temperature of the palmrest area of similar devices was 28.7 °C / 83.7 F (+3.7 °C / 6.7 F).
Stress Test
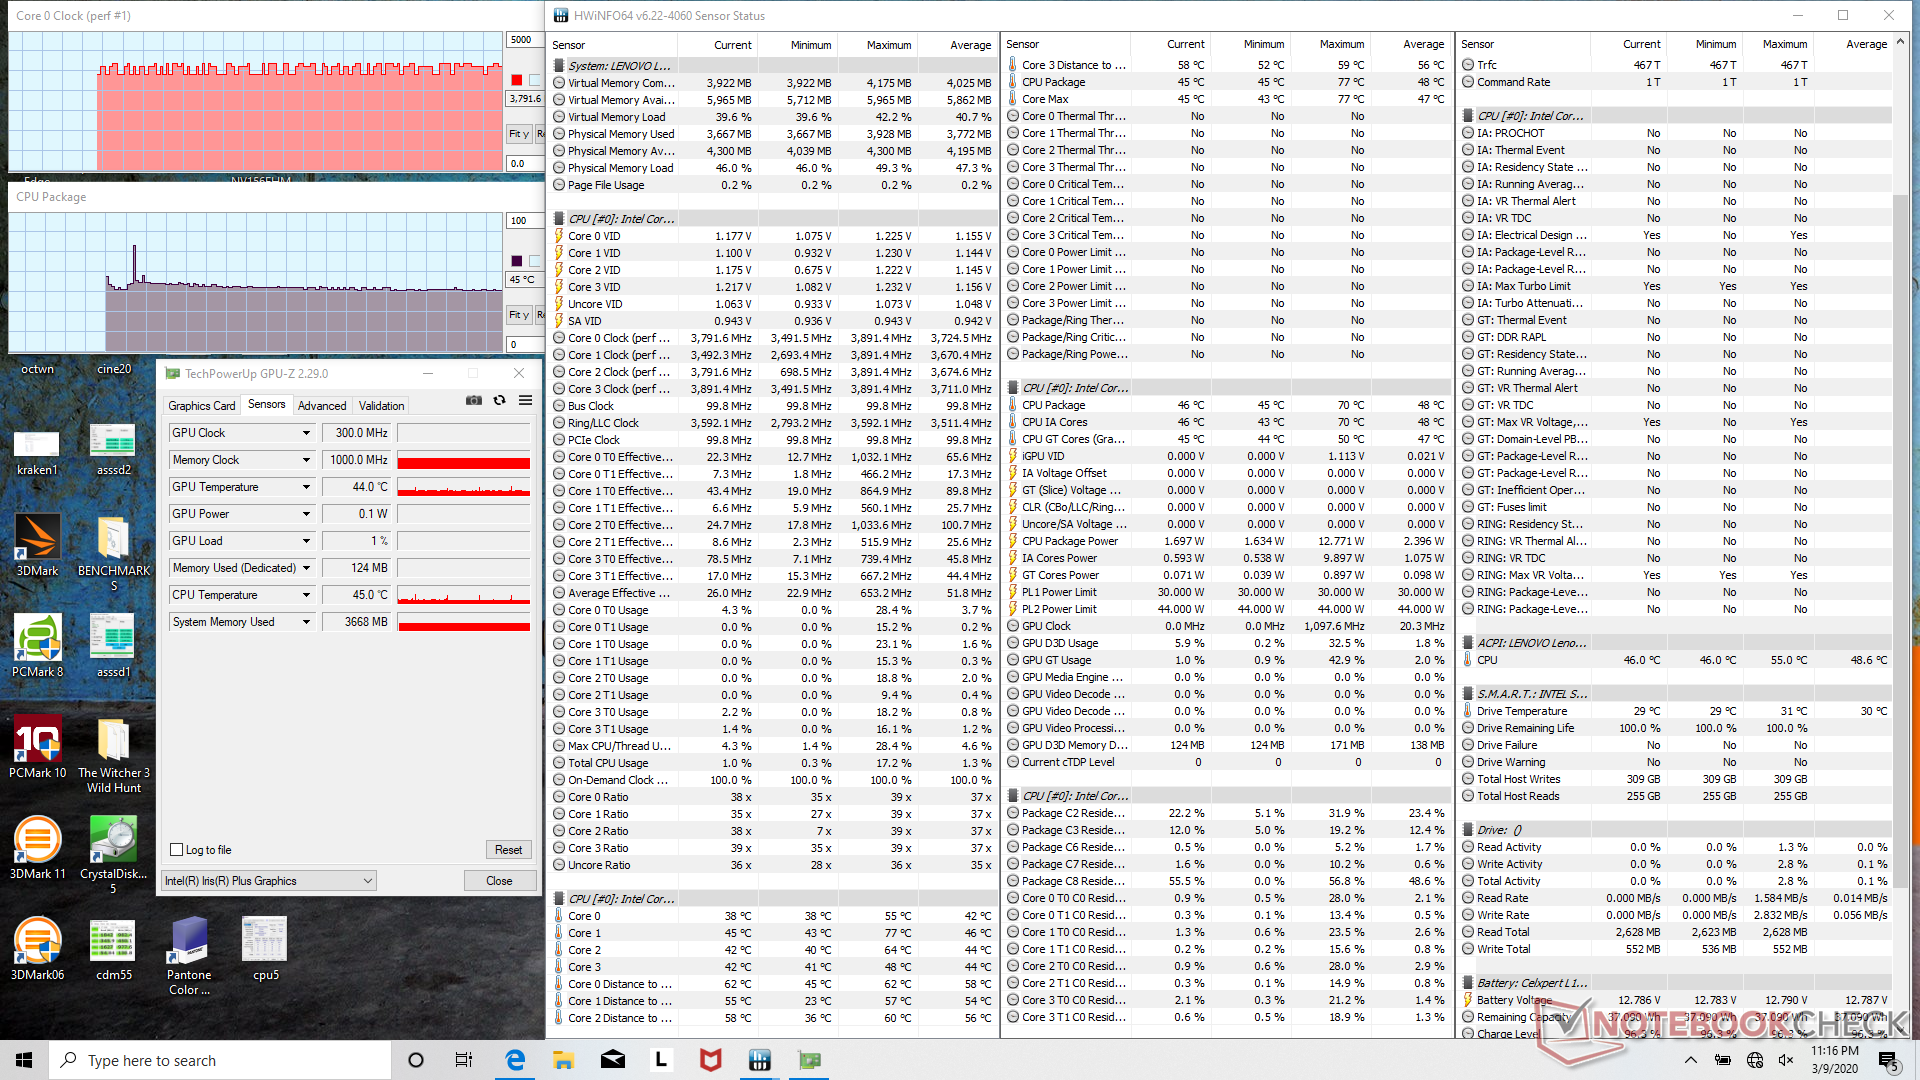
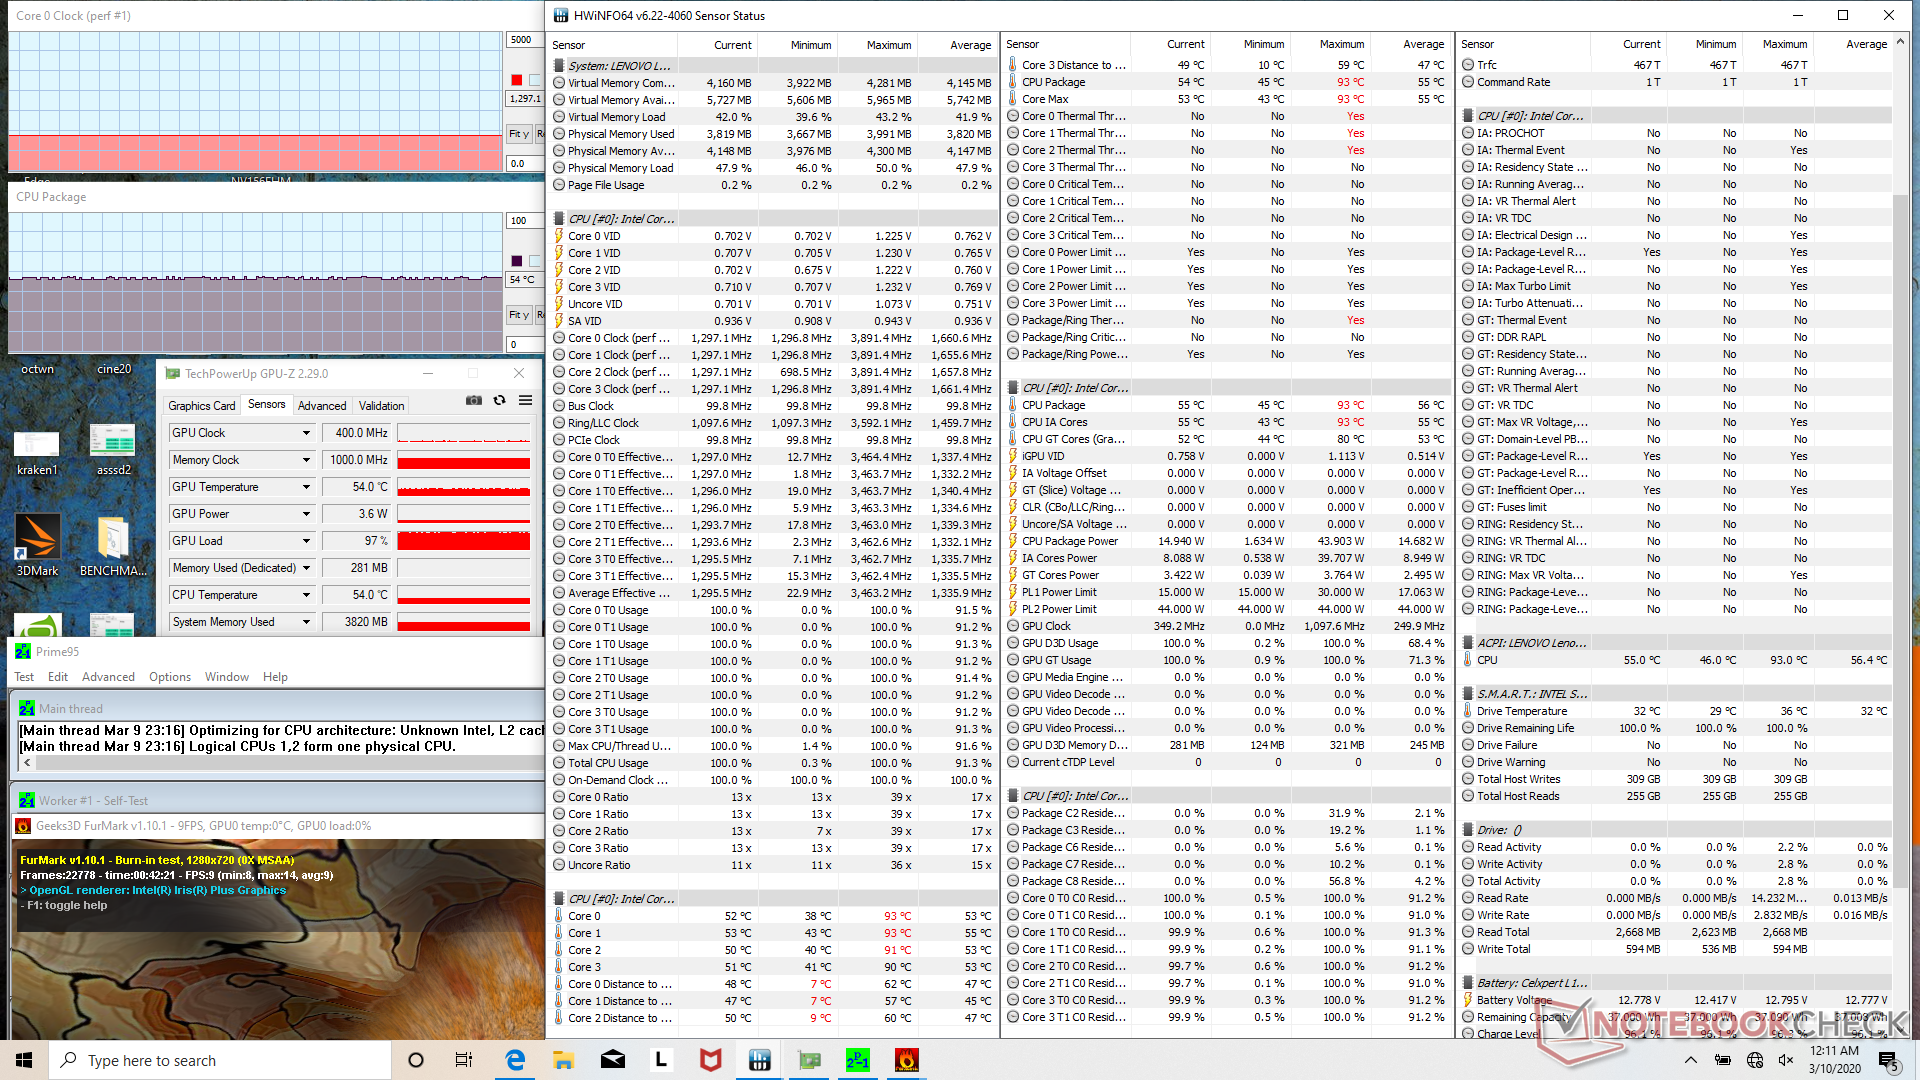
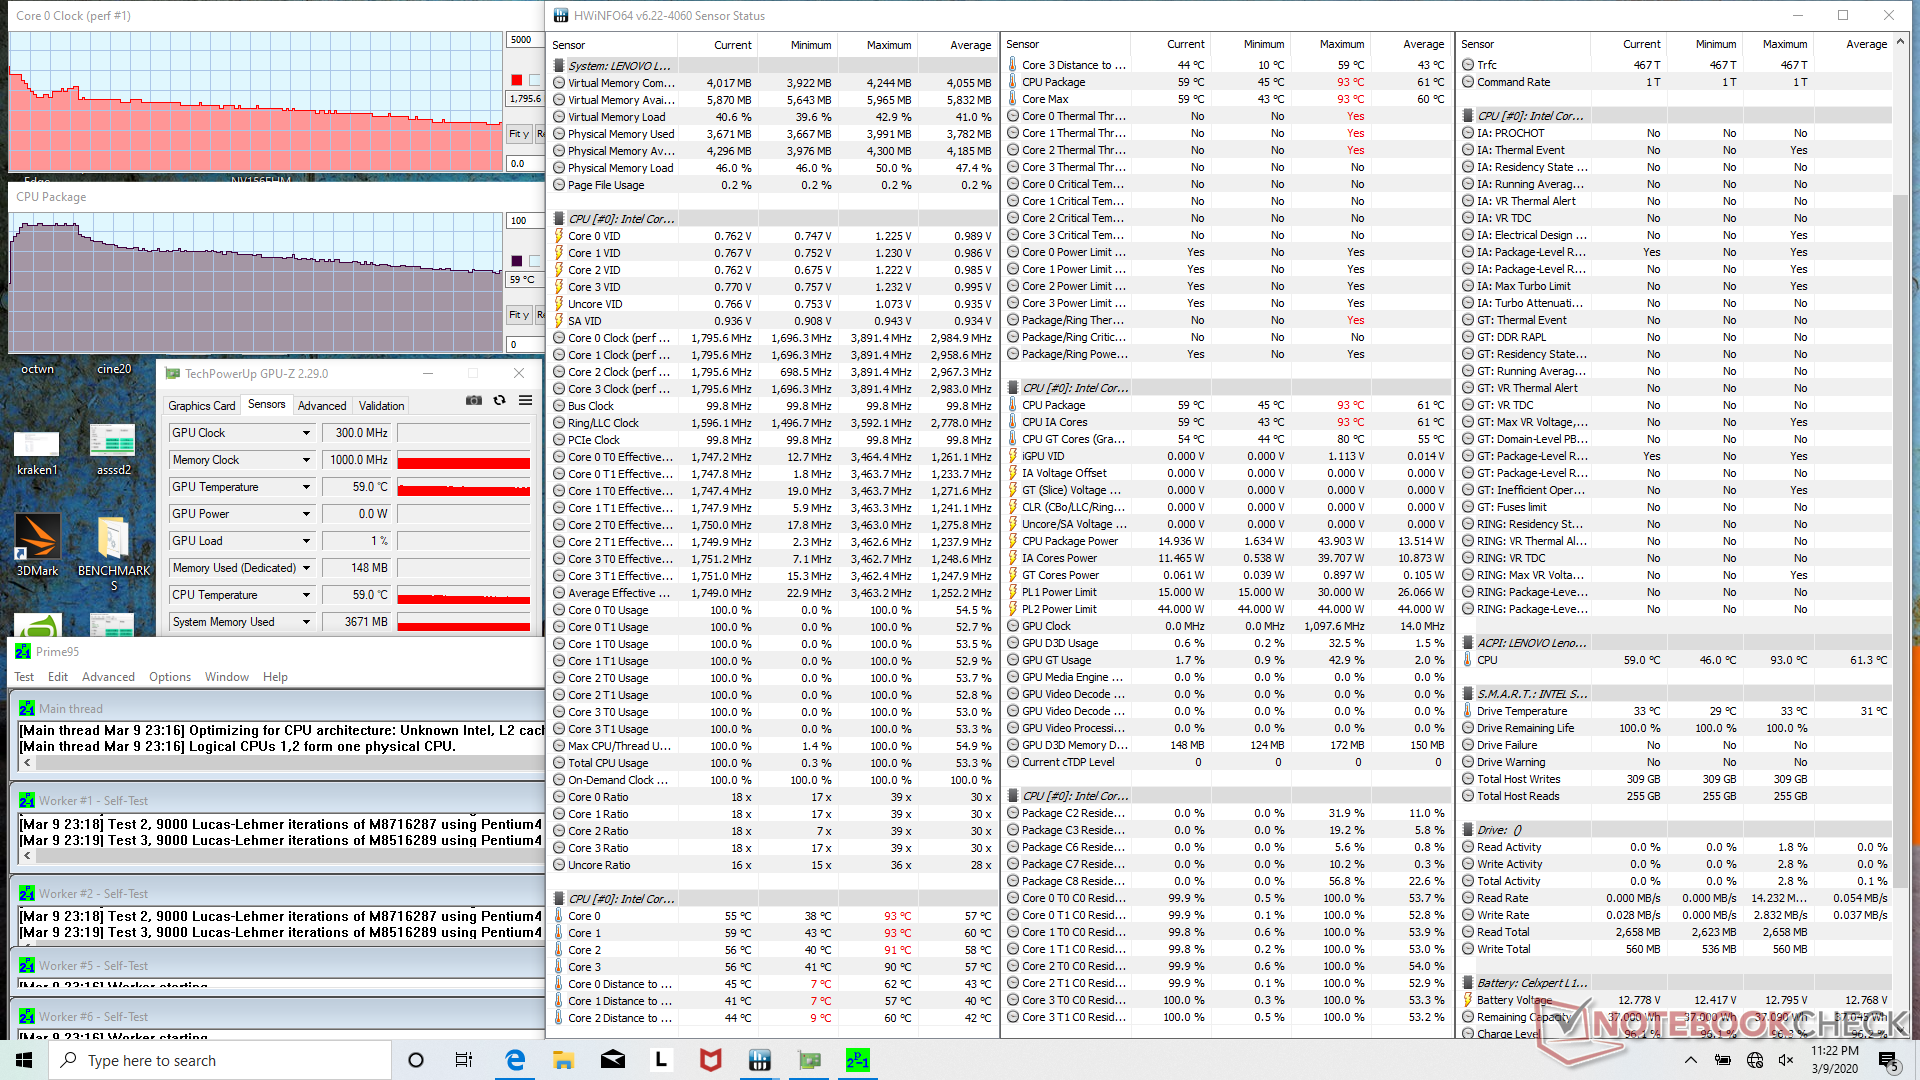
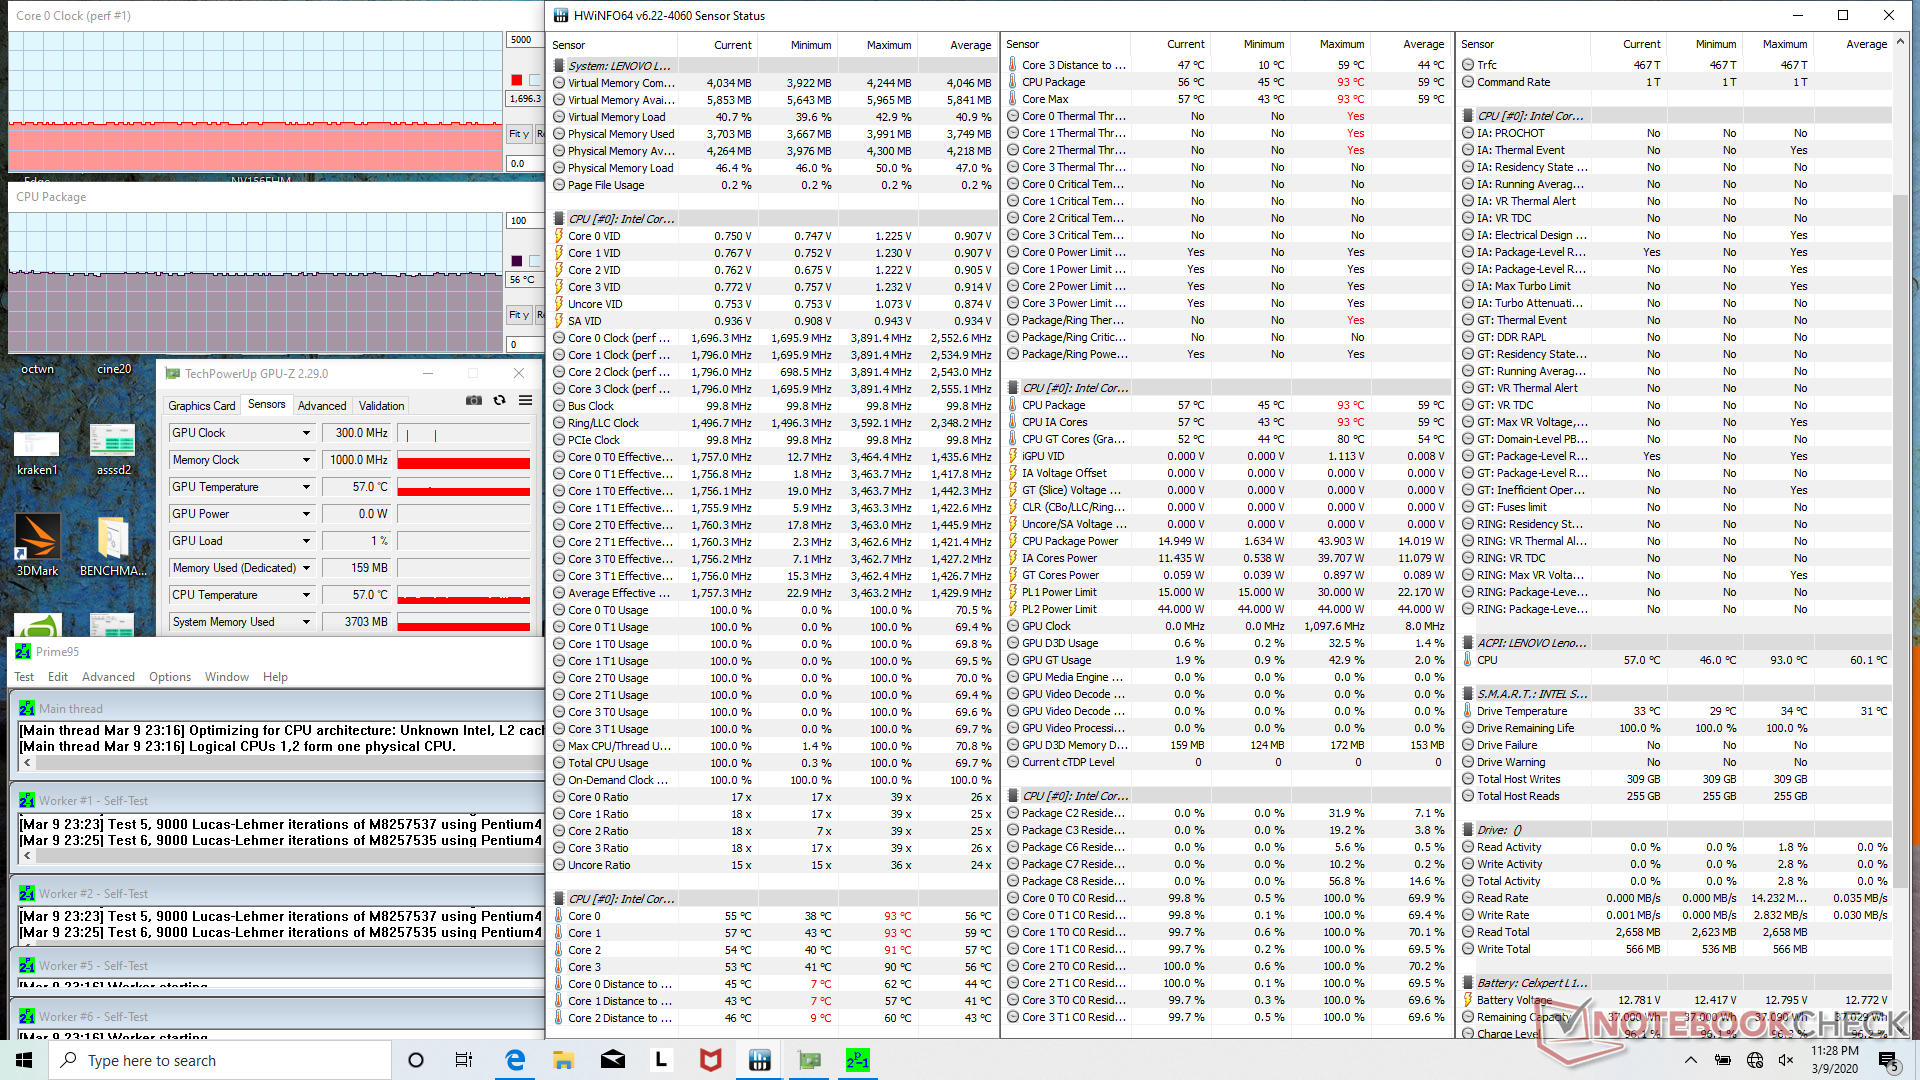
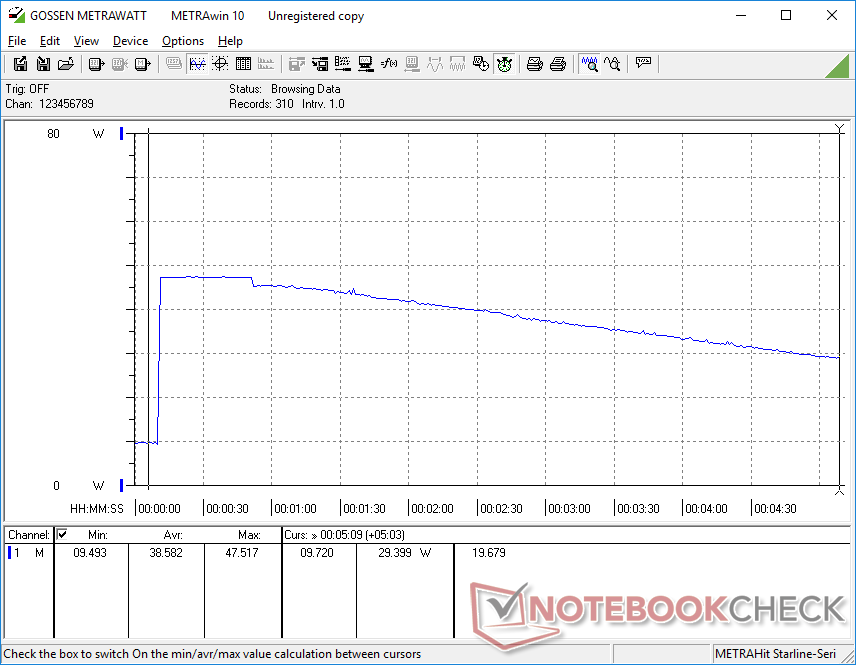
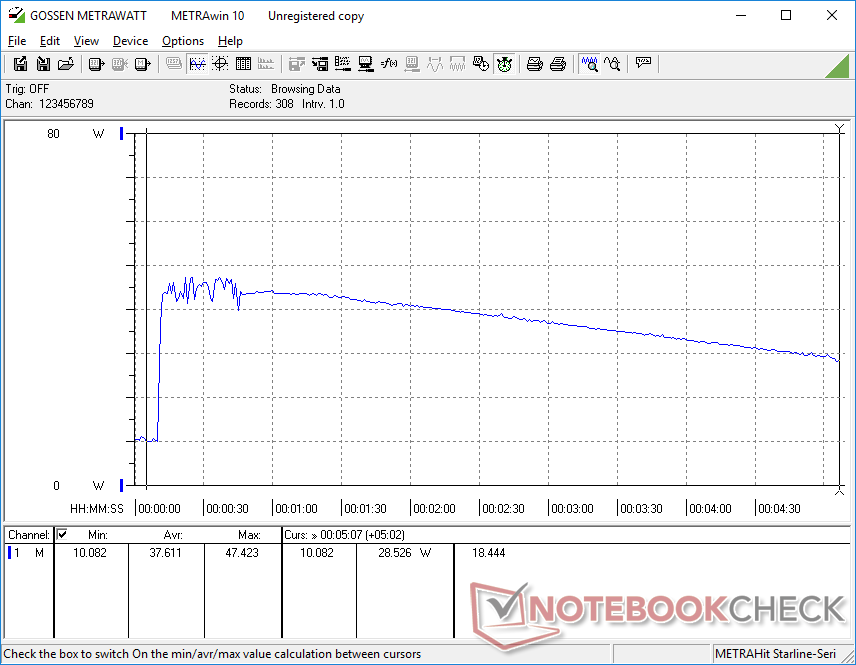
The poor performance sustainability mentioned in our CPU section above can be explained with HWiNFO. When running Prime95, clock rates would boost up to 3.5 GHz for only the first 5 seconds or so until hitting a core temperature of 93 C. Thereafter, clock rates would drop steadily over time to 2.9 GHz before finally stabilizing at just 1.7 GHz and at a core temperature of ~54 C. When considering that the base clock rate of the Core i7-1065G7 is 1.3 GHz, the 400 MHz boost is disappointing. The XPS 13 2-in-1 with the same CPU stabilizes at 3.0 GHz when under the same conditions.
Running on battery power will not limit performance. A 3DMark 11 run on batteries returns Physics and Graphics scores of 6743 and4083 points, respectively, compared to 5819 and 3796 points when on mains.
| CPU Clock (GHz) | GPU Clock (MHz) | Average CPU Temperature (°C) | |
| System Idle | -- | -- | 45 |
| Prime95 Stress | 1.7 | -- | 56 |
| Prime95 + FurMark Stress | 1.3 | 400 | 54 |
Speakers
The stereo speakers offer nothing out of the ordinary for an inexpensive 15.6-inch laptop. Audio is loud with weak bass meaning that the speakers are better for video conferencing rather than music or multimedia playback. Higher volume settings will not vibrate the palm rests or introduce any static.


Lenovo Ideapad S340-15IIL audio analysis
(+) | speakers can play relatively loud (83.4 dB)
Bass 100 - 315 Hz
(-) | nearly no bass - on average 21.2% lower than median
(±) | linearity of bass is average (11.4% delta to prev. frequency)
Mids 400 - 2000 Hz
(+) | balanced mids - only 4.8% away from median
(±) | linearity of mids is average (7% delta to prev. frequency)
Highs 2 - 16 kHz
(+) | balanced highs - only 2.5% away from median
(+) | highs are linear (4% delta to prev. frequency)
Overall 100 - 16.000 Hz
(±) | linearity of overall sound is average (22% difference to median)
Compared to same class
» 78% of all tested devices in this class were better, 4% similar, 17% worse
» The best had a delta of 5%, average was 17%, worst was 45%
Compared to all devices tested
» 64% of all tested devices were better, 6% similar, 30% worse
» The best had a delta of 4%, average was 23%, worst was 134%
Apple MacBook 12 (Early 2016) 1.1 GHz audio analysis
(+) | speakers can play relatively loud (83.6 dB)
Bass 100 - 315 Hz
(±) | reduced bass - on average 11.3% lower than median
(±) | linearity of bass is average (14.2% delta to prev. frequency)
Mids 400 - 2000 Hz
(+) | balanced mids - only 2.4% away from median
(+) | mids are linear (5.5% delta to prev. frequency)
Highs 2 - 16 kHz
(+) | balanced highs - only 2% away from median
(+) | highs are linear (4.5% delta to prev. frequency)
Overall 100 - 16.000 Hz
(+) | overall sound is linear (10.2% difference to median)
Compared to same class
» 7% of all tested devices in this class were better, 2% similar, 90% worse
» The best had a delta of 5%, average was 18%, worst was 53%
Compared to all devices tested
» 5% of all tested devices were better, 1% similar, 94% worse
» The best had a delta of 4%, average was 23%, worst was 134%
Energy Management
Power Consumption
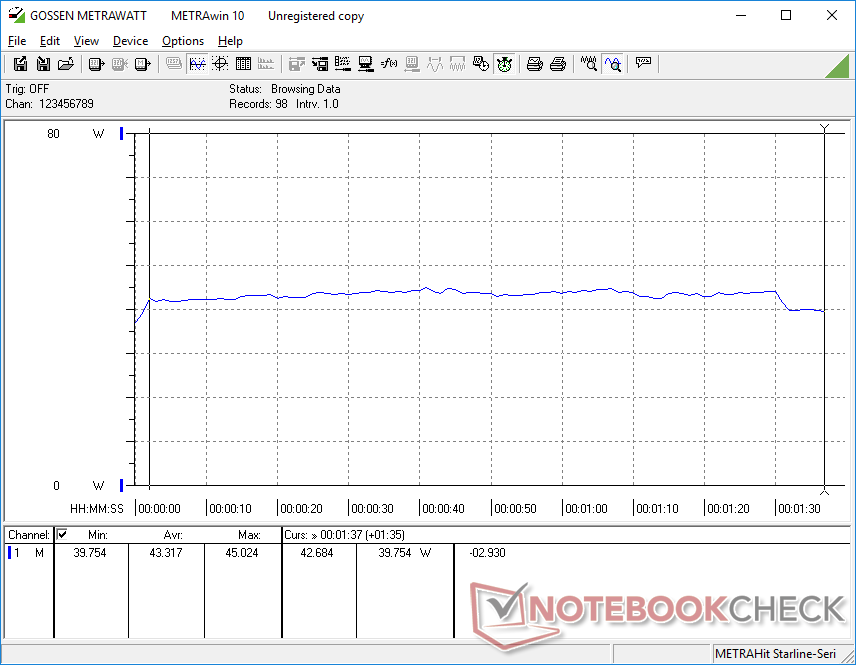
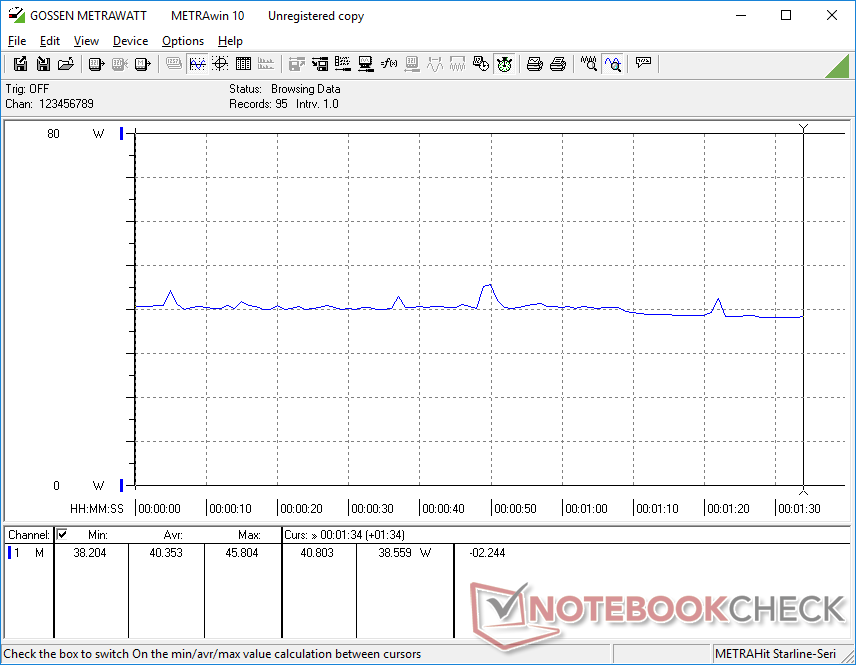
Idling on desktop consumes between 3 W and 7 W depending on the brightness level and power profile. When gaming, the system will consume between 40 W and 44 W compared to 44 W and 64 W on the IdeaPad S540 with the more powerful dedicated GeForce MX250 GPU.
We're able to record a maximum of 47.5 W from the small (~6.3 x 6.3 x 2.8 cm) 45 W AC adapter when running Prime95 or both Prime95 and FurMark simultaneously. This high of a consumption is only temporary as shown by our graphs below due to the limited Turbo Boost potential of the system. The power consumption behavior mirrors what we observed in the Stress Test section above.
| Off / Standby | |
| Idle | |
| Load |
|
Key:
min: | |
| Lenovo Ideapad S340-15IIL i7-1065G7, Iris Plus Graphics G7 (Ice Lake 64 EU), Intel SSD 660p SSDPEKNW512G8, IPS, 1920x1080, 15.6" | Dell XPS 15 7590 i5 iGPU FHD i5-9300H, UHD Graphics 630, Toshiba XG6 KXG60ZNV512G, IPS, 1920x1080, 15.6" | Dell Inspiron 15 5000 5585 R7 3700U, Vega 10, WDC PC SN520 SDAPNUW-512G, IPS, 1920x1080, 15.6" | Lenovo Ideapad S540-15IML i5-10210U, GeForce MX250, Samsung SSD PM981a MZVLB512HBJQ, IPS, 1920x1080, 15.6" | HP Pavilion 15-cs2019ng i5-8265U, GeForce MX250, Toshiba KBG30ZMV256G, IPS, 1920x1080, 15.6" | Asus VivoBook 15 X542UF-DM143T i5-8250U, GeForce MX130, Micron 1100 MTFDDAV256TBN, TN LED, 1920x1080, 15.6" | |
|---|---|---|---|---|---|---|
| Power Consumption | -38% | 5% | -27% | -19% | -15% | |
| Idle Minimum * (Watt) | 3.8 | 3.79 -0% | 4.2 -11% | 5 -32% | 4.9 -29% | 4.75 -25% |
| Idle Average * (Watt) | 6.9 | 6.9 -0% | 6.8 1% | 7 -1% | 7.9 -14% | 6.9 -0% |
| Idle Maximum * (Watt) | 7.7 | 9.2 -19% | 7 9% | 10 -30% | 10.1 -31% | 7 9% |
| Load Average * (Watt) | 43.3 | 62 -43% | 36.5 16% | 64 -48% | 60 -39% | 53 -22% |
| Witcher 3 ultra * (Watt) | 40.4 | 37.9 6% | 44 -9% | |||
| Load Maximum * (Watt) | 47.5 | 108 -127% | 44 7% | 67 -41% | 38 20% | 65.3 -37% |
* ... smaller is better
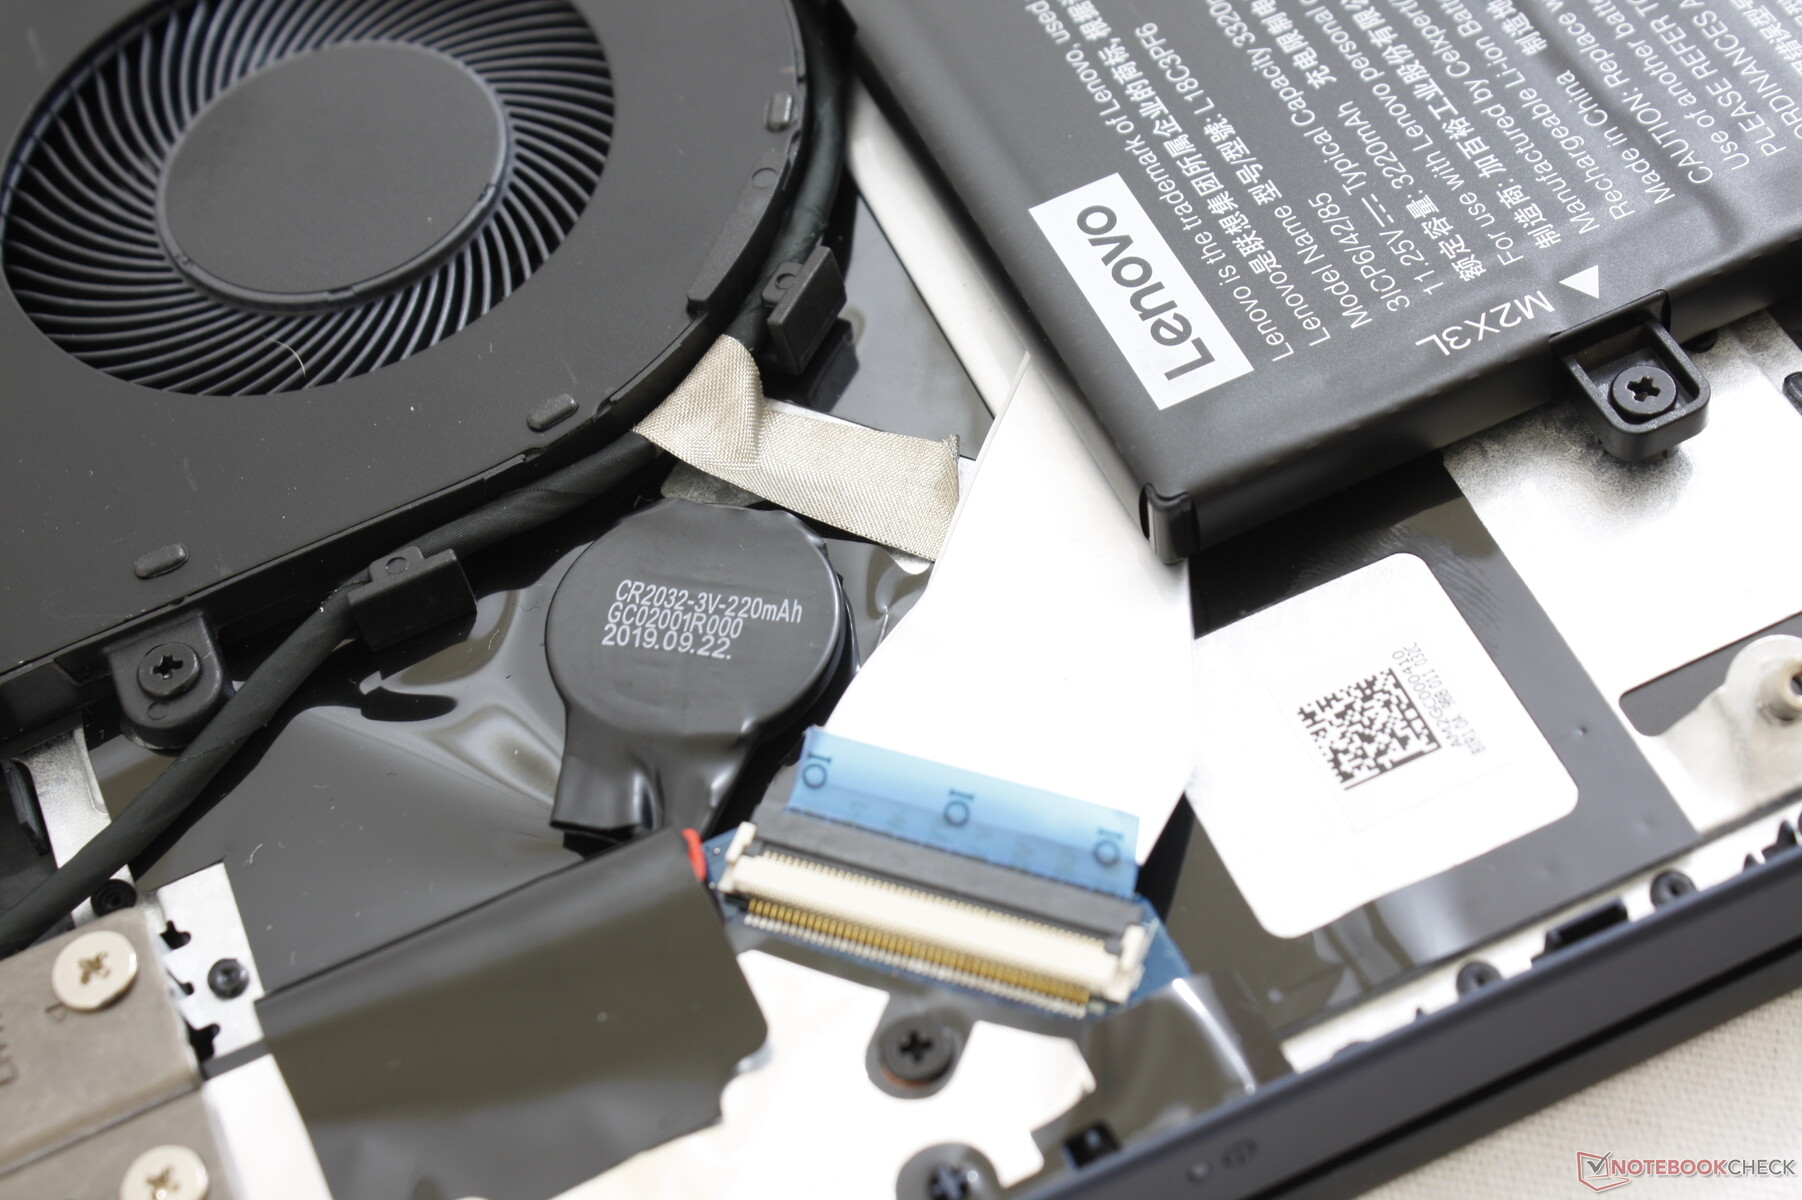
Battery Life
Depending on region and SKU, configurations may come with either a 36 Wh or 52.5 Wh internal battery. Our specific unit has the smaller 36 Wh version. In comparison, the IdeaPad S540-15 comes with a much larger 70 Wh battery. Runtimes are short on our IdeaPad S340-15 at just over 4 hours of real-world WLAN use.
Recharging the system from empty to full capacity is slow. The process takes about 2.5 to 3 hours compared to just 1.5 to 2 hours of most other Ultrabooks. When considering the already small battery capacity of the IdeaPad S340-15, this is a bit disappointing. Recharging via USB Type-C will not work, either.
| Lenovo Ideapad S340-15IIL i7-1065G7, Iris Plus Graphics G7 (Ice Lake 64 EU), 36 Wh | Dell XPS 15 7590 i5 iGPU FHD i5-9300H, UHD Graphics 630, 97 Wh | Dell Inspiron 15 5000 5585 R7 3700U, Vega 10, 42 Wh | Lenovo Ideapad S540-15IML i5-10210U, GeForce MX250, 70 Wh | HP Pavilion 15-cs2019ng i5-8265U, GeForce MX250, 41 Wh | Asus VivoBook 15 X542UF-DM143T i5-8250U, GeForce MX130, 38 Wh | |
|---|---|---|---|---|---|---|
| Battery runtime | 142% | 44% | 137% | 5% | 58% | |
| Reader / Idle (h) | 10 | 14.3 43% | 30.2 202% | 8 -20% | ||
| WiFi v1.3 (h) | 4.3 | 14.1 228% | 7 63% | 12.1 181% | 5 16% | 6.8 58% |
| Load (h) | 1.1 | 1.7 55% | 1.4 27% | 1.4 27% | 1.3 18% |
Pros
Cons
Verdict
A few weeks ago, we posted about the Lenovo IdeaPad S340-15 as being one of the cheapest laptops you can find with Intel's latest 10th gen Core i7-1065G7 CPU. This is the same processor found on much more expensive alternatives like the Dell XPS 13 2-in-1 or the Razer Blade Stealth that can easily cost two times more than our Lenovo. While this looks good for Lenovo on paper, the reality is that the IdeaPad S340-15 exhibits below-average CPU performance than the aforementioned alternatives especially when gaming or running other demanding loads. If you want the best that Ice Lake has to offer, you're going to have to look beyond the IdeaPad series.
As for the laptop itself, it's more modern and visually attractive than the competing Dell Inspiron, Asus VivoBook, or HP Pavilion series. The matte touchscreen and accessible dual storage bays are also a nice surprises as these features are uncommon on budget laptops. Otherwise, almost everything else about the system is adequate if not middling. The narrow color space, light keys, and mediocre battery life are all commonplace for its price range. We recommend opting for the less expensive Core i5 or Core i7 Whiskey Lake-U SKUs as Ice Lake brings very little extra to the table for the IdeaPad S340.
The Lenovo IdeaPad S340-15 is at its best for home multimedia use and the occasional travel because of its light weight. Don't expect good Core i7 Ice Lake performance when running higher loads like gaming.
Lenovo Ideapad S340-15IIL
- 03/14/2020 v7 (old)
Allen Ngo
Price comparison
