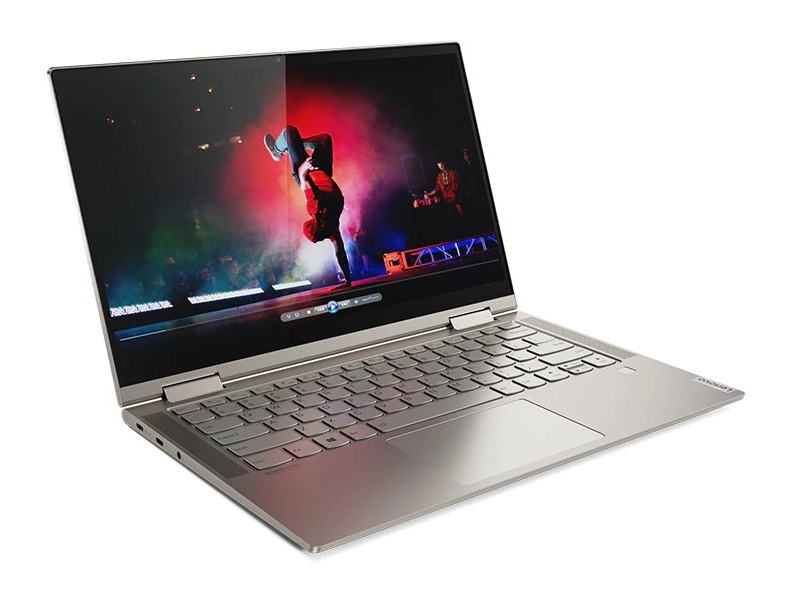
Lenovo Yoga C740-14IML Convertible Review: Top-tier Looks, Mid-tier Price
The 14-inch Yoga C740-14 is Lenovo's mid-range convertible laptop that sits in between the lower-end Flex 14 and higher-end Yoga C940-14. It incorporates many of the same features as found on the Yoga C940-14 while dropping some of the more luxurious options as we will detail below in order to keep prices low.
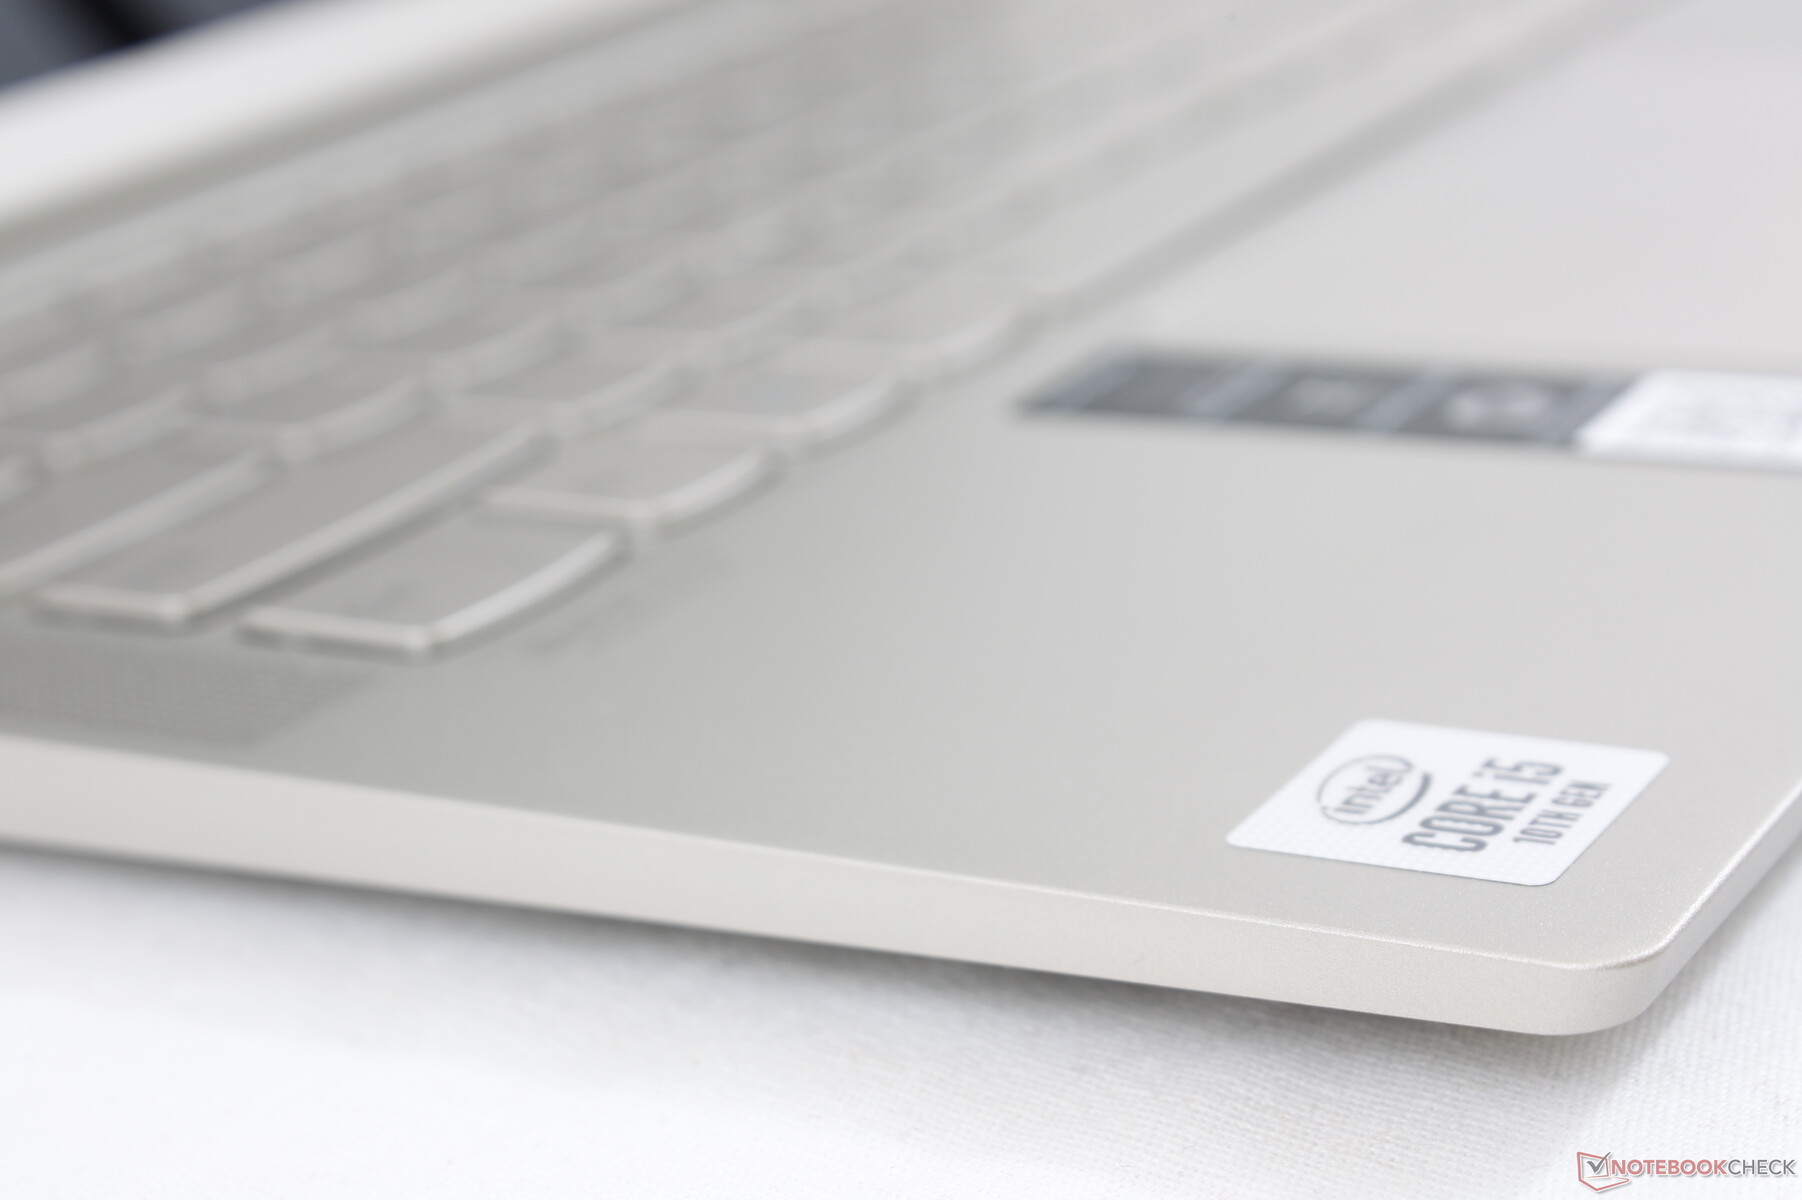
Current SKUs range from the Core i5-10210U CPU with 512 GB SSD and 8 GB of RAM for $799 up to the Core i7-10510U CPU with 1 TB SSD and 16 GB of RAM for $1000. All configurations are fixed at 1080p with no hexa-core Core i7-10710U options, 4K UHD, or Ice Lake CPUs.
The Yoga C740-14 competes with other mid-range to high-end 2-in-1 laptops like the Asus ZenBook Flip 14, Dell XPS 13 7390 2-in-1, Acer Spin 7, and the HP Envy x360 13.
More Lenovo reviews:
Rating | Date | Model | Weight | Height | Size | Resolution | Price |
|---|---|---|---|---|---|---|---|
| 84.3 % v7 (old) | 03 / 2020 | Lenovo Yoga C740-14IML i5-10210U, UHD Graphics 620 | 1.4 kg | 16.9 mm | 14.00" | 1920x1080 | |
| 85.9 % v7 (old) | 09 / 2019 | Dell XPS 13 7390 2-in-1 Core i3 i3-1005G1, UHD Graphics G1 (Ice Lake 32 EU) | 1.3 kg | 13 mm | 13.40" | 1920x1200 | |
| 81.2 % v7 (old) | 09 / 2019 | Asus ZenBook Flip 14 UM462DA-AI023T R7 3700U, Vega 10 | 1.6 kg | 18.9 mm | 14.00" | 1920x1080 | |
| 88.1 % v7 (old) | 02 / 2020 | Microsoft Surface Pro 7 i7-1065G7, Iris Plus Graphics G7 (Ice Lake 64 EU) | 790 g | 8.5 mm | 12.30" | 2736x1824 | |
| 88.4 % v7 (old) | 12 / 2019 | HP Spectre x360 13-aw0013dx i7-1065G7, Iris Plus Graphics G7 (Ice Lake 64 EU) | 1.2 kg | 16.9 mm | 13.30" | 1920x1080 |
Case
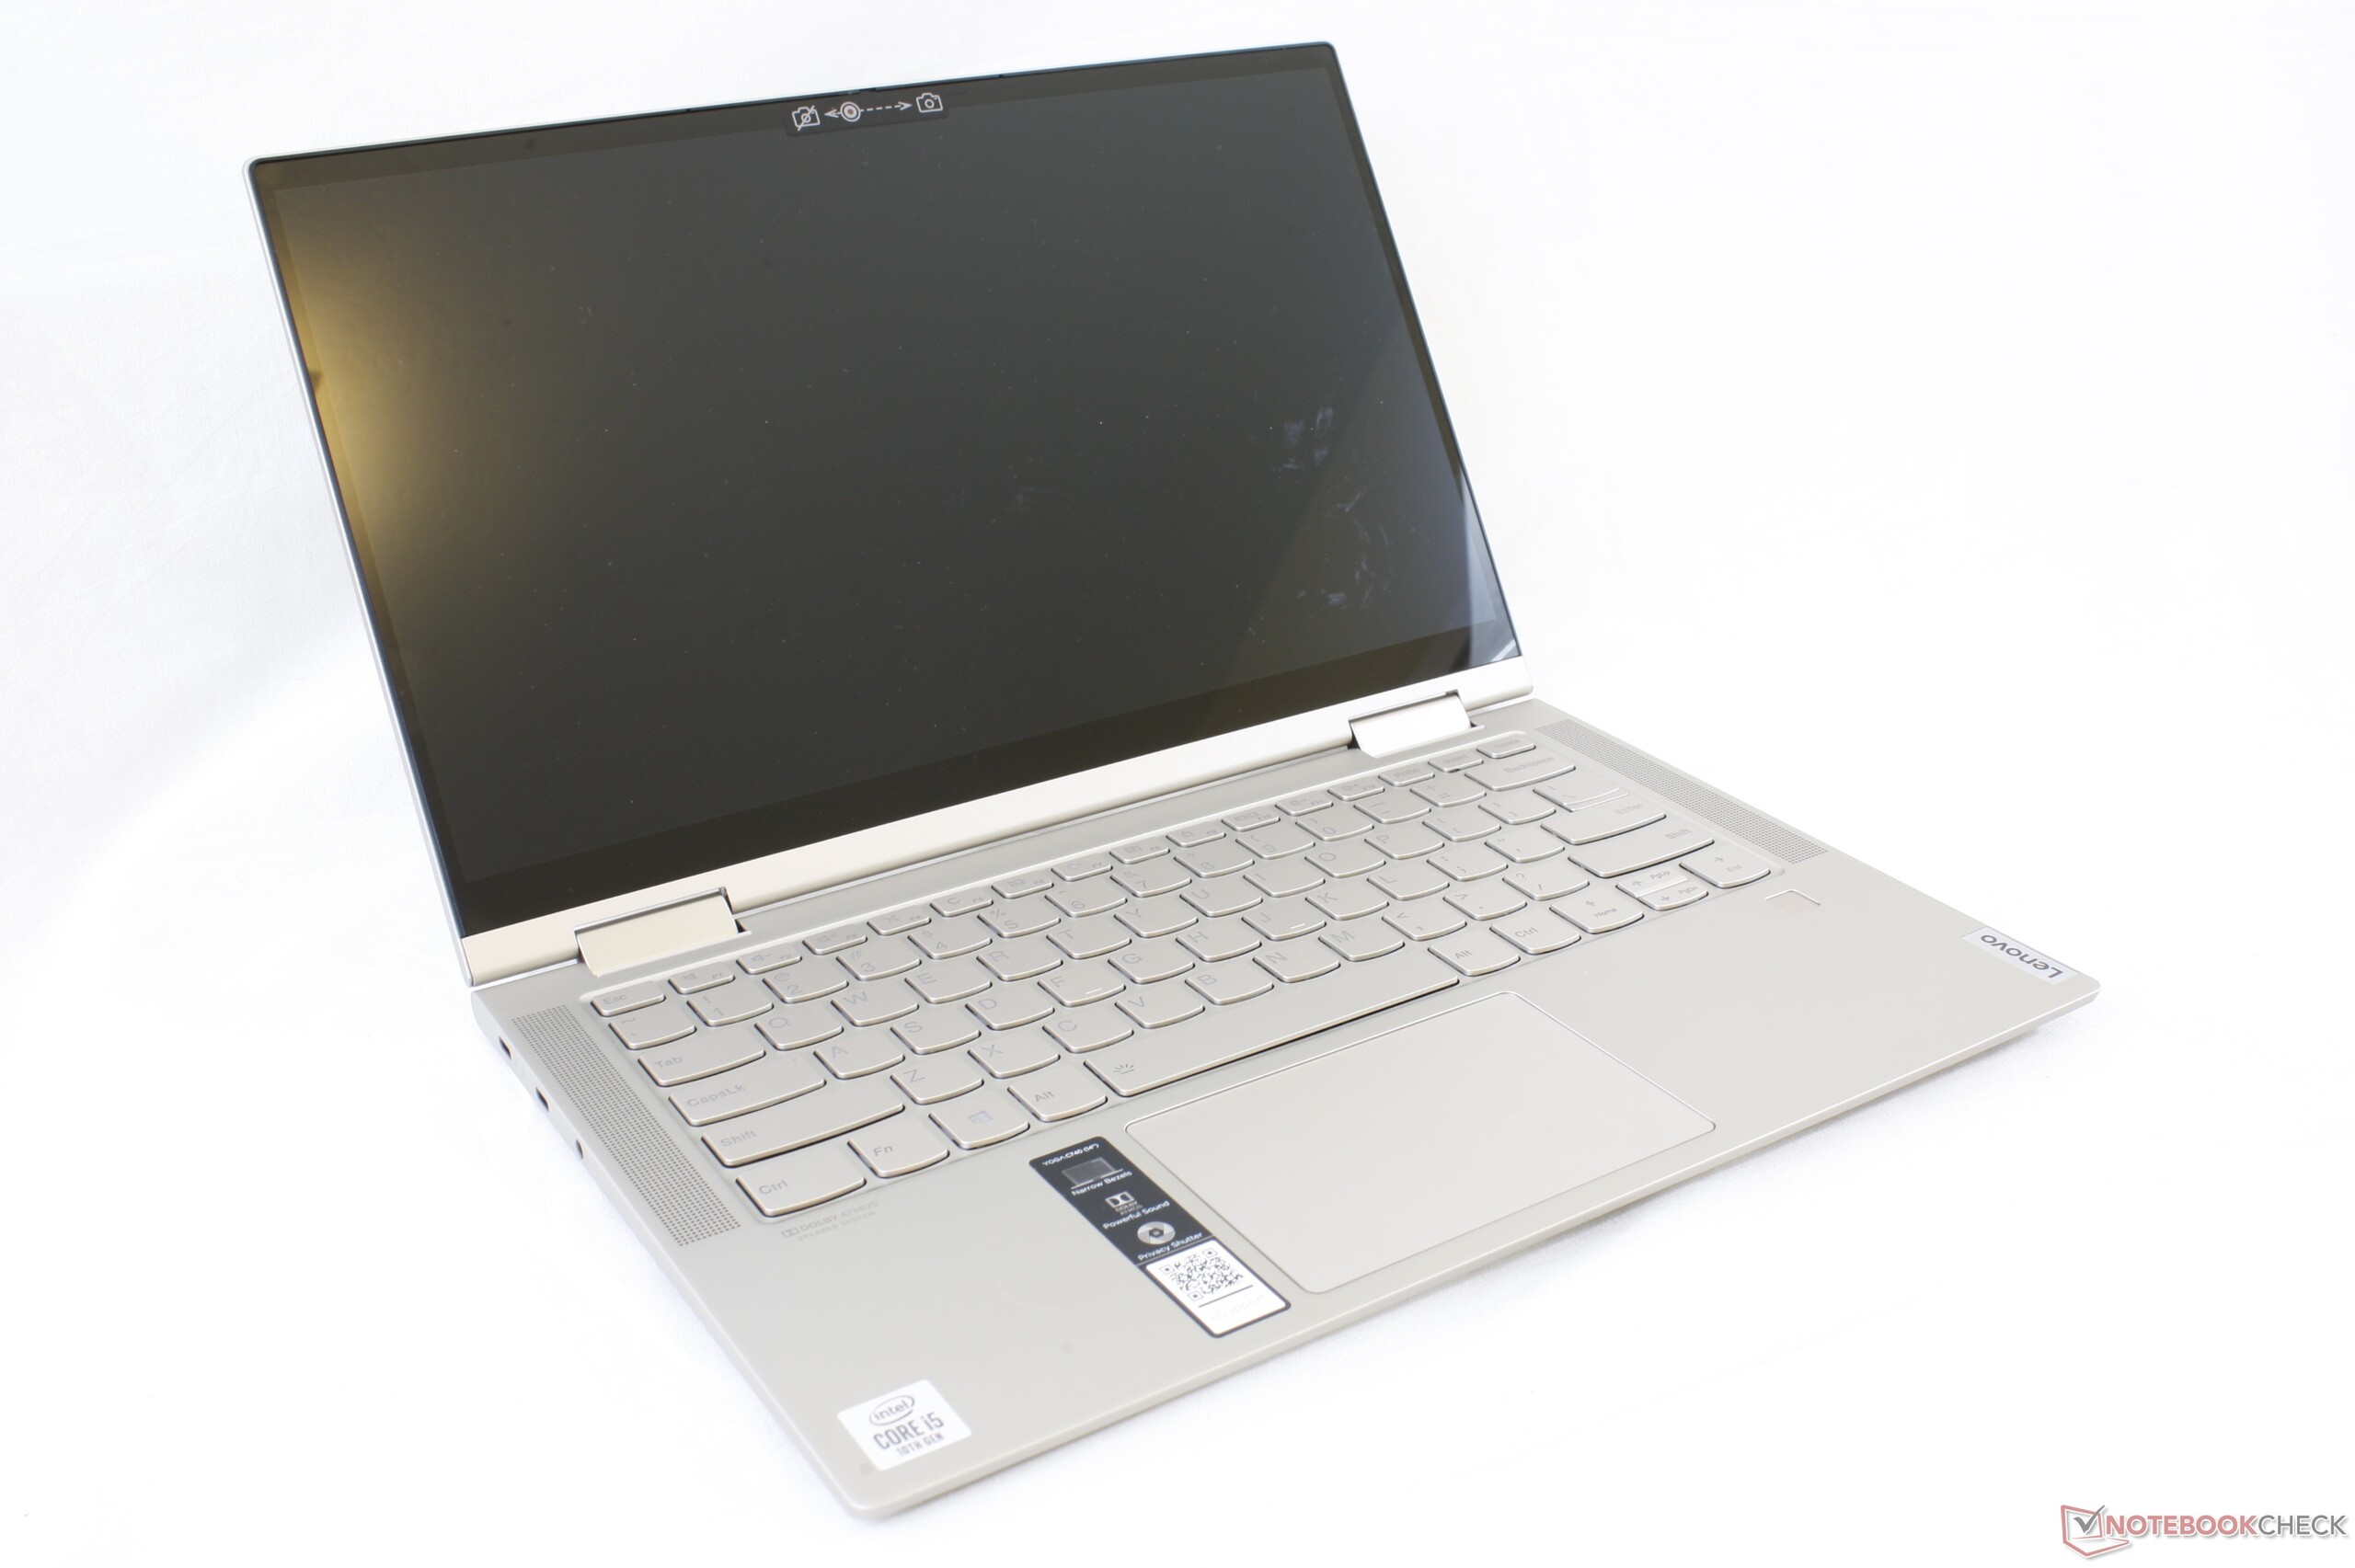
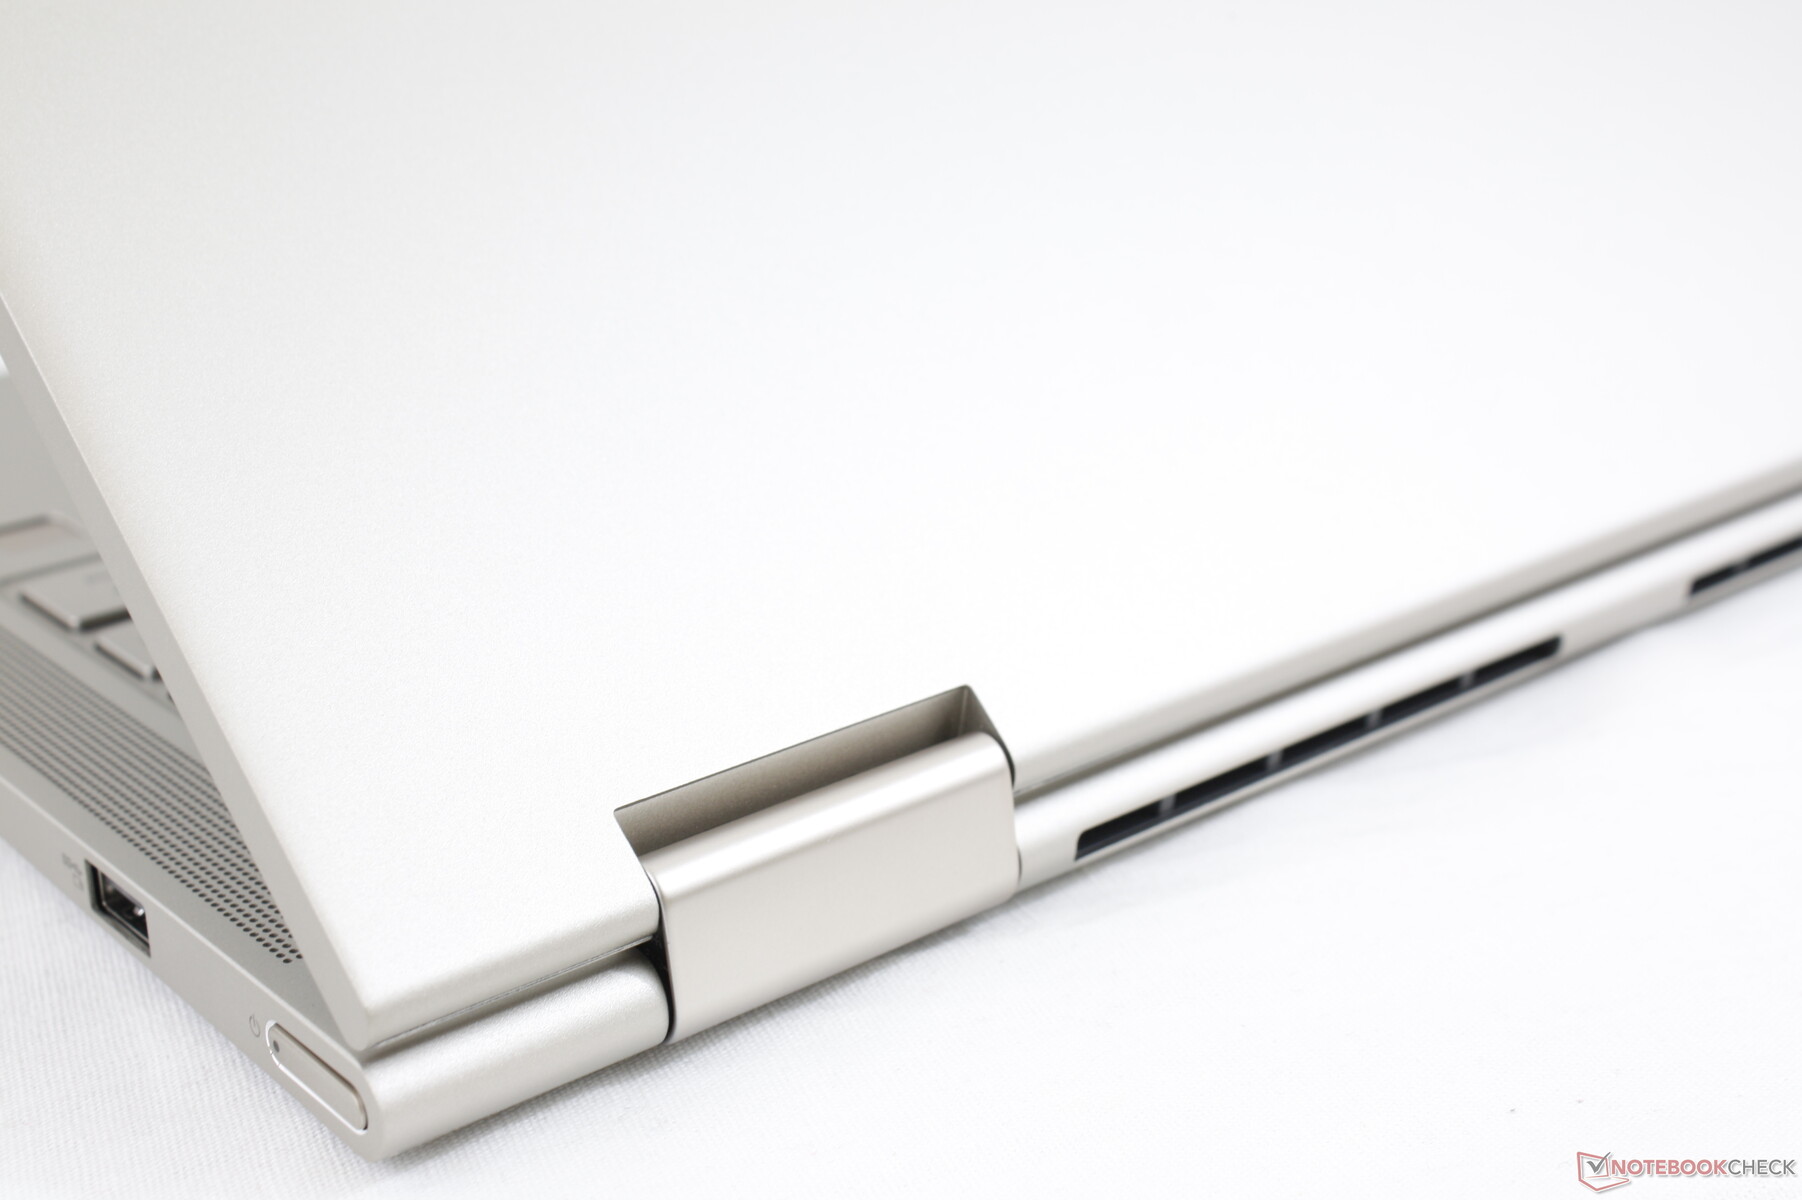
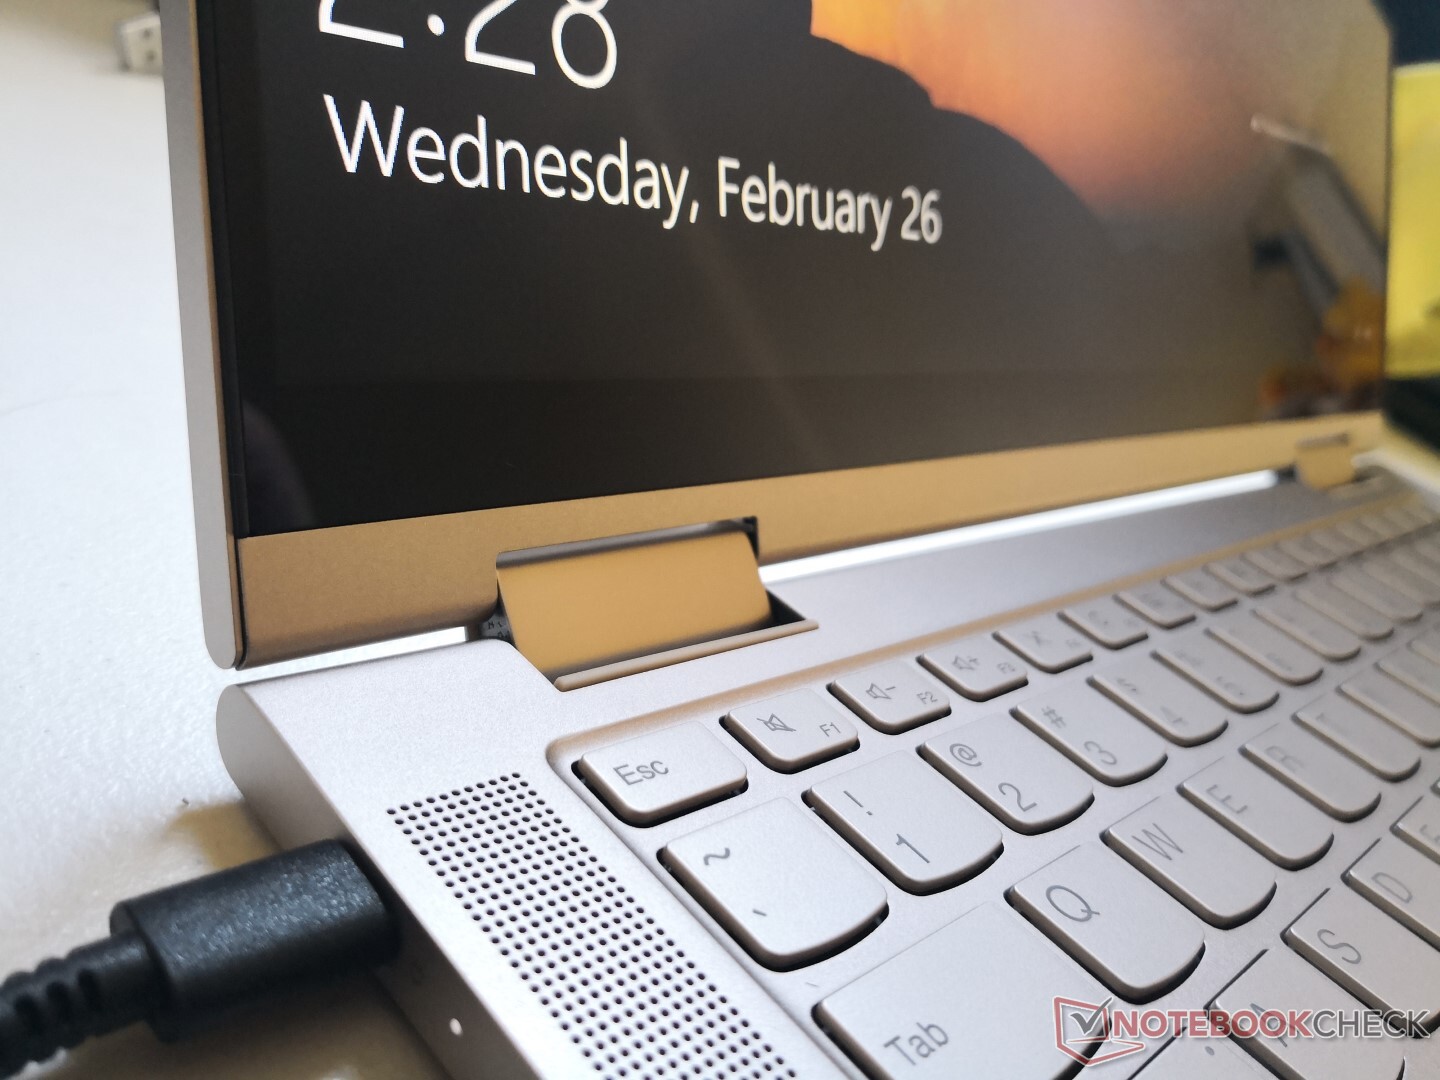
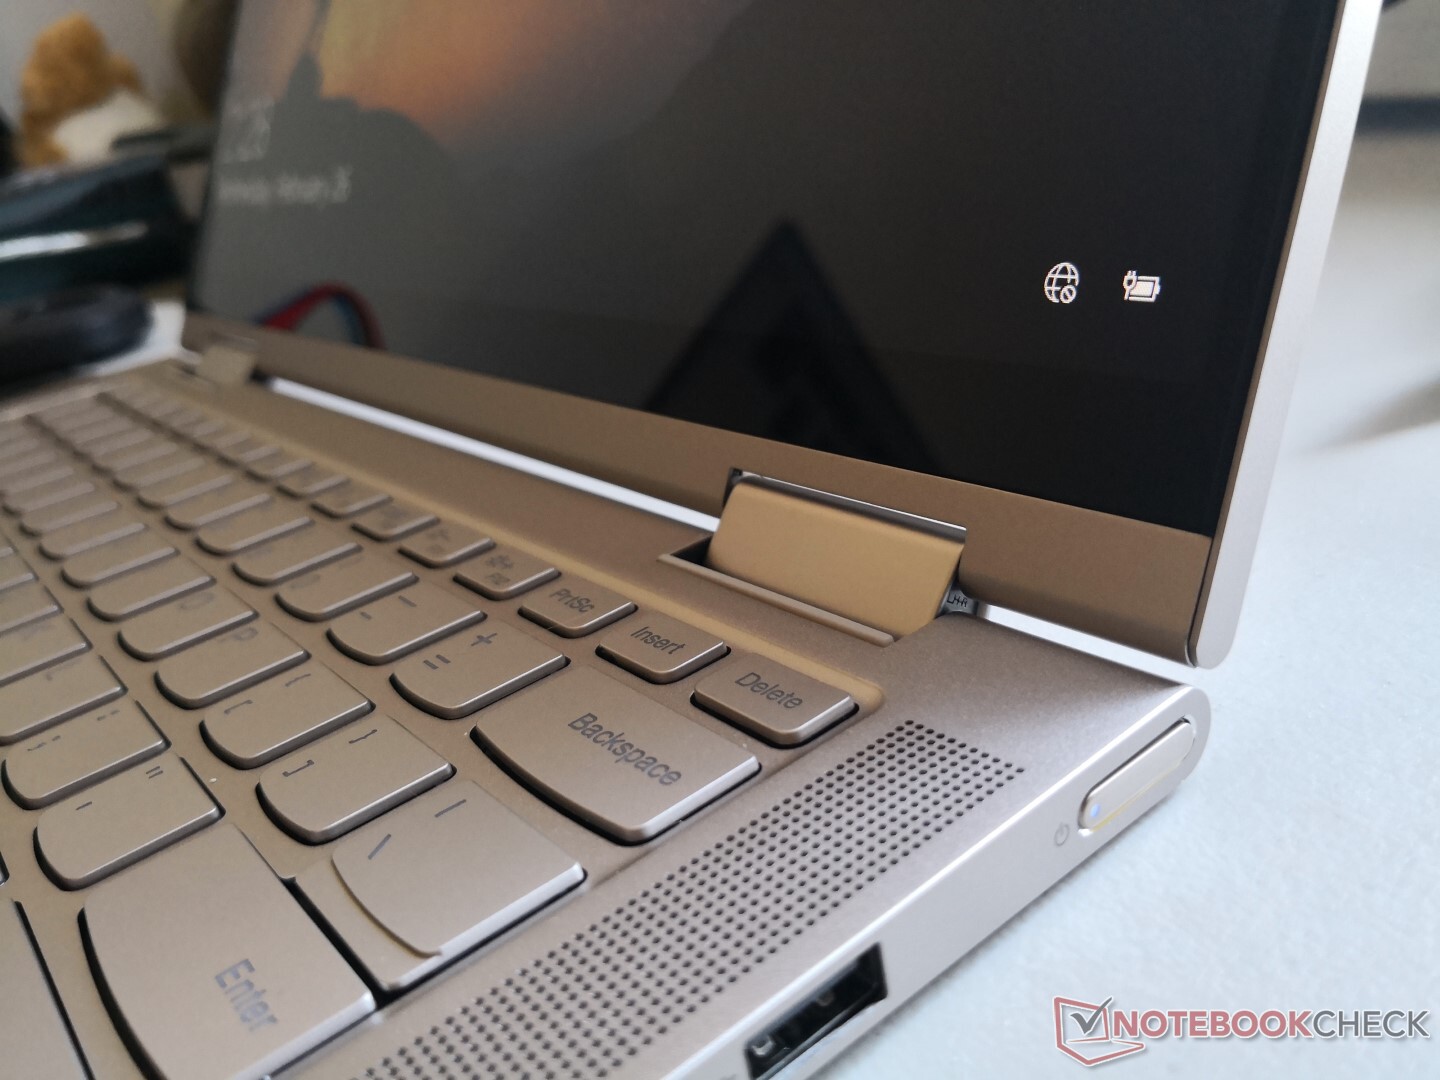
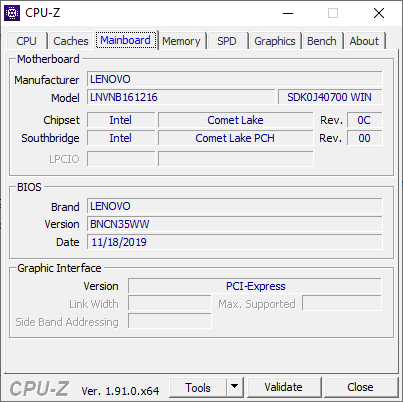
The chassis shares the same style as its larger 15.6-inch Yoga C740-15 sibling but in a more travel-friendly 14-inch size. The smooth aluminum surfaces and clean look seem inspired by more expensive Ultrabooks like the Yoga C940 or the HP Spectre series. Rigidity is not as strong, however, as twisting the base will cause more warping and creaking than on the aforementioned alternatives. Even so, the slight flexing is definitely not of any concern and nowhere near as "budget" as what we experienced on the HP Pavilion x360 series.
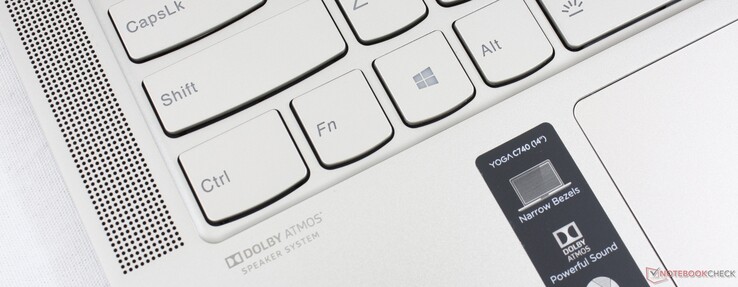
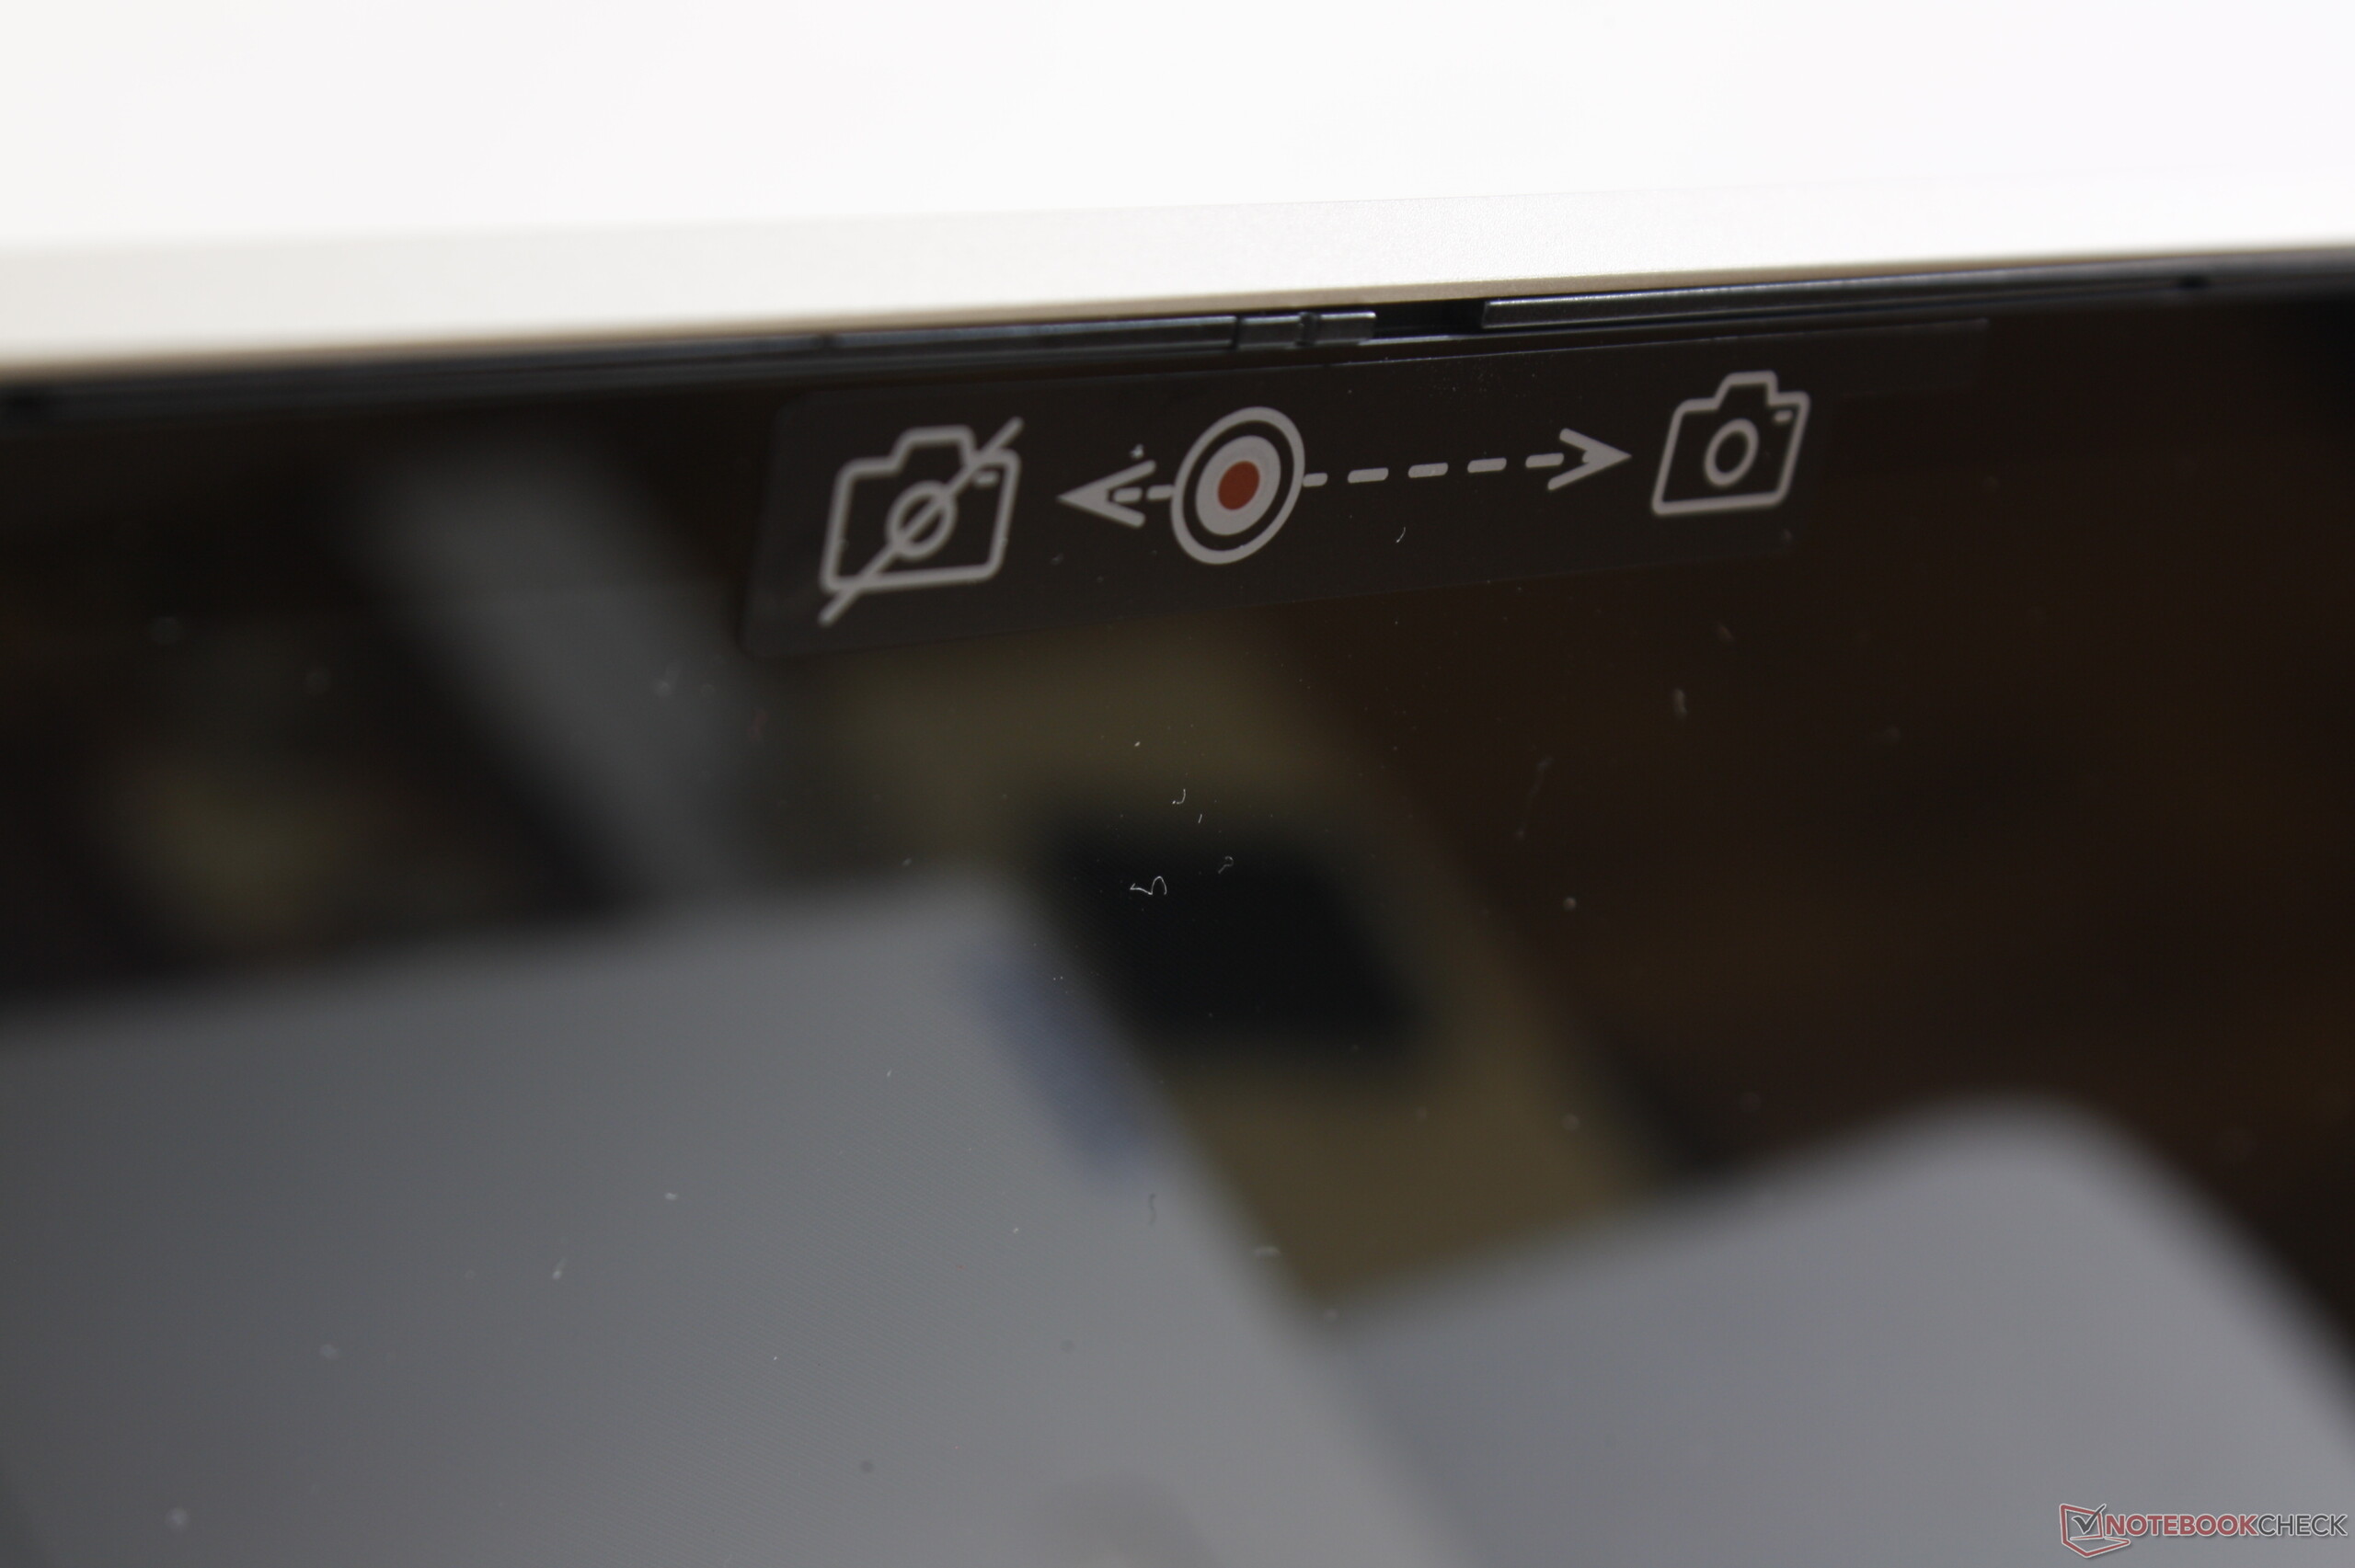
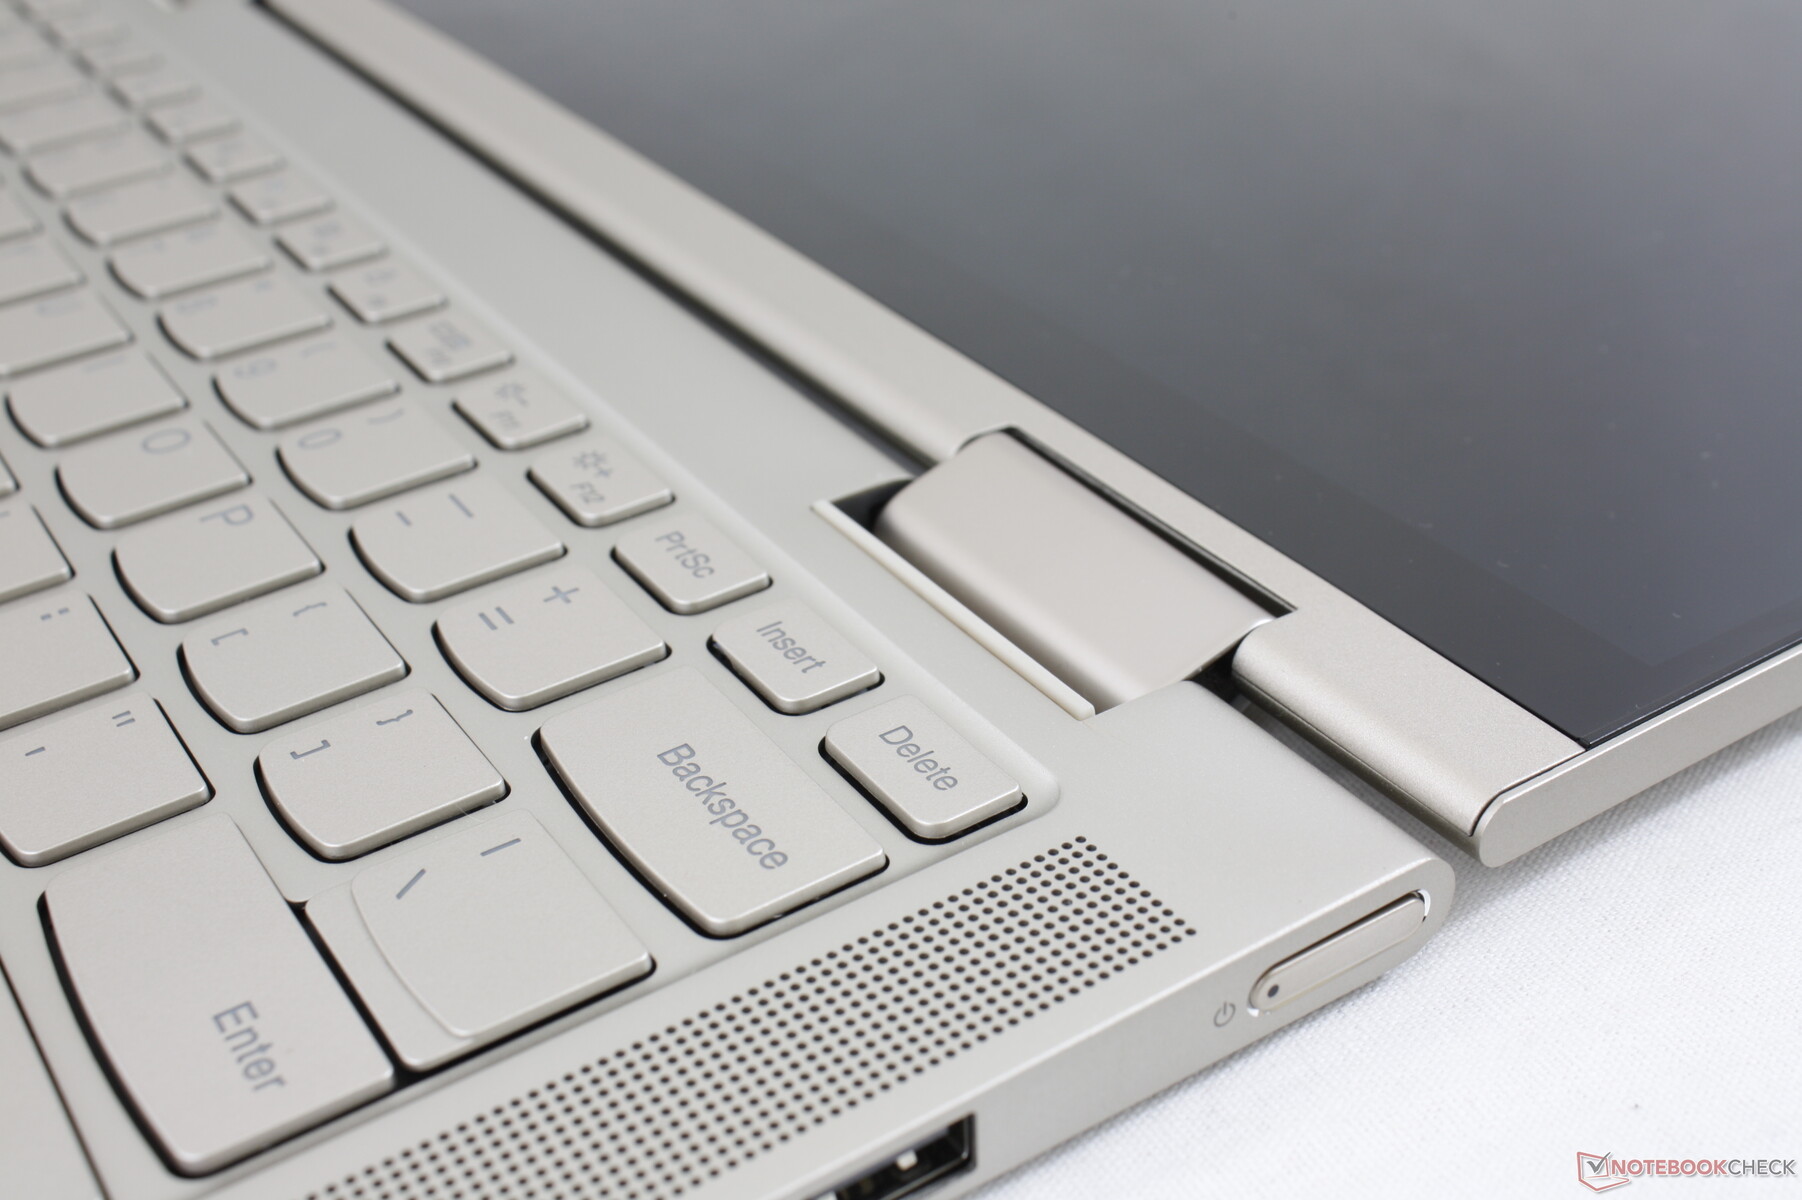
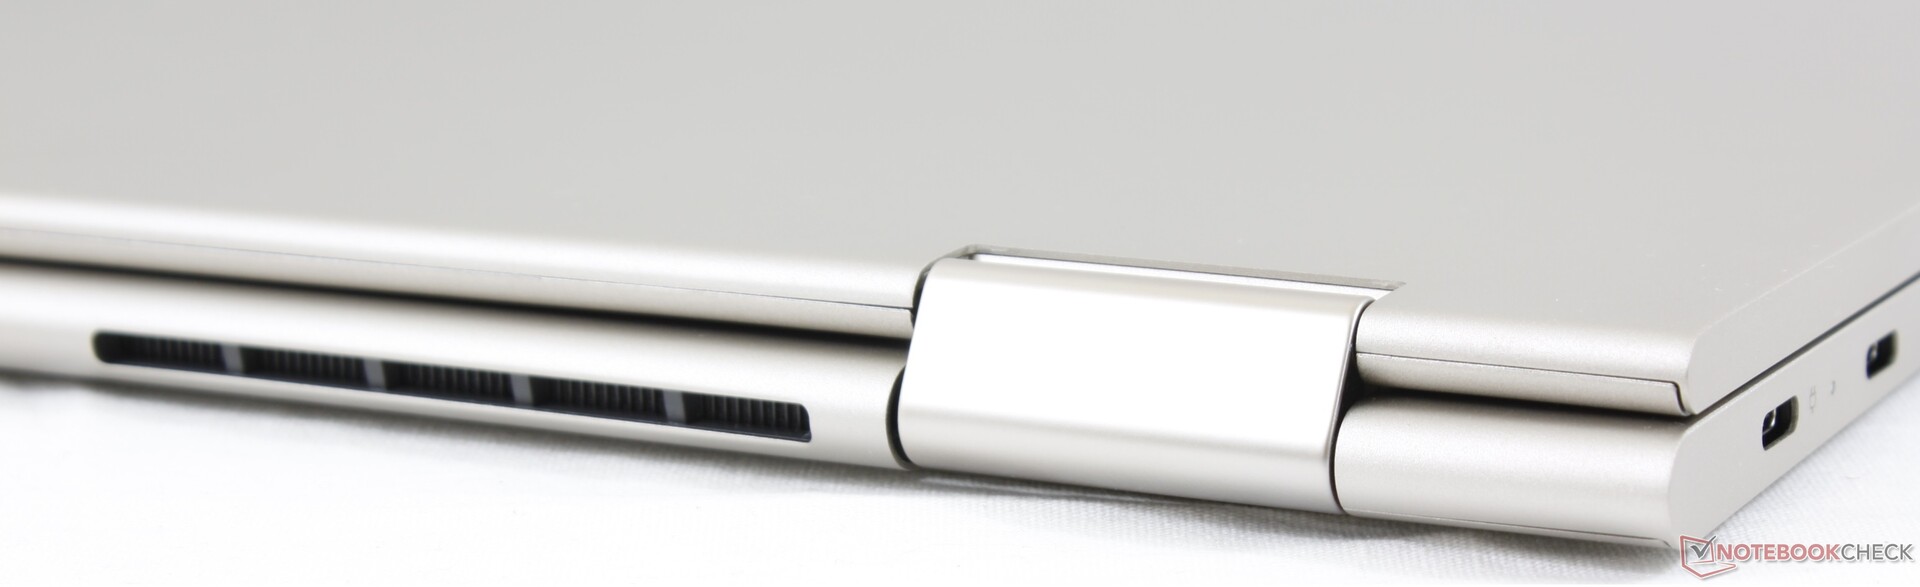
When compared to the pricier Yoga C940-14, some physical features had to be cut in order to reach a lower price. The hinges, for example, no longer house speakers and they even feel slightly weaker this around. The notched webcam along the top edge and the integrated active stylus on the Yoga C940 have both been omitted as well for a more straight-forward design. Fortunately, the webcam privacy slider remains and chassis quality is excellent on our store-bought unit with no unintended gaps or noticeable defects.
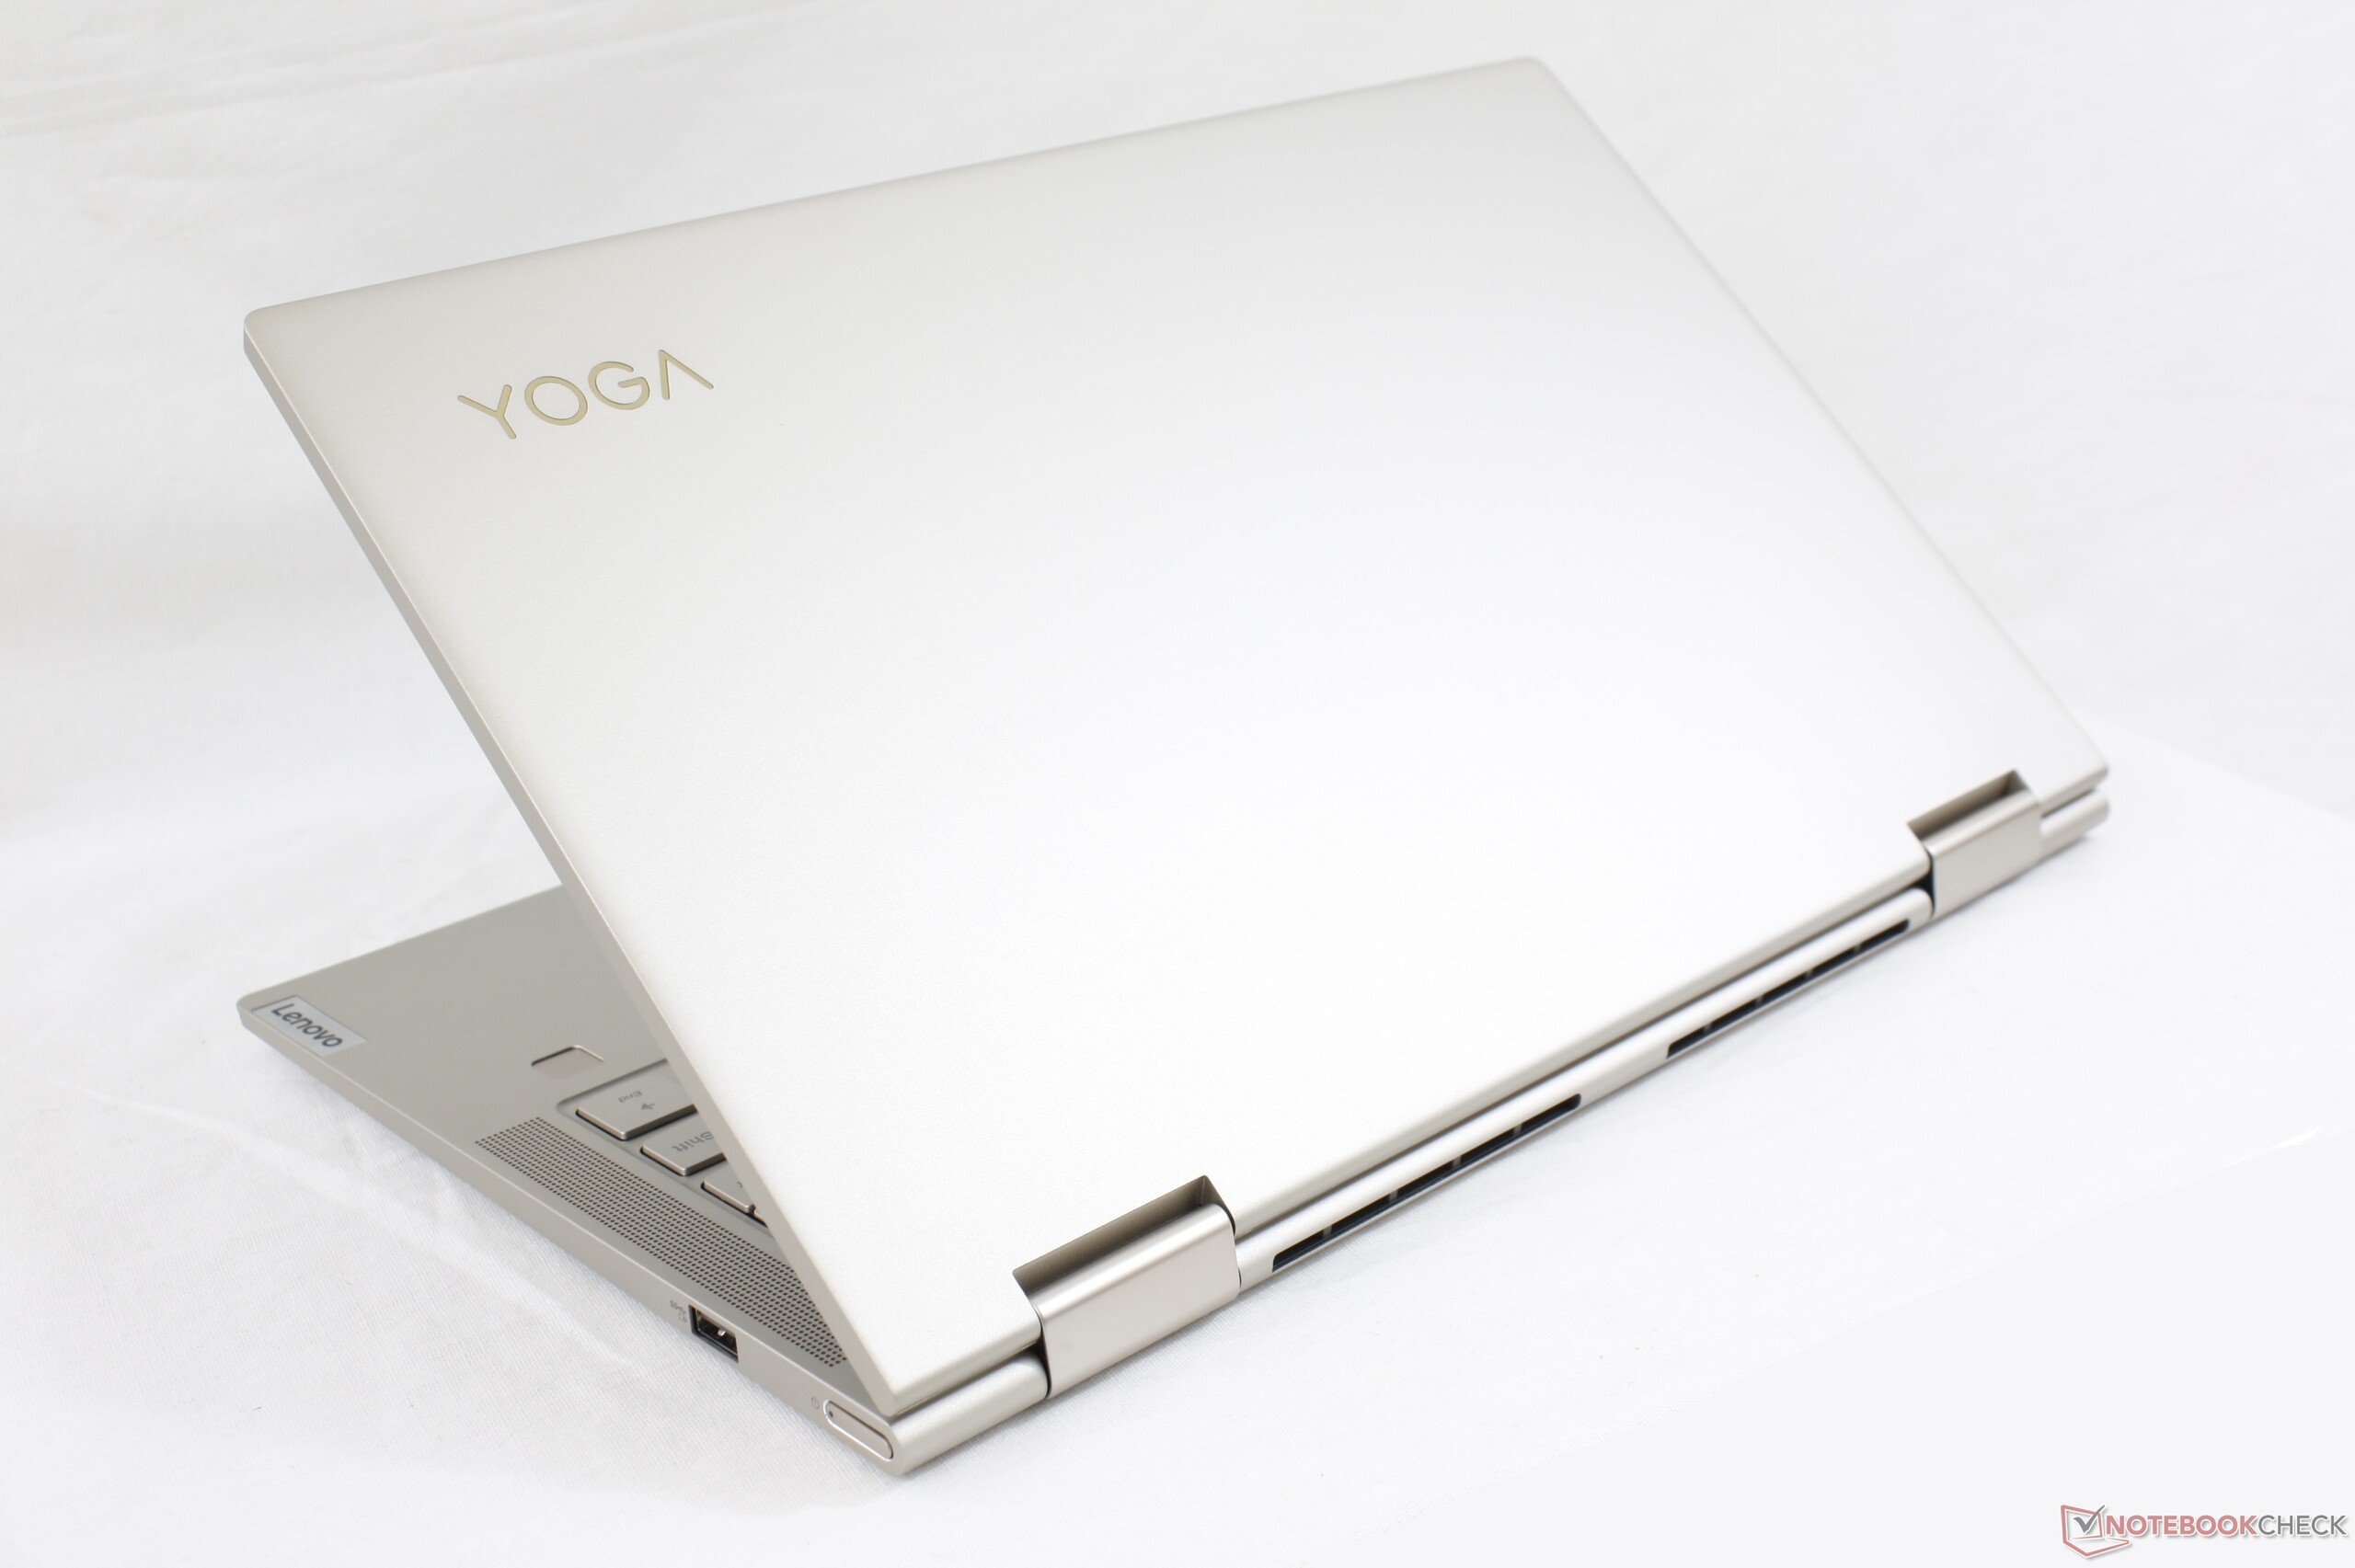
Overall size is within 1 to 2 mm of the pricier Yoga C940 in each dimension. Even the weight between the two systems are nearly identical at about 1.4 kg each. We find the 14-inch form factor to be the most practical when it comes to convertible laptops as screen size is larger than the 13.3-inch while not being as unwieldy as heavier 15.6-inch solutions like the Lenovo Yoga C740-15 or the HP Spectre x360 15.
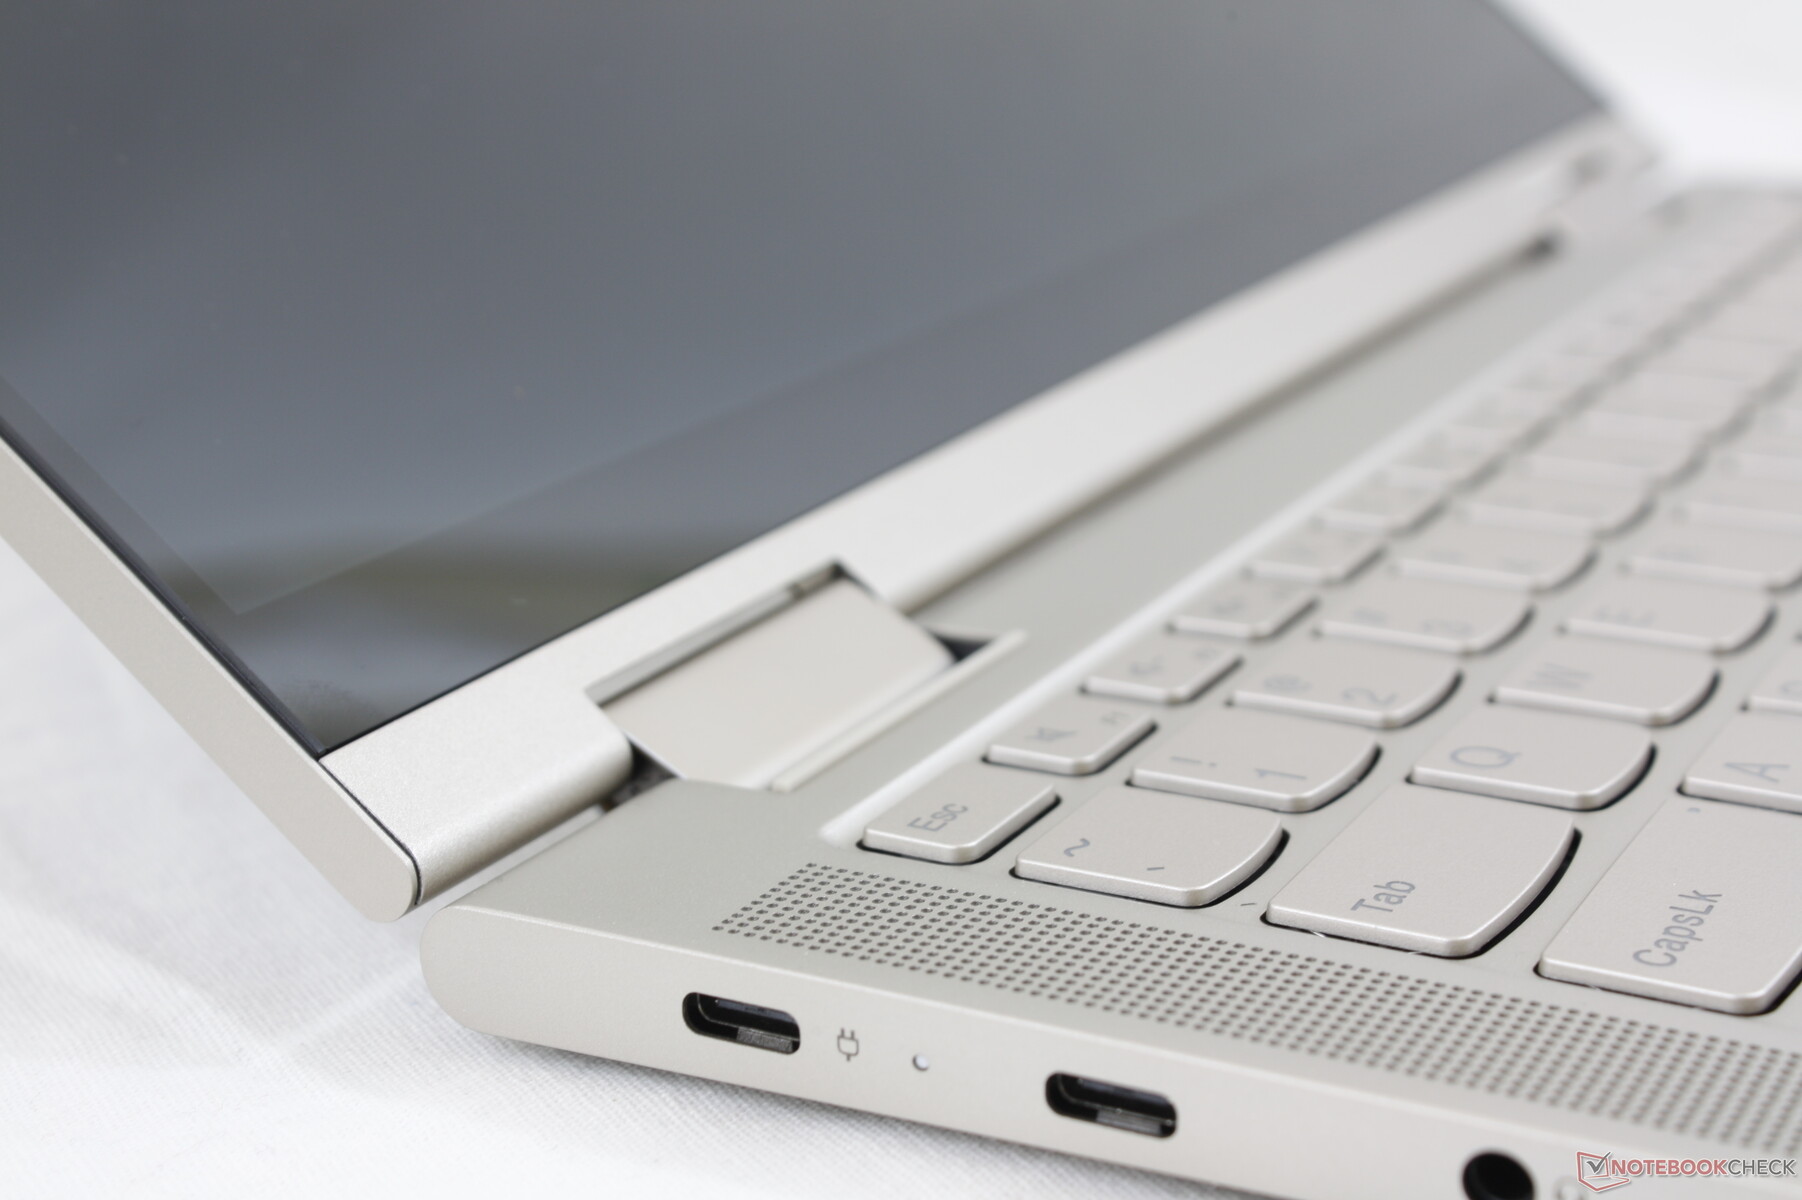
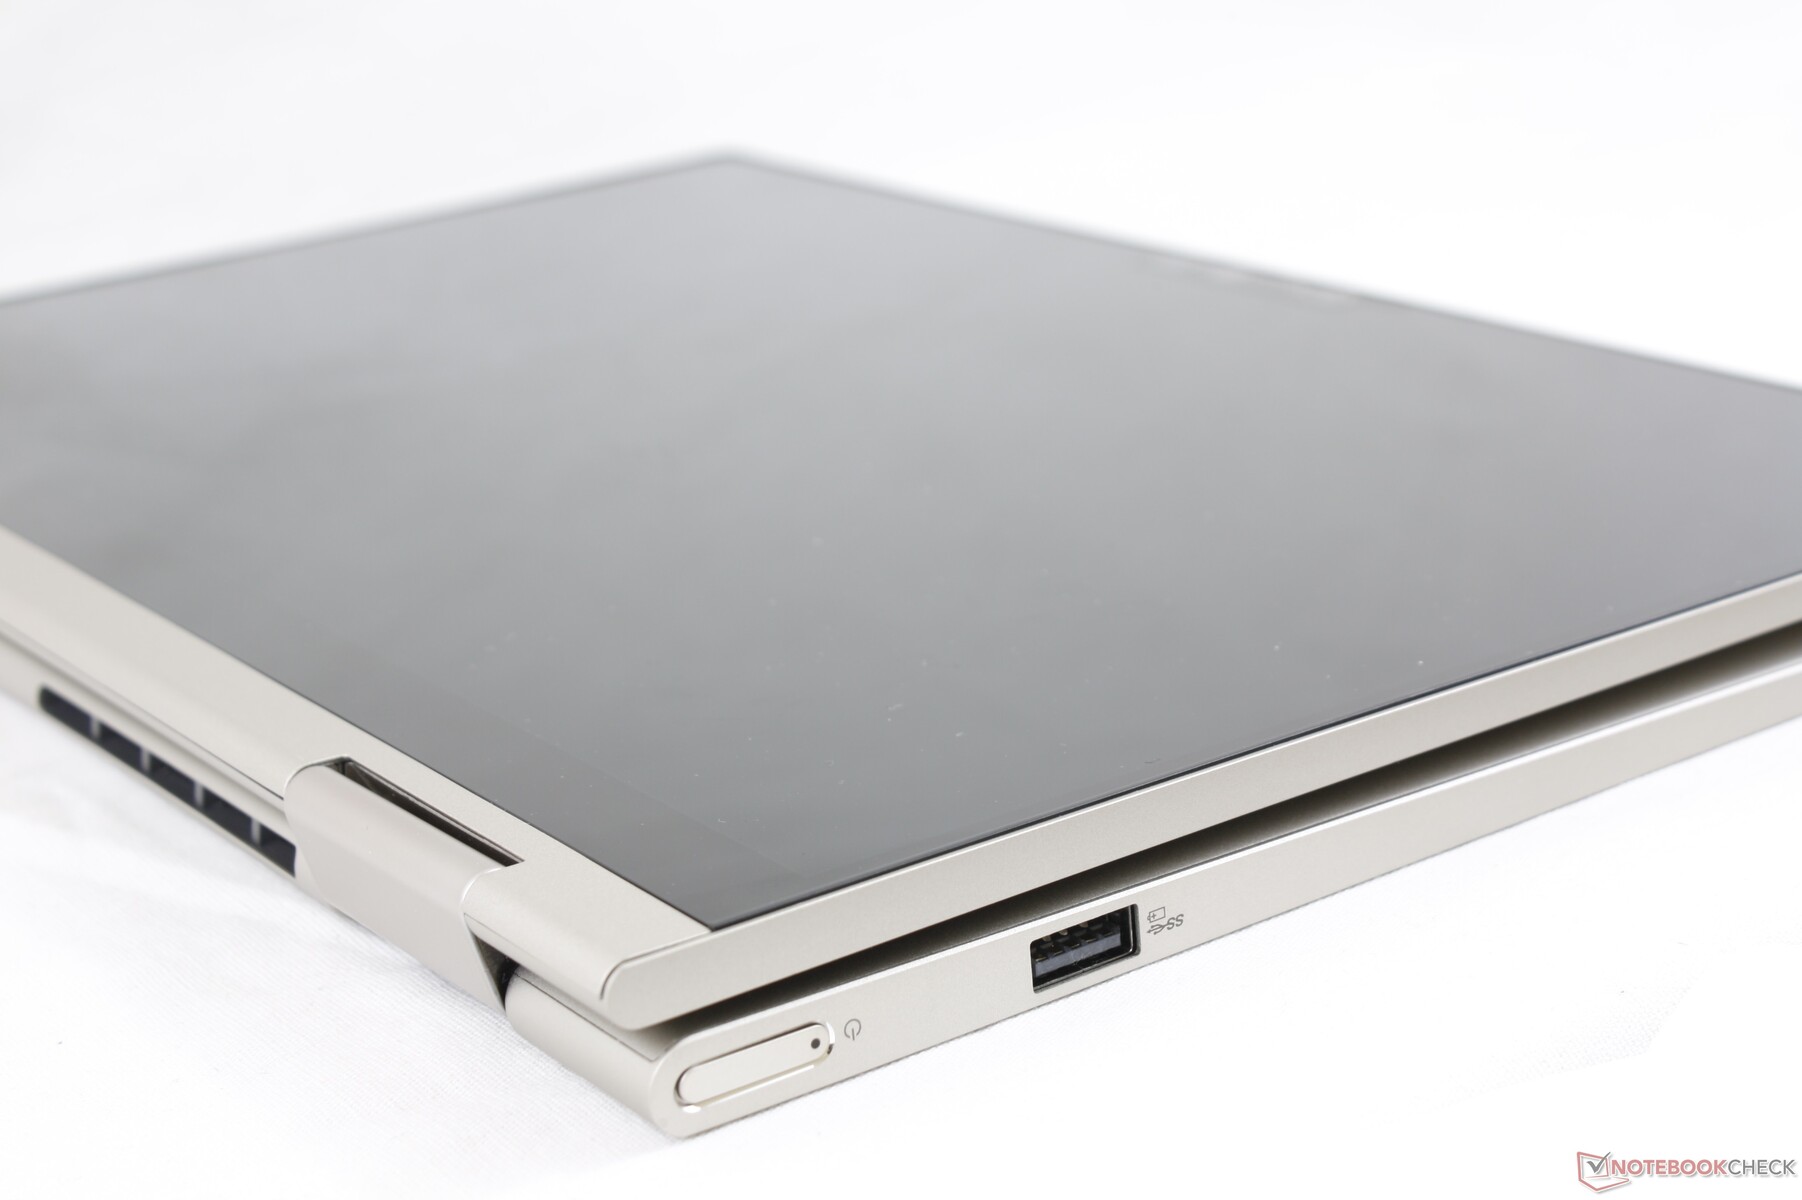
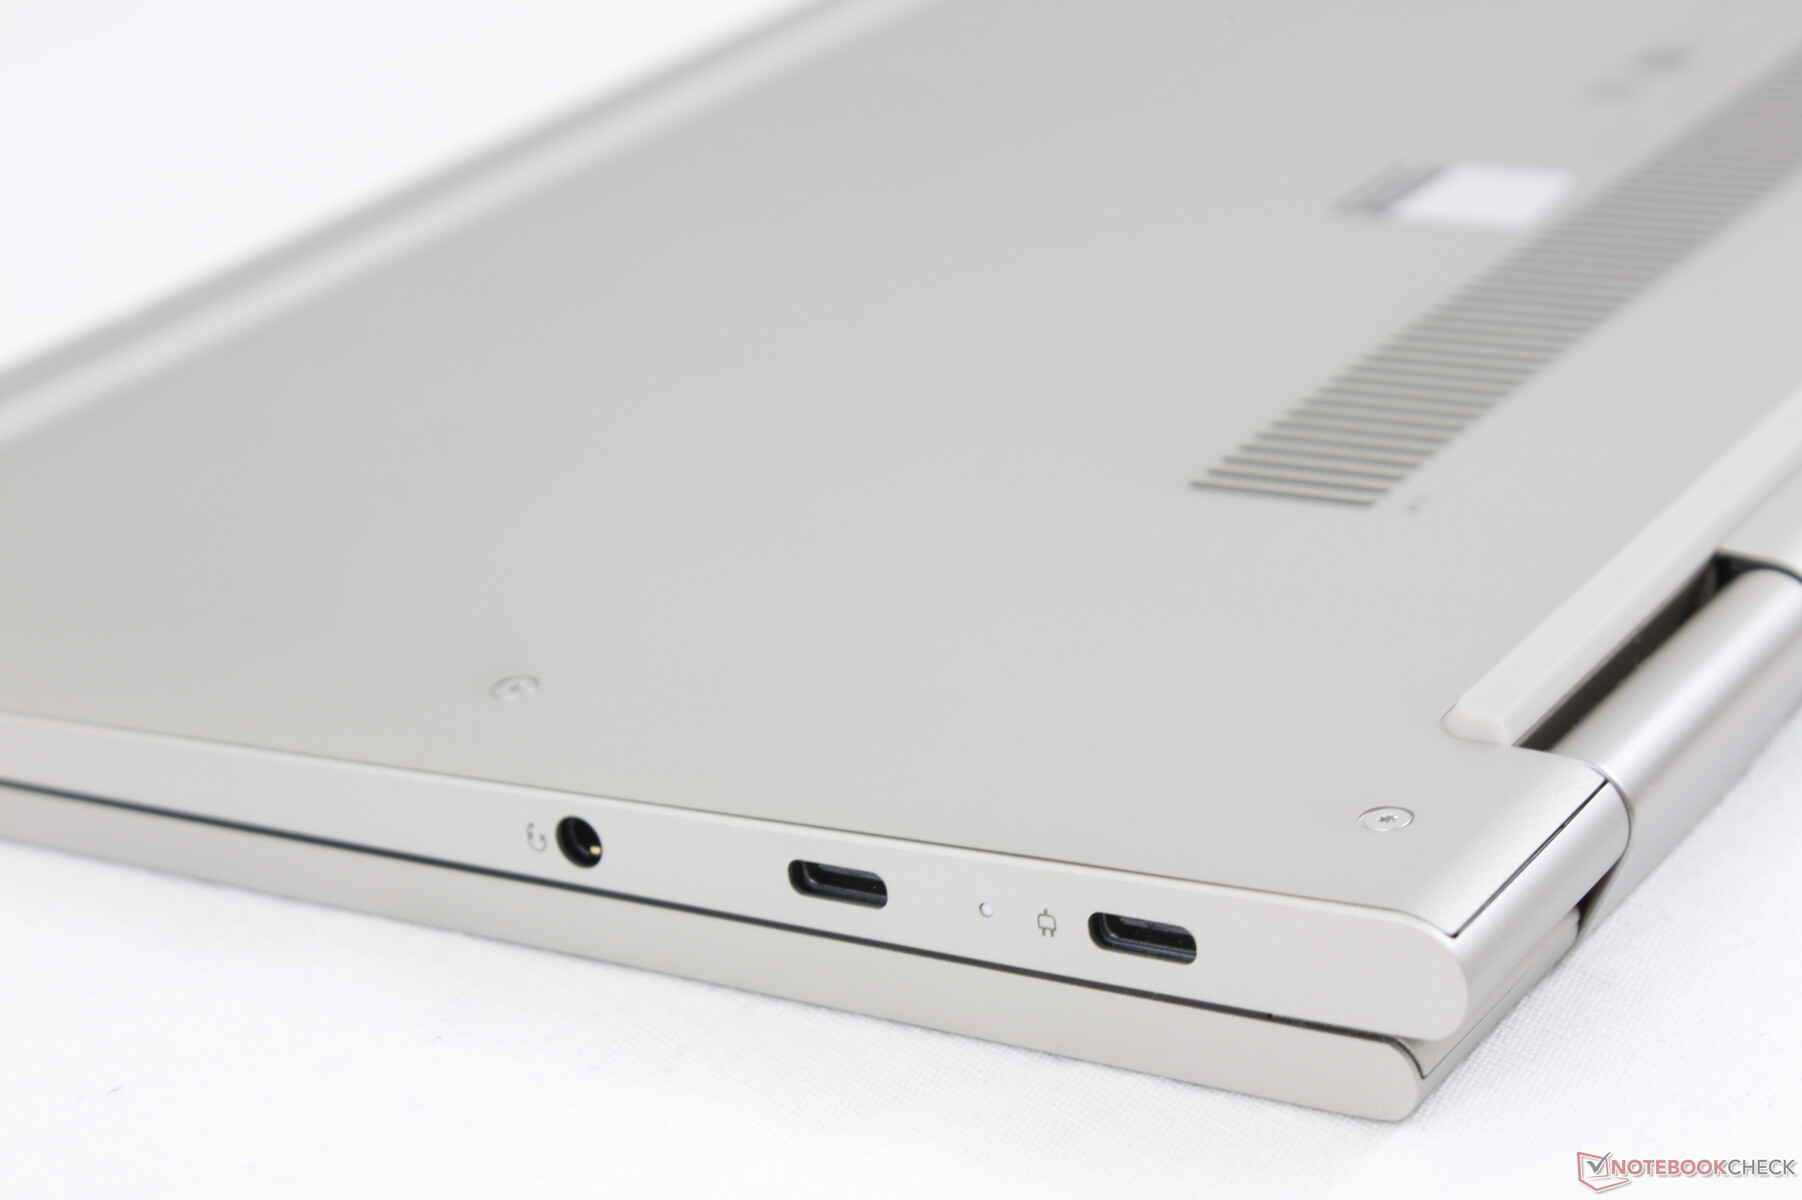
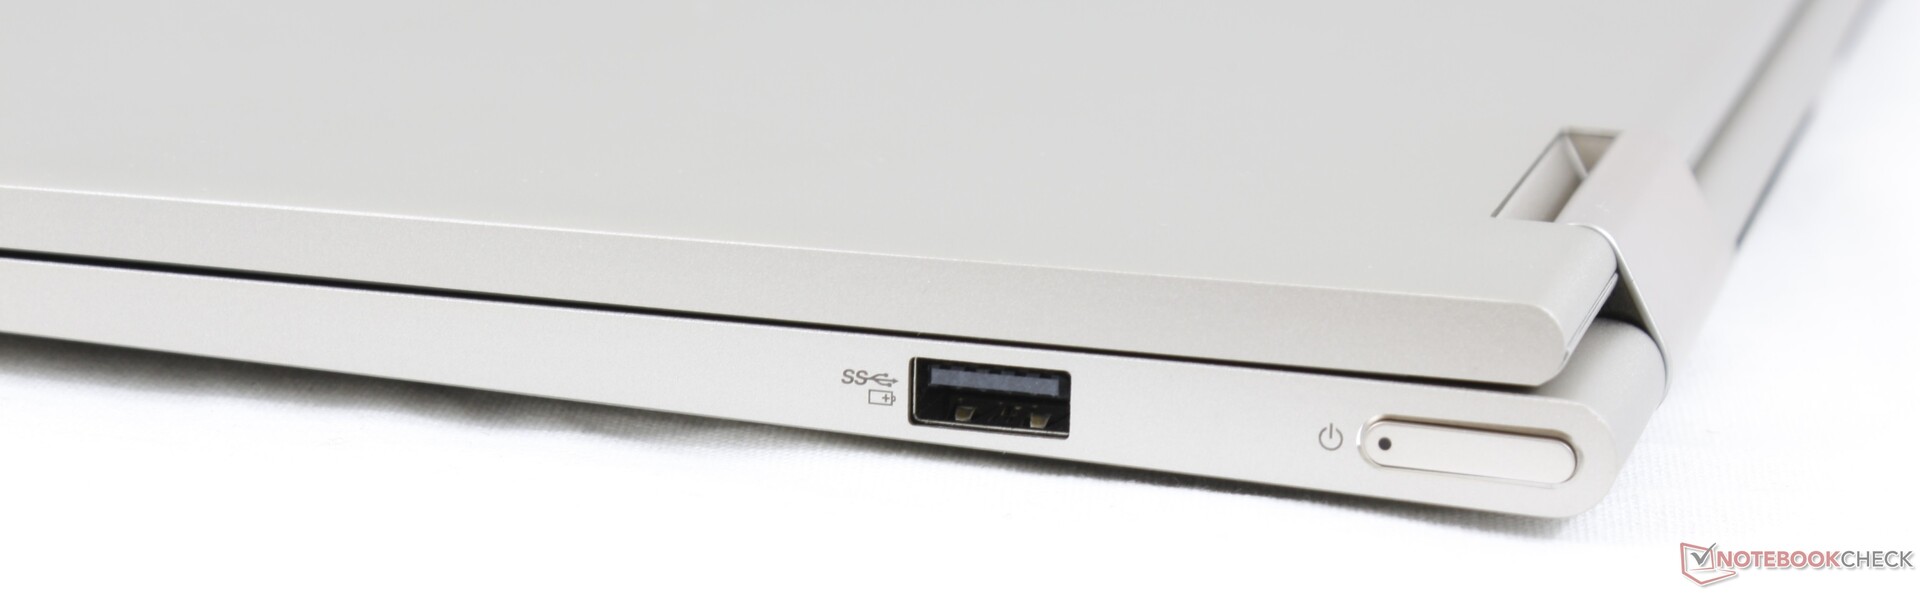
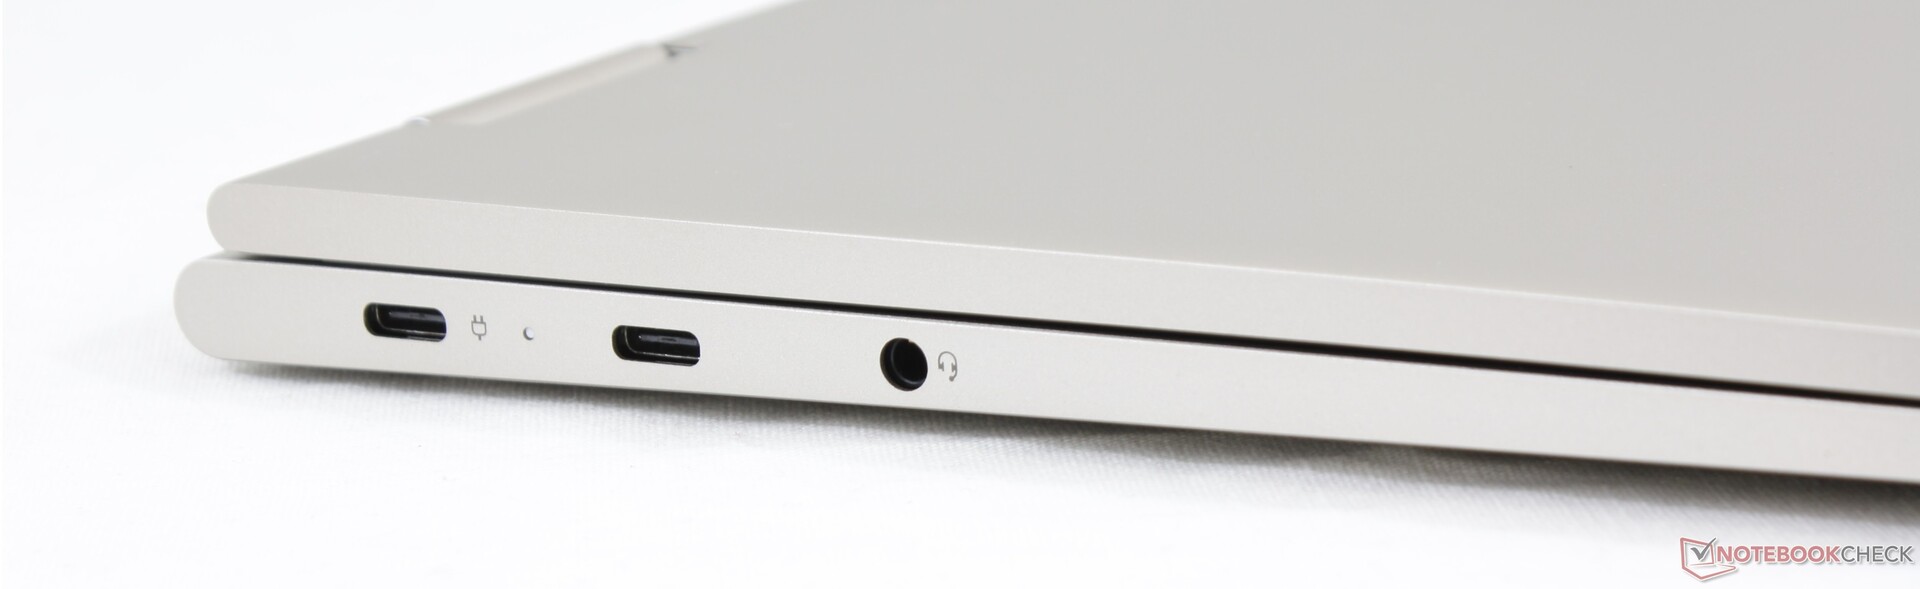
Connectivity
Port options are limited to USB Type-A and two USB Type-C ports. Both of the Type-C ports are capable of recharging and DisplayPort for added versatility. There is no Thunderbolt 3 support as Lenovo is reserving this feature for its costlier Yoga C900 series instead.
Communication
WLAN is provided by an Intel 9560 for Wi-Fi 5 speeds. Average transfer rates are quite close to the latest AX200 Wi-Fi 6 cards even when connected to the same high-end Netgear RAX200 router and 2.5 Gbps server line. We didn't experience any connectivity issues during our time with the test unit.
| Networking | |
| iperf3 transmit AX12 | |
| Acer Aspire 5 A514-52 | |
| MSI Prestige 15 A10SC | |
| Lenovo Yoga C740-14IML | |
| Alienware m17 R2 P41E | |
| iperf3 receive AX12 | |
| MSI Prestige 15 A10SC | |
| Acer Aspire 5 A514-52 | |
| Lenovo Yoga C740-14IML | |
| Alienware m17 R2 P41E | |
Webcam

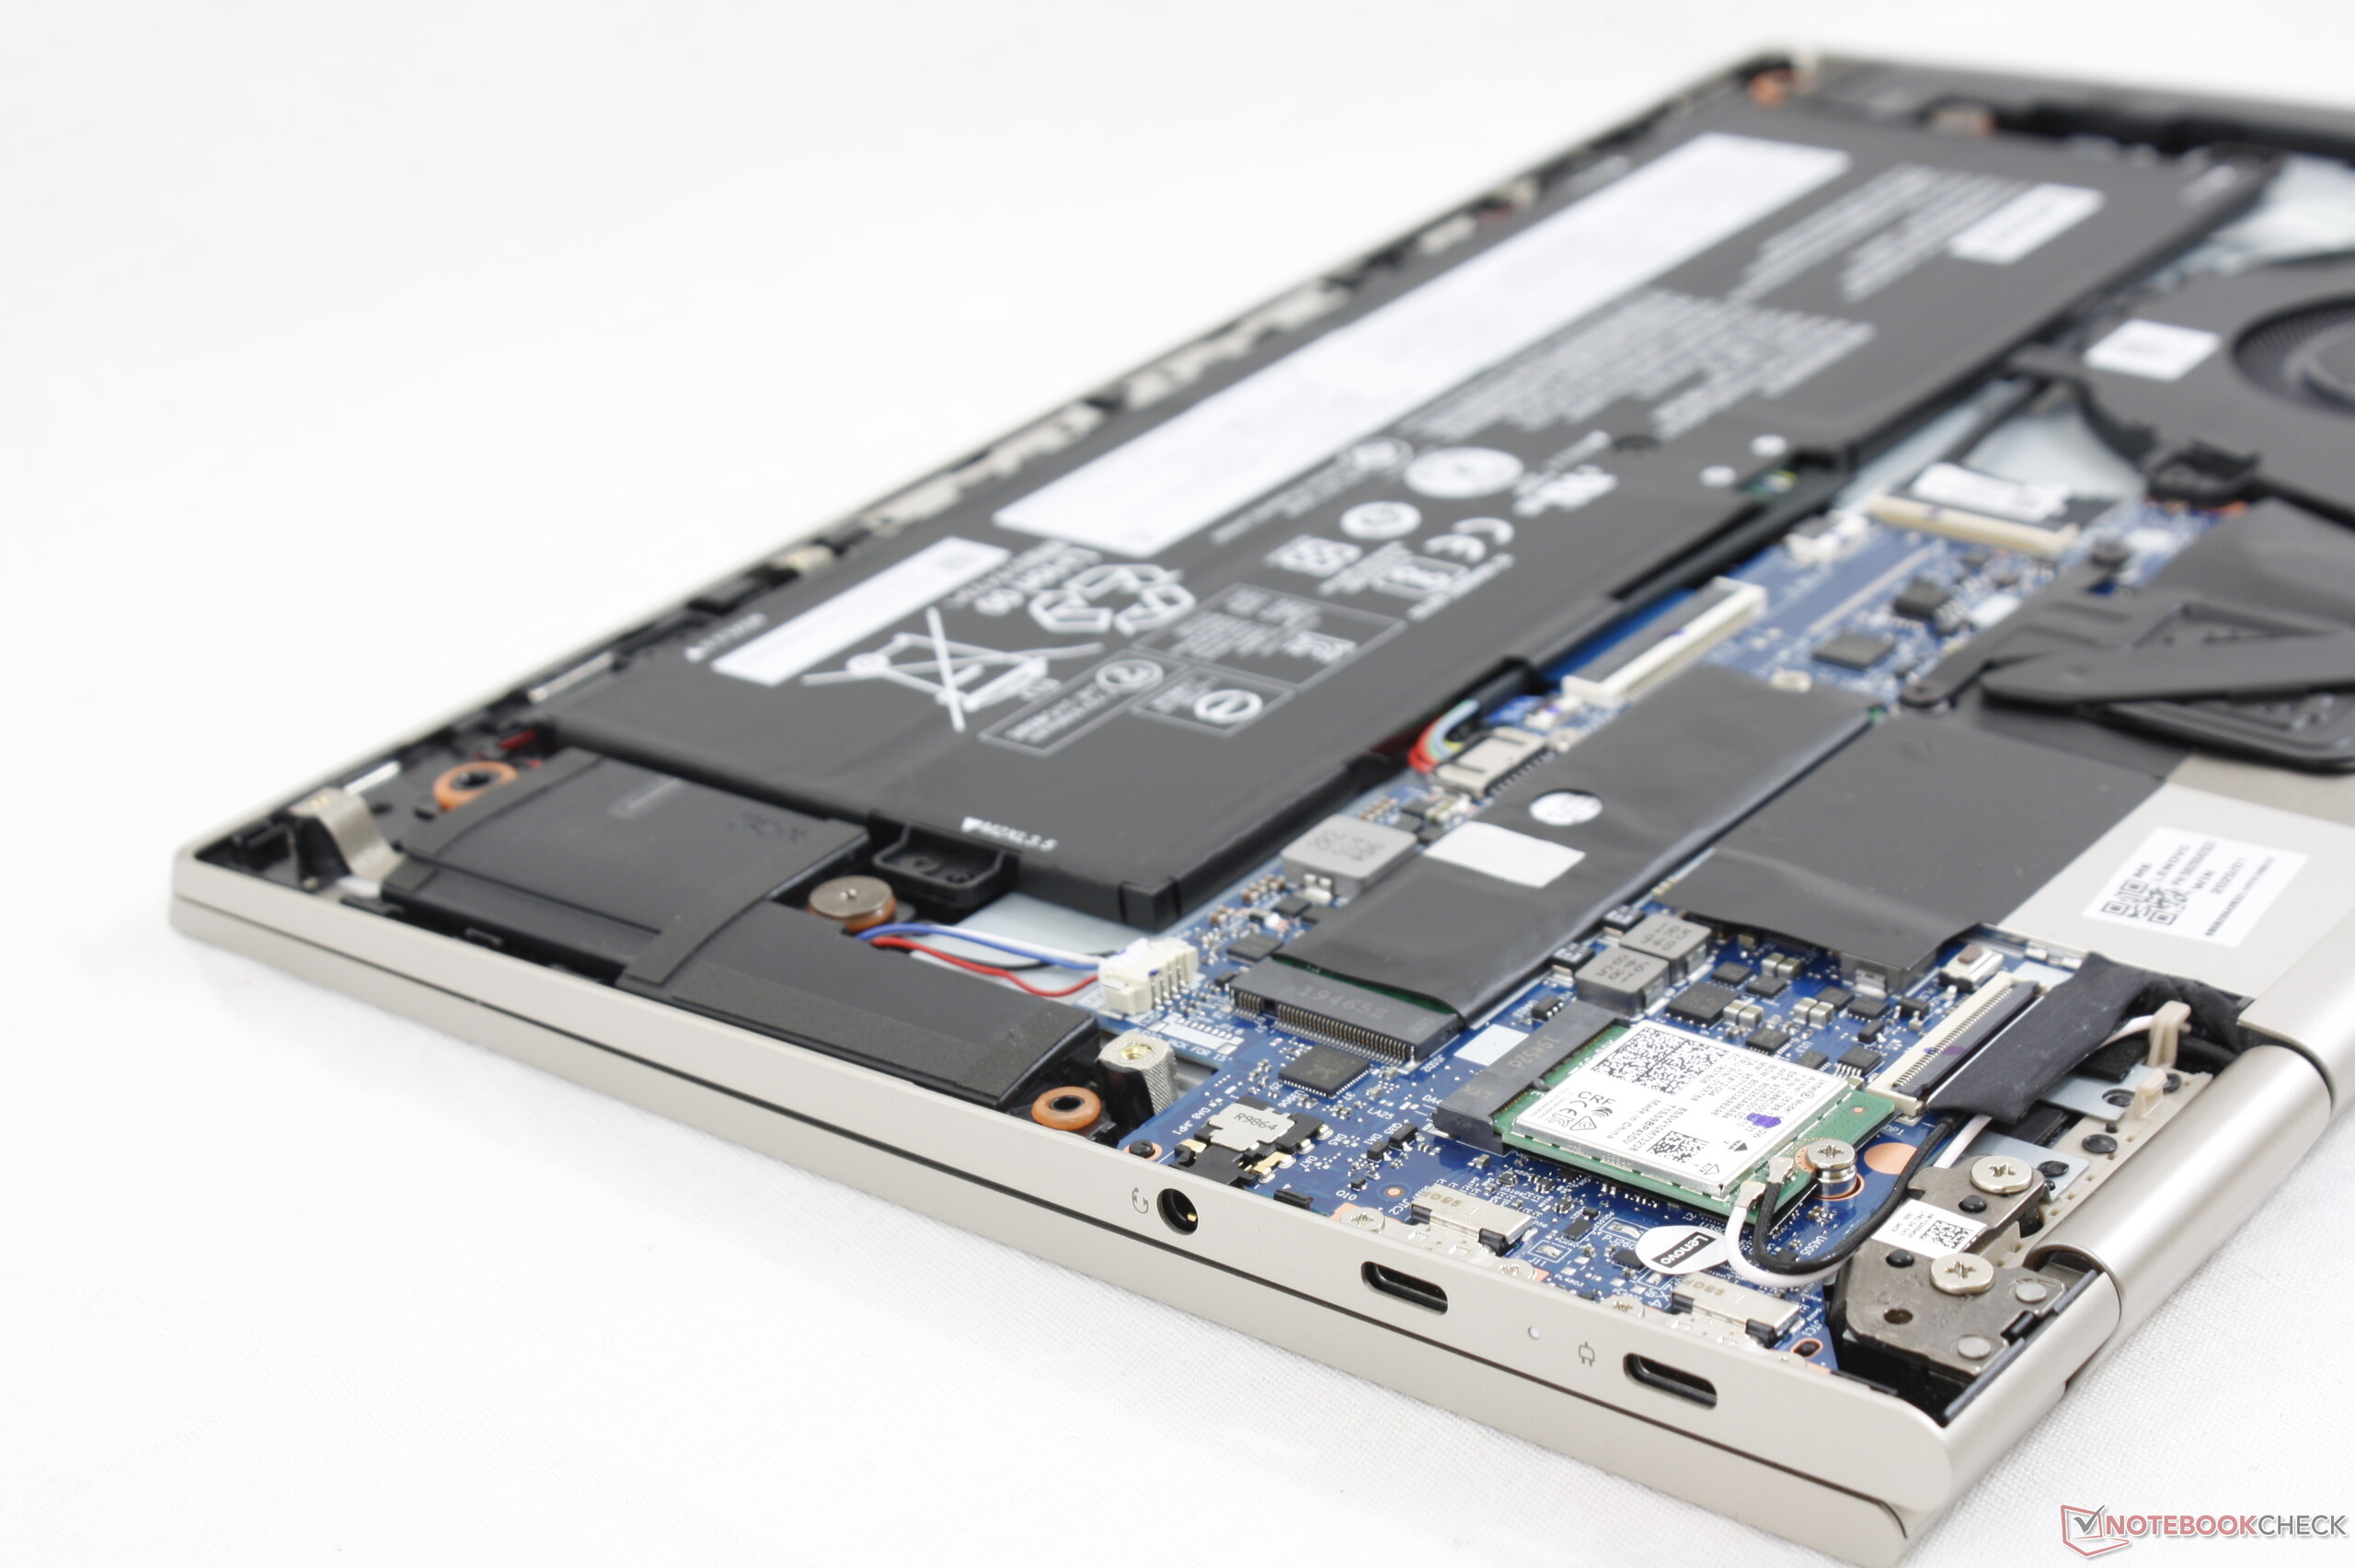
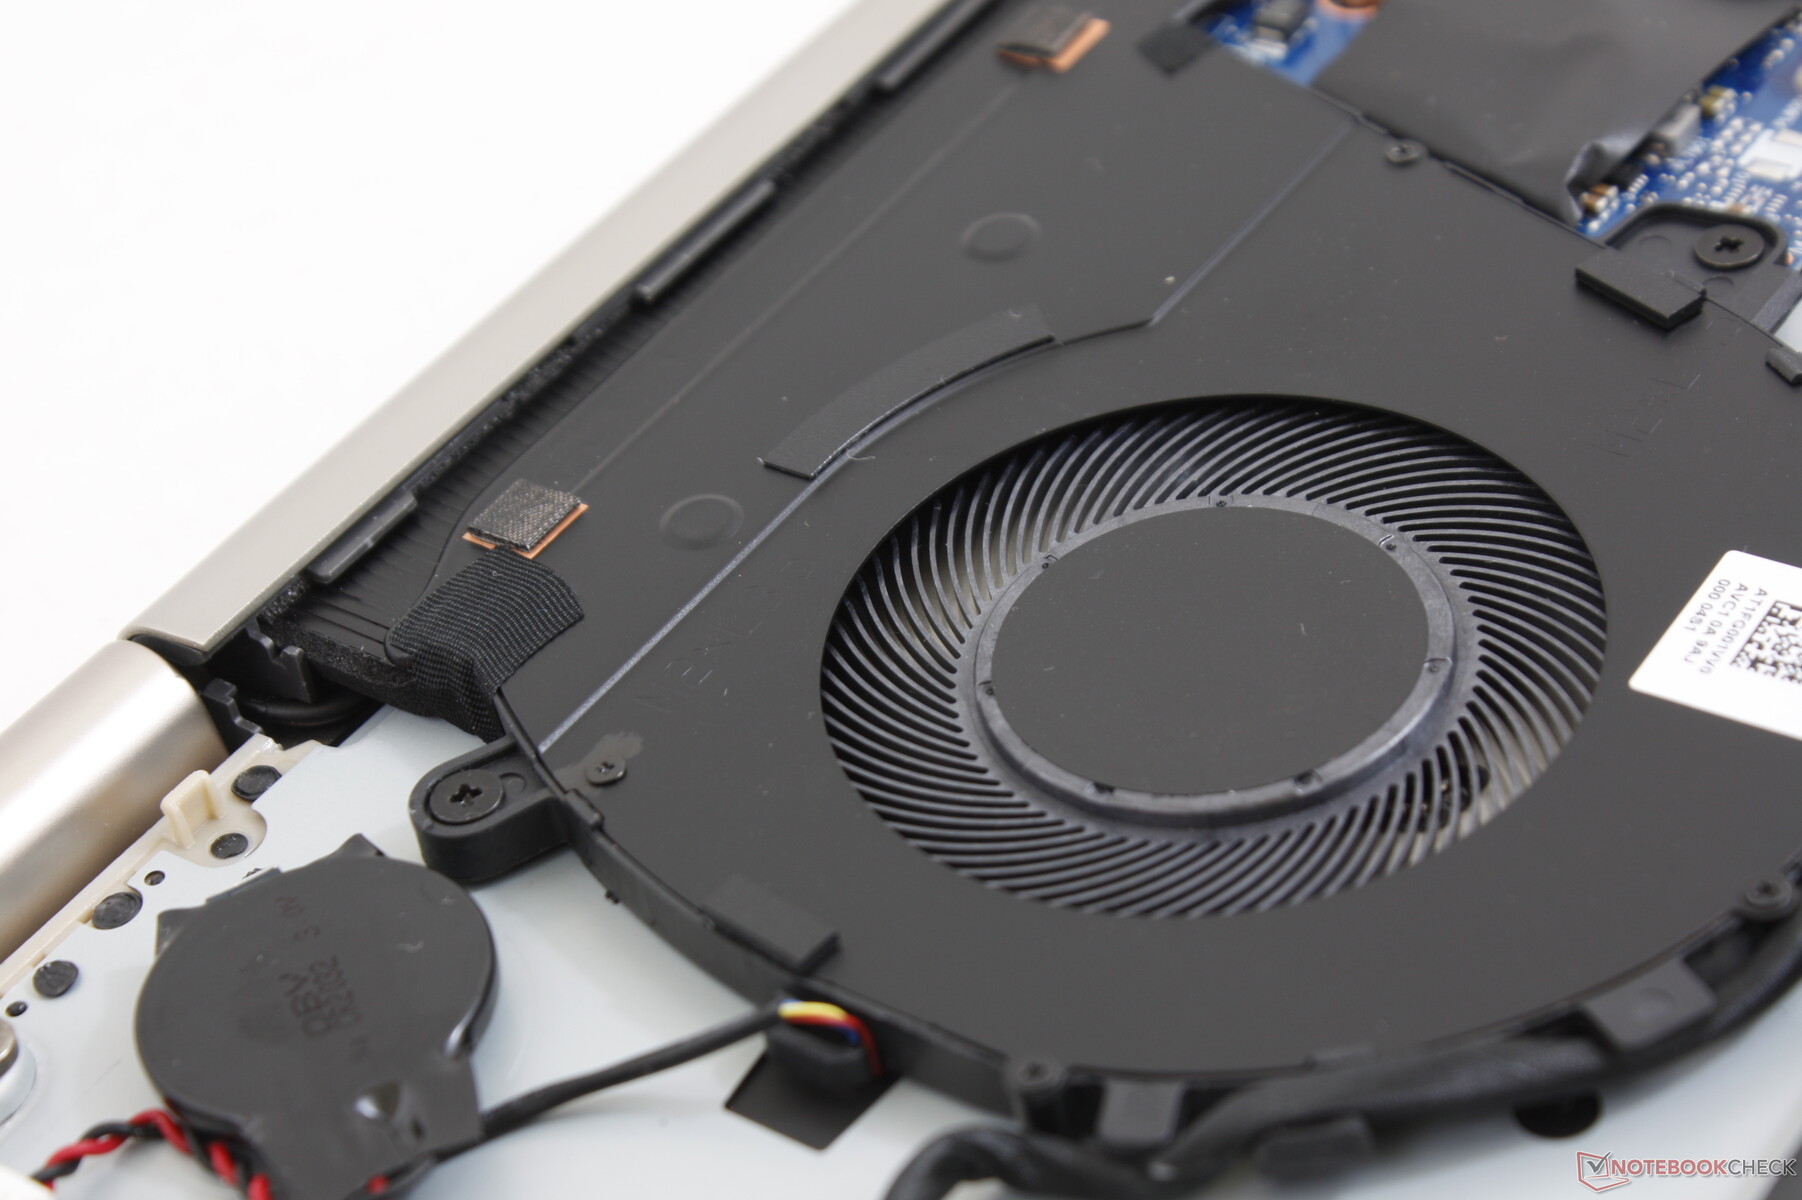
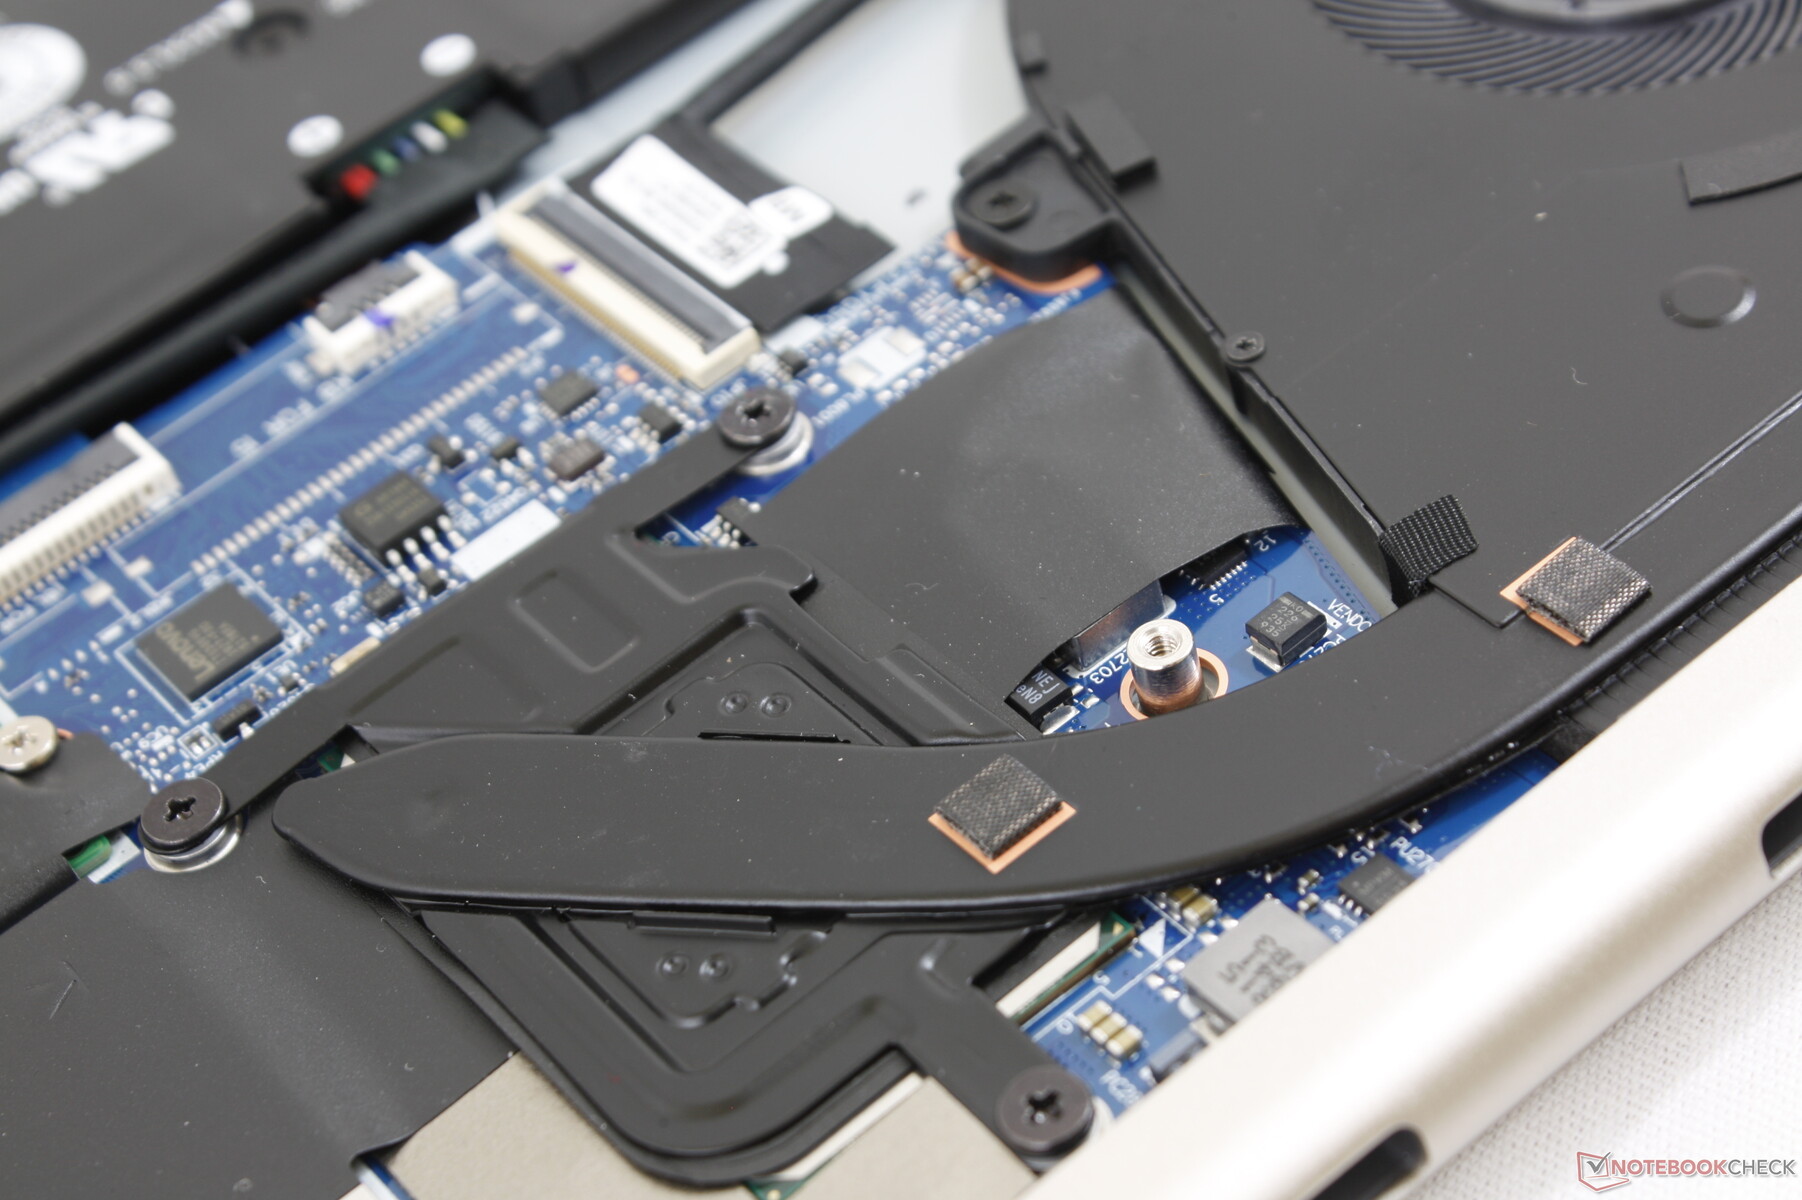
Maintenance
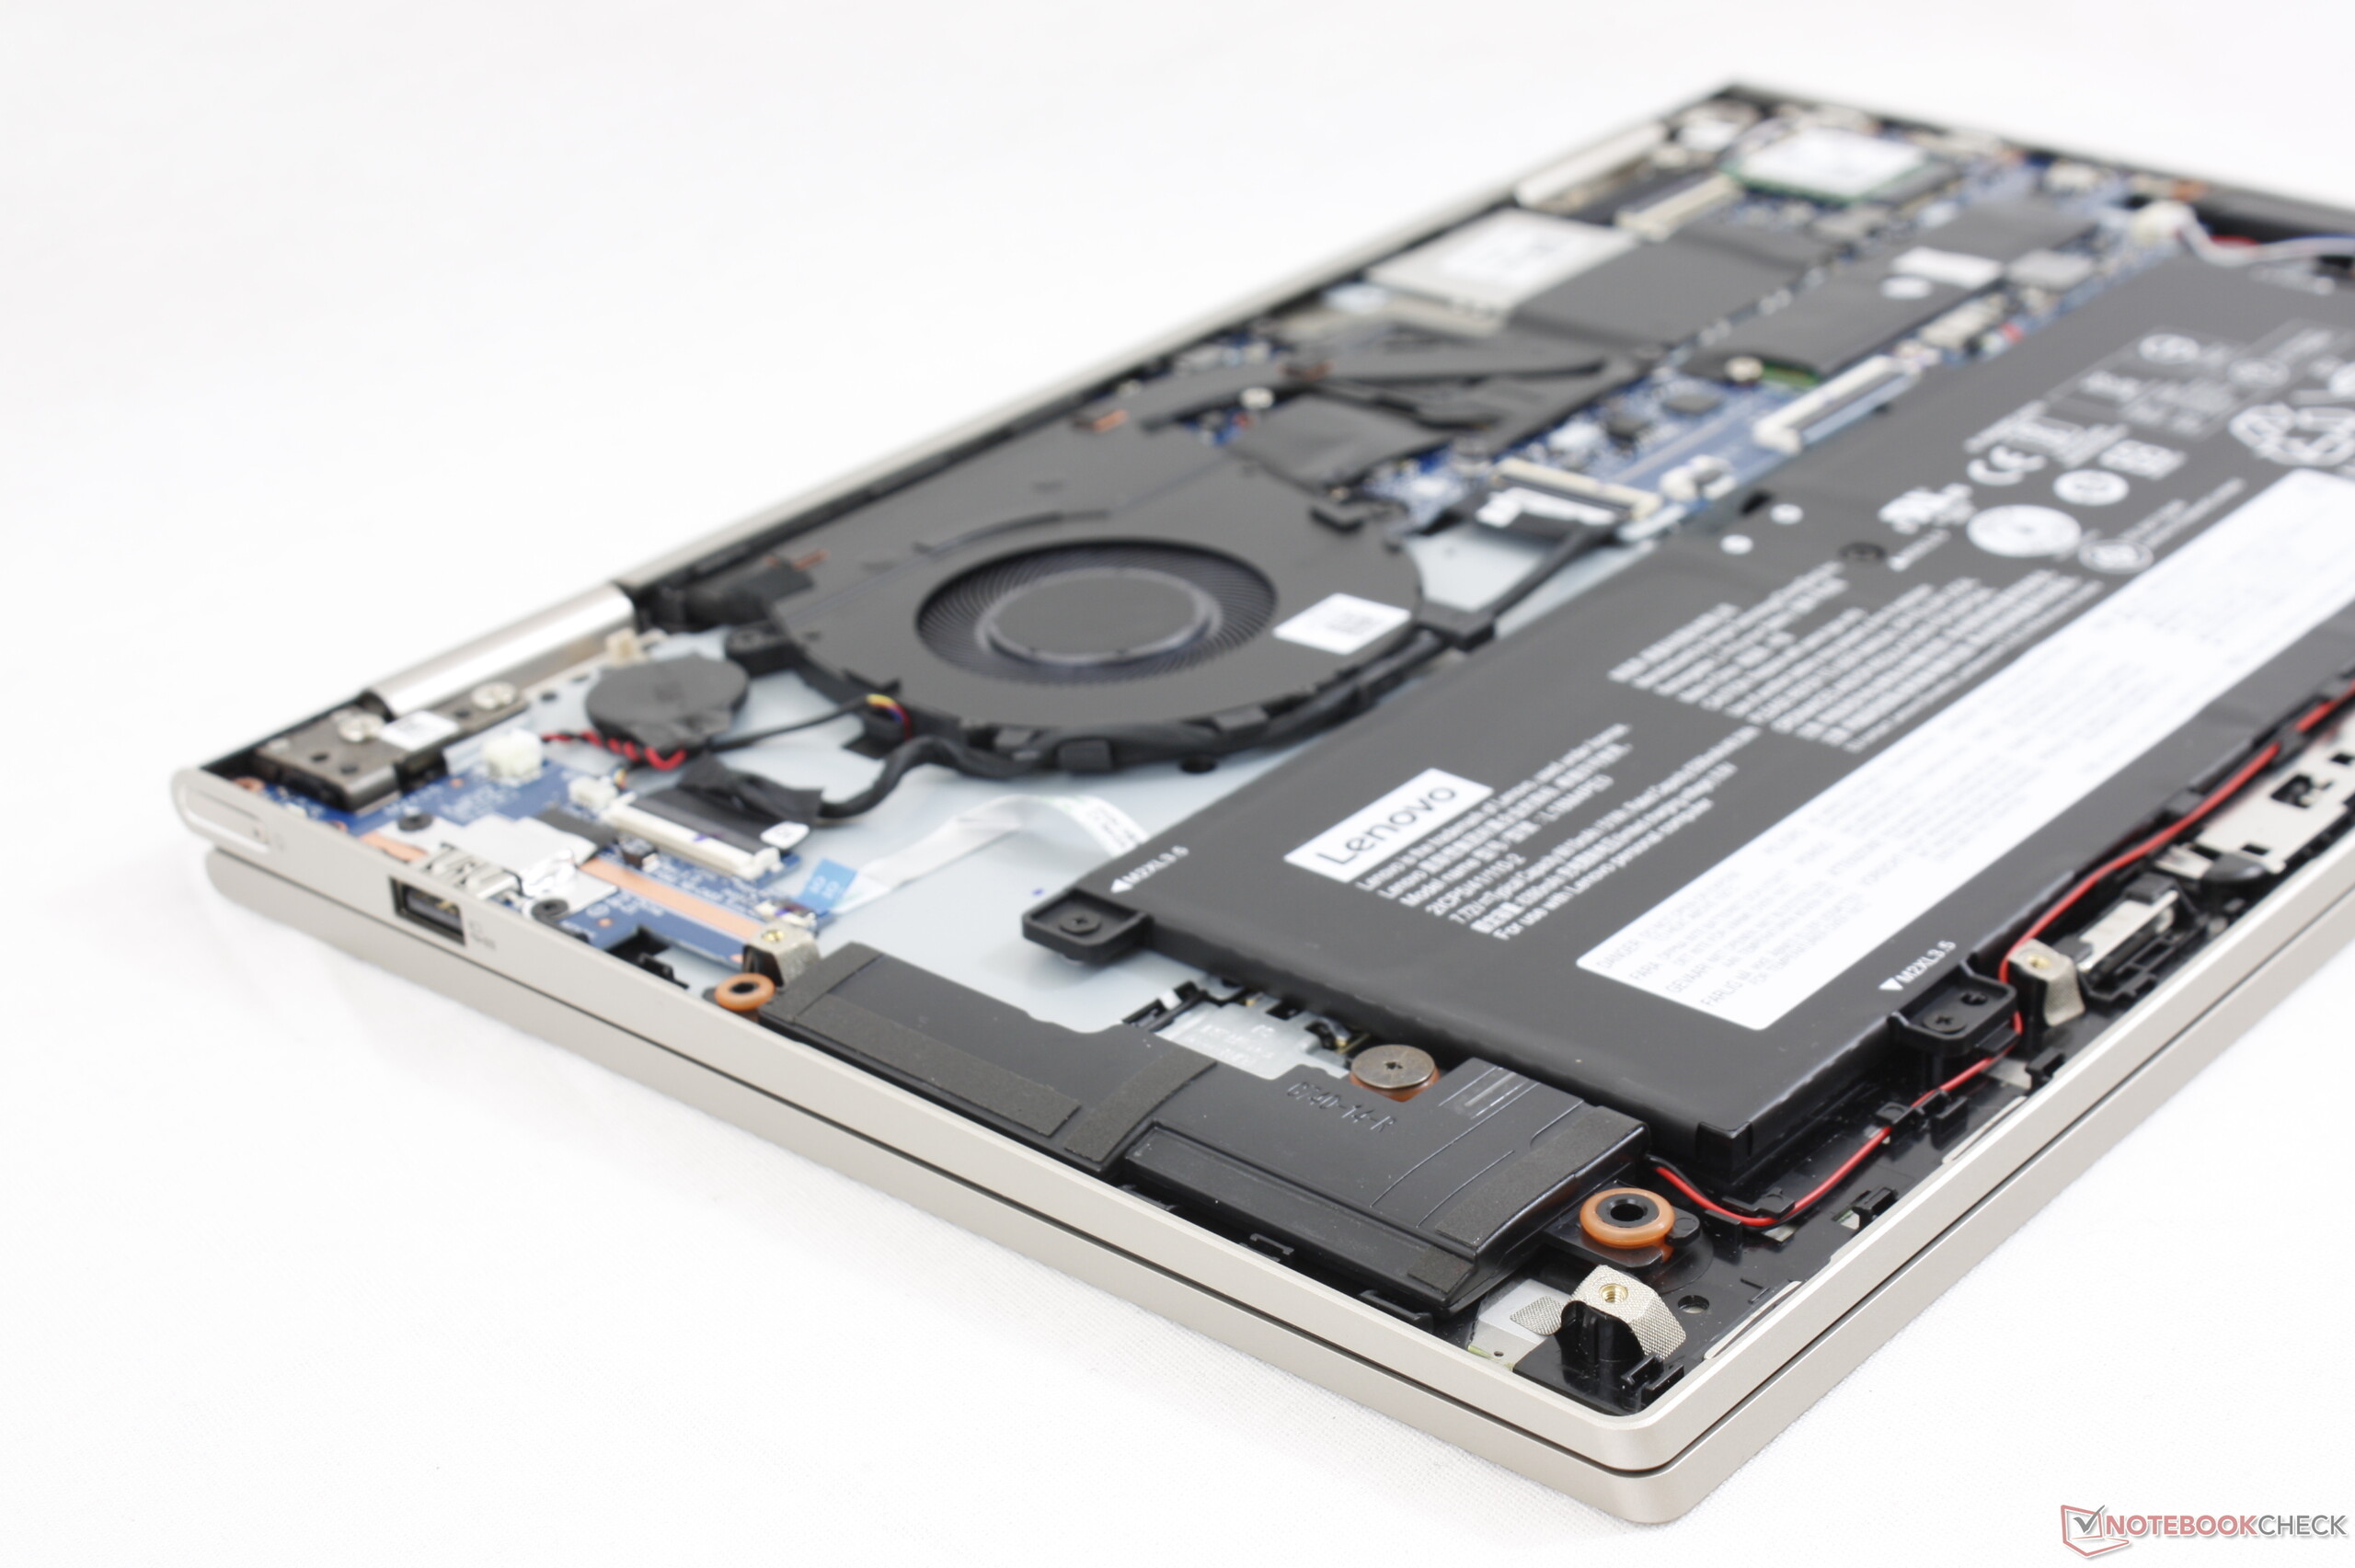
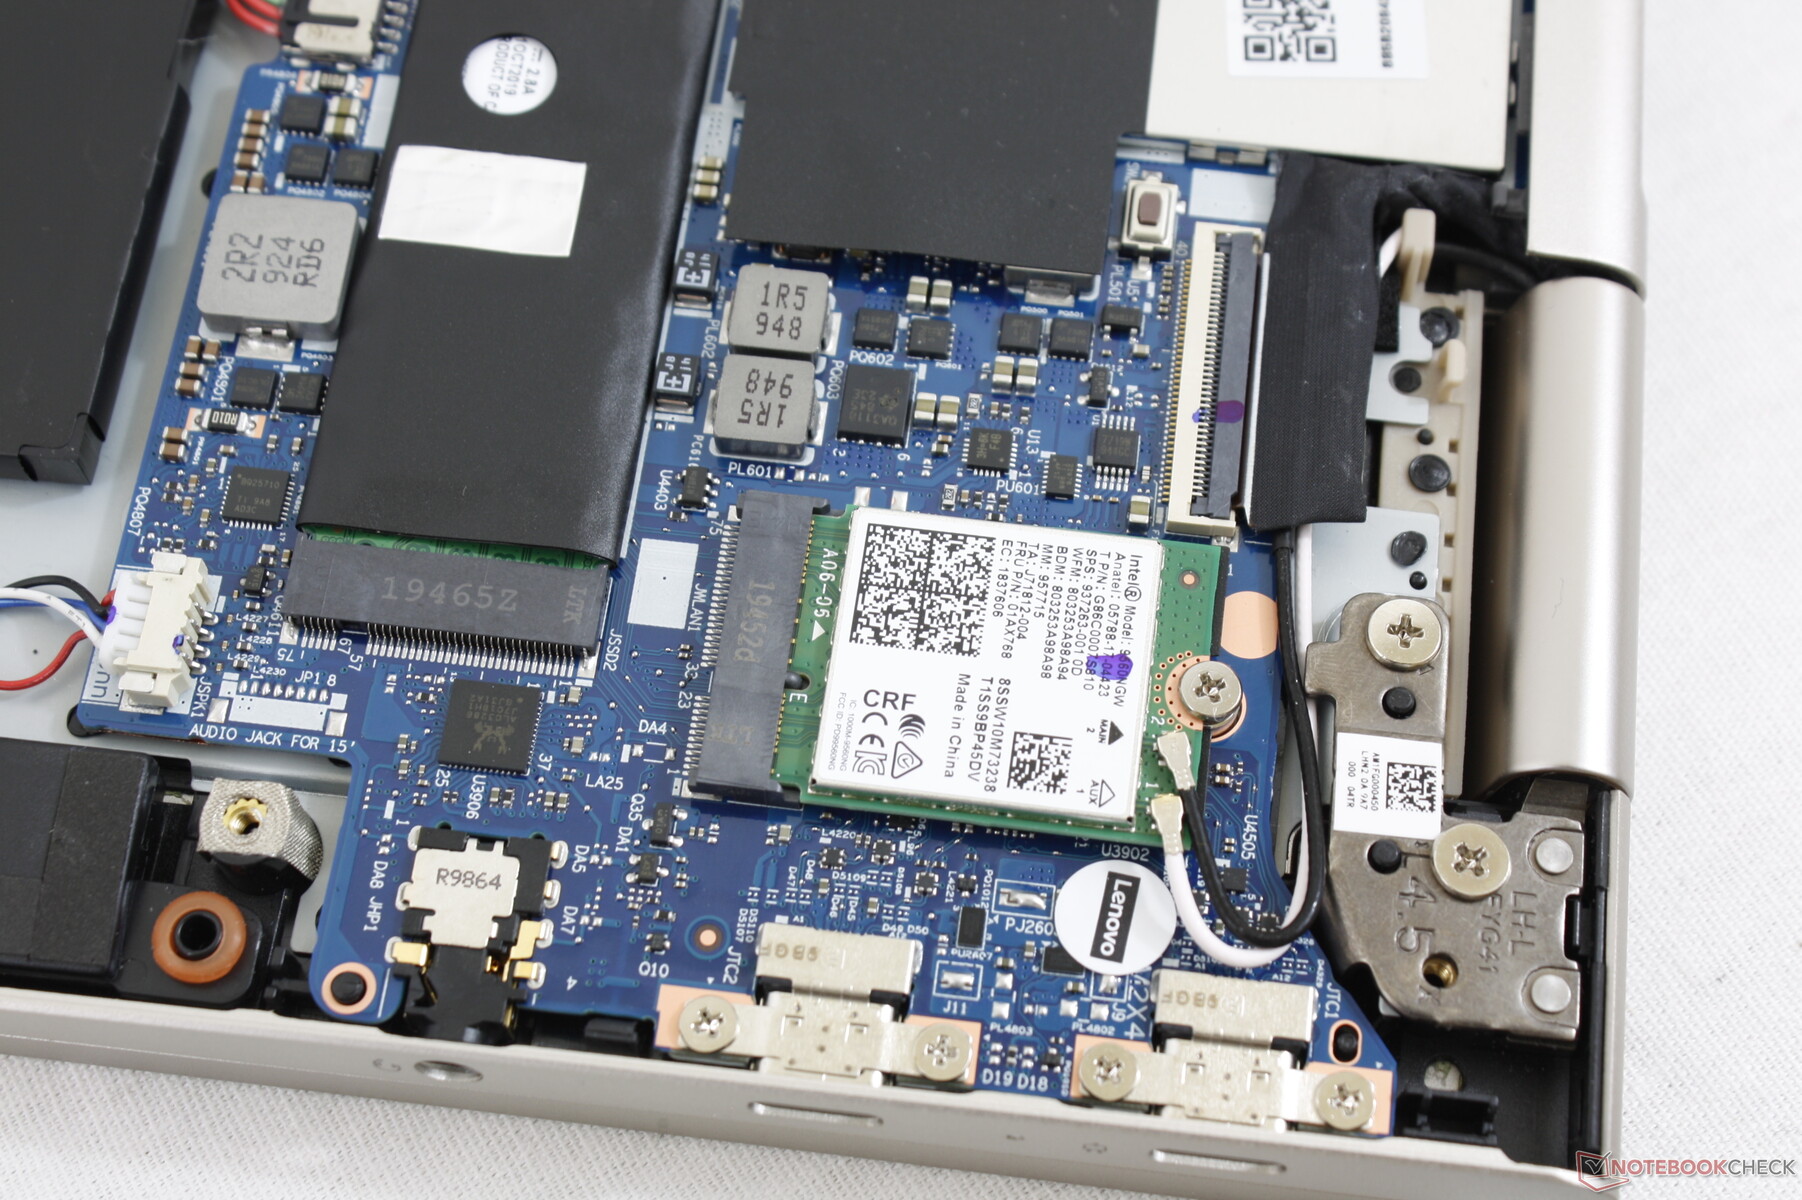
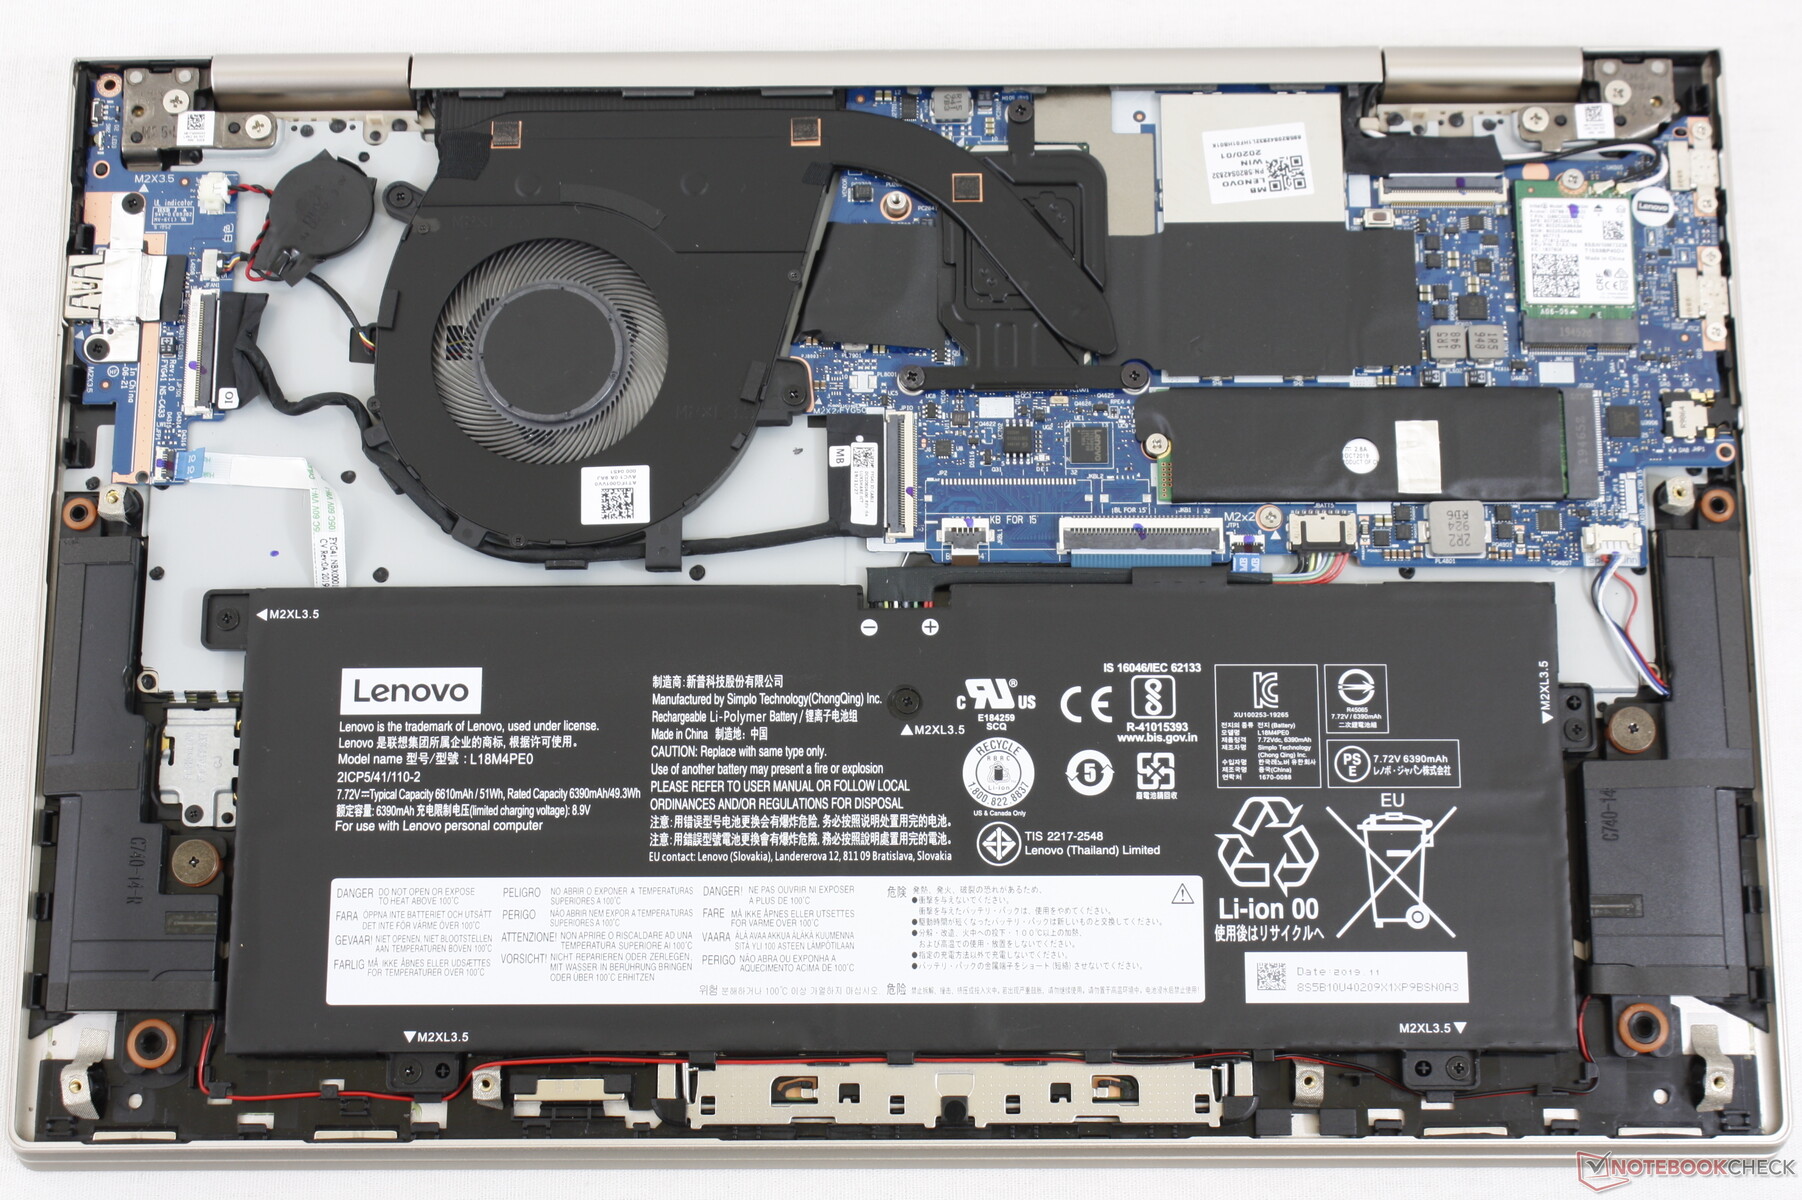
The bottom panel requires a T5 Torx wrench and a sharp edge to remove. Once inside, users have direct access to the M.2 2280 SSD, WLAN module, and batteries. RAM is not upgradeable.
Accessories and Warranty
There are no extras in the box other than the AC adapter and some paperwork. A cleaning cloth, protective sleeve, or stylus would have been neat additions.
The standard one-year limited warranty applies. Like HP and Dell, Lenovo offers a wider range of extension options than other OEMs.
Input Devices
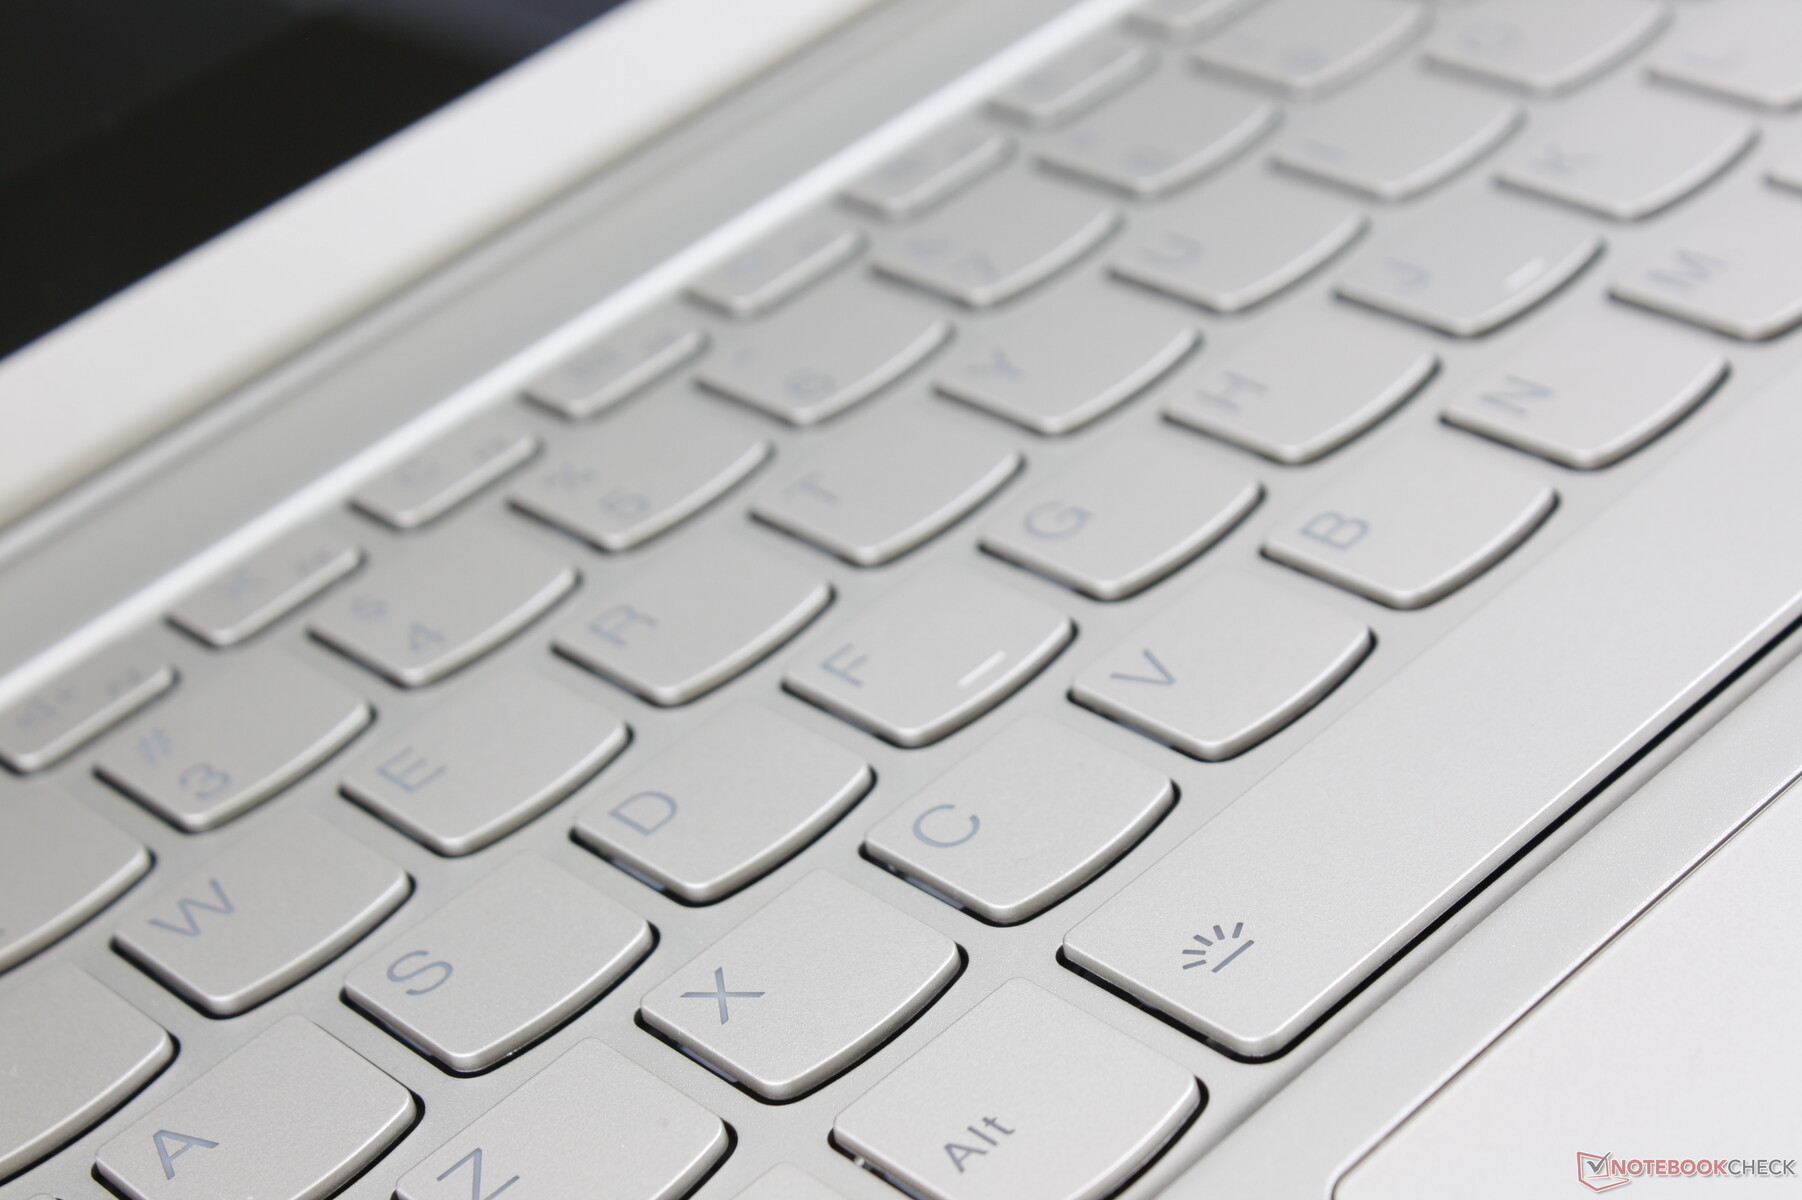
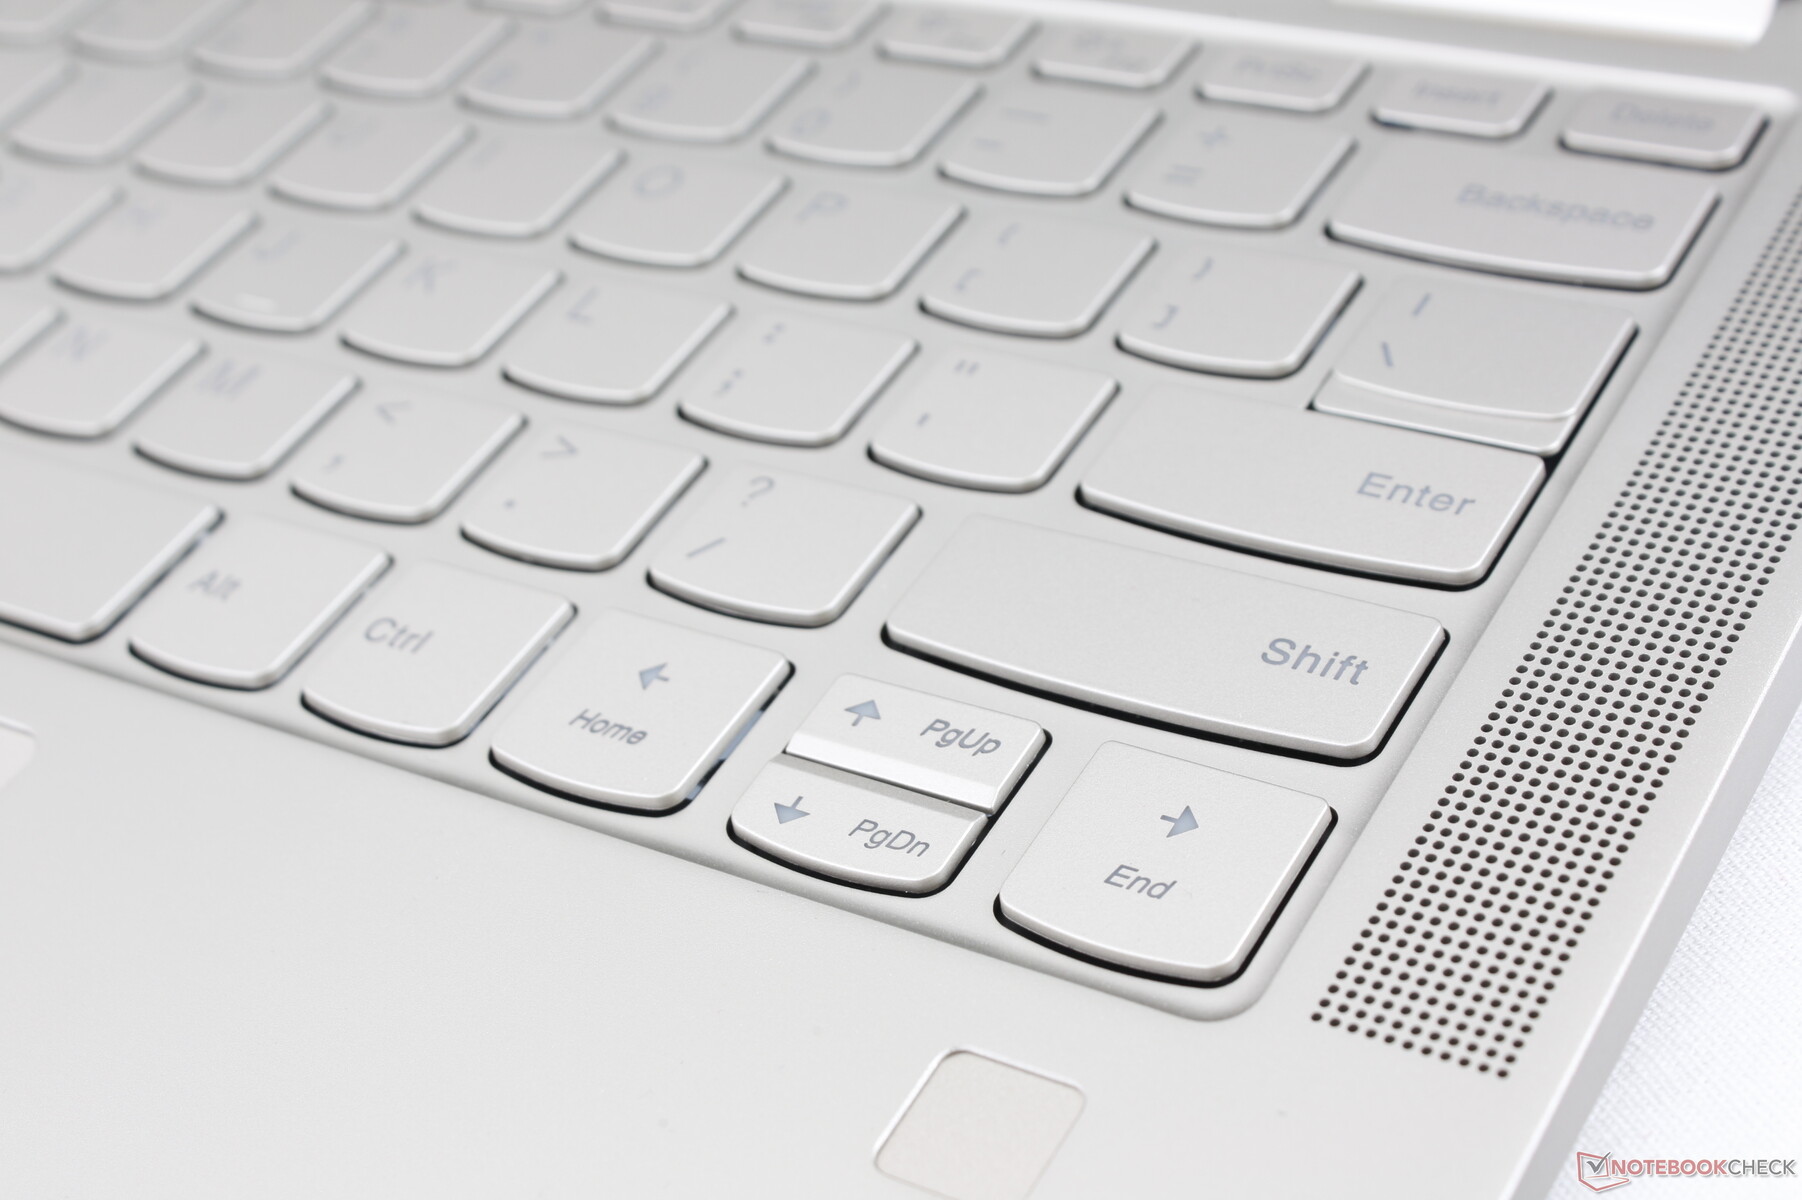
Keyboard
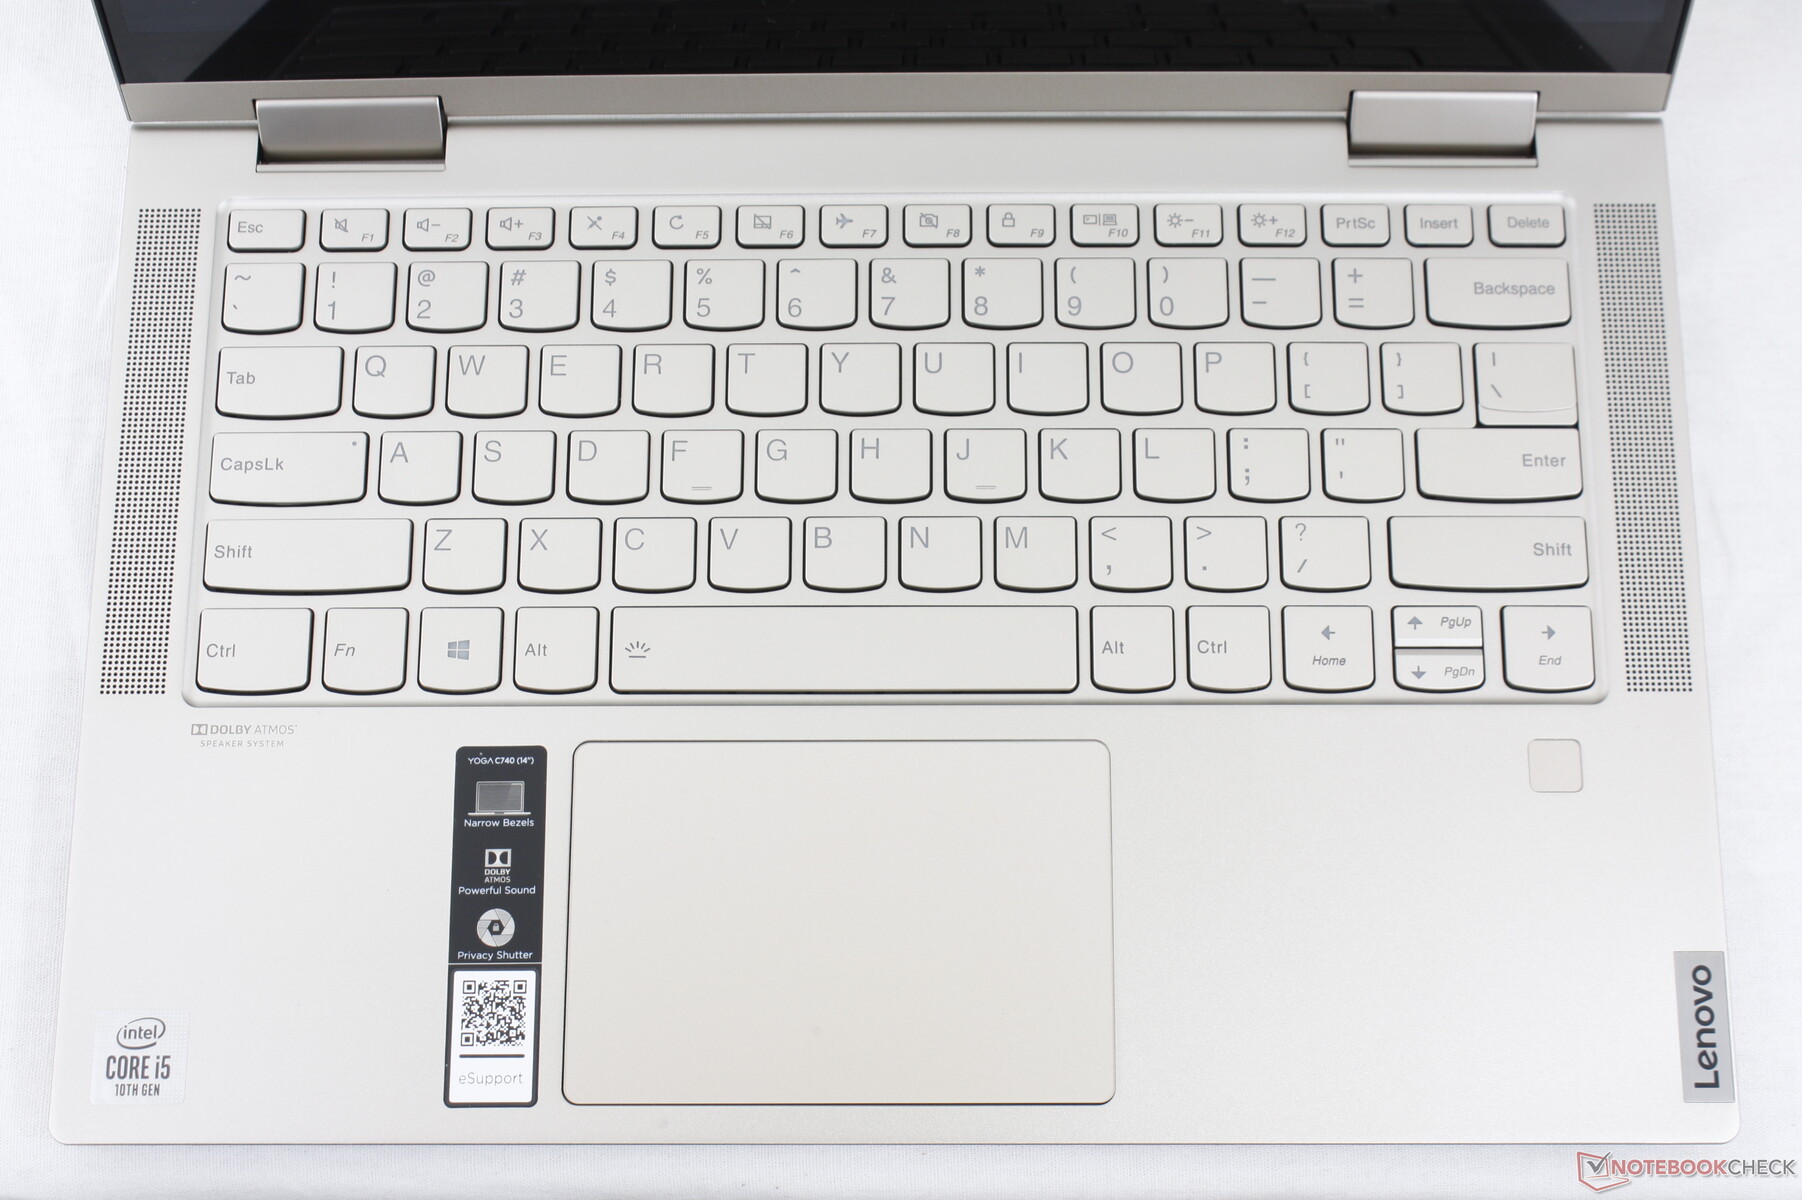
Lenovo offers some of the better keyboards on a laptop in terms of tactility and travel throughout its ThinkPad series. Unfortunately, we cannot say the same for the Yoga series. The keyboard here is closer to a cheaper IdeaPad offering than on a renowed ThinkPad as keys are shallow in travel with relatively weak feedback when pressed. The keyboards on the XPS 13, Spectre x360 13, Surface Laptop 3, or MateBook X Pro are firmer for a more satisfying typing experience. On the plus side, clatter is quiet when typing likely due to the soft key feedback.
Two-level white backlight comes standard to illuminate all keys and their secondary labels.
Touchpad
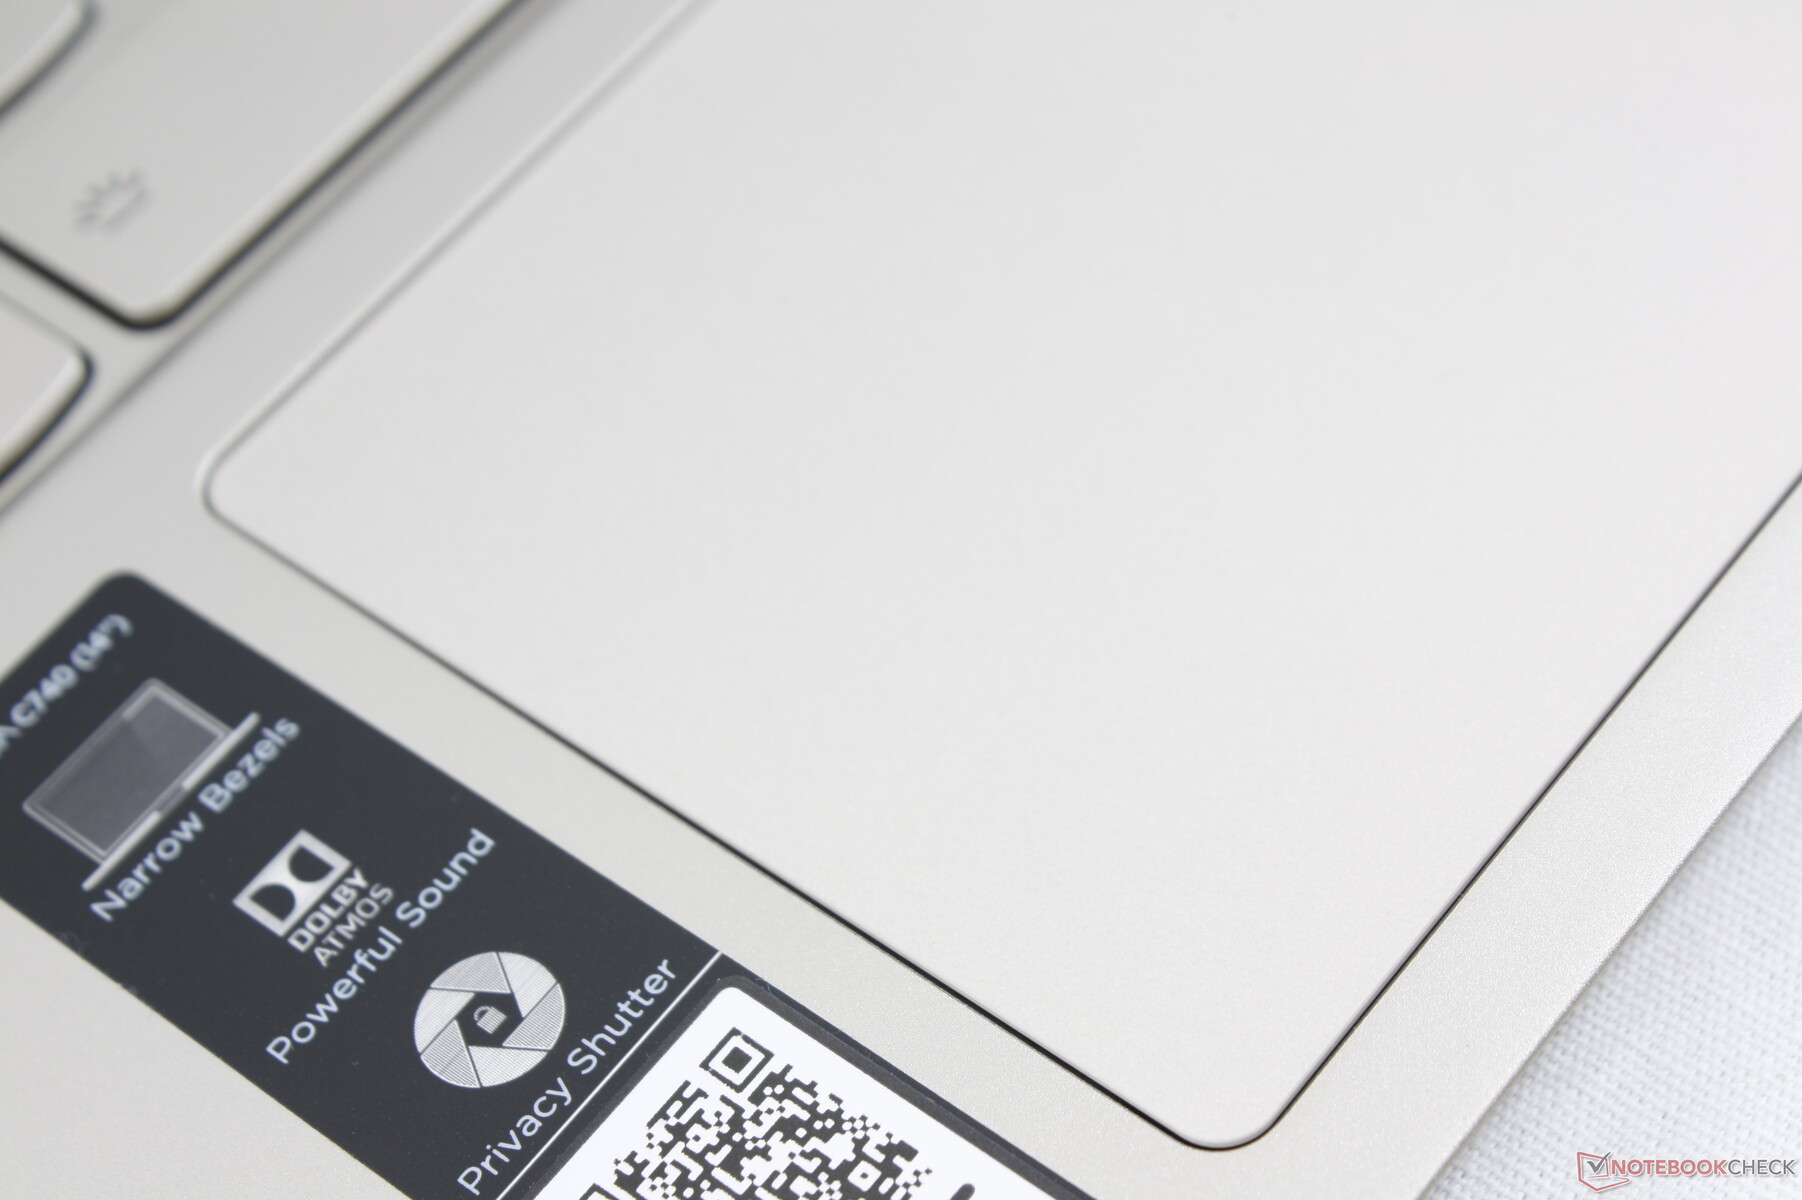
The clickpad (~10.5 x 7 cm) is slightly smaller than the ones on both the 13.5-inch Surface Book 3 (~11.5 x 7.6 cm) and 13.4-inch XPS 13 7390 2-in-1 (~11.3 x 6.8 cm). Gliding across the surface is smooth with almost no sticking even at slow speeds. We encountered no cursor jumping or stalling issues no matter the movement speed.
The integrated mouse keys are average in feedback with an audible click when pressed. It's satisfactory overall, but could have been firmer. Dragging and dropping is still more challenging when compared to laptops with dedicated mouse buttons like the ThinkPad T490.
Display
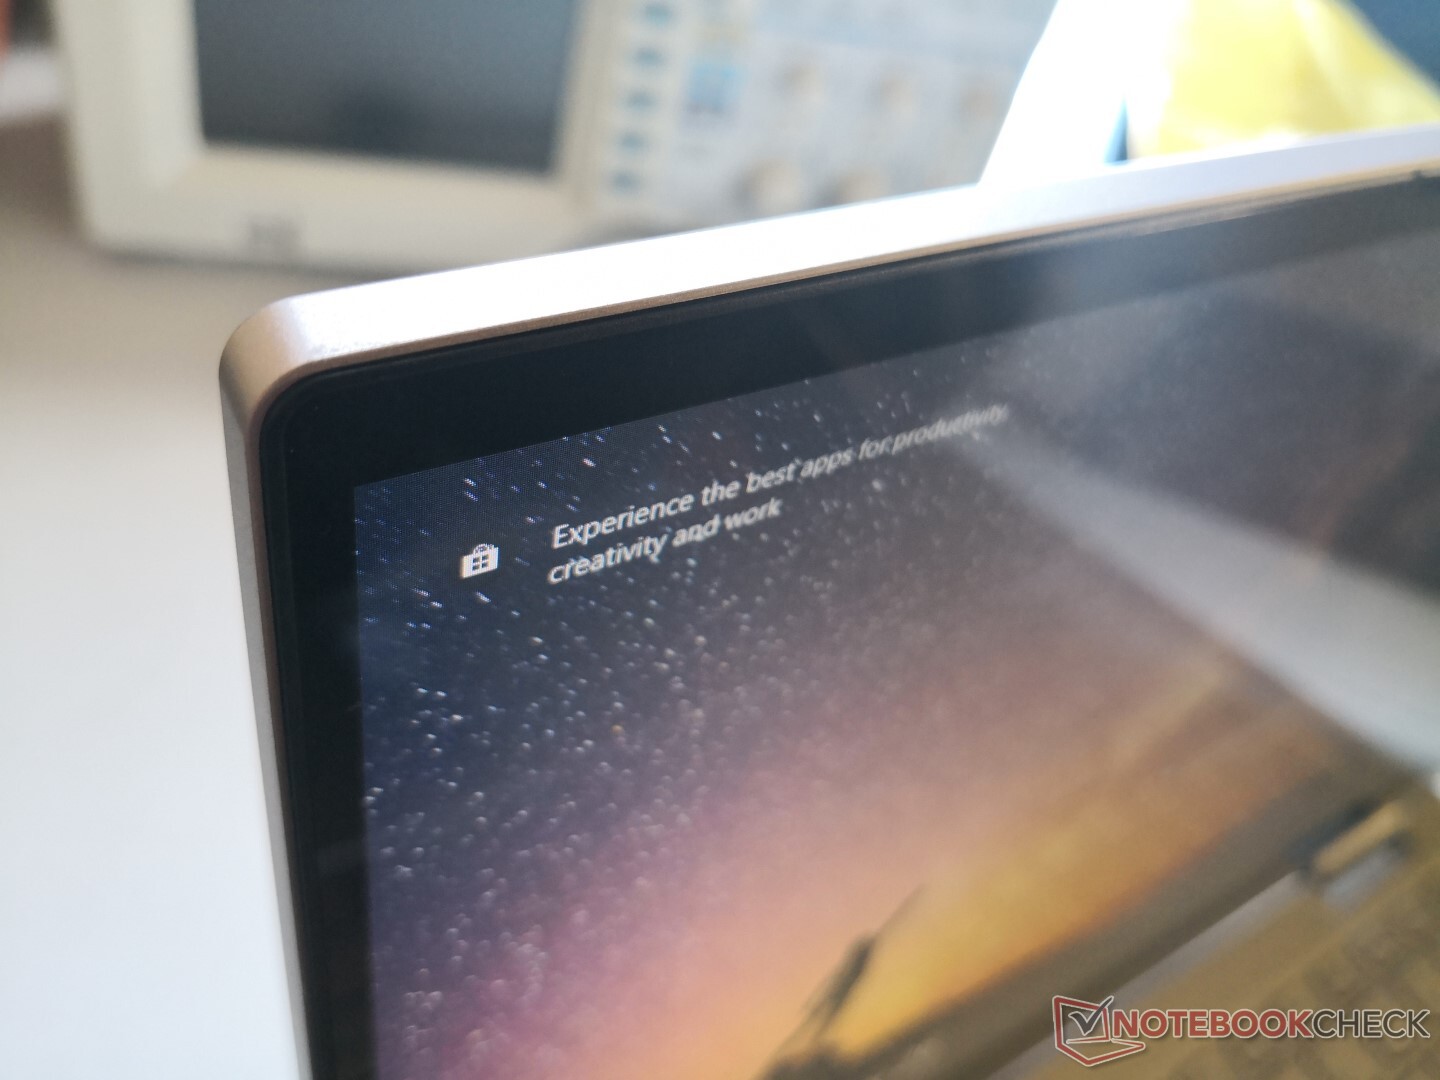
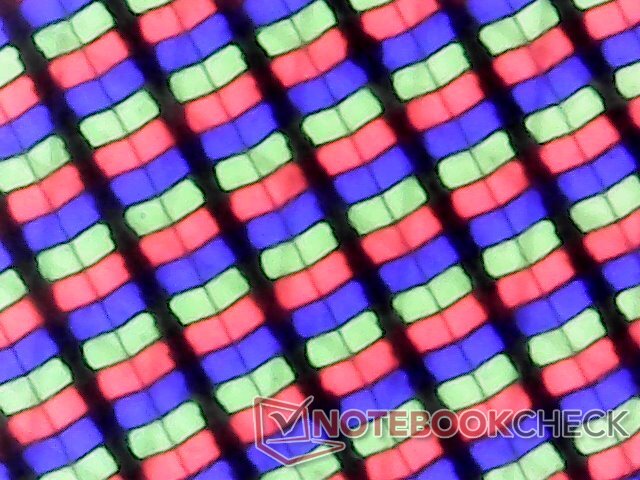
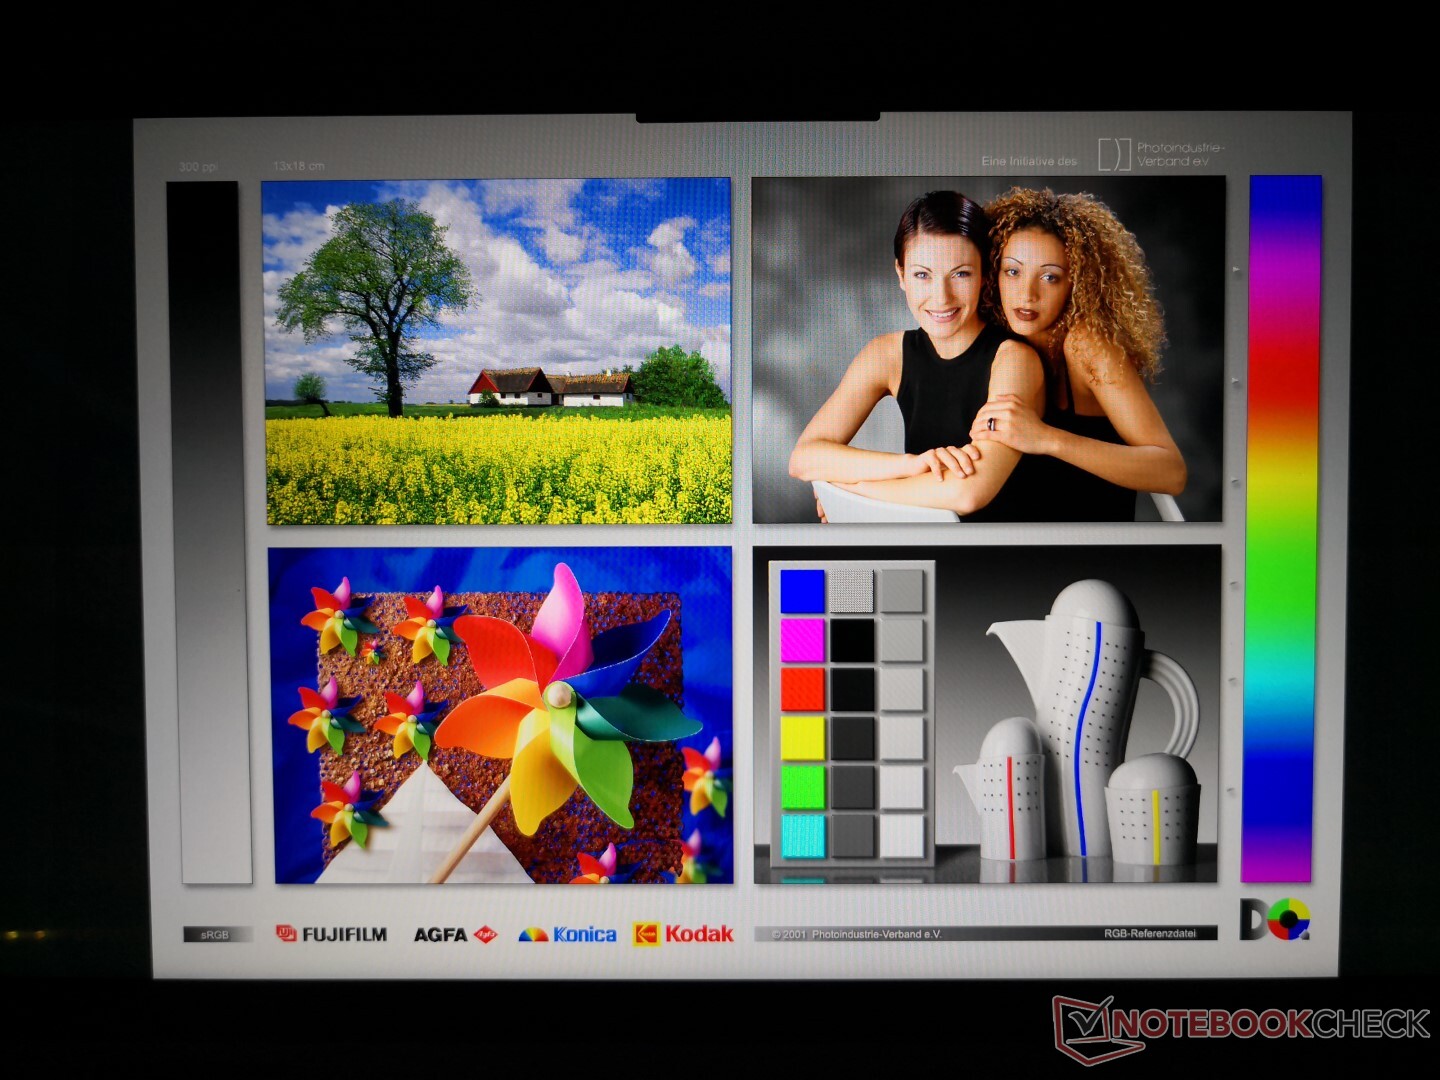
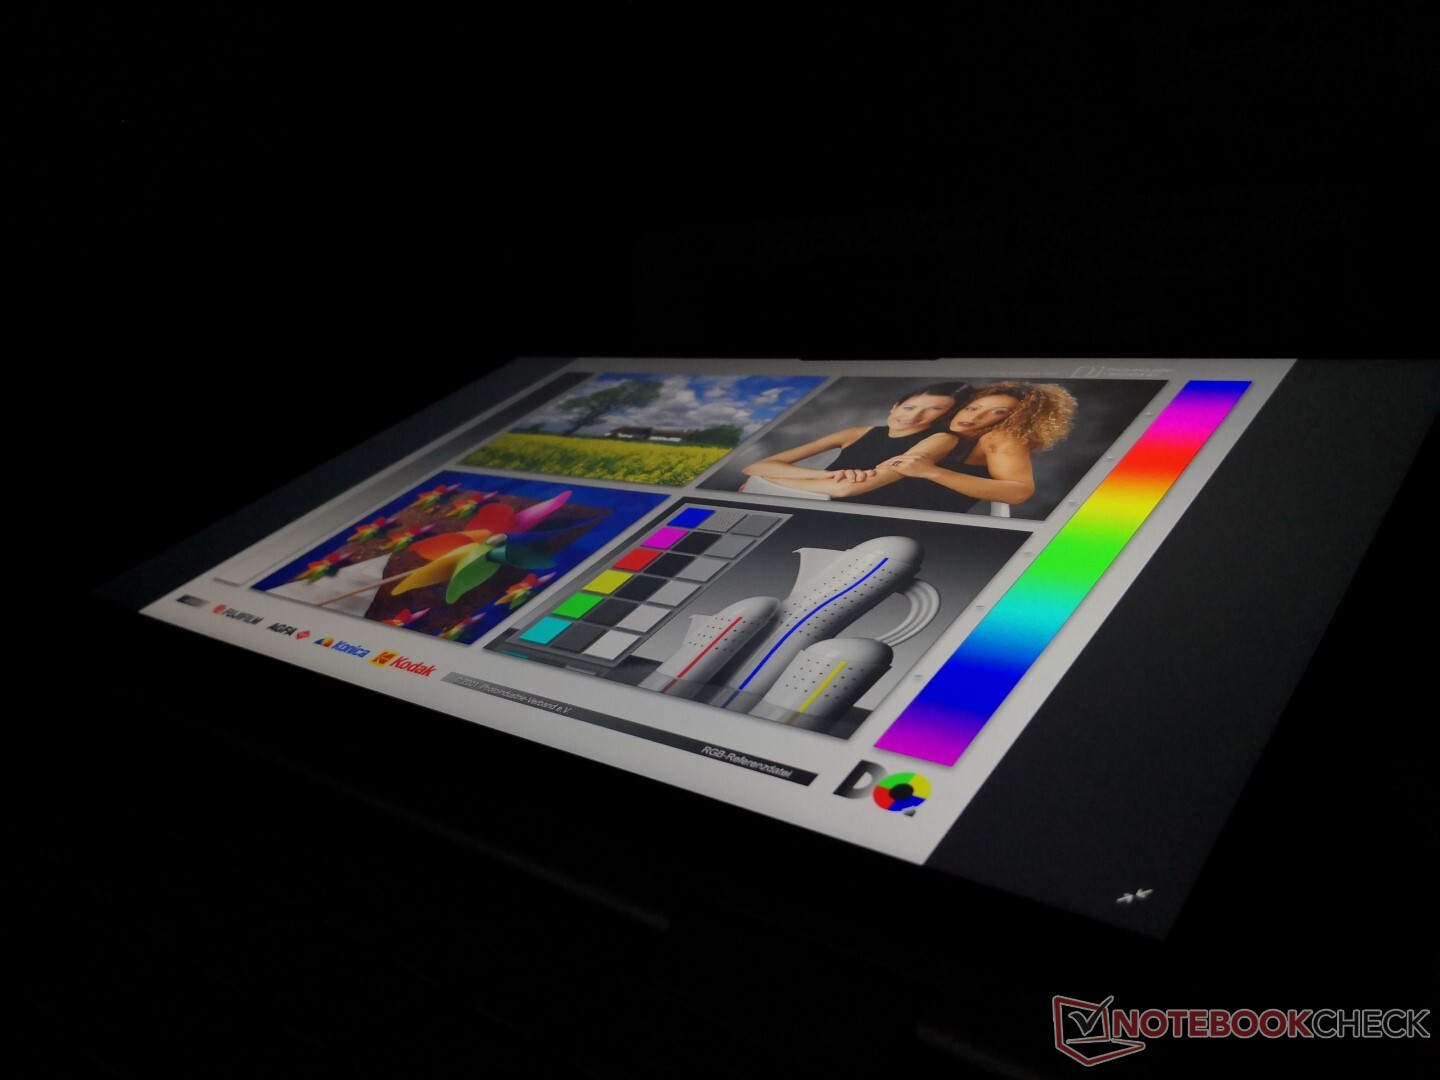
The CMN N140HCE-ET2 panel can be found on no other laptop in our database. The CMN N140HCE series in general, however, is common amongst many 14-inch laptops including the Asus ZenBook UX3410, MSI PS42, ZenBook UX3430, and Lenovo's own ThinkPad T460 and T460s. Though display quality is still very good, there are a few drawbacks that put it a step or two below higher-end systems like the XPS 13 or Yoga S940. Firstly, the display is dimmer at around 300 nits compared to 500 nits or higher on the the two aforementioned alternatives. Secondly, colors are not as well calibrated out of the box. And lastly, there is a small layer of graininess on the display despite it being a glossy panel. Texts and images are thus slightly less crisp than they could have been.
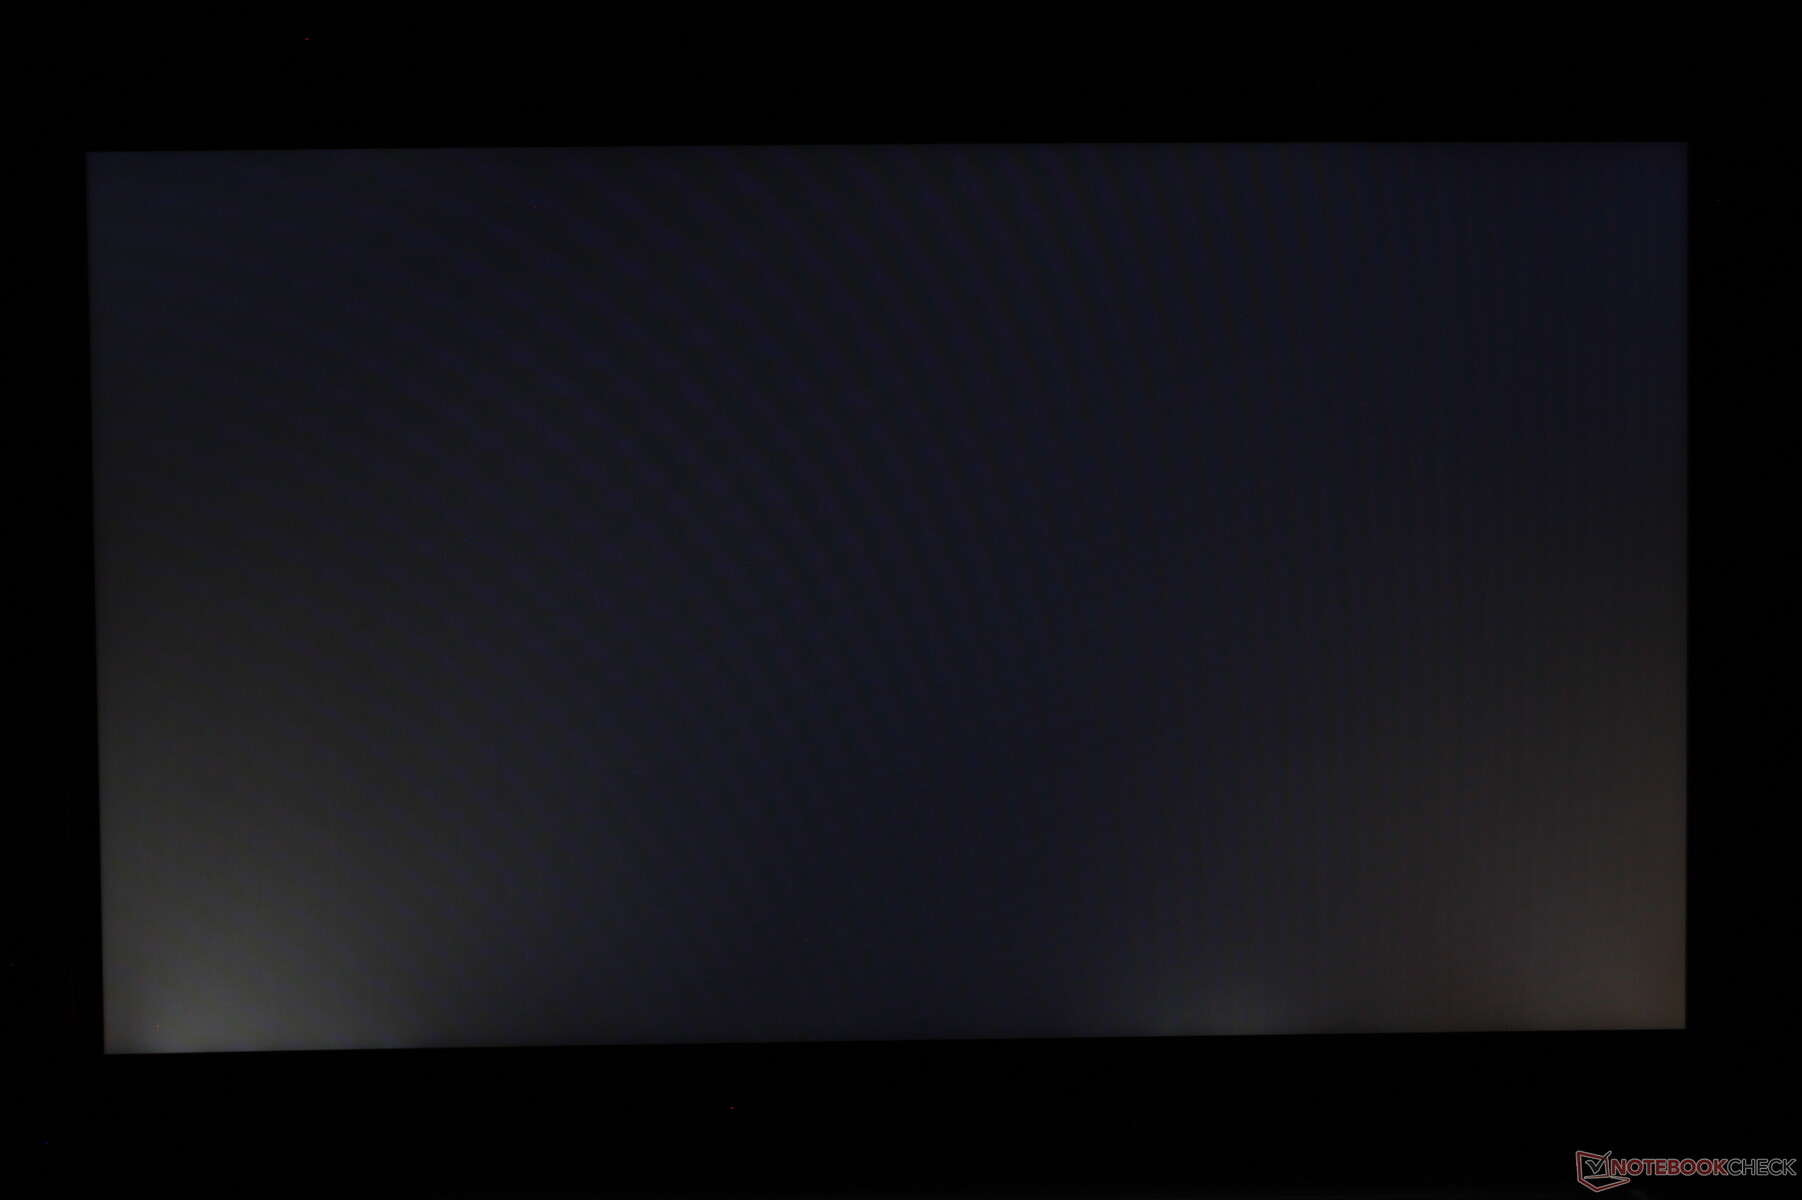
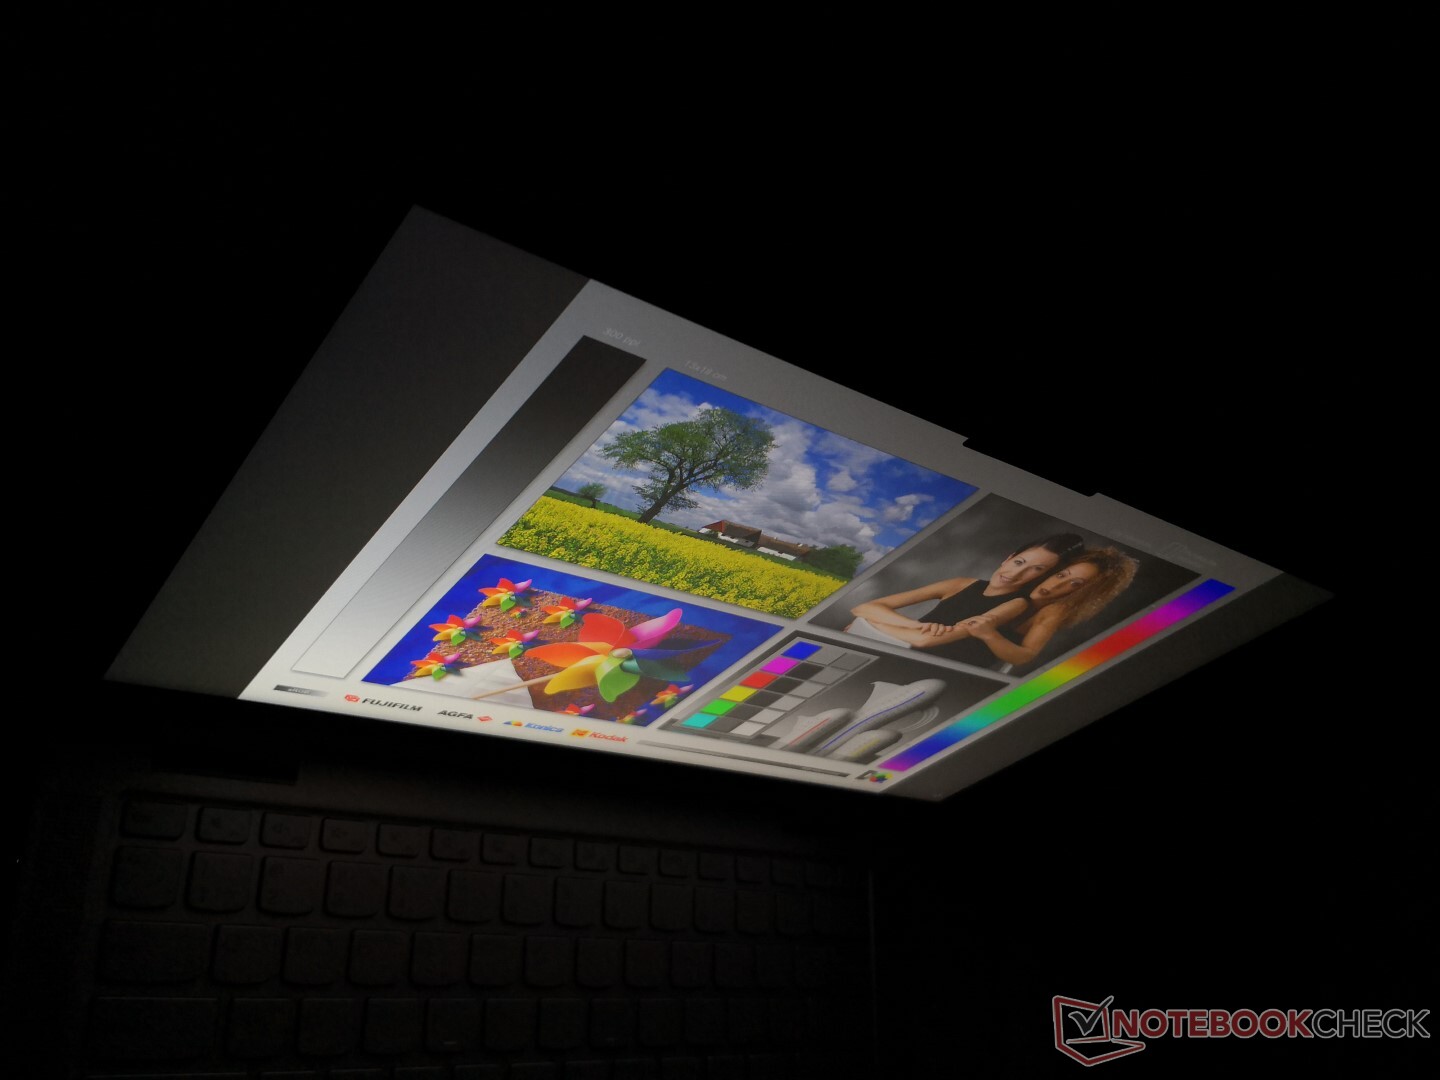
Response times are typical for an Ultrabook. Ghosting is noticeable but not intrusive since the system was not designed to play fast-paced games. Backlight bleeding, however, could have been better especially around the bottom corners as shown by our screenshot below.
| |||||||||||||||||||||||||
Brightness Distribution: 90 %
Center on Battery: 329.9 cd/m²
Contrast: 1138:1 (Black: 0.29 cd/m²)
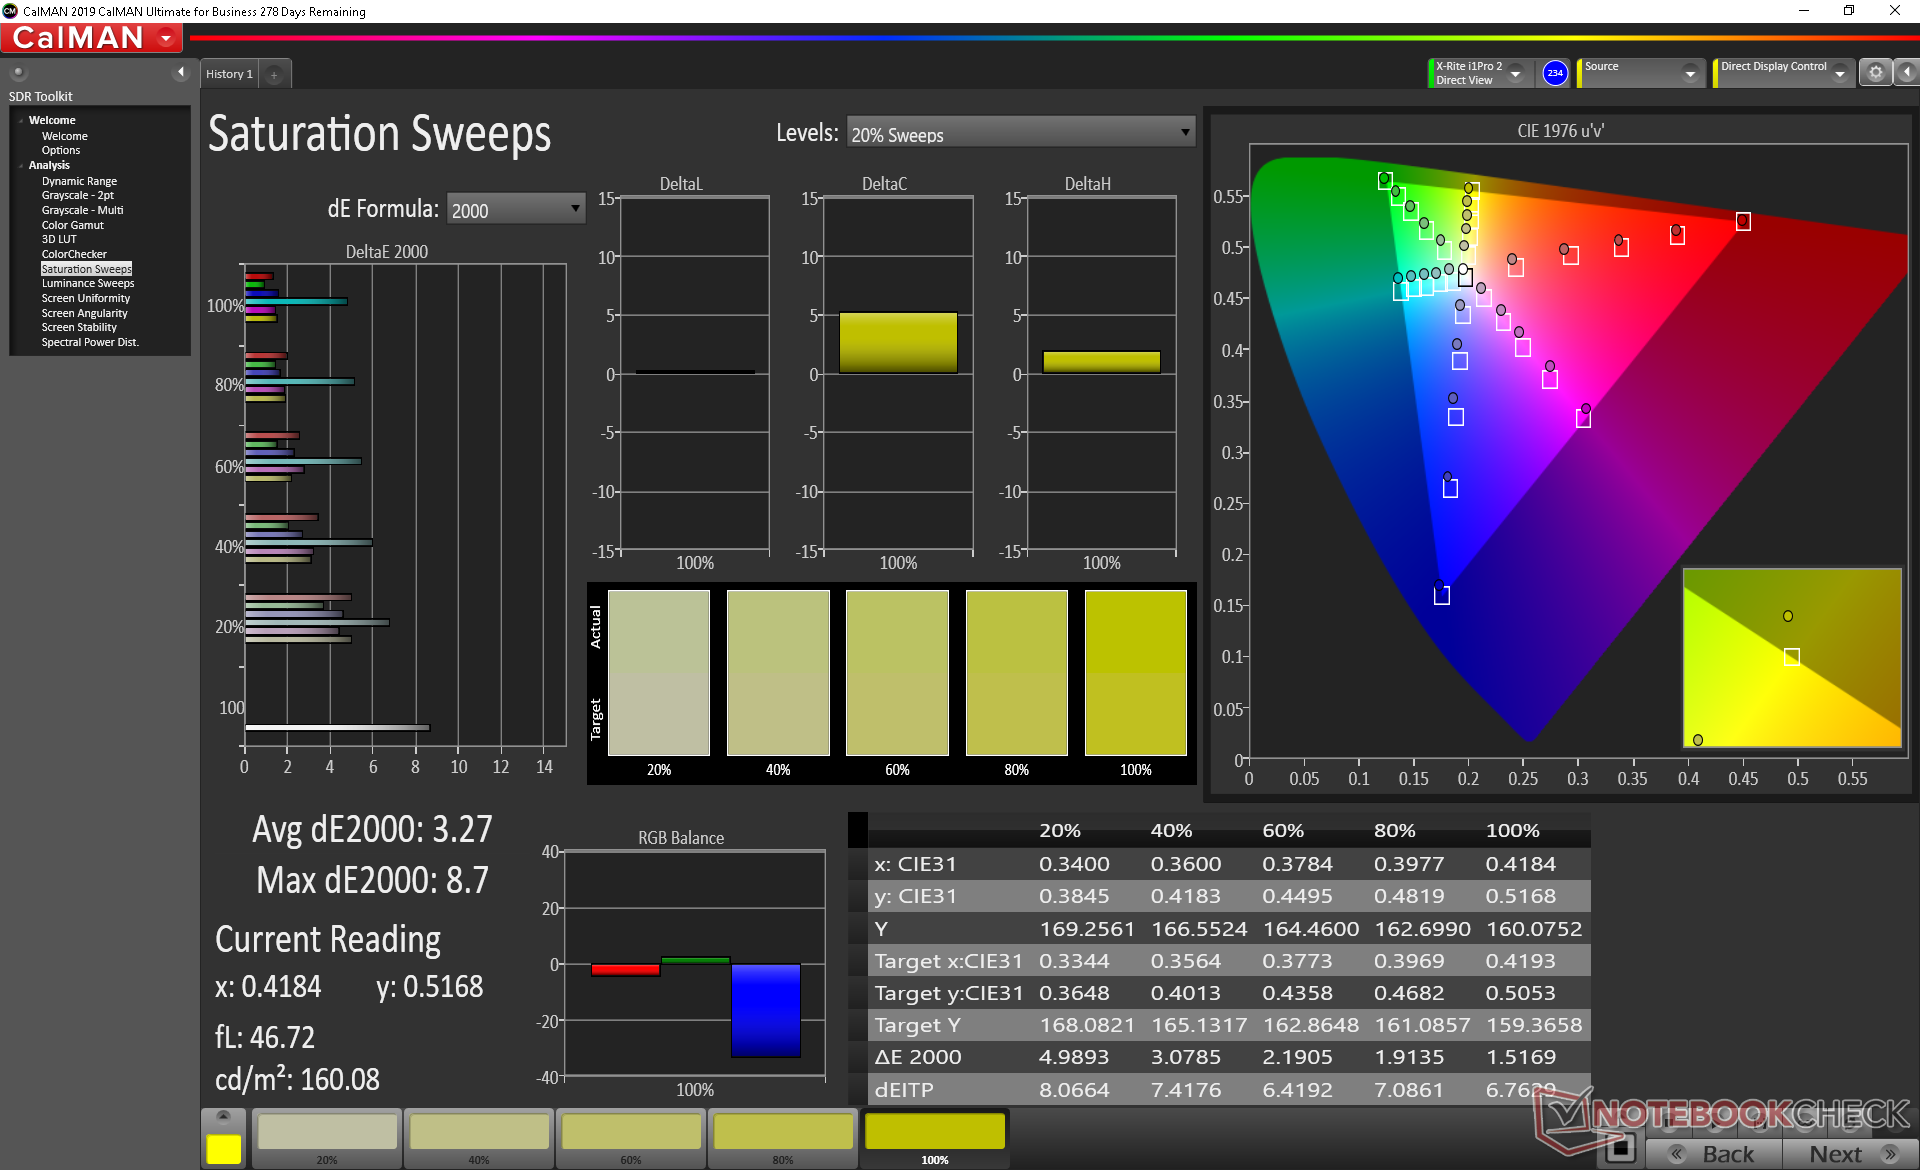
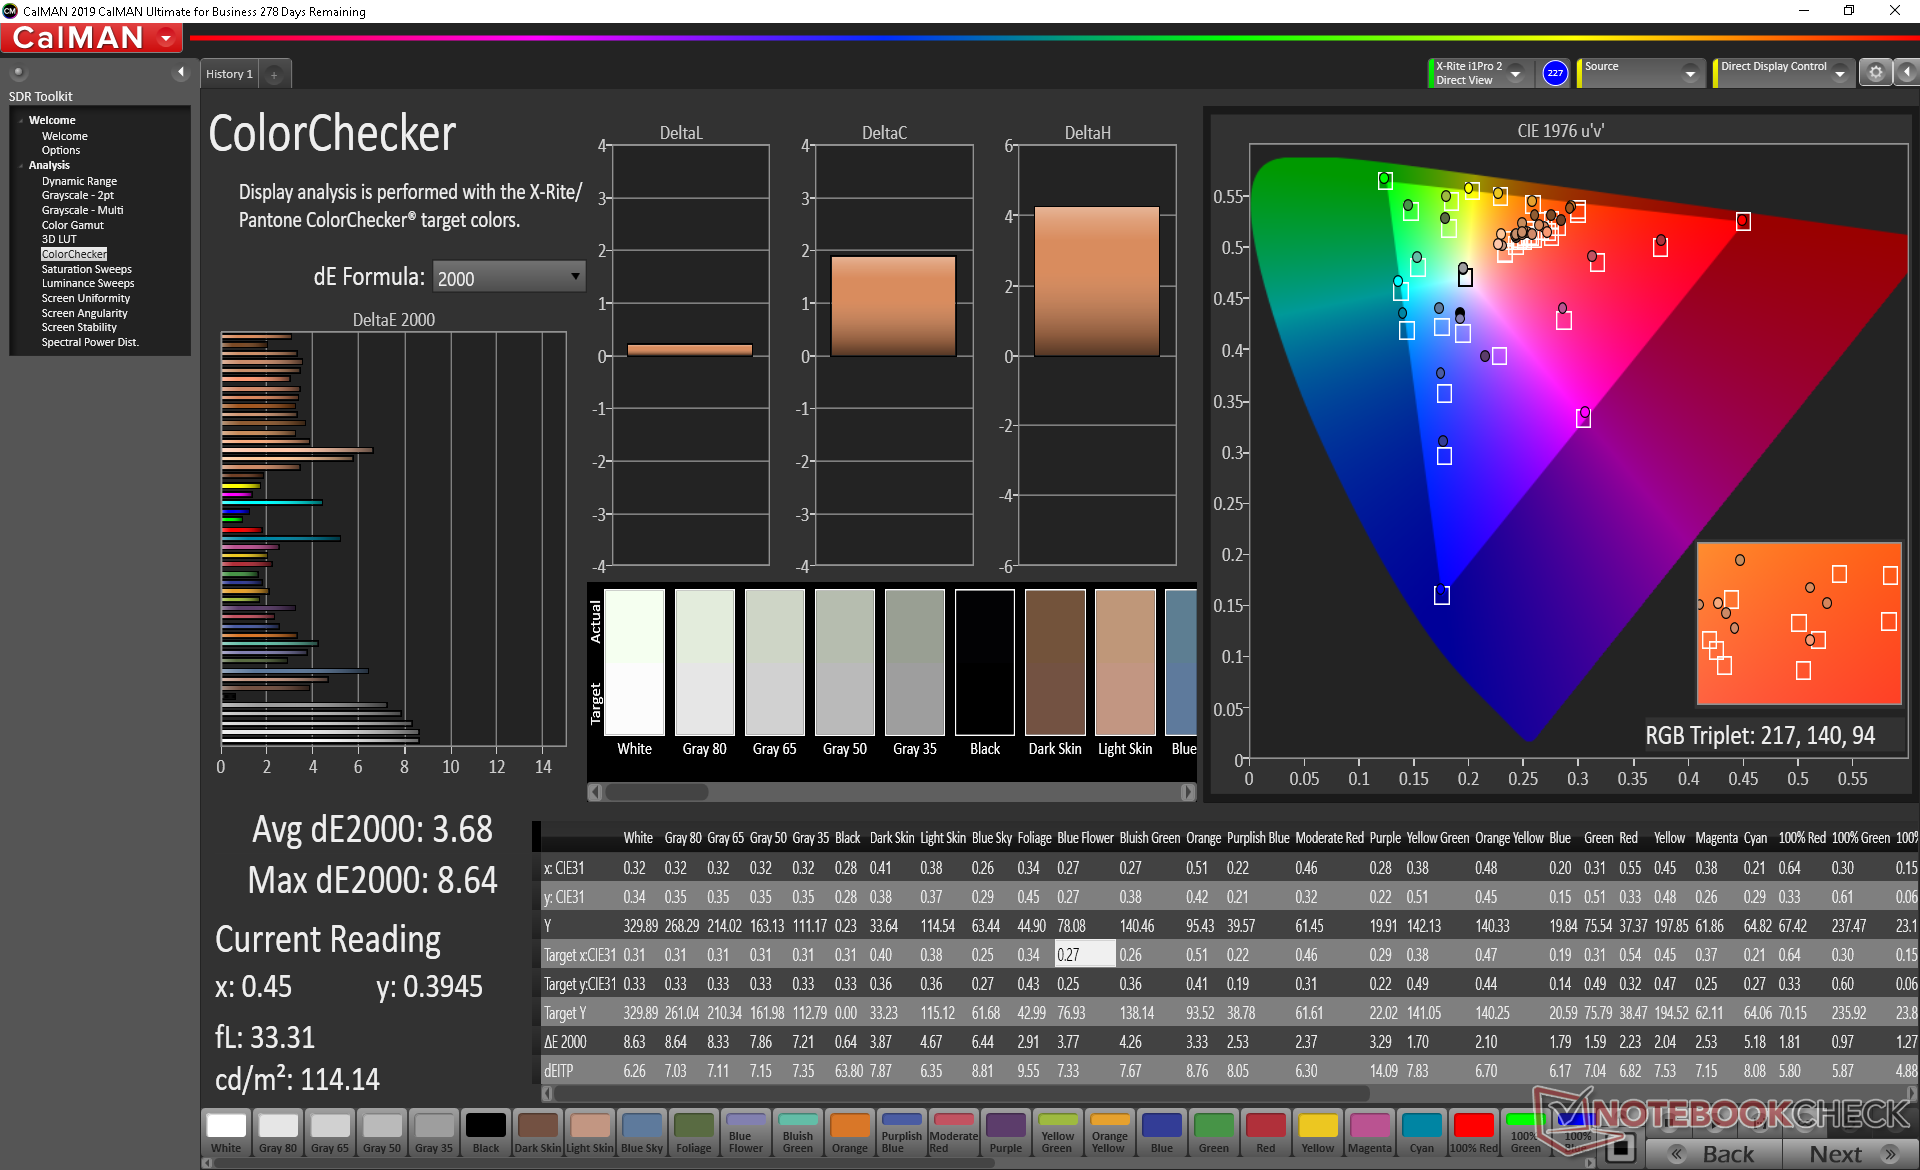
ΔE ColorChecker Calman: 3.68 | ∀{0.5-29.43 Ø4.71}
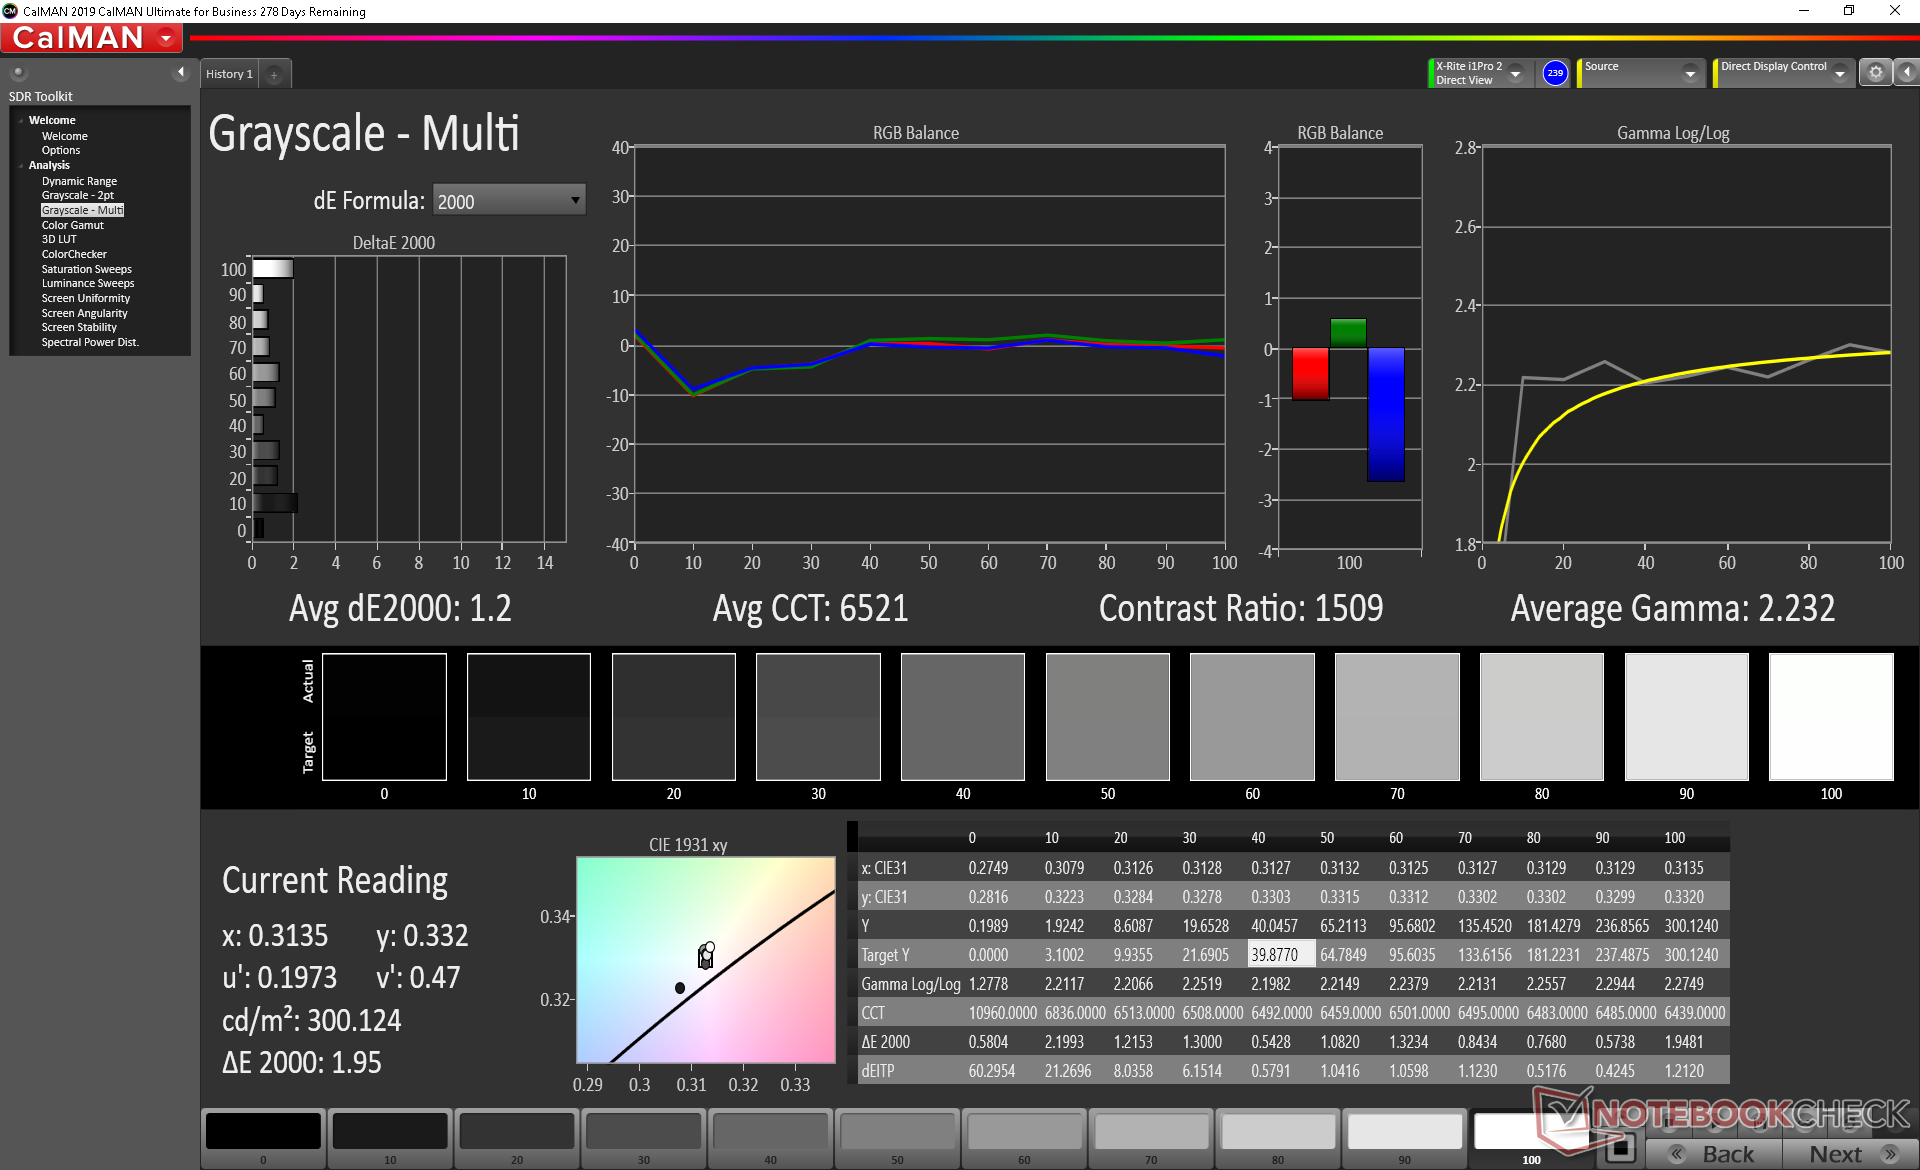
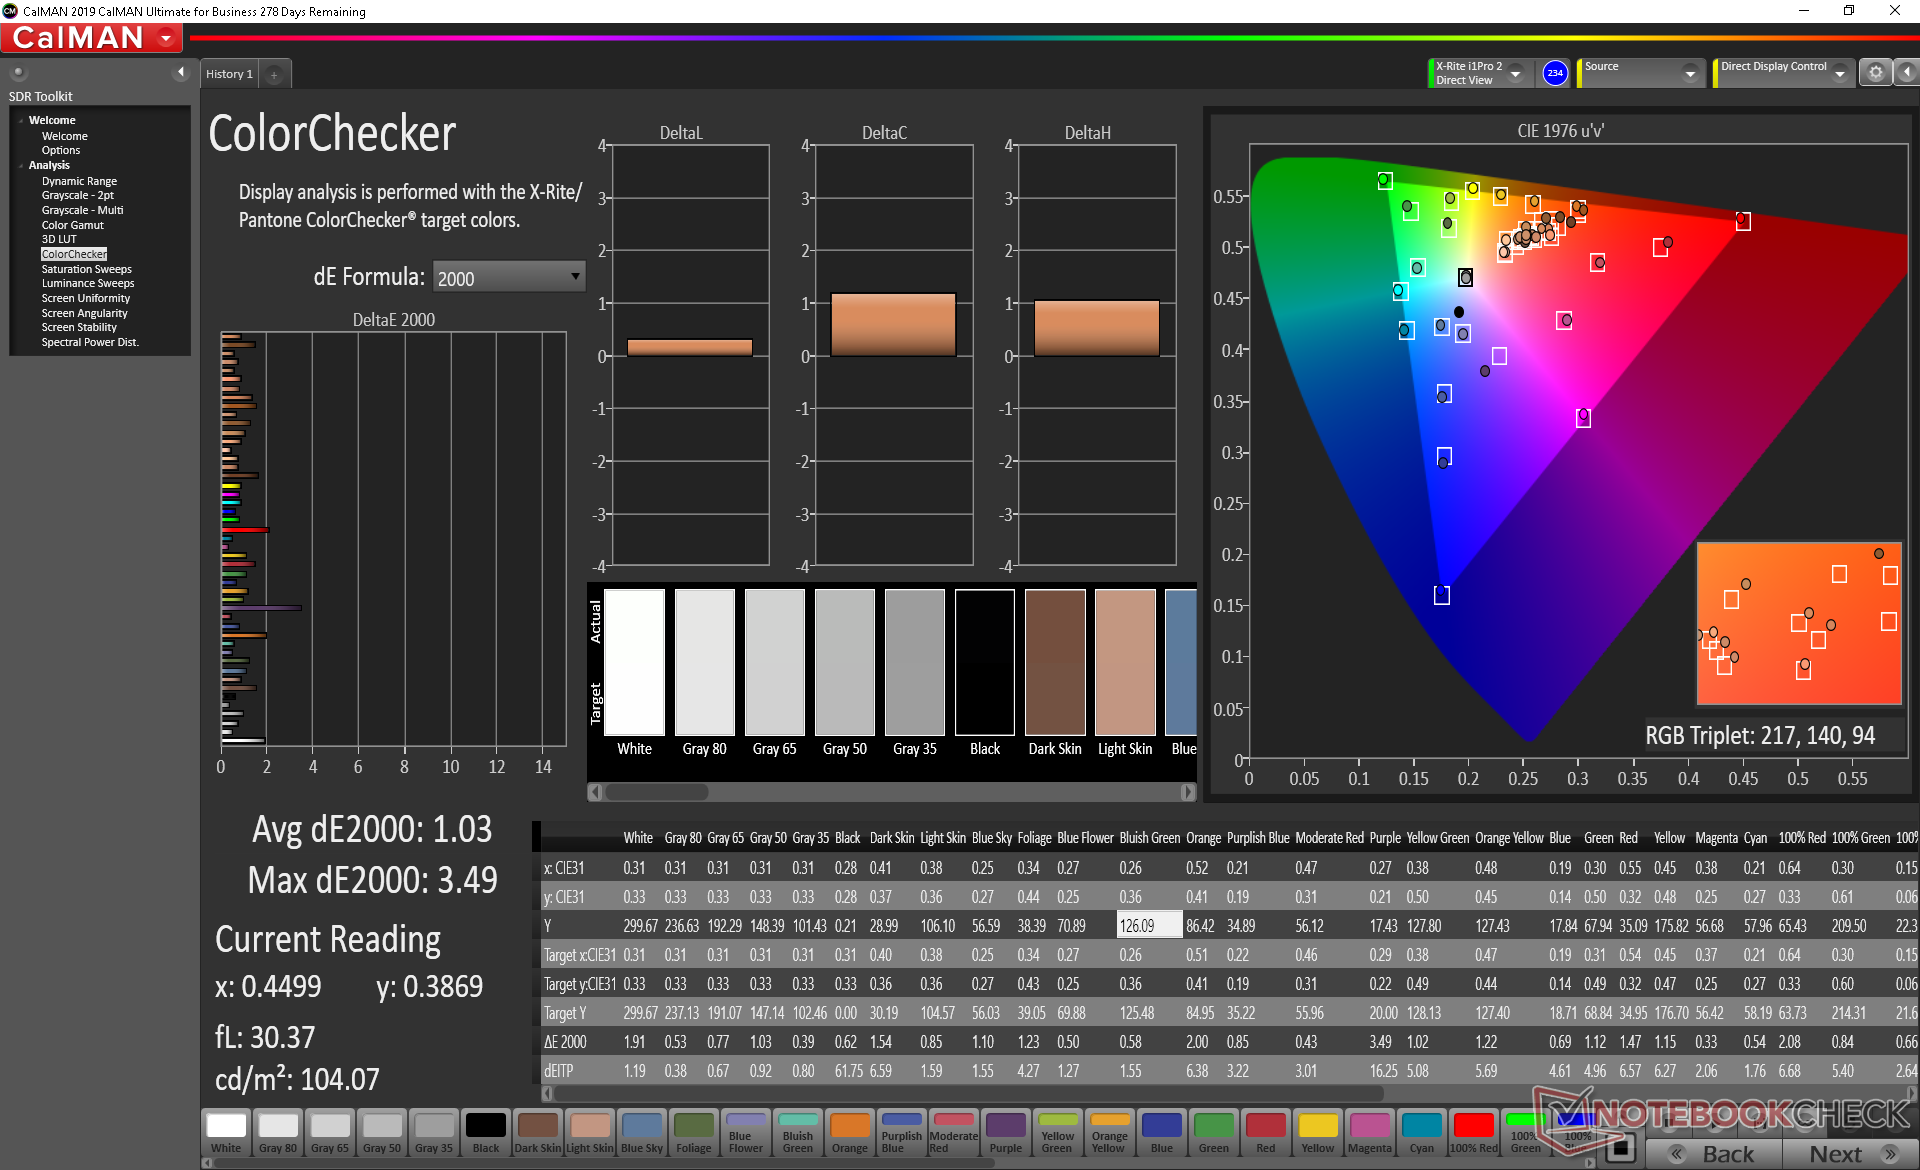
calibrated: 1.03
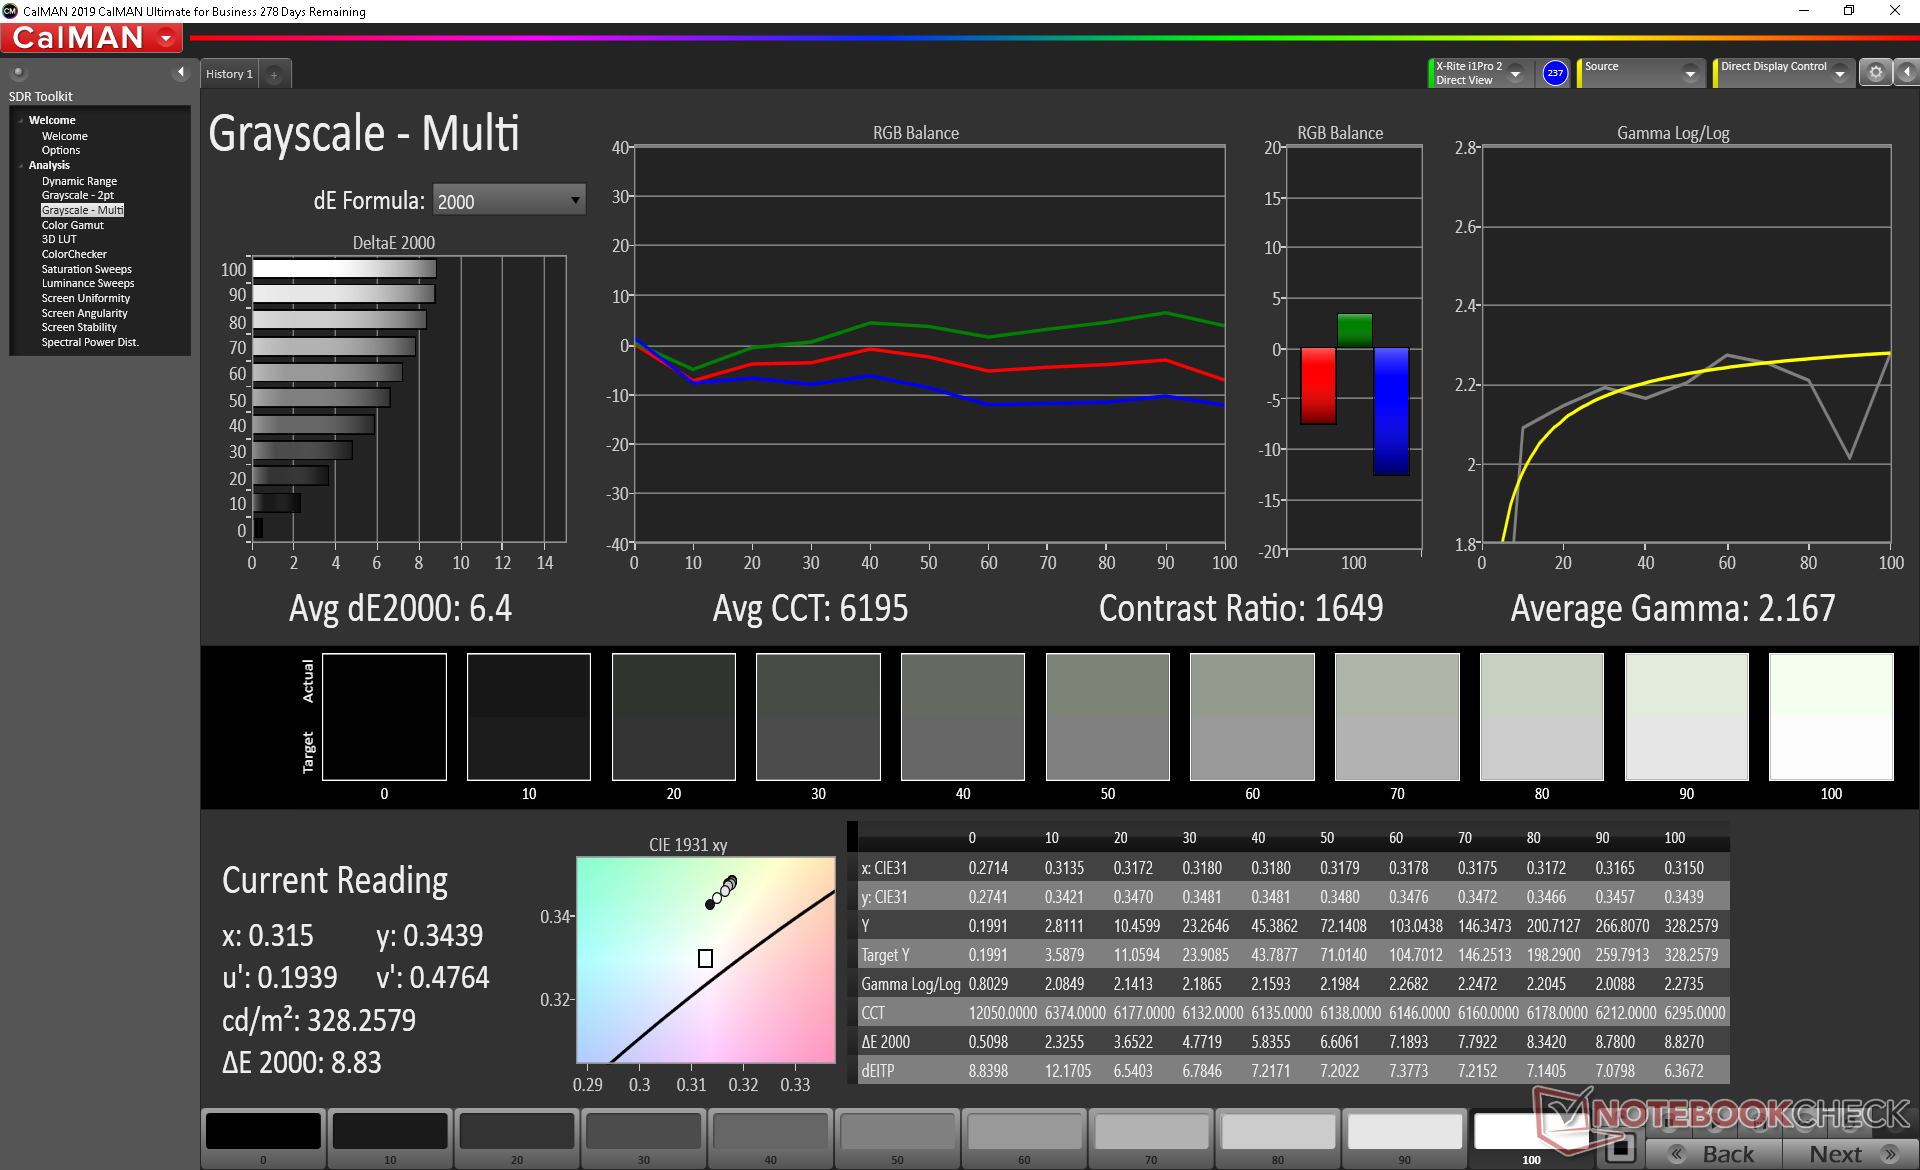
ΔE Greyscale Calman: 6.4 | ∀{0.09-98 Ø4.96}
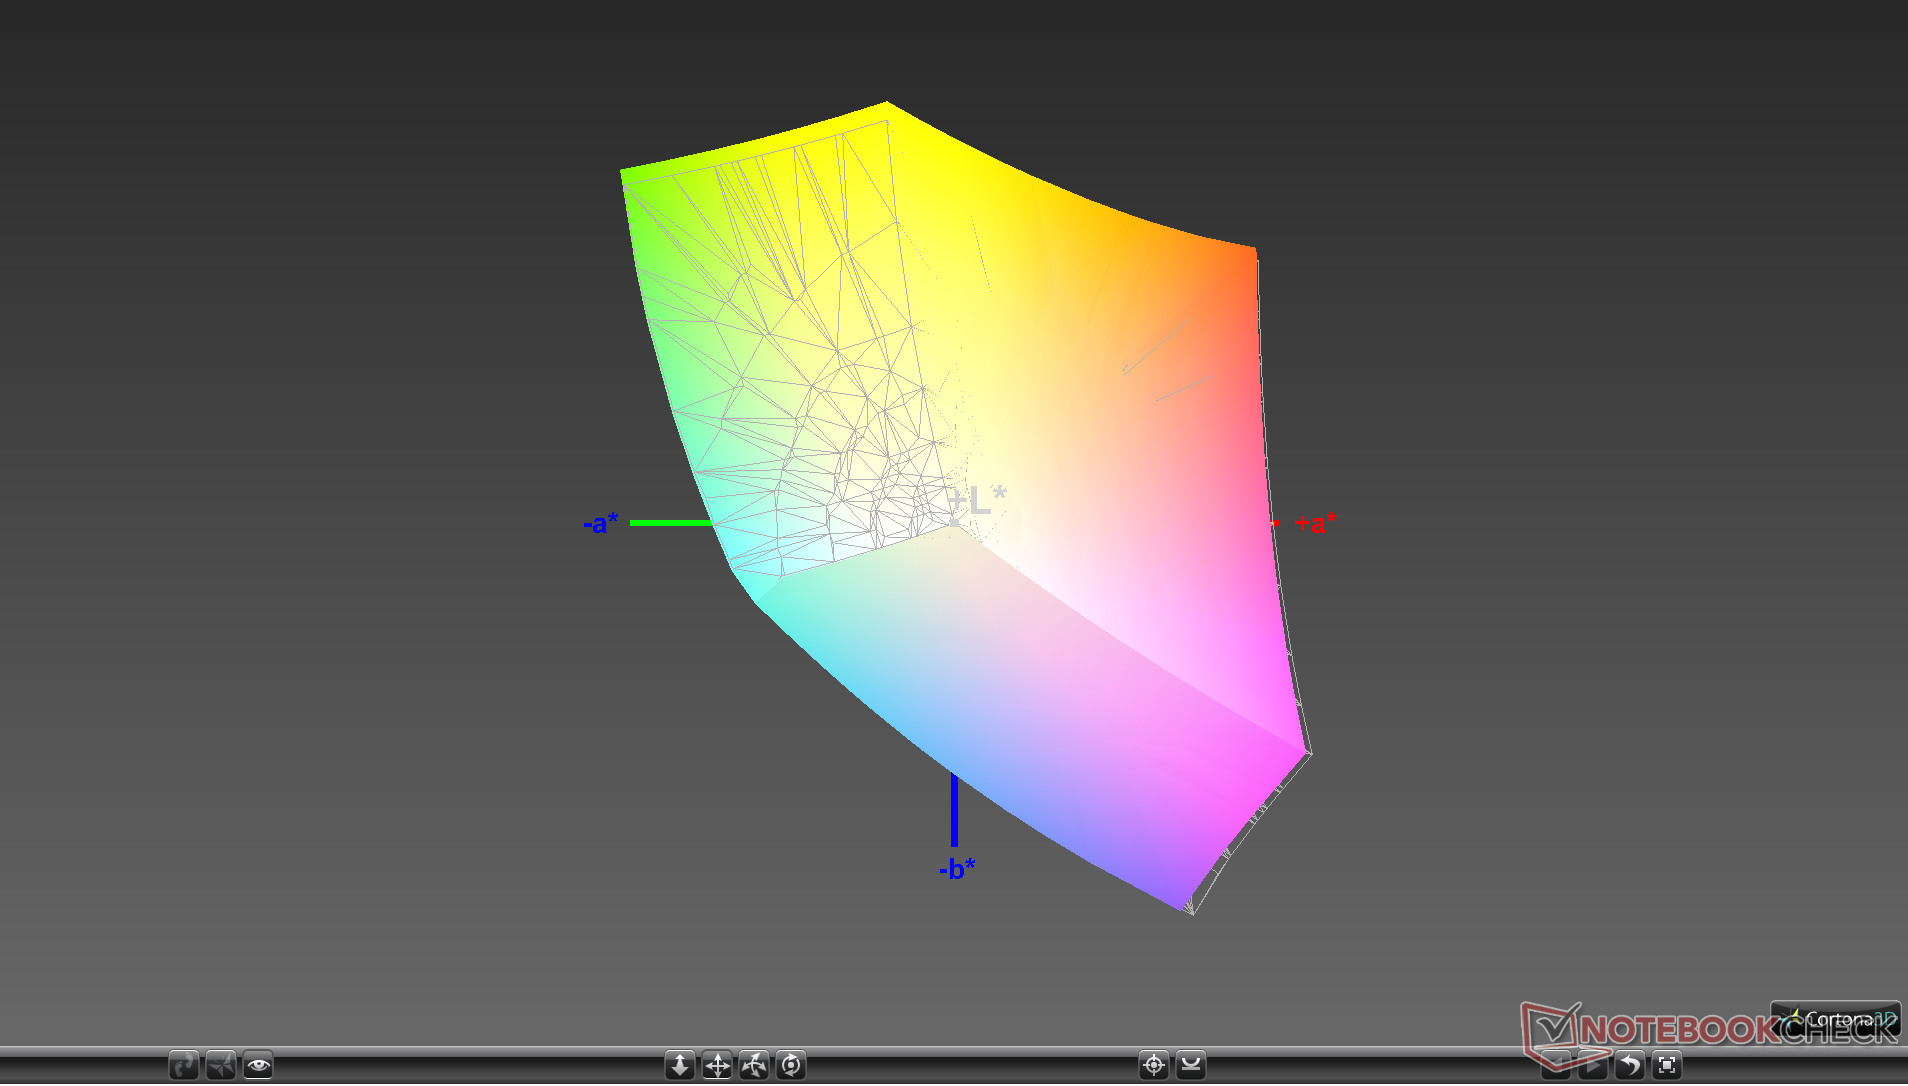
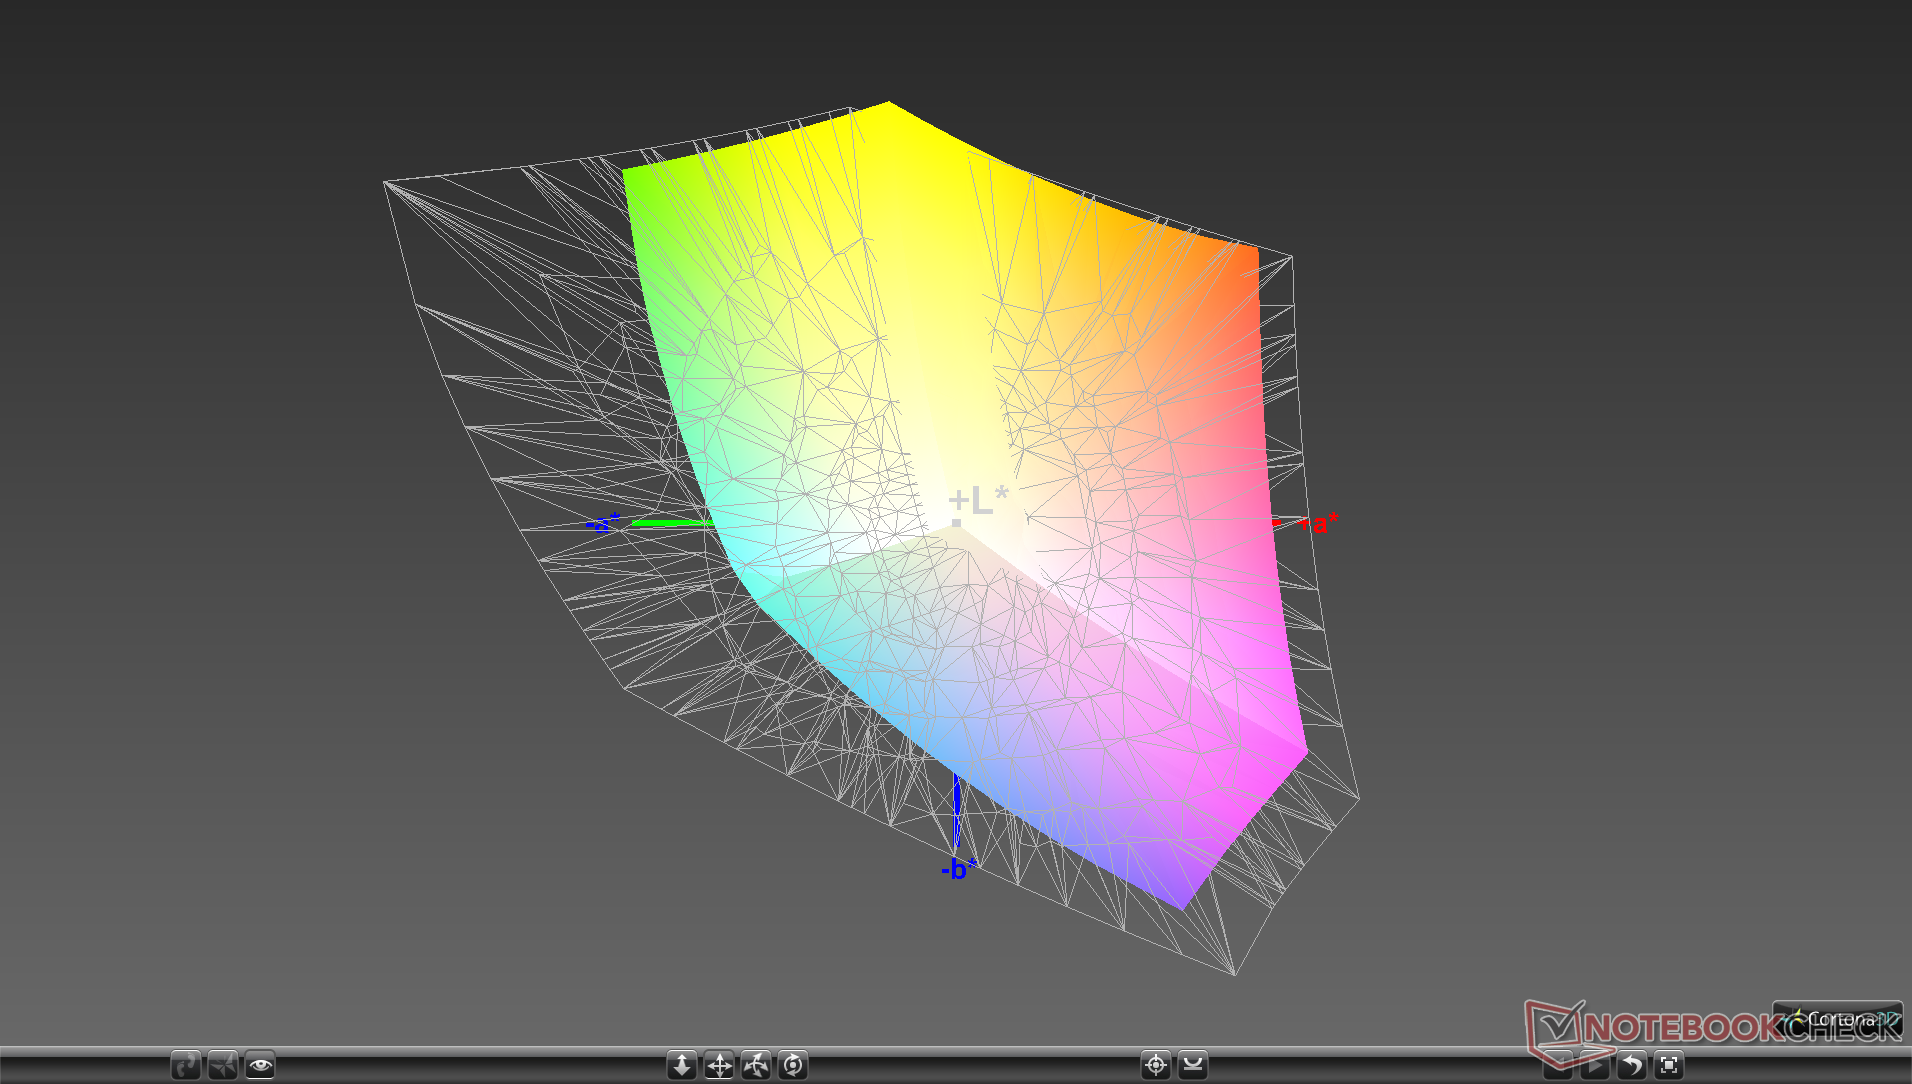
98.4% sRGB (Argyll 1.6.3 3D)
63.6% AdobeRGB 1998 (Argyll 1.6.3 3D)
70.1% AdobeRGB 1998 (Argyll 3D)
98.3% sRGB (Argyll 3D)
67.9% Display P3 (Argyll 3D)
Gamma: 2.17
CCT: 6195 K
| Lenovo Yoga C740-14IML CMN N140HCE-ET2, IPS, 14", 1920x1080 | Lenovo Yoga C940-14IIL 81Q9 BOE HF NV140QUM-N54, IPS, 14", 3840x2160 | Dell XPS 13 7390 2-in-1 Core i3 Sharp LQ134N1, IPS, 13.4", 1920x1200 | Asus ZenBook Flip 14 UM462DA-AI023T IPS, 14", 1920x1080 | Microsoft Surface Laptop 3 13 Core i5-1035G7 Sharp LQ135P1JX51, IPS, 13.5", 2256x1504 | HP Spectre x360 13-aw0013dx AU Optronics AUO5E2D, IPS, 13.3", 1920x1080 | |
|---|---|---|---|---|---|---|
| Display | 15% | 0% | -9% | -2% | 2% | |
| Display P3 Coverage (%) | 67.9 | 83.8 23% | 68.6 1% | 65.5 -4% | 65.7 -3% | 69.6 3% |
| sRGB Coverage (%) | 98.3 | 99.9 2% | 98.2 0% | 85.2 -13% | 98.6 0% | 98.9 1% |
| AdobeRGB 1998 Coverage (%) | 70.1 | 83.3 19% | 70.4 0% | 62.2 -11% | 67.8 -3% | 71.5 2% |
| Response Times | 1% | -10% | -5% | -40% | -36% | |
| Response Time Grey 50% / Grey 80% * (ms) | 35.6 ? | 44.4 ? -25% | 46 ? -29% | 42 ? -18% | 59.2 ? -66% | 60.8 ? -71% |
| Response Time Black / White * (ms) | 36.8 ? | 27.2 ? 26% | 33.6 ? 9% | 34 ? 8% | 41.6 ? -13% | 36.8 ? -0% |
| PWM Frequency (Hz) | 27030 ? | 2525 ? | 21740 ? | |||
| Screen | -5% | 31% | -33% | 24% | 4% | |
| Brightness middle (cd/m²) | 329.9 | 501.7 52% | 576.3 75% | 306 -7% | 403.4 22% | 447.4 36% |
| Brightness (cd/m²) | 315 | 501 59% | 555 76% | 294 -7% | 397 26% | 420 33% |
| Brightness Distribution (%) | 90 | 82 -9% | 88 -2% | 81 -10% | 89 -1% | 85 -6% |
| Black Level * (cd/m²) | 0.29 | 0.32 -10% | 0.33 -14% | 0.39 -34% | 0.34 -17% | 0.31 -7% |
| Contrast (:1) | 1138 | 1568 38% | 1746 53% | 785 -31% | 1186 4% | 1443 27% |
| Colorchecker dE 2000 * | 3.68 | 5.48 -49% | 1.45 61% | 5.16 -40% | 0.94 74% | 4.23 -15% |
| Colorchecker dE 2000 max. * | 8.64 | 10.03 -16% | 4.12 52% | 9.9 -15% | 2.92 66% | 9.34 -8% |
| Colorchecker dE 2000 calibrated * | 1.03 | 2.22 -116% | 1.19 -16% | 3.07 -198% | 0.99 4% | 1.32 -28% |
| Greyscale dE 2000 * | 6.4 | 8.1 -27% | 3.1 52% | 5.86 8% | 0.9 86% | 6.1 5% |
| Gamma | 2.17 101% | 2.07 106% | 2.27 97% | 2.31 95% | 2.13 103% | 2.11 104% |
| CCT | 6195 105% | 6730 97% | 6931 94% | 6349 102% | 6620 98% | 6136 106% |
| Color Space (Percent of AdobeRGB 1998) (%) | 63.6 | 74.1 17% | 64.2 1% | 56 -12% | 62.3 -2% | 64.8 2% |
| Color Space (Percent of sRGB) (%) | 98.4 | 100 2% | 98.5 0% | 85 -14% | 98.7 0% | 98.9 1% |
| Total Average (Program / Settings) | 4% /
-1% | 7% /
20% | -16% /
-25% | -6% /
11% | -10% /
-2% |
* ... smaller is better
Color space covers approximately 98 percent of sRGB or 64 percent of AdobeRGB to be indicative of a high-end panel. Lesser laptop families like the IdeaPad series or Inspiron series tend to cover ~60 percent of sRGB only for shallower and less accurate colors.
Further measurements with an X-Rite colorimeter reveal a warmer-than-expected color temperature with mediocre RGB balance. Once we calibrated the display ourselves, its average grayscale deltaE improves sharply from 6.4 to 1.2 for more accurate colors overall. We recommend applying our calibrated ICM file above or calibrating the unit yourself to get the most out of the display.
Display Response Times
| ↔ Response Time Black to White | ||
|---|---|---|
| 36.8 ms ... rise ↗ and fall ↘ combined | ↗ 17.2 ms rise | 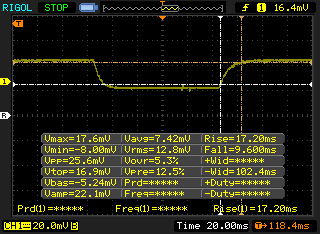 |
| ↘ 9.6 ms fall | ||
| The screen shows slow response rates in our tests and will be unsatisfactory for gamers. In comparison, all tested devices range from 0.1 (minimum) to 240 (maximum) ms. » 95 % of all devices are better. This means that the measured response time is worse than the average of all tested devices (19.8 ms). | ||
| ↔ Response Time 50% Grey to 80% Grey | ||
| 35.6 ms ... rise ↗ and fall ↘ combined | ↗ 19.2 ms rise | 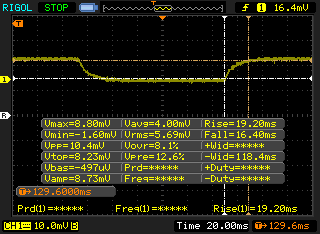 |
| ↘ 16.4 ms fall | ||
| The screen shows slow response rates in our tests and will be unsatisfactory for gamers. In comparison, all tested devices range from 0.165 (minimum) to 636 (maximum) ms. » 50 % of all devices are better. This means that the measured response time is worse than the average of all tested devices (30.9 ms). | ||
Screen Flickering / PWM (Pulse-Width Modulation)
| Screen flickering / PWM detected | 27030 Hz | ≤ 67 % brightness setting | 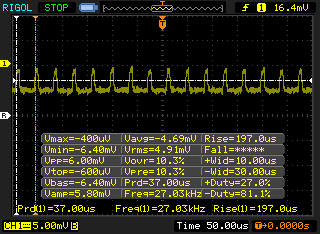 |
The display backlight flickers at 27030 Hz (worst case, e.g., utilizing PWM) Flickering detected at a brightness setting of 67 % and below. There should be no flickering or PWM above this brightness setting. The frequency of 27030 Hz is quite high, so most users sensitive to PWM should not notice any flickering. In comparison: 52 % of all tested devices do not use PWM to dim the display. If PWM was detected, an average of 7741 (minimum: 5 - maximum: 343500) Hz was measured. | |||
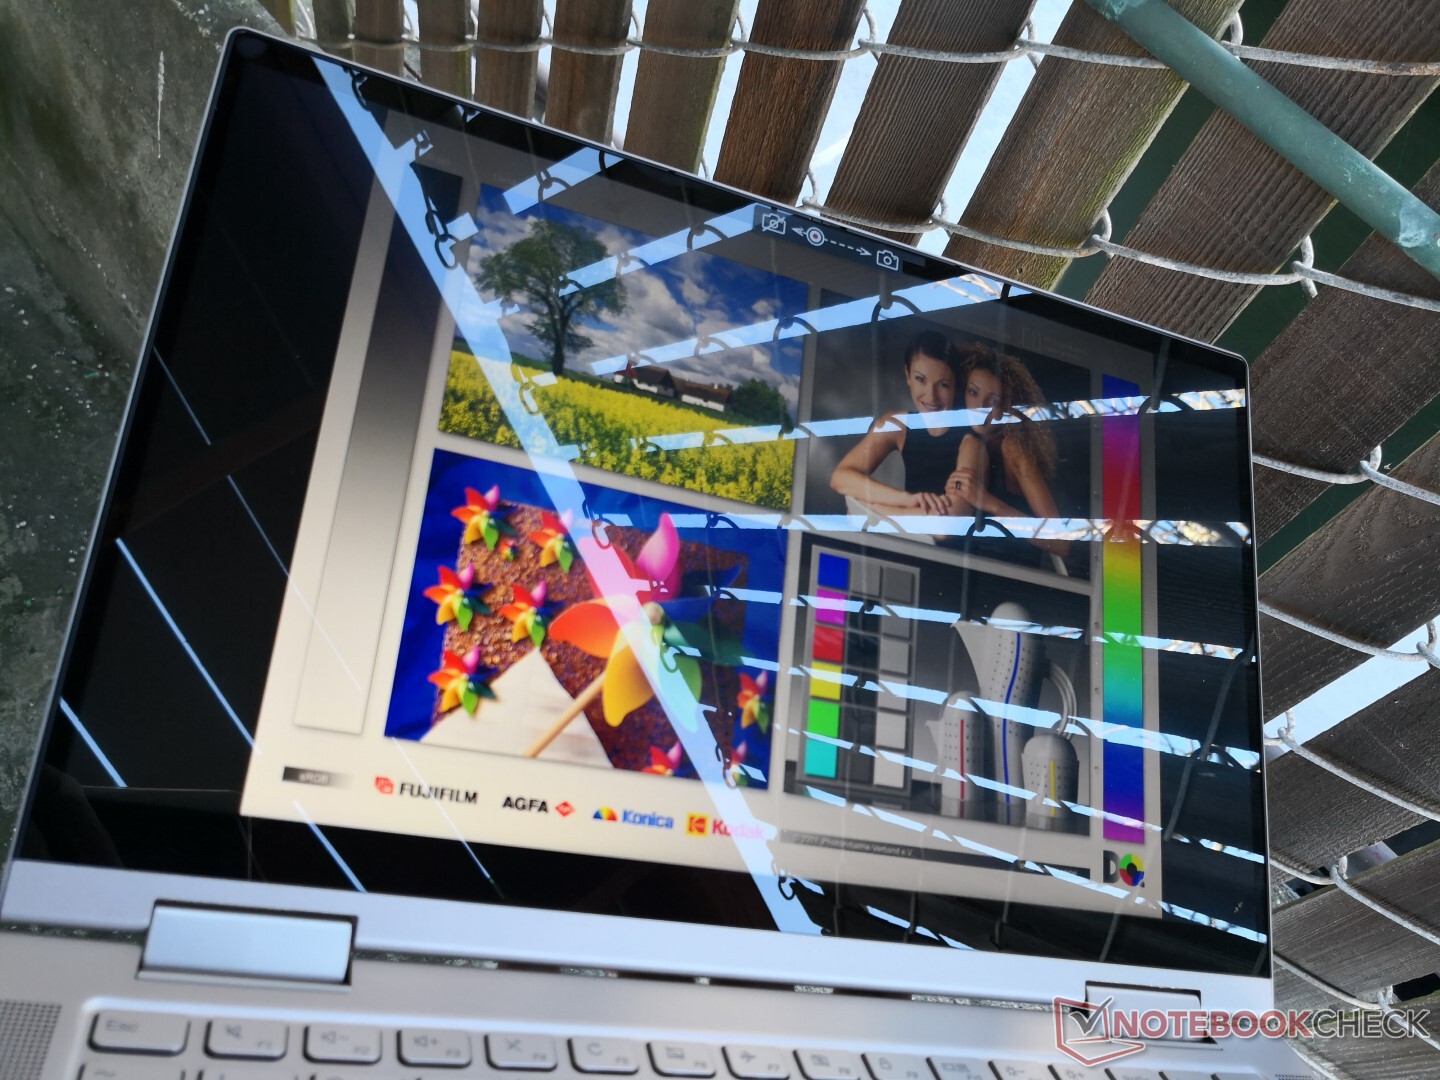
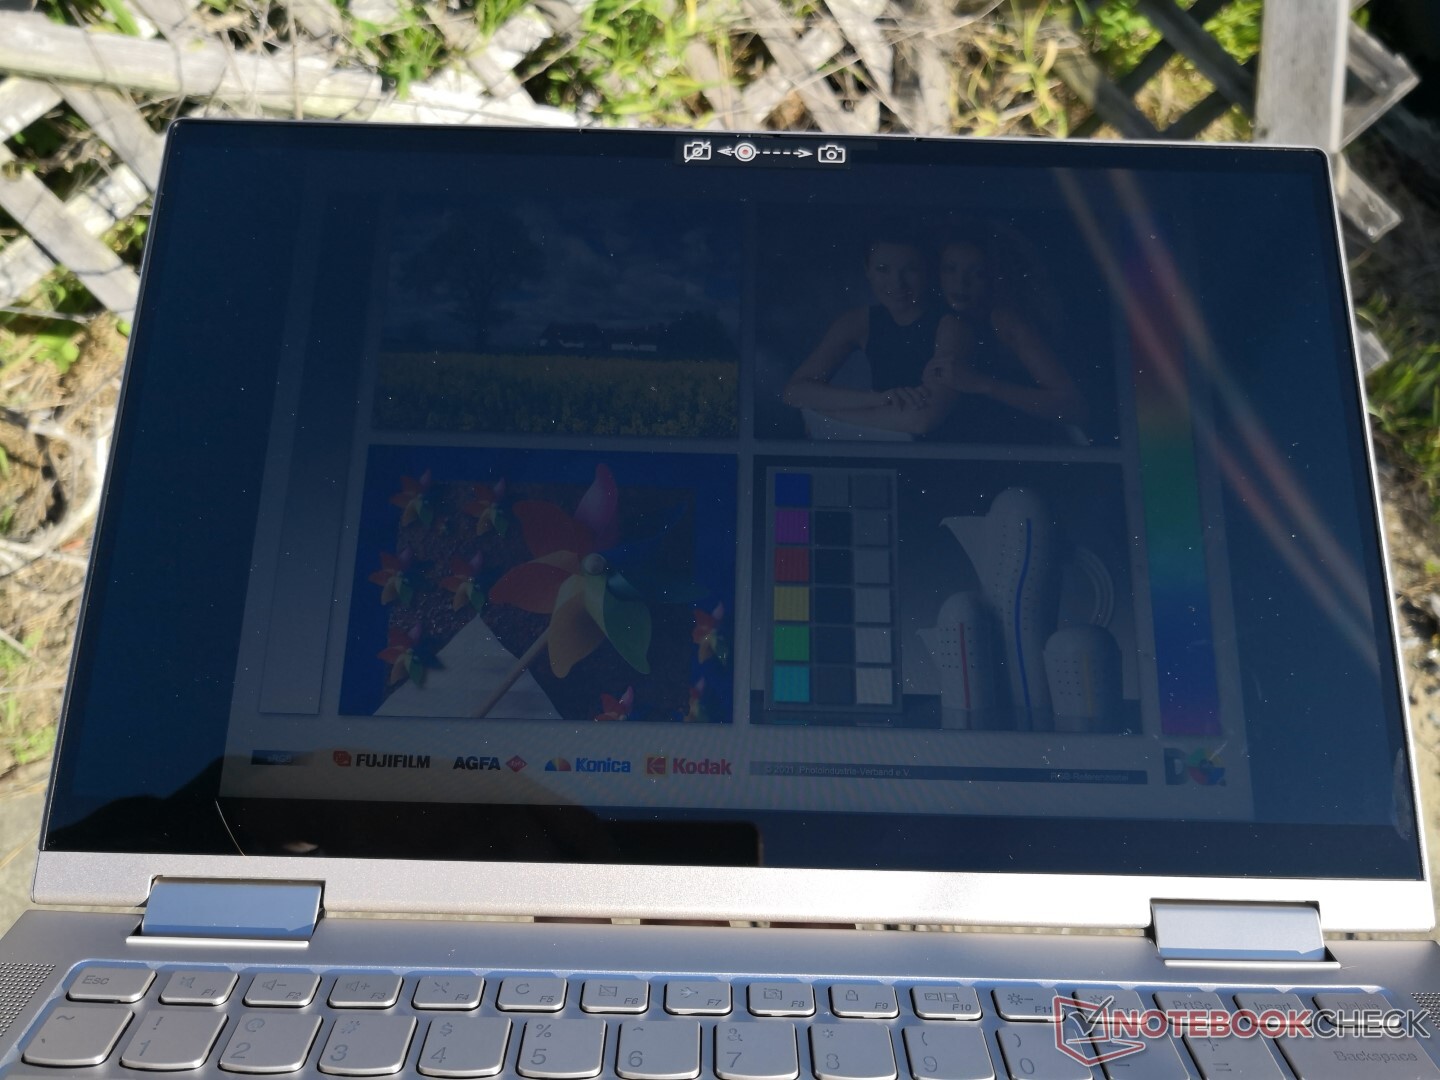
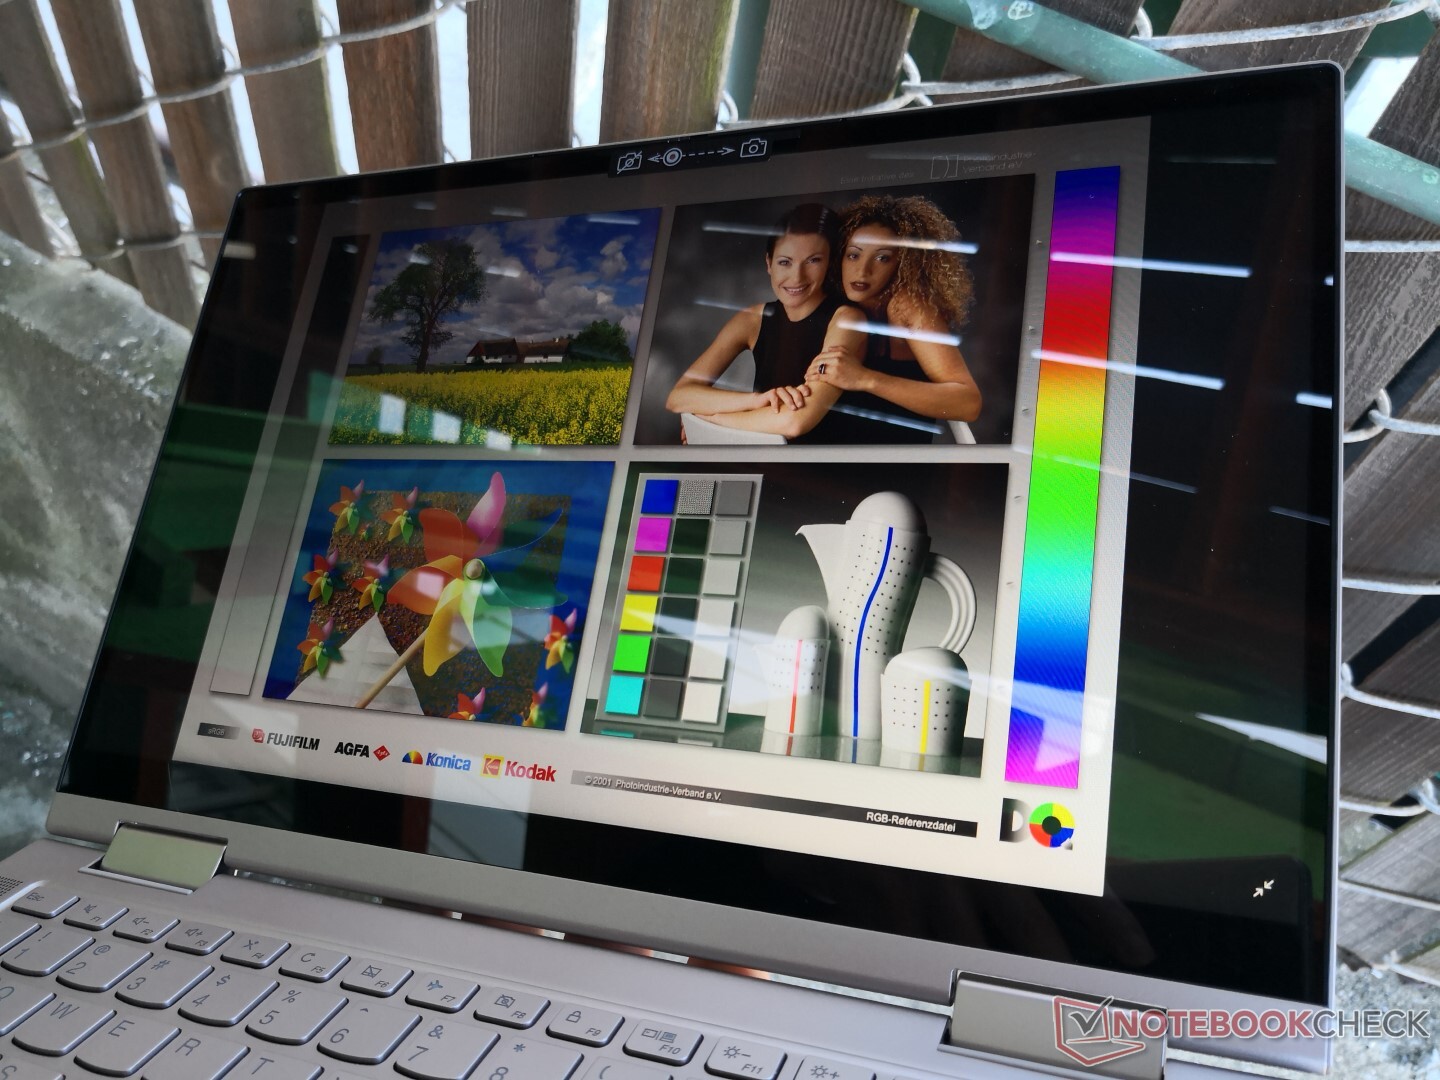
Outdoor visibility is merely average and could have been better for a convertible laptop since owners are more likely to use these 2-in-1 systems on-the-go. Colors become washed out on an overcast day and glare becomes prevalent when under shade. A brighter display would have minimized these issues, but you'll have to invest in the pricier Yoga C940 for that.
Performance
Configurable options feel limited as is common on convertible subnotebooks. Users can choose between the Intel 10th gen Comet Lake-U Core i5-10210U or Core i7-10510U CPU with no other display or GPU options. If you want something with more graphics potential, then consider the Ice Lake-powered Dell XPS 13 2-in-1, Yoga C940, or Spectre x360 13 instead. We're hoping that Lenovo will add AMD Ryzen options in the future.
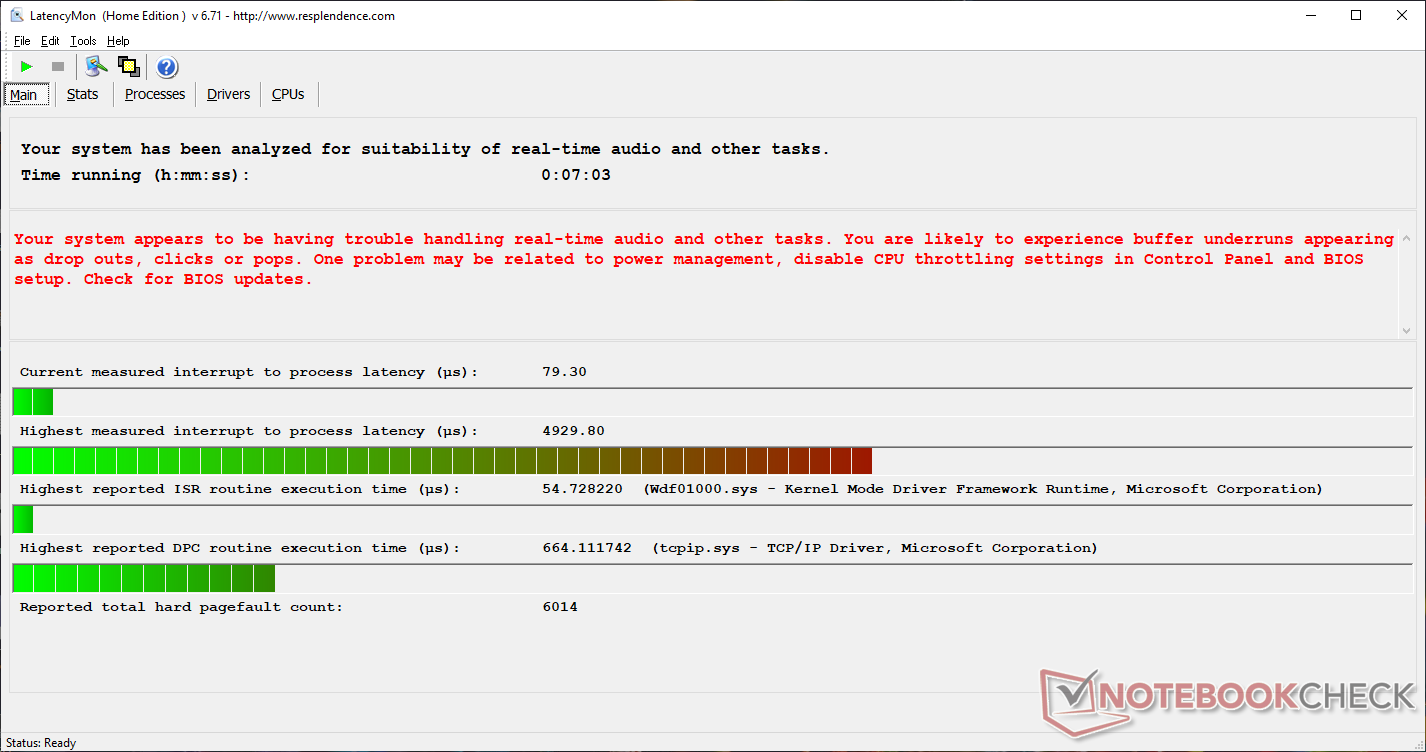
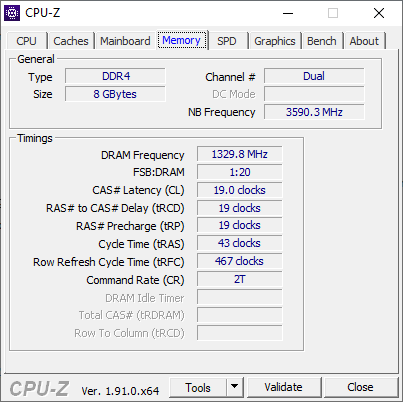
DDR4 RAM is soldered up to 16 GB. We experienced DPC latency issues even with the wireless disabled.
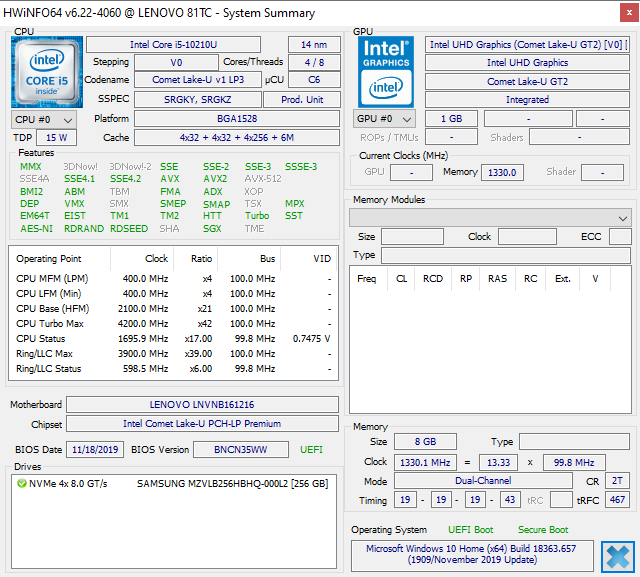
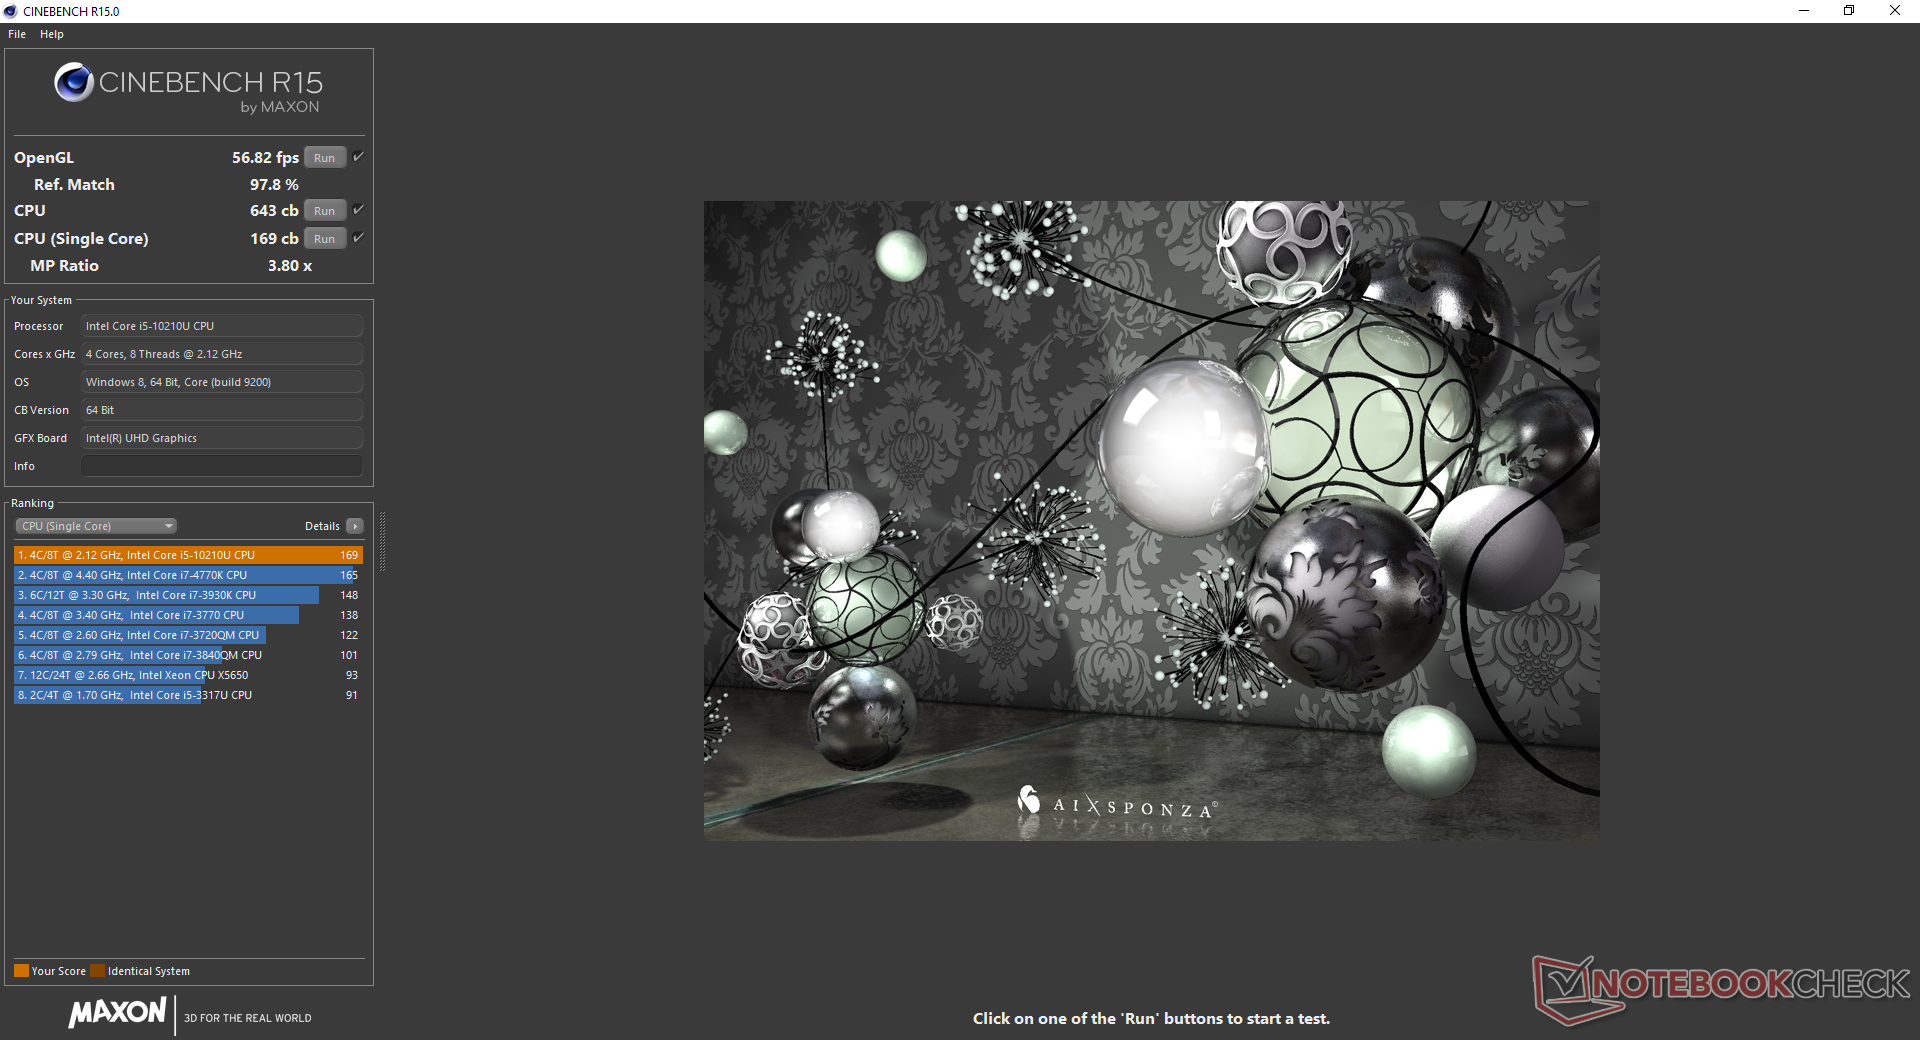
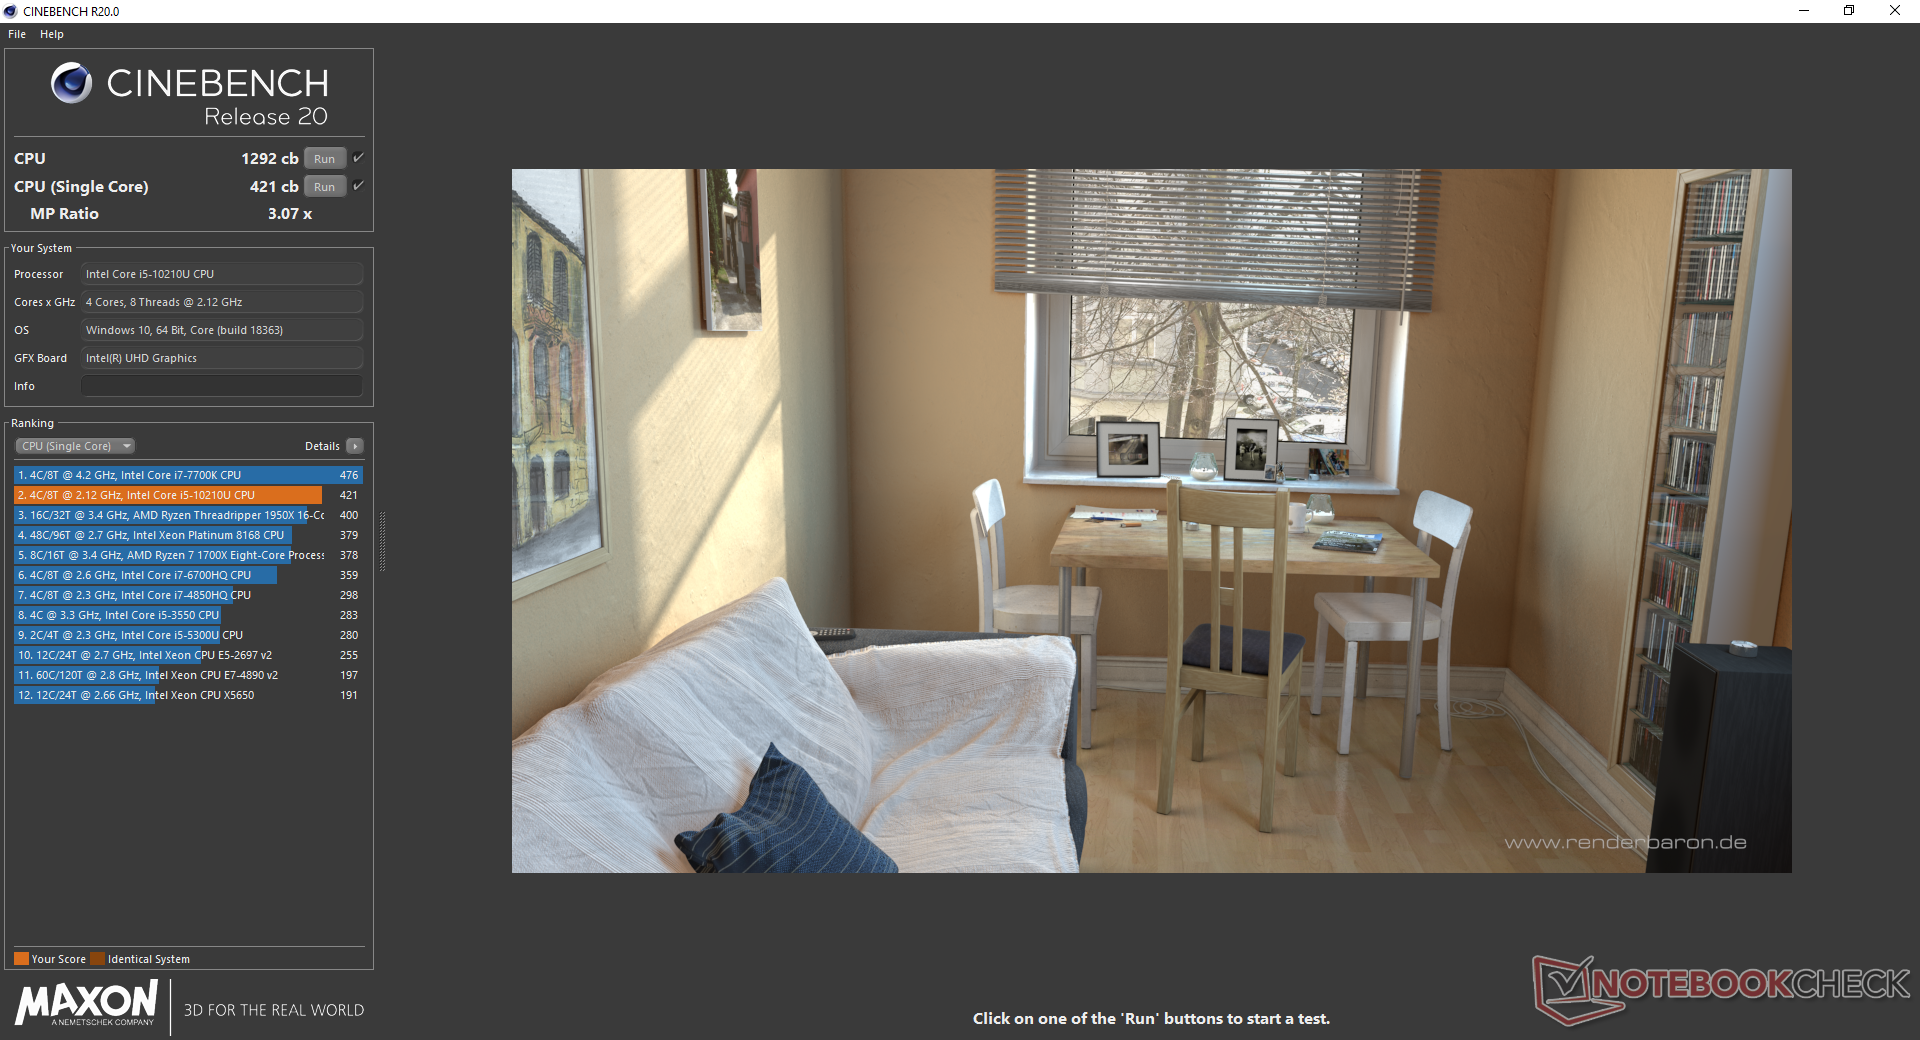
Processor
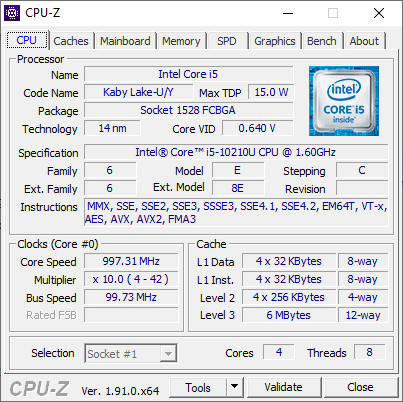
Opting for the Core i5-10210U instead of the higher-end Core i7-10510U configuration will incur a 15 to 20 percent performance deficit according to CineBench multi-threaded benchmarks. With the exception of the more impressive hexa-core Core i7-10710U, the 10th gen Comet Lake-U series brings only minor performance benefits over the 9th gen Whiskey Lake-U series and even the 8th gen Kaby Lake-R series as detailed here. The older Core i5-8250U, for example, is only about 15 percent slower. The higher-end Yoga C940-14 with the Ice Lake Core i7-1065G7 performs more in line with the Core i7-10510U than our i5-10510U.
Turbo Boost sustainability could be better. When running CineBench R15 Multi-Thread in a loop, the initial score of 675 points drops to about 540 points over time to represent a 20 percent performance deficit when the CPU is stressed. Results are very close to what we observed on the ThinkBook 15 equipped with the same Core i5 CPU.
See our dedicated page on the Core i5-10210U for more technical information and benchmark comparisons.
| Cinebench R10 | |
| Rendering Multiple CPUs 32Bit | |
| Dell XPS 13 7390 Core i7-10710U | |
| Average Intel Core i5-10210U (15037 - 22164, n=3) | |
| Dynabook Portege A30-E-174 | |
| Lenovo ThinkPad P43s-20RH001FGE | |
| Rendering Single 32Bit | |
| Dell XPS 13 7390 Core i7-10710U | |
| Average Intel Core i5-10210U (6410 - 6613, n=3) | |
| Dynabook Portege A30-E-174 | |
| Lenovo ThinkPad P43s-20RH001FGE | |
| wPrime 2.10 - 1024m | |
| Average Intel Core i5-10210U (n=1) | |
| Dell XPS 13 7390 Core i7-10710U | |
* ... smaller is better
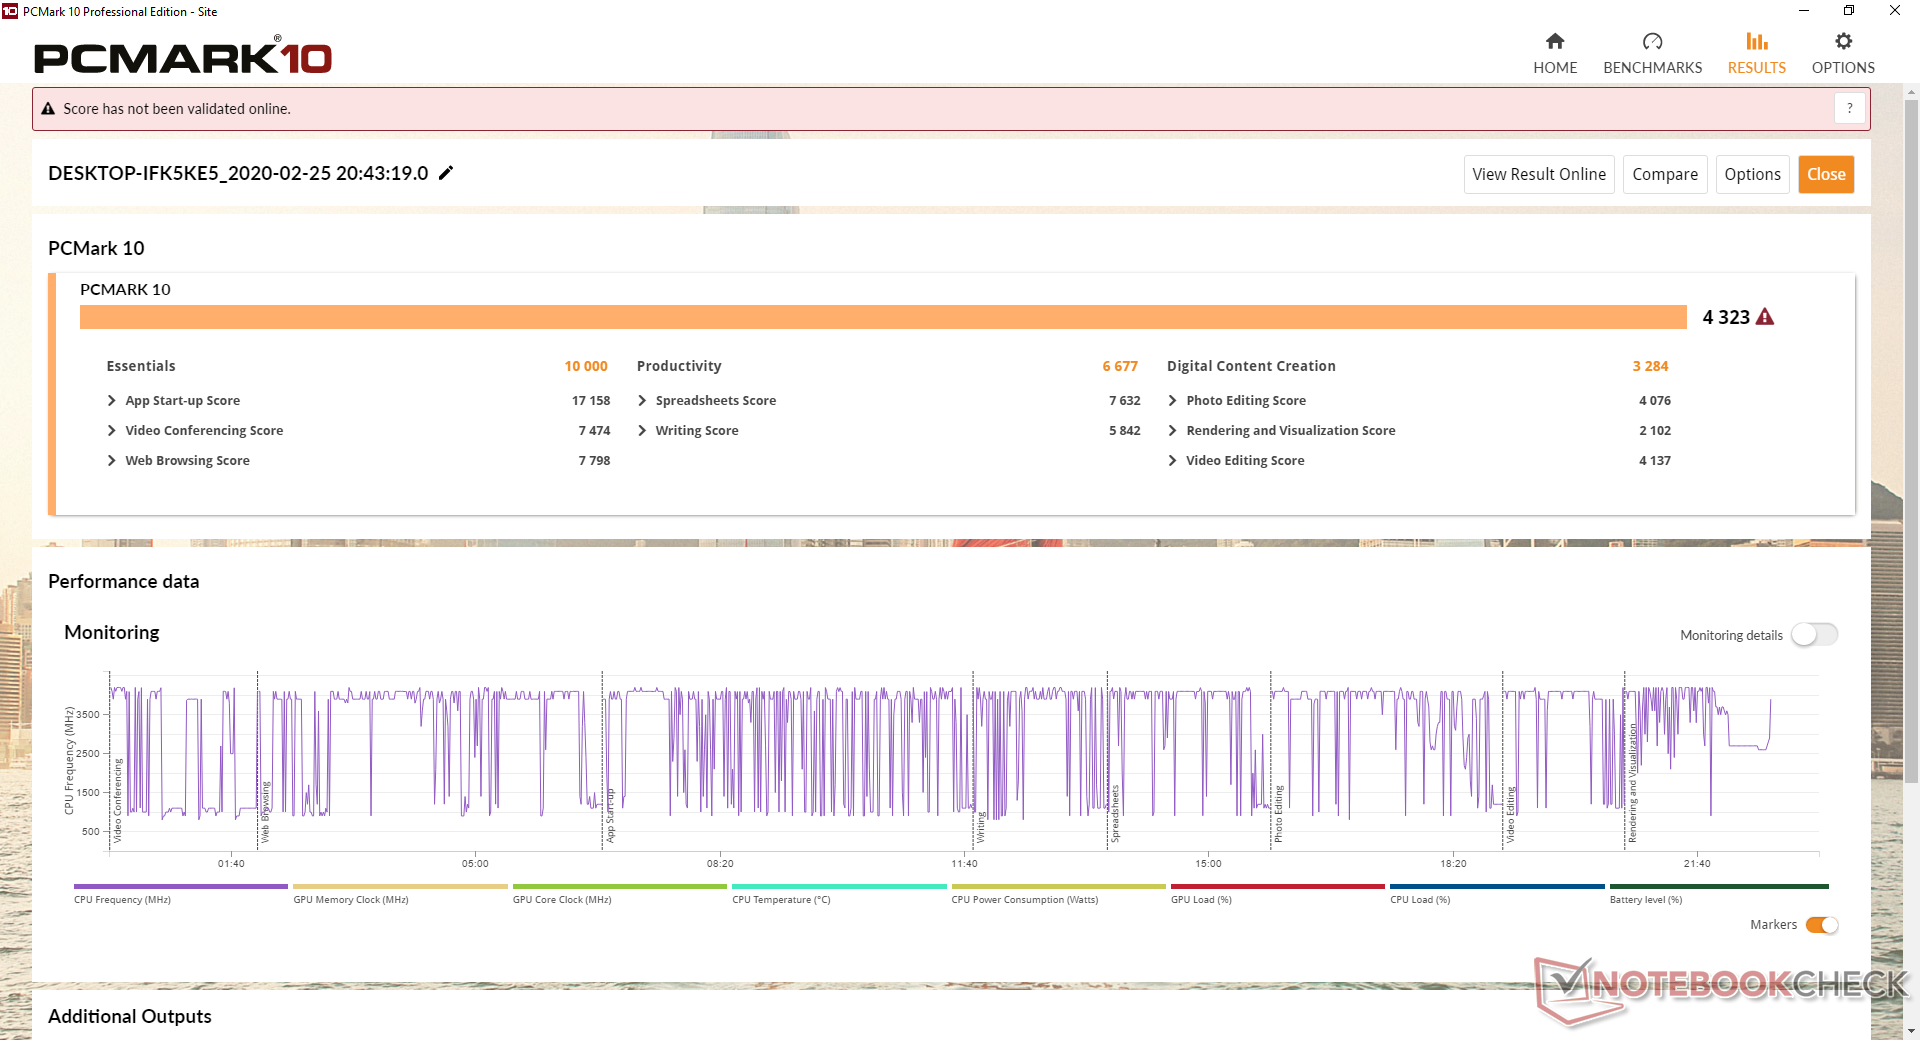
System Performance
PCMark results are comparable to other laptops with the Core i5-10210U and even those equipped with the Core i7-1065G7 like Lenovo's more expensive Yoga C940. Ice Lake has a superior integrated Iris GPU, however, and so our Comet Lake system falls behind in the GPU-heavy Digital Content Creation benchmark. Its PCMark Essentials score is particularly high likely due to the fast Samsung SSD PM981a NVMe SSD.
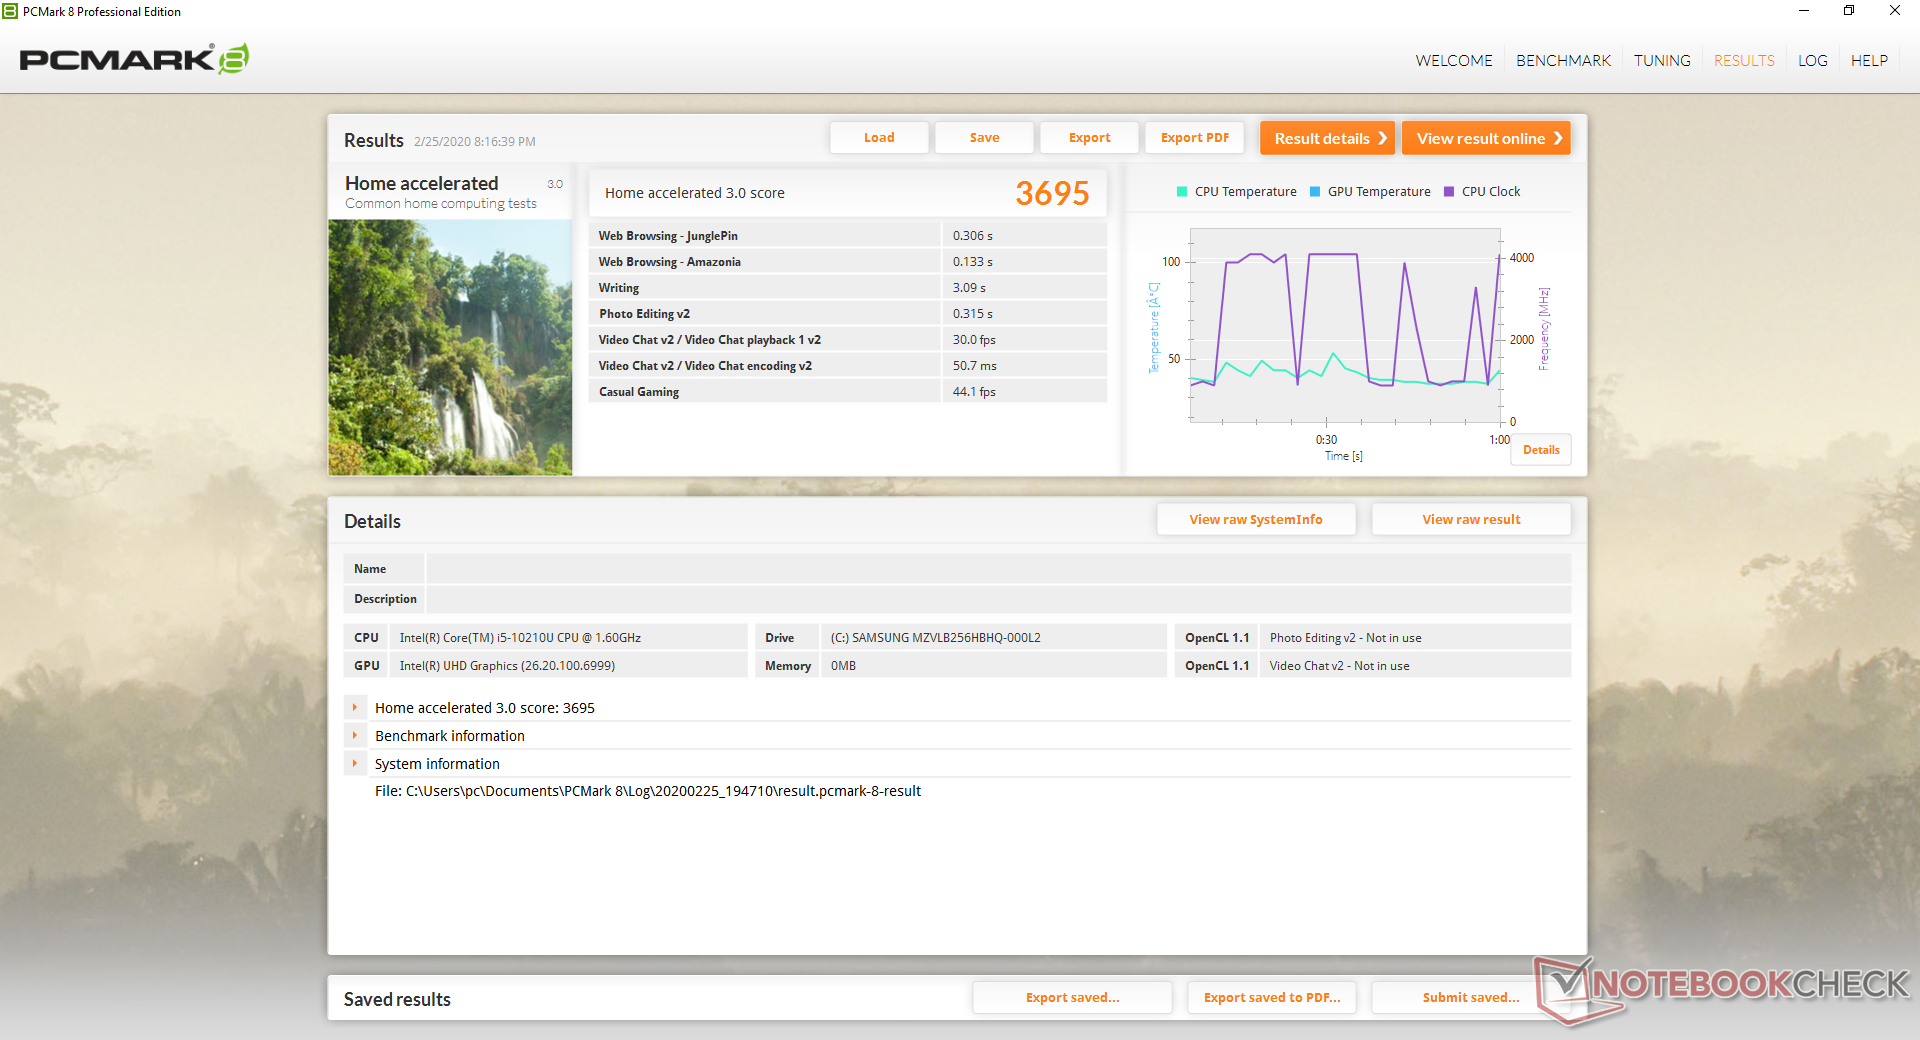
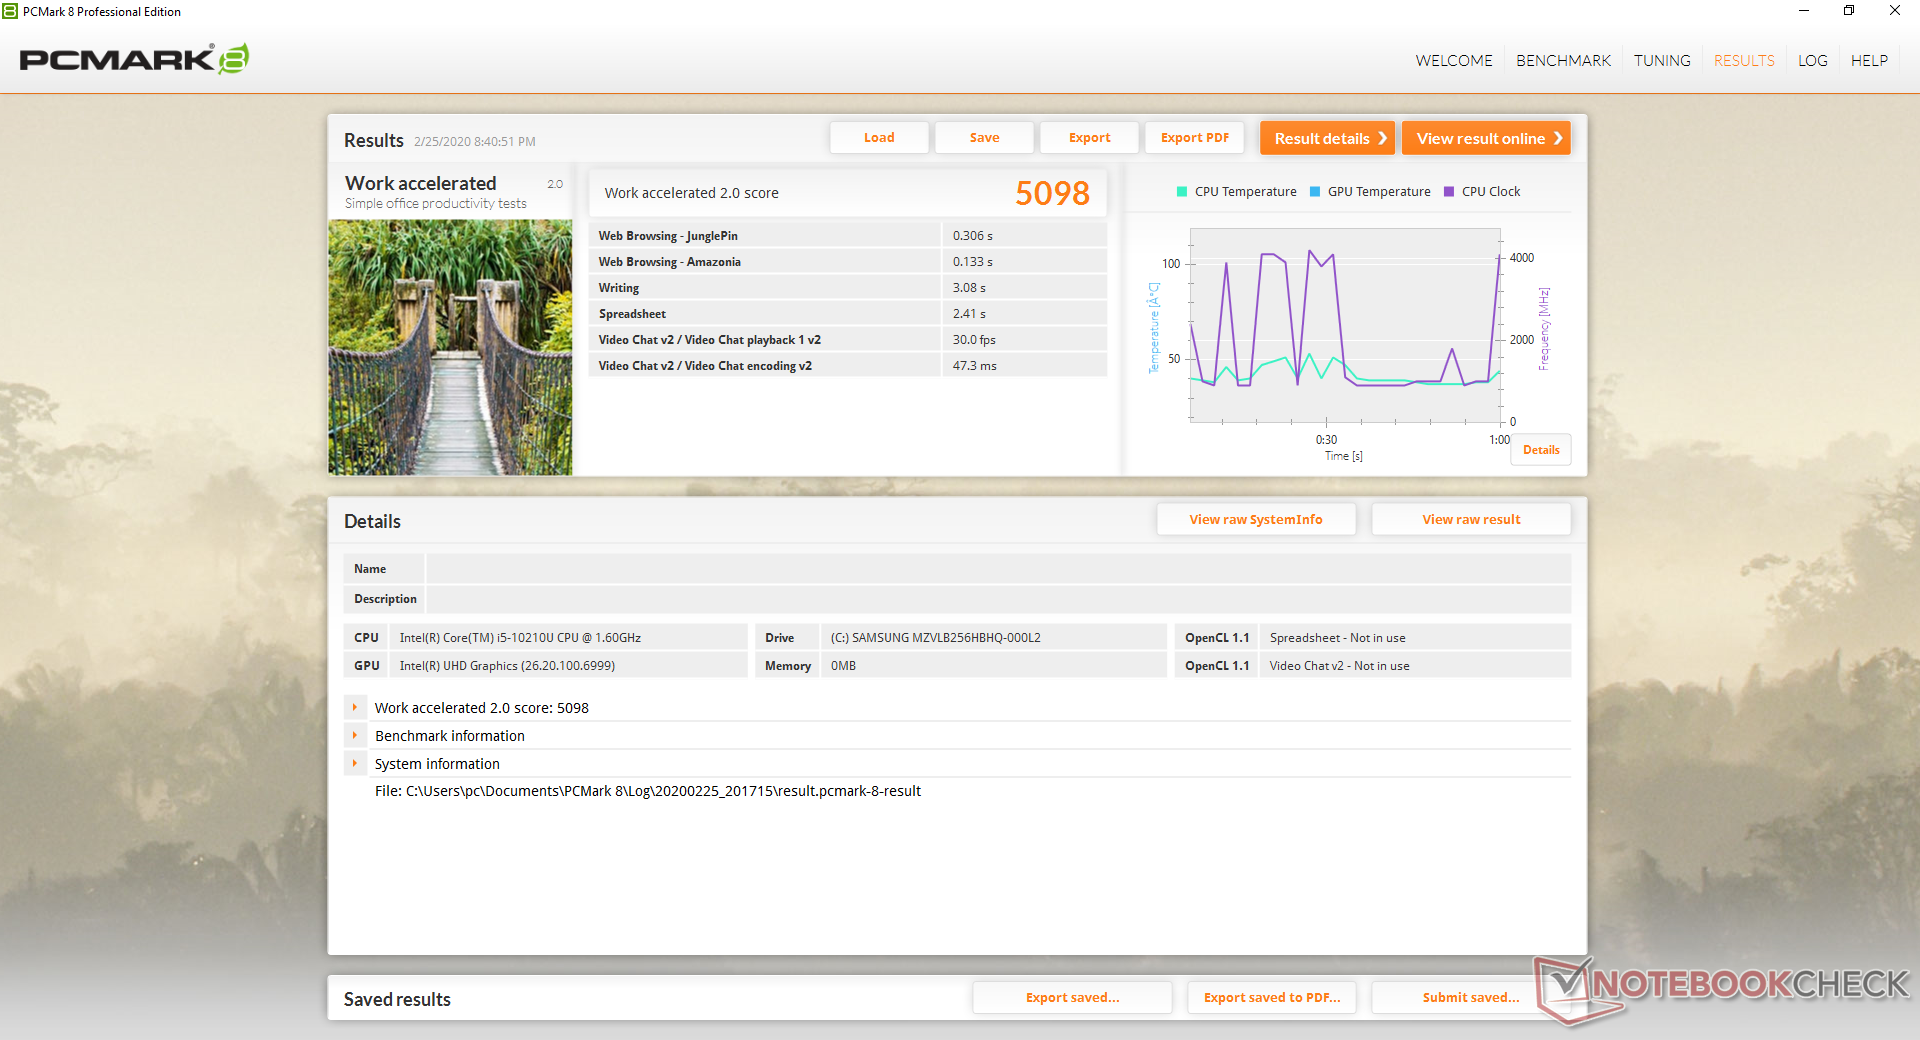
| PCMark 8 Home Score Accelerated v2 | 3695 points | |
| PCMark 8 Work Score Accelerated v2 | 5098 points | |
| PCMark 10 Score | 4323 points | |
Help | ||
Storage Devices
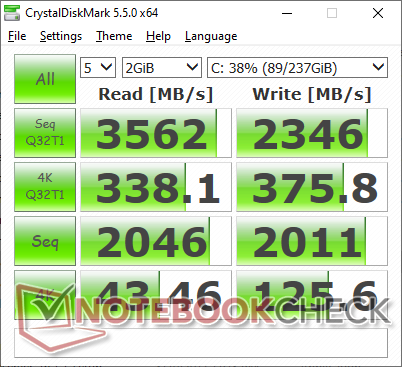
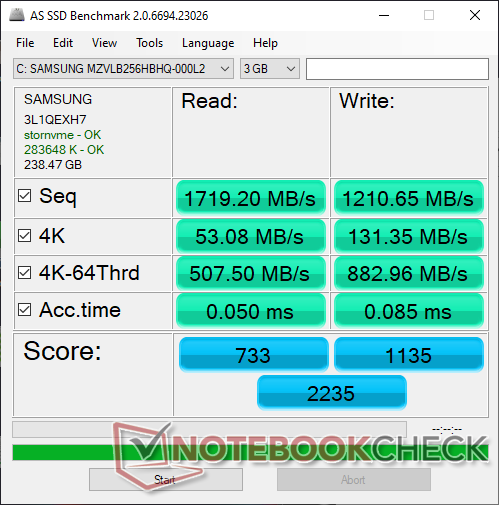
Lenovo has equipped its Yoga C740-14 with the same Samsung PM981a NVMe SSD as found on the Yoga C940-14. Meanwhile, the ThinkBook 15 gets the faster Samsung PM981 instead. Average performance is faster than on the older Toshiba BG4 or cheaper SK Hynix BC501 that Microsoft uses for the Surface Laptop 3. There are no secondary internal drive options.

| Lenovo Yoga C740-14IML Samsung SSD PM981a MZVLB256HBHQ | Lenovo Yoga C940-14IIL 81Q9 Samsung PM981a MZVLB1T0HBLR | Dell XPS 13 7390 2-in-1 Core i3 Toshiba BG4 KBG40ZPZ256G | Microsoft Surface Laptop 3 13 Core i5-1035G7 SK hynix BC501 HFM256GDGTNG | Lenovo ThinkBook 15 Samsung SSD PM981 MZVLB512HAJQ | |
|---|---|---|---|---|---|
| AS SSD | 29% | -60% | -33% | 53% | |
| Seq Read (MB/s) | 1719 | 2213 29% | 1558 -9% | 1387 -19% | 2564 49% |
| Seq Write (MB/s) | 1211 | 1401 16% | 1103 -9% | 504 -58% | 2268 87% |
| 4K Read (MB/s) | 53.1 | 55.2 4% | 37.52 -29% | 42.35 -20% | 57 7% |
| 4K Write (MB/s) | 131.4 | 130.3 -1% | 59 -55% | 120 -9% | 141.4 8% |
| 4K-64 Read (MB/s) | 508 | 878 73% | 1684 231% | 497.4 -2% | 1175 131% |
| 4K-64 Write (MB/s) | 883 | 1478 67% | 198.9 -77% | 354.9 -60% | 1665 89% |
| Access Time Read * (ms) | 0.05 | 0.036 28% | 0.099 -98% | 0.055 -10% | 0.032 36% |
| Access Time Write * (ms) | 0.085 | 0.086 -1% | 0.722 -749% | 0.093 -9% | 0.025 71% |
| Score Read (Points) | 733 | 1154 57% | 1877 156% | 678 -8% | 1488 103% |
| Score Write (Points) | 1135 | 1748 54% | 368 -68% | 525 -54% | 2033 79% |
| Score Total (Points) | 2235 | 3467 55% | 3180 42% | 1520 -32% | 4279 91% |
| Copy ISO MB/s (MB/s) | 1636 | 2161 32% | 677 -59% | 764 -53% | 2118 29% |
| Copy Program MB/s (MB/s) | 698 | 572 -18% | 298.4 -57% | 256.1 -63% | 495.6 -29% |
| Copy Game MB/s (MB/s) | 1246 | 1433 15% | 496.1 -60% | 368.4 -70% | 1174 -6% |
| CrystalDiskMark 5.2 / 6 | 11% | -28% | -29% | 15% | |
| Write 4K (MB/s) | 125.6 | 128.6 2% | 61.6 -51% | 112.3 -11% | 176.3 40% |
| Read 4K (MB/s) | 43.46 | 45.25 4% | 39.12 -10% | 42.13 -3% | 48.98 13% |
| Write Seq (MB/s) | 2011 | 1949 -3% | 1220 -39% | 630 -69% | 1789 -11% |
| Read Seq (MB/s) | 2046 | 2359 15% | 1590 -22% | 1023 -50% | 1671 -18% |
| Write 4K Q32T1 (MB/s) | 375.8 | 445 18% | 283.4 -25% | 336.6 -10% | 433.5 15% |
| Read 4K Q32T1 (MB/s) | 338.1 | 404.5 20% | 350.3 4% | 399.6 18% | 526 56% |
| Write Seq Q32T1 (MB/s) | 2346 | 3019 29% | 1238 -47% | 821 -65% | 2983 27% |
| Read Seq Q32T1 (MB/s) | 3562 | 3564 0% | 2330 -35% | 2030 -43% | 3555 0% |
| Write 4K Q8T8 (MB/s) | 1688 | ||||
| Read 4K Q8T8 (MB/s) | 1036 | ||||
| Total Average (Program / Settings) | 20% /
23% | -44% /
-48% | -31% /
-32% | 34% /
39% |
* ... smaller is better

GPU Performance
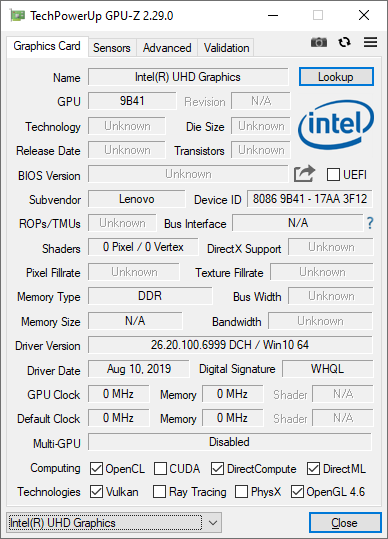
Graphics performance has barely changed from the older Kaby Lake-U series since the Comet Lake-U series uses the same outdated integrated UHD Graphics 620 GPU. As a result, 3DMark benchmarks are only about 10 percent faster than the average UHD Graphics 620 in our database compared to over 100 percent on the newer Ice Lake Core i7-1065G7 Iris Plus GPU or the competing integrated Radeon RX Vega series. This is an Ultrabook more for 4K video playback rather than any sort of gaming or editing.
See our dedicated page on the UHD Graphics 620 for more technical information and benchmarks.
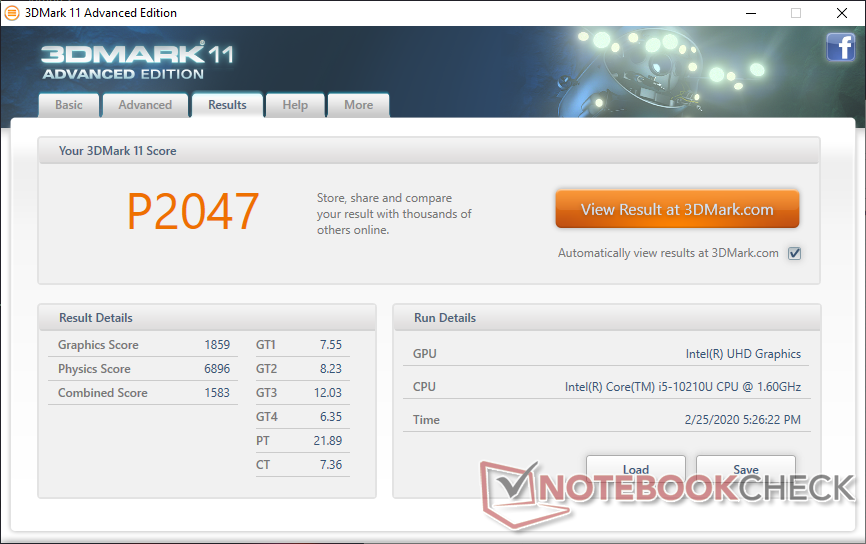
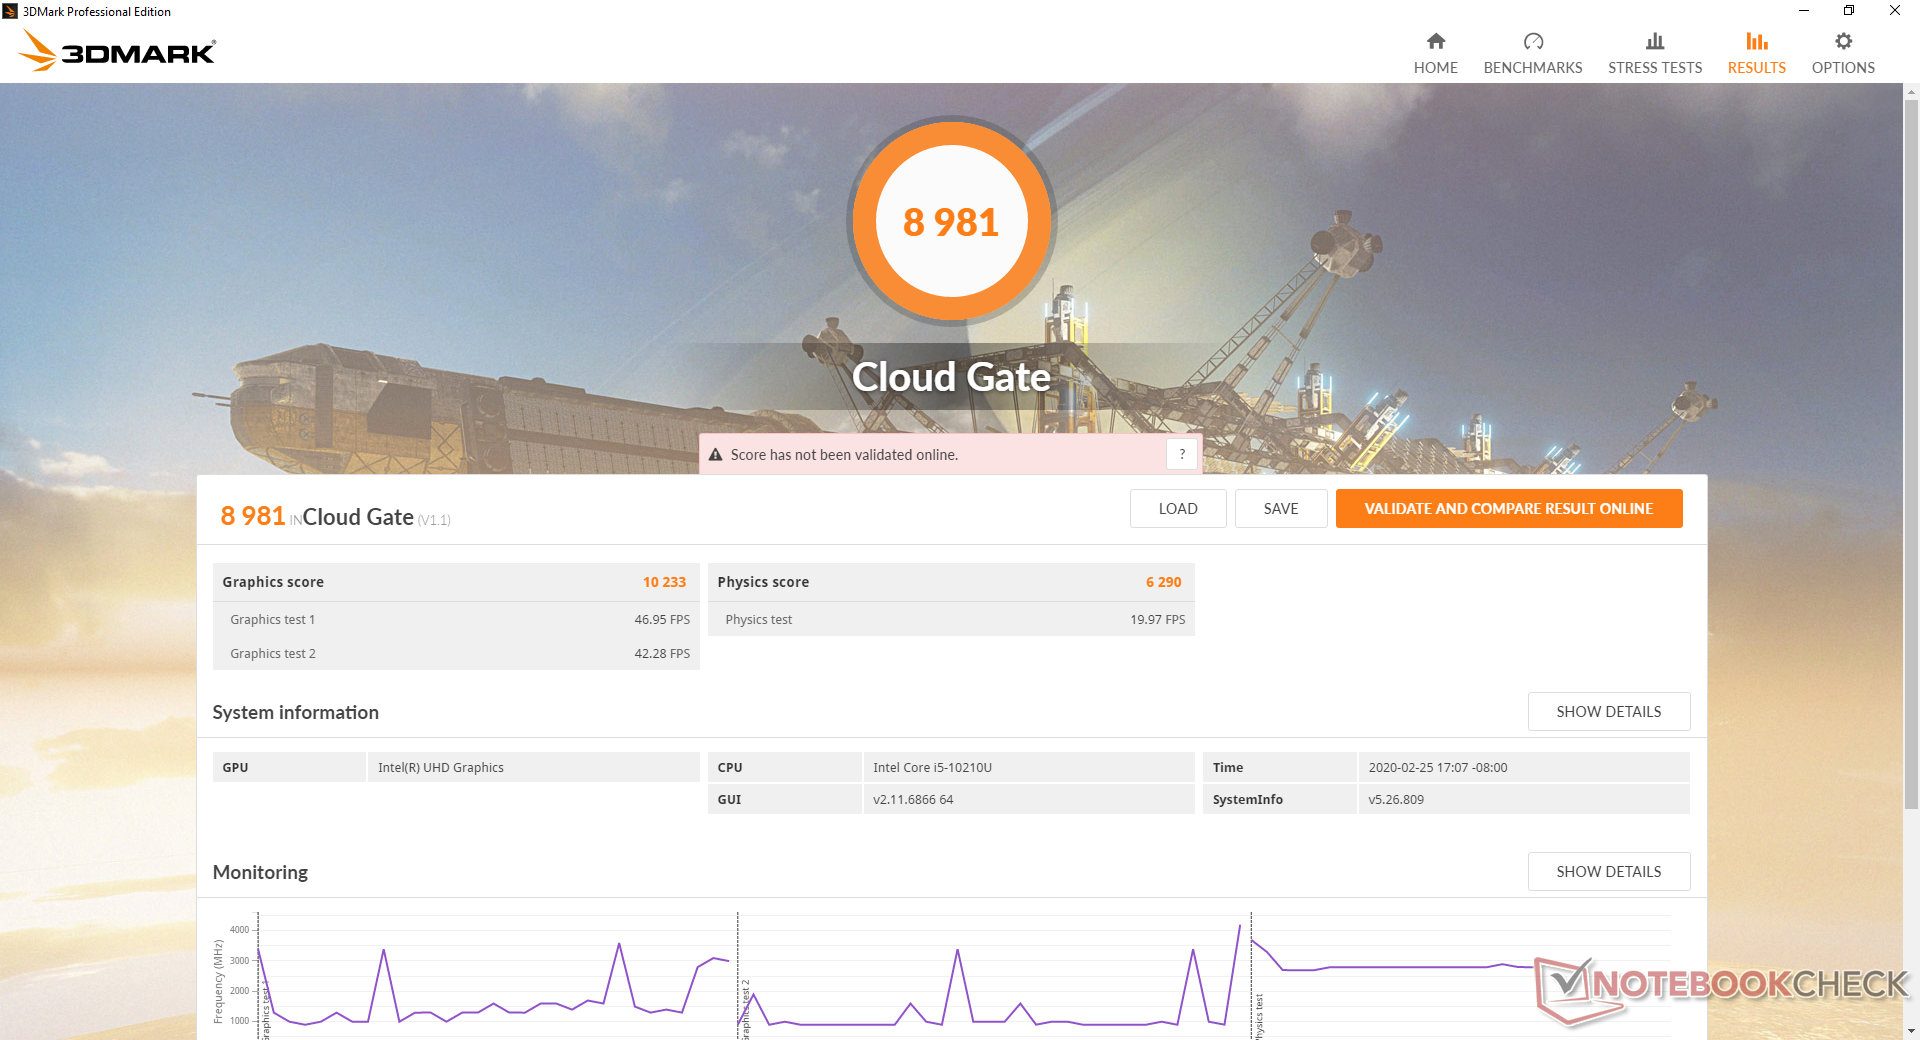
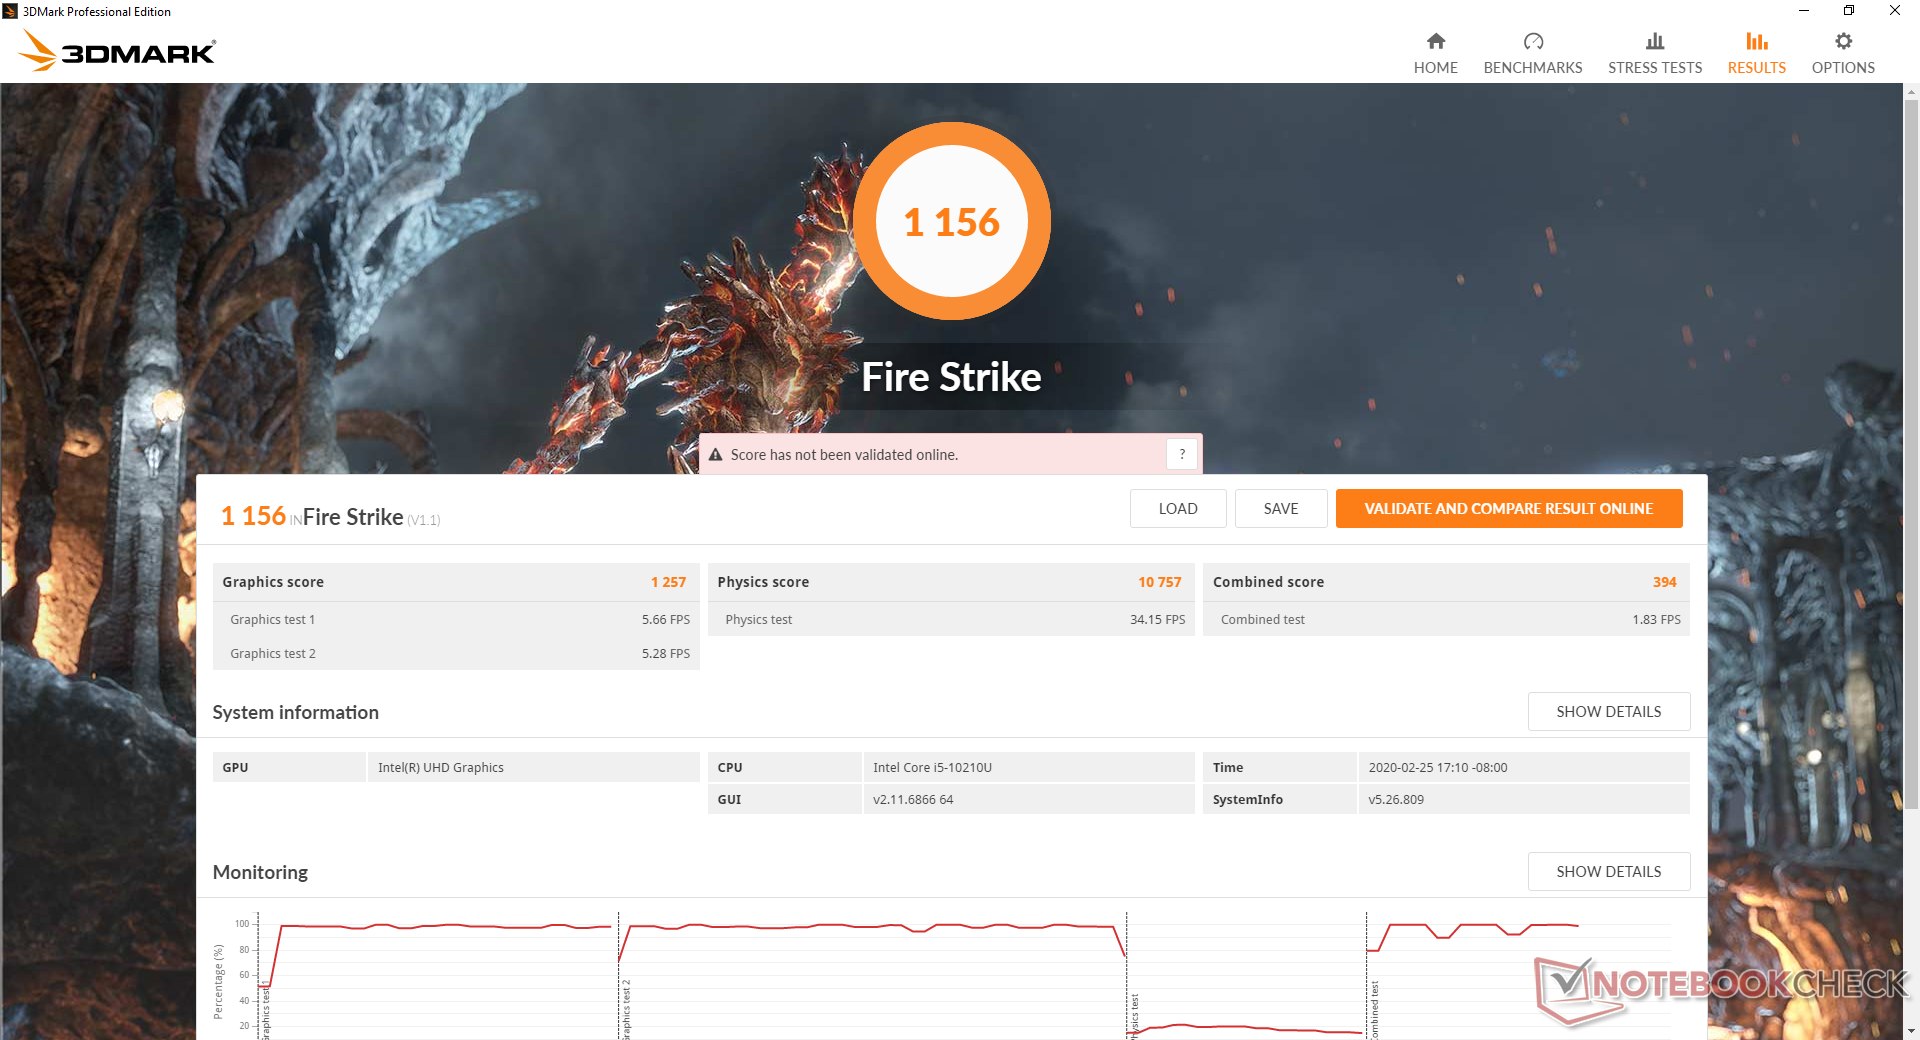
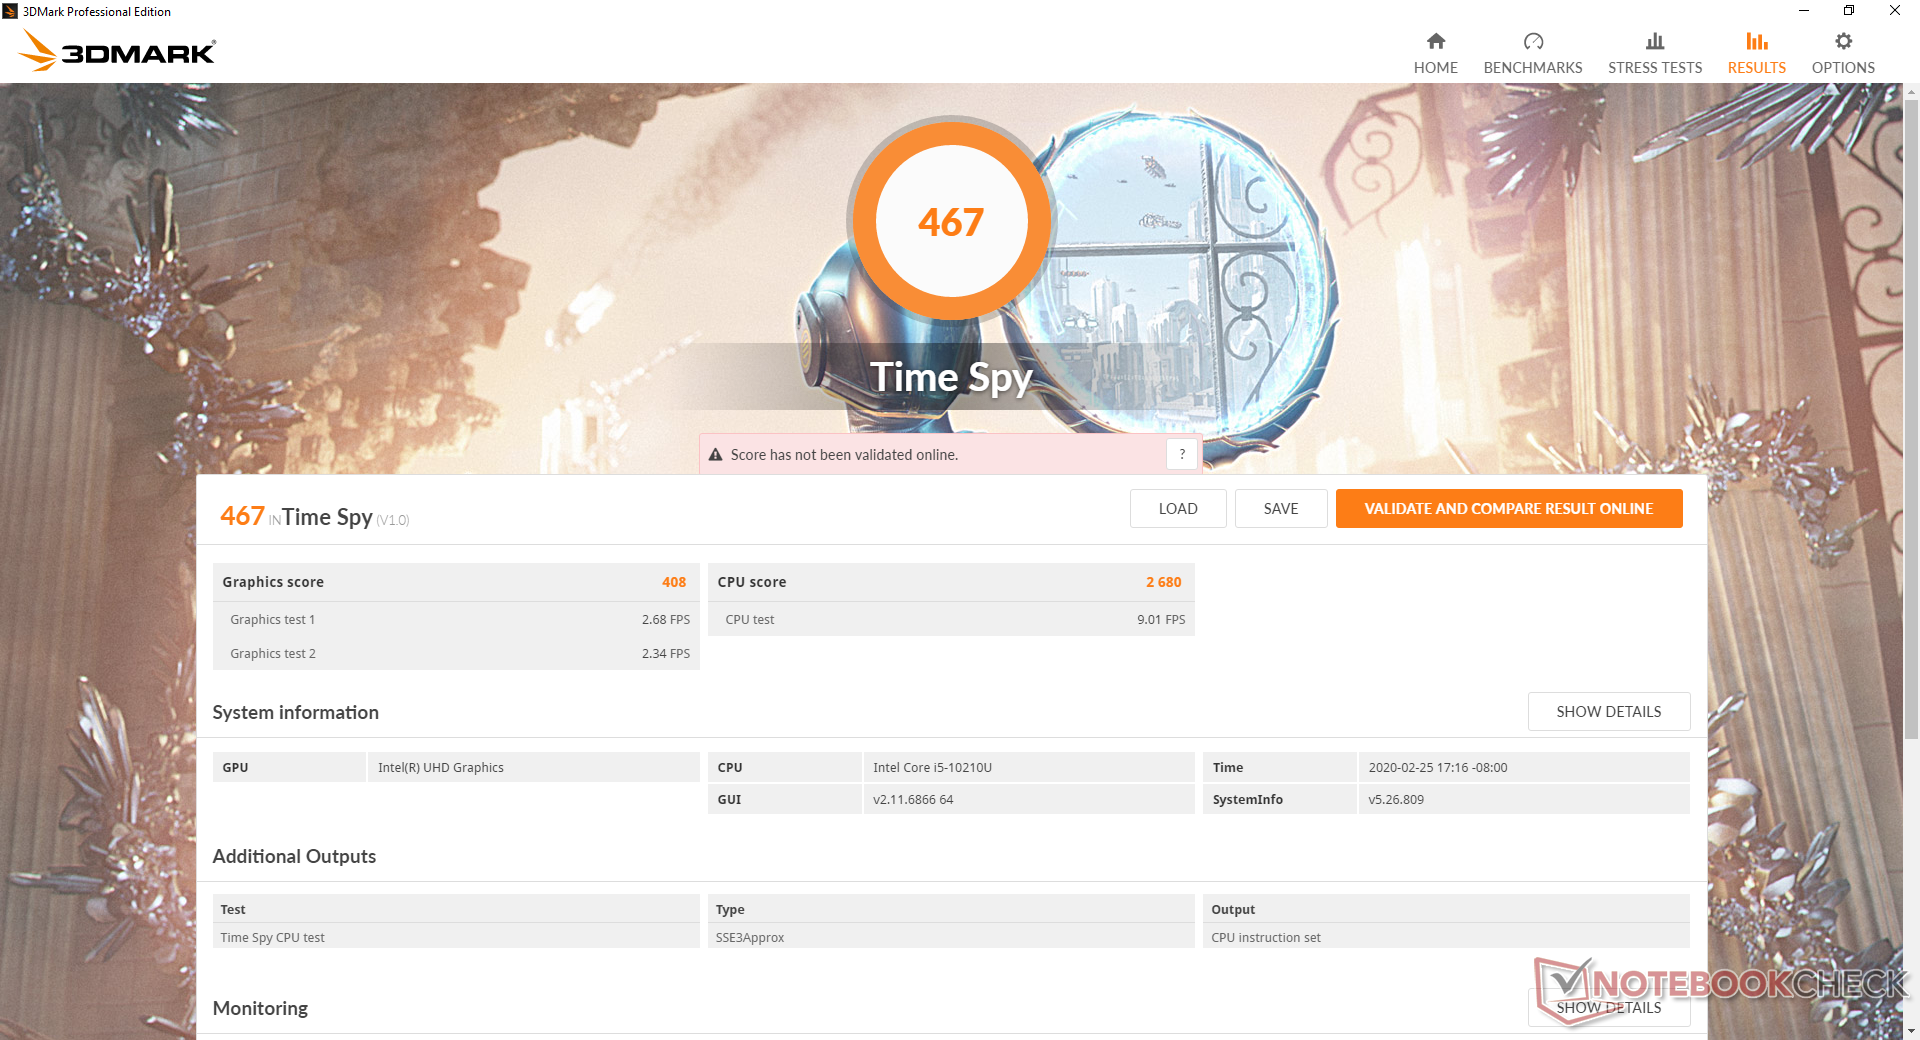
| 3DMark 11 Performance | 2047 points | |
| 3DMark Cloud Gate Standard Score | 8981 points | |
| 3DMark Fire Strike Score | 1156 points | |
| 3DMark Time Spy Score | 467 points | |
Help | ||
| low | med. | high | ultra | |
|---|---|---|---|---|
| BioShock Infinite (2013) | 75.6 | 38.2 | 31.8 | 10.5 |
| Rocket League (2017) | 70.4 | 33.6 | 20.6 | |
| Shadow of the Tomb Raider (2018) | 13 |
Emissions
System Noise
The cooling solution consists a single ~50 mm fan and a short copper heat pipe. Fan noise is quiet and essentially inaudible during low loads at up to 31 dB(A) against a background of 29 dB(A). Running the first benchmark scene of 3DMark 06 induces a fan noise of 32.6 dB(A) towards the end of the test to be comparable to what we recorded on the Yoga C940. Fan noise stabilizes at 39 dB(A) when running Prime95 for long periods.
Perhaps the worst aspect of the fan is that it is higher-pitched than most other Ultrabooks. Thus, fan noise is more noticeable when it begins to ramp up even though the system is generally quiet under most low to medium processing conditions.
We can notice no electronic noise or coil whine from our test unit.
| Lenovo Yoga C740-14IML UHD Graphics 620, i5-10210U, Samsung SSD PM981a MZVLB256HBHQ | Lenovo Yoga C940-14IIL 81Q9 Iris Plus Graphics G7 (Ice Lake 64 EU), i7-1065G7, Samsung PM981a MZVLB1T0HBLR | Dell XPS 13 7390 2-in-1 Core i3 UHD Graphics G1 (Ice Lake 32 EU), i3-1005G1, Toshiba BG4 KBG40ZPZ256G | Asus ZenBook Flip 14 UM462DA-AI023T Vega 10, R7 3700U | Microsoft Surface Laptop 3 13 Core i5-1035G7 Iris Plus Graphics G7 (Ice Lake 64 EU), i5-1035G7, SK hynix BC501 HFM256GDGTNG | HP Spectre x360 13-aw0013dx Iris Plus Graphics G7 (Ice Lake 64 EU), i7-1065G7, Intel Optane Memory H10 with Solid State Storage 32GB + 512GB HBRPEKNX0202A(L/H) | |
|---|---|---|---|---|---|---|
| Noise | 1% | 1% | -2% | 3% | 5% | |
| off / environment * (dB) | 29 | 28.5 2% | 28 3% | 30 -3% | 28.5 2% | 28.5 2% |
| Idle Minimum * (dB) | 29 | 28.5 2% | 28 3% | 30 -3% | 28.5 2% | 28.5 2% |
| Idle Average * (dB) | 29 | 28.5 2% | 28 3% | 30 -3% | 28.5 2% | 28.5 2% |
| Idle Maximum * (dB) | 29.7 | 29 2% | 28 6% | 30 -1% | 28.5 4% | 28.5 4% |
| Load Average * (dB) | 32.6 | 33 -1% | 31.7 3% | 34.2 -5% | 28.5 13% | 28.5 13% |
| Load Maximum * (dB) | 39 | 39.5 -1% | 43.5 -12% | 37.5 4% | 40.4 -4% | 35.3 9% |
| Witcher 3 ultra * (dB) | 40.7 | 40.4 | 35.3 |
* ... smaller is better
Noise level
| Idle |
| 29 / 29 / 29.7 dB(A) |
| Load |
| 32.6 / 39 dB(A) |
 | ||
30 dB silent 40 dB(A) audible 50 dB(A) loud |
||
min: | ||
Temperature
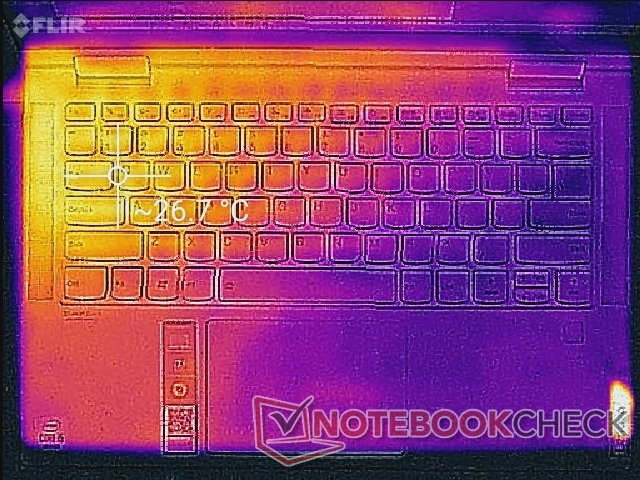
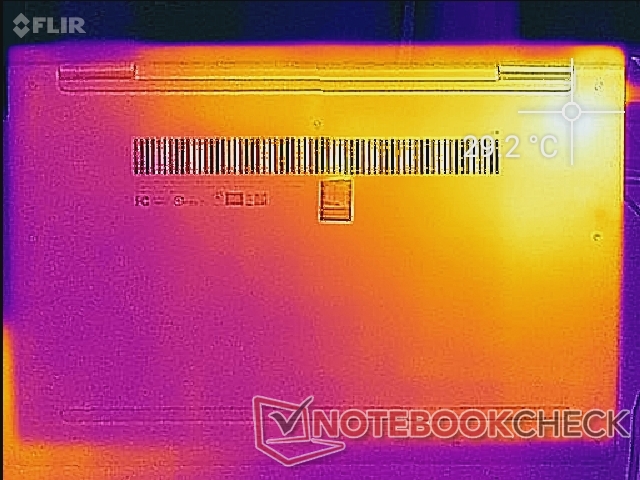
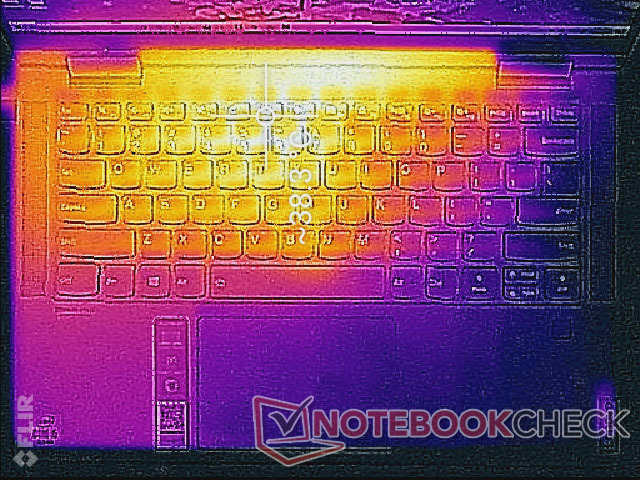
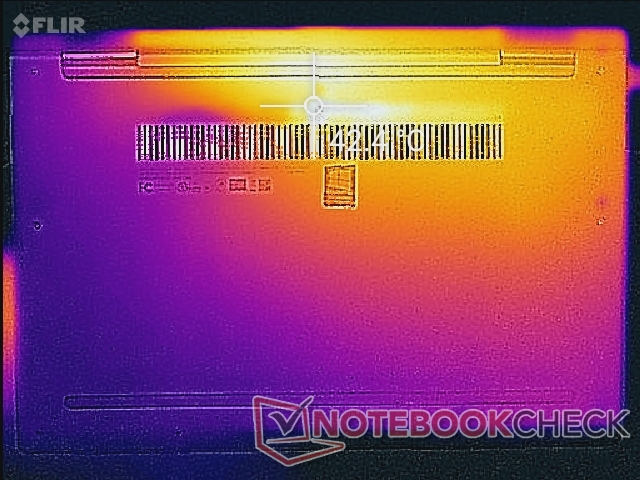
When idling, the left half of the system becomes warmer than the right half. We're able to measure a hot spot of about 29 C on the bottom of the laptop nearest the SSD and WLAN card. When running heavy loads, however, hot spots will shift to the center of the laptop due to the positioning of the processor. The new hot spots can be as warm as 38 C to 42 C compared to 43 C to 47 C on the thinner Yoga C940 or 46 C to 51 C on the XPS 13 7390 2-in-1. The palm rests and most of the keyboard remain cooler.
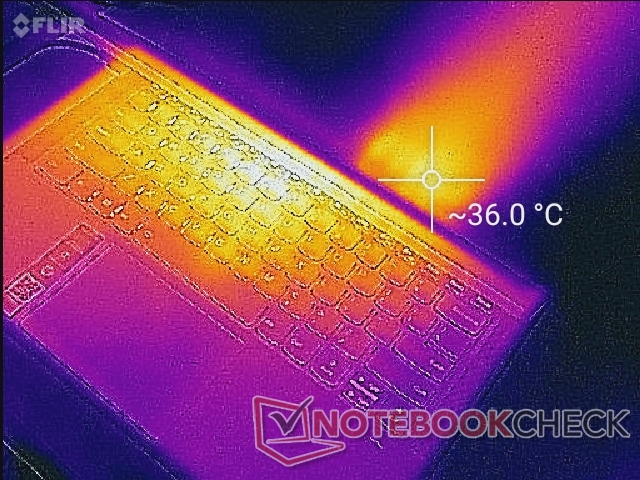
(+) The maximum temperature on the upper side is 38.6 °C / 101 F, compared to the average of 35.4 °C / 96 F, ranging from 19.6 to 60 °C for the class Convertible.
(±) The bottom heats up to a maximum of 42.6 °C / 109 F, compared to the average of 36.9 °C / 98 F
(+) In idle usage, the average temperature for the upper side is 25.2 °C / 77 F, compared to the device average of 30.3 °C / 87 F.
(+) The palmrests and touchpad are cooler than skin temperature with a maximum of 27.6 °C / 81.7 F and are therefore cool to the touch.
(±) The average temperature of the palmrest area of similar devices was 28 °C / 82.4 F (+0.4 °C / 0.7 F).
Stress Test
We stress the laptop with synthetic loads to identify for any potential throttling or stability issues. When running Prime95, the CPU can be observed boosting to 3.7 GHz for just a few seconds until hitting a core temperature of 97 C. Thereafter, clock rate and temperature drop to 2.8 GHz and 81 C, respectively, for just a few minutes. The CPU eventually stabilizes at 2.1 to 2.2 GHz and 72 C.
Running on battery power will not limit performance. A 3DMark 11 test on batteries returns a final score that is within 1 percent of what we recorded when on mains.
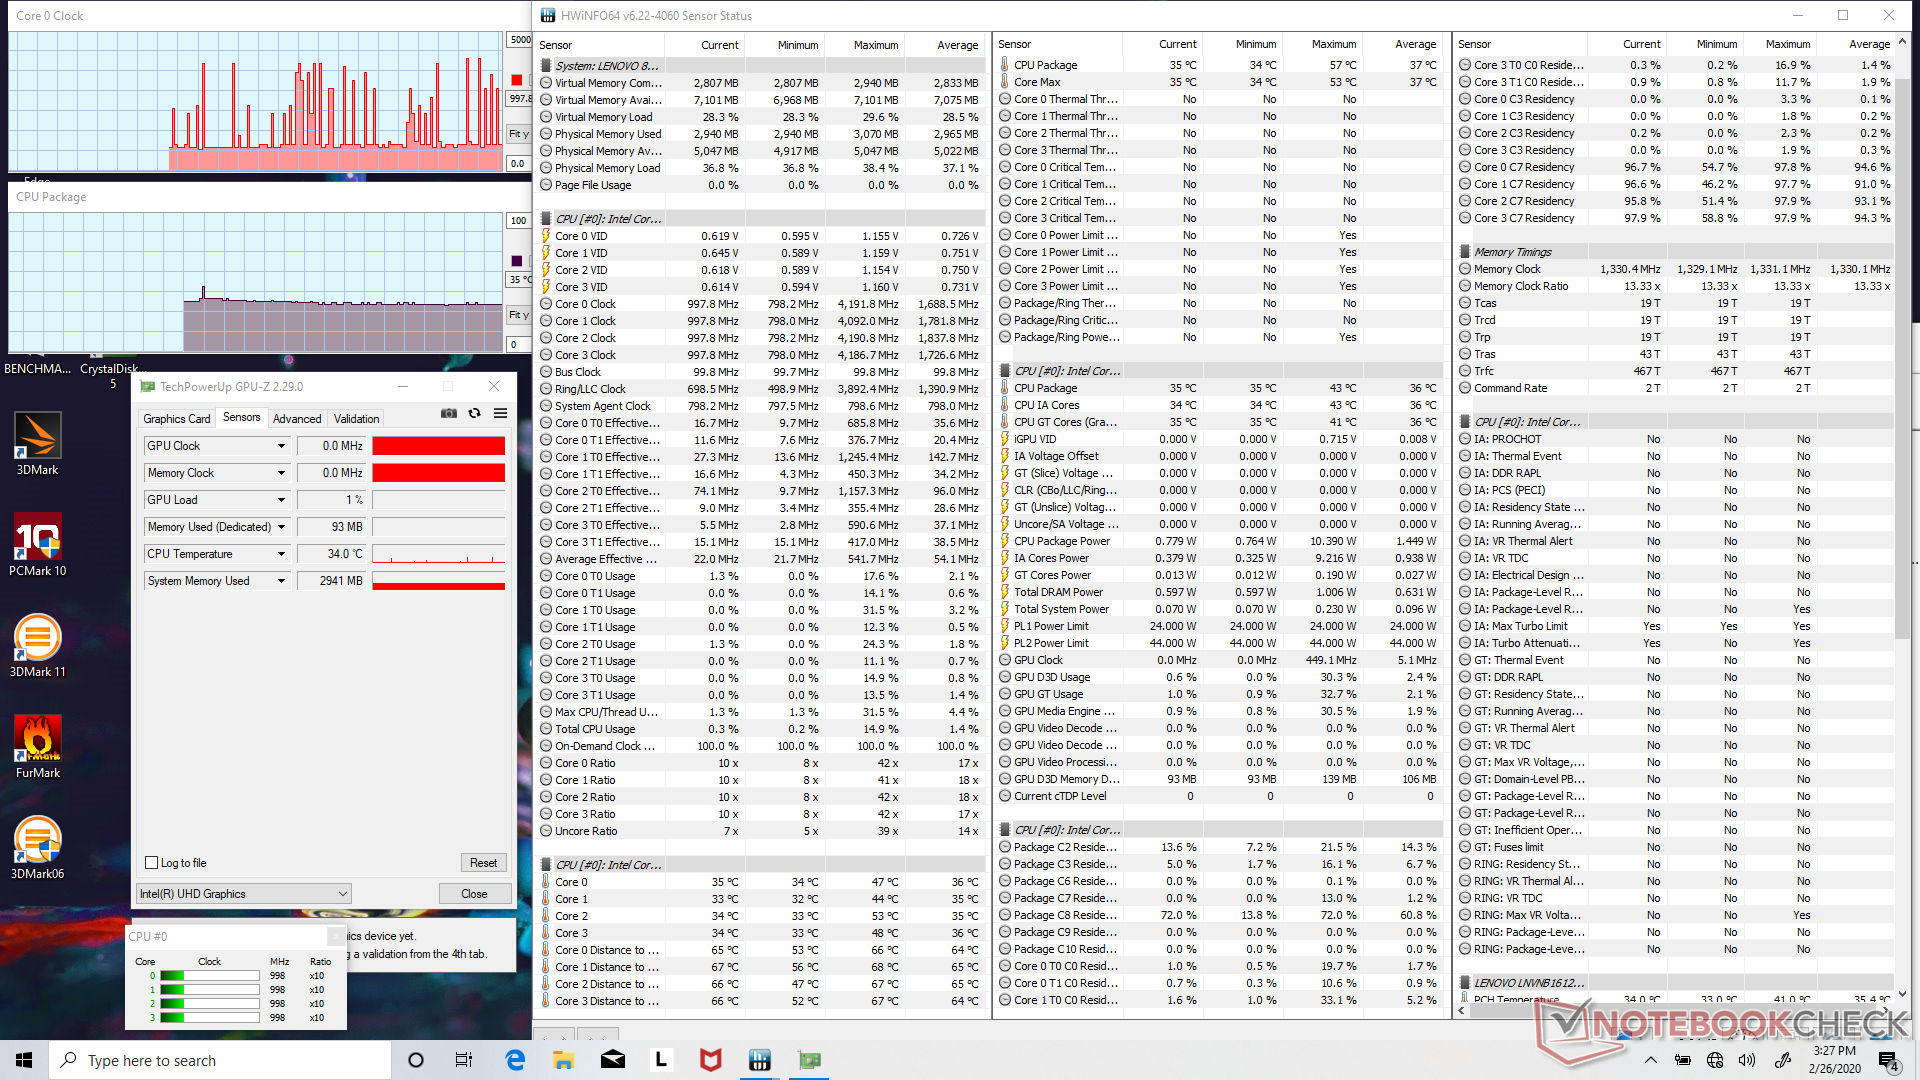
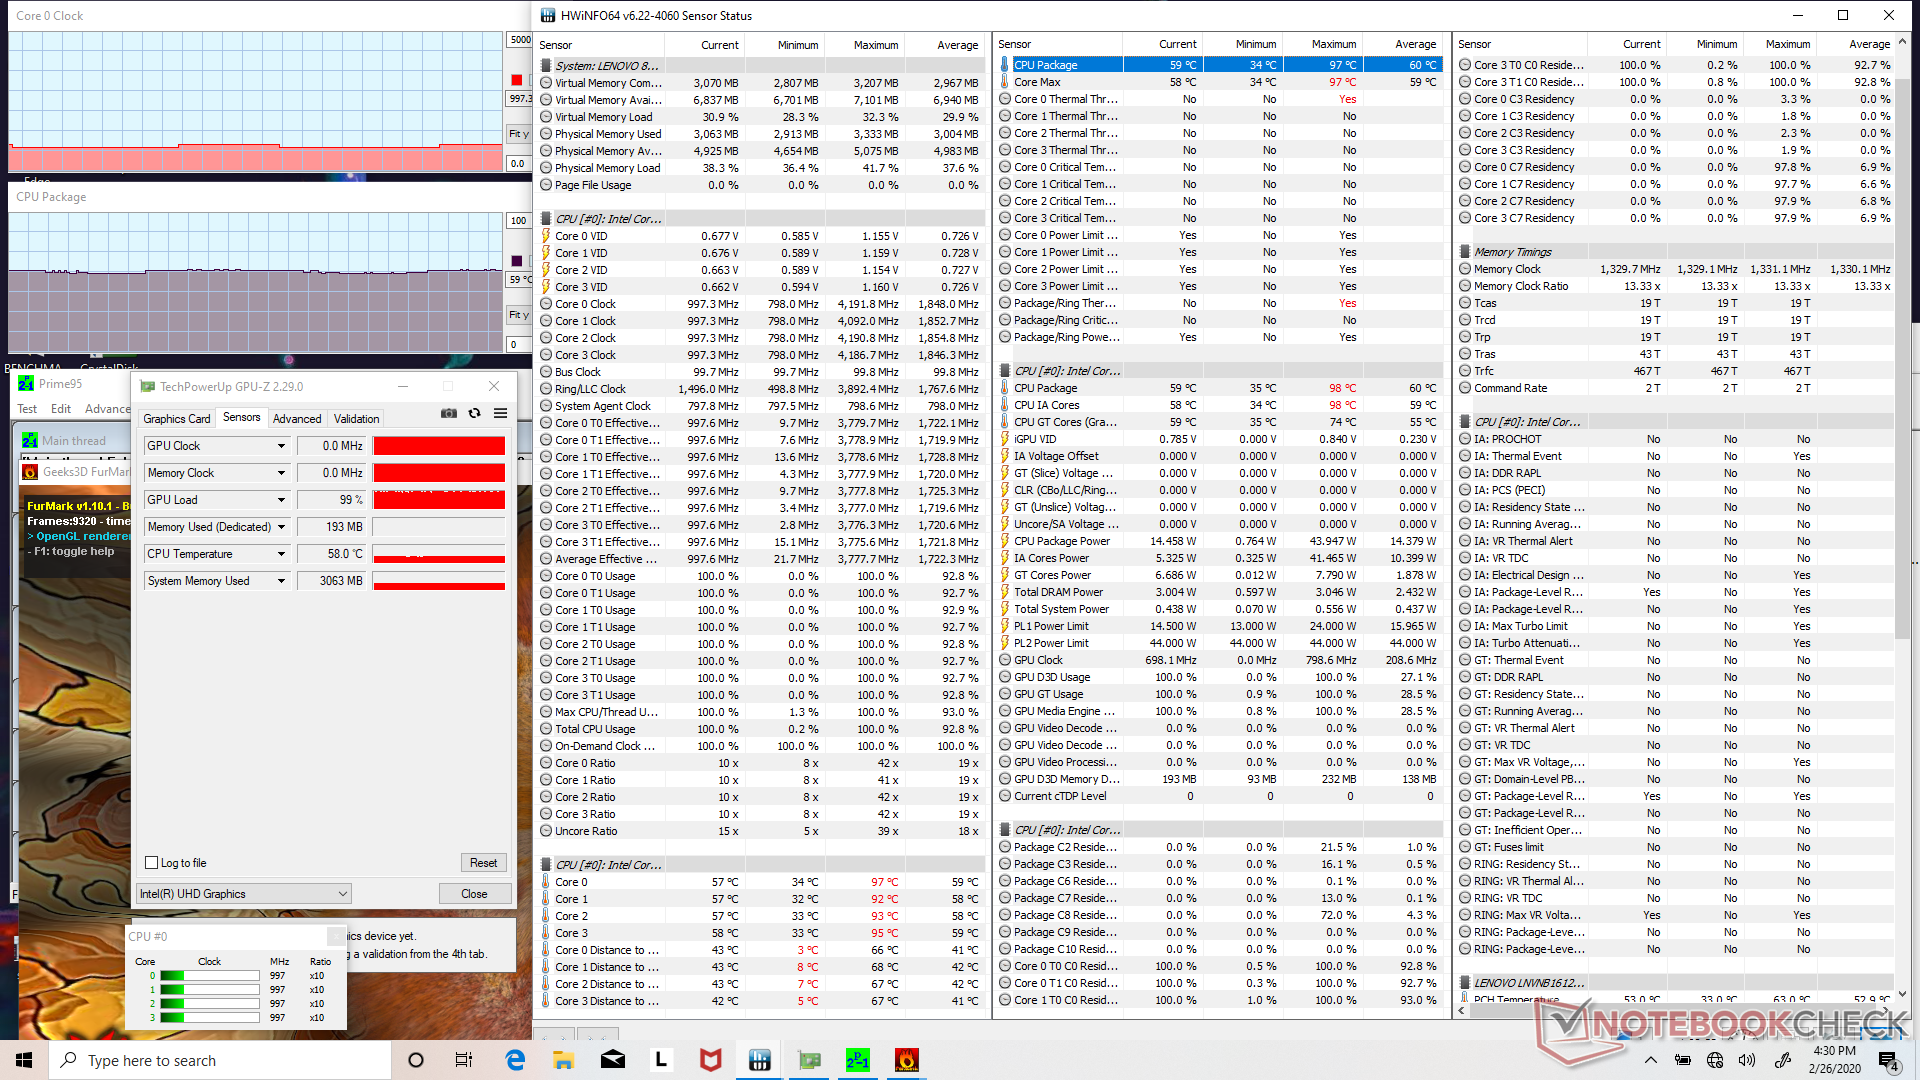
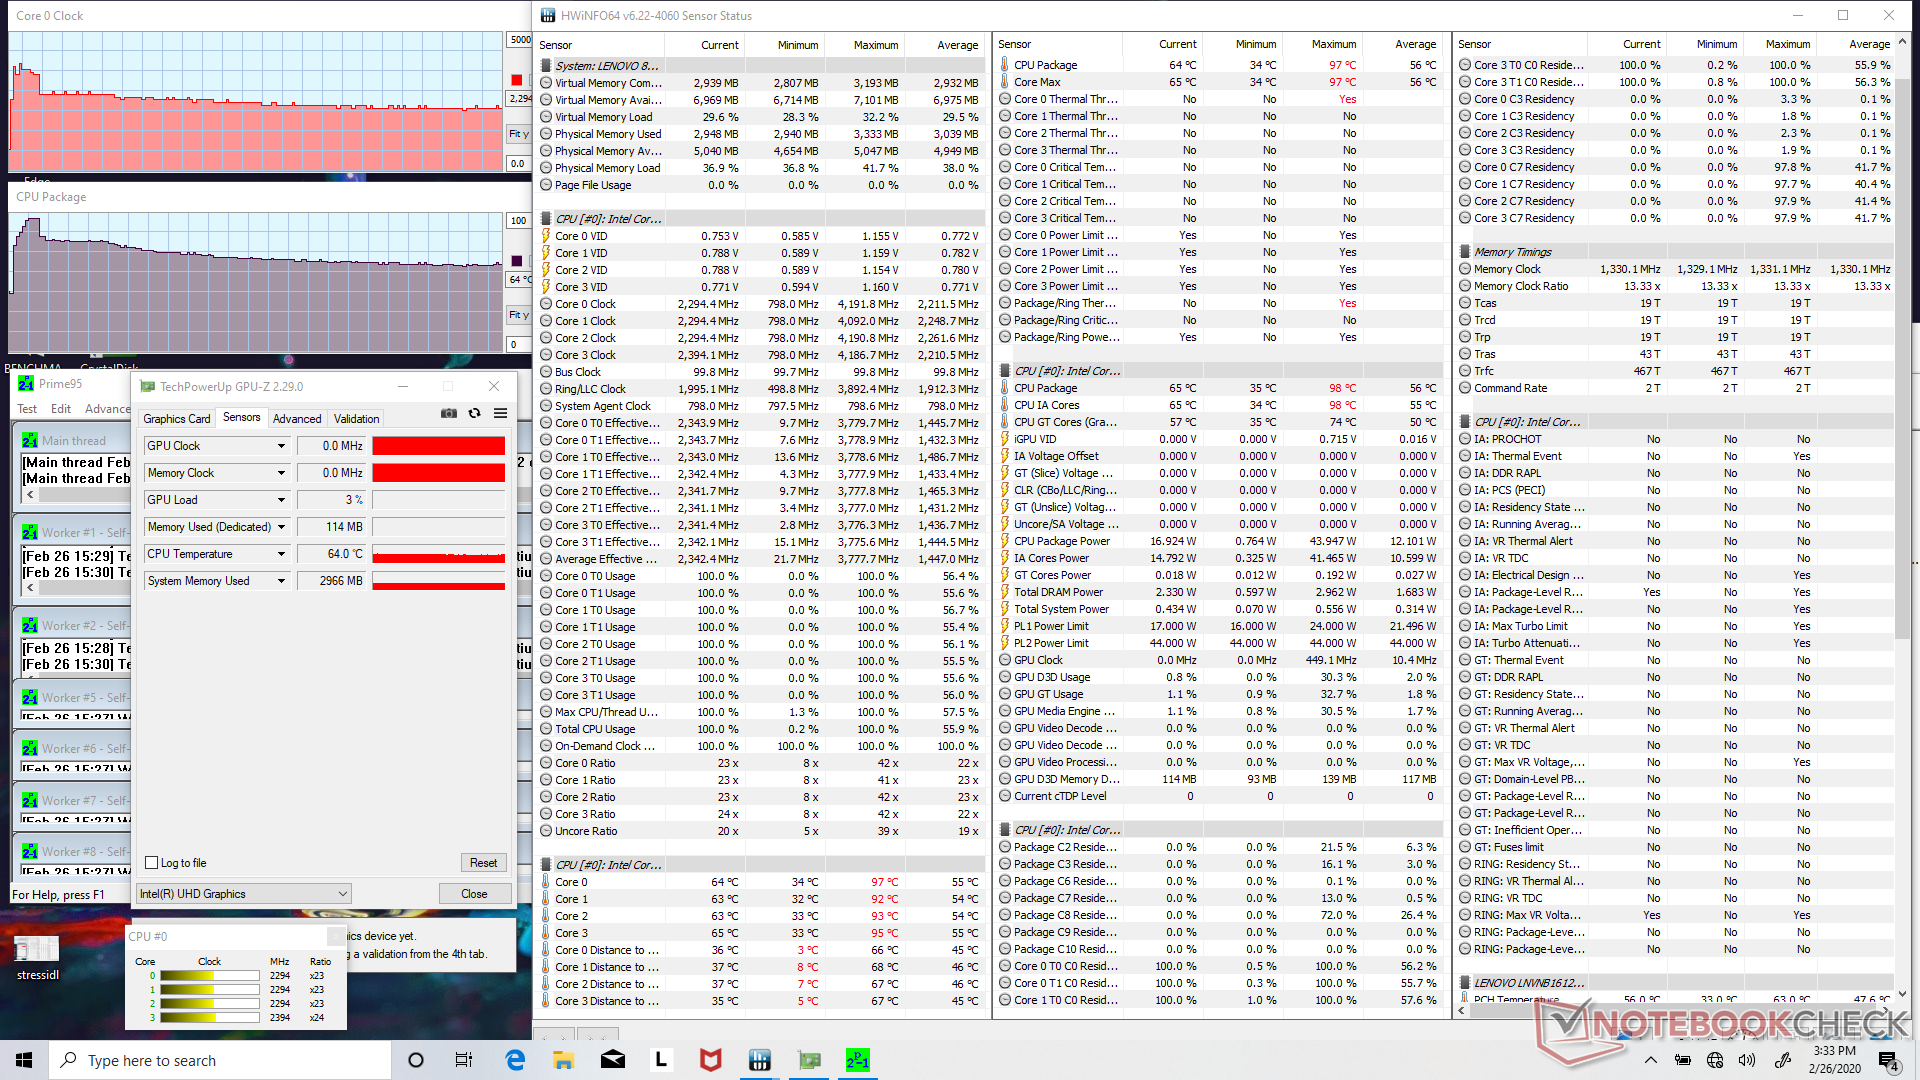
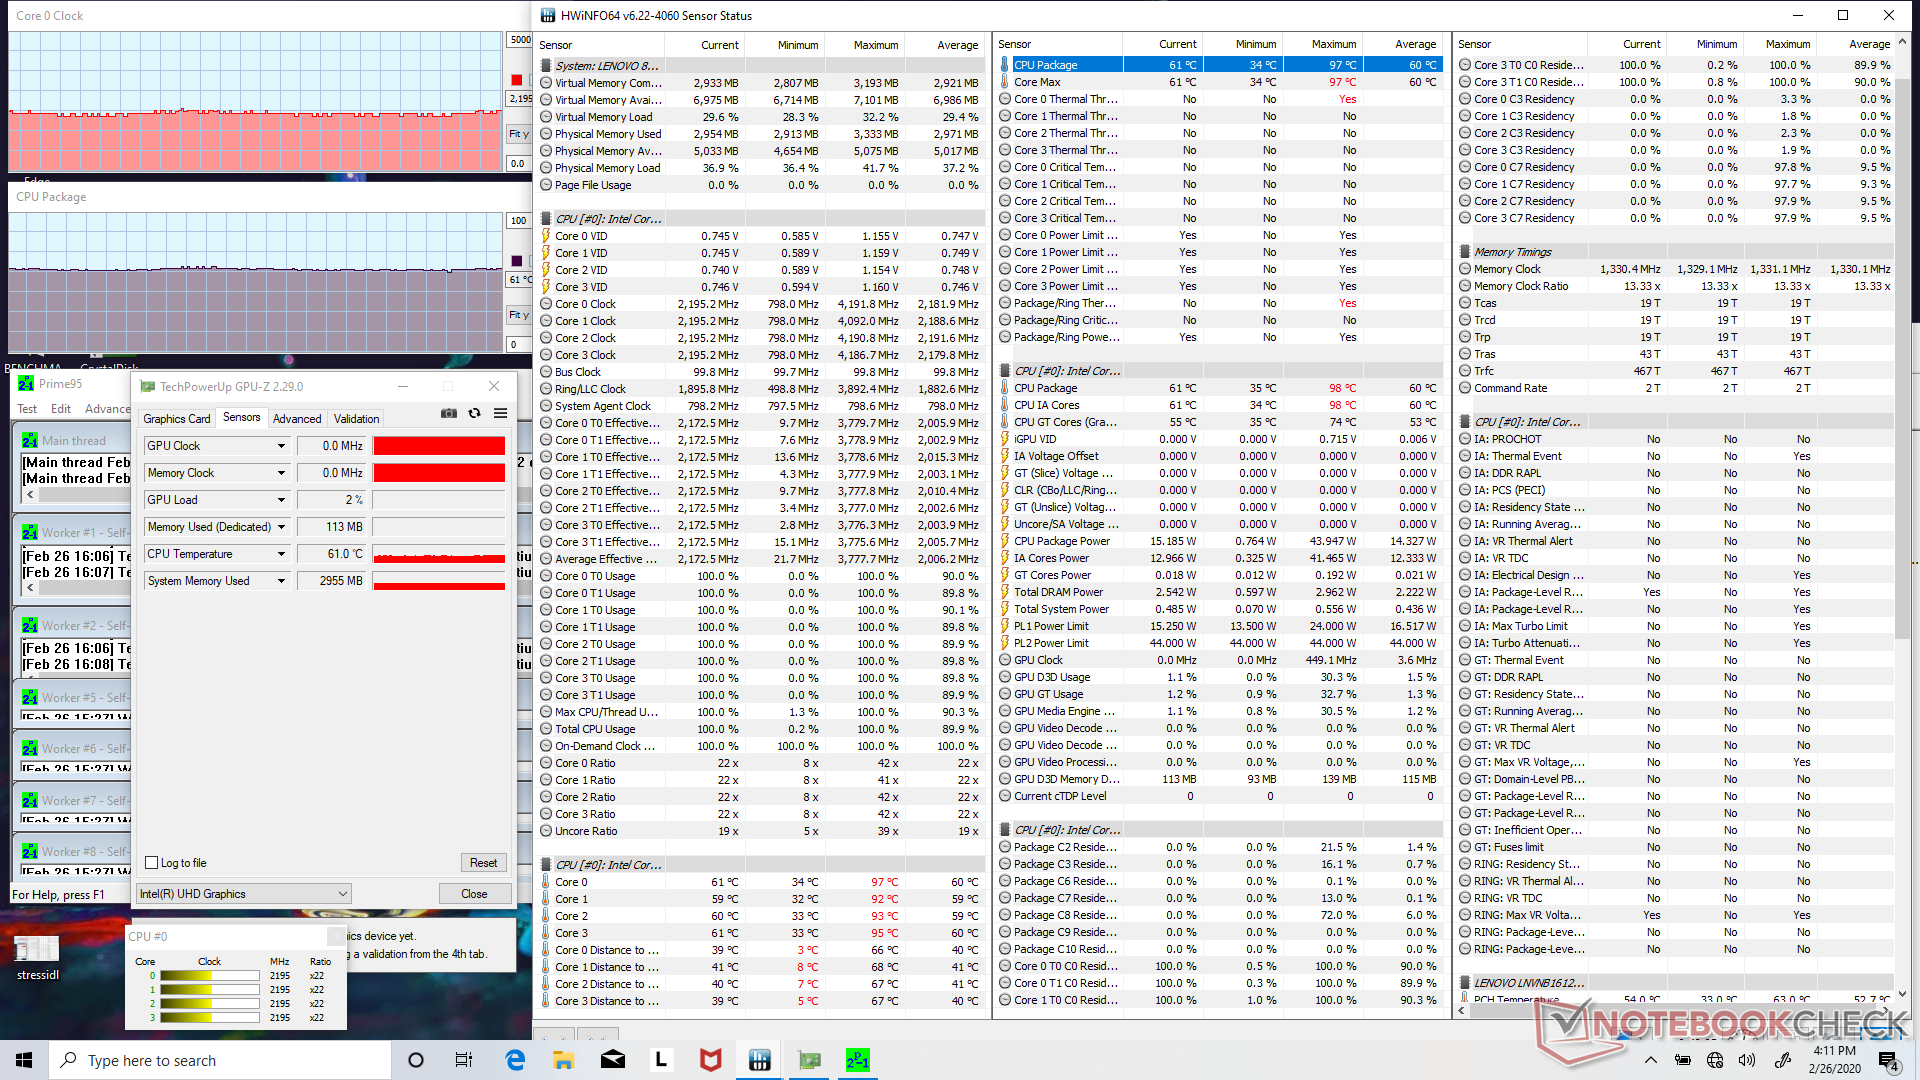
| CPU Clock (GHz) | GPU Clock (MHz) | Average CPU Temperature (°C) | |
| System Idle | -- | -- | 35 |
| Prime95 Stress | 2.1 - 2.2 | -- | 61 |
| Prime95 + FurMark Stress | 0.8 - 1.0 | -- | 59 |
Speakers
Audio quality is good for a 14-inch convertible but inferior to the speakers on the more expensive Yoga C940. Our pink noise measurements show the speakers of the Yoga C740 to be quieter with slightly less powerful bass. While high volume settings will not introduce any static, the palm rests will vibrate slightly to the touch.


Lenovo Yoga C740-14IML audio analysis
(+) | speakers can play relatively loud (82.6 dB)
Bass 100 - 315 Hz
(±) | reduced bass - on average 13.1% lower than median
(±) | linearity of bass is average (9.4% delta to prev. frequency)
Mids 400 - 2000 Hz
(+) | balanced mids - only 4.7% away from median
(±) | linearity of mids is average (7.2% delta to prev. frequency)
Highs 2 - 16 kHz
(+) | balanced highs - only 4.2% away from median
(+) | highs are linear (6.1% delta to prev. frequency)
Overall 100 - 16.000 Hz
(±) | linearity of overall sound is average (21.1% difference to median)
Compared to same class
» 56% of all tested devices in this class were better, 11% similar, 32% worse
» The best had a delta of 6%, average was 20%, worst was 57%
Compared to all devices tested
» 59% of all tested devices were better, 7% similar, 34% worse
» The best had a delta of 4%, average was 23%, worst was 134%
Apple MacBook 12 (Early 2016) 1.1 GHz audio analysis
(+) | speakers can play relatively loud (83.6 dB)
Bass 100 - 315 Hz
(±) | reduced bass - on average 11.3% lower than median
(±) | linearity of bass is average (14.2% delta to prev. frequency)
Mids 400 - 2000 Hz
(+) | balanced mids - only 2.4% away from median
(+) | mids are linear (5.5% delta to prev. frequency)
Highs 2 - 16 kHz
(+) | balanced highs - only 2% away from median
(+) | highs are linear (4.5% delta to prev. frequency)
Overall 100 - 16.000 Hz
(+) | overall sound is linear (10.2% difference to median)
Compared to same class
» 7% of all tested devices in this class were better, 2% similar, 90% worse
» The best had a delta of 5%, average was 18%, worst was 53%
Compared to all devices tested
» 5% of all tested devices were better, 1% similar, 94% worse
» The best had a delta of 4%, average was 23%, worst was 134%
Energy Management
Power Consumption
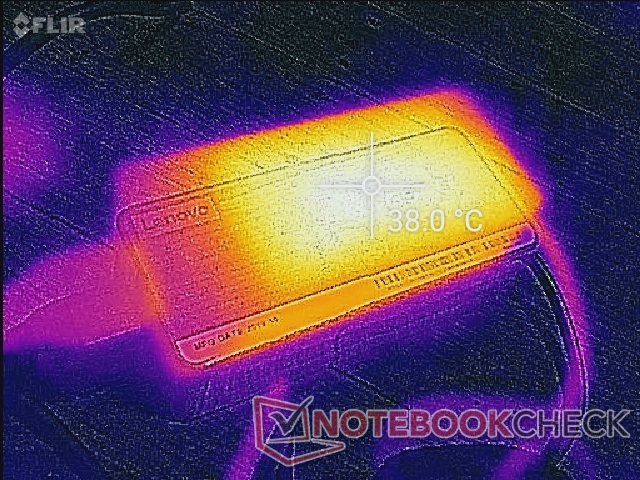
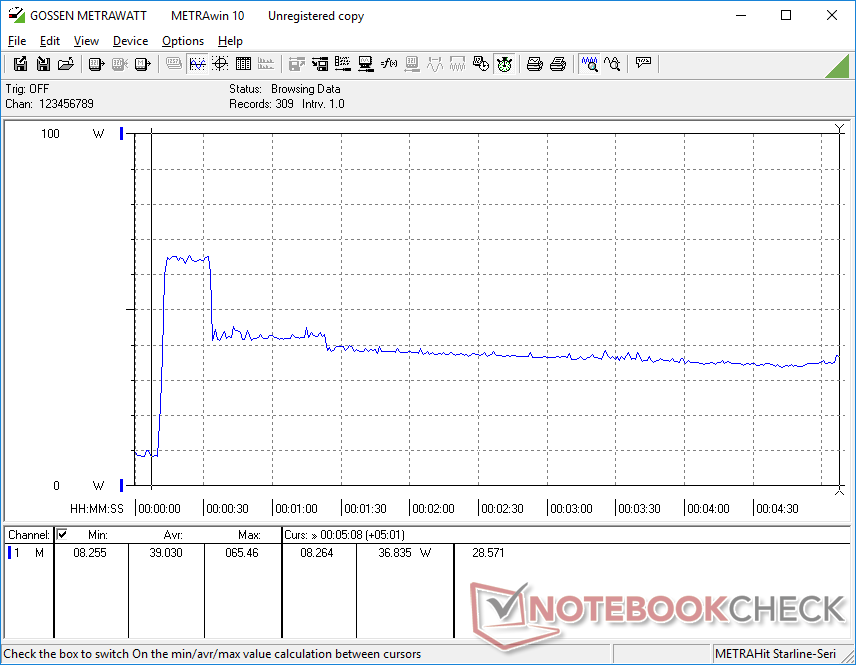
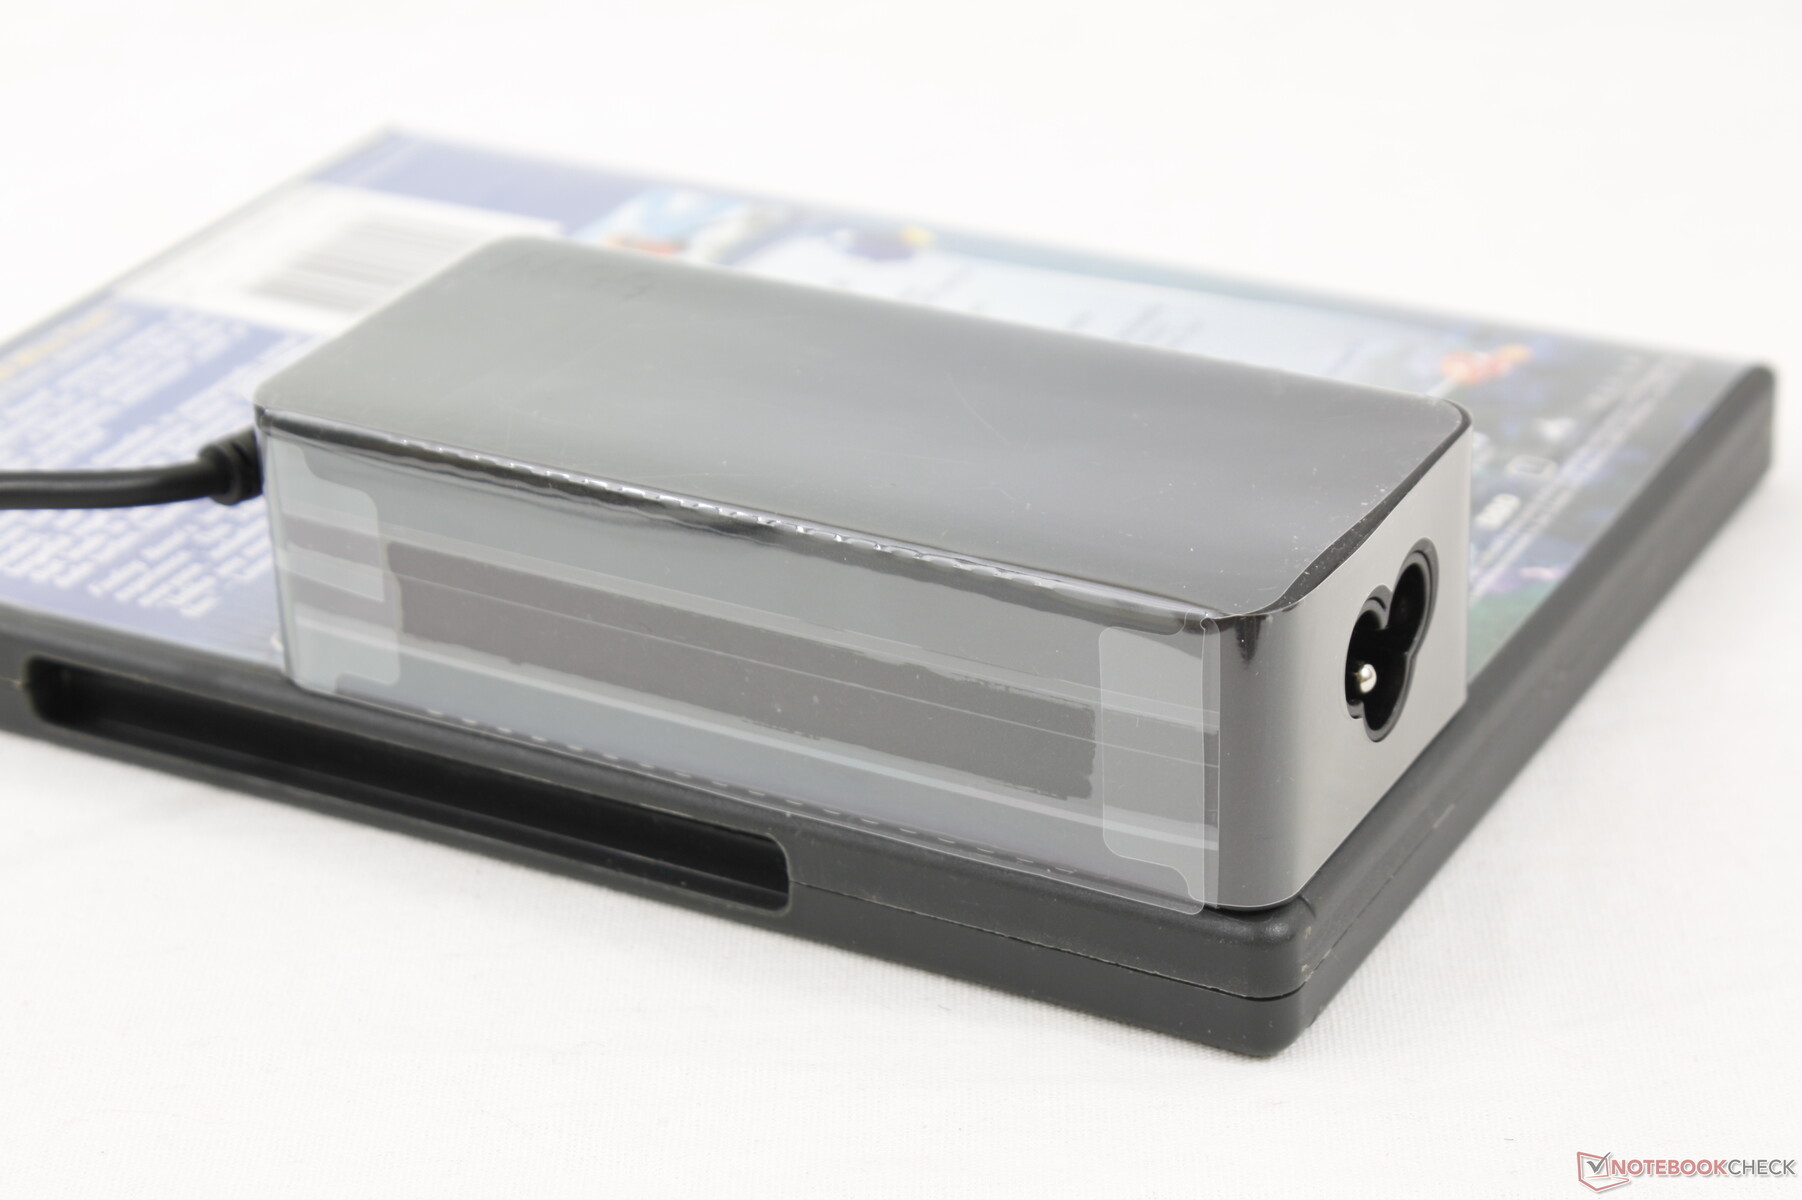
Idling on desktop demands between 3 W and 8 W depending on the brightness setting and power profile compared to 5 W and 12 W from the 4K UHD Yoga C940. We're able to record a temporary maximum of almost 66 W from the small (~11 x 4.8 x 3 cm) 65 W AC adapter when initiating Prime95 and FurMark. Expect consumption to be around 37 W to 42 W when running high sustained loads like gaming.


| Off / Standby | |
| Idle | |
| Load |
|
Key:
min: | |
| Lenovo Yoga C740-14IML i5-10210U, UHD Graphics 620, Samsung SSD PM981a MZVLB256HBHQ, IPS, 1920x1080, 14" | Lenovo Yoga C940-14IIL 81Q9 i7-1065G7, Iris Plus Graphics G7 (Ice Lake 64 EU), Samsung PM981a MZVLB1T0HBLR, IPS, 3840x2160, 14" | Dell XPS 13 7390 2-in-1 Core i3 i3-1005G1, UHD Graphics G1 (Ice Lake 32 EU), Toshiba BG4 KBG40ZPZ256G, IPS, 1920x1200, 13.4" | Asus ZenBook Flip 14 UM462DA-AI023T R7 3700U, Vega 10, , IPS, 1920x1080, 14" | Microsoft Surface Laptop 3 13 Core i5-1035G7 i5-1035G7, Iris Plus Graphics G7 (Ice Lake 64 EU), SK hynix BC501 HFM256GDGTNG, IPS, 2256x1504, 13.5" | Lenovo Yoga C740-15IML i7-10510U, UHD Graphics 620, Samsung SSD PM981 MZVLB512HAJQ, IPS LED, 1920x1080, 15.6" | |
|---|---|---|---|---|---|---|
| Power Consumption | -69% | 2% | -15% | -29% | -23% | |
| Idle Minimum * (Watt) | 3 | 5.6 -87% | 3 -0% | 3.7 -23% | 4.4 -47% | 2.97 1% |
| Idle Average * (Watt) | 3.9 | 10.5 -169% | 5.4 -38% | 6.9 -77% | 7.5 -92% | 7.2 -85% |
| Idle Maximum * (Watt) | 7.3 | 12 -64% | 7.3 -0% | 9.4 -29% | 7.8 -7% | 9.9 -36% |
| Load Average * (Watt) | 42.5 | 53.3 -25% | 33.4 21% | 34 20% | 41.9 1% | 40.8 4% |
| Load Maximum * (Watt) | 65.5 | 64.6 1% | 48.3 26% | 44 33% | 63.9 2% | 64.7 1% |
| Witcher 3 ultra * (Watt) | 46.9 | 40.8 |
* ... smaller is better
Battery Life
Battery capacity is smaller than on the Yoga C940 (60 Wh vs 51 Wh). Even so, runtimes are impressive at just over 9 hours of real-world WLAN use to be above average for its convertible category. Results are longer than what we recorded on the Yoga C940-14.
Charging from empty to full capacity takes 2 to 2.5 hours.
| Lenovo Yoga C740-14IML i5-10210U, UHD Graphics 620, 51 Wh | Lenovo Yoga C940-14IIL 81Q9 i7-1065G7, Iris Plus Graphics G7 (Ice Lake 64 EU), 60 Wh | Dell XPS 13 7390 2-in-1 Core i3 i3-1005G1, UHD Graphics G1 (Ice Lake 32 EU), 51 Wh | Asus ZenBook Flip 14 UM462DA-AI023T R7 3700U, Vega 10, 42 Wh | Microsoft Surface Laptop 3 13 Core i5-1035G7 i5-1035G7, Iris Plus Graphics G7 (Ice Lake 64 EU), 45 Wh | HP Spectre x360 13-aw0013dx i7-1065G7, Iris Plus Graphics G7 (Ice Lake 64 EU), 60 Wh | |
|---|---|---|---|---|---|---|
| Battery runtime | -21% | 39% | -18% | 29% | 55% | |
| Reader / Idle (h) | 18.6 | 35.7 92% | 34.4 85% | 37.1 99% | ||
| WiFi v1.3 (h) | 9.2 | 7.3 -21% | 8.9 -3% | 7.5 -18% | 8.3 -10% | 9.9 8% |
| Load (h) | 1.7 | 2.2 29% | 1.9 12% | 2.7 59% |
Pros
Cons
Verdict
Lenovo has positioned the Yoga C740-14 quite well in the current market. It's hundreds of dollars less than both the Dell XPS 13 7390 2-in-1 and Asus ZenBook Flip 14 when configured with the same RAM and storage capacities while offering a larger screen size than the HP Spectre x360 13. Best of all, the Yoga C740 retains a high quality look and feel that most users have come to expect from a flagship model even though it retailers for well under a grand. It's a great in-between option if you don't care about 4K, Thunderbolt 3, or Ice Lake features.
There is still a list of drawbacks that add up. The moderate uneven backlight bleeding, relatively dim display, poorly calibrated colors out of the box, spongy keyboard keys, and high-pitched fan noise when under load make the overall experience not as solid as it could have been. Still, it's a well-rounded convertible given the price point and it's definitely worth the extra investment over something like the horrid HP Pavilion x360 or cheap VivoBook Flip.
The Lenovo Yoga C740-14 is one of the better convertible laptops in its mid-range category because it looks and feels closer to the pricier high-end models without costing any more.
Lenovo Yoga C740-14IML
- 03/03/2020 v7 (old)
Allen Ngo
Price comparison
