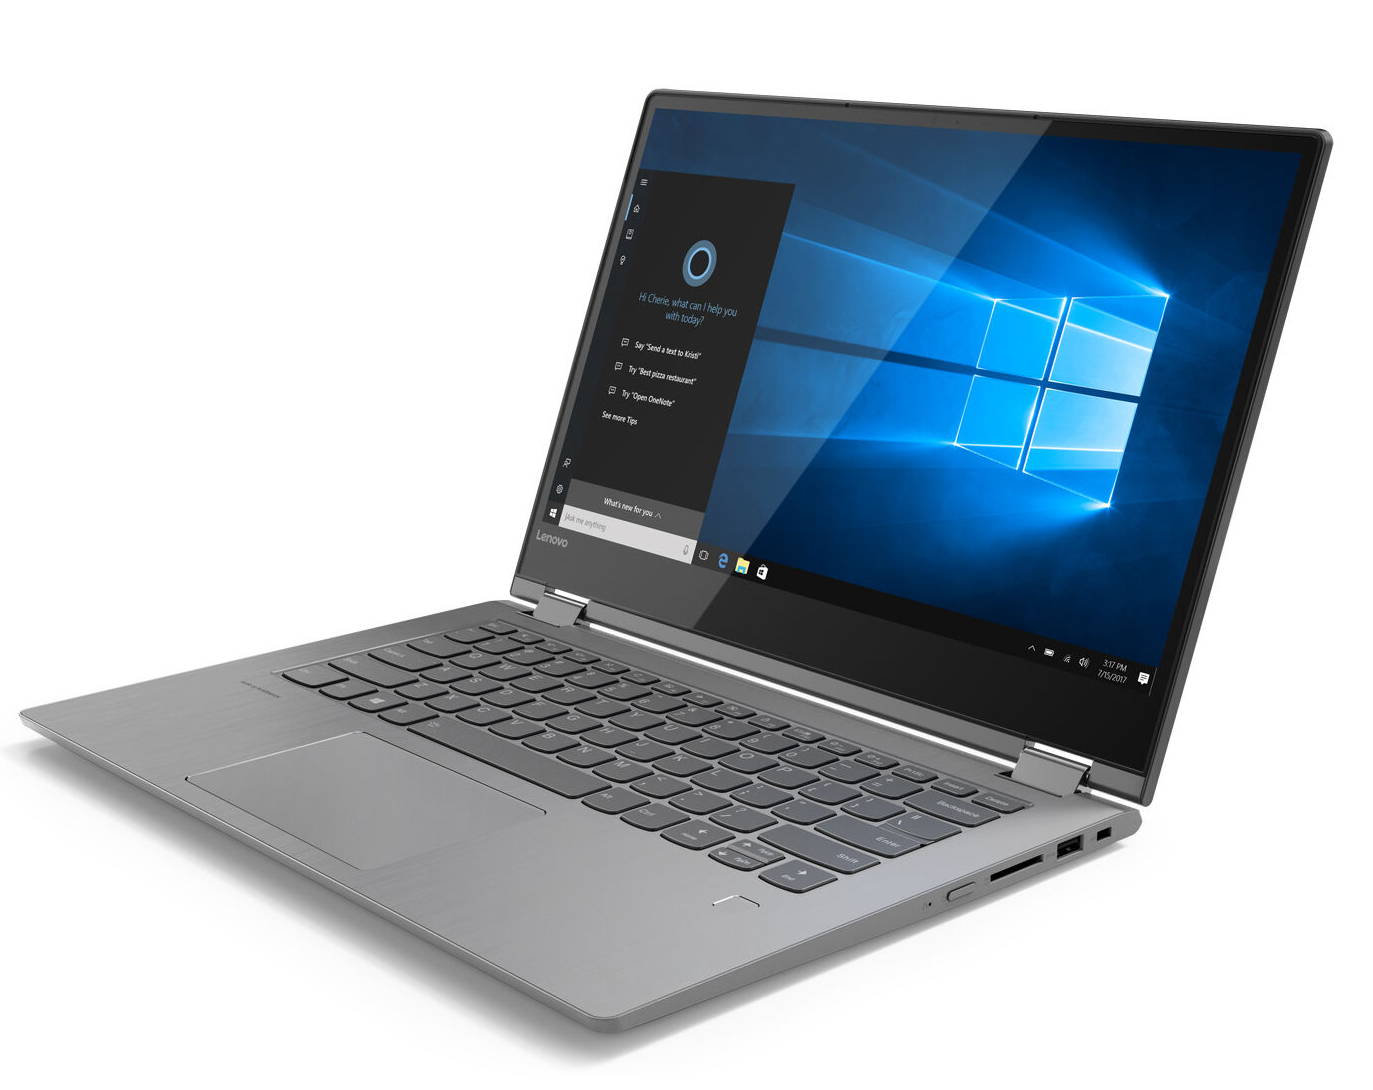
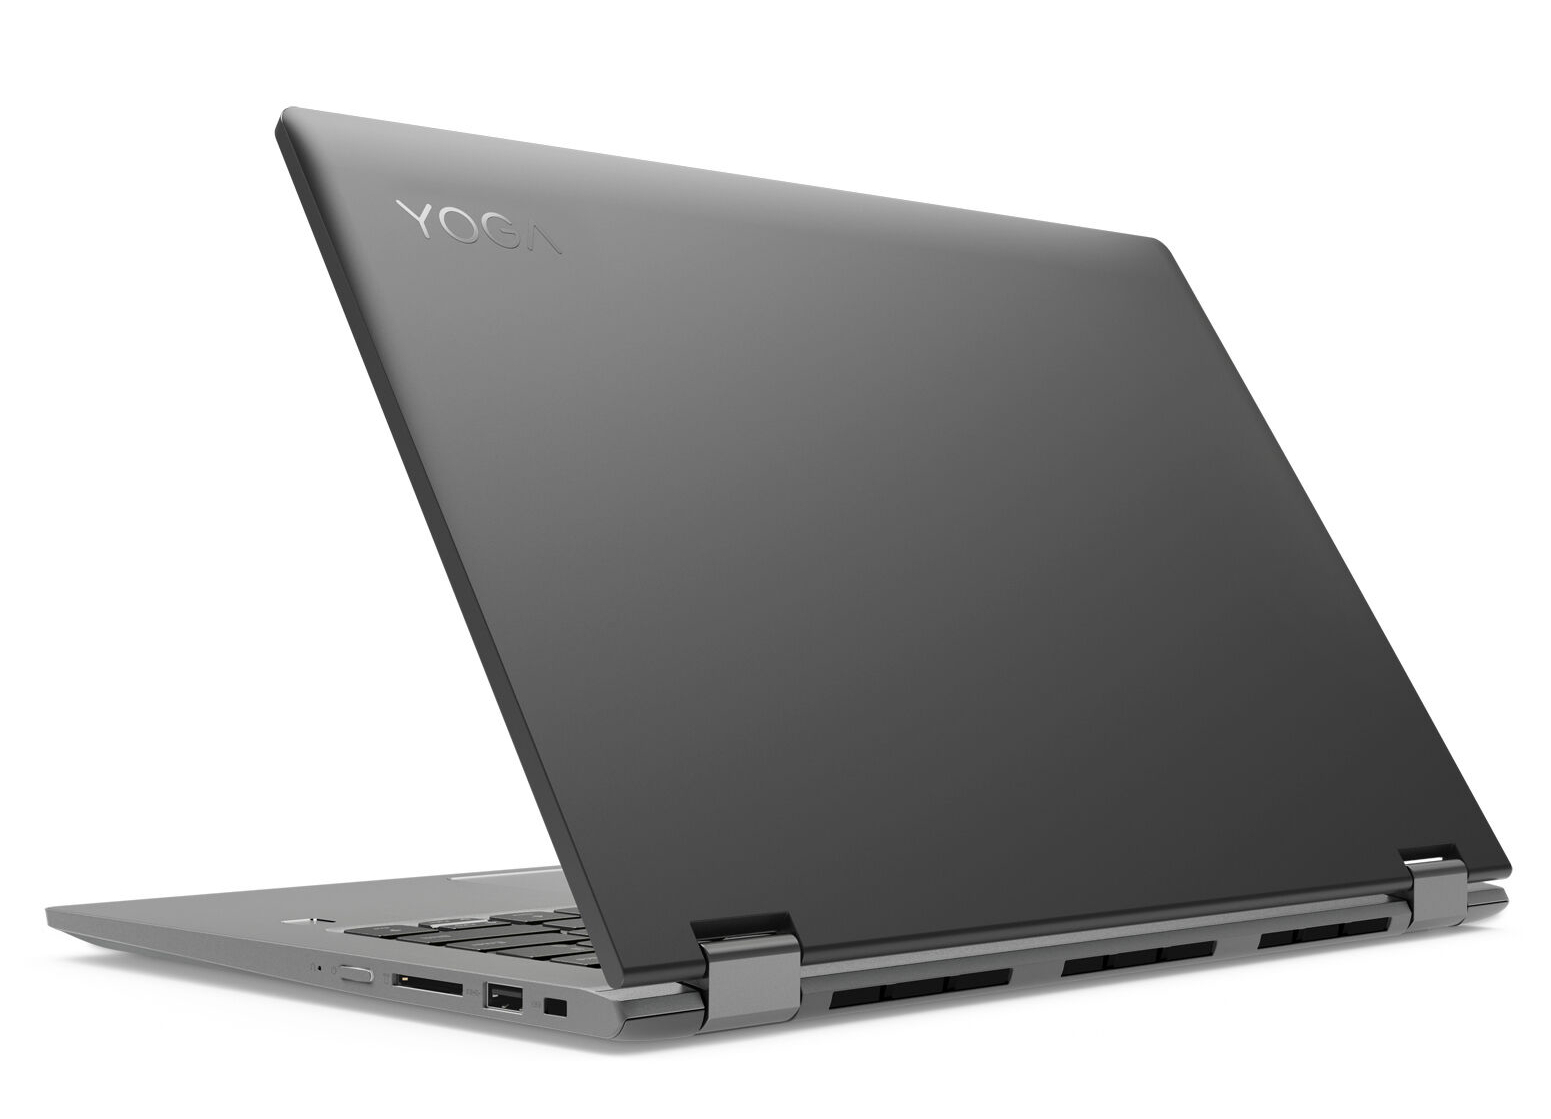
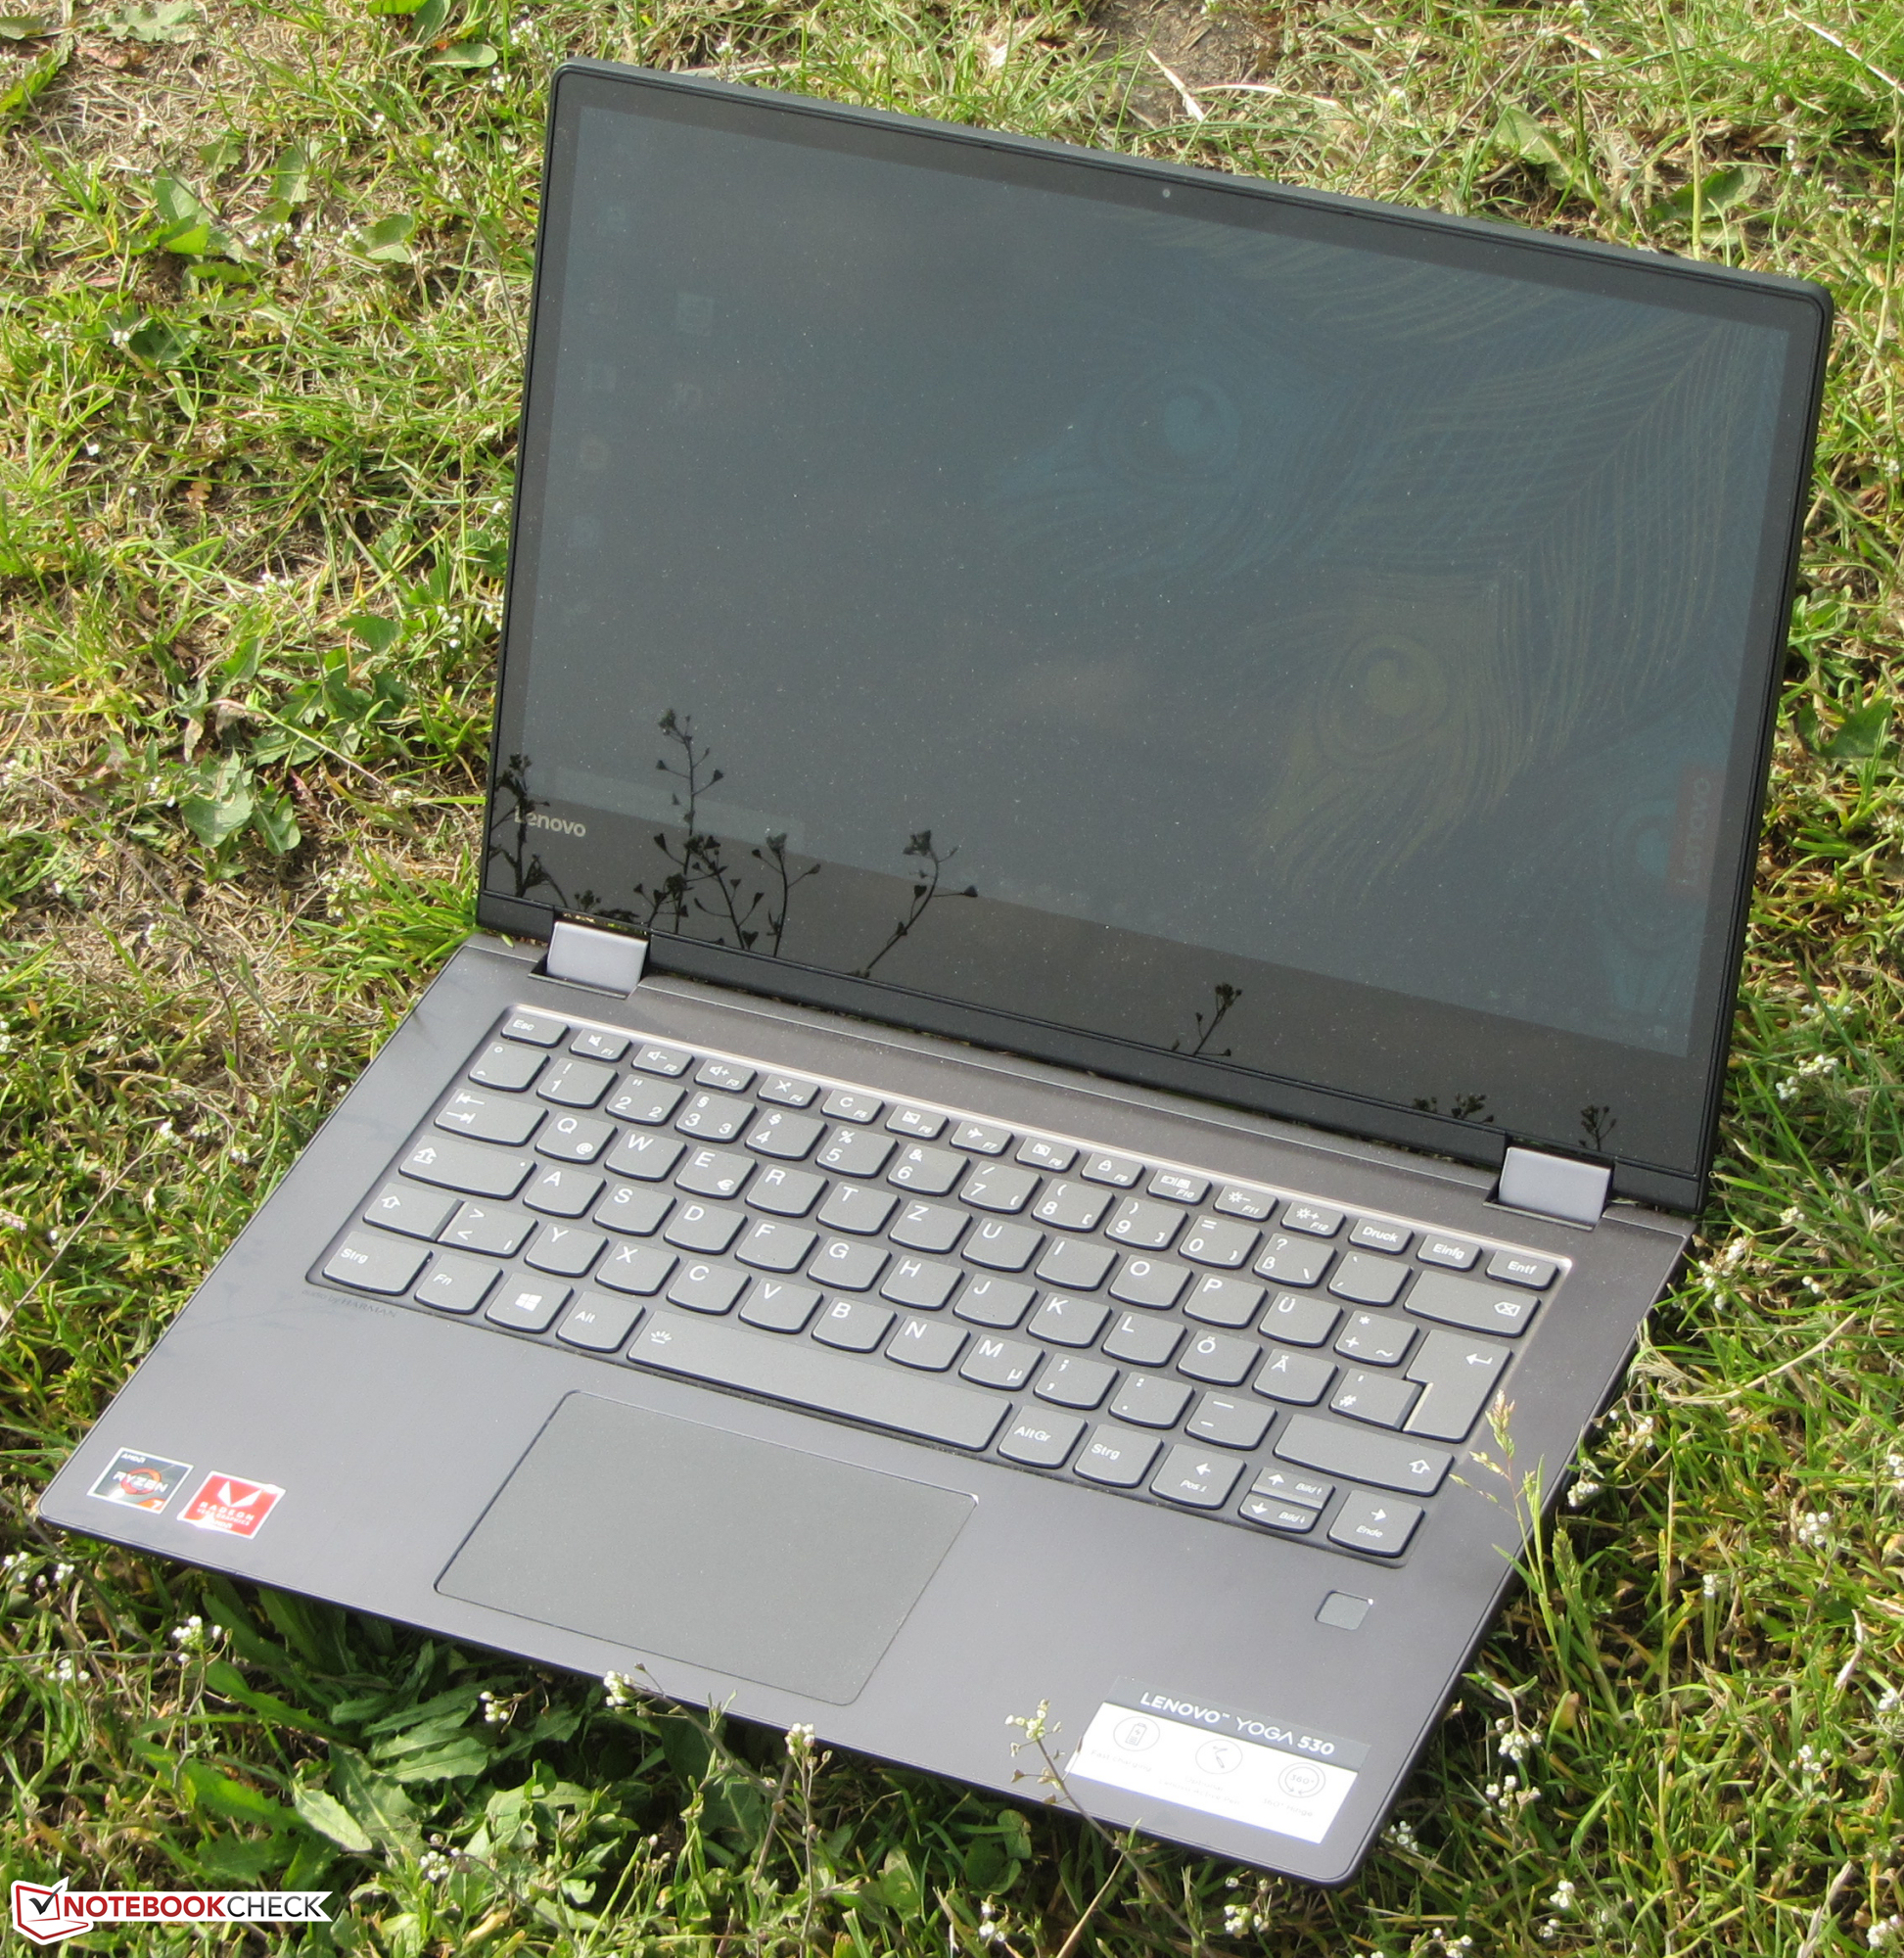
Lenovo Yoga 530-14ARR (Ryzen 7 2700U, RX Vega 10, SSD, FHD) Convertible Review

Lenovo’s Yoga 530-14ARR is a slim and compact 14-inch Windows convertible powered by a Ryzen 7 2700U APU. We already had its Intel-equipped sibling, the Yoga 530-14IKB, in review a while ago. Its main competitors are the HP Pavilion x360 14, Dell Inspiron 14 5482 2-in-1, Asus VivoBook Flip 14 TP412UA, and Acer Spin 3 SP314-51.
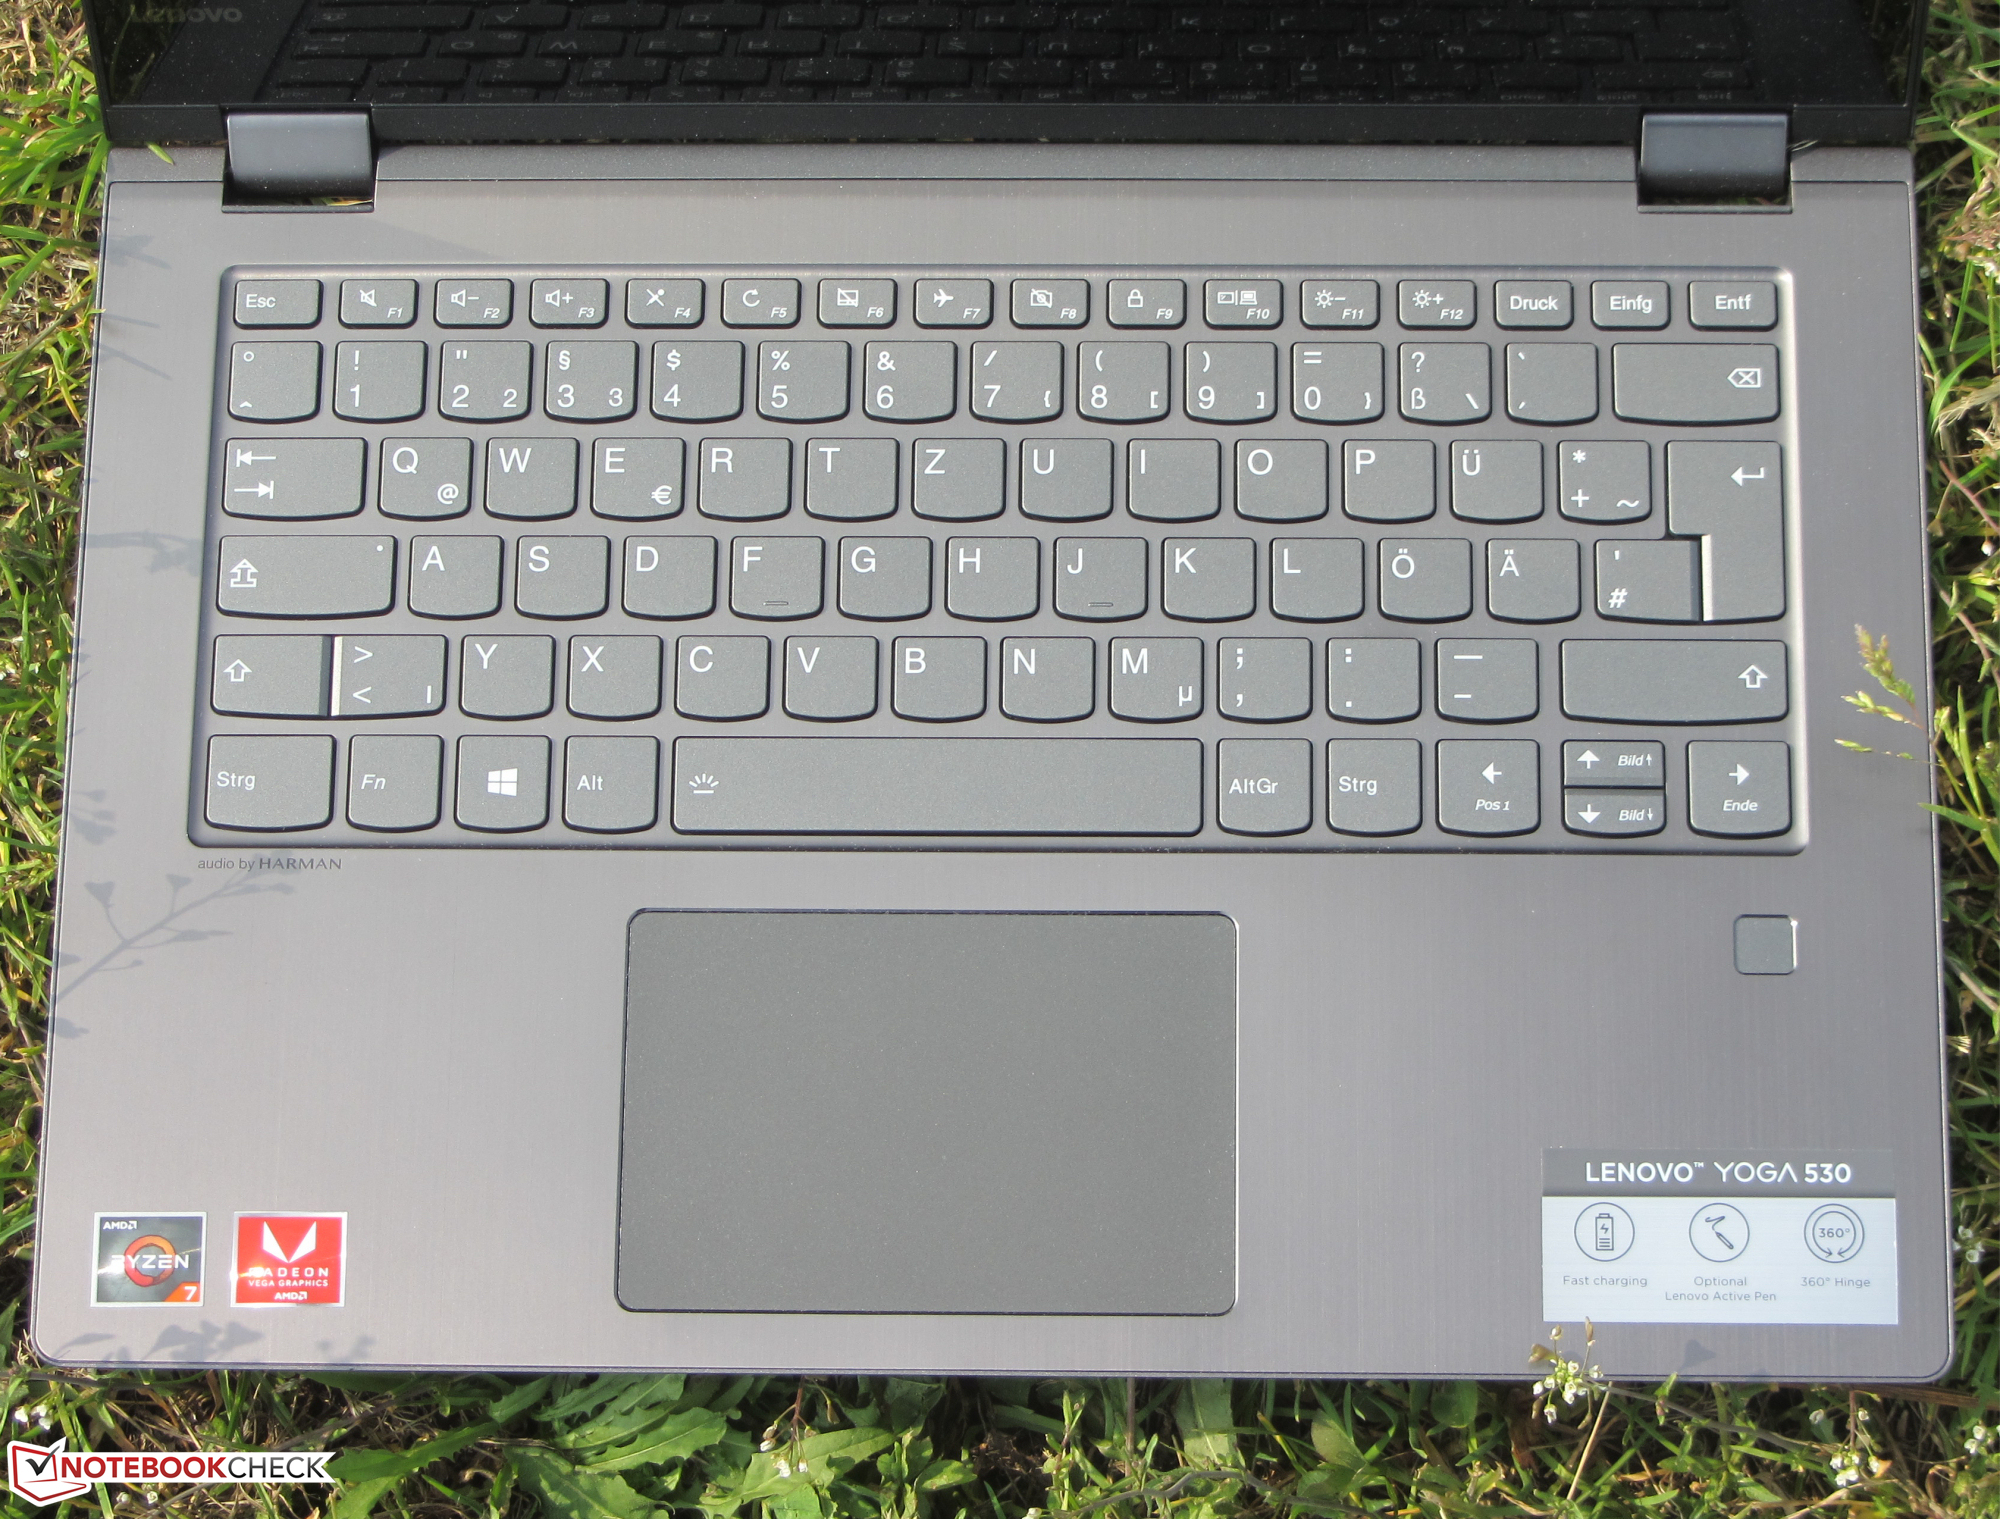
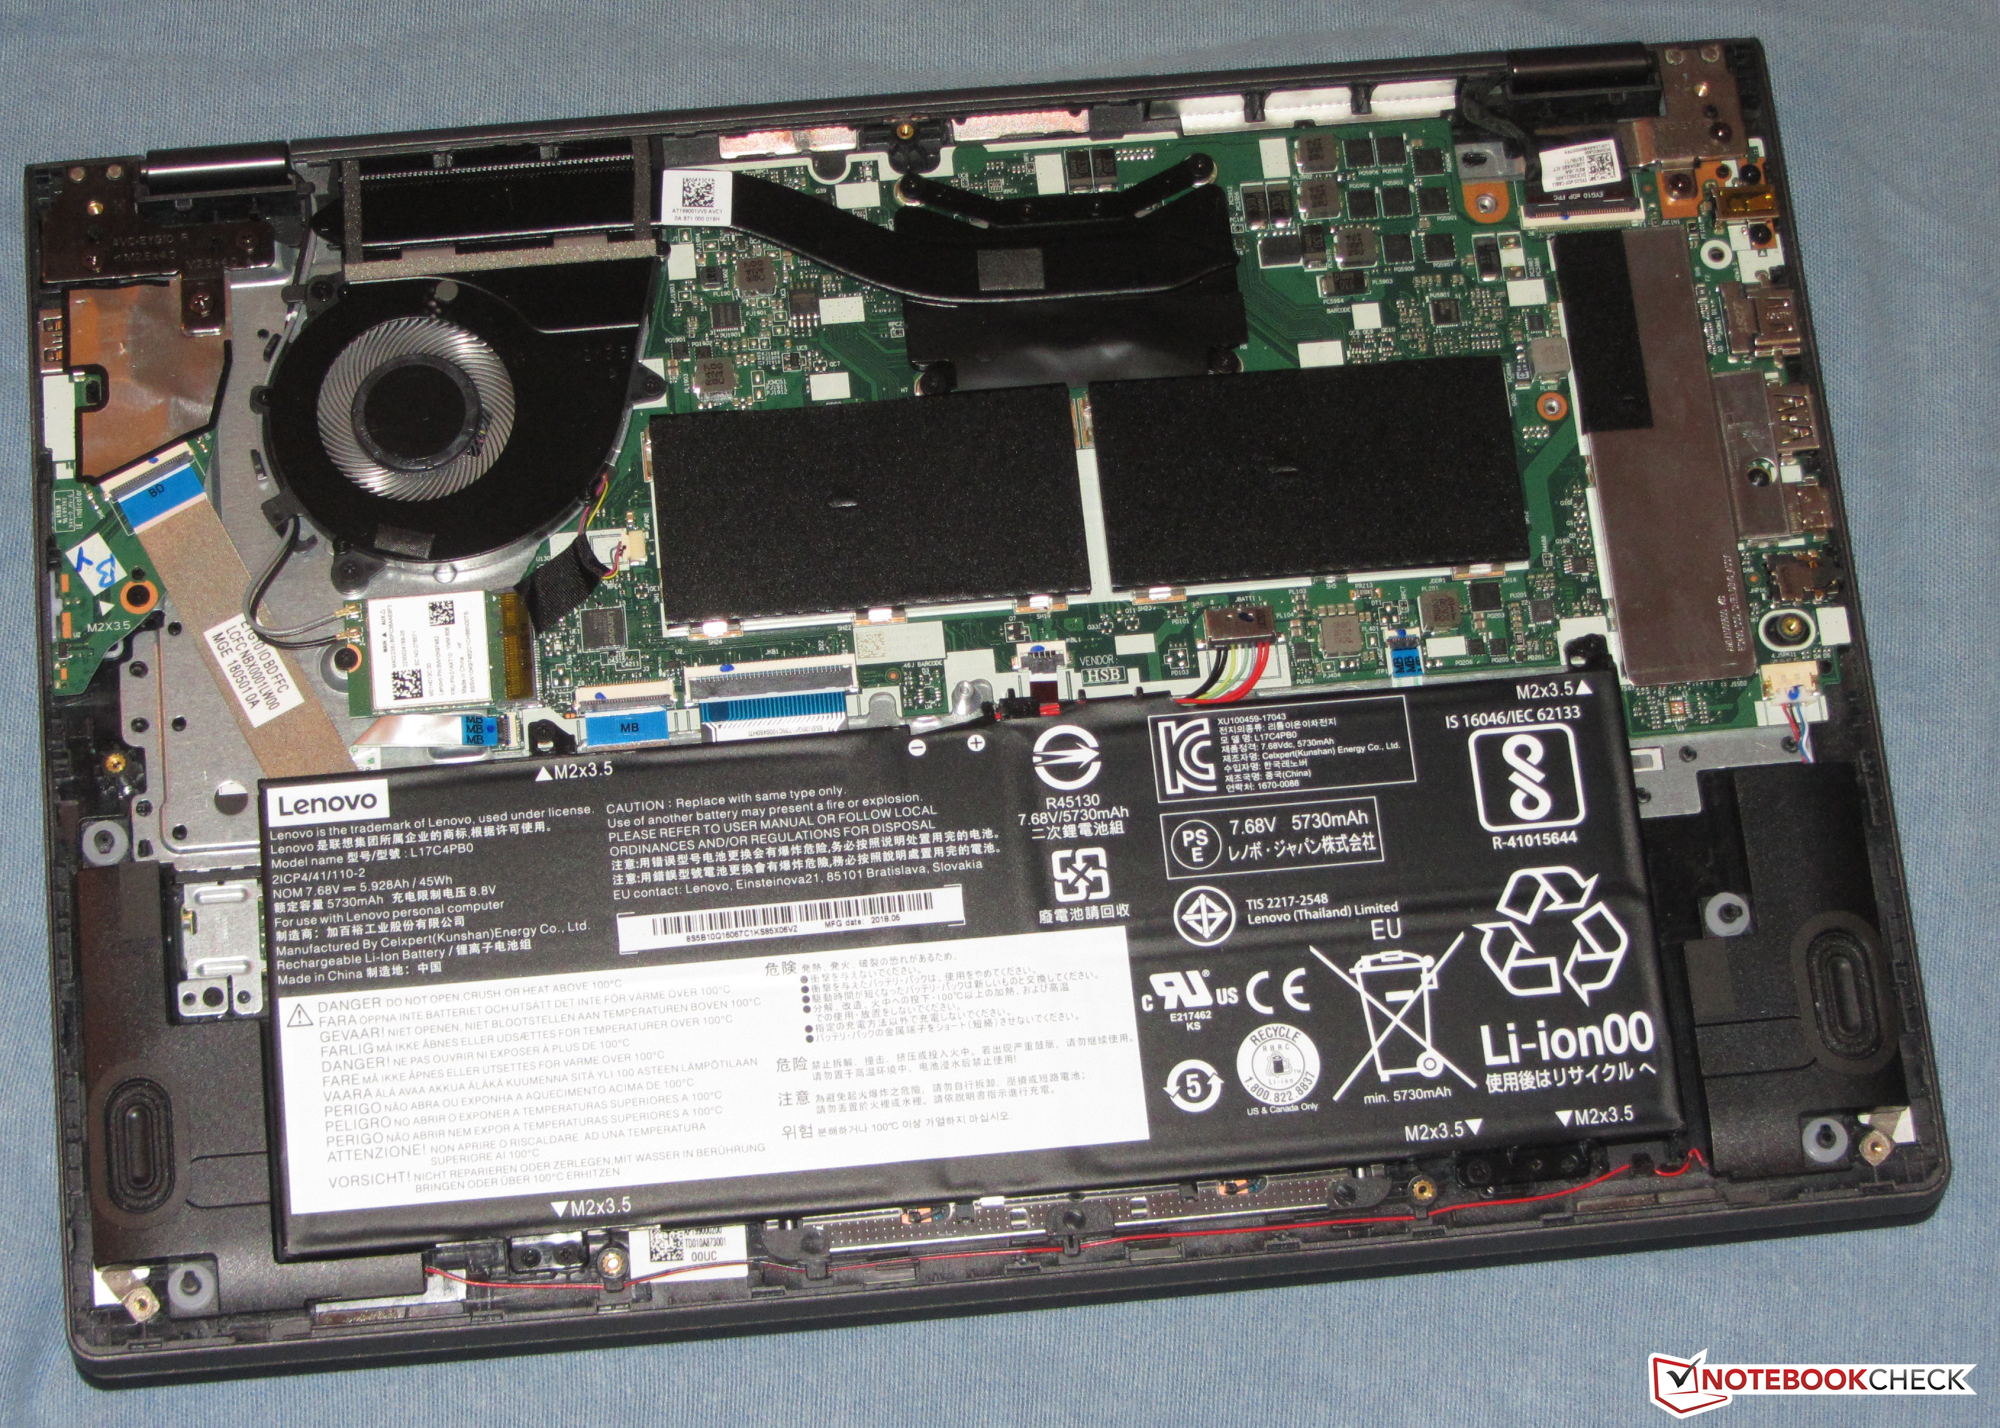
Given that the 530-14ARR is identical to the 530-14IKB in regard to case, design, input devices, and speakers we are not going to cover these aspects in this review. Those interested are welcome to take a look at our Yoga 530-14IKB review.

| SD Card Reader | |
| average JPG Copy Test (av. of 3 runs) | |
| Average of class Convertible (29.4 - 186, n=21, last 2 years) | |
| HP Pavilion x360 14-cd0002ng (Toshiba Exceria Pro SDXC 64 GB UHS-II) | |
| Lenovo Yoga 530-14ARR-81H9000VGE (Toshiba Exceria Pro SDXC 64 GB UHS-II) | |
| Dell Inspiron 14 5000 5482 2-in-1 (Toshiba Exceria Pro SDXC 64 GB UHS-II) | |
| Lenovo Yoga 530-14IKB-81EK00CWGE (Toshiba Exceria Pro SDXC 64 GB UHS-II) | |
| Asus VivoBook Flip 14 TP412UA-EC969T (Toshiba Exceria Pro SDXC 64 GB UHS-II) | |
| Acer Spin 3 SP314-51-548L (Toshiba Exceria Pro SDXC 64 GB UHS-II) | |
| maximum AS SSD Seq Read Test (1GB) | |
| Average of class Convertible (67.5 - 254, n=20, last 2 years) | |
| HP Pavilion x360 14-cd0002ng (Toshiba Exceria Pro SDXC 64 GB UHS-II) | |
| Lenovo Yoga 530-14ARR-81H9000VGE (Toshiba Exceria Pro SDXC 64 GB UHS-II) | |
| Dell Inspiron 14 5000 5482 2-in-1 (Toshiba Exceria Pro SDXC 64 GB UHS-II) | |
| Lenovo Yoga 530-14IKB-81EK00CWGE (Toshiba Exceria Pro SDXC 64 GB UHS-II) | |
| Asus VivoBook Flip 14 TP412UA-EC969T (Toshiba Exceria Pro SDXC 64 GB UHS-II) | |
| Acer Spin 3 SP314-51-548L (Toshiba Exceria Pro SDXC 64 GB UHS-II) | |
Display
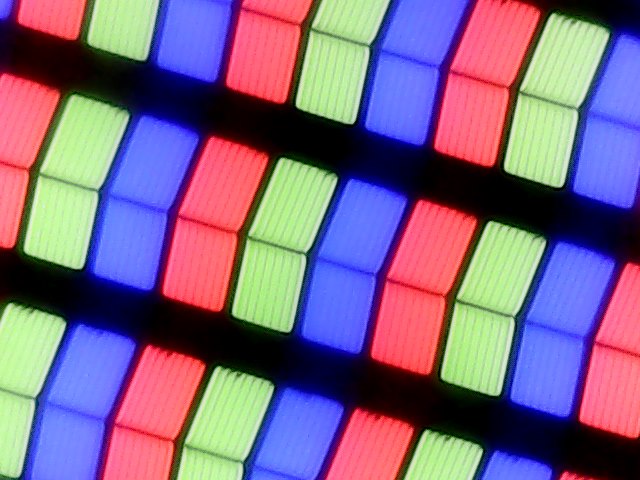
The 14-inch touchscreen display runs at a native resolution of 1920x1080. While it offers a decent contrast ratio (1,687:1) its maximum brightness of just 233 nits is too low. That being said, most competitors are not any better in this regard either and some feature even dimmer displays. Generally speaking we consider a brightness of 300 nits and a contrast ratio of 1,000:1 to be adequate. On a more positive note we failed to detect any PWM flickering.

| |||||||||||||||||||||||||
Brightness Distribution: 85 %
Center on Battery: 233 cd/m²
Contrast: 1366:1 (Black: 0.175 cd/m²)
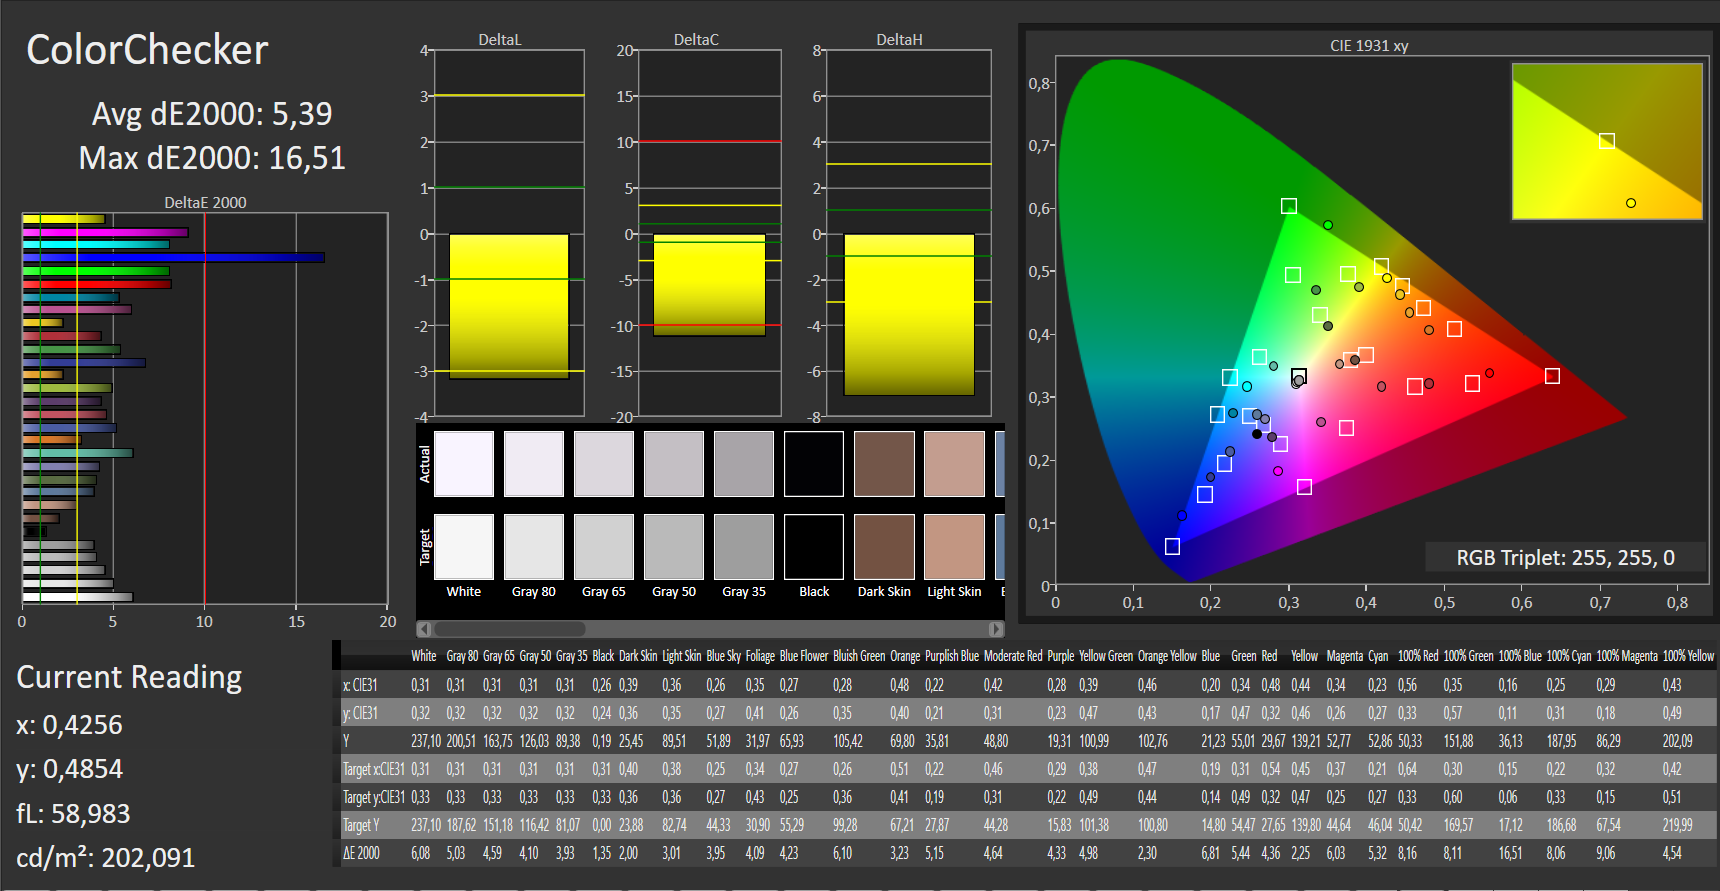
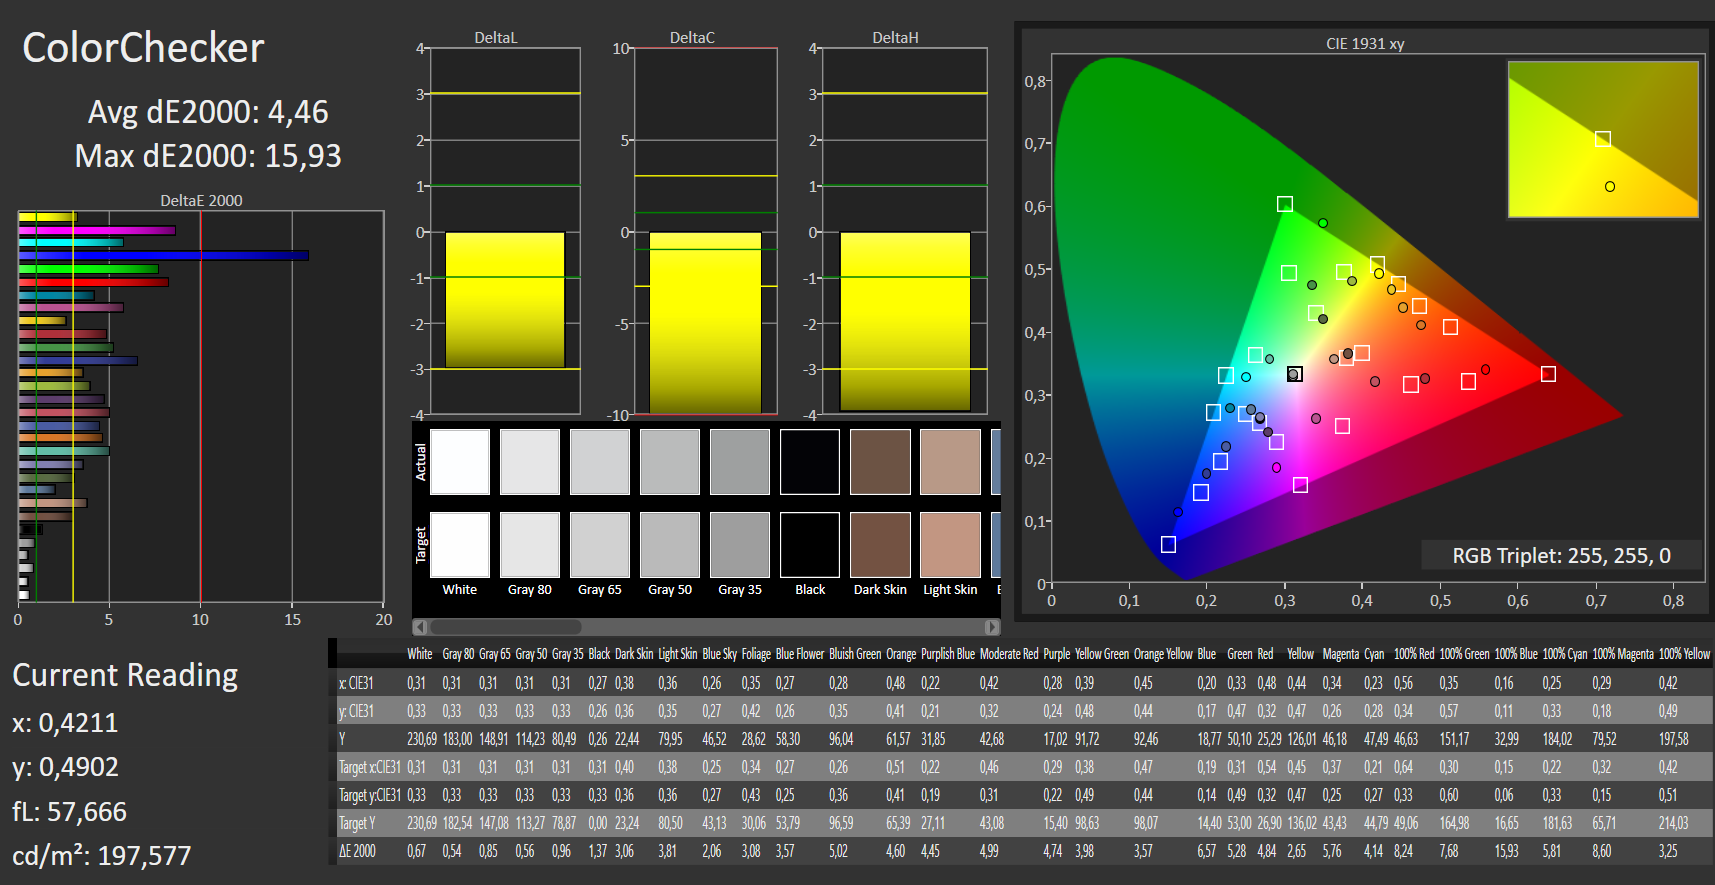
ΔE ColorChecker Calman: 5.39 | ∀{0.5-29.43 Ø4.71}
calibrated: 4.46
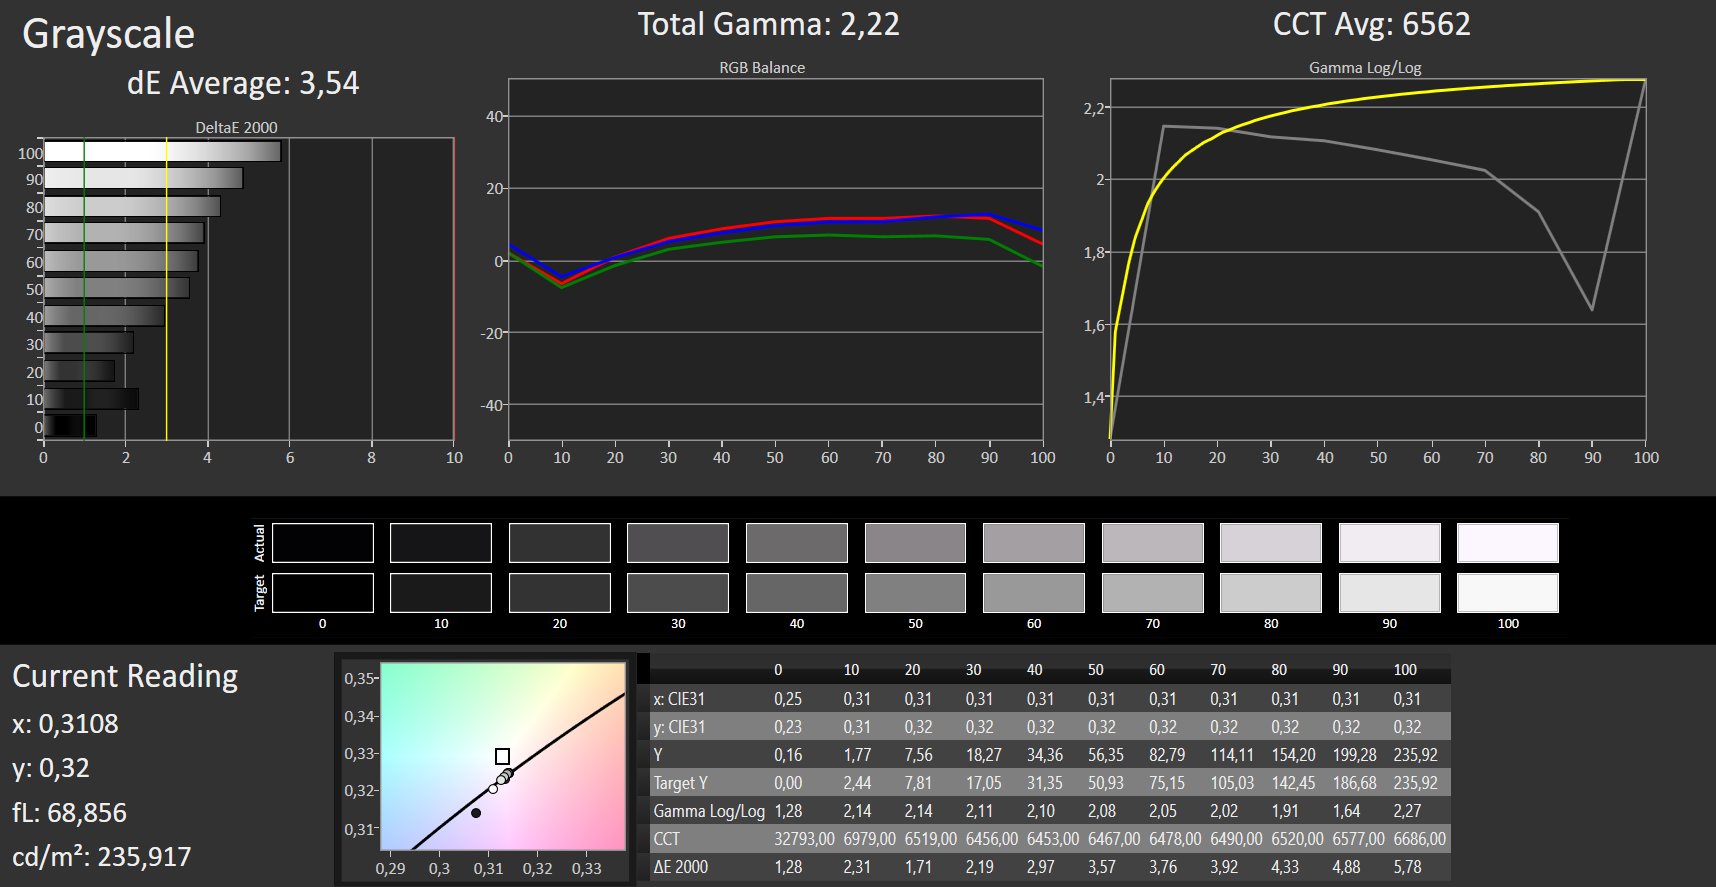
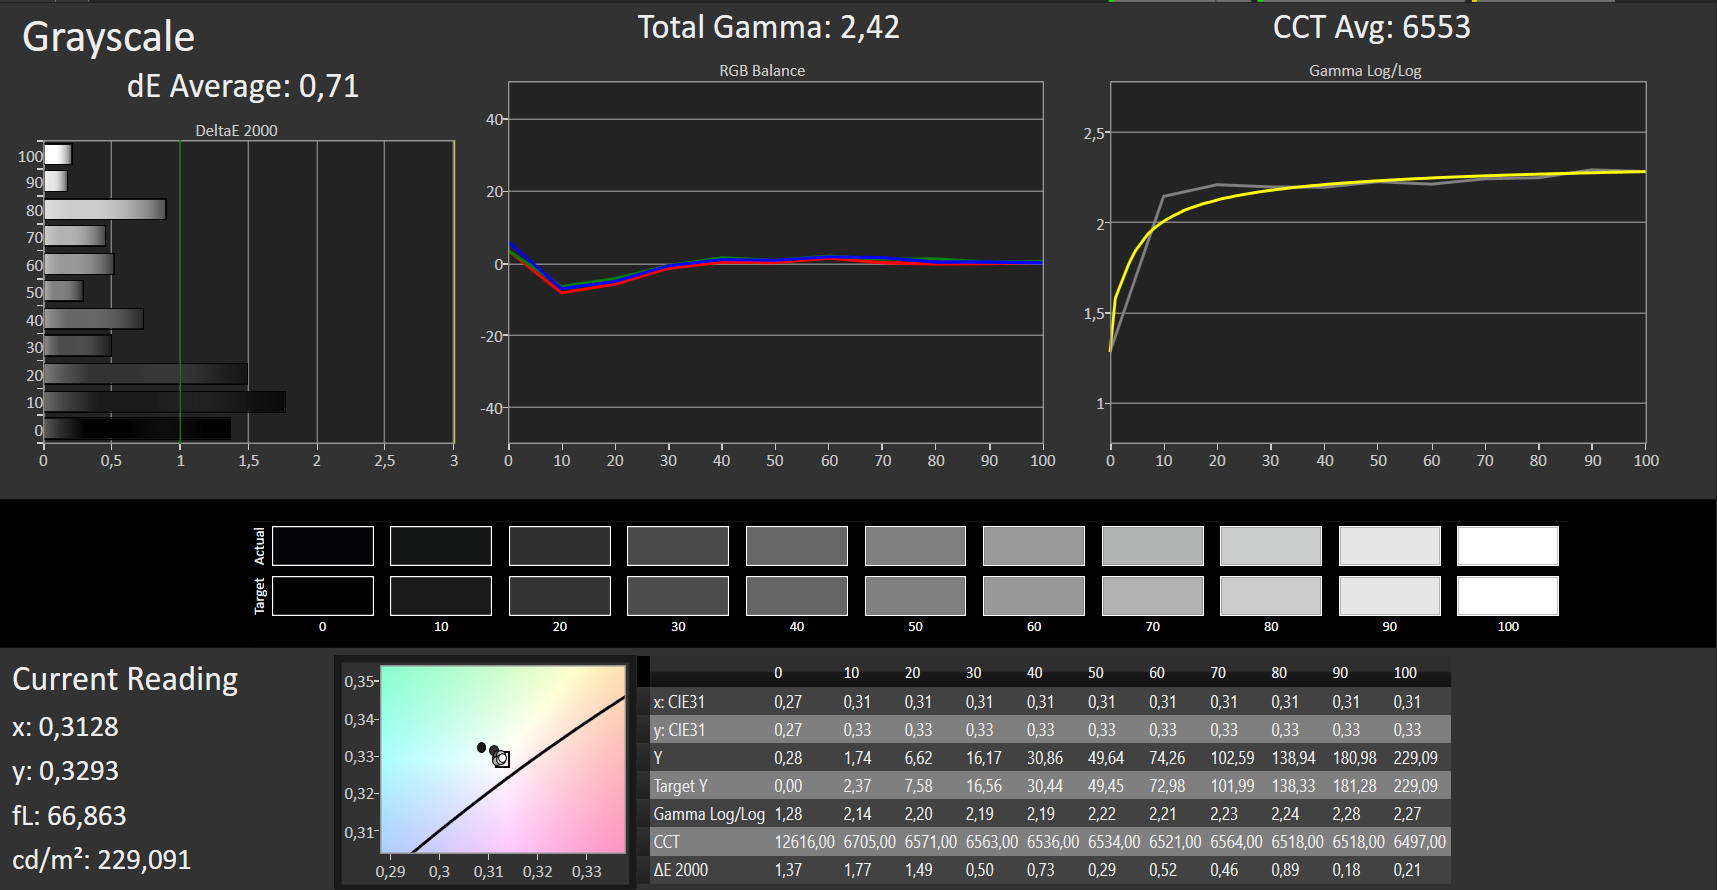
ΔE Greyscale Calman: 3.54 | ∀{0.09-98 Ø4.96}
56% sRGB (Argyll 1.6.3 3D)
36% AdobeRGB 1998 (Argyll 1.6.3 3D)
38.9% AdobeRGB 1998 (Argyll 3D)
56.6% sRGB (Argyll 3D)
37.65% Display P3 (Argyll 3D)
Gamma: 2.22
CCT: 6562 K
| Lenovo Yoga 530-14ARR-81H9000VGE IPS, 1920x1080, 14" | Lenovo Yoga 530-14IKB-81EK00CWGE IPS, 1920x1080, 14" | Asus VivoBook Flip 14 TP412UA-EC969T IPS, 1920x1080, 14" | HP Pavilion x360 14-cd0002ng IPS, 1920x1080, 14" | Dell Inspiron 14 5000 5482 2-in-1 IPS, 1920x1080, 14" | Acer Spin 3 SP314-51-548L IPS, 1920x1080, 14" | |
|---|---|---|---|---|---|---|
| Display | 10% | 5% | 10% | 7% | 5% | |
| Display P3 Coverage (%) | 37.65 | 41.52 10% | 39.56 5% | 41.32 10% | 40.57 8% | 39.68 5% |
| sRGB Coverage (%) | 56.6 | 62.1 10% | 59.5 5% | 61.8 9% | 58.6 4% | 58.9 4% |
| AdobeRGB 1998 Coverage (%) | 38.9 | 42.92 10% | 40.88 5% | 42.74 10% | 41.91 8% | 41 5% |
| Response Times | -7% | 3% | -6% | -30% | -14% | |
| Response Time Grey 50% / Grey 80% * (ms) | 42 ? | 45 ? -7% | 40 ? 5% | 44 ? -5% | 58.8 ? -40% | 43 ? -2% |
| Response Time Black / White * (ms) | 28 ? | 30 ? -7% | 28 ? -0% | 30 ? -7% | 33.2 ? -19% | 35 ? -25% |
| PWM Frequency (Hz) | 520 ? | 2439 ? | 198.4 ? | 1000 | ||
| Screen | 18% | 6% | -2% | -20% | 11% | |
| Brightness middle (cd/m²) | 239 | 240 0% | 251 5% | 225 -6% | 193.6 -19% | 220 -8% |
| Brightness (cd/m²) | 233 | 234 0% | 242 4% | 195 -16% | 181 -22% | 221 -5% |
| Brightness Distribution (%) | 85 | 93 9% | 87 2% | 72 -15% | 78 -8% | 78 -8% |
| Black Level * (cd/m²) | 0.175 | 0.11 37% | 0.25 -43% | 0.14 20% | 0.17 3% | 0.18 -3% |
| Contrast (:1) | 1366 | 2182 60% | 1004 -27% | 1607 18% | 1139 -17% | 1222 -11% |
| Colorchecker dE 2000 * | 5.39 | 4.98 8% | 4.03 25% | 5.44 -1% | 6.99 -30% | 3.98 26% |
| Colorchecker dE 2000 max. * | 16.51 | 10.75 35% | 7.33 56% | 20.38 -23% | 23.58 -43% | 7.69 53% |
| Colorchecker dE 2000 calibrated * | 4.46 | 3.33 25% | 4.46 -0% | 4.86 -9% | 4 10% | |
| Greyscale dE 2000 * | 3.54 | 3.51 1% | 2.55 28% | 3.98 -12% | 5.7 -61% | 1.68 53% |
| Gamma | 2.22 99% | 2.2 100% | 2.48 89% | 2.32 95% | 2.12 104% | 2.37 93% |
| CCT | 6562 99% | 6606 98% | 6831 95% | 6163 105% | 5845 111% | 6382 102% |
| Color Space (Percent of AdobeRGB 1998) (%) | 36 | 40 11% | 38 6% | 39 8% | 37.6 4% | 38 6% |
| Color Space (Percent of sRGB) (%) | 56 | 62 11% | 59 5% | 62 11% | 58 4% | |
| Total Average (Program / Settings) | 7% /
13% | 5% /
5% | 1% /
0% | -14% /
-16% | 1% /
7% |
* ... smaller is better
Color accuracy was decent ex factory, and the display’s DeltaE for colors was just 5.39. Ideally, you want this to be less than 3. We found no blue tint. Calibrating the display improved the color accuracy, and we were able to lower DeltaE for colors to 4.4 and improve grayscale balance at the same time. AdobeRGB and sRGB color-space coverage was only 36 and 56%, respectively.
As always you can download the resulting ICC profile from the box above. Keep in mind to make sure that your device is equipped with the exact same display (manufacturer + model) as our review unit. Otherwise you might end up decreasing instead of improving color accuracy. Many OEMs source their displays from various manufacturers even within a single series of notebooks.

Display Response Times
| ↔ Response Time Black to White | ||
|---|---|---|
| 28 ms ... rise ↗ and fall ↘ combined | ↗ 16 ms rise | 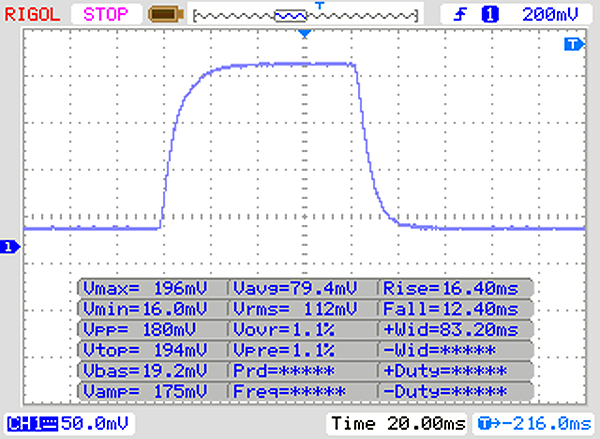 |
| ↘ 12 ms fall | ||
| The screen shows relatively slow response rates in our tests and may be too slow for gamers. In comparison, all tested devices range from 0.1 (minimum) to 240 (maximum) ms. » 71 % of all devices are better. This means that the measured response time is worse than the average of all tested devices (19.8 ms). | ||
| ↔ Response Time 50% Grey to 80% Grey | ||
| 42 ms ... rise ↗ and fall ↘ combined | ↗ 19 ms rise | 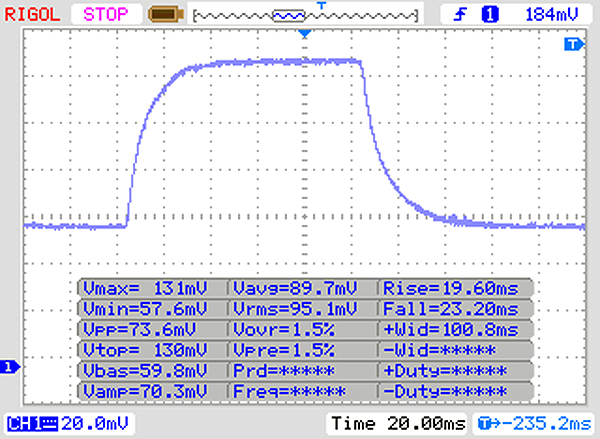 |
| ↘ 23 ms fall | ||
| The screen shows slow response rates in our tests and will be unsatisfactory for gamers. In comparison, all tested devices range from 0.165 (minimum) to 636 (maximum) ms. » 67 % of all devices are better. This means that the measured response time is worse than the average of all tested devices (30.9 ms). | ||
Screen Flickering / PWM (Pulse-Width Modulation)
| Screen flickering / PWM not detected | 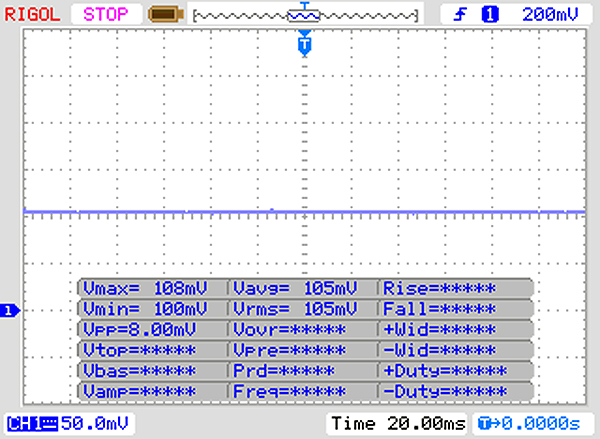 | ||
In comparison: 52 % of all tested devices do not use PWM to dim the display. If PWM was detected, an average of 7741 (minimum: 5 - maximum: 343500) Hz was measured. | |||
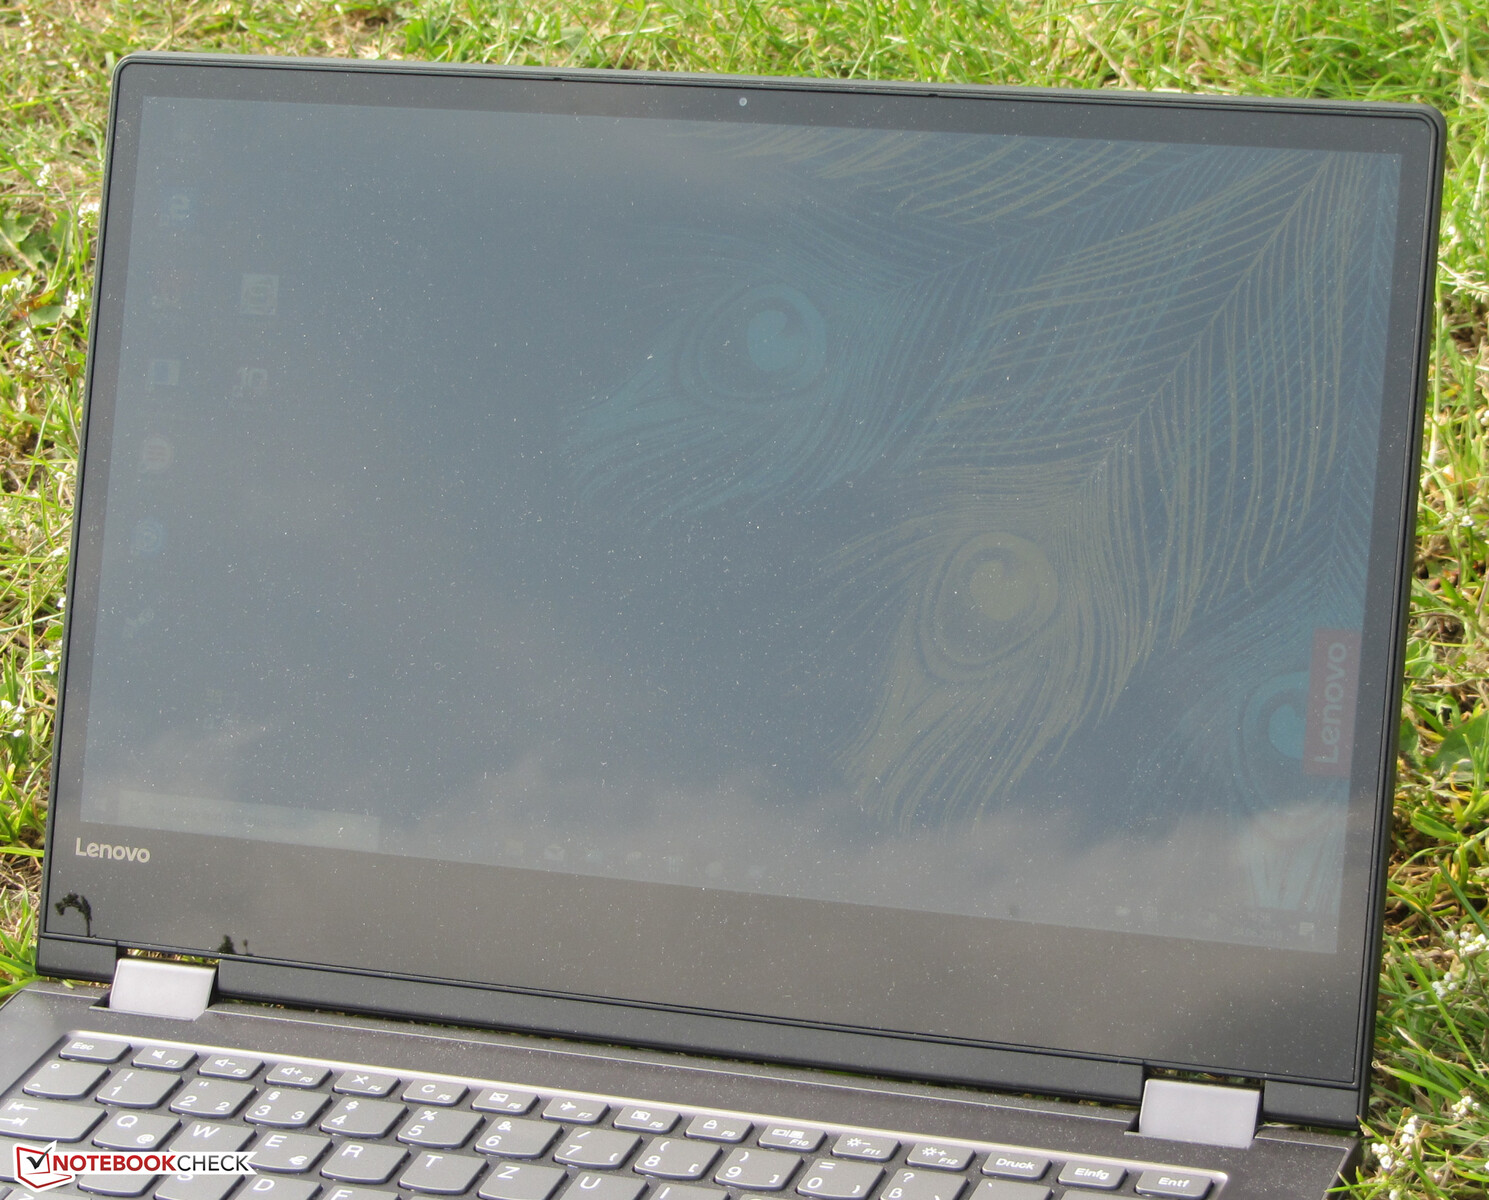
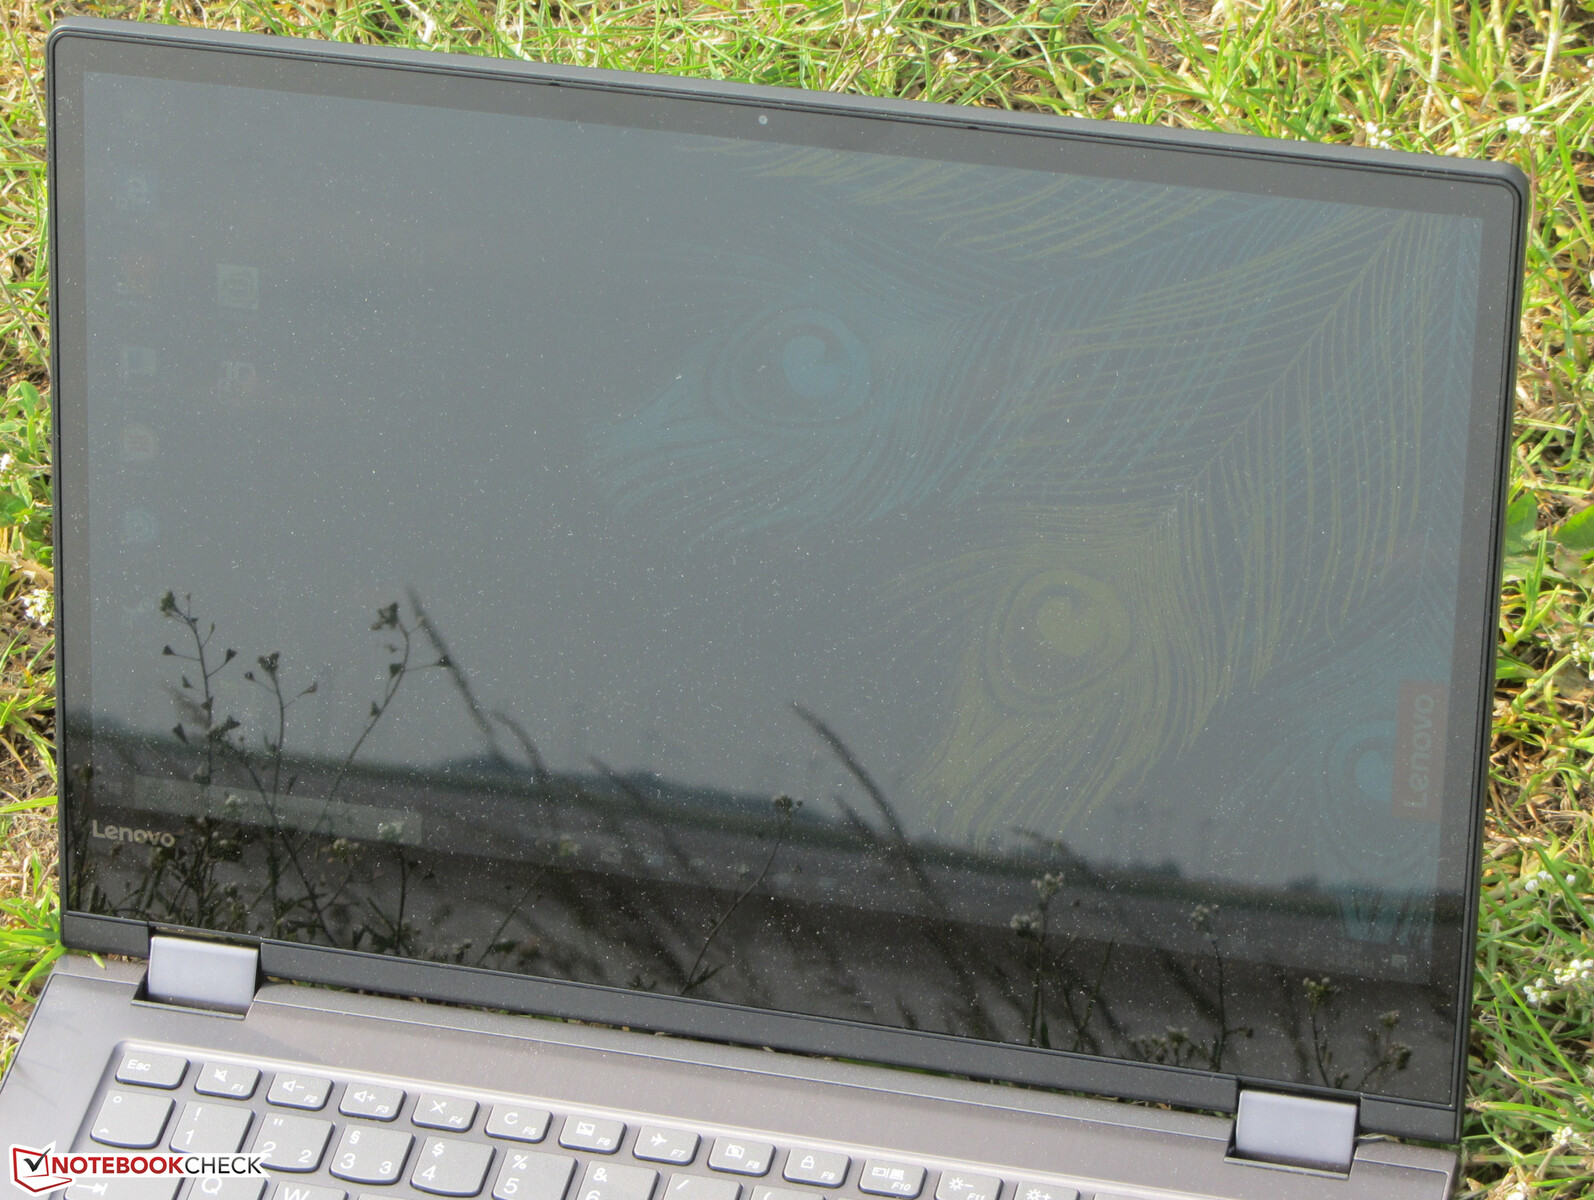
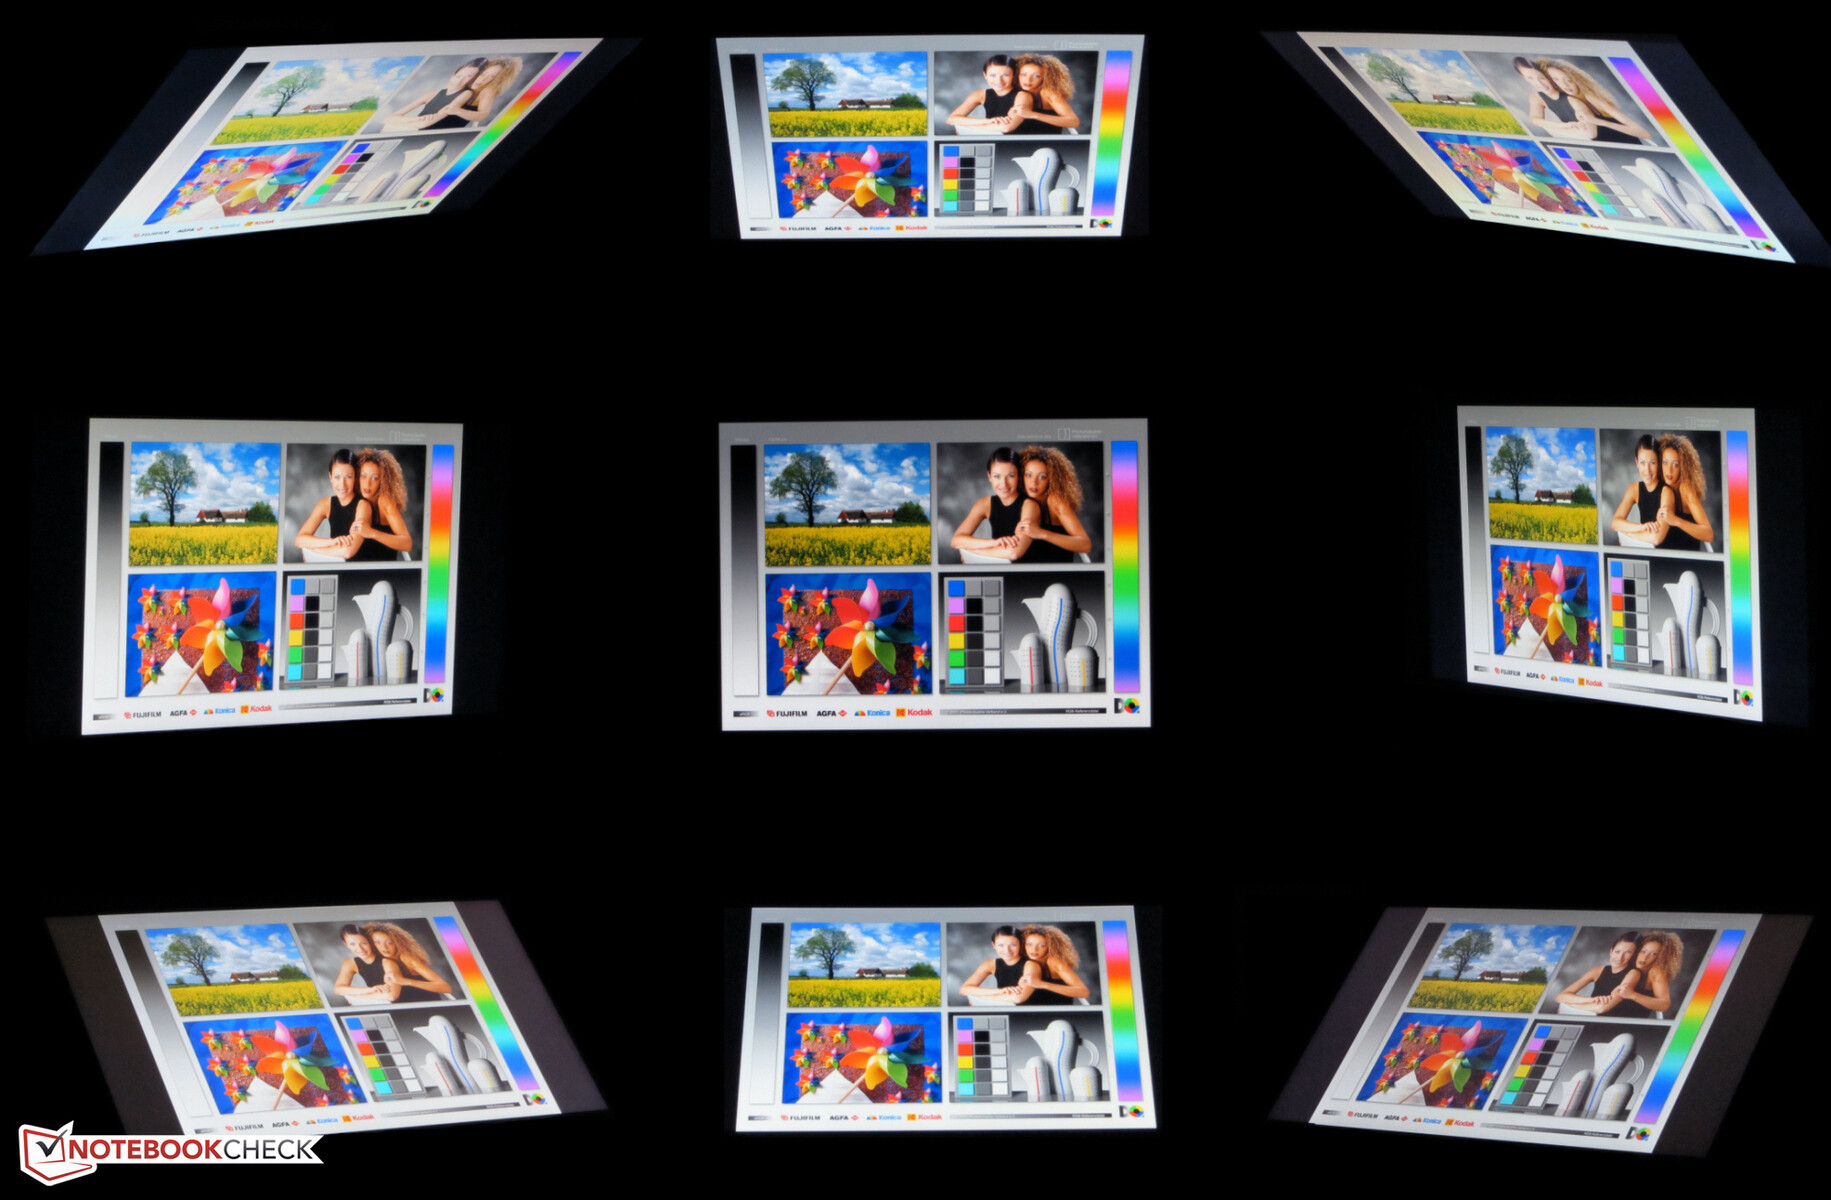
Thanks to its IPS panel the display remained well readable from all angles and positions. Outdoors, it was practically unusable due to its low maximum brightness combined with its highly reflective coating.
Performance
Lenovo’s Yoga 530-14ARR convertible offers enough performance for most office and Internet applications. At the time of writing, our review unit sold for around $800, and other SKUs were available starting at around $500.


Processor
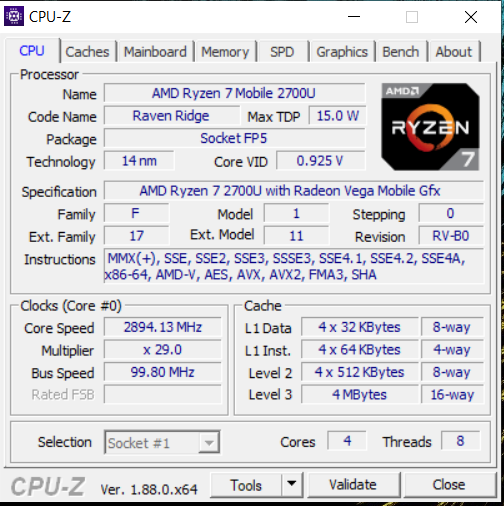
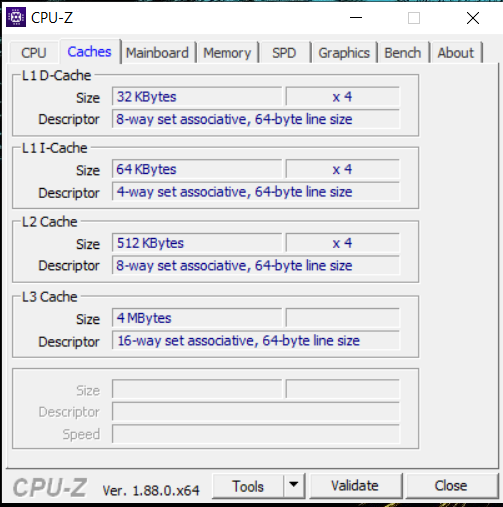
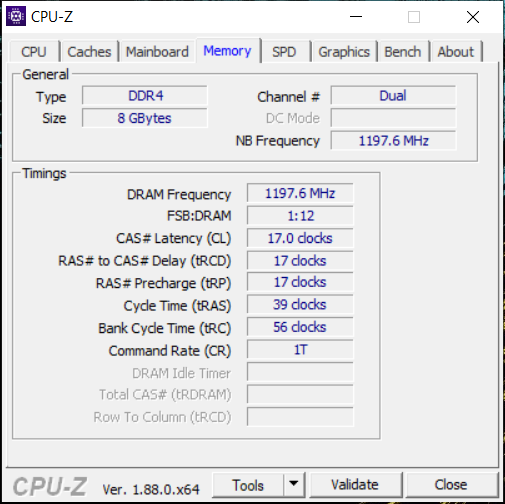
The Yoga 530 is powered by an AMD Ryzen 7 2700U (Raven Ridge) APU, the CPU part of which is comprised of a quad-core processor with a base clock speed of 2.2 GHz and a turbo boost of up to 3.8 GHz. The CPU supports SMT (simultaneous multi-threading), which means each CPU core can work on two separate threads simultaneously.
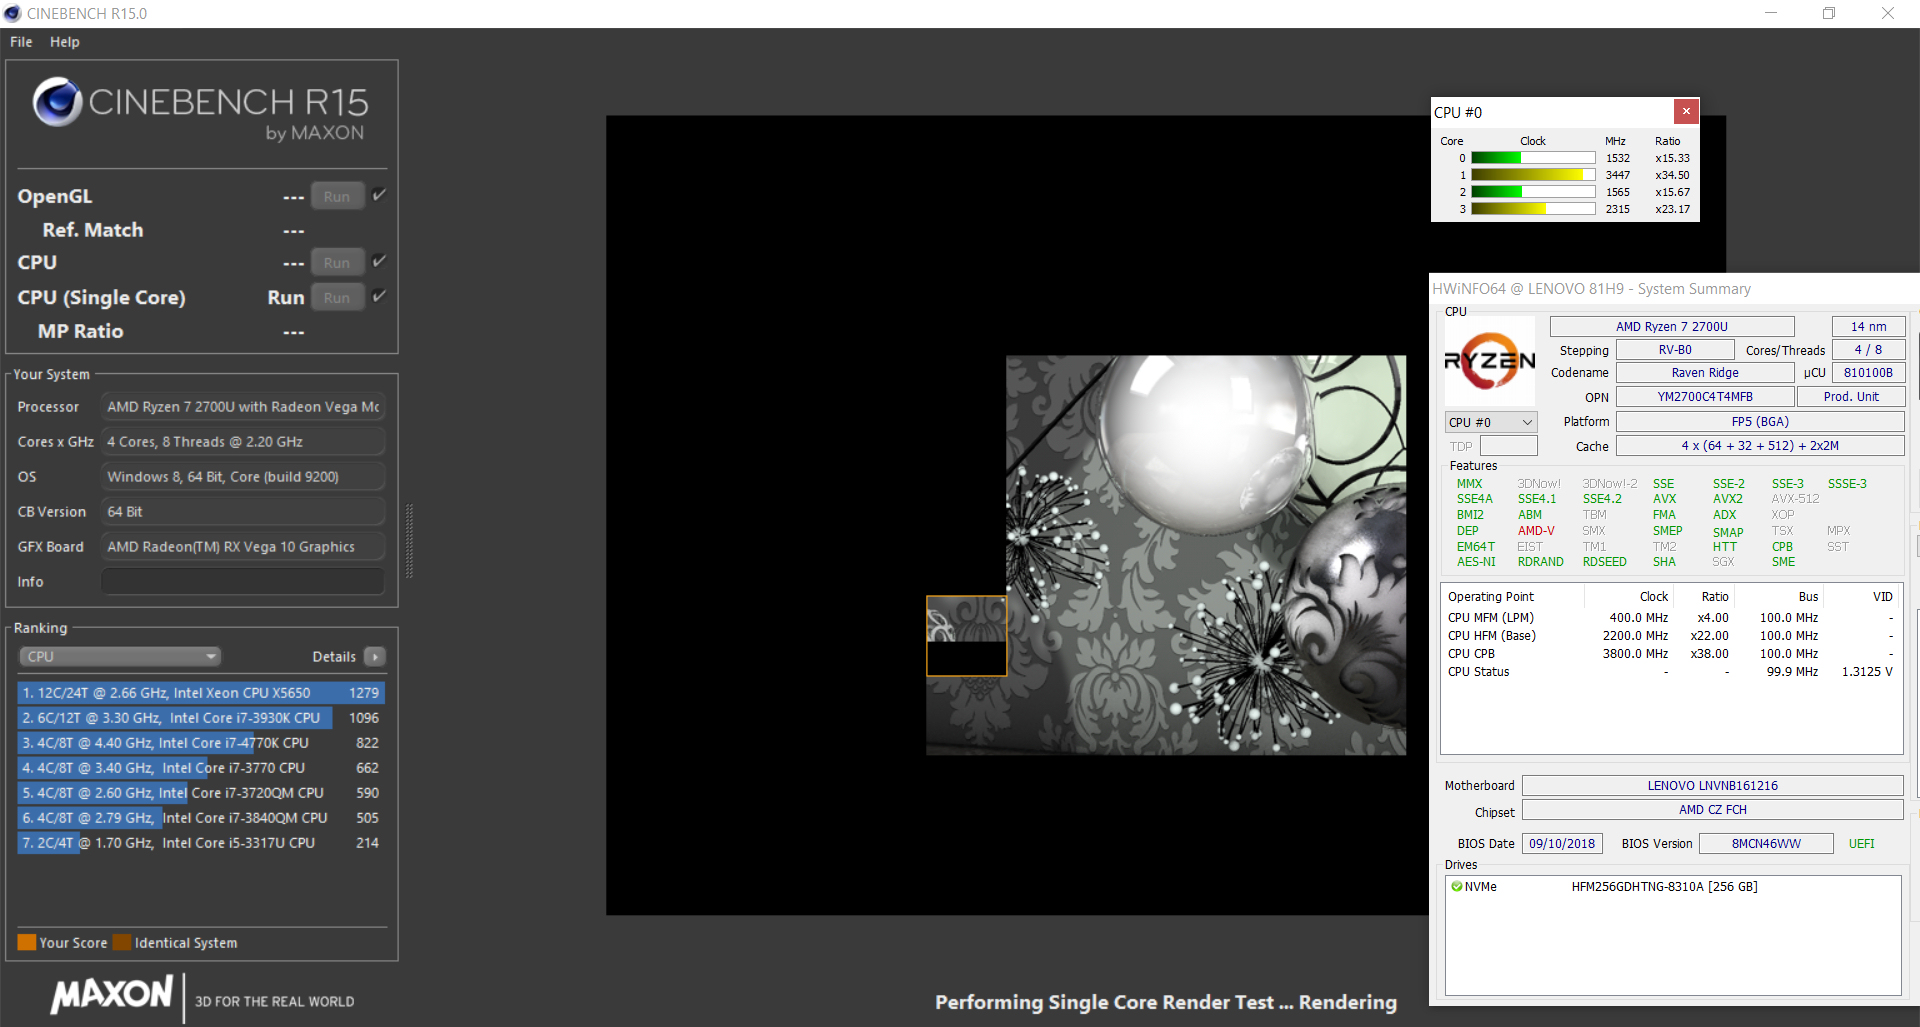
On mains, the Cinebench benchmark was performed at 3.1 to 3.3 GHz (multithread) and 1.5 to 3.8 GHz (single-thread). On battery, the CPU ran at 2.4 GHz in the multithread test at first and eventually boosted to between 2.6 and 3.3 GHz, and it completed the single-thread test at between 1.6 and 2.4 GHz.
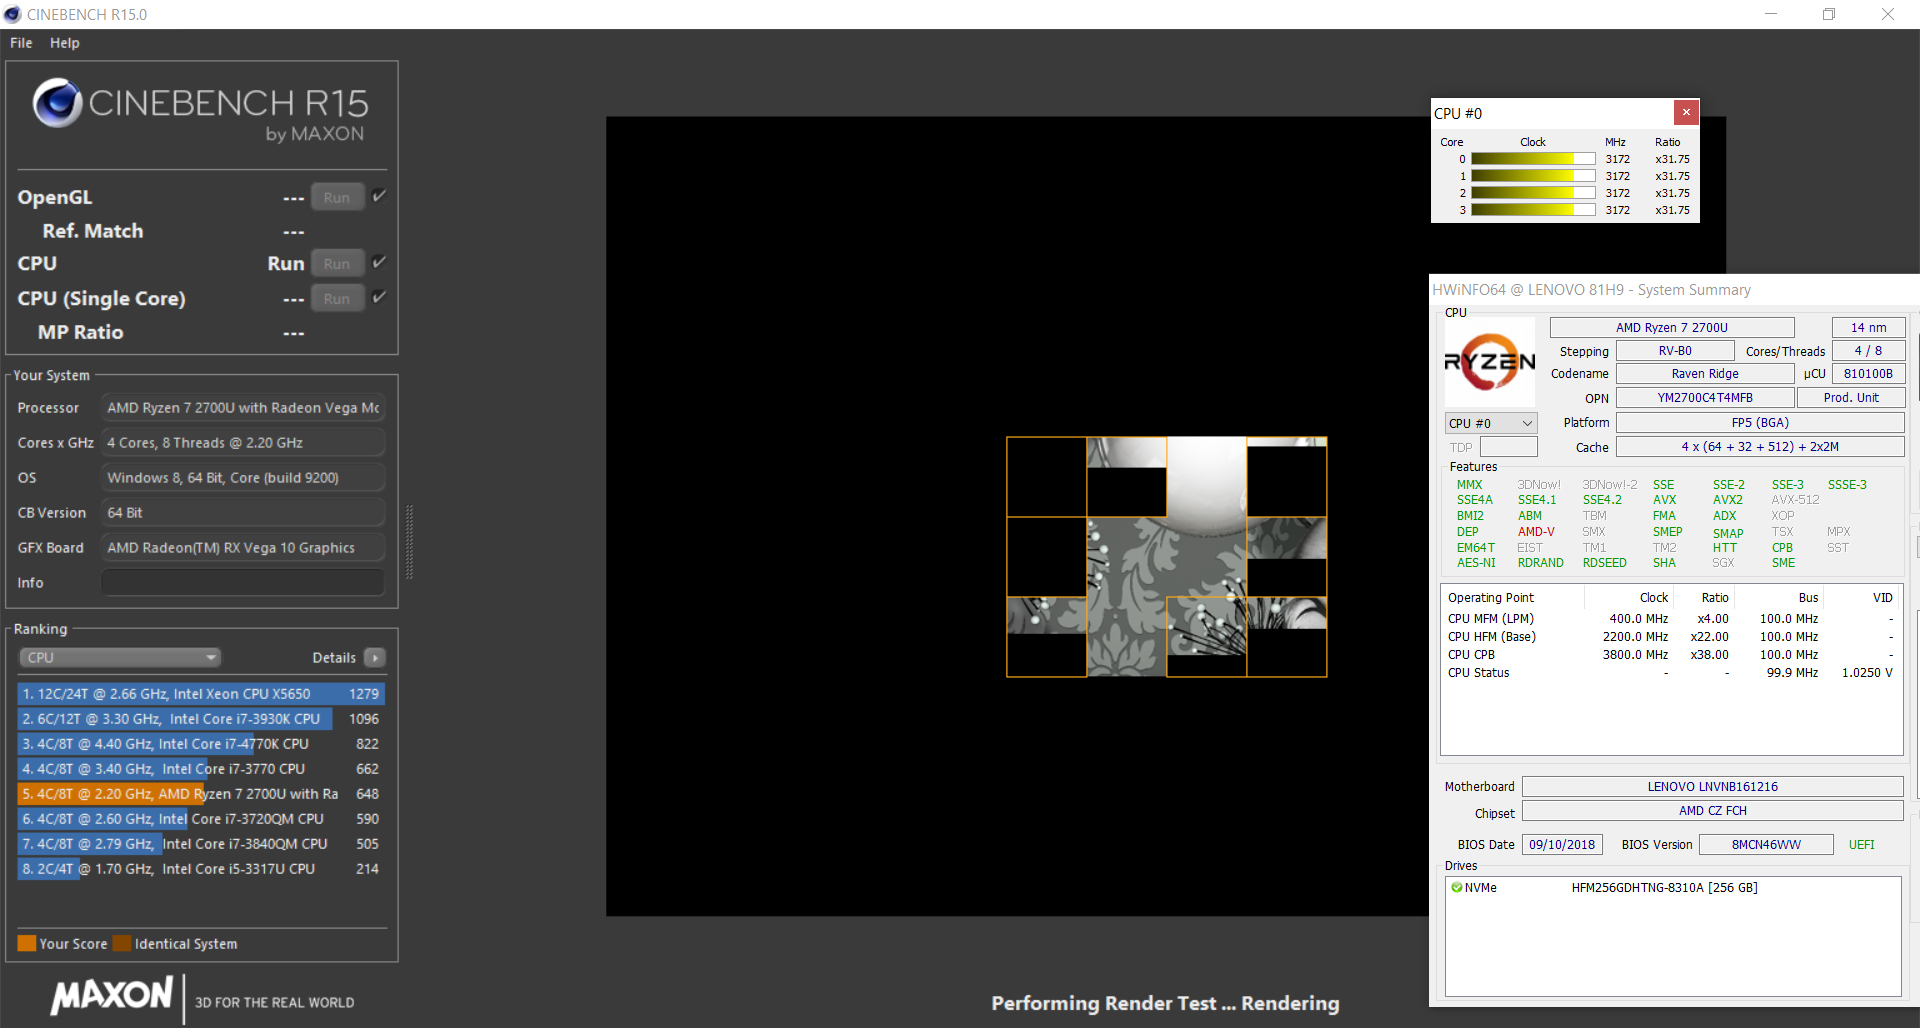
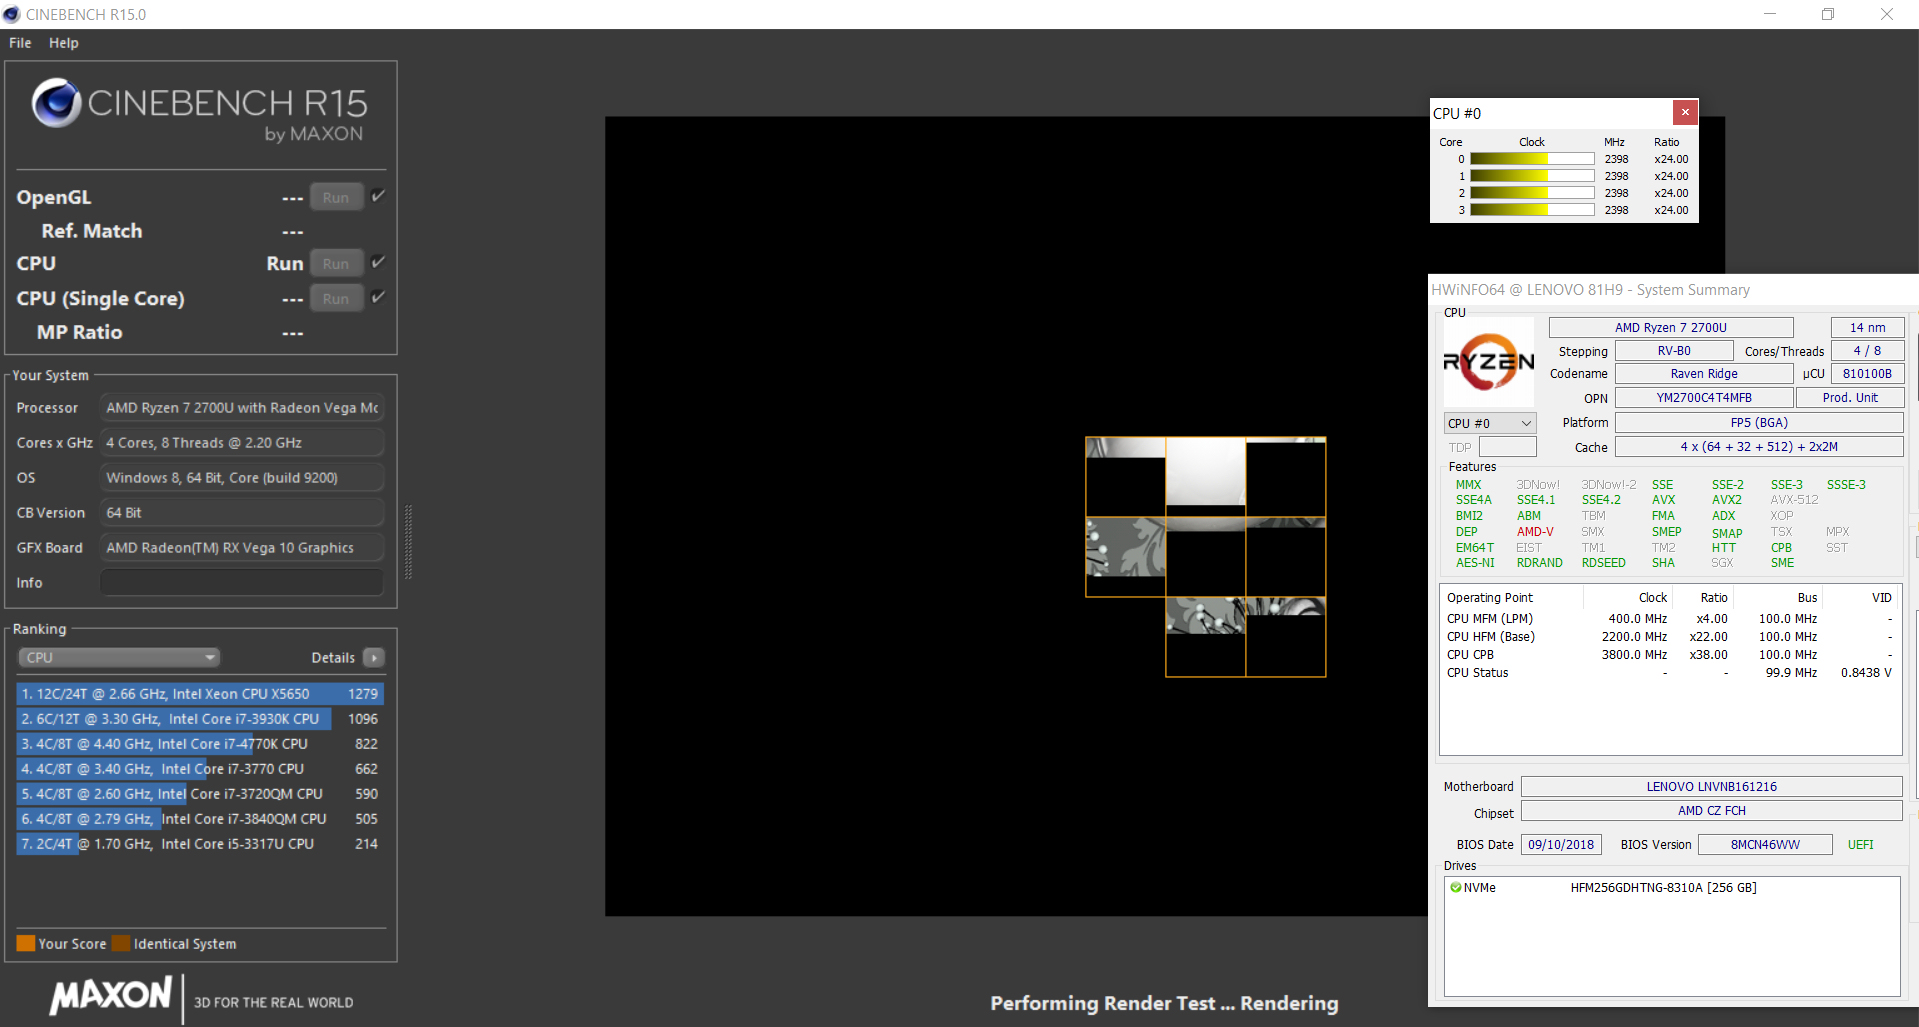
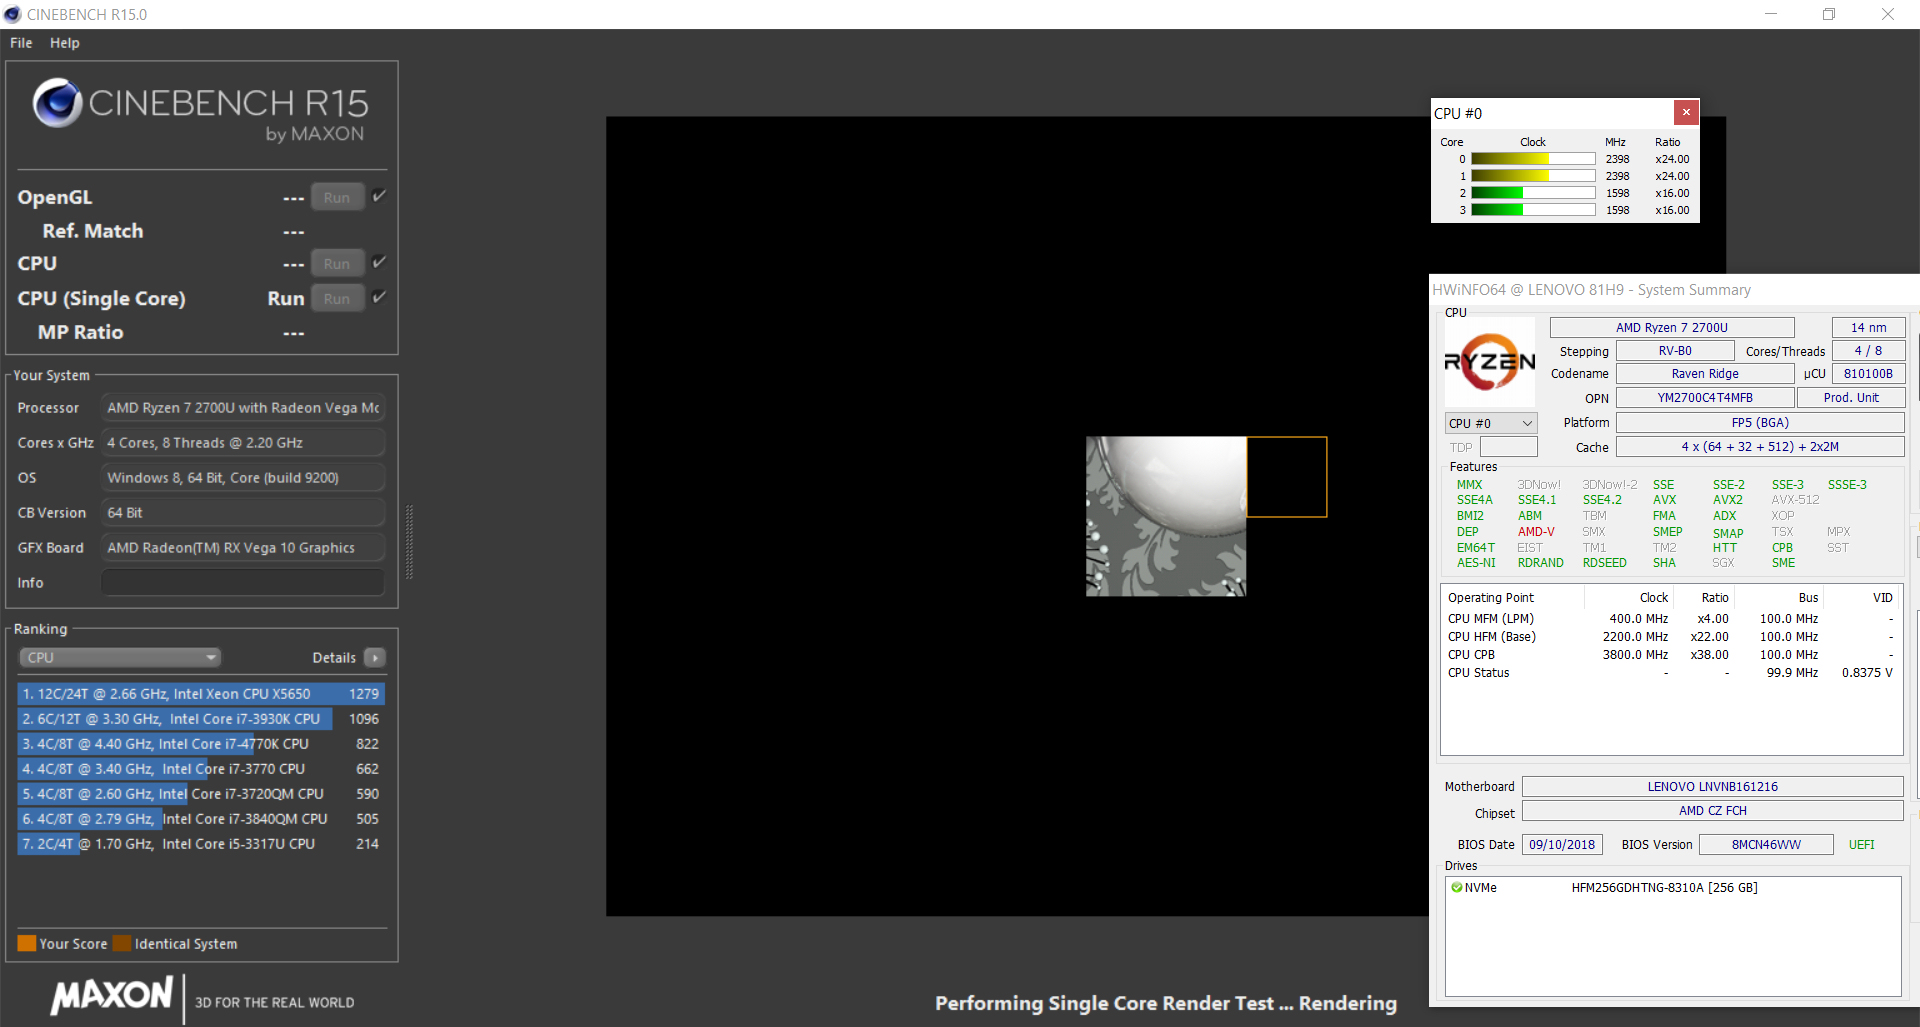
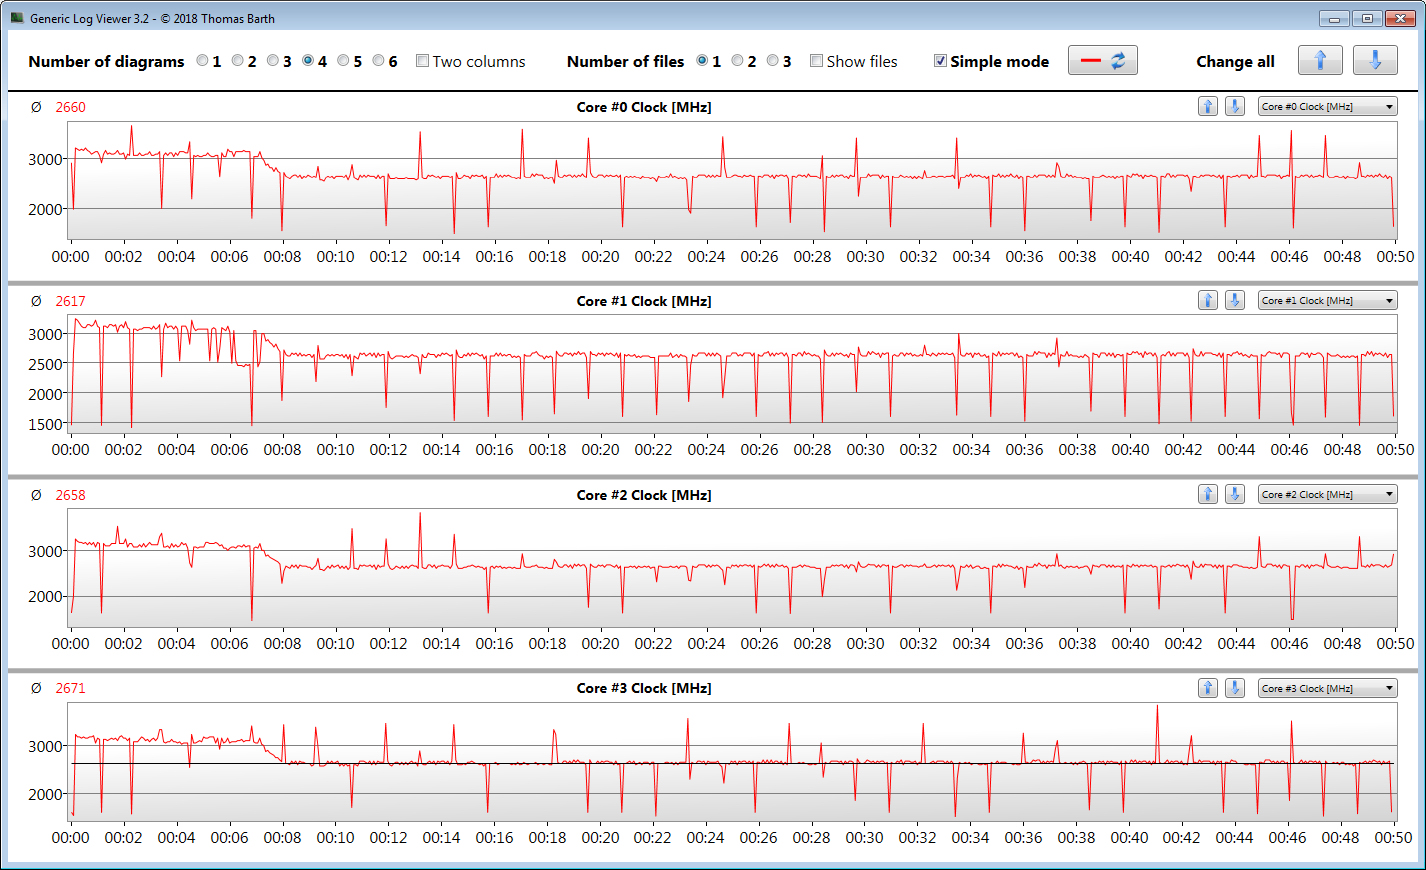
Whether or not a notebook is capable of maintaining a high level of turbo boost on mains is determined by running the Cinebench R15 multithread test in a loop for at least 30 minutes. The resulting scores dropped between the first and eighth iteration and remained consistent afterwards. Turbo boost was liberally applied during the first few iterations, and the CPU ran at more than 3 GHz. In subsequent iterations, boost frequency was reduced to 2.6 to 2.7 GHz. Nevertheless, the Ryzen-powered device was able to outperform is Core i5-8250U-equipped sibling.
| Mozilla Kraken 1.1 - Total | |
| HP Pavilion x360 14-cd0002ng (42.17134.10 EDGE HTML 17.17134) | |
| Asus VivoBook Flip 14 TP412UA-EC969T (Edge 44) | |
| Average AMD Ryzen 7 2700U (1193 - 1686, n=7) | |
| Lenovo Yoga 530-14ARR-81H9000VGE (Edge 44) | |
| Dell Inspiron 14 5000 5482 2-in-1 (Edge 42.17134.1.0) | |
| Acer Spin 3 SP314-51-548L (Edge 41) | |
| Average of class Convertible (386 - 1089, n=52, last 2 years) | |
| Octane V2 - Total Score | |
| Average of class Convertible (50984 - 123023, n=13, last 2 years) | |
| Acer Spin 3 SP314-51-548L (Edge 41) | |
| Dell Inspiron 14 5000 5482 2-in-1 (Edge 42.17134.1.0) | |
| Asus VivoBook Flip 14 TP412UA-EC969T (Edge 44) | |
| Lenovo Yoga 530-14ARR-81H9000VGE (Edge 44) | |
| HP Pavilion x360 14-cd0002ng (42.17134.10 EDGE HTML 17.17134) | |
| Average AMD Ryzen 7 2700U (20231 - 27727, n=6) | |
| Speedometer 2.0 - Result 2.0 | |
| Average of class Convertible (168.2 - 644, n=13, last 2 years) | |
| Asus VivoBook Flip 14 TP412UA-EC969T (Edge 44) | |
| Lenovo Yoga 530-14ARR-81H9000VGE (Edge 44) | |
| Average AMD Ryzen 7 2700U (n=1) | |
| JetStream 1.1 - 1.1 Total | |
| Dell Inspiron 14 5000 5482 2-in-1 (Edge 42.17134.1.0) | |
| Acer Spin 3 SP314-51-548L (Edge 41) | |
| Asus VivoBook Flip 14 TP412UA-DB51T (Edge 42.17134.1.0) | |
| HP Pavilion x360 14-cd0002ng (42.17134.10 EDGE HTML 17.17134) | |
| Lenovo Yoga 530-14ARR-81H9000VGE (Edge 44) | |
| Average AMD Ryzen 7 2700U (128.7 - 191.7, n=6) | |
* ... smaller is better
System Performance
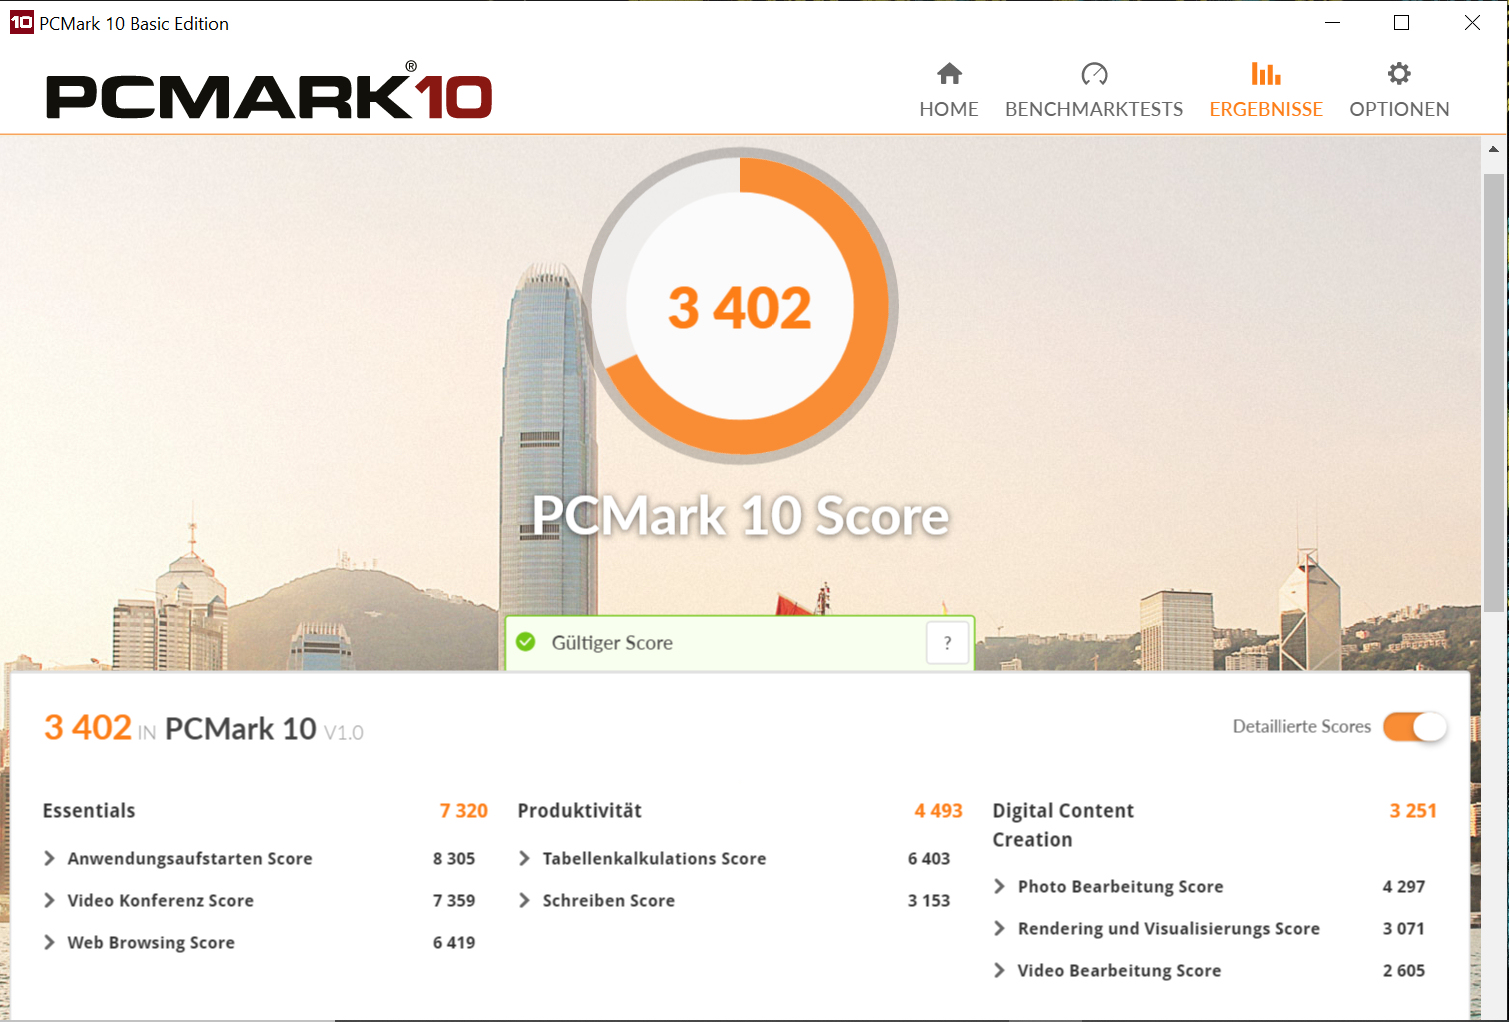
Overall, the system ran perfectly smooth. We did not encounter any issues. The notebook offers more than enough performance for office and Internet applications. PCMark benchmark results were decent. Looking at our comparison chart we noticed that some Intel-based competitors scored much higher than the Lenovo 530. The reason for this was their higher single-thread performance.
| PCMark 7 Score | 6212 points | |
| PCMark 8 Home Score Accelerated v2 | 3365 points | |
| PCMark 8 Creative Score Accelerated v2 | 3430 points | |
| PCMark 8 Work Score Accelerated v2 | 4340 points | |
| PCMark 10 Score | 3402 points | |
Help | ||
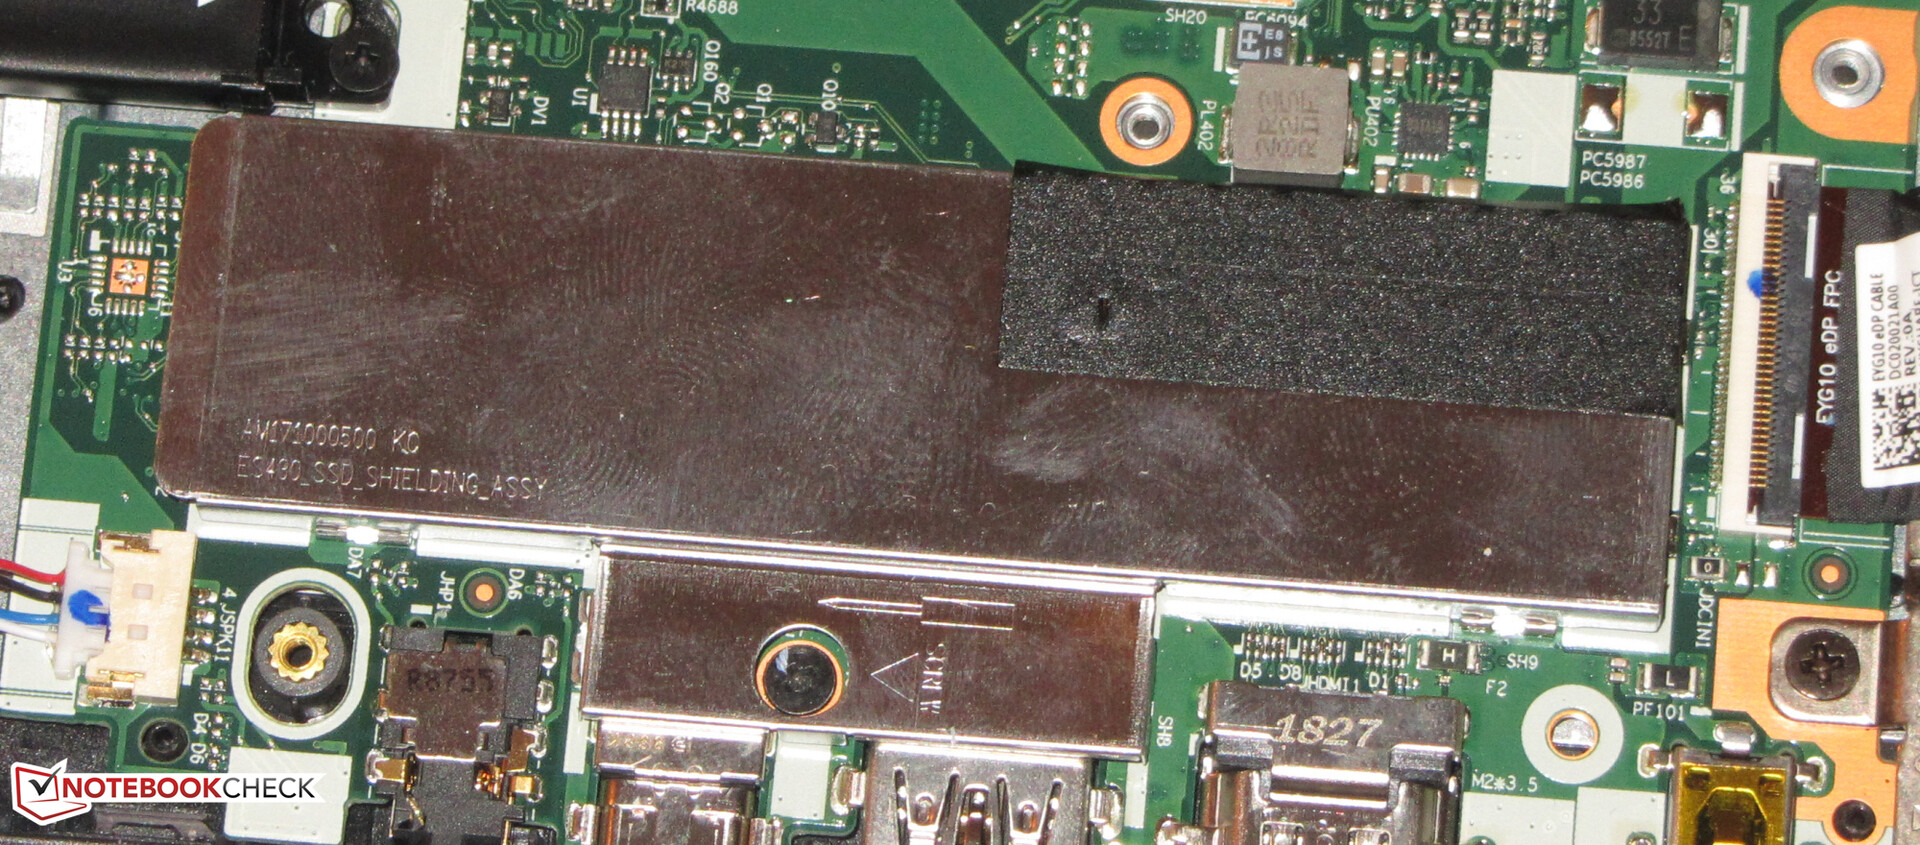
Storage Devices
The 256 GB M.2-2280 NVMe SSD is made by Hynix. Roughly 211 GB was user-accessible out of the box, with the rest taken up by the Windows installation and the recovery partition. Transfer rates were decent; however, the SSD was unable to keep up with the top dogs in this category. NVMe SSDs tend to be much faster than SATA III SSDs (max. 600 MB/s) due to the fact that they are connected to the much faster PCIe bus.

| Lenovo Yoga 530-14ARR-81H9000VGE SK hynix BC501 HFM256GDHTNG | Lenovo Yoga 530-14IKB-81EK00CWGE SK hynix PC401 HFS256GD9TNG | Asus VivoBook Flip 14 TP412UA-EC969T SanDisk SD9SN8W256G1002 | HP Pavilion x360 14-cd0002ng Toshiba KBG30ZMV256G | Dell Inspiron 14 5000 5482 2-in-1 SK Hynix BC501 NVMe 256 GB | Acer Spin 3 SP314-51-548L Micron 1100 MTFDDAV256TBN | Average SK hynix BC501 HFM256GDHTNG | |
|---|---|---|---|---|---|---|---|
| AS SSD | 10% | -112% | -15% | 30% | -26% | 18% | |
| Seq Read (MB/s) | 1168 | 2071 77% | 454.4 -61% | 1225 5% | 576 -51% | 491.1 -58% | 1384 ? 18% |
| Seq Write (MB/s) | 540 | 721 34% | 380.2 -30% | 764 41% | 471.6 -13% | 406.9 -25% | 635 ? 18% |
| 4K Read (MB/s) | 35.16 | 34.44 -2% | 26.69 -24% | 41.45 18% | 39.48 12% | 25.41 -28% | 38.2 ? 9% |
| 4K Write (MB/s) | 73.1 | 91 24% | 51.1 -30% | 90.5 24% | 112.4 54% | 77.9 7% | 90.5 ? 24% |
| 4K-64 Read (MB/s) | 512 | 448.2 -12% | 369.5 -28% | 584 14% | 522 2% | 236.1 -54% | 520 ? 2% |
| 4K-64 Write (MB/s) | 376.2 | 268.9 -29% | 136.8 -64% | 224.9 -40% | 416.5 11% | 273.6 -27% | 381 ? 1% |
| Access Time Read * (ms) | 0.07 | 0.046 34% | 0.134 -91% | 0.138 -97% | 0.046 34% | 0.091 -30% | 0.05675 ? 19% |
| Access Time Write * (ms) | 0.051 | 0.054 -6% | 0.606 -1088% | 0.229 -349% | 0.032 37% | 0.056 -10% | 0.04 ? 22% |
| Score Read (Points) | 664 | 690 4% | 442 -33% | 748 13% | 619 -7% | 311 -53% | 696 ? 5% |
| Score Write (Points) | 503 | 432 -14% | 226 -55% | 392 -22% | 576 15% | 392 -22% | 535 ? 6% |
| Score Total (Points) | 1485 | 1416 -5% | 898 -40% | 1511 2% | 1520 2% | 867 -42% | 1561 ? 5% |
| Copy ISO MB/s (MB/s) | 462.3 | 339.5 -27% | 574 24% | 773 67% | 329.8 -29% | 633 ? 37% | |
| Copy Program MB/s (MB/s) | 127.8 | 145 13% | 263.4 106% | 344.4 169% | 158.8 24% | 192.7 ? 51% | |
| Copy Game MB/s (MB/s) | 289.7 | 265.6 -8% | 424.9 47% | 536 85% | 231.9 -20% | 393 ? 36% |
* ... smaller is better
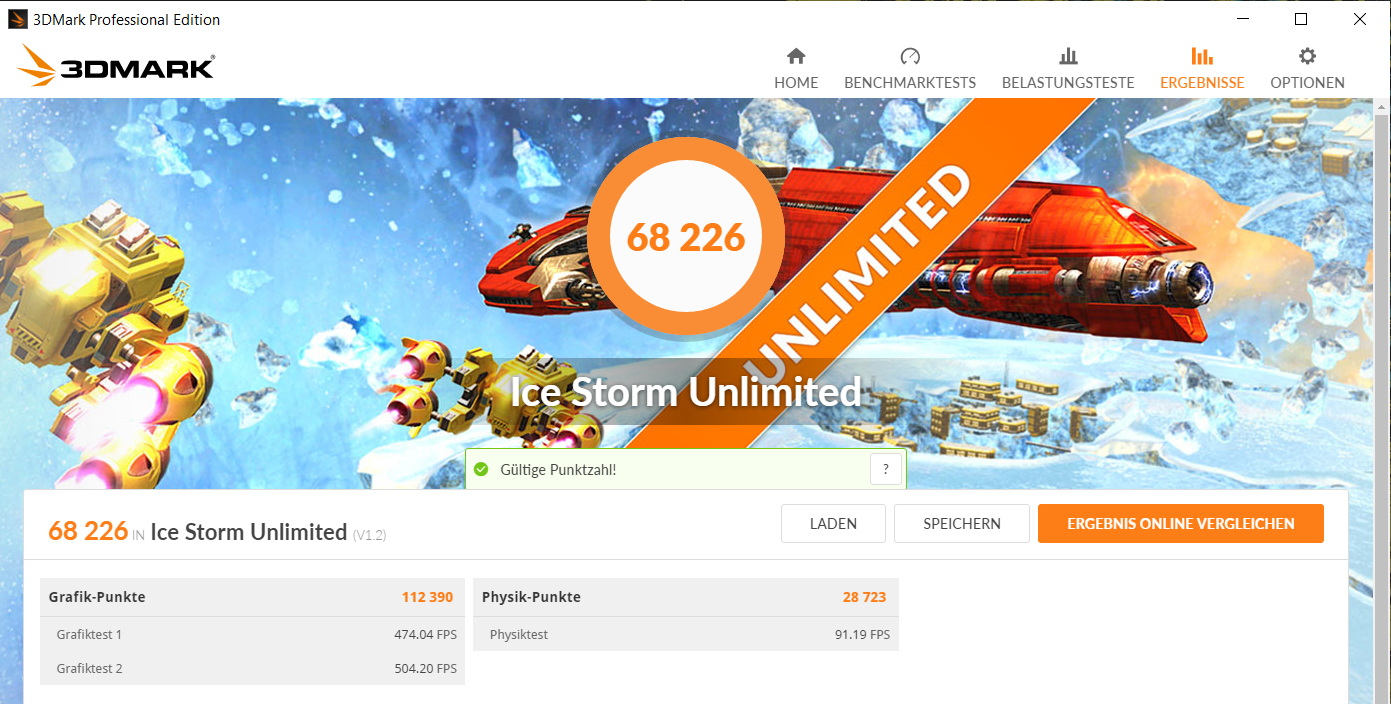
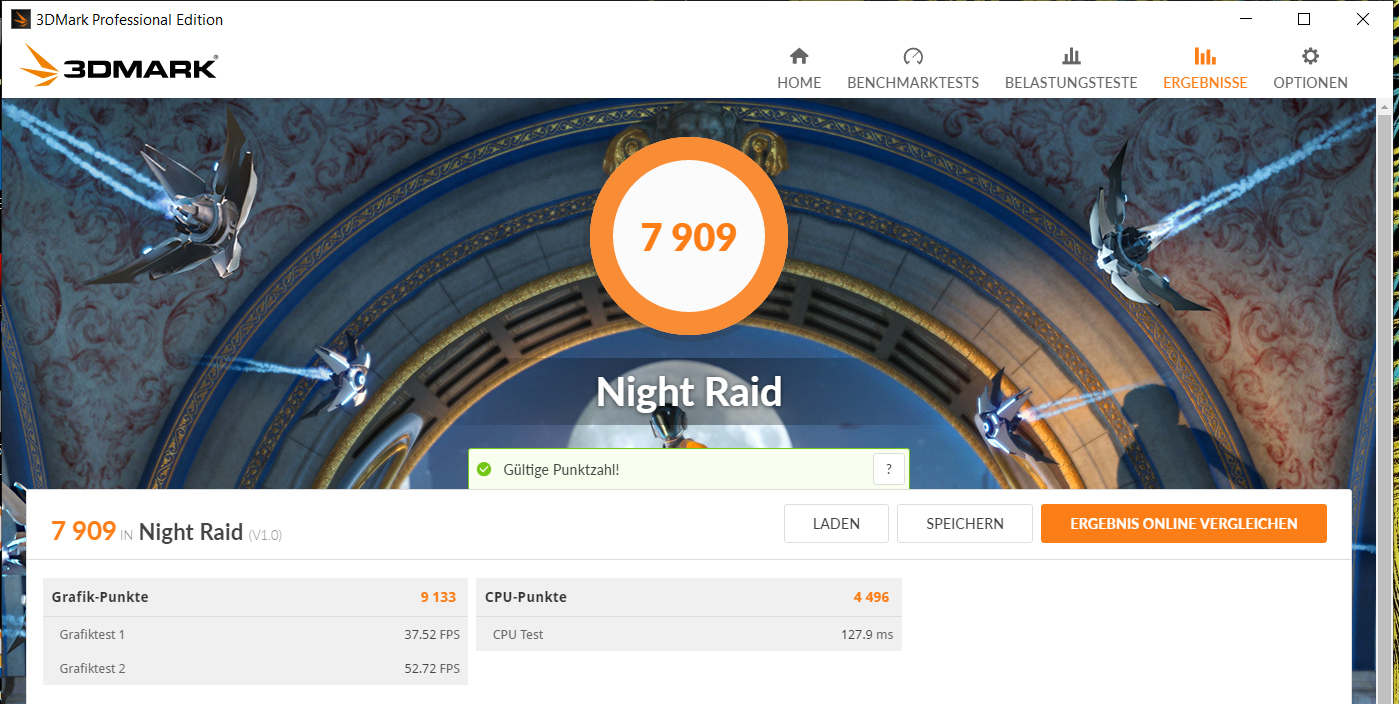
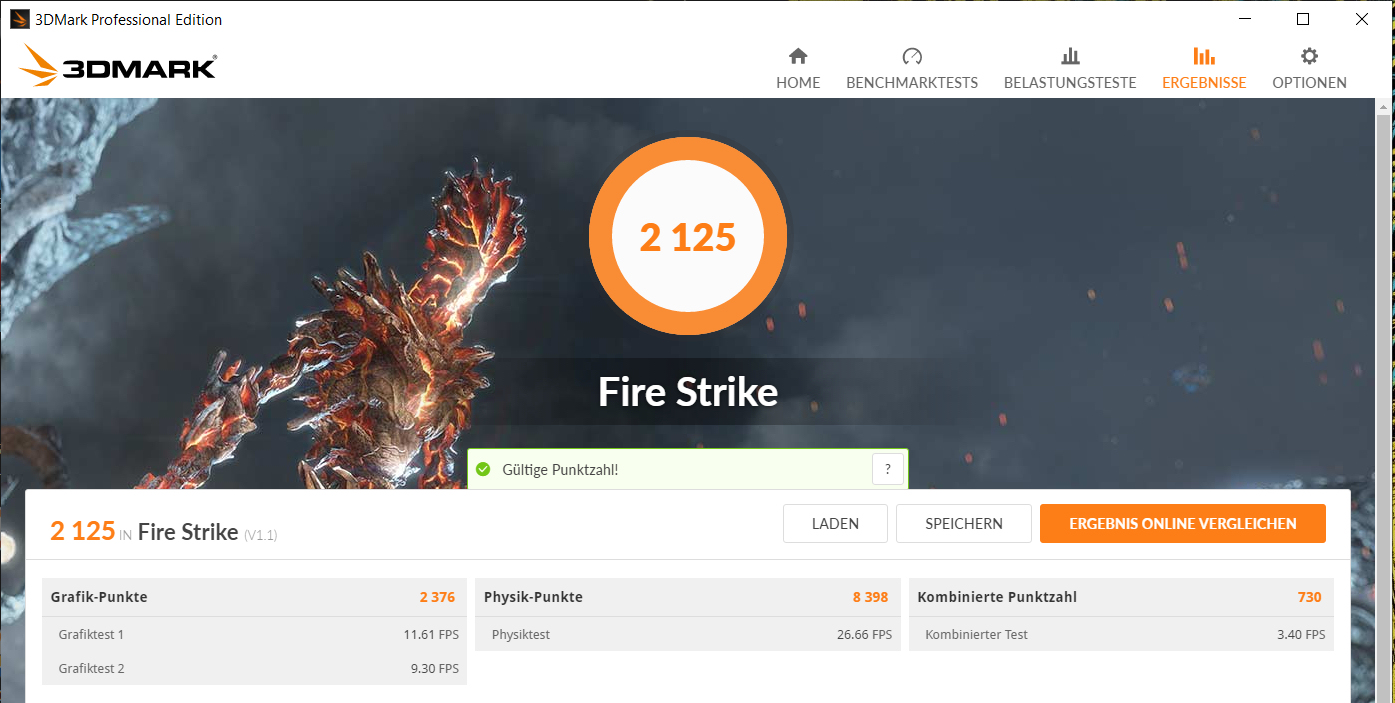
GPU Performance
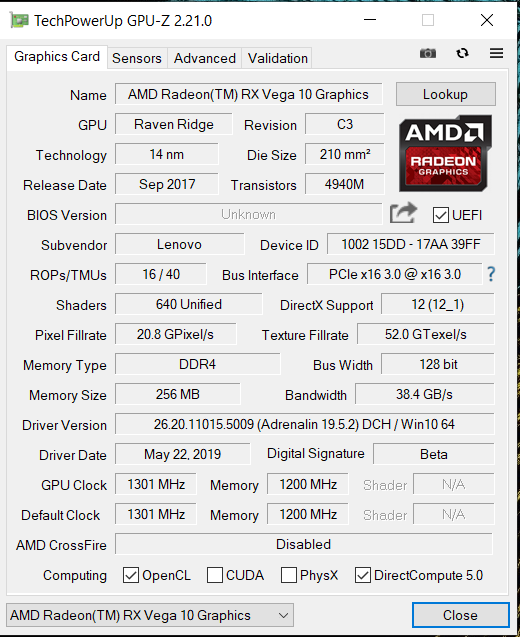
The GPU part of the installed APU is AMD’s Radeon RX Vega 10. It supports DirectX 12 and runs at speeds of up to 1,300 MHz. Its 3DMark benchmark results were among the best we were ever able to determine for this particular GPU. For example, last year’s IdeaPad 720s-13ARR scored much lower due to its massively throttled GPU and its single-channel RAM interface. GPU performance was not throttled on battery.
| 3DMark 05 Standard | 16454 points | |
| 3DMark 06 Standard Score | 14890 points | |
| 3DMark Vantage P Result | 11391 points | |
| 3DMark 11 Performance | 4045 points | |
| 3DMark Ice Storm Standard Score | 62756 points | |
| 3DMark Cloud Gate Standard Score | 12179 points | |
| 3DMark Fire Strike Score | 2125 points | |
| 3DMark Time Spy Score | 765 points | |
Help | ||
Gaming Performance
Many of the games in our database can be enjoyed smoothly on the Yoga 530, especially those that are either already a few years old or are not too demanding. Among others, this list includes games such as Dota 2 Reborn, Diablo 3, Starcraft 2, Team Fortress 2, and League of Legends. Generally speaking these can be enjoyed in HD resolution (1366x768) and medium details. Demanding and more recent 2018/2019 games are more challenging. Some, such as Apex Legends, Darksiders III, and Dirt Rally 2.0, ran smoothly in low resolutions and with minimum details.
| low | med. | high | ultra | |
|---|---|---|---|---|
| StarCraft 2 (2010) | 203.7 | 68.5 | 48.1 | 28.4 |
| The Elder Scrolls V: Skyrim (2011) | 58.8 | 47.5 | 35.4 | 23.1 |
| Diablo III (2012) | 94.1 | 76.2 | 72.3 | 52.5 |
| Counter-Strike: GO (2012) | 121.2 | 93.1 | 65.2 | 41.8 |
| BioShock Infinite (2013) | 95 | 65.9 | 54.8 | 16.8 |
| GTA V (2015) | 57.4 | 50.9 | 14.2 | 5.8 |
| The Witcher 3 (2015) | 36.5 | 24 | 13.3 | 8.3 |
| Batman: Arkham Knight (2015) | 35 | 29 | 15 | |
| Dota 2 Reborn (2015) | 53.5 | 43.9 | 34.6 | 32.9 |
| World of Warships (2015) | 78.9 | 59.2 | 39.2 | 29.7 |
| Ashes of the Singularity (2016) | 20.5 | 11.7 | 10.2 | |
| For Honor (2017) | 44.7 | 15.6 | 14.9 | |
| Ark Survival Evolved (2017) | 23.7 | 14.2 | 5.7 | |
| X-Plane 11.11 (2018) | 23.3 | 15.6 | 14.2 | |
| World of Tanks enCore (2018) | 129.7 | 43.9 | 15.6 | |
| Far Cry 5 (2018) | 25 | 12 | 11 | |
| Call of Duty Black Ops 4 (2018) | 37.3 | 16.8 | 15.8 | |
| Darksiders III (2018) | 57.7 | 16.7 | 14 | |
| Just Cause 4 (2018) | 29.2 | 17.9 | 13.3 | |
| Apex Legends (2019) | 44.6 | 18.9 | 15 | |
| Far Cry New Dawn (2019) | 22 | 12 | 11 | |
| Metro Exodus (2019) | 20.6 | 9.8 | 7 | |
| Anthem (2019) | 17.3 | 10 | 6.9 | |
| Dirt Rally 2.0 (2019) | 73.8 | 27.2 | 21.7 | 10.8 |
| The Division 2 (2019) | 33 | 14 | 10 | |
| Anno 1800 (2019) | 30.1 | 12.6 | 7.5 | |
| Rage 2 (2019) | 24.8 | 11.7 | 7.1 | |
| League of Legends (2019) | 85.2 | 67.3 | 58.6 | 58 |
| The Witcher 3 - 1024x768 Low Graphics & Postprocessing | |
| Average of class Convertible (22 - 124.6, n=3, last 2 years) | |
| Average AMD Radeon RX Vega 10 (29.7 - 53.8, n=8) | |
| Lenovo Yoga 530-14ARR-81H9000VGE | |
| HP Pavilion x360 14-cd0002ng | |
| Dota 2 Reborn - 1366x768 med (1/3) | |
| Average of class Convertible (38.2 - 192.3, n=49, last 2 years) | |
| Average AMD Radeon RX Vega 10 (32.6 - 63, n=10) | |
| Lenovo Yoga 530-14ARR-81H9000VGE | |
| Dirt Rally 2.0 - 1280x720 Ultra Low Preset AF:2x | |
| Lenovo Yoga 530-14ARR-81H9000VGE | |
| Average AMD Radeon RX Vega 10 (n=1) | |
| Asus VivoBook Flip 14 TP412UA-EC969T | |
Emissions
System Noise
Overall, the Yoga 530 remained fairly quiet. The fan was off when idle, and the device was completely silent as a result. Once the fan revved up it remained almost inaudible and only became noticeable under load. The maximum noise level determined during our stress test was a very decent 36.5 dB(A).
Noise level
| Idle |
| 30.6 / 30.6 / 30.8 dB(A) |
| Load |
| 36.1 / 36.5 dB(A) |
 | ||
30 dB silent 40 dB(A) audible 50 dB(A) loud |
||
min: | ||
| Lenovo Yoga 530-14ARR-81H9000VGE R7 2700U, Vega 10 | Lenovo Yoga 530-14IKB-81EK00CWGE i5-8250U, UHD Graphics 620 | Asus VivoBook Flip 14 TP412UA-EC969T i3-8130U, UHD Graphics 620 | HP Pavilion x360 14-cd0002ng i3-8130U, UHD Graphics 620 | Dell Inspiron 14 5000 5482 2-in-1 i7-8565U, UHD Graphics 620 | Acer Spin 3 SP314-51-548L i5-8250U, UHD Graphics 620 | Average AMD Radeon RX Vega 10 | Average of class Convertible | |
|---|---|---|---|---|---|---|---|---|
| Noise | 2% | 0% | -1% | 5% | -3% | 3% | 11% | |
| off / environment * (dB) | 30.6 | 30.3 1% | 30.7 -0% | 30.2 1% | 28.2 8% | 30 2% | 29.5 ? 4% | 24.1 ? 21% |
| Idle Minimum * (dB) | 30.6 | 30.3 1% | 30.7 -0% | 31 -1% | 28.2 8% | 30 2% | 29.5 ? 4% | 24.3 ? 21% |
| Idle Average * (dB) | 30.6 | 30.3 1% | 30.7 -0% | 31 -1% | 28.2 8% | 30 2% | 29.5 ? 4% | 24.7 ? 19% |
| Idle Maximum * (dB) | 30.8 | 30.3 2% | 31 -1% | 31 -1% | 29.4 5% | 30 3% | 30.1 ? 2% | 25.4 ? 18% |
| Load Average * (dB) | 36.1 | 36.1 -0% | 33.9 6% | 36.5 -1% | 35.8 1% | 38.5 -7% | 34.6 ? 4% | 35.2 ? 2% |
| Load Maximum * (dB) | 36.5 | 33.9 7% | 37.5 -3% | 36.6 -0% | 35.8 2% | 44 -21% | 37.5 ? -3% | 42.5 ? -16% |
* ... smaller is better
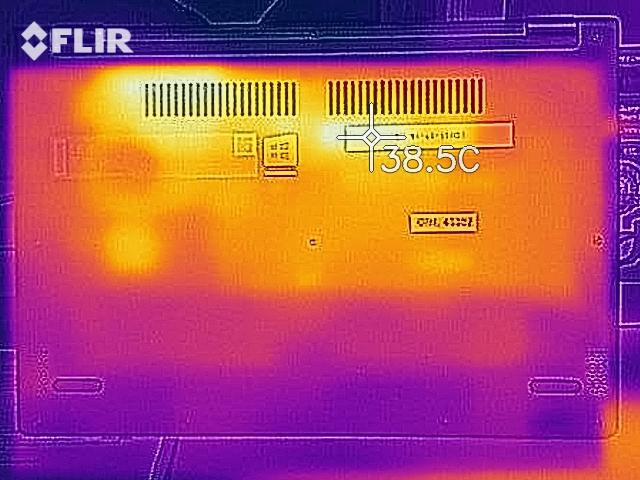
Temperature
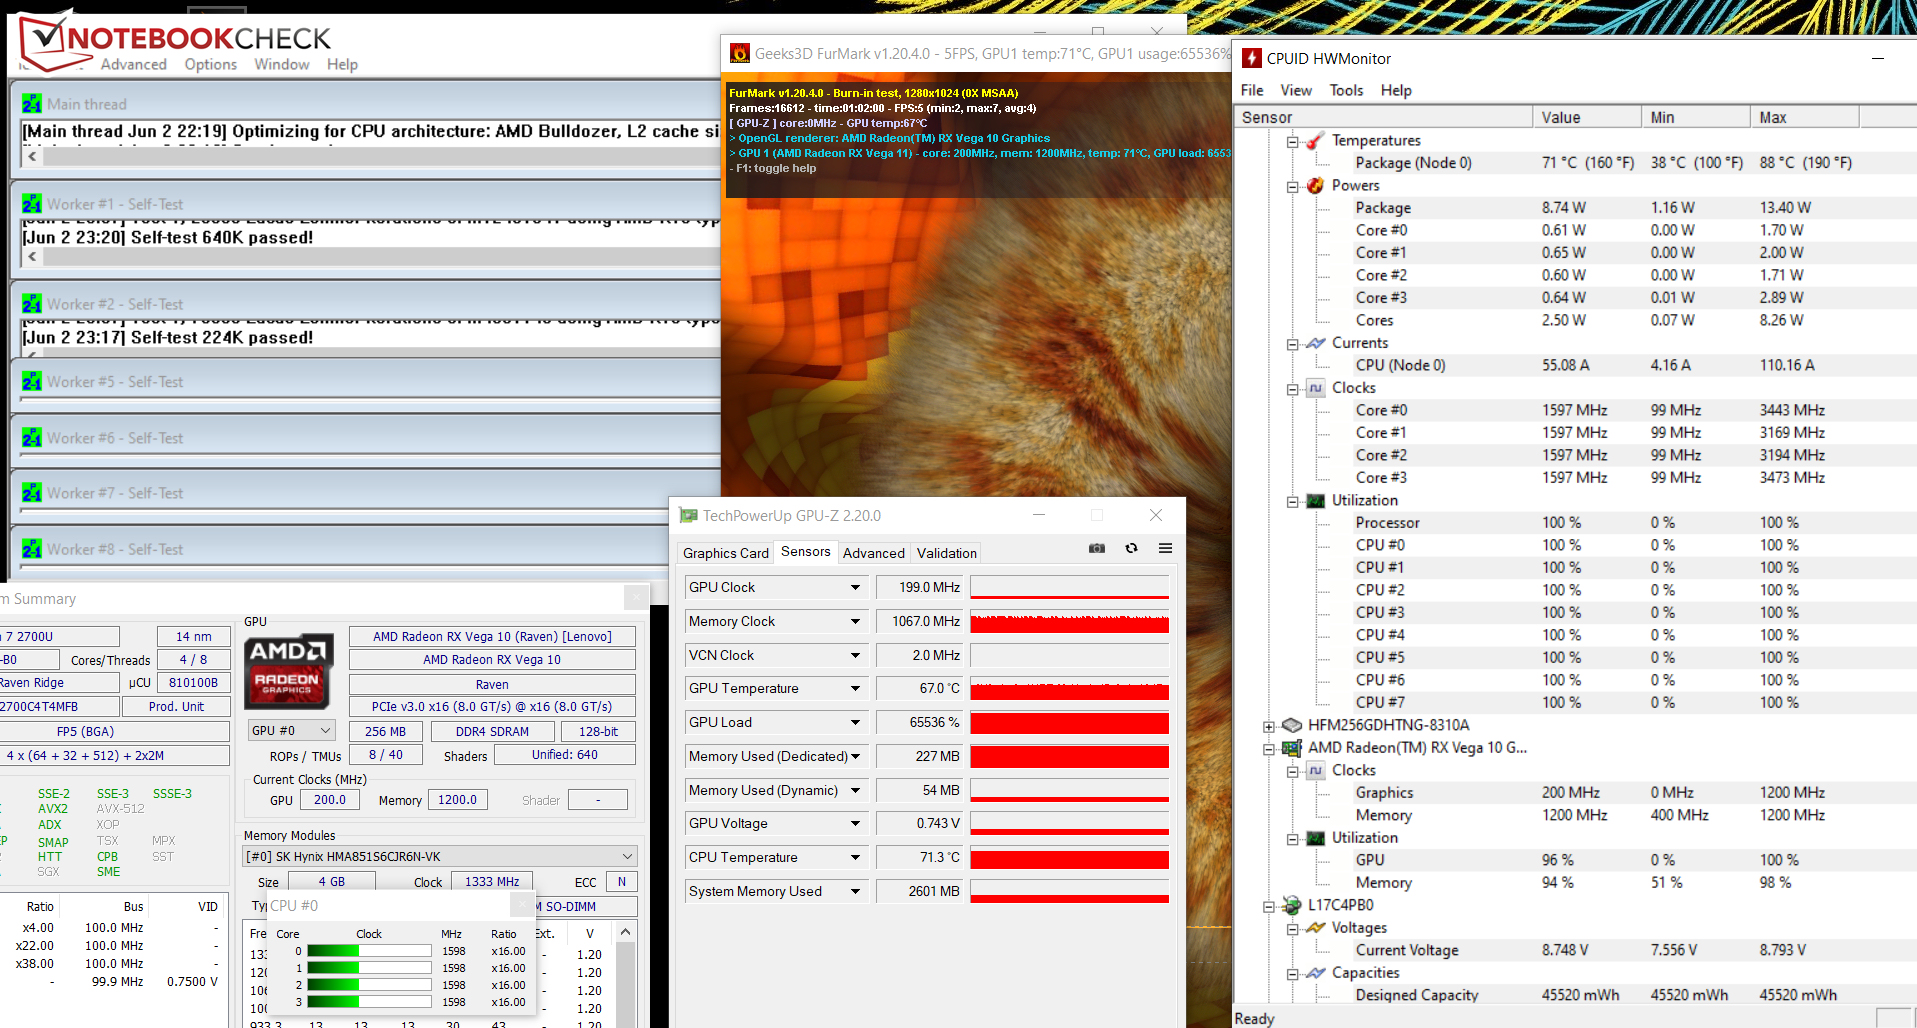
The Yoga 530 completed our stress test (Prime95 and FurMark run simultaneously for at least one hour) identically on mains and battery. During the first few minutes, the CPU and GPU ran at 2.6 - 2.8 GHz and 300 - 600 MHz, respectively. Afterwards, they slowed down to just 1.6 GHz and 200 MHz and remained at this level throughout the remainder of the test. Keep in mind that the load produced by our stress test rarely ever occurs in the real world. We use this test to determine potential stability issues under maximum load.
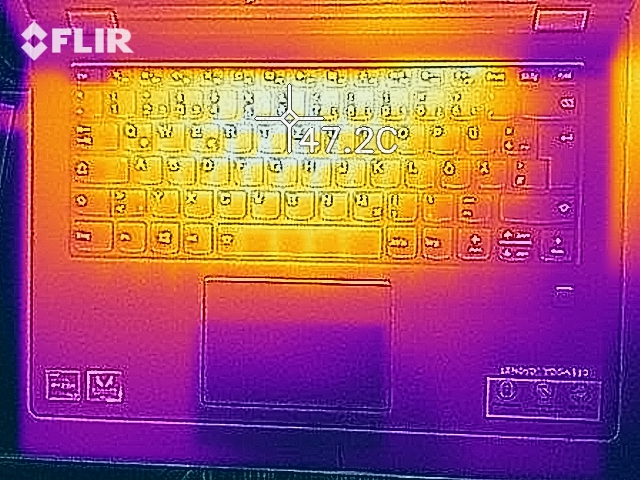
In addition to remaining fairly quiet, Lenovo’s tablet also remained comparatively cool. We found two hot spots of more than 40 °C during our stress test, and all things considered the AMD SKU got a little bit warmer than the Intel SKU. It remained inconspicuous under realistic conditions.
(+) The maximum temperature on the upper side is 39.9 °C / 104 F, compared to the average of 35.4 °C / 96 F, ranging from 19.6 to 60 °C for the class Convertible.
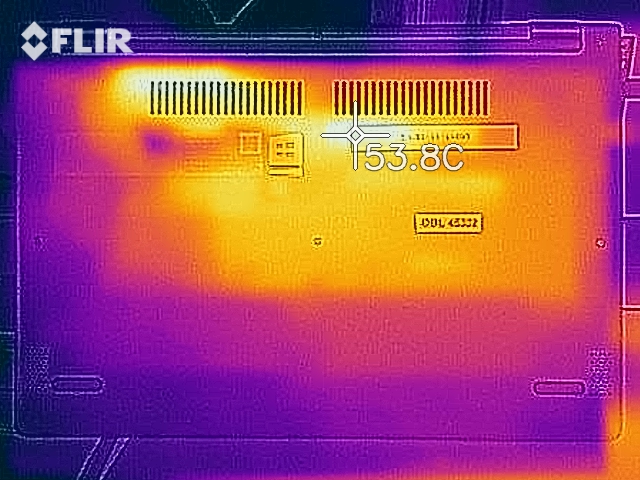
(±) The bottom heats up to a maximum of 44.6 °C / 112 F, compared to the average of 36.9 °C / 98 F
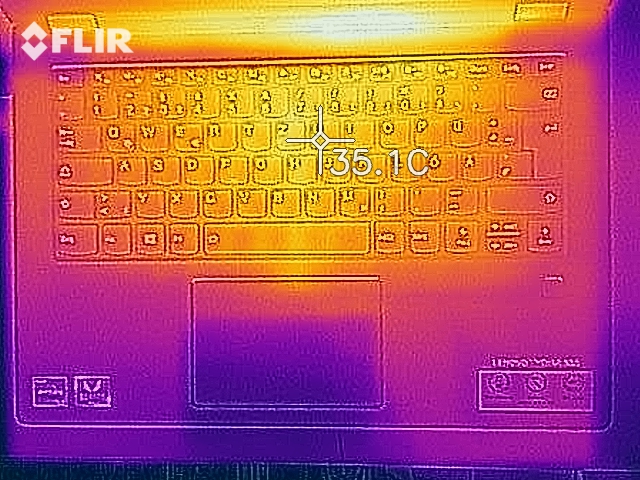
(+) In idle usage, the average temperature for the upper side is 26.7 °C / 80 F, compared to the device average of 30.3 °C / 87 F.
(+) The palmrests and touchpad are cooler than skin temperature with a maximum of 27.6 °C / 81.7 F and are therefore cool to the touch.
(±) The average temperature of the palmrest area of similar devices was 28 °C / 82.4 F (+0.4 °C / 0.7 F).
| Lenovo Yoga 530-14ARR-81H9000VGE R7 2700U, Vega 10 | Lenovo Yoga 530-14IKB-81EK00CWGE i5-8250U, UHD Graphics 620 | Asus VivoBook Flip 14 TP412UA-EC969T i3-8130U, UHD Graphics 620 | HP Pavilion x360 14-cd0002ng i3-8130U, UHD Graphics 620 | Dell Inspiron 14 5000 5482 2-in-1 i7-8565U, UHD Graphics 620 | Acer Spin 3 SP314-51-548L i5-8250U, UHD Graphics 620 | Average AMD Radeon RX Vega 10 | Average of class Convertible | |
|---|---|---|---|---|---|---|---|---|
| Heat | 15% | 13% | 13% | 8% | -2% | 4% | 4% | |
| Maximum Upper Side * (°C) | 39.9 | 35 12% | 36 10% | 33.7 16% | 33.2 17% | 44.1 -11% | 40.9 ? -3% | 42.1 ? -6% |
| Maximum Bottom * (°C) | 44.6 | 35.6 20% | 37.3 16% | 41.6 7% | 42.6 4% | 41.6 7% | 41.8 ? 6% | 43.7 ? 2% |
| Idle Upper Side * (°C) | 29.2 | 25.4 13% | 28.2 3% | 26 11% | 26.8 8% | 28.4 ? 3% | 27.5 ? 6% | |
| Idle Bottom * (°C) | 32.2 | 27 16% | 25.2 22% | 26.7 17% | 31.6 2% | 29.6 ? 8% | 28.4 ? 12% |
* ... smaller is better
Speaker
Lenovo Yoga 530-14ARR-81H9000VGE audio analysis
(-) | not very loud speakers (70.1 dB)
Bass 100 - 315 Hz
(-) | nearly no bass - on average 18.9% lower than median
(±) | linearity of bass is average (13.8% delta to prev. frequency)
Mids 400 - 2000 Hz
(+) | balanced mids - only 4.8% away from median
(±) | linearity of mids is average (9.1% delta to prev. frequency)
Highs 2 - 16 kHz
(+) | balanced highs - only 1.5% away from median
(+) | highs are linear (4.9% delta to prev. frequency)
Overall 100 - 16.000 Hz
(±) | linearity of overall sound is average (21.1% difference to median)
Compared to same class
» 56% of all tested devices in this class were better, 11% similar, 32% worse
» The best had a delta of 6%, average was 20%, worst was 57%
Compared to all devices tested
» 59% of all tested devices were better, 7% similar, 34% worse
» The best had a delta of 4%, average was 23%, worst was 134%
Energy Management
Power Consumption
We found no issues with the device’s power consumption. Maximum power consumption when idle was just 7.8 W, which is very similar to the Yoga’s Intel-equipped SKU. Under load, power consumption was first measured at 49 W but subsequently decreased due to CPU and GPU throttling. The power supply is rated at 65 W.
| Off / Standby | |
| Idle | |
| Load |
|
Key:
min: | |
| Lenovo Yoga 530-14ARR-81H9000VGE R7 2700U, Vega 10 | Lenovo Yoga 530-14IKB-81EK00CWGE i5-8250U, UHD Graphics 620 | Asus VivoBook Flip 14 TP412UA-EC969T i3-8130U, UHD Graphics 620 | HP Pavilion x360 14-cd0002ng i3-8130U, UHD Graphics 620 | Dell Inspiron 14 5000 5482 2-in-1 i7-8565U, UHD Graphics 620 | Acer Spin 3 SP314-51-548L i5-8250U, UHD Graphics 620 | Average AMD Radeon RX Vega 10 | Average of class Convertible | |
|---|---|---|---|---|---|---|---|---|
| Power Consumption | 16% | 9% | 12% | 2% | 27% | -9% | -19% | |
| Idle Minimum * (Watt) | 4.3 | 3.3 23% | 2.8 35% | 3.9 9% | 3.4 21% | 2.9 33% | 4.73 ? -10% | 4.28 ? -0% |
| Idle Average * (Watt) | 6.4 | 5.8 9% | 5.4 16% | 5.9 8% | 6.4 -0% | 5.2 19% | 7.61 ? -19% | 6.96 ? -9% |
| Idle Maximum * (Watt) | 7.8 | 8 -3% | 8.4 -8% | 7.1 9% | 7.8 -0% | 5.4 31% | 9.63 ? -23% | 8.67 ? -11% |
| Load Average * (Watt) | 34 | 29.2 14% | 38 -12% | 29.4 14% | 36.7 -8% | 29.4 14% | 33.3 ? 2% | 45.1 ? -33% |
| Load Maximum * (Watt) | 47.8 | 31.1 35% | 40.3 16% | 39 18% | 49.3 -3% | 29.6 38% | 45.1 ? 6% | 67.7 ? -42% |
* ... smaller is better
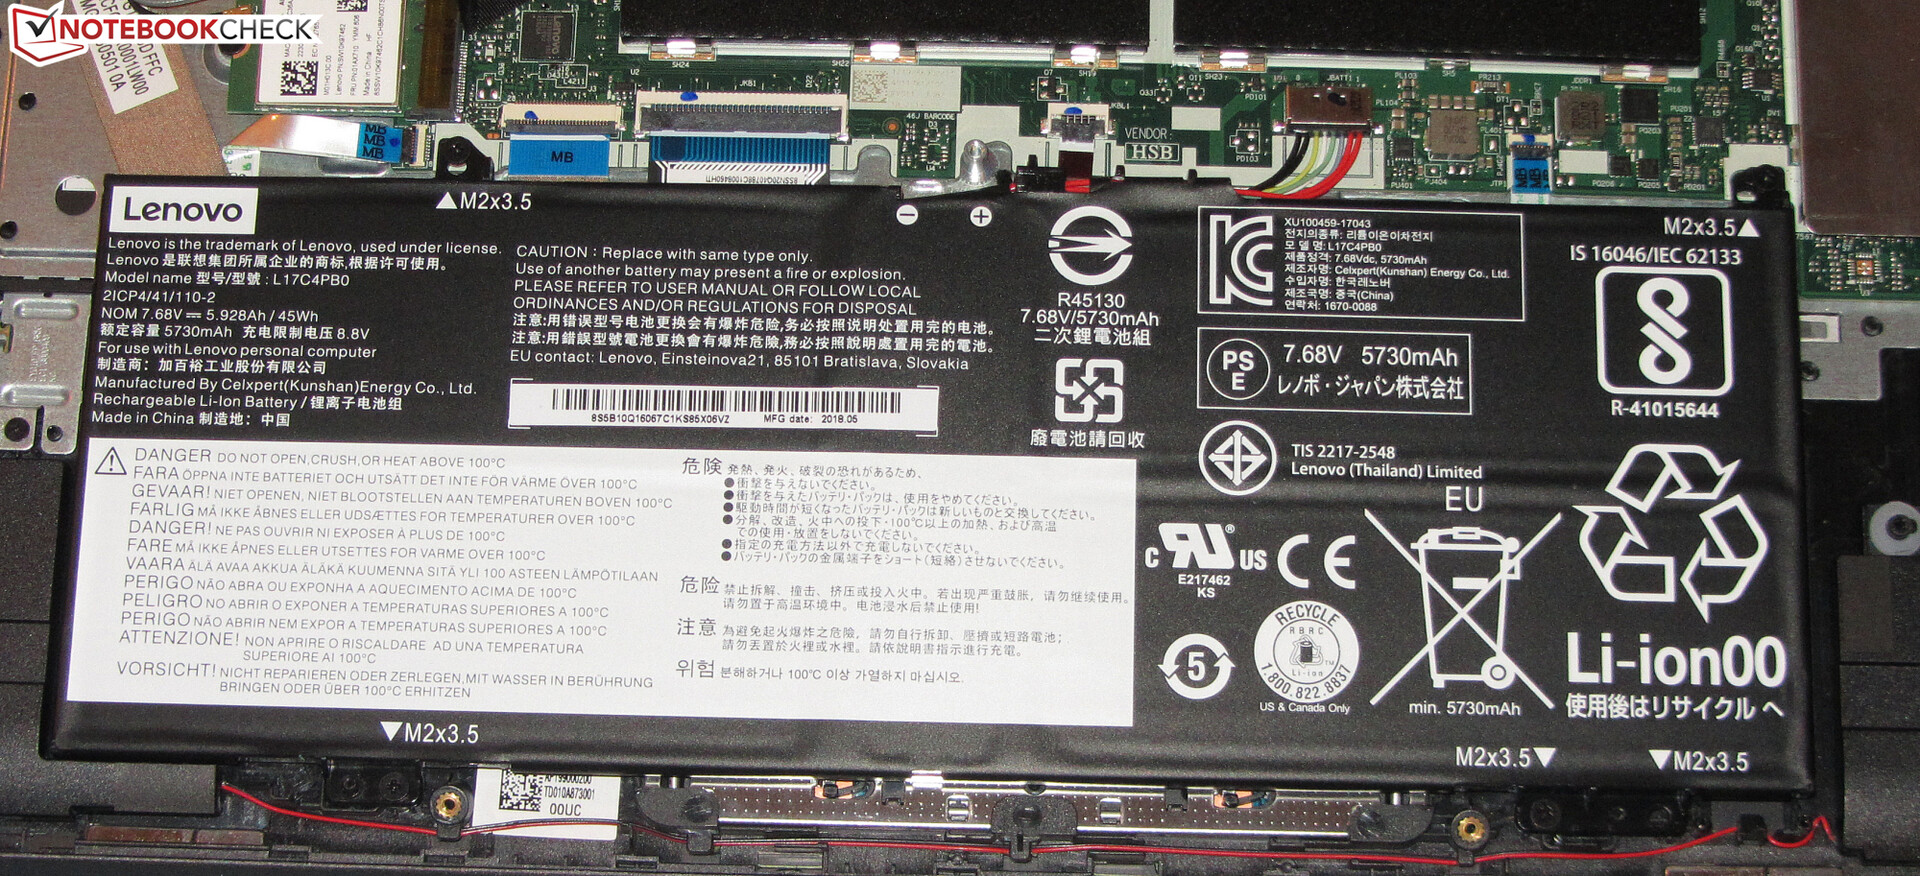
Battery Life
In our real-world Wi-Fi test the Yoga 530-14ARR lasted for 6:41 hours. In this test, we simulate typical web-browsing load by loading various websites via a script. The energy plan is set to Balanced, all power-saving features are disabled, and display brightness is normalized to 150 nits. In the video playback test it lasted for 7:38 hours. In this test we run the Big Buck Bunny short film (H.264, 1920x1080) in a loop. The energy plan is set to Power Saver, all wireless modems and power-saving features are disabled, and display brightness is once again normalized to 150 nits.
All things considered, Lenovo’s convertible offered decent battery life. However, it was outrun by its Intel-powered sibling.
| Lenovo Yoga 530-14ARR-81H9000VGE R7 2700U, Vega 10, 45 Wh | Lenovo Yoga 530-14IKB-81EK00CWGE i5-8250U, UHD Graphics 620, 45 Wh | Asus VivoBook Flip 14 TP412UA-EC969T i3-8130U, UHD Graphics 620, 42 Wh | HP Pavilion x360 14-cd0002ng i3-8130U, UHD Graphics 620, 41 Wh | Dell Inspiron 14 5000 5482 2-in-1 i7-8565U, UHD Graphics 620, 42 Wh | Acer Spin 3 SP314-51-548L i5-8250U, UHD Graphics 620, 52.5 Wh | Average of class Convertible | |
|---|---|---|---|---|---|---|---|
| Battery runtime | 13% | 3% | 0% | -3% | 24% | 74% | |
| Reader / Idle (h) | 11.7 | 15.3 31% | 12.7 9% | 12.4 6% | 26.7 ? 128% | ||
| H.264 (h) | 7.6 | 9.1 20% | 5.4 -29% | 15 ? 97% | |||
| WiFi v1.3 (h) | 6.7 | 7 4% | 6.9 3% | 7.4 10% | 7.2 7% | 8.3 24% | 12 ? 79% |
| Load (h) | 1.9 | 1.8 -5% | 2.1 11% | 1.5 -21% | 1.713 ? -10% |
Pros
Cons
Verdict
Lenovo’s Yoga 530-14ARR is a well-made 14-inch device squeezed into a sleek and compact plastic/metal case. Its Ryzen APU performed very well and was able to outperform its Intel-equipped competitor by a significant margin in our GPU benchmarks and keep up with it in our multithread CPU benchmarks. However, Intel’s i5 and i7 CPUs remain the faster choice for single-thread workloads.
The convertible has everything you need for office use: a powerful processor, a fast SSD, dual-channel RAM, and an excellent backlit keyboard. It is comparatively cool and quiet regardless of load, and battery life was decent.
Lenovo’s Yoga 530-14ARR is a well-made decent convertible. However, it is not perfect.
While the IPS touchscreen display offered a decent contrast ratio and wide viewing angles, its maximum brightness was not nearly high enough. As a result, it was practically unusable outdoors. Its color-space coverage was also subpar. On the plus side the touchscreen supports stylus input via the optional Lenovo Active Pen in addition to finger input.
Its major downsides, however, circle around the issue of connectivity. The Wi-Fi modem is too slow, as is the integrated card reader. The USB-C port only supports USB peripherals and does not carry a DisplayPort signal, nor can it be used to charge the convertible via USB power delivery. The latter is something we simply have come to expect of mobile and compact devices in 2019.
Lenovo Yoga 530-14ARR-81H9000VGE
- 06/11/2019 v6 (old)
Sascha Mölck
Price comparison

