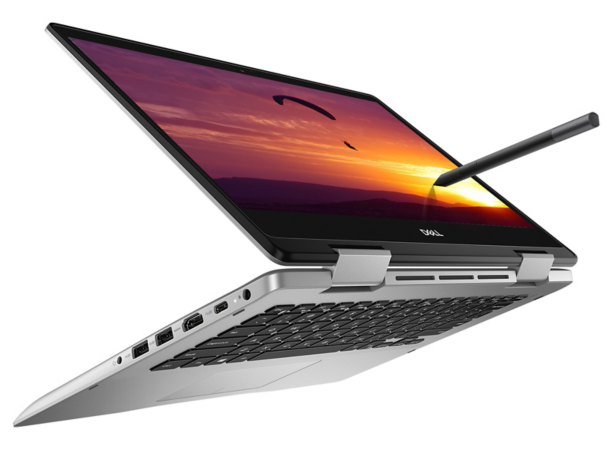
Dell Inspiron 14 5000 5482 2-in-1 (i7-8565U) Convertible Review
The refreshed Inspiron 5000 series was unveiled at IFA 2018 and, as promised, Dell has already begun shipping the new affordable models just in time for the Holiday shopping season. The system we have here today is the 14-inch Inspiron 14 5482 2-in-1 equipped with a brand new Whiskey Lake-U CPU. The model can be configured for as low as $580 USD with a Core i3-8145U CPU, 1 TB HDD, and 4 GB of RAM or as high as $1080 USD with a Core i7-8565U CPU, 512 GB NVMe SSD, and 16 GB of RAM. All current SKUs are otherwise identical when it comes to the 1080p display.
The Inspiron 14 5482 convertible competes directly against other budget-mainstream convertibles like the Lenovo Yoga 530, Asus VivoBook Flip 14, HP Pavilion x360 14, or the Acer Spin series. We'll be seeing how the Dell convertible compares against these alternatives and the kinds of performance benefits users can expect from Intel's new line of Whiskey Lake-U CPUs.
More Dell Inspiron reviews:
Case
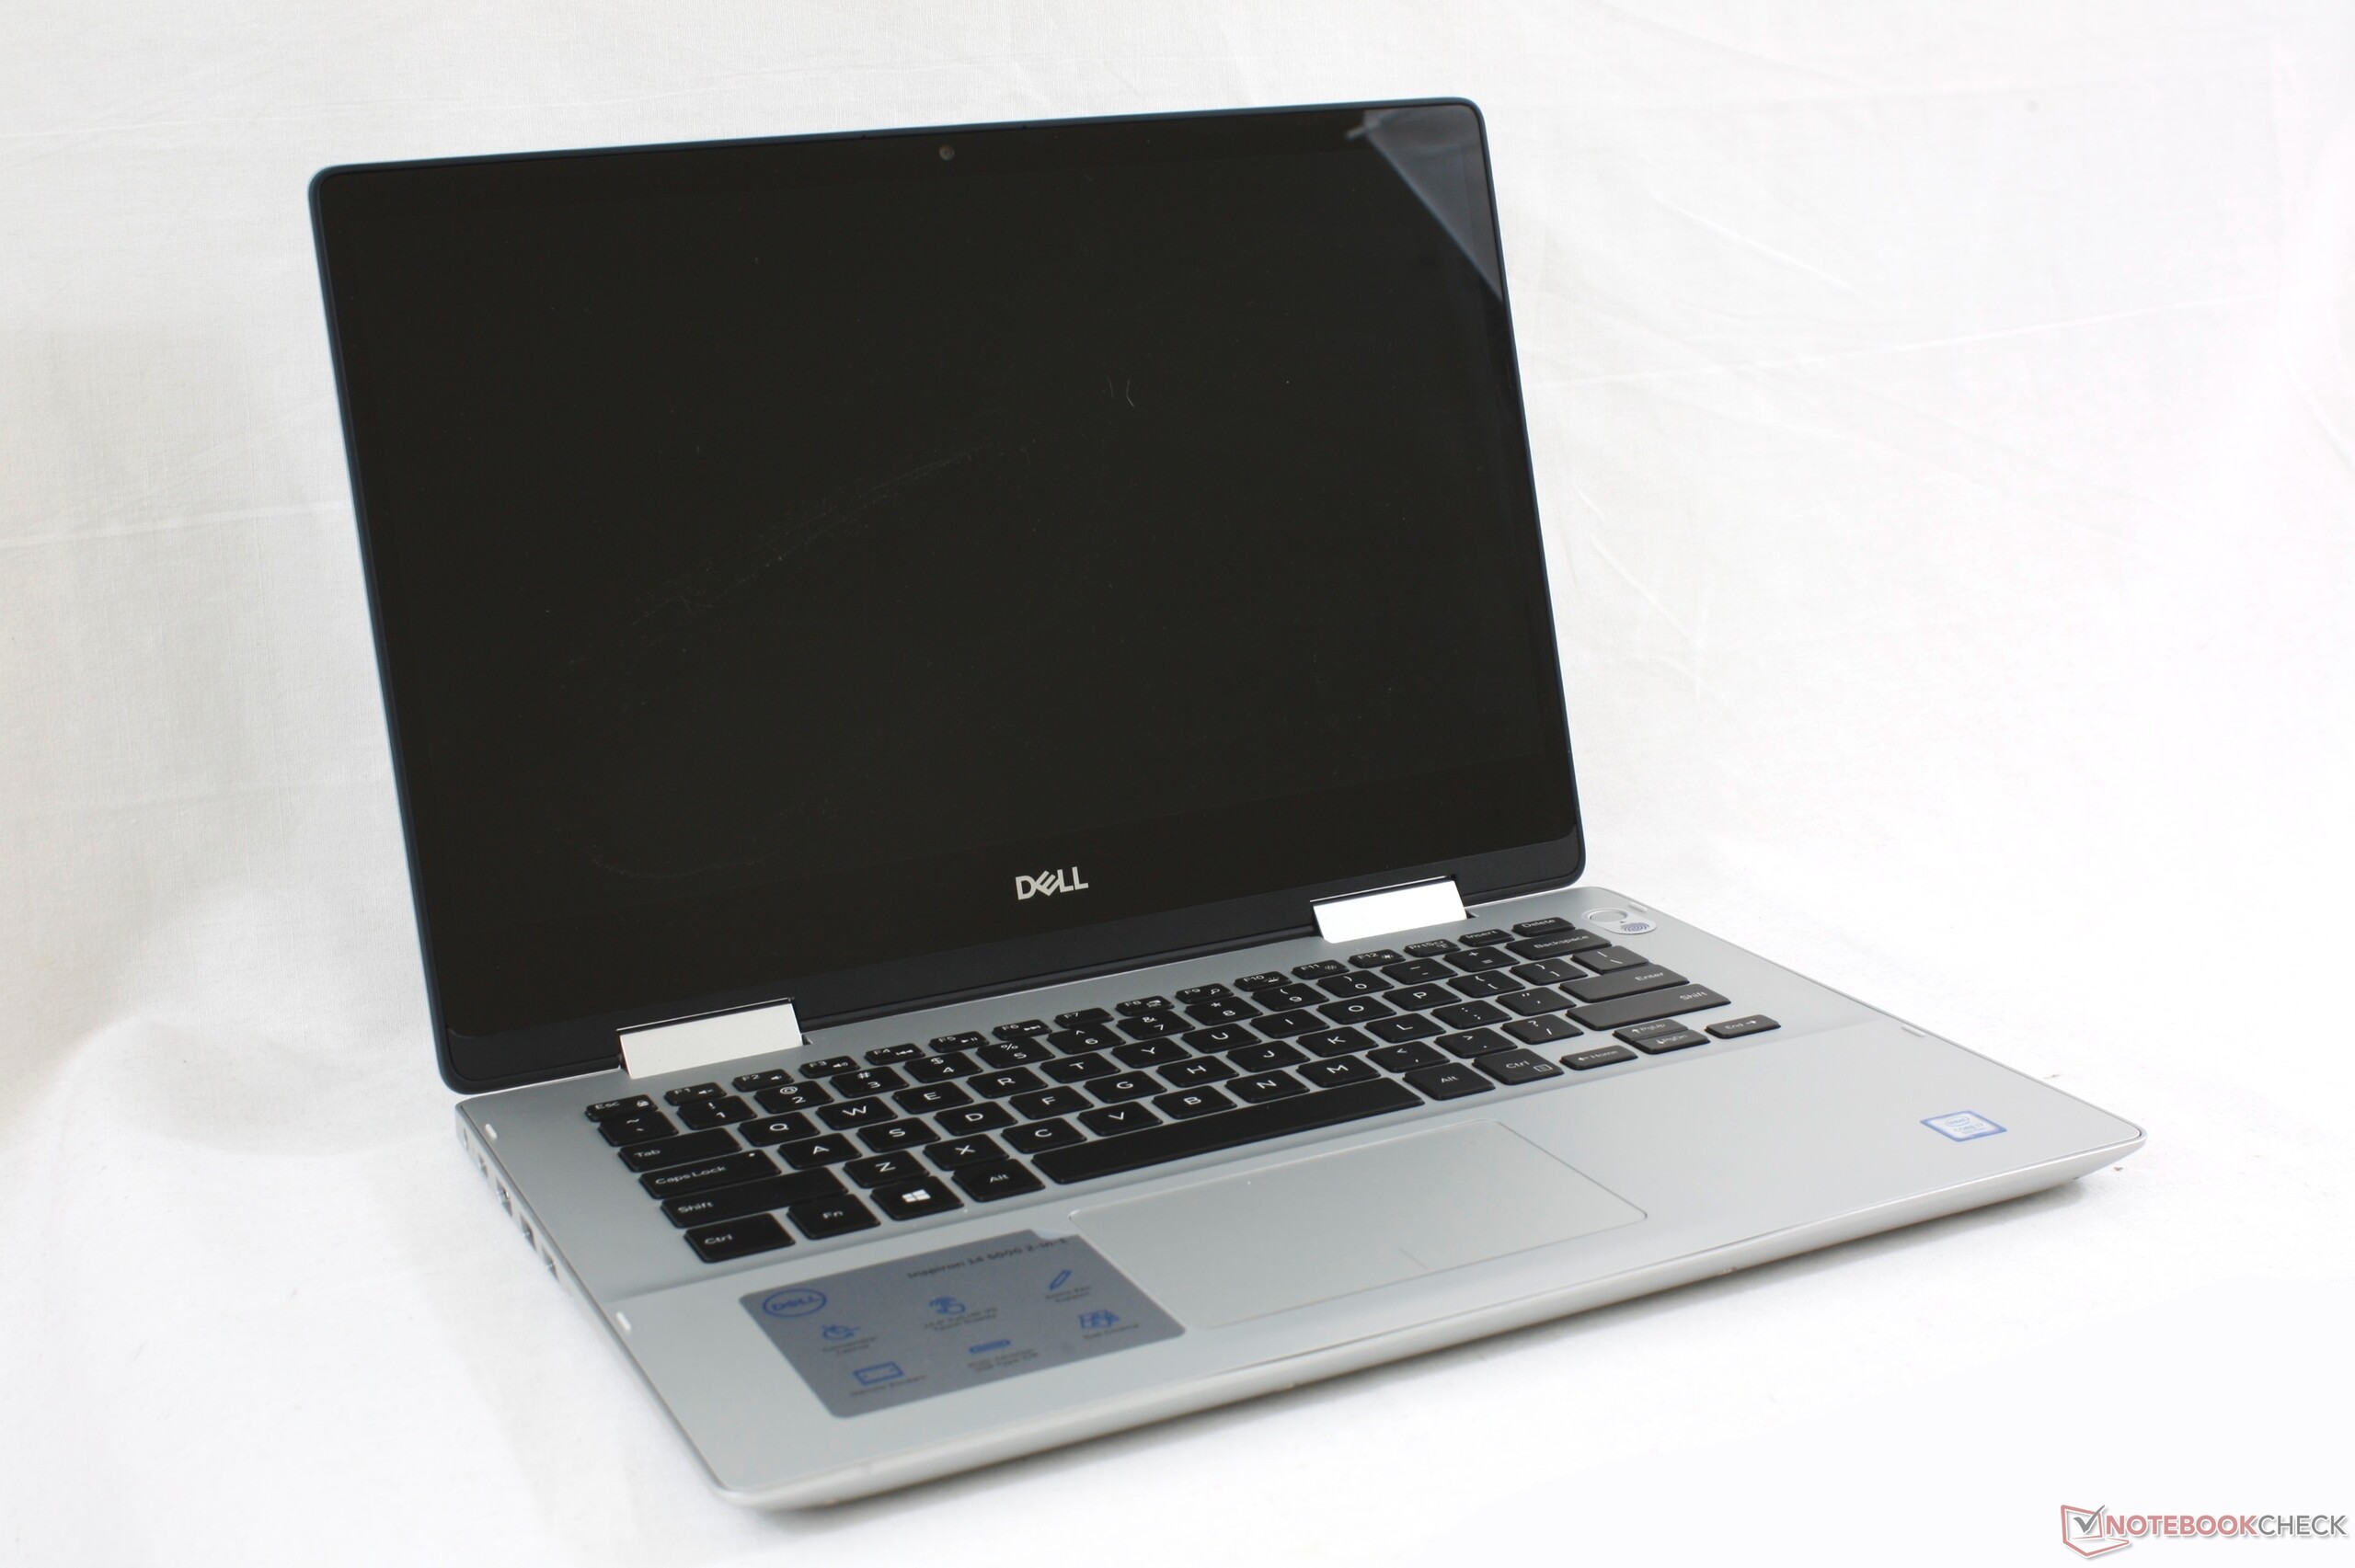
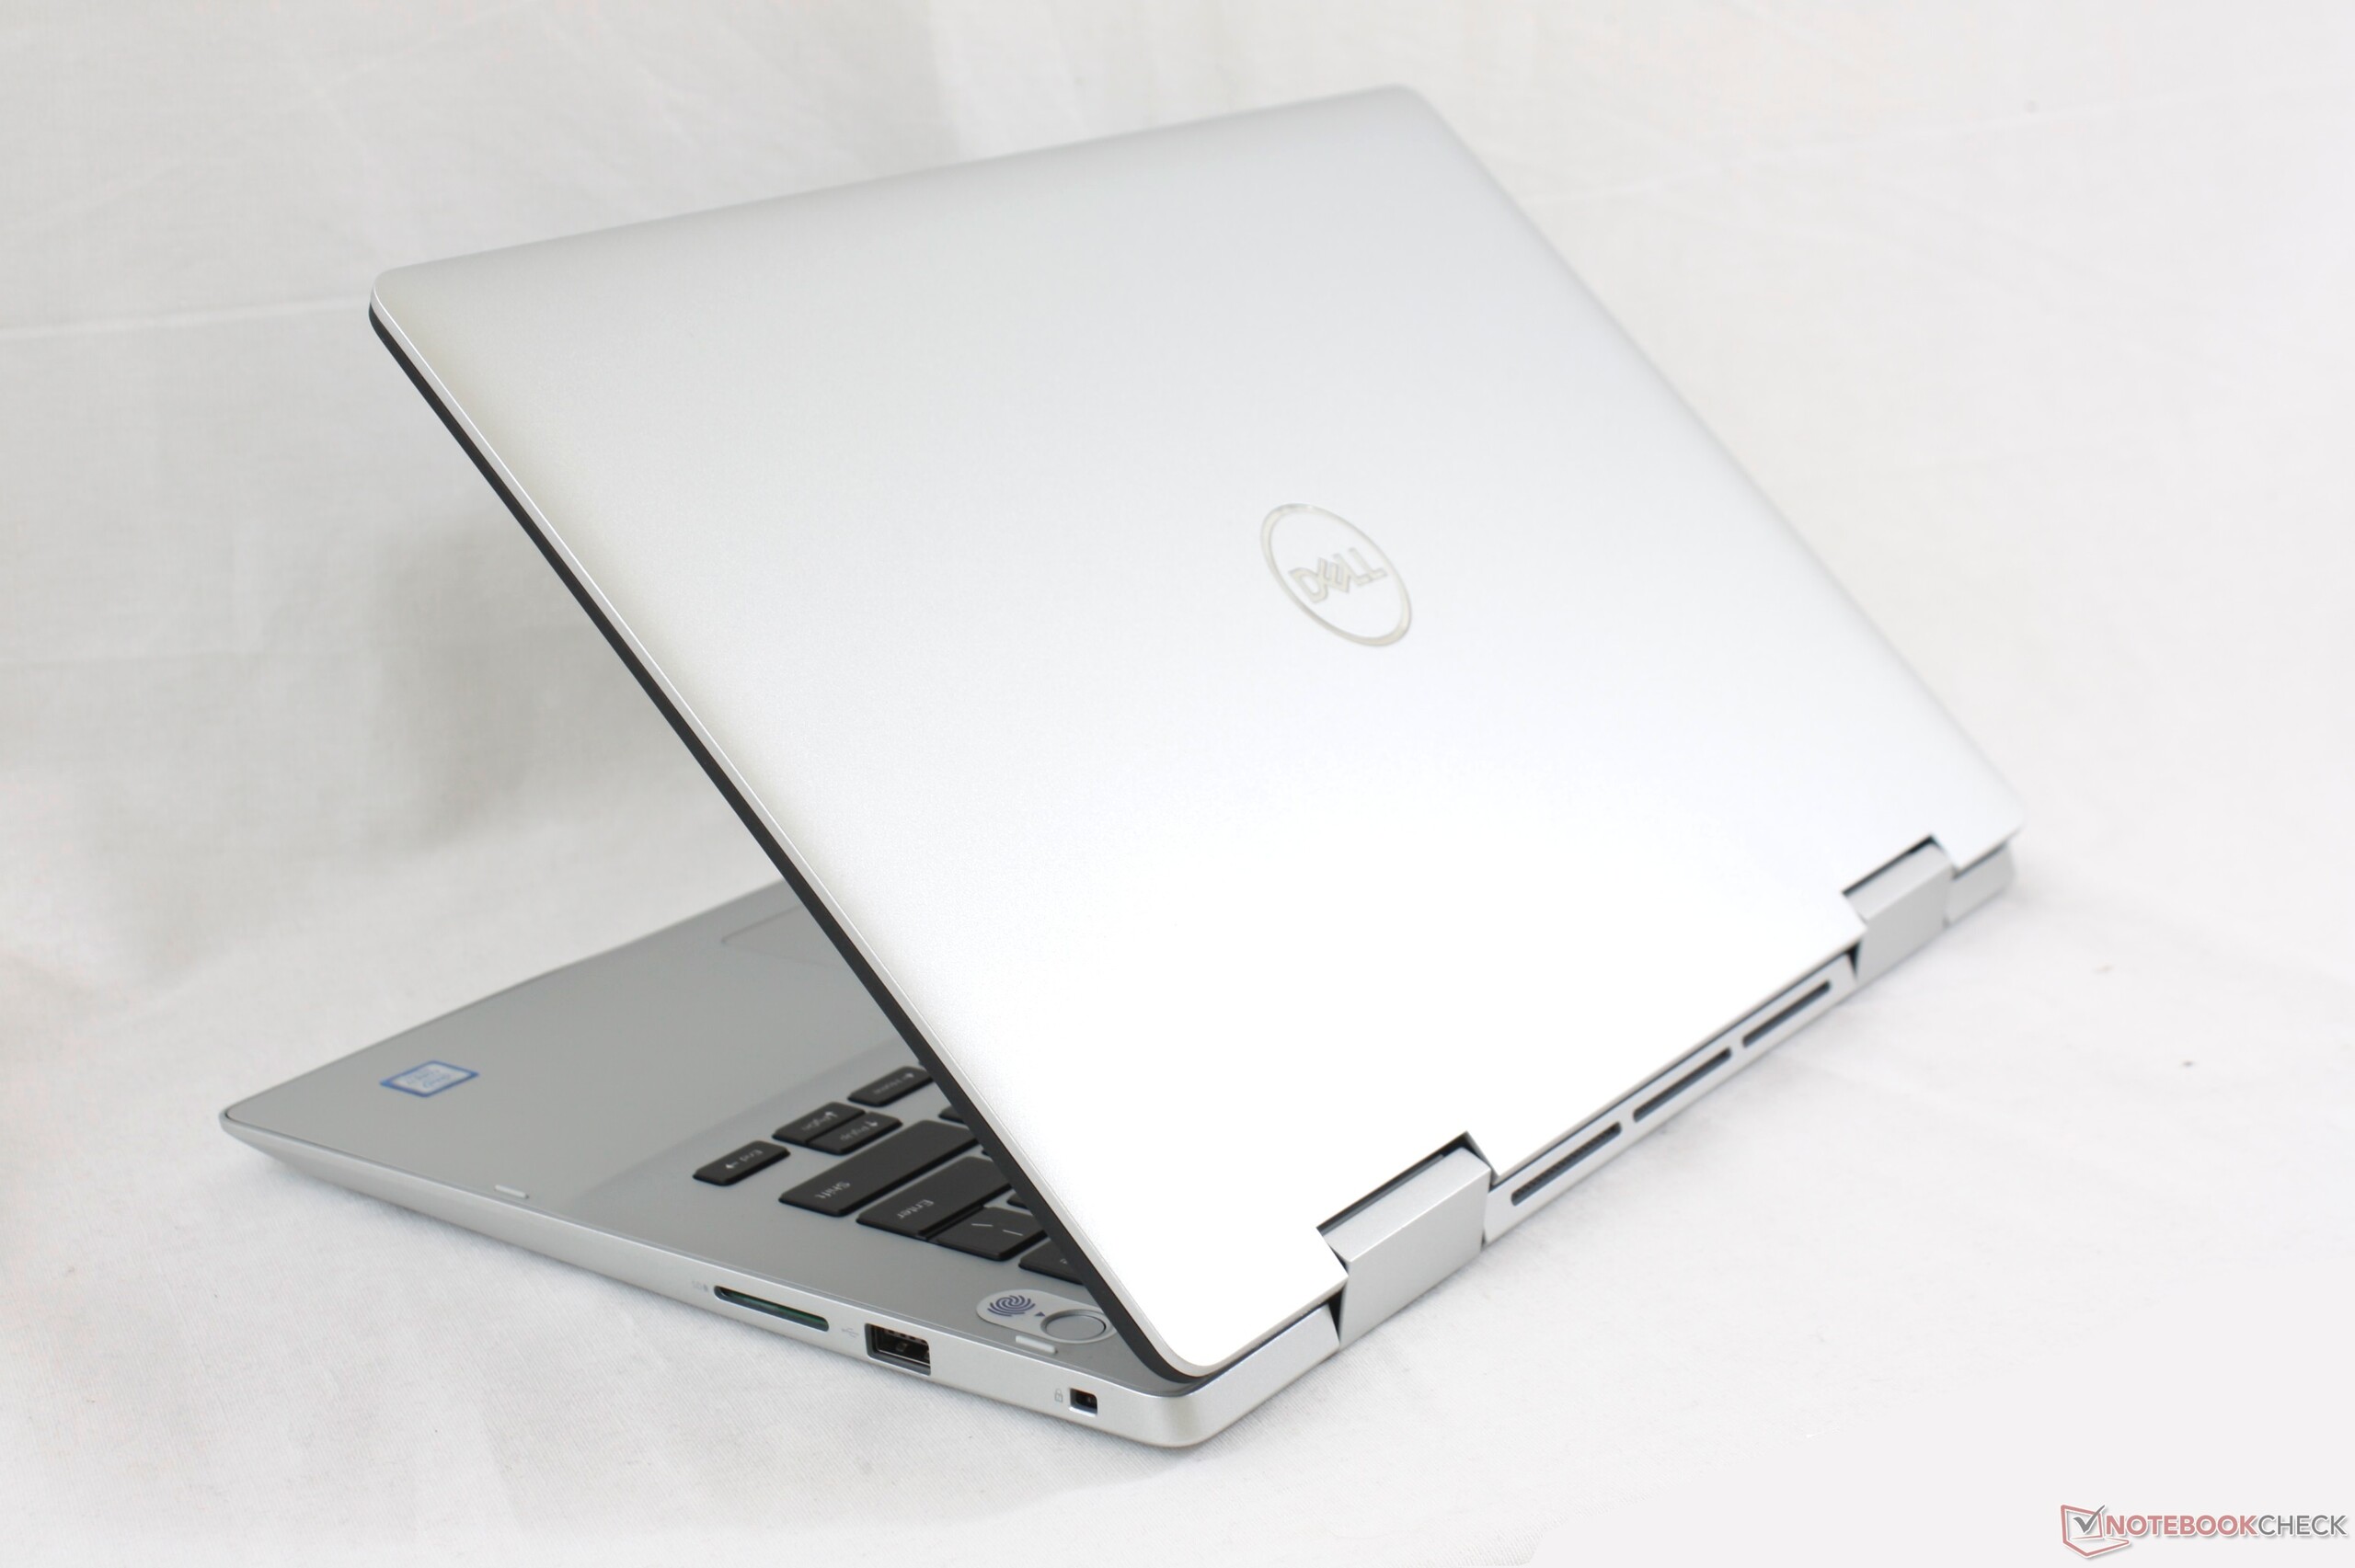
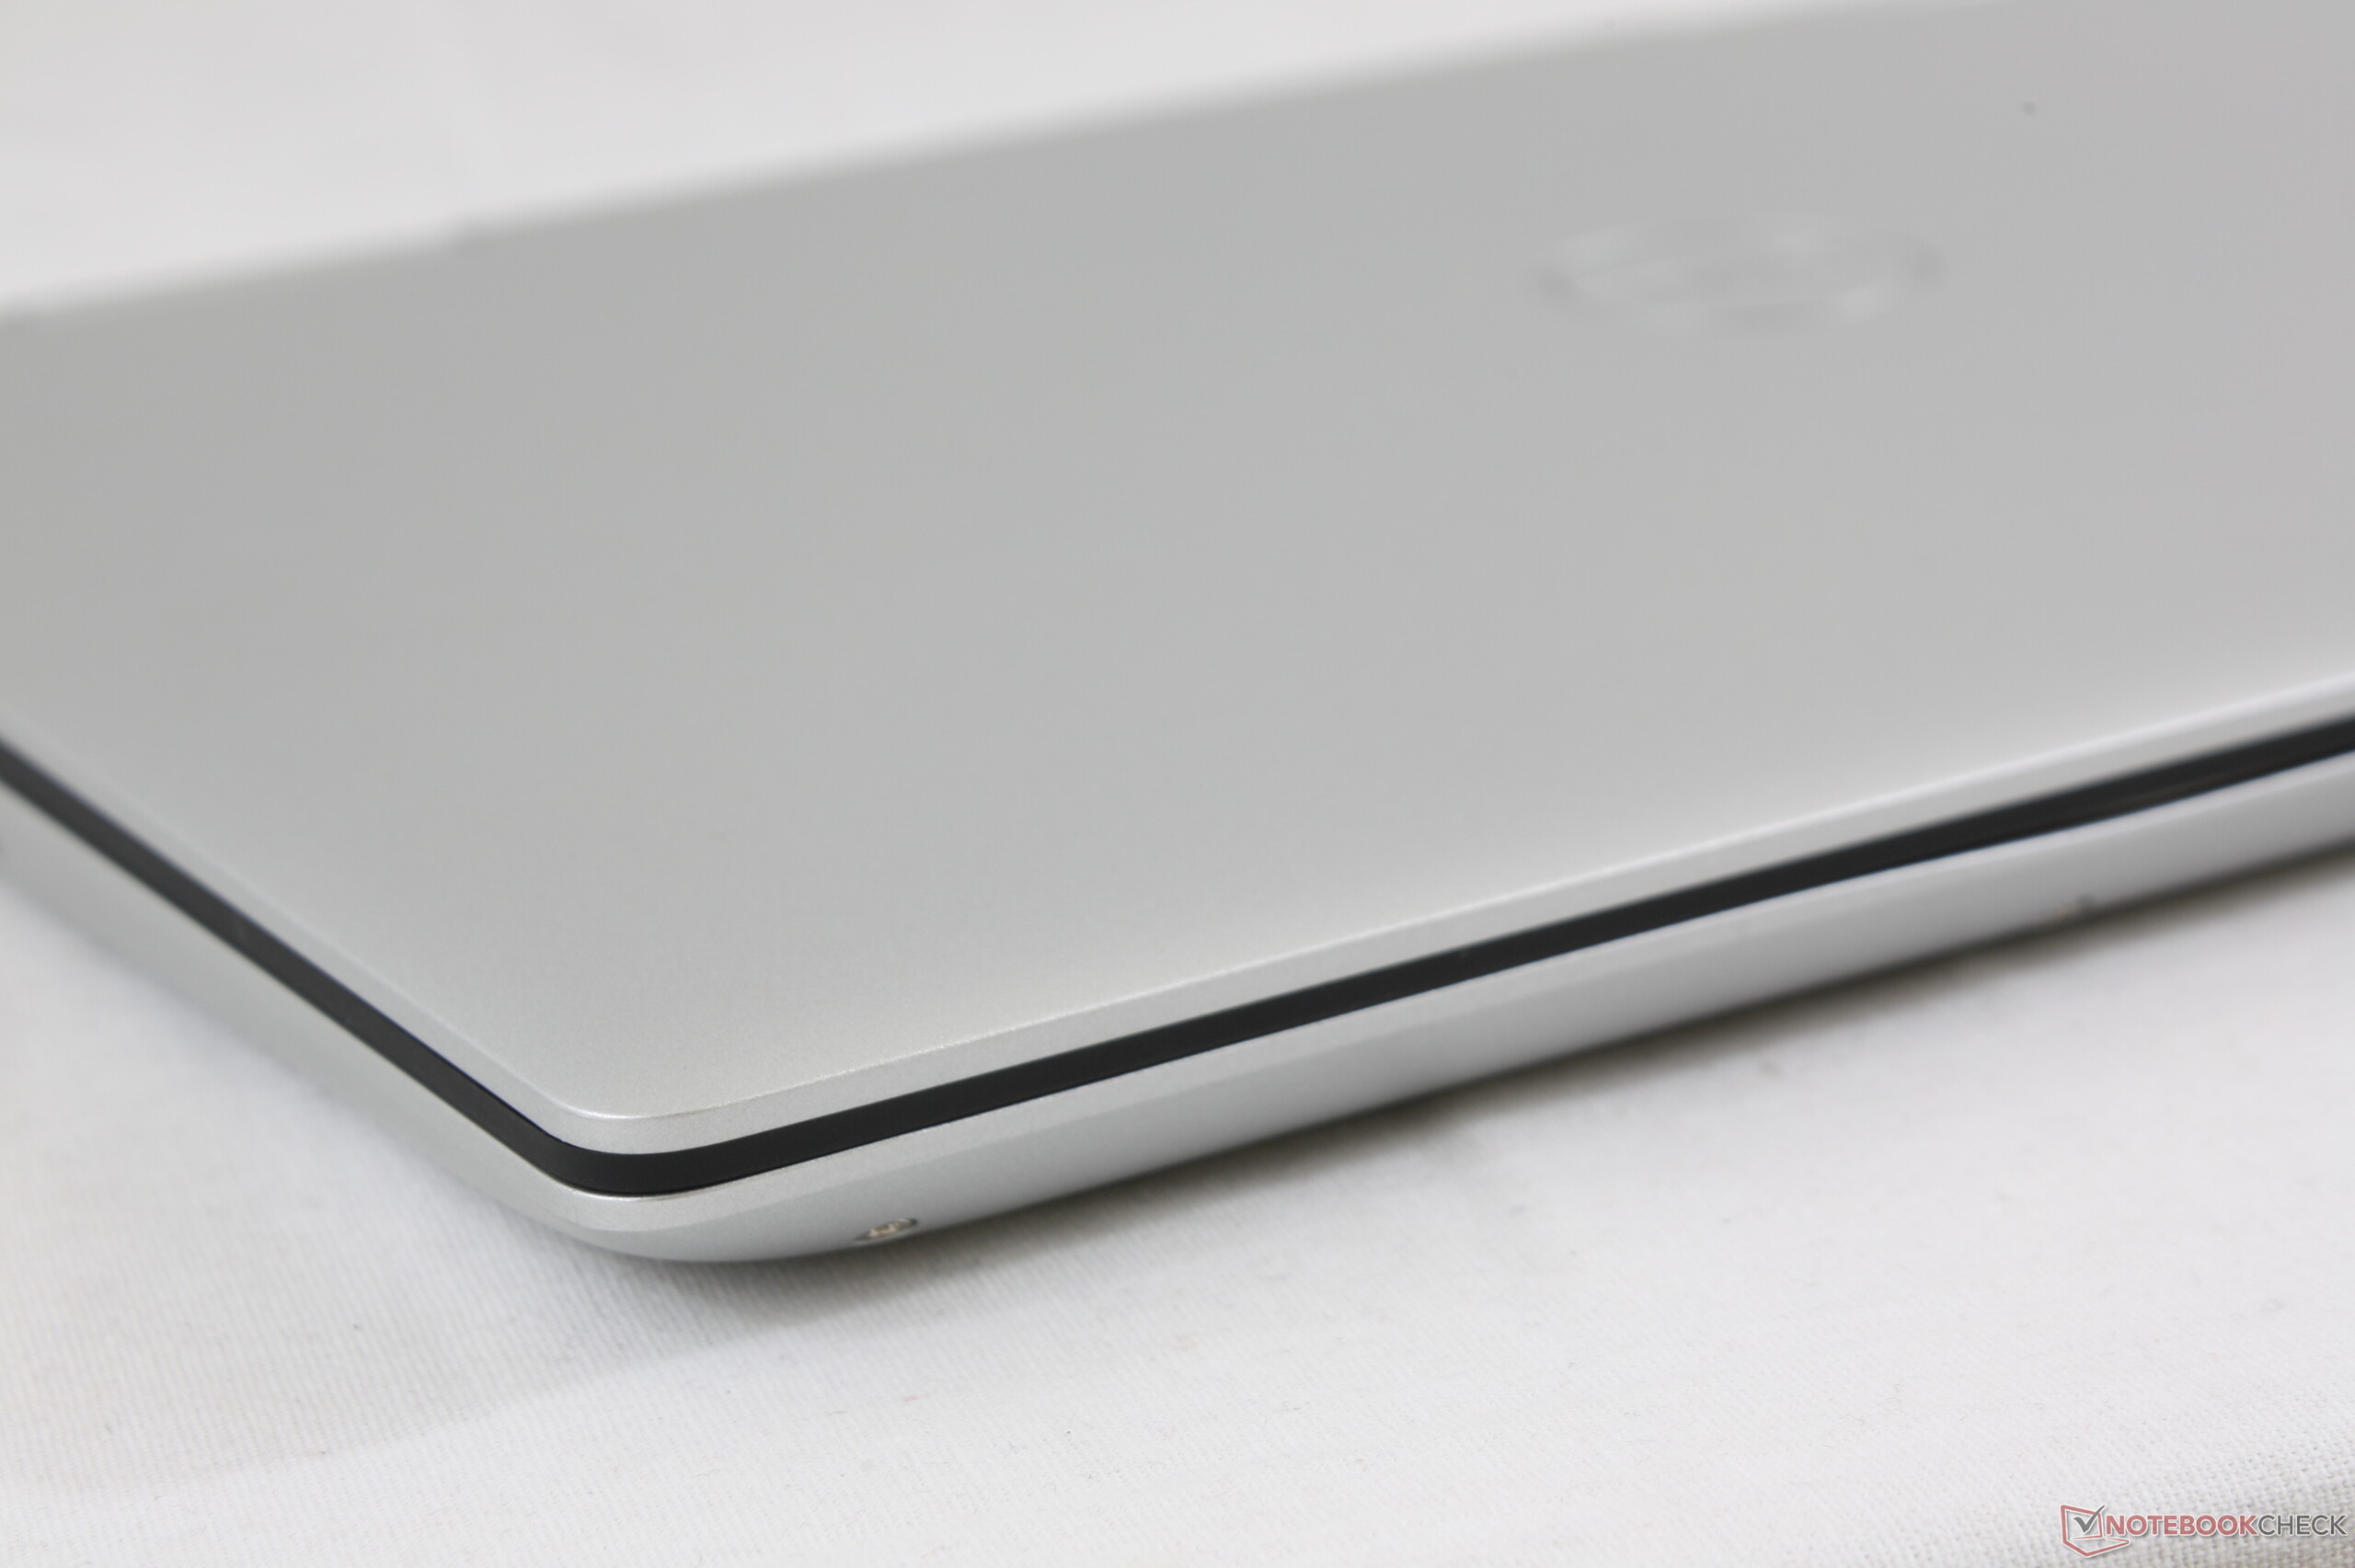
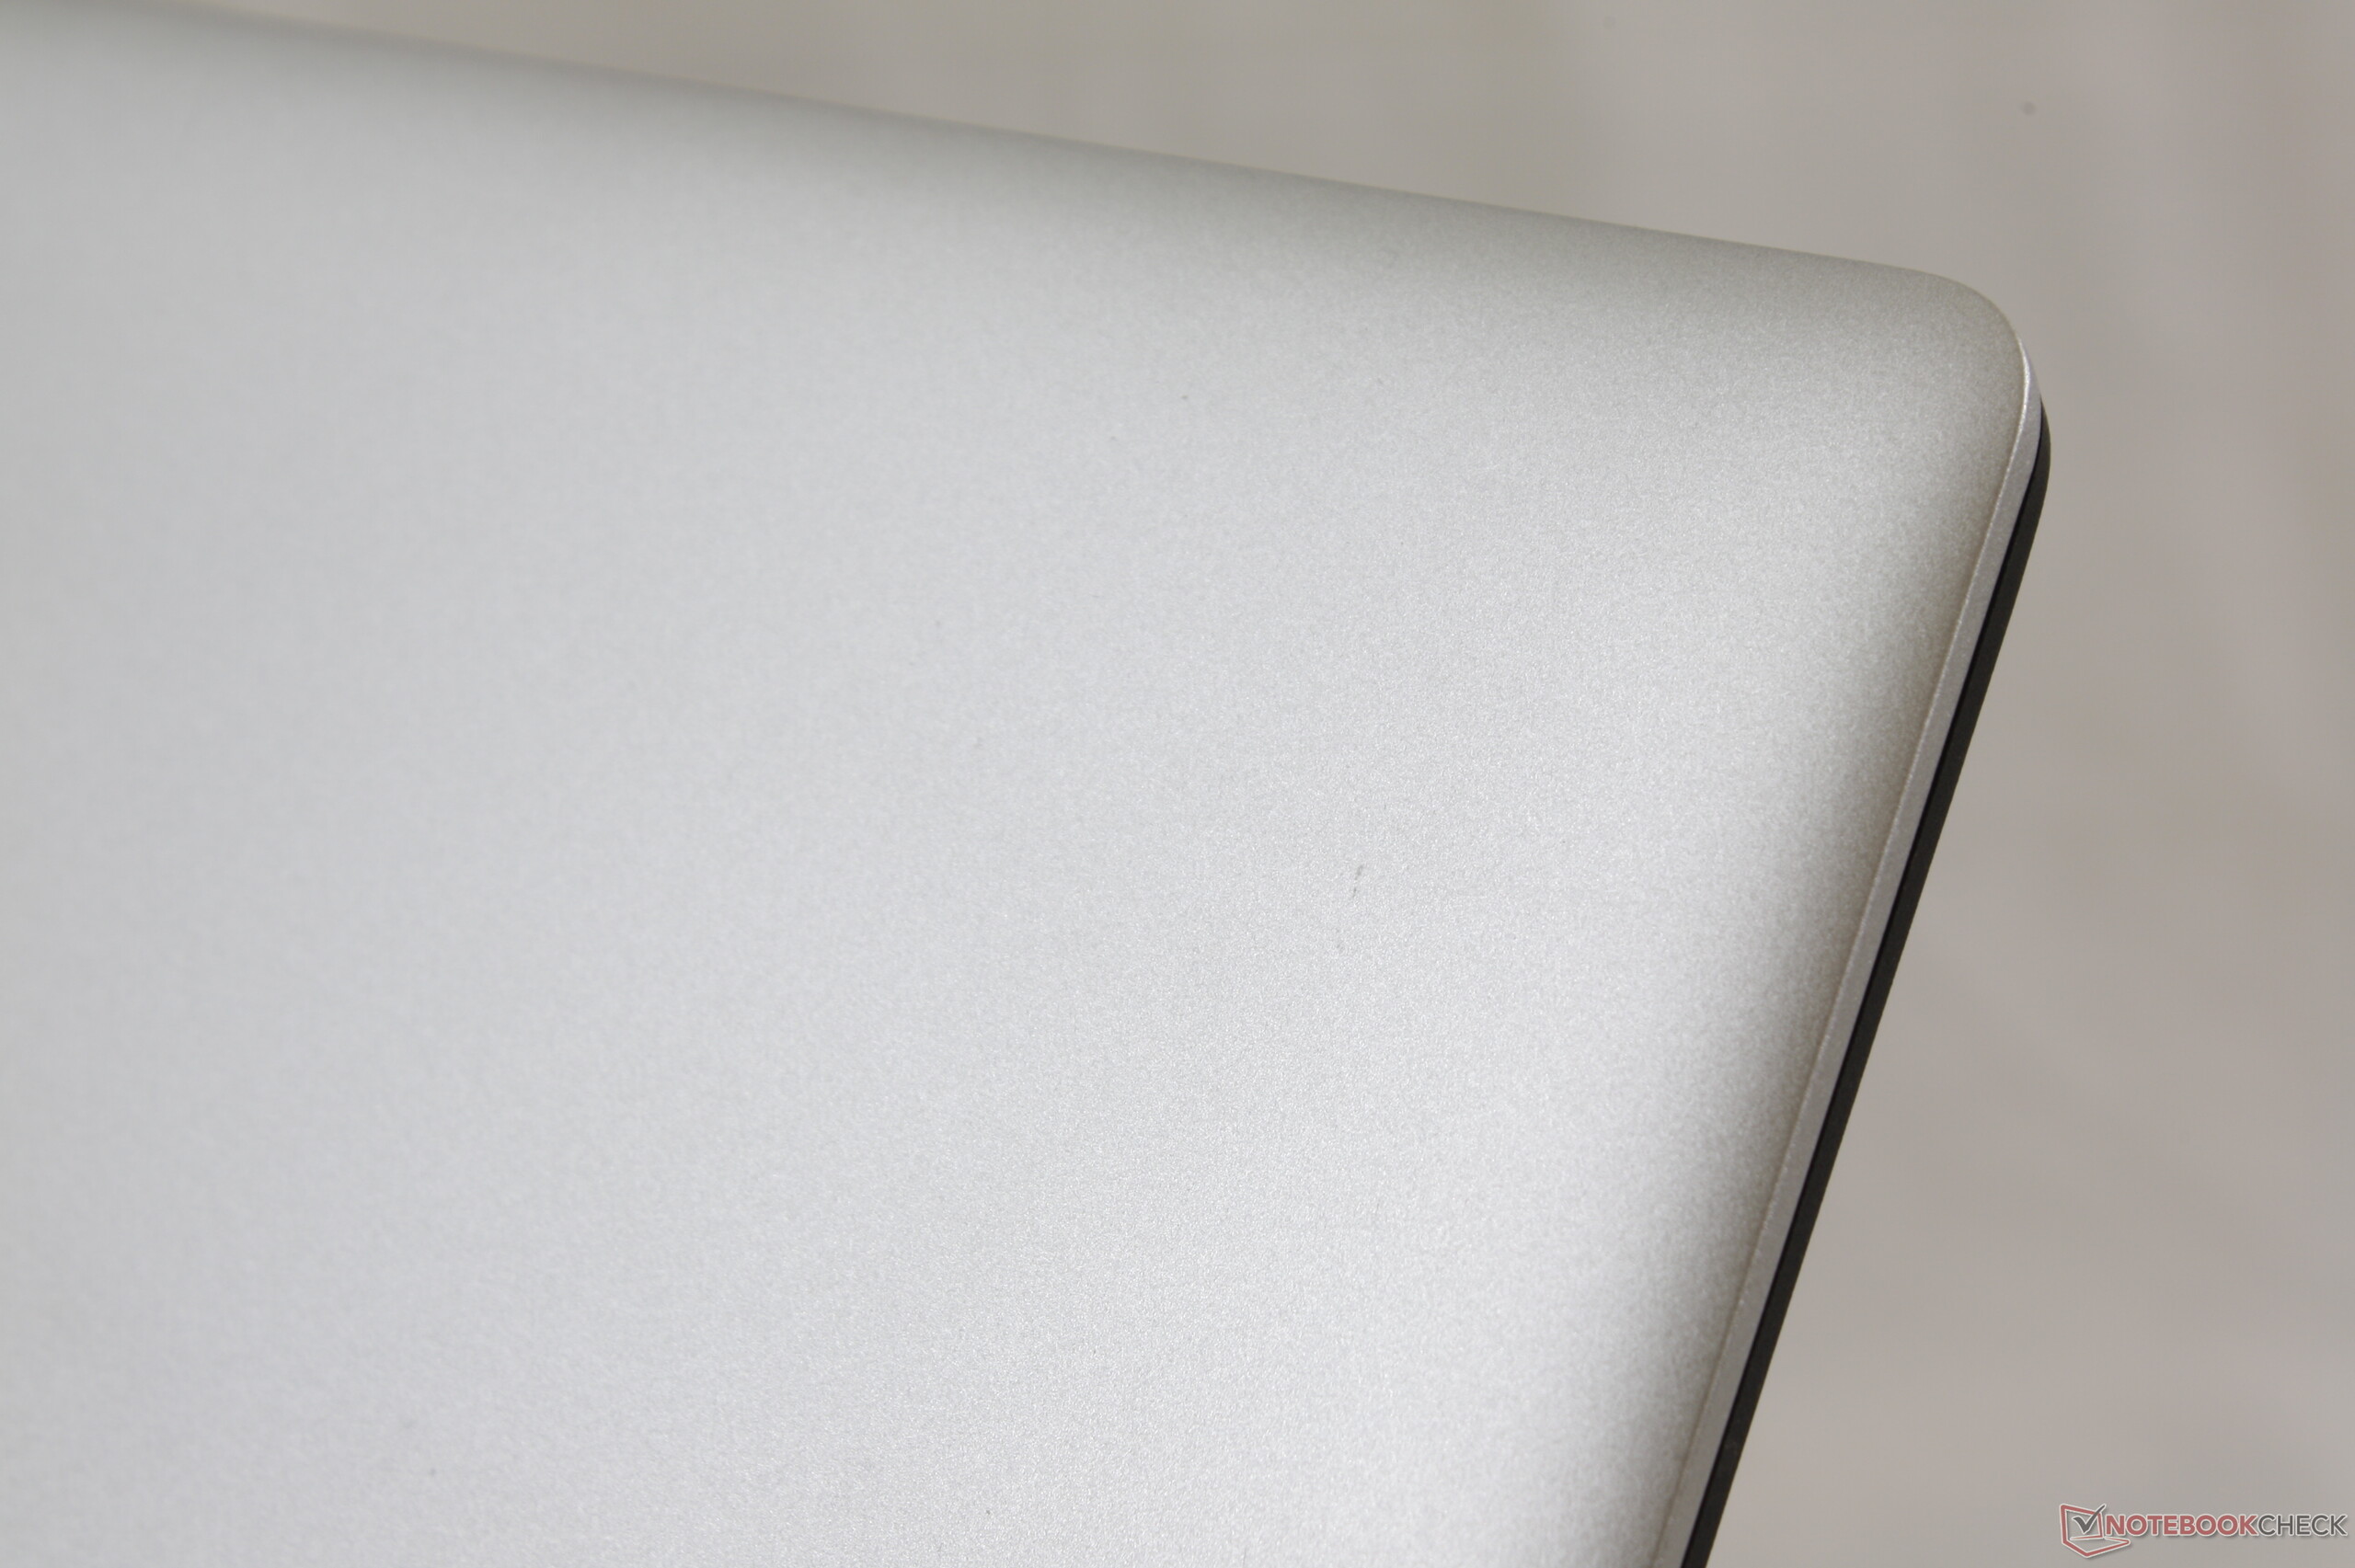
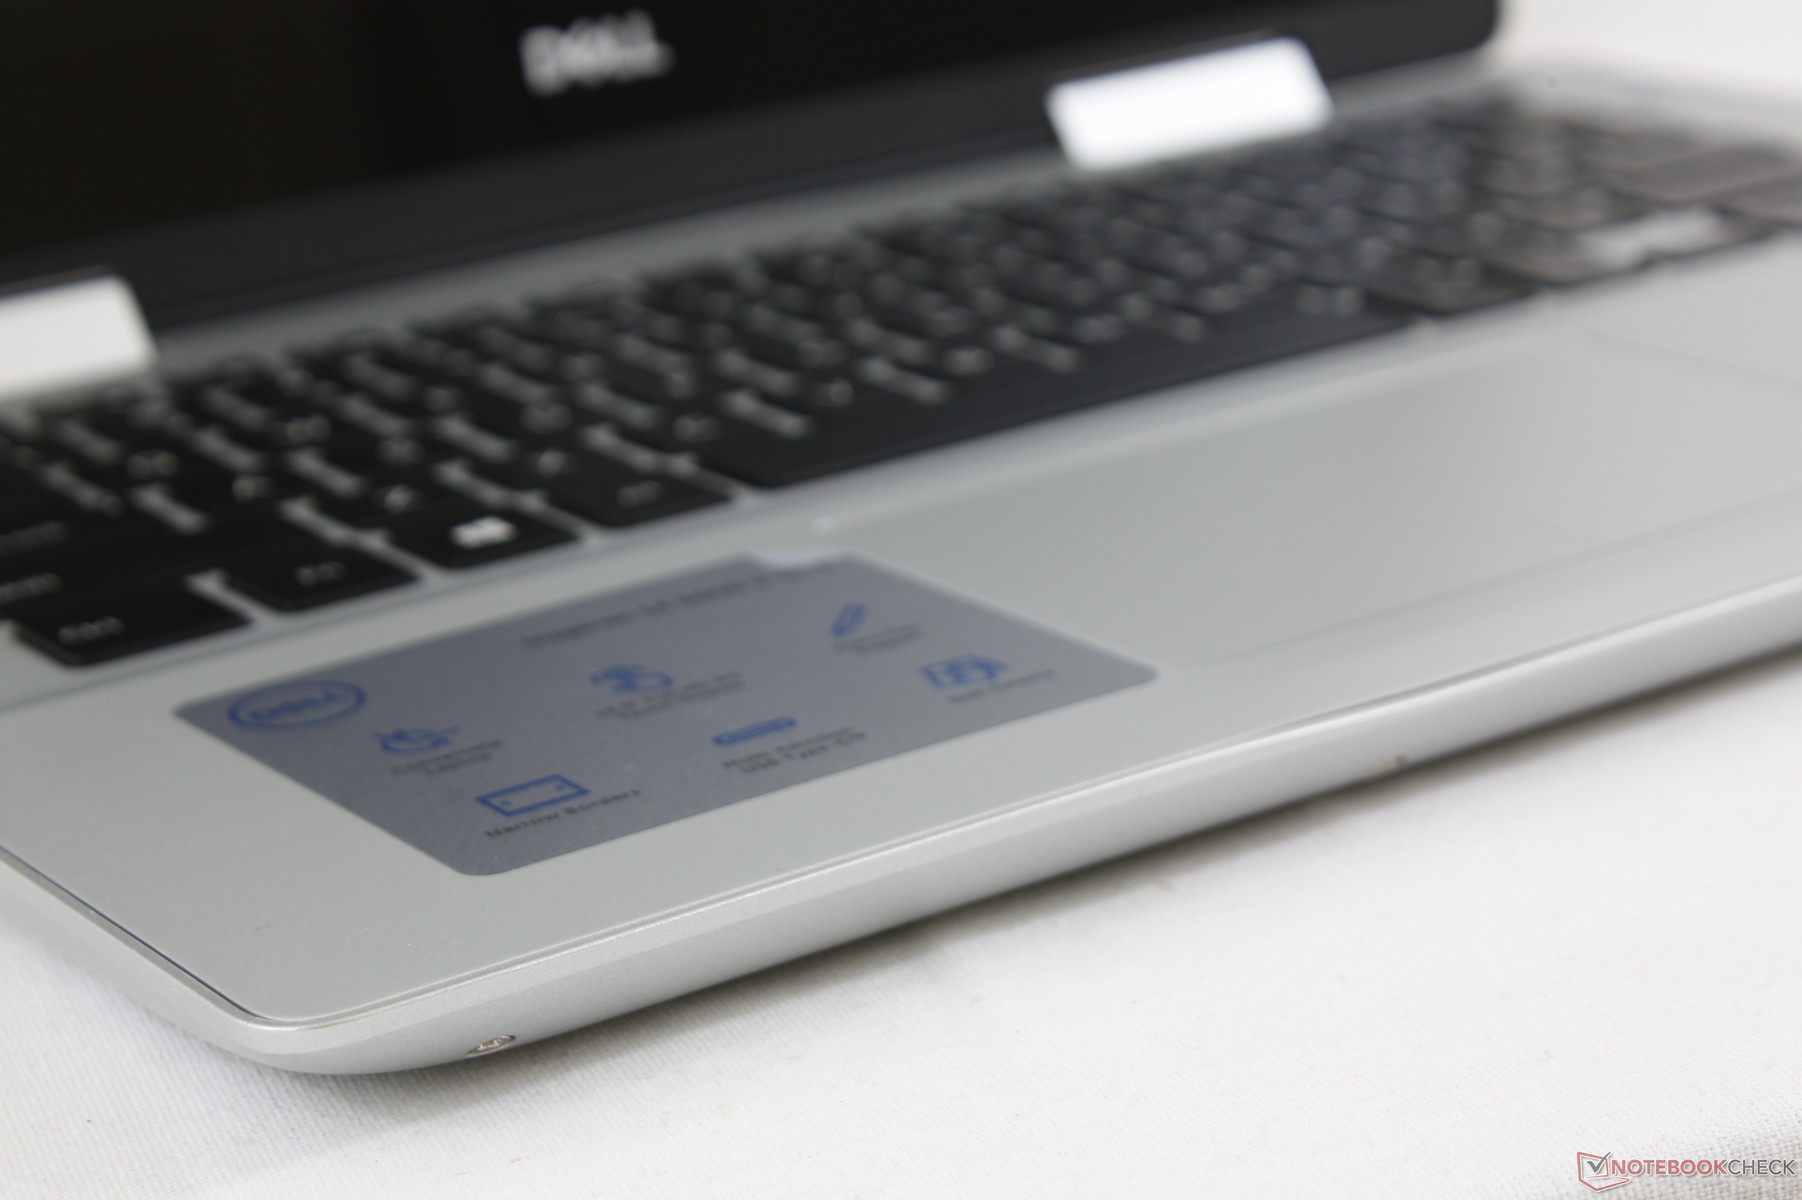
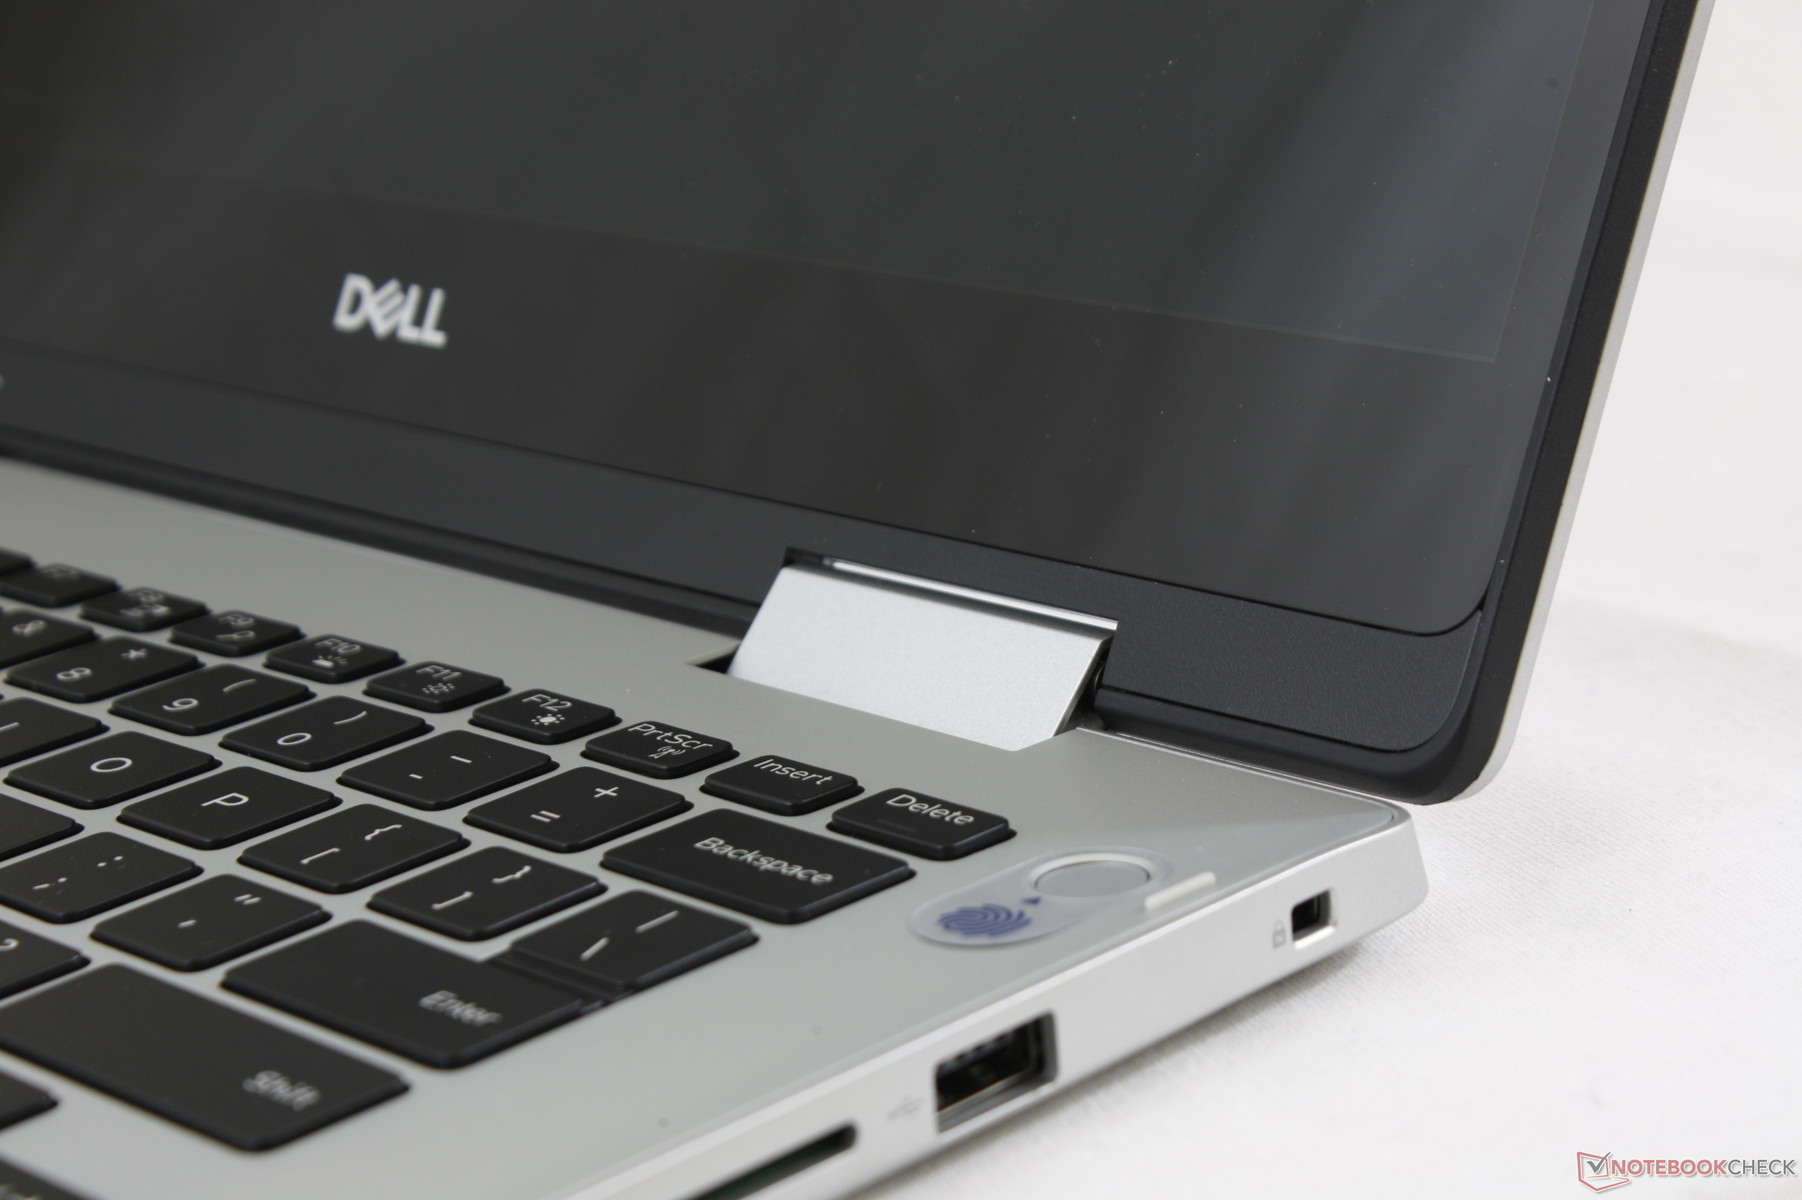
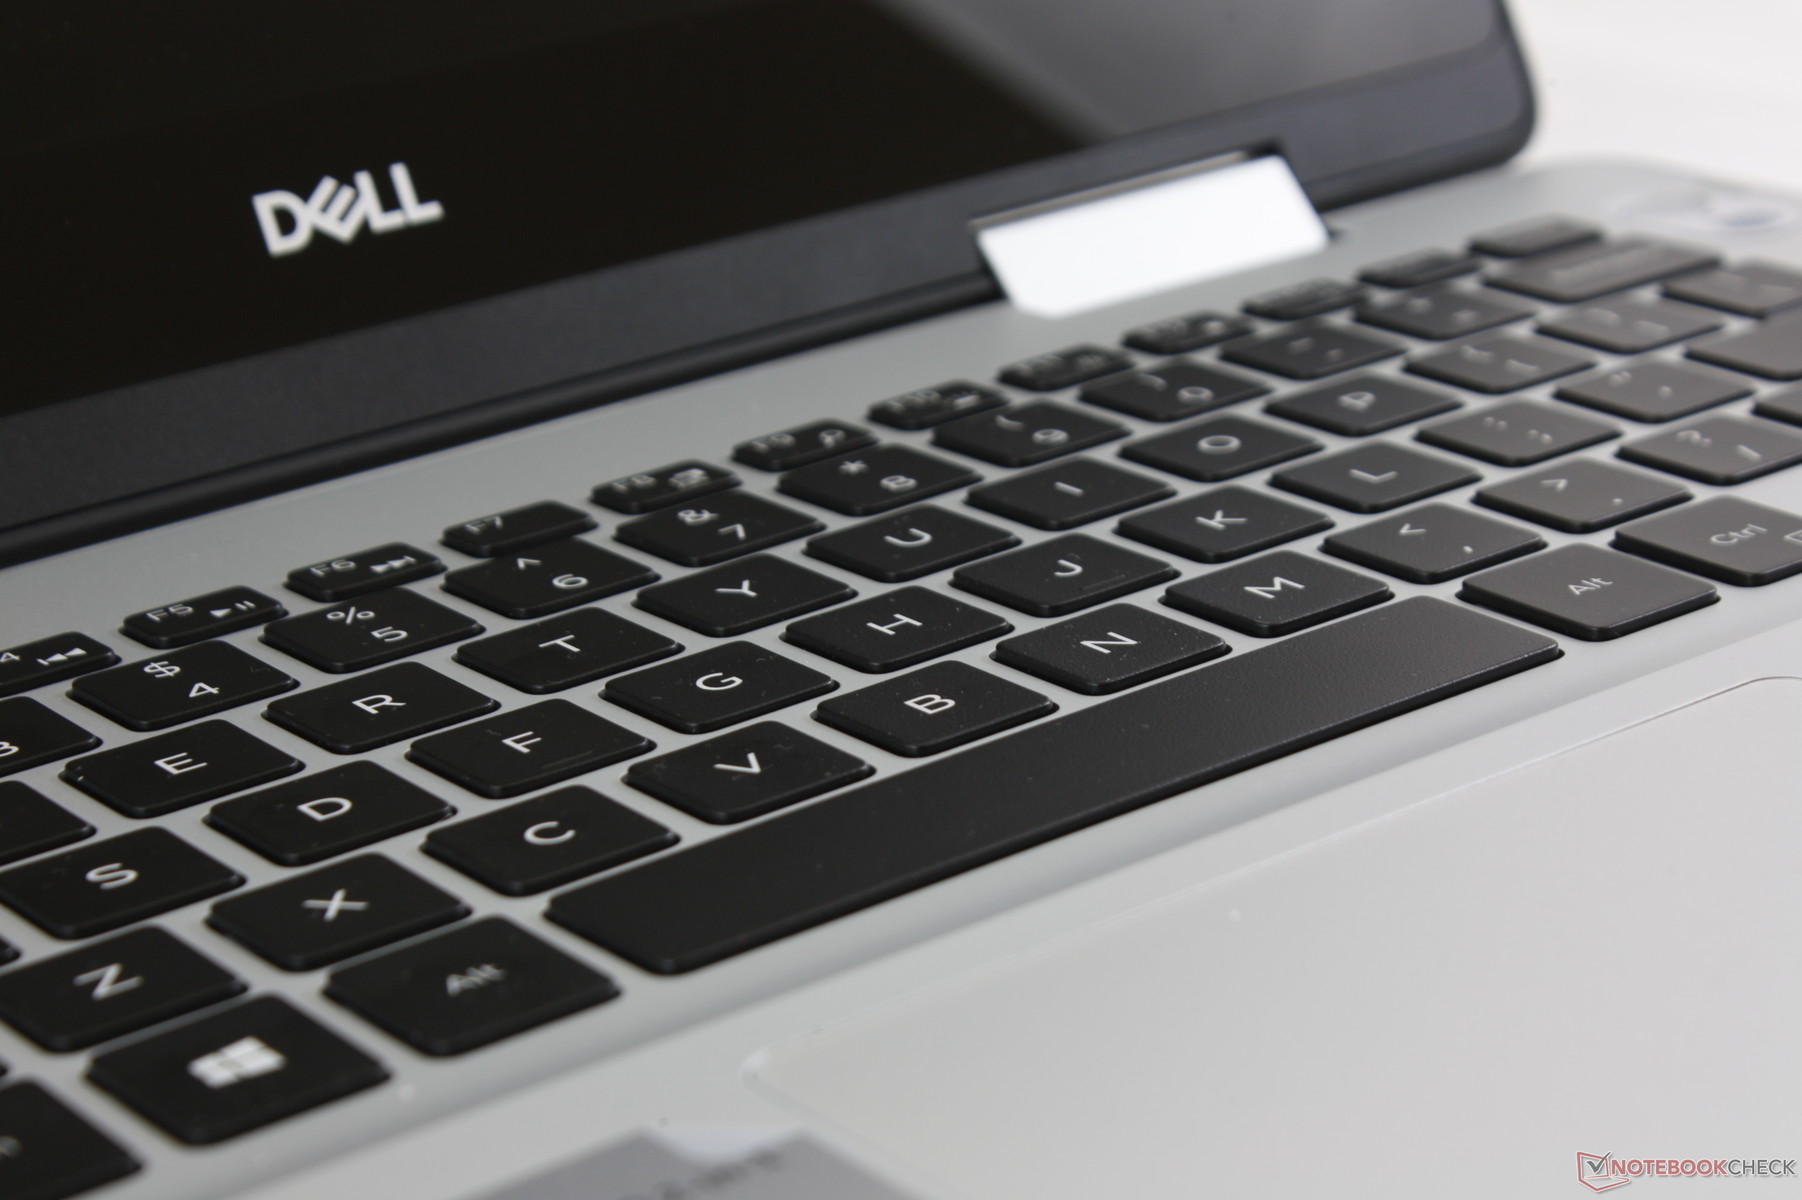
The smooth matte silver chassis is a combination of plastic and aluminum in contrast to the magnesium and carbon fiber materials of the higher-end XPS series. As a result, the system is certainly reflective of its budget-mainstream category in terms of looks and feel. While we can't knock the system for what it is, we're a bit disappointed that the hinges tend to creak when opening or closing the lid. This gives a poorer impression of the notebook especially since the 360-degree hinges define the capabilities of the model. The creaking is strange because the hinges are otherwise taut and uniform with almost no teetering.
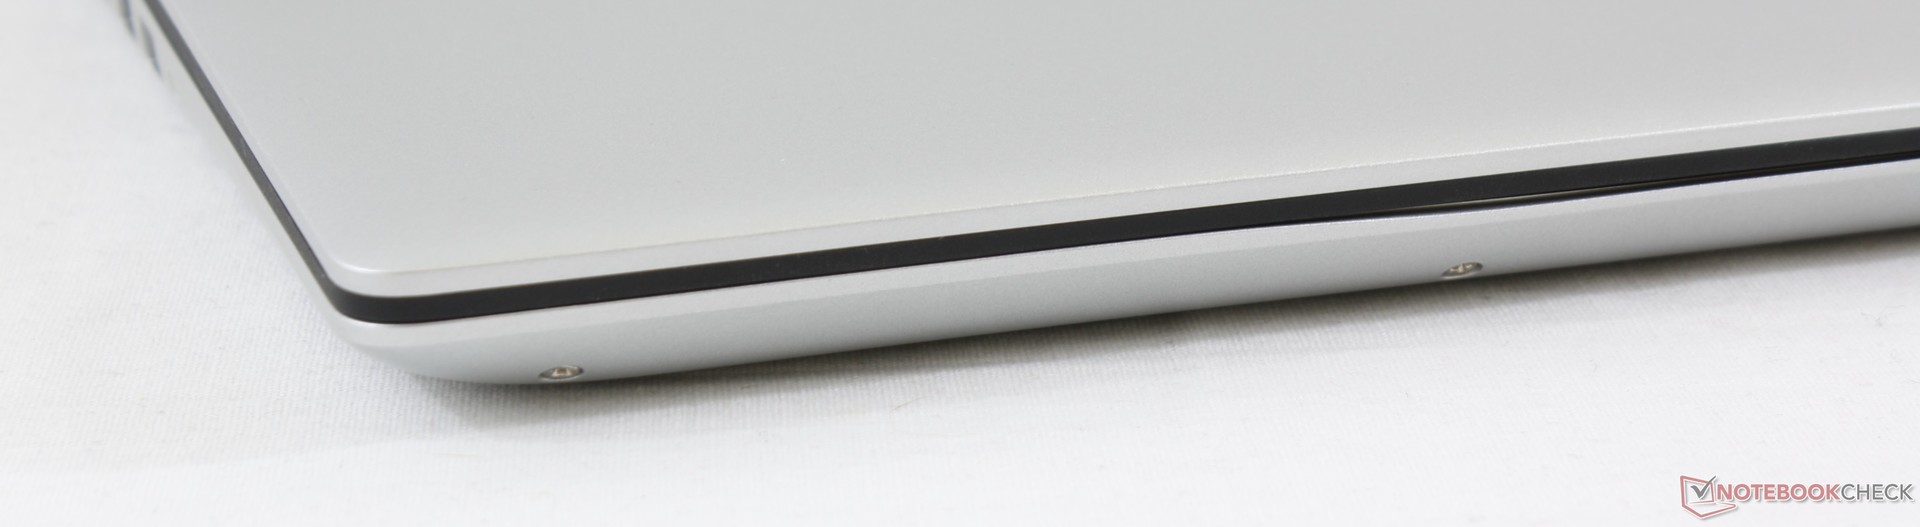
Beyond the hinges, the lid is actually quite rigid for its category and resistant to side-to-side twisting. The base flexes a bit more when attempting to warp its surfaces which is not uncommon on slim budget laptops. In Dell's defense, the chassis is no better or worse than the competing Yoga 530 or VivoBook Flip 14 where creaking and/or weaker hinges are present.
Construction quality is imperfect on our test unit as the plastic cover for one of the hinges appears to be loose. It's not severe enough to impact day-to-day use, but it's undesirable nonetheless.
The Dell is larger and a few hundred grams heavier than some of its closest competitors. This may be attributed to its thicker and sturdier lid and the secondary internal 2.5-inch SATA III bay.
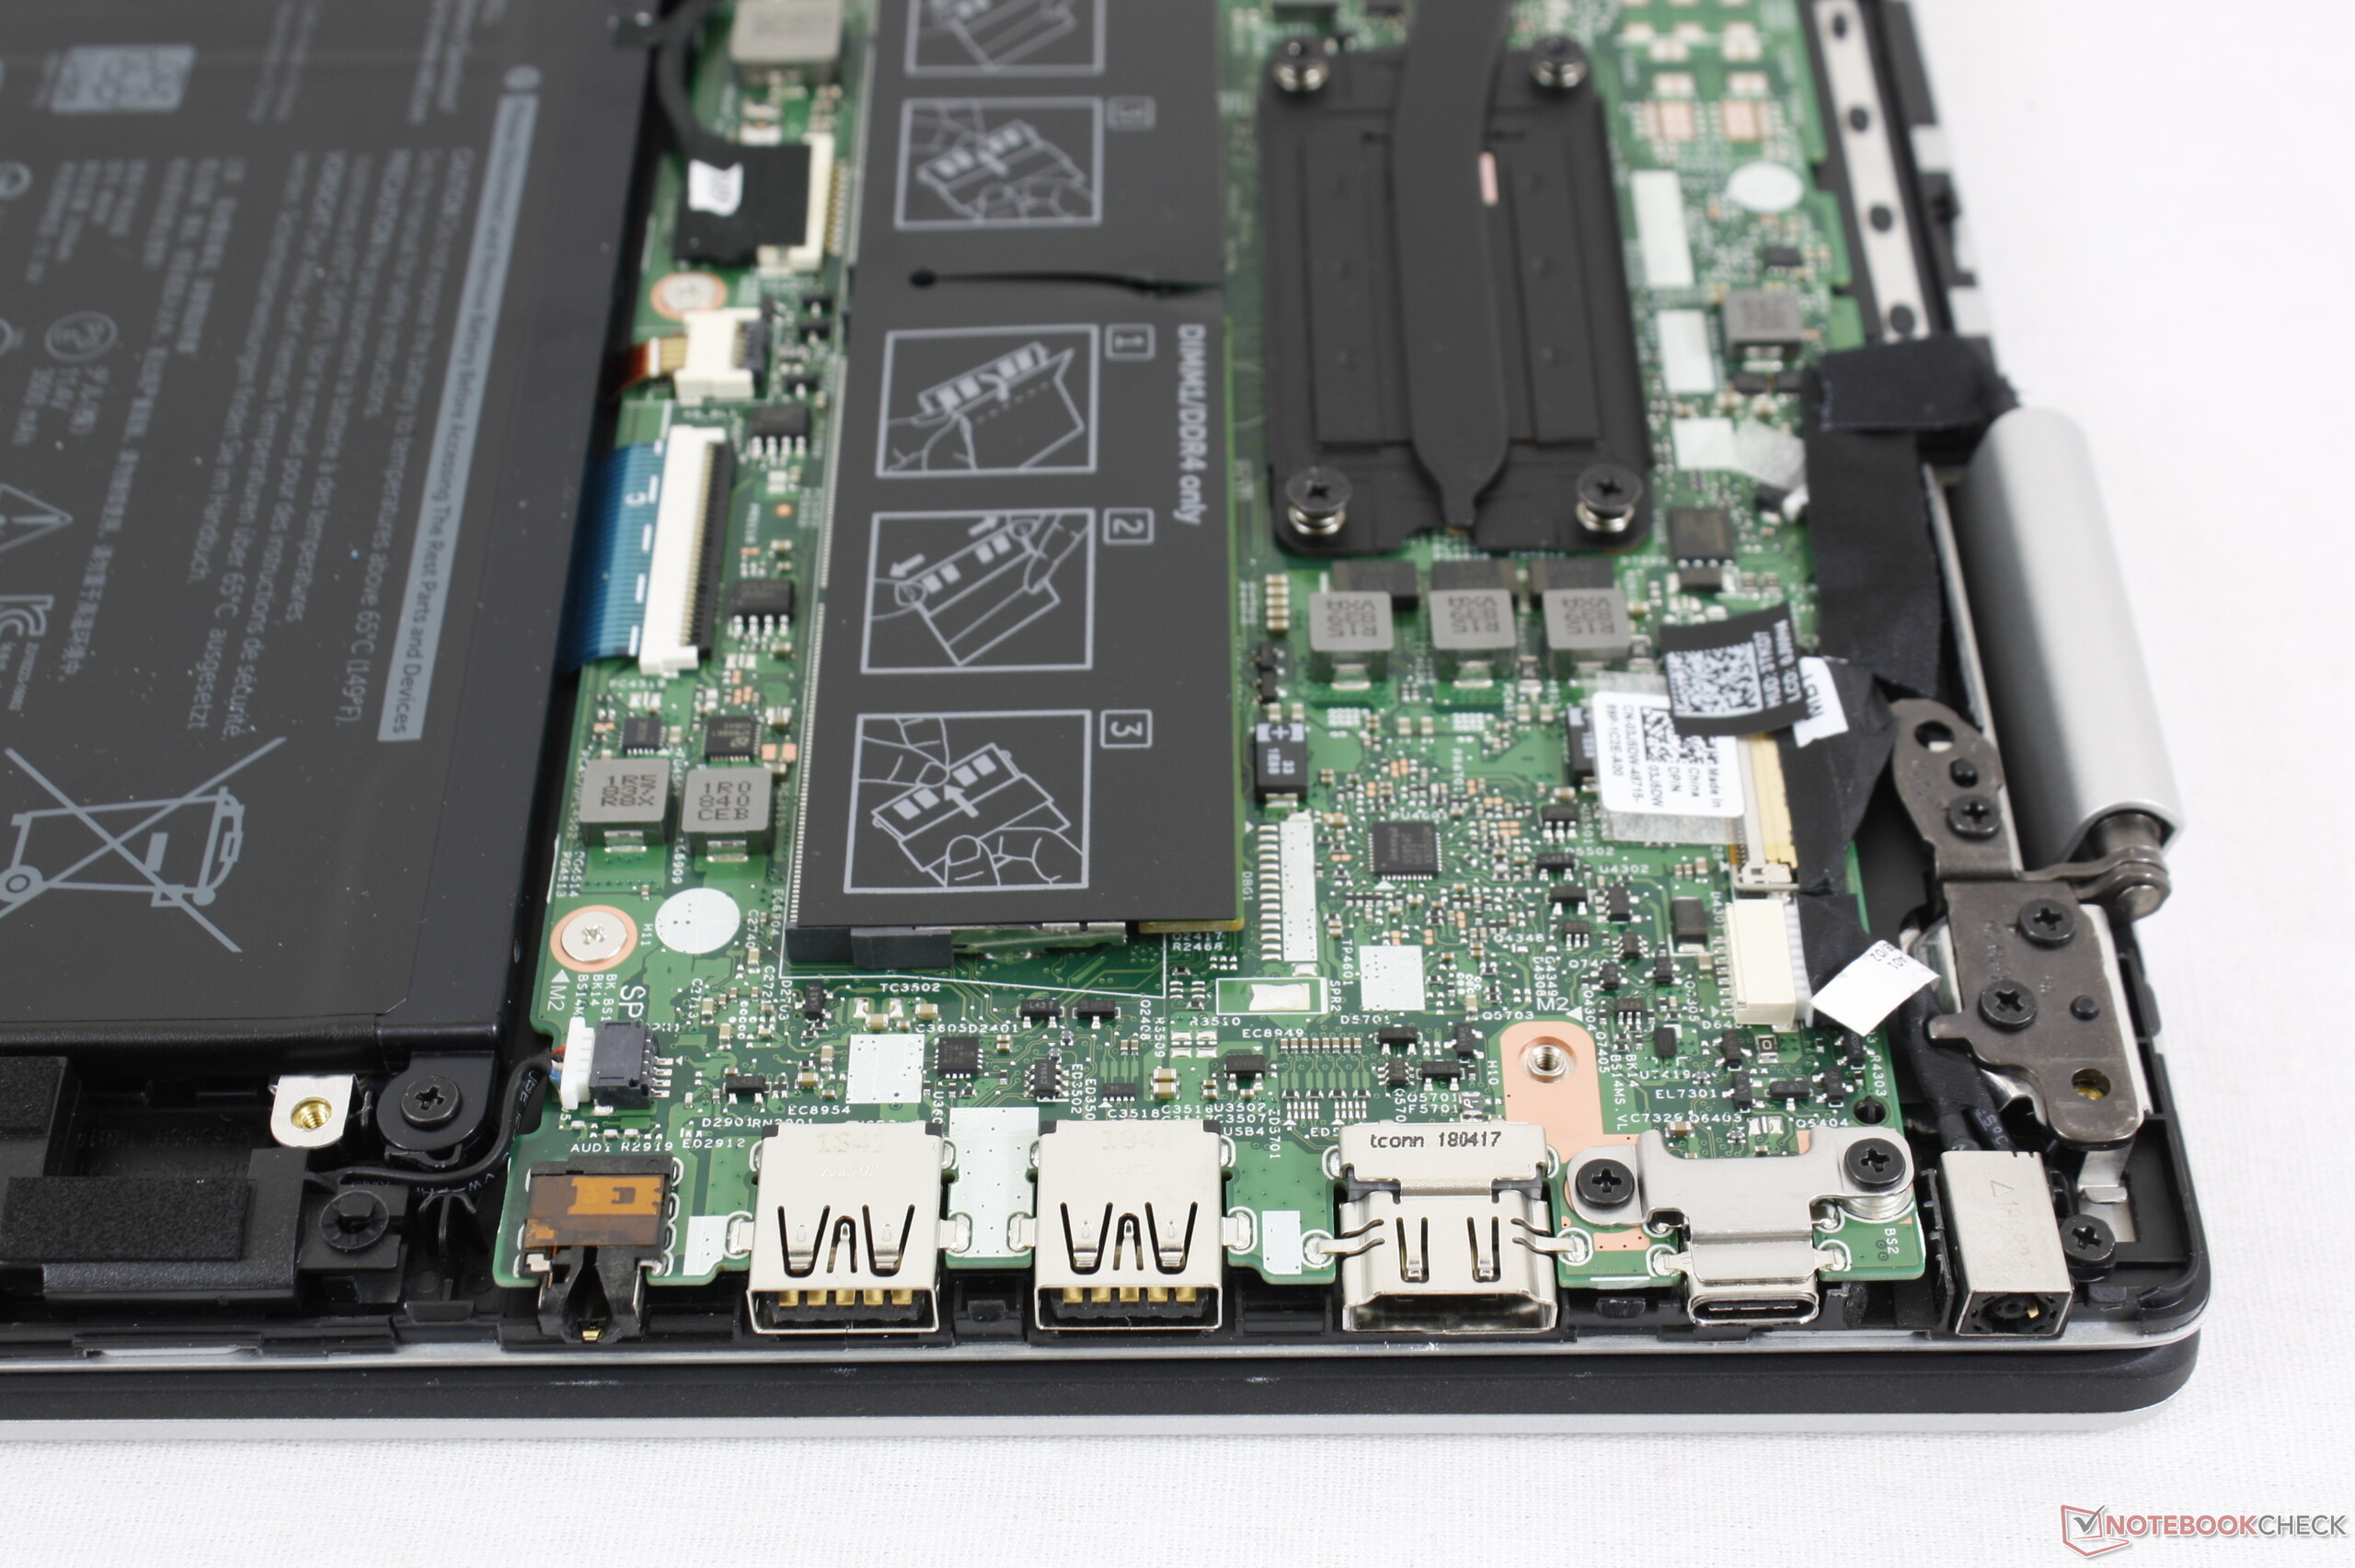
Connectivity
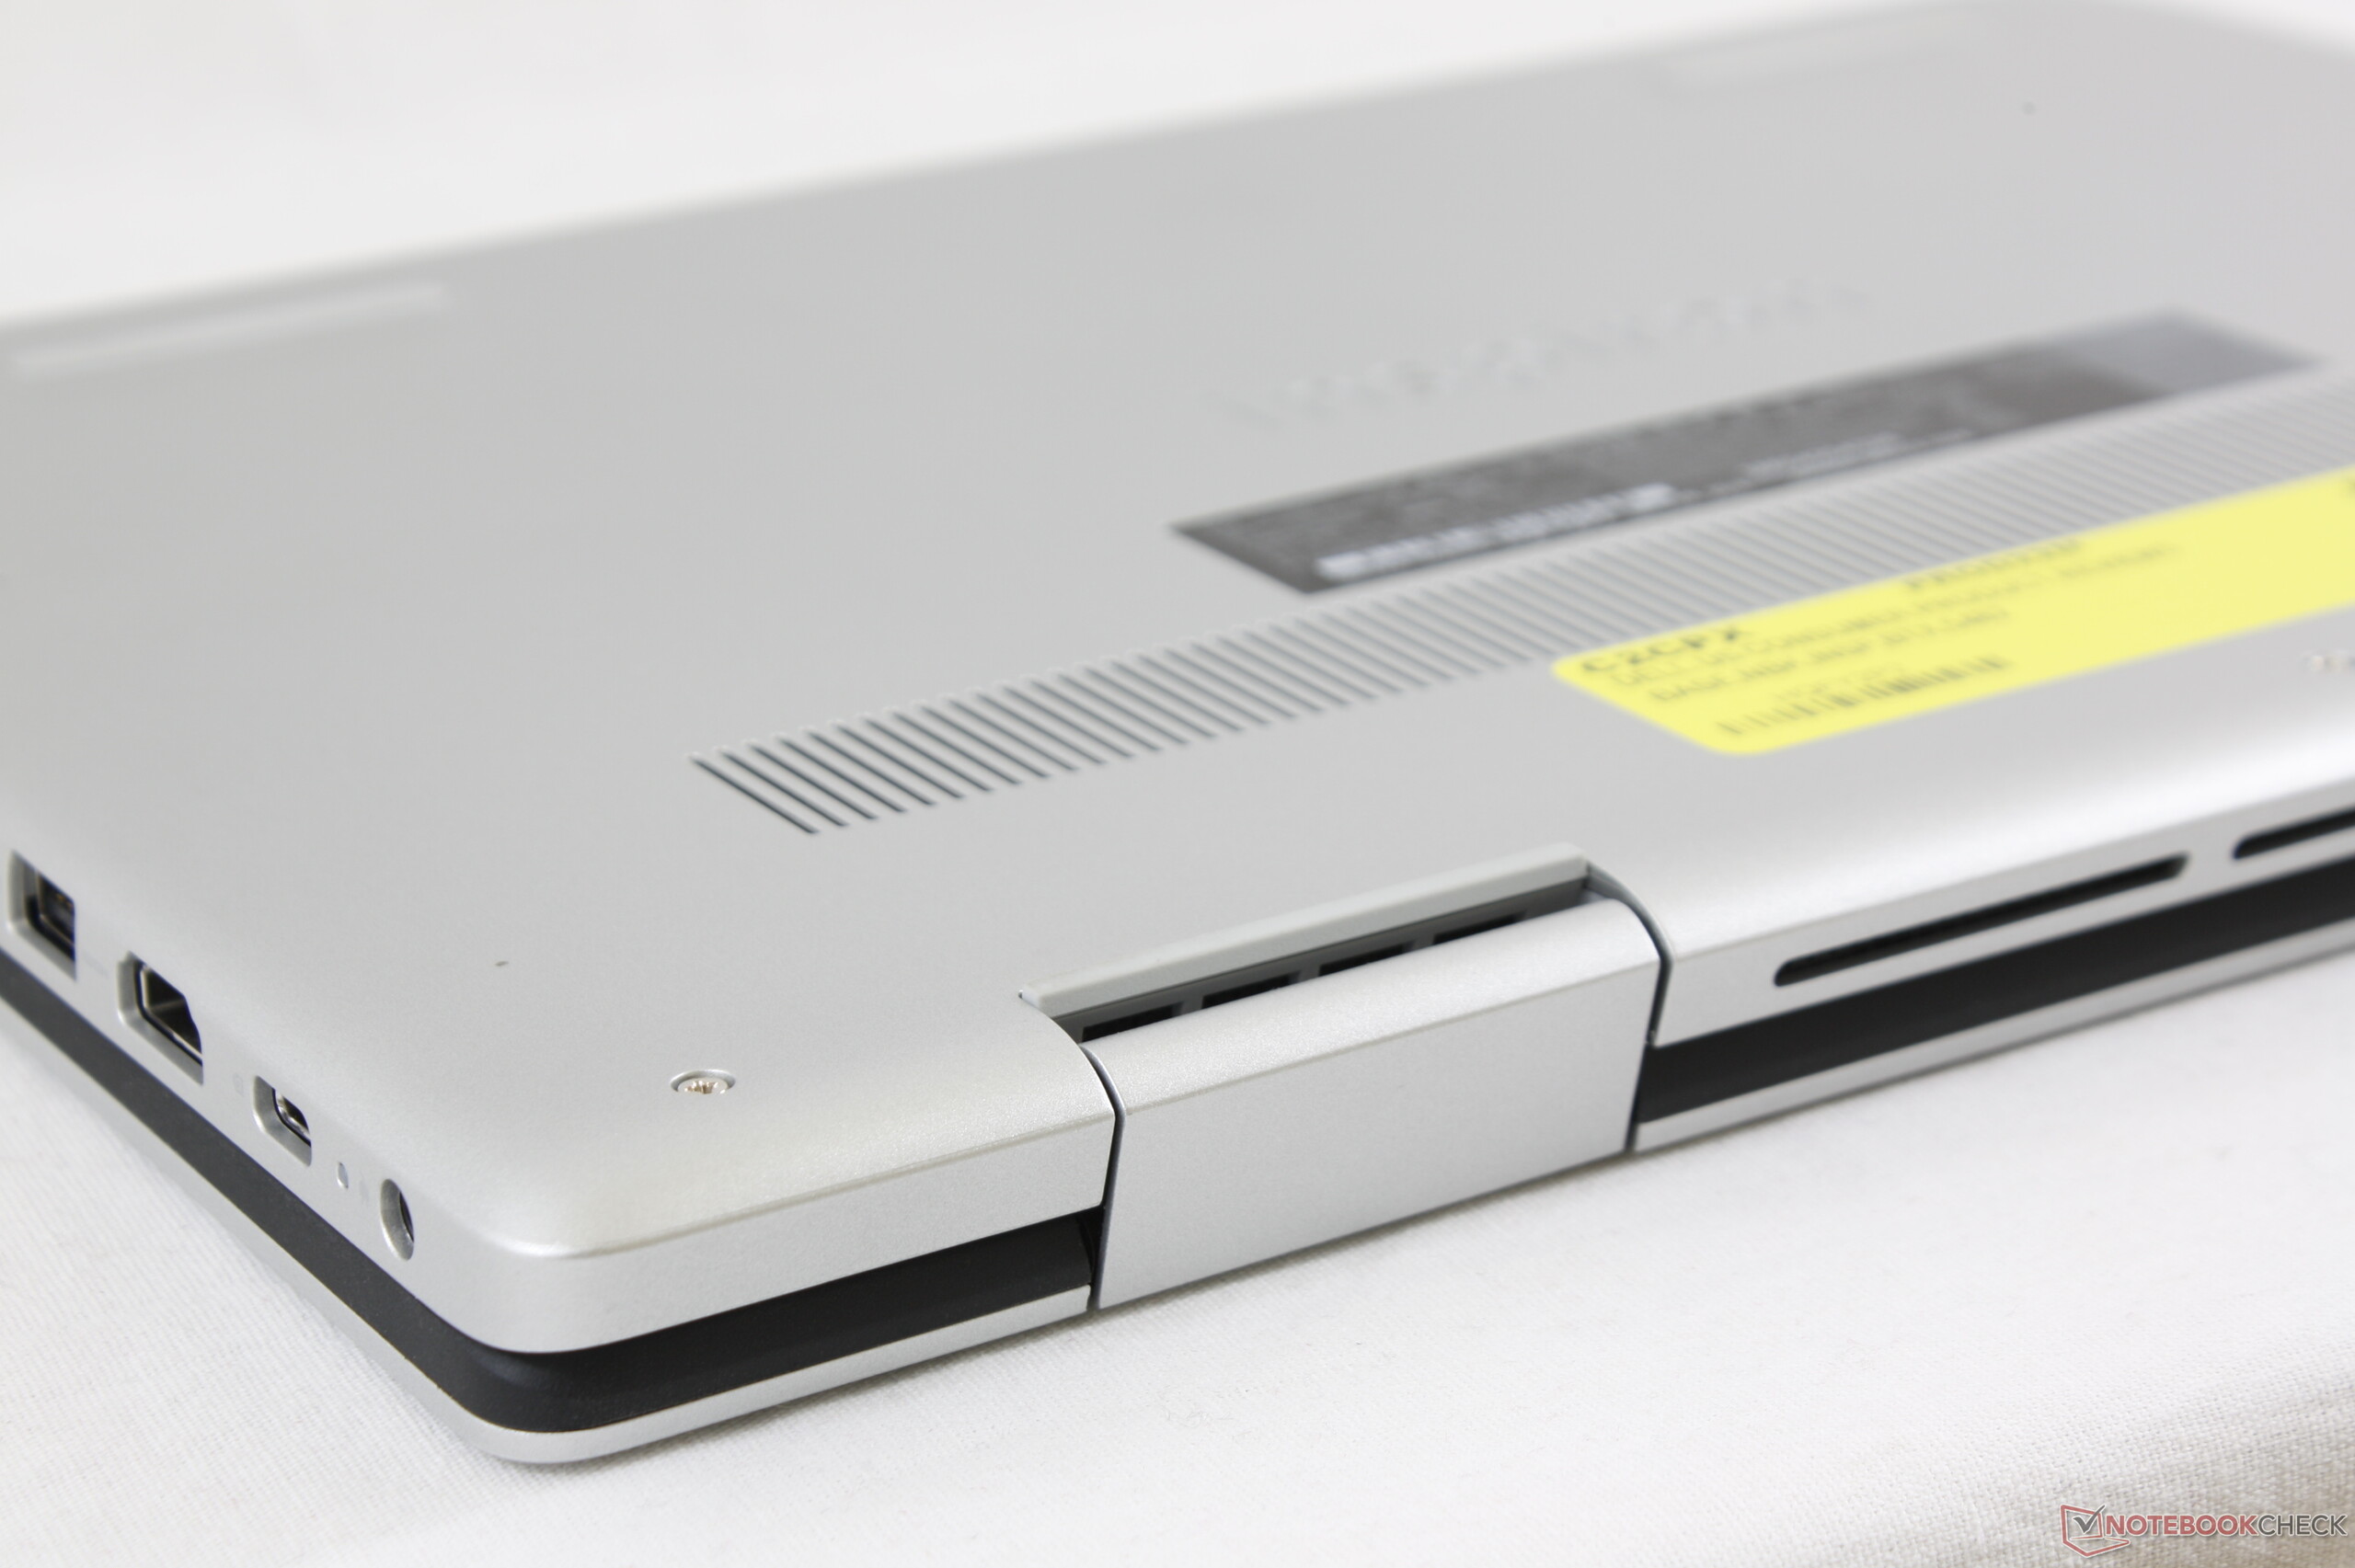
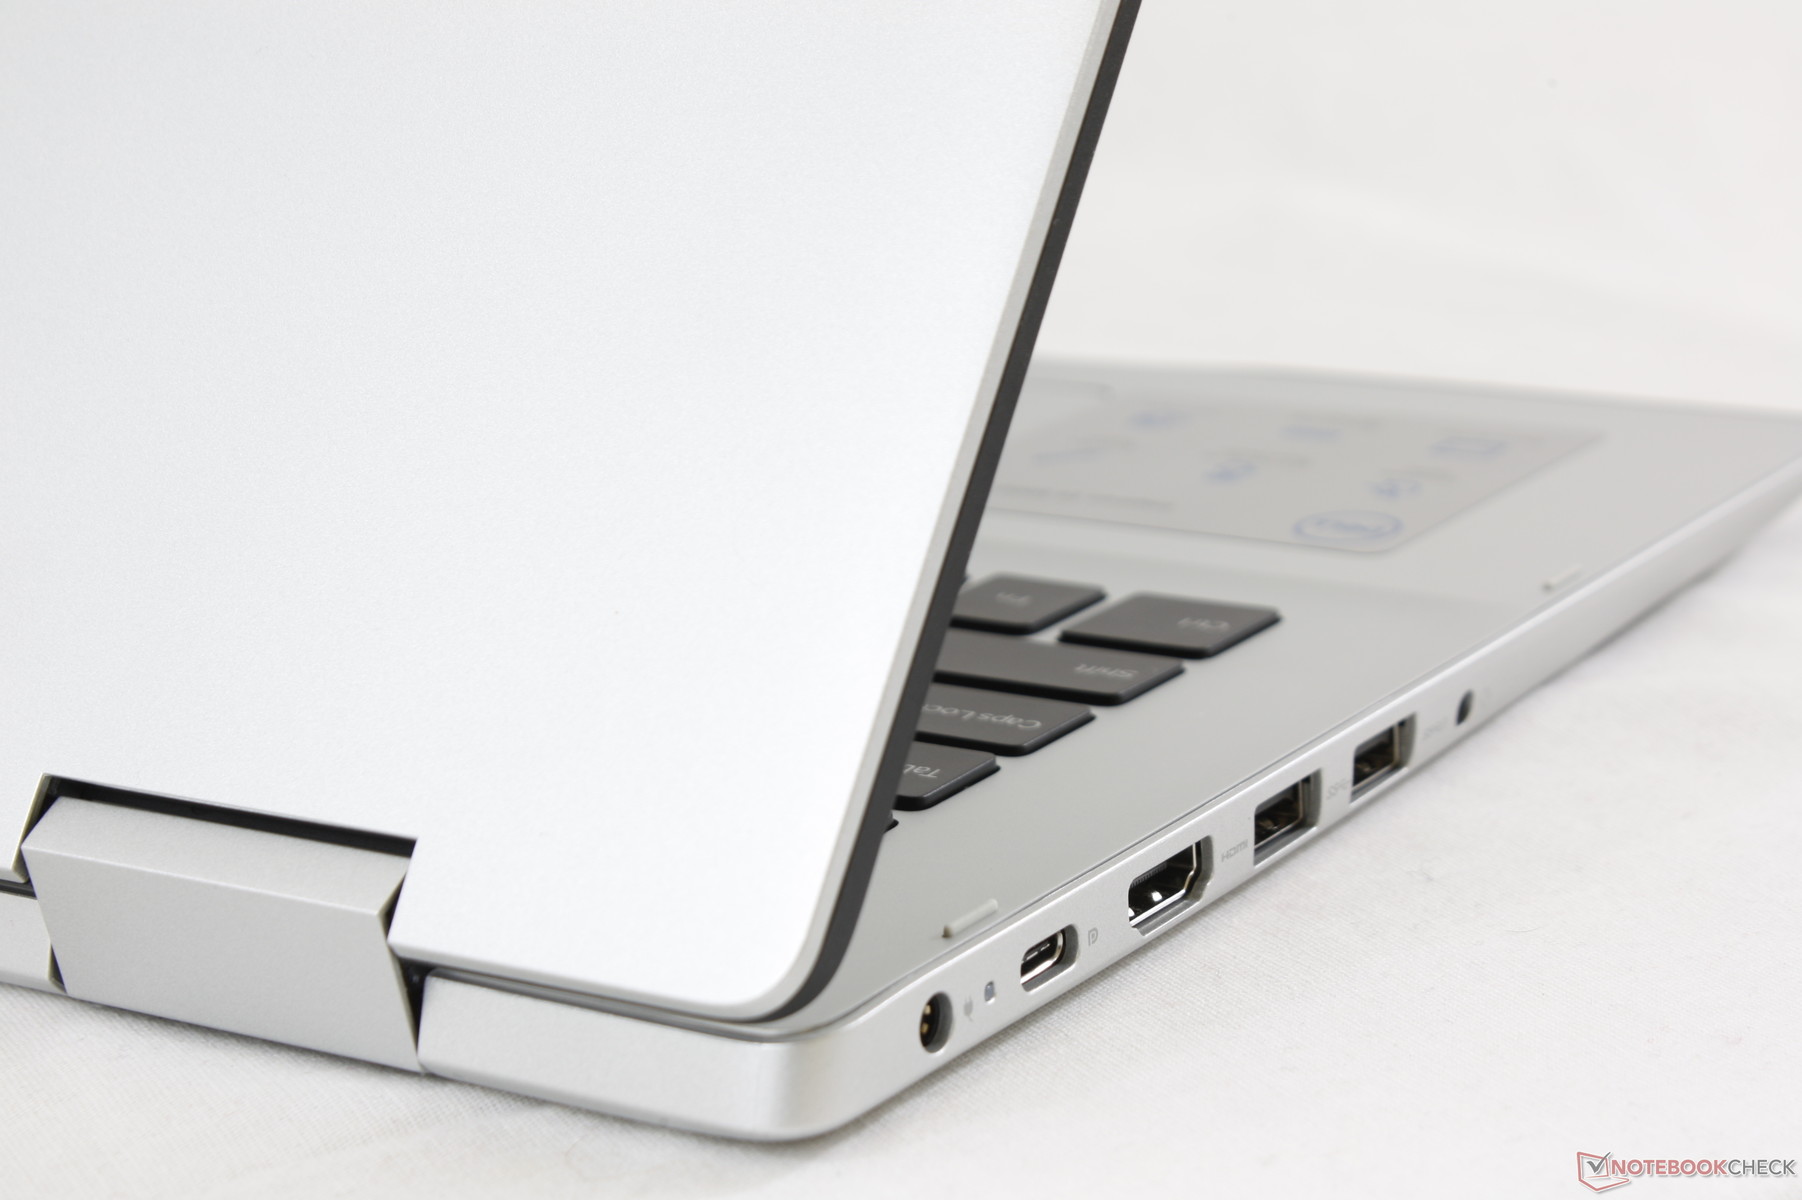
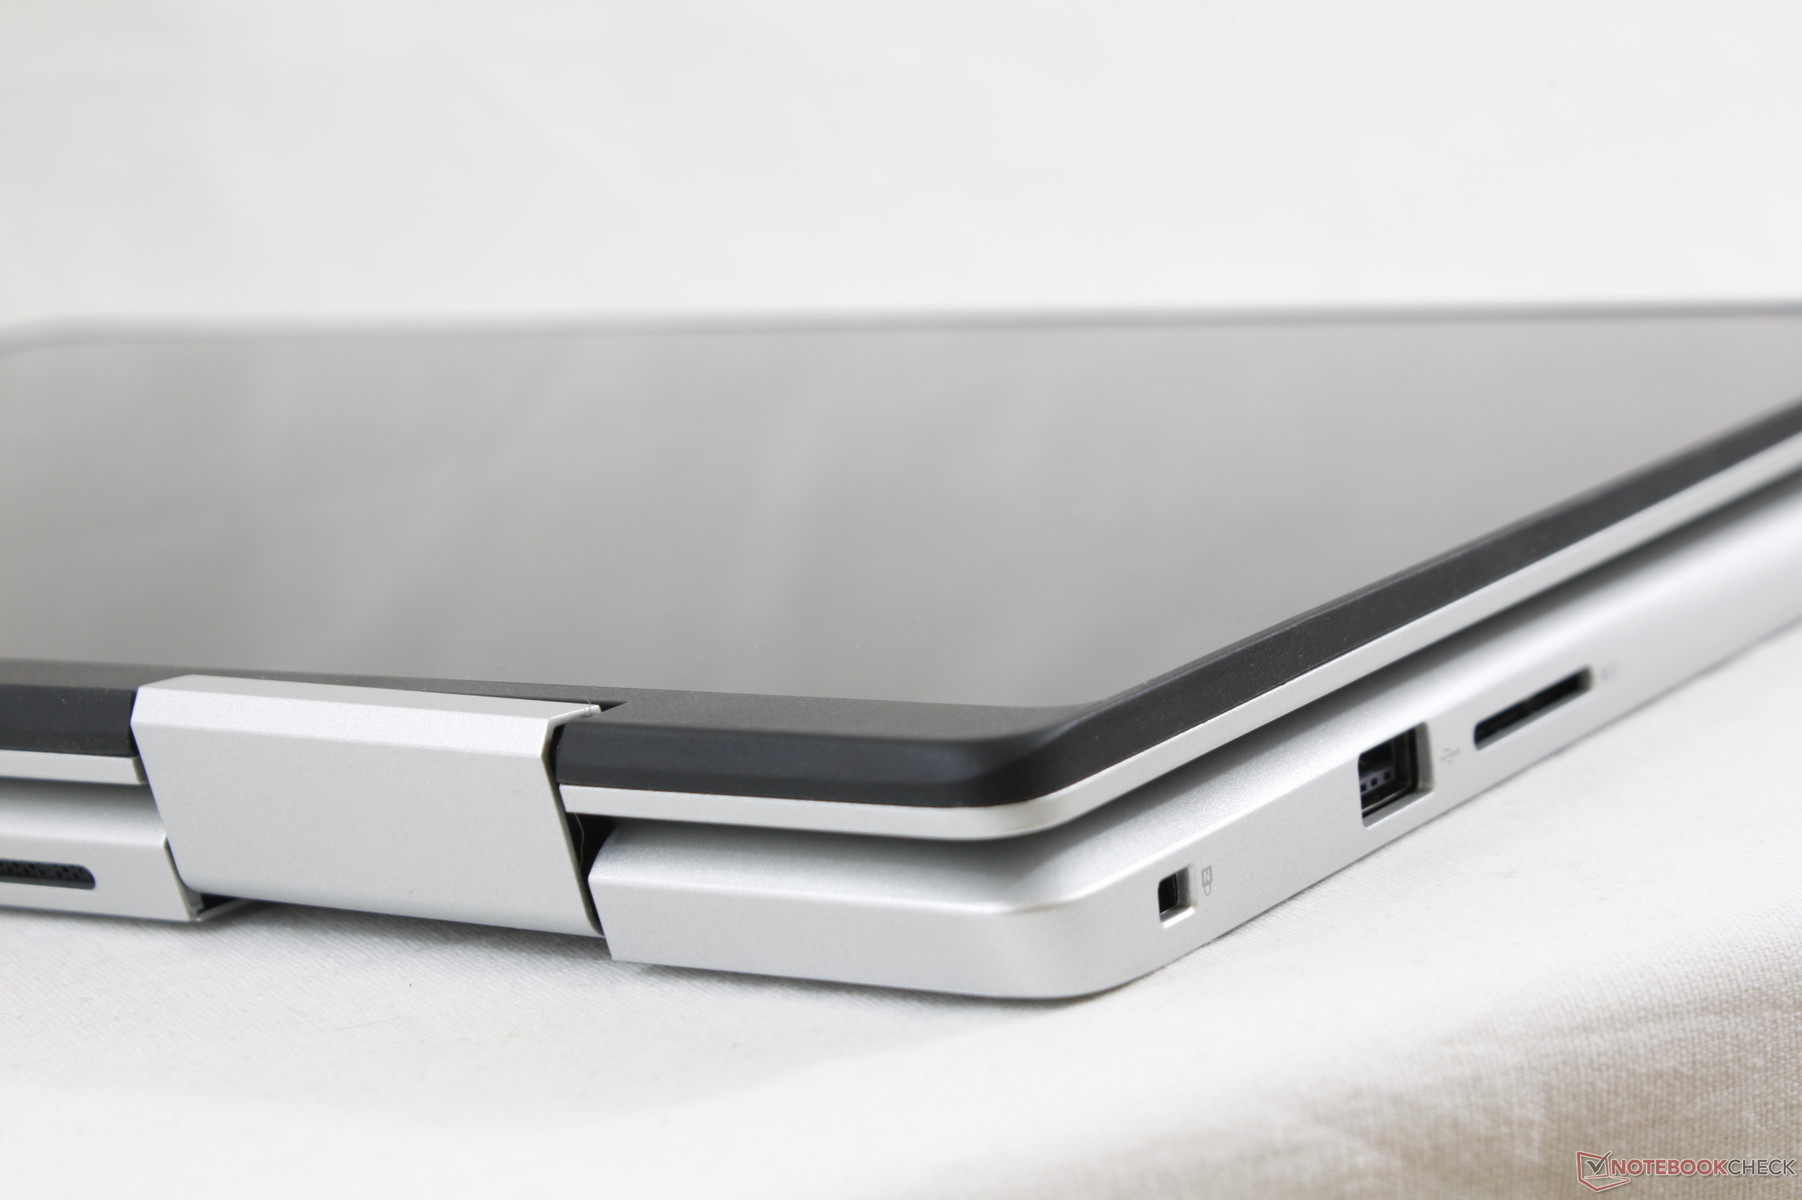
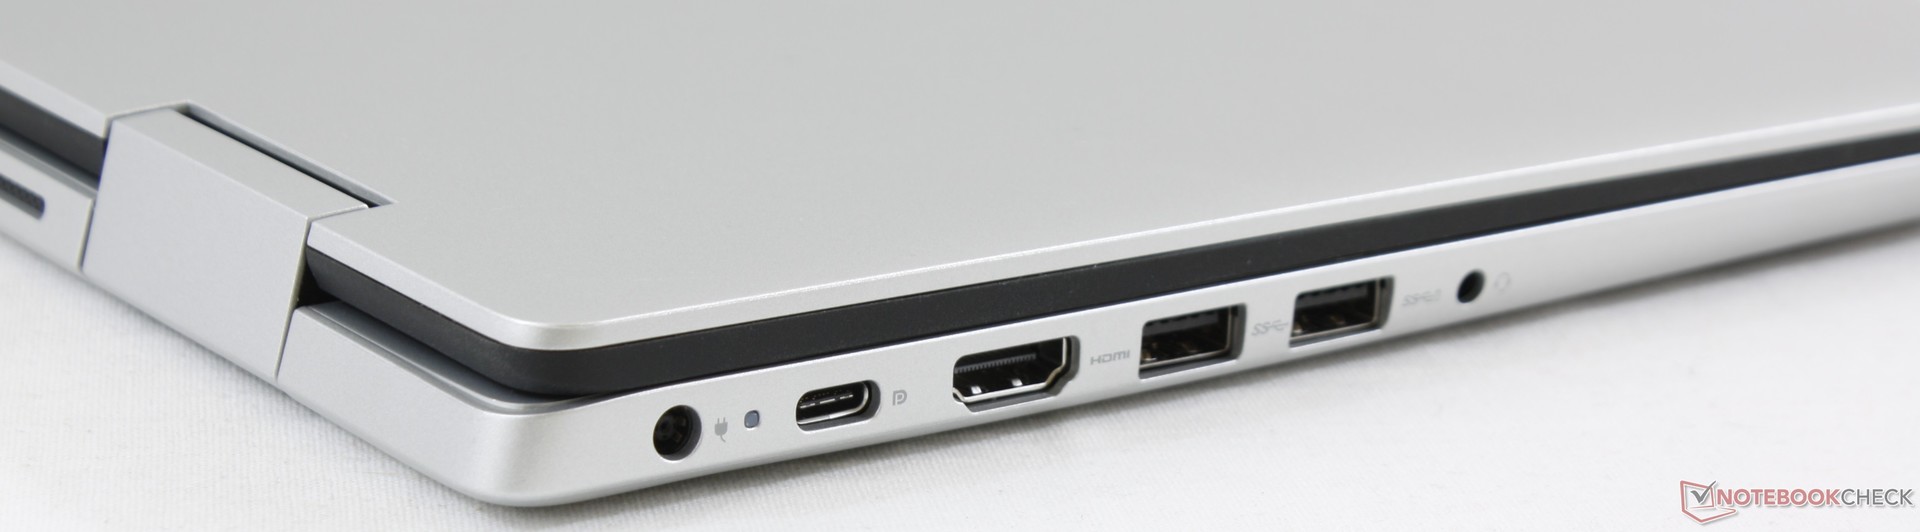
Available ports are plentiful and easy to reach with almost identical options to the competing Yoga 530 and VivoBook Flip 14. Thunderbolt 3 is missing which is to be expected at this price point. A volume rocker would have been convenient for multimedia use.
While there is a proprietary AC charging port, the system can still charge via its USB Type-C port. We tested this with a generic third-party USB-C charger and the system will indeed recognize it as a charging source. A pop-up message will warn users to connect a 27 W or higher adapter and we still suggest using the included proprietary AC charger for more reliable charging.
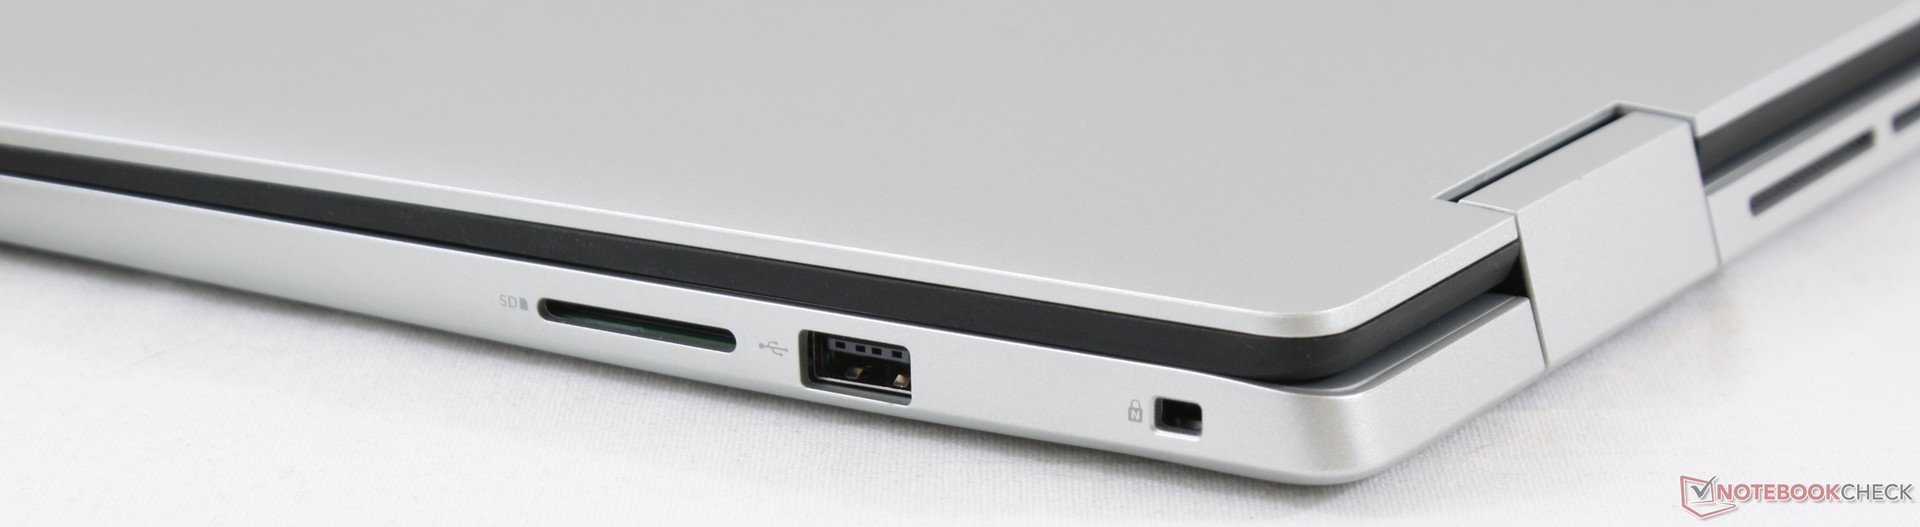
SD Card Reader
Transfer rates are slow at only about 30 MB/s. Moving 1 GB worth of photos from our test card to desktop takes about 34 seconds compared to less than 10 seconds on the XPS 13.
A fully inserted SD card still protrudes by over half its length and so we recommend removing the card before transporting.
| SD Card Reader | |
| average JPG Copy Test (av. of 3 runs) | |
| Dell XPS 13 9370 i7 UHD (Toshiba Exceria Pro UHS-II) | |
| Dell Inspiron 14 5000 5482 2-in-1 (Toshiba Exceria Pro SDXC 64 GB UHS-II) | |
| Lenovo Yoga 530-14IKB-81EK00CWGE (Toshiba Exceria Pro SDXC 64 GB UHS-II) | |
| Asus VivoBook Flip 14 TP412UA-DB51T (Toshiba Exceria Pro SDXC 64 GB UHS-II) | |
| maximum AS SSD Seq Read Test (1GB) | |
| Dell XPS 13 9370 i7 UHD (Toshiba Exceria Pro UHS-II) | |
| Dell Inspiron 14 5000 5482 2-in-1 (Toshiba Exceria Pro SDXC 64 GB UHS-II) | |
| Lenovo Yoga 530-14IKB-81EK00CWGE (Toshiba Exceria Pro SDXC 64 GB UHS-II) | |
| Asus VivoBook Flip 14 TP412UA-DB51T (Toshiba Exceria Pro SDXC 64 GB UHS-II) | |
Communication
It's surprising to see an Intel 9560 module in the system as most pricier Ultrabooks carry the same module. Theoretical transfer rates are up to 1.73 Gbps compared to only half that or less on the Intel 8265 or 3165. We experienced no connectivity issues during our time with the test unit.
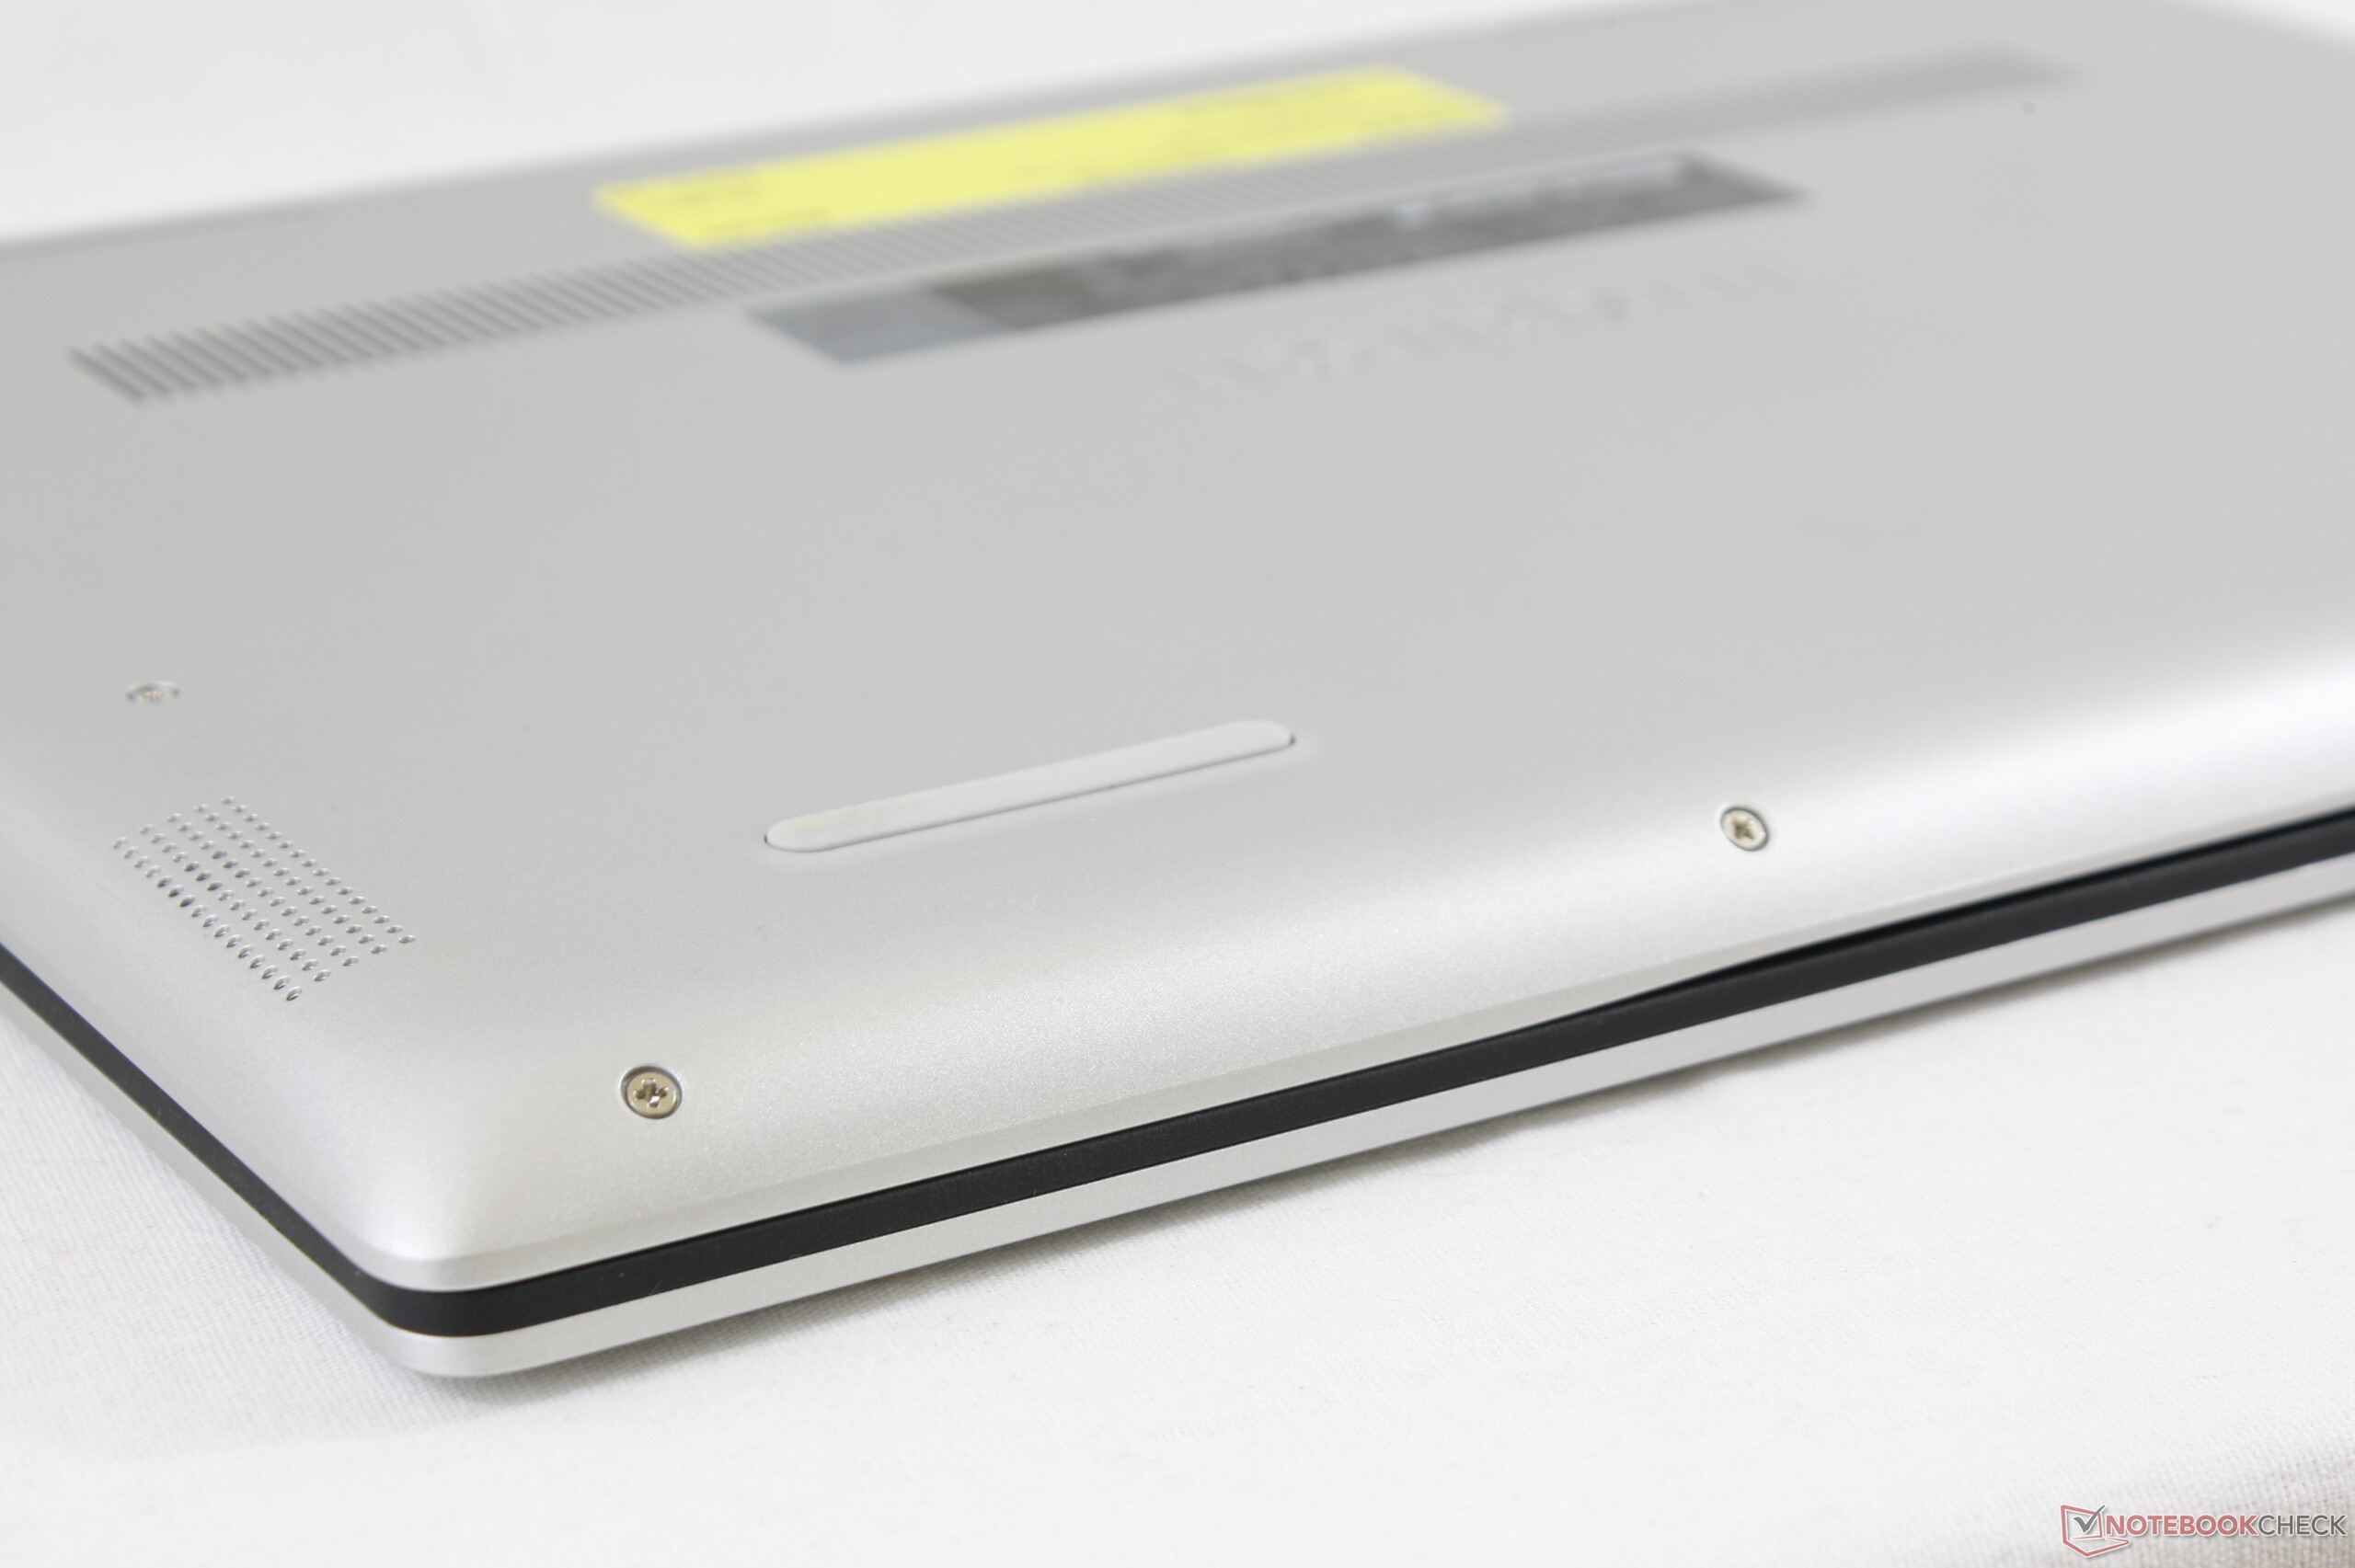
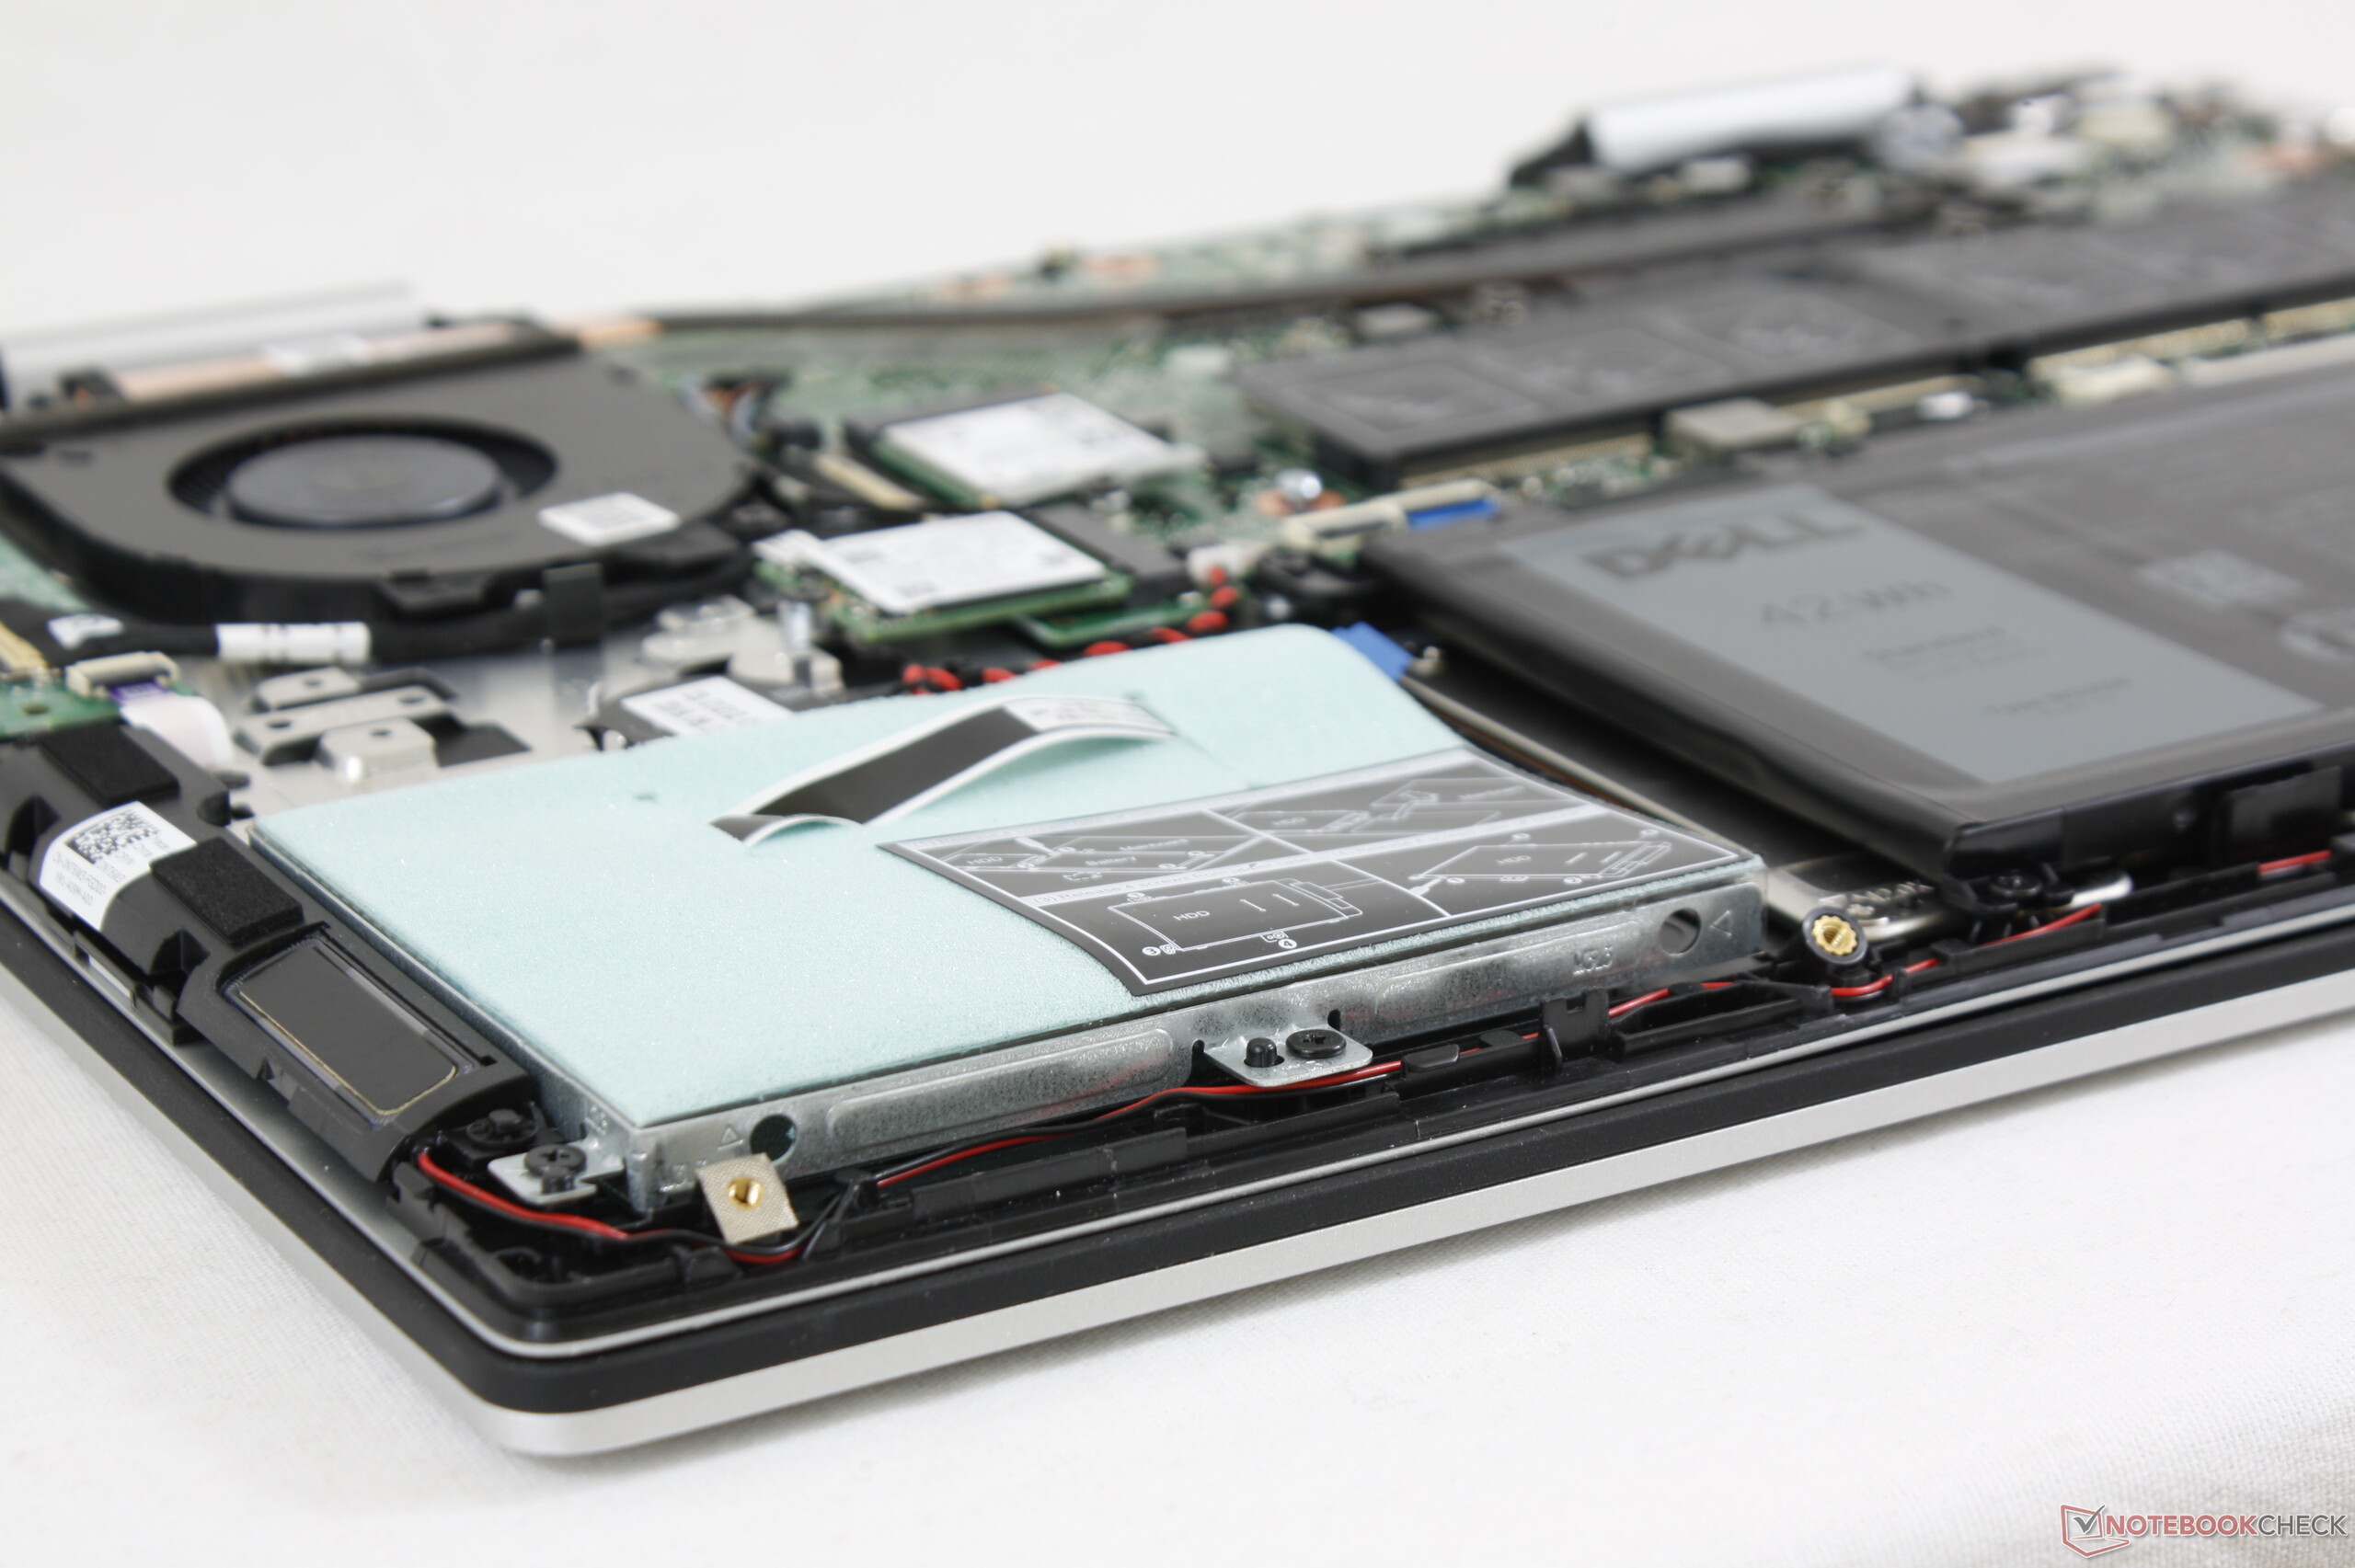
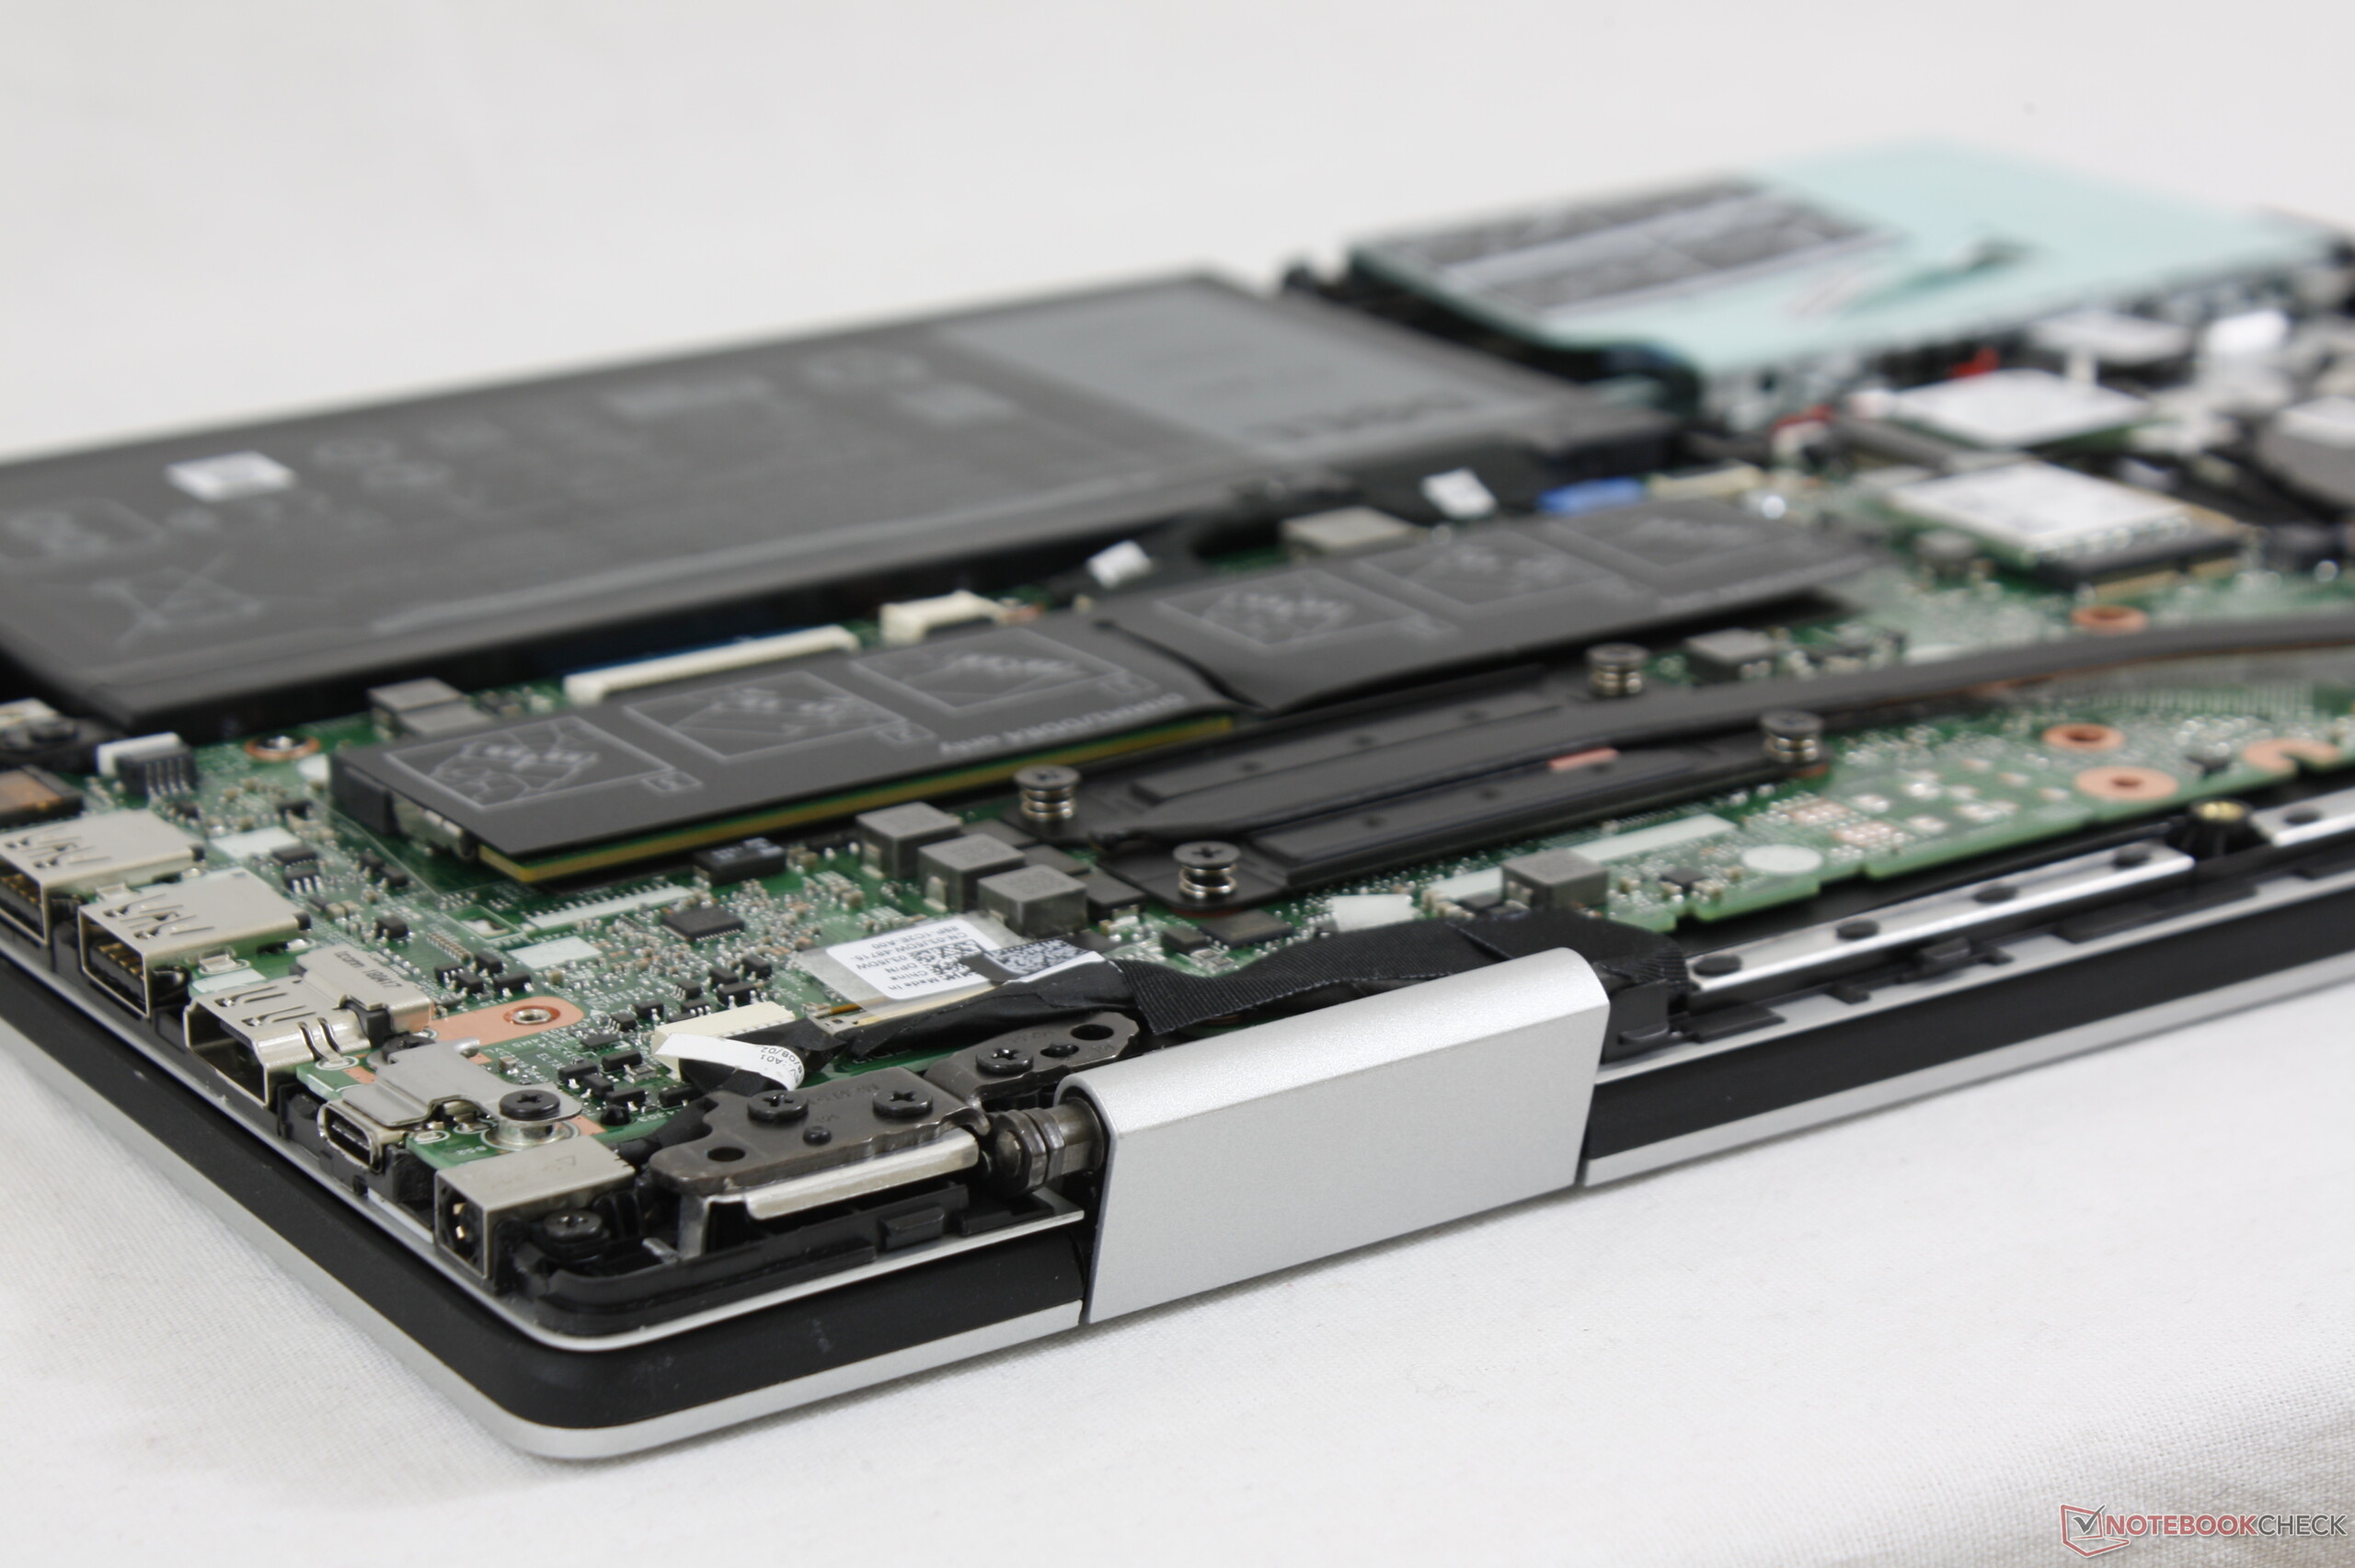
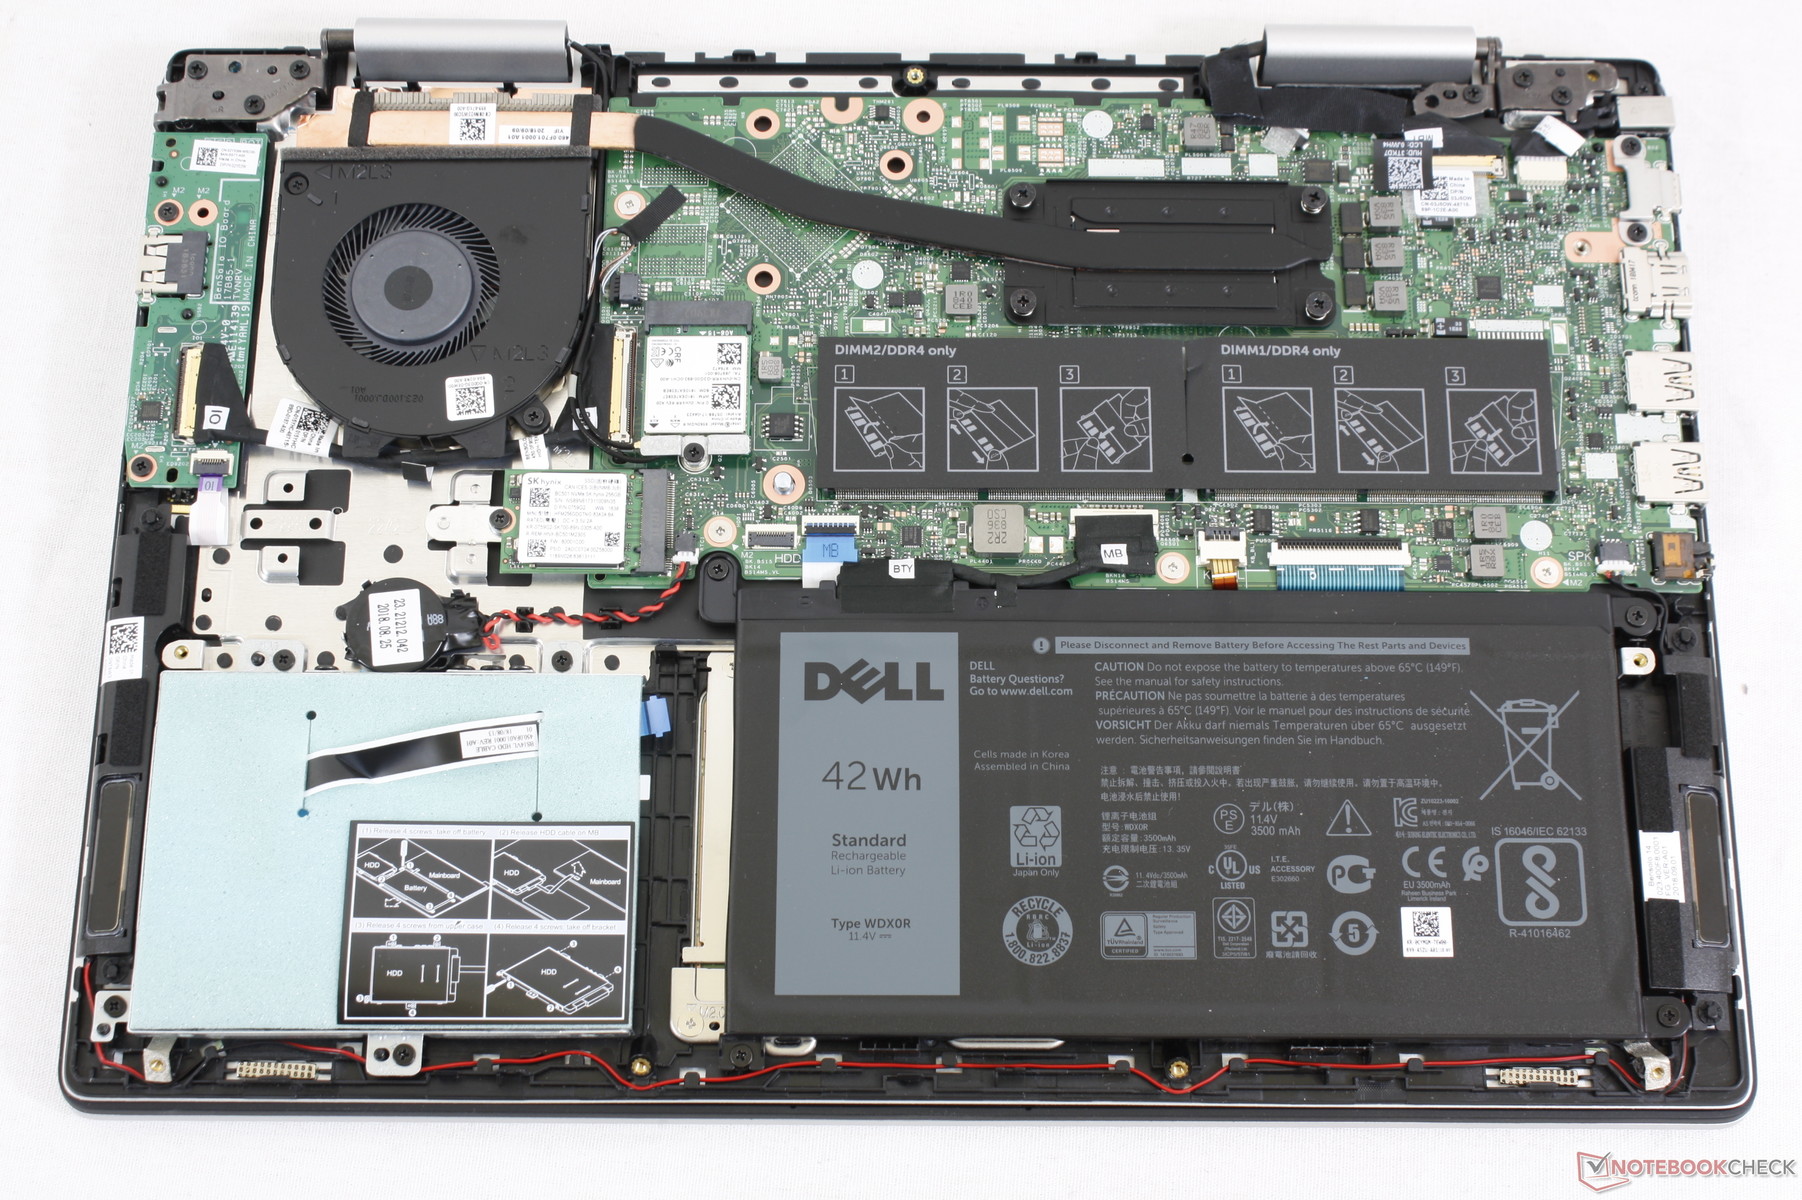
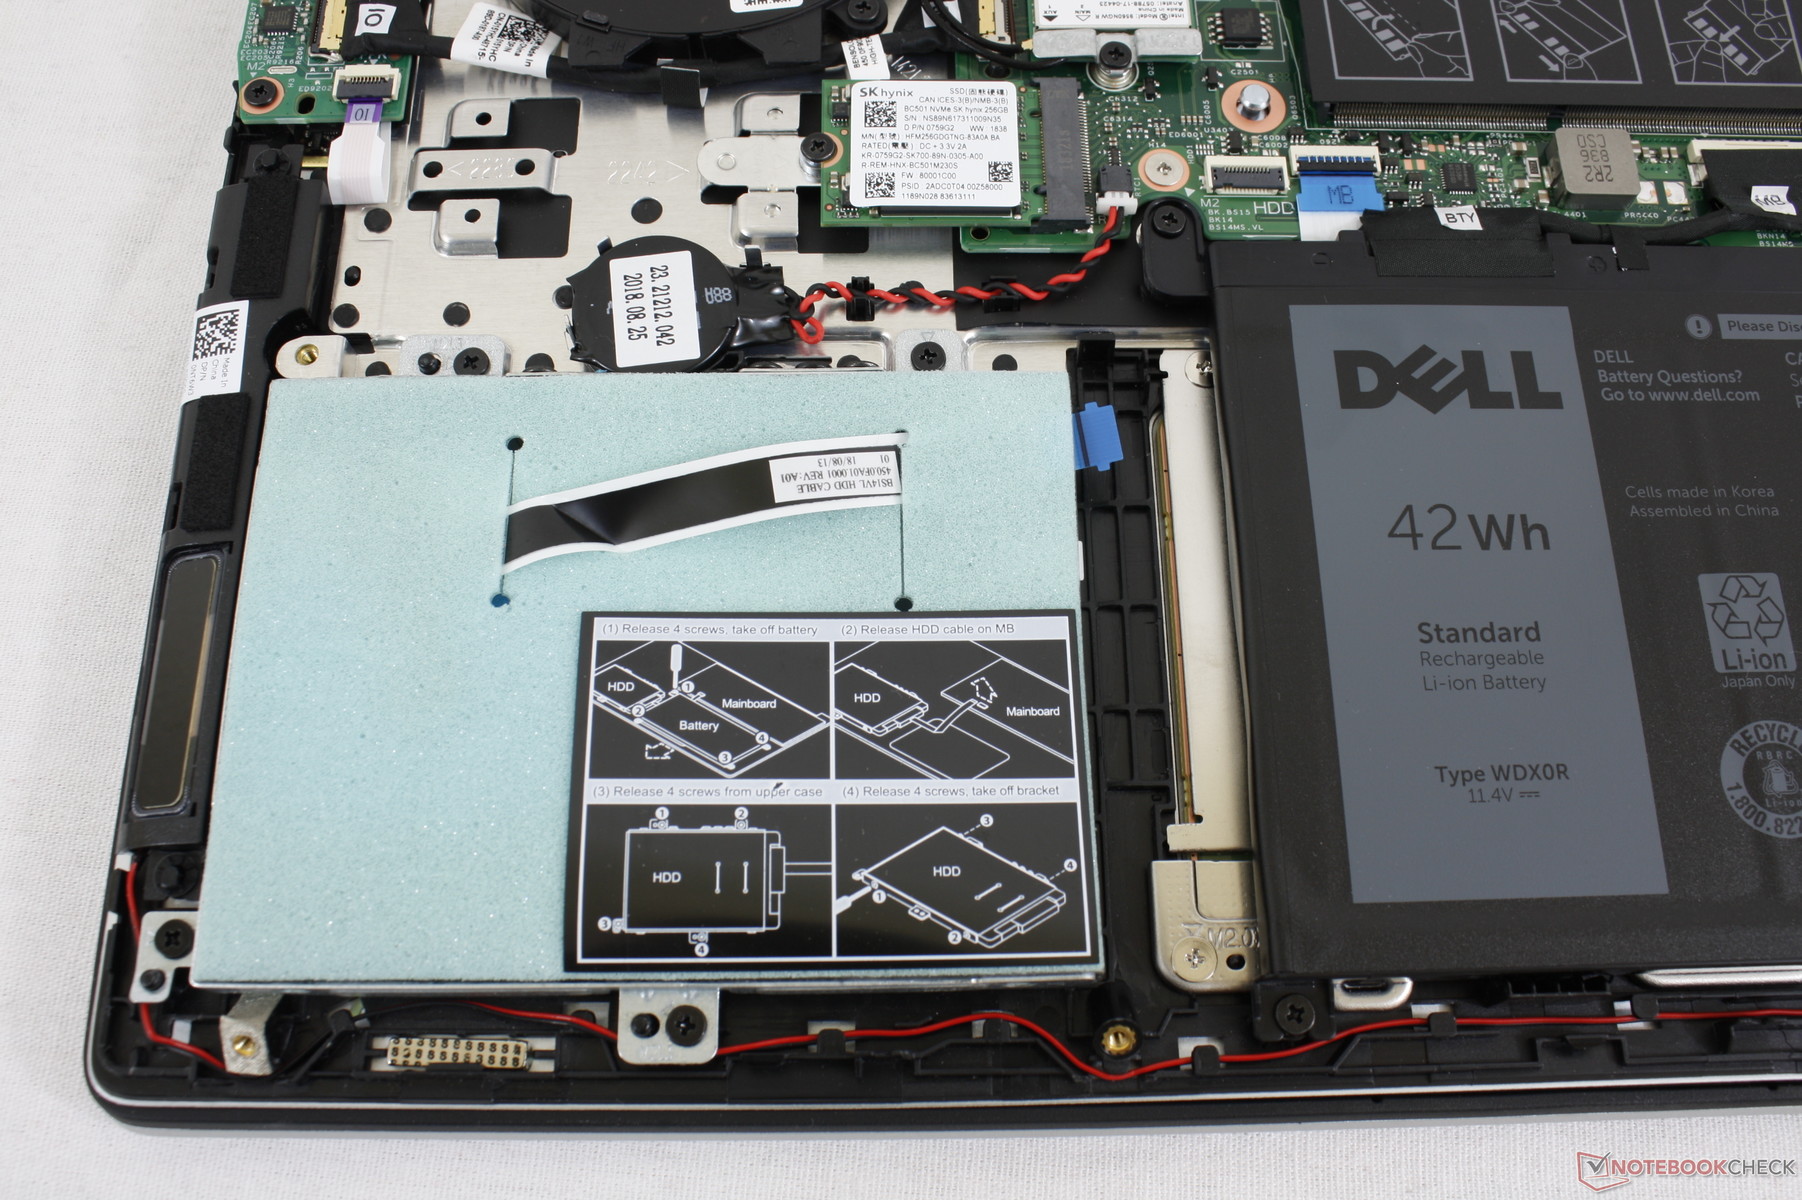
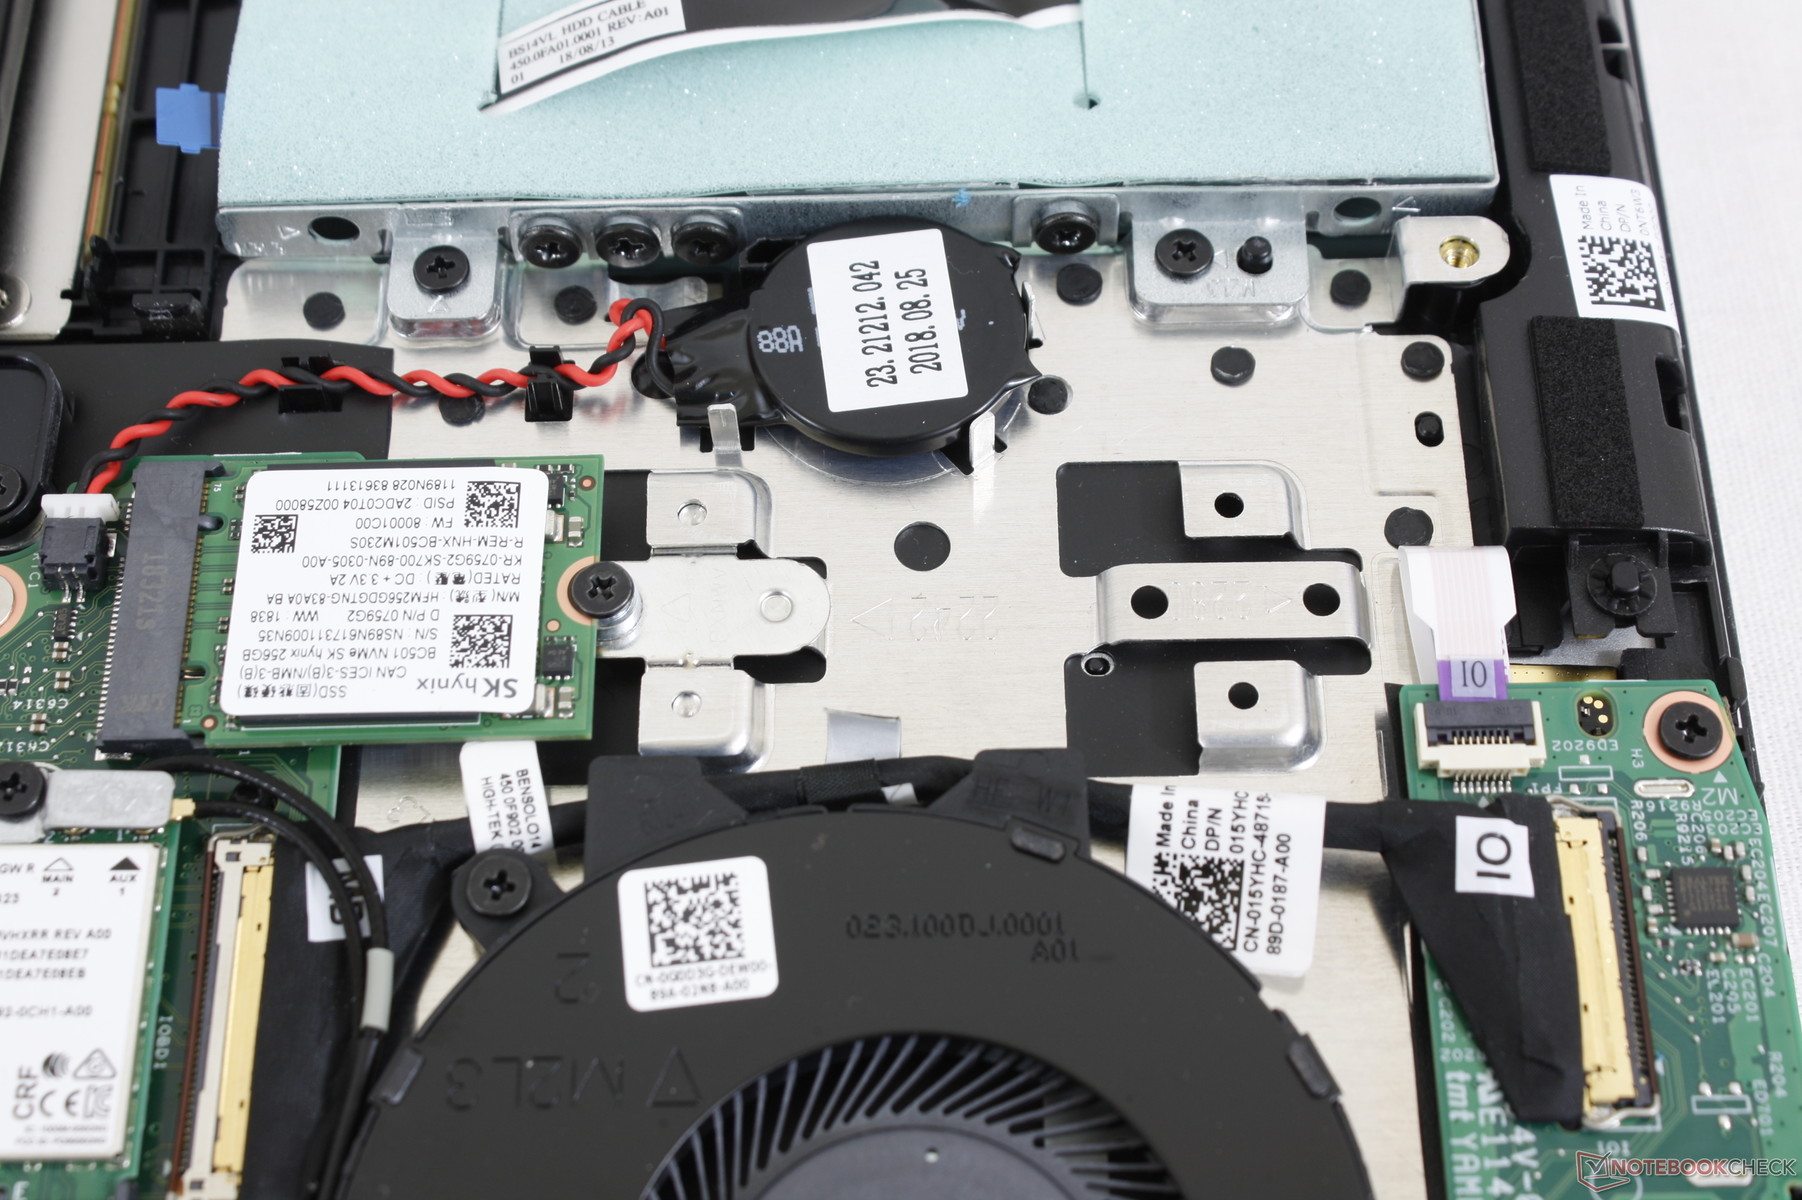
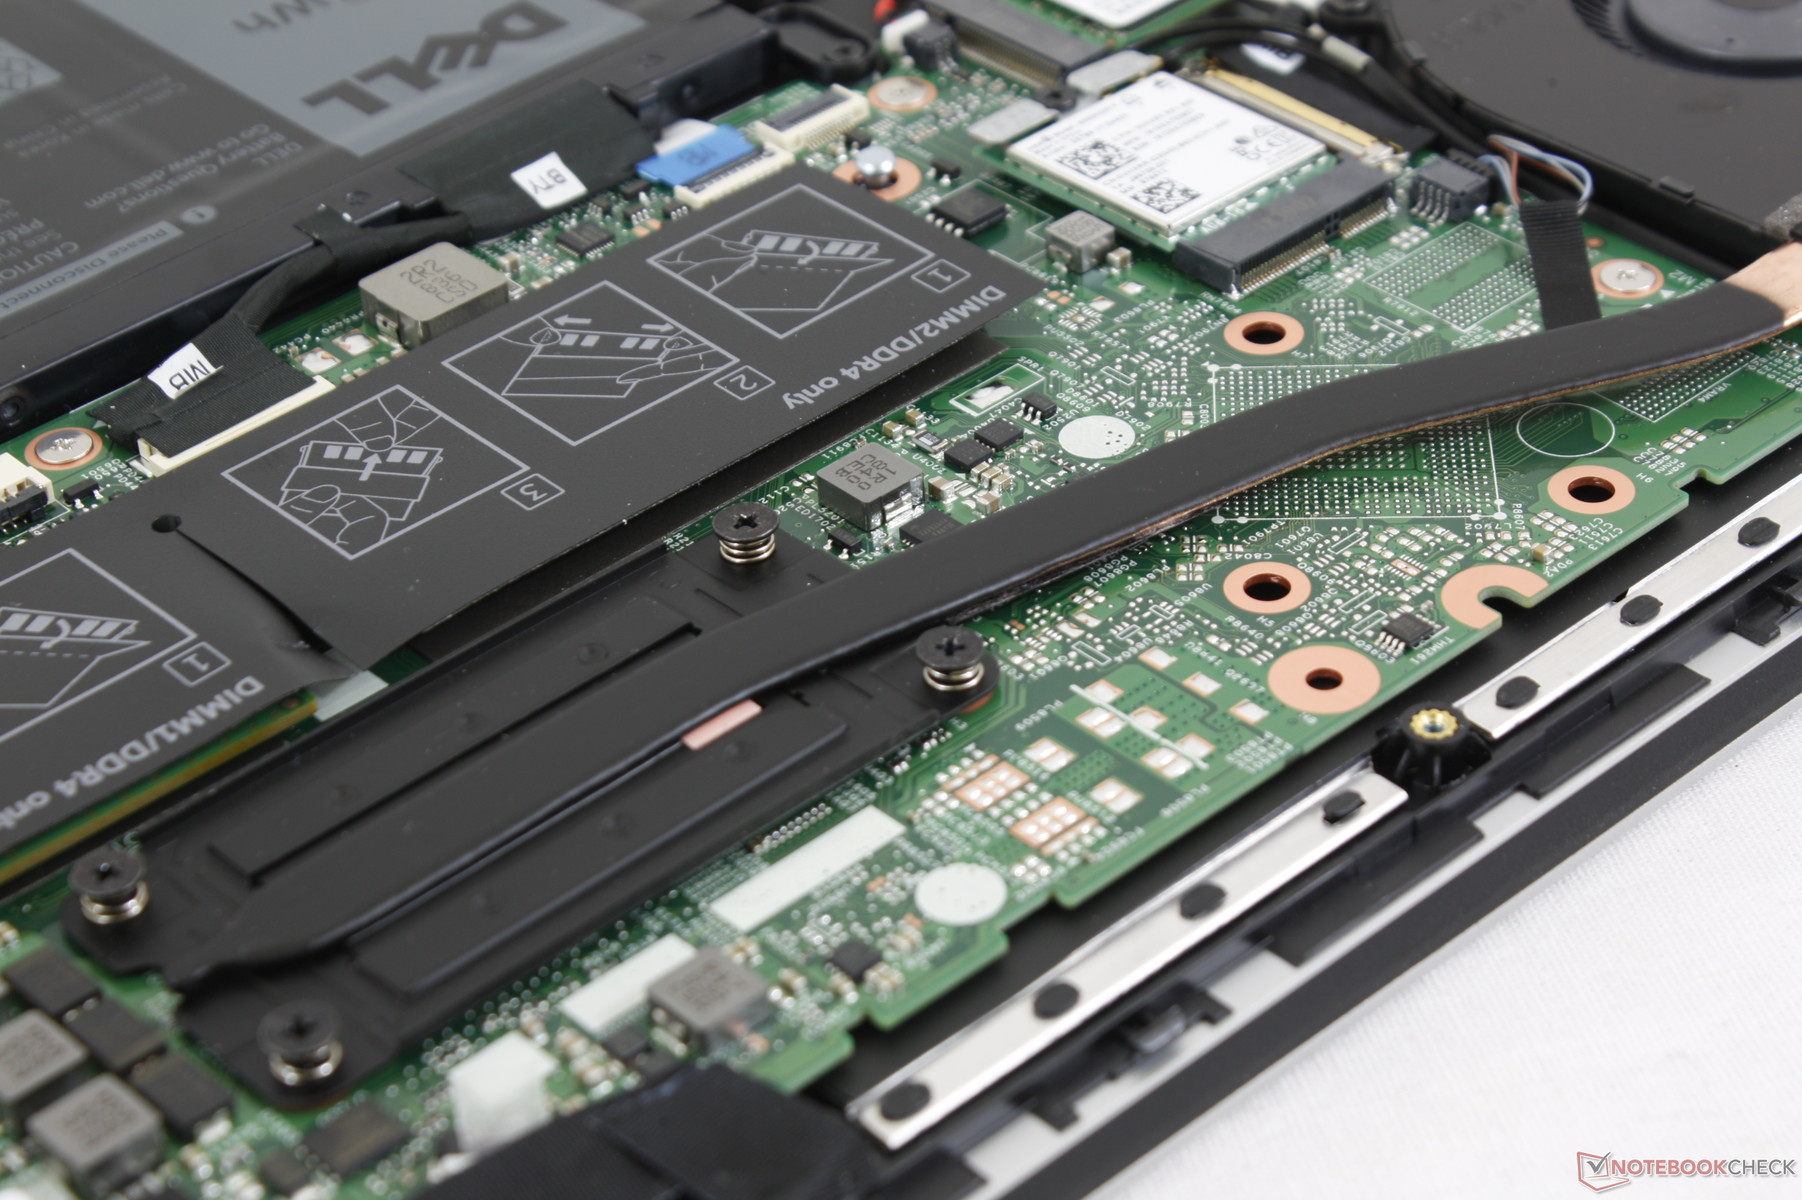
Maintenance
The bottom panel can be removed with a Philips screwdriver and a sharp edge. Users get direct access to all major components without additional disassembly.
Accessories and Warranty
There are no included extras, adapters, or pens outside of the AC adapter and warranty card.
The standard one-year limited warranty applies with options to extend up to four years. Please see our Guarantees, Return policies and Warranties FAQ for country-specific information.
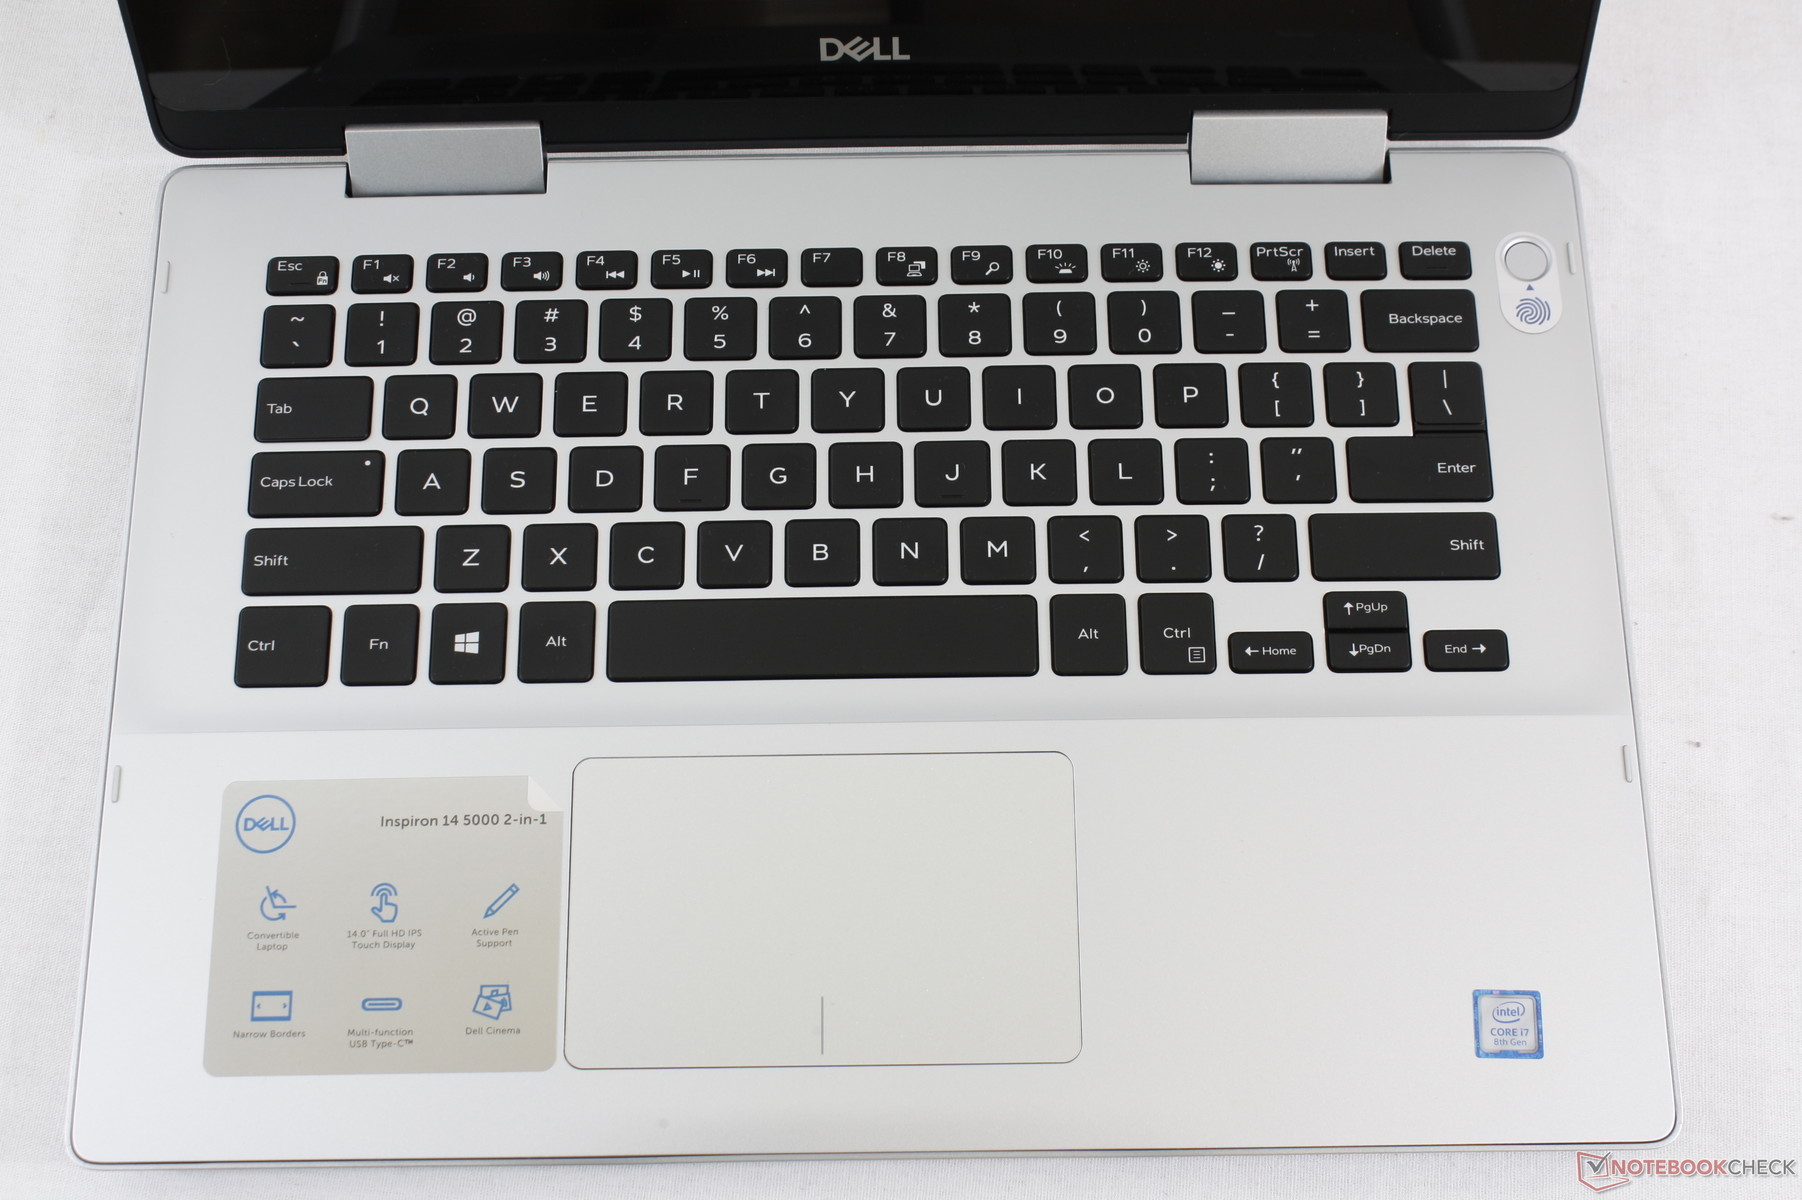
Input Devices
Keyboard
The keyboard is a weak point of the Inspiron. Travel is very shallow, feedback is soft, and the keys are very light. It's definitely inferior to what the pricier XPS or Latitude series have to offer. Perhaps the only positive attributes are its three-level white backlight and relatively quiet clatter whilst typing.
Touchpad
The slightly textured trackpad (10.1 x 6.5 cm) offers nearly the same surface area as the trackpad on the smaller XPS 13 2-in-1. Gliding and responsiveness are excellent for slow or fast cursor control as one would expect. The integrated mouse keys are shallow and slightly spongy in travel despite the auditory click when pressed. Firmer feedback would have improved accuracy and user experience.
Display
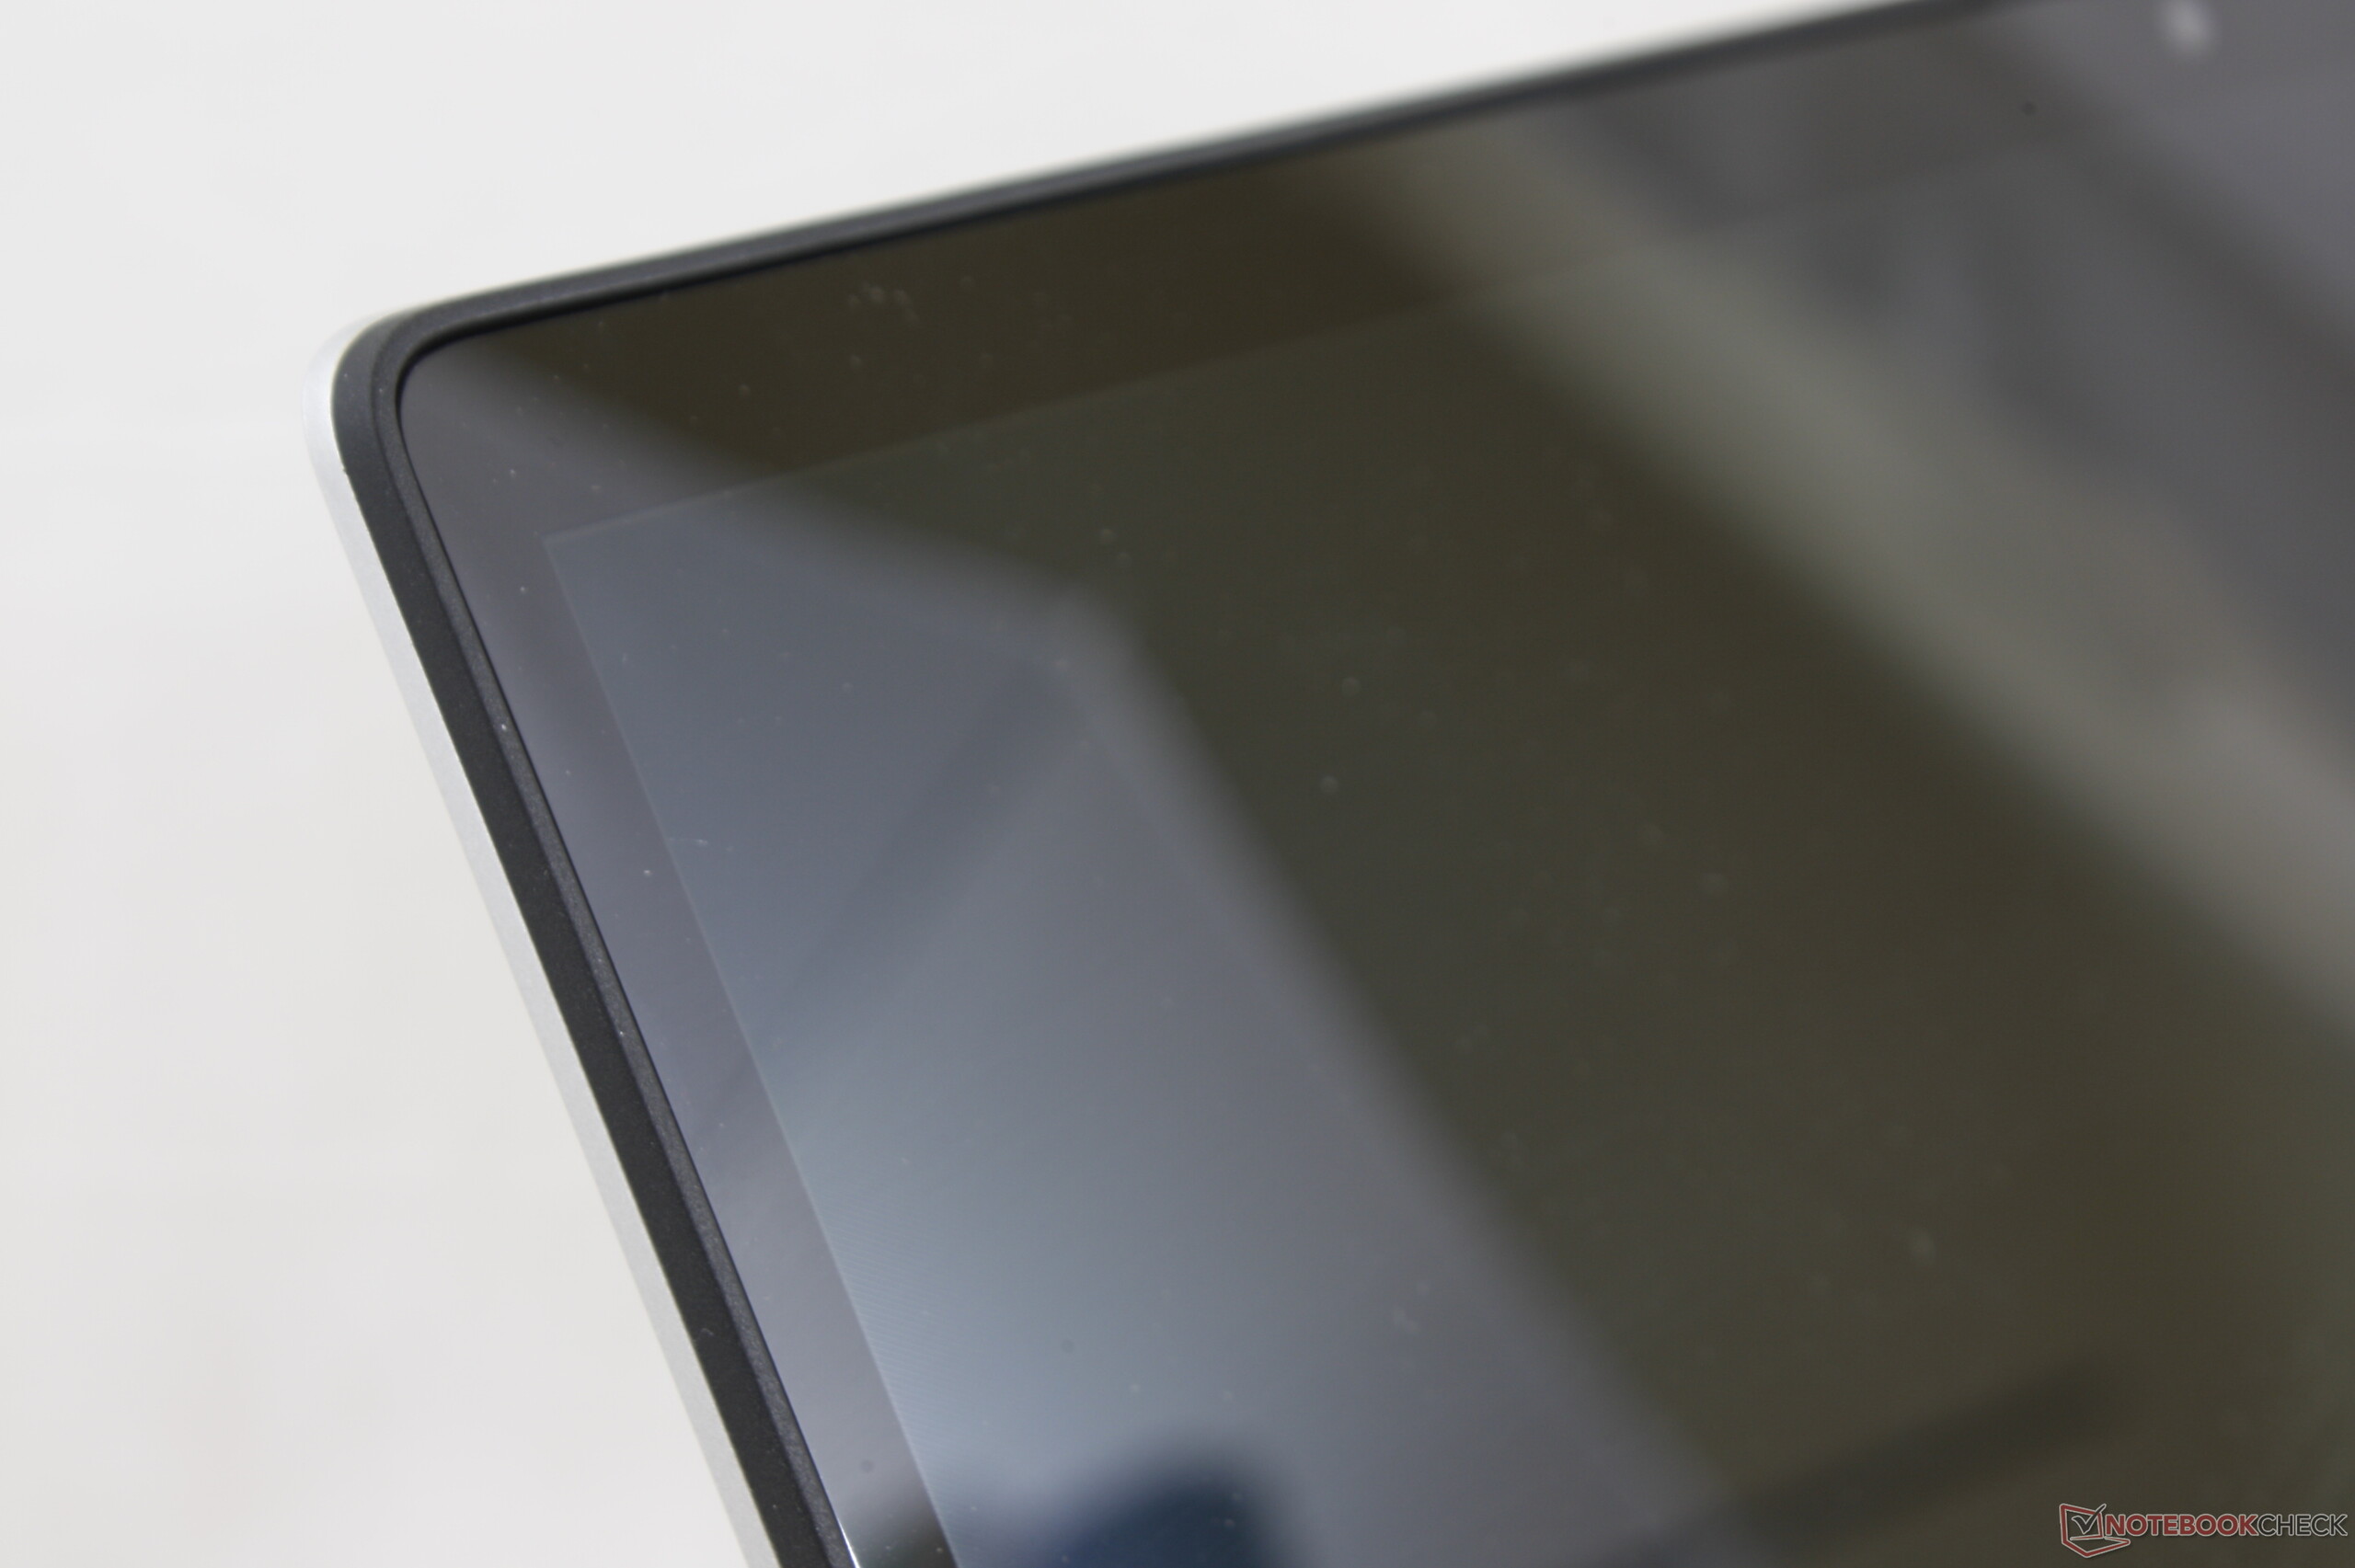
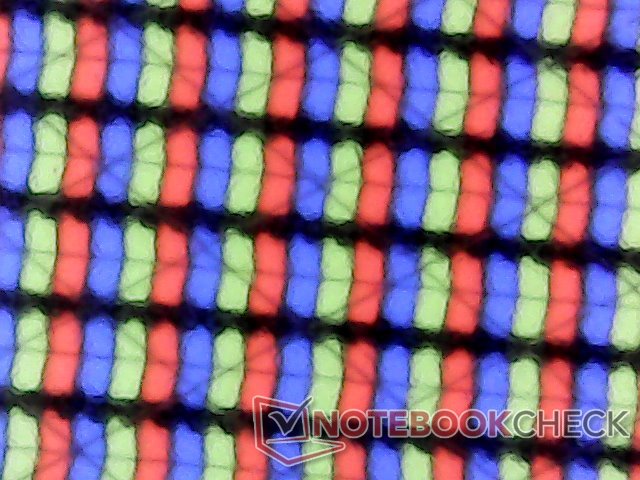
All current SKUs carry a WACOM-compatible 1080p IPS touchscreen with no other options. Our test unit uses a BOE NV14N4H IPS panel found on no other laptop in our database. Most of its core attributes like response times and gamut are otherwise similar to other budget IPS panels. A bright spot is its contrast ratio of over 1000:1, but this is held back by the average color space and color accuracy.
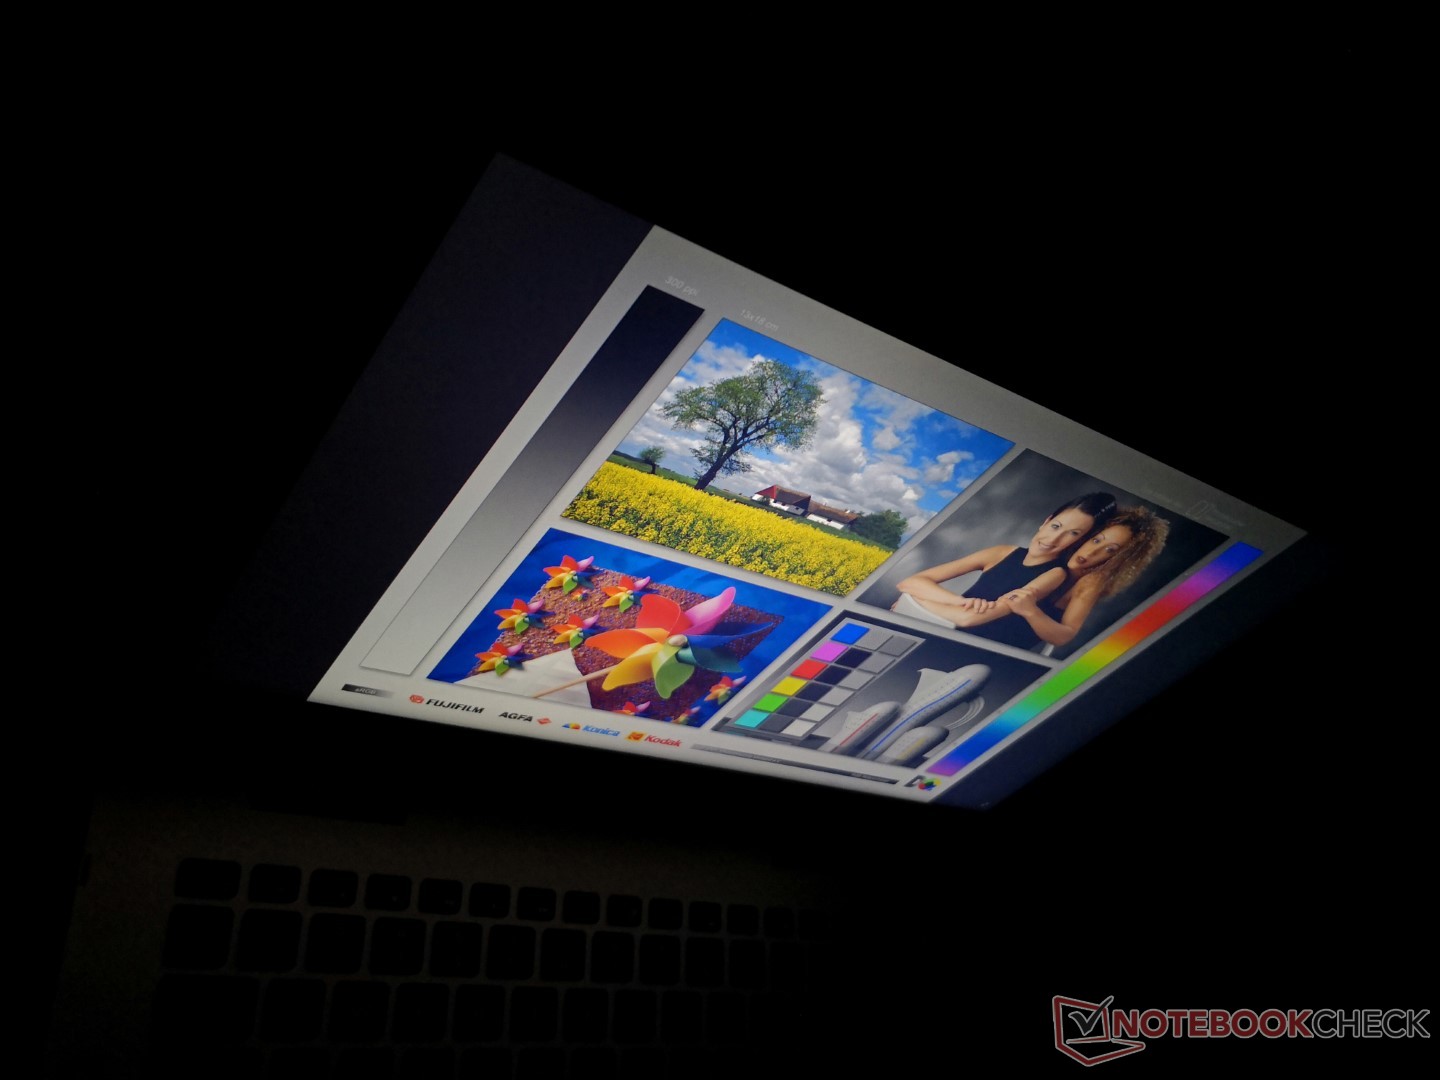
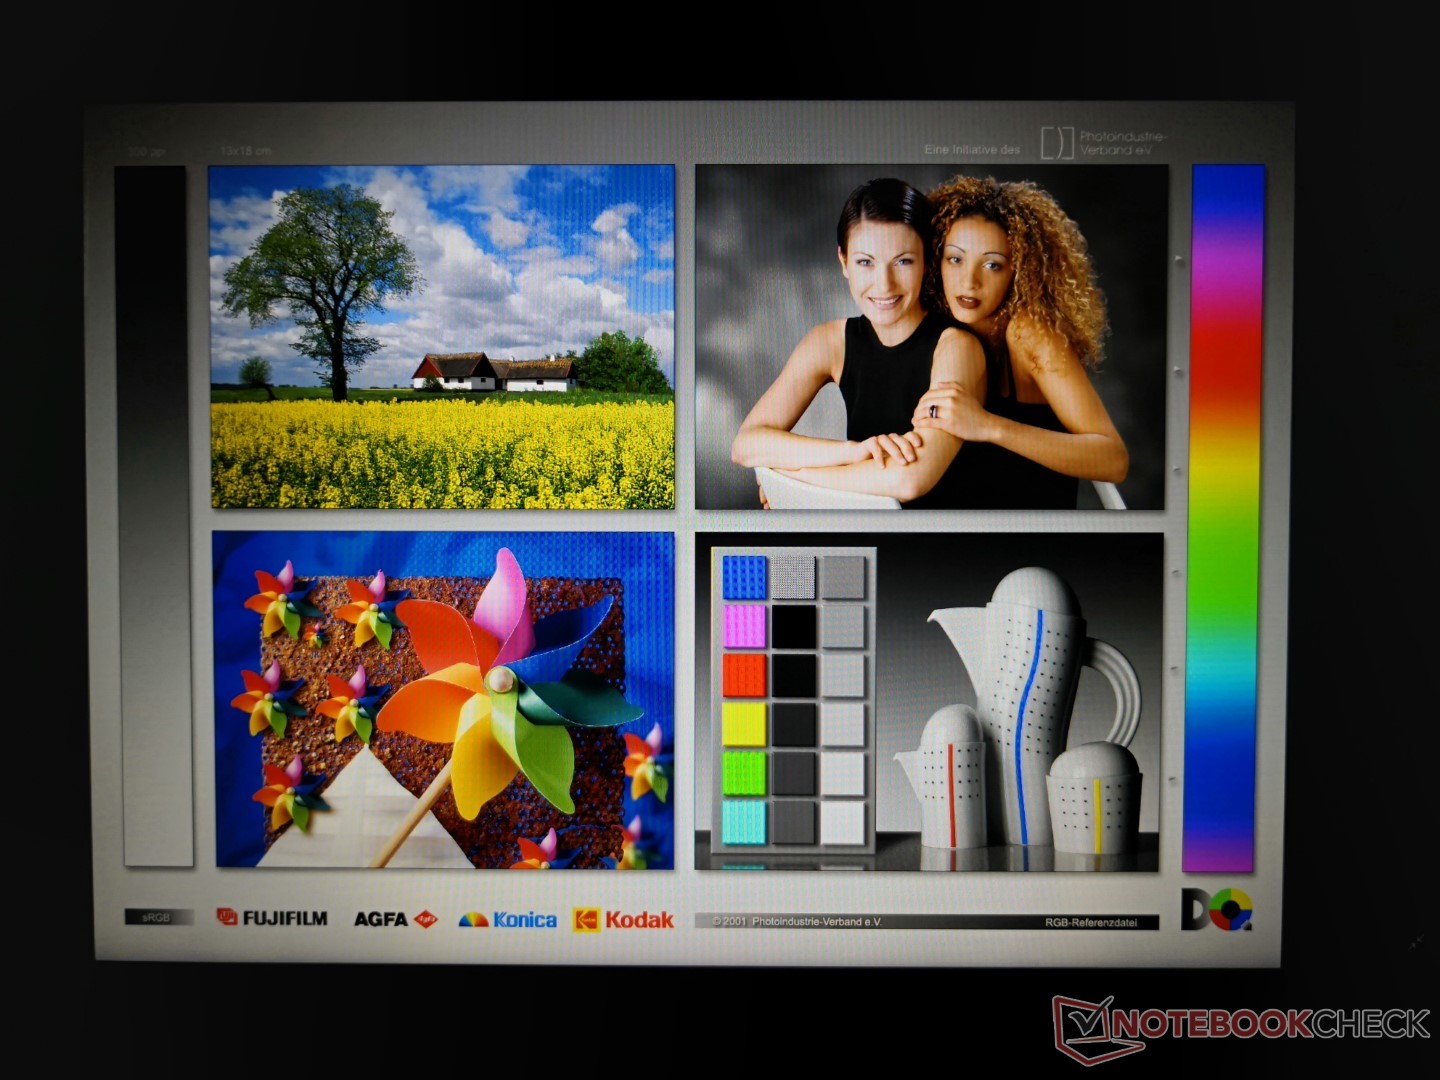
Texts and images are slightly grainy for a glossy panel. This is most noticeable when displaying black text against a white background such as on a NotePad file.
Maximum brightness is poor at under 200 nits. The competing Yoga 530 and VivoBook Flip 14 are each about 50 nits brighter. Additionally, pulse-width modulation is present on almost all brightness levels which may affect a small subset of users sensitive to onscreen flickering.
Backlight bleeding is present but minimal on our test unit. We are able to detect pulse-width modulation on all brightness levels up to 98 percent and so users sensitive to onscreen flickering may want to avoid this model.

| |||||||||||||||||||||||||
Brightness Distribution: 78 %
Center on Battery: 193.6 cd/m²
Contrast: 1139:1 (Black: 0.17 cd/m²)
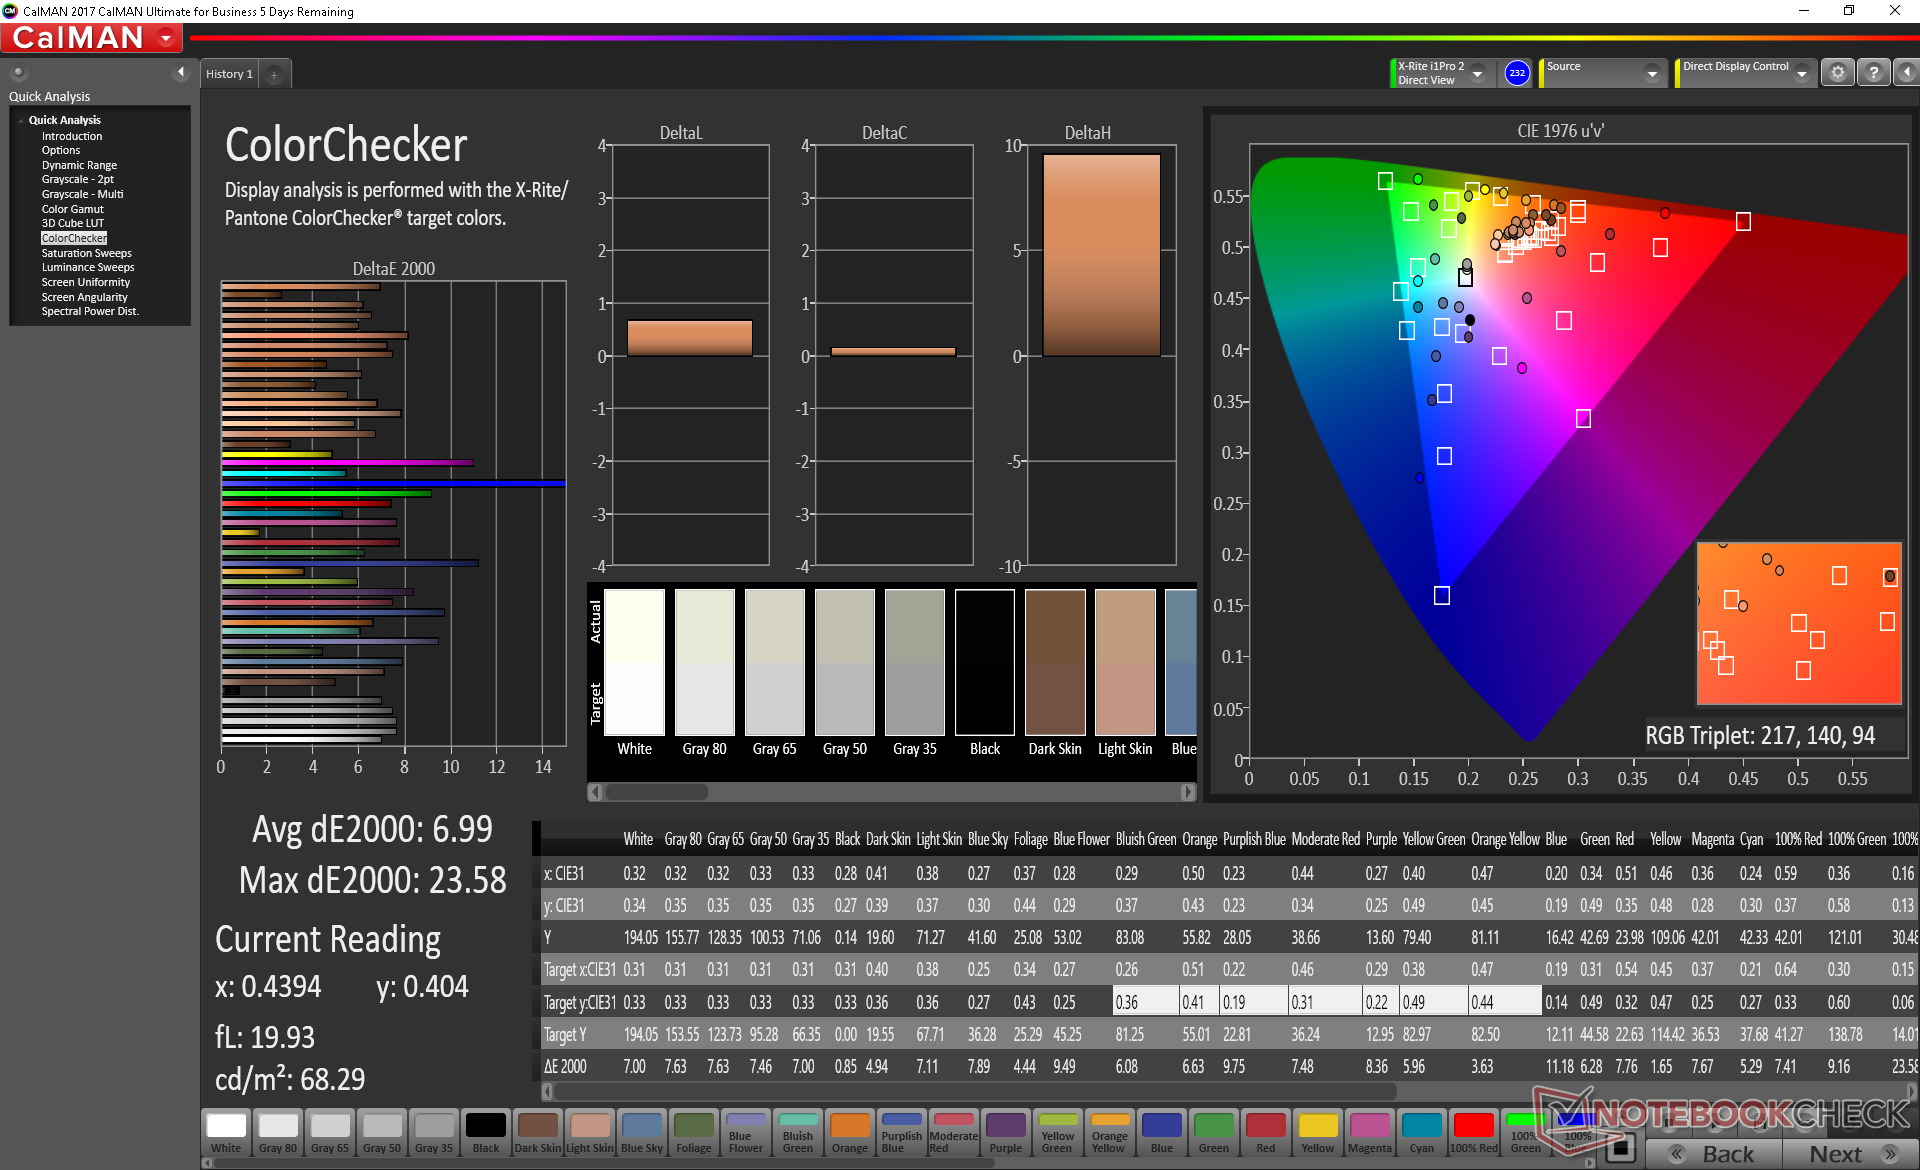
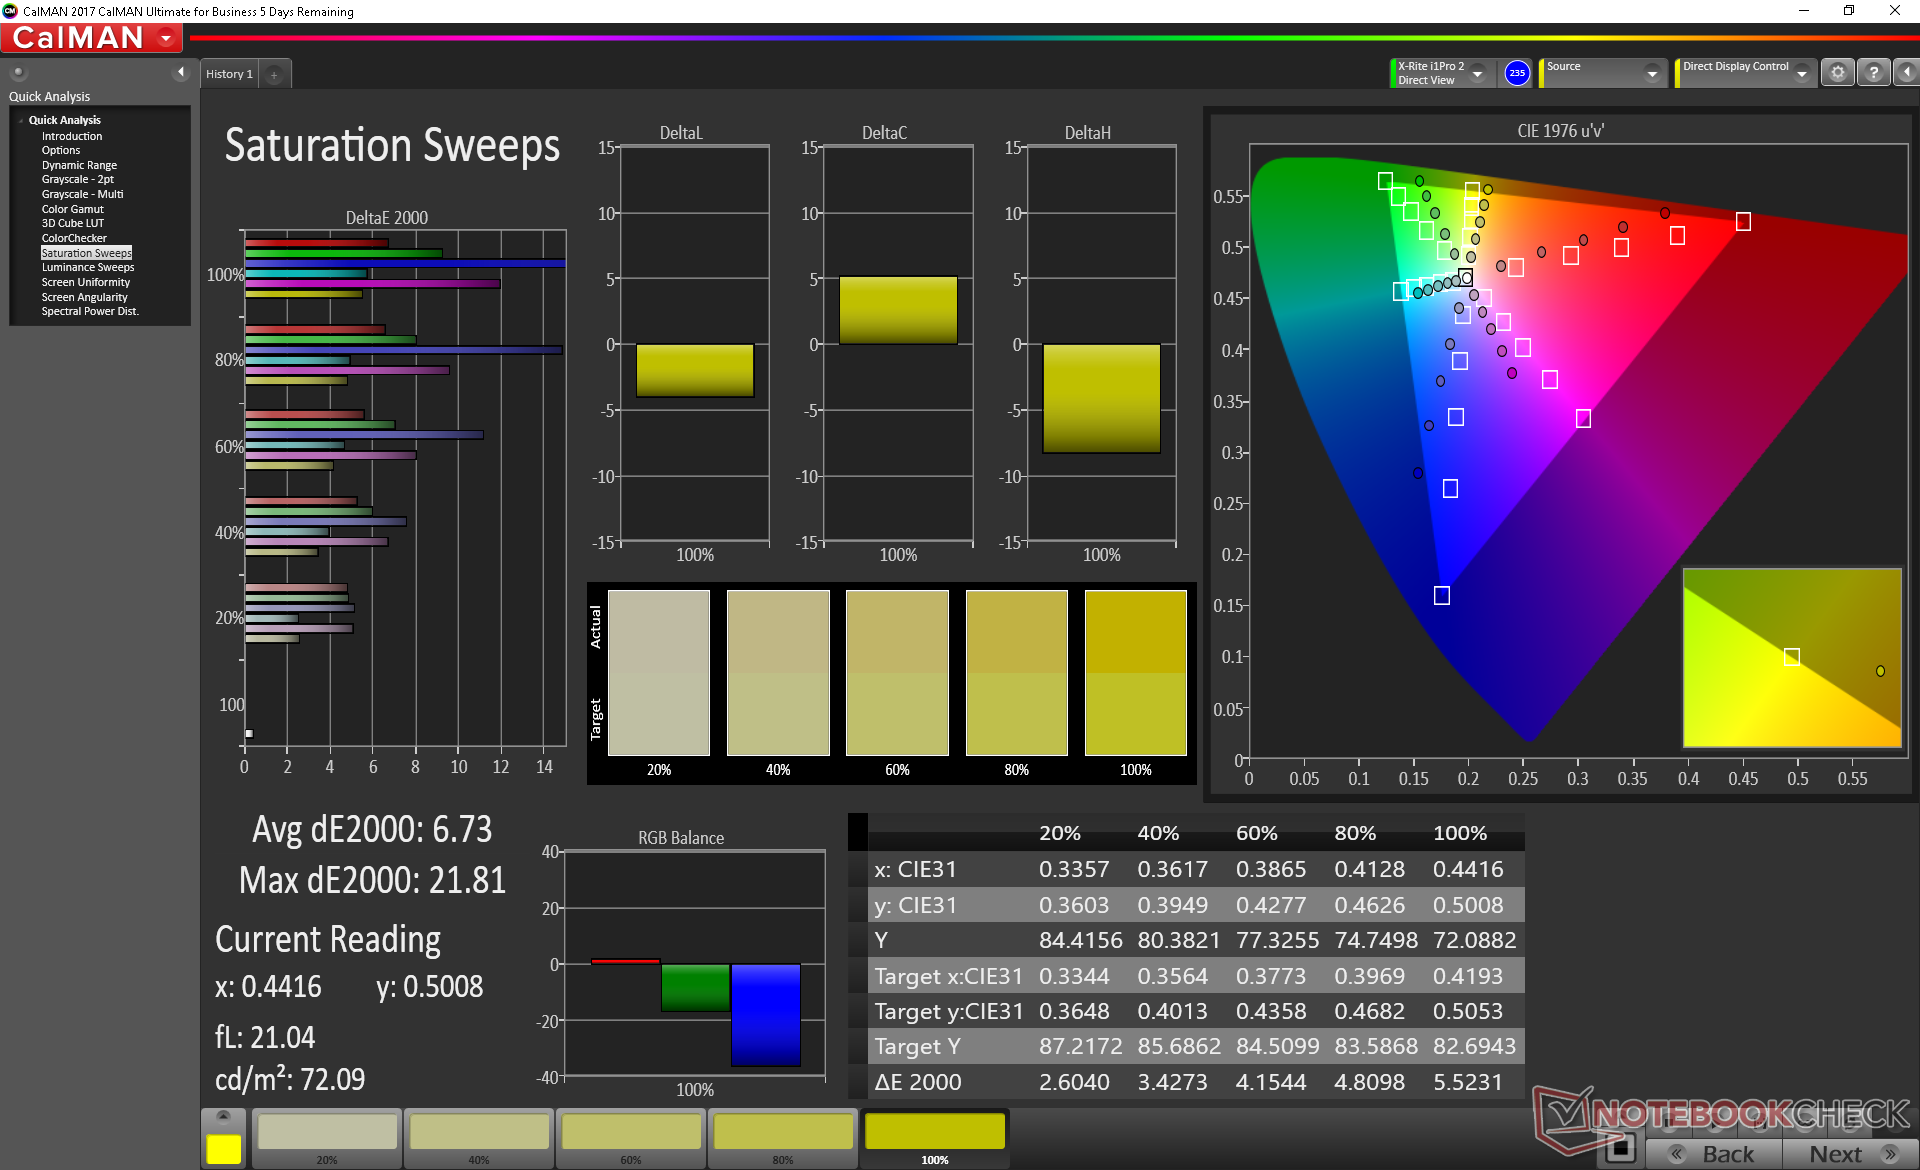
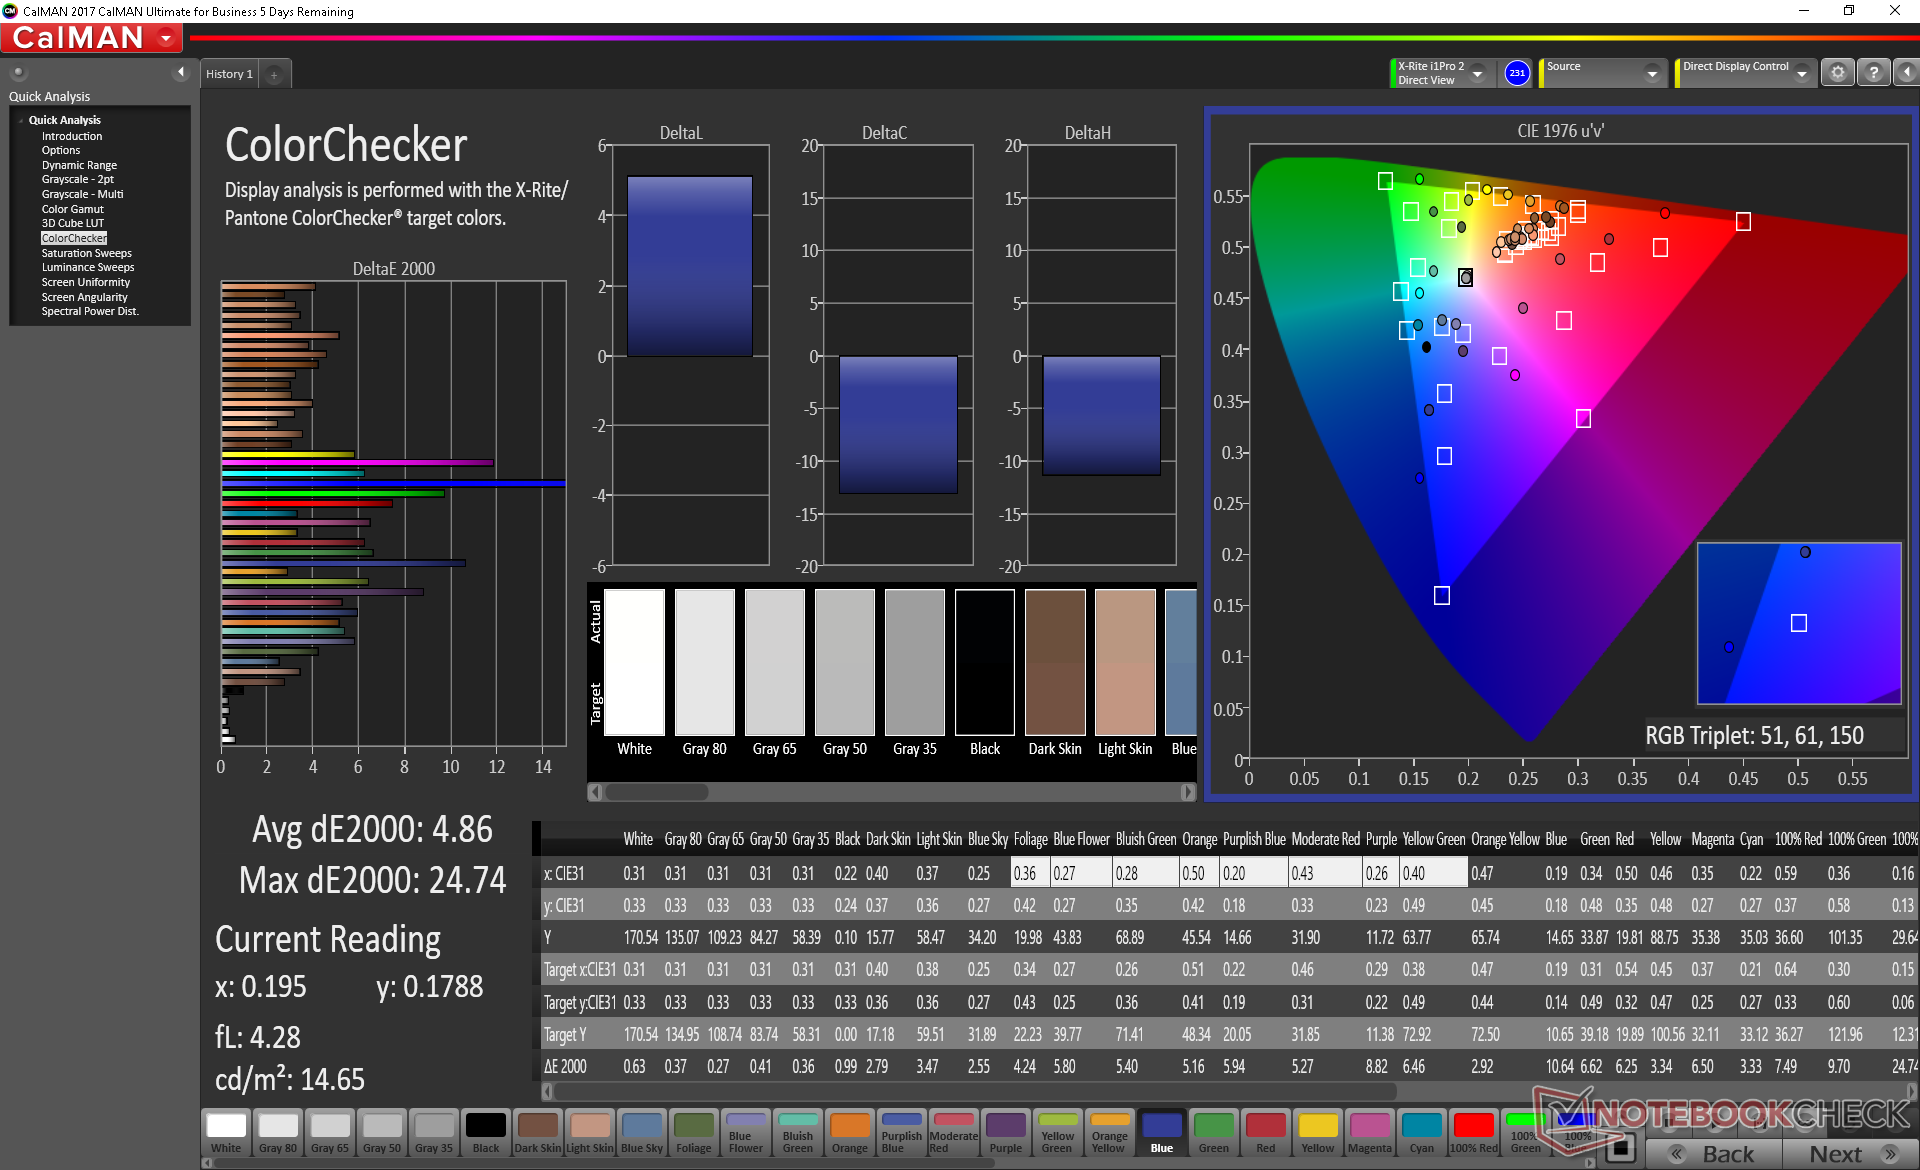
ΔE ColorChecker Calman: 6.99 | ∀{0.5-29.43 Ø4.73}
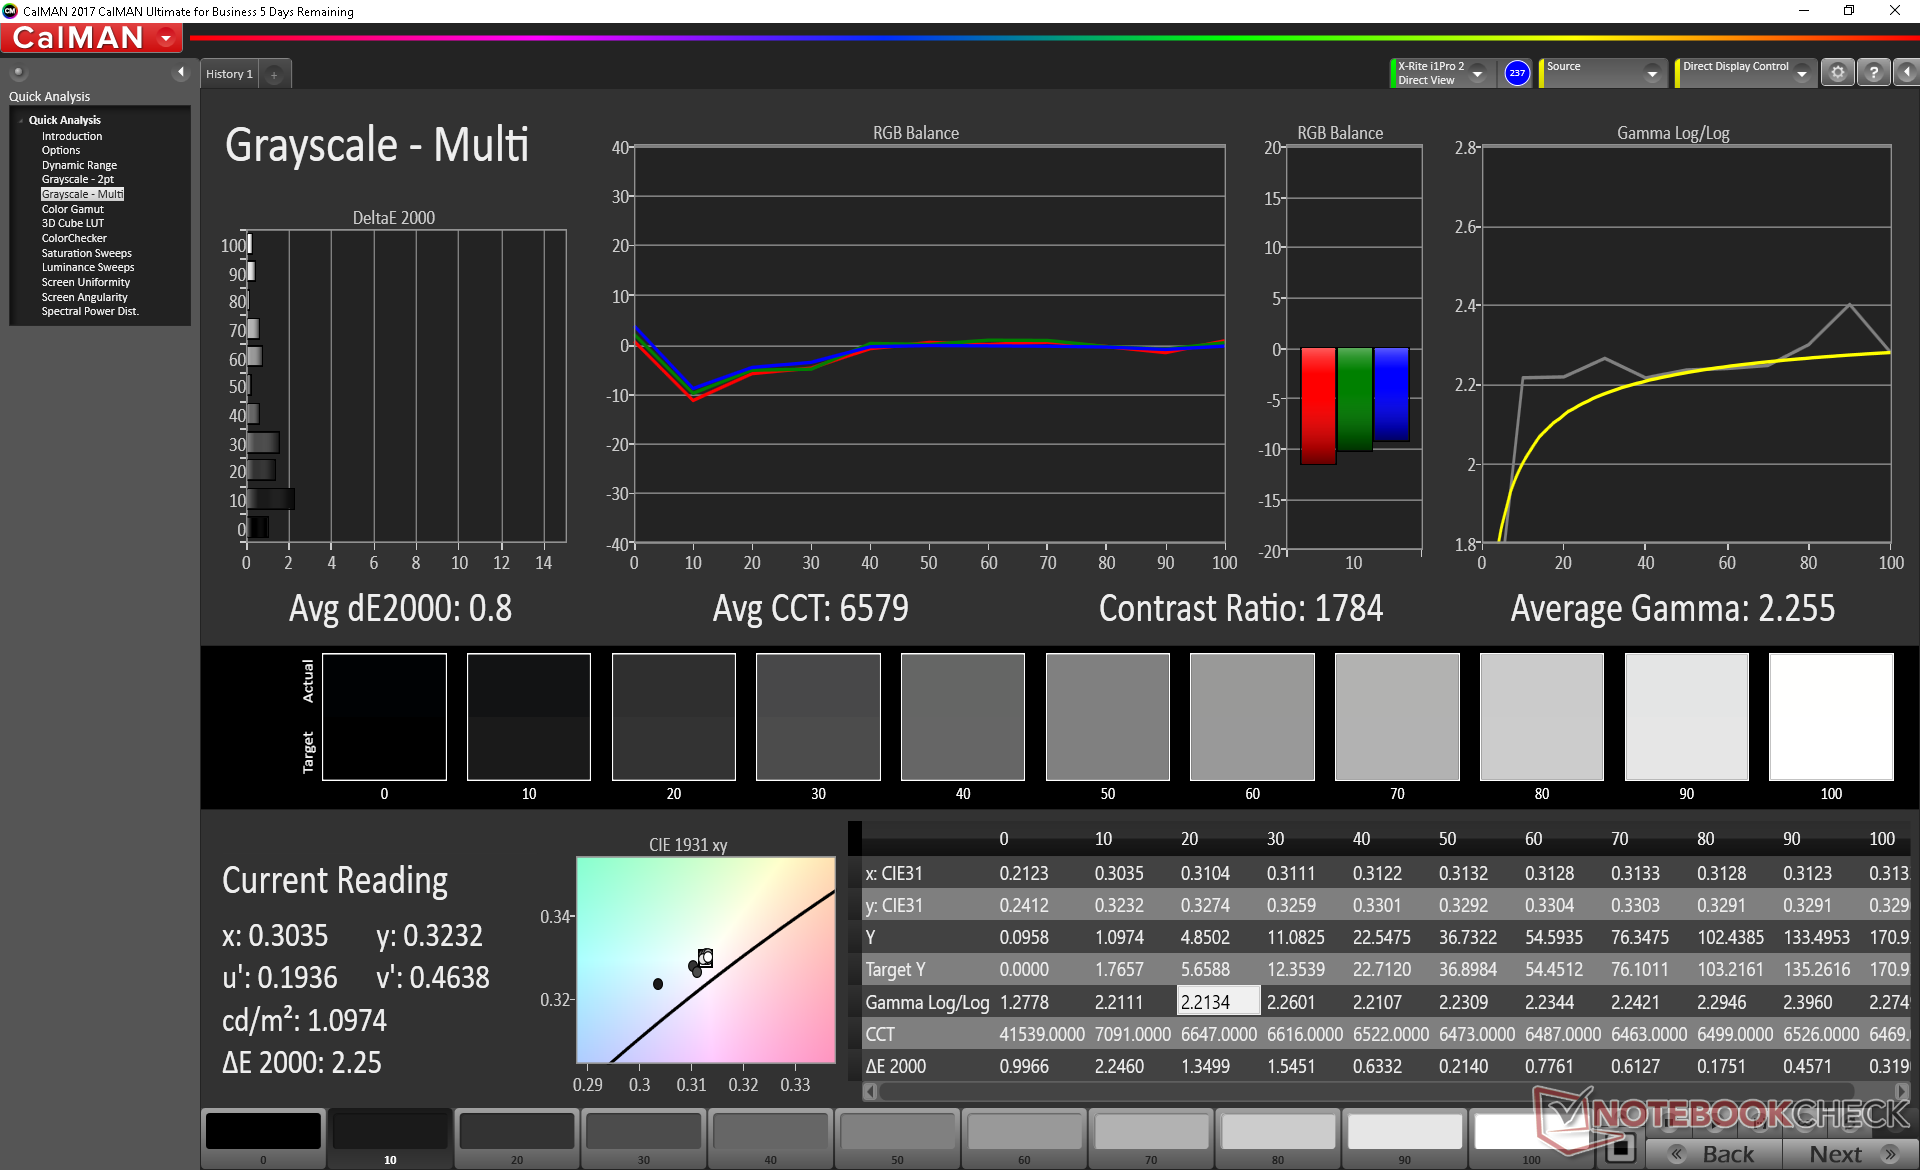
calibrated: 4.86
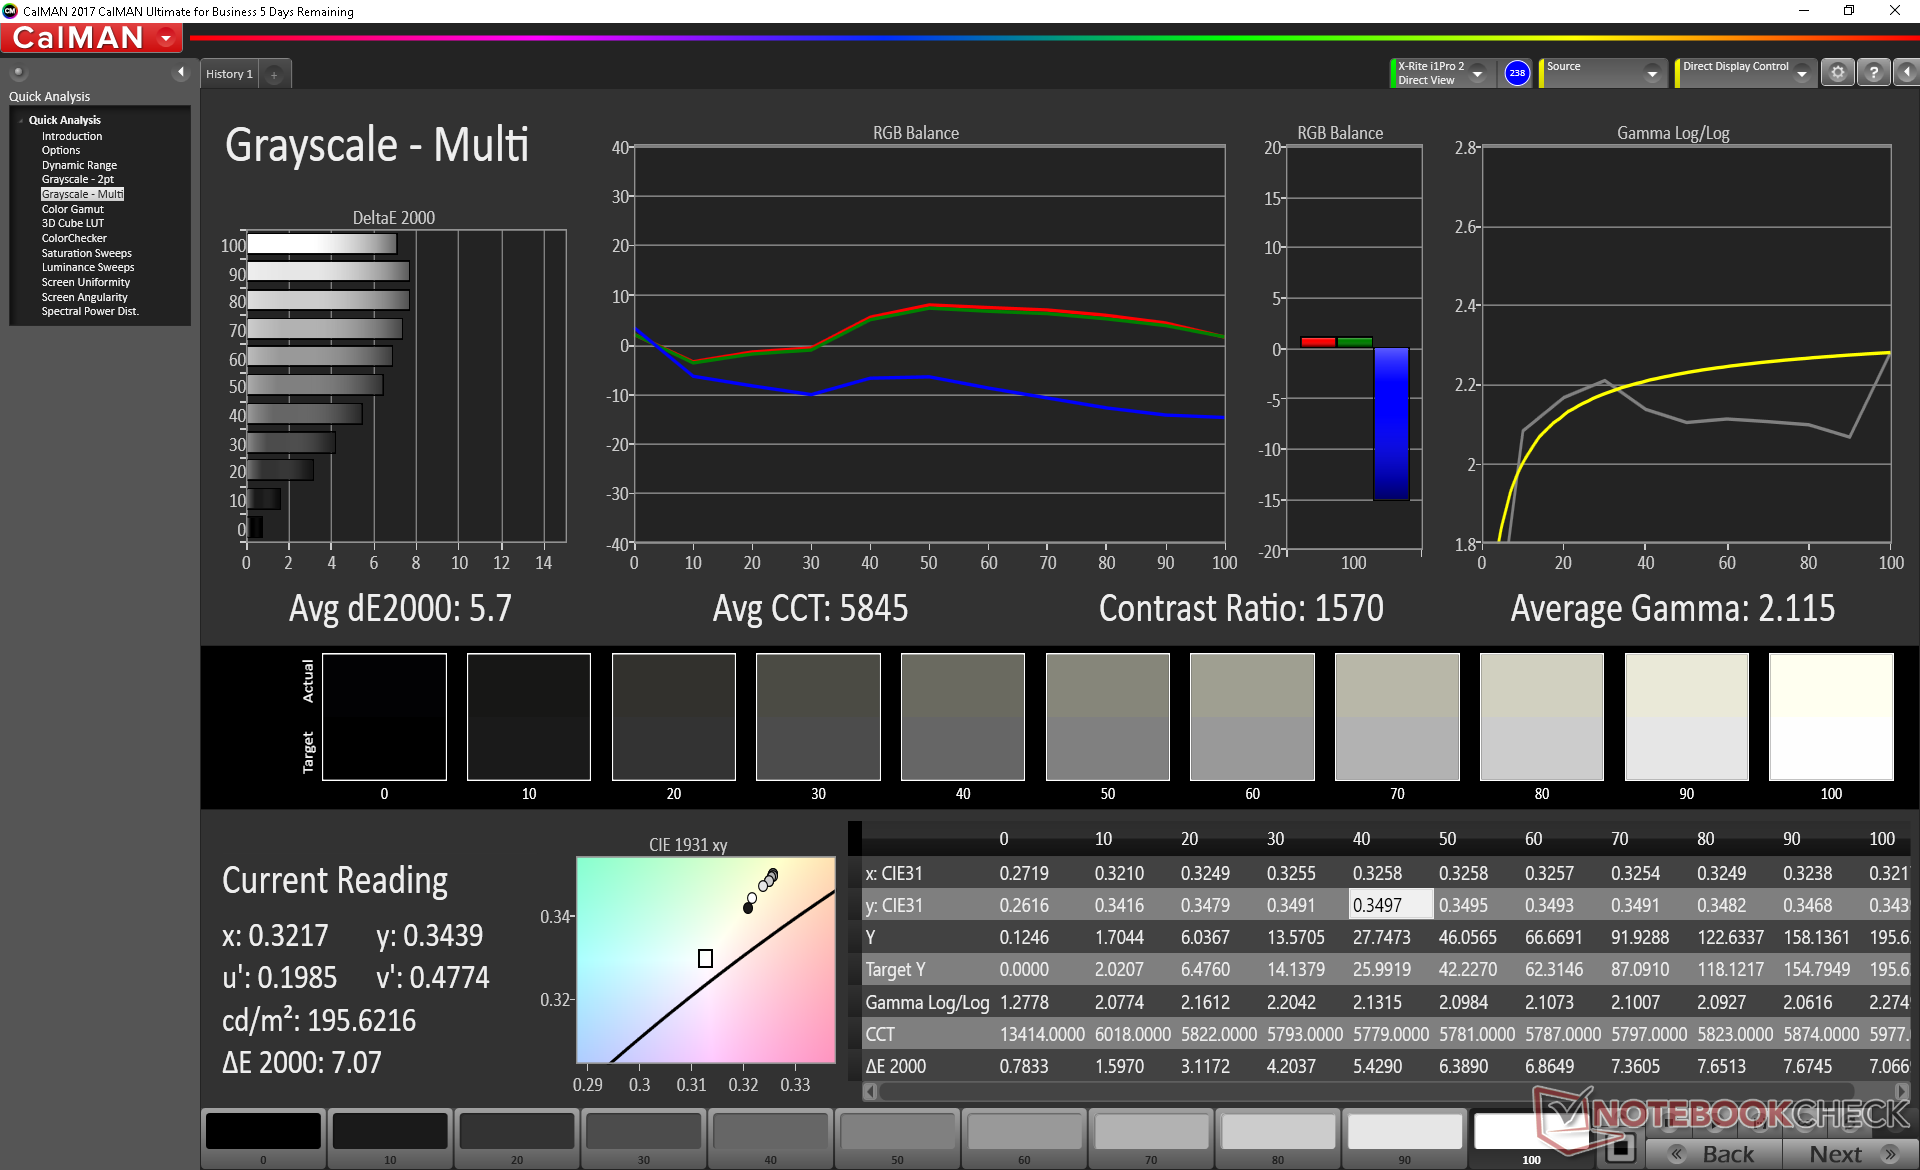
ΔE Greyscale Calman: 5.7 | ∀{0.09-98 Ø4.97}
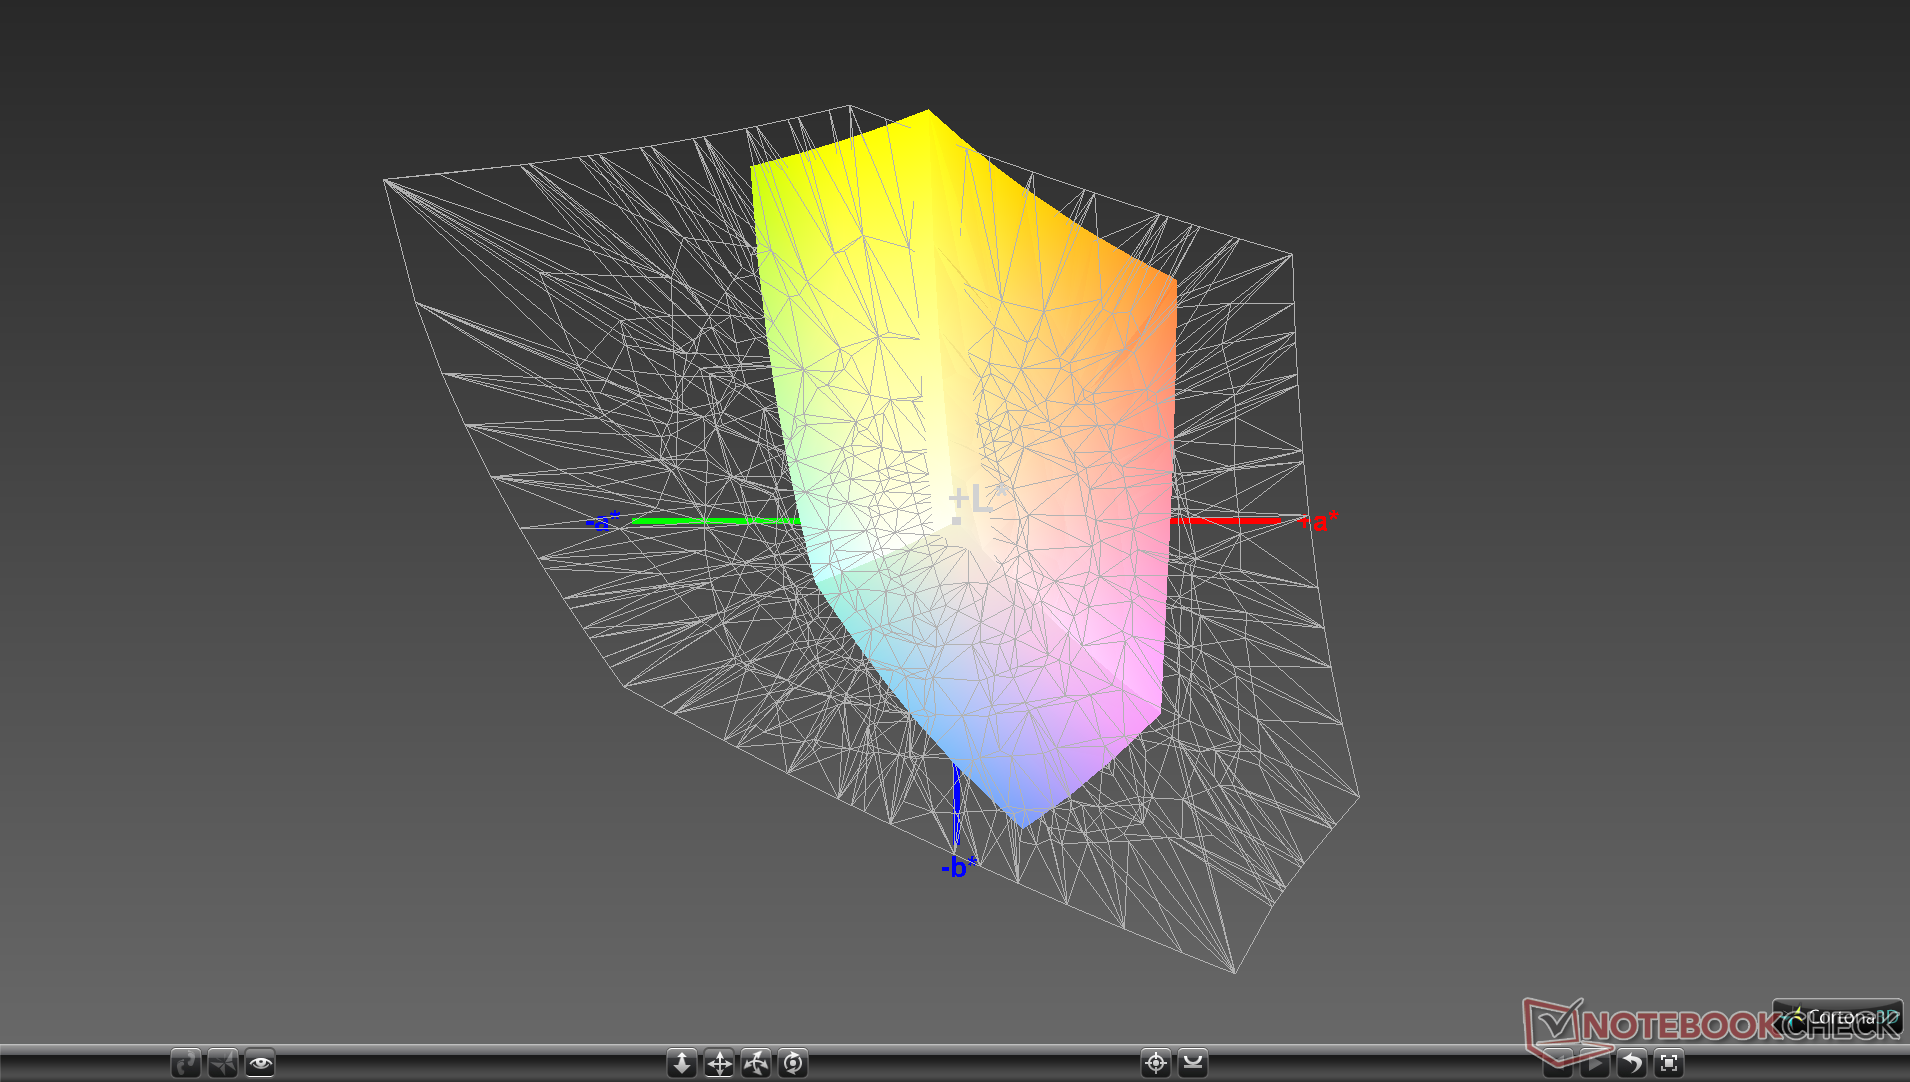
58.1% sRGB (Calman 2D)
37.6% AdobeRGB 1998 (Argyll 1.6.3 3D)
41.91% AdobeRGB 1998 (Argyll 3D)
58.6% sRGB (Argyll 3D)
40.57% Display P3 (Argyll 3D)
Gamma: 2.12
CCT: 5845 K
| Dell Inspiron 14 5000 5482 2-in-1 NV14N4H, IPS, 14", 1920x1080 | Lenovo Yoga 530-14IKB-81EK00CWGE InfoVision M140NWF5 R2, IPS, 14", 1920x1080 | Asus VivoBook Flip 14 TP412UA-DB51T AUO B140HAN04.0, IPS, 14", 1920x1080 | Dell XPS 13 9365-4537 2-in-1 Sharp LQ133Z1, IPS, 13.3", 3200x1800 | Lenovo Yoga C930-13IKB B139HAN03_0, IPS, 13.9", 1920x1080 | Huawei Matebook X Pro i5 Tianma XM, IPS, 13.9", 3000x2000 | |
|---|---|---|---|---|---|---|
| Display | 3% | -2% | 59% | 59% | 62% | |
| Display P3 Coverage (%) | 40.57 | 41.52 2% | 39.42 -3% | 64.4 59% | 64.3 58% | 65.9 62% |
| sRGB Coverage (%) | 58.6 | 62.1 6% | 59.2 1% | 92.9 59% | 94.6 61% | 95.2 62% |
| AdobeRGB 1998 Coverage (%) | 41.91 | 42.92 2% | 40.73 -3% | 66.1 58% | 66.2 58% | 67.6 61% |
| Response Times | 17% | 21% | 17% | 24% | 27% | |
| Response Time Grey 50% / Grey 80% * (ms) | 58.8 ? | 45 ? 23% | 38 ? 35% | 48 ? 18% | 40.8 ? 31% | 40.4 ? 31% |
| Response Time Black / White * (ms) | 33.2 ? | 30 ? 10% | 30.8 ? 7% | 28 ? 16% | 27.6 ? 17% | 25.6 ? 23% |
| PWM Frequency (Hz) | 198.4 ? | 520 ? | ||||
| Screen | 36% | 13% | 47% | 14% | 43% | |
| Brightness middle (cd/m²) | 193.6 | 240 24% | 255.5 32% | 348 80% | 316 63% | 442.7 129% |
| Brightness (cd/m²) | 181 | 234 29% | 242 34% | 306 69% | 291 61% | 428 136% |
| Brightness Distribution (%) | 78 | 93 19% | 87 12% | 78 0% | 83 6% | 84 8% |
| Black Level * (cd/m²) | 0.17 | 0.11 35% | 0.29 -71% | 0.2 -18% | 0.36 -112% | 0.31 -82% |
| Contrast (:1) | 1139 | 2182 92% | 881 -23% | 1740 53% | 878 -23% | 1428 25% |
| Colorchecker dE 2000 * | 6.99 | 4.98 29% | 4.18 40% | 2.79 60% | 5.9 16% | 2.24 68% |
| Colorchecker dE 2000 max. * | 23.58 | 10.75 54% | 19.15 19% | 5.53 77% | 12.9 45% | 7.19 70% |
| Colorchecker dE 2000 calibrated * | 4.86 | 3.33 31% | 3.8 22% | 1.3 73% | 1.11 77% | |
| Greyscale dE 2000 * | 5.7 | 3.51 38% | 2.2 61% | 3.47 39% | 8.6 -51% | 9.7 -70% |
| Gamma | 2.12 104% | 2.2 100% | 2.05 107% | 2.54 87% | 2.1 105% | 1.42 155% |
| CCT | 5845 111% | 6606 98% | 6599 98% | 6564 99% | 6854 95% | 6227 104% |
| Color Space (Percent of AdobeRGB 1998) (%) | 37.6 | 40 6% | 37.5 0% | 60 60% | 60.7 61% | 61.6 64% |
| Color Space (Percent of sRGB) (%) | 62 | 59.1 | 93 | 94.5 | 95 | |
| Total Average (Program / Settings) | 19% /
27% | 11% /
11% | 41% /
45% | 32% /
24% | 44% /
44% |
* ... smaller is better
Color space is limited to only 38 percent and 58 percent of the AdobeRGB and sRGB standards, respectively, to be indicative of a budget panel. Results are comparable to other budget convertibles. Users who may want deeper colors should consider the Yoga C930 or Asus Zenbook Flip 14.
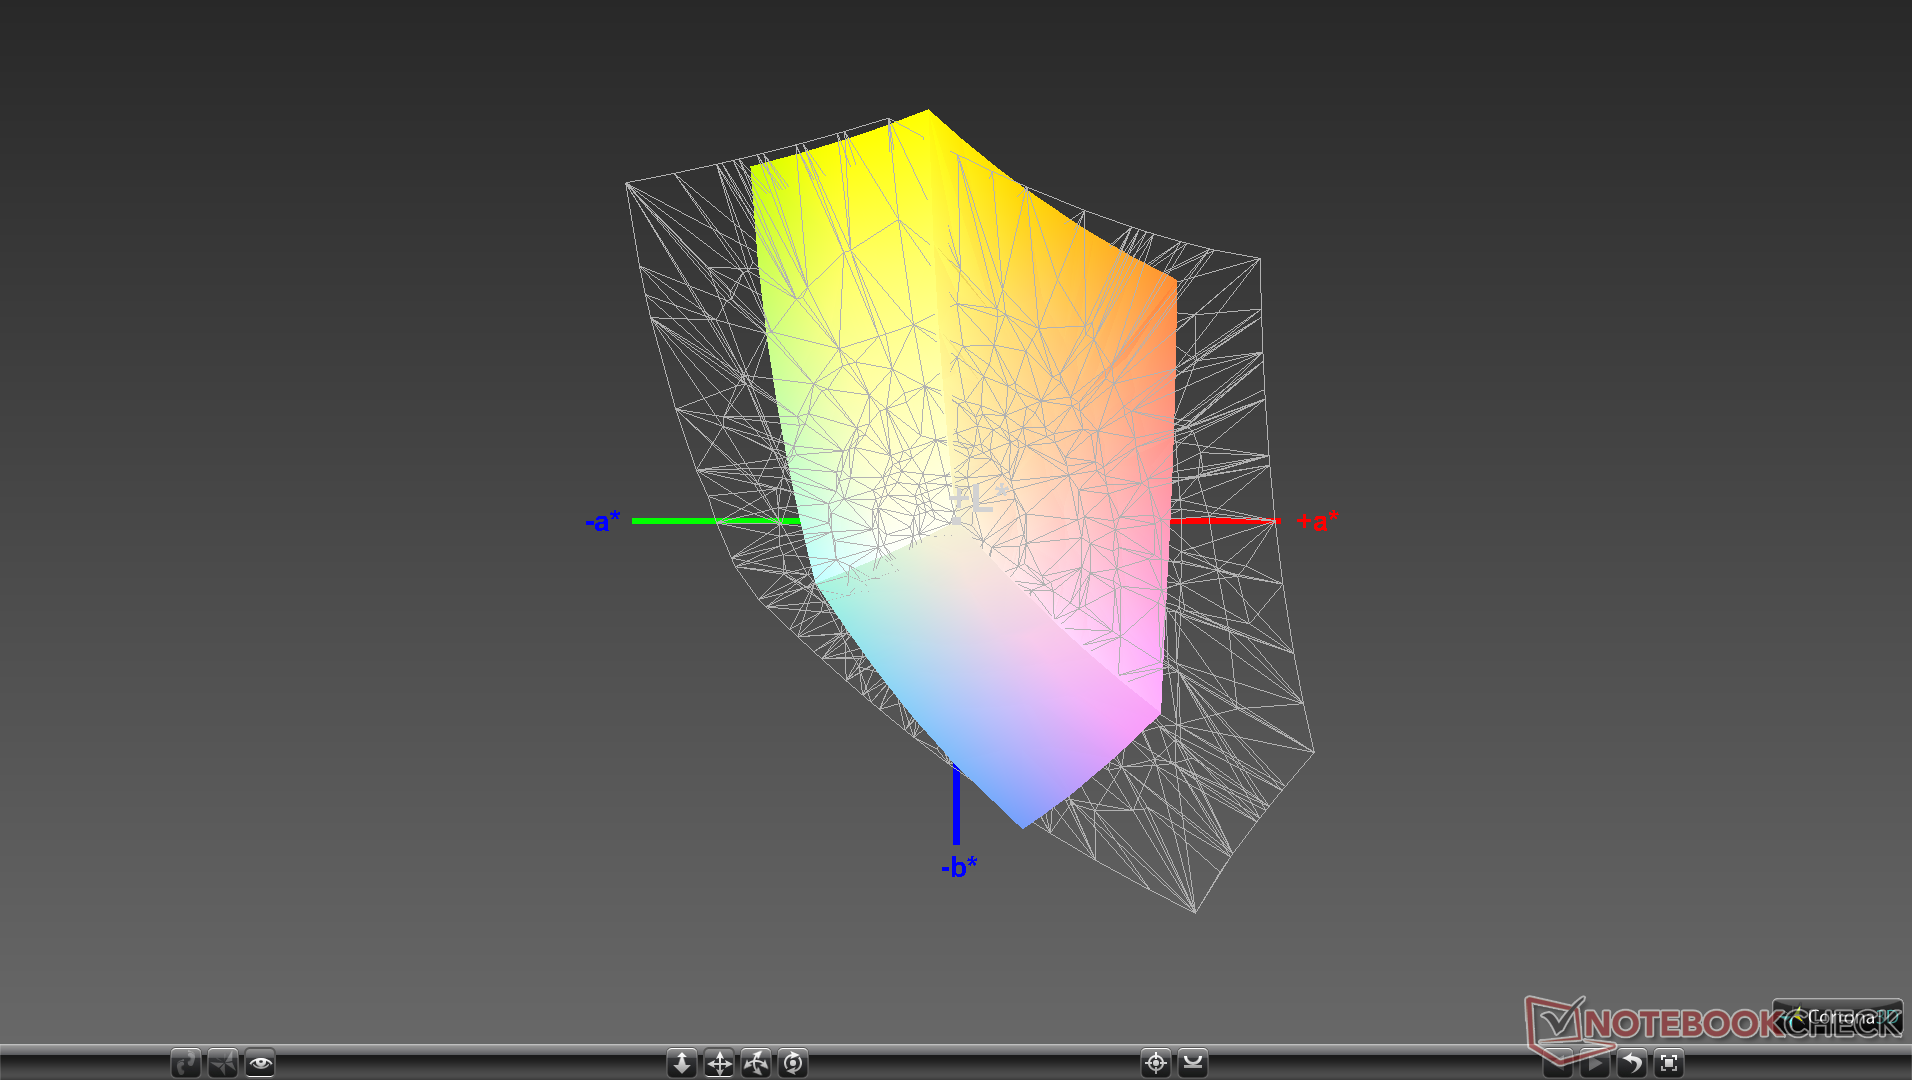
Colors are inaccurate out of the box with grayscale being a bit too warm against the sRGB standard. Calibration improves colors and grayscale by significant margins and so we recommend it if possible. Pure blue, unfortunately, still appears more blue-violet than normal.

Display Response Times
| ↔ Response Time Black to White | ||
|---|---|---|
| 33.2 ms ... rise ↗ and fall ↘ combined | ↗ 20 ms rise | 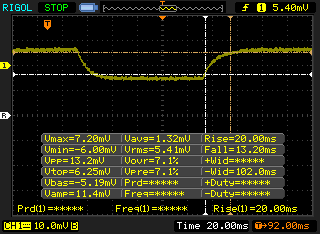 |
| ↘ 13.2 ms fall | ||
| The screen shows slow response rates in our tests and will be unsatisfactory for gamers. In comparison, all tested devices range from 0.1 (minimum) to 240 (maximum) ms. » 90 % of all devices are better. This means that the measured response time is worse than the average of all tested devices (19.9 ms). | ||
| ↔ Response Time 50% Grey to 80% Grey | ||
| 58.8 ms ... rise ↗ and fall ↘ combined | ↗ 25.6 ms rise | 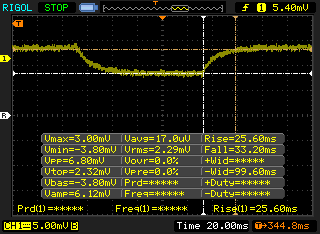 |
| ↘ 33.2 ms fall | ||
| The screen shows slow response rates in our tests and will be unsatisfactory for gamers. In comparison, all tested devices range from 0.165 (minimum) to 636 (maximum) ms. » 95 % of all devices are better. This means that the measured response time is worse than the average of all tested devices (31.1 ms). | ||
Screen Flickering / PWM (Pulse-Width Modulation)
| Screen flickering / PWM detected | 198.4 Hz | ≤ 98 % brightness setting | 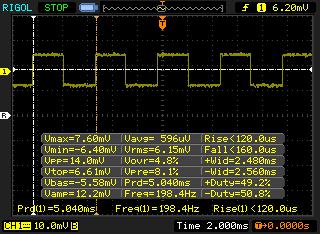 |
The display backlight flickers at 198.4 Hz (worst case, e.g., utilizing PWM) Flickering detected at a brightness setting of 98 % and below. There should be no flickering or PWM above this brightness setting. The frequency of 198.4 Hz is relatively low, so sensitive users will likely notice flickering and experience eyestrain at the stated brightness setting and below. In comparison: 52 % of all tested devices do not use PWM to dim the display. If PWM was detected, an average of 7794 (minimum: 5 - maximum: 343500) Hz was measured. | |||
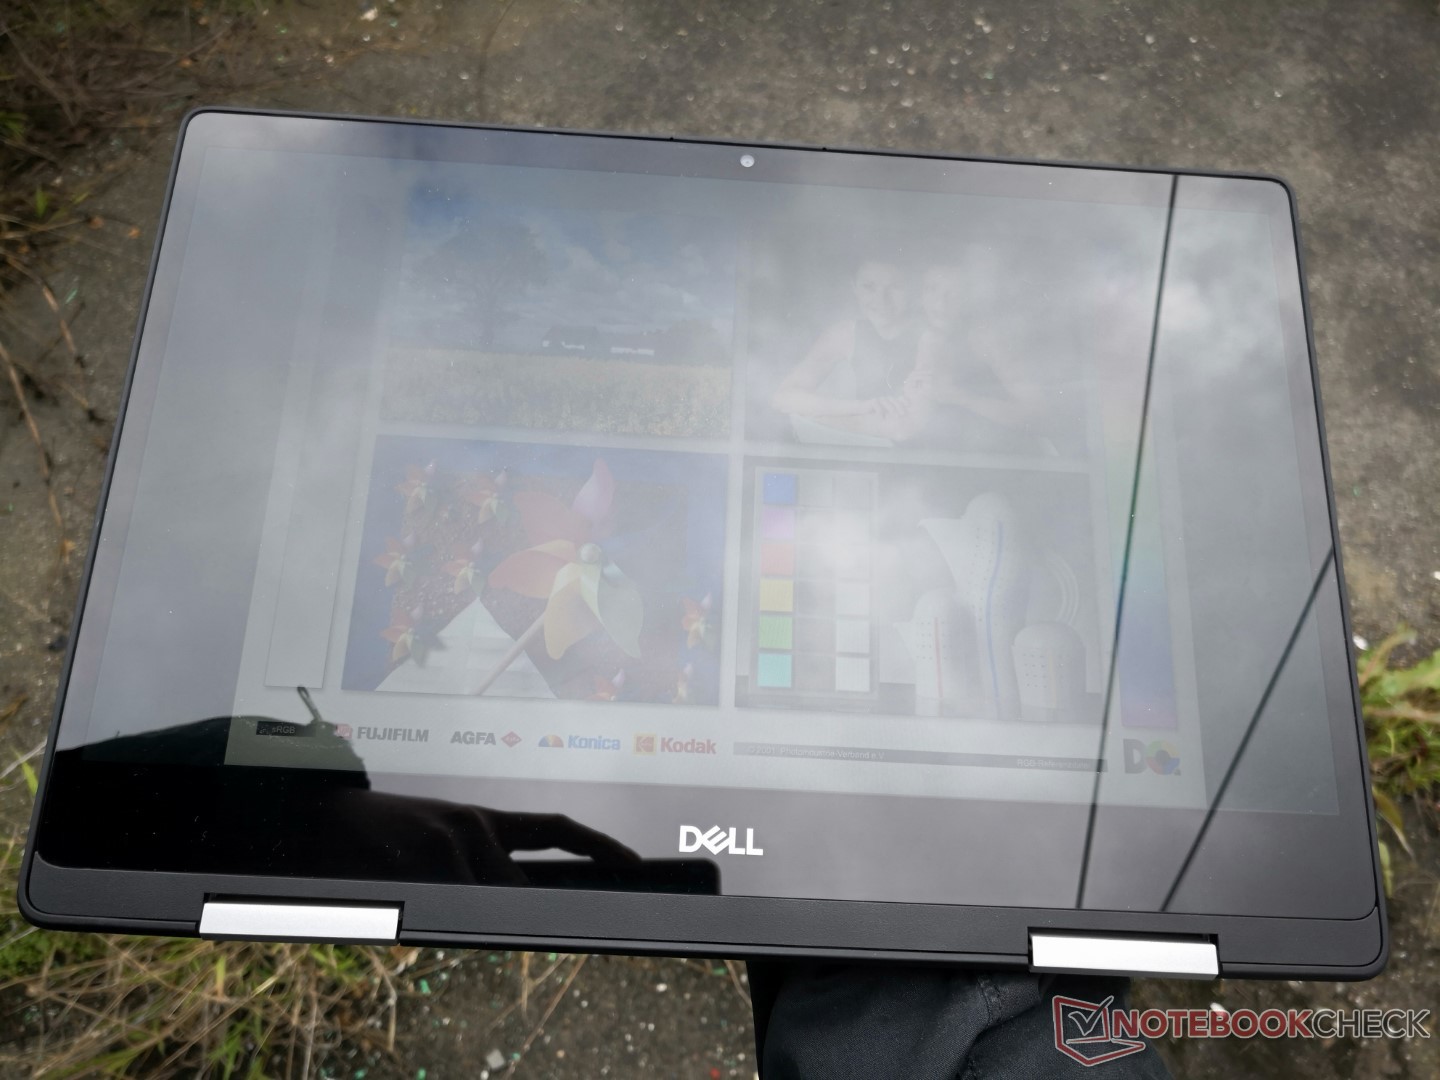
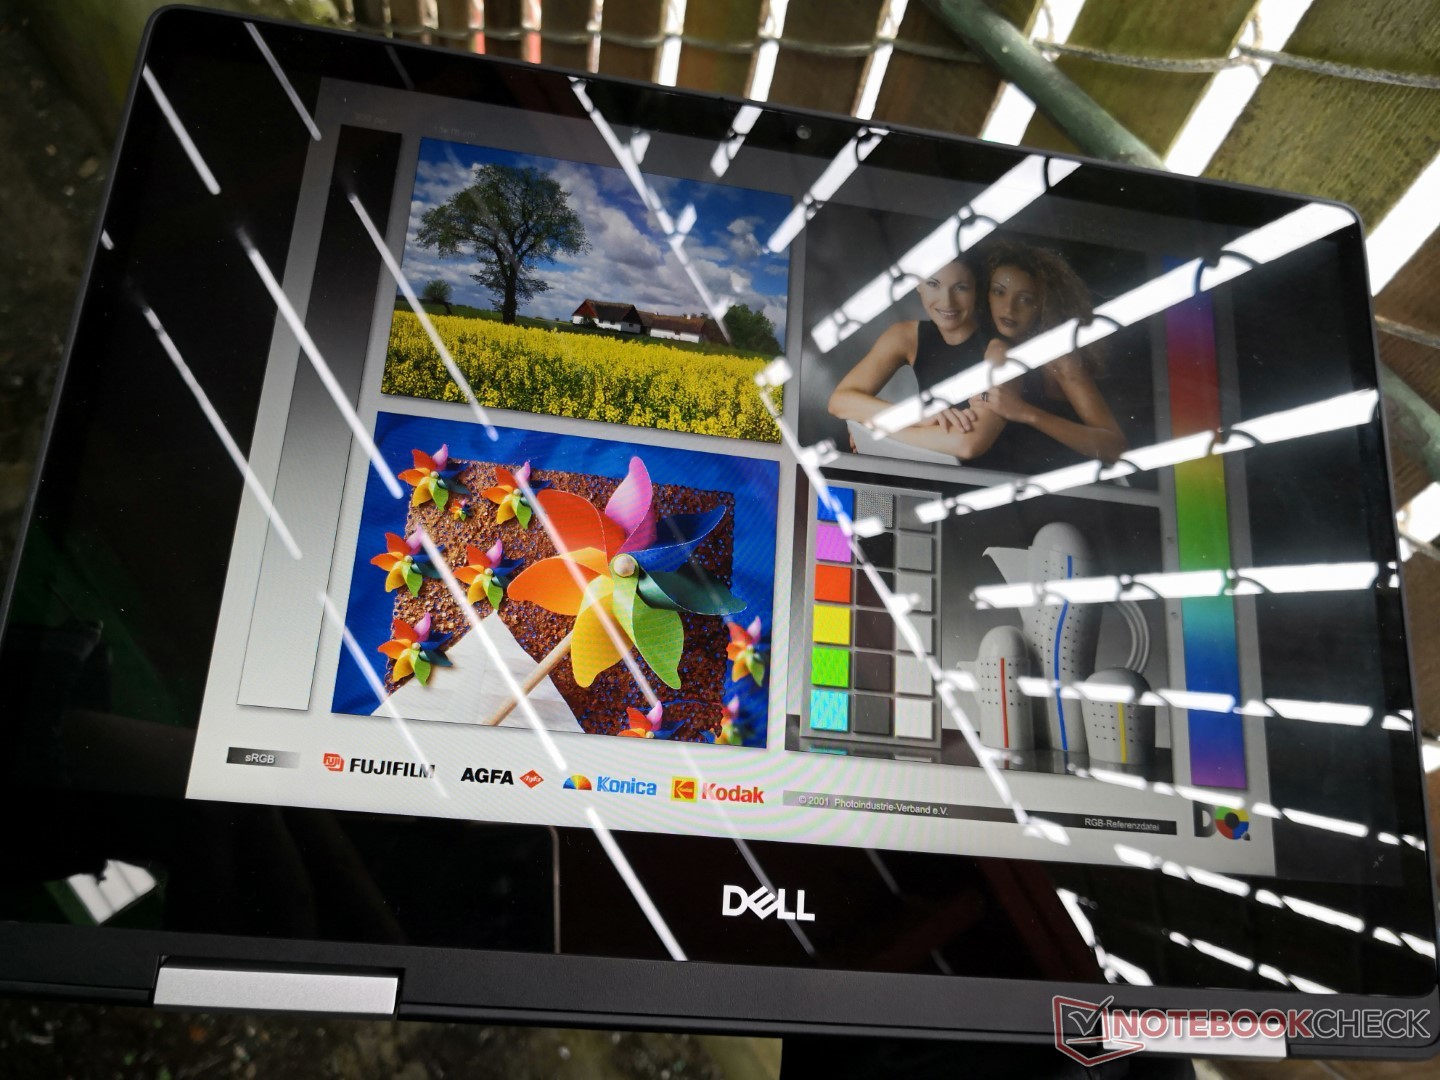
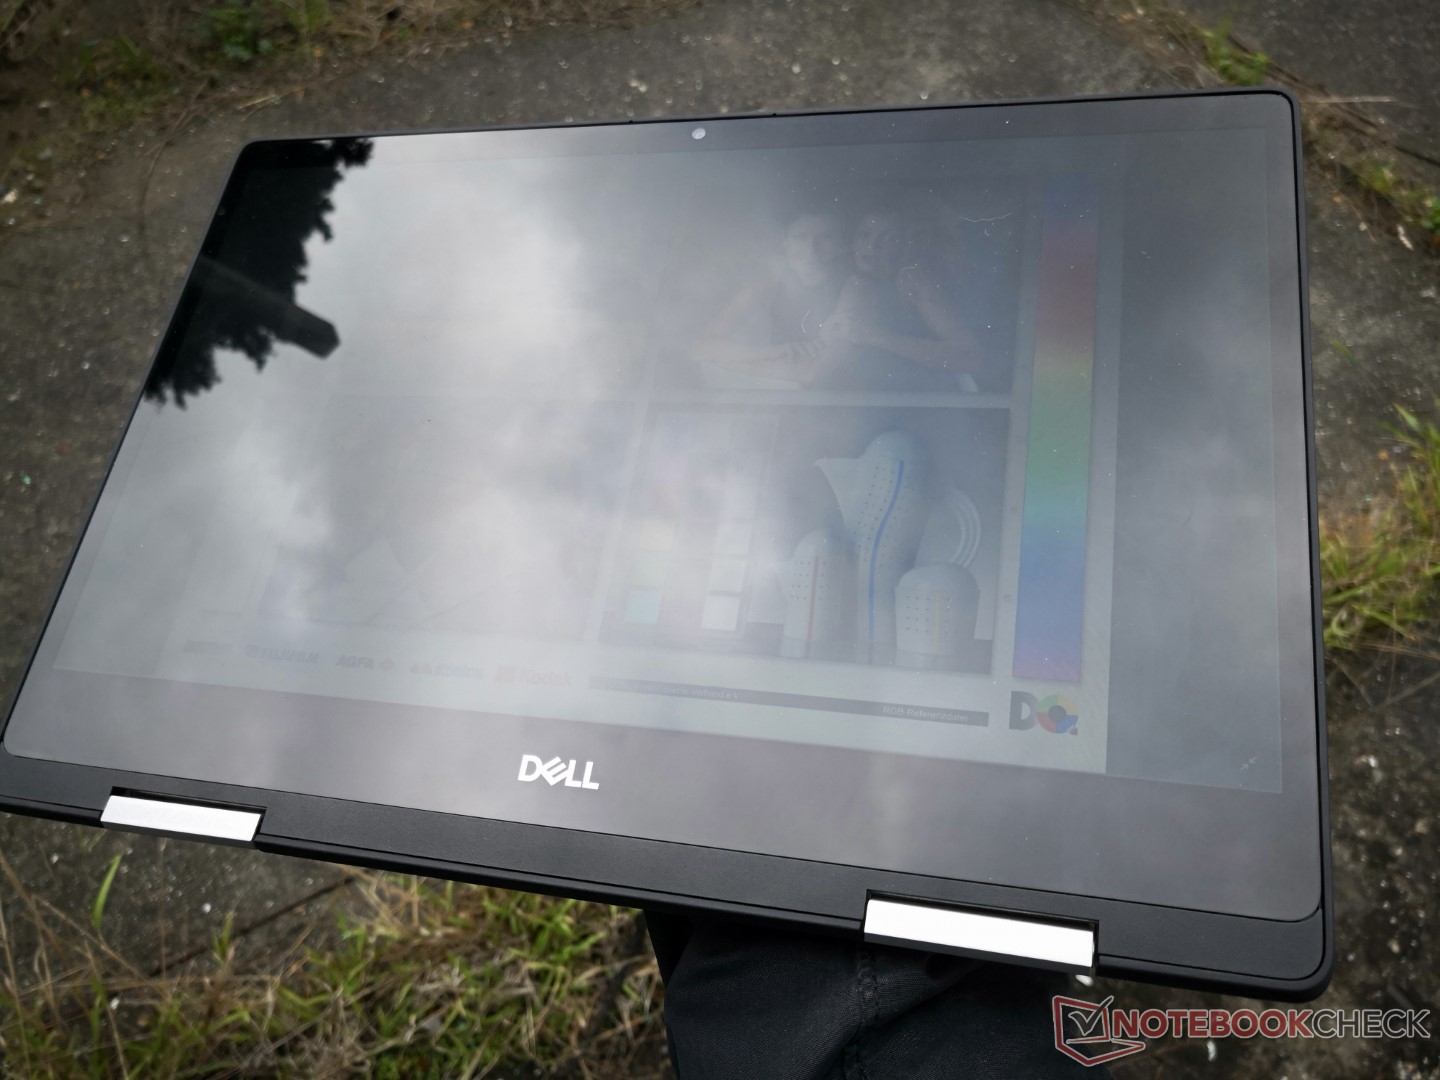
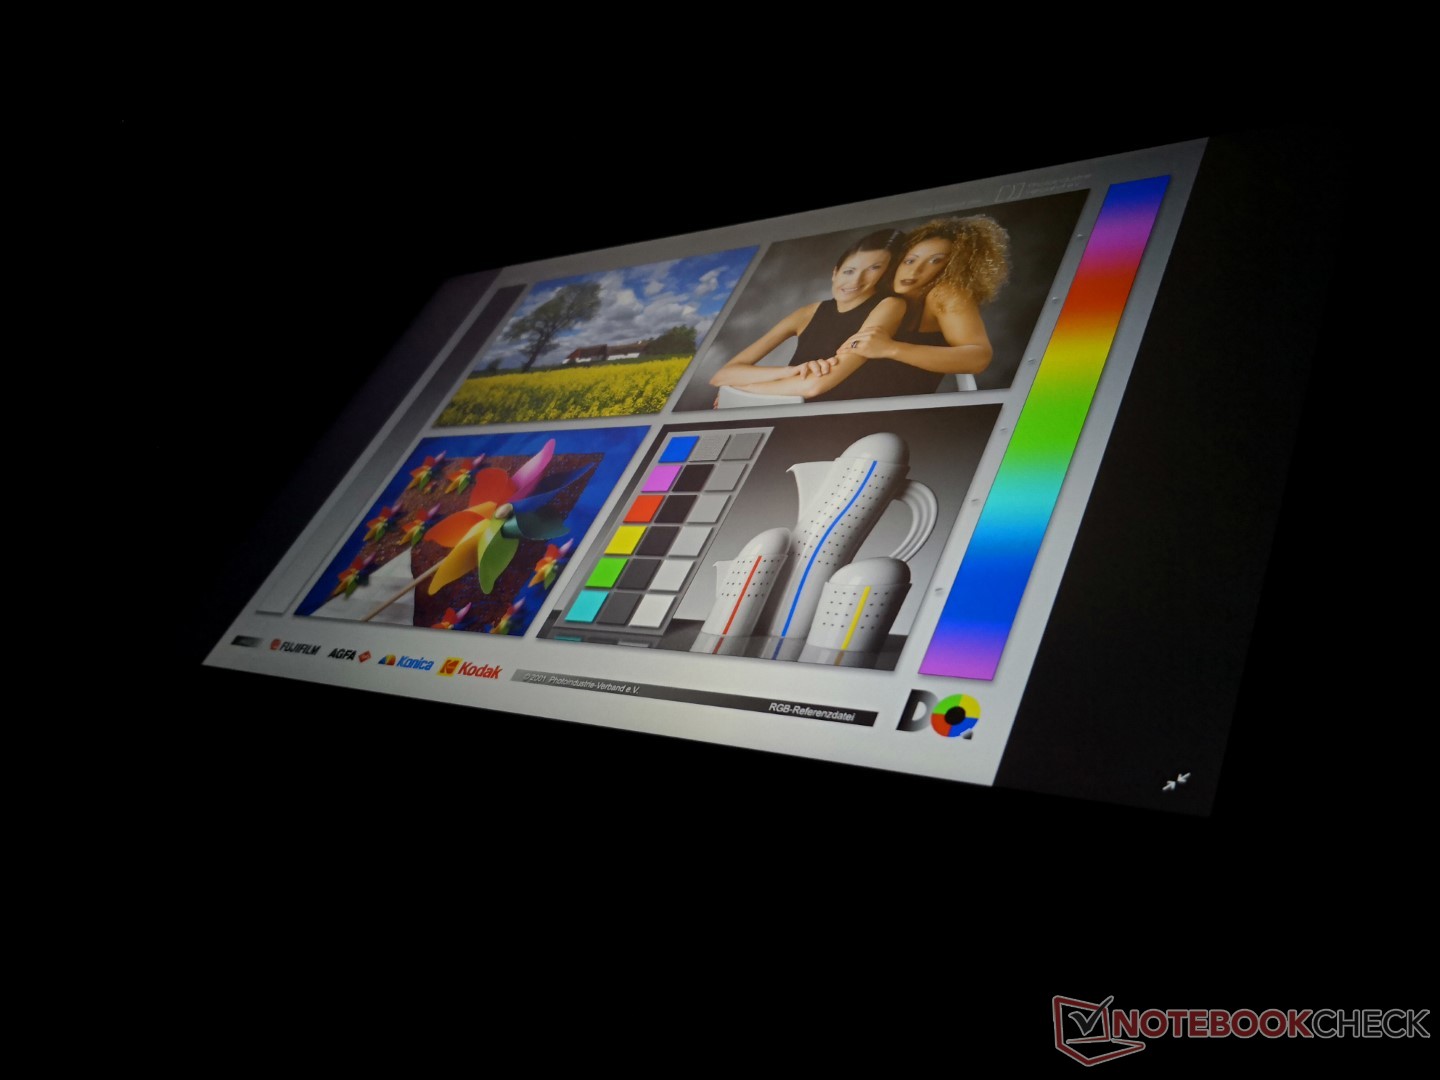
Outdoor visibility is poor because of the glossy display and below average backlight brightness. Glare becomes inevitable even if under shade. Viewing angles are thankfully wide for no color shifting when adjusting the lid angle or when in tablet mode..
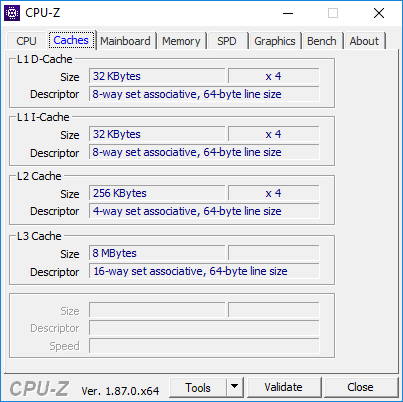
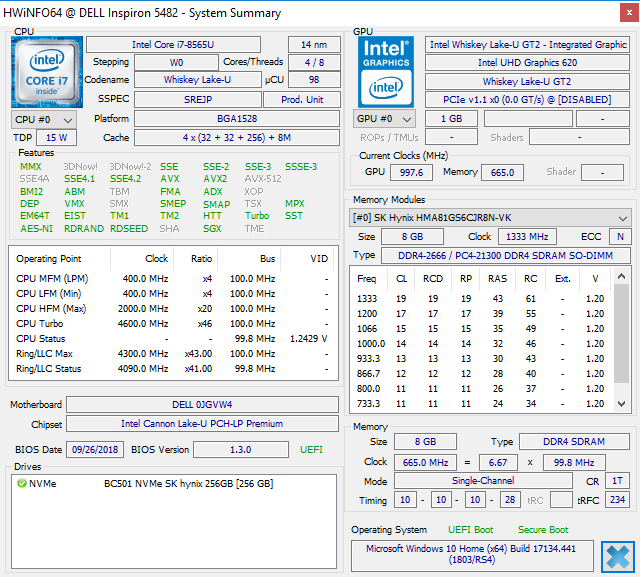
Performance
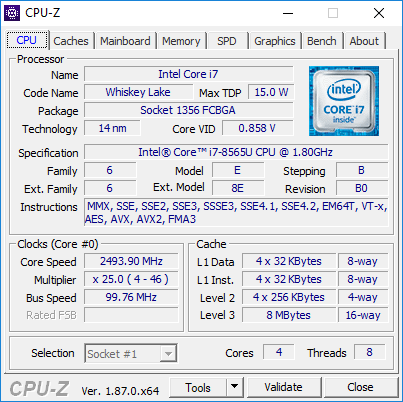
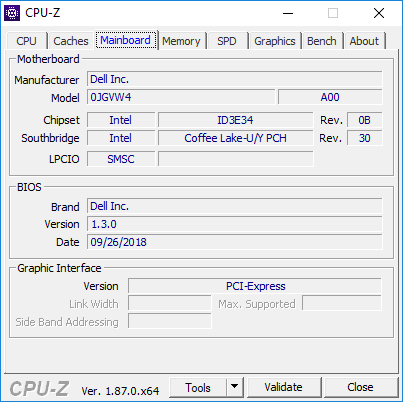
The new Inspiron system utilizes the latest Intel Whiskey Lake-U CPU to succeed the Kaby Lake-R series. The Core i7-8565U on our unit can also be found on pricier Ultrabooks like the Asus Zenbook UX433. There are currently no dedicated GPU options even though there appears to be space for one on the motherboard.
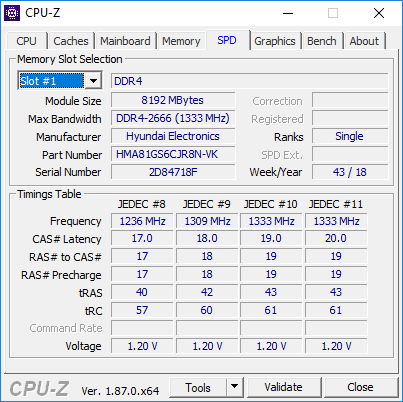
Up to 16 GB of DDR4 2666 MHz RAM is supported with optional Intel Optane.
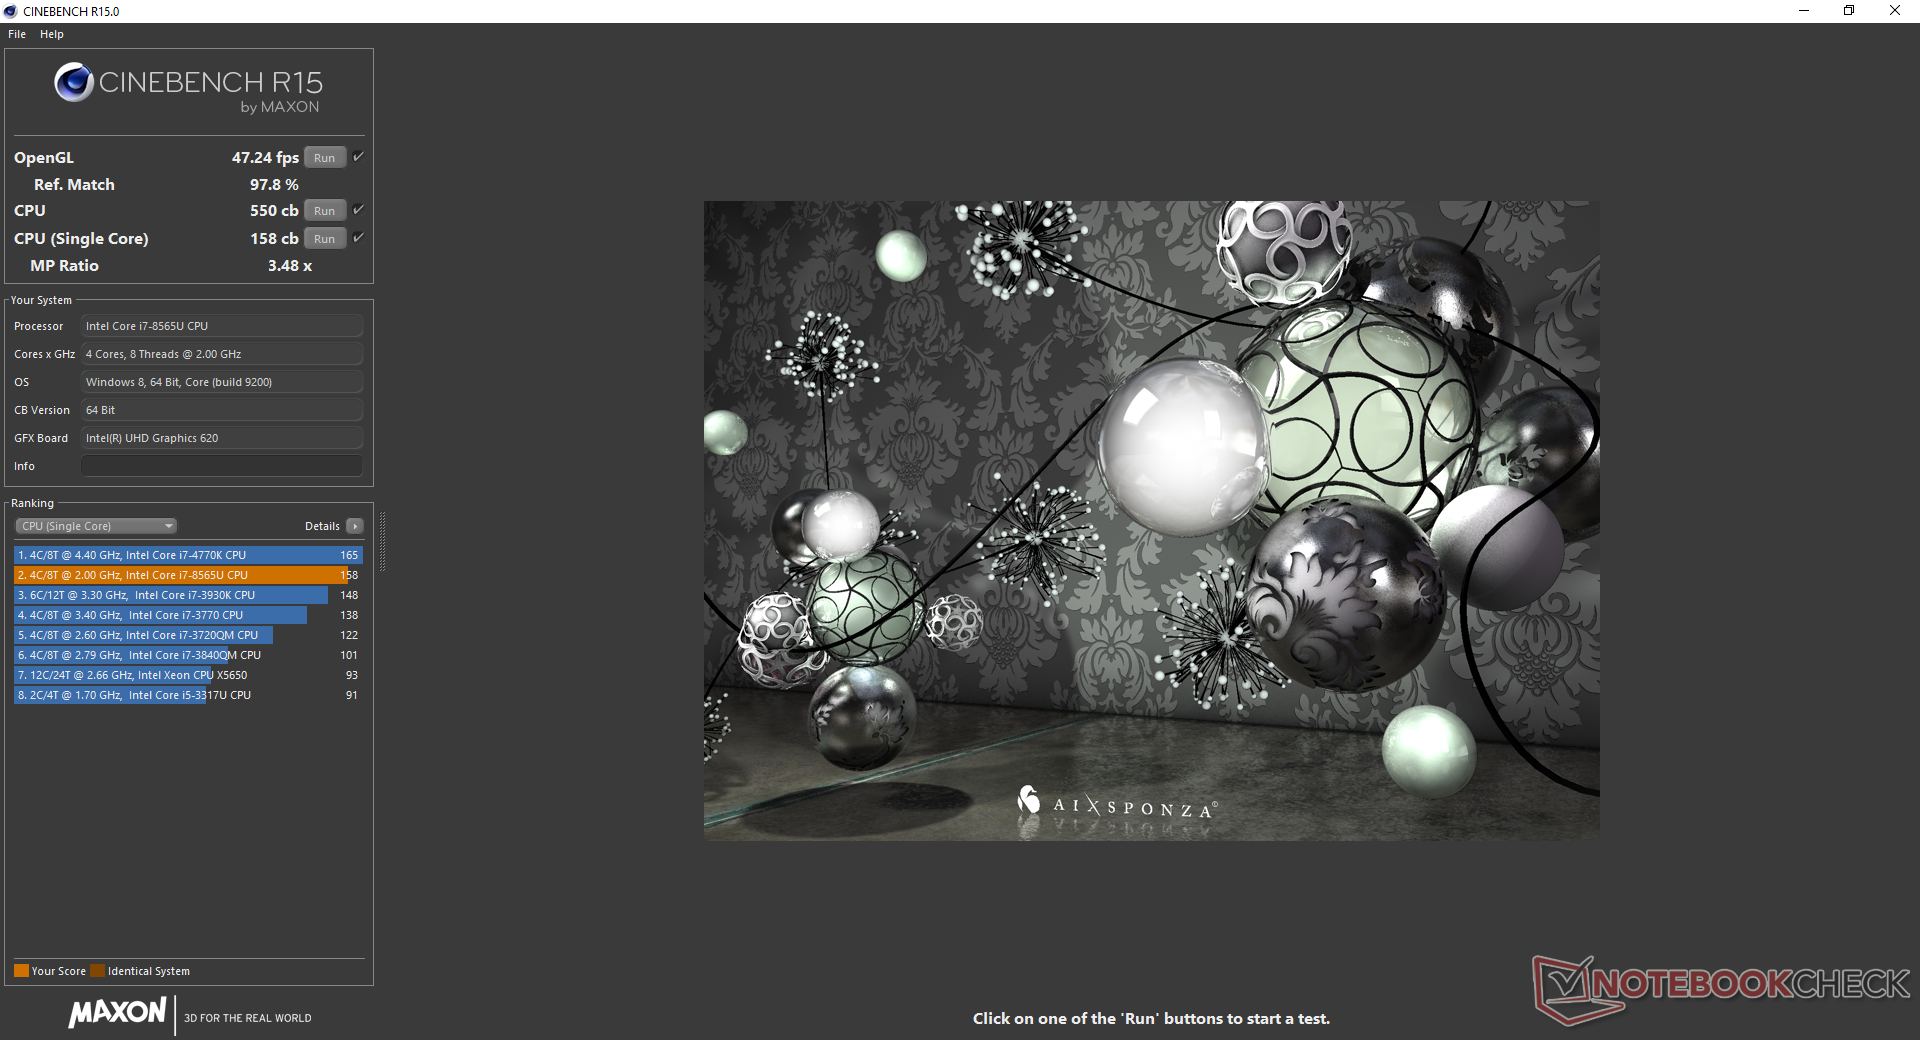
Processor
Processor performance is a bit slower than the average i7-8565U in our database since throttling kicks in quickly. As shown by our CineBench R15 Multi-Thread loop test graph below, its initial score of 594 points drops to 555 points after the first loop. Nonetheless, the performance drop is very small and essentially unnoticeable by the end-user during regular day-to-day loads. Overall performance is in between than of the last generation Core i5-8250U and i7-8550U.
See our dedicated page on the Core i7-8565U for more technical information and benchmark comparisons.
| wPrime 2.10 - 1024m | |
| HP Spectre Folio 13t-ak000 | |
| Dell XPS 13 9360-4764 | |
| Microsoft Surface Laptop i7 | |
| Dell XPS 13 9370 i7 UHD | |
| Average Intel Core i7-8565U (263 - 420, n=7) | |
| Dell Inspiron 15 7000 7577 | |
| Dell Inspiron 14 5000 5482 2-in-1 | |
* ... smaller is better
System Performance
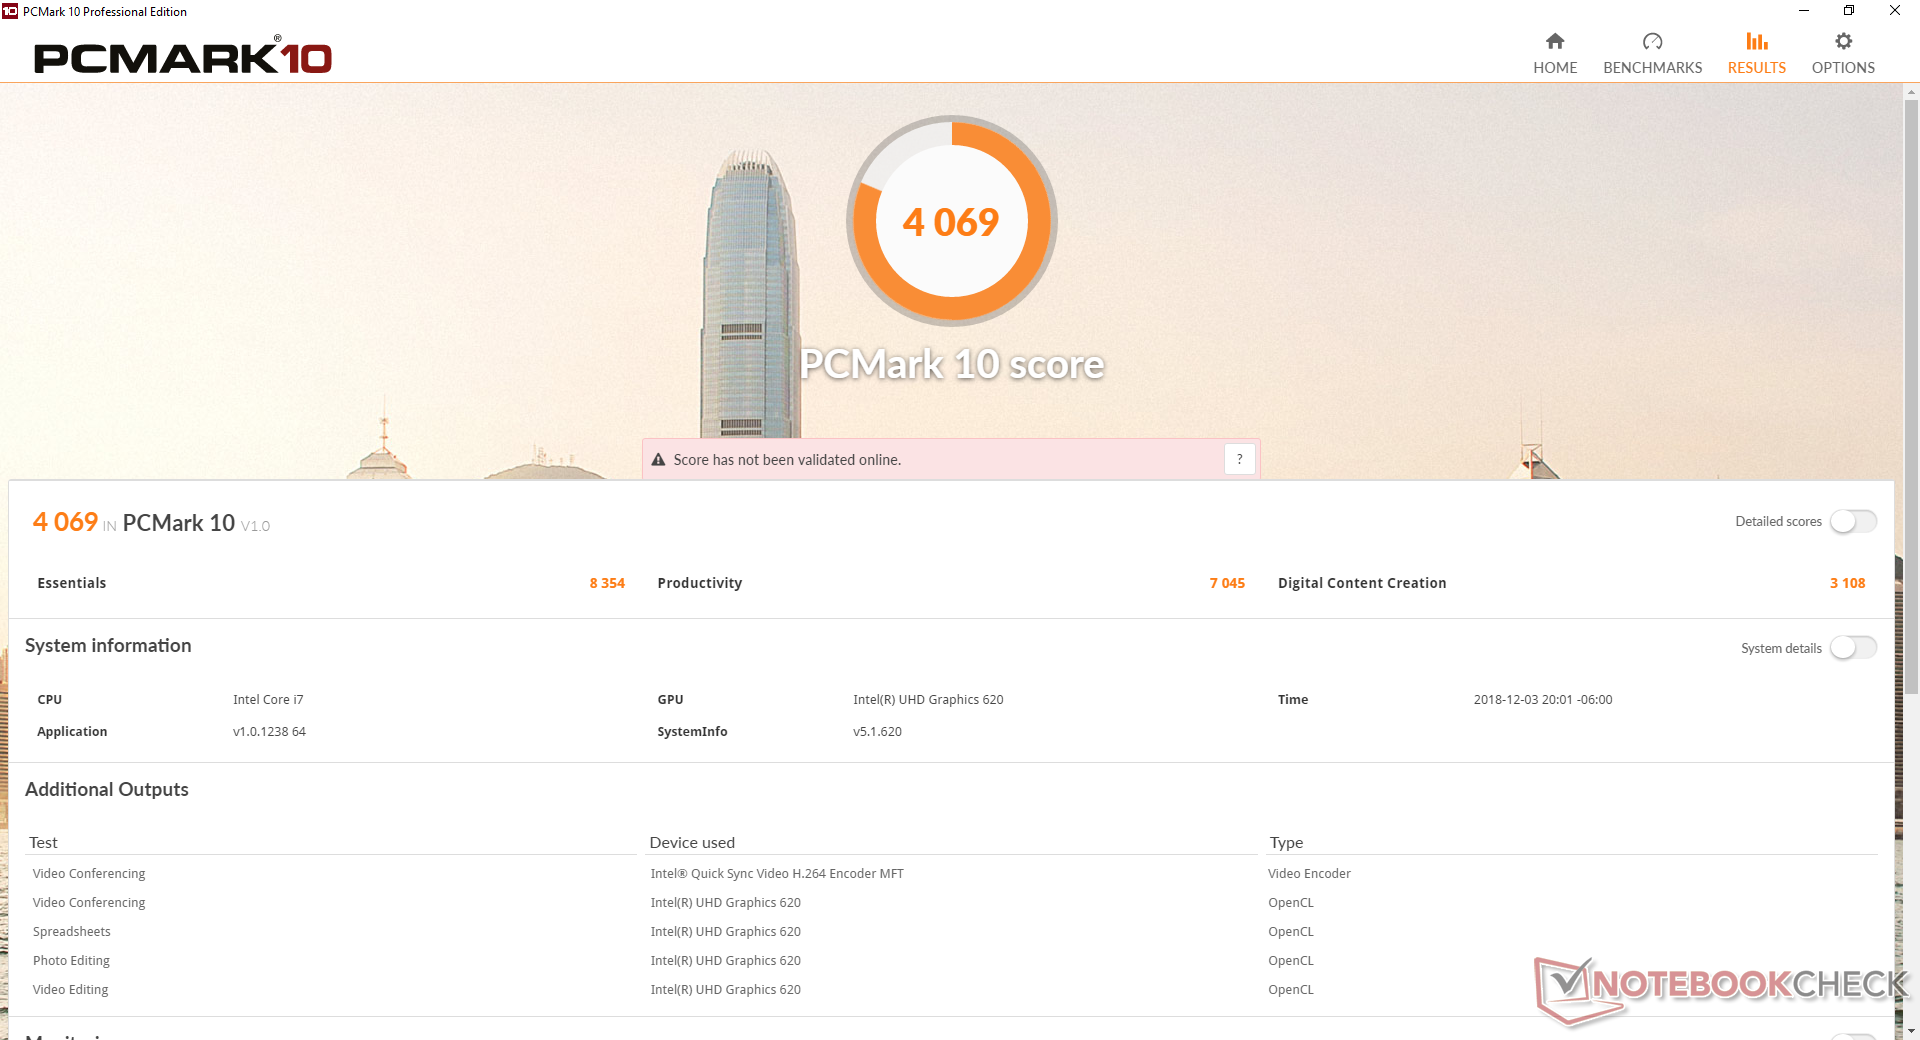
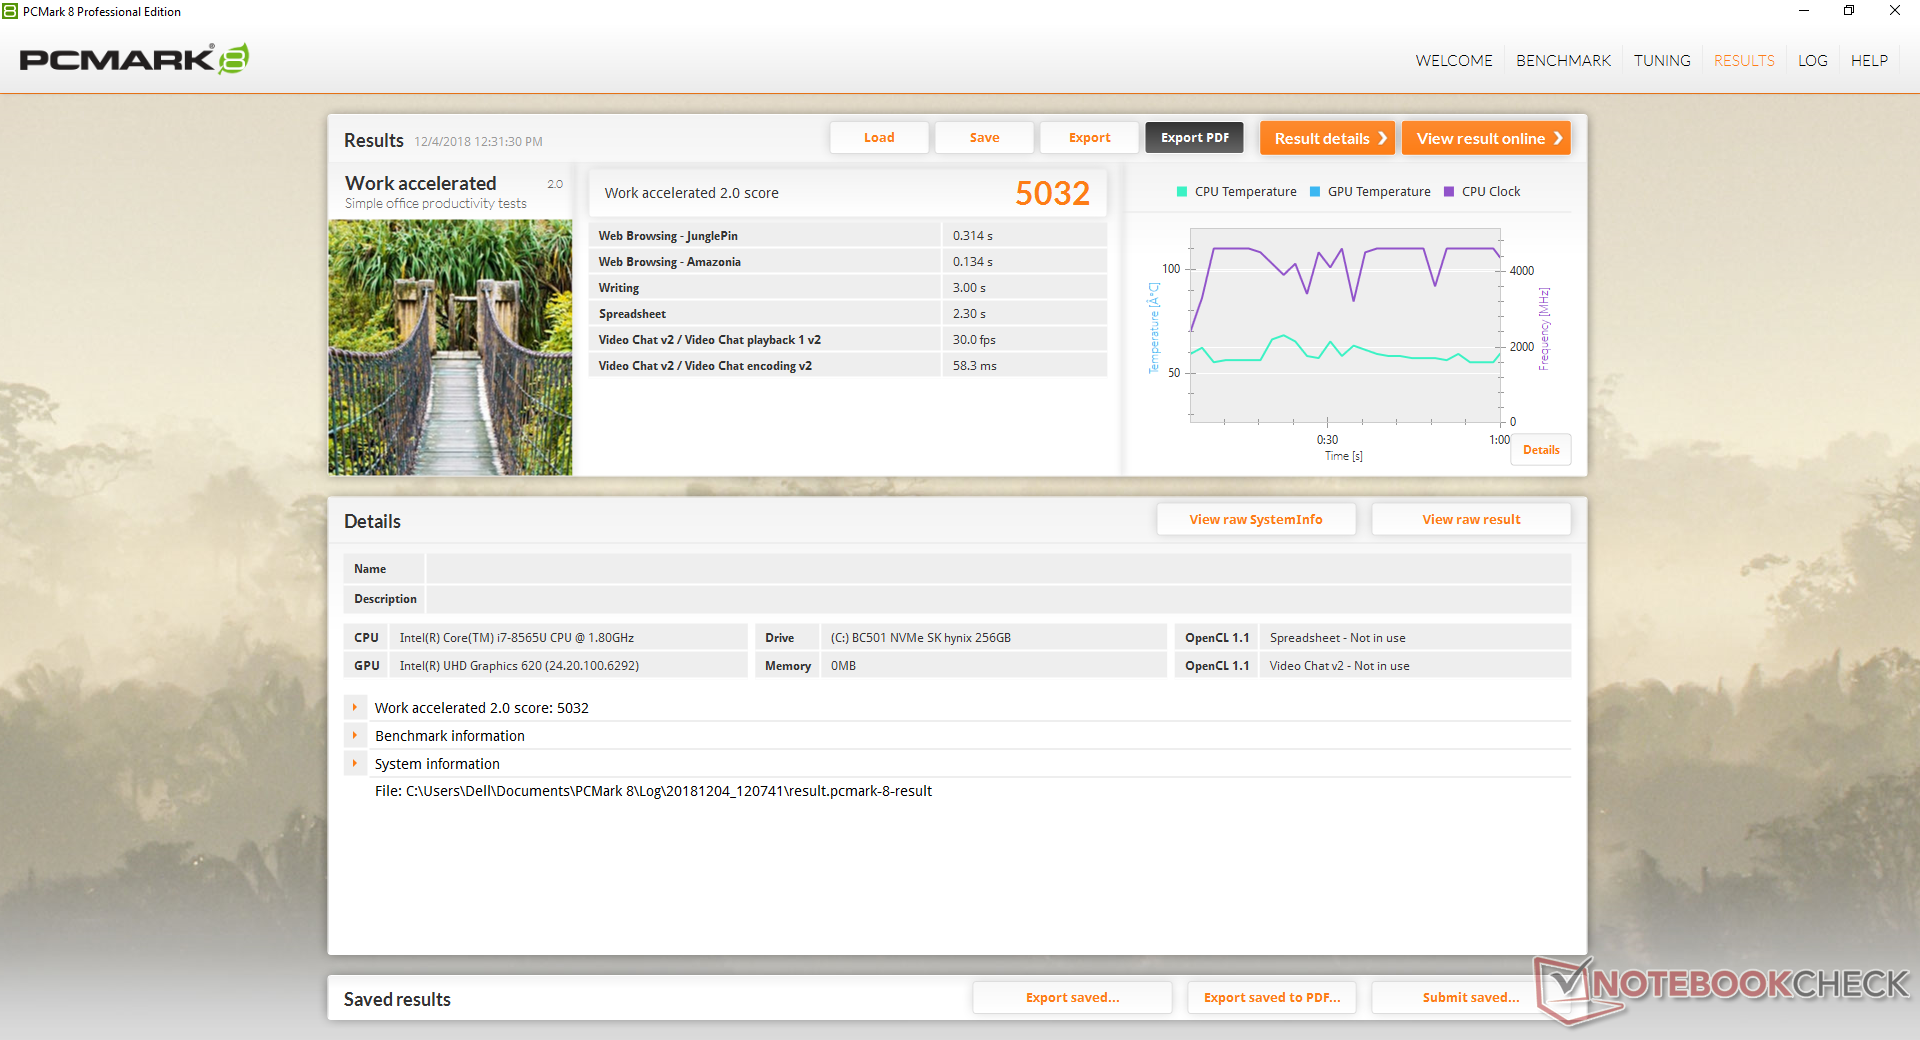
PCMark results are comparable to other convertible laptops if not slightly higher. We experienced no software or hardware issues during our time with the test unit unlike on our recent Core i9 XPS 15 from the same OEM.
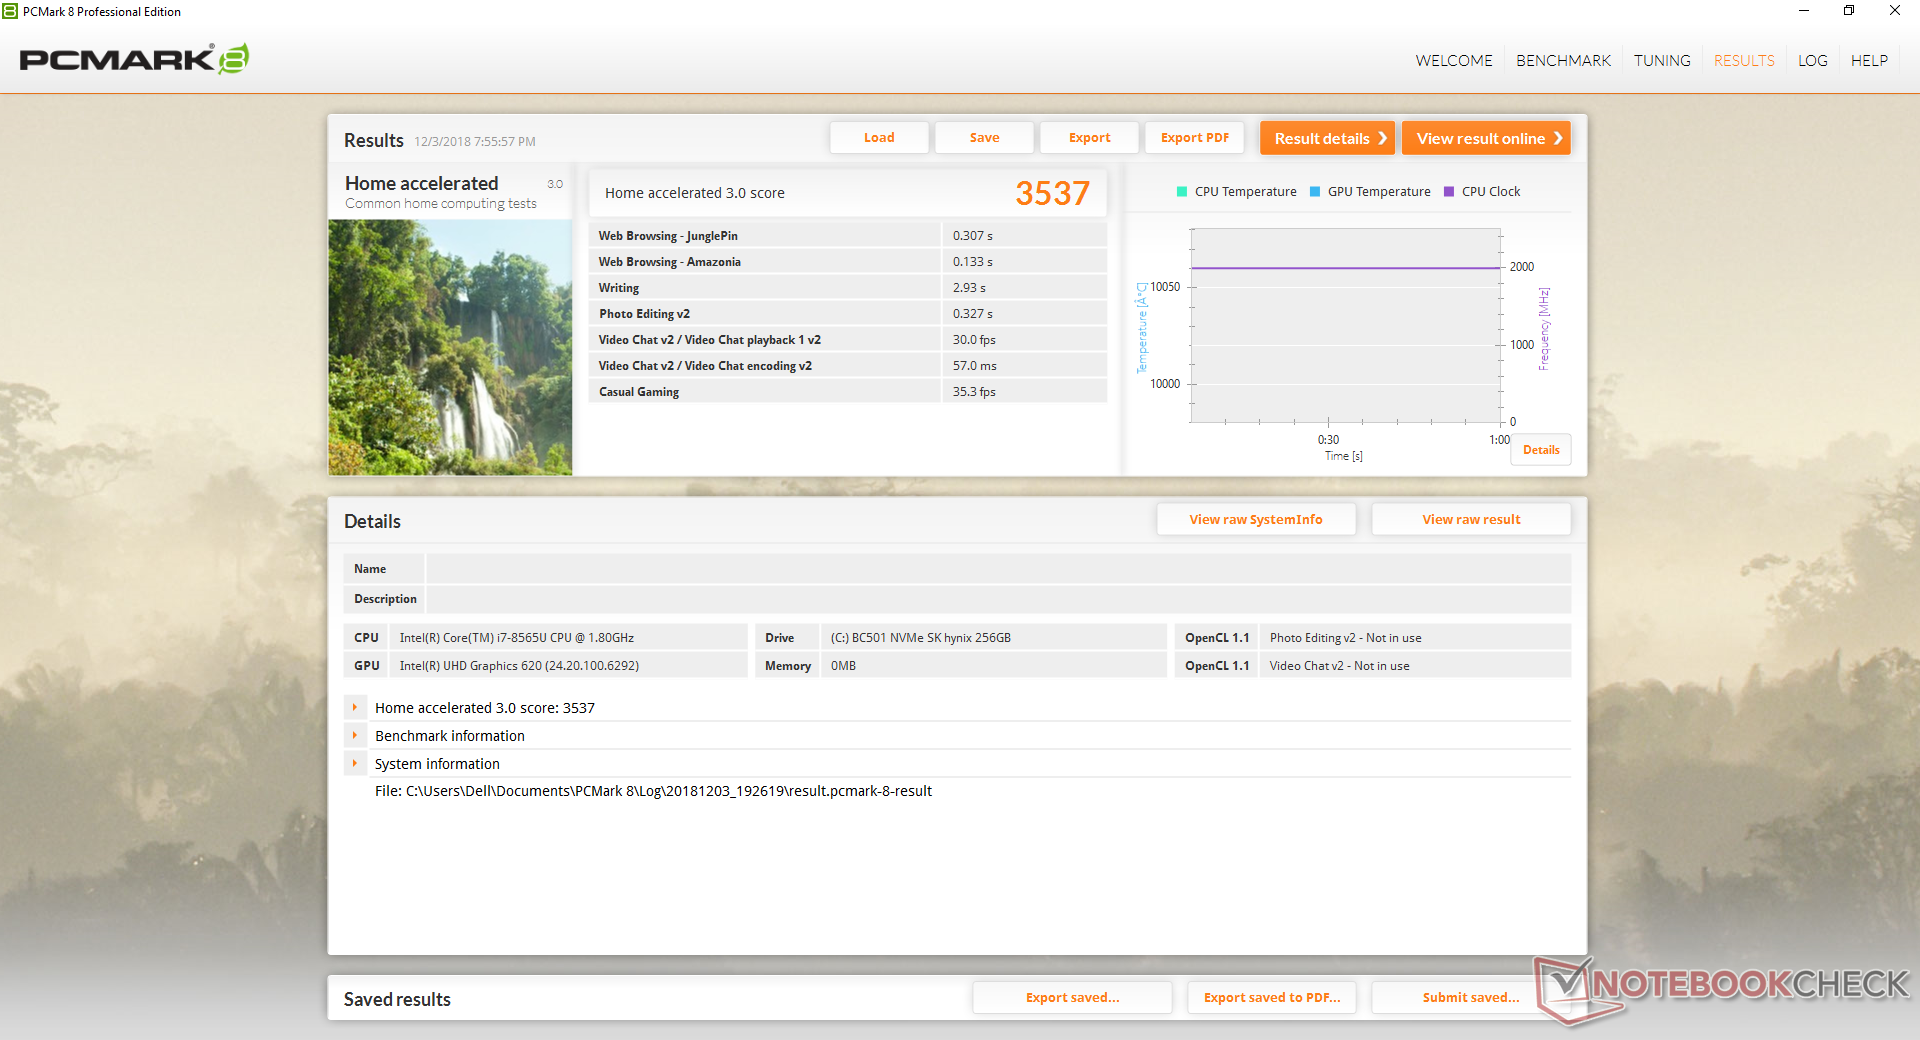
| PCMark 8 Home Score Accelerated v2 | 3537 points | |
| PCMark 8 Work Score Accelerated v2 | 5032 points | |
| PCMark 10 Score | 4069 points | |
Help | ||
Storage Devices
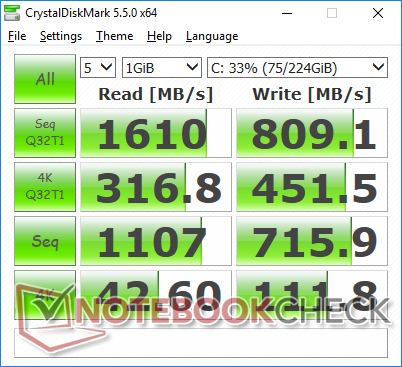
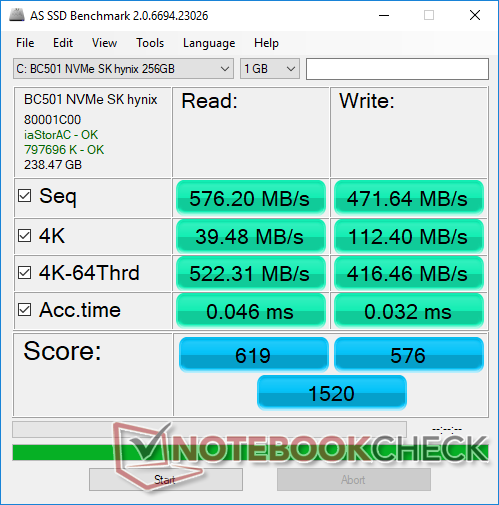
Impressively, Dell offers two accessible storage bays (M.2 2280 NVMe + 2.5-inch SATA III) which is uncommon for a budget 14-inch convertible. The 512 GB SK Hynix BC501 SSD in our test unit is slow for a NVMe drive especially when compared to the Samsung NVMe drives on pricier alternatives. Budget laptops in this category tend to use slower SSDs from SK Hynix or Micron as opposed to Samsung or Lite-On. The target audience is unlikely to notice this sly cut corner.
See our table of SSDs and HDDs for more benchmark comparisons.
| Dell Inspiron 14 5000 5482 2-in-1 SK Hynix BC501 NVMe 256 GB | Lenovo Yoga 530-14IKB-81EK00CWGE SK hynix PC401 HFS256GD9TNG | Asus VivoBook Flip 14 TP412UA-DB51T Micron 1100 MTFDDAV256TBN | Dell XPS 13 9365-4537 2-in-1 Toshiba NVMe THNSN5256GPUK | Lenovo Yoga C930-13IKB SK hynix PC401 HFS256GD9TNG | Huawei Matebook X Pro i5 Samsung PM961 MZVLW256HEHP | |
|---|---|---|---|---|---|---|
| AS SSD | 13% | -41% | -22% | -5% | 51% | |
| Seq Read (MB/s) | 576 | 2071 260% | 437.9 -24% | 1342 133% | 1850 221% | 2416 319% |
| Seq Write (MB/s) | 471.6 | 721 53% | 350.3 -26% | 543 15% | 661 40% | 1170 148% |
| 4K Read (MB/s) | 39.48 | 34.44 -13% | 23.31 -41% | 34.77 -12% | 38.04 -4% | 48.33 22% |
| 4K Write (MB/s) | 112.4 | 91 -19% | 64.7 -42% | 85.8 -24% | 95 -15% | 103.1 -8% |
| 4K-64 Read (MB/s) | 522 | 448.2 -14% | 234.3 -55% | 512 -2% | 434.3 -17% | 1039 99% |
| 4K-64 Write (MB/s) | 416.5 | 268.9 -35% | 279.4 -33% | 249.4 -40% | 266.3 -36% | 399.6 -4% |
| Access Time Read * (ms) | 0.046 | 0.046 -0% | 0.079 -72% | 0.169 -267% | 0.069 -50% | 0.058 -26% |
| Access Time Write * (ms) | 0.032 | 0.054 -69% | 0.056 -75% | 0.041 -28% | 0.056 -75% | 0.036 -13% |
| Score Read (Points) | 619 | 690 11% | 301 -51% | 681 10% | 657 6% | 1329 115% |
| Score Write (Points) | 576 | 432 -25% | 379 -34% | 389 -32% | 427 -26% | 620 8% |
| Score Total (Points) | 1520 | 1416 -7% | 839 -45% | 1388 -9% | 1373 -10% | 2575 69% |
| Copy ISO MB/s (MB/s) | 773 | 414.4 -46% | 714 -8% | 539 -30% | 739 -4% | |
| Copy Program MB/s (MB/s) | 344.4 | 364.3 6% | 264.7 -23% | 209.7 -39% | 312.3 -9% | |
| Copy Game MB/s (MB/s) | 536 | 354 -34% | 457.8 -15% | 340 -37% | 486.3 -9% | |
| CrystalDiskMark 5.2 / 6 | 12% | -48% | 1% | 19% | ||
| Write 4K (MB/s) | 111.8 | 123.1 10% | 66.5 -41% | 94.5 -15% | 116.5 4% | |
| Read 4K (MB/s) | 42.6 | 43.24 2% | 24.65 -42% | 39.95 -6% | 42.18 -1% | |
| Write Seq (MB/s) | 716 | 763 7% | 413.2 -42% | 531 -26% | 1079 51% | |
| Read Seq (MB/s) | 1107 | 1632 47% | 465.2 -58% | 1499 35% | 1030 -7% | |
| Write 4K Q32T1 (MB/s) | 451.5 | 268.6 -41% | 227 -50% | 315.3 -30% | 225.7 -50% | |
| Read 4K Q32T1 (MB/s) | 316.8 | 345.2 9% | 188.4 -41% | 279.8 -12% | 302.9 -4% | |
| Write Seq Q32T1 (MB/s) | 809 | 800 -1% | 439.9 -46% | 829 2% | 1174 45% | |
| Read Seq Q32T1 (MB/s) | 1610 | 2620 63% | 533 -67% | 2570 60% | 3394 111% | |
| Write 4K Q8T8 (MB/s) | 332 | |||||
| Read 4K Q8T8 (MB/s) | 488.6 | |||||
| Total Average (Program / Settings) | 13% /
13% | -45% /
-44% | -22% /
-22% | -2% /
-3% | 35% /
39% |
* ... smaller is better

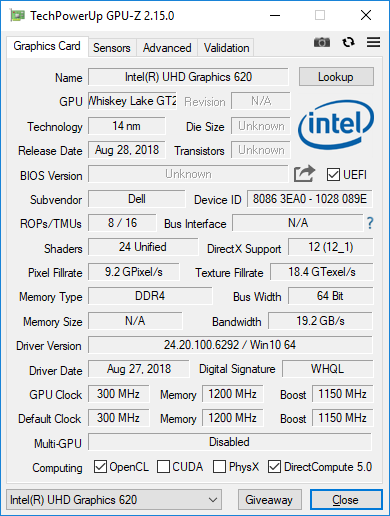
GPU Performance
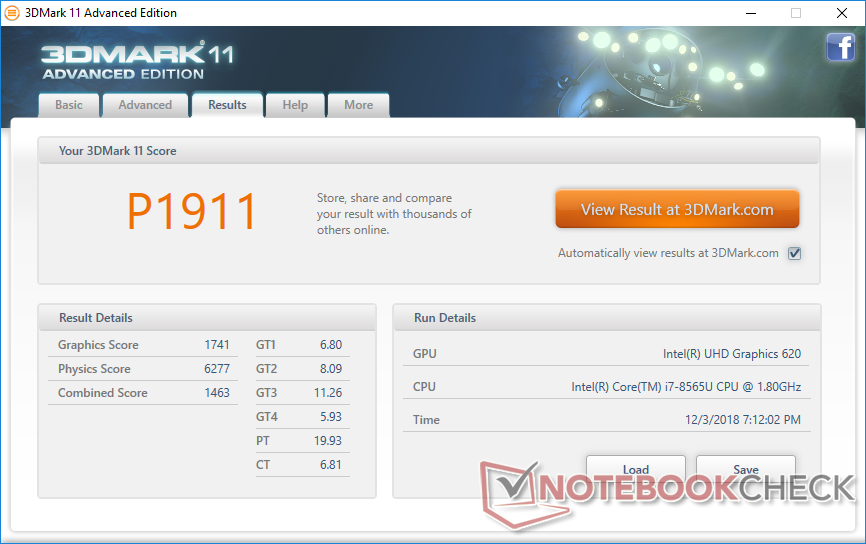
The Intel UHD Graphics series has evolved little over the years and this remains true for the Whiskey Lake-U series. The UHD Graphics 620 on the Inspiron is performing exactly where we expect it to be. Users upgrading from Atom-based or passively-cooled laptops will still see a boost in GPU power by about 60 percent. Users who want more graphics potential should consider systems with the GeForce MX150 or the AMD RX Vega 10 instead.
See our dedicated page on the UHD Graphics 620 for more technical information and benchmark comparisons.
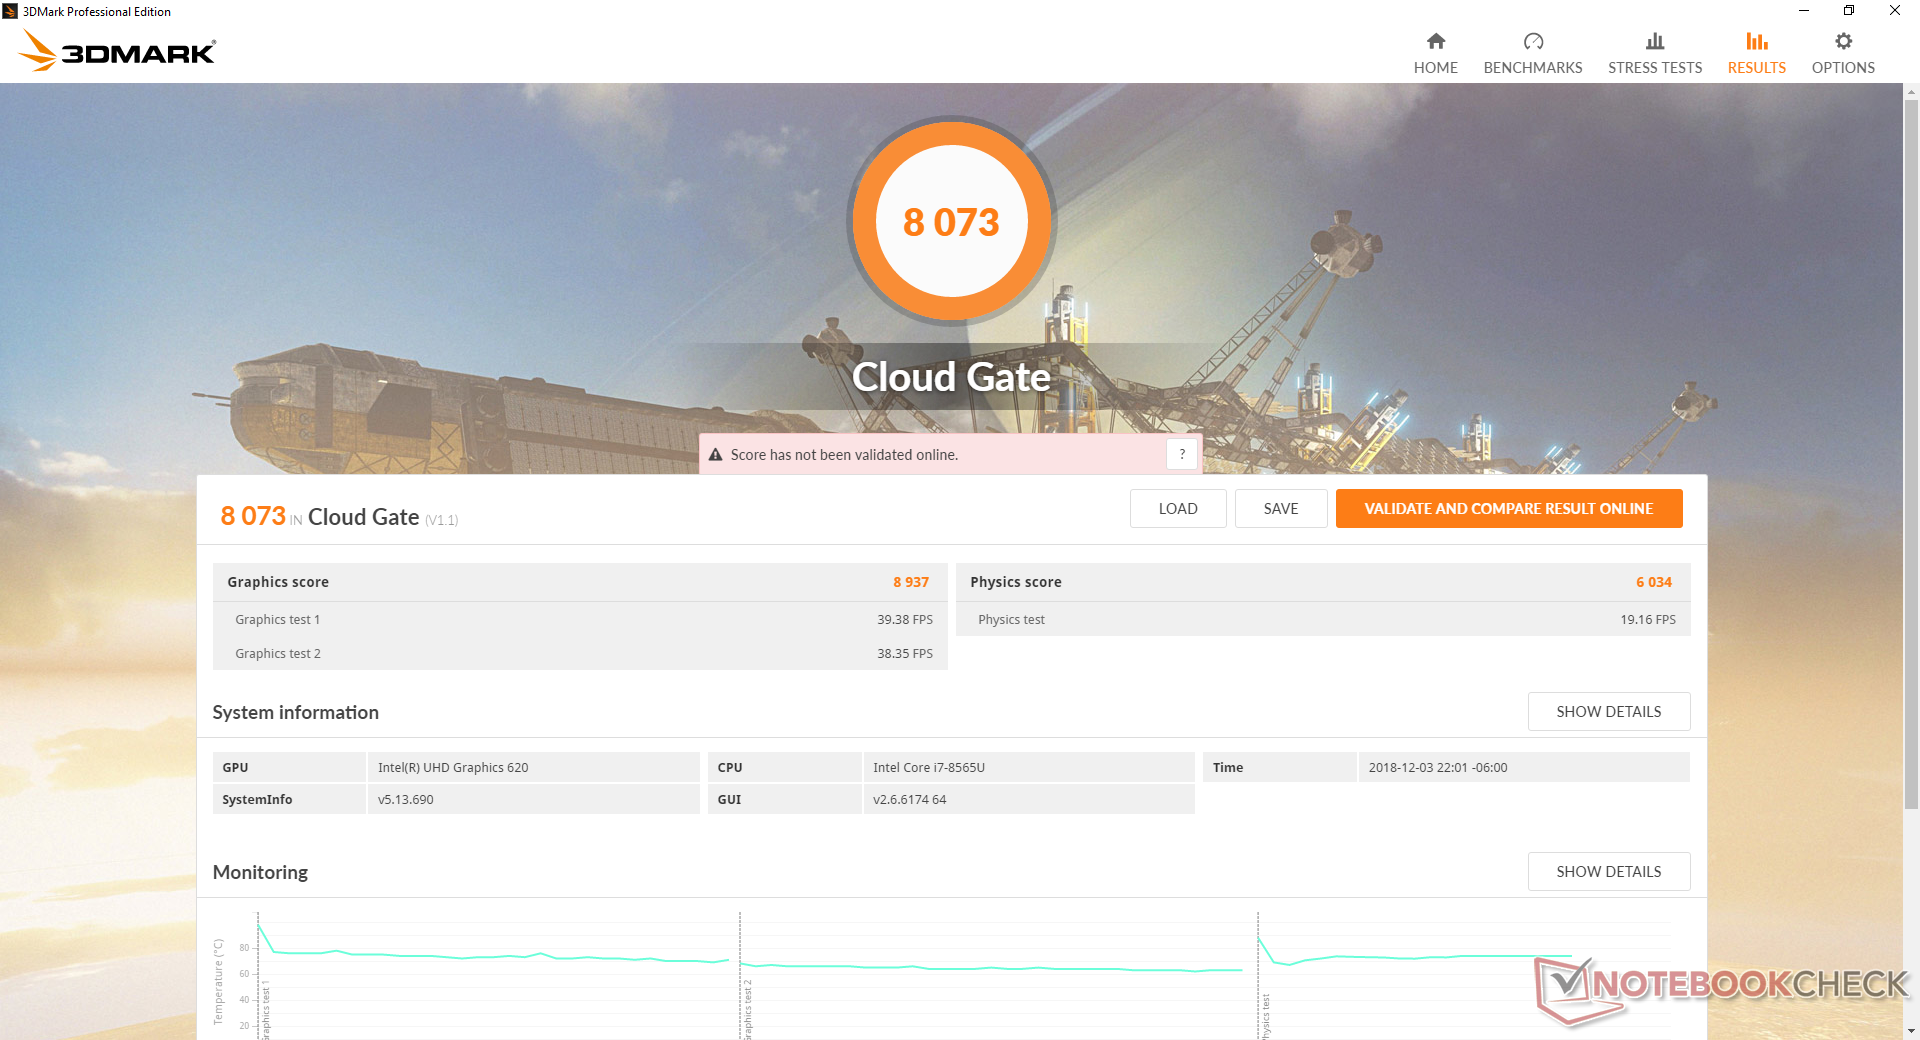
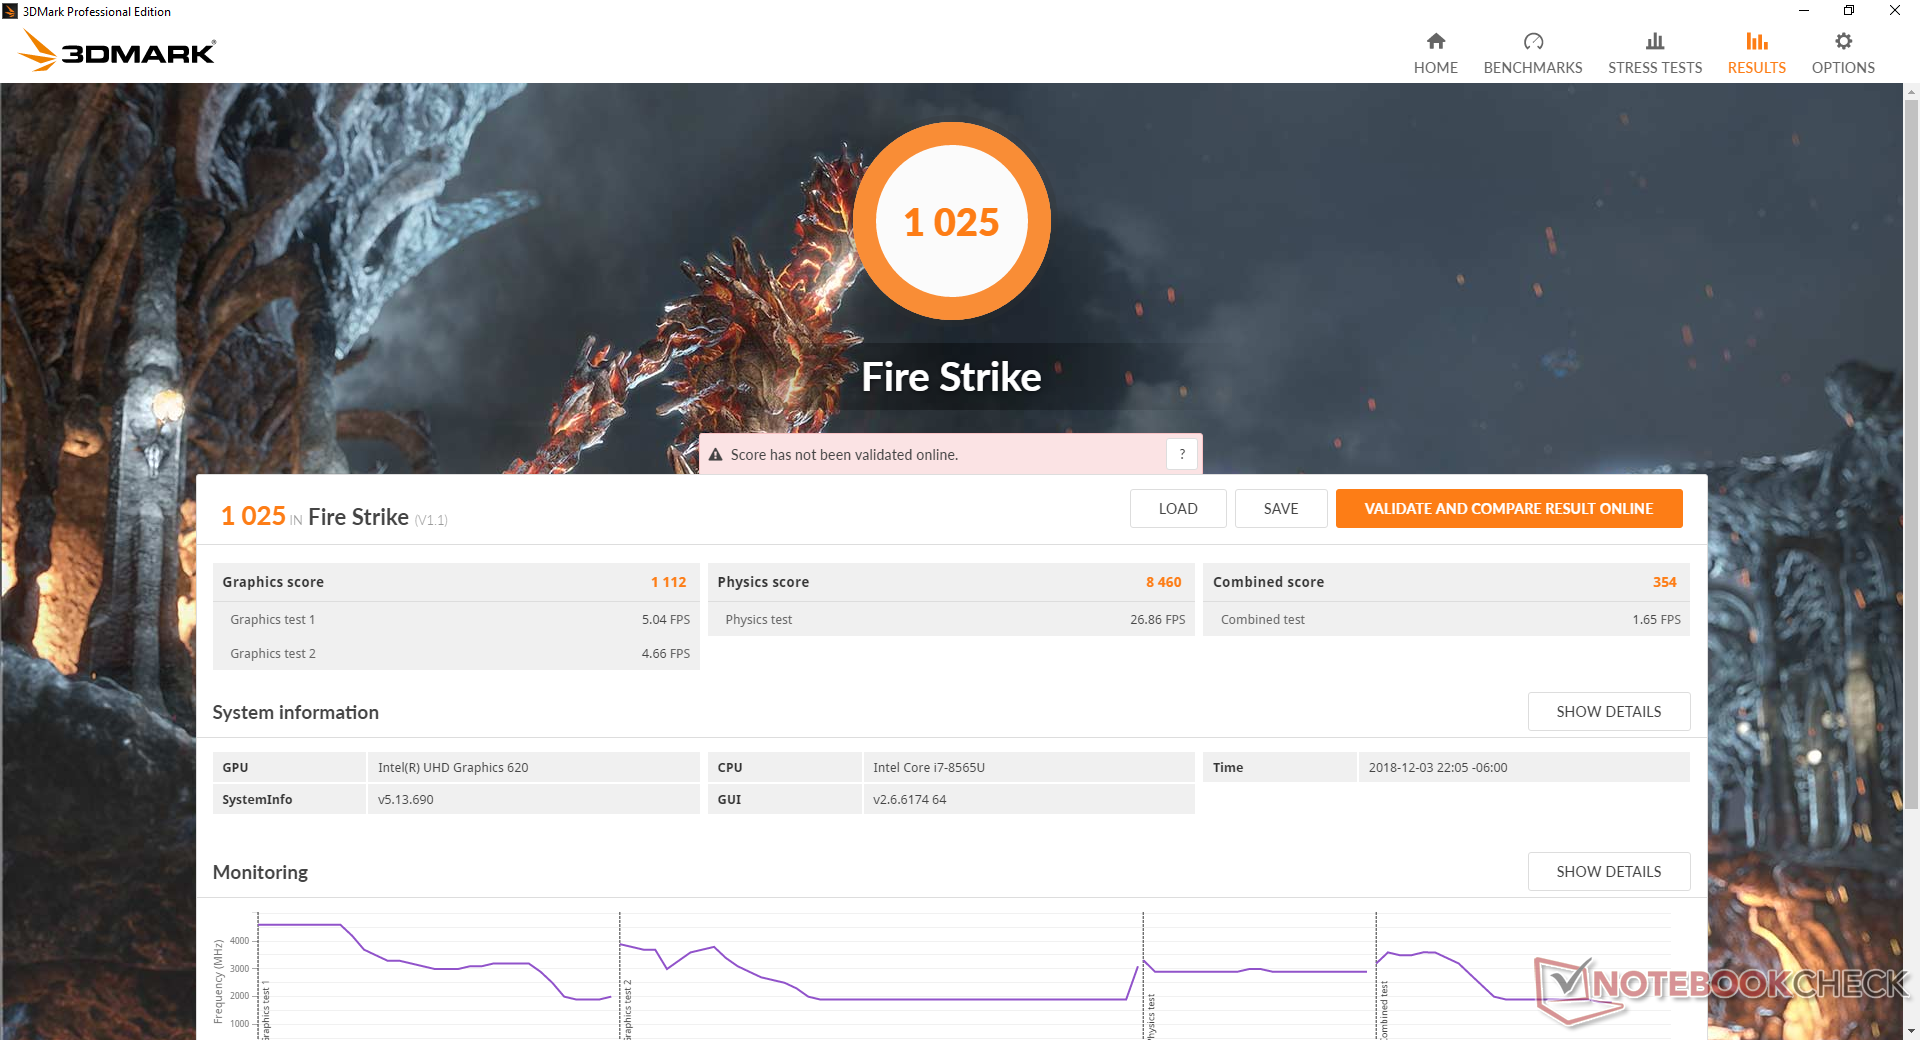
| 3DMark 06 Standard Score | 10342 points | |
| 3DMark 11 Performance | 1911 points | |
| 3DMark Cloud Gate Standard Score | 8073 points | |
| 3DMark Fire Strike Score | 1025 points | |
Help | ||
| low | med. | high | ultra | |
|---|---|---|---|---|
| BioShock Infinite (2013) | 51.1 | 30.3 | 24.5 | 7.6 |
| Rocket League (2017) | 50.6 | 24.3 | 15.7 | |
| Shadow of the Tomb Raider (2018) | 12 |
Emissions
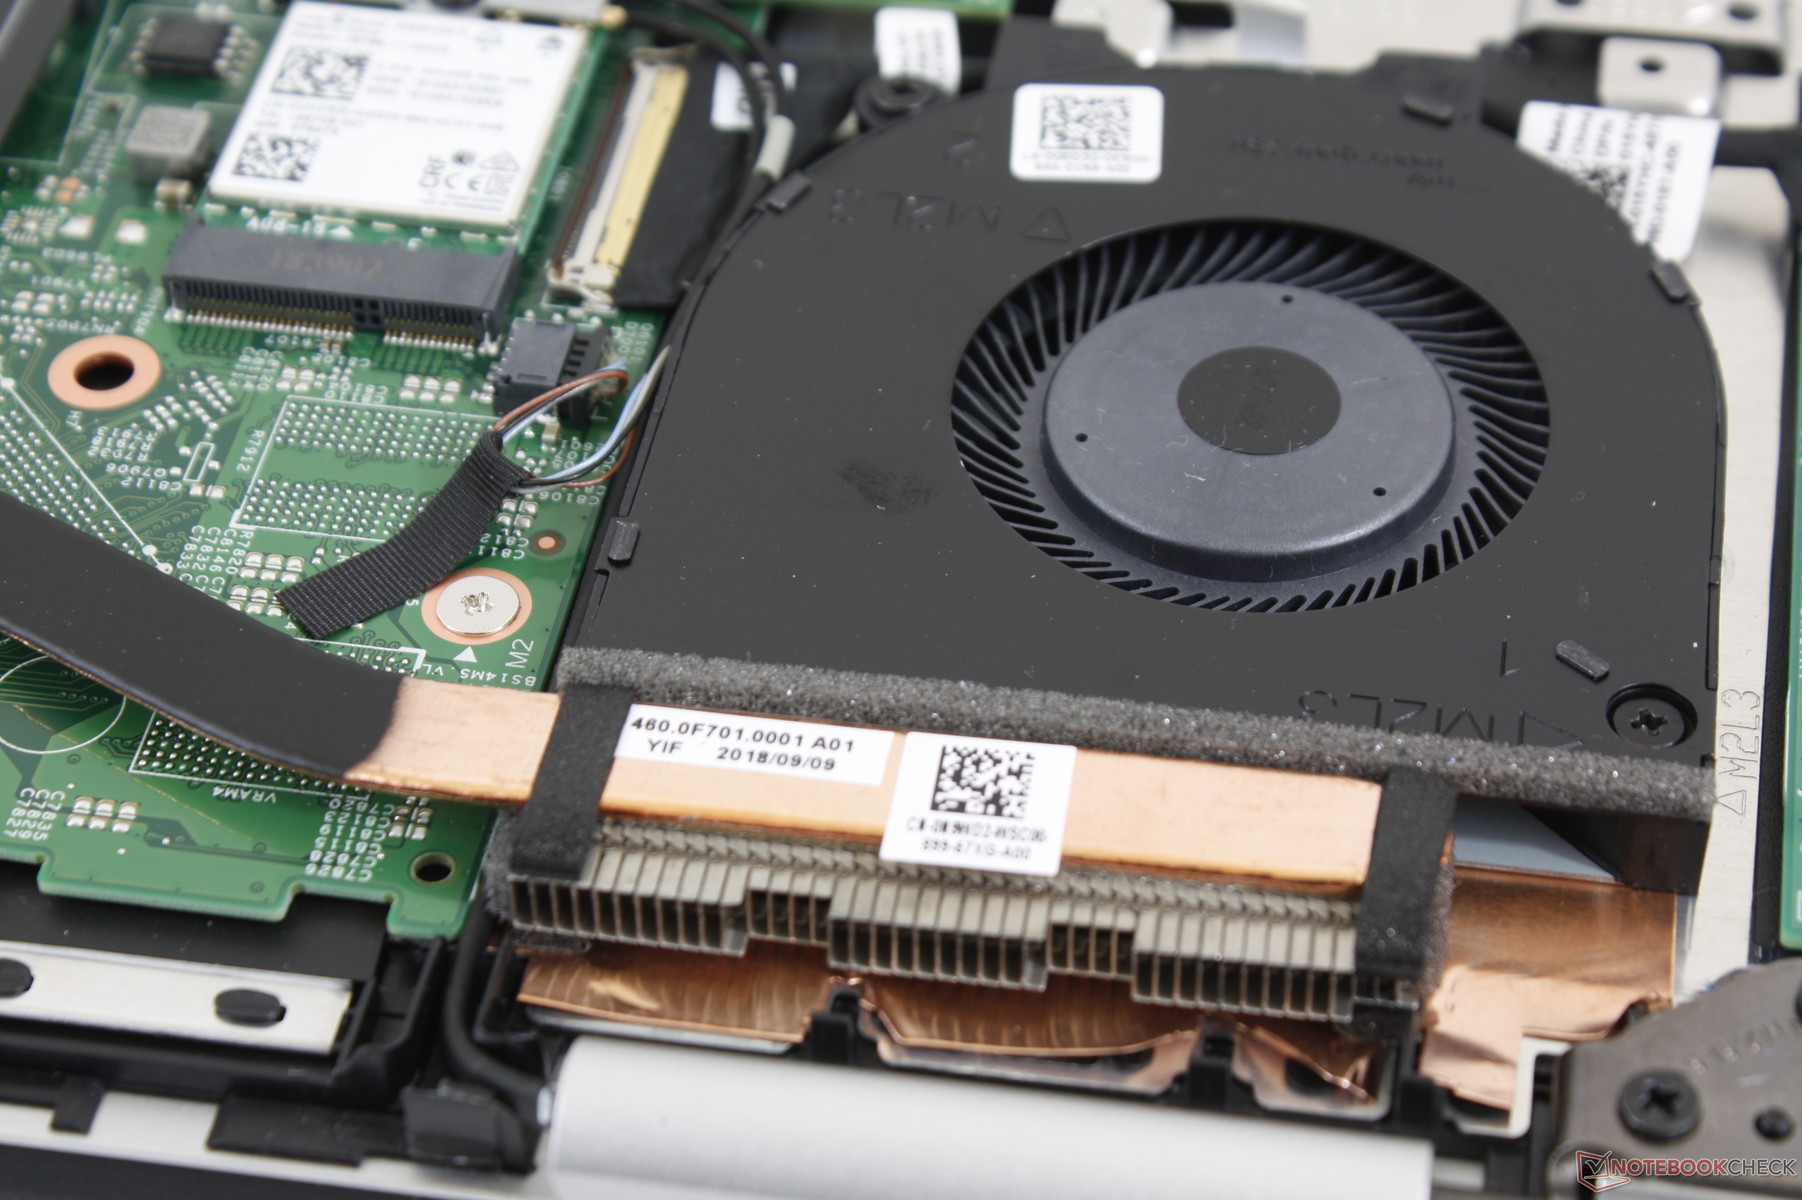
System Noise
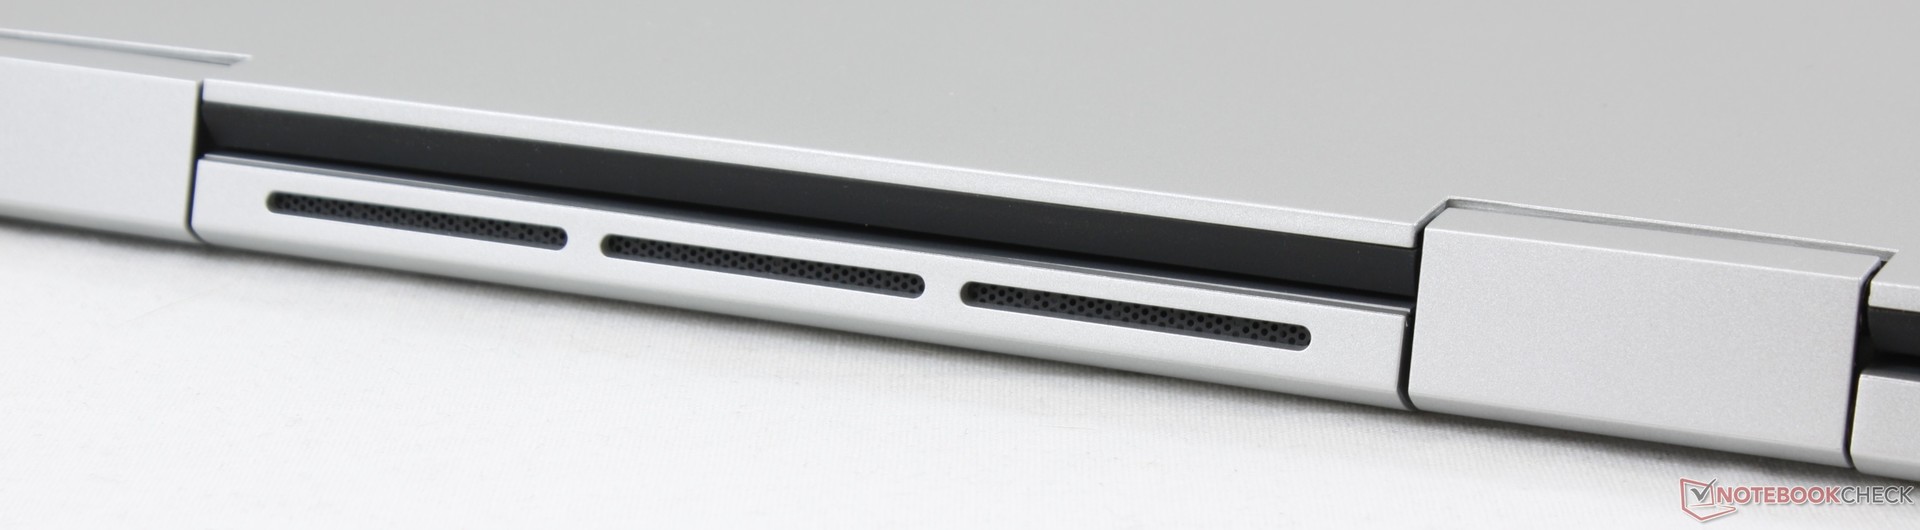
The cooling solution consists of a single ~45 mm fan and a heat pipe. The fan is idle during very low processing loads, but we are still able to record a noise of 29.4 dB(A) against a background of 28.2 dB(A) due to some electronic noise from our test unit. Gaming loads or higher will induce a fan noise of almost 36 dB(A) to be much quieter than the Surface Laptop when under similar conditions. Fan noise is generally steady and mostly unnoticeable when streaming video or browsing the web.
| Dell Inspiron 14 5000 5482 2-in-1 UHD Graphics 620, i7-8565U, SK Hynix BC501 NVMe 256 GB | Lenovo Yoga 530-14IKB-81EK00CWGE UHD Graphics 620, i5-8250U, SK hynix PC401 HFS256GD9TNG | Asus VivoBook Flip 14 TP412UA-DB51T UHD Graphics 620, i5-8250U, Micron 1100 MTFDDAV256TBN | Huawei Matebook X Pro i5 GeForce MX150, i5-8250U, Samsung PM961 MZVLW256HEHP | Microsoft Surface Laptop i7 Iris Plus Graphics 640, i7-7660U, Samsung PM971 KUS040202M | Lenovo ThinkPad A485-20MU000CGE Vega 8, R5 PRO 2500U, Samsung SSD PM981 MZVLB256HAHQ | |
|---|---|---|---|---|---|---|
| Noise | -3% | -2% | -3% | -10% | 2% | |
| off / environment * (dB) | 28.2 | 30.3 -7% | 28.4 -1% | 27.9 1% | 30.5 -8% | 29.3 -4% |
| Idle Minimum * (dB) | 28.2 | 30.3 -7% | 28.4 -1% | 27.9 1% | 30.9 -10% | 29.3 -4% |
| Idle Average * (dB) | 28.2 | 30.3 -7% | 28.4 -1% | 27.9 1% | 30.9 -10% | 29.3 -4% |
| Idle Maximum * (dB) | 29.4 | 30.3 -3% | 28.4 3% | 27.9 5% | 30.9 -5% | 29.6 -1% |
| Load Average * (dB) | 35.8 | 36.1 -1% | 35.7 -0% | 36.2 -1% | 40.2 -12% | 31.6 12% |
| Load Maximum * (dB) | 35.8 | 33.9 5% | 39 -9% | 45.2 -26% | 40.2 -12% | 31.6 12% |
| Witcher 3 ultra * (dB) | 45 |
* ... smaller is better
Noise level
| Idle |
| 28.2 / 28.2 / 29.4 dB(A) |
| Load |
| 35.8 / 35.8 dB(A) |
 | ||
30 dB silent 40 dB(A) audible 50 dB(A) loud |
||
min: | ||
Temperature
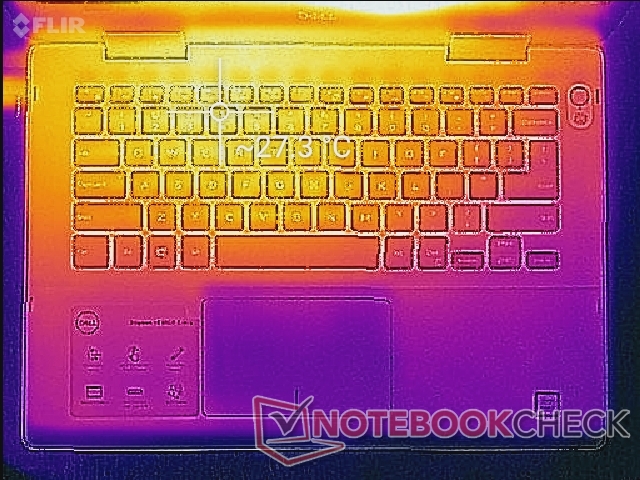
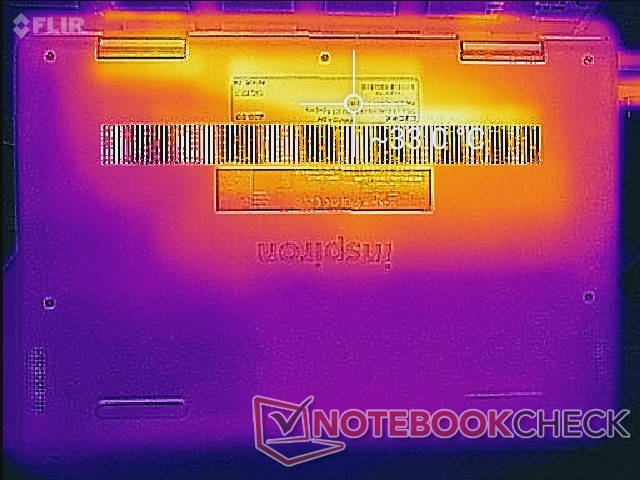
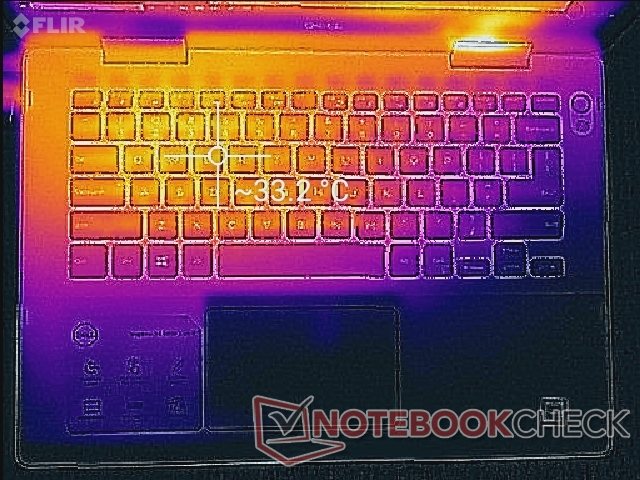
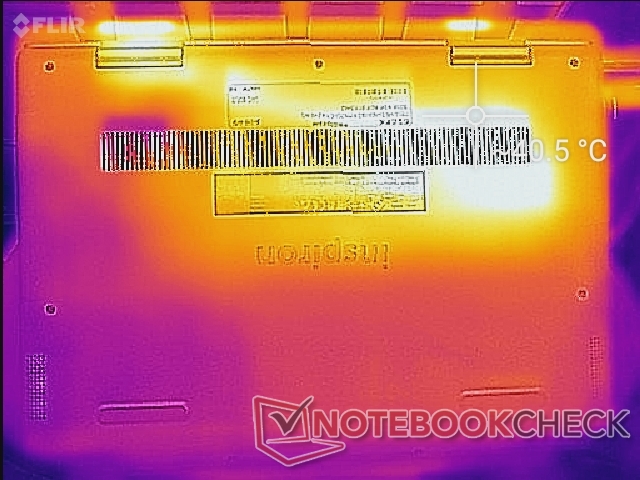
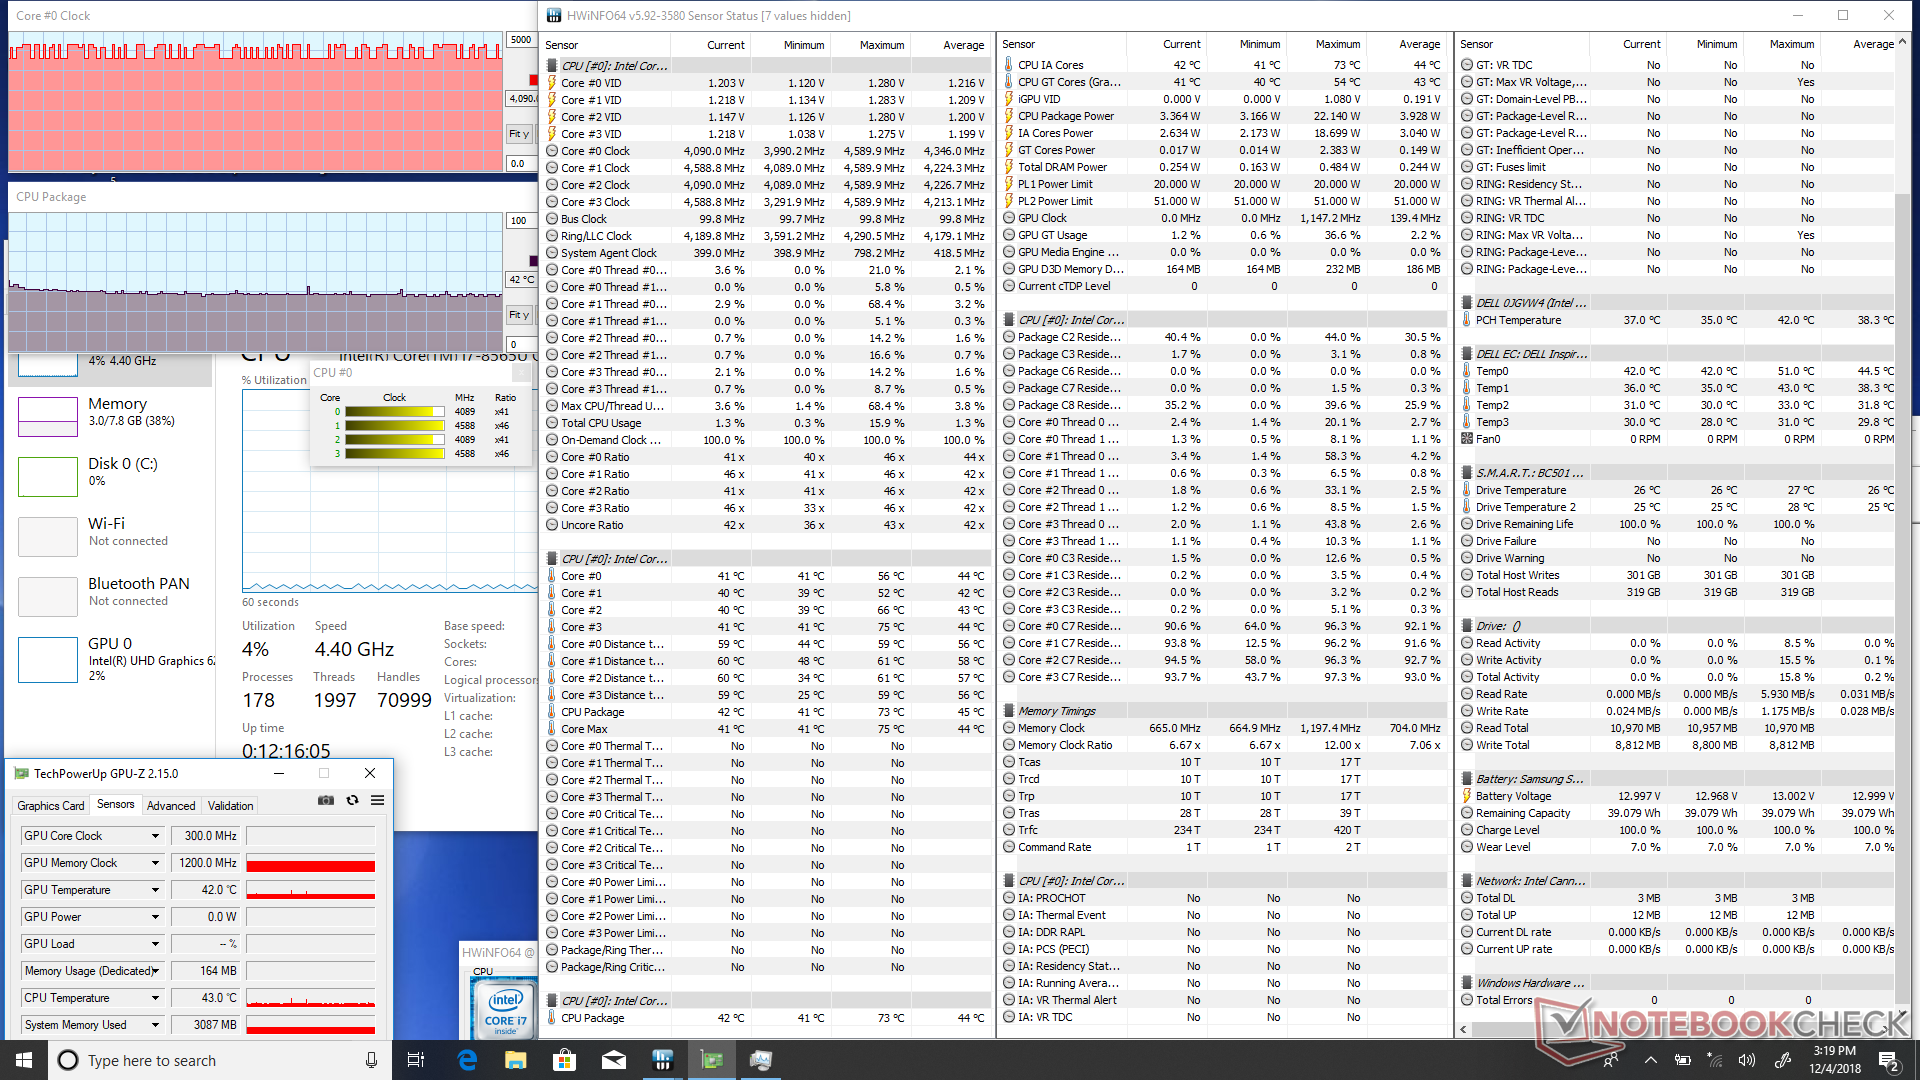
Surface temperatures when idling are warmer than expected towards the rear of the system where it can reach 31 C compared to just 21 C on the palm rests. When under maximum load, the hot spot on the bottom of the system can reach over 42 C. Thankfully, the keyboard and palm rests experience almost no temperature change and so the hands or fingers never become uncomfortably warm. Nonetheless, the left half of the system will always be warmer than the right due to the positioning of the processor underneath.
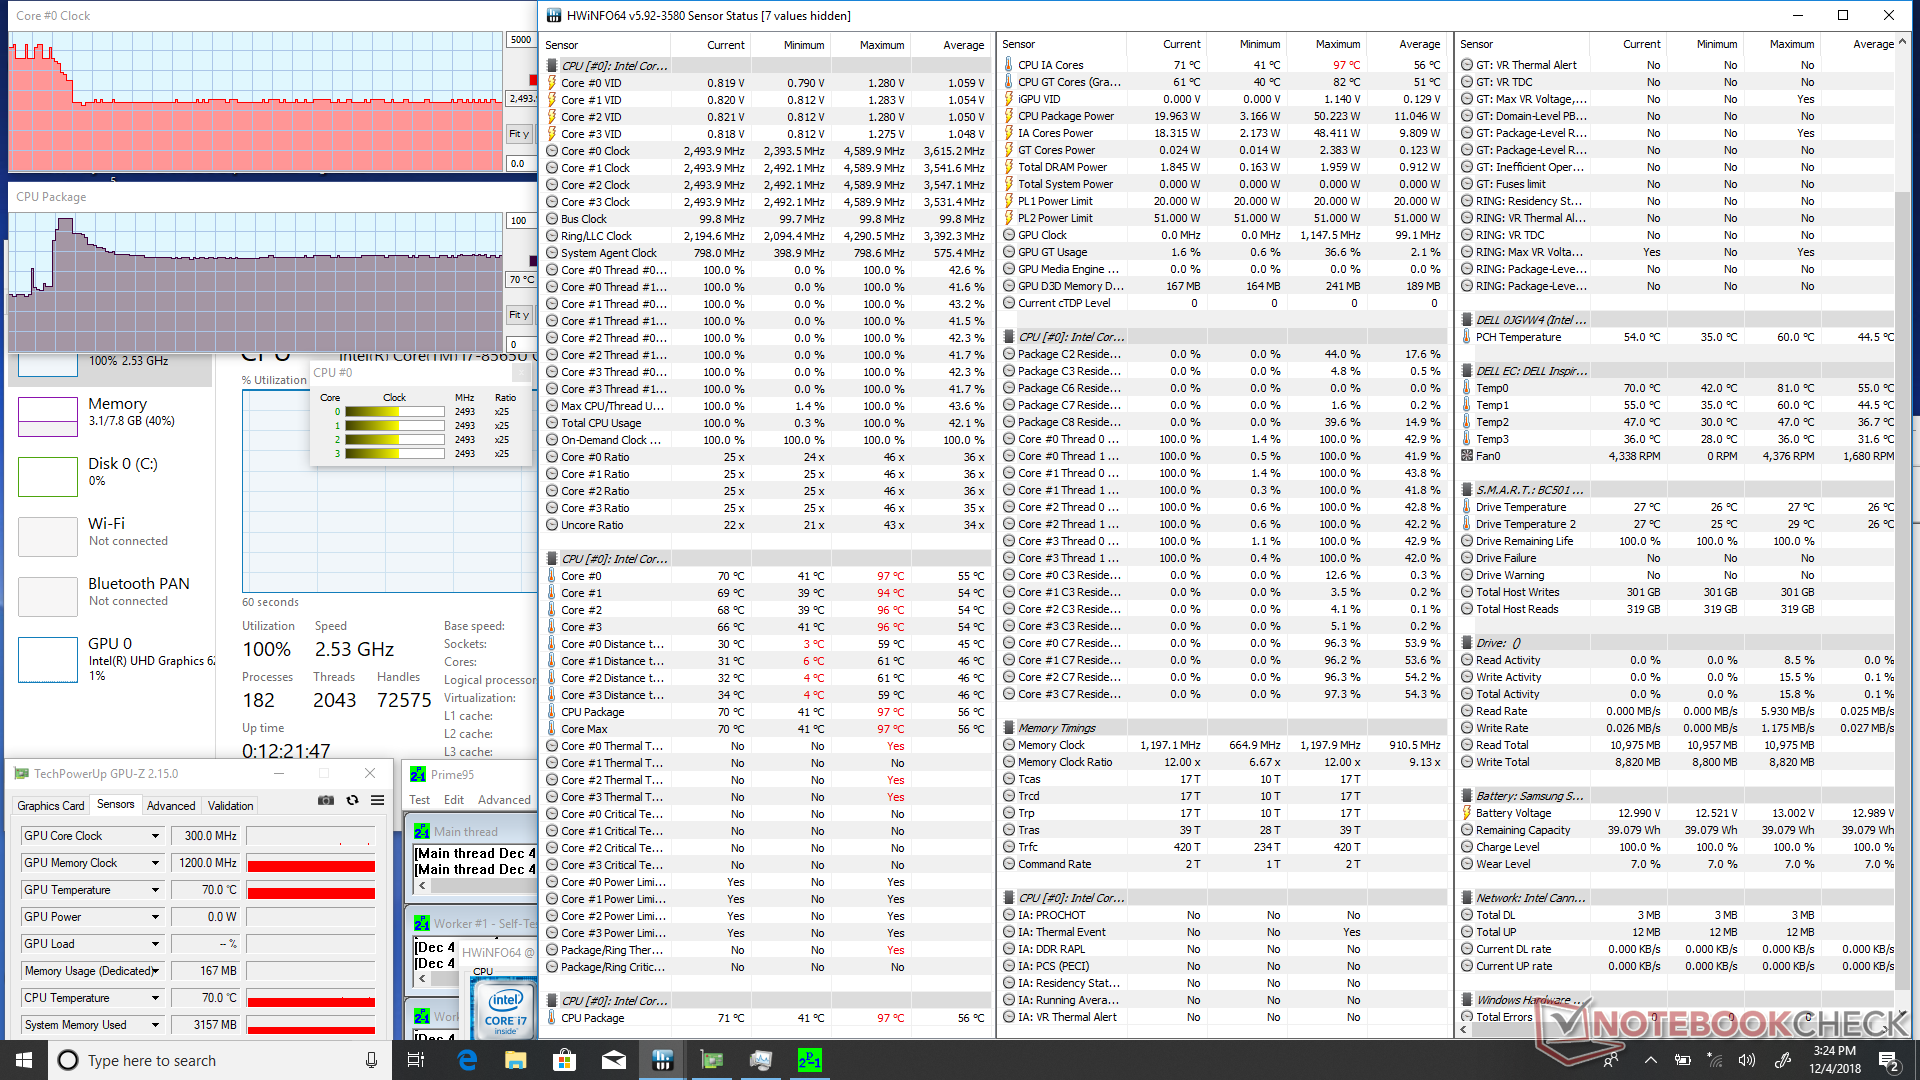
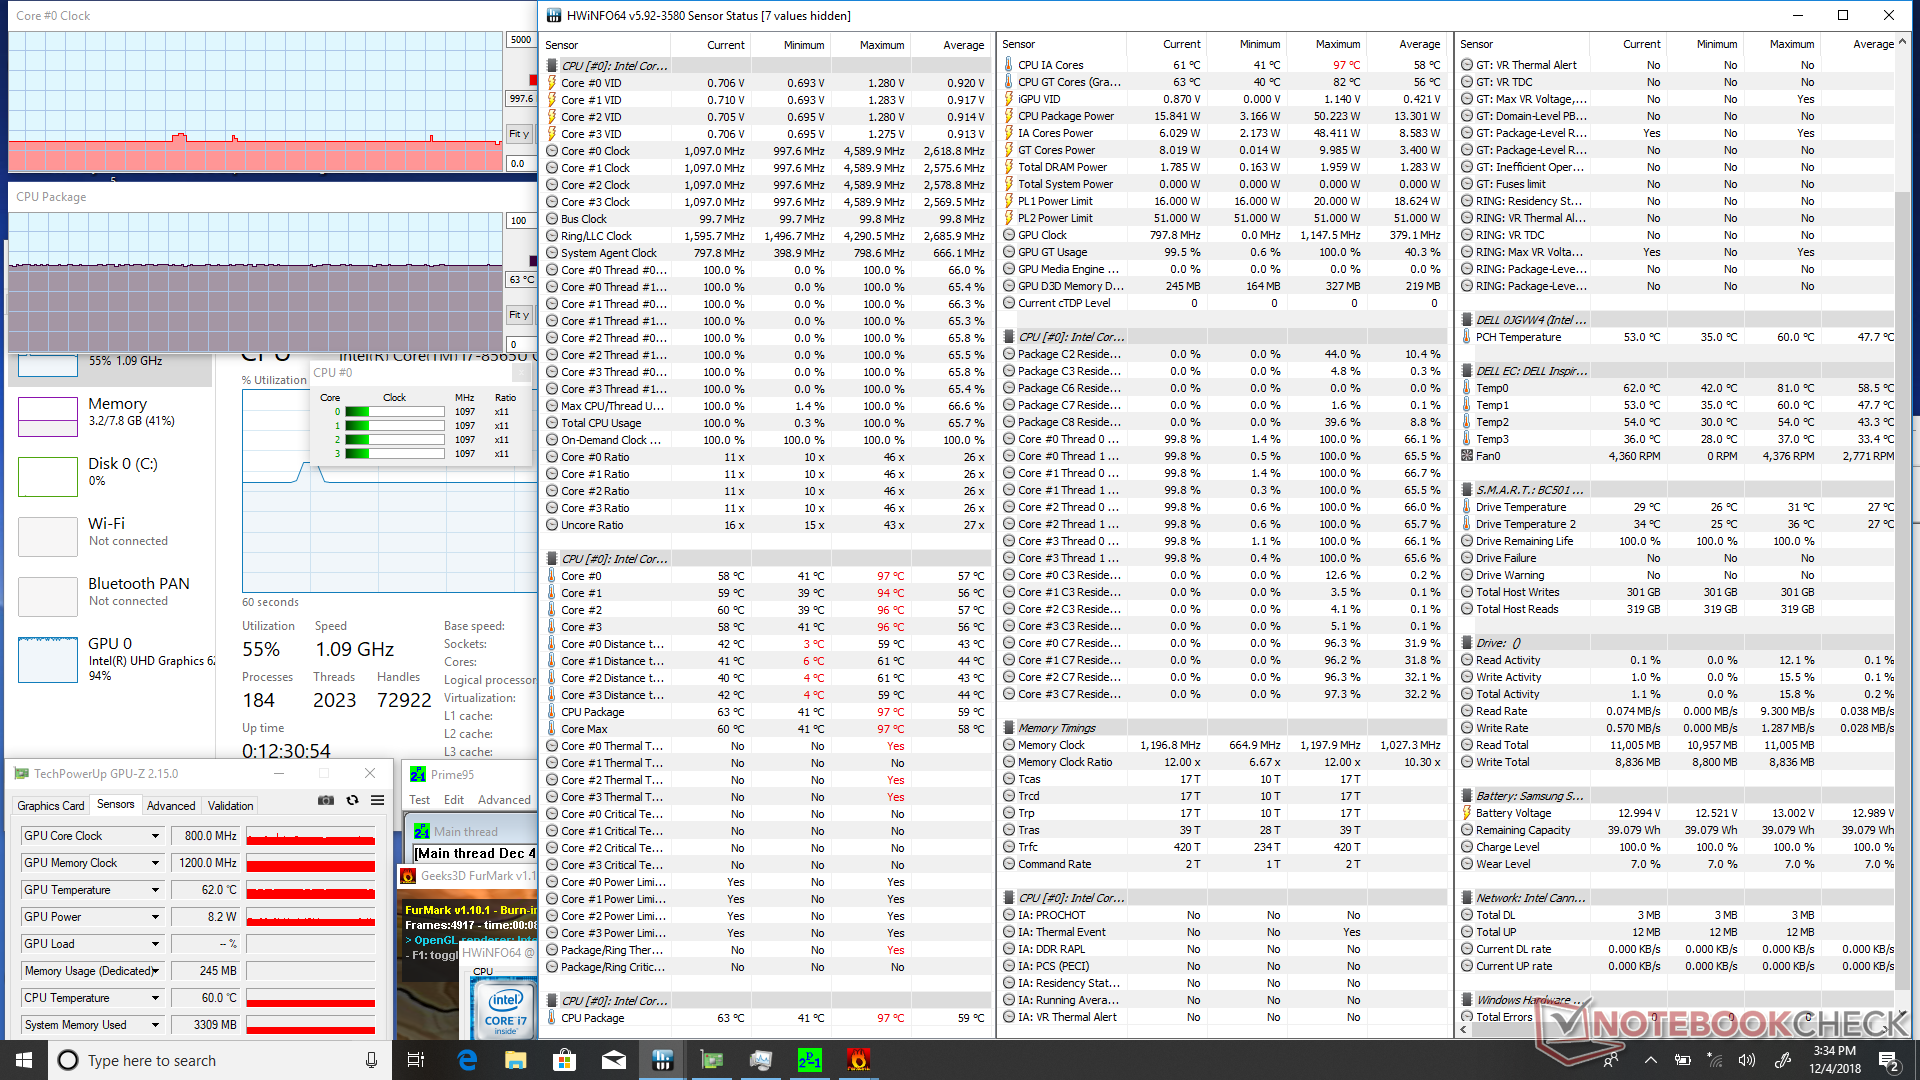
We stress the convertible with synthetic loads to identify for any potential throttling or stability issues. When running only Prime95, the CPU can be observed running at 4.0 GHz for the first few seconds before reaching a core temperature of 97 C. Clock rates then fall and stabilize at about 2.5 GHz in order to maintain a cooler core temperature of 70 C. If running both Prime95 and FurMark simultaneously, clock rates throttle to just 1.0 GHz.
Running on battery power will impact performance just slightly. A 3DMark 11 test on batteries returns Physics and Graphics scores of 5781 and 1689 points, respectively, compared to 6277 and 1741 points when on mains.
| CPU Clock (GHz) | GPU Clock (MHz) | Average CPU Temperature (°C) | |
| System Idle | -- | -- | 42 |
| Prime95 Stress | 2.5 | -- | 70 |
| Prime95 + FurMark Stress | 1.0 | 800 | 63 |
(+) The maximum temperature on the upper side is 33.2 °C / 92 F, compared to the average of 35.4 °C / 96 F, ranging from 19.6 to 60 °C for the class Convertible.
(±) The bottom heats up to a maximum of 42.6 °C / 109 F, compared to the average of 36.9 °C / 98 F
(+) In idle usage, the average temperature for the upper side is 23.9 °C / 75 F, compared to the device average of 30.3 °C / 87 F.
(+) The palmrests and touchpad are cooler than skin temperature with a maximum of 24.2 °C / 75.6 F and are therefore cool to the touch.
(+) The average temperature of the palmrest area of similar devices was 28 °C / 82.4 F (+3.8 °C / 6.8 F).
Speakers
The integrated stereo speakers are lacking in bass as one would expect. Frequencies above 1k Hz are represented evenly while frequencies below 1k trail off quickly for a treble-heavy audio experience. Louder volume settings will reverberate the palm rests slightly.


Dell Inspiron 14 5000 5482 2-in-1 audio analysis
(-) | not very loud speakers (68.2 dB)
Bass 100 - 315 Hz
(-) | nearly no bass - on average 16.4% lower than median
(±) | linearity of bass is average (8.9% delta to prev. frequency)
Mids 400 - 2000 Hz
(+) | balanced mids - only 4.2% away from median
(±) | linearity of mids is average (7.3% delta to prev. frequency)
Highs 2 - 16 kHz
(+) | balanced highs - only 3.4% away from median
(±) | linearity of highs is average (8.6% delta to prev. frequency)
Overall 100 - 16.000 Hz
(±) | linearity of overall sound is average (20.1% difference to median)
Compared to same class
» 51% of all tested devices in this class were better, 6% similar, 44% worse
» The best had a delta of 6%, average was 20%, worst was 57%
Compared to all devices tested
» 52% of all tested devices were better, 8% similar, 40% worse
» The best had a delta of 4%, average was 24%, worst was 134%
Apple MacBook 12 (Early 2016) 1.1 GHz audio analysis
(+) | speakers can play relatively loud (83.6 dB)
Bass 100 - 315 Hz
(±) | reduced bass - on average 11.3% lower than median
(±) | linearity of bass is average (14.2% delta to prev. frequency)
Mids 400 - 2000 Hz
(+) | balanced mids - only 2.4% away from median
(+) | mids are linear (5.5% delta to prev. frequency)
Highs 2 - 16 kHz
(+) | balanced highs - only 2% away from median
(+) | highs are linear (4.5% delta to prev. frequency)
Overall 100 - 16.000 Hz
(+) | overall sound is linear (10.2% difference to median)
Compared to same class
» 7% of all tested devices in this class were better, 2% similar, 91% worse
» The best had a delta of 5%, average was 18%, worst was 53%
Compared to all devices tested
» 5% of all tested devices were better, 1% similar, 94% worse
» The best had a delta of 4%, average was 24%, worst was 134%
Energy Management
Power Consumption
Idling on desktop demands between 3 W and 8 W depending on the brightness setting and power profile to be similar to its competitors.
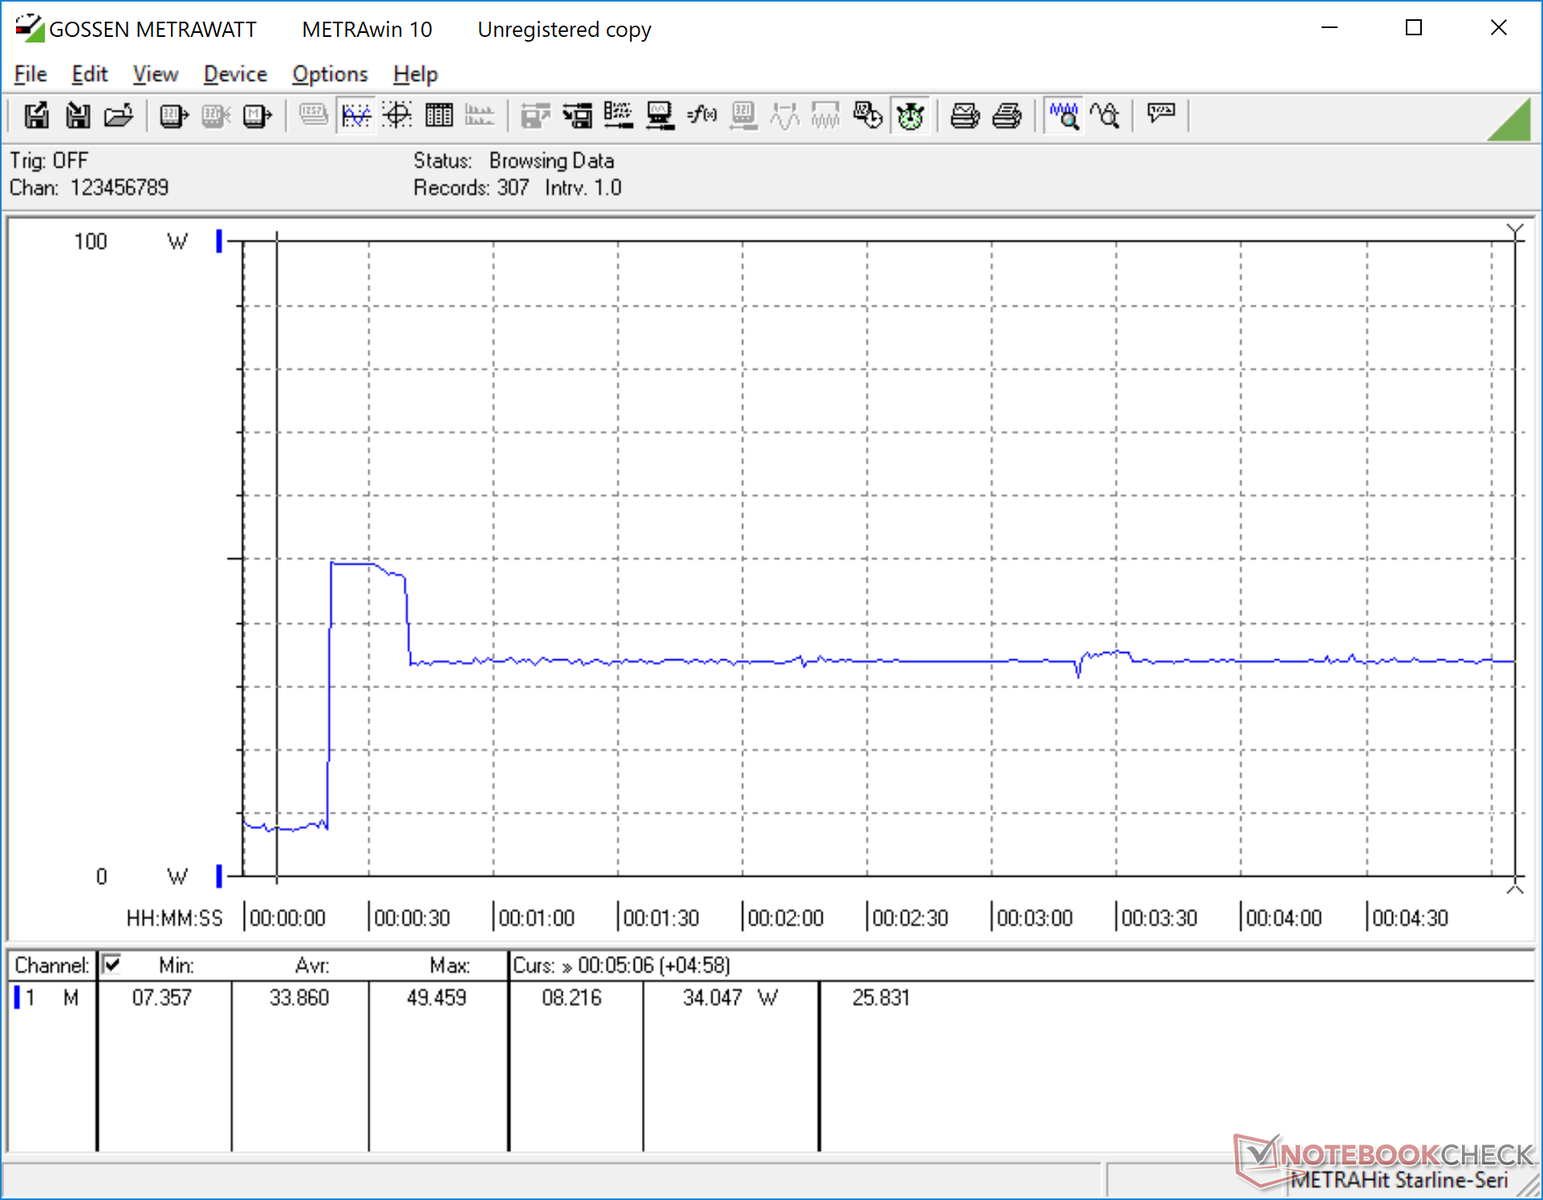
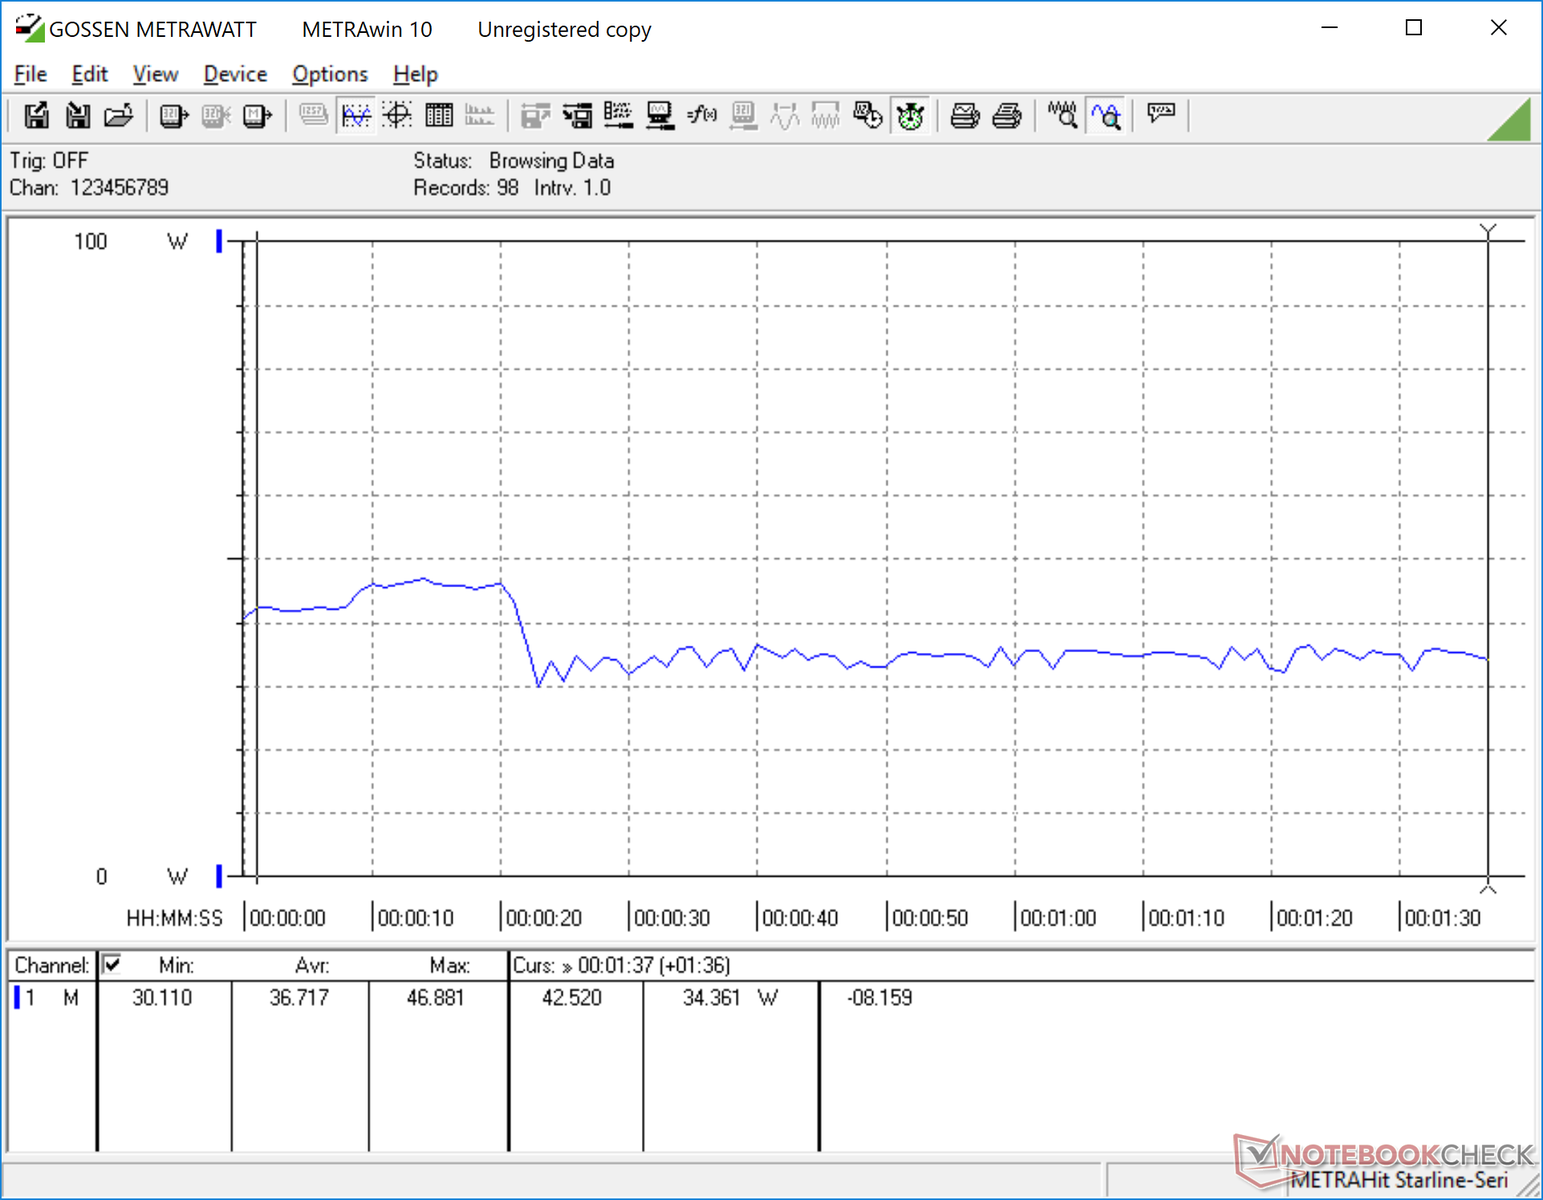
We are able to record a maximum load of 49 W from the small (~9.5 x 3.8 x 2.6 cm) 45 W AC adapter. The laptop is unable to sustain this high of a load for extended periods and so consumption eventually falls and stabilizes as shown by the graph below.
| Off / Standby | |
| Idle | |
| Load |
|
Key:
min: | |
| Dell Inspiron 14 5000 5482 2-in-1 i7-8565U, UHD Graphics 620, SK Hynix BC501 NVMe 256 GB, IPS, 1920x1080, 14" | Lenovo Yoga 530-14IKB-81EK00CWGE i5-8250U, UHD Graphics 620, SK hynix PC401 HFS256GD9TNG, IPS, 1920x1080, 14" | Asus VivoBook Flip 14 TP412UA-DB51T i5-8250U, UHD Graphics 620, Micron 1100 MTFDDAV256TBN, IPS, 1920x1080, 14" | Dell XPS 13 9365-4537 2-in-1 i5-7Y54, HD Graphics 615, Toshiba NVMe THNSN5256GPUK, IPS, 3200x1800, 13.3" | Lenovo Yoga C930-13IKB i5-8250U, UHD Graphics 620, SK hynix PC401 HFS256GD9TNG, IPS, 1920x1080, 13.9" | Huawei Matebook X Pro i5 i5-8250U, GeForce MX150, Samsung PM961 MZVLW256HEHP, IPS, 3000x2000, 13.9" | |
|---|---|---|---|---|---|---|
| Power Consumption | 13% | 18% | -37% | -10% | -31% | |
| Idle Minimum * (Watt) | 3.4 | 3.3 3% | 3.3 3% | 8.2 -141% | 3.3 3% | 3.5 -3% |
| Idle Average * (Watt) | 6.4 | 5.8 9% | 5.2 19% | 10.8 -69% | 6.8 -6% | 8.9 -39% |
| Idle Maximum * (Watt) | 7.8 | 8 -3% | 5.6 28% | 12.7 -63% | 9.5 -22% | 12.3 -58% |
| Load Average * (Watt) | 36.7 | 29.2 20% | 32.9 10% | 22.6 38% | 40.8 -11% | 54.2 -48% |
| Load Maximum * (Watt) | 49.3 | 31.1 37% | 35.2 29% | 24.6 50% | 57 -16% | 52.1 -6% |
| Witcher 3 ultra * (Watt) | 42.4 |
* ... smaller is better
Battery Life
Runtimes are long if not average for its category. Expect a real-world WLAN battery life of around 7 hours to be comparable to the Lenovo Yoga 530 and even the XPS 13 2-in-1.
Charging from empty to full capacity with the included AC adapter is extraordinarily slow. Be prepared to wait between 3 to 3.5 hours for a full charge compared to just 1.5 to 2 hours on most other laptops.
| Dell Inspiron 14 5000 5482 2-in-1 i7-8565U, UHD Graphics 620, 42 Wh | Lenovo Yoga 530-14IKB-81EK00CWGE i5-8250U, UHD Graphics 620, 45 Wh | Asus VivoBook Flip 14 TP412UA-DB51T i5-8250U, UHD Graphics 620, 42 Wh | Dell XPS 13 9365-4537 2-in-1 i5-7Y54, HD Graphics 615, 46 Wh | Lenovo Yoga C930-13IKB i5-8250U, UHD Graphics 620, 60 Wh | Huawei Matebook X Pro i5 i5-8250U, GeForce MX150, 57.4 Wh | |
|---|---|---|---|---|---|---|
| Battery runtime | 13% | 33% | -6% | 54% | 48% | |
| Reader / Idle (h) | 12.4 | 15.3 23% | 23.9 93% | 20.7 67% | ||
| WiFi v1.3 (h) | 7.2 | 7 -3% | 9.6 33% | 6.8 -6% | 9.2 28% | 9.3 29% |
| Load (h) | 1.5 | 1.8 20% | 2.1 40% | 2.2 47% |
Verdict
Pros
Cons
The latest Inspiron convertible is well-rounded if not middle-of-the-road. It doesn't go the extra mile to offer anything more compelling than its competitors to coax potential buyers. Small advantages like a brighter display, free WACOM pen, or faster charging could have boosted the appeal of the system or given it the slight edge to stand out from the crowd.
Because of its very affordable starting price and 1080p touchscreen, the Inspiron 14 5482 2-in-1 is best suited for student use, home multimedia playback, or the occasional car trip. Alternatives like the Yoga 530 and VivoBook Flip 14 are indeed smaller and lighter but for slightly higher retail prices.
A well-rounded entry-level convertible for beginner users. It's an affordable back-to-school option even if it doesn't offer anything extraordinary for its category.
Dell Inspiron 14 5000 5482 2-in-1
- 12/07/2018 v6 (old)
Allen Ngo
Price comparison
