Microsoft Surface (i7-7660U) Laptop Review
")
For the original German translation, click here
After our extensive review of the i5-based Microsoft Surface Laptop, we now move on to examine the more powerful variant, the Microsoft Surface Laptop that is based on the Intel Core i7-7660U. At a first glance, the Surface Laptop i7-7660U appears to be a more capable sibling of the Microsoft Surface Laptop that comes equipped with the Intel Core i5-7200U, only with a premium of 350 Euros (~$406) over the i5 variant with the same SSD capacity and amount of RAM. Had things really been that simple, Notebookcheck would have had much less work to do. But upon closer examination and after new intensive tests, we have found that the devil is, as always, in the details and is invisible to most consumers. When thinking about the Surface Laptop i7, one should keep the following points in mind: Although the Intel Core i7-7660U comes with the more capable Iris Plus Graphics 640 GPU, the i7 cannot reach its full potential due to throttling. Microsoft's new laptop is equipped with a faster SSD from Samsung, instead of the slower SSD from Toshiba that we found inside the i5 variant.
Therefore, in our review, we lay emphasis on the benchmark results in the areas of performance and graphics power, in order to better show the differences. On this occasion, we have also thrown the Microsoft Surface Pro (2017) into the mix, which is equipped with the same Intel Core i7-7660U processor and should be comparable, in terms of CPU power to the Surface Laptop i7. It has been known at least since our review of the Surface Pro (2017) that the Core i7-7660U cannot use all of its power, because after a few minutes of operation performance starts to deteriorate and the clock rate drops to the levels of an Intel Core i7-7500U.You can learn more about this in the “Performance” section.
At first, we will take a look at the available configurations. Unlike the i5 variant with its top SSD capacity of 256 GB, the i7-based laptop provides a larger selection of SSD capacities, offering SSDs with 512 GB and 1 TB of storage space, which are only available in combination with 16 GB of RAM. For this reason, the upper price bracket extends all the way up to a hefty 3099 Euros (~$3606) for the 1 TB version, which comes solely in the “Platinum Grey” color scheme. For those who seek a more reasonably priced i7 variant: The MSRP for the i7 version with a 256 GB SSD and 8 GB of RAM is 1799 Euros (~$2094). A direct price comparison between the i5 and the i7 processor with the same 256 GB SSD and 8 GB of RAM shows that the i7 luxury is going to cost one an extra 350 Euros ($407).
So the question in the room is: Whether or not the i7 processor is worth that extra 350 Euros (~$407). We try to answer that question in the following sections.
Case
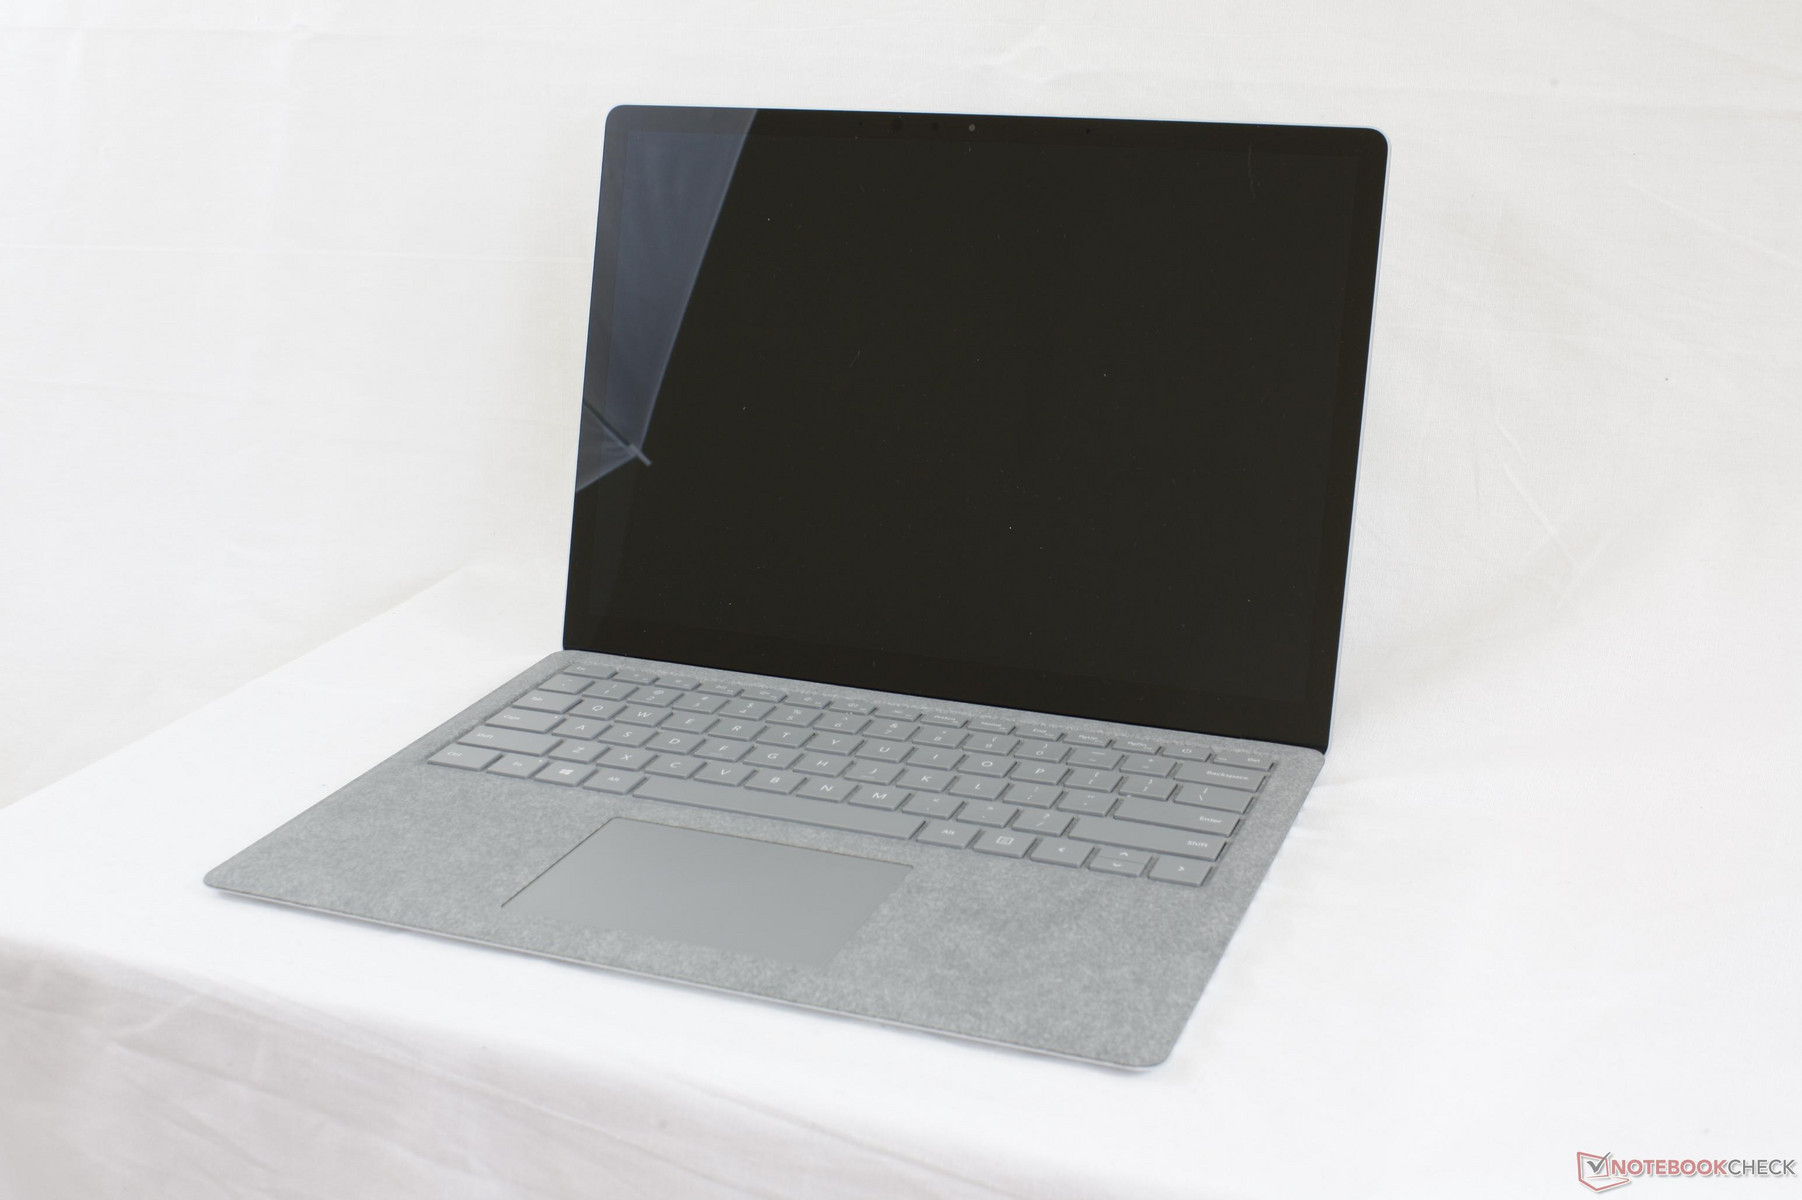
The i5 and i7 cases are structurally identical and from the outside, we cannot tell which is which. The overall build quality and the rigidity of the i7 leaves a very positive impression. The unusual use of Alcantara for the wrist rest area is particularly striking. This may cause some problems for certain users. The question of how well the material is going to hold up after some time in use can only be answered after a long-term review. Fresh out of the box, the material looks elegant and feels nice to touch.
The following color variants are available: Platinum grey, burgundy, graphite gold and cobalt blue. There are only minor changes in terms of weight. At 1.283 kilograms (~2.83 lb), the i7-based model weighs just 31 grams (~1.1 oz) more than its smaller sibling. This should not be noticeable in day-to-day use.
Connectivity
Due to the identical structure of the cases, there is no hope that the significantly more expensive device can offer better I/O than its cheaper and slower counterpart. Unfortunately, that is the case. As with the i5, the i7 version lacks a Thunderbolt 3 port, as well as a USB Type-C port, and even a simple SD card reader. These ports, which are nowadays considered standard fare, should not be missing in a laptop that exceeds the 3000-Euro (~$3500) mark.
Display
The Microsoft Surface Laptop Intel Core i7 uses exactly the same Panasonic panel VVX14T092N00 as the Intel Core i5 model. There are only minor differences between the two laptops in terms of the display. With its LG Display LP123WQ112604, the Microsoft Surface Pro (2017) provides better results, as far as brightness and contrast are concerned. There are also differences in resolution between the Panasonic and the LG panels. Whilst the Surface Laptops come with a native resolution of 2256x1504, the Surface Pro (2017) supports a resolution 2736x1824.
| |||||||||||||||||||||||||
Brightness Distribution: 89 %
Center on Battery: 398 cd/m²
Contrast: 948:1 (Black: 0.42 cd/m²)
| Microsoft Surface Laptop i7 ID: MEI96A2, Name: Panasonic VVX14T092N00, , 2256x1504, 13.5" | Microsoft Surface Laptop i5 ID: MEI96A2, Name: Panasonic VVX14T092N00, , 2256x1504, 13.5" | Microsoft Surface Pro (2017) i7 LG Display LP123WQ112604, , 2736x1824, 12.3" | Apple MacBook Pro 13 2017 Touchbar i5 APPA034, , 2560x1600, 13.3" | Dell XPS 13 9360 FHD i7 Iris SHP1449, , 1920x1080, 13.3" | |
|---|---|---|---|---|---|
| Display | |||||
| Display P3 Coverage (%) | 67.8 | 66.6 | 98.6 | 51.6 | |
| sRGB Coverage (%) | 94.3 | 96.5 | 100 | 77.4 | |
| AdobeRGB 1998 Coverage (%) | 69.5 | 67.8 | 86.5 | 53.3 | |
| Response Times | |||||
| Response Time Grey 50% / Grey 80% * (ms) | 50.8 ? | 37 ? | 48 ? | 41.2 ? | |
| Response Time Black / White * (ms) | 37.2 ? | 25 ? | 33.6 ? | 30 ? | |
| PWM Frequency (Hz) | 22130 ? | 119000 ? | 19530 ? | ||
| Screen | 4% | 16% | 15% | 43% | |
| Brightness middle (cd/m²) | 398 | 384.2 -3% | 482 21% | 551 38% | 461 16% |
| Brightness (cd/m²) | 393 | 378 -4% | 466 19% | 514 31% | 418 6% |
| Brightness Distribution (%) | 89 | 90 1% | 92 3% | 88 -1% | 85 -4% |
| Black Level * (cd/m²) | 0.42 | 0.36 14% | 0.395 6% | 0.48 -14% | 0.2 52% |
| Contrast (:1) | 948 | 1067 13% | 1220 29% | 1148 21% | 2305 143% |
| Colorchecker dE 2000 * | 1.8 | 4 | 0.8 | 5.4 | |
| Colorchecker dE 2000 max. * | 4.2 | 7.2 | 1.4 | 12.2 | |
| Greyscale dE 2000 * | 1.2 | 5.7 | 1 | 5.4 | |
| Gamma | 2.21 100% | 2.28 96% | 2.16 102% | 2.15 102% | |
| CCT | 6708 97% | 7950 82% | 6672 97% | 7258 90% | |
| Color Space (Percent of AdobeRGB 1998) (%) | 63.7 | 62 | 48.6 | ||
| Color Space (Percent of sRGB) (%) | 94.2 | 96 | 76.9 | ||
| Total Average (Program / Settings) | 4% /
4% | 16% /
16% | 15% /
15% | 43% /
43% |
* ... smaller is better
Performance
We were already somewhat surprised during our extensive testing of the Surface Laptop i5 that Microsoft had decided to go with the rarely-used Core i7-7660U instead of the much more common Core i7-7600U. Here, the decision was made in favor of graphics power, which is the only differentiating feature between the two CPUs. While the Core i7-7660U has the Iris Plus Graphics 640 GPU at its disposal, the Core i7-7600U comes with a 6-month old HD Graphics 620 GPU. On account of the Iris Plus Graphics 640, we expect to see a clear advantage with the i7-based laptop in GPU-intensive application, but we do not expect any wonders in video games.
Processor
Compared directly with the Surface Laptop Intel Core i5-7200U, the more powerful Surface Laptop i7-7660U is clocked much higher, and with the Turbo boost it can reach 4 GHz, whereas the i5 variant can only hit 3.1 GHz with the Turbo. Therefore the i7 gets an acceptable score in the Cinebench R15 (Multi-Core) test, which puts it a touch above the devices with the Intel Core i7-7600U. But wait! It only looks that way on paper and in the lab. Things are different in real life. The party-crasher here is called “throttling”.
Even though there was some throttling present with the Surface Laptop i5, it never led to performance drops of more than 7% (such drops are barely noticeable in practice), and that is after multiple benchmark runs. The Surface Laptop i7 with the Intel Core i7-7660U, on the other hand, registers huge performance drops after only a few minutes under continuous load. The Surface Laptop i7 as well as the Surface Pro i7 (2017), both of which come with the same CPU, lose anywhere from 12 to 17% in terms of CPU performance in the Cinebench R15 continuous loop. Taking into account all these performance declines, the Intel Core i7-7660U processors take their place a little below the i7-7500U, which can be found in the Acer Switch 5 SW512-52-5819.
Put it another way: Thanks to its throttling, the Surface Laptop i7 comes dangerously close to the cheaper Surface Laptop i5. When it is experiencing throttling, the performance advantage in CPU-intensive tasks of the significantly more expensive i7 laptop is reduced to a ridiculous 6%.
System Performance
As expected, the system performance of the Microsoft Surface Laptop i7 lies well above that of the i5 model, and also above the Surface Pro i7 (2017). There are two results in the benchmark list, the lower one was observed with the energy saving function enabled.
| PCMark 8 Home Score Accelerated v2 | 4182 points | |
| PCMark 8 Creative Score Accelerated v2 | 5509 points | |
| PCMark 8 Work Score Accelerated v2 | 4700 points | |
| PCMark 10 Score | 3812 points | |
Help | ||
Storage Devices
Although, the performance decline that we saw from the CPU was sobering, comparing the integrated Samsung PM971 KUS040202M 512 GB SSD with the Toshiba THNSN0128GTYA of the i5 model (which we harshly criticized in our review) yielded pleasant results. The i7 with its built-in Samsung SSD is considerably ahead of the Surface Laptop i5 in almost all categories.
| Microsoft Surface Laptop i7 Samsung PM971 KUS040202M | Microsoft Surface Laptop i5 Toshiba THNSN0128GTYA | Microsoft Surface Pro (2017) i7 Samsung PM971 KUS040202M | Lenovo ThinkPad P51s 20HB000SGE Samsung SSD PM961 1TB M.2 PCIe 3.0 x4 NVMe (MZVLW1T0) | Dell XPS 13 9360 FHD i7 Iris Toshiba XG4 NVMe (THNSN5512GPUK) | |
|---|---|---|---|---|---|
| CrystalDiskMark 3.0 | -65% | 5% | 47% | 32% | |
| Read Seq (MB/s) | 1021 | 425.6 -58% | 1308 28% | 1189 16% | 1314 29% |
| Write Seq (MB/s) | 973 | 128.2 -87% | 961 -1% | 1138 17% | 617 -37% |
| Read 512 (MB/s) | 253 | 278.5 10% | 227.5 -10% | 782 209% | 1058 318% |
| Write 512 (MB/s) | 778 | 126.7 -84% | 792 2% | 959 23% | 502 -35% |
| Read 4k (MB/s) | 53 | 22.15 -58% | 53.6 1% | 54.8 3% | 37.31 -30% |
| Write 4k (MB/s) | 130.4 | 40.45 -69% | 136.3 5% | 161.4 24% | 133.6 2% |
| Read 4k QD32 (MB/s) | 453.3 | 77.8 -83% | 485.6 7% | 642 42% | 425.1 -6% |
| Write 4k QD32 (MB/s) | 389.7 | 41.18 -89% | 421.5 8% | 549 41% | 431.3 11% |

GPU Performance
We were quite excited to examine the gaming performance of the Iris Plus Graphics 640. It should blow the HD Graphics 620 of the Intel Core i5 out of the water. The Iris Plus Graphics 640 can go as high up as 1050 MHz, and it has twice as many execution units set up in a GT3e configuration.
| 3DMark | |
| 1280x720 Cloud Gate Standard Graphics | |
| Apple MacBook Pro 13 2017 | |
| Microsoft Surface Pro (2017) i7 | |
| Dell XPS 13 9360 FHD i7 Iris | |
| Microsoft Surface Laptop i7 | |
| Microsoft Surface Laptop i5 | |
| 1920x1080 Fire Strike Graphics | |
| Apple MacBook Pro 13 2017 | |
| Microsoft Surface Pro (2017) i7 | |
| Dell XPS 13 9360 FHD i7 Iris | |
| Microsoft Surface Laptop i7 | |
| Microsoft Surface Laptop i5 | |
| 3DMark 06 Standard Score | 13164 points | |
| 3DMark 11 Performance | 2561 points | |
| 3DMark Cloud Gate Standard Score | 7558 points | |
| 3DMark Fire Strike Score | 1236 points | |
| 3DMark Time Spy Score | 476 points | |
Help | ||
Gaming Performance
The Iris Plus Graphics 640 of the Surface Laptop i7 will be of at least some use to the gamers. With the minimum graphics settings, the GPU can run a number of current titles, but with higher settings and at higher resolutions getting playable frame rates is really tough on account of all the throttling. As one would expect, the gaming performance of the Surface Laptop i7 is comparable to that of the Surface Pro i7, which is equipped with the same hardware.
| Overwatch | |
| 1920x1080 Epic (Render Scale 100 %) AA:SM AF:16x | |
| Apple MacBook Pro 13 2017 | |
| 1920x1080 High (Render Scale 100 %) AA:SM AF:4x | |
| Apple MacBook Pro 13 2017 | |
| Dell XPS 13 9360 FHD i7 Iris | |
| Microsoft Surface Pro (2017) i7 | |
| 1366x768 Medium (Render Scale 100 %) AA:FX AF:2x | |
| Apple MacBook Pro 13 2017 | |
| Microsoft Surface Pro (2017) i7 | |
| Dell XPS 13 9360 FHD i7 Iris | |
| Microsoft Surface Laptop i7 | |
| 1280x720 Low (Render Scale 100 %) AA:FX AF:1x | |
| Apple MacBook Pro 13 2017 | |
| Microsoft Surface Pro (2017) i7 | |
| Dell XPS 13 9360 FHD i7 Iris | |
| Microsoft Surface Laptop i7 | |
| The Evil Within 2 - 1280x720 Low Preset AA:T | |
| Microsoft Surface Laptop i7 | |
| Middle-earth: Shadow of War - 1280x720 Lowest Preset | |
| Microsoft Surface Laptop i7 | |
| FIFA 18 | |
| 1920x1080 Medium Preset | |
| Microsoft Surface Laptop i7 | |
| 1280x720 Low Preset | |
| Microsoft Surface Laptop i7 | |
| F1 2017 | |
| 1920x1080 Medium Preset AF:4x | |
| Dell XPS 13 9360 FHD i7 Iris | |
| Microsoft Surface Laptop i7 | |
| 1280x720 Ultra Low Preset | |
| Microsoft Surface Laptop i7 | |
| Dell XPS 13 9360 FHD i7 Iris | |
| Team Fortress 2 | |
| 1920x1080 maximum AA:8x MS AF:16x | |
| Microsoft Surface Laptop i7 | |
| 1920x1080 high AF:16x | |
| Microsoft Surface Laptop i7 | |
| 1366x768 medium AF:4x | |
| Microsoft Surface Laptop i7 | |
| Playerunknown's Battlegrounds (PUBG) - 1280x720 Very Low Preset | |
| Microsoft Surface Laptop i7 | |
| Rocket League | |
| 1920x1080 High Quality AA:High FX | |
| Apple MacBook Pro 13 2017 | |
| Microsoft Surface Pro (2017) i7 | |
| Dell XPS 13 9360 FHD i7 Iris | |
| Microsoft Surface Laptop i7 | |
| 1920x1080 Quality AA:Medium FX | |
| Apple MacBook Pro 13 2017 | |
| Microsoft Surface Pro (2017) i7 | |
| Dell XPS 13 9360 FHD i7 Iris | |
| Microsoft Surface Laptop i7 | |
| 1280x720 Performance | |
| Microsoft Surface Pro (2017) i7 | |
| Apple MacBook Pro 13 2017 | |
| Microsoft Surface Laptop i7 | |
| Dell XPS 13 9360 FHD i7 Iris | |
| Titanfall 2 | |
| 1920x1080 High / Enabled AA:TS AF:8x | |
| Apple MacBook Pro 13 2017 | |
| 1366x768 Medium / Disabled AF:4x | |
| Apple MacBook Pro 13 2017 | |
| 1280x720 Low / Disabled AF:Trilinear | |
| Microsoft Surface Laptop i7 | |
| Apple MacBook Pro 13 2017 | |
| Dota 2 Reborn | |
| 1920x1080 ultra (3/3) best looking | |
| Microsoft Surface Laptop i7 | |
| Microsoft Surface Pro (2017) i7 | |
| 1920x1080 high (2/3) | |
| Microsoft Surface Pro (2017) i7 | |
| Microsoft Surface Laptop i7 | |
| 1366x768 med (1/3) | |
| Microsoft Surface Pro (2017) i7 | |
| Microsoft Surface Laptop i7 | |
| 1280x720 min (0/3) fastest | |
| Microsoft Surface Pro (2017) i7 | |
| Microsoft Surface Laptop i7 | |
| Battlefield 1 | |
| 1920x1080 High Preset AA:T | |
| Apple MacBook Pro 13 2017 | |
| Microsoft Surface Pro (2017) i7 | |
| 1366x768 Medium Preset AA:FX | |
| Apple MacBook Pro 13 2017 | |
| Microsoft Surface Pro (2017) i7 | |
| 1280x720 Low Preset | |
| Apple MacBook Pro 13 2017 | |
| Microsoft Surface Laptop i7 | |
| Microsoft Surface Pro (2017) i7 | |
| The Witcher 3 | |
| 1920x1080 Ultra Graphics & Postprocessing (HBAO+) | |
| Apple MacBook Pro 13 2017 | |
| 1366x768 Medium Graphics & Postprocessing | |
| Apple MacBook Pro 13 2017 | |
| 1024x768 Low Graphics & Postprocessing | |
| Microsoft Surface Pro (2017) i7 | |
| Apple MacBook Pro 13 2017 | |
| Dell XPS 13 9360 FHD i7 Iris | |
| Microsoft Surface Laptop i7 | |
| Sims 4 | |
| 1920x1080 Ultra Preset | |
| Microsoft Surface Pro (2017) i7 | |
| Microsoft Surface Laptop i7 | |
| 1920x1080 High Preset | |
| Microsoft Surface Laptop i7 | |
| Diablo III - 1920x1080 High AA:on | |
| Microsoft Surface Laptop i7 | |
| World of Warcraft - 1280x1024 high | |
| Microsoft Surface Laptop i7 | |
| low | med. | high | ultra | |
|---|---|---|---|---|
| World of Warcraft (2005) | 28.5 | |||
| Diablo III (2012) | 35.2 | |||
| Sims 4 (2014) | 28.6 | 20.2 | ||
| The Witcher 3 (2015) | 16.4 | |||
| Dota 2 Reborn (2015) | 68 | 55 | 27.6 | 23 |
| Overwatch (2016) | 53.6 | 24.1 | ||
| Battlefield 1 (2016) | 29.2 | |||
| Titanfall 2 (2016) | 45 | |||
| Rocket League (2017) | 96 | 33.9 | 24.9 | |
| Team Fortress 2 (2017) | 99 | 48 | 31.8 | |
| Playerunknown's Battlegrounds (PUBG) (2017) | 22.9 | |||
| F1 2017 (2017) | 38 | 15 | ||
| FIFA 18 (2017) | 69 (some slowdowns in game) | 38 (some slowdowns in game) | ||
| Middle-earth: Shadow of War (2017) | 28 | |||
| The Evil Within 2 (2017) | 13.8 |
Emissions
System Noise
At idle or under low load, e.g. surfing the web or editing text documents, the Surface Laptop i7 is almost silent. However, under full load, the fan is clearly audible and is about 10% louder than the less powerful Surface Laptop i5. This is due to the i7 processor, which produces more heat than the i5; the fan has to run at a higher speed to dissipate the heat away from the CPU. One big drawback of our test device is the relatively loud and annoying coil whine, which can be perceived even at zero load.
Noise level
| Idle |
| 30.9 / 30.9 / 30.9 dB(A) |
| Load |
| 40.2 / 40.2 dB(A) |
 | ||
30 dB silent 40 dB(A) audible 50 dB(A) loud |
||
min: | ||
Temperature
As with the Surface Laptop i5, the temperature difference between the upper side and the underside of the i7-based laptop is quite striking, especially so in the area of the wrist rest. Here we have measured a difference of 10 degrees Celsius (~18 degrees Fahrenheit). The temperature levels off in the keyboard area, though.
(+) The maximum temperature on the upper side is 37 °C / 99 F, compared to the average of 35.9 °C / 97 F, ranging from 21.4 to 59 °C for the class Subnotebook.
(±) The bottom heats up to a maximum of 40 °C / 104 F, compared to the average of 39.2 °C / 103 F
(+) In idle usage, the average temperature for the upper side is 25.4 °C / 78 F, compared to the device average of 30.8 °C / 87 F.
(+) The palmrests and touchpad are cooler than skin temperature with a maximum of 30 °C / 86 F and are therefore cool to the touch.
(±) The average temperature of the palmrest area of similar devices was 28.2 °C / 82.8 F (-1.8 °C / -3.2 F).
Speakers
Due to the identical construction design, there are no big differences between the Microsoft Surface Laptop i5 and its i7 counterpart in terms of the sound quality. The so-called “OmniSonic” stereo speakers are located beneath the keyboard. There are no holes or slits that are provided for them. But because the sound quality remains at a high level, we consider this solution to be optimal (speaker openings covered with grills in the area of the keyboard tend to turn into unsightly dust catchers over time).
Microsoft Surface Laptop i7 audio analysis
(±) | speaker loudness is average but good (78 dB)
Bass 100 - 315 Hz
(±) | reduced bass - on average 7.7% lower than median
(-) | bass is not linear (15.9% delta to prev. frequency)
Mids 400 - 2000 Hz
(+) | balanced mids - only 3.8% away from median
(+) | mids are linear (4.6% delta to prev. frequency)
Highs 2 - 16 kHz
(+) | balanced highs - only 1.6% away from median
(+) | highs are linear (4.4% delta to prev. frequency)
Overall 100 - 16.000 Hz
(+) | overall sound is linear (11.9% difference to median)
Compared to same class
» 13% of all tested devices in this class were better, 5% similar, 82% worse
» The best had a delta of 5%, average was 18%, worst was 53%
Compared to all devices tested
» 9% of all tested devices were better, 2% similar, 89% worse
» The best had a delta of 4%, average was 23%, worst was 134%
Microsoft Surface Laptop i5 audio analysis
(-) | not very loud speakers (64.6 dB)
Bass 100 - 315 Hz
(±) | reduced bass - on average 7.1% lower than median
(±) | linearity of bass is average (11.8% delta to prev. frequency)
Mids 400 - 2000 Hz
(+) | balanced mids - only 4.1% away from median
(+) | mids are linear (5.6% delta to prev. frequency)
Highs 2 - 16 kHz
(+) | balanced highs - only 1.2% away from median
(+) | highs are linear (4.7% delta to prev. frequency)
Overall 100 - 16.000 Hz
(±) | linearity of overall sound is average (15.6% difference to median)
Compared to same class
» 36% of all tested devices in this class were better, 5% similar, 58% worse
» The best had a delta of 5%, average was 18%, worst was 53%
Compared to all devices tested
» 23% of all tested devices were better, 5% similar, 72% worse
» The best had a delta of 4%, average was 23%, worst was 134%
Apple MacBook Pro 13 2017 Touchbar i5 audio analysis
(+) | speakers can play relatively loud (86.2 dB)
Bass 100 - 315 Hz
(±) | reduced bass - on average 11.5% lower than median
(±) | linearity of bass is average (10.8% delta to prev. frequency)
Mids 400 - 2000 Hz
(±) | higher mids - on average 5.2% higher than median
(+) | mids are linear (6.4% delta to prev. frequency)
Highs 2 - 16 kHz
(+) | balanced highs - only 2.2% away from median
(+) | highs are linear (5.7% delta to prev. frequency)
Overall 100 - 16.000 Hz
(+) | overall sound is linear (11.9% difference to median)
Compared to same class
» 13% of all tested devices in this class were better, 5% similar, 82% worse
» The best had a delta of 5%, average was 18%, worst was 53%
Compared to all devices tested
» 9% of all tested devices were better, 2% similar, 89% worse
» The best had a delta of 4%, average was 23%, worst was 134%
Frequency diagram in comparison (checkboxes can be selected/unselected!)
Energy Management
Power Consumption
While idling, the Microsoft Surface i7’s energy consumption is very close to that of the Surface Laptop i5. Under full load, the more capable i7 CPU draws 25 % more power. On a positive note, Microsoft has managed to reduce the energy consumption of the Microsoft Surface i7 at idle as compared to the Surface Pro, which has the same CPU. However, it bears repeating that when we were reviewing the Surface Pro we had found that its energy consumption was well above what we saw from its competitors.
| Off / Standby | |
| Idle | |
| Load |
|
Key:
min: | |
| Microsoft Surface Laptop i7 i7-7660U, Iris Plus Graphics 640, Samsung PM971 KUS040202M, IPS, 2256x1504, 13.5" | Microsoft Surface Laptop i5 i5-7200U, HD Graphics 620, Toshiba THNSN0128GTYA, IPS, 2256x1504, 13.5" | Dell XPS 13 9360 FHD i7 Iris i7-7560U, Iris Plus Graphics 640, Toshiba XG4 NVMe (THNSN5512GPUK), IPS, 1920x1080, 13.3" | Microsoft Surface Pro (2017) i7 i7-7660U, Iris Plus Graphics 640, Samsung PM971 KUS040202M, IPS, 2736x1824, 12.3" | Apple MacBook Pro 13 2017 i5-7360U, Iris Plus Graphics 640, Apple SSD AP0128, IPS, 2560x1600, 13.3" | |
|---|---|---|---|---|---|
| Power Consumption | 9% | 6% | -28% | -7% | |
| Idle Minimum * (Watt) | 2.7 | 3.2 -19% | 3.32 -23% | 4.2 -56% | 3.7 -37% |
| Idle Average * (Watt) | 7.6 | 6.5 14% | 5.27 31% | 10.1 -33% | 5.2 32% |
| Idle Maximum * (Watt) | 7.8 | 6.8 13% | 6.32 19% | 14 -79% | 7.6 3% |
| Load Average * (Watt) | 37.5 | 28.2 25% | 32 15% | 37.4 -0% | 41.6 -11% |
| Witcher 3 ultra * (Watt) | 31.7 | 38.1 -20% | |||
| Load Maximum * (Watt) | 41.6 | 36 13% | 45.9 -10% | 34 18% | 50.5 -21% |
* ... smaller is better
Battery Life
As far as battery life goes, the Surface Laptop i7, with the Wi-Fi turned on and under full load, behaves very similarly to the Surface Pro (2017), just as we expected. When playing back video, the i7-based laptop lasts longer than the Surface Pro or the MacBook Pro 13, although it cannot reach the same stellar battery runtimes as the Dell XPS 13.
| Microsoft Surface Laptop i7 i7-7660U, Iris Plus Graphics 640, 45 Wh | Microsoft Surface Laptop i5 i5-7200U, HD Graphics 620, 45 Wh | Dell XPS 13 9360 FHD i7 Iris i7-7560U, Iris Plus Graphics 640, 60 Wh | Microsoft Surface Pro (2017) i7 i7-7660U, Iris Plus Graphics 640, 45 Wh | Apple MacBook Pro 13 2017 i5-7360U, Iris Plus Graphics 640, 54.5 Wh | |
|---|---|---|---|---|---|
| Battery runtime | 22% | 32% | -4% | 2% | |
| H.264 (h) | 12.8 | 15 17% | 10.2 -20% | 11.4 -11% | |
| WiFi v1.3 (h) | 7.6 | 10 32% | 10.9 43% | 8.2 8% | 11.4 50% |
| Load (h) | 1.9 | 2.1 11% | 2.6 37% | 1.9 0% | 1.3 -32% |
| Reader / Idle (h) | 22.5 | 25.4 | |||
| Witcher 3 ultra (h) | 1.9 |
Verdict
Pros
Cons
It does not come easy for us to draw a definitive conclusion about the Microsoft Surface Laptop i7. The Intel Core i7-7660U is and remains a double-edged sword. On the one hand, we have the disappointing results with the Turbo performance, and it appears as though Microsoft has learned nothing from the mistakes of the past which it made with the Surface Pro i7 (2017).
On account of the throttling, the higher Turbo frequency of the Intel Core i7-7660U cannot be fully utilized under continuous load. In terms of price, one must pay a premium of 350 Euros (~$407) for the i7 over the i5-7200U.
On the other hand, the first drawback is cancelled out; let it be known that the i7 is not the only contributor to the price. One must also take into account the significantly faster SSD and the Iris Plus Graphics 640 GPU, which is integrated into the Intel Core i7-7660U. This is the time and the place to criticize the sluggish SSD from Toshiba in the i5 model and to praise the fast Samsung SSD in the i7 laptop. The more powerful Iris Plus Graphics 640 is, by all means, the better solution for graphics-intensive applications, although this does not turn the i7-based Surface Laptop into a gaming notebook.
As is the case with the i5 model, the i7 variant is also missing a USB Type-C port and an SD card reader, even if these things are not front of mind for every buyer. The Alcantara surface material does not play a decision-making role either, although it is a nice change compared to the usual plastic surfaces. There is nothing bad to say about the build quality, and the case is also of high quality. It leaves a very good general impression. The mobility can also be described as very good, thanks to the long battery life. With the Surface laptops, Microsoft targets students, who should have no trouble getting through a day at college with the more affordable i5 model.
In conclusion, the initial question is still open, whether getting a Surface Laptop i7 is advisable. In our view, the only point of criticism are the constantly mentioned performance drops that occur after a few minutes in Turbo mode. Despite all that, the i7 laptop still remains a faster device with better CPU and GPU performance, even during the throttling. Taking the faster Samsung SSD into account, the decision to get a Surface Laptop i7 seems absolutely reasonable.
Microsoft Surface Laptop i7
- 10/24/2017 v6 (old)
Klaus Hinum, Daniel Puschina