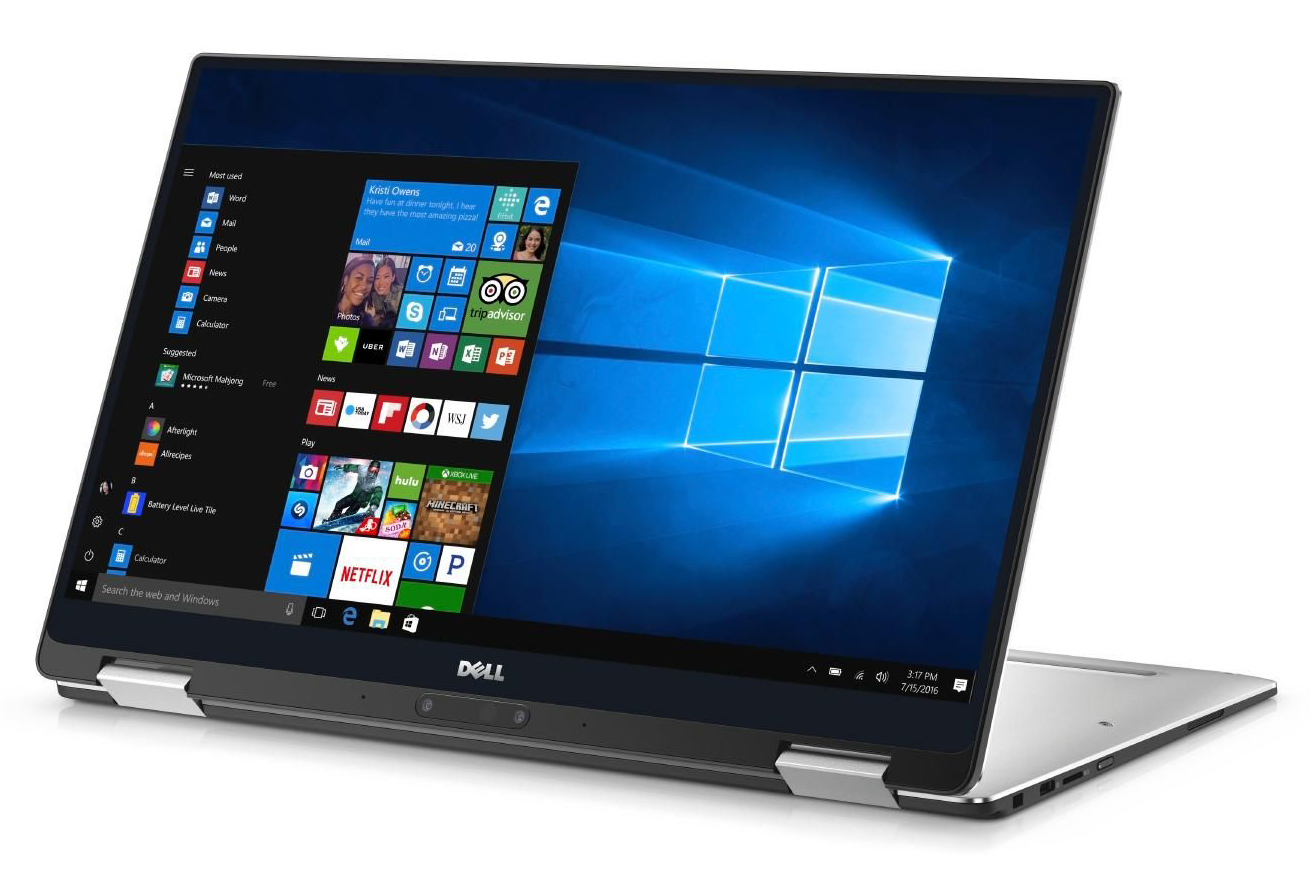
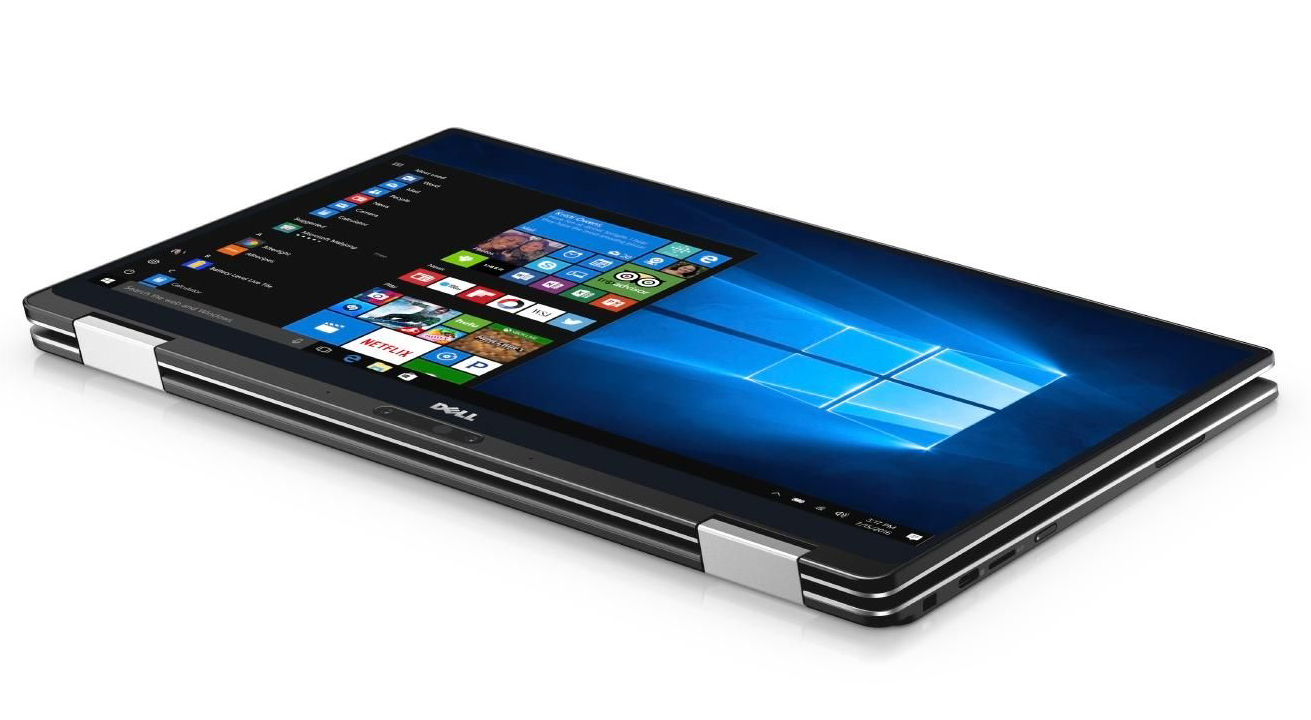
Dell XPS 13 9365 (7Y54, QHD+) Convertible Review
For the original German version, see here.
The Dell XPS 13 9365 is not unknown to us. We have already tested a model that is equipped with a Core i7-7Y75 processor and a Full HD display. Our current test unit offers a Core i5-7Y54 processor and a QHD+ screen. The competitors of the convertible include devices such as the Lenovo Yoga 910-13IKB and the HP Spectre x360 13.
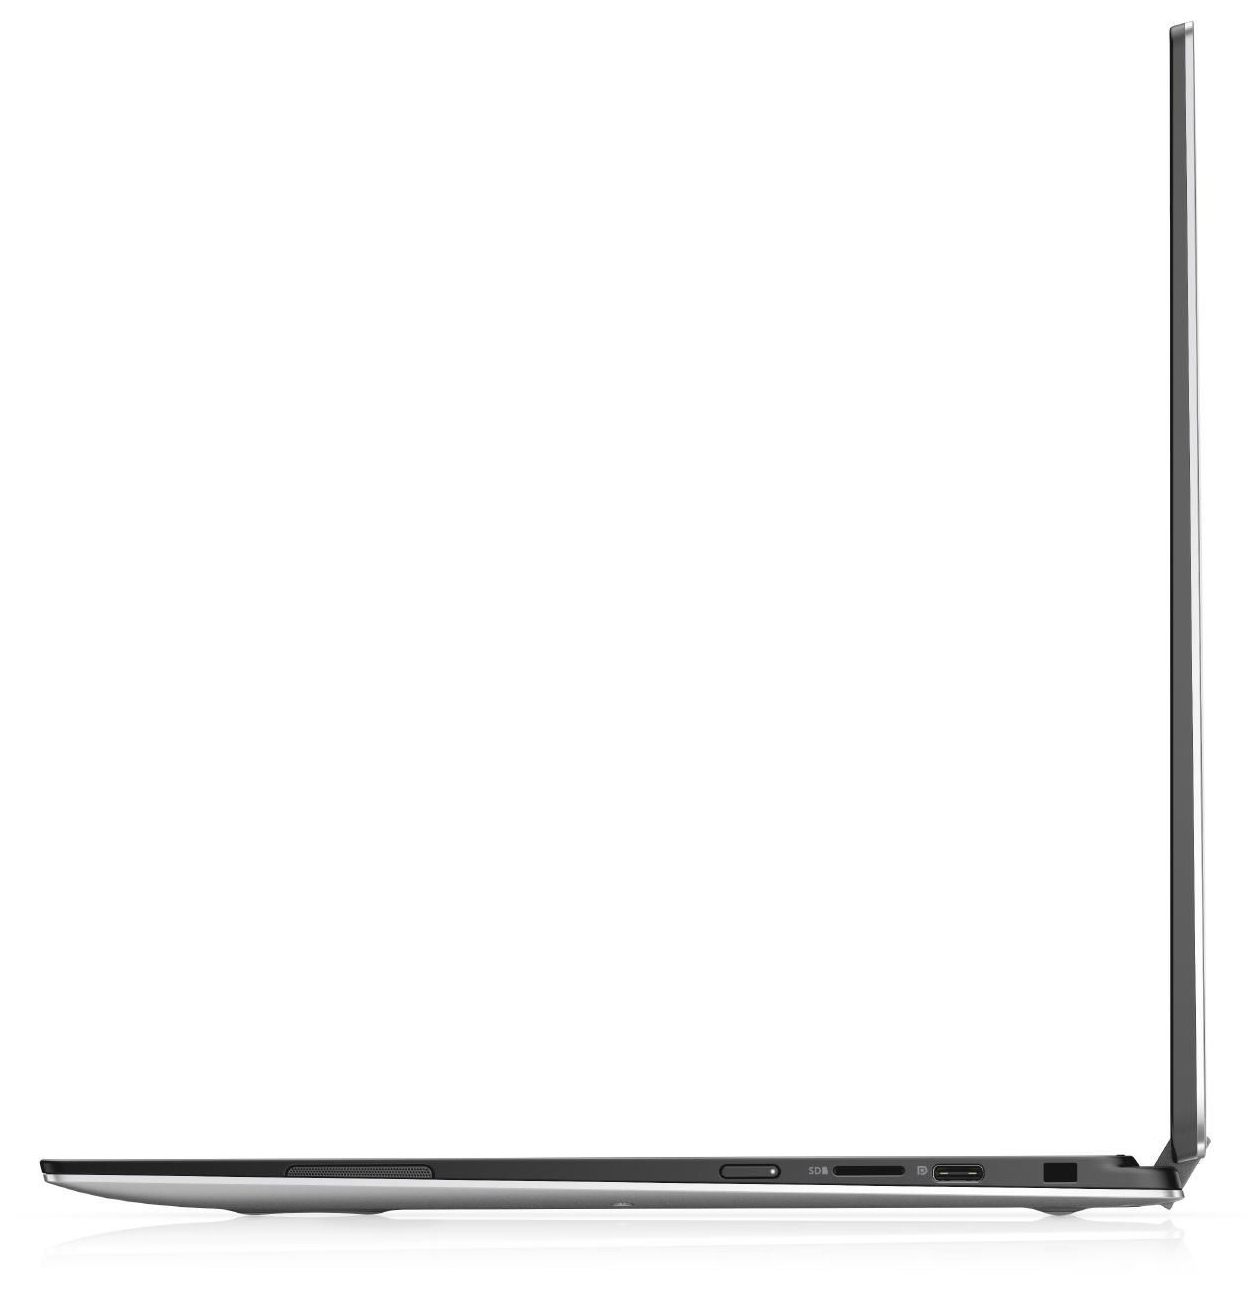
Since both of the XPS-13 models have a similar build, we will not discuss the case, features, input devices, and speakers again here. That information can be found in the review of the Full HD model of the XPS 13.
| Networking | |
| iperf3 transmit AX12 | |
| Dell XPS 13-9365 2-in-1 | |
| HP Spectre x360 13-ac033dx | |
| Dell XPS 13 9365-4537 2-in-1 | |
| iperf3 receive AX12 | |
| HP Spectre x360 13-ac033dx | |
| Dell XPS 13-9365 2-in-1 | |
| Dell XPS 13 9365-4537 2-in-1 | |
Display
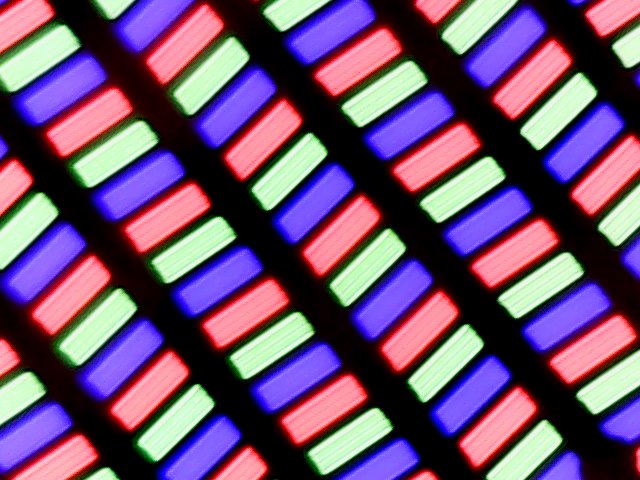
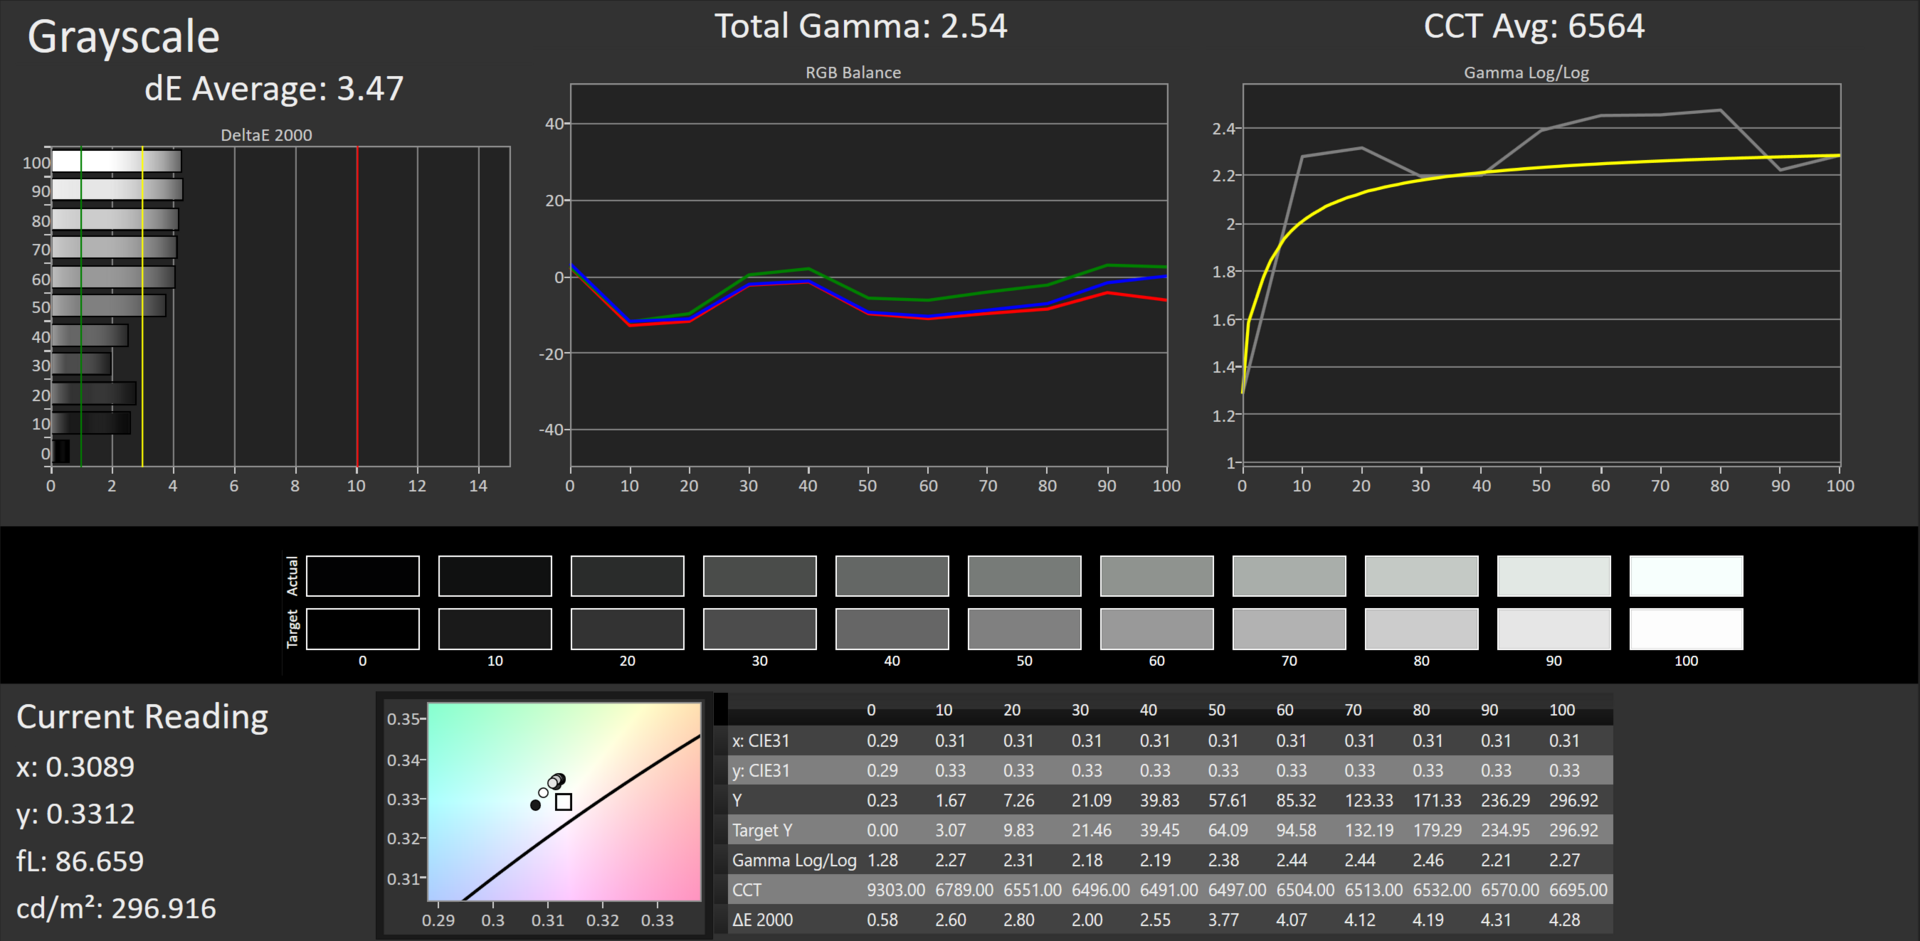
The 13.3-inch touchscreen display of the XPS 13 works with a native resolution of 3200x1800 pixels. The brightness (306.4 cd/m2) and contrast (1740:1) of the screen turn out very good. The Full HD display that is also available offers almost identical values. Positive: at no time does the QHD+ display show any PWM flickering. In the Full HD model, however, it is a different story.
| |||||||||||||||||||||||||
Brightness Distribution: 78 %
Center on Battery: 348 cd/m²
Contrast: 1740:1 (Black: 0.2 cd/m²)
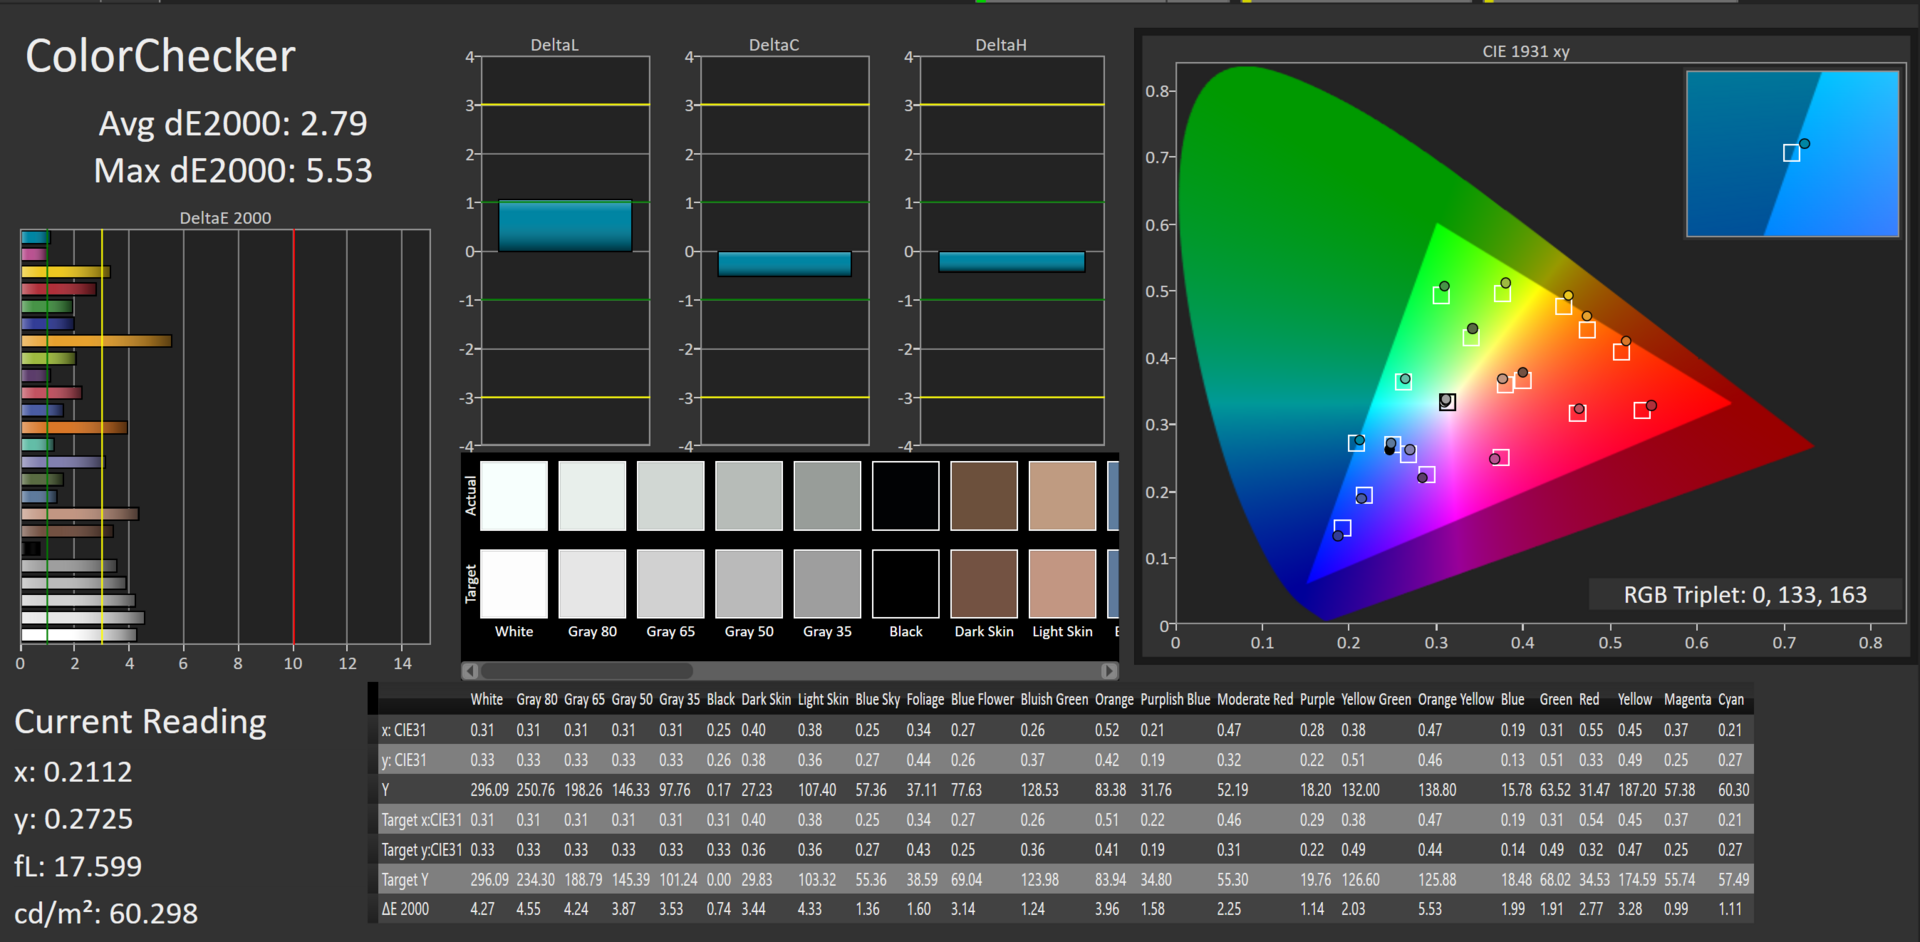
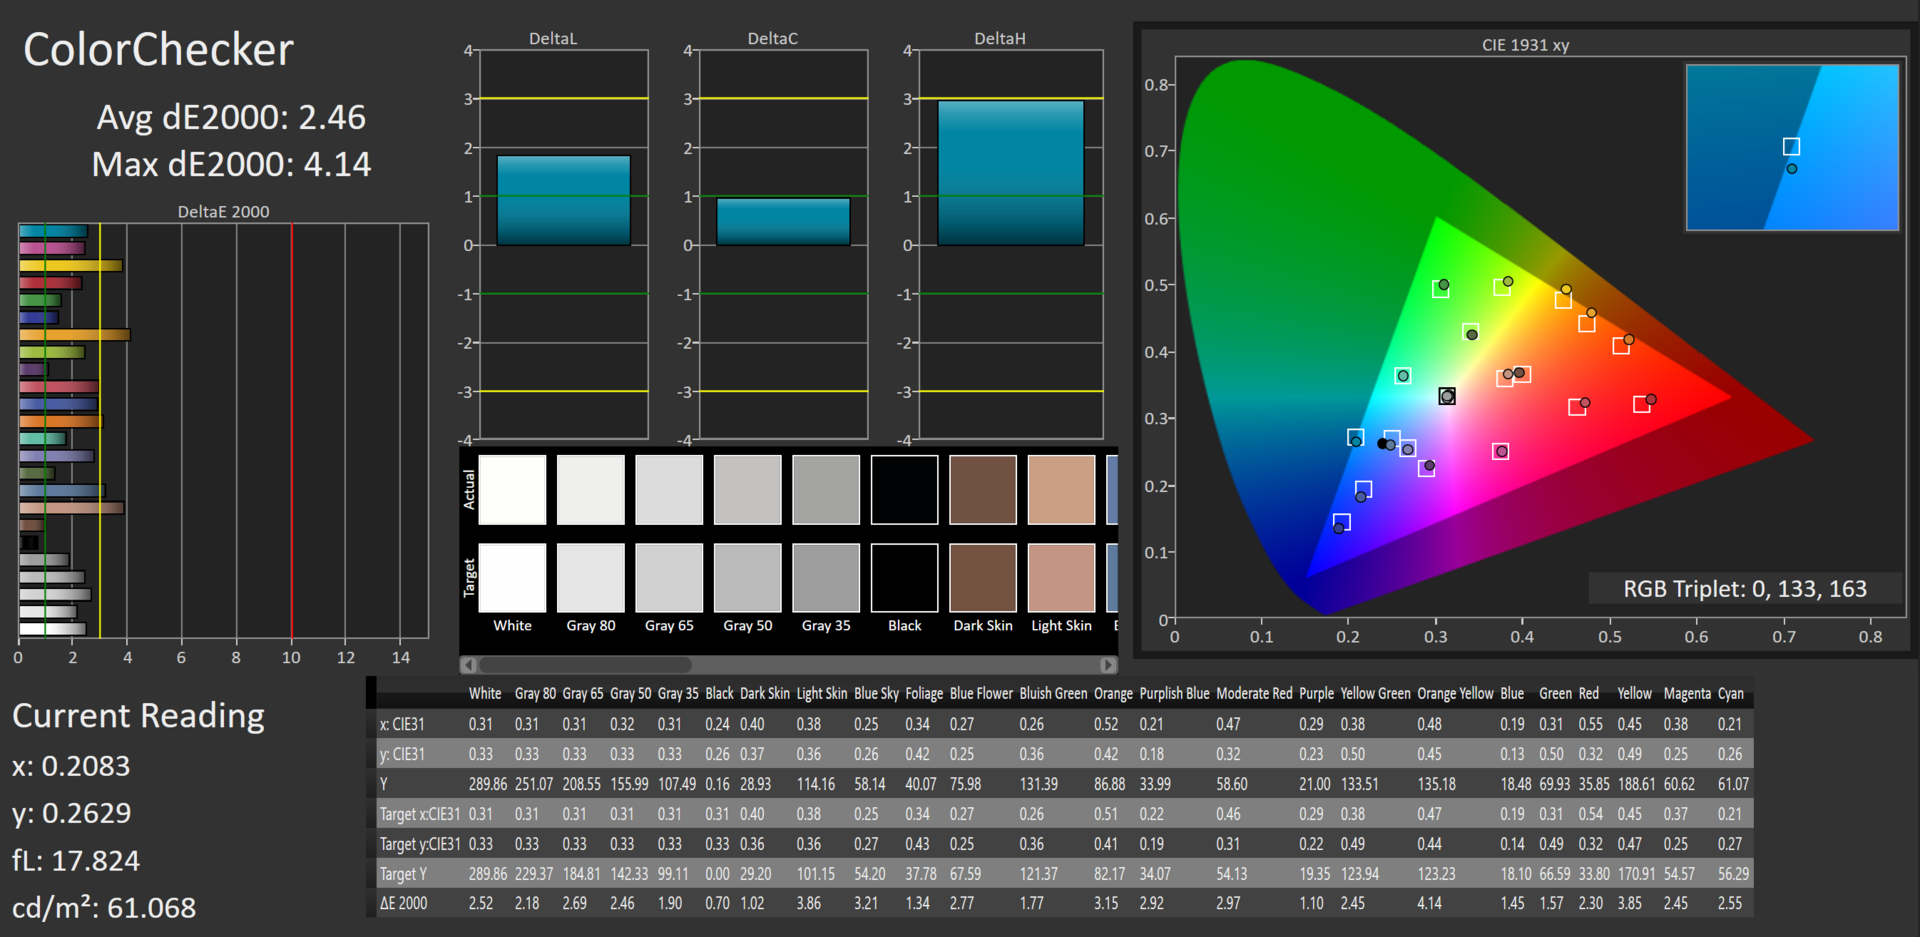
ΔE ColorChecker Calman: 2.79 | ∀{0.5-29.43 Ø4.73}
ΔE Greyscale Calman: 3.47 | ∀{0.09-98 Ø4.97}
93% sRGB (Argyll 1.6.3 3D)
60% AdobeRGB 1998 (Argyll 1.6.3 3D)
66.1% AdobeRGB 1998 (Argyll 3D)
92.9% sRGB (Argyll 3D)
64.4% Display P3 (Argyll 3D)
Gamma: 2.54
CCT: 6564 K
| Dell XPS 13 9365-4537 2-in-1 IPS, 3200x1800, 13.3" | Dell XPS 13-9365 2-in-1 IPS, 1920x1080, 13.3" | HP Spectre x360 13-ac033dx IPS, 3840x2160, 13.3" | Lenovo Yoga 910-13IKB-80VF004CGE IPS, 3840x2160, 13.9" | |
|---|---|---|---|---|
| Display | -25% | 7% | -3% | |
| Display P3 Coverage (%) | 64.4 | 47.32 -27% | 69.4 8% | 62.2 -3% |
| sRGB Coverage (%) | 92.9 | 71.1 -23% | 96.8 4% | 90.1 -3% |
| AdobeRGB 1998 Coverage (%) | 66.1 | 48.83 -26% | 71.1 8% | 63.5 -4% |
| Response Times | -9% | -1% | 9% | |
| Response Time Grey 50% / Grey 80% * (ms) | 48 ? | 48 ? -0% | 42 ? 12% | 46 ? 4% |
| Response Time Black / White * (ms) | 28 ? | 32.8 ? -17% | 32 ? -14% | 24 ? 14% |
| PWM Frequency (Hz) | 1042 ? | |||
| Screen | -44% | -1% | -51% | |
| Brightness middle (cd/m²) | 348 | 322.6 -7% | 302.6 -13% | 348 0% |
| Brightness (cd/m²) | 306 | 306 0% | 282 -8% | 310 1% |
| Brightness Distribution (%) | 78 | 91 17% | 83 6% | 80 3% |
| Black Level * (cd/m²) | 0.2 | 0.19 5% | 0.25 -25% | 0.25 -25% |
| Contrast (:1) | 1740 | 1698 -2% | 1210 -30% | 1392 -20% |
| Colorchecker dE 2000 * | 2.79 | 7.7 -176% | 2.4 14% | 7.86 -182% |
| Colorchecker dE 2000 max. * | 5.53 | 11.1 -101% | 4.9 11% | 13.43 -143% |
| Greyscale dE 2000 * | 3.47 | 7.9 -128% | 2.8 19% | 8.25 -138% |
| Gamma | 2.54 87% | 2.88 76% | 2.2 100% | 2.05 107% |
| CCT | 6564 99% | 7044 92% | 6333 103% | 6834 95% |
| Color Space (Percent of AdobeRGB 1998) (%) | 60 | 44.1 -26% | 65.5 9% | 58 -3% |
| Color Space (Percent of sRGB) (%) | 93 | 69.9 -25% | 97.1 4% | 90 -3% |
| Total Average (Program / Settings) | -26% /
-36% | 2% /
0% | -15% /
-33% |
* ... smaller is better
Screen Flickering / PWM (Pulse-Width Modulation)
| Screen flickering / PWM not detected | ||
In comparison: 52 % of all tested devices do not use PWM to dim the display. If PWM was detected, an average of 7791 (minimum: 5 - maximum: 343500) Hz was measured. | ||
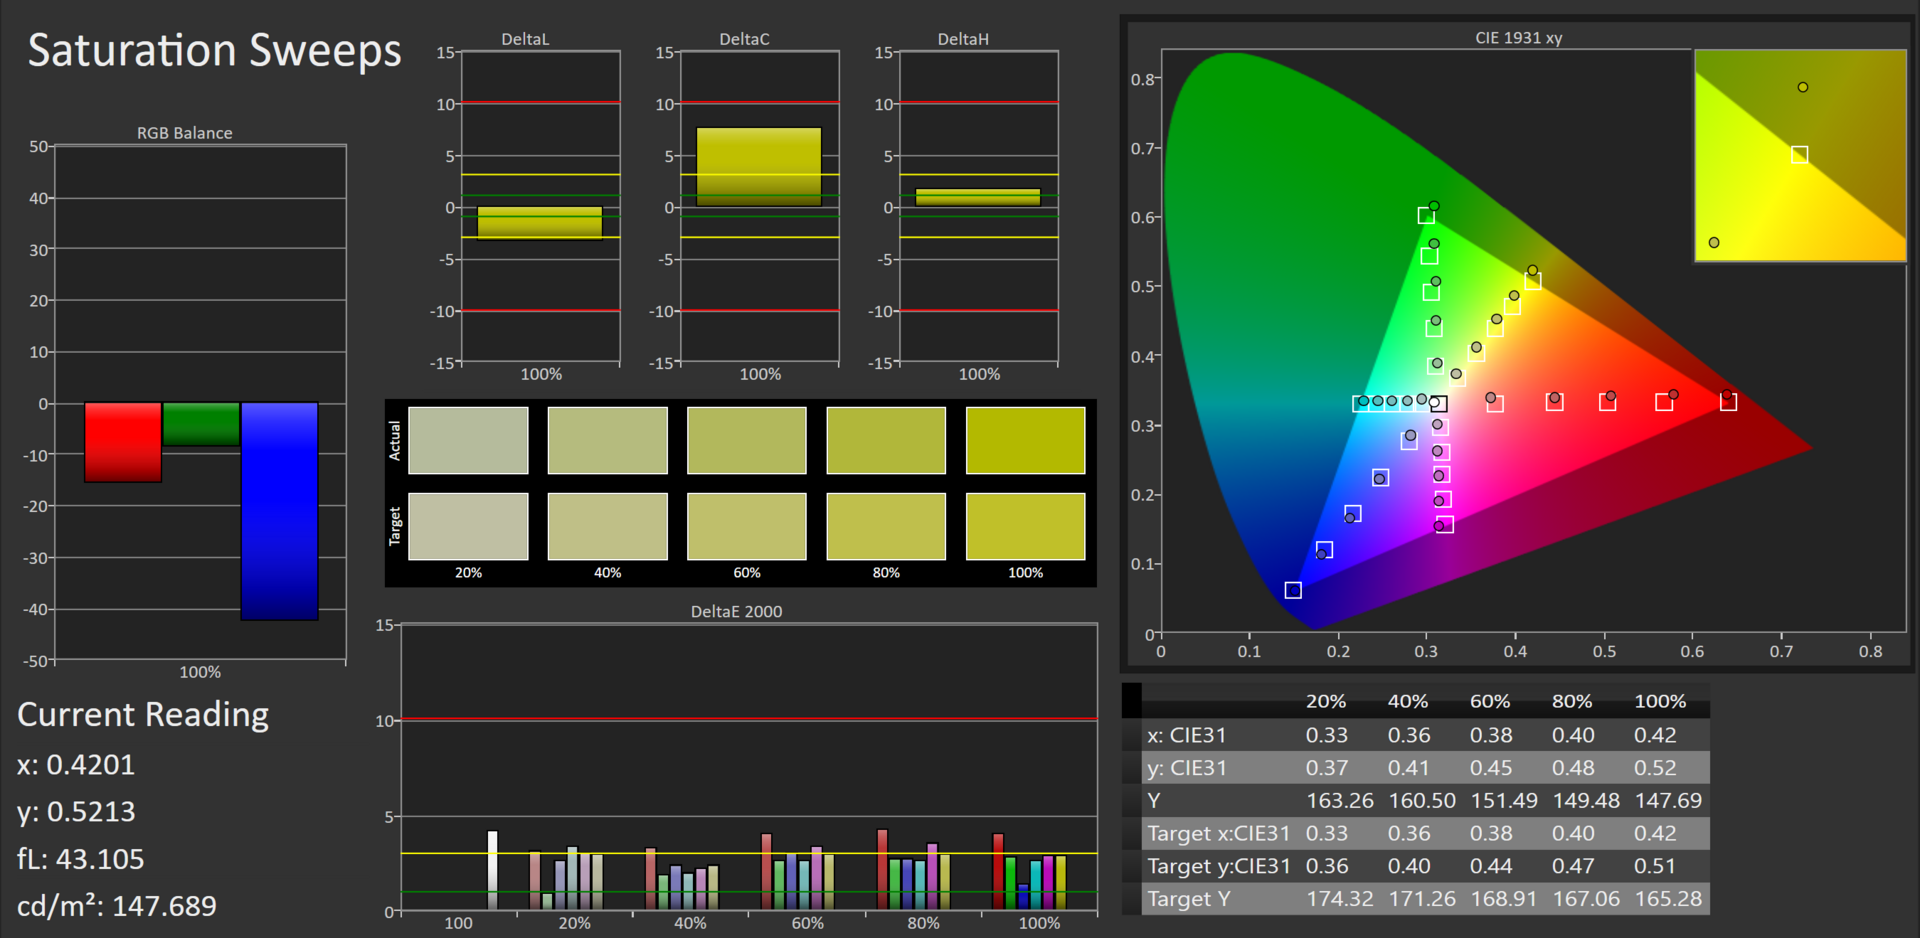
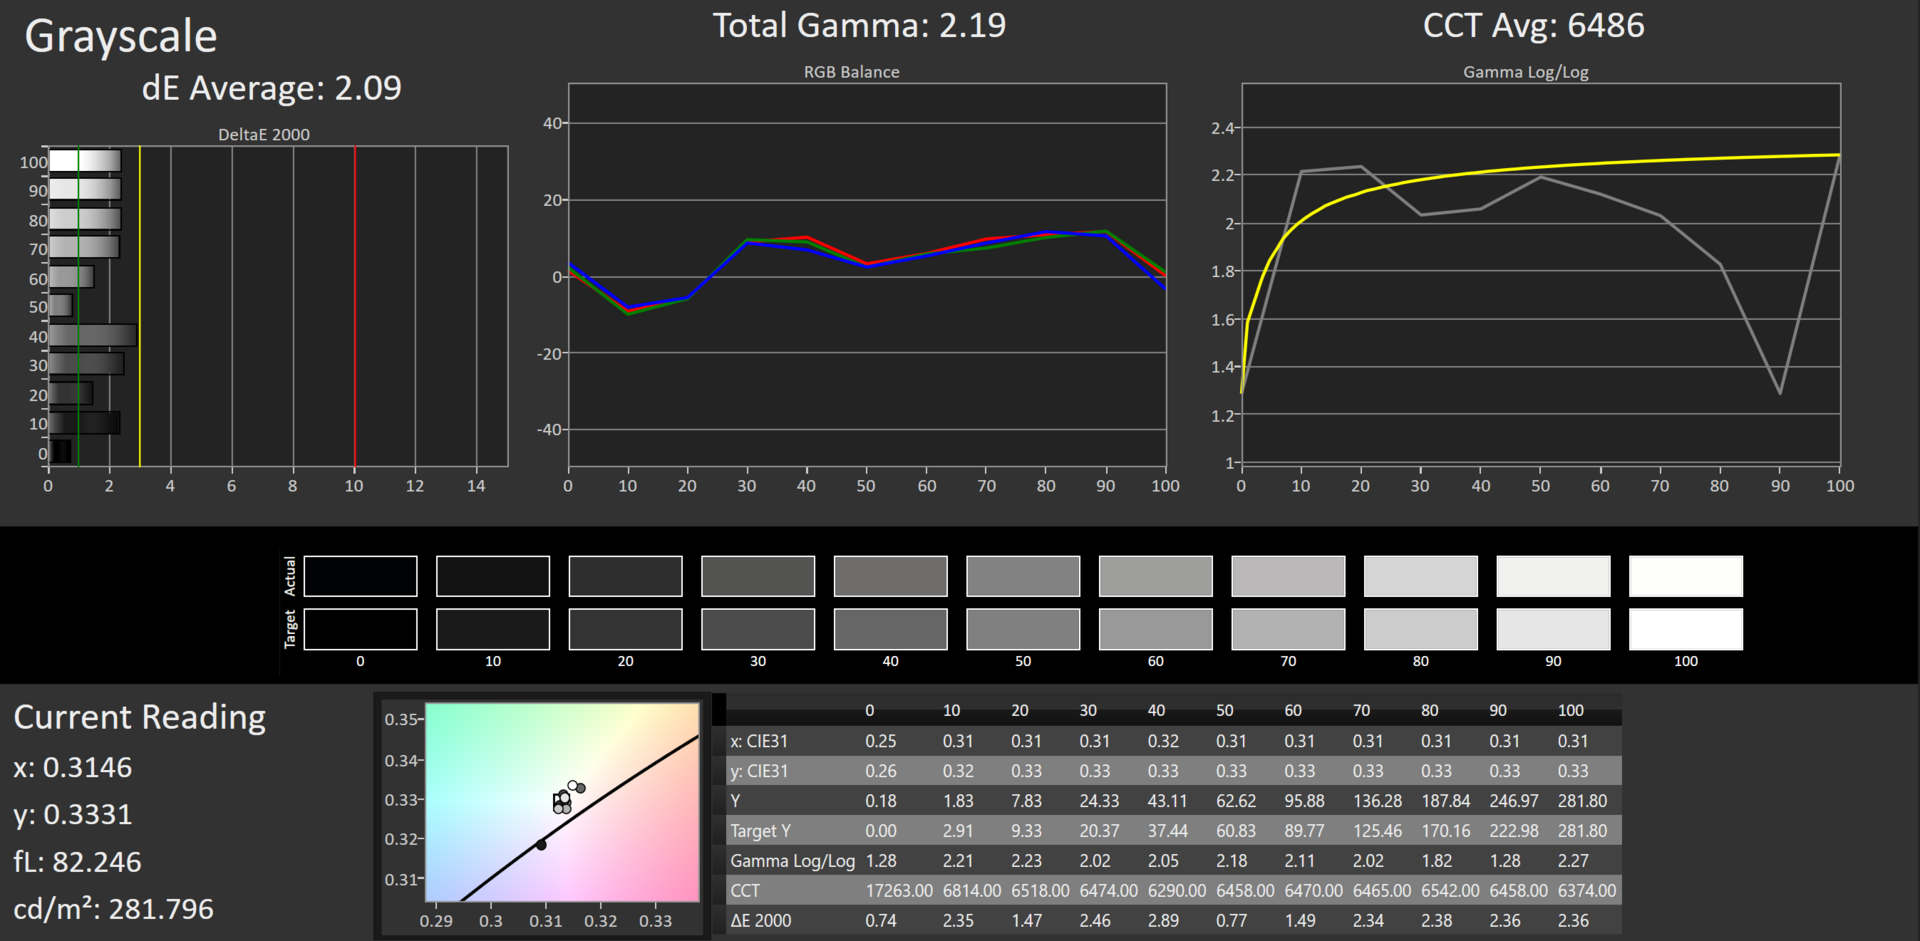
The display already shows a good color presentation in the state of delivery. With a DeltaE-2000 color deviation of 2.79, it completely fulfills the requirements. The display does not suffer from a blue tint. It can be only minimally improved via calibration. Not only does the QHD+ display offer a higher color accuracy than the Full HD model, but also a better color space coverage.

Display Response Times
| ↔ Response Time Black to White | ||
|---|---|---|
| 28 ms ... rise ↗ and fall ↘ combined | ↗ 16 ms rise | 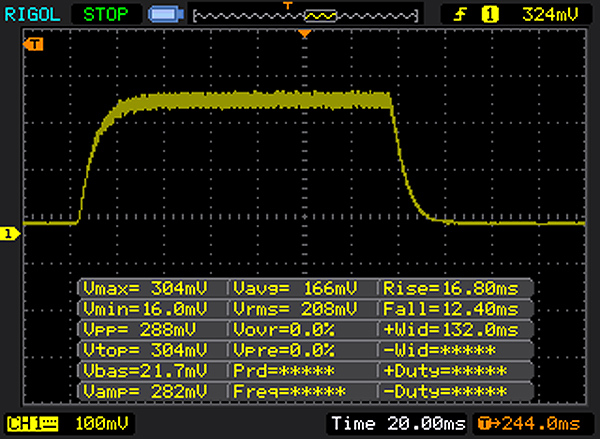 |
| ↘ 12 ms fall | ||
| The screen shows relatively slow response rates in our tests and may be too slow for gamers. In comparison, all tested devices range from 0.1 (minimum) to 240 (maximum) ms. » 71 % of all devices are better. This means that the measured response time is worse than the average of all tested devices (19.9 ms). | ||
| ↔ Response Time 50% Grey to 80% Grey | ||
| 48 ms ... rise ↗ and fall ↘ combined | ↗ 26 ms rise | 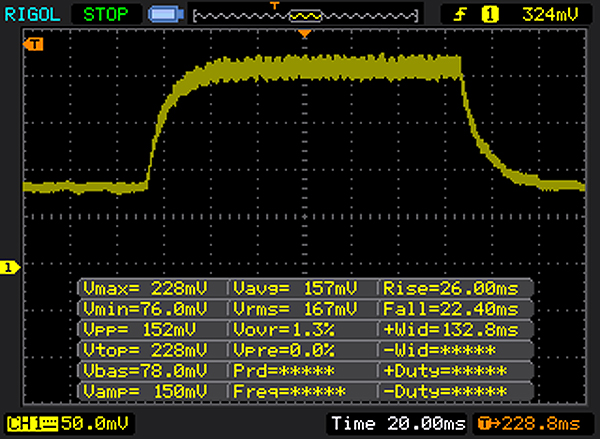 |
| ↘ 22 ms fall | ||
| The screen shows slow response rates in our tests and will be unsatisfactory for gamers. In comparison, all tested devices range from 0.165 (minimum) to 636 (maximum) ms. » 82 % of all devices are better. This means that the measured response time is worse than the average of all tested devices (31.1 ms). | ||
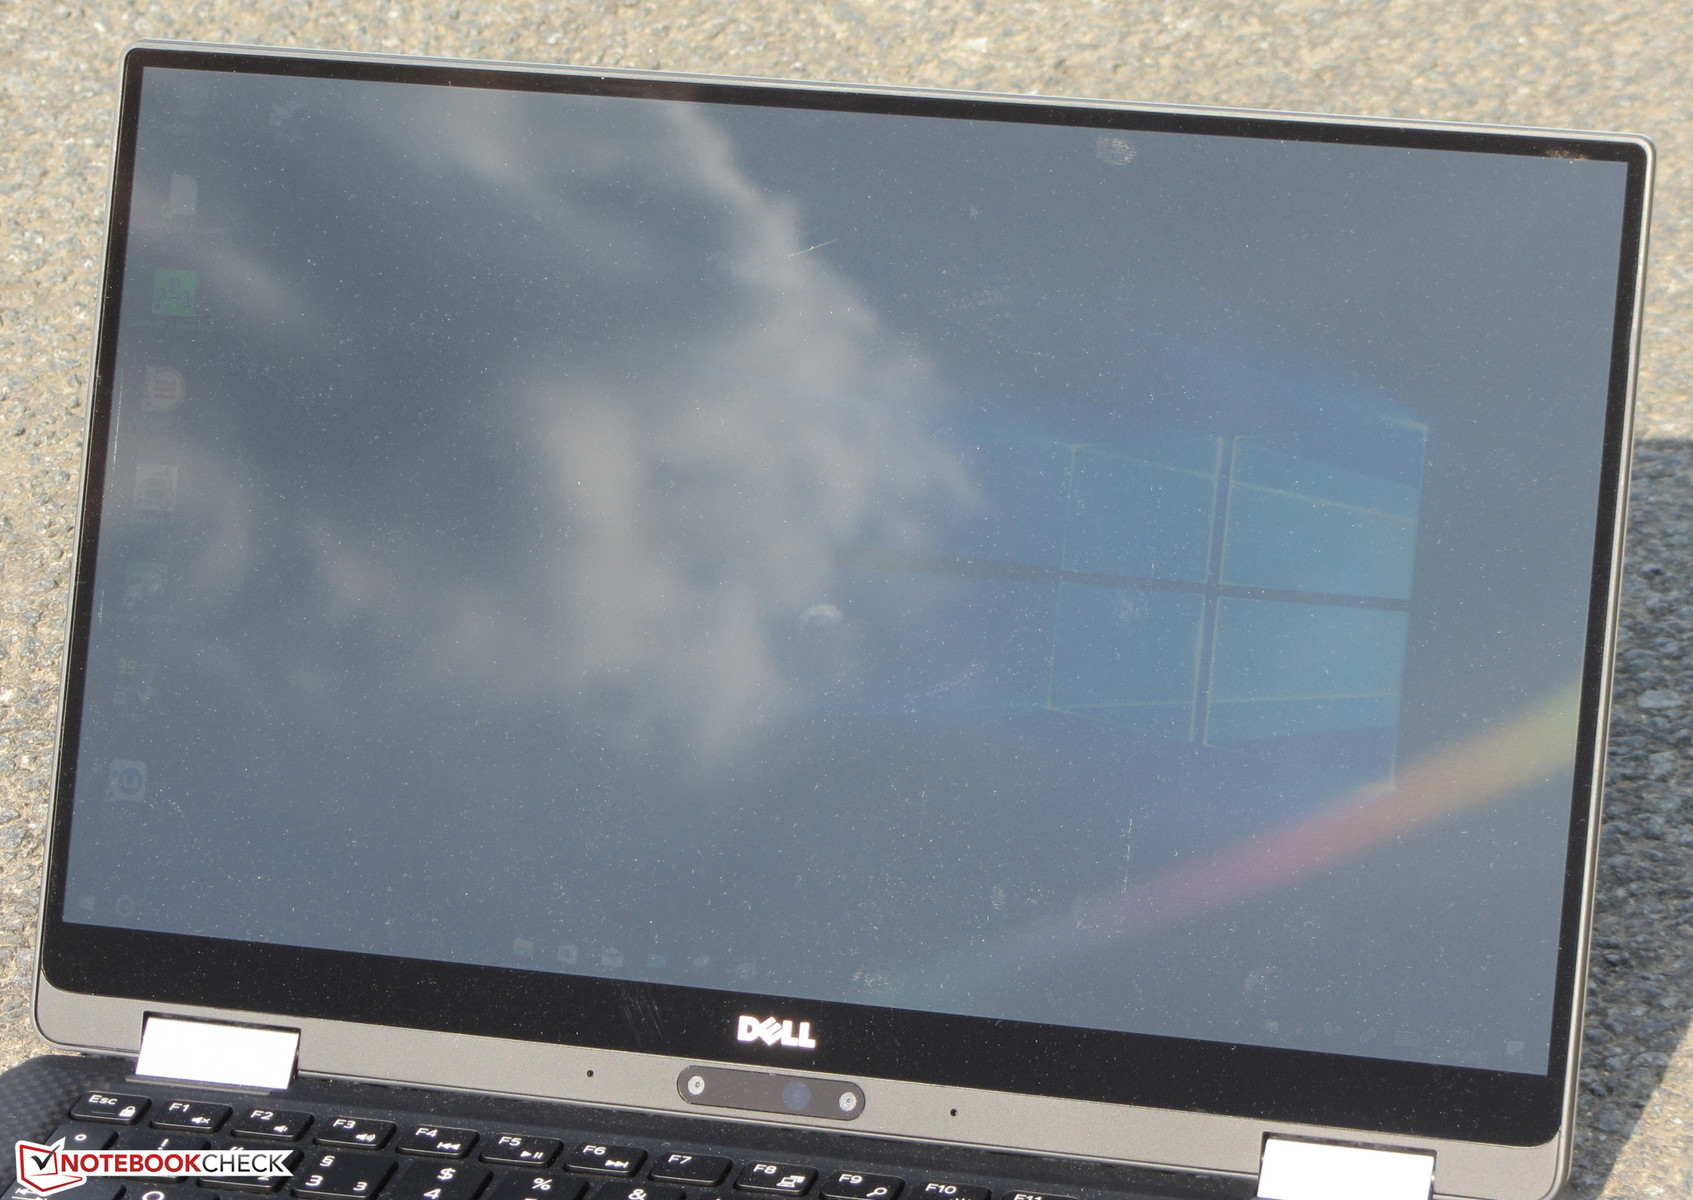
Dell has provided the XPS 13 with an IPS panel that is stable from all viewing angles. Thus the screen can be read from any position. Outdoors, the device can only be used when it is not sunny, since otherwise the reflective display surface will prevent its use.
Performance
With the XPS 13 2-in-1, Dell delivers a very slim convertible in the 13.3-inch format. The built-in CPU offers sufficient computing power for applications in the office and Internet areas. Our test unit can be purchased for about 1650 Euros (~$1850; in the US $1599 from Dell with i7-7Y75, 8 GB RAM, 256 GB SSD). Other feature variants are also available, and prices begin at 1350 Euros (~$1512).
Processor
Dell has equipped the XPS 13 with an Intel Core i5-7Y54 (Kaby Lake) dual-core processor. Thanks to a low TDP of 4.5 watts, the CPU can be cooled passively, which is also done here. The processor operates with a basic speed of 1.2 GHz, which can be increased up to 3.2 GHz via Turbo. The CPU runs through our single thread tests at 2.7 to 2.8 GHz. The processor begins the Multithread tests with constantly fluctuating speeds (400 MHz to 2.8 GHz). After a few seconds, the speed stabilizes at 2.2 to 2.3 GHz and then decreases to 2.1 to 2.2 GHz.
We test whether the Turbo can maintain this level for a prolonged period by running the Cinebench R15 Multithread test in a constant loop for about 30 minutes. From the first to the fifth run, the XPS 13 results decrease by about 20% and then remain constantly at the same level.
| Cinebench R10 | |
| Rendering Multiple CPUs 32Bit | |
| HP Spectre x360 13-ac033dx | |
| Dell XPS 13-9365 2-in-1 | |
| Dell XPS 13 9365-4537 2-in-1 | |
| Rendering Single 32Bit | |
| HP Spectre x360 13-ac033dx | |
| Dell XPS 13-9365 2-in-1 | |
| Dell XPS 13 9365-4537 2-in-1 | |
| Geekbench 3 | |
| 32 Bit Multi-Core Score | |
| Dell XPS 13 9365-4537 2-in-1 | |
| 32 Bit Single-Core Score | |
| Dell XPS 13 9365-4537 2-in-1 | |
| Geekbench 4.0 | |
| 64 Bit Multi-Core Score | |
| Dell XPS 13 9365-4537 2-in-1 | |
| 64 Bit Single-Core Score | |
| Dell XPS 13 9365-4537 2-in-1 | |
| Geekbench 4.4 | |
| 64 Bit Multi-Core Score | |
| Dell XPS 13 9365-4537 2-in-1 | |
| 64 Bit Single-Core Score | |
| Dell XPS 13 9365-4537 2-in-1 | |
| JetStream 1.1 - 1.1 Total | |
| Lenovo Yoga 910-13IKB-80VF004CGE | |
| HP Spectre x360 13-ac033dx | |
| Dell XPS 13 9365-4537 2-in-1 | |
| Dell XPS 13-9365 2-in-1 | |
System Performance
The system runs smoothly and very fast. We did not encounter any problems. The result in the PC Mark 8 benchmark attests that the computer has more than enough power for applications of the office and Internet areas. The result of our current test unit remains below that of the Core-i7 model that we had tested previously. This is not due to the weaker Core-i5 processor, but to the considerably higher display resolution of our current test unit.
| PCMark 8 Home Score Accelerated v2 | 2706 points | |
Help | ||
| PCMark 8 - Home Score Accelerated v2 | |
| Lenovo Yoga 910-13IKB-80VF004CGE | |
| Dell XPS 13-9365 2-in-1 | |
| HP Spectre x360 13-ac033dx | |
| Dell XPS 13 9365-4537 2-in-1 | |
Storage Solution
An M.2-2280 SSD by Toshiba serves as the system drive. It is an NVMe model that offers a total capacity of 256 GB, of which about 200 GB remains usable. The remaining storage space is used up by the recovery partition and the Windows installation. The SSD basically offers very good transfer rates, although we have seen faster NVMe SSDs.

| Dell XPS 13 9365-4537 2-in-1 Toshiba NVMe THNSN5256GPUK | Dell XPS 13-9365 2-in-1 Toshiba NVMe THNSN5256GPUK | HP Spectre x360 13-ac033dx Samsung PM961 NVMe MZVLW512HMJP | Lenovo Yoga 910-13IKB-80VF004CGE Samsung PM951 NVMe MZVLV512 | |
|---|---|---|---|---|
| CrystalDiskMark 3.0 | 31% | 114% | 58% | |
| Read Seq (MB/s) | 1159 | 1206 4% | 2065 78% | 1412 22% |
| Write Seq (MB/s) | 324.1 | 629 94% | 1550 378% | 578 78% |
| Read 512 (MB/s) | 528 | 966 83% | 865 64% | 701 33% |
| Write 512 (MB/s) | 373.7 | 410.7 10% | 1229 229% | 580 55% |
| Read 4k (MB/s) | 29.26 | 32.93 13% | 54.7 87% | 43.5 49% |
| Write 4k (MB/s) | 108.3 | 121.2 12% | 139.4 29% | 159.7 47% |
| Read 4k QD32 (MB/s) | 335.9 | 411 22% | 518 54% | 570 70% |
| Write 4k QD32 (MB/s) | 234.1 | 250.2 7% | 225.6 -4% | 488.7 109% |
Graphics Card
Intel's HD Graphics 615 GPU takes care of the graphics output. It is supported by DirectX 12 and achieves speeds of up to 950 MHz. The results in the 3D Mark benchmarks are at a normal level for this GPU.
| 3DMark 11 Performance | 1272 points | |
Help | ||
| 3DMark 11 - 1280x720 Performance GPU | |
| Lenovo Yoga 910-13IKB-80VF004CGE | |
| HP Spectre x360 13-ac033dx | |
| Dell XPS 13-9365 2-in-1 | |
| Dell XPS 13 9365-4537 2-in-1 | |
Gaming Performance
The hardware of the XPS 13 brings some games smoothly to the display. This goes mainly for those titles that do not make too-high a demand on the hardware, such as “Dota 2 Reborn” or “Farming Simulator 2017”. But even in such games, you have to limit yourself to a low resolution and low quality settings. You cannot play more power-hungry games such as “Mass Effect Andromeda” at all.
| low | med. | high | ultra | |
|---|---|---|---|---|
| Diablo III (2012) | 55.8 | 36.3 | 30.1 | 17.8 |
| Counter-Strike: GO (2012) | 99.9 | 57.3 | 39.5 | 21.9 |
| BioShock Infinite (2013) | 31.4 | 20.4 | 19.3 | 6.1 |
| GRID: Autosport (2014) | 74.9 | 24.6 | ||
| F1 2014 (2014) | 55 | 34 | ||
| GTA V (2015) | 19.9 | 16.7 | ||
| World of Warships (2015) | 49.9 | 30.2 | ||
| Anno 2205 (2015) | 15.9 | 10.2 | ||
| Rainbow Six Siege (2015) | 24.6 | 16.2 | ||
| Far Cry Primal (2016) | 12 | 5 | ||
| Mirror's Edge Catalyst (2016) | 15.5 | 9 | ||
| Civilization 6 (2016) | 20.6 | 9.2 | ||
| Farming Simulator 17 (2016) | 70.2 | 45.1 | ||
| Titanfall 2 (2016) | 19.9 | 15.9 | ||
| Resident Evil 7 (2017) | 22.2 | 9.5 | ||
| For Honor (2017) | 16.8 | 6.2 | ||
| Ghost Recon Wildlands (2017) | 9.8 | 4 | ||
| Warhammer 40.000: Dawn of War III (2017) | 11.6 | 4 | ||
| Prey (2017) | 14.3 | 6.6 |
Emissions
Noise Emissions
The convertible does not have a fan on board, so it always runs quietly. From time to time, the device produces an electronic buzzing sound, although this is so quiet, that it can only be heard when you hold your ear close to the keyboard.
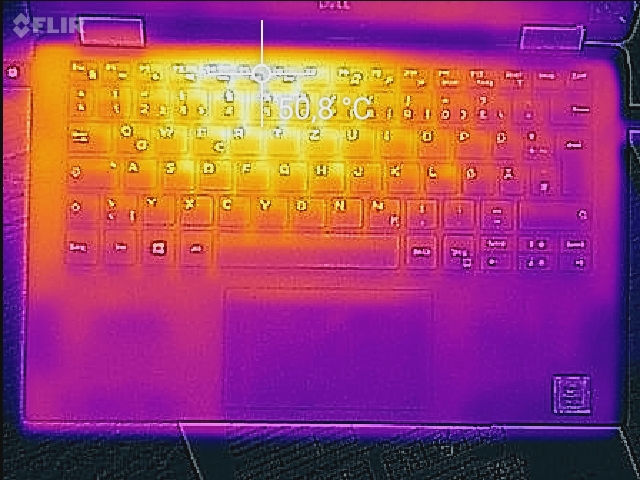
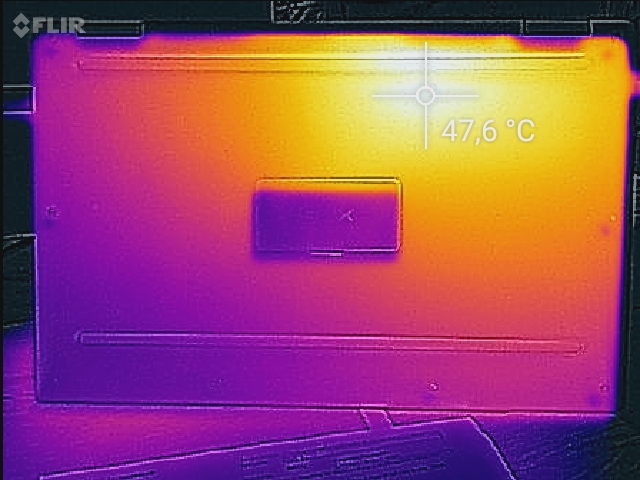
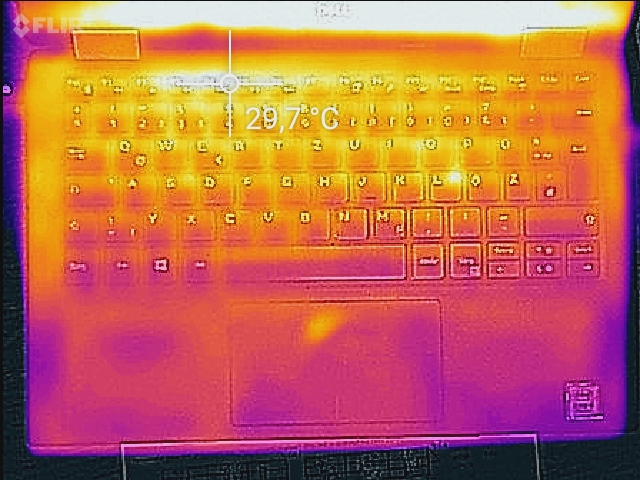
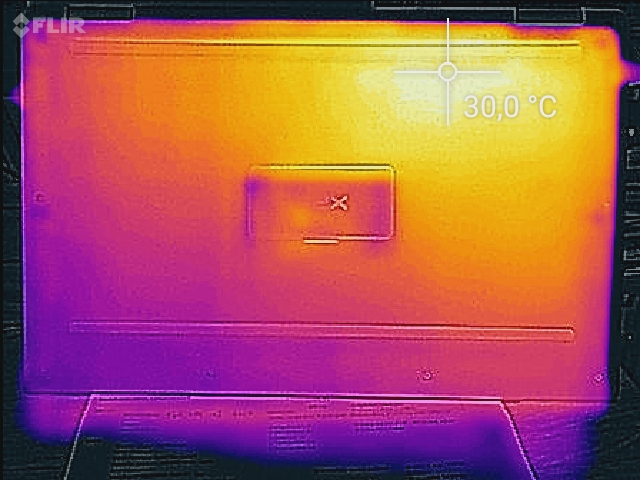
Temperature
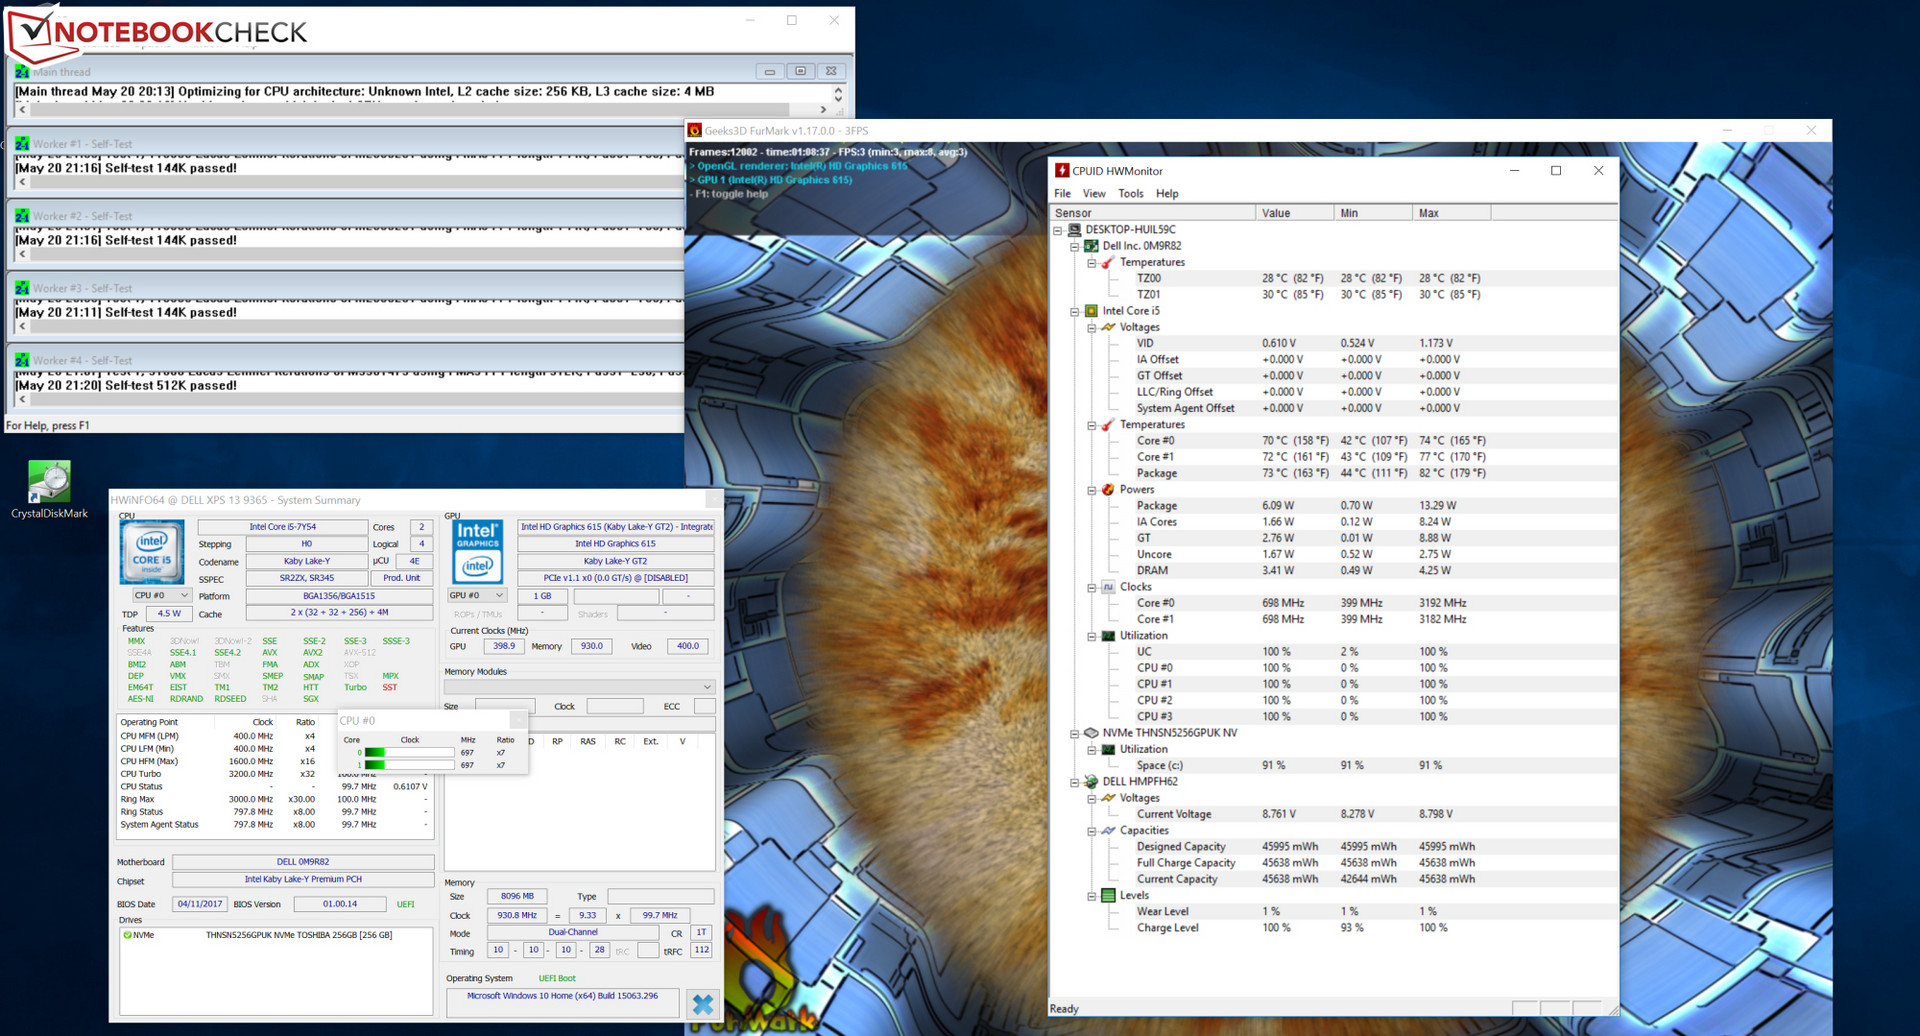
The XPS 13 runs through our stress test (Prime95 and FurMark run for at least one hour) in the same way in battery or mains operation: the CPU (up to 800 MHz) and GPU (450 MHz) begin the stress test with speeds that are already very low. During the course of the test, the values sink even lower. The working speed of the processor decreases to below 600 MHz and that of the graphics core to 350 MHz. The heat development of the computer remains within limits. During the stress test, the 40 °C mark (104 °F) is exceeded at three monitoring points.
(±) The maximum temperature on the upper side is 43.1 °C / 110 F, compared to the average of 35.4 °C / 96 F, ranging from 19.6 to 60 °C for the class Convertible.
(±) The bottom heats up to a maximum of 41.7 °C / 107 F, compared to the average of 36.9 °C / 98 F
(+) In idle usage, the average temperature for the upper side is 22.7 °C / 73 F, compared to the device average of 30.3 °C / 87 F.
(+) The palmrests and touchpad are cooler than skin temperature with a maximum of 26.8 °C / 80.2 F and are therefore cool to the touch.
(±) The average temperature of the palmrest area of similar devices was 28 °C / 82.4 F (+1.2 °C / 2.2 F).
Speakers
Dell XPS 13 9365-4537 2-in-1 audio analysis
(±) | speaker loudness is average but good (73 dB)
Bass 100 - 315 Hz
(±) | reduced bass - on average 14.8% lower than median
(+) | bass is linear (4.5% delta to prev. frequency)
Mids 400 - 2000 Hz
(±) | higher mids - on average 5.2% higher than median
(+) | mids are linear (5.1% delta to prev. frequency)
Highs 2 - 16 kHz
(+) | balanced highs - only 3.4% away from median
(±) | linearity of highs is average (7.4% delta to prev. frequency)
Overall 100 - 16.000 Hz
(±) | linearity of overall sound is average (17.4% difference to median)
Compared to same class
» 33% of all tested devices in this class were better, 8% similar, 59% worse
» The best had a delta of 6%, average was 20%, worst was 57%
Compared to all devices tested
» 33% of all tested devices were better, 8% similar, 59% worse
» The best had a delta of 4%, average was 24%, worst was 134%
Apple MacBook 12 (Early 2016) 1.1 GHz audio analysis
(+) | speakers can play relatively loud (83.6 dB)
Bass 100 - 315 Hz
(±) | reduced bass - on average 11.3% lower than median
(±) | linearity of bass is average (14.2% delta to prev. frequency)
Mids 400 - 2000 Hz
(+) | balanced mids - only 2.4% away from median
(+) | mids are linear (5.5% delta to prev. frequency)
Highs 2 - 16 kHz
(+) | balanced highs - only 2% away from median
(+) | highs are linear (4.5% delta to prev. frequency)
Overall 100 - 16.000 Hz
(+) | overall sound is linear (10.2% difference to median)
Compared to same class
» 7% of all tested devices in this class were better, 2% similar, 91% worse
» The best had a delta of 5%, average was 18%, worst was 53%
Compared to all devices tested
» 5% of all tested devices were better, 1% similar, 94% worse
» The best had a delta of 4%, average was 24%, worst was 134%
Frequency diagram in comparison (checkboxes above can be checked/un-checked!)
Power Management
Power Consumption
In terms of its power demands, the XPS 13 does not show any abnormalities. It is hardly surprising that it needs more power in idle than its Full HD sibling model. During the stress test, the power consumption is at a normal level for the hardware used. The power supply is rated at 30 watts.
| Off / Standby | |
| Idle | |
| Load |
|
Key:
min: | |
Battery Life
Our practically relevant WLAN test simulates the load via a script when calling up web sites. The "Balanced" profile is active, the power saving functions of the notebook are deactivated, and the display brightness is adjusted to about 150 cd/m². The XPS 13 achieves a runtime of 6:50 h. This puts it significantly behind the Full HD sibling model (11:26 h).
| Battery Runtime - WiFi Websurfing | |
| Dell XPS 13-9365 2-in-1 | |
| Lenovo Yoga 910-13IKB-80VF004CGE | |
| HP Spectre x360 13-ac033dx | |
| Dell XPS 13 9365-4537 2-in-1 | |
Verdict
Pros
Cons
The Dell XPS 13 model that we are testing has a Core i5-7Y54 processor on board. This is in no way inferior to the nominally stronger Core-i7 processor that is built into the sibling model that we have already tested. Since both CPUs hardly reach their maximum speeds due to the passive cooling, their results in the CPU tests are to a large extent at the same level. Only a slight advantage that can hardly be noticed during everyday operation can be attested to the Core i7. The extra charge for the Core-i7 processor is not really worth it.
Since there is no fan, the computer always runs quietly. Yet it does not heat up too much. An NVMe SSD assures a fast-running system. Exchanging the SSD might be possible. To do that, you would need to remove the bottom of the computer casing. The keyboard of the convertible left a good overall impression.
The IPS display pleases with stable viewing angles and a very good contrast. The brightness value is also favorable, although it could be even higher, since the device will be used in various places under various lighting conditions.
The razor-sharp QHD+ display has a negative effect on the battery life.
In our practically relevant WLAN test, the runtime decreases by a good 5 hours compared to the Full HD model of the XPS 13. Users who need a battery life that is as long as possible should therefore choose the Full HD model.
Dell XPS 13 9365-4537 2-in-1
- 05/26/2017 v6 (old)
Sascha Mölck
Price comparison
