Dell Inspiron 15 5579 (i5-8250U, SSD, IPS, Touch) Convertible Review
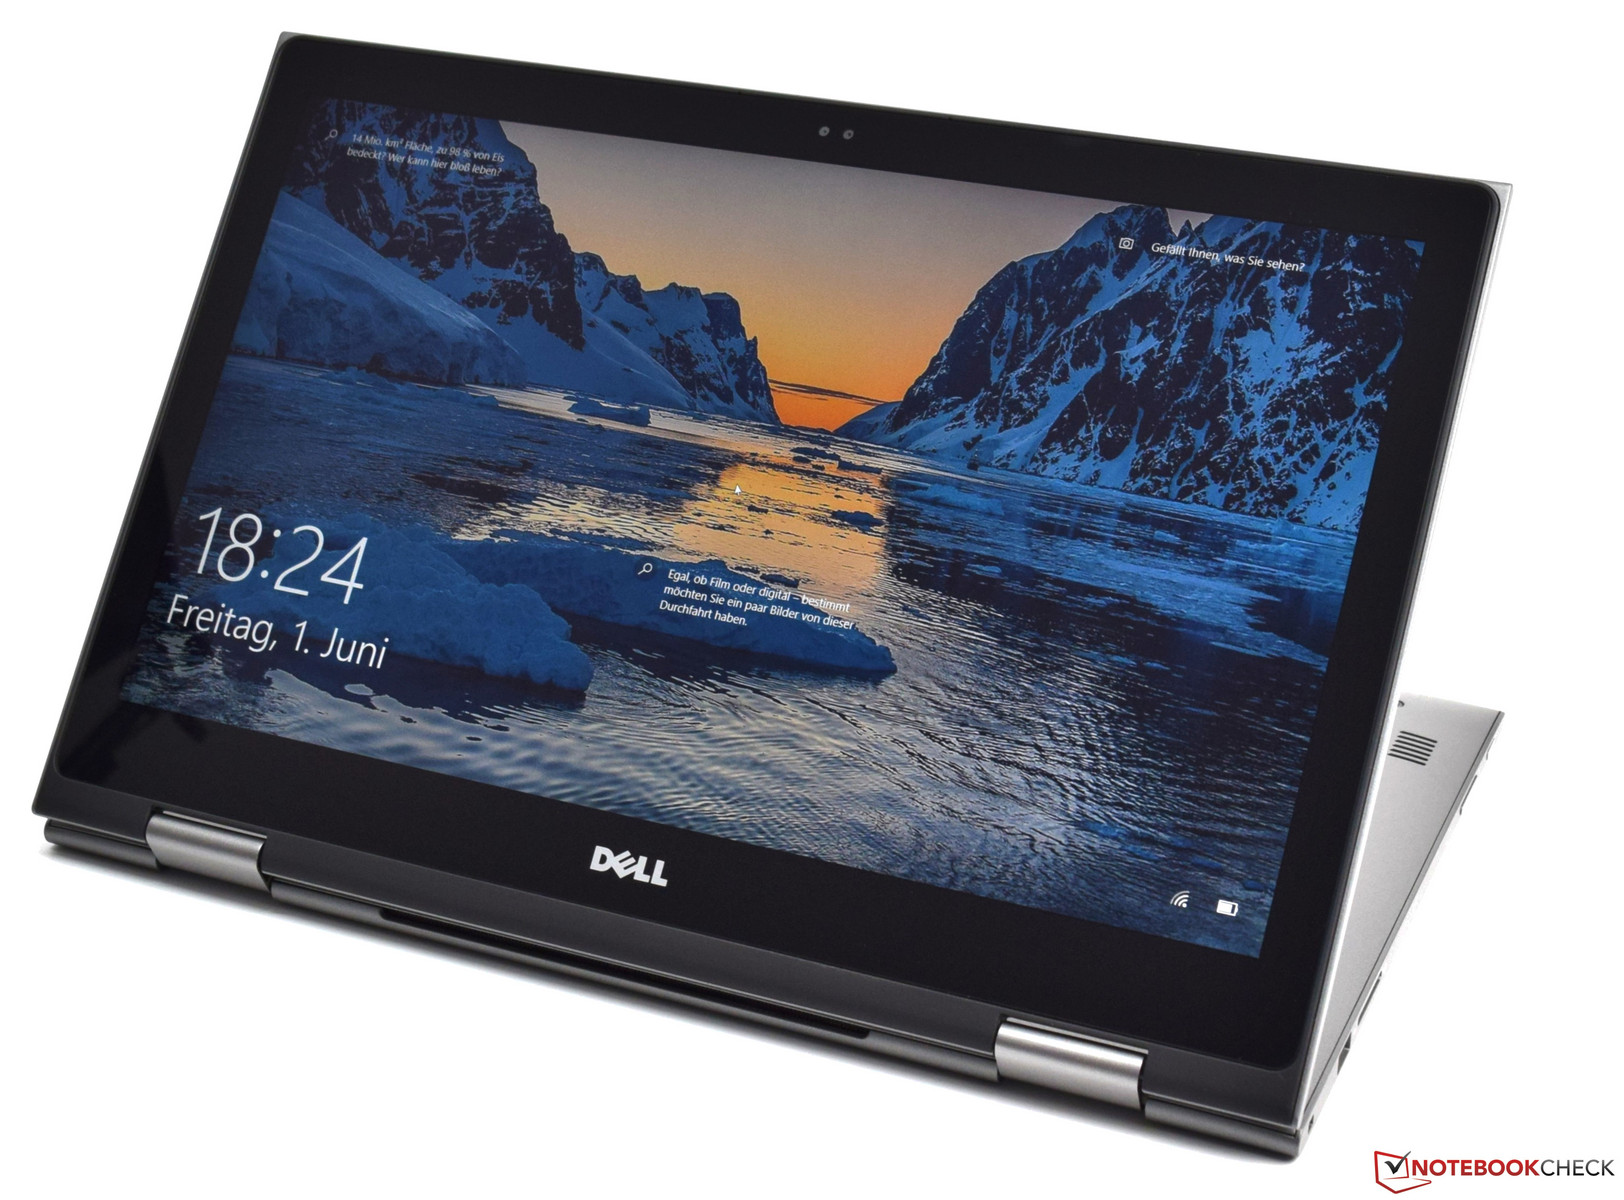
Dell’s latest Inspiron 15 5579 is a 15.6-inch convertible with just minor differences to its predecessor (Dell Inspiron 15 5578). Since last year’s model also received no more than a simple CPU upgrade we would have preferred to see a new, fresh design but alas, we are left with the well-established aging chassis once more. The differences underneath the hood are fairly minimal and limited to a CPU upgrade. However, given the current generation of CPUs the result is a massive improvement in CPU performance.
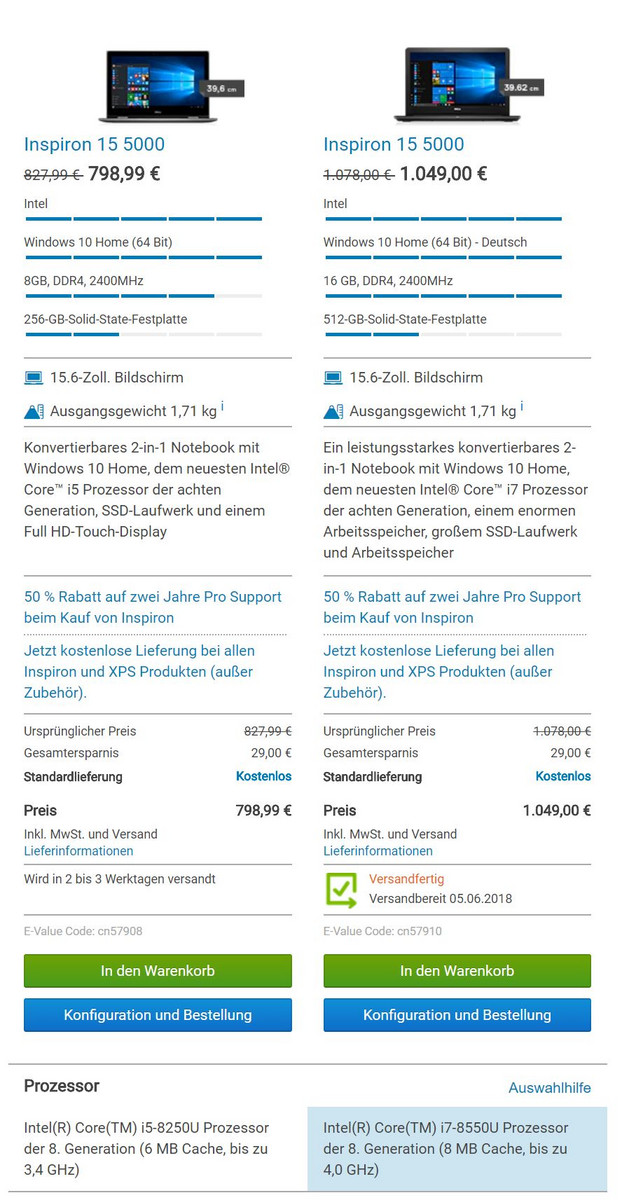
Two different base models of the Inspiron 15 5579 are available, see the screenshot on the right. Our particular review unit - equipped with an Intel Core i5-8250U, 8 GB of DDR4-RAM, and a 256 GB SSD - will set you back $749 plus sales tax in the US. It also came with a 15-inch IPS touchscreen.
Alternatively, the convertible is also available with an Intel Core i7-8550U, twice the RAM, and twice the storage for $999 plus sales tax instead.
The Inspiron’s main competitors are listed in the table below. We have included its predecessor as well in order to determine how much faster the new model really is.
| Dell Inspiron 15 5578 | HP Envy x360 15 | Asus VivoBook Flip 15 | Acer Spin 3 | Lenovo ThinkPad L380 | |
| CPU | Intel Core i5-7200U | AMD Ryzen 5 2500U | Intel Core i5-8250U | Intel Core i5-8250U | Intel Core i5-8250U |
| GPU | Intel HD Graphics 620 | AMD Radeon RX Vega 8 | Intel UHD Graphics 620 | Intel UHD Graphics 620 | Intel UHD Graphics 620 |
| Display | 15.6-inch 1920x1080 (IPS) | 15.6-inch 1920x1080 (IPS) | 15.6-inch 1920x1080 (IPS) | 14-inch 1920x1080 (IPS) | 13.3-inch 1920x1080 (IPS) |
| RAM | 8 GB DDR4 | 8 GB DDR4 | 8 GB DDR4 | 8 GB DDR4 | 8 GB DDR4 |
| Storage | 256 GB SSD | 256 GB SSD (NVMe) | 128 GB SSD + 1 TB HDD | 256 GB SSD | 256 GB SSD (NVMe) |
| Rating | 79% | 80% | 79% | 81% | 86% |
Case
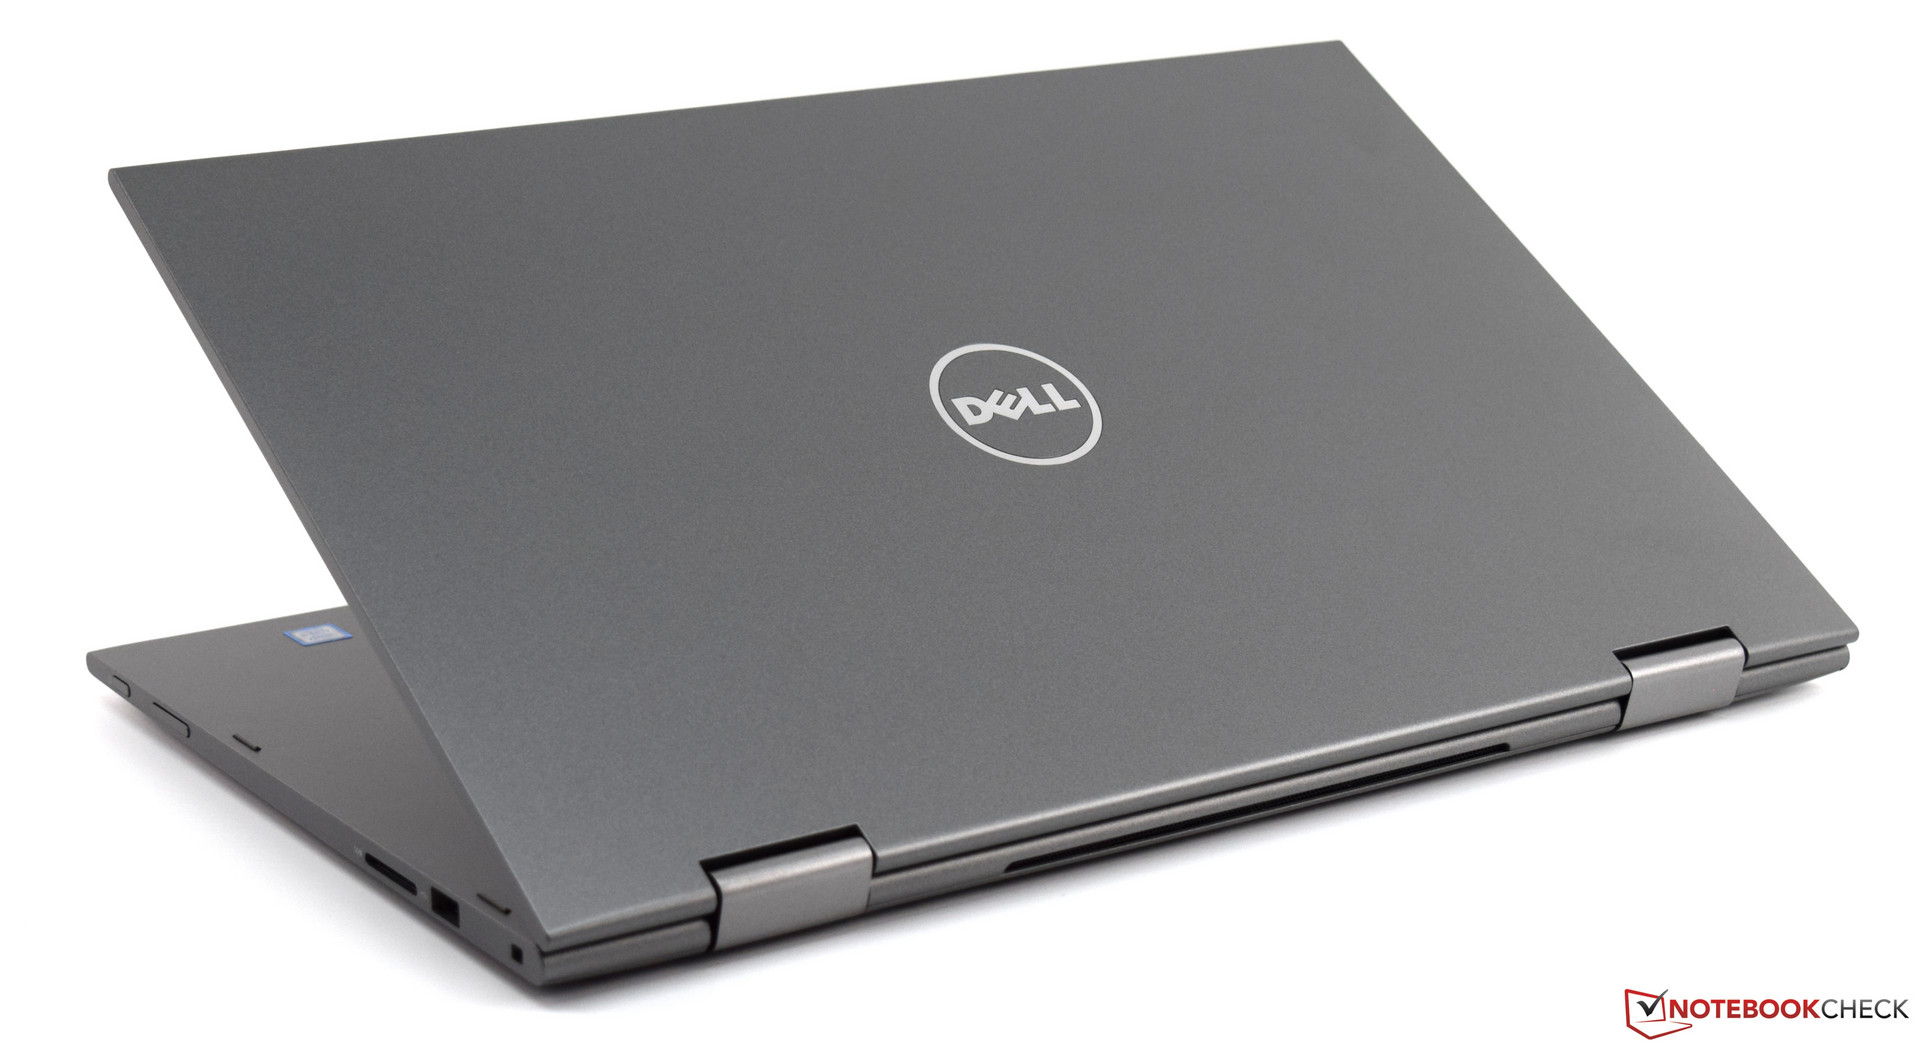
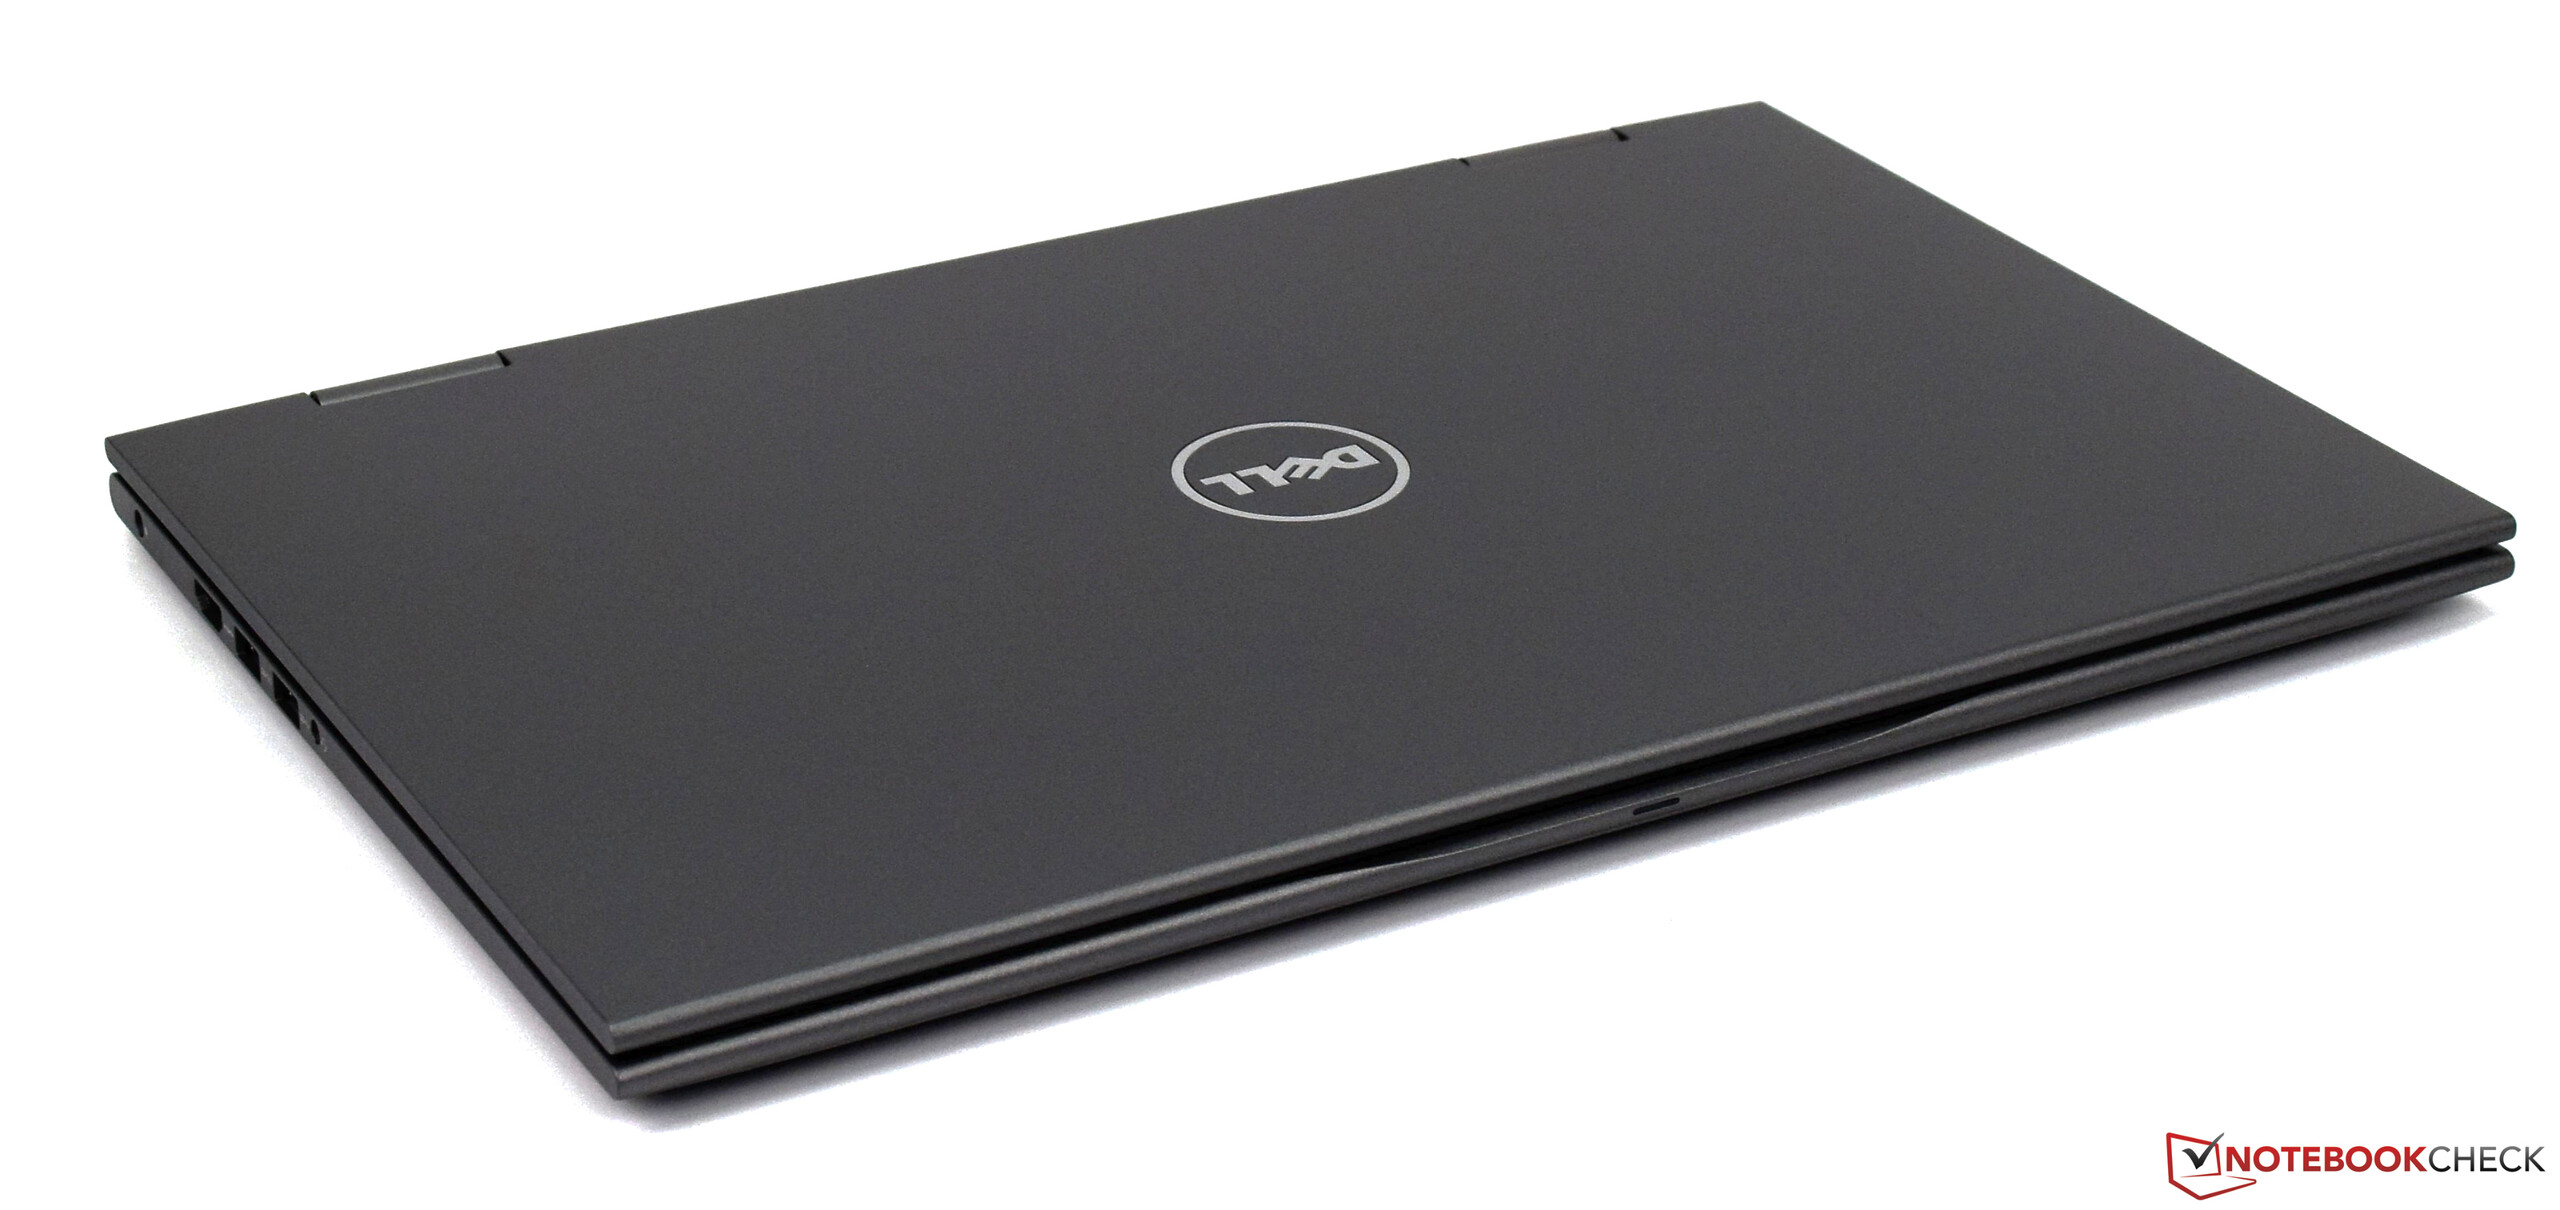
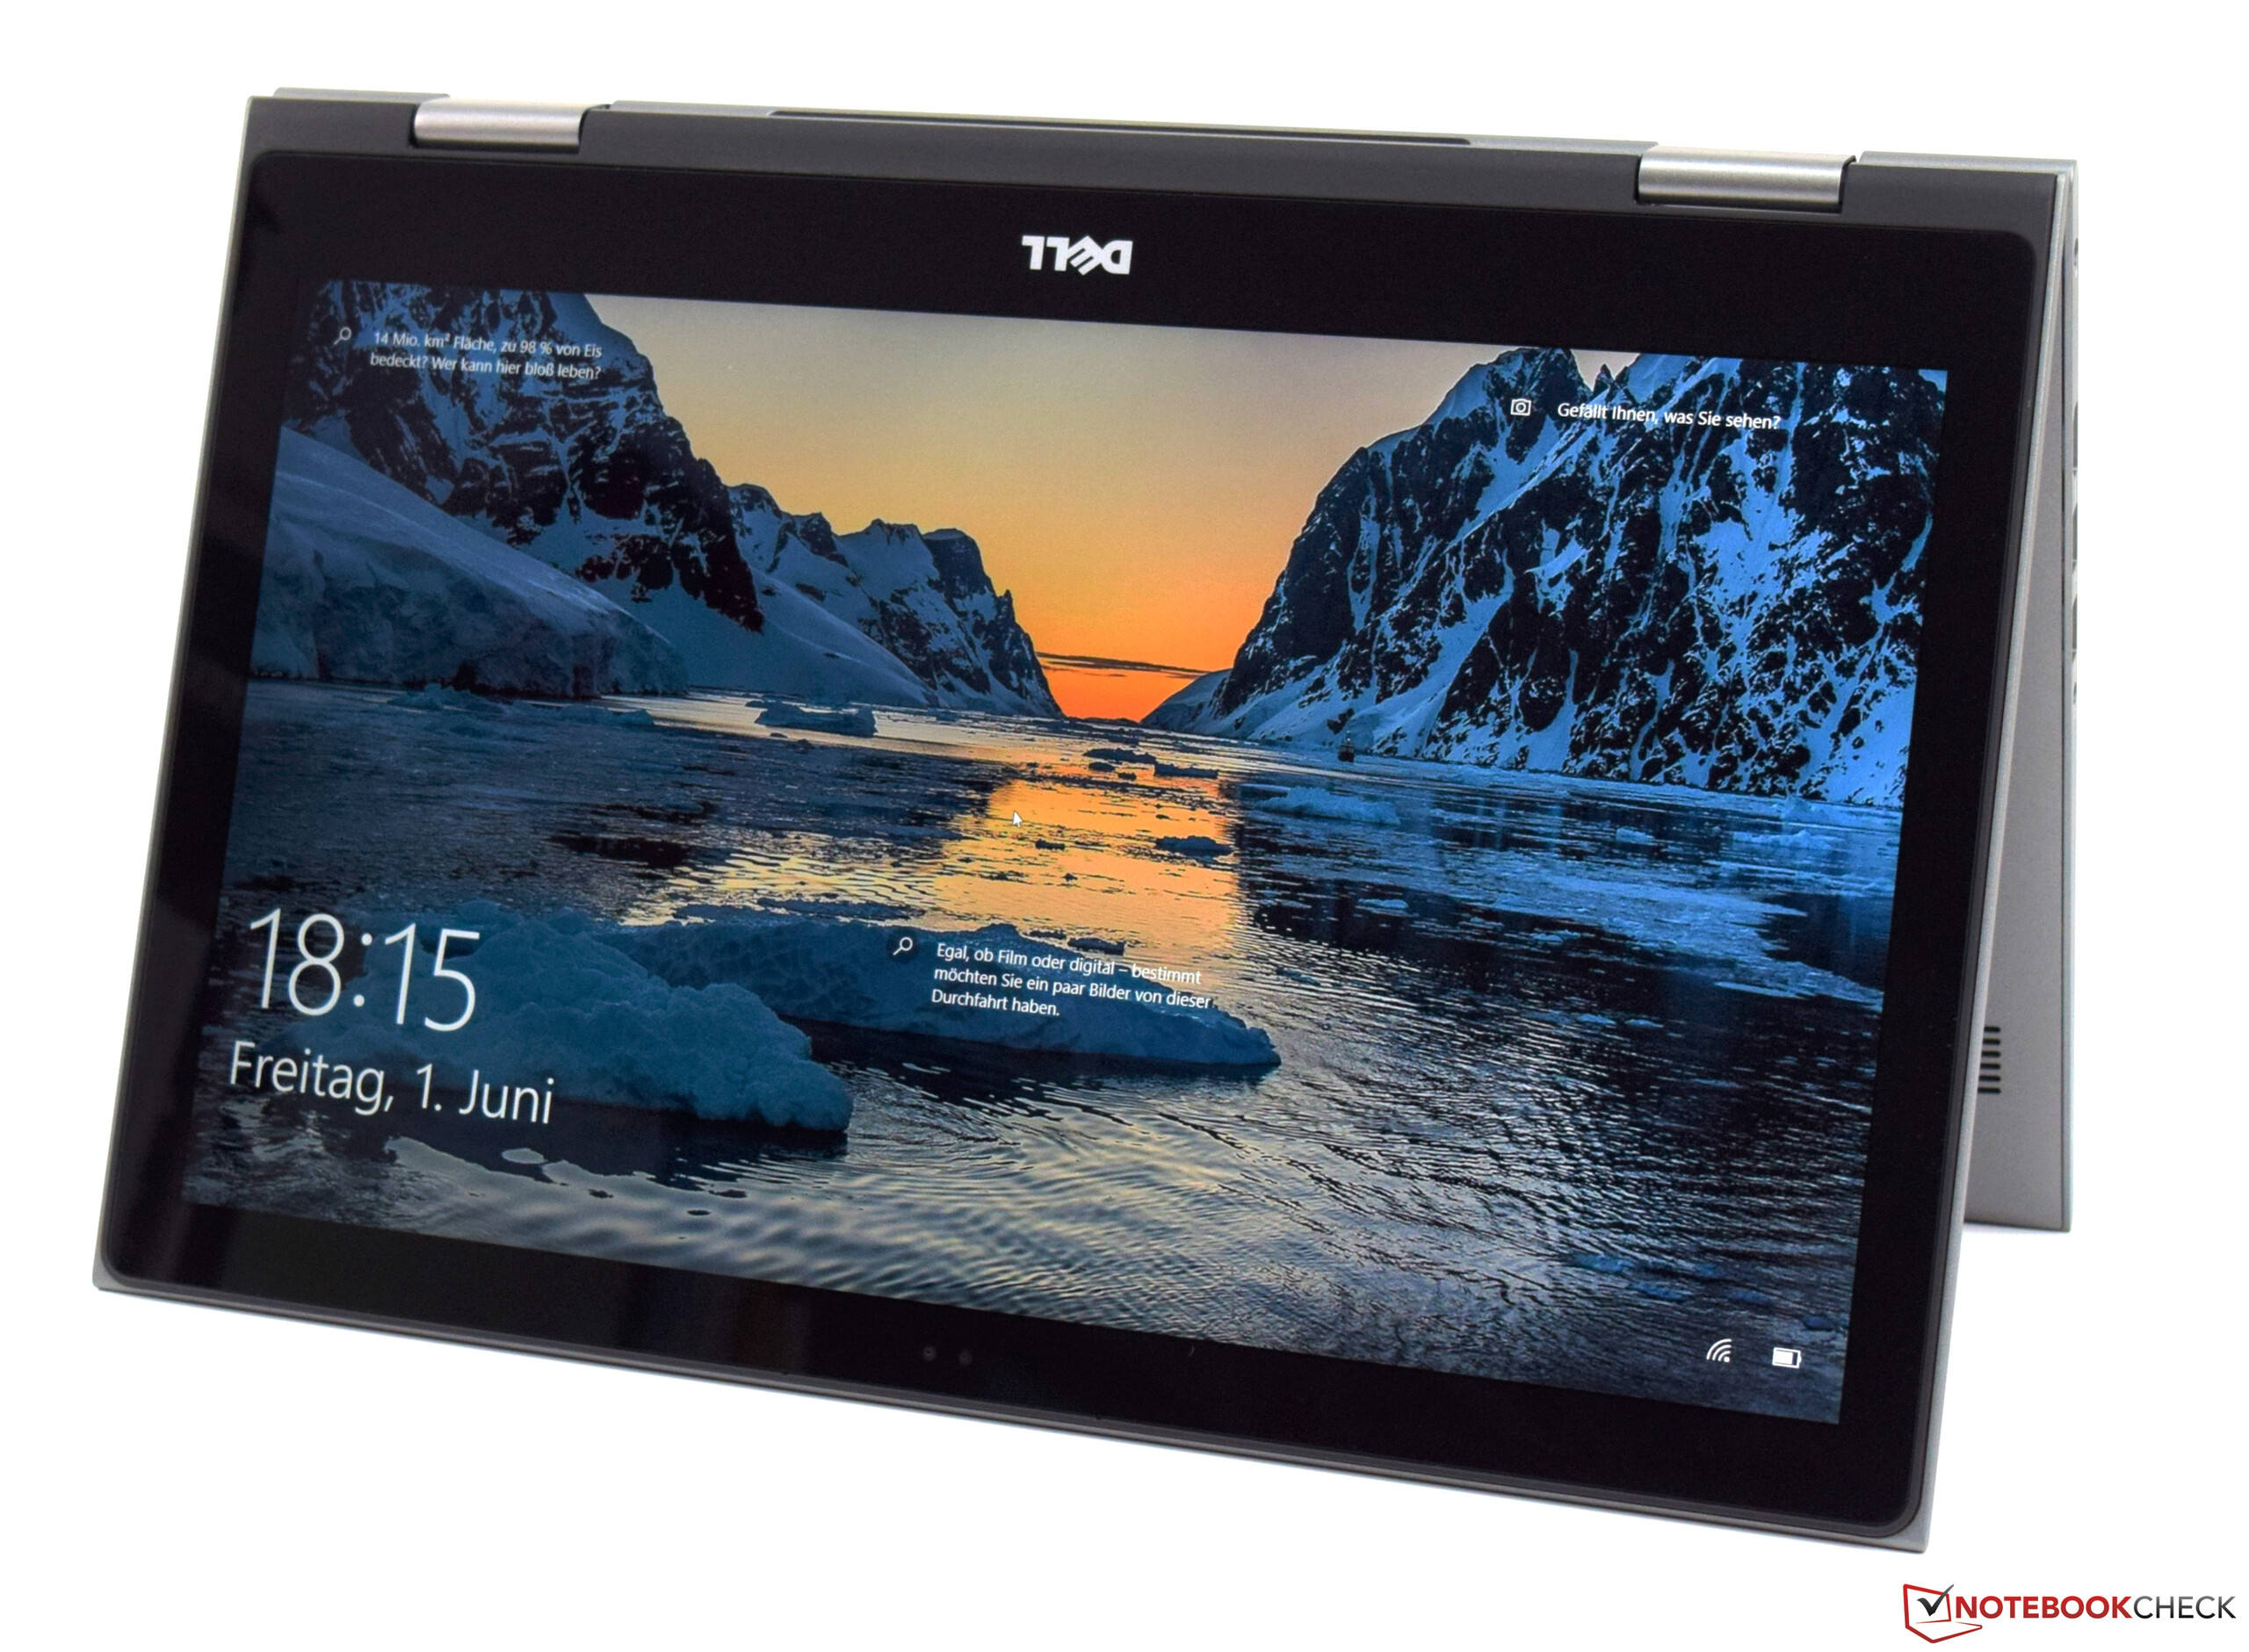
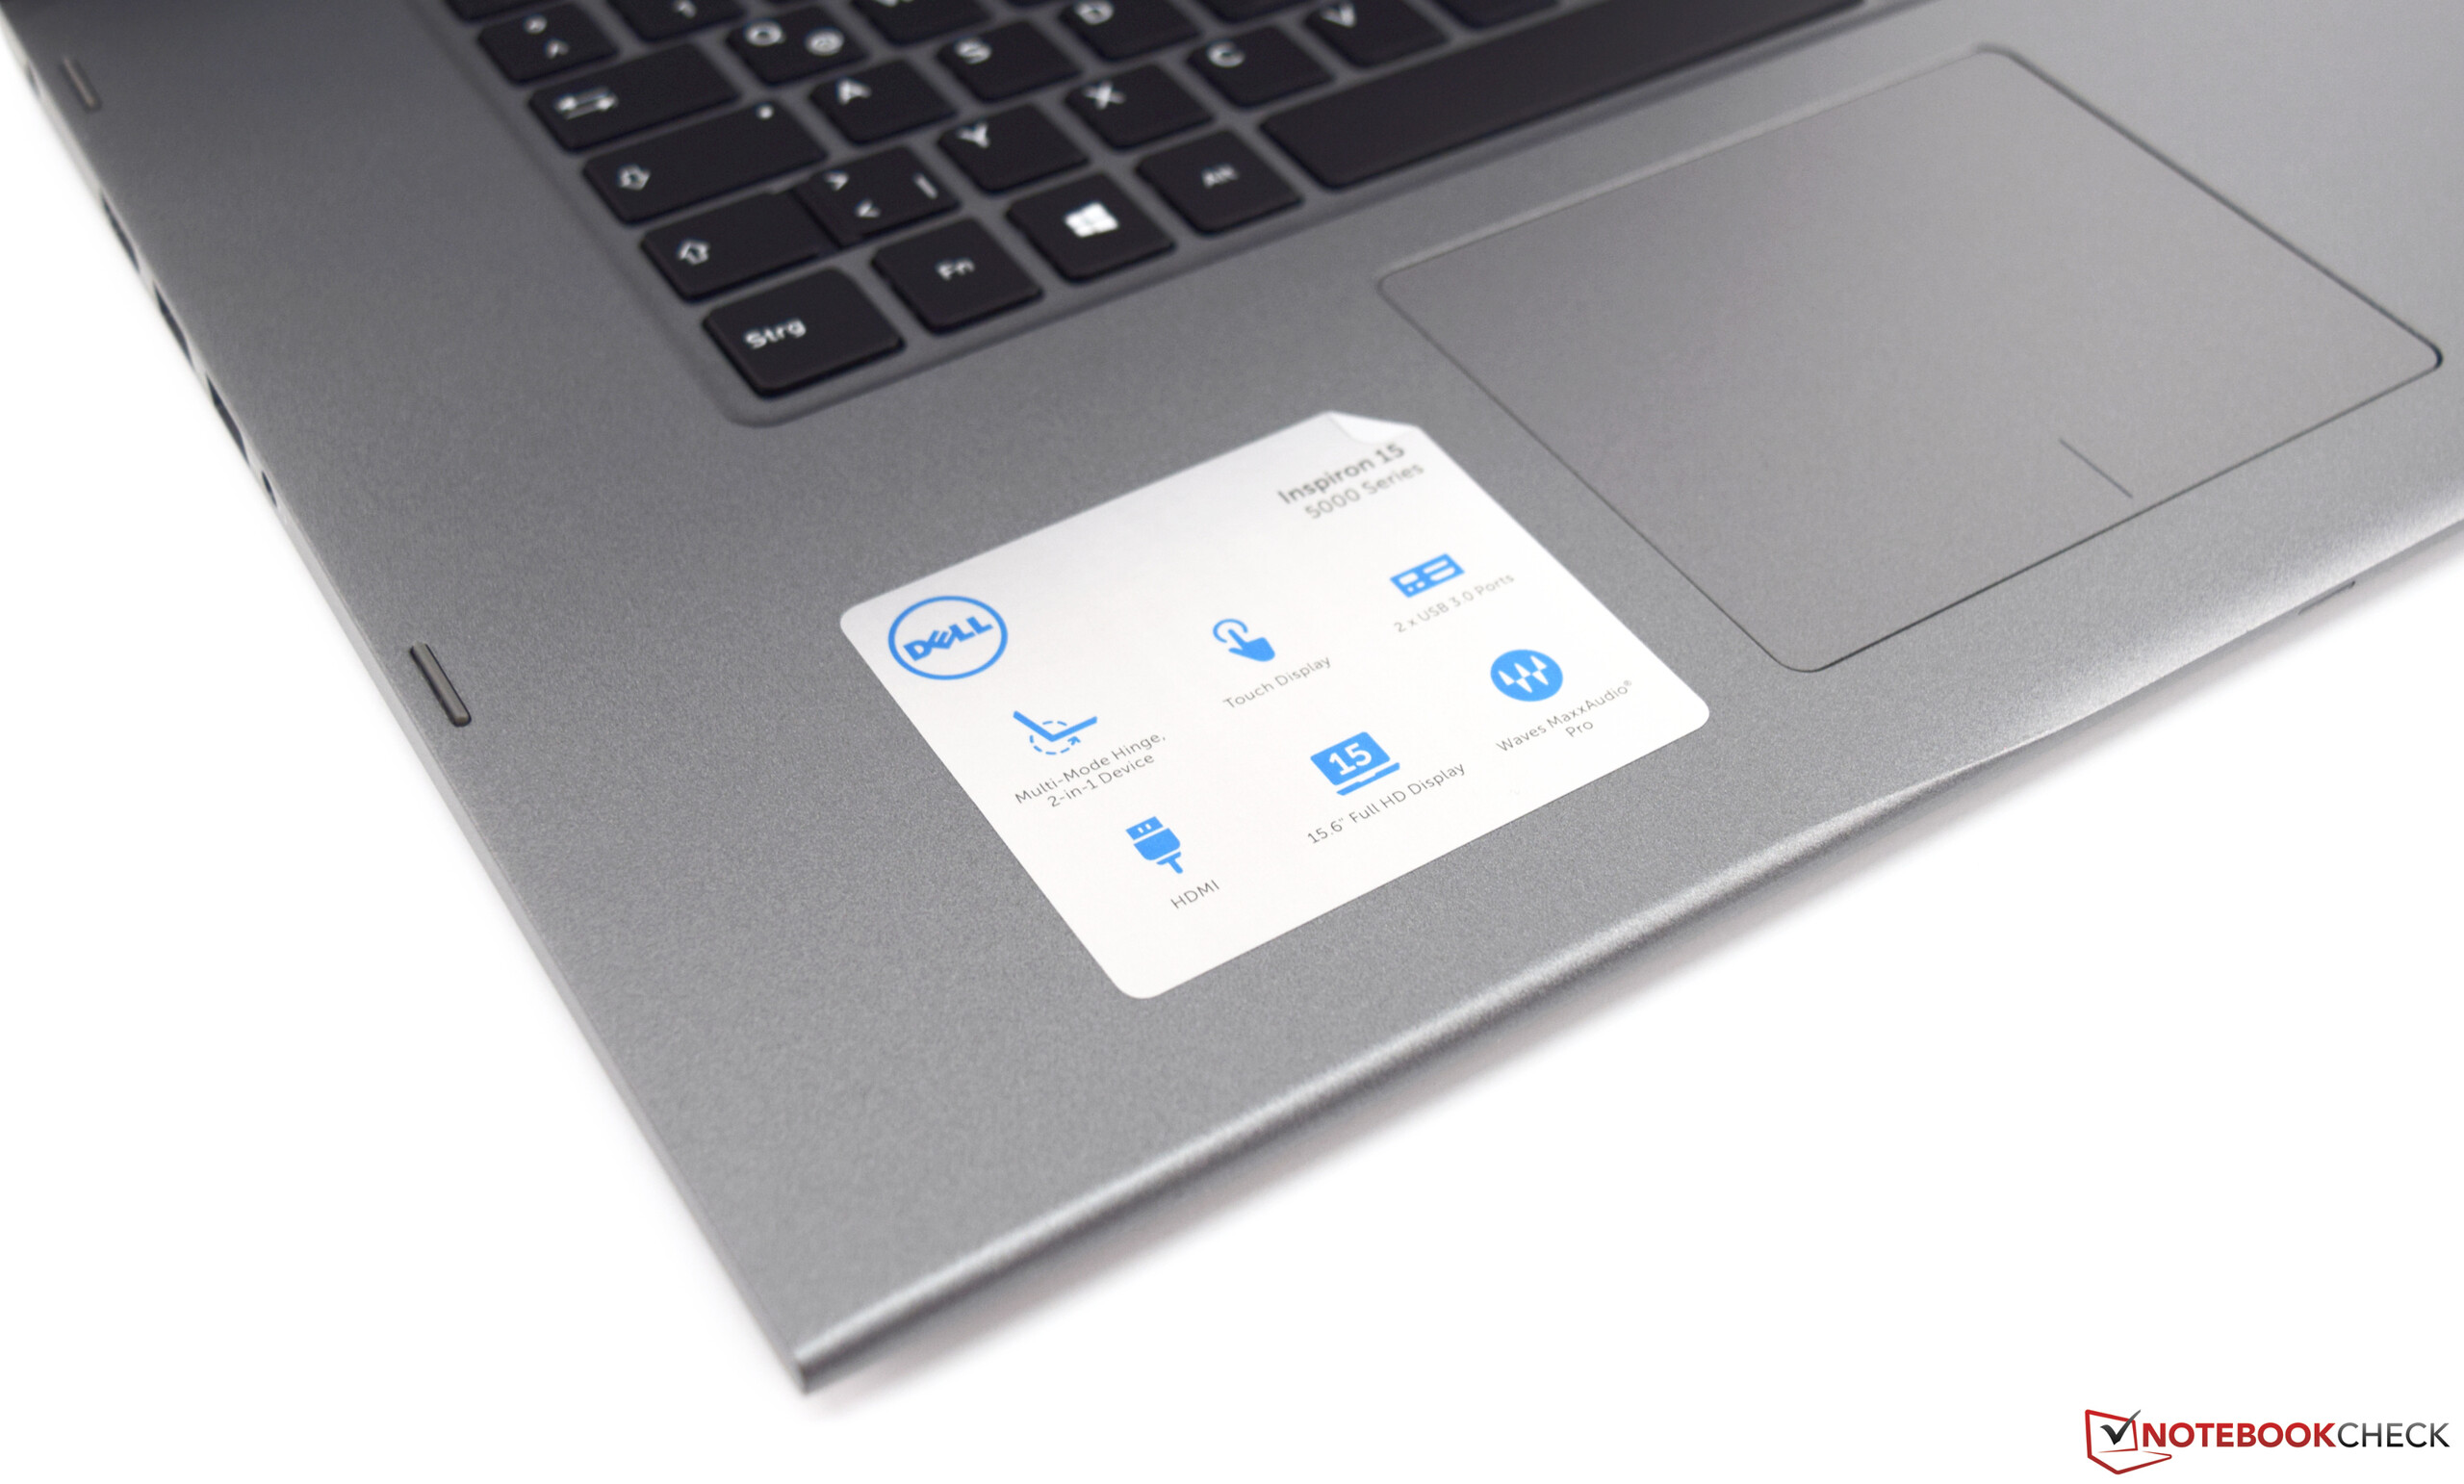
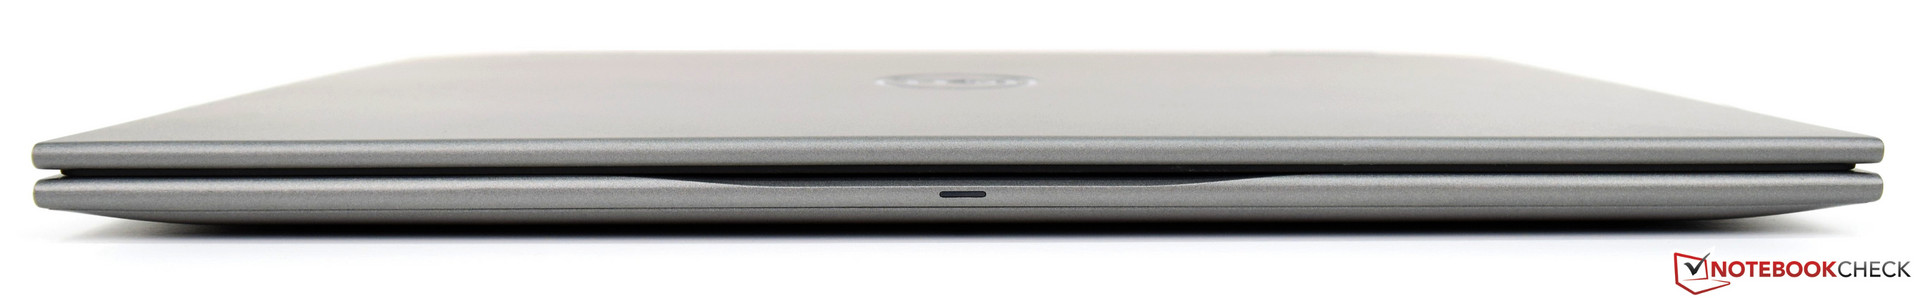
The only thing we can really say about the 5579’s case is that it is old news. We’ve already seen it on the 5568 and the 5578. It is made entirely out of gray plastic. Our particular unit showed some flex in the area surrounding the touchpad, which resulted in accidental clicks when using the device on our lap. Both the display lid and base can be quite easily warped and the base flexed noticeably in the middle. The display lid had its weakest spot around the Dell logo and flexed quite significantly in this area, resulting in the dreaded ripple effect on the display.
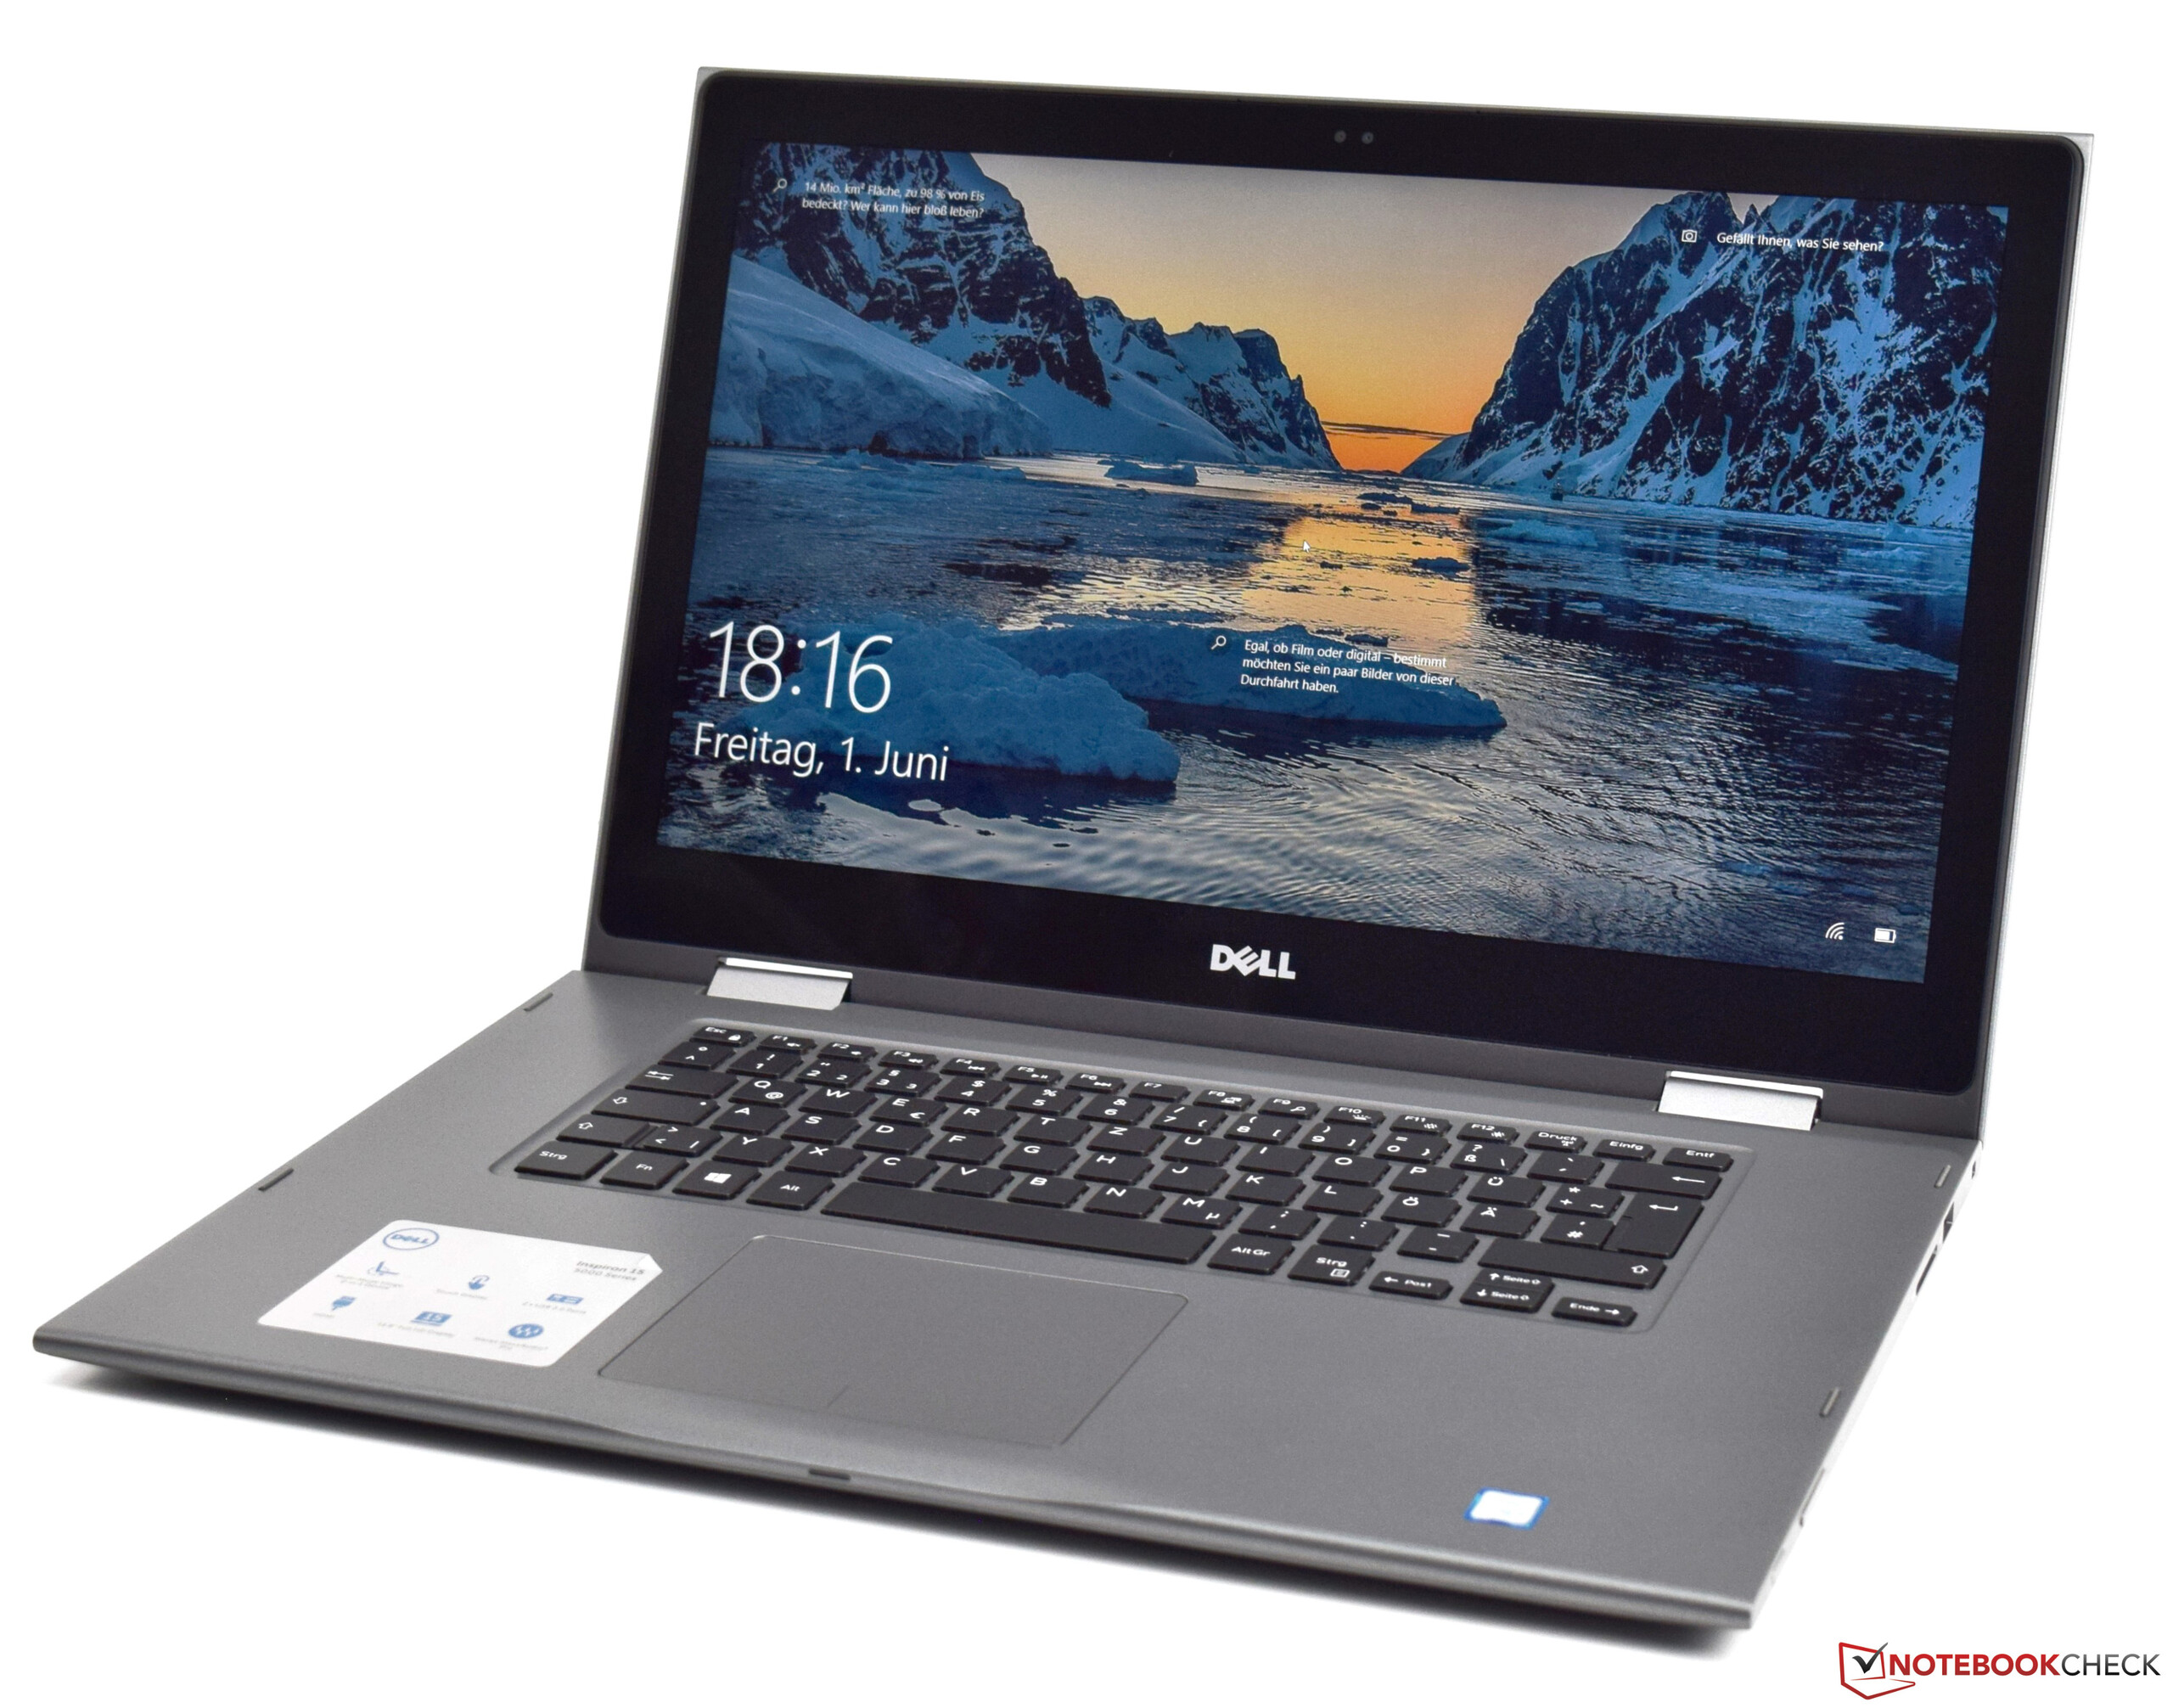
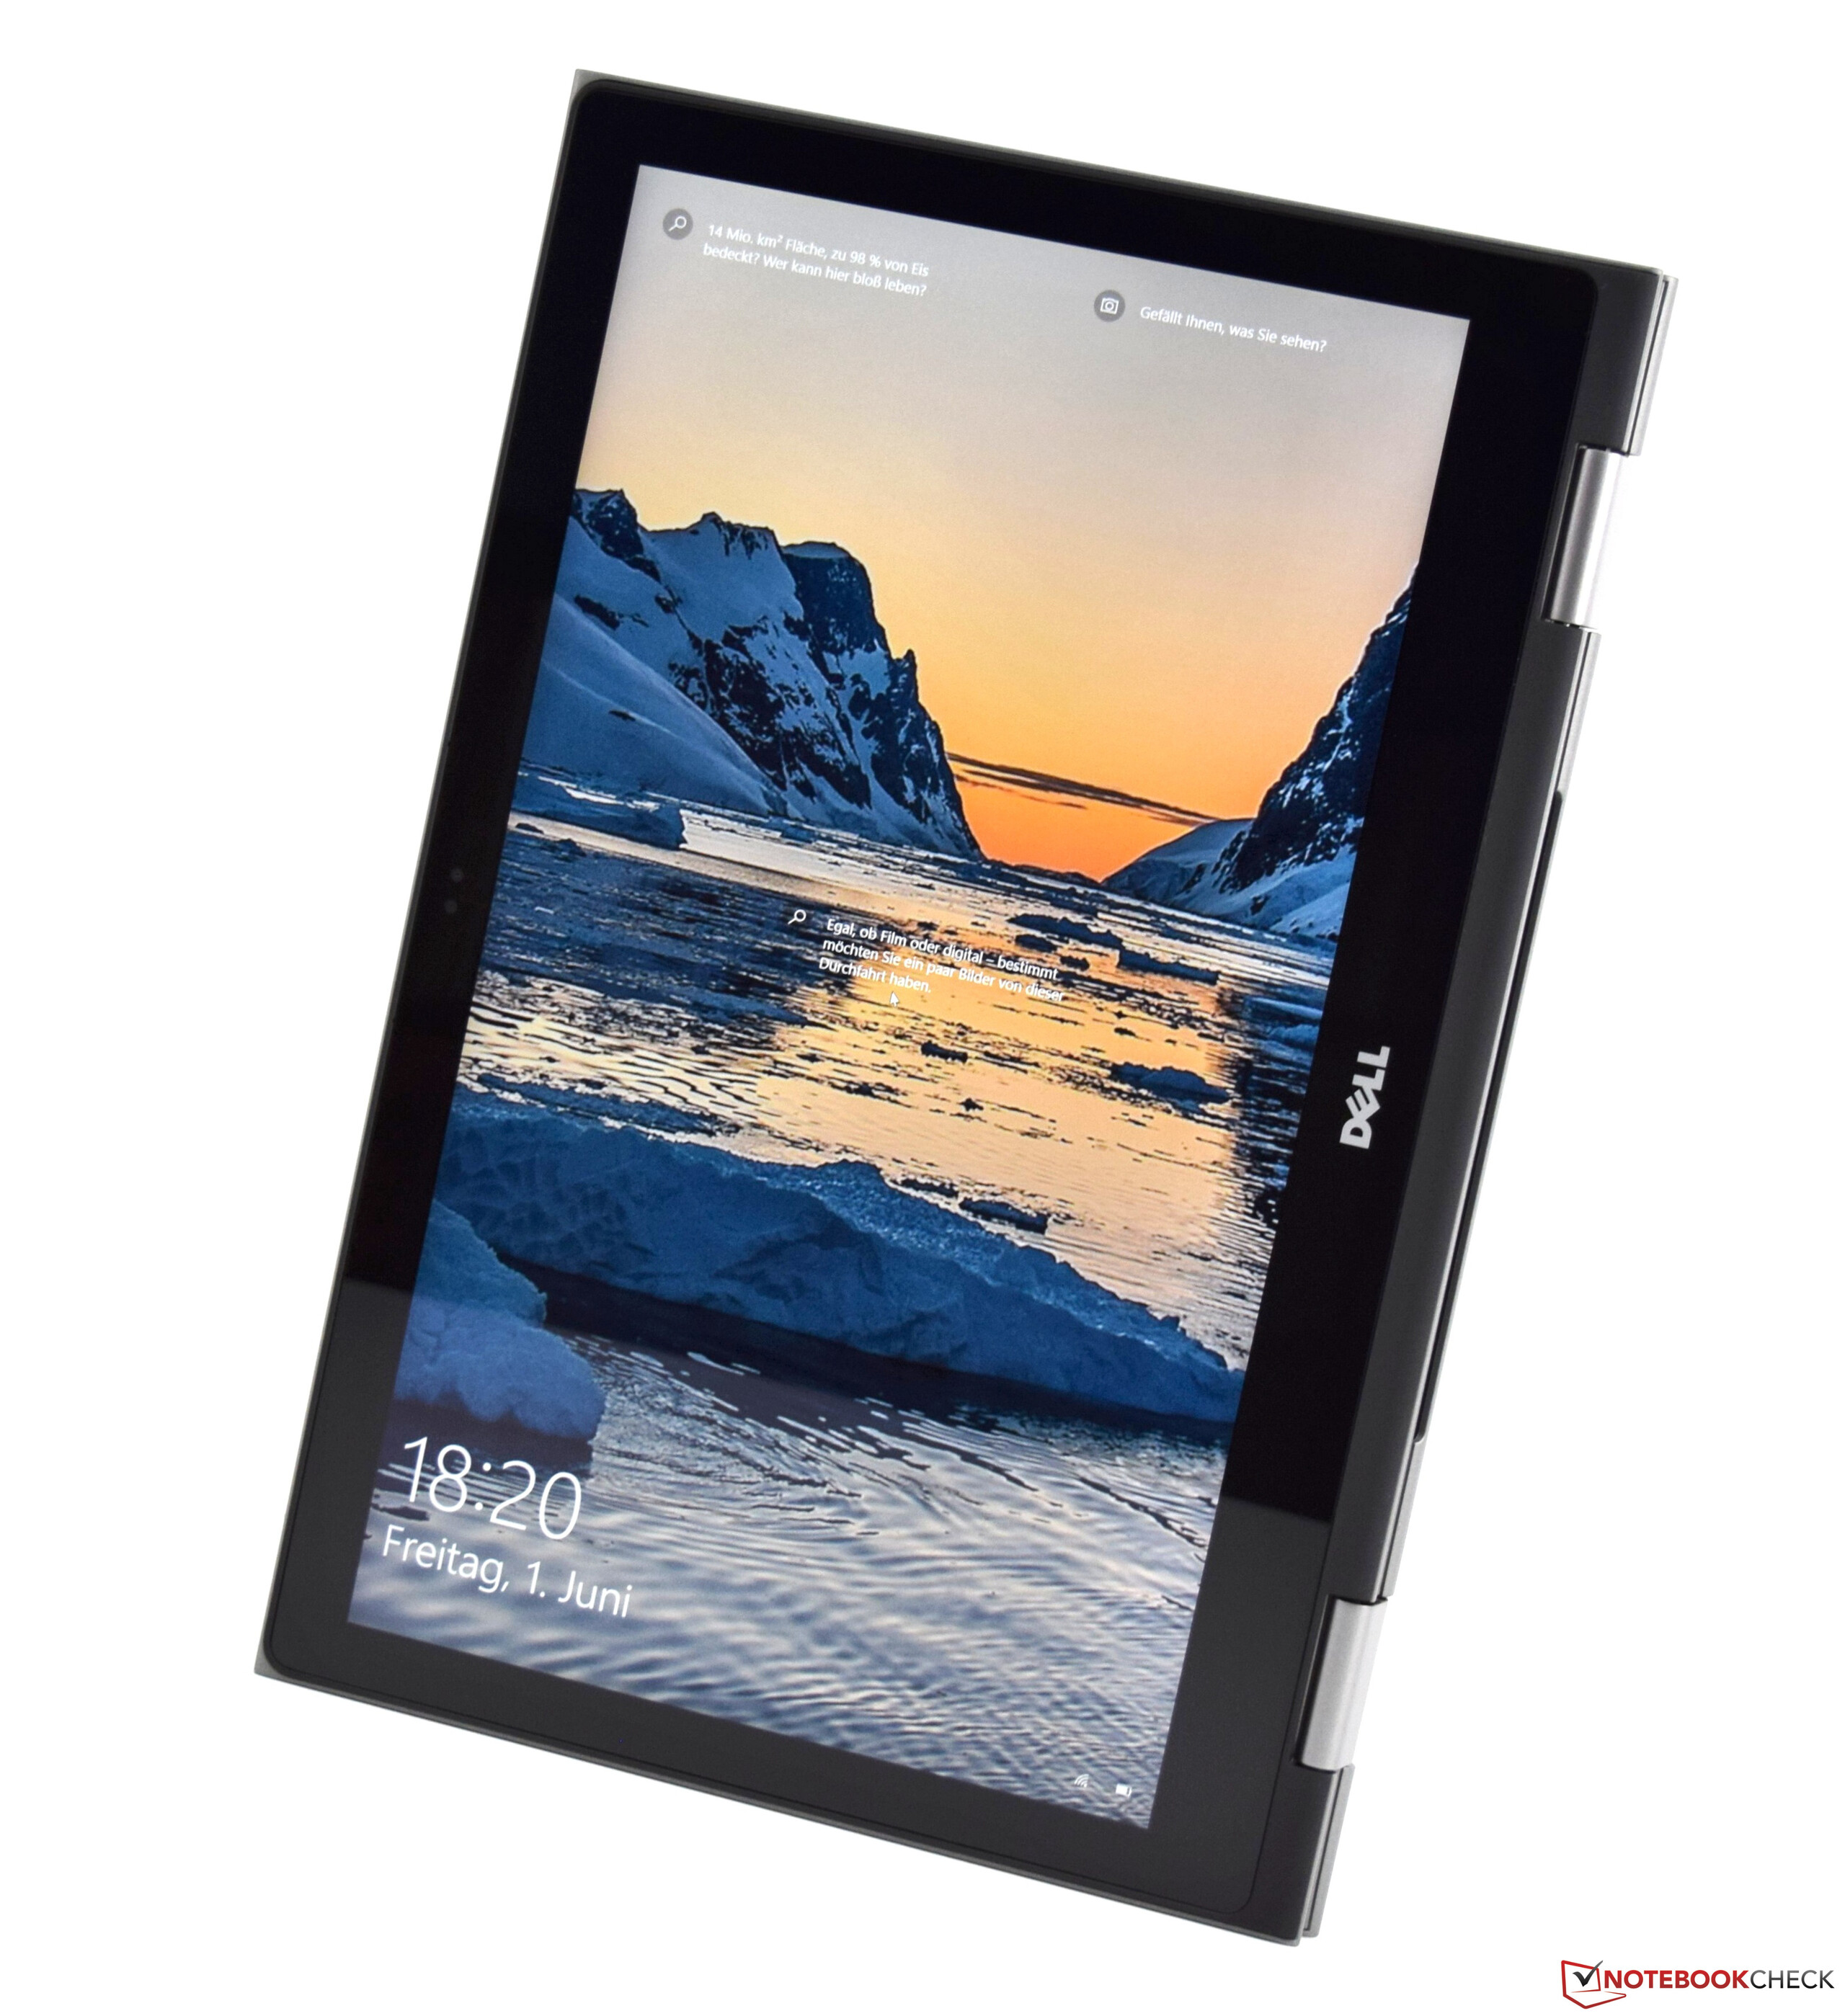
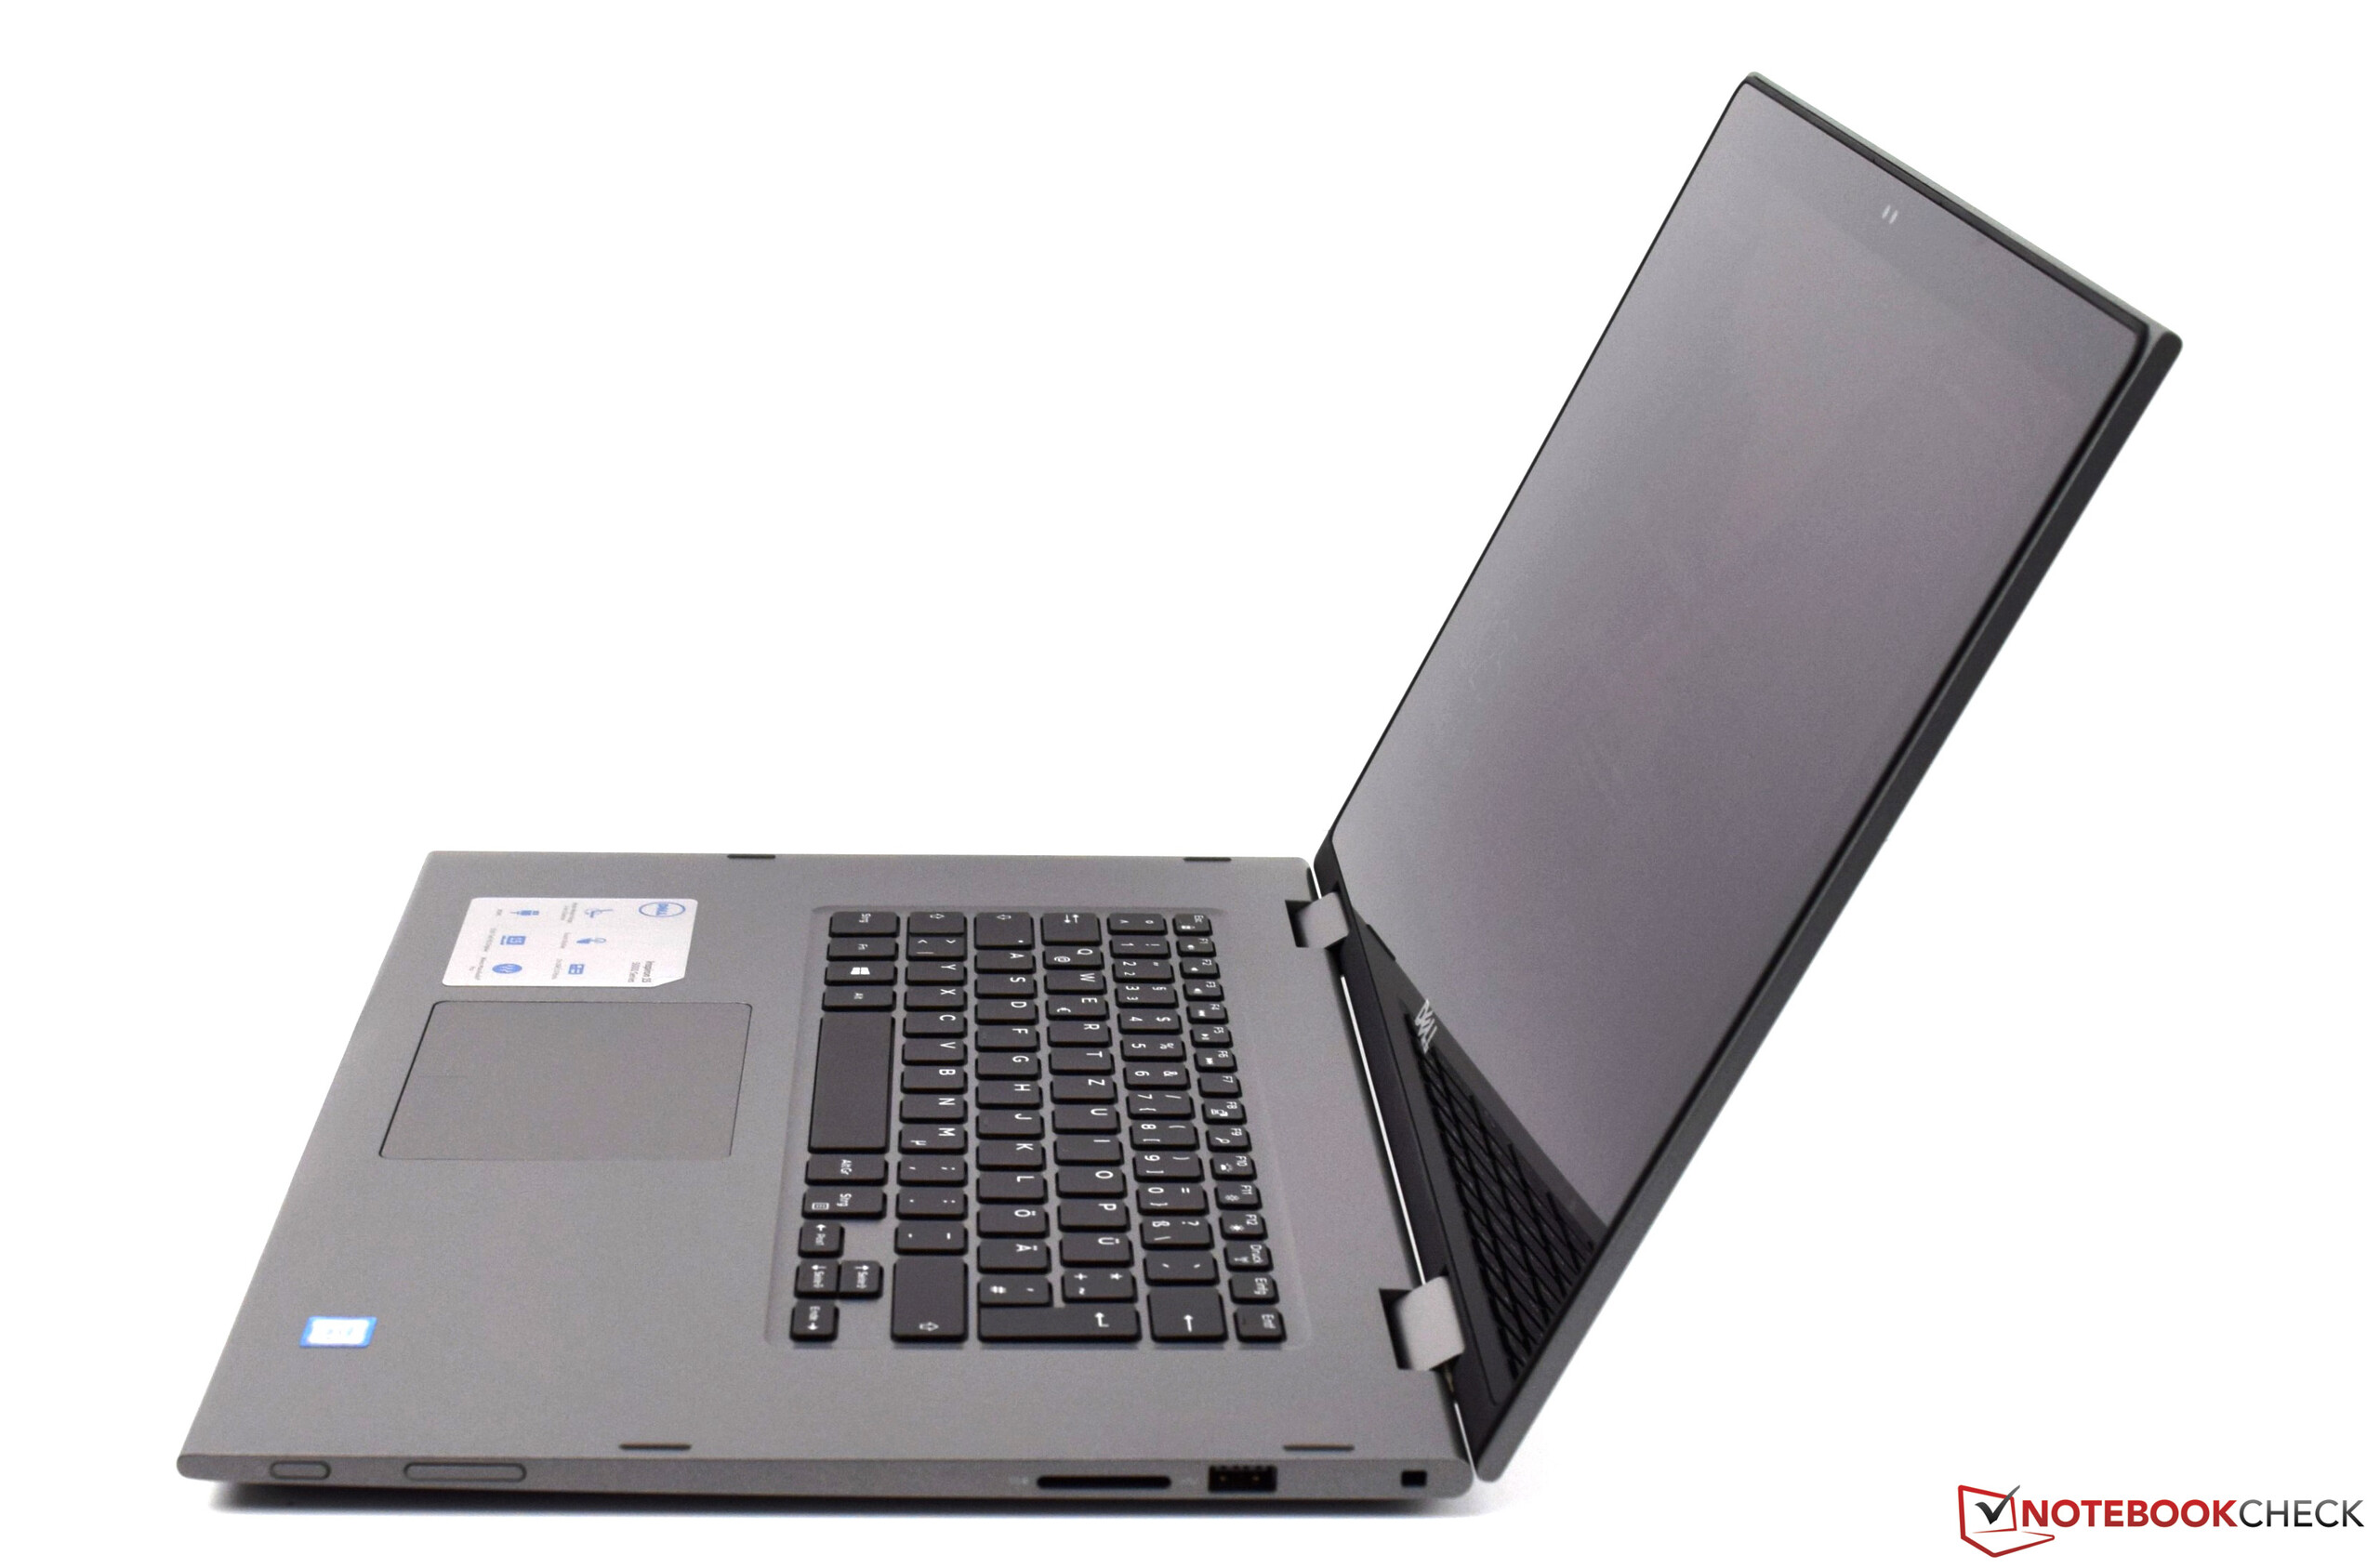
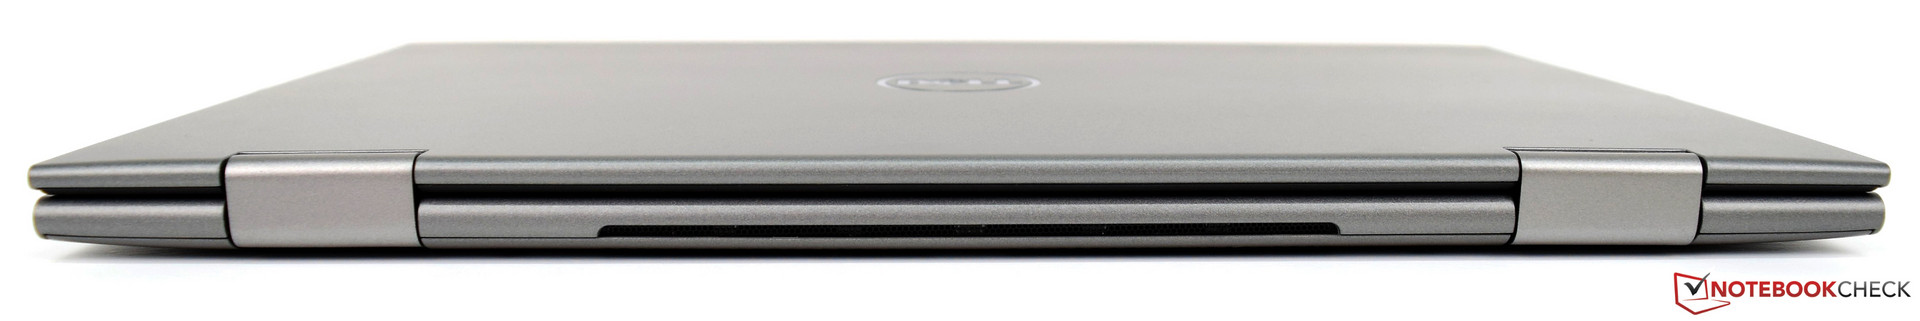
Nevertheless, the Inspiron 15 5579 looks the part, with its beveled edges and smooth surfaces. The 360-degree hinges were too tight for one-handed operation but not tight enough to avoid teetering entirely.
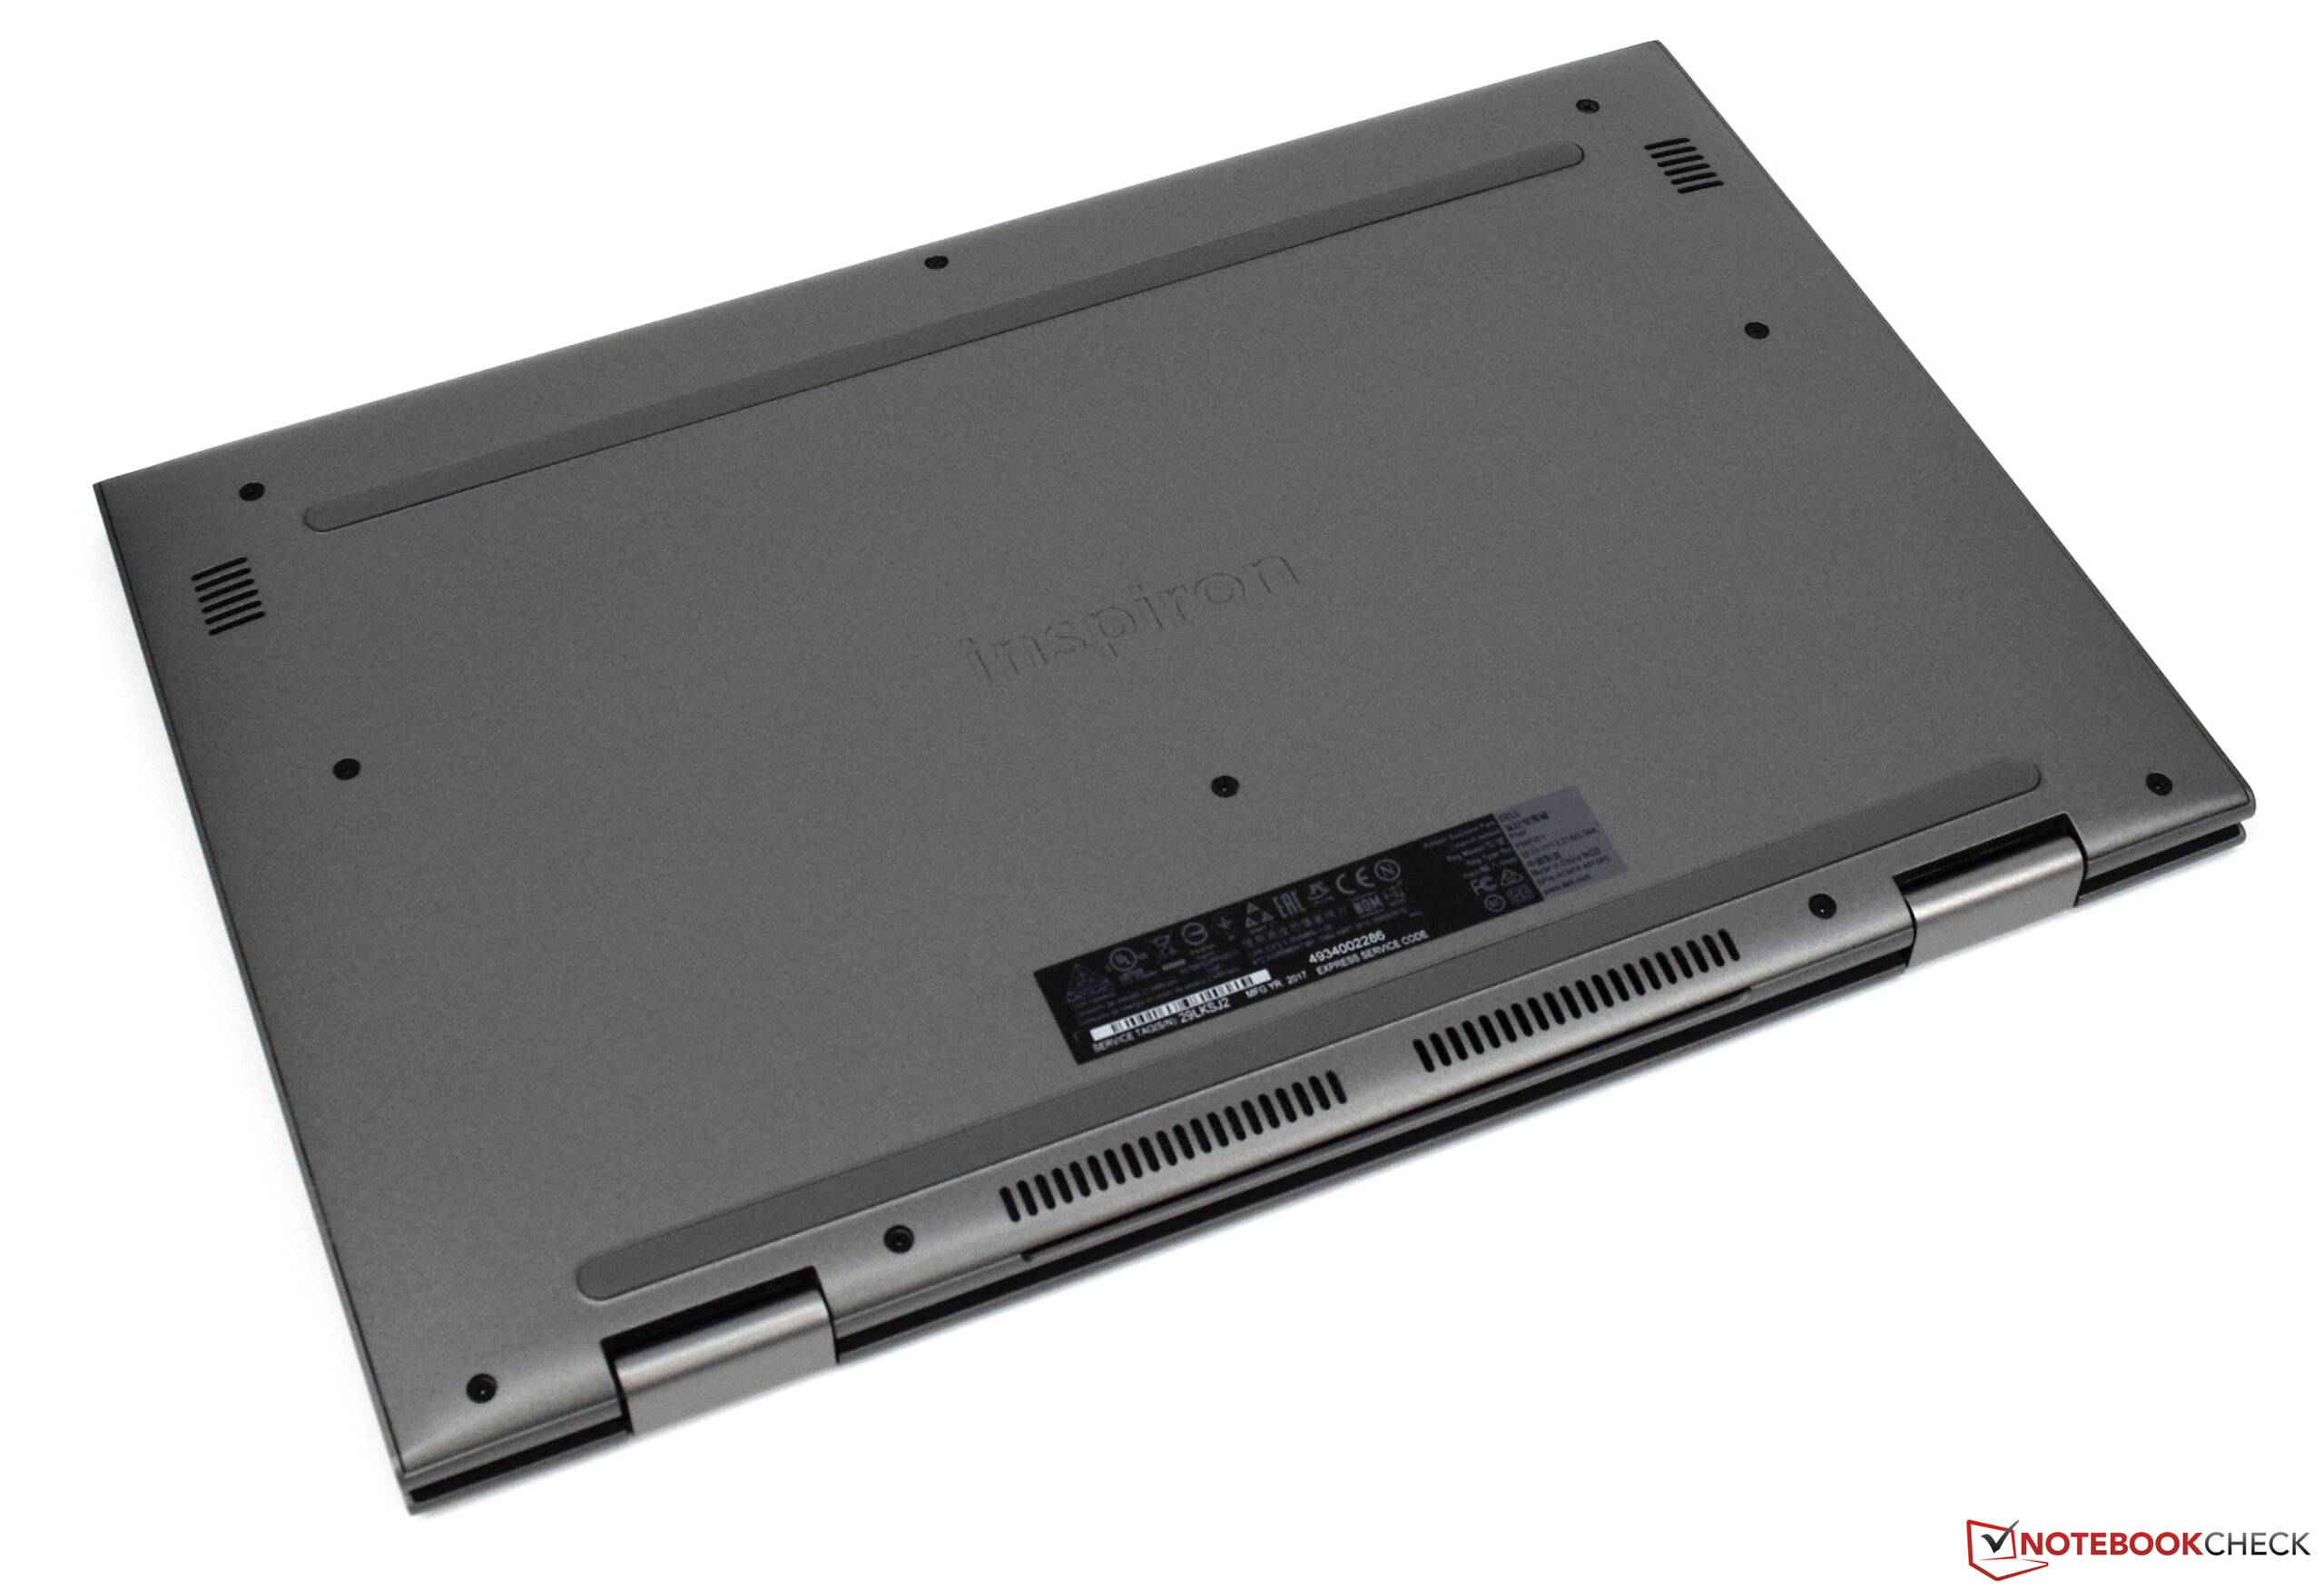
Since the notebook still lacks a dedicated maintenance flap, the entire bottom shell needs to be removed in order to access the internal hardware.


Size Comparison
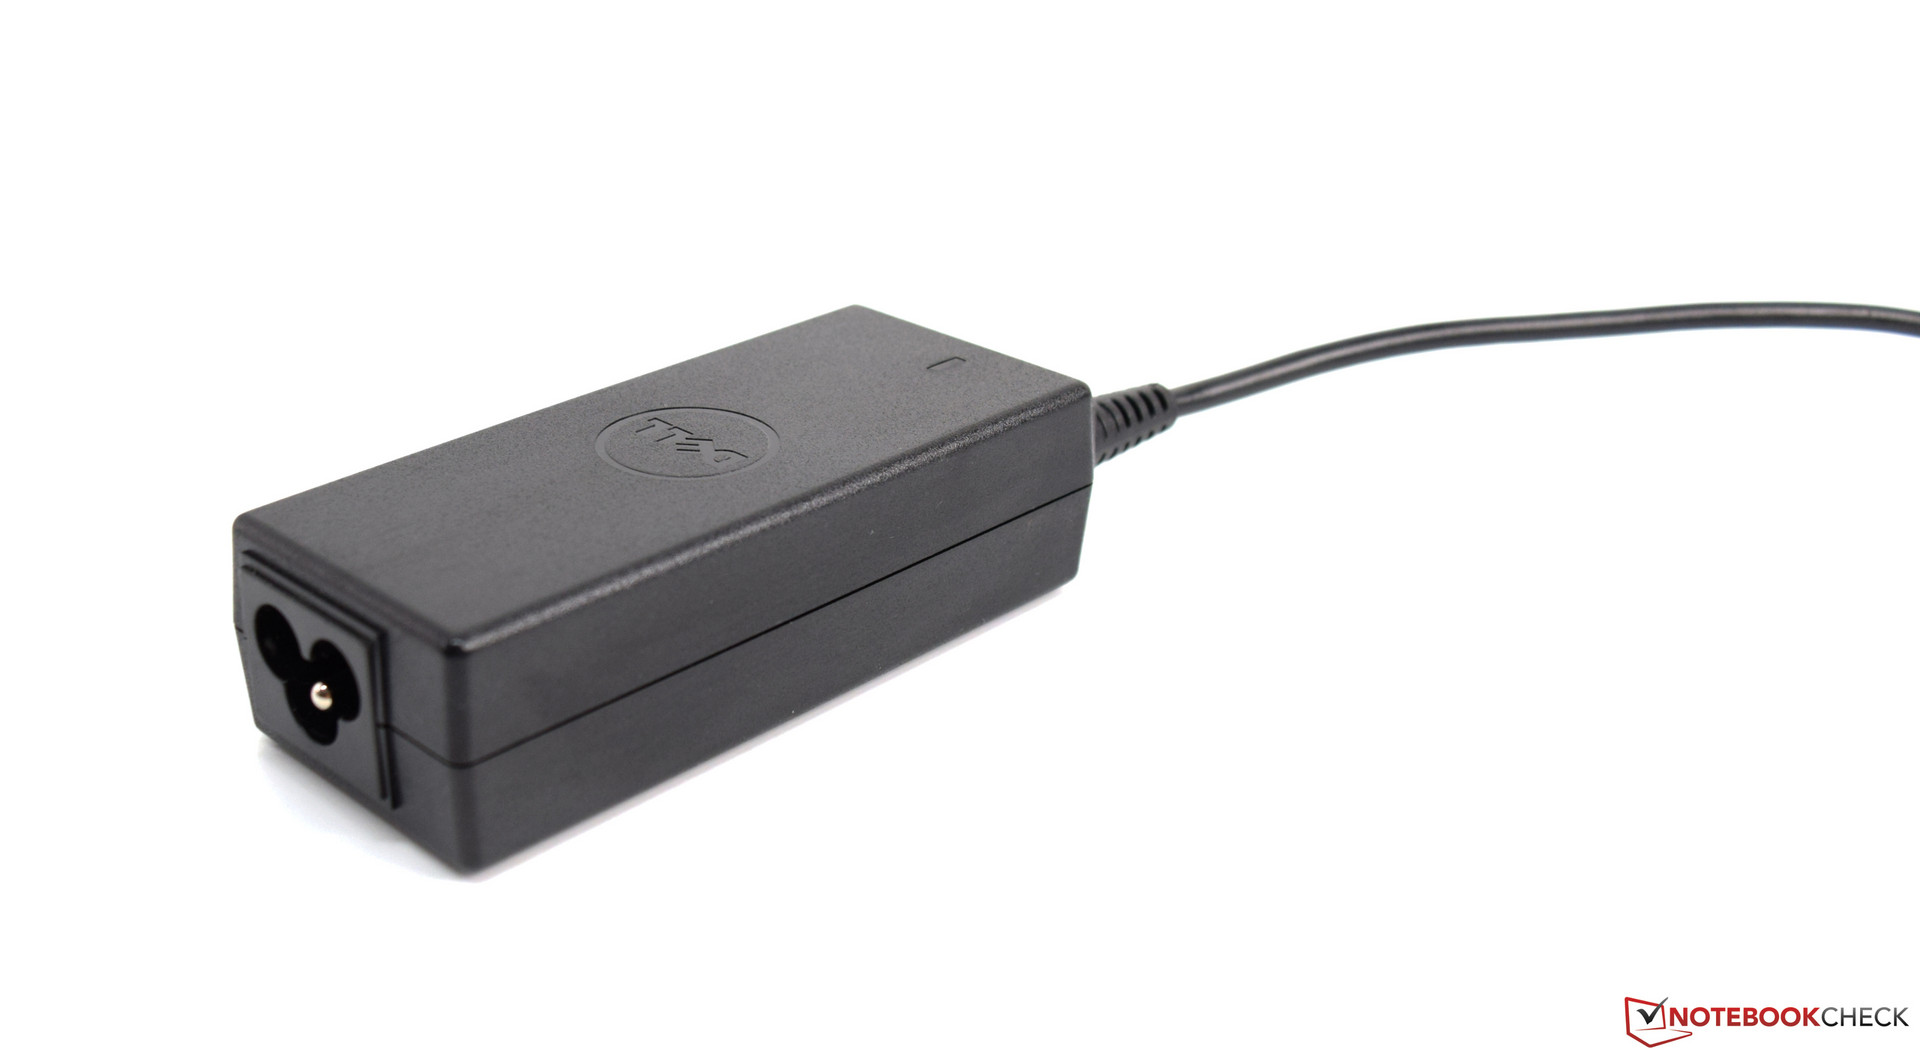
With a footprint of 38.1 x 25.3 cm (15 in x 10 in) the 5579 was by far the largest device in our test group. However, we should also note that the Acer Spin 3 and Lenovo ThinkPad L380 are 14 and 13.3-inch notebooks, respectively. The scale stopped at 2.1 kg (4.6 lbs) for the notebook itself and 269 g (9.5 oz) for the charger.
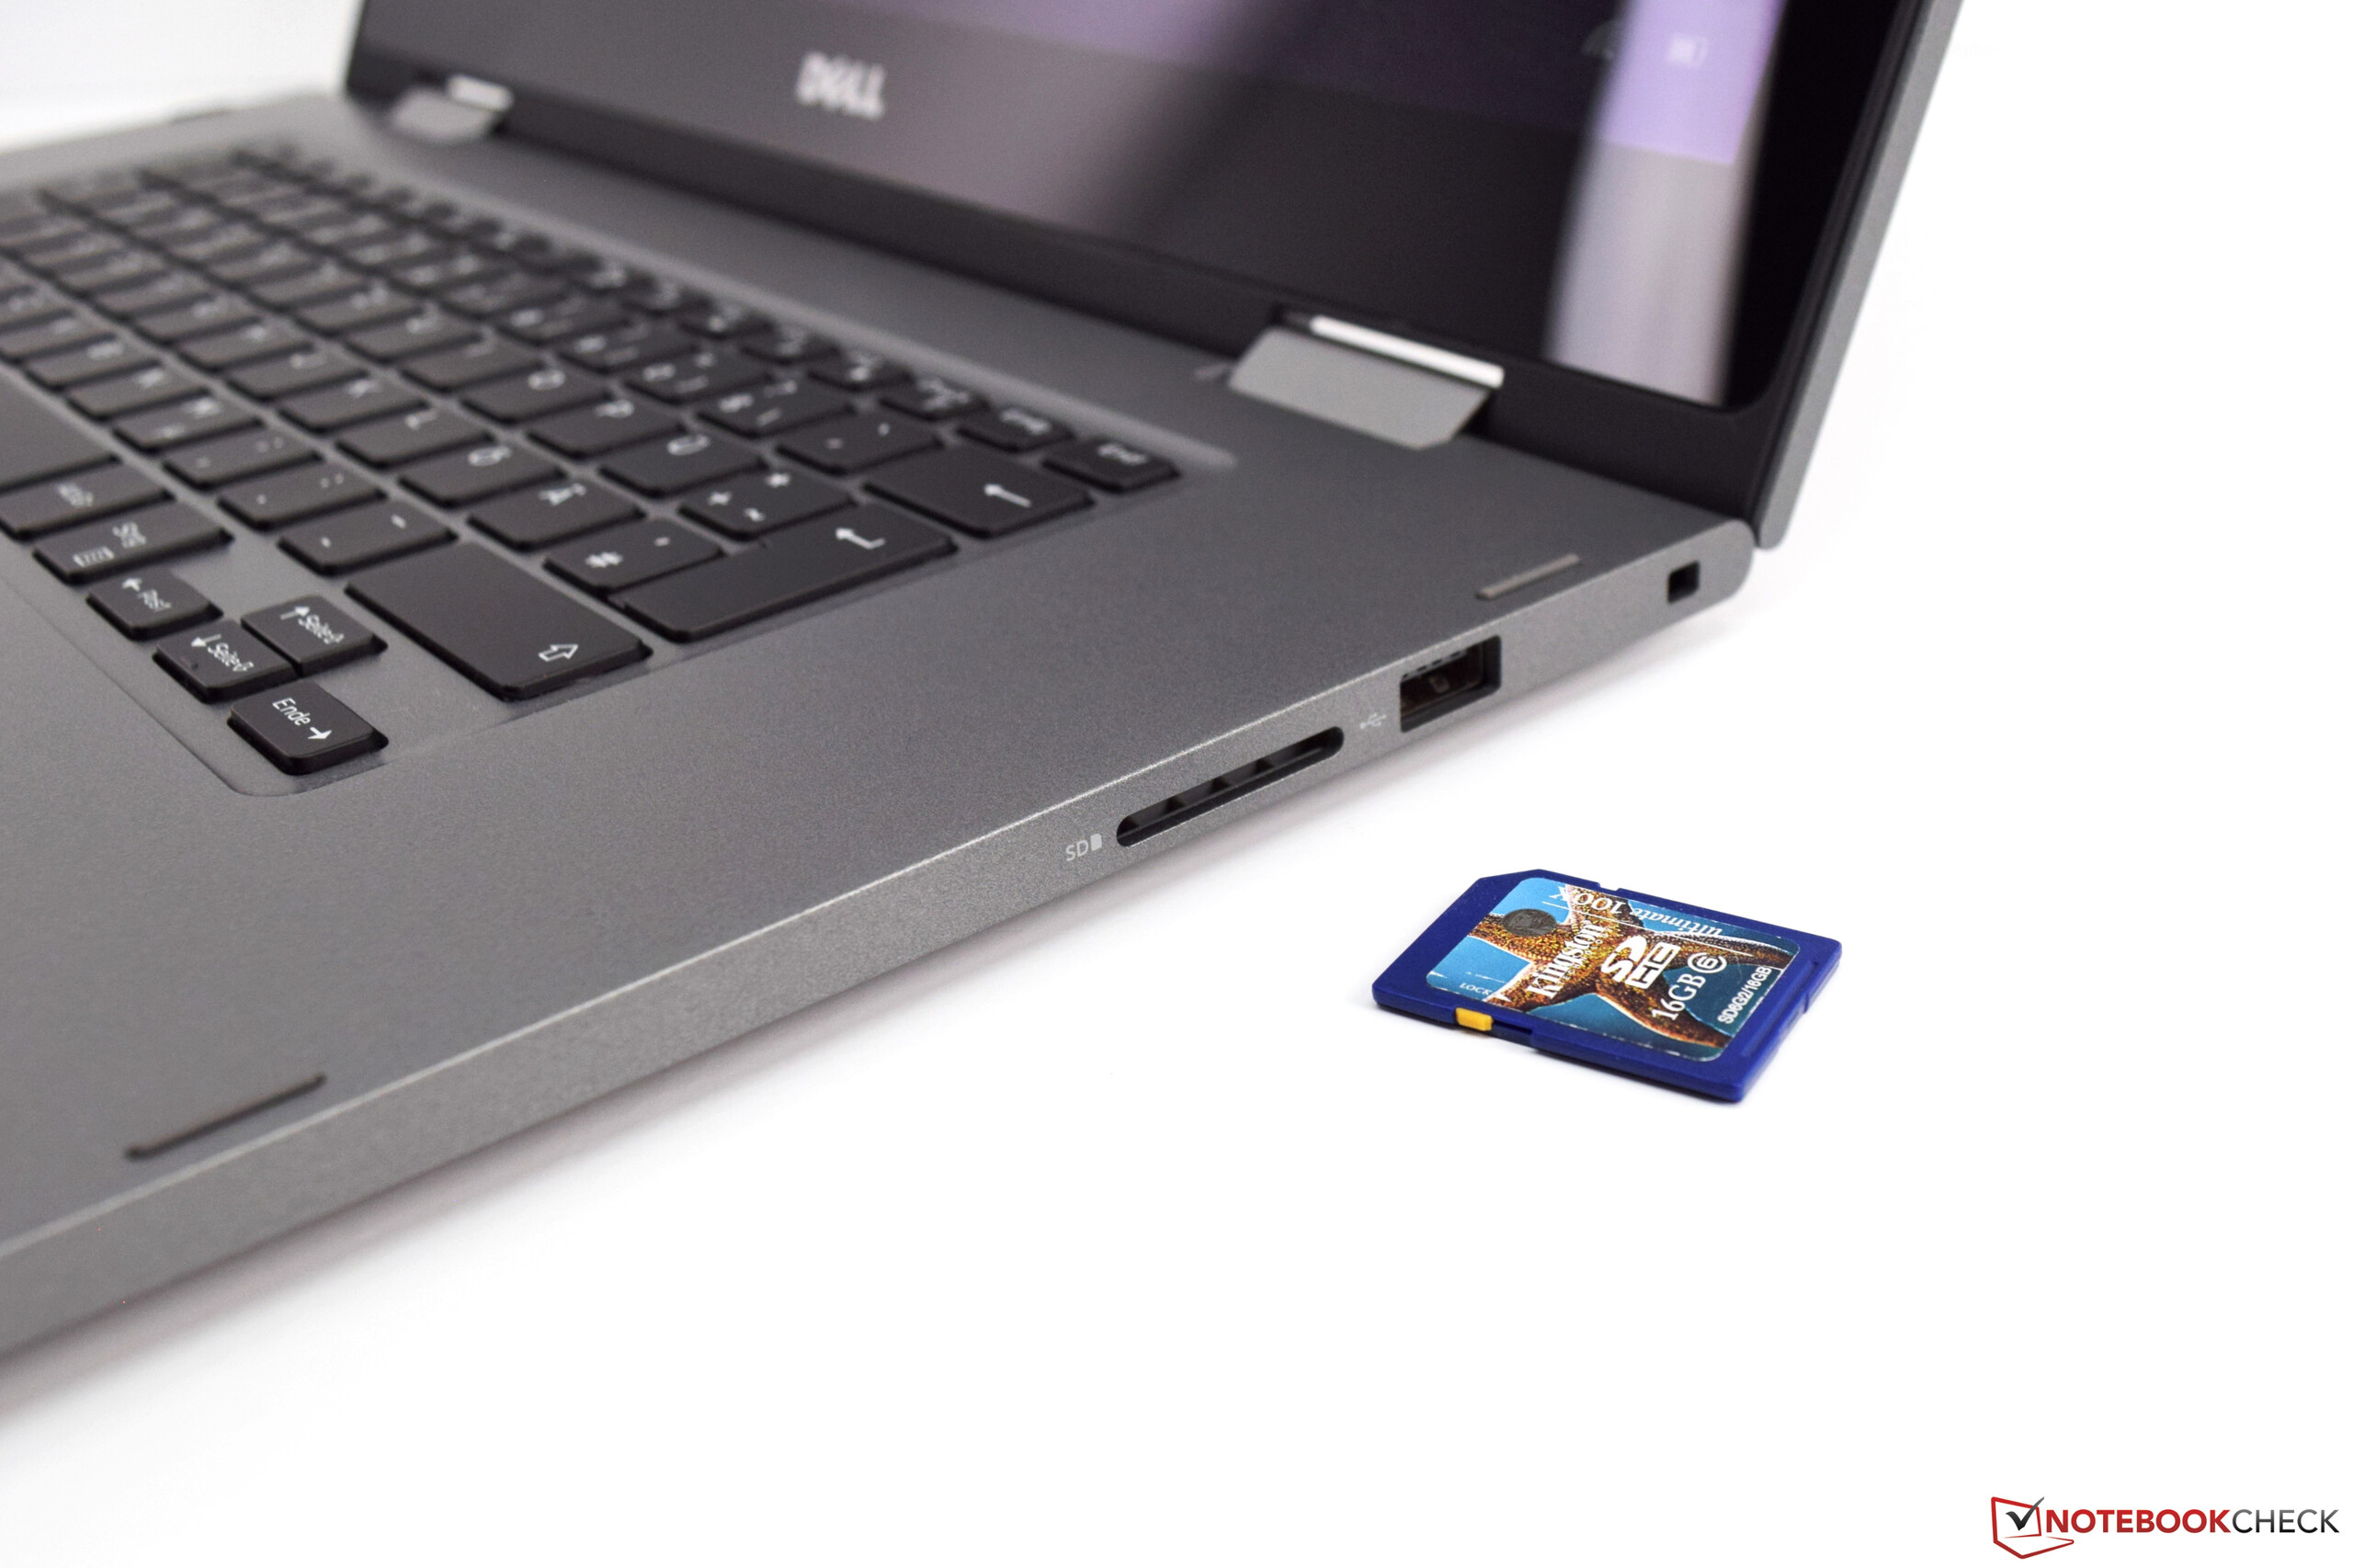
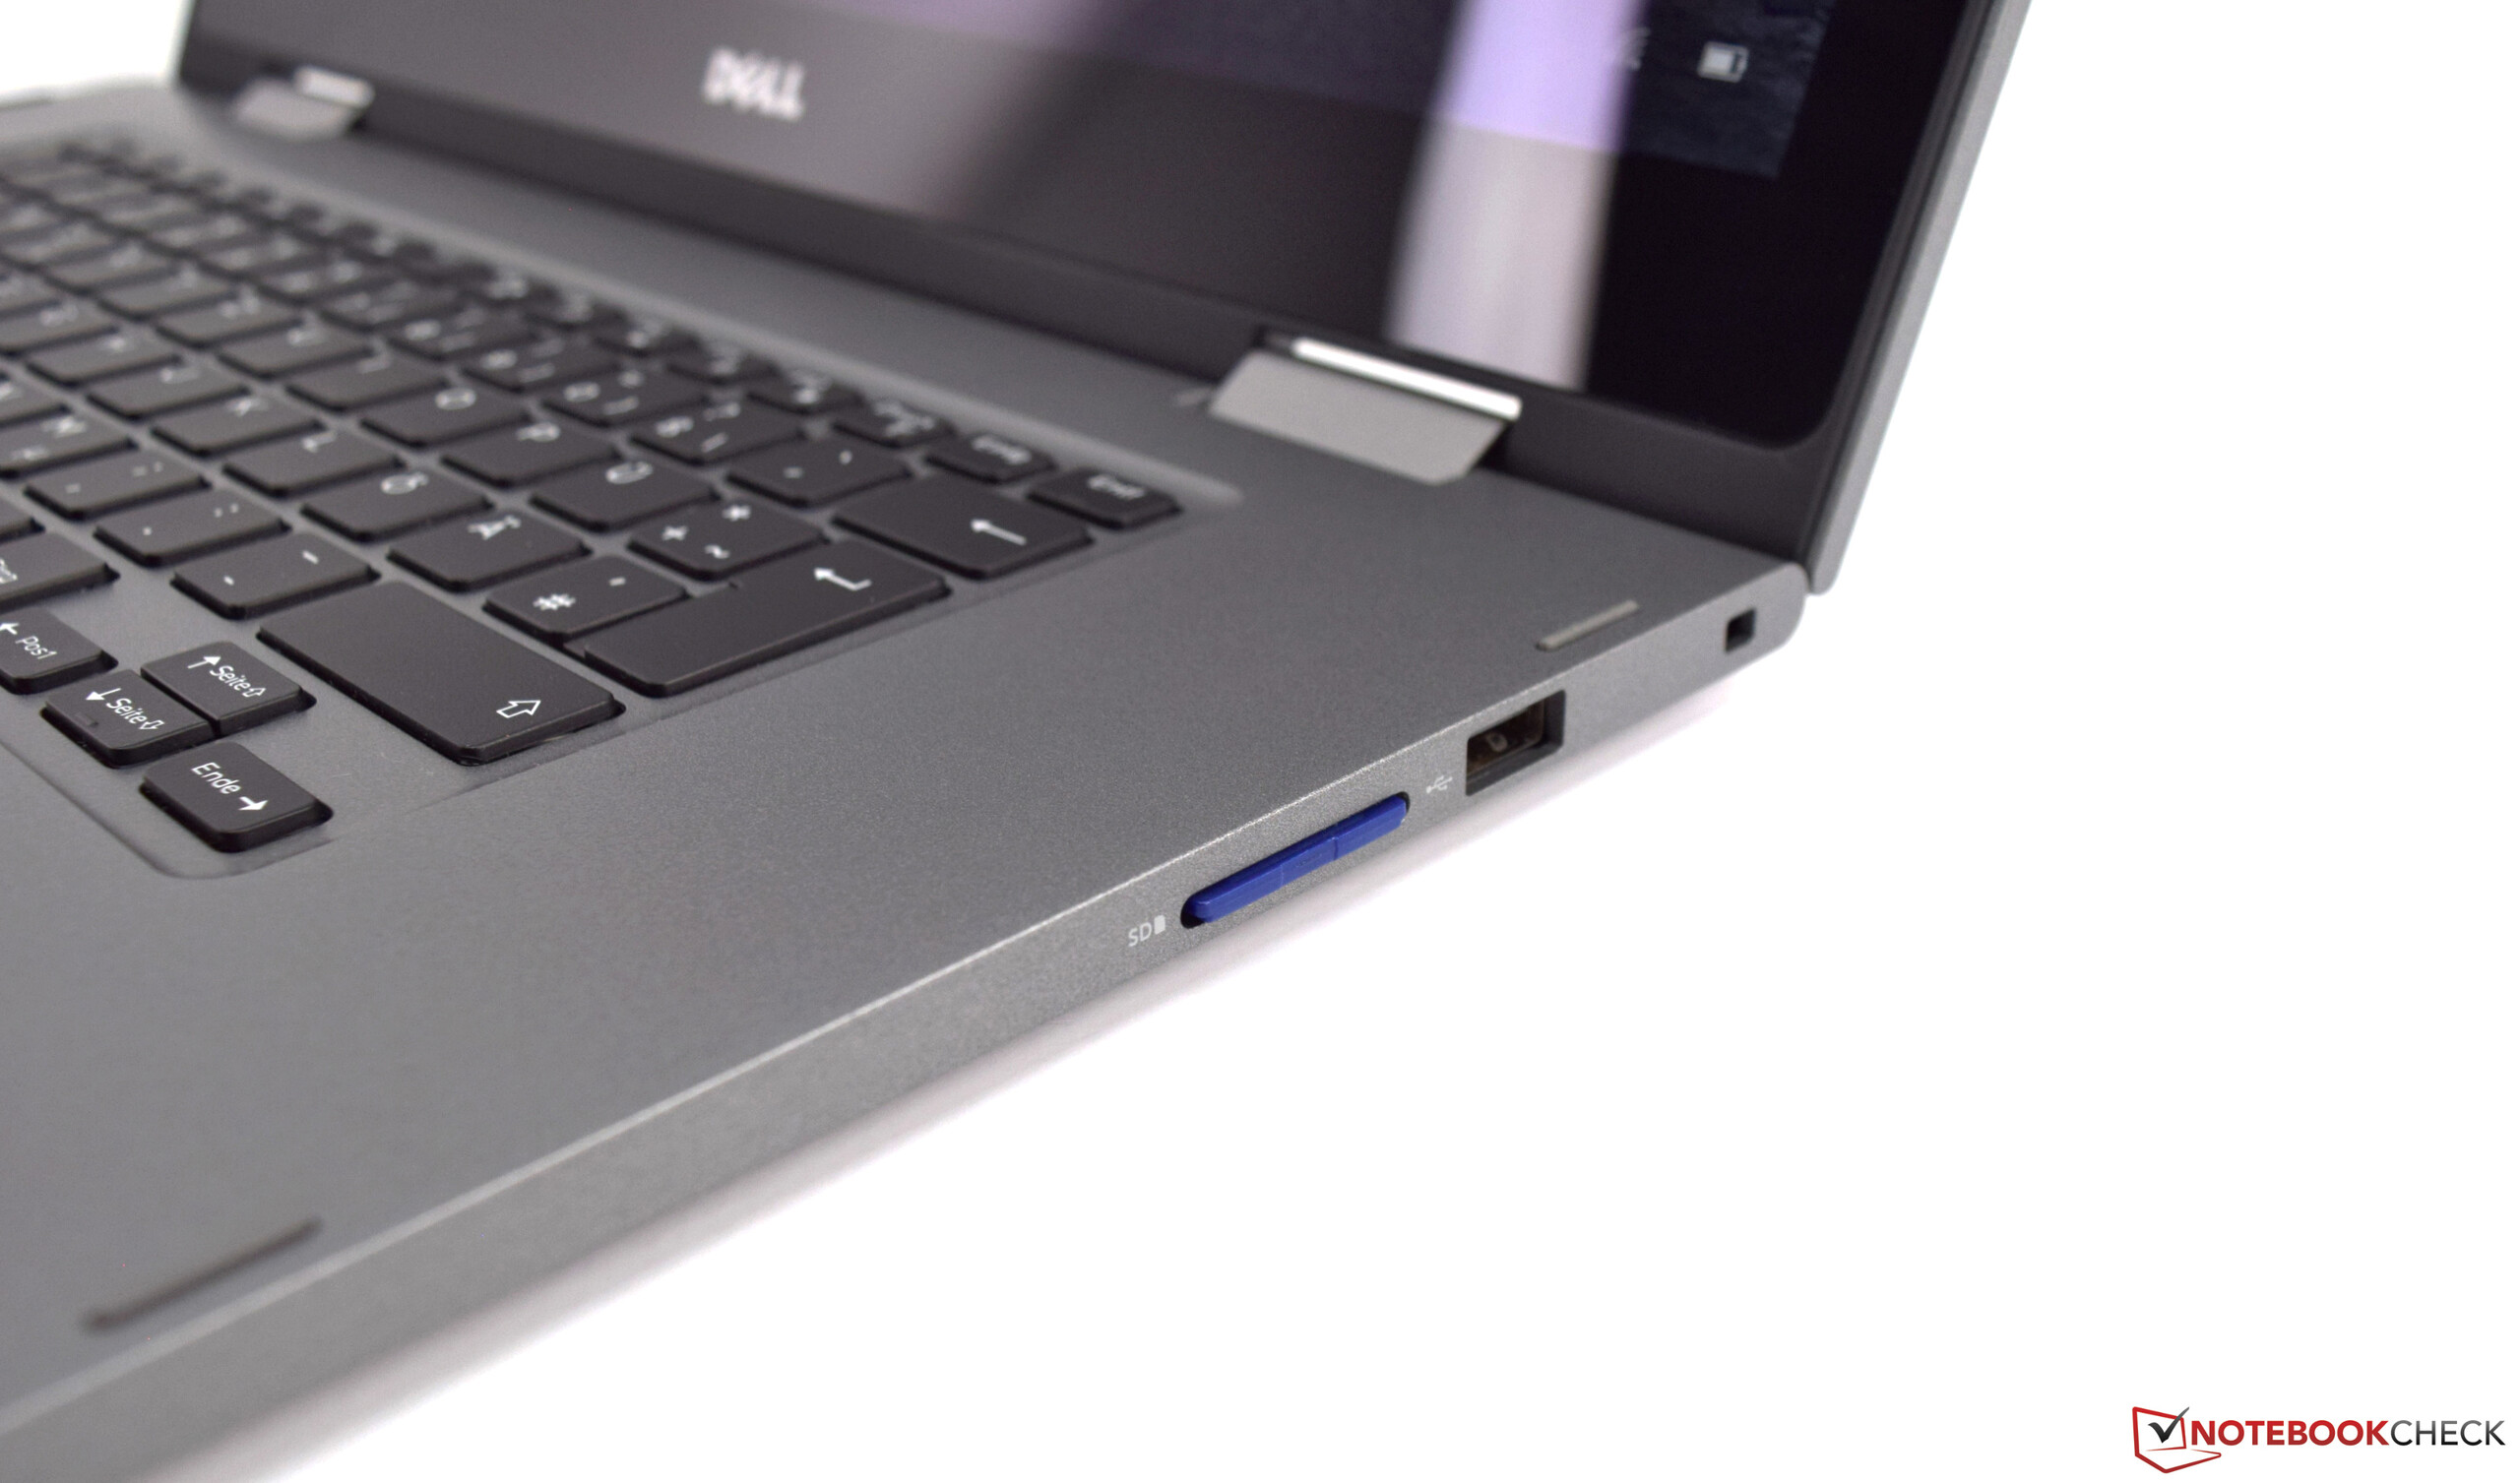
Connectivity
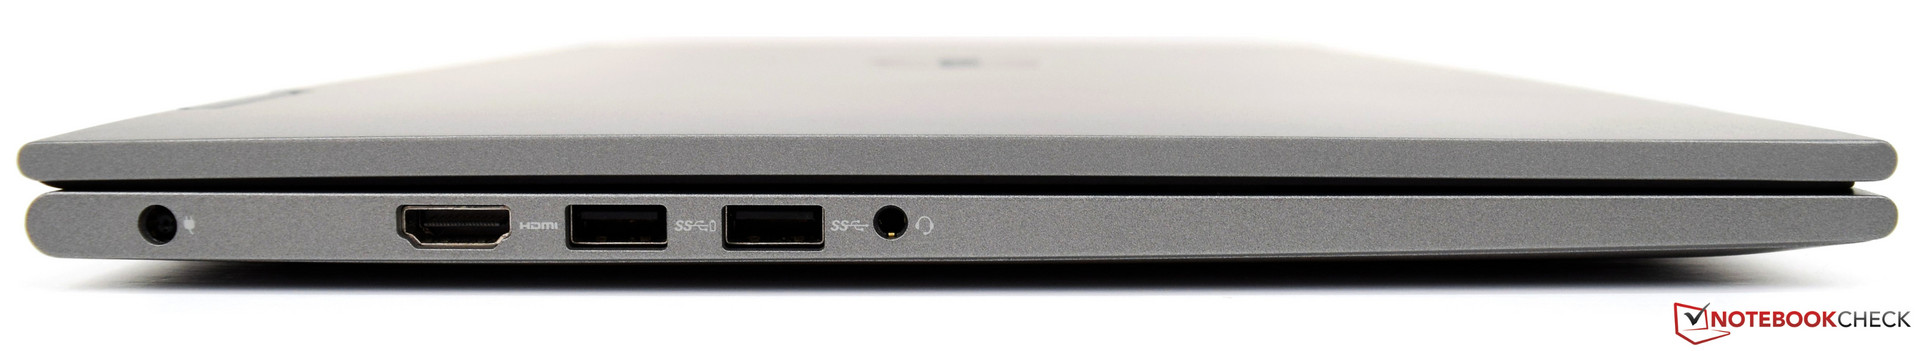
In terms of connectivity, the 5579 turned out to be pretty vanilla. More specifically, one of its three USB ports offers USB 2.0 speeds only, and in addition all you will find is an HDMI port and an SD card reader. USB-C or DisplayPort are still nowhere to be seen.
At least the ports are spread out more or less evenly on both sides, located towards the rear of the device, and they are spaced widely apart.
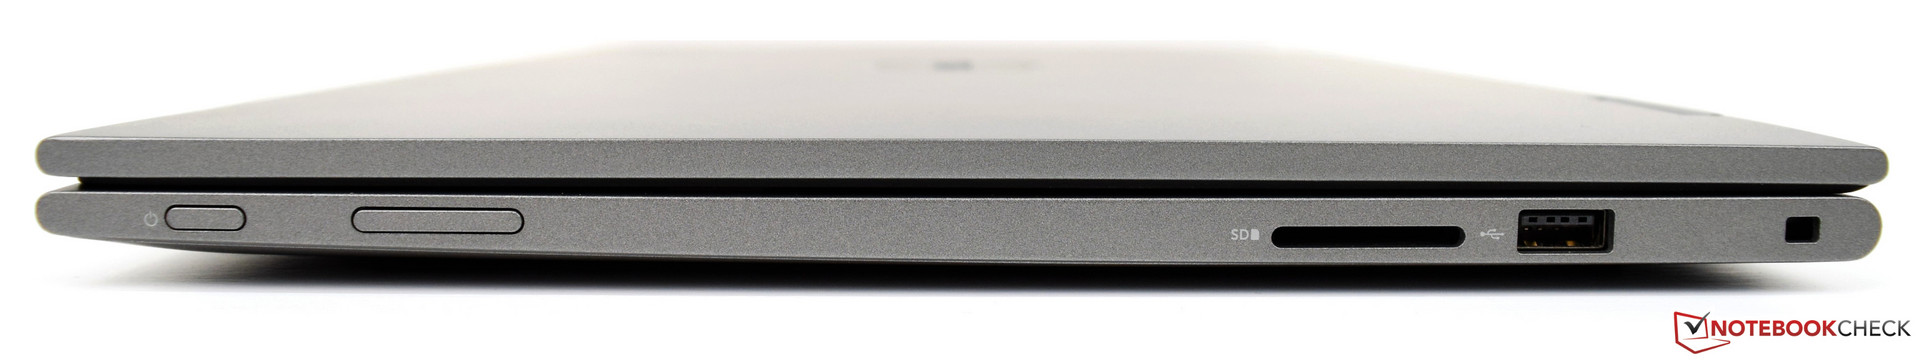
SD Card Reader
The Dell Inspiron 15 5579’s SD card reader supports all current formats. Our benchmarks showed that it is connected to the chipset’s USB 2.0 interface, and it was thus not any faster than on the predecessor. The benchmarks were performed using our 64 GB Toshiba Exceria Pro SDXC UHS-II reference card.
| SD Card Reader | |
| average JPG Copy Test (av. of 3 runs) | |
| Lenovo ThinkPad L380 Yoga-20M7001BGE (Toshiba Exceria Pro M501 microSDXC 64GB) | |
| HP Envy x360 15-bq102ng (Toshiba Exceria Pro SDXC 64 GB UHS-II) | |
| Average of class Convertible (28.1 - 197, n=23, last 2 years) | |
| Dell Inspiron 15 5578-1777 2-in-1 (Toshiba Exceria Pro SDXC 64 GB UHS-II) | |
| Dell Inspiron 15 5579-9672 (Toshiba Exceria Pro SDXC 64 GB UHS-II) | |
| Asus VivoBook Flip 15 TP510UA-E8073T (Toshiba Exceria Pro SDXC 64 GB UHS-II) | |
| Acer Spin 3 SP314-51-548L (Toshiba Exceria Pro SDXC 64 GB UHS-II) | |
| maximum AS SSD Seq Read Test (1GB) | |
| Average of class Convertible (28.9 - 254, n=22, last 2 years) | |
| Lenovo ThinkPad L380 Yoga-20M7001BGE (Toshiba Exceria Pro M501 microSDXC 64GB) | |
| HP Envy x360 15-bq102ng (Toshiba Exceria Pro SDXC 64 GB UHS-II) | |
| Dell Inspiron 15 5578-1777 2-in-1 (Toshiba Exceria Pro SDXC 64 GB UHS-II) | |
| Dell Inspiron 15 5579-9672 (Toshiba Exceria Pro SDXC 64 GB UHS-II) | |
| Asus VivoBook Flip 15 TP510UA-E8073T (Toshiba Exceria Pro SDXC 64 GB UHS-II) | |
| Acer Spin 3 SP314-51-548L (Toshiba Exceria Pro SDXC 64 GB UHS-II) | |
Communication
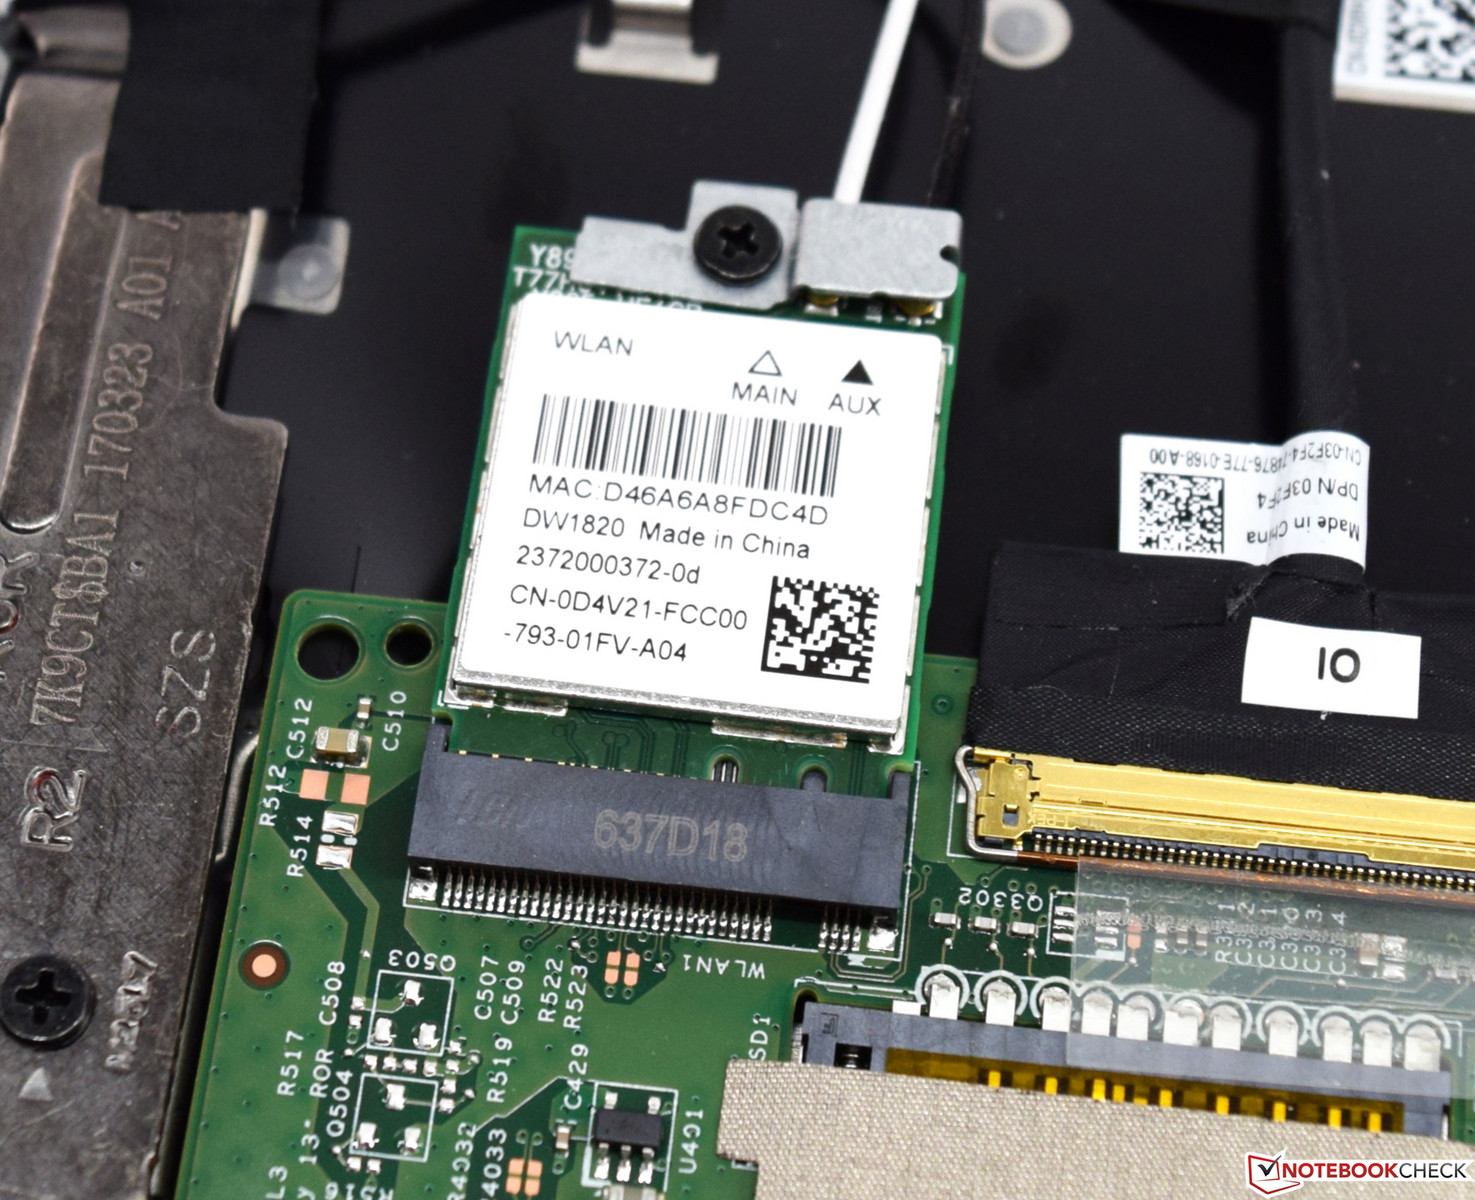
Wireless communication is handled by a Qualcomm Wi-Fi modem with support for 2x2 802.11 ac and Bluetooth 4.1. The 5579 performed very well in our Wi-Fi benchmarks under ideal conditions, but so did most of its competitors. We have been able to determine maximum RX and TX rates of 657 and 612 Mb/s, respectively. Wi-Fi performance has thus been improved quite remarkably.
Other ways to connect to networks are not supported by Dell’s convertible, and a USB dongle will be necessary in order to connect via Ethernet cable as the device does not have a standard RJ45 Ethernet port.
The 5579 did not come equipped with an LTE modem, and unfortunately it cannot be installed retroactively either.
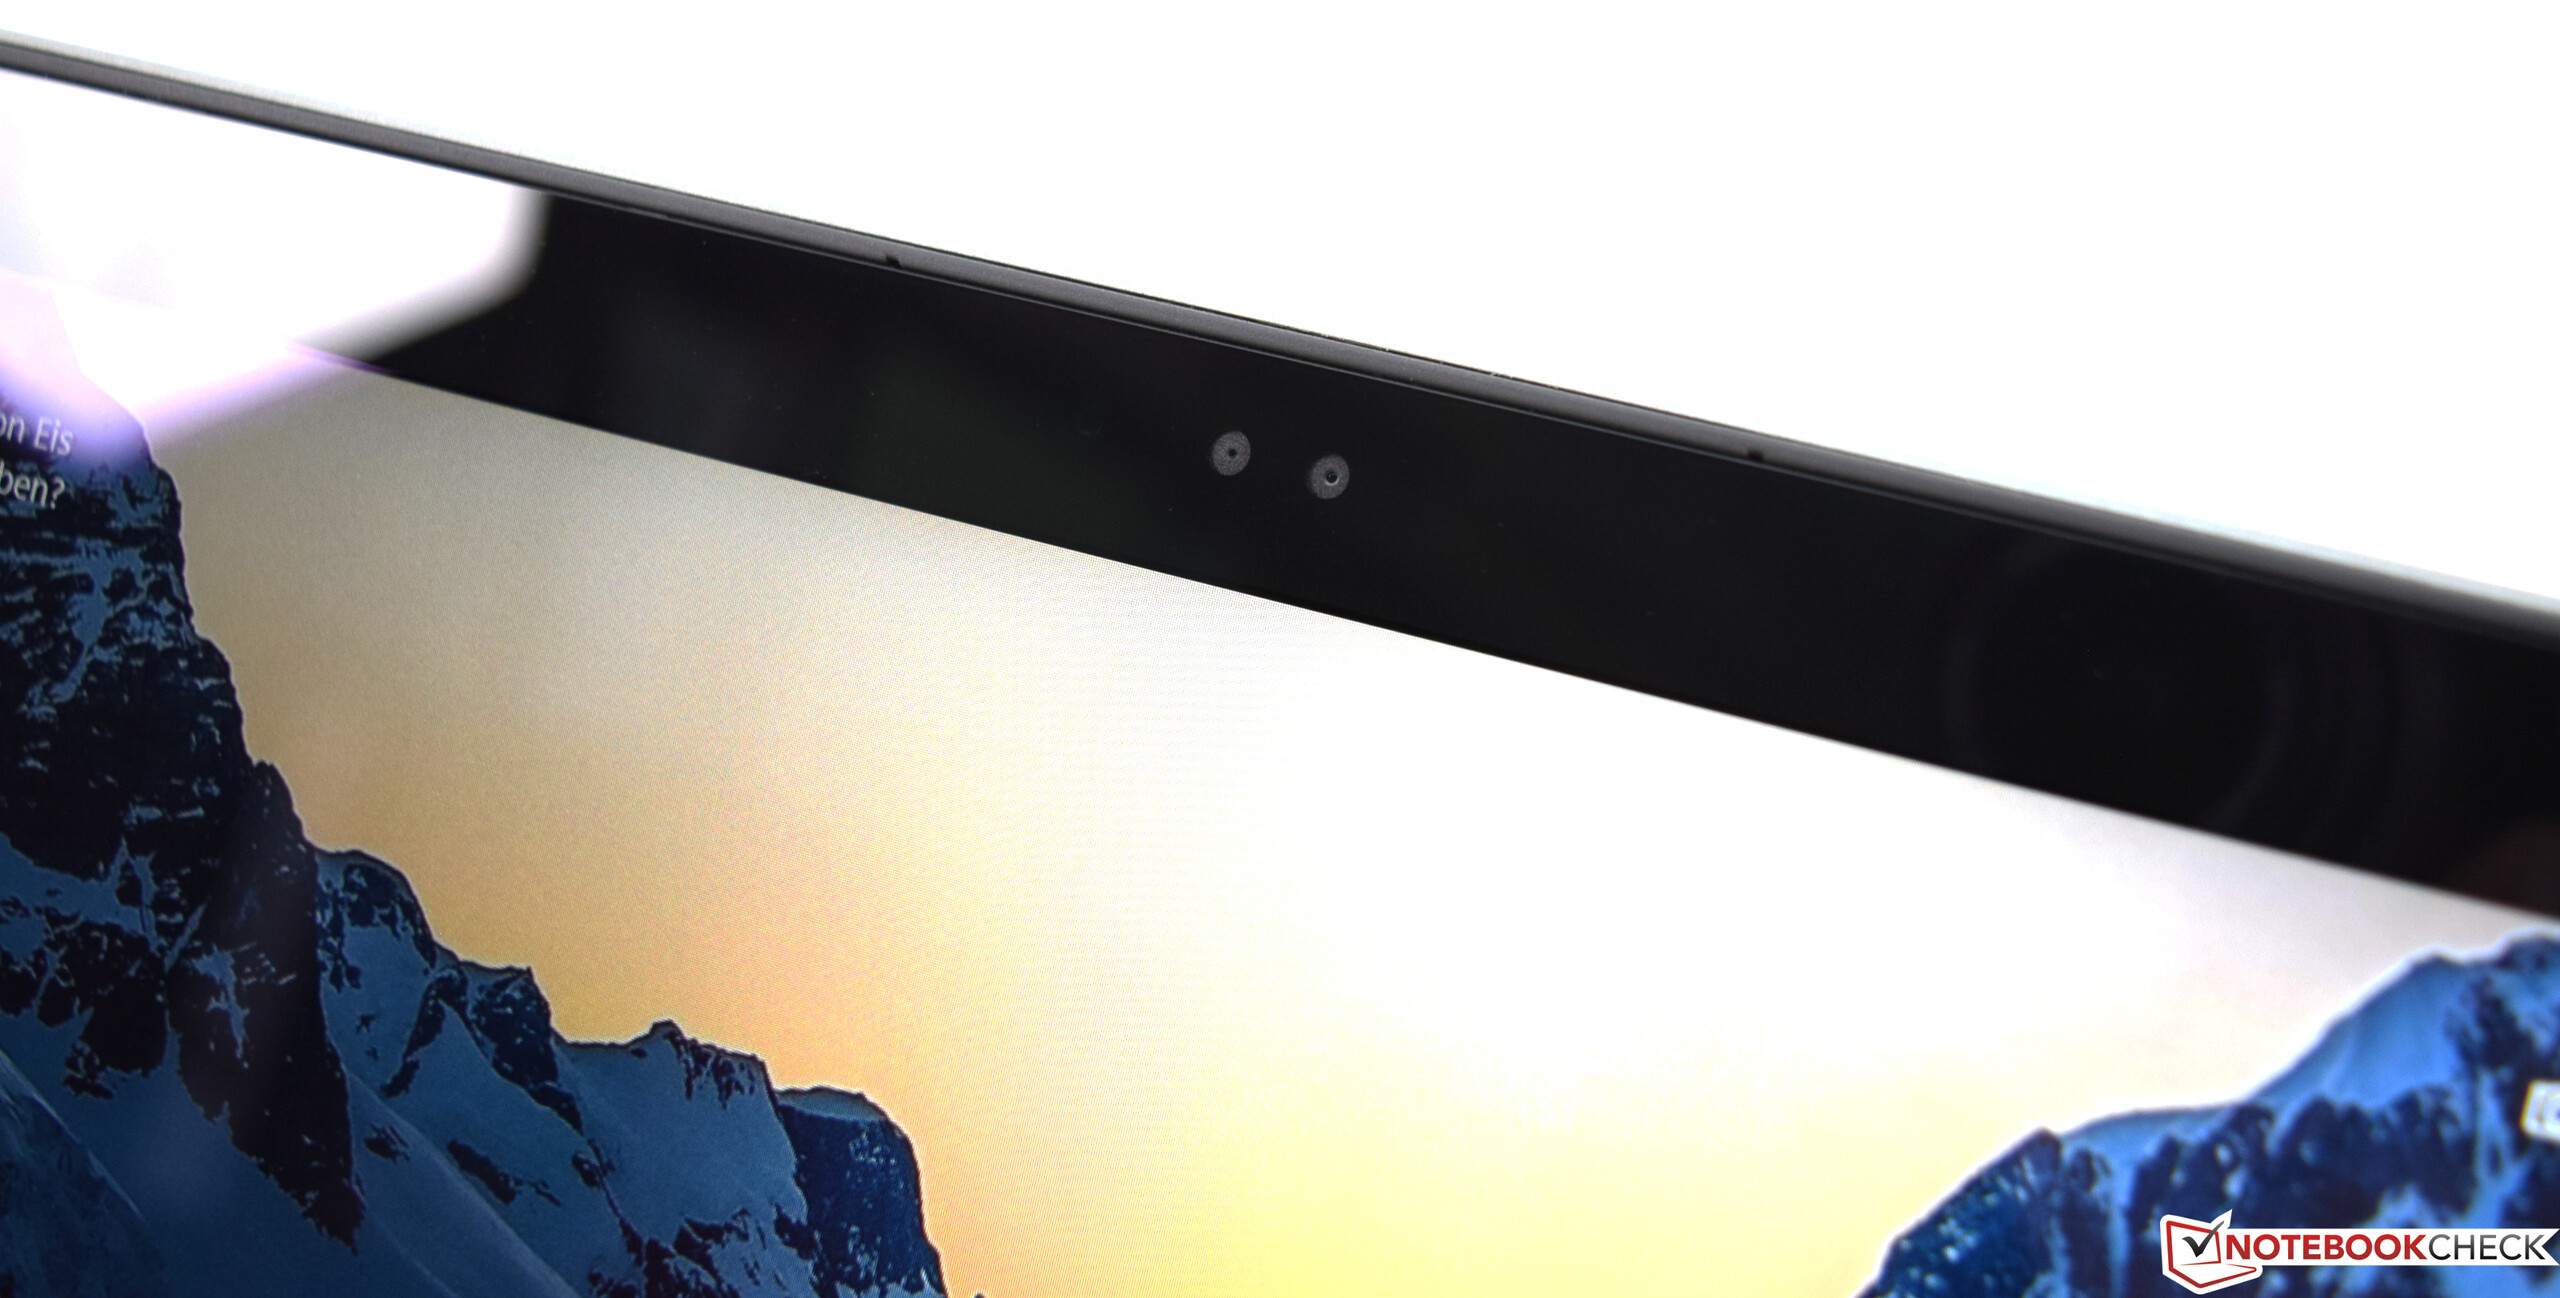
Security
Security features include a TPM chip and an infrared camera with support for Windows Hello. Face detection worked very well and reliably once it was set up. Also included is a 12-month subscription to McAfee LiteSafe. The upgrade to a three-year subscription can be added at the time of purchase for another $70.
Accessories
In terms of accessories the choices are slim pickings. Included in the box are the notebook itself, a power supply, and several warranty information and safety booklets and leaflets. All other accessories have to be purchased separately, for example Dell’s D3100 USB 3.0 docking station for $139. Unfortunately, the 5579 does not support active stylus pens. The only option is a passive stylus, such as the Targus Stylus for Media Tablets for $16.
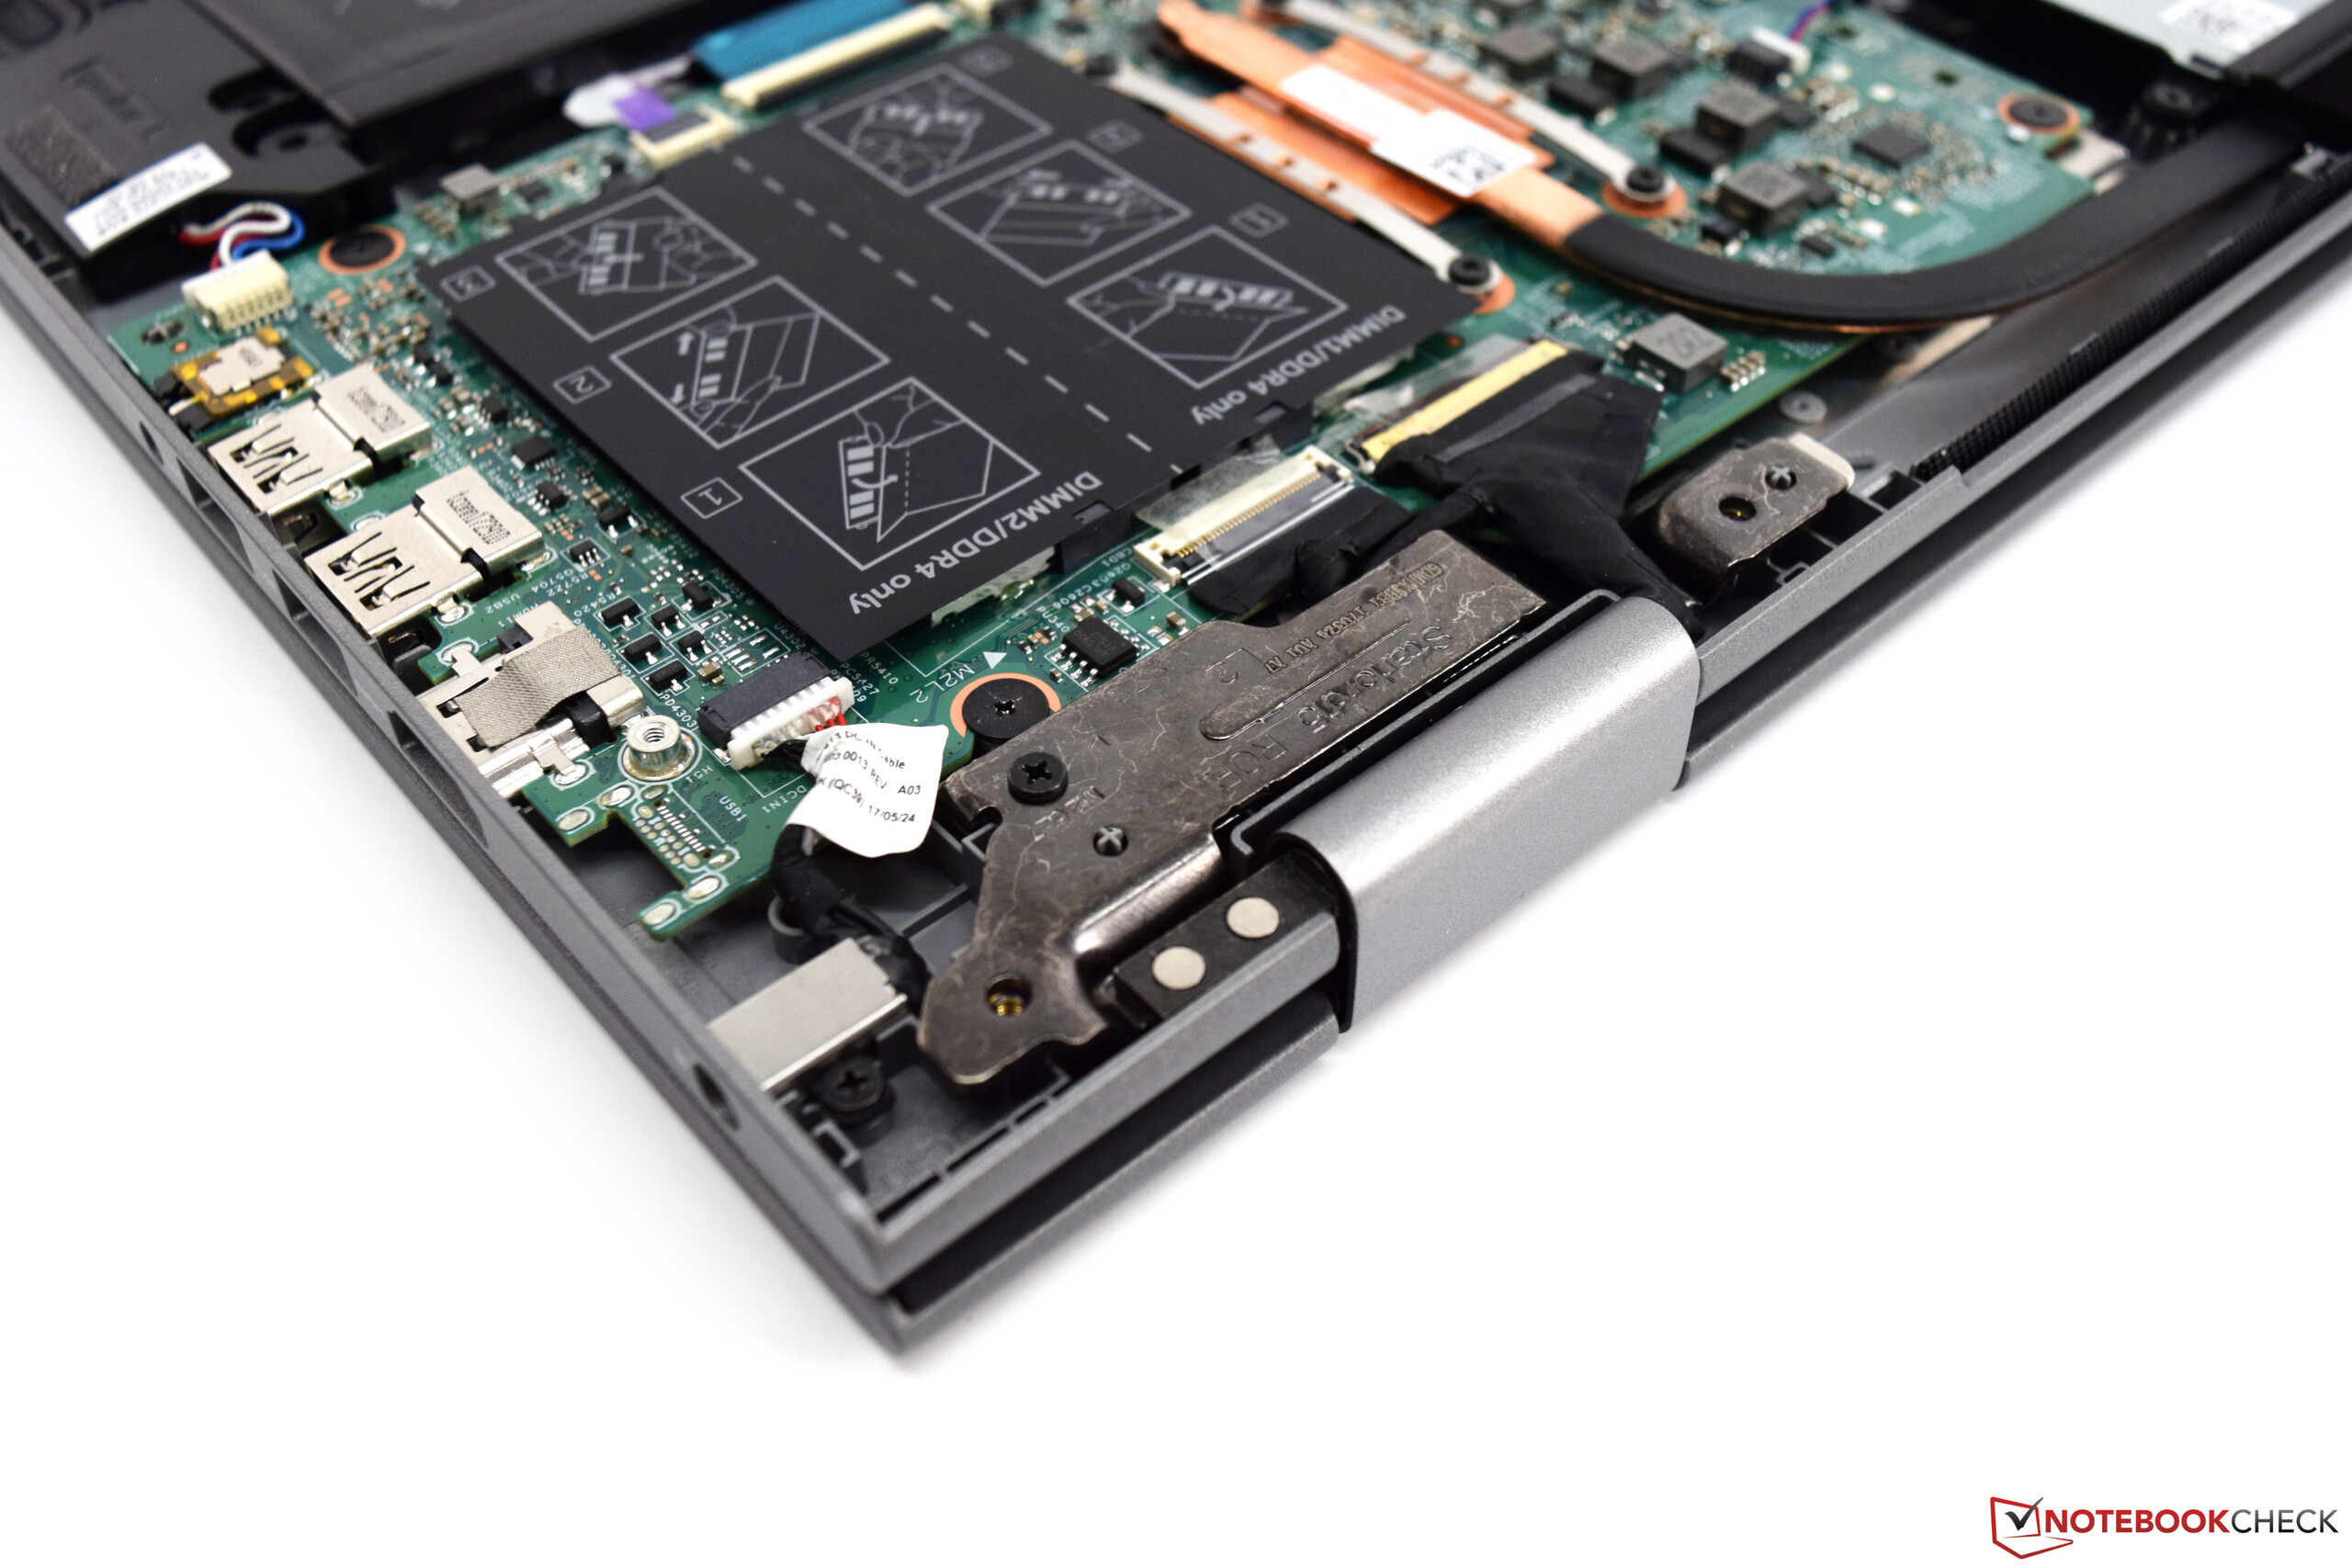
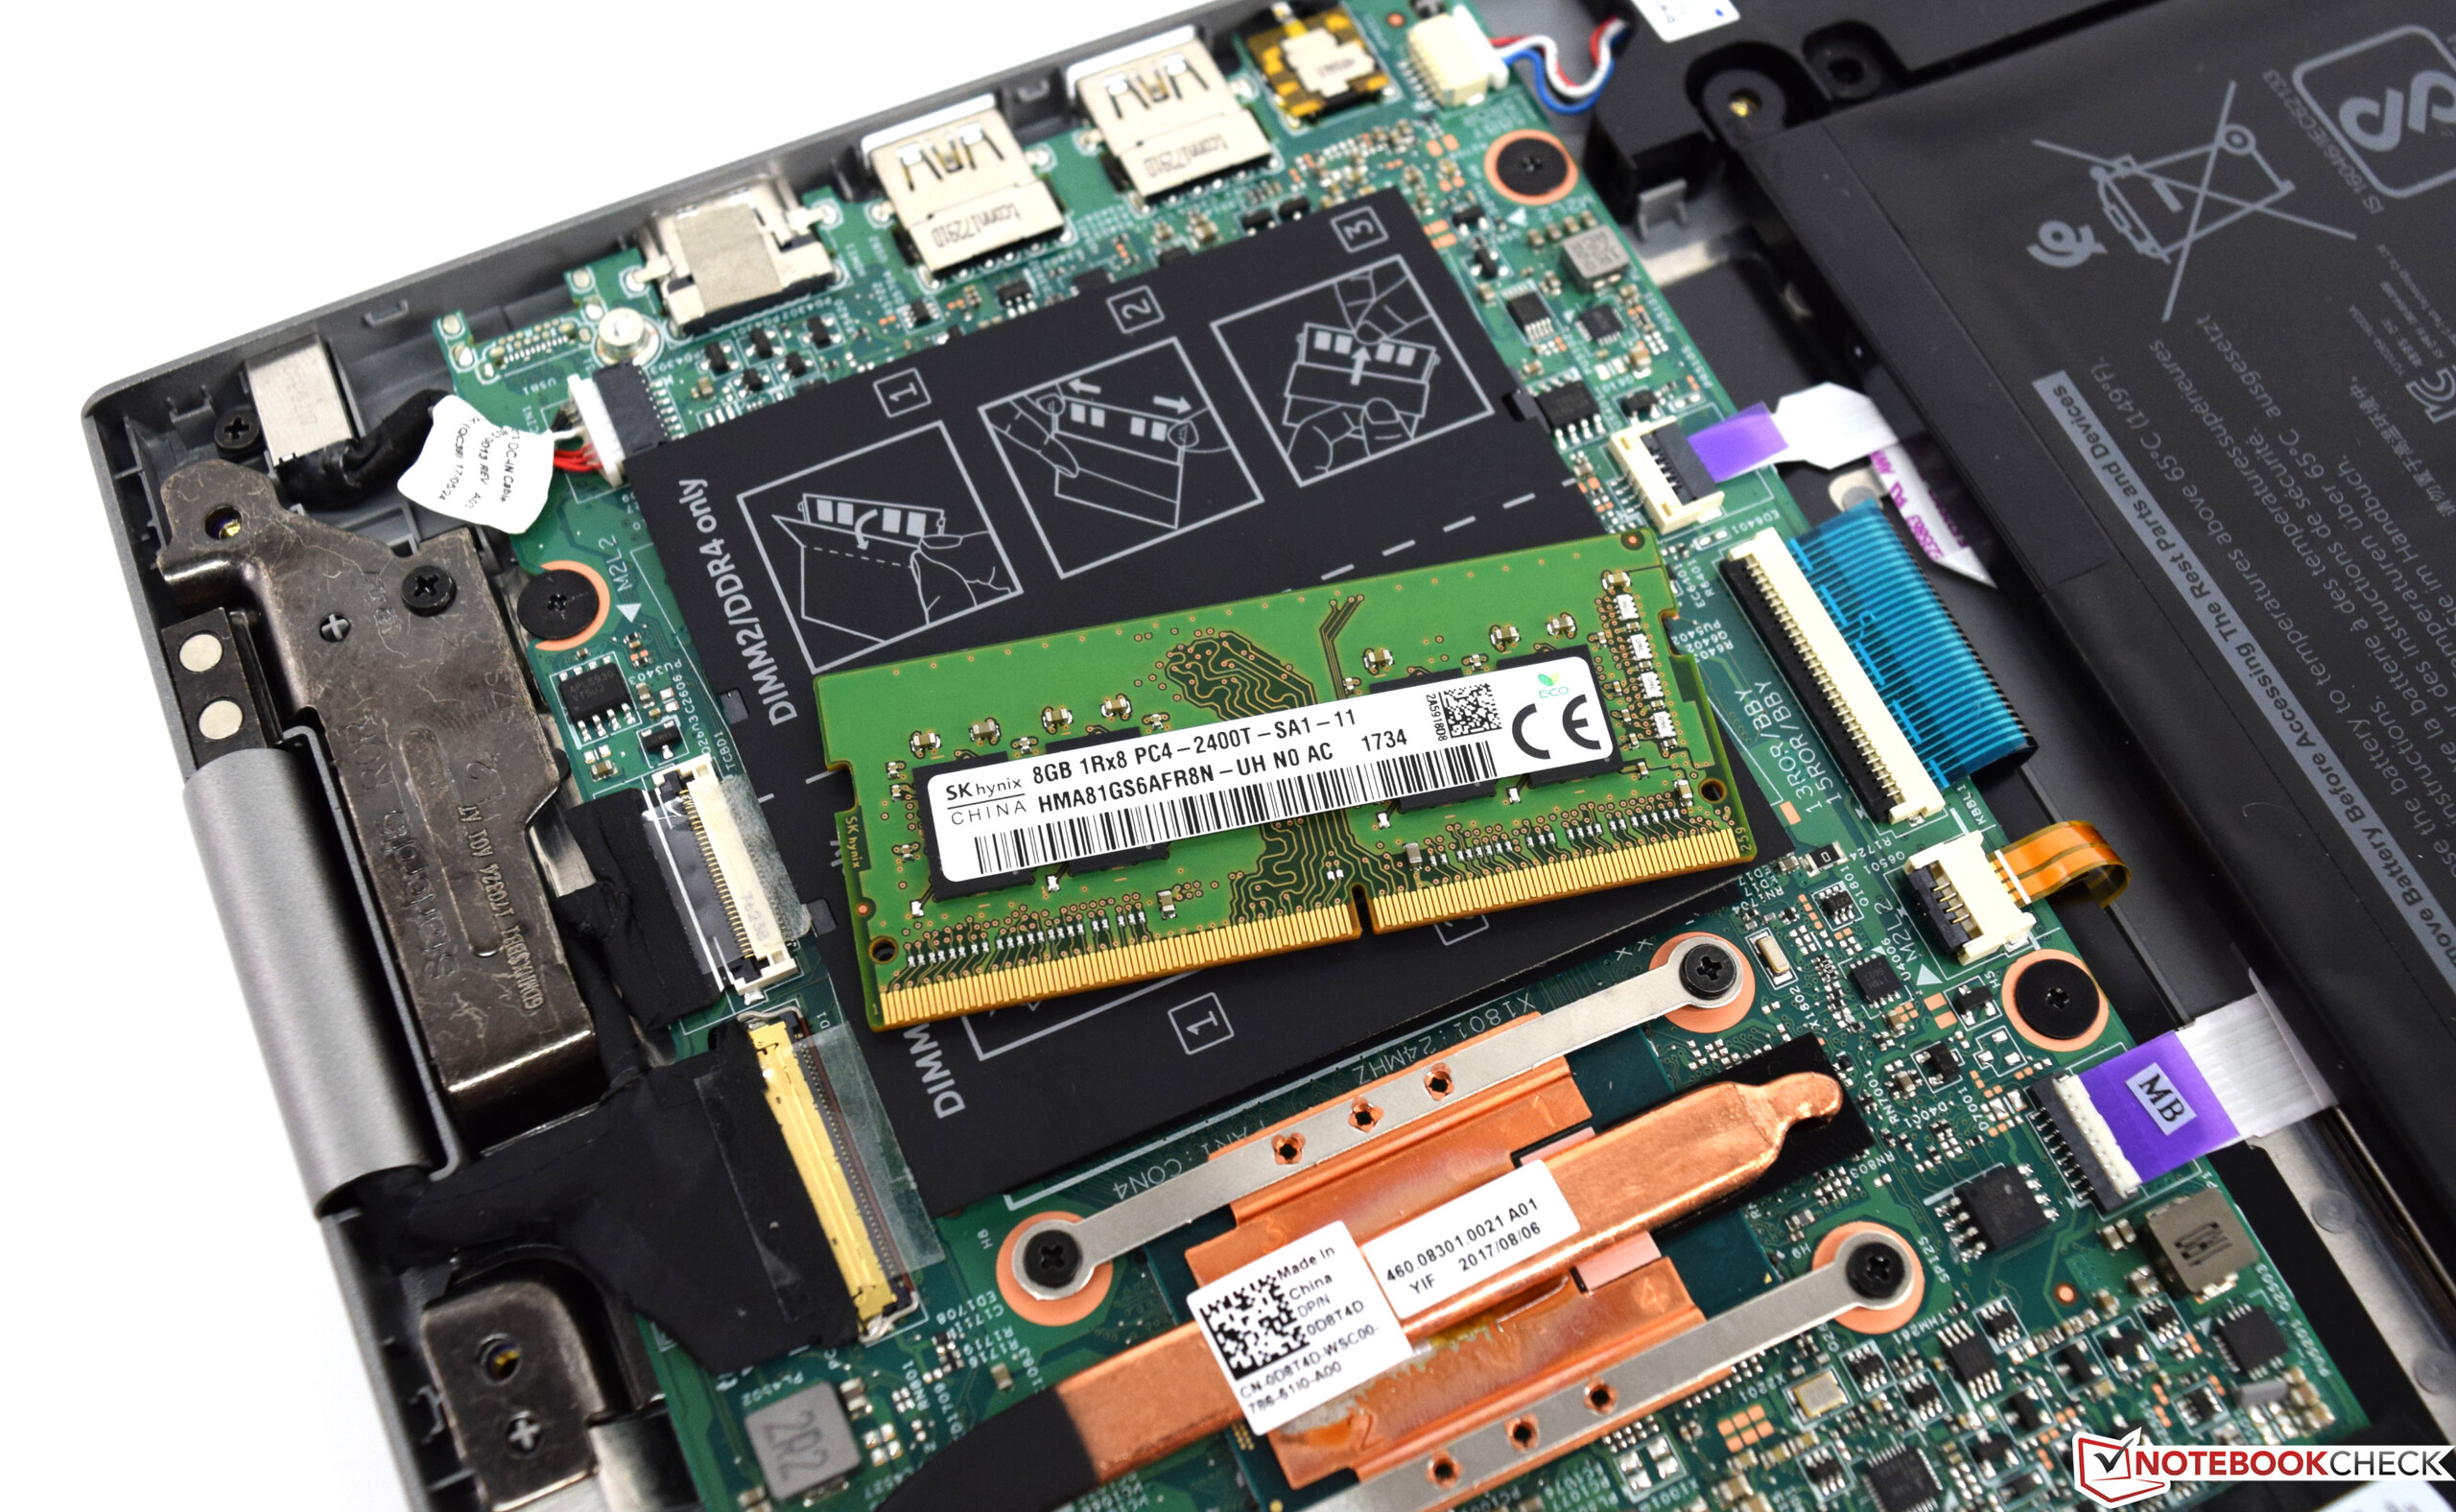
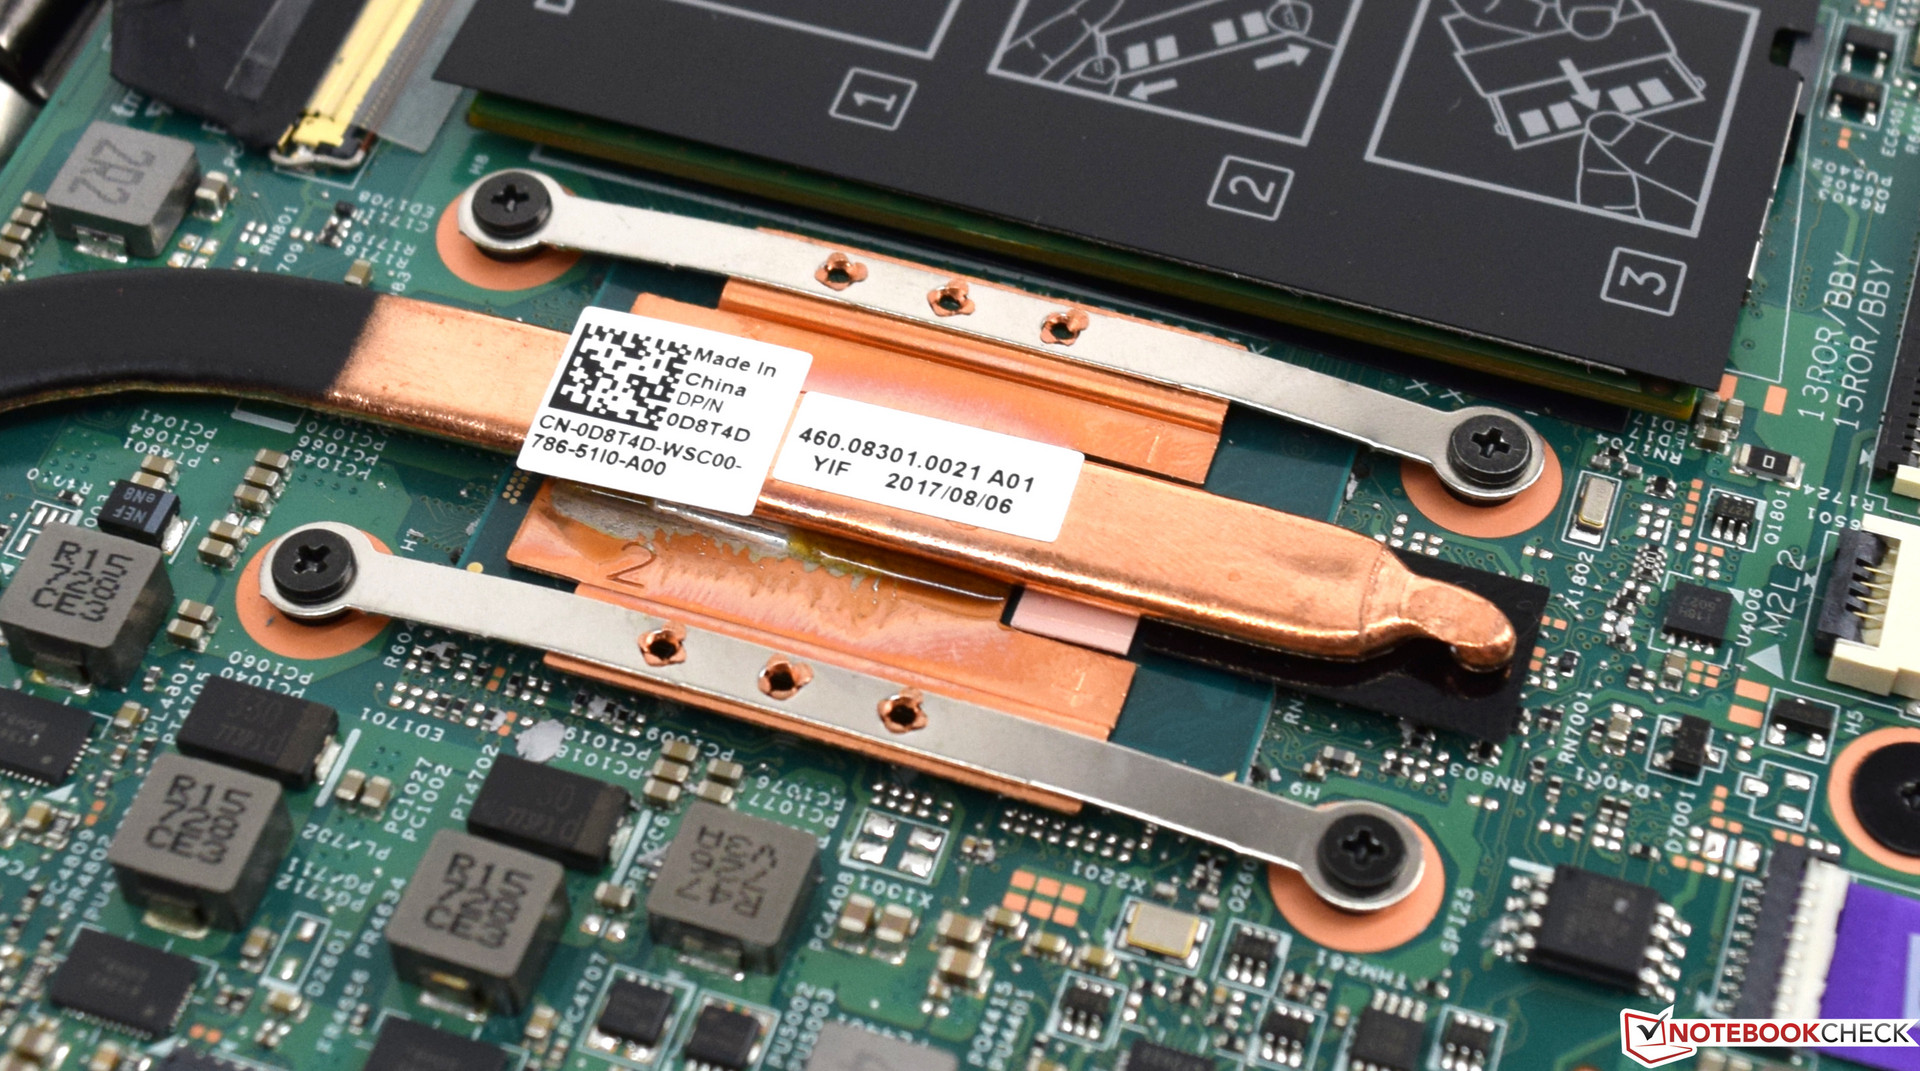
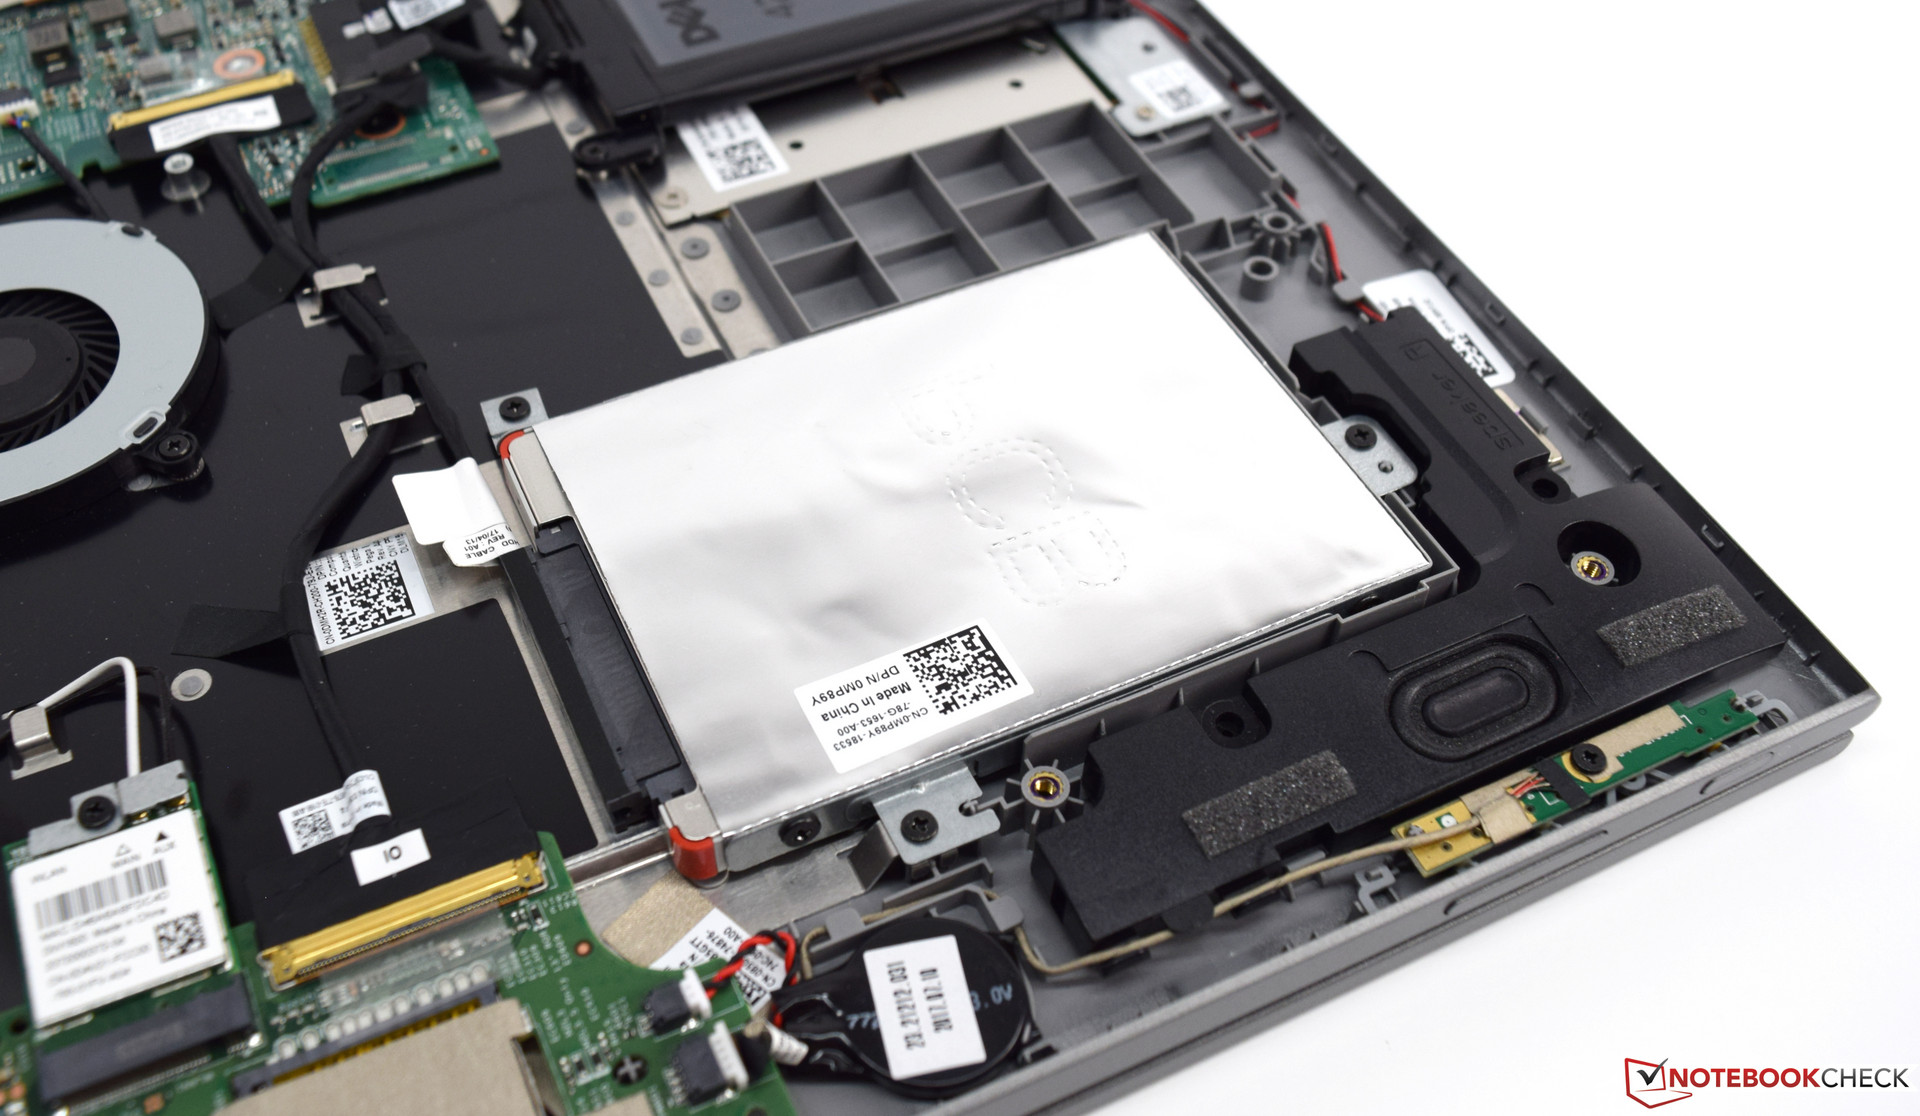
Maintenance
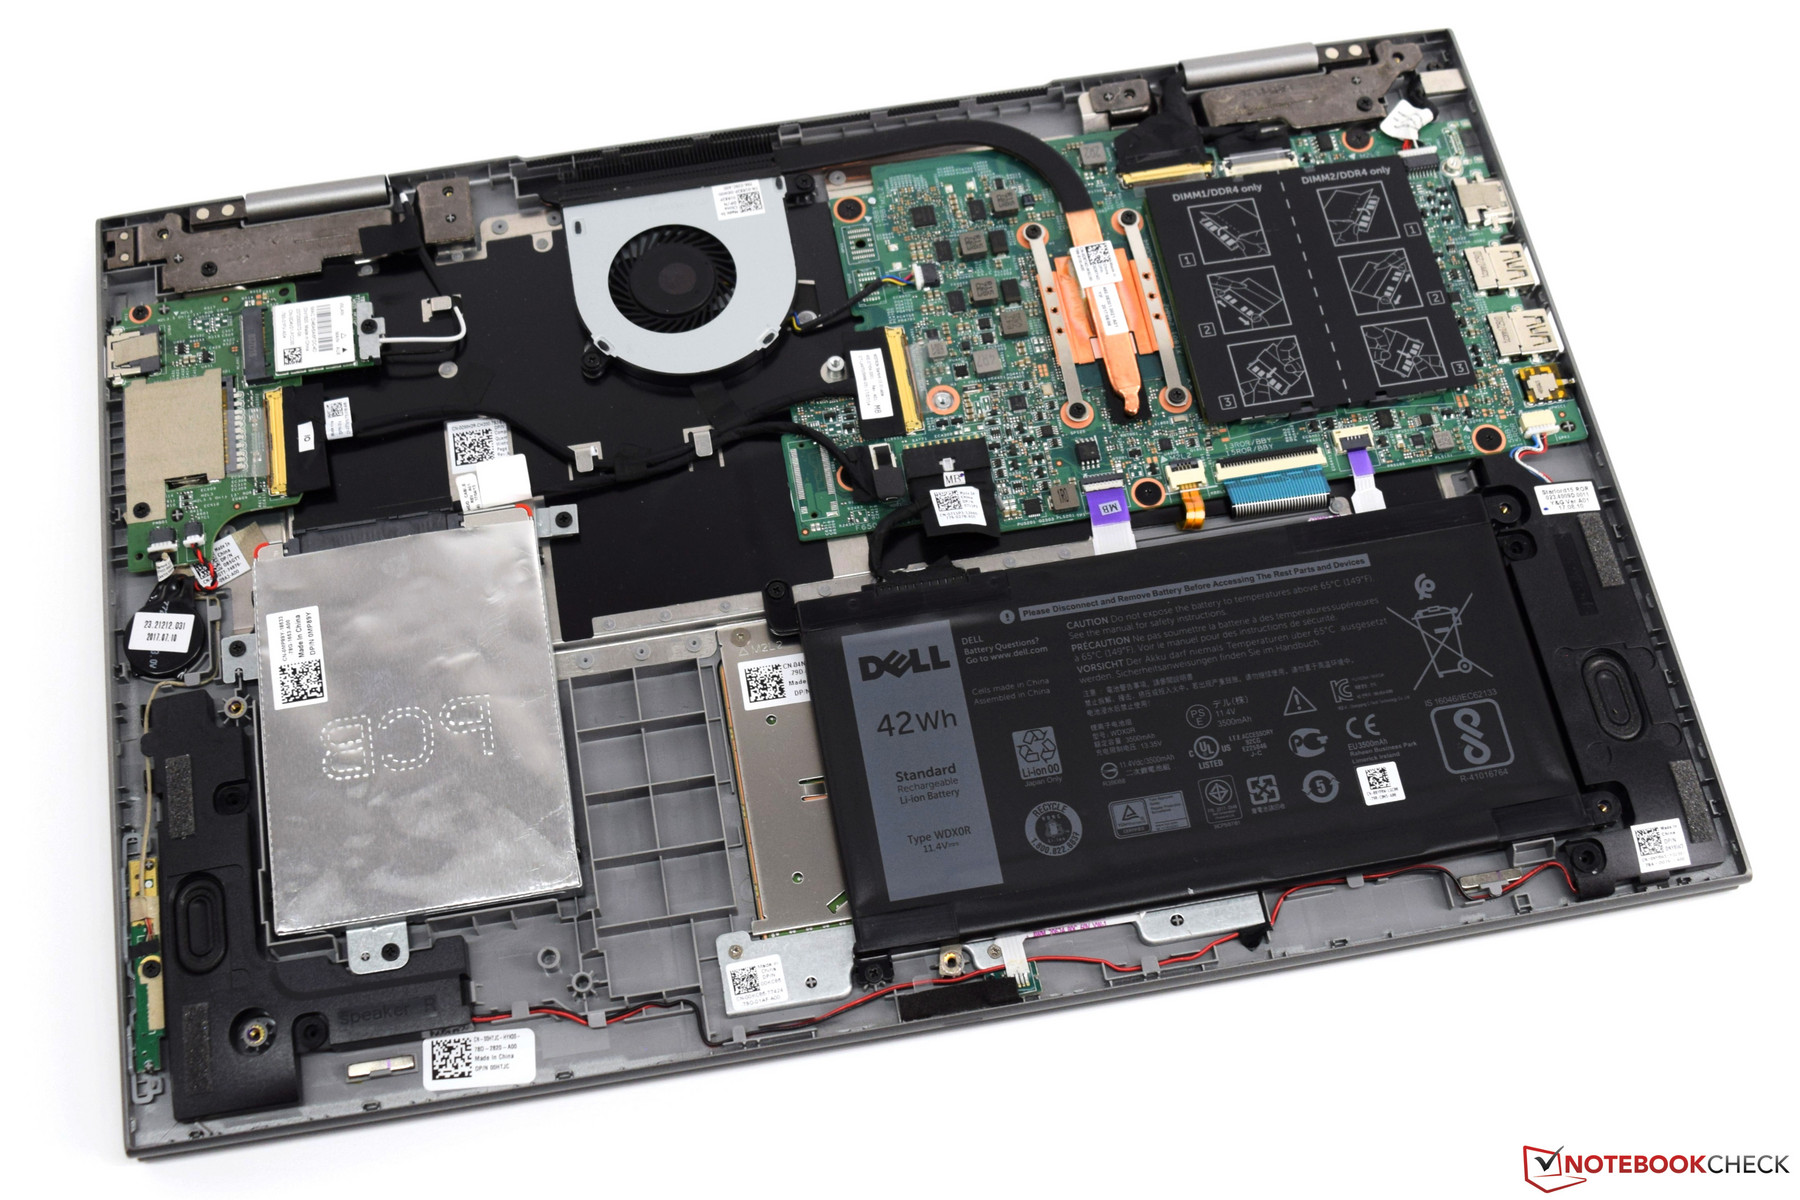
As mentioned before, the Dell Inspiron 15 5579 lacks a dedicated maintenance opening at the bottom. Accordingly, the entire bottom shell needs to be removed carefully in order to access the internal hardware components. The bottom cover is securely held in place with several plastic clips, and we highly recommend using a plastic tool in order to avoid damaging the case or the clips. Once removed one has access to the internal hardware with the possibility to upgrade the RAM and storage.
Since our review unit was equipped with a single RAM module, adding a second module is a no-brainer. However, there are is no empty M.2 storage slot and the only way to upgrade the storage is by replacing the existing SSD.
Warranty
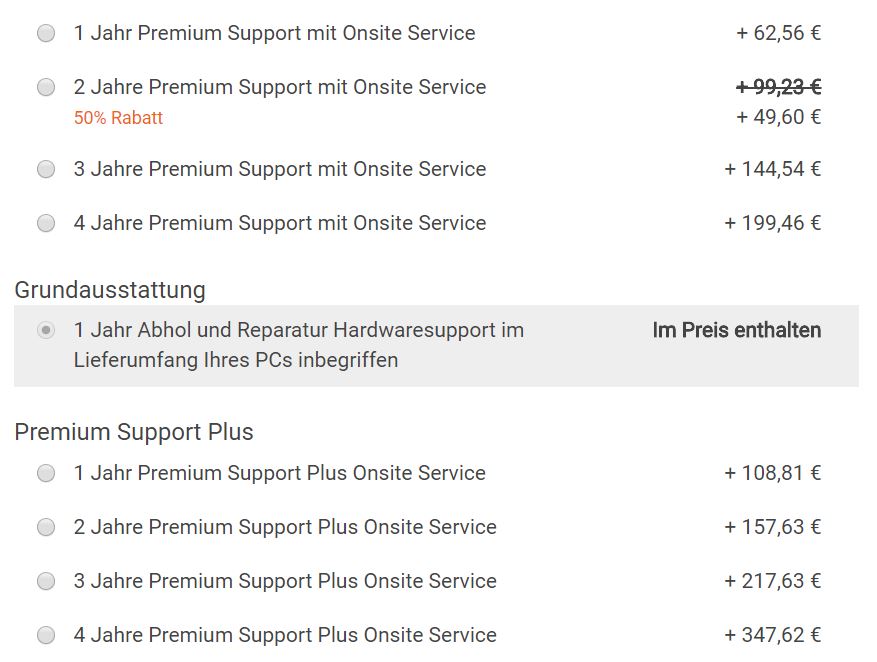
By default, Dell sells the 5579 with one year of mail-in warranty but offers a wide variety of optional warranty extensions. For example, $309 will get you four years of Premium Support Plus with on-site service. Please see our Guarantees, Return policies and Warranties FAQ for country-specific information.
Input Devices
Keyboard
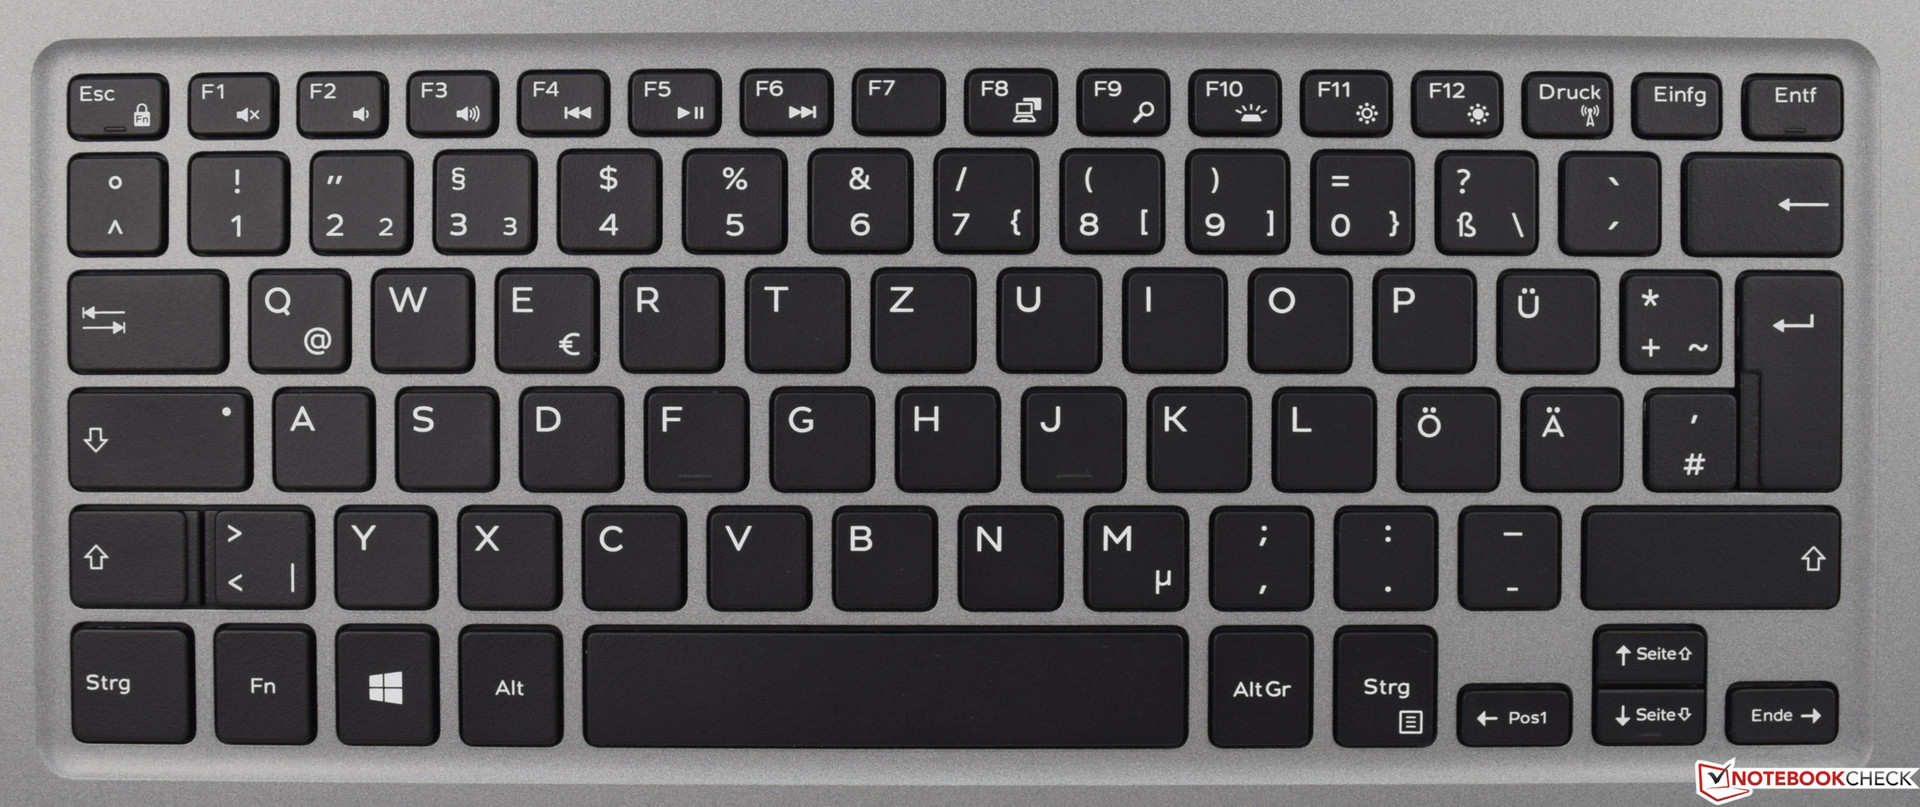
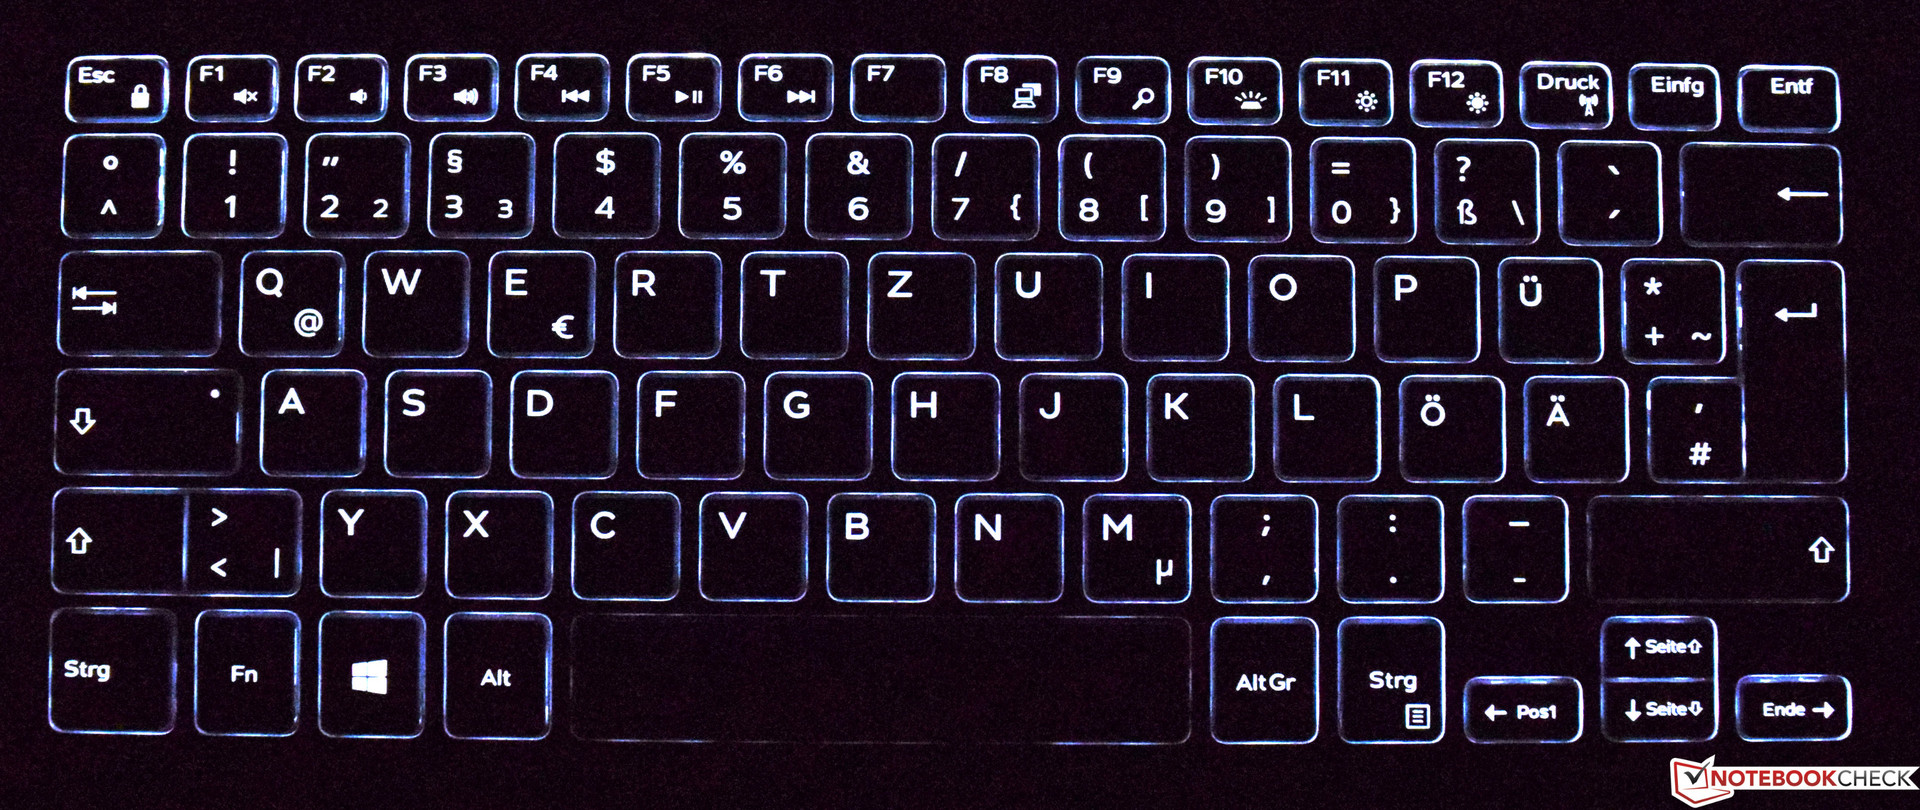
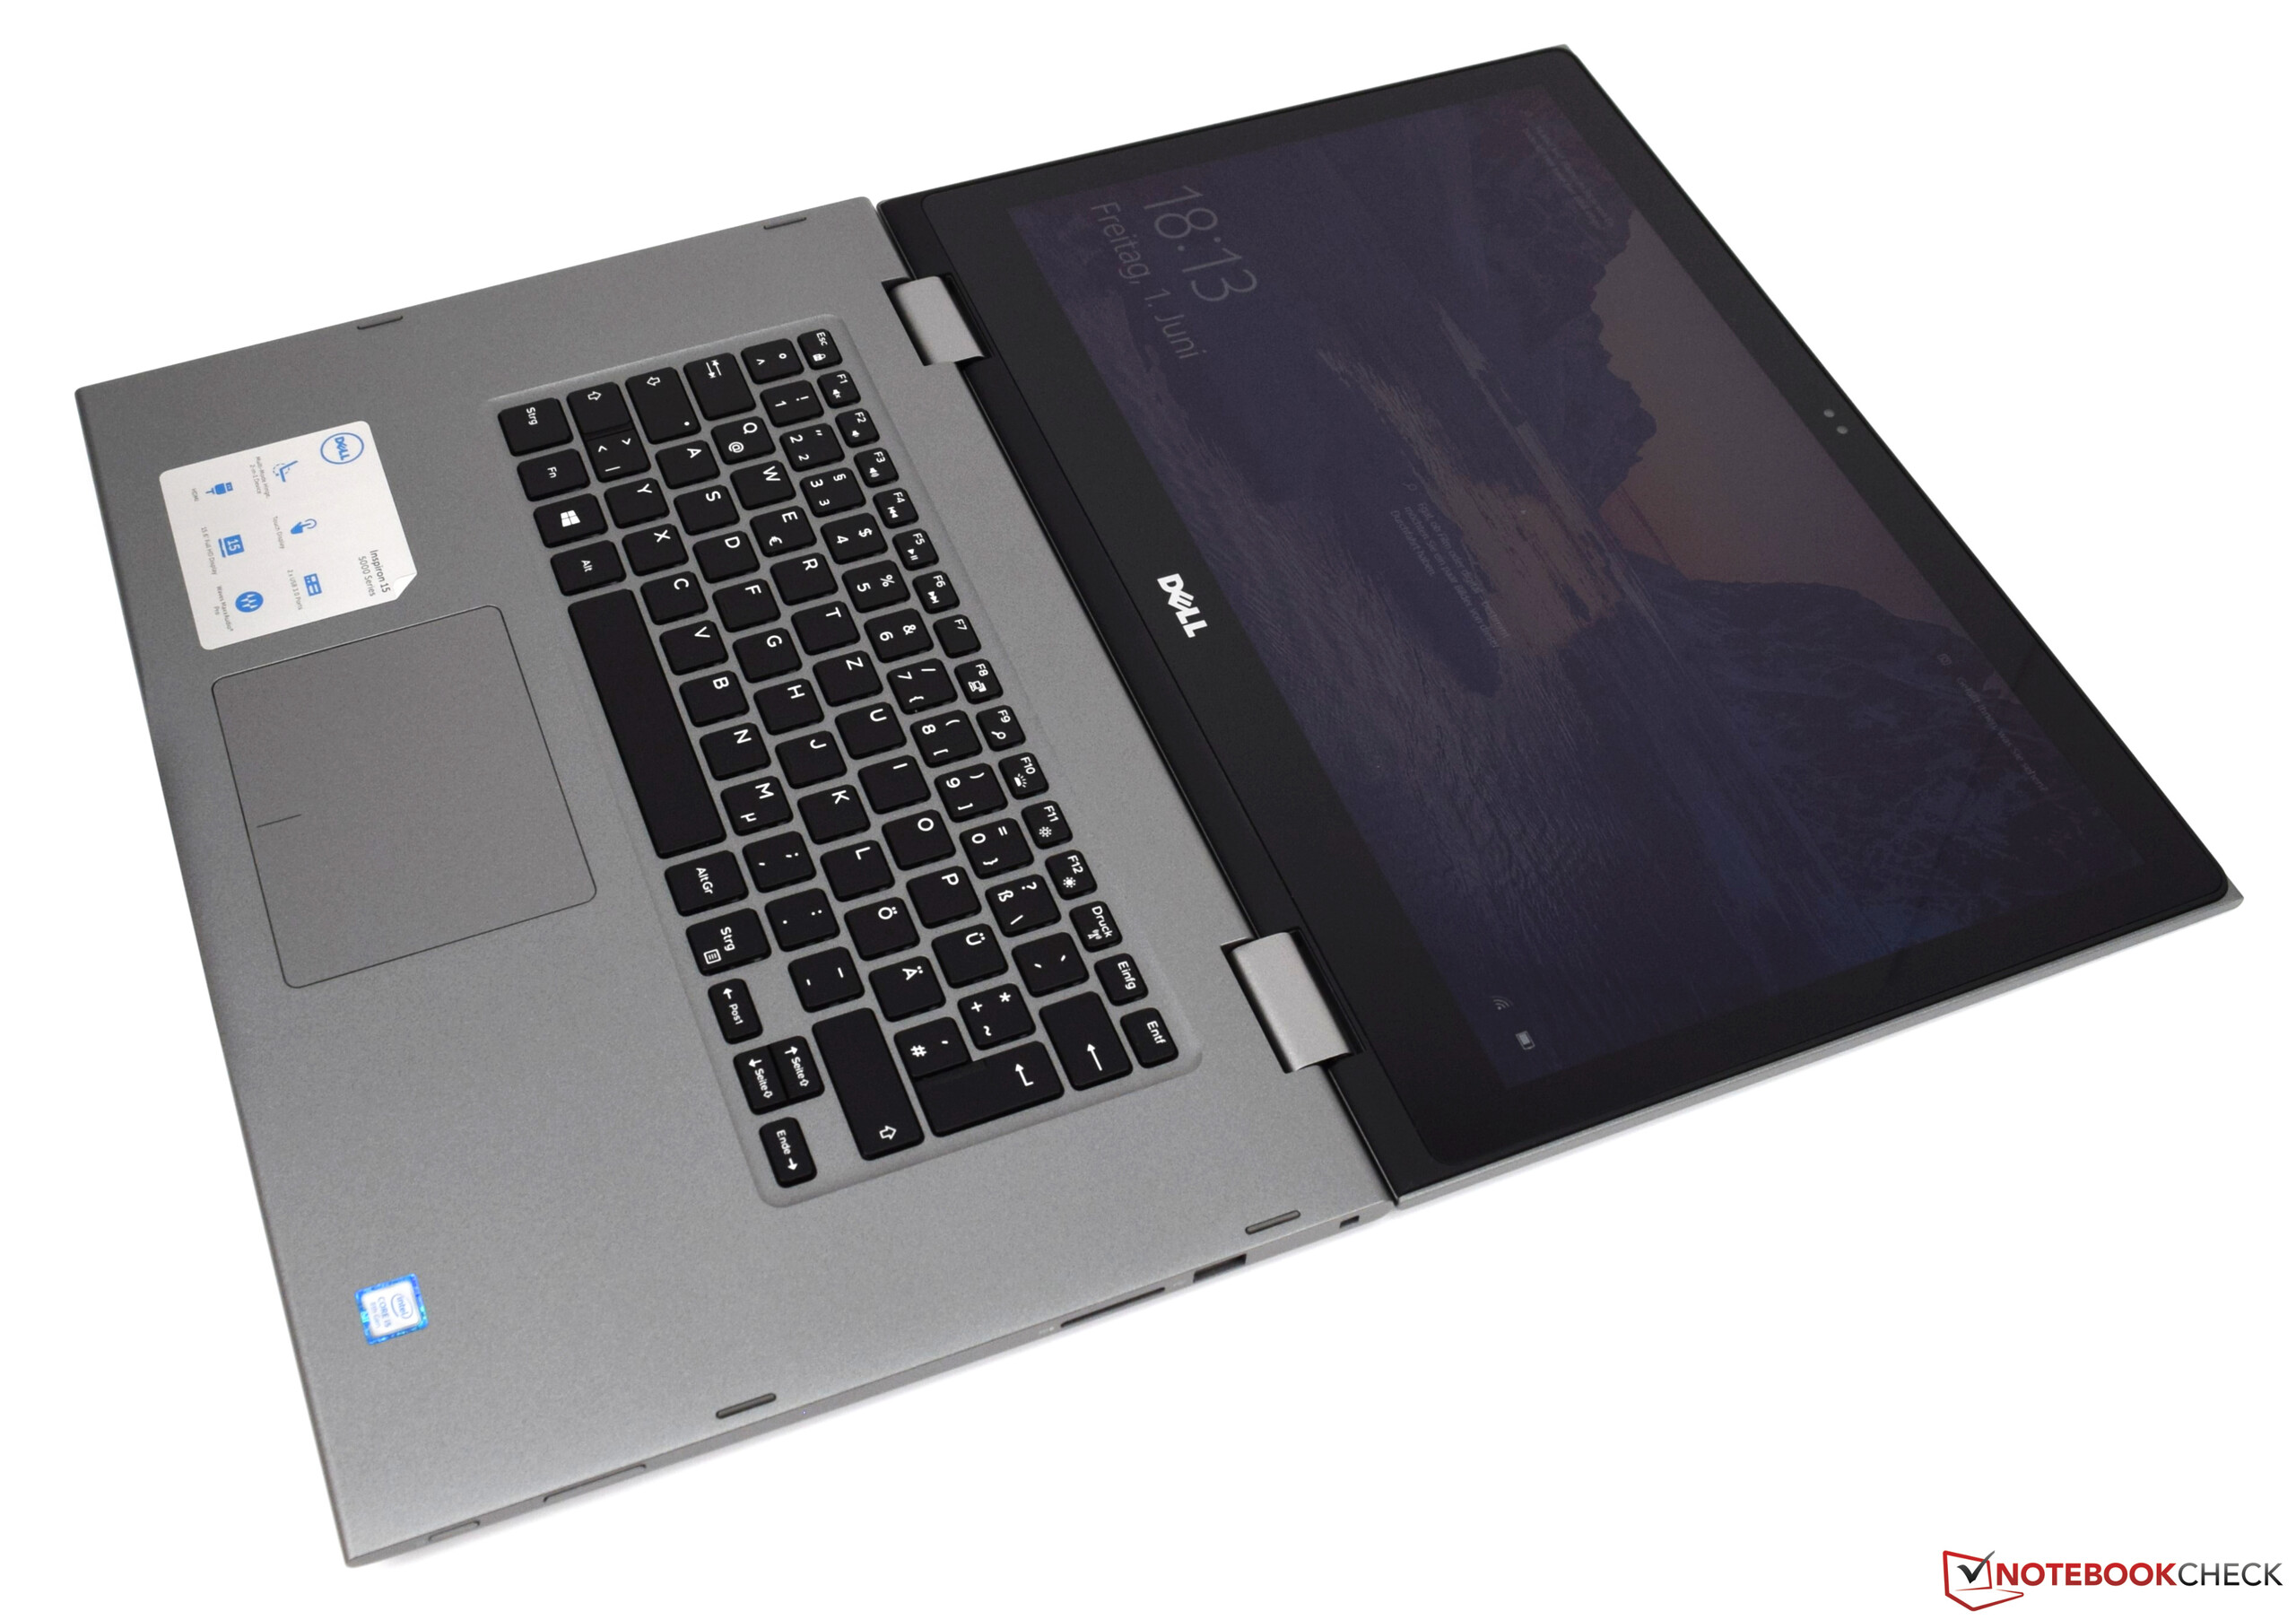
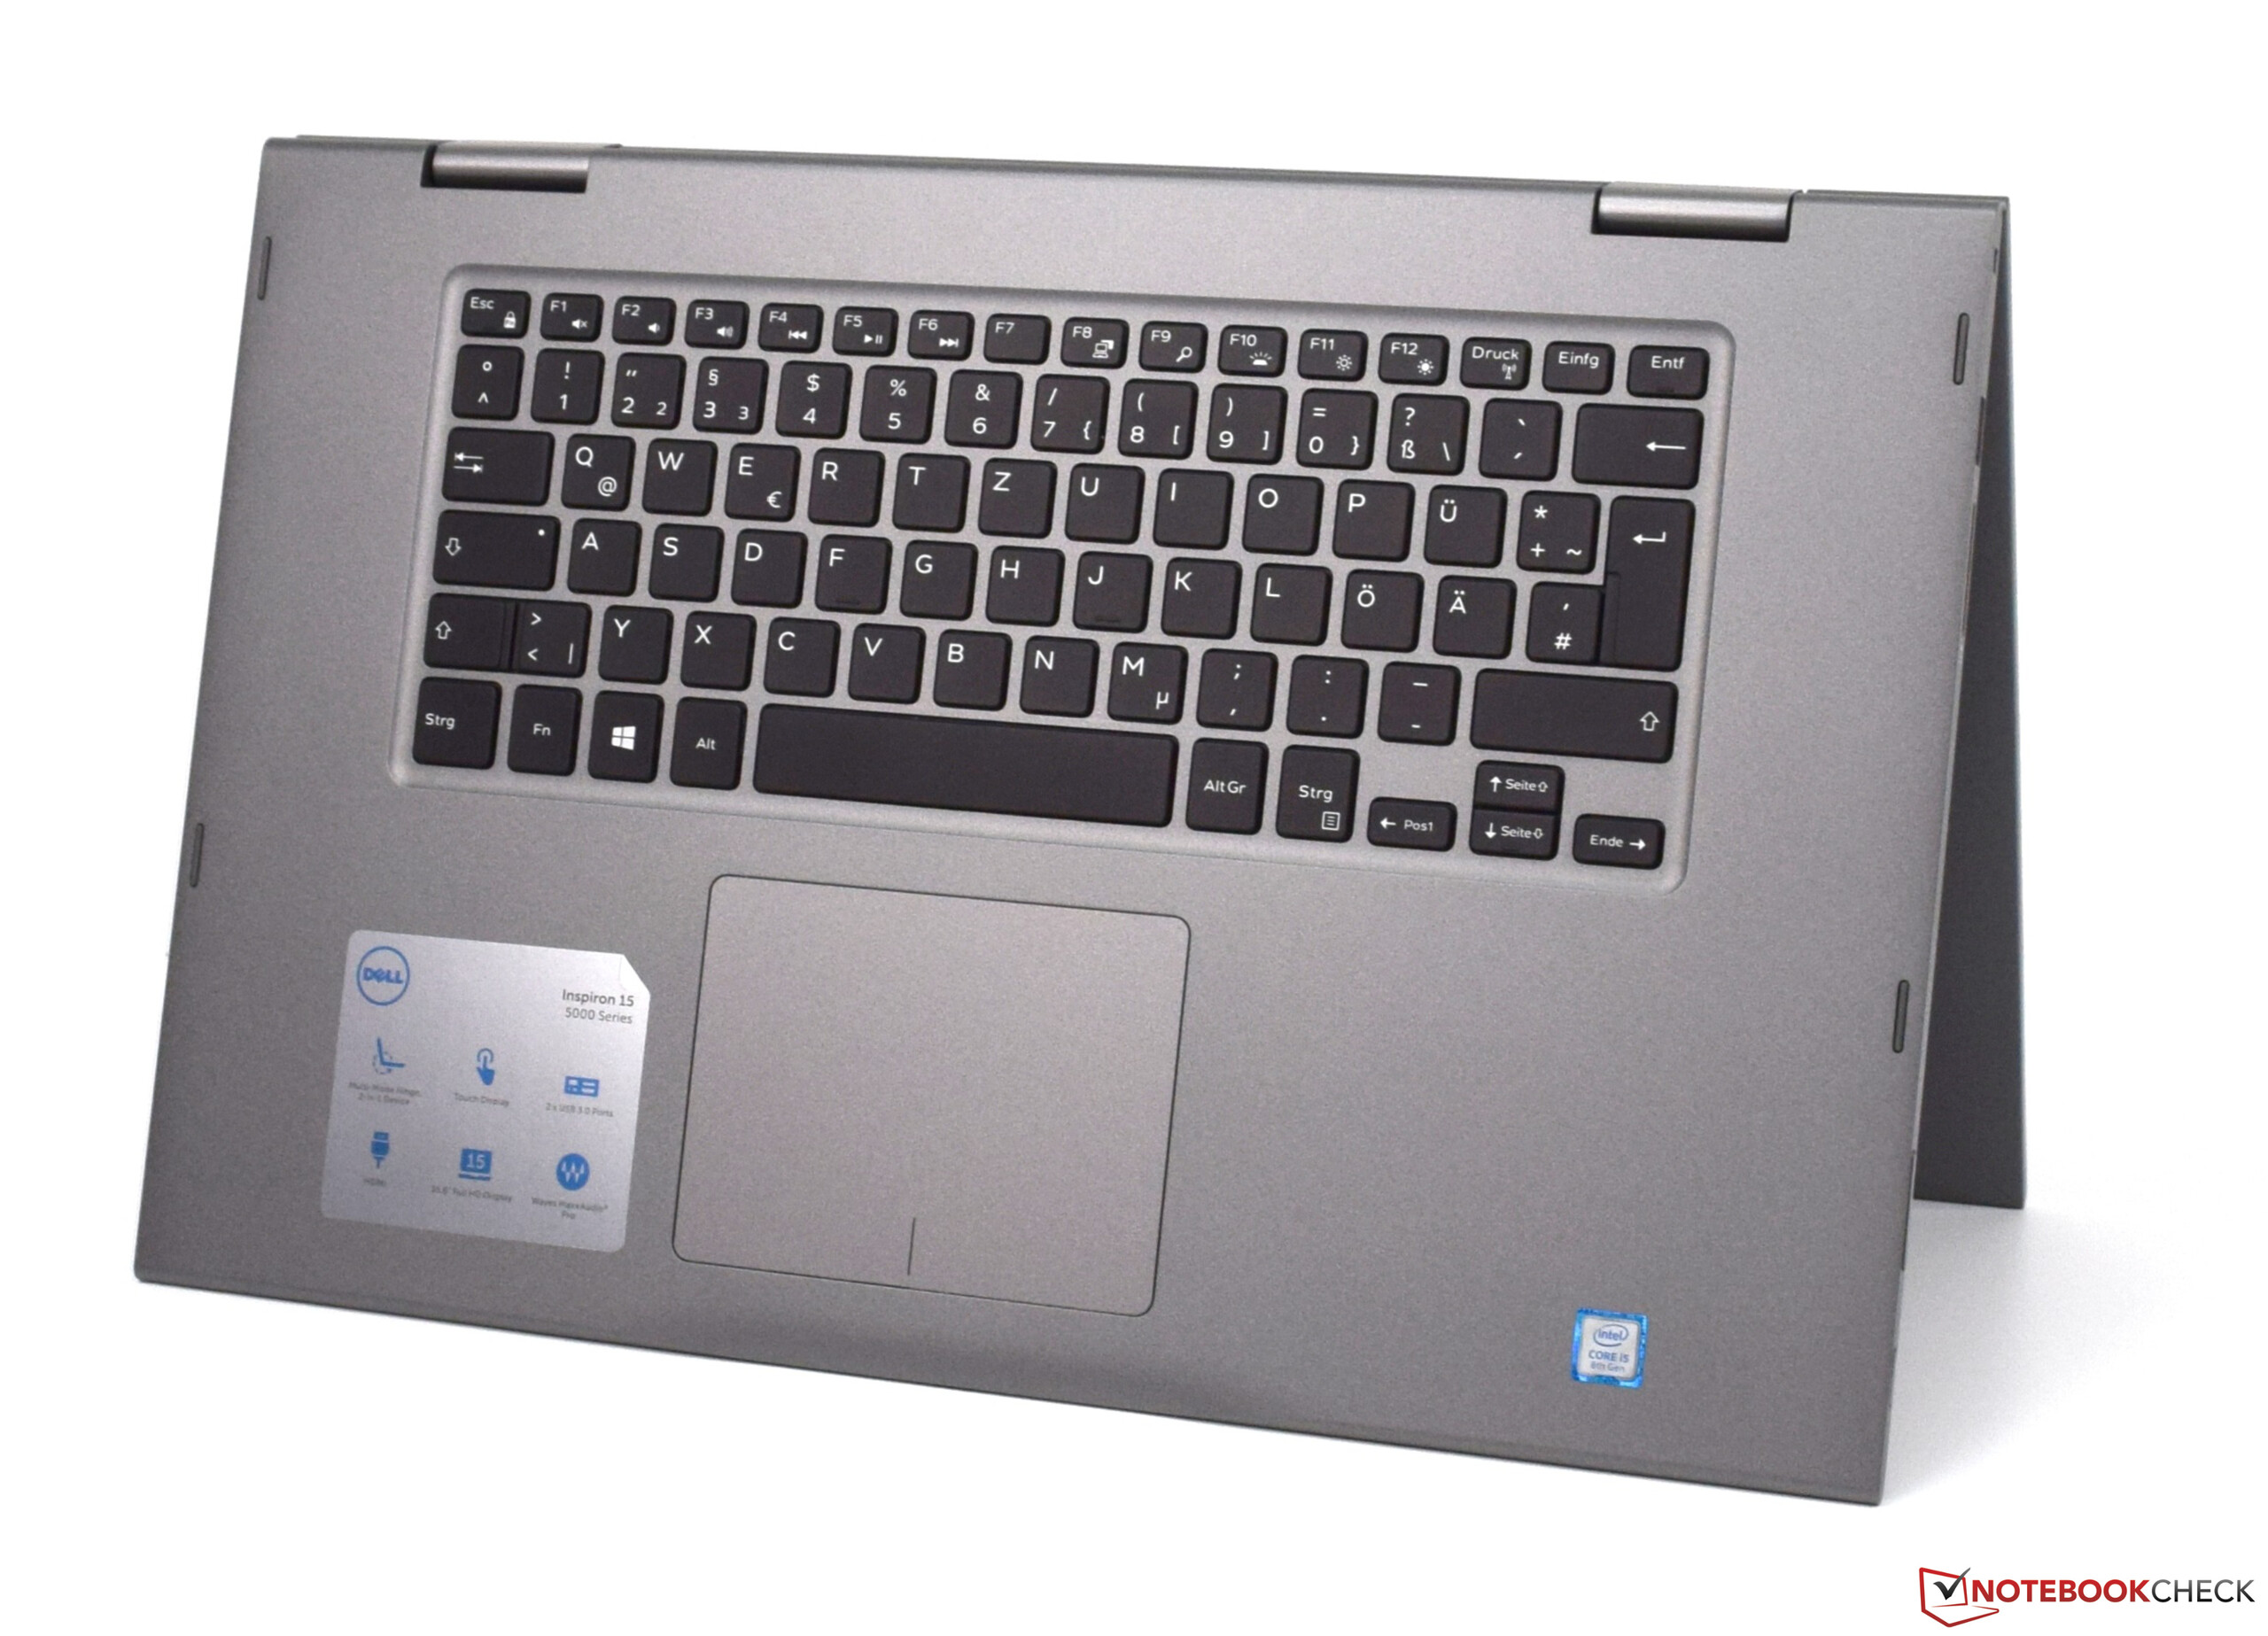
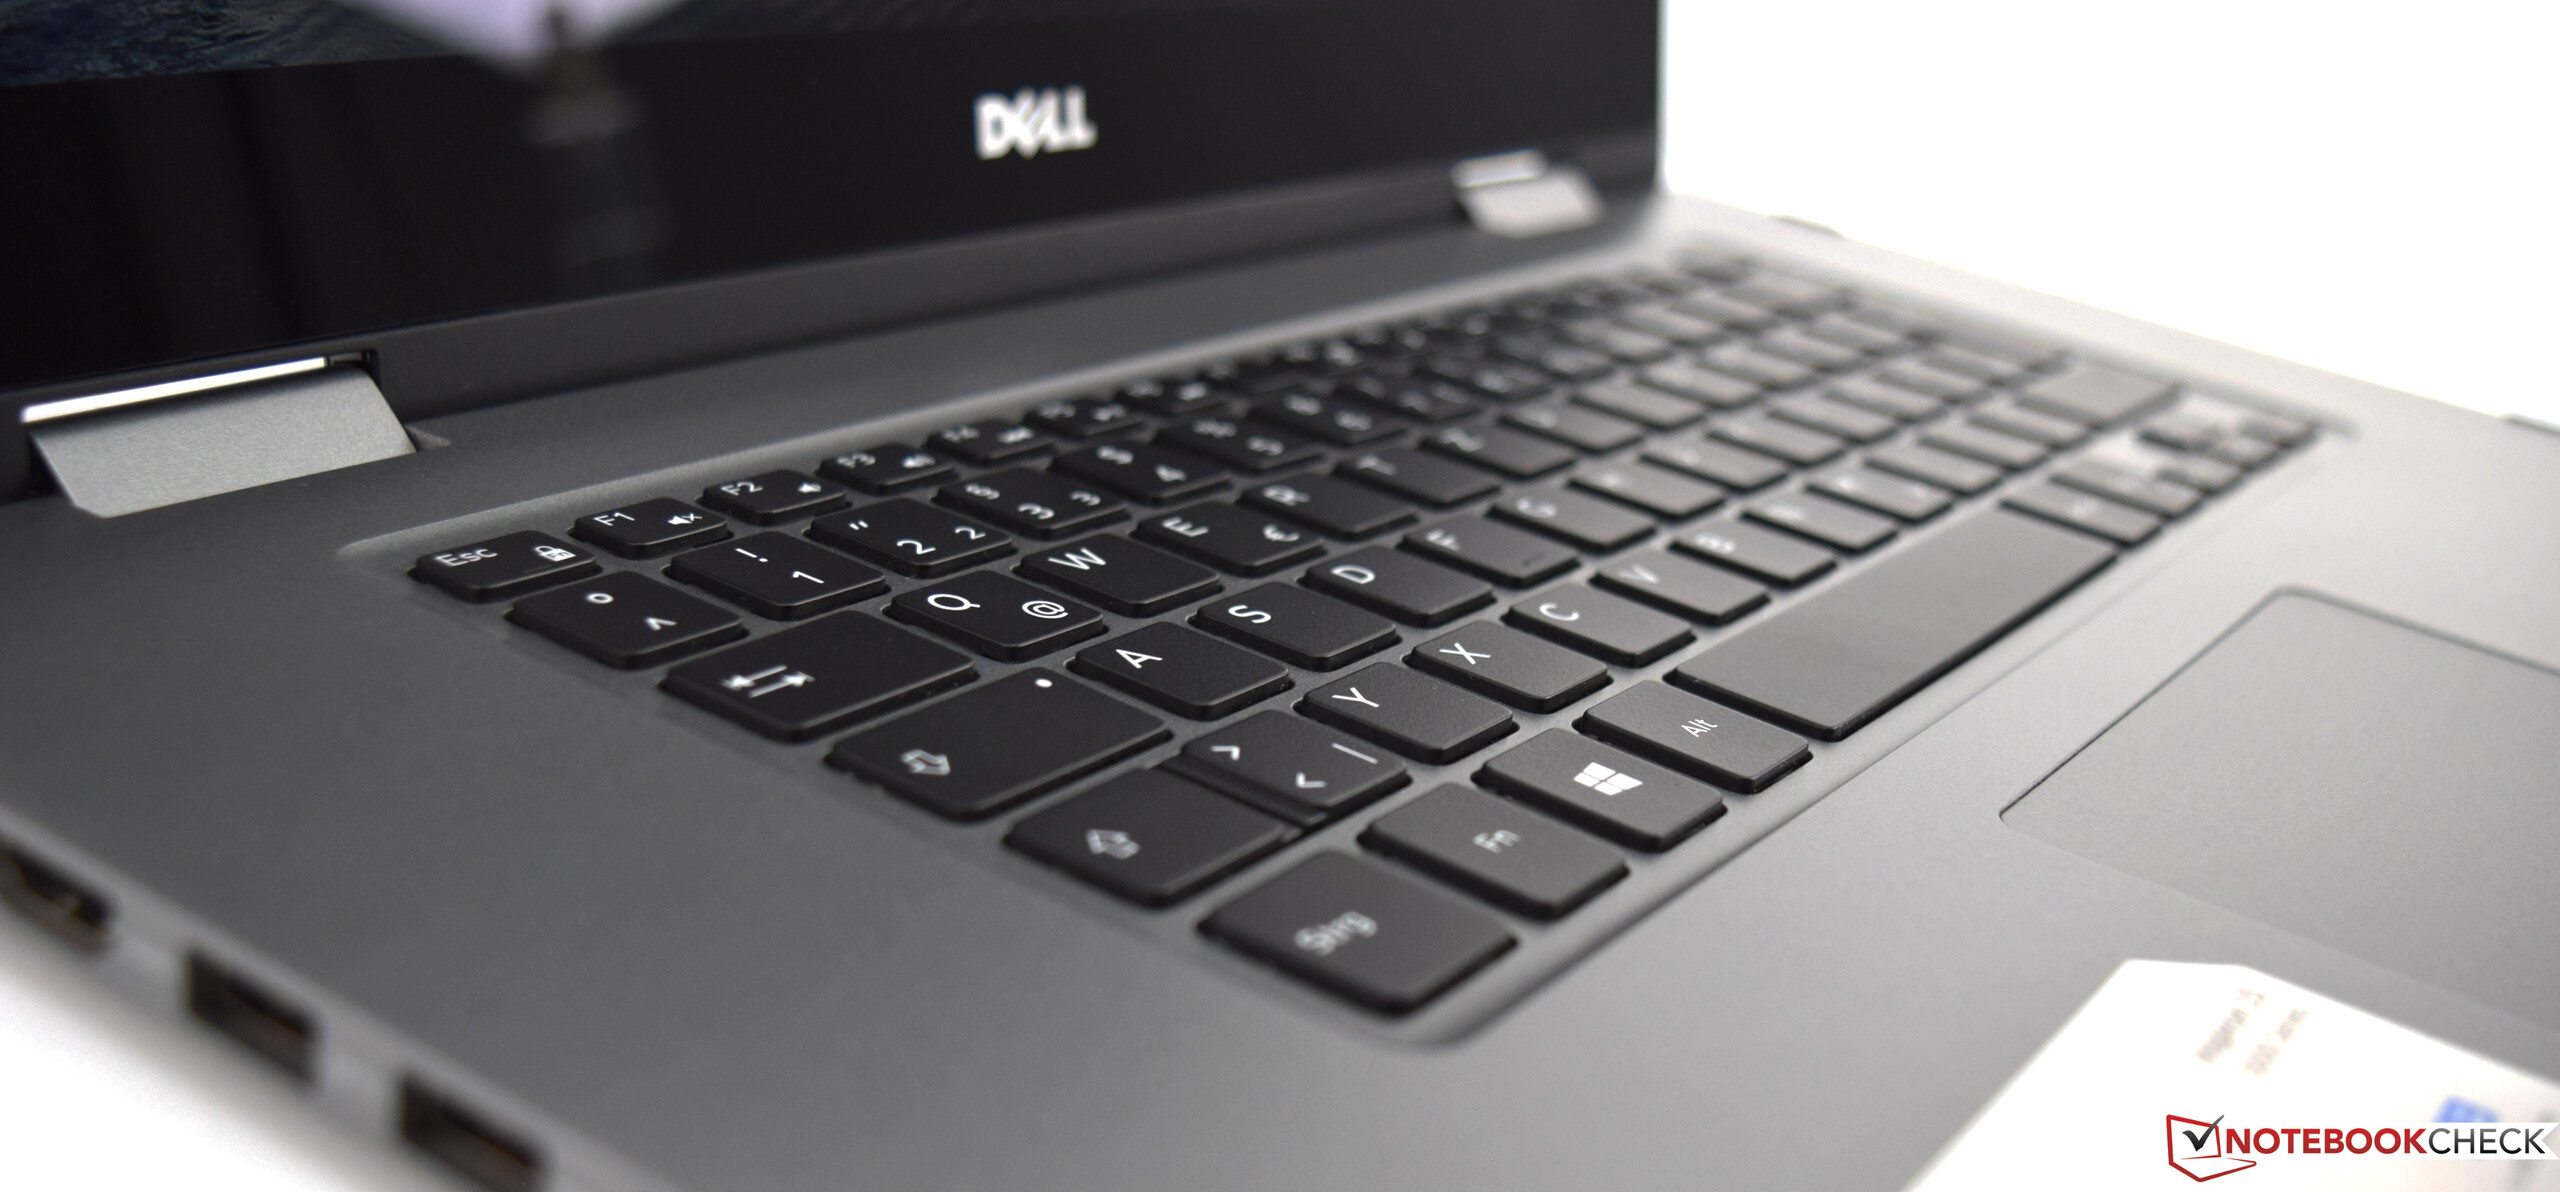
Avid typists are going to fall in love with the Inspiron 15 5579’s chiclet keyboard. The keys’ 16 x 15 mm large nonslip surface felt very nice to the touch. A well-defined and very consistent accentuation point is followed by a rather short key travel that not all users will be comfortable with, but at least the keystroke was well defined and firm. The labels are easily legible and supported by a white two-stage backlight. Except for the space-bar, clatter was fairly minimal. However, the small cursor keys are definitely going to take some getting used to.
Touchpad
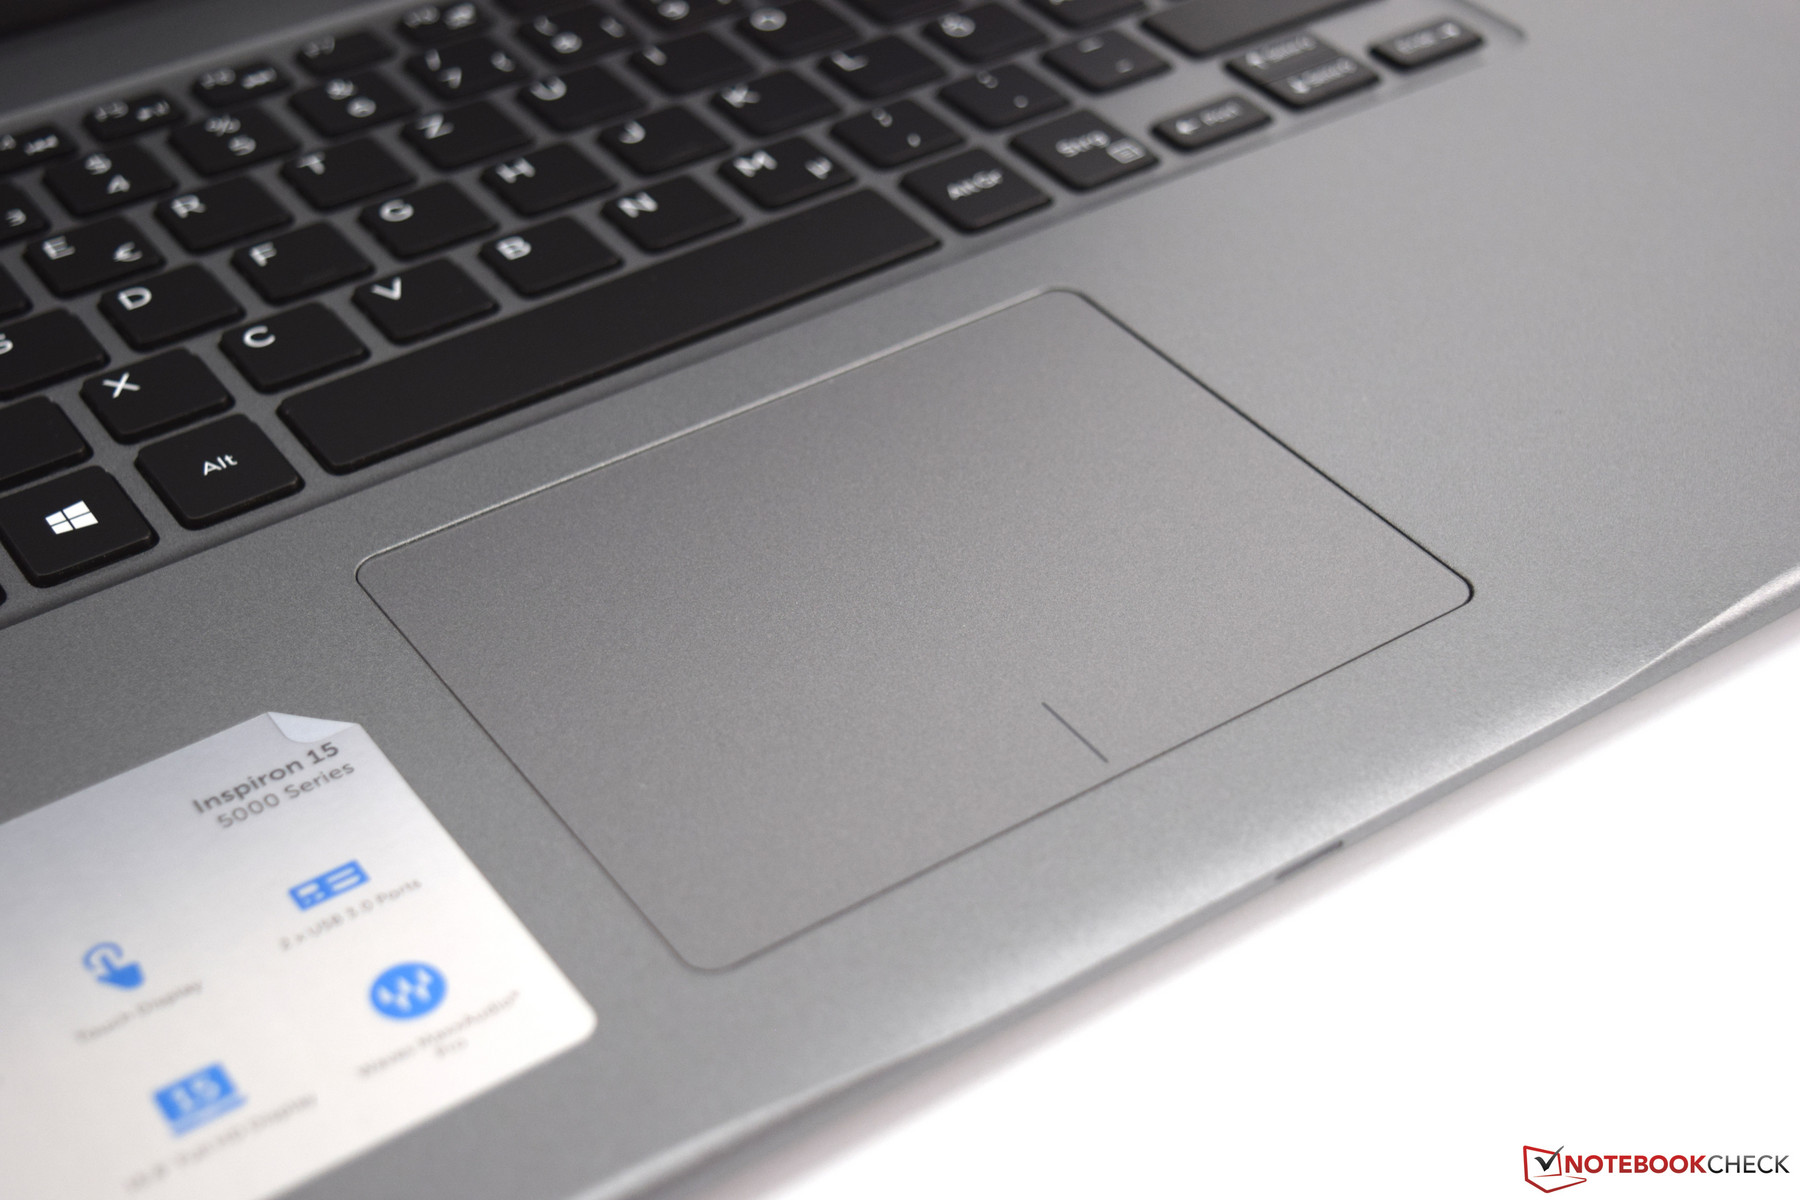
At 10.5 x 8.1 cm the touchpad was comparatively large, and its surface was delightfully smooth. Thus, it allowed for very accurate pointer input with high-precision touch recognition up to its very edges.
The integrated buttons are located at the bottom. They offer a rather short travel but a very loud acoustic feedback in return. By and large we would deem the ClickPad to be adequate. The large surface is particularly useful for multi-finger gesture input.
Touchscreen
The 15.6-inch touchscreen offers a third way of input, and it worked flawlessly during our tests. Fingers were detected very quickly, and response times were practically nonexistent. Unfortunately, our review unit’s display did not support active styluses and required a passive stylus instead.
Display

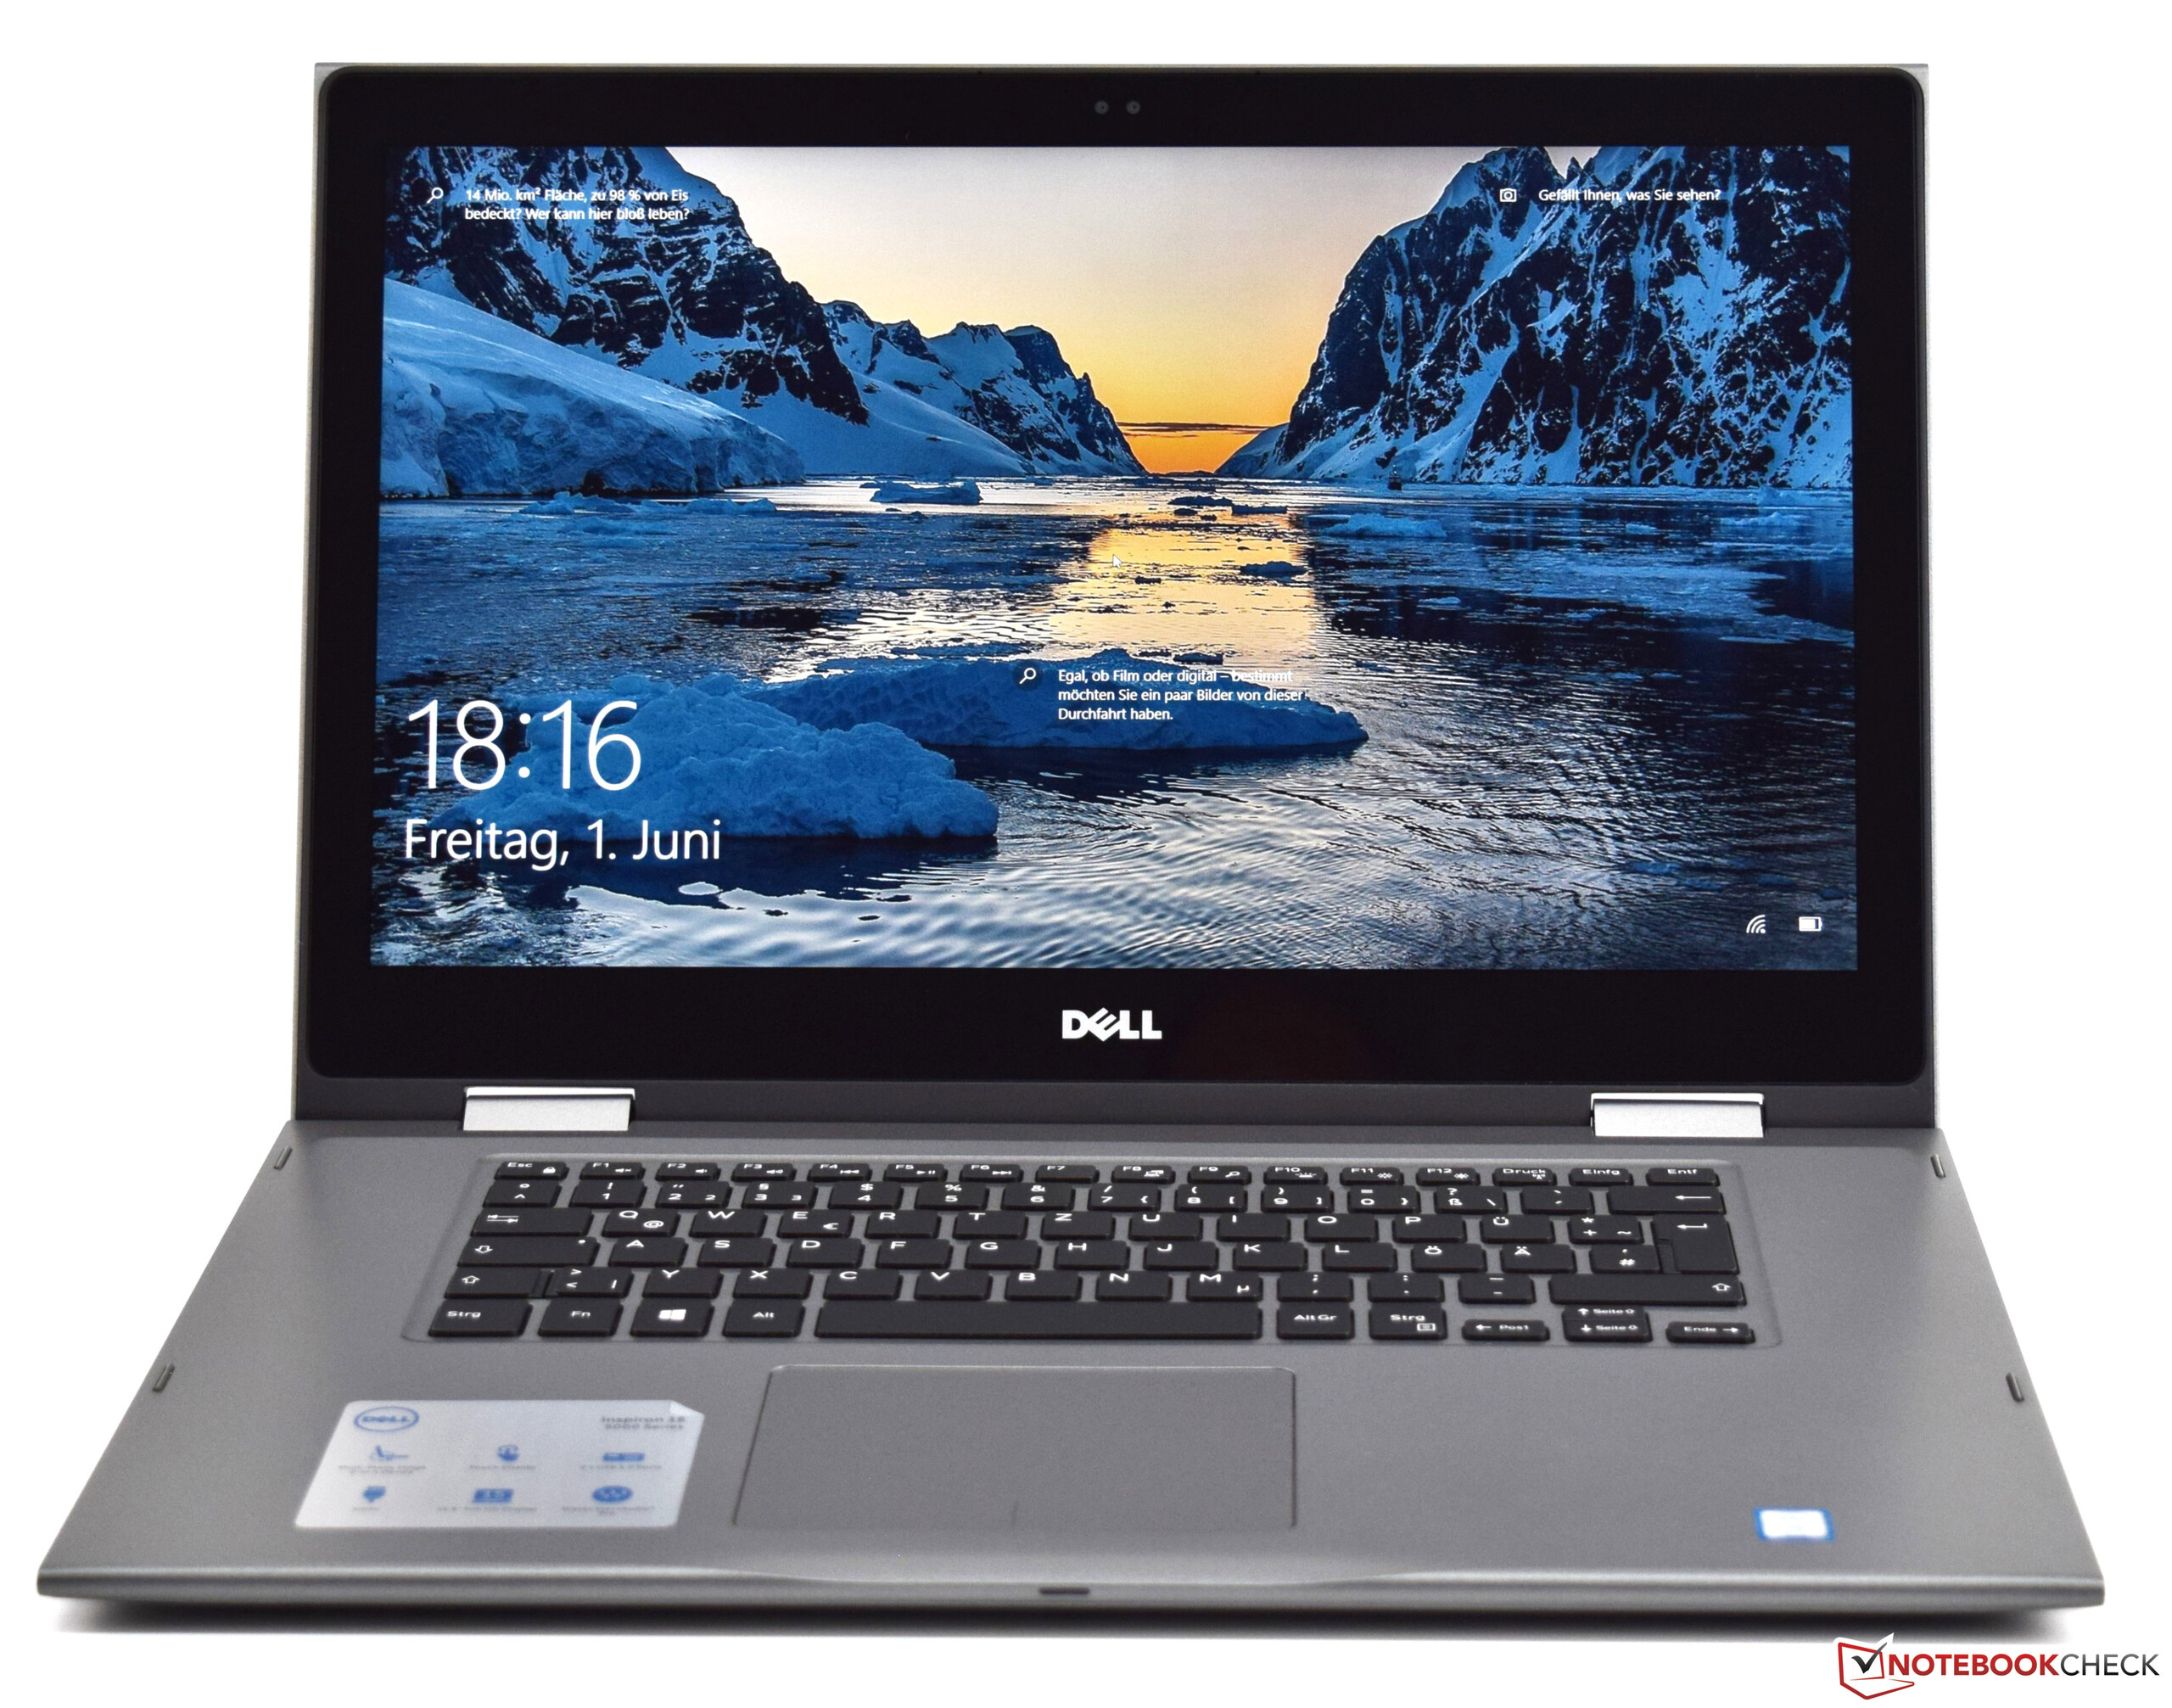
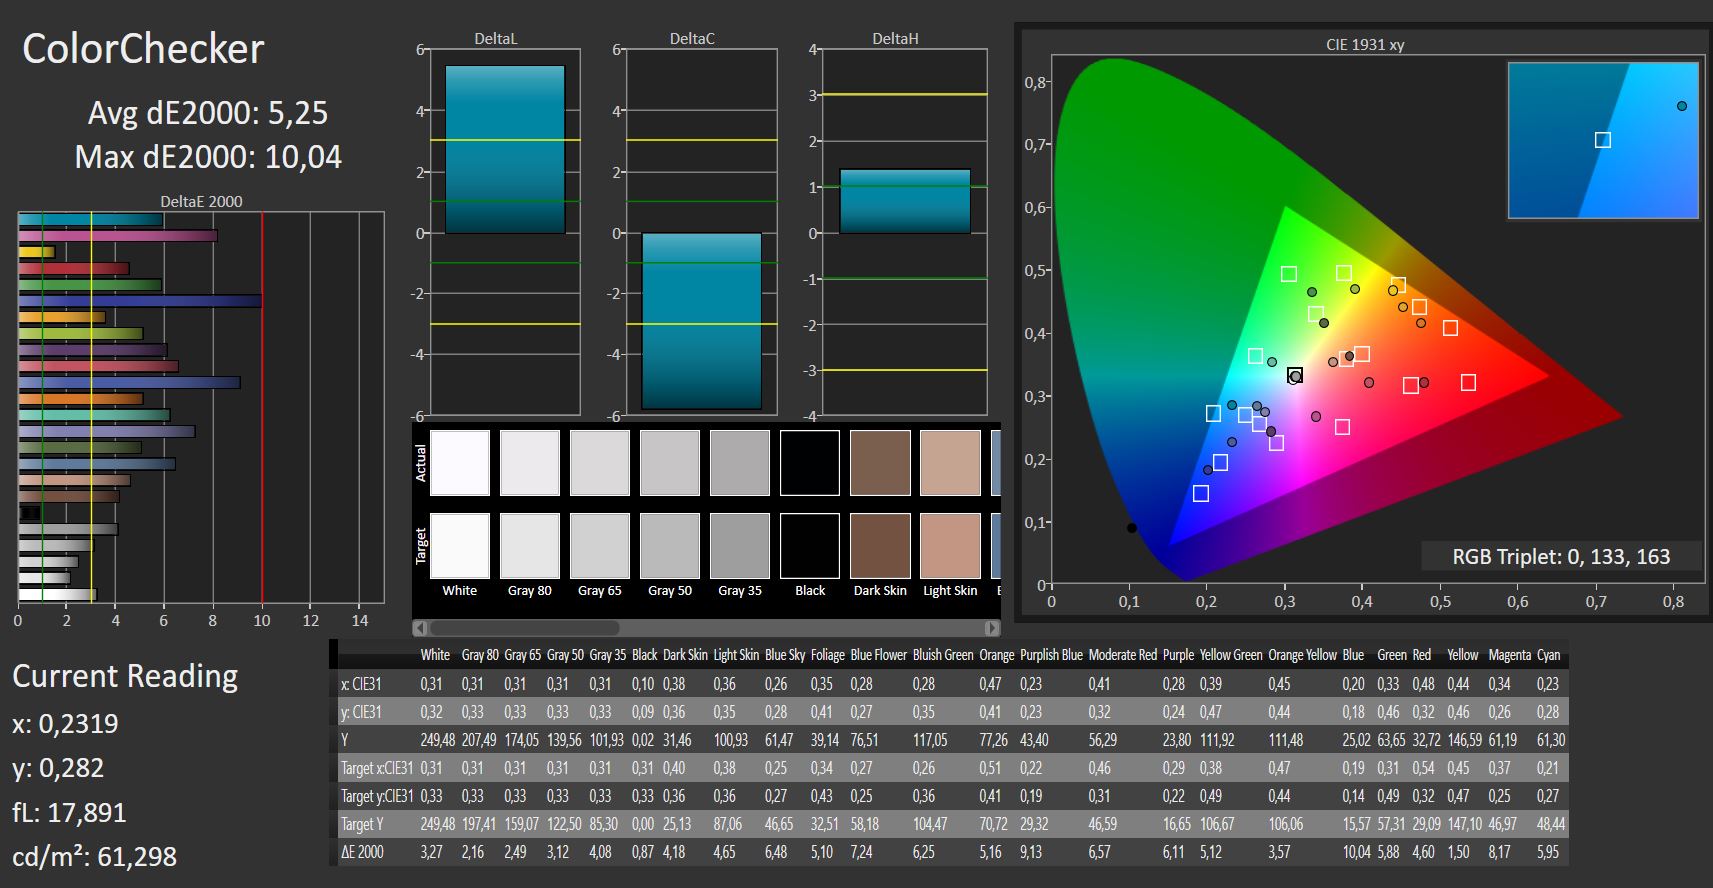
Our review unit came equipped with an AU Optronics FHD panel with a native resolution of 1920x1080. At 15.6-inches, the resulting pixel density was 141 dpi. Its average maximum brightness was just 240 nits, which was slightly brighter than the HP Envy x360’s 207 nits panel. Thanks to a very low black level of just 0.2 nits the contrast ratio of 1,255:1 was fairly high. In this regard, the 5579 offered a much better experience than its LG panel-equipped 5578 predecessor.
Unfortunately, at just 84% brightness distribution was mediocre at best, and we would have expected more. Nevertheless, we have failed to notice any shadowing effects. Clouding, on the other hand, was very pronounced along the left edge on a completely dark screen. PWM was also not present on this particular AU Optronics panel regardless of brightness level.
| |||||||||||||||||||||||||
Brightness Distribution: 84 %
Center on Battery: 249 cd/m²
Contrast: 1255:1 (Black: 0.2 cd/m²)
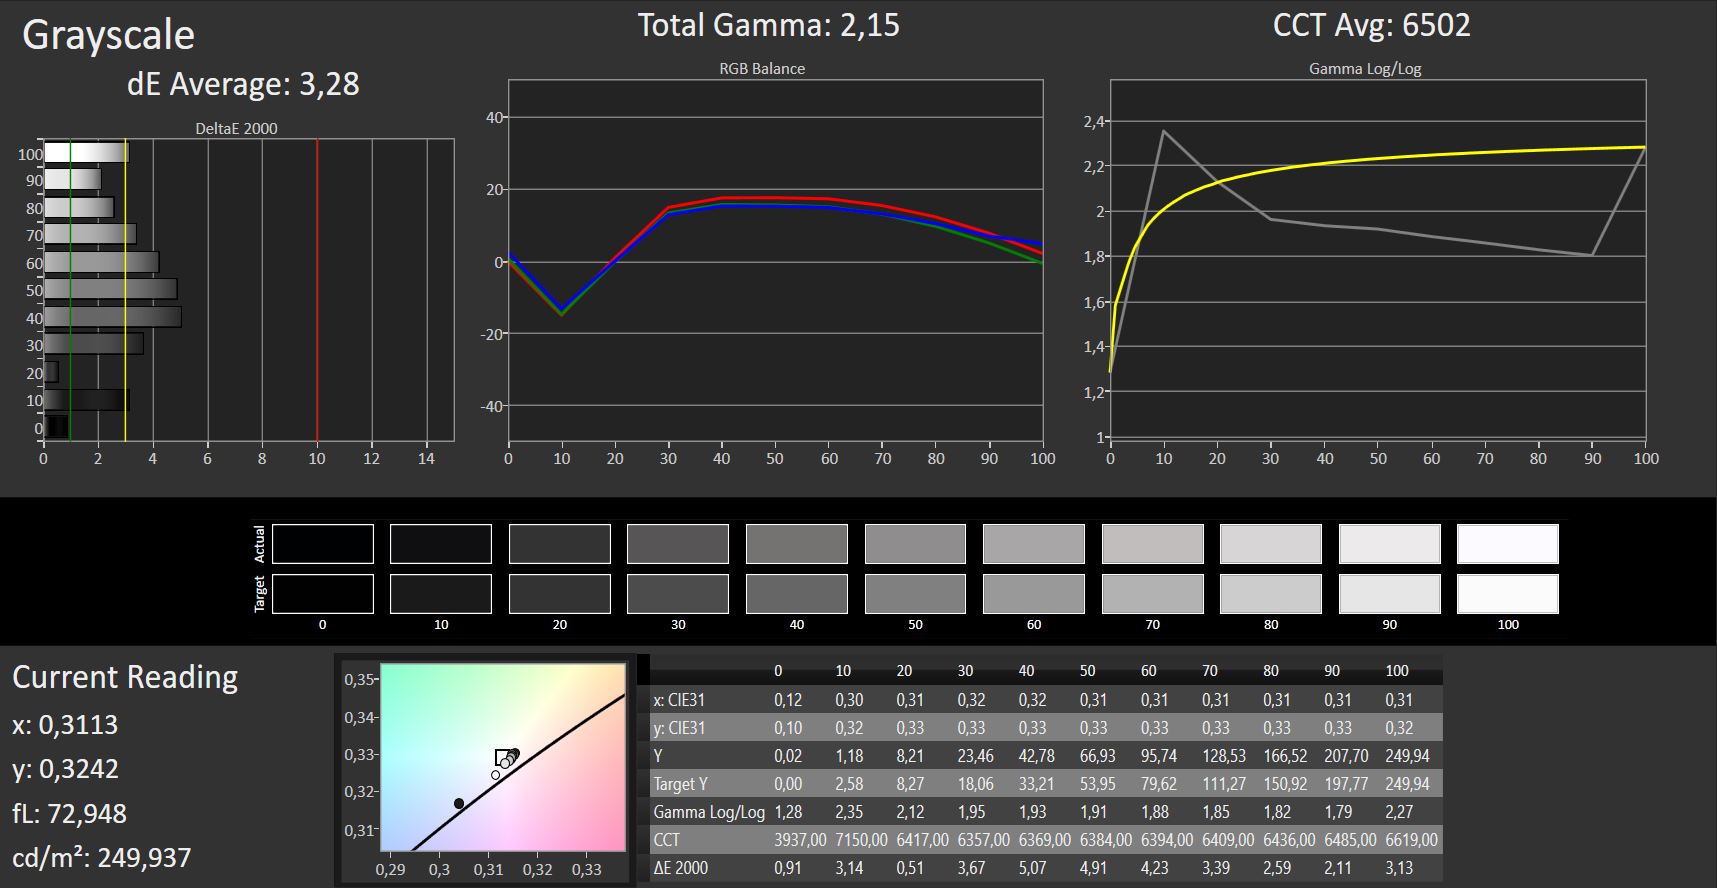
ΔE ColorChecker Calman: 5.25 | ∀{0.5-29.43 Ø4.73}
ΔE Greyscale Calman: 3.28 | ∀{0.09-98 Ø4.97}
55% sRGB (Argyll 1.6.3 3D)
35% AdobeRGB 1998 (Argyll 1.6.3 3D)
38.23% AdobeRGB 1998 (Argyll 3D)
55.6% sRGB (Argyll 3D)
37% Display P3 (Argyll 3D)
Gamma: 2.15
CCT: 6502 K
| Dell Inspiron 15 5579-9672 AUO, B156HW01, 1920x1080, 15.6" | Dell Inspiron 15 5578-1777 2-in-1 LG Philips (Dell 156WF7), 1920x1080, 15.6" | HP Envy x360 15-bq102ng Chi Mei CM15E9, 1920x1080, 15.6" | Asus VivoBook Flip 15 TP510UA-E8073T AU Optronics B156HAN02.1, 1920x1080, 15.6" | Acer Spin 3 SP314-51-548L BOE CQ NV140FHM-N41, 1920x1080, 14" | Lenovo ThinkPad L380 Yoga-20M7001BGE M133NWF4-R3, 1920x1080, 13.3" | |
|---|---|---|---|---|---|---|
| Display | 13% | 12% | 6% | 7% | 74% | |
| Display P3 Coverage (%) | 37 | 41.74 13% | 41.36 12% | 39.19 6% | 39.68 7% | 65.1 76% |
| sRGB Coverage (%) | 55.6 | 62.8 13% | 62.2 12% | 58.9 6% | 58.9 6% | 95.5 72% |
| AdobeRGB 1998 Coverage (%) | 38.23 | 43.13 13% | 42.74 12% | 40.49 6% | 41 7% | 66.9 75% |
| Response Times | -2% | 6% | -4% | -13% | -6% | |
| Response Time Grey 50% / Grey 80% * (ms) | 41 ? | 55 ? -34% | 40 ? 2% | 44 ? -7% | 43 ? -5% | 47 ? -15% |
| Response Time Black / White * (ms) | 29 ? | 20 ? 31% | 26 ? 10% | 29 ? -0% | 35 ? -21% | 28 ? 3% |
| PWM Frequency (Hz) | 25000 ? | 1000 | 217 ? | |||
| Screen | -3% | 17% | -2% | 9% | 13% | |
| Brightness middle (cd/m²) | 251 | 244 -3% | 221 -12% | 229 -9% | 220 -12% | 323 29% |
| Brightness (cd/m²) | 240 | 242 1% | 207 -14% | 221 -8% | 221 -8% | 310 29% |
| Brightness Distribution (%) | 84 | 93 11% | 87 4% | 76 -10% | 78 -7% | 88 5% |
| Black Level * (cd/m²) | 0.2 | 0.25 -25% | 0.15 25% | 0.15 25% | 0.18 10% | 0.22 -10% |
| Contrast (:1) | 1255 | 976 -22% | 1473 17% | 1527 22% | 1222 -3% | 1468 17% |
| Colorchecker dE 2000 * | 5.25 | 4.94 6% | 4.35 17% | 5.03 4% | 3.98 24% | 5 5% |
| Colorchecker dE 2000 max. * | 10.04 | 7.3 27% | 8.98 11% | 8.89 11% | 7.69 23% | 9.56 5% |
| Greyscale dE 2000 * | 3.28 | 4.93 -50% | 3.09 6% | 5.56 -70% | 1.68 49% | 6.64 -102% |
| Gamma | 2.15 102% | 2.7 81% | 2.23 99% | 2.64 83% | 2.37 93% | 2.2 100% |
| CCT | 6502 100% | 7401 88% | 6068 107% | 7015 93% | 6382 102% | 6638 98% |
| Color Space (Percent of AdobeRGB 1998) (%) | 35 | 40 14% | 56 60% | 37 6% | 38 9% | 61 74% |
| Color Space (Percent of sRGB) (%) | 55 | 63 15% | 86 56% | 59 7% | 58 5% | 95 73% |
| Colorchecker dE 2000 calibrated * | 4 | |||||
| Total Average (Program / Settings) | 3% /
1% | 12% /
15% | 0% /
-1% | 1% /
6% | 27% /
22% |
* ... smaller is better
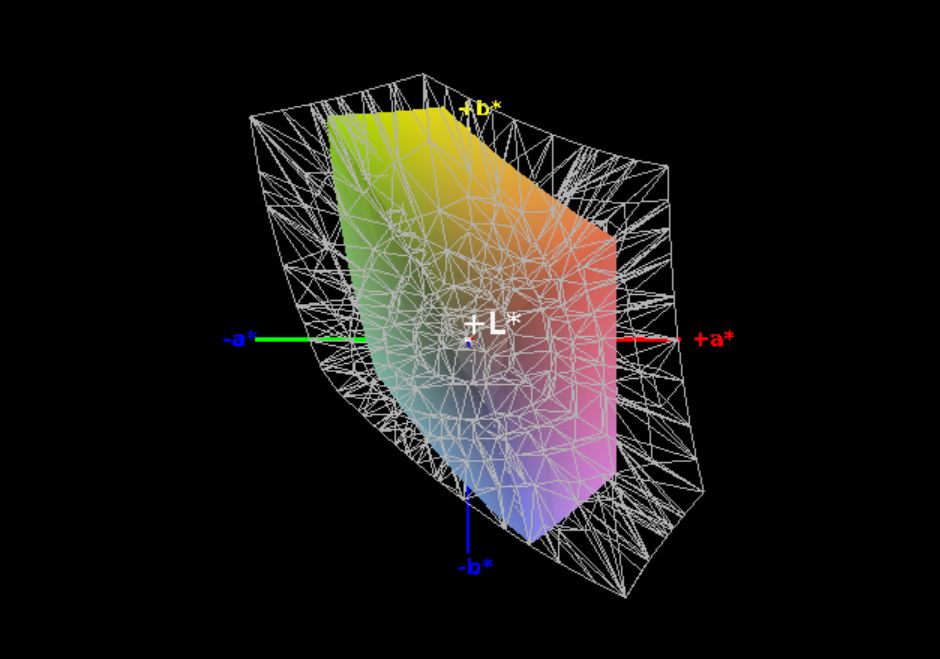
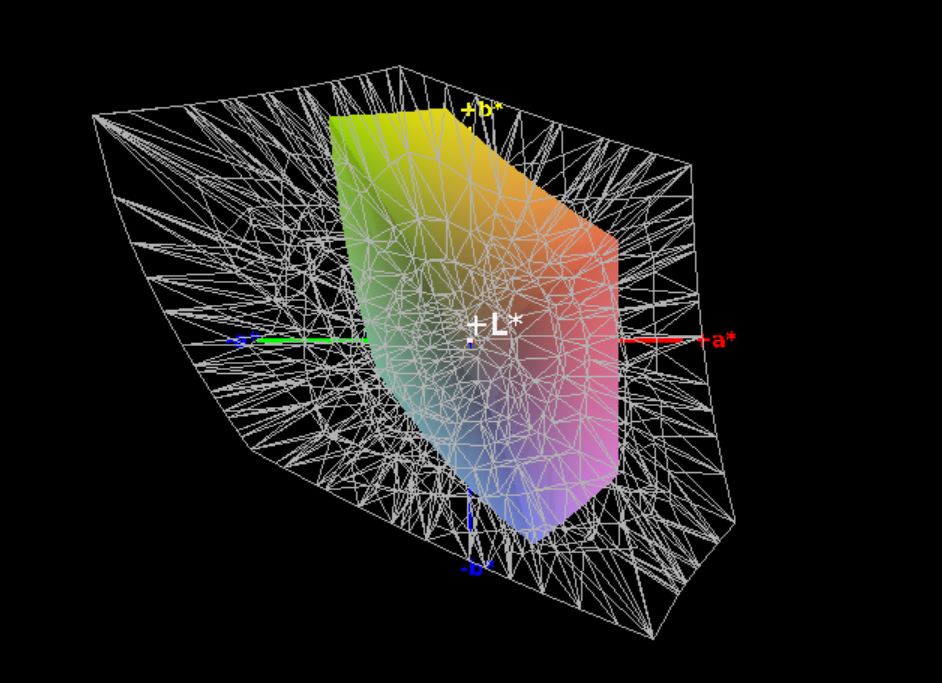
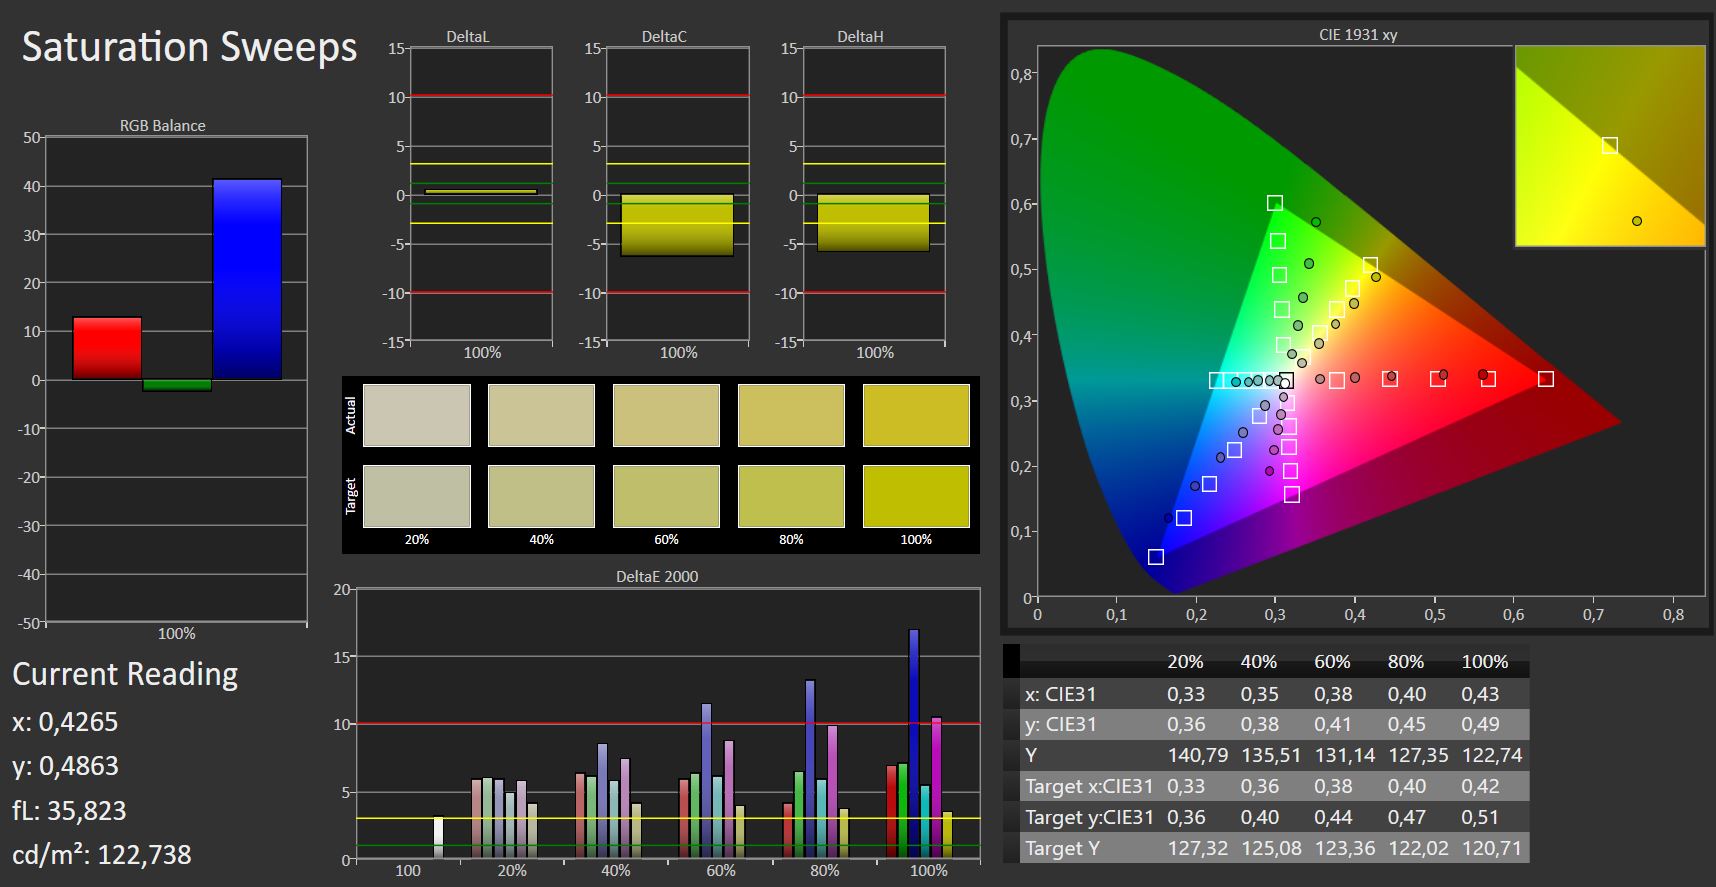
Under normal conditions, the display did not suffer from clouding or its mediocre brightness distribution. Colors were displayed fairly well without being too over-the-top. DeltaE deviations were definitely way too high out of the box, and we suggest downloading our ICC profile from the box above for improved color accuracy. Color-space coverage was very poor overall, with just 55% and 35% for sRGB and AdobeRGB, respectively. The Inspiron 15 5579 was beaten in this regard by every single one of its competitors, and we expect a much better color-space coverage on a laptop at the 5579’s price point.
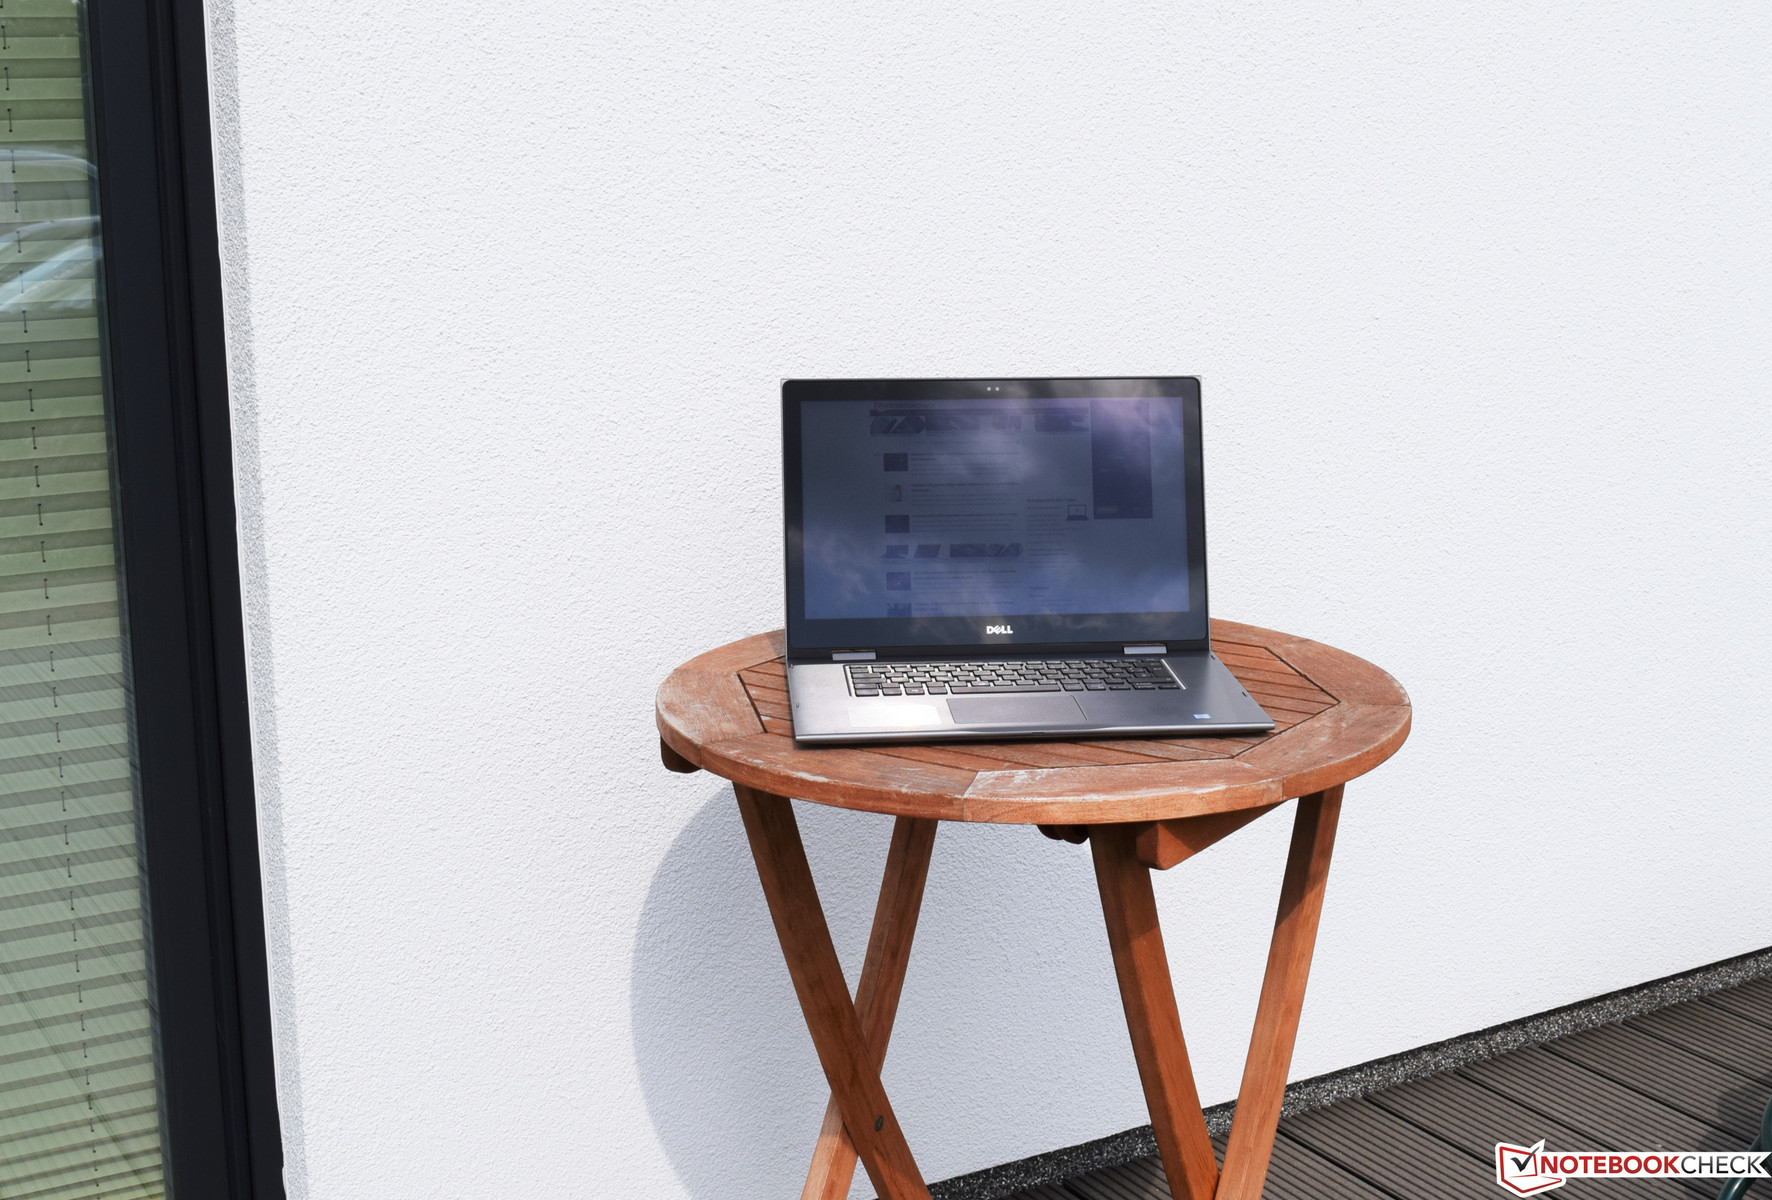
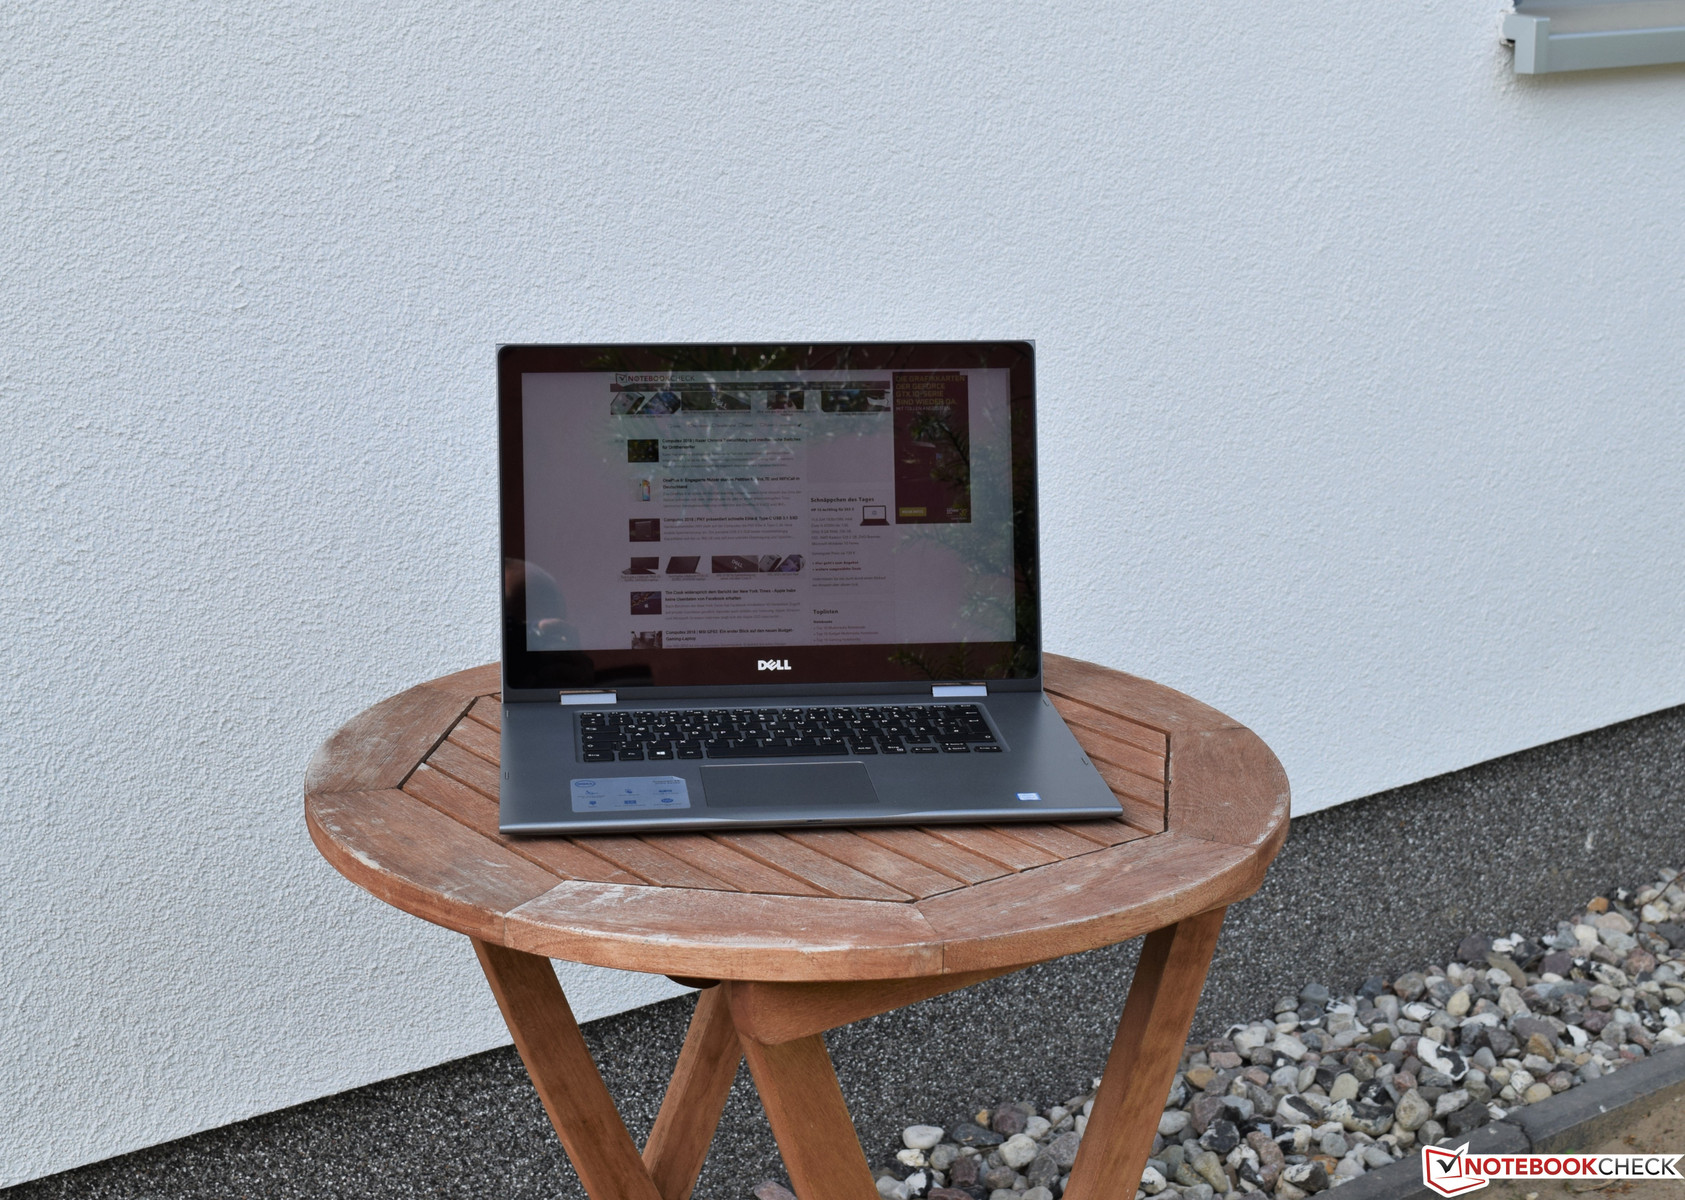
Outdoor usability was limited by the panel’s touch surface as well as its low maximum brightness. As a consequence, the Inspiron 15 5579 was practically unusable in sunlight. It was somewhat usable in the shade, but once again its usability was severely limited due to massive reflections.
Display Response Times
| ↔ Response Time Black to White | ||
|---|---|---|
| 29 ms ... rise ↗ and fall ↘ combined | ↗ 17 ms rise |  |
| ↘ 12 ms fall | ||
| The screen shows relatively slow response rates in our tests and may be too slow for gamers. In comparison, all tested devices range from 0.1 (minimum) to 240 (maximum) ms. » 77 % of all devices are better. This means that the measured response time is worse than the average of all tested devices (19.9 ms). | ||
| ↔ Response Time 50% Grey to 80% Grey | ||
| 41 ms ... rise ↗ and fall ↘ combined | ↗ 19 ms rise |  |
| ↘ 22 ms fall | ||
| The screen shows slow response rates in our tests and will be unsatisfactory for gamers. In comparison, all tested devices range from 0.165 (minimum) to 636 (maximum) ms. » 65 % of all devices are better. This means that the measured response time is worse than the average of all tested devices (31.1 ms). | ||
Screen Flickering / PWM (Pulse-Width Modulation)
| Screen flickering / PWM not detected |  | ||
In comparison: 52 % of all tested devices do not use PWM to dim the display. If PWM was detected, an average of 7798 (minimum: 5 - maximum: 343500) Hz was measured. | |||
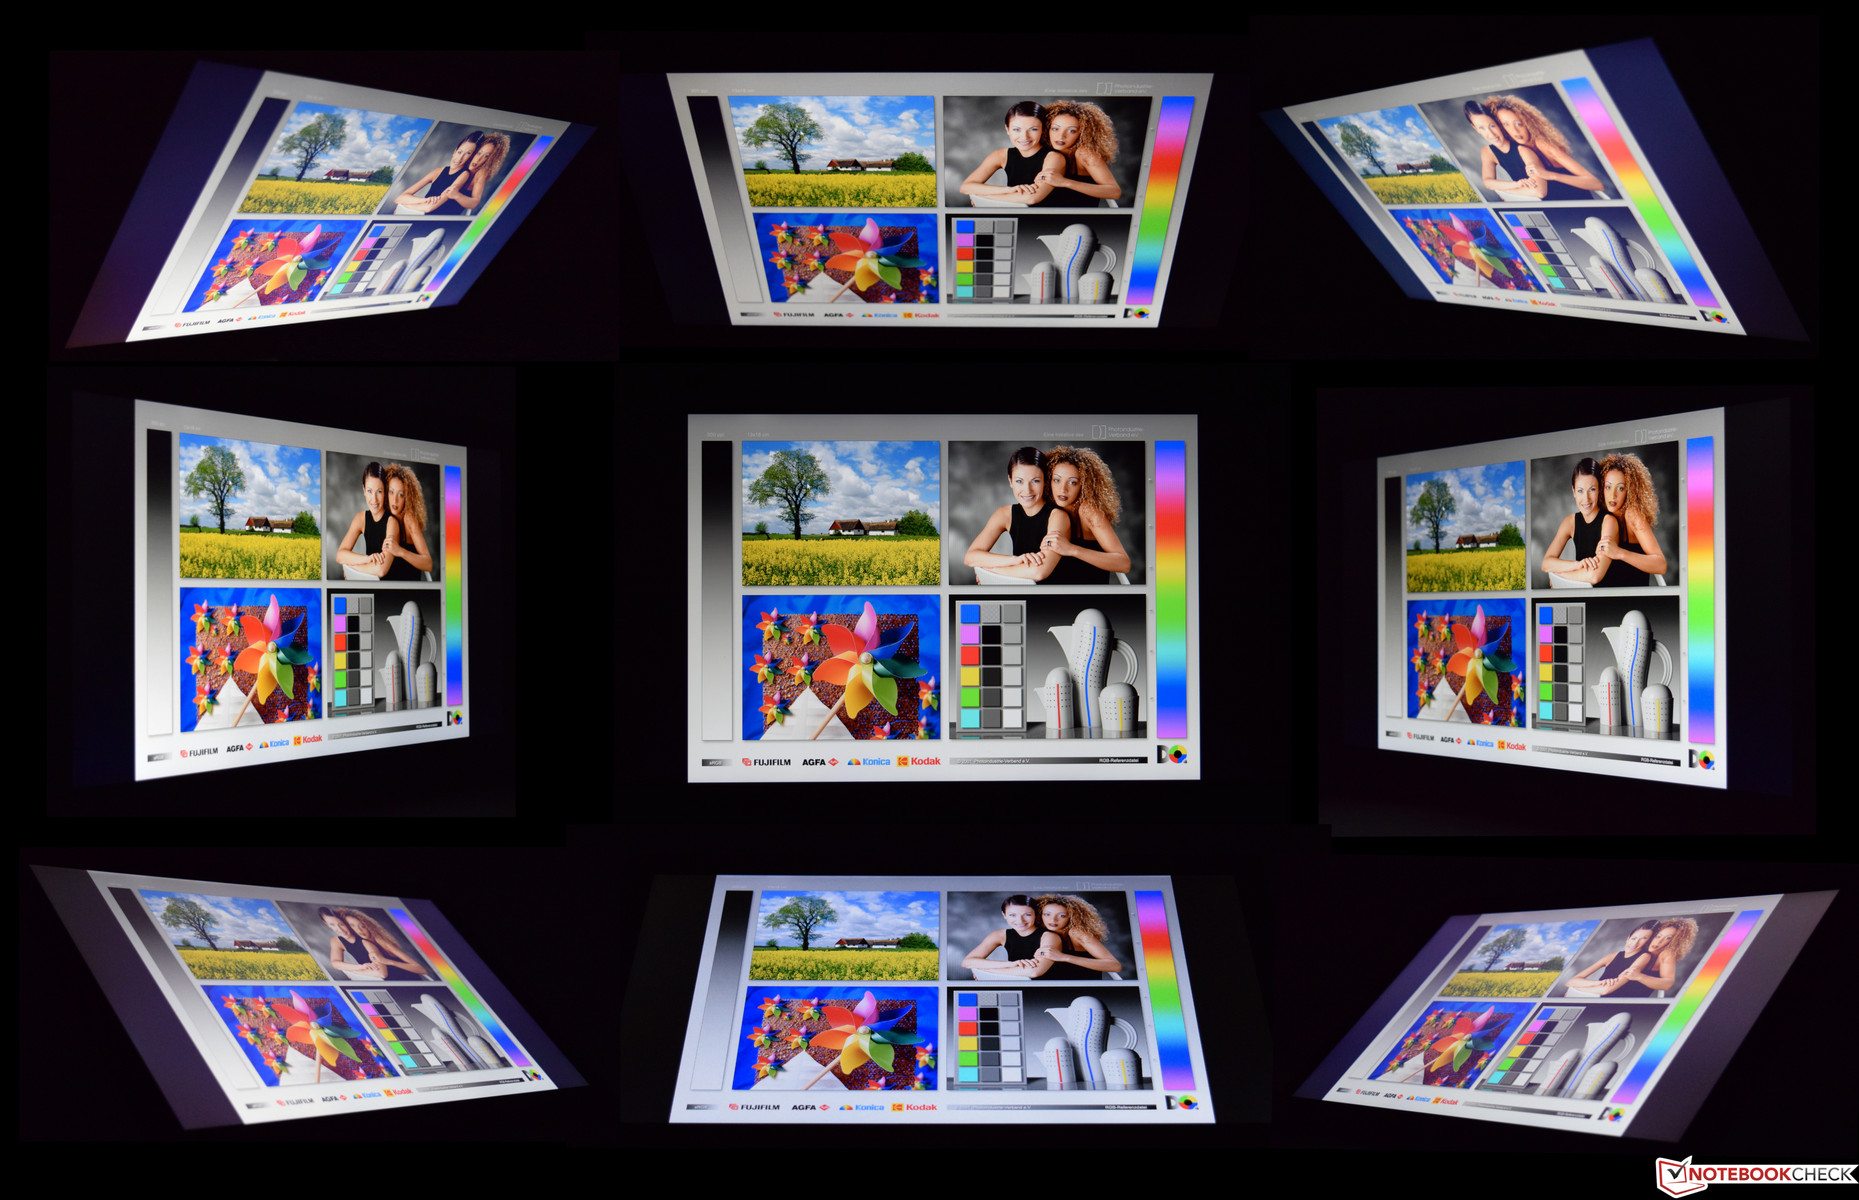
Viewing angles, on the other hand, were as wide as expected of an IPS panel. Colors never shifted noticeably even at acute angles, and we would have expected no less from a convertible.
Performance
For most users, the cheaper SKU will be perfectly adequate thanks to its Core i5-8250U quad-core CPU with plenty of oomph for everyday tasks. The limit most users will run into first is most likely going to be storage space; however, the SSD is user-replaceable and thus not a limiting factor in the long run. The Inspiron 15 5579 is also available with twice the RAM and twice the storage, and this more expensive unit also entails an Intel Core i7-8550U CPU that should be around 10% faster than our review unit’s i5.
The high latencies detected by LatencyMon can be a problem for some users, and we expect Dell to solve this issue in future driver updates.


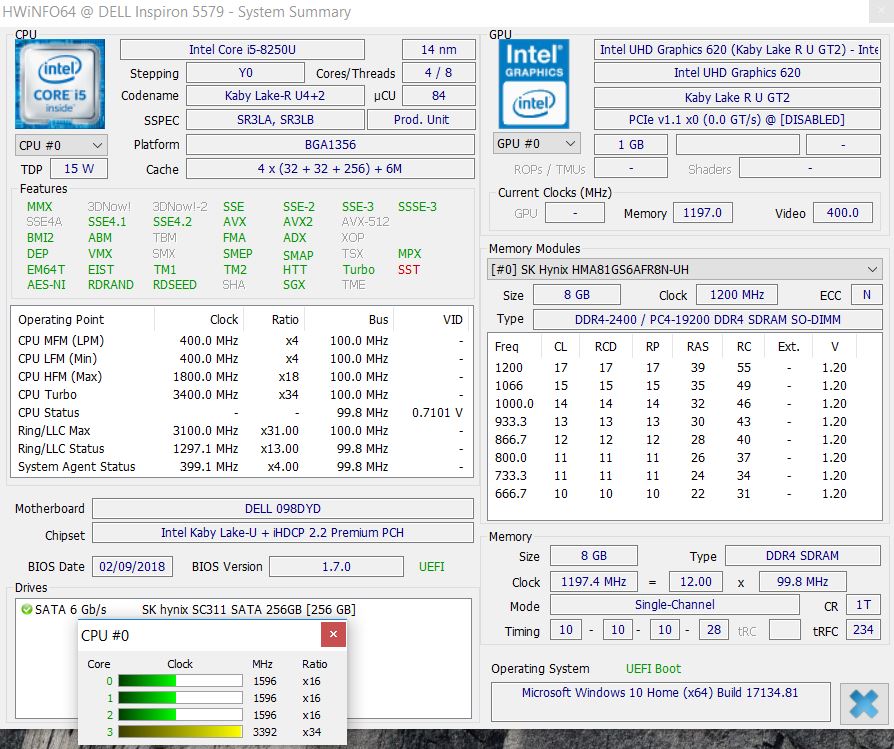
Processor
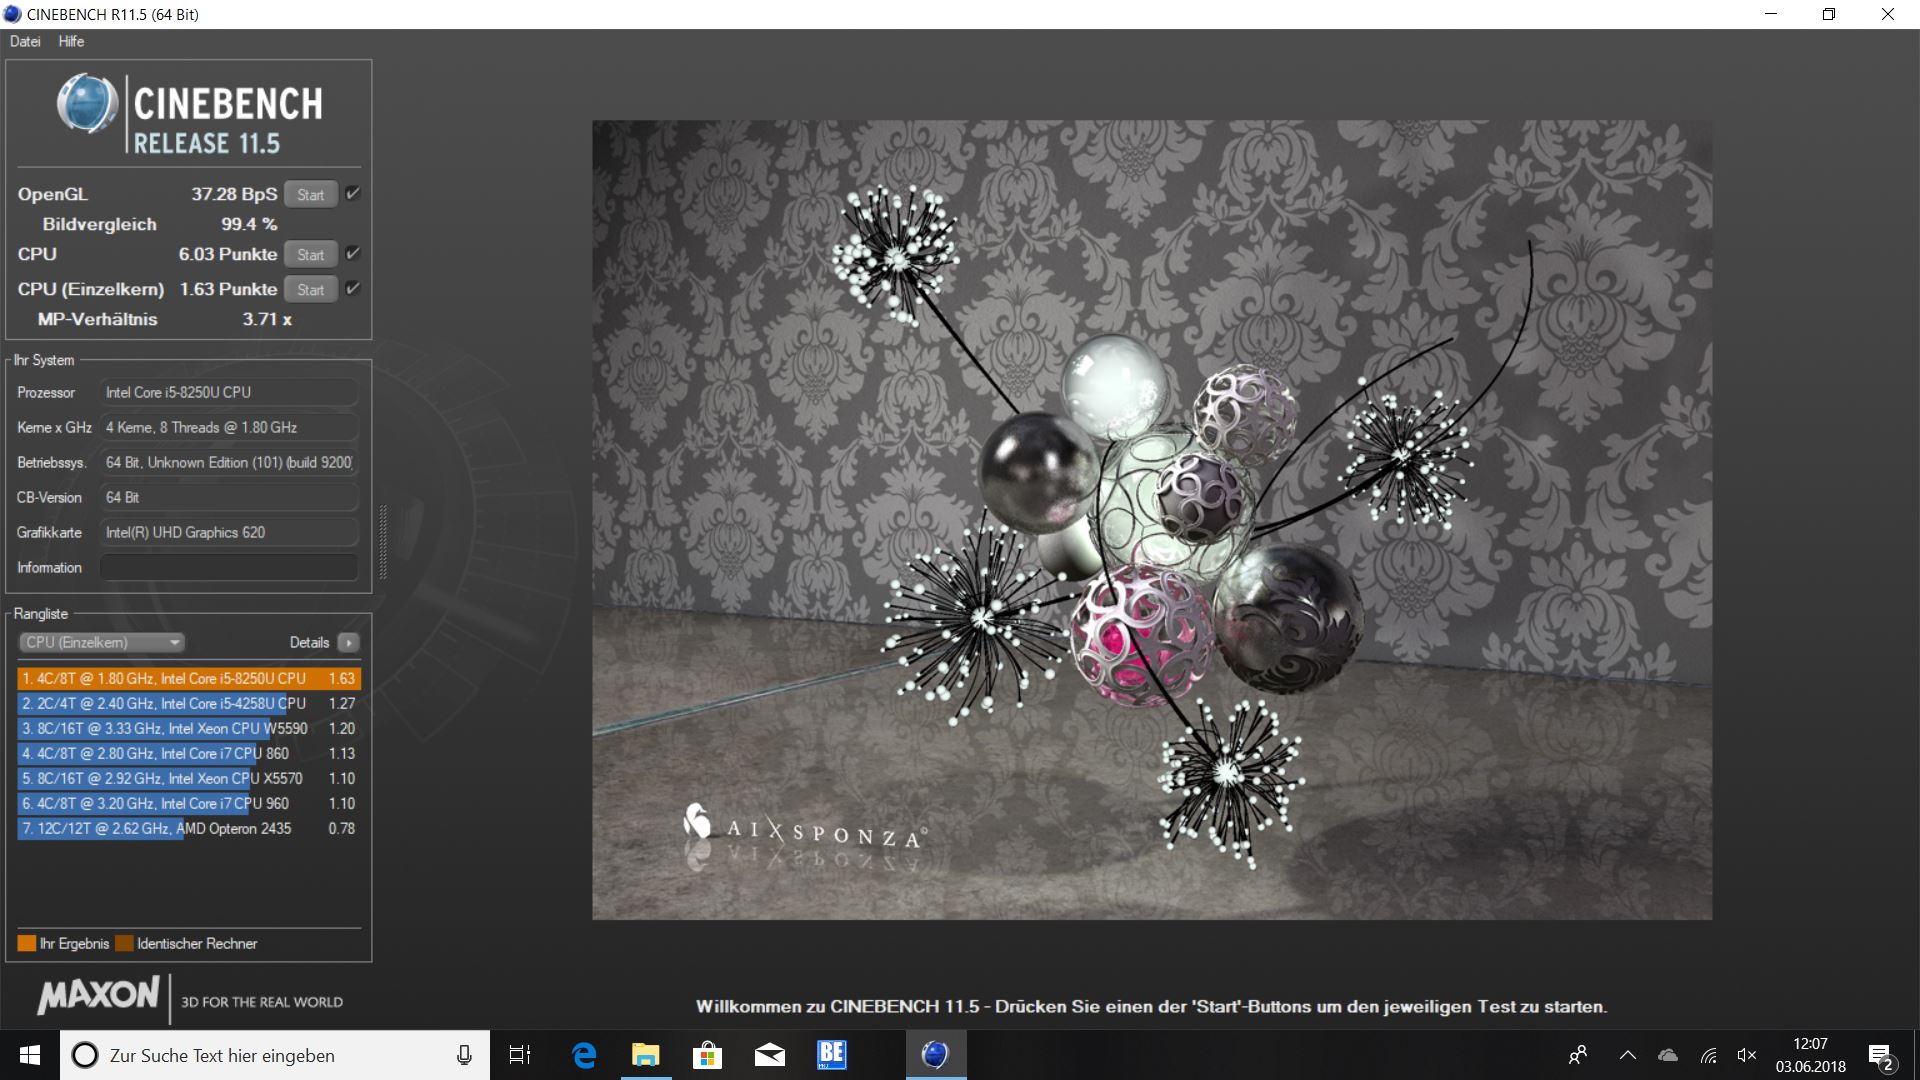
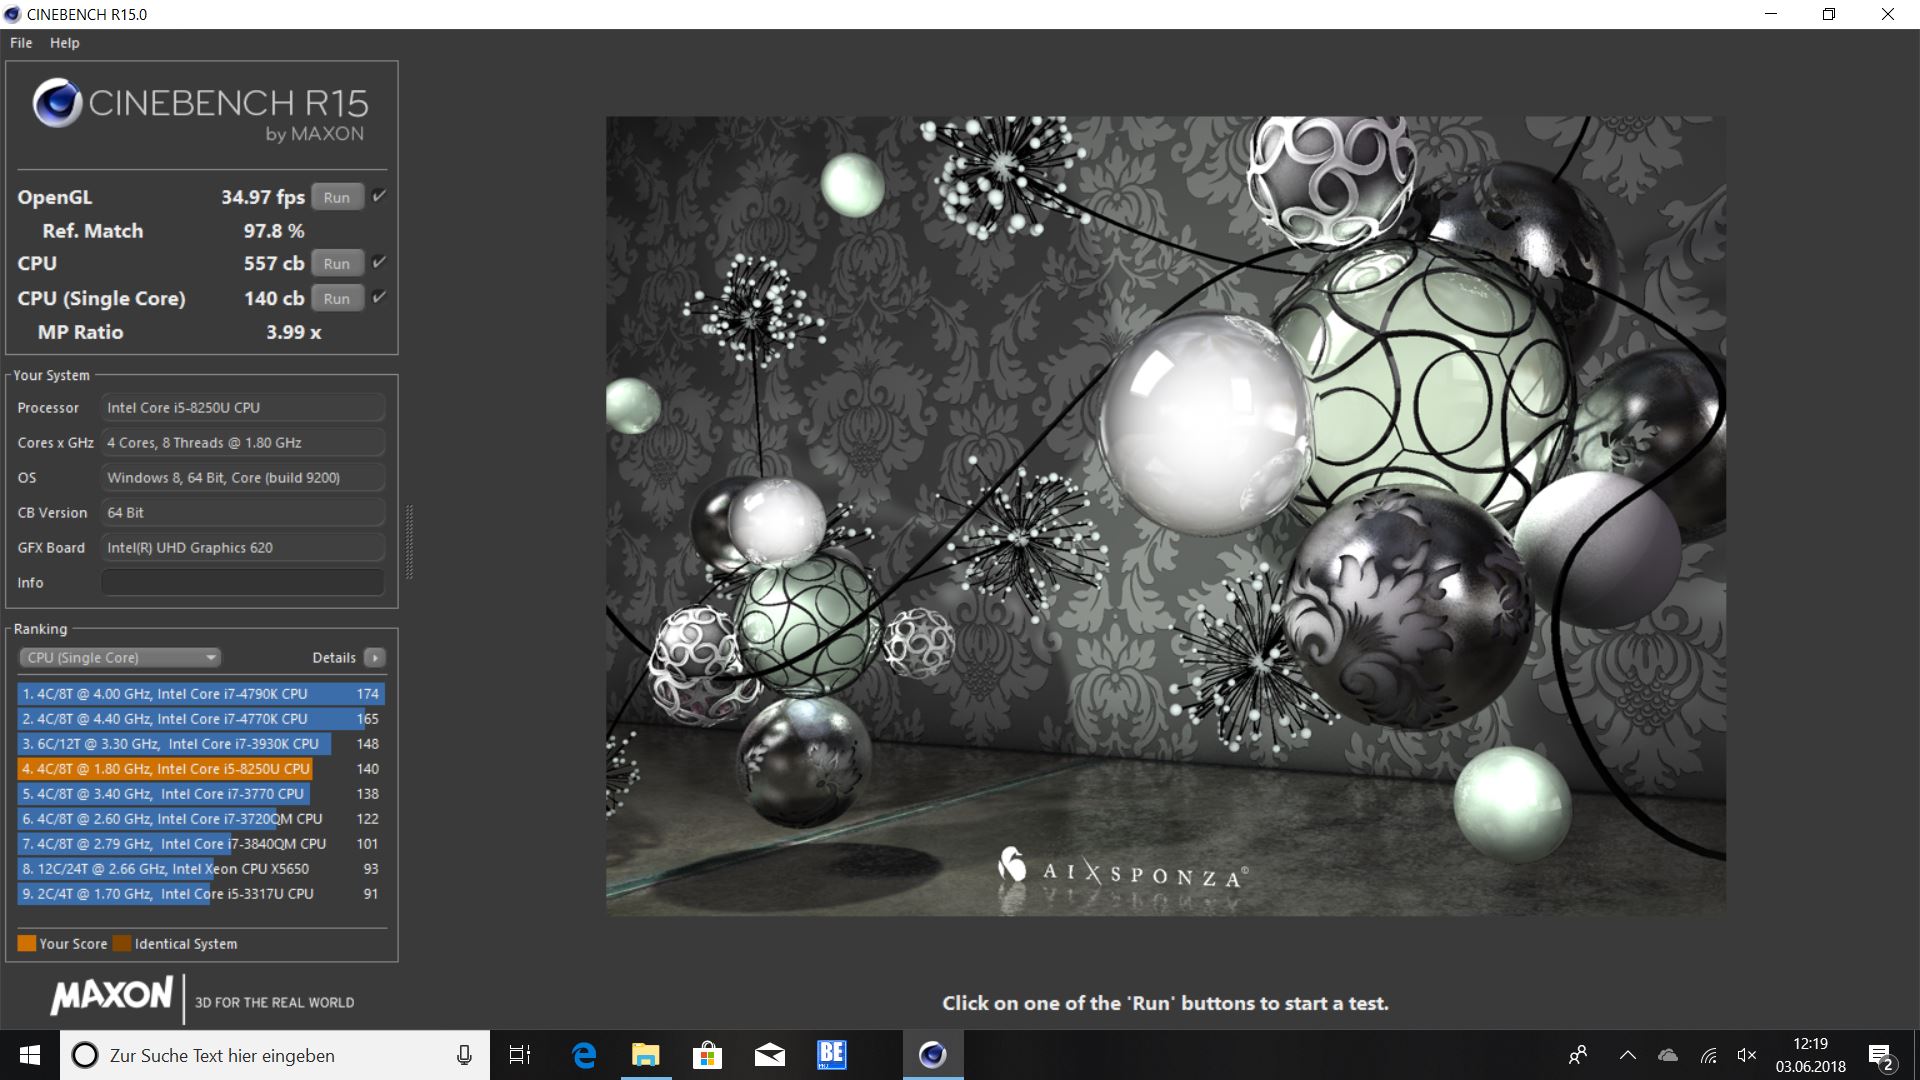
As mentioned before, the more affordable SKU comes with the successor to the last generation’s Core i5-7200U, the Core i5-8250U. At a TDP of 15 W this CPU offers four physical cores and up to eight threads running at 1.6 GHz and turbo boosting up to 3.4 GHz on demand. In our single-thread benchmark the 5579 was on a par with Lenovo's ThinkPad L380, although the latter had a slightly higher multithreaded performance. Looking at the results of all notebooks we can see that single-threaded performance is almost identical for all i5-8250U-equipped notebooks. Multithreaded performance is where the wheat is separated from the chaff, though, and the Asus VivoBook Flip 15 turned out to be much faster than all of its competitors.
Compared with its predecessor, the Inspiron 15 5578, the new CPU was between 11% (single-core) and 60% (multi-core) faster.
Additional benchmarks for Intel’s Core i5-8250U can be found here.
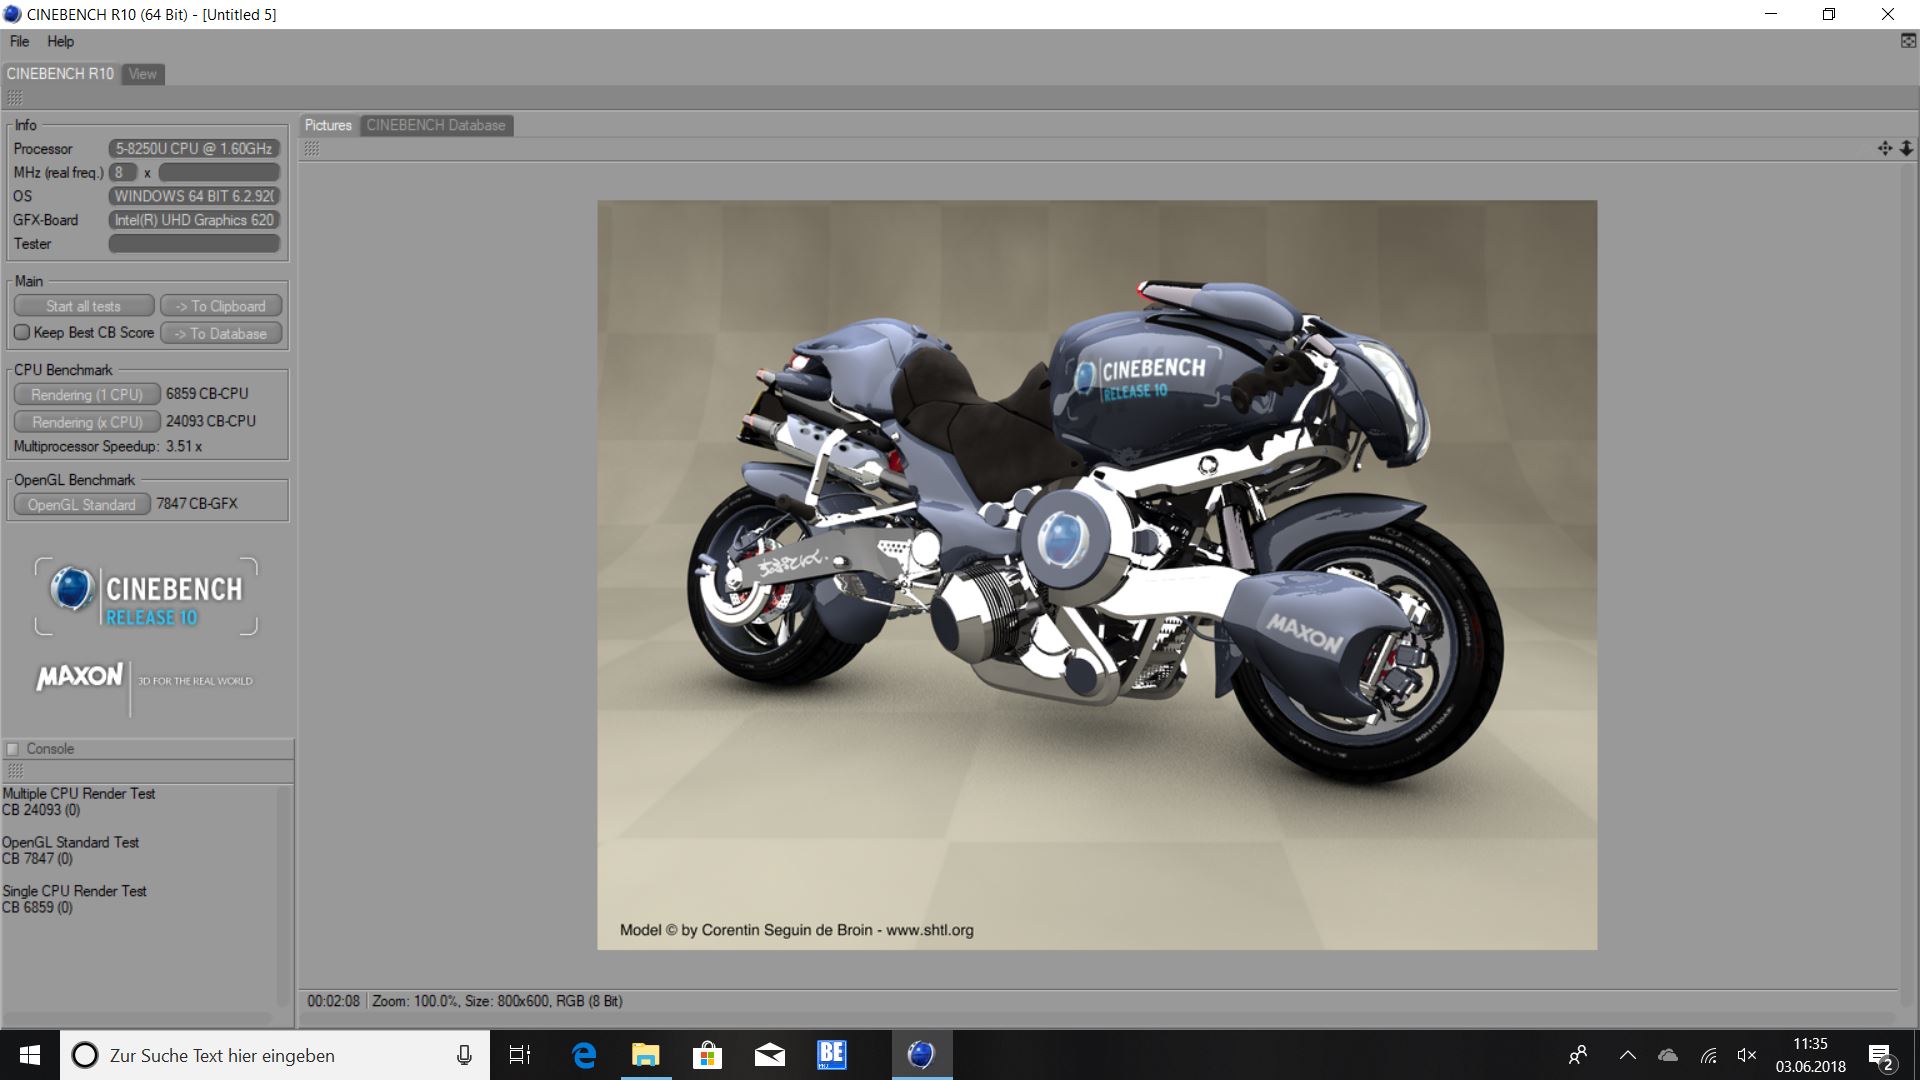
Like all notebooks, the 5579 has to run our Cinebench R15 multi-core loop sustained load test. While its initial score of 560 was decent the second iteration dropped to just 480 points, and eventually the score settled at around 500 points. Accordingly, CPU performance decreased by 12% under sustained load.
| Cinebench R10 | |
| Rendering Single CPUs 64Bit | |
| Average of class Convertible (12127 - 12555, n=2, last 2 years) | |
| Average Intel Core i5-8250U (5163 - 8153, n=13) | |
| Dell Inspiron 15 5579-9672 | |
| Rendering Multiple CPUs 64Bit | |
| Average of class Convertible (36094 - 50439, n=2, last 2 years) | |
| Dell Inspiron 15 5579-9672 | |
| Average Intel Core i5-8250U (11245 - 28932, n=13) | |
| HWBOT x265 Benchmark v2.2 - 4k Preset | |
| Average of class Convertible (3.43 - 36.2, n=48, last 2 years) | |
| Average Intel Core i5-8250U (3.02 - 4.78, n=8) | |
| Dell Inspiron 15 5579-9672 | |
* ... smaller is better
System Performance
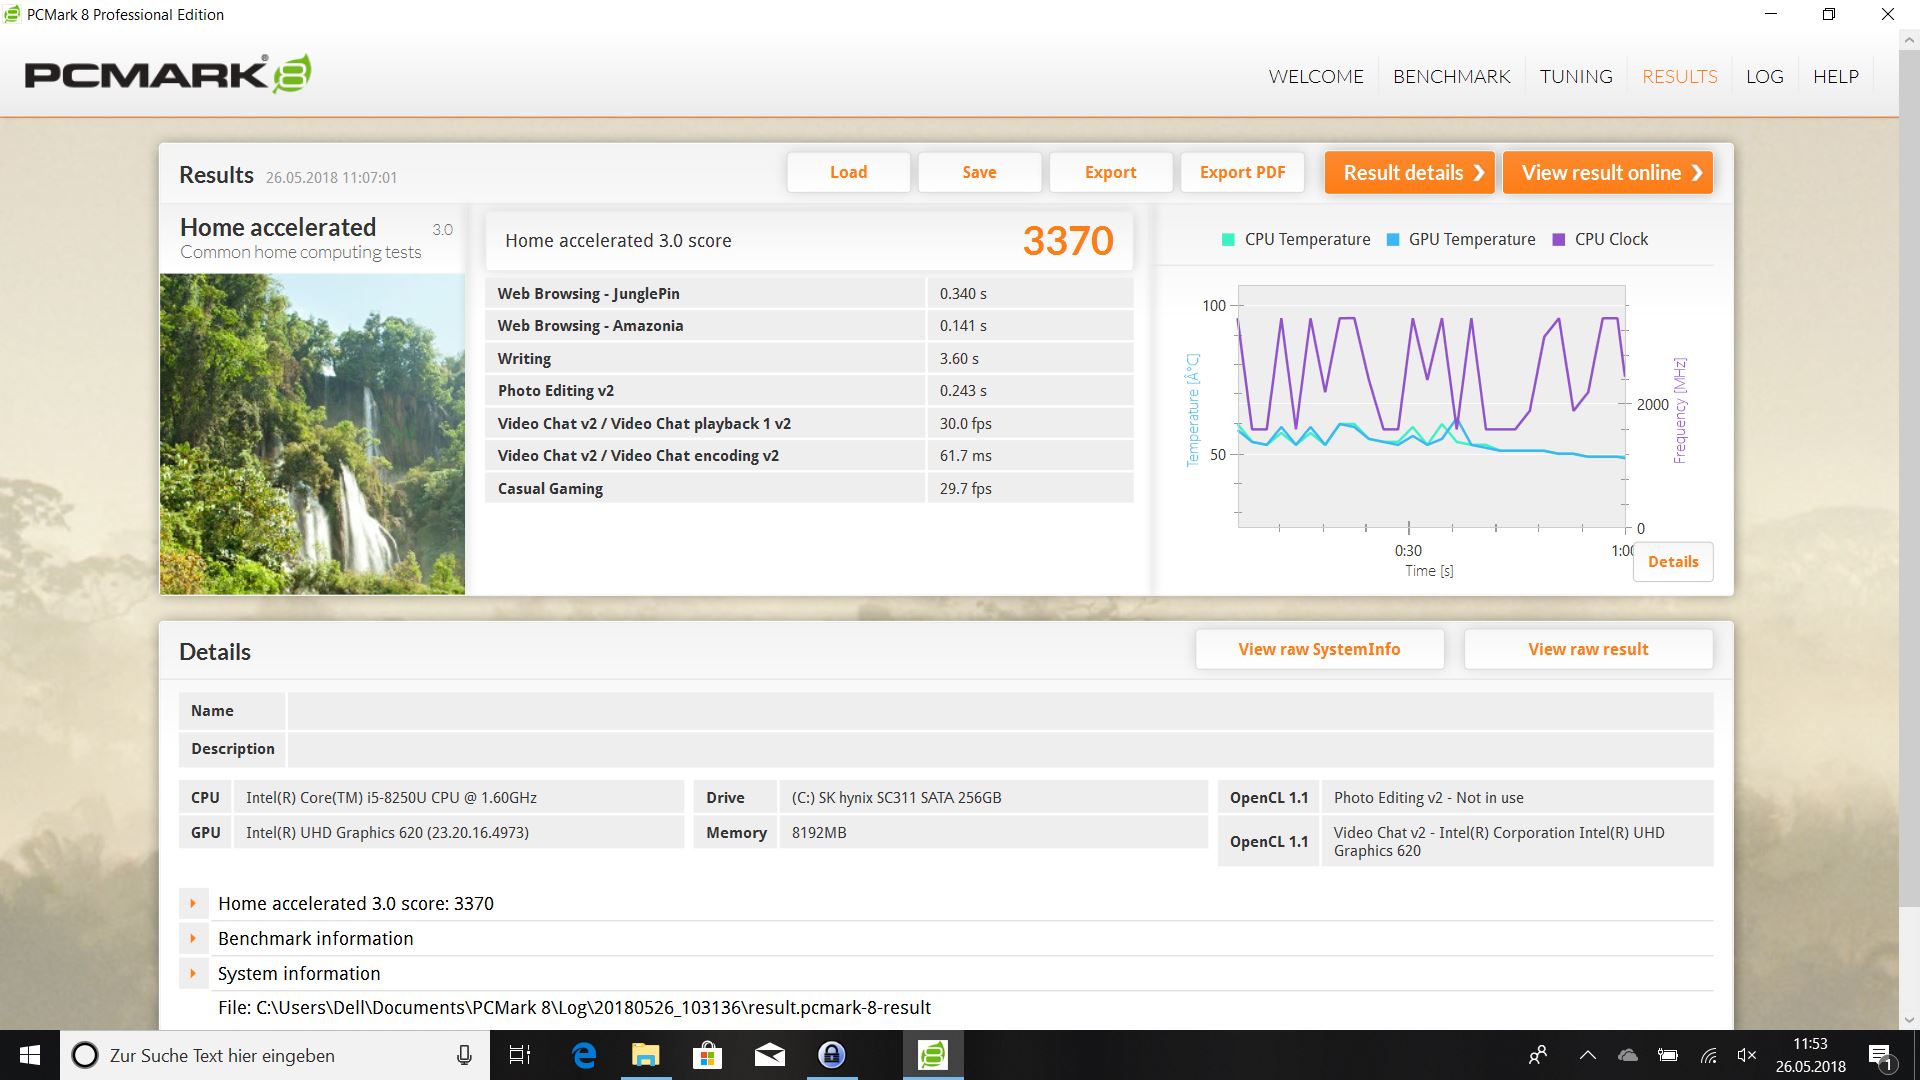
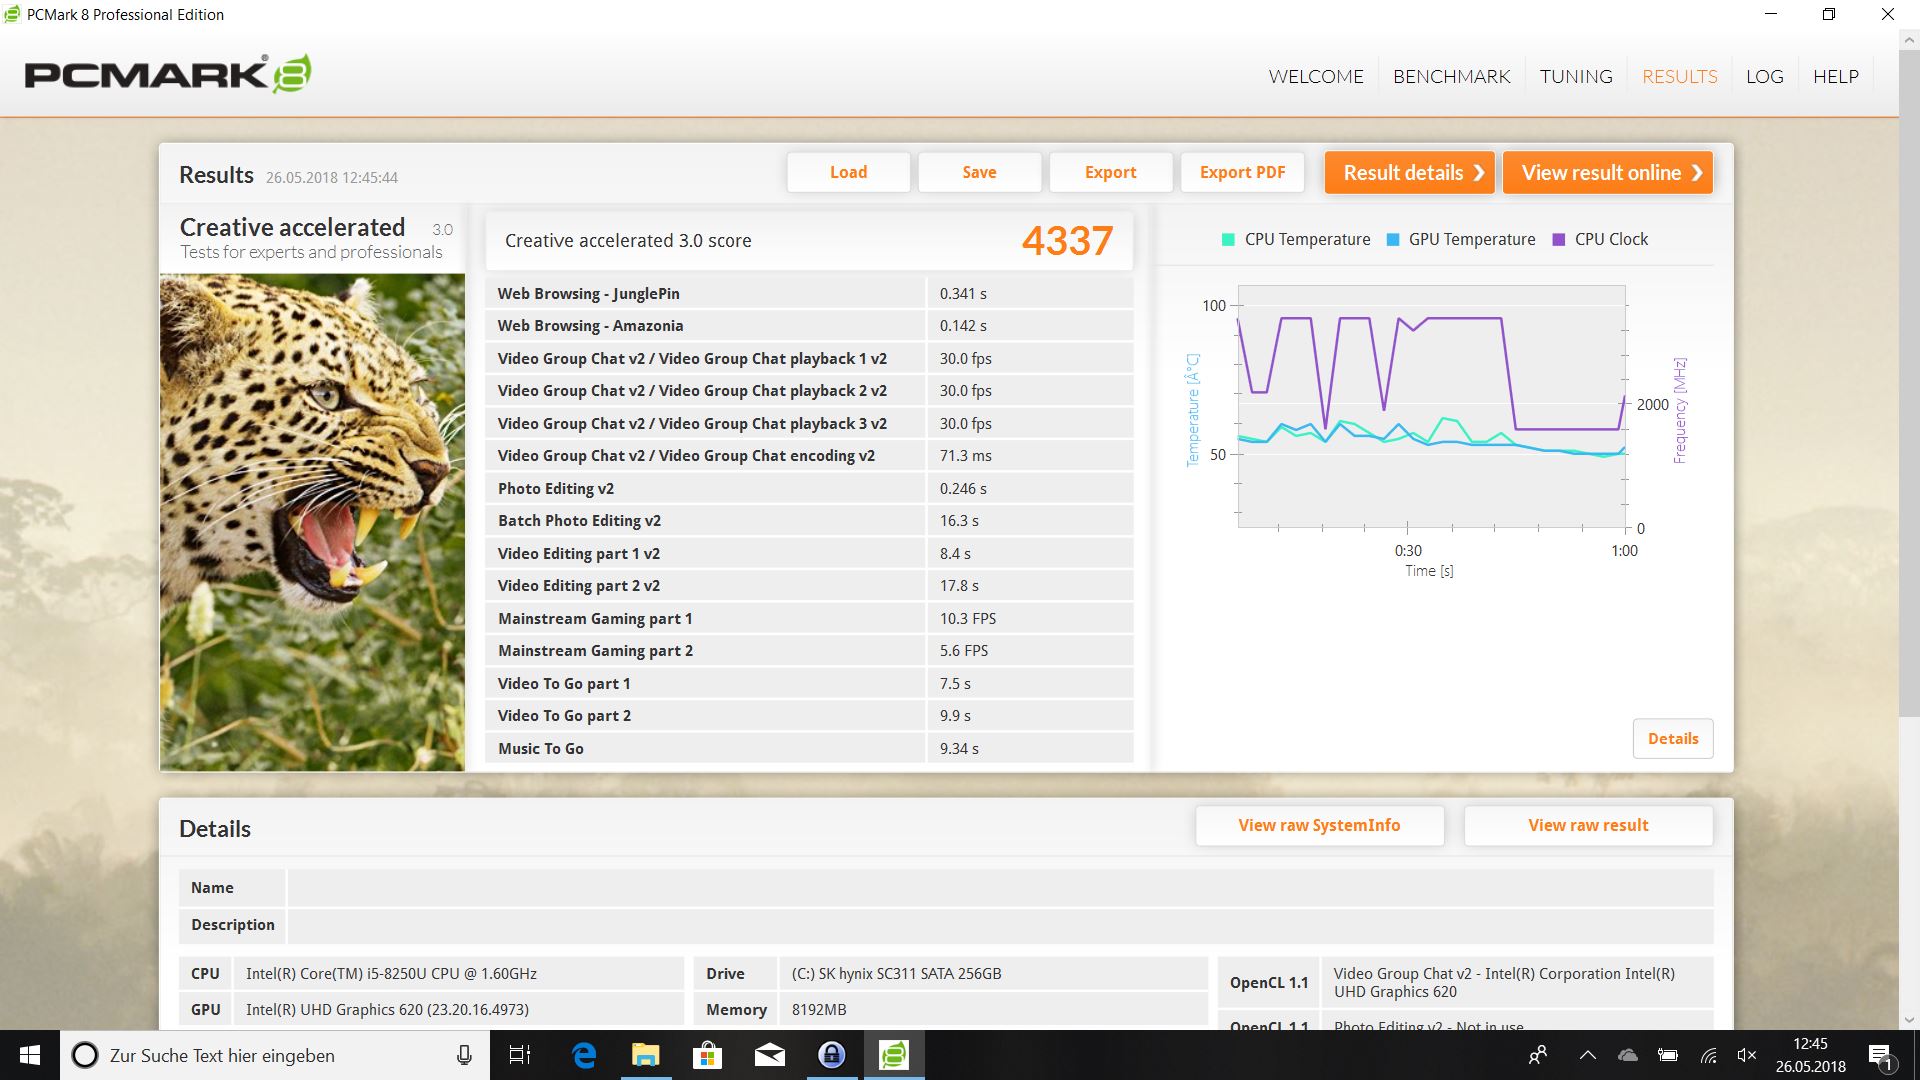
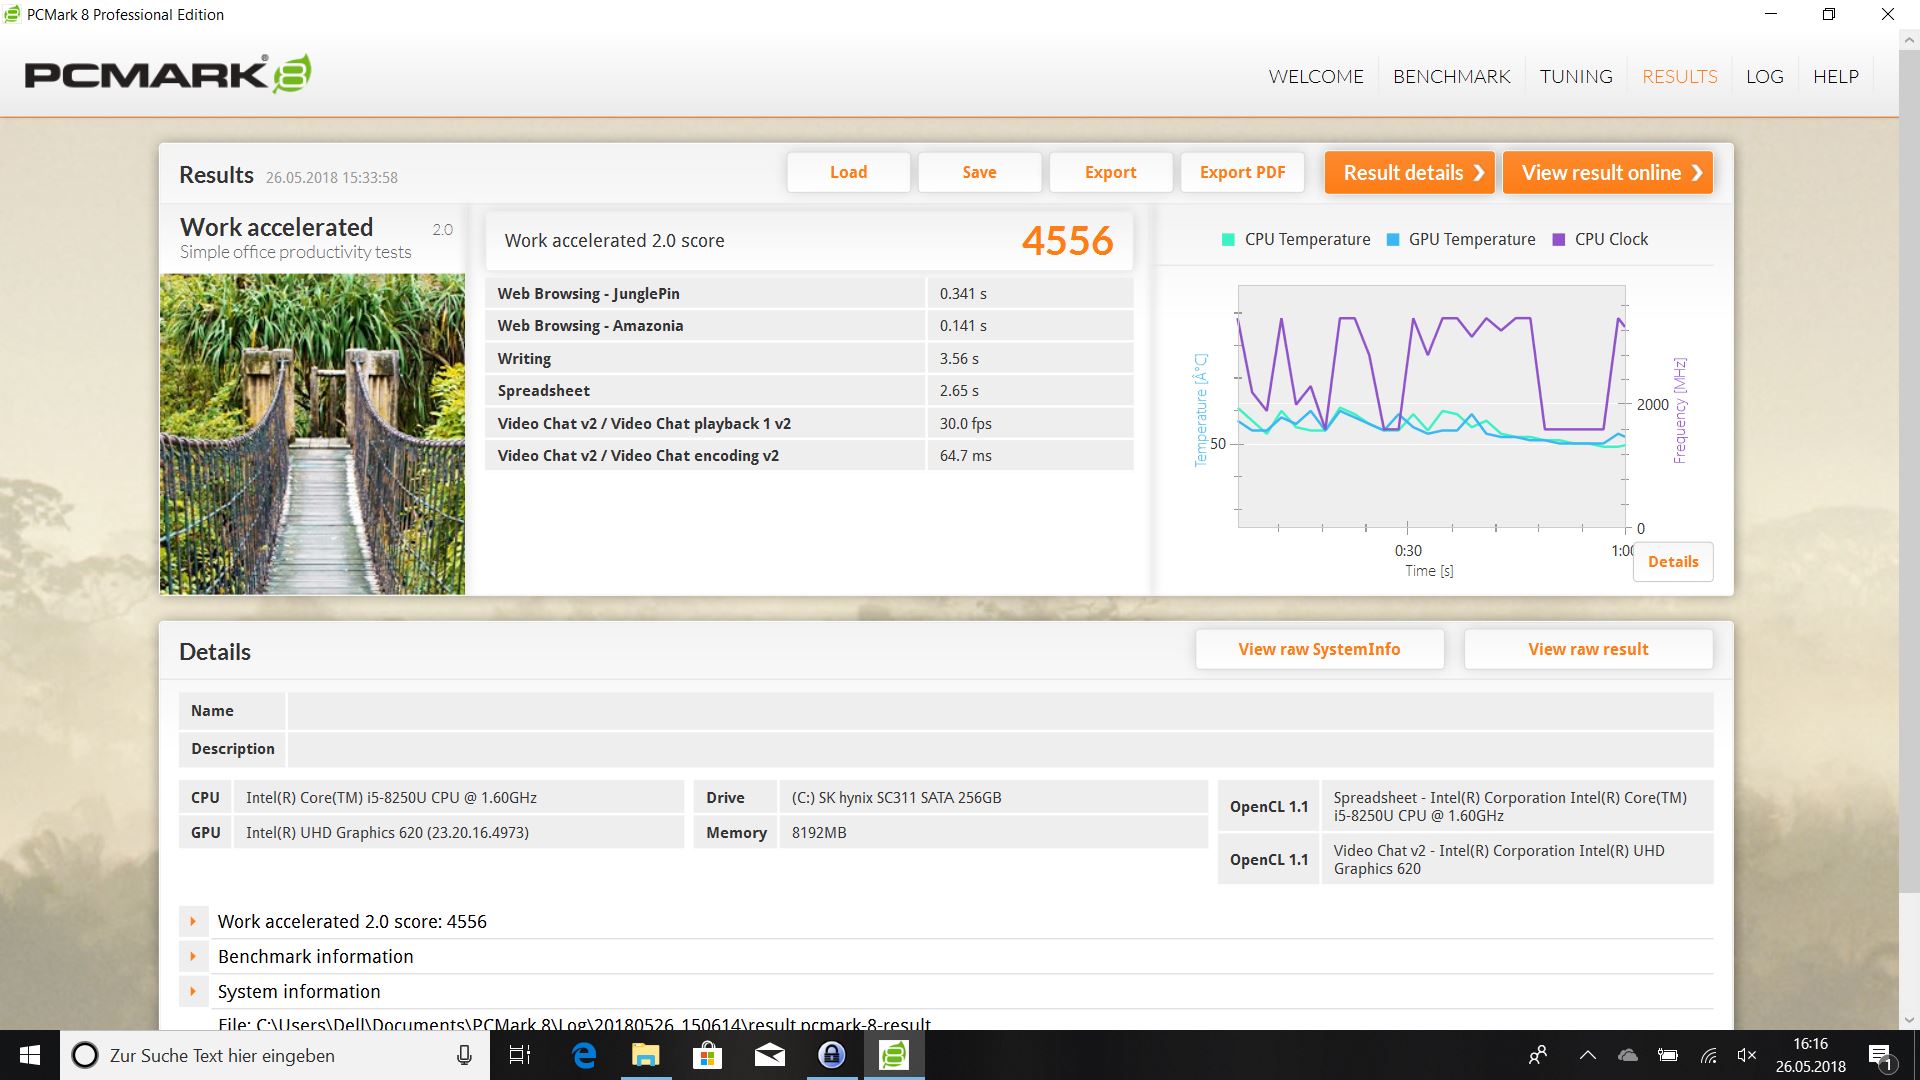
The synthetic PCMark benchmarks were definitely not the 5579’s strong suit, although we must add that the difference between the 5579 and the fastest contender was just a few percent. The review unit performed very well during our tests. The system felt fast and snappy thanks to its SSD, and demanding multithread tasks were completed without breaking a sweat thanks to the fast quad-core CPU. The system never stalled or stuttered due to lack of memory.
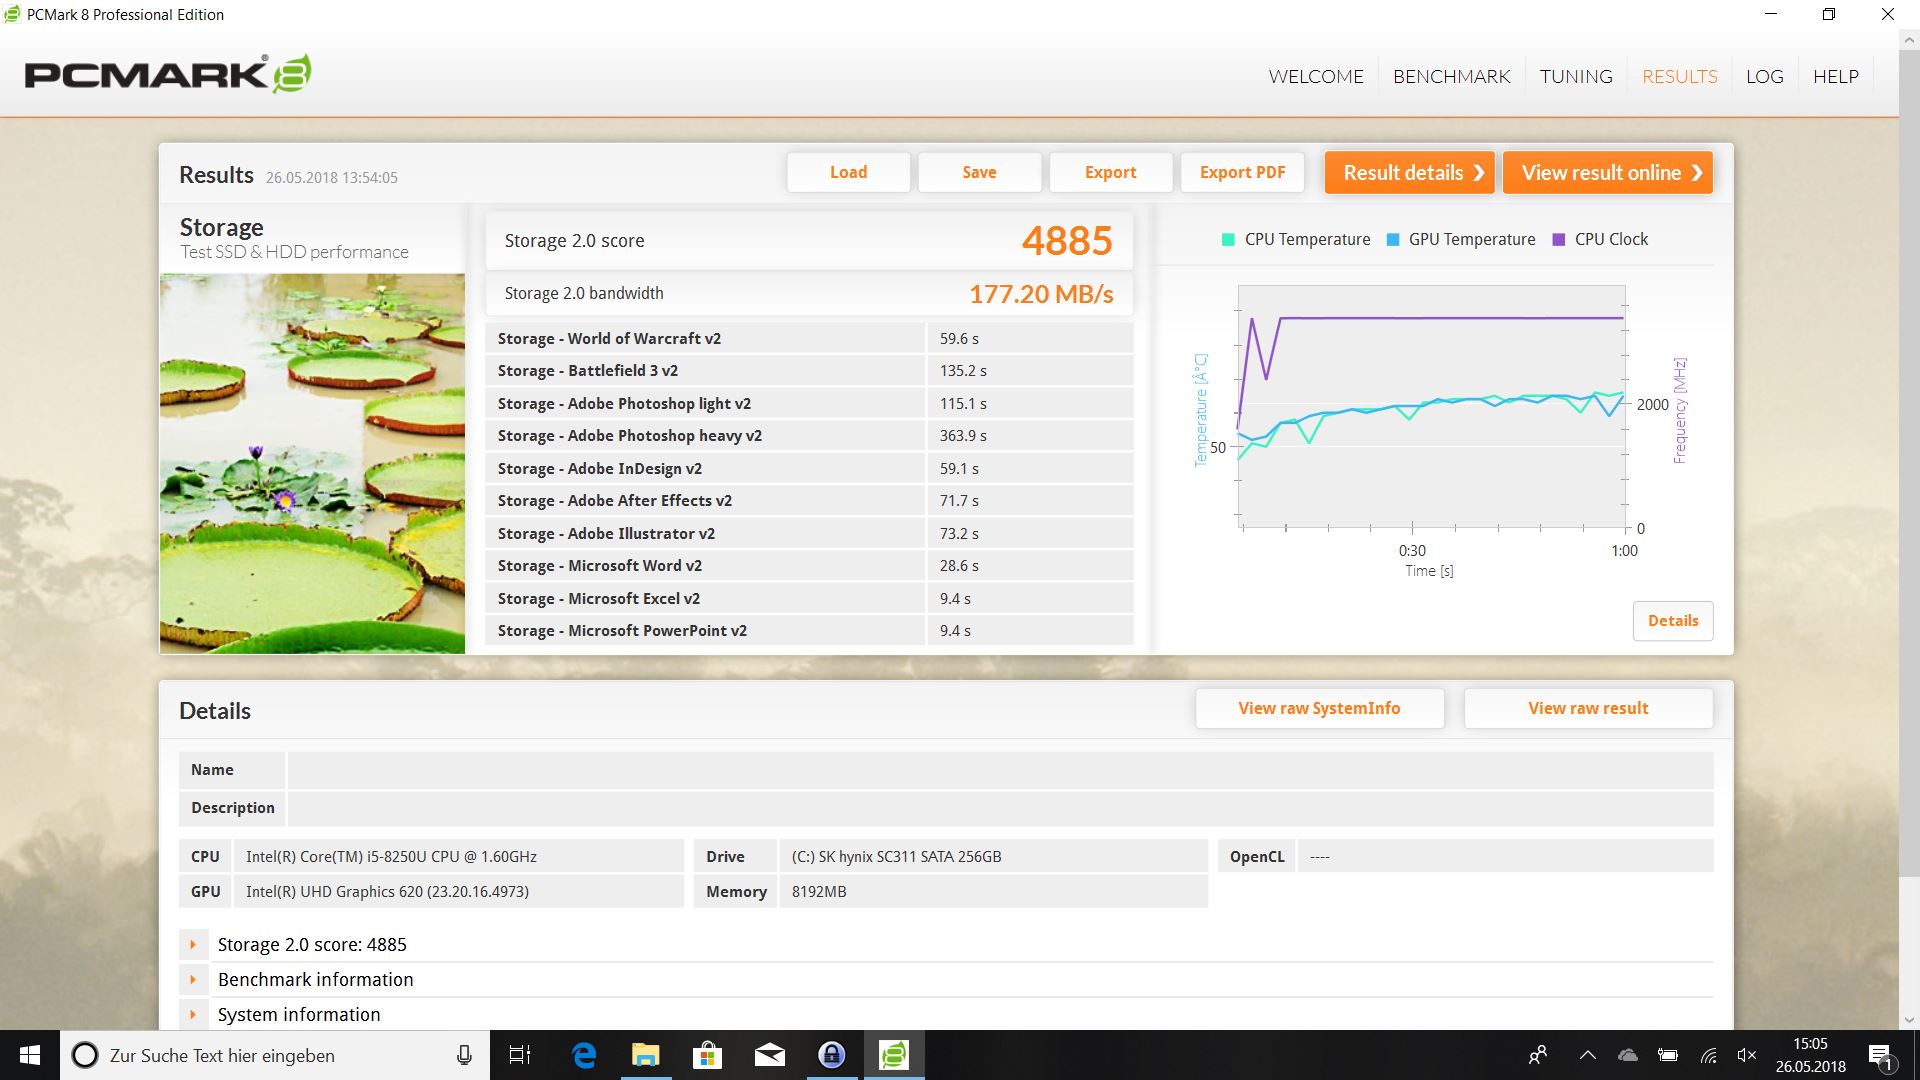
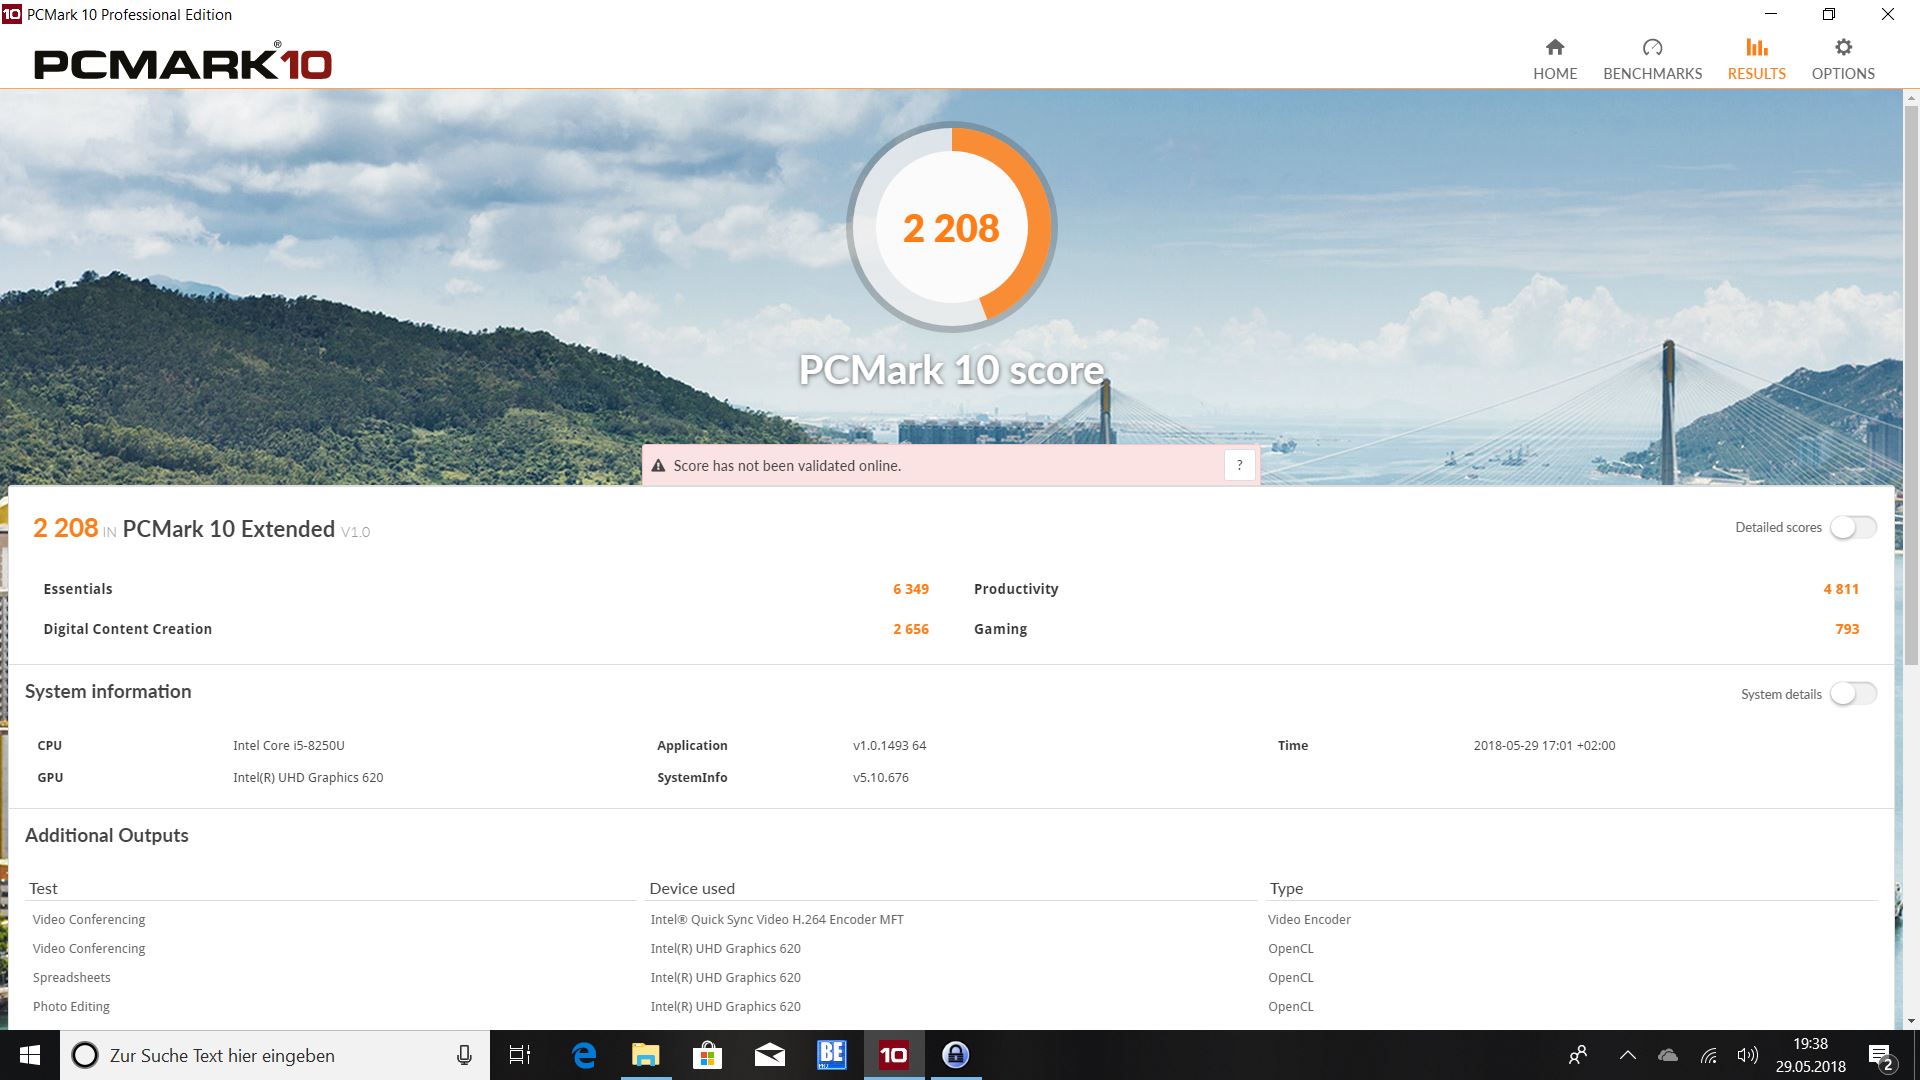

| PCMark 7 Score | 5313 points | |
| PCMark 8 Home Score Accelerated v2 | 3370 points | |
| PCMark 8 Creative Score Accelerated v2 | 4337 points | |
| PCMark 8 Work Score Accelerated v2 | 4556 points | |
| PCMark 10 Score | 2208 points | |
Help | ||
Storage Devices

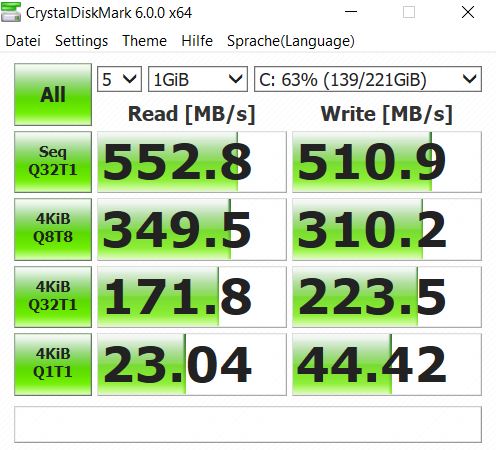
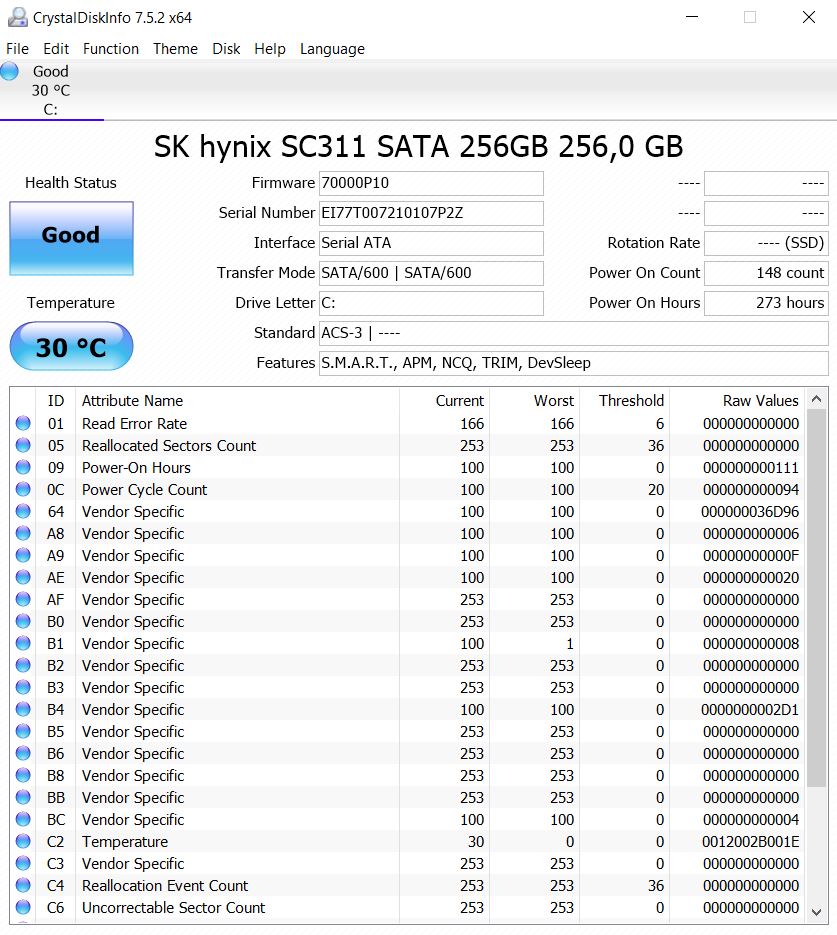
The 256 GB 2.5-inch SSD is made by SK Hynix. Out of the box, around 190 GB is available with the rest taken up by the Windows installation and the preloaded software. 4K read performance was adequate even though higher 4K performance would have resulted in faster application launches.
The SSD performed exactly as expected of a SATA SSD. Unfortunately, the 5579 does not support NVMe SSDs, and it also does not feature a second storage bay or slot.


| Dell Inspiron 15 5579-9672 SK hynix SC311 SATA | Dell Inspiron 15 5578-1777 2-in-1 SanDisk X400 256GB, SATA (SD8SB8U-256G) | HP Envy x360 15-bq102ng Samsung PM961 MZVLW256HEHP | Asus VivoBook Flip 15 TP510UA-E8073T SanDisk SD8SN8U128G1002 | Acer Spin 3 SP314-51-548L Micron 1100 MTFDDAV256TBN | Lenovo ThinkPad L380 Yoga-20M7001BGE Samsung PM961 MZVLW256HEHP | |
|---|---|---|---|---|---|---|
| CrystalDiskMark 3.0 | 7% | 114% | -5% | 14% | 164% | |
| Read Seq (MB/s) | 503 | 503 0% | 1487 196% | 458.5 -9% | 484.3 -4% | 2073 312% |
| Write Seq (MB/s) | 447.2 | 465.3 4% | 1241 178% | 337.2 -25% | 439.8 -2% | 943 111% |
| Read 512 (MB/s) | 360.1 | 293 -19% | 923 156% | 319.1 -11% | 316.4 -12% | 1221 239% |
| Write 512 (MB/s) | 360.1 | 322.7 -10% | 797 121% | 186 -48% | 345.4 -4% | 819 127% |
| Read 4k (MB/s) | 21.78 | 28.9 33% | 49.38 127% | 28.39 30% | 27.17 25% | 53.5 146% |
| Write 4k (MB/s) | 45.64 | 55 21% | 97.3 113% | 56.6 24% | 86.7 90% | 127.4 179% |
| Read 4k QD32 (MB/s) | 223.3 | 314.5 41% | 295 32% | 321.1 44% | 246.7 10% | 396.6 78% |
| Write 4k QD32 (MB/s) | 248.4 | 209.2 -16% | 212.5 -14% | 128.5 -48% | 260.6 5% | 538 117% |

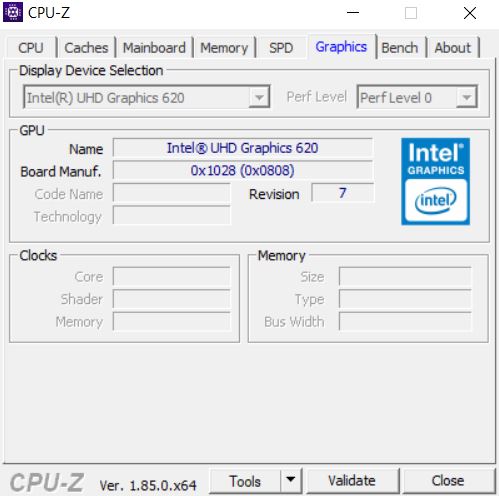
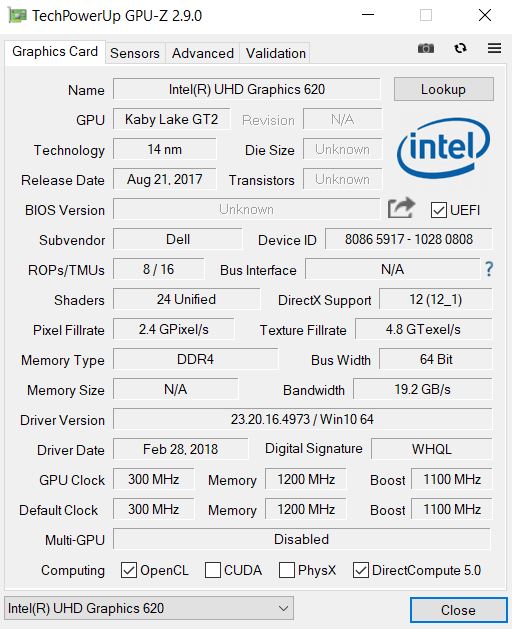
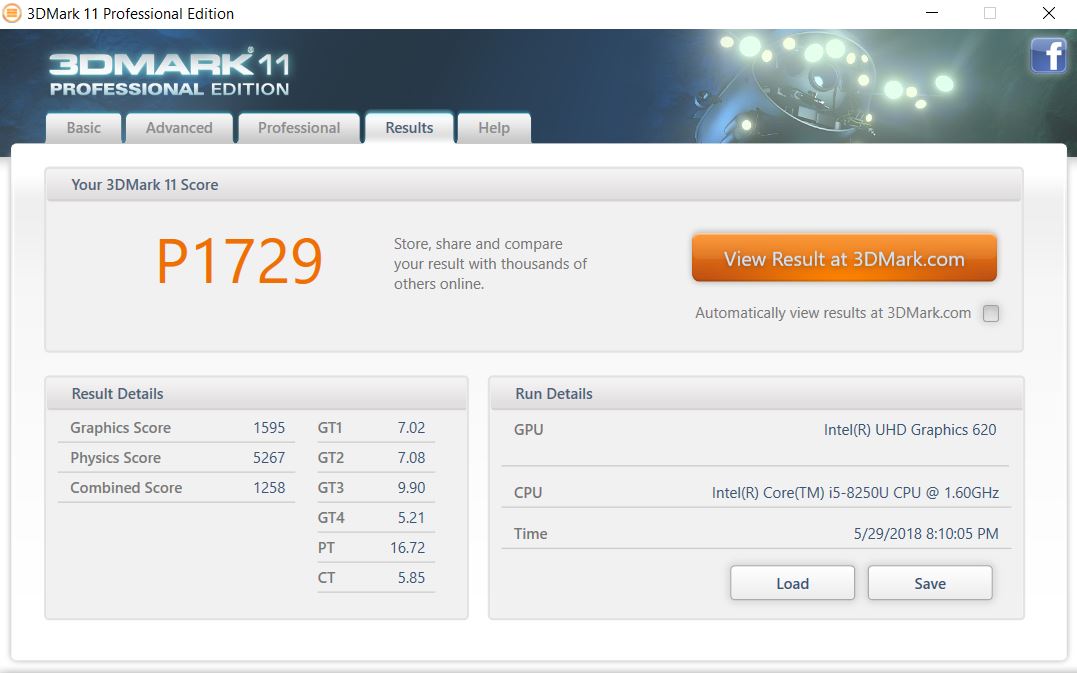
GPU Performance
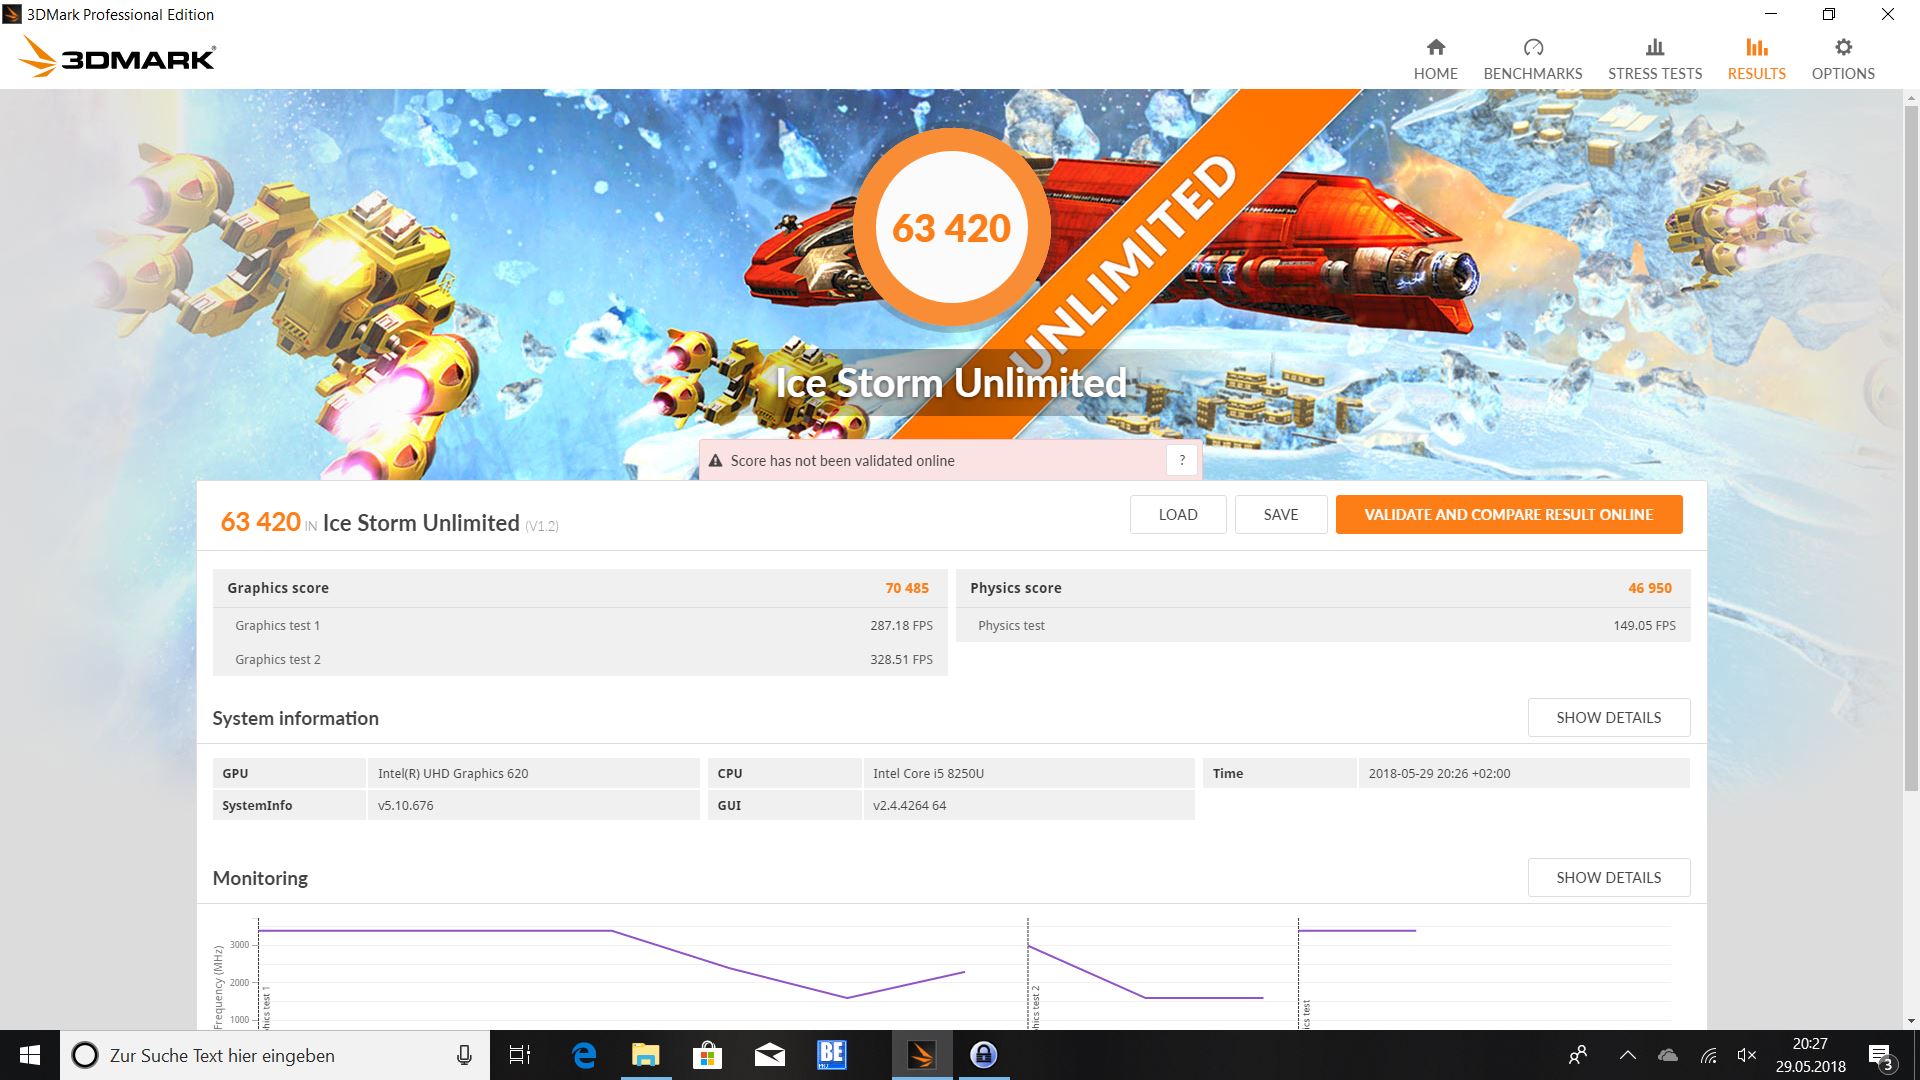
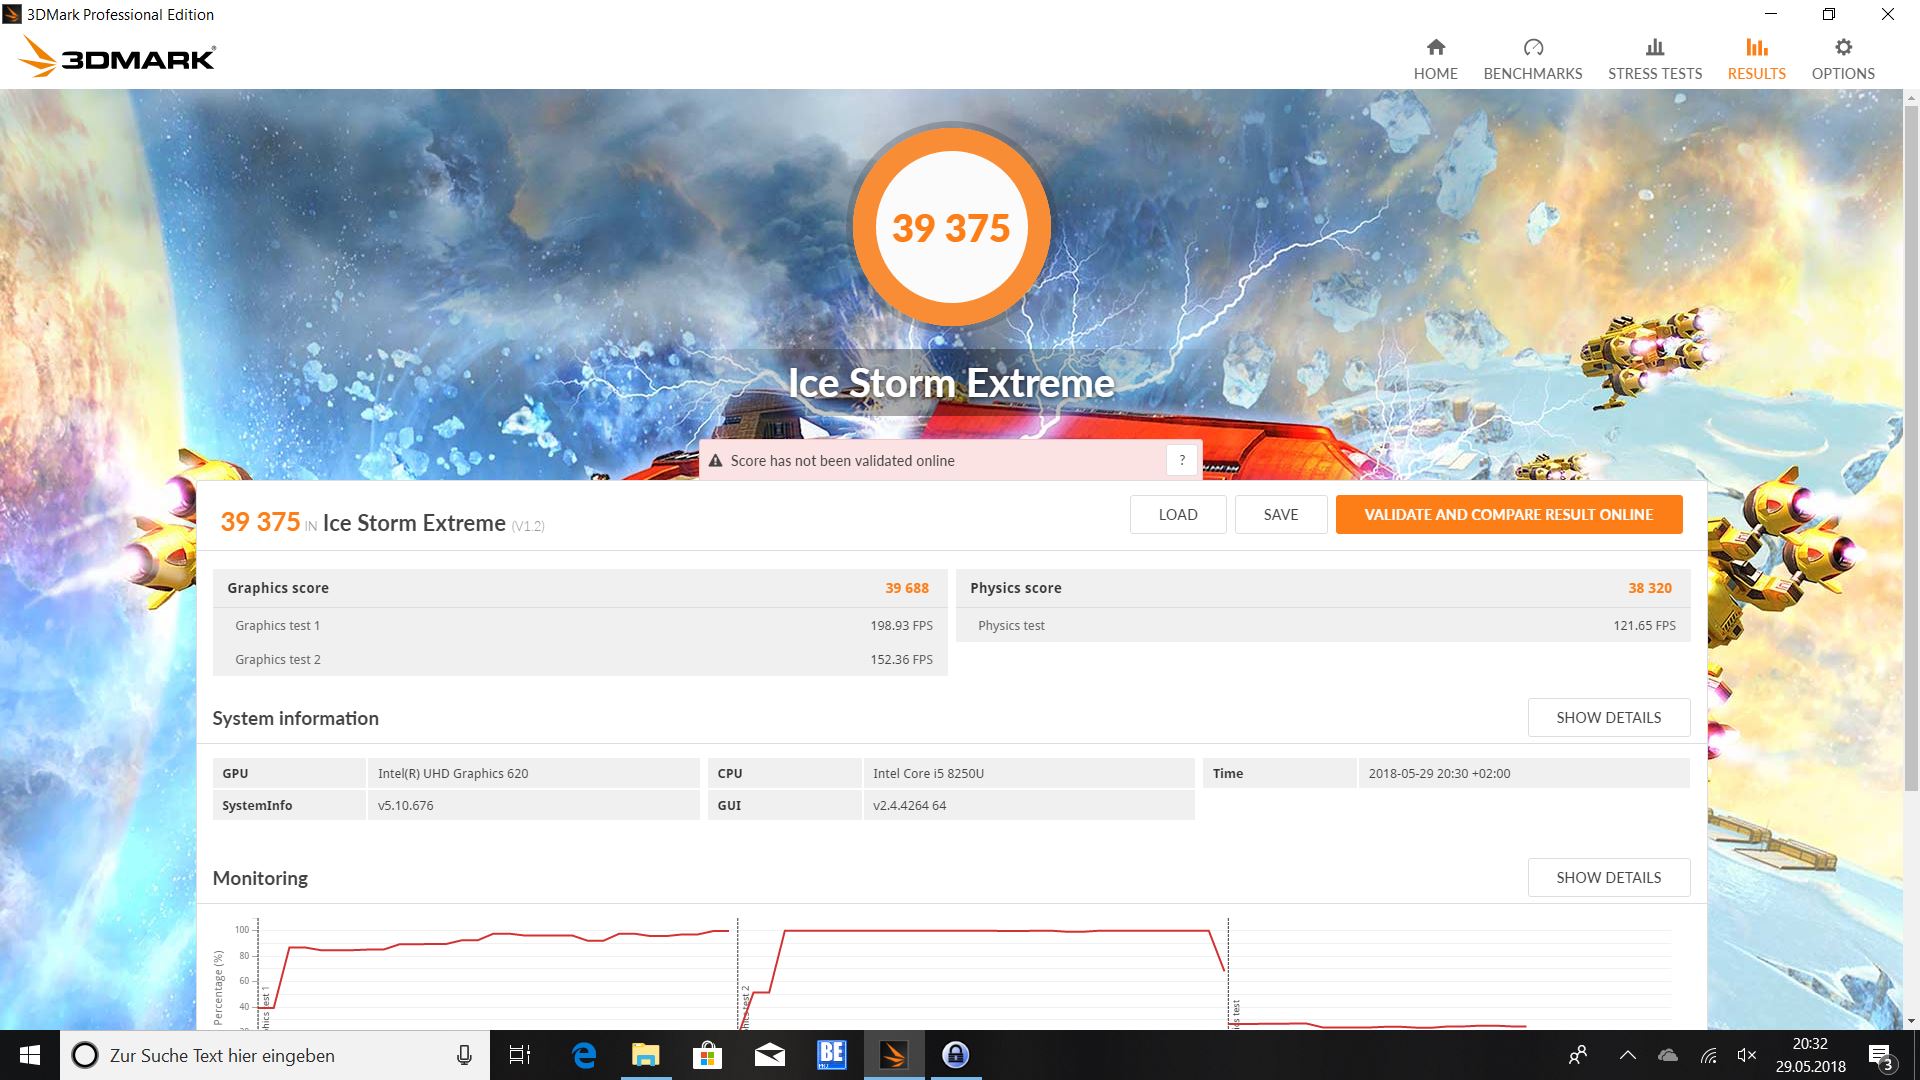
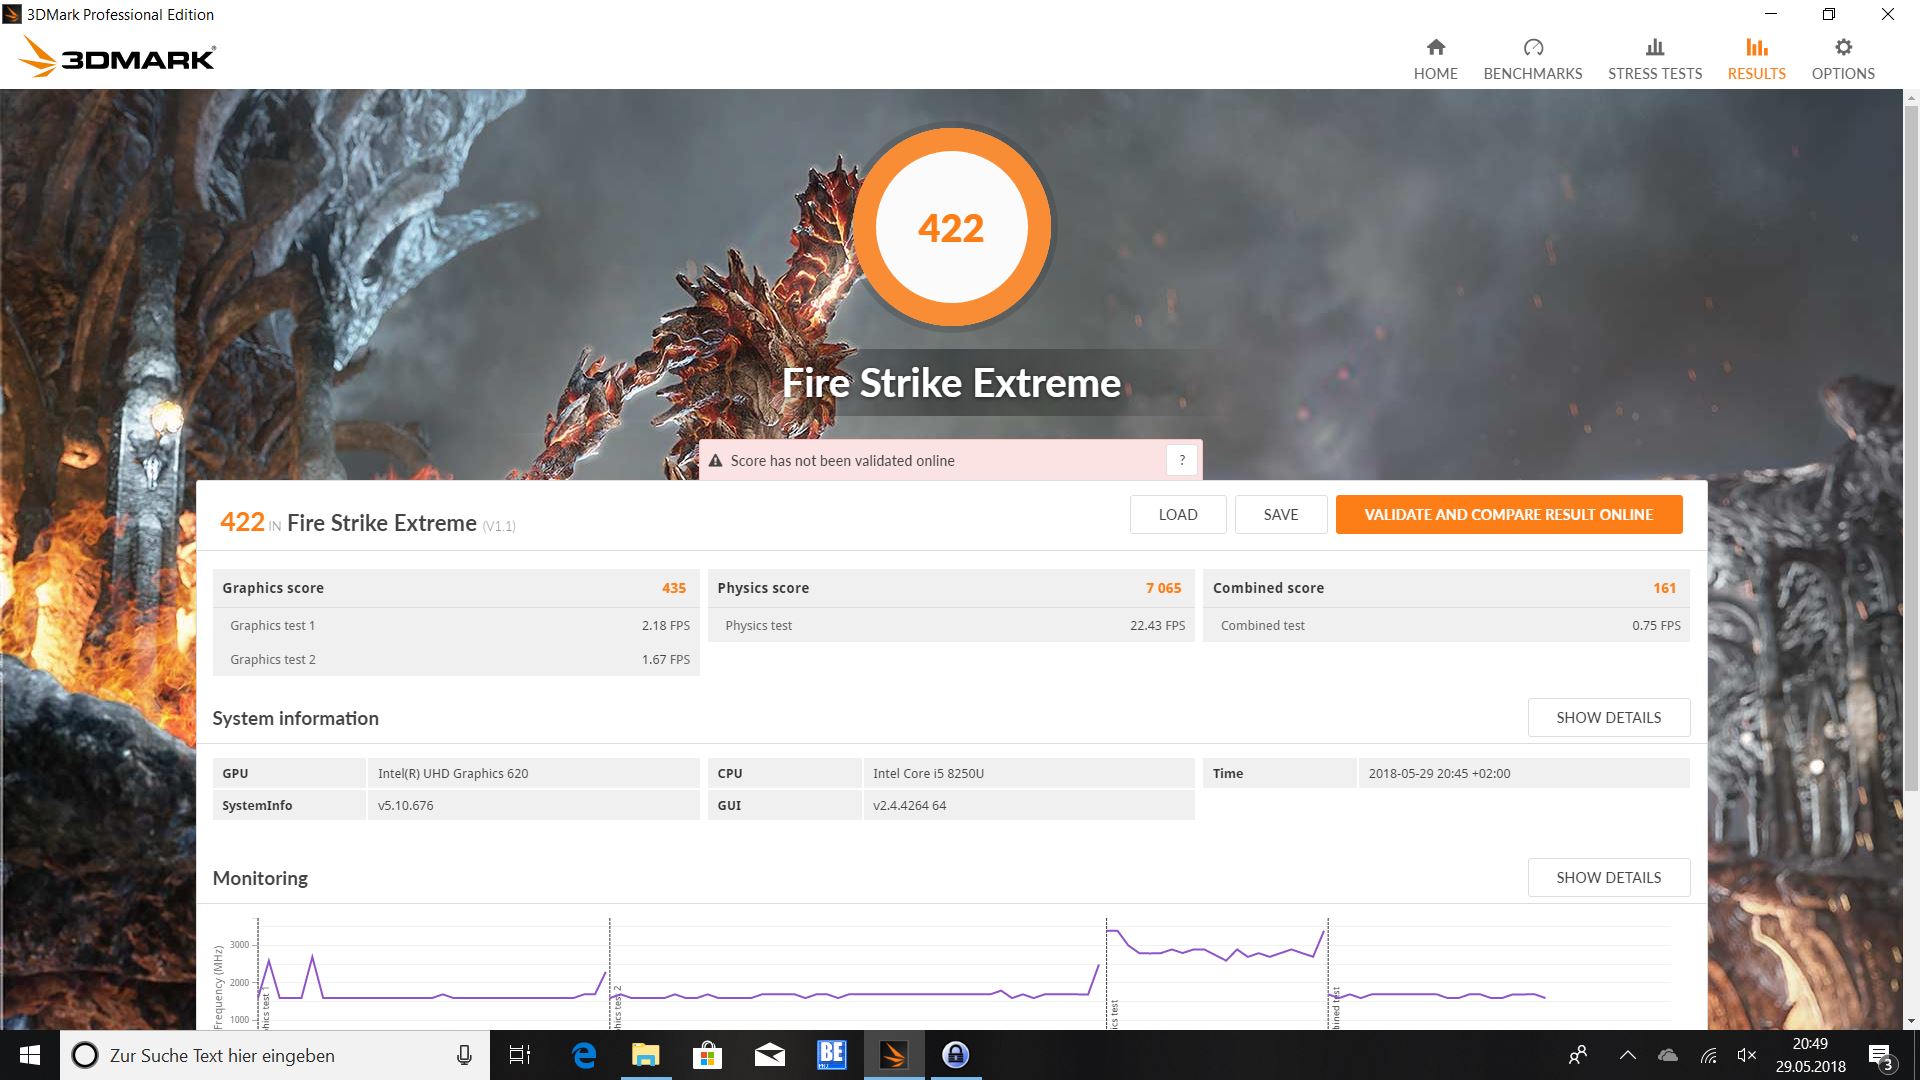
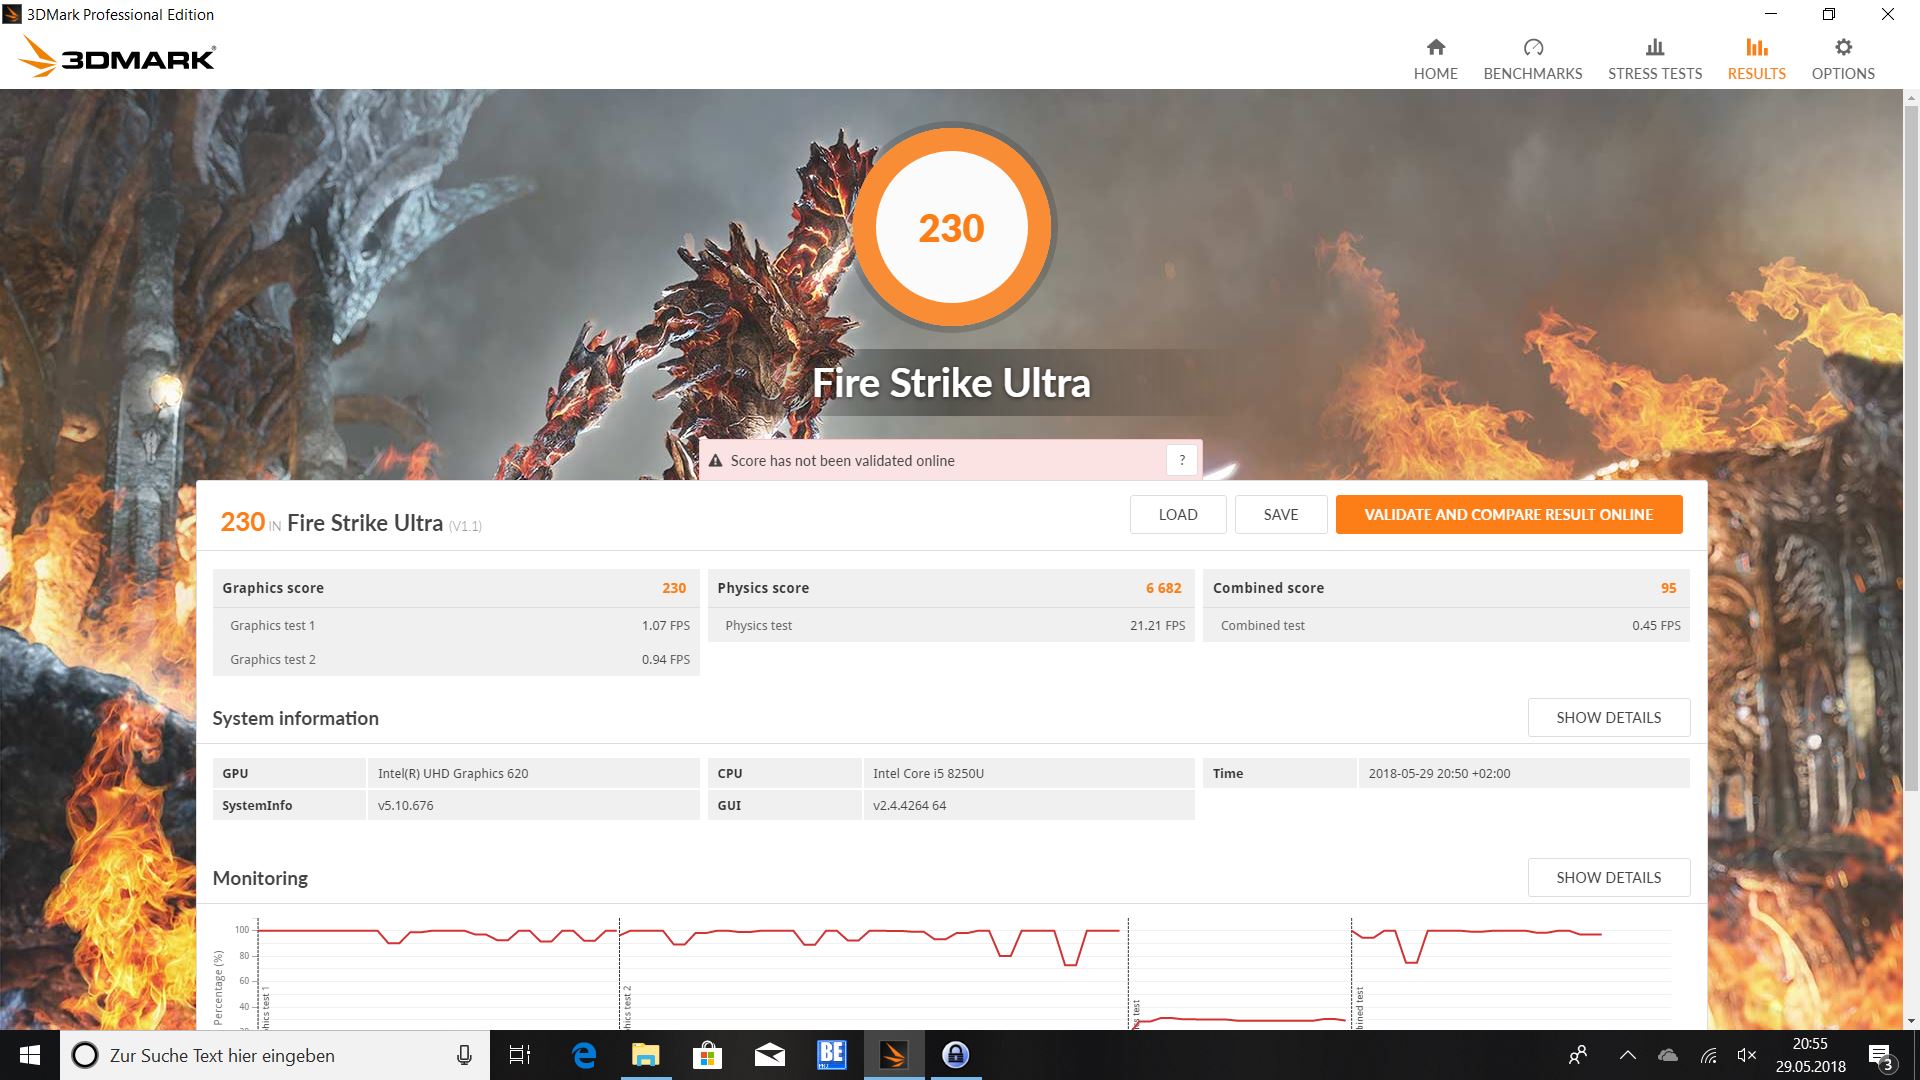
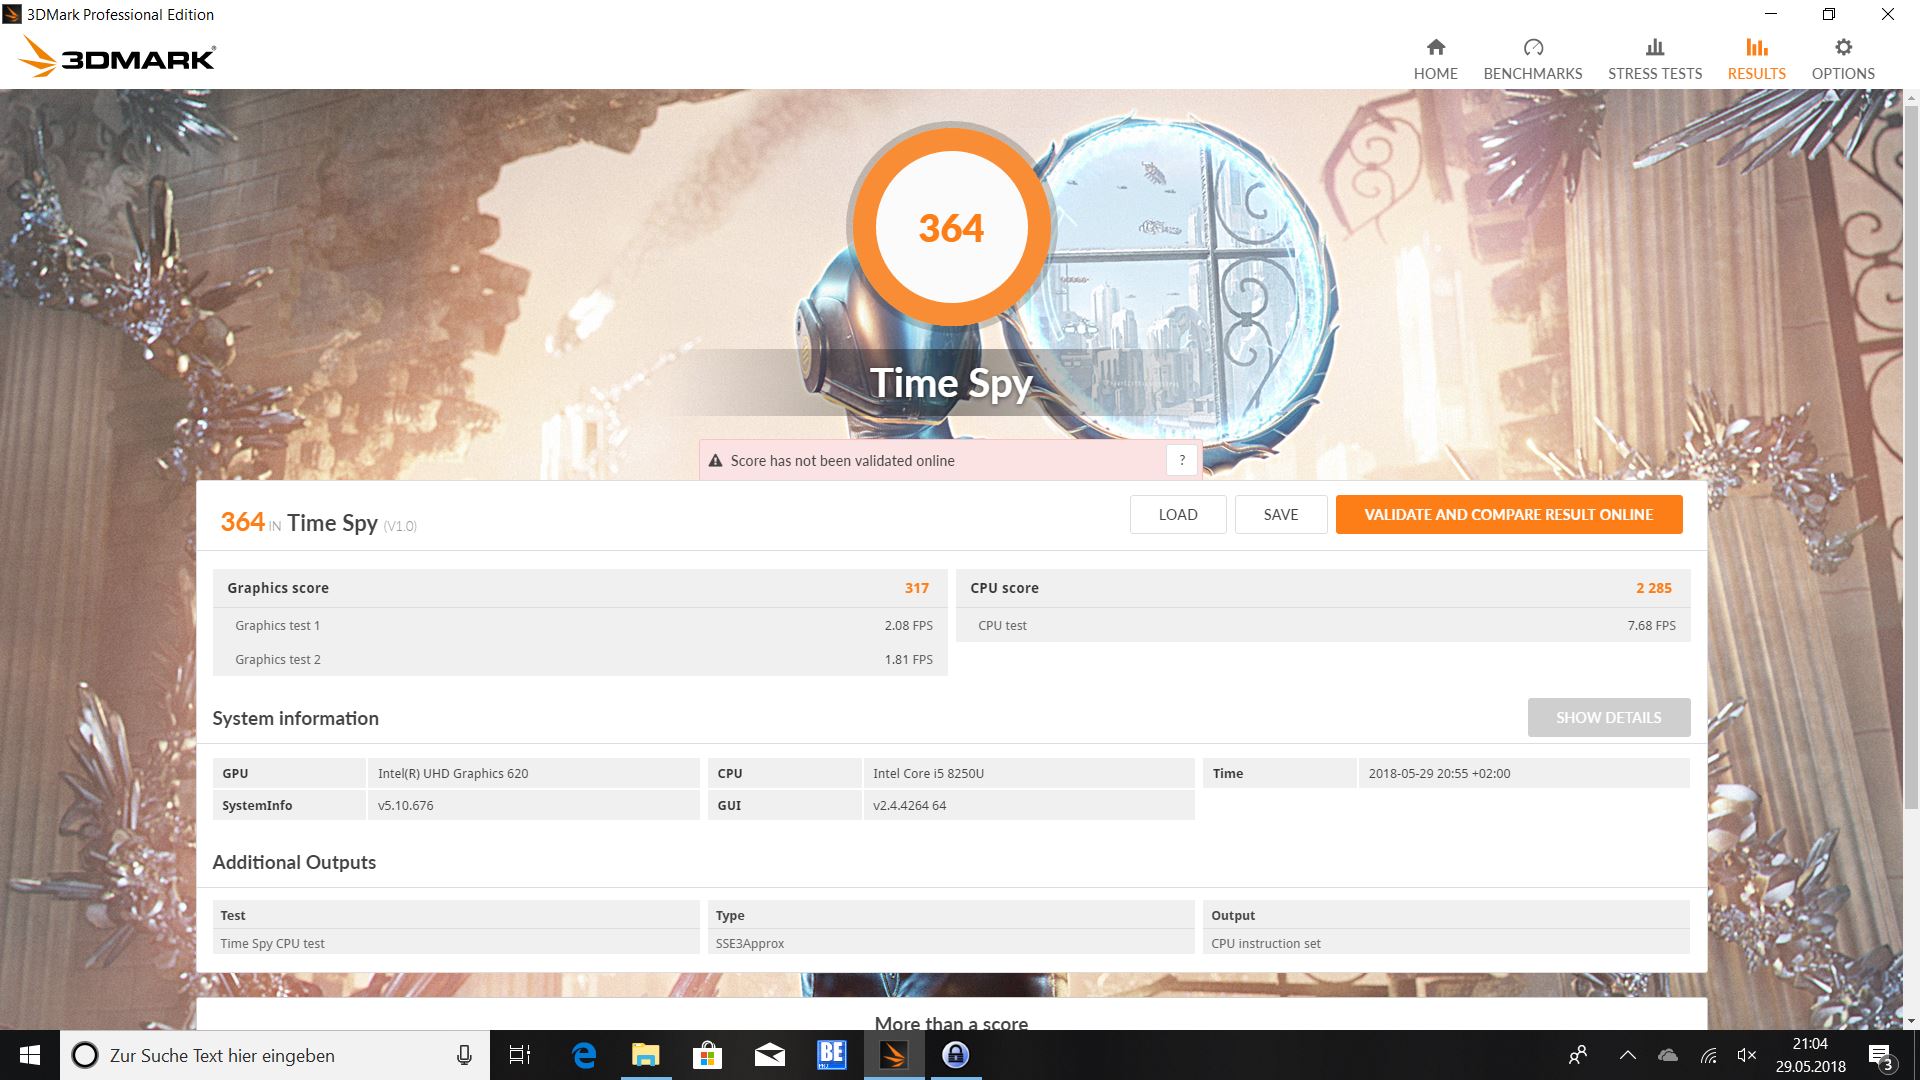
Thanks to its integrated hardware decoder for high-resolution videos, Intel’s UHD Graphics 620 allows for smooth video playback without causing any noticeable strain on the CPU. In 3DMark, the Inspiron 15 5579 scored somewhere in the thick of it. The highest scores were achieved by HP’s Envy x360 thanks to its integrated AMD Radeon RX Vega 8 GPU. In our synthetic benchmarks, it performed nearly twice as fast as Intel’s integrated UHD Graphics. A second memory module would have improved our review unit’s GPU performance somewhat, although we are talking single-digit percentages here. The HP Envy x360 is thus out of reach.
Additional benchmarks for Intel’s UHD Graphics 620 can be found here.


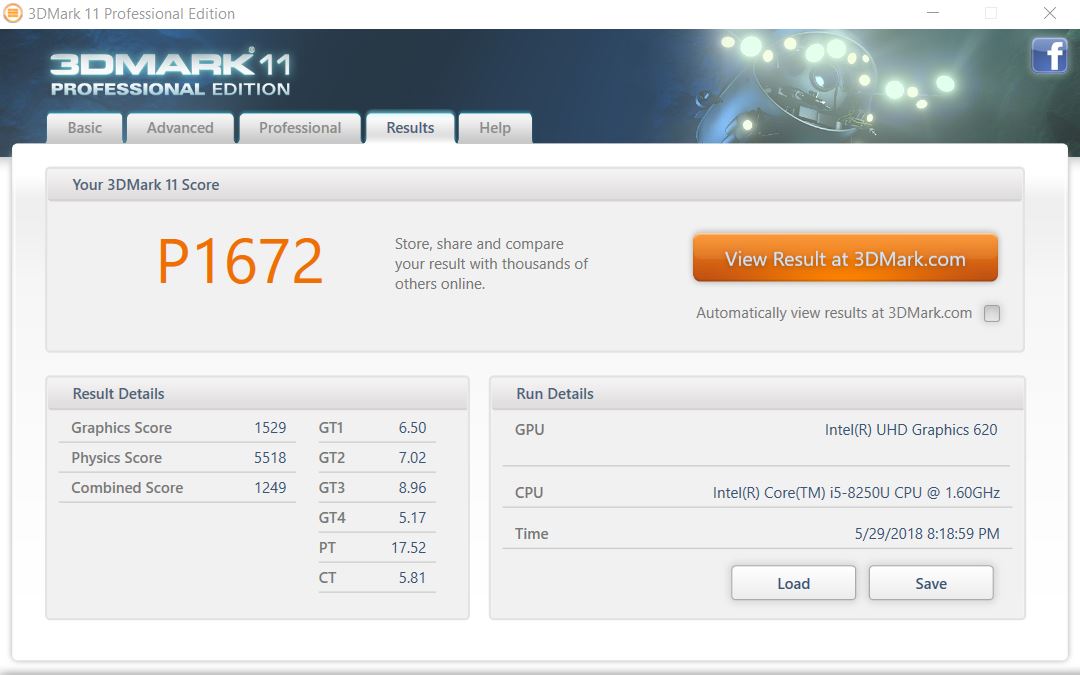
| 3DMark 11 Performance | 1672 points | |
| 3DMark Ice Storm Standard Score | 51513 points | |
| 3DMark Cloud Gate Standard Score | 7040 points | |
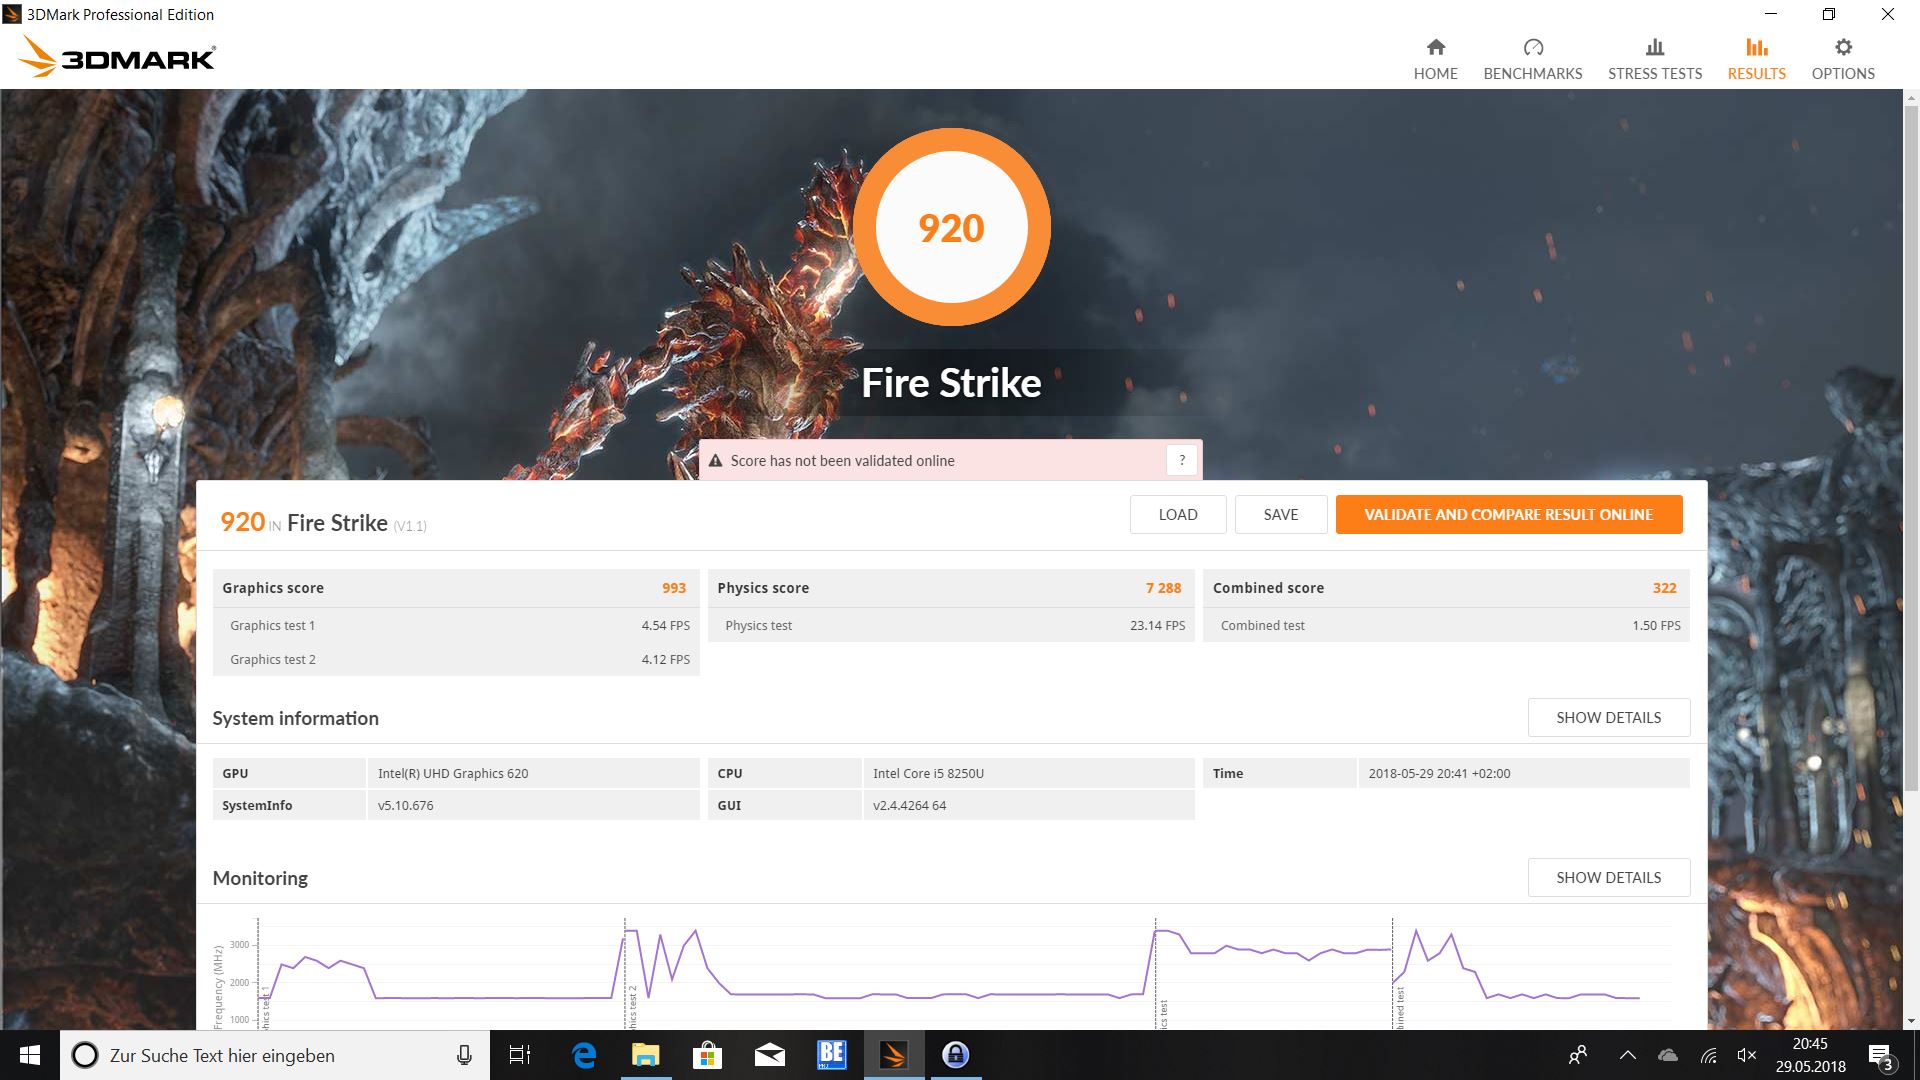
| 3DMark Fire Strike Score | 920 points | |
| 3DMark Fire Strike Extreme Score | 422 points | |
| 3DMark Time Spy Score | 364 points | |
Help | ||
Gaming Performance
Intel's UHD Graphics 620 is known for its moderate 3D performance. As such, it is not made for demanding games and is only capable of running a few games smoothly on minimal settings.
| low | med. | high | ultra | |
|---|---|---|---|---|
| BioShock Infinite (2013) | 48.1 | 27.1 | 22.4 | 7.4 |
| Battlefield 4 (2013) | 42.1 | 29.6 | 19.9 | 5.7 |
| The Witcher 3 (2015) | 15.2 | 9.9 | 5.5 | |
| Rise of the Tomb Raider (2016) | 18.6 | 11.4 | 6.5 | |
| Rocket League (2017) | 20.7 | 13.1 | ||
| FIFA 18 (2017) | 58.3 | 31.8 | 27.4 | 24.7 |
Emissions
Noise Emissions
After a cold start and when either idle or under moderate load, the 5579 remained completely silent. The fan spun up under load; however, at just 31.5 dB(A) it remained fairly unobtrusive. Thus, the Inspiron 15 5579 was the quietest notebook in our test group, with the Acer Spin 3 representing the antipole with its maximum sound pressure level of 44 dB(A).
Noise level
| Idle |
| 30.4 / 30.4 / 31.2 dB(A) |
| Load |
| 31.5 / 31.5 dB(A) |
 | ||
30 dB silent 40 dB(A) audible 50 dB(A) loud |
||
min: | ||
| Dell Inspiron 15 5579-9672 UHD Graphics 620, i5-8250U, SK hynix SC311 SATA | Dell Inspiron 15 5578-1777 2-in-1 HD Graphics 620, i5-7200U, SanDisk X400 256GB, SATA (SD8SB8U-256G) | HP Envy x360 15-bq102ng Vega 8, R5 2500U, Samsung PM961 MZVLW256HEHP | Asus VivoBook Flip 15 TP510UA-E8073T UHD Graphics 620, i5-8250U, SanDisk SD8SN8U128G1002 | Acer Spin 3 SP314-51-548L UHD Graphics 620, i5-8250U, Micron 1100 MTFDDAV256TBN | Lenovo ThinkPad L380 Yoga-20M7001BGE UHD Graphics 620, i5-8250U, Samsung PM961 MZVLW256HEHP | |
|---|---|---|---|---|---|---|
| Noise | -2% | -7% | -3% | -9% | -1% | |
| off / environment * (dB) | 30.4 | 30.6 -1% | 30.13 1% | 30.2 1% | 30 1% | 30.4 -0% |
| Idle Minimum * (dB) | 30.4 | 30.4 -0% | 30.13 1% | 30.9 -2% | 30 1% | 30.4 -0% |
| Idle Average * (dB) | 30.4 | 30.4 -0% | 30.13 1% | 30.9 -2% | 30 1% | 30.4 -0% |
| Idle Maximum * (dB) | 31.2 | 30.4 3% | 30.13 3% | 30.9 1% | 30 4% | 30.8 1% |
| Load Average * (dB) | 31.5 | 32.3 -3% | 38.8 -23% | 34.2 -9% | 38.5 -22% | 32.1 -2% |
| Load Maximum * (dB) | 31.5 | 35.2 -12% | 38.8 -23% | 34.2 -9% | 44 -40% | 32.9 -4% |
* ... smaller is better
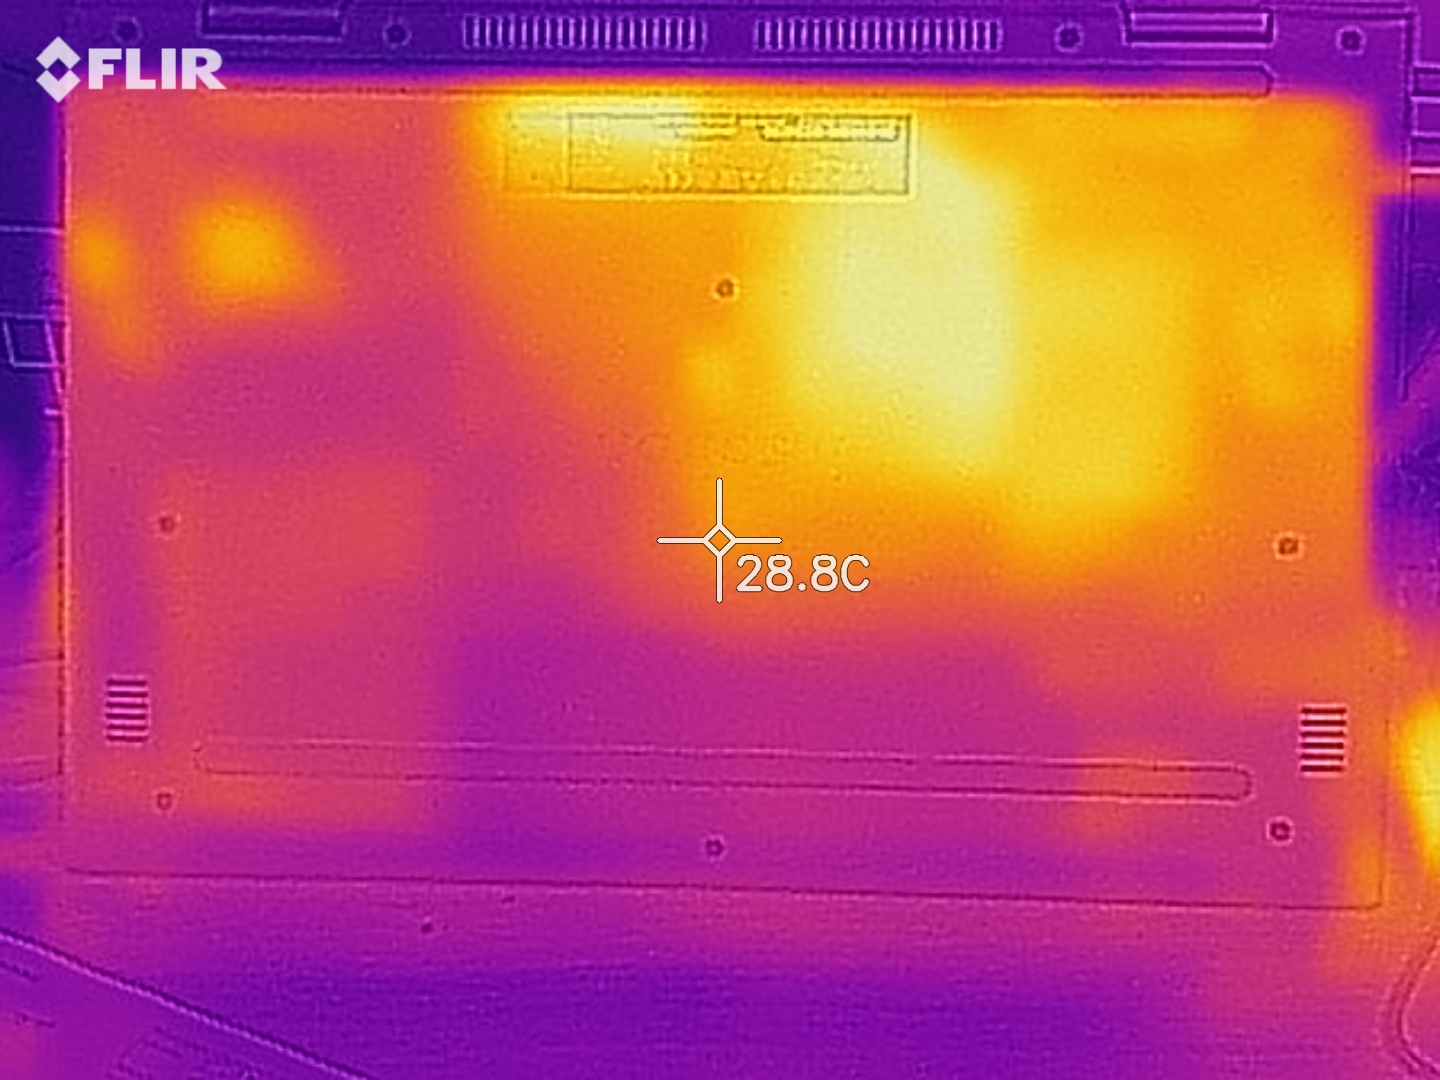
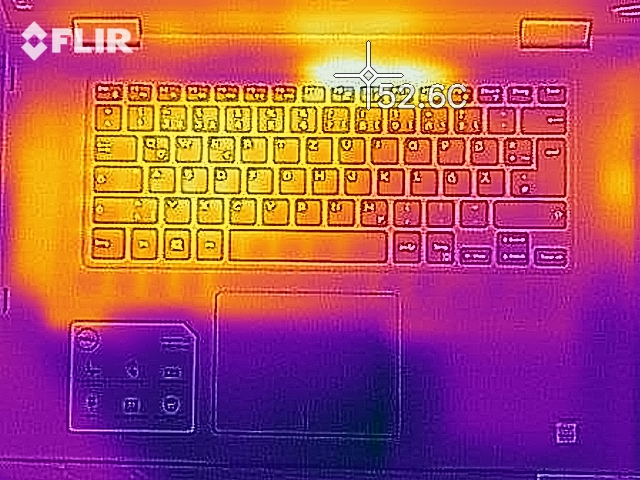
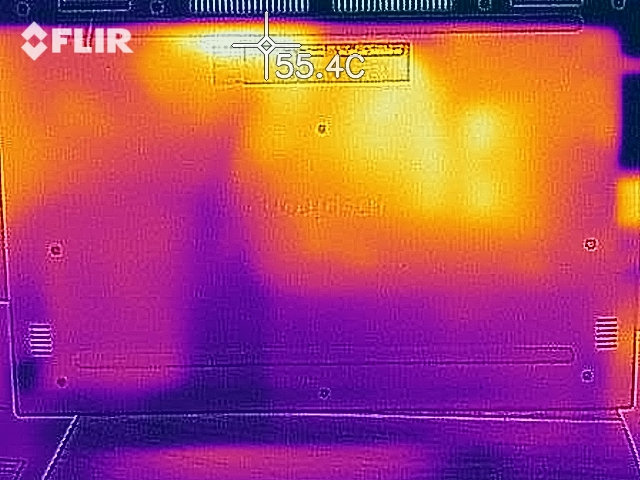
Temperature

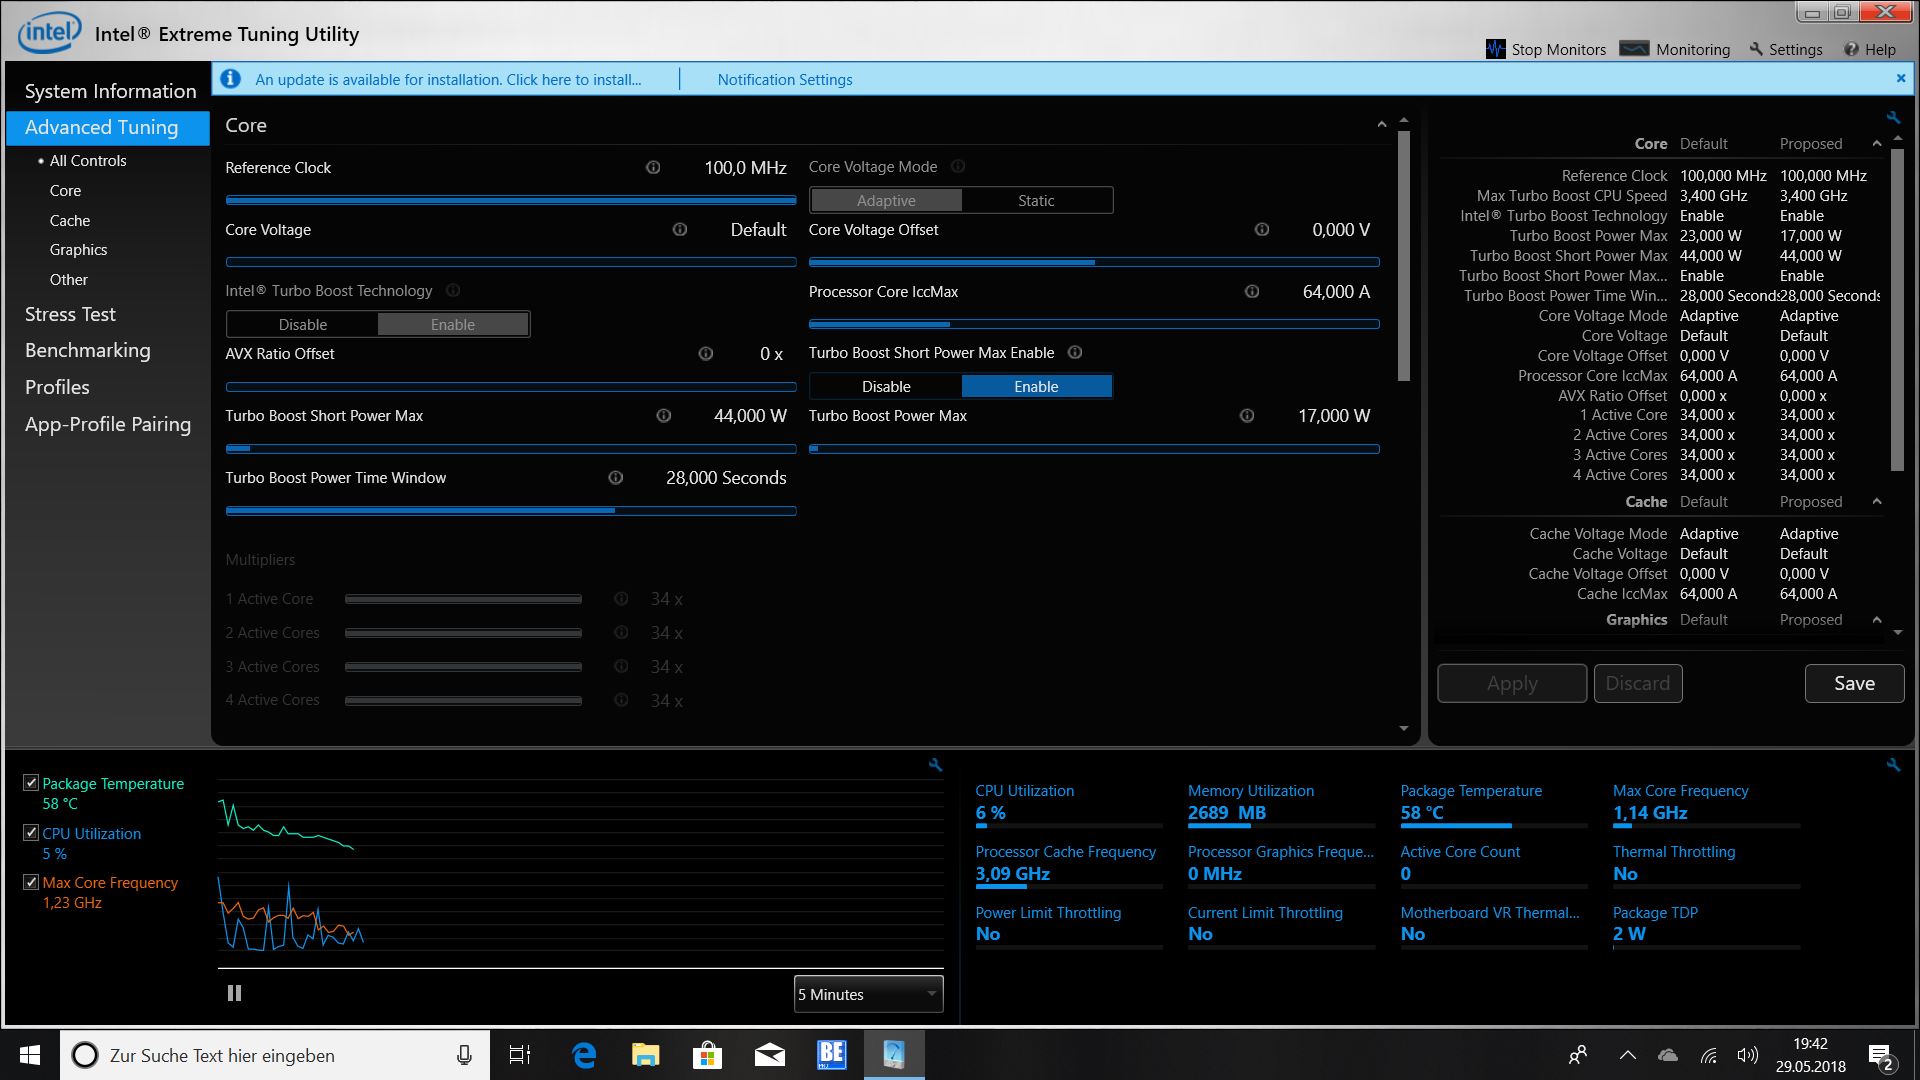
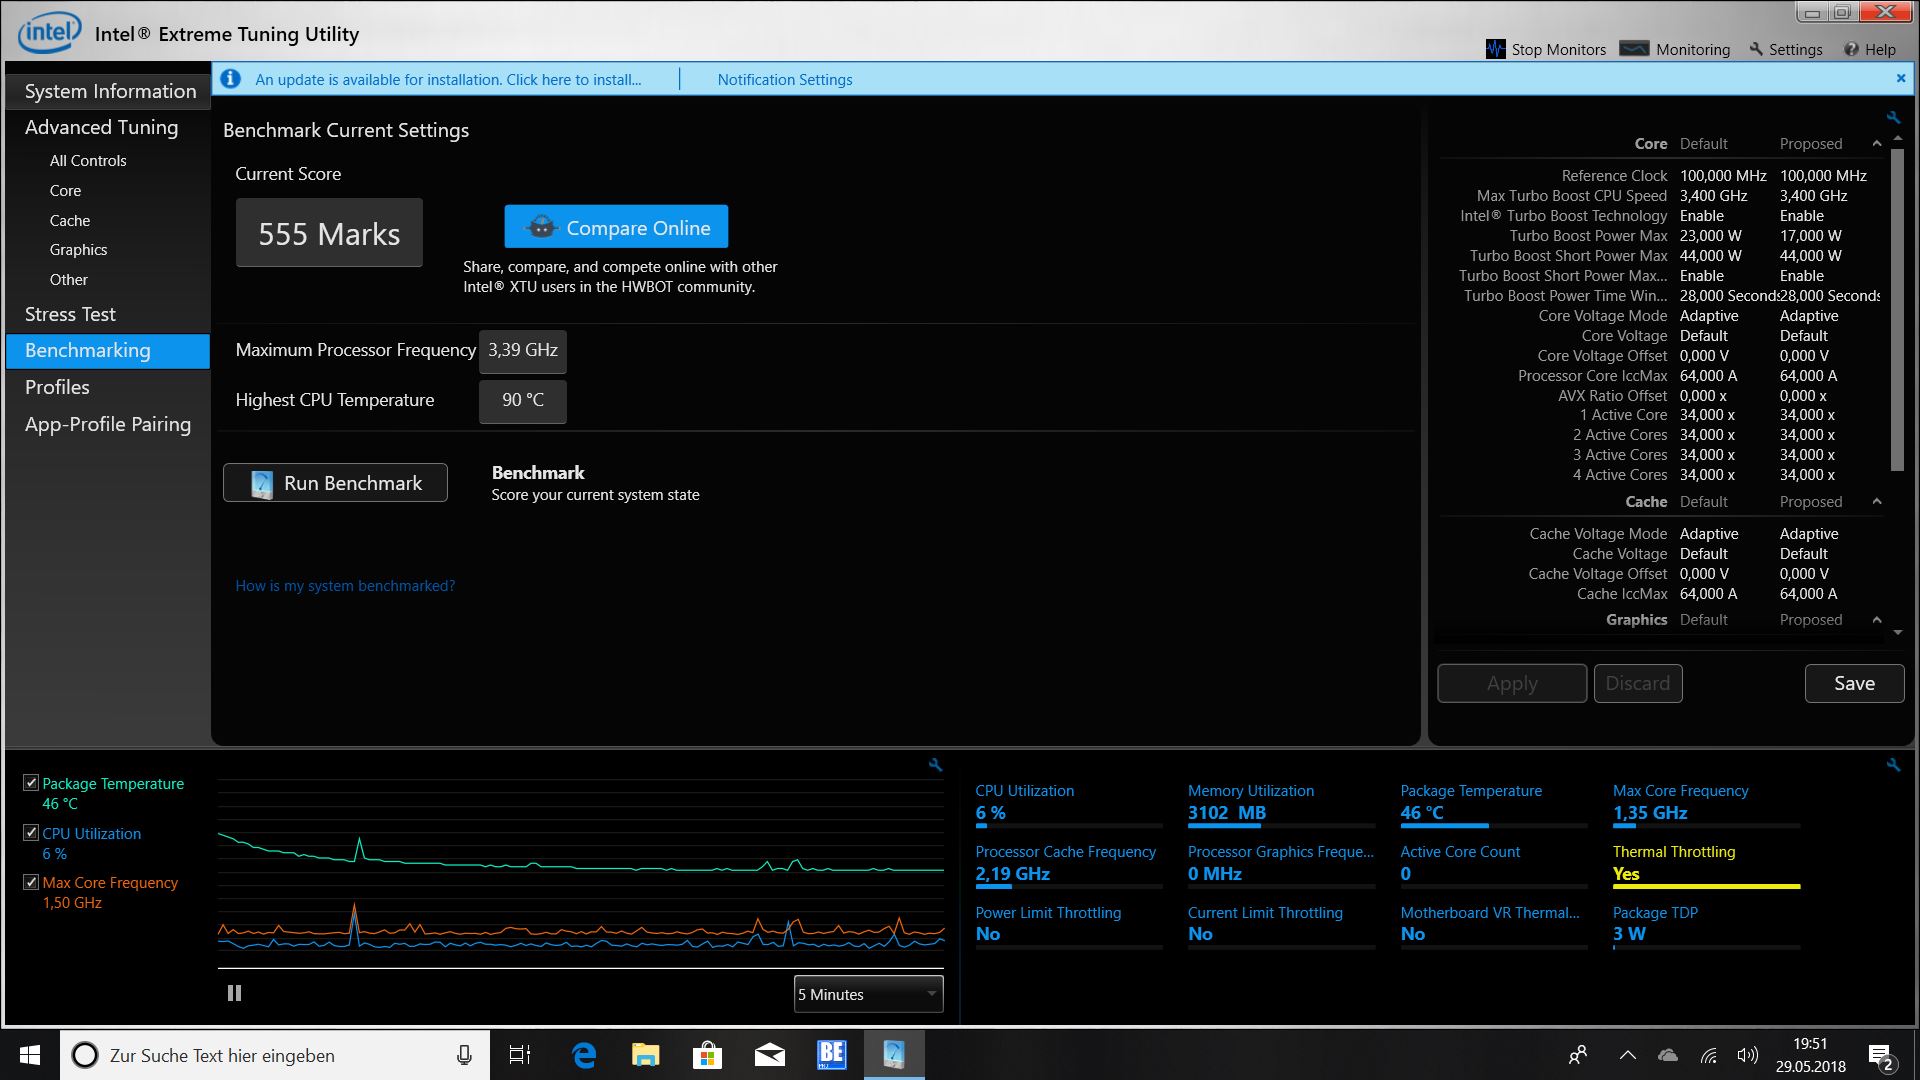
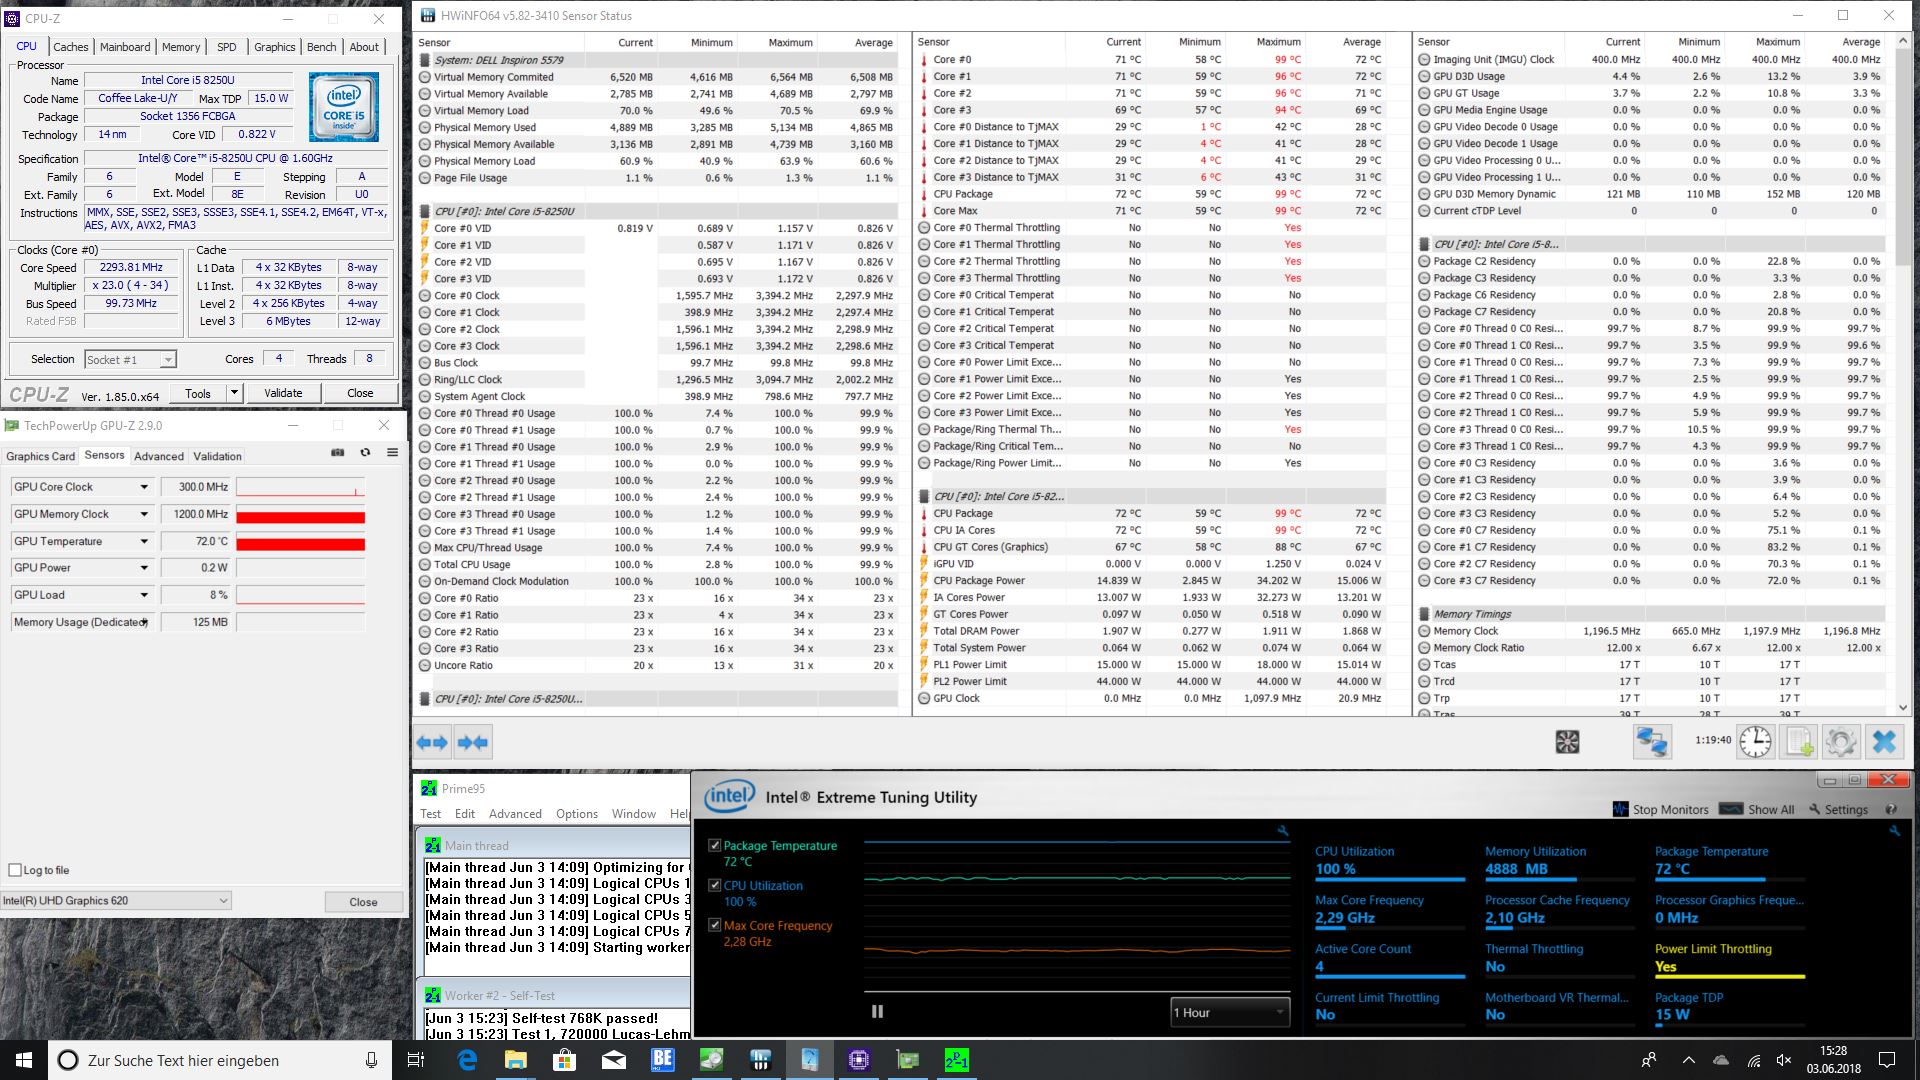
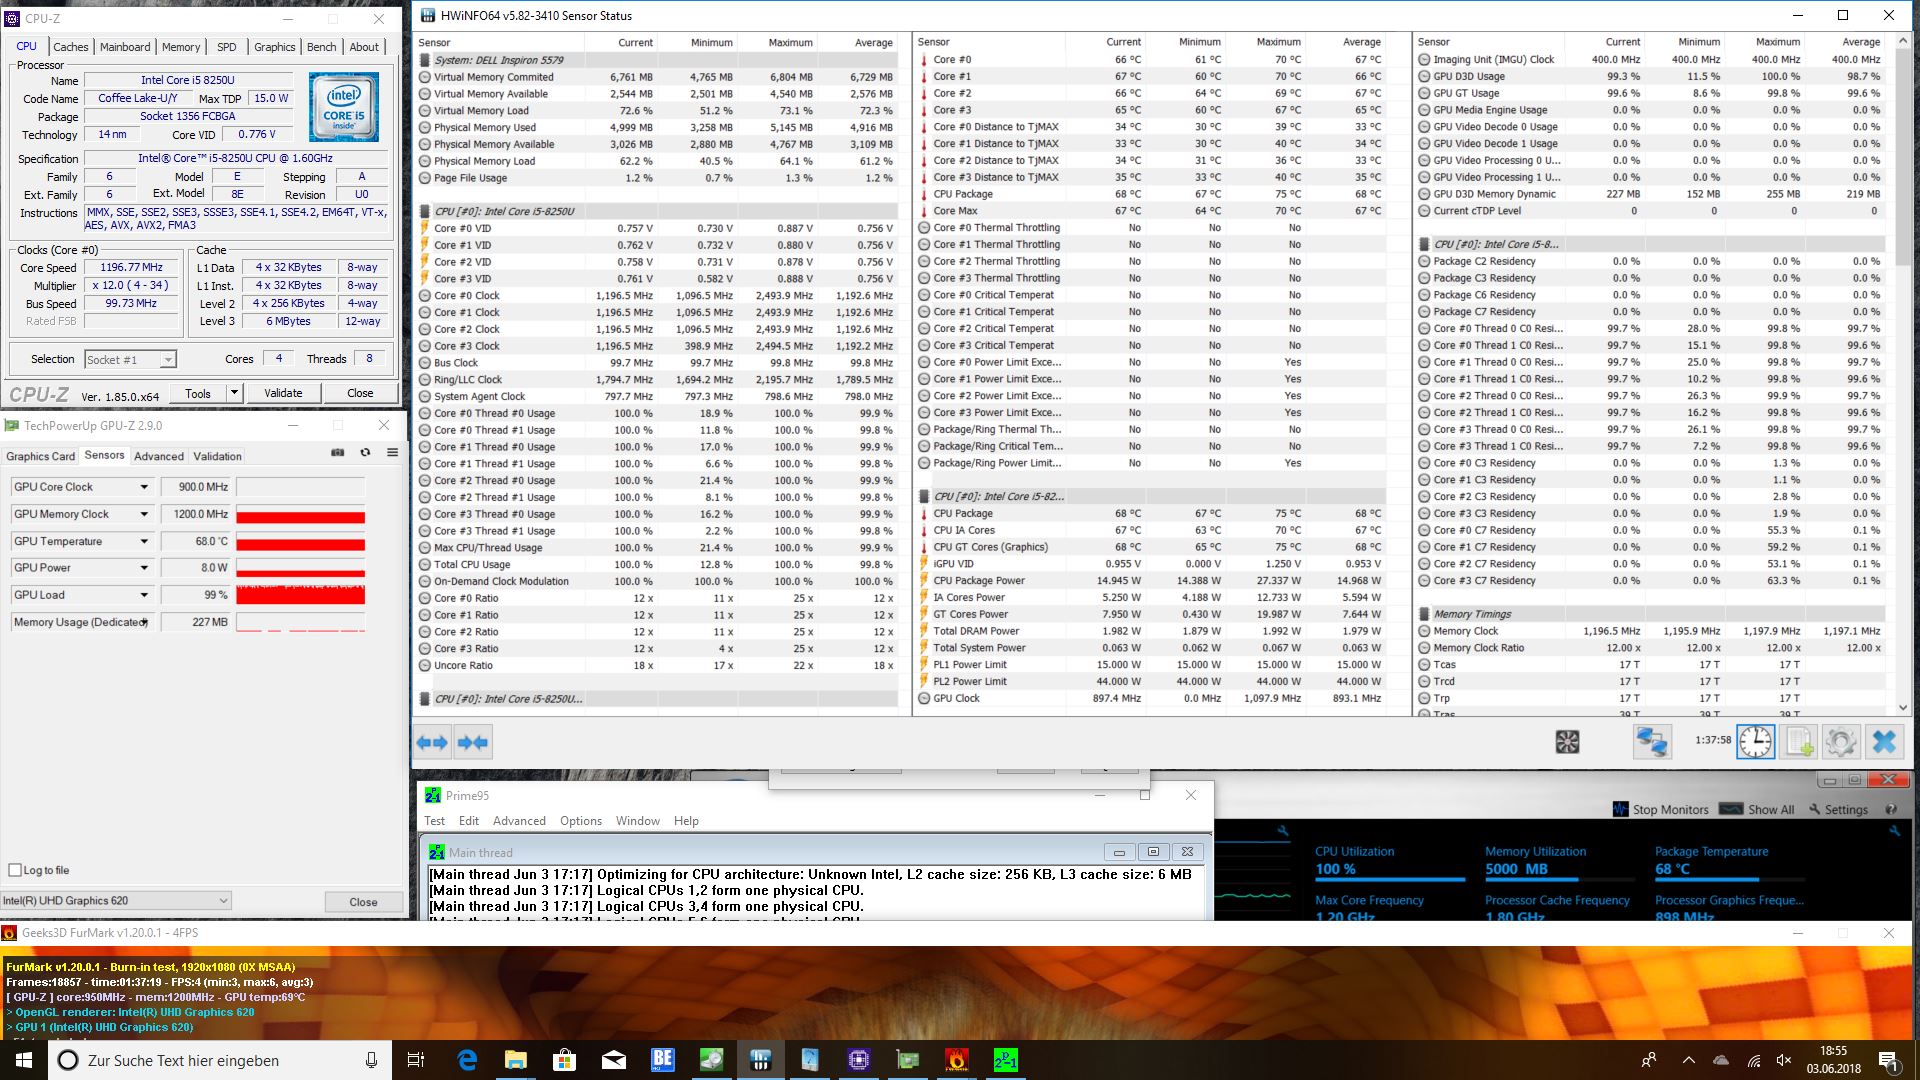
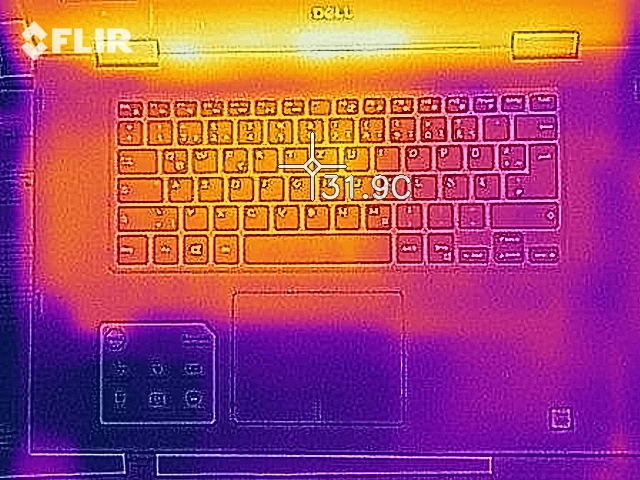
We found a total of three surface hotspots of slightly over 41 °C. By and large, the 5579 remained cooler than its predecessor (43.3 °C). CPU temperature quickly shot up to critical levels of 99 °C max while running our Prime 95 stress test. In other words: Thermal throttling was unavoidable. When stressing both the CPU and GPU the former remained cooler due to the fact that it had to share its 15 W TDP with the GPU. Consequently, it only reached 70 °C at clock speeds of just 1.2 GHz. There was no long-term effect on 3D performance whatsoever - running 3DMark immediately after our stress test yielded the exact same result as running 3DMark immediately following a cold boot.

(±) The maximum temperature on the upper side is 41.6 °C / 107 F, compared to the average of 35.4 °C / 96 F, ranging from 19.6 to 60 °C for the class Convertible.
(±) The bottom heats up to a maximum of 41.9 °C / 107 F, compared to the average of 36.9 °C / 98 F
(+) In idle usage, the average temperature for the upper side is 24.5 °C / 76 F, compared to the device average of 30.3 °C / 87 F.
(+) The palmrests and touchpad are cooler than skin temperature with a maximum of 25 °C / 77 F and are therefore cool to the touch.
(+) The average temperature of the palmrest area of similar devices was 28 °C / 82.4 F (+3 °C / 5.4 F).
| Dell Inspiron 15 5579-9672 UHD Graphics 620, i5-8250U, SK hynix SC311 SATA | Dell Inspiron 15 5578-1777 2-in-1 HD Graphics 620, i5-7200U, SanDisk X400 256GB, SATA (SD8SB8U-256G) | HP Envy x360 15-bq102ng Vega 8, R5 2500U, Samsung PM961 MZVLW256HEHP | Asus VivoBook Flip 15 TP510UA-E8073T UHD Graphics 620, i5-8250U, SanDisk SD8SN8U128G1002 | Acer Spin 3 SP314-51-548L UHD Graphics 620, i5-8250U, Micron 1100 MTFDDAV256TBN | Lenovo ThinkPad L380 Yoga-20M7001BGE UHD Graphics 620, i5-8250U, Samsung PM961 MZVLW256HEHP | |
|---|---|---|---|---|---|---|
| Heat | 0% | -11% | 7% | -3% | -5% | |
| Maximum Upper Side * (°C) | 41.6 | 37.3 10% | 38 9% | 36 13% | 44.1 -6% | 45 -8% |
| Maximum Bottom * (°C) | 41.9 | 43.3 -3% | 37.1 11% | 37 12% | 41.6 1% | 44.5 -6% |
| Idle Upper Side * (°C) | 26.1 | 26.8 -3% | 38.6 -48% | 25.6 2% | 25.6 2% | |
| Idle Bottom * (°C) | 25.7 | 26.6 -4% | 29.2 -14% | 25.7 -0% | 27.7 -8% |
* ... smaller is better
Speaker
The Inspiron 15 5579 is equipped with two speakers that can be adjusted with Wave’s MaxxAudio Pro software. However, even software adjustments were unable to whitewash the fact that the speakers were missing spatial volume resulting in overemphasized mids and highs. There was no bass worth mentioning, and the speakers were adequate for the occasional YouTube video or TV series episode.
External speakers can be connected via a combined 3.5-mm audio jack.
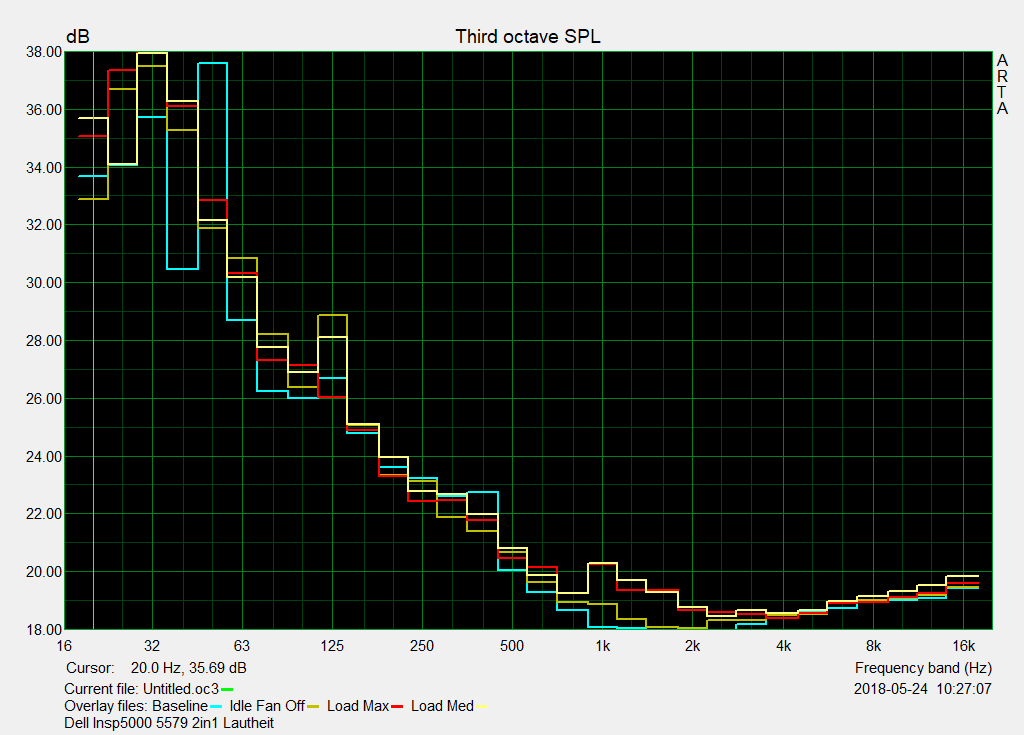
Dell Inspiron 15 5579-9672 audio analysis
(±) | speaker loudness is average but good (72.5 dB)
Bass 100 - 315 Hz
(-) | nearly no bass - on average 20.7% lower than median
(±) | linearity of bass is average (11.9% delta to prev. frequency)
Mids 400 - 2000 Hz
(±) | higher mids - on average 7.8% higher than median
(±) | linearity of mids is average (11.2% delta to prev. frequency)
Highs 2 - 16 kHz
(±) | higher highs - on average 5.1% higher than median
(+) | highs are linear (5.7% delta to prev. frequency)
Overall 100 - 16.000 Hz
(±) | linearity of overall sound is average (25.6% difference to median)
Compared to same class
» 78% of all tested devices in this class were better, 5% similar, 17% worse
» The best had a delta of 6%, average was 20%, worst was 57%
Compared to all devices tested
» 78% of all tested devices were better, 4% similar, 17% worse
» The best had a delta of 4%, average was 24%, worst was 134%
Lenovo ThinkPad L380 Yoga-20M7001BGE audio analysis
(-) | not very loud speakers (66.7 dB)
Bass 100 - 315 Hz
(-) | nearly no bass - on average 17.5% lower than median
(±) | linearity of bass is average (13.8% delta to prev. frequency)
Mids 400 - 2000 Hz
(+) | balanced mids - only 2.9% away from median
(+) | mids are linear (5.1% delta to prev. frequency)
Highs 2 - 16 kHz
(+) | balanced highs - only 2.4% away from median
(±) | linearity of highs is average (8.7% delta to prev. frequency)
Overall 100 - 16.000 Hz
(±) | linearity of overall sound is average (17.3% difference to median)
Compared to same class
» 33% of all tested devices in this class were better, 8% similar, 59% worse
» The best had a delta of 6%, average was 20%, worst was 57%
Compared to all devices tested
» 32% of all tested devices were better, 8% similar, 59% worse
» The best had a delta of 4%, average was 24%, worst was 134%
Power Management
Power Consumption
Dell has managed to improve overall power consumption, which means the 5579 is around 5% more efficient than its 5578 predecessor. Idle power consumption was measured between 3.9 and 9.3 W, and maximum power consumption was 33.2 W. Eventually, it settled at 30.2 W.
Peak load was 48 W, which was due to a higher TDP of up to 44 W for a short period of time. Accordingly, we don’t expect any problems and the 45 W charger is amply dimensioned.
| Off / Standby | |
| Idle | |
| Load |
|
Key:
min: | |
| Dell Inspiron 15 5579-9672 i5-8250U, UHD Graphics 620, SK hynix SC311 SATA, IPS, 1920x1080, 15.6" | Dell Inspiron 15 5578-1777 2-in-1 i5-7200U, HD Graphics 620, SanDisk X400 256GB, SATA (SD8SB8U-256G), IPS, 1920x1080, 15.6" | HP Envy x360 15-bq102ng R5 2500U, Vega 8, Samsung PM961 MZVLW256HEHP, IPS, 1920x1080, 15.6" | Asus VivoBook Flip 15 TP510UA-E8073T i5-8250U, UHD Graphics 620, SanDisk SD8SN8U128G1002, IPS, 1920x1080, 15.6" | Acer Spin 3 SP314-51-548L i5-8250U, UHD Graphics 620, Micron 1100 MTFDDAV256TBN, IPS, 1920x1080, 14" | Lenovo ThinkPad L380 Yoga-20M7001BGE i5-8250U, UHD Graphics 620, Samsung PM961 MZVLW256HEHP, IPS LED, 1920x1080, 13.3" | Average Intel UHD Graphics 620 | Average of class Convertible | |
|---|---|---|---|---|---|---|---|---|
| Power Consumption | -5% | -20% | -7% | 21% | 6% | -11% | -32% | |
| Idle Minimum * (Watt) | 3.9 | 4.3 -10% | 4.8 -23% | 3.9 -0% | 2.9 26% | 3.44 12% | 3.81 ? 2% | 4.29 ? -10% |
| Idle Average * (Watt) | 6.6 | 7.6 -15% | 7 -6% | 7.2 -9% | 5.2 21% | 6.9 -5% | 6.94 ? -5% | 7.08 ? -7% |
| Idle Maximum * (Watt) | 9.3 | 9.8 -5% | 9.5 -2% | 9.5 -2% | 5.4 42% | 9.2 1% | 8.75 ? 6% | 8.68 ? 7% |
| Load Average * (Watt) | 30.2 | 32.6 -8% | 40.8 -35% | 36.8 -22% | 29.4 3% | 27.6 9% | 35 ? -16% | 44 ? -46% |
| Load Maximum * (Watt) | 33.2 | 28.4 14% | 44.3 -33% | 33.1 -0% | 29.6 11% | 29 13% | 47.5 ? -43% | 67.3 ? -103% |
* ... smaller is better
Battery Life
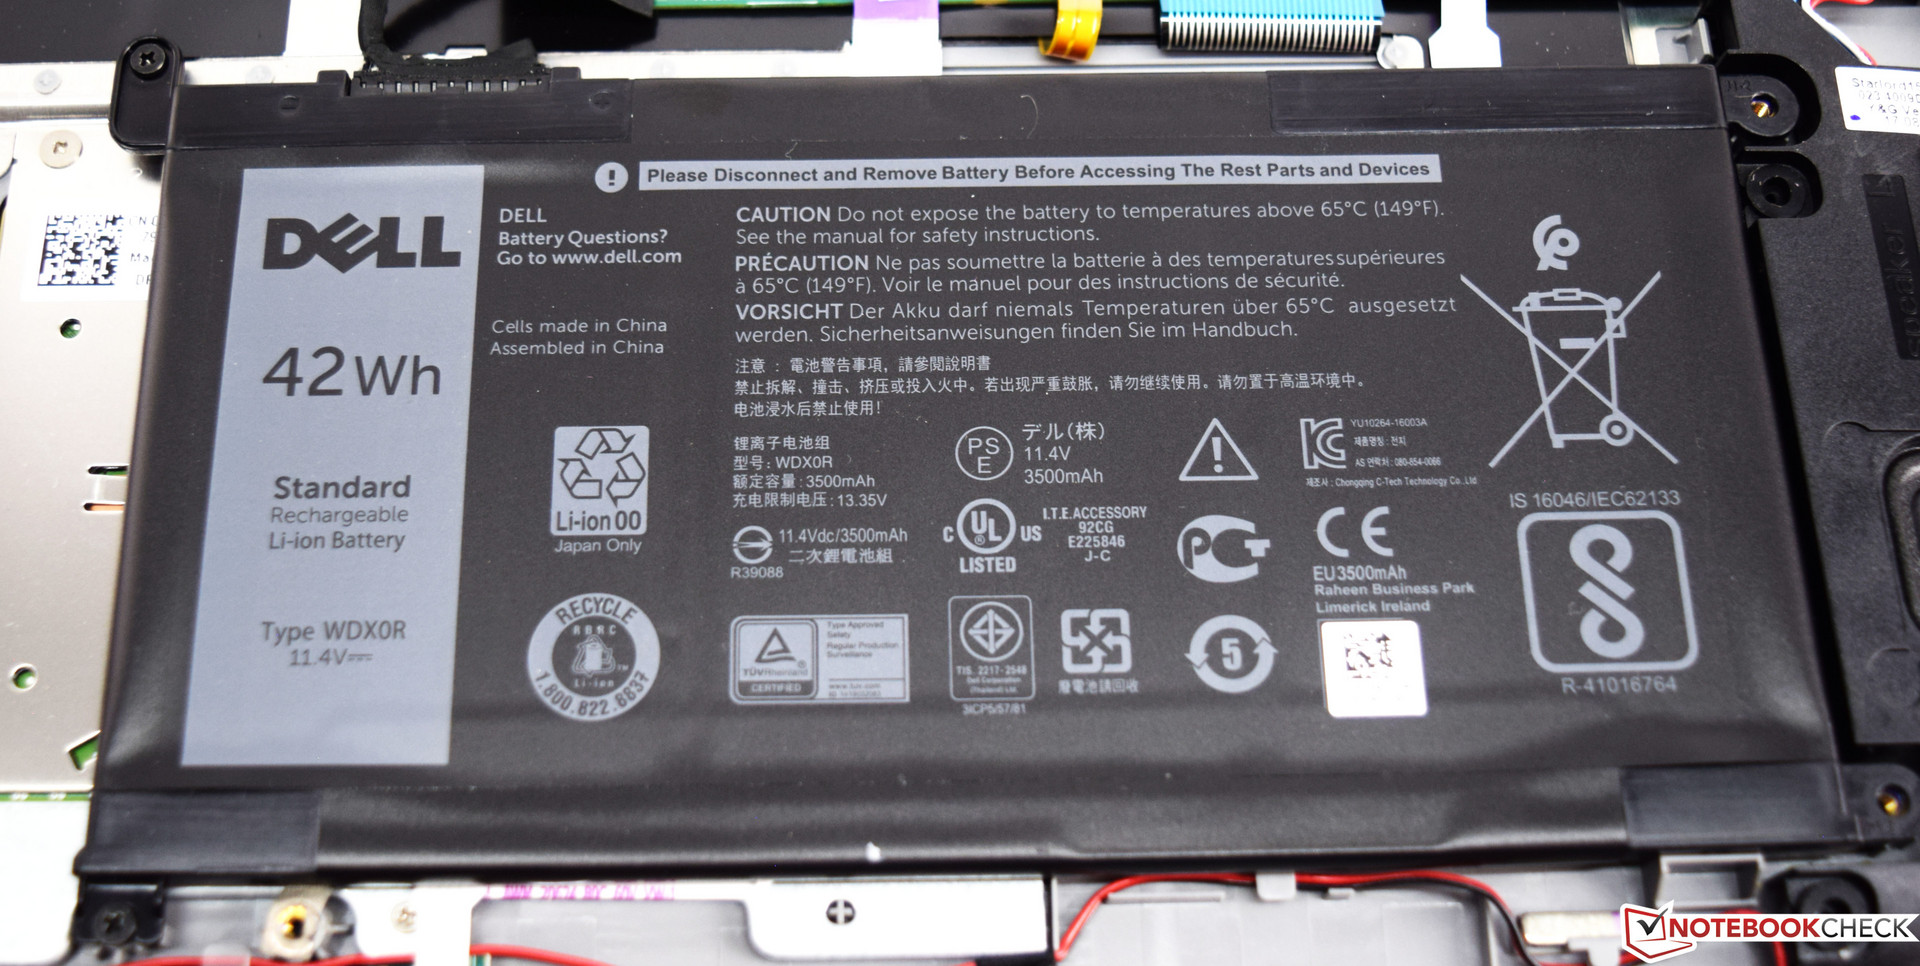
While measuring the device’s power consumption we got a first glimpse at the 5579’s potential battery life, and the notebook did not disappoint. It beat its 5578 predecessor hands down with its 42 Wh battery but had to surrender to the larger batteries in Lenovo’s and Acer’s contenders. Nevertheless, the 5579 lasted for an acceptable 7:15 hours in our real-life Wi-Fi test. This particular test is performed under normalized conditions, which means we set the display brightness to 150 nits on all candidates. In the case of the 5579, this meant reducing the brightness by four clicks.
Given that there is plenty of free space on the inside, Dell could have opted for a larger battery. Our guess is that the engineers went with the smaller battery due to its lower weight.
3D performance was not limited on battery at all, and 3DMark 11 performed just as well as on mains.

| Dell Inspiron 15 5579-9672 i5-8250U, UHD Graphics 620, 42 Wh | Dell Inspiron 15 5578-1777 2-in-1 i5-7200U, HD Graphics 620, 42 Wh | HP Envy x360 15-bq102ng R5 2500U, Vega 8, 55.8 Wh | Asus VivoBook Flip 15 TP510UA-E8073T i5-8250U, UHD Graphics 620, 42 Wh | Acer Spin 3 SP314-51-548L i5-8250U, UHD Graphics 620, 52.5 Wh | Lenovo ThinkPad L380 Yoga-20M7001BGE i5-8250U, UHD Graphics 620, 45 Wh | |
|---|---|---|---|---|---|---|
| Battery runtime | -10% | -3% | -18% | 14% | 10% | |
| Reader / Idle (h) | 11.2 | 13.9 24% | ||||
| H.264 (h) | 6.7 | 8.5 27% | ||||
| WiFi v1.3 (h) | 7.3 | 6.6 -10% | 7.1 -3% | 6 -18% | 8.3 14% | 7 -4% |
| Load (h) | 1.8 | 1.7 -6% |
Verdict
Pros
Cons
The Dell Inspiron 15 5579 is a 15.6-inch convertible with just minor upgrades from the previous model. It even looks identical to its predecessor’s predecessor, the Dell Inspiron 15 5568. However, it is more powerful than ever thanks to Intel’s Core i5-8250U, and Wi-Fi performance has been improved dramatically as well and was much faster than on last year’s Dell Inspiron 15 5578. Equipped with 8 GB of DDR4 RAM and a 256 GB large SSD, the 5579 currently sells for $749.
The price is right for the 15.6-inch convertible, and the decent input devices will please prolific writers. However, the notebook’s downsides are its dark display and the lack of Active Pen support.
Unfortunately, many modern features like USB-C or DisplayPort are still suspiciously missing. An SD card reader is present, albeit connected via USB 2.0. We like the quiet mode of operation and the notebook’s overall acceptable battery life. The integrated infrared camera is a nice bonus and speeds up logging into Windows significantly.
The display, on the other hand, is a mixed bag. On the one hand it offers a very high contrast ratio and does not resort to PWM for brightness control. On the other hand, its color-space coverage and brightness are much too low.
Dell Inspiron 15 5579-9672
- 06/09/2018 v6 (old)
Sebastian Bade
Price comparison

