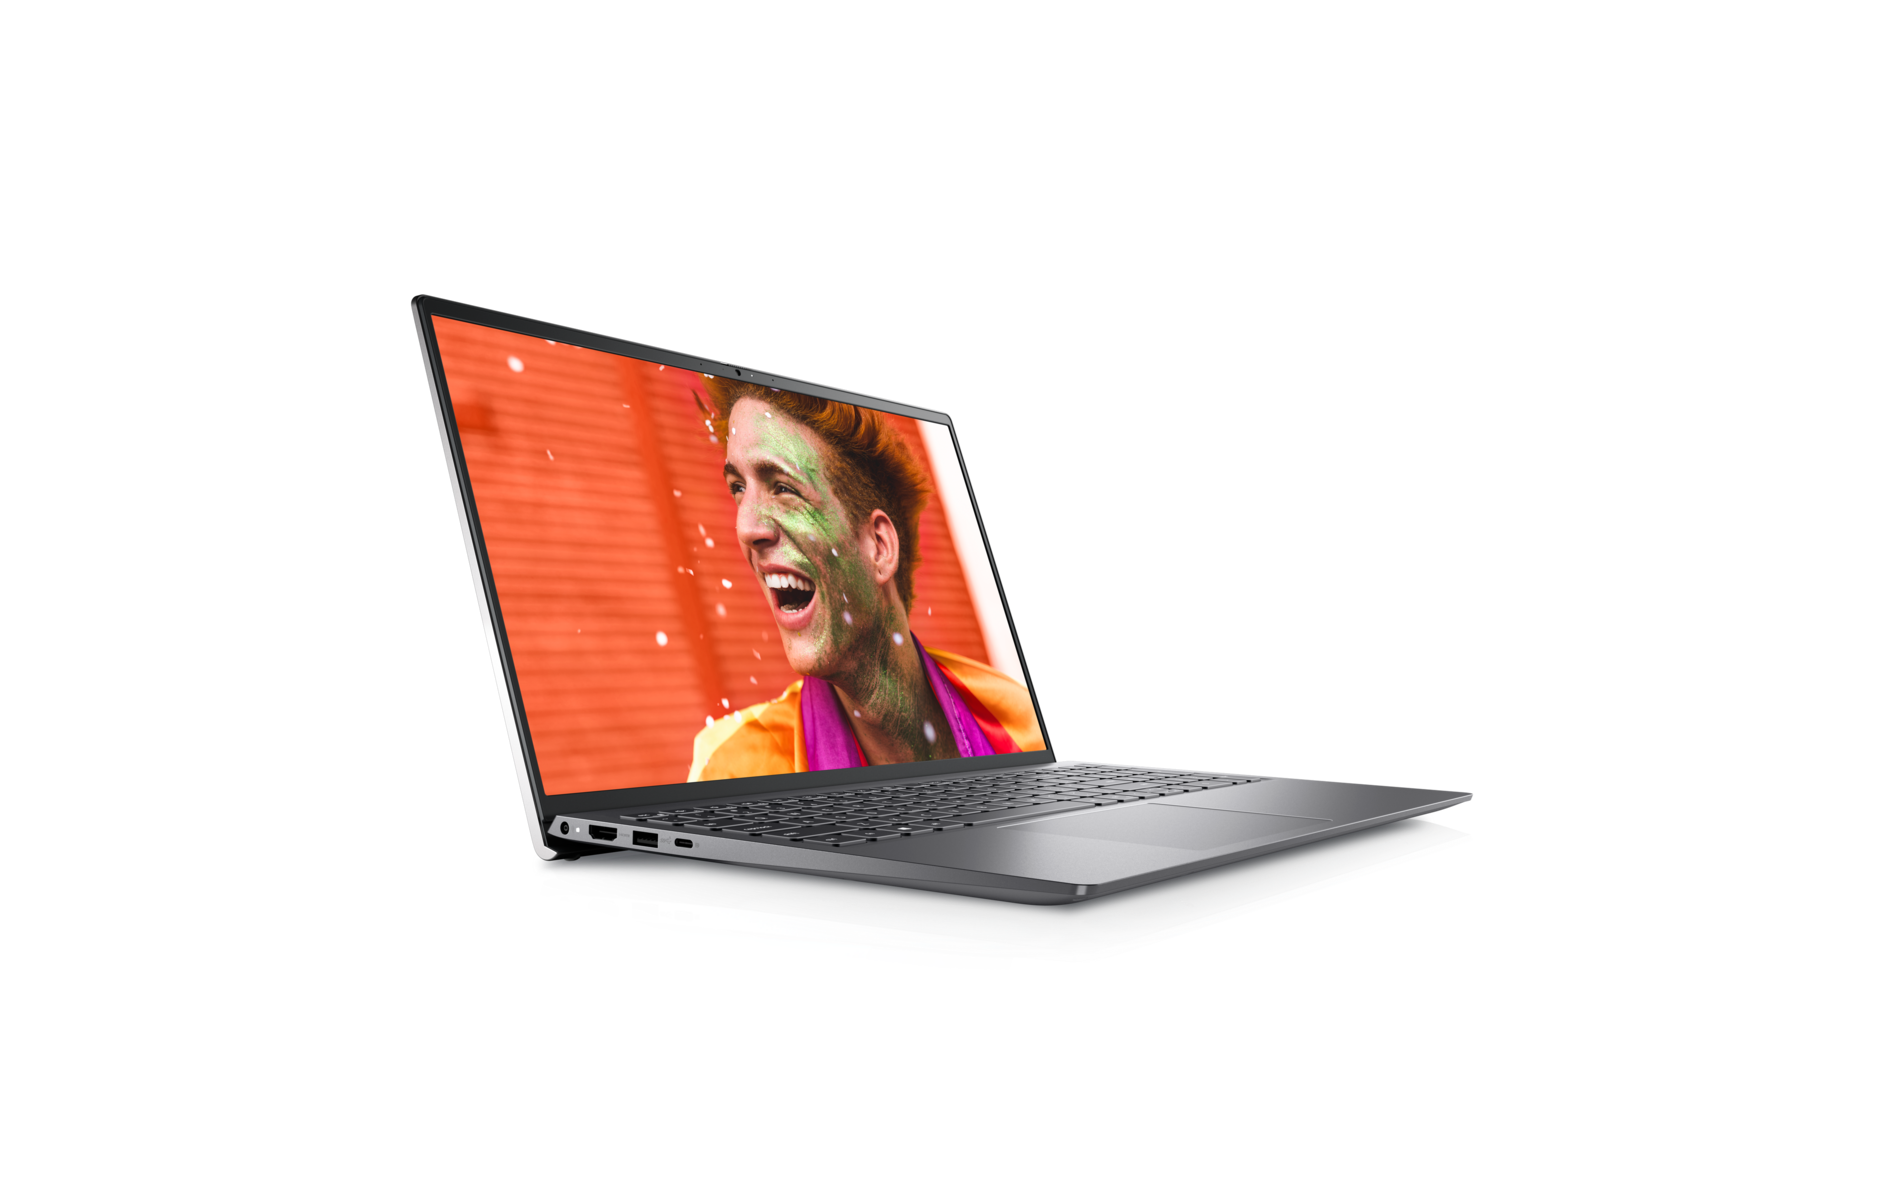
Dell Inspiron 15 5515 laptop review: Enduring office notebook with untapped potential
The Dell Inspiron 15 5515 in the H8P8F configuration is an affordable office notebook grounded in AMD's Ryzen 7 5700U. The manufacturer combines the octa-core CPU with 8 GB of RAM, does without a dedicated graphics solution, and installs everything in a plainly designed, 15.6-inch clamshell case.
Our review reveals how well the Dell Inspiron 15 5515-H8P8F performs under testing and in practice. The laptop has to compete against two rivals with the same CPU: the Acer Aspire 5 A515 and the Asus VivoBook 15 with an OLED panel. Several other rivals also join the fray, most of which have slightly weaker processors and should not be able to keep up with our review candidate. In theory, at least.
Possible Competitors in Comparison
Rating | Date | Model | Weight | Height | Size | Resolution | Price |
|---|---|---|---|---|---|---|---|
| 84.7 % v7 (old) | 07 / 2022 | Dell Inspiron 15 5515-H8P8F R7 5700U, Vega 8 | 1.6 kg | 18 mm | 15.60" | 1920x1080 | |
| 81 % v7 (old) | 02 / 2022 | Acer Aspire 5 A515-45-R4R1 R7 5700U, Vega 8 | 1.7 kg | 18 mm | 15.60" | 1920x1080 | |
| 80.7 % v7 (old) | 04 / 2022 | Asus VivoBook 15 OLED M513UA-L1282W R7 5700U, Vega 8 | 1.8 kg | 18.6 mm | 15.60" | 1920x1080 | |
| 82.6 % v7 (old) | 05 / 2022 | Huawei MateBook D 15 Ryzen 5 5500U R5 5500U, Vega 7 | 1.6 kg | 16.9 mm | 15.60" | 1920x1080 | |
| 79.9 % v7 (old) | 01 / 2022 | Dell Inspiron 15 3000 3511 i5-1135G7, Iris Xe G7 80EUs | 1.7 kg | 18.99 mm | 15.60" | 1920x1080 | |
| 83.5 % v7 (old) | 07 / 2022 | Dell Inspiron 15 Plus i5-11400H, GeForce RTX 3050 4GB Laptop GPU | 1.9 kg | 19 mm | 15.60" | 1920x1080 |
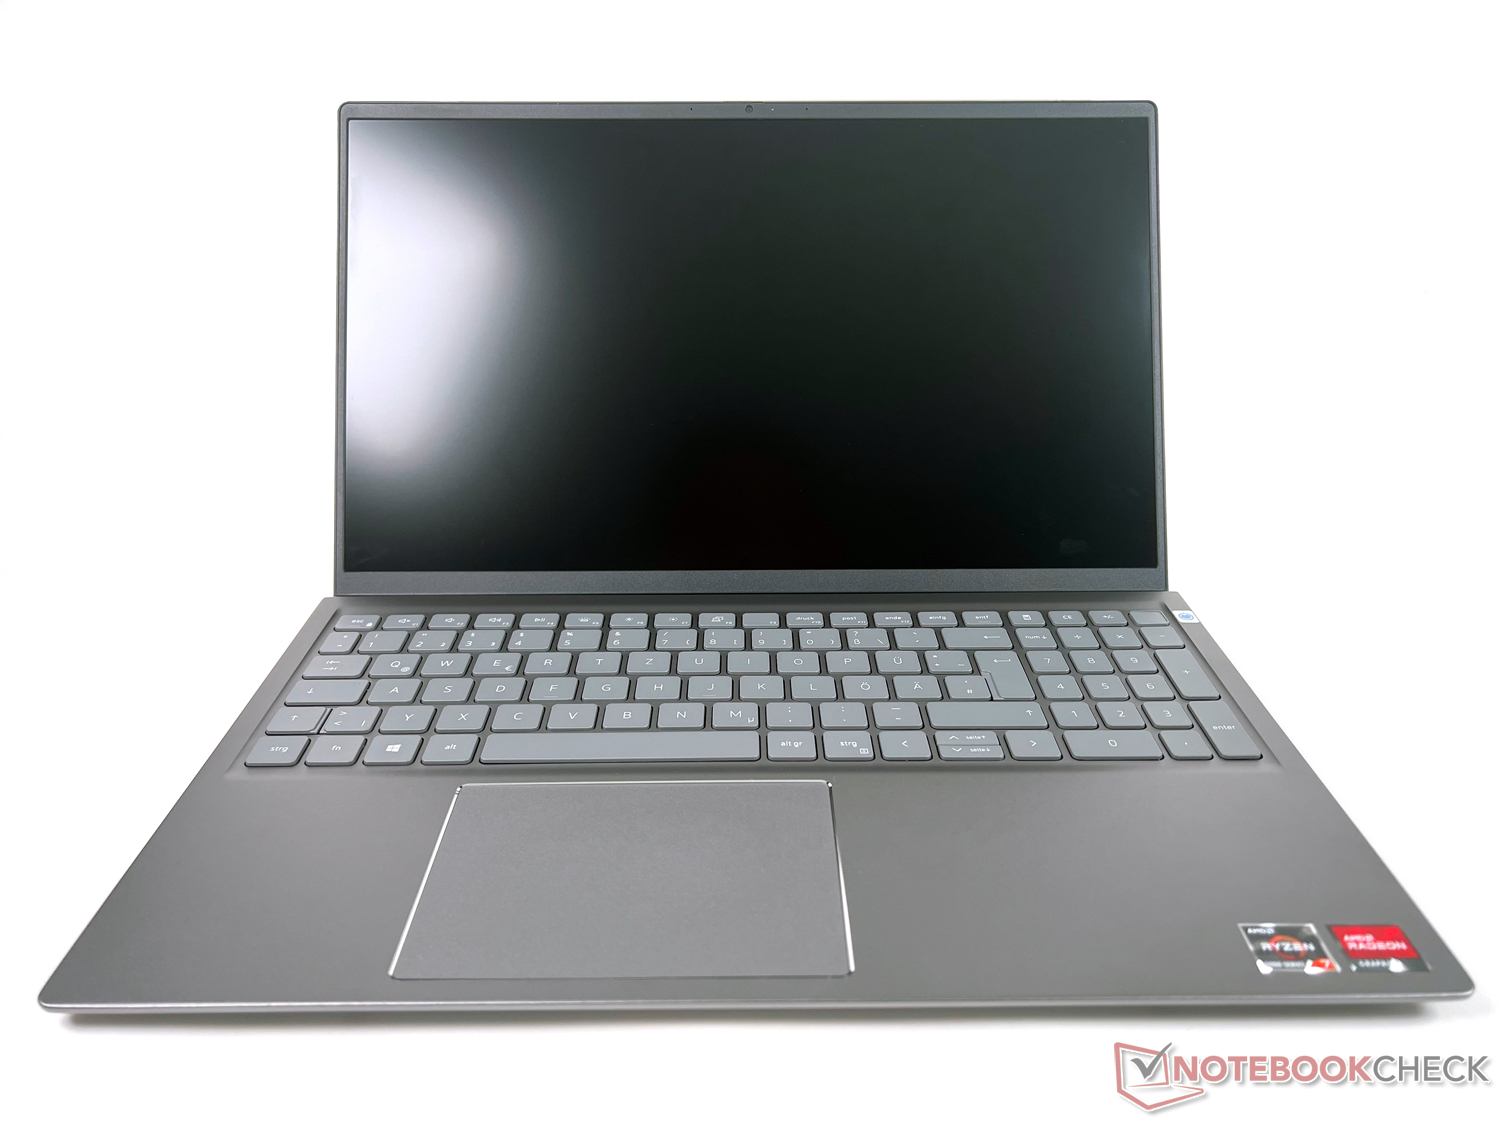
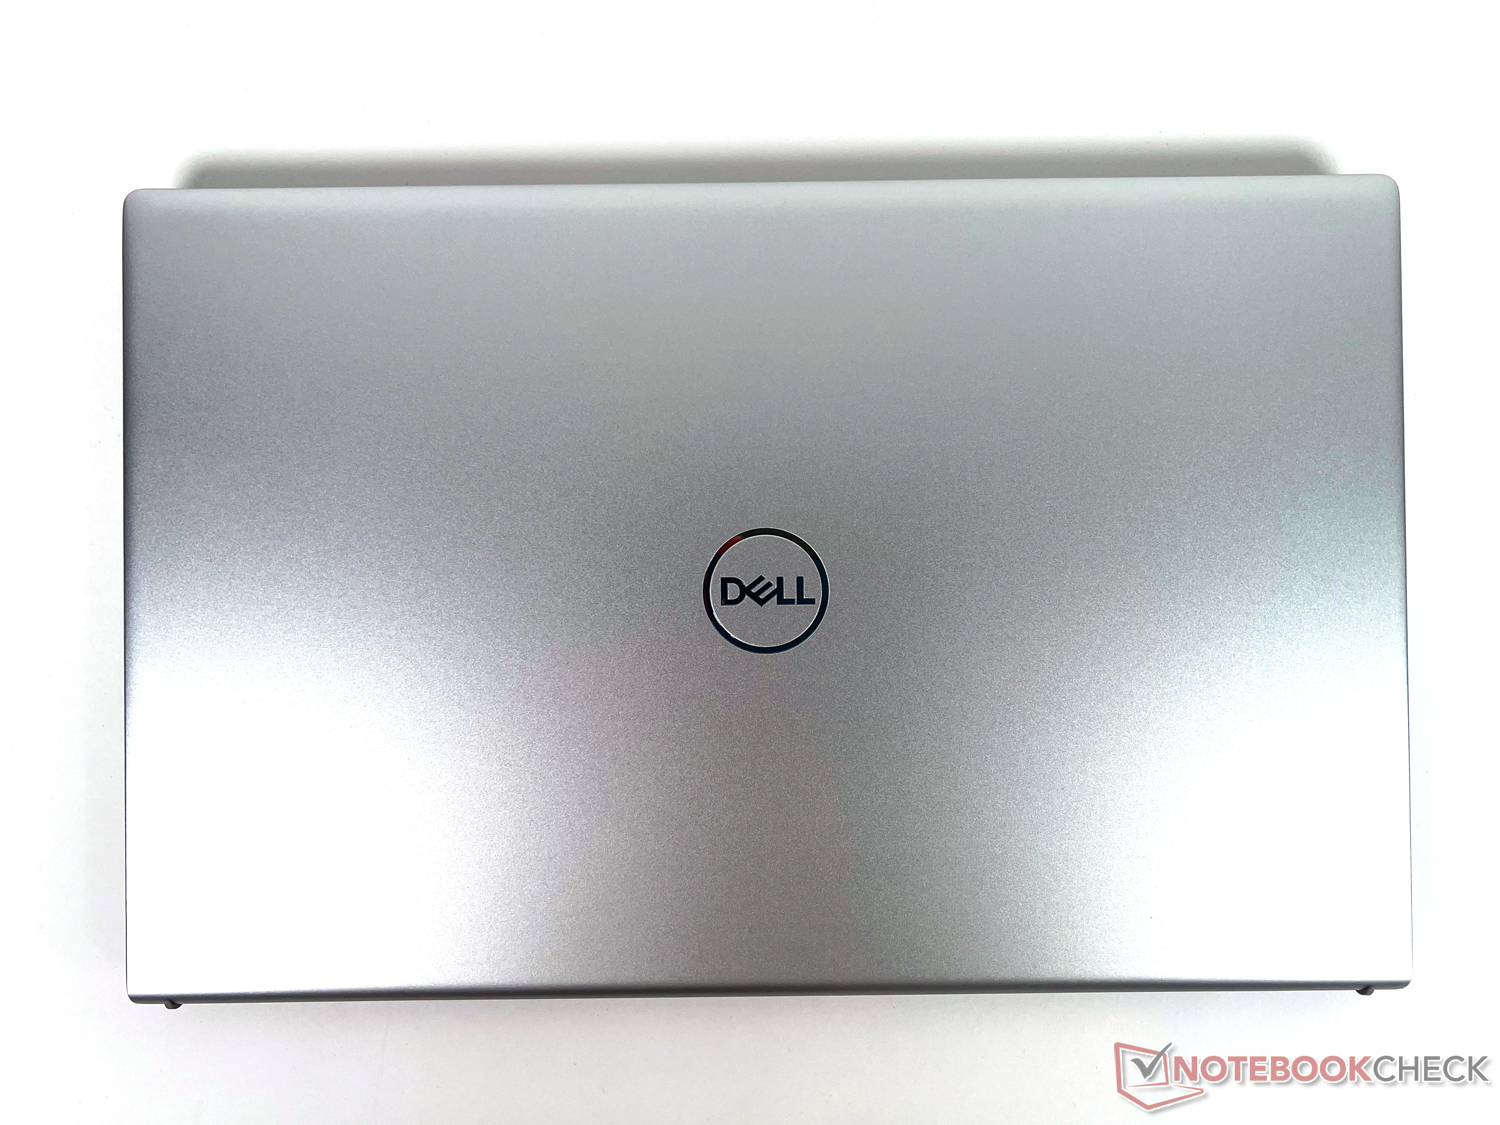
Case & Equipment: Plain Dell notebook made of aluminum
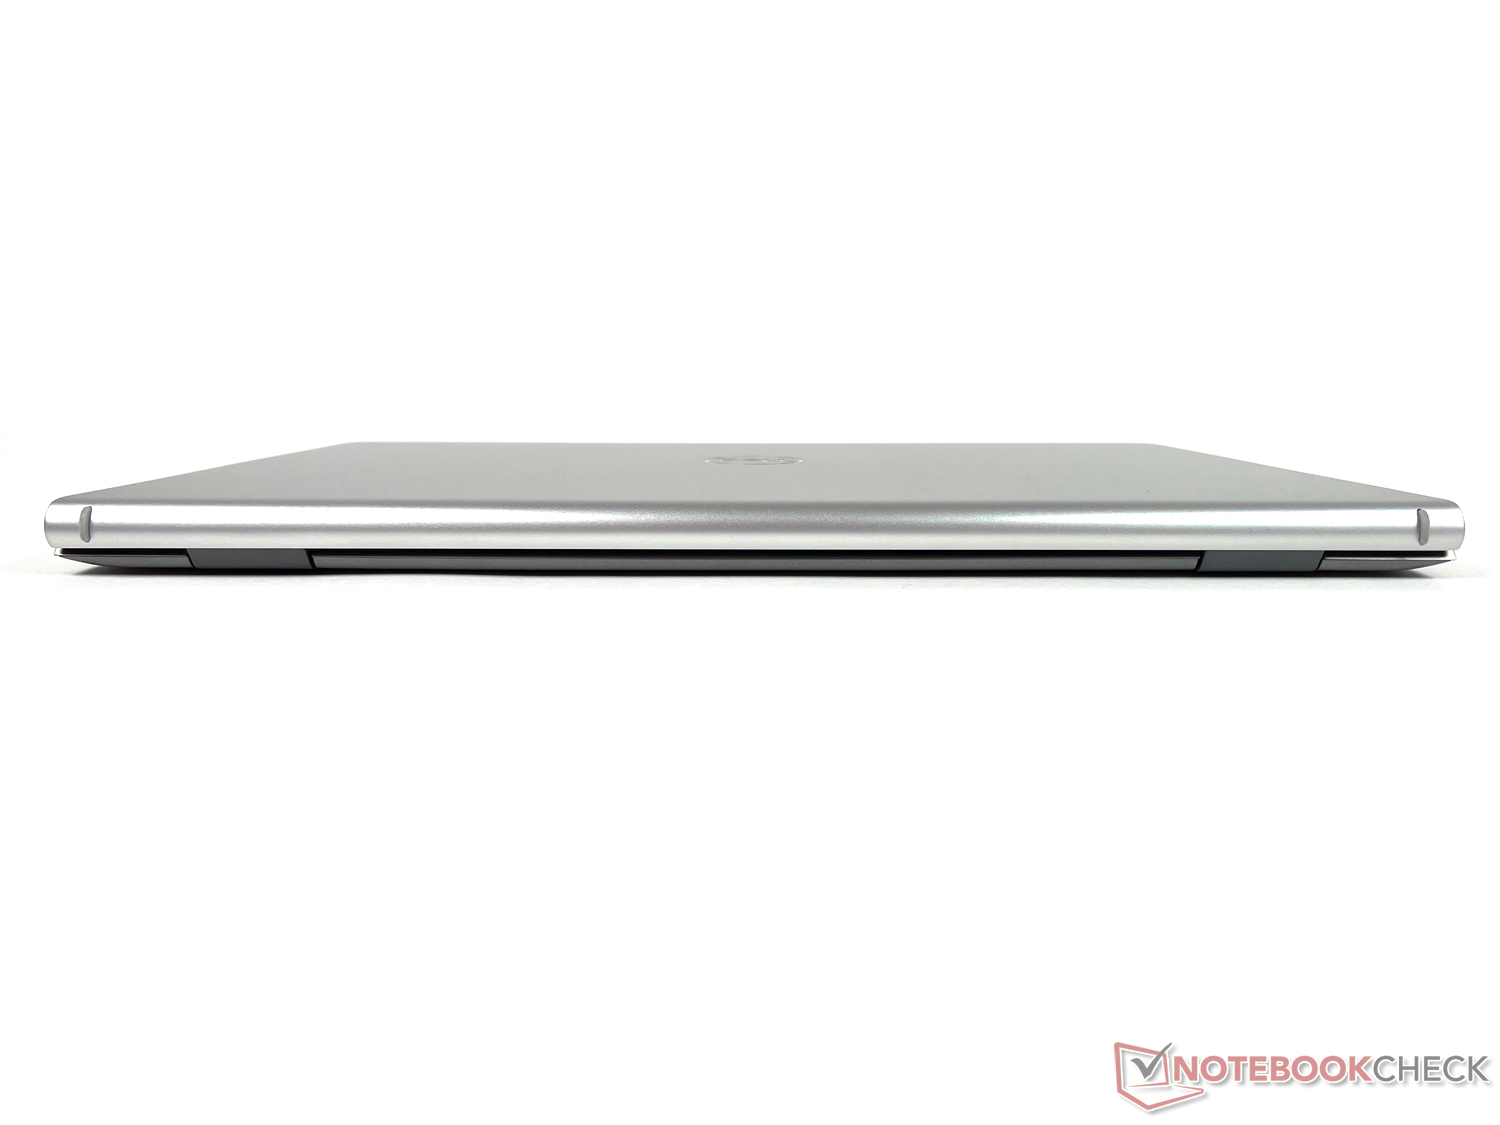
The Dell Inspiron 15 5515 comes in an aluminum shell, simply designed and in the Platinum Silver color. The choice of materials gives the device a high-quality feel, reflecting an equally professional manufacturing process. The hinges holding the monitor are quite taut, but still allow for one-handed opening. The base lifts slightly when opened.
In terms of dimensions, the device is ahead in the class of 15.6-inch contenders, so it is one of the most compact notebooks. It also leads in terms of weight, recording around 1.6 kg. Together with the power adapter, it weighs just under 2 kg. Not so heavy after all.
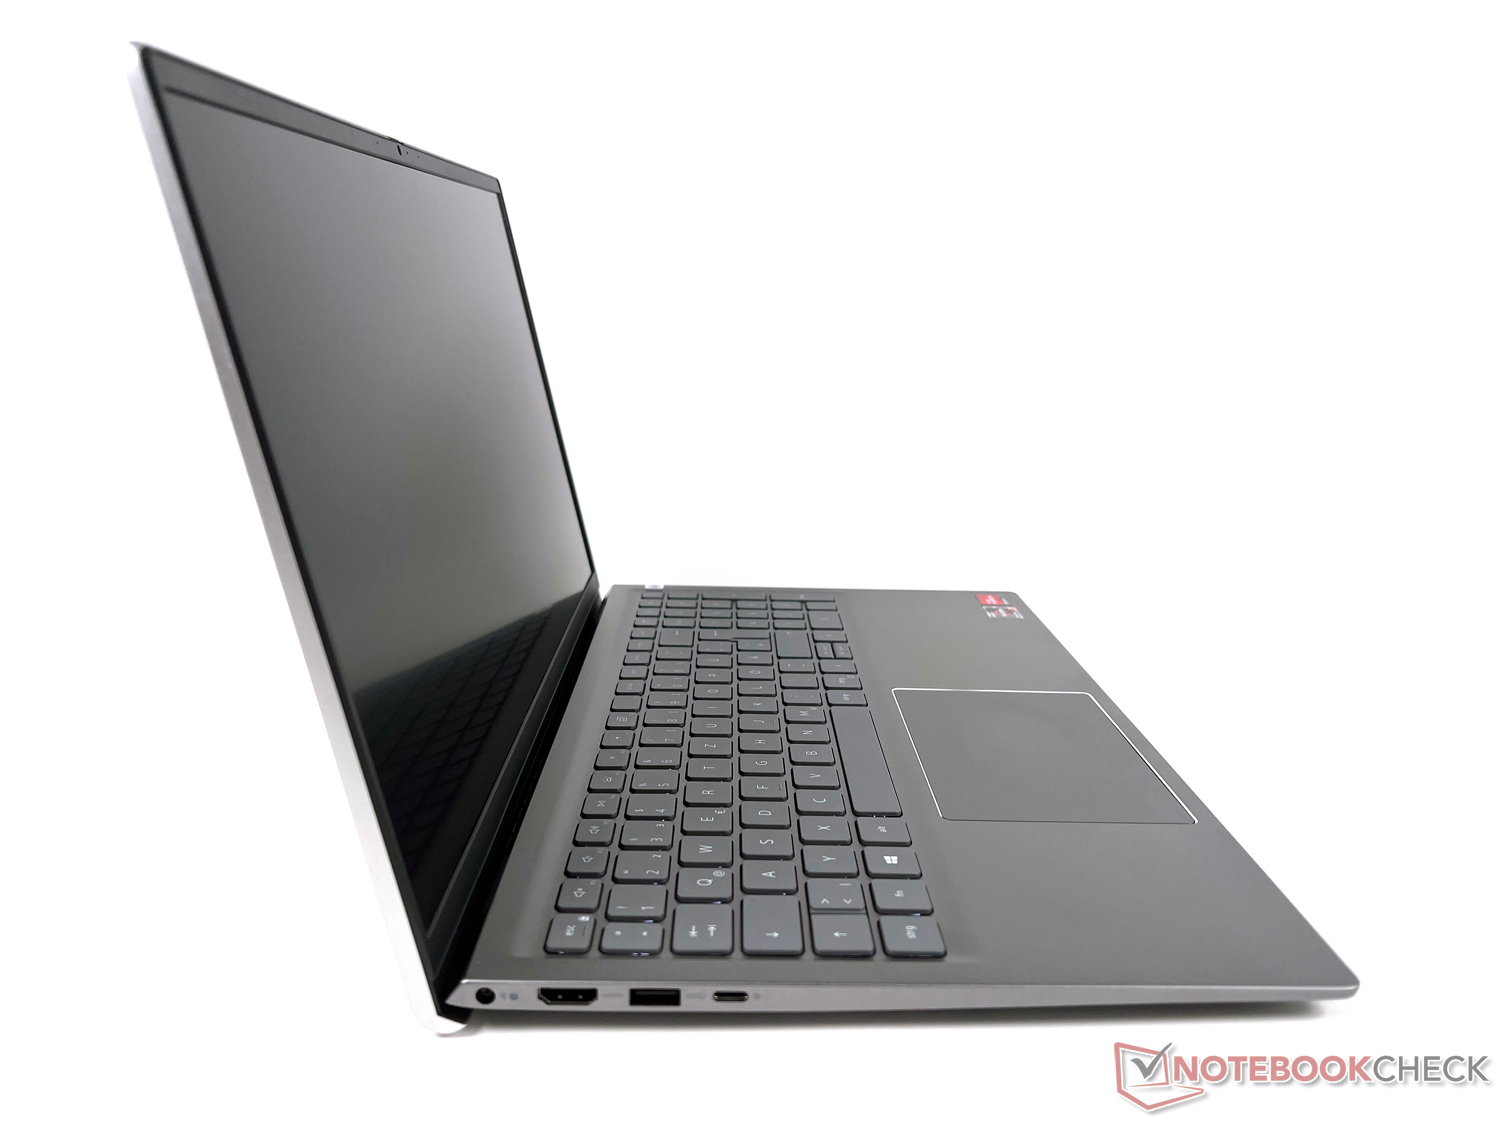
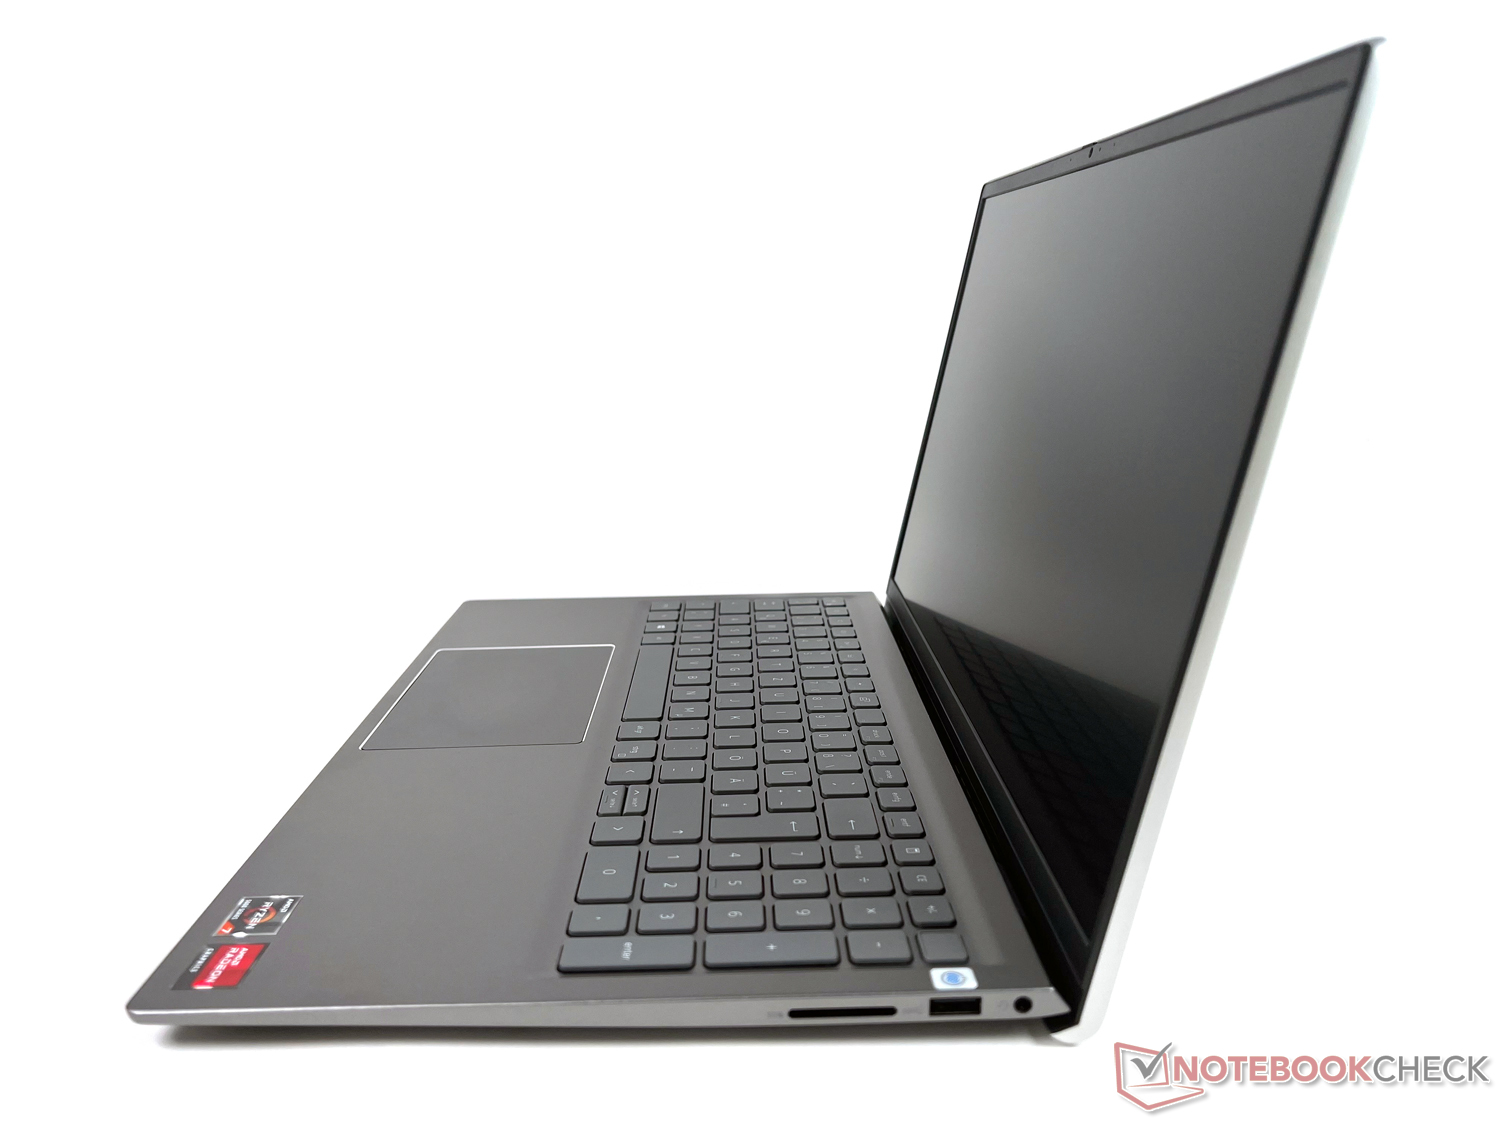
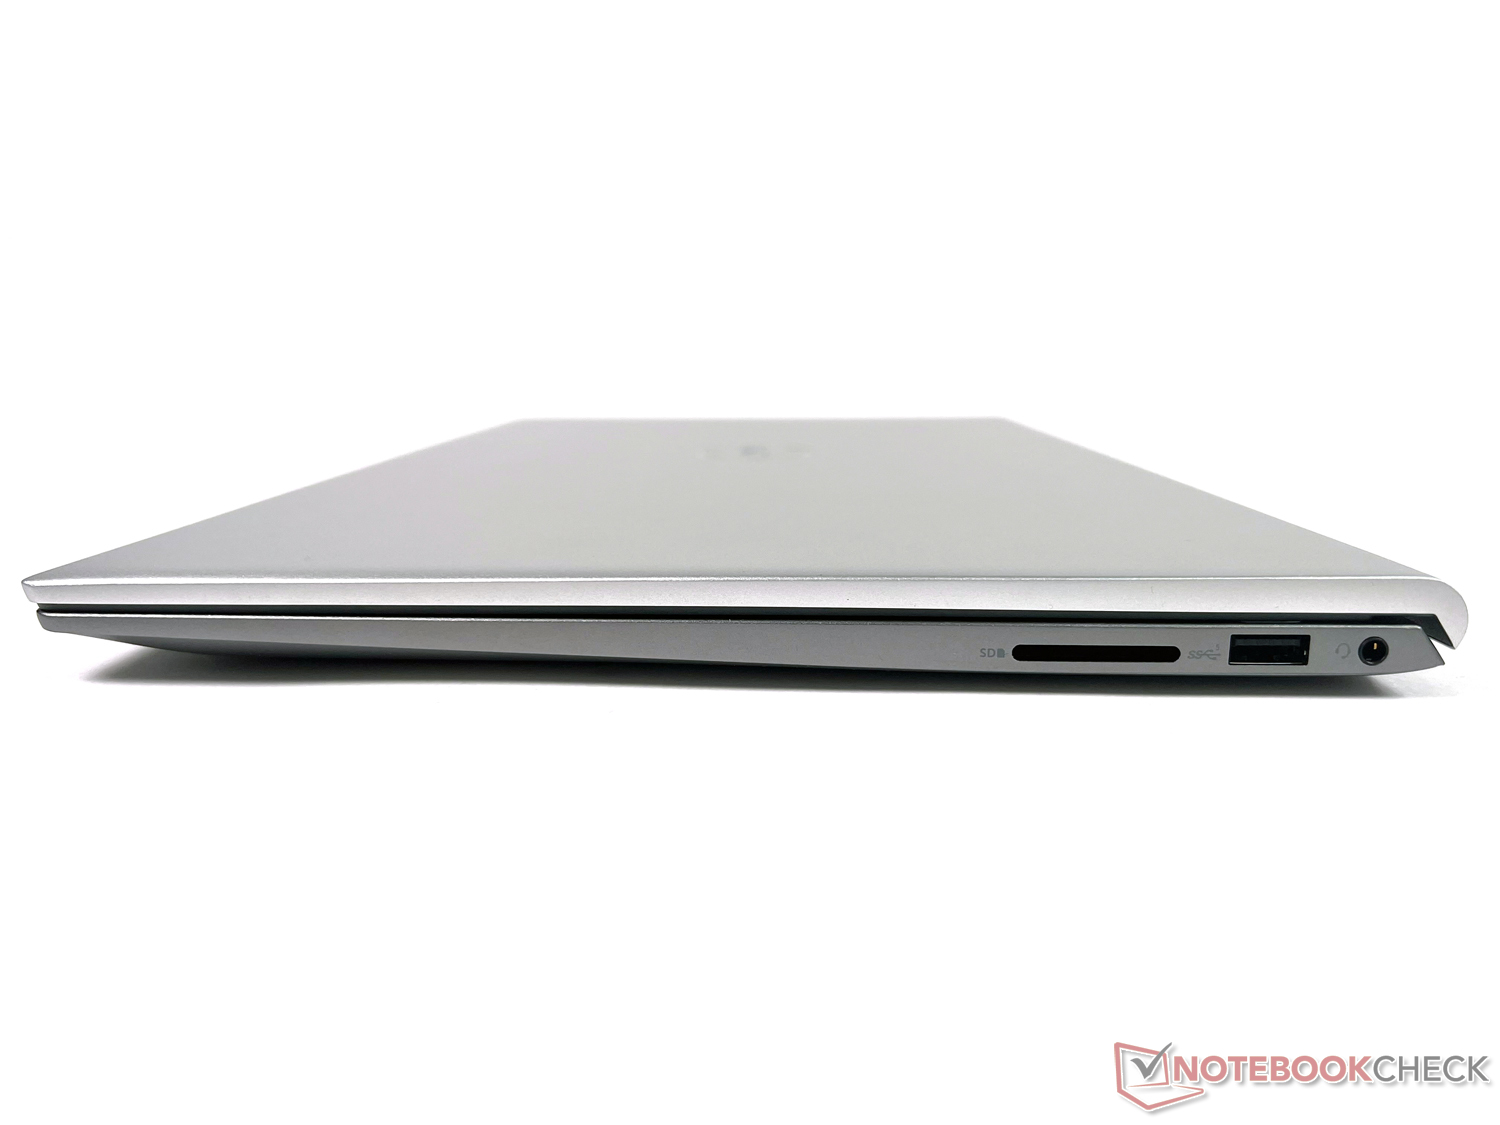
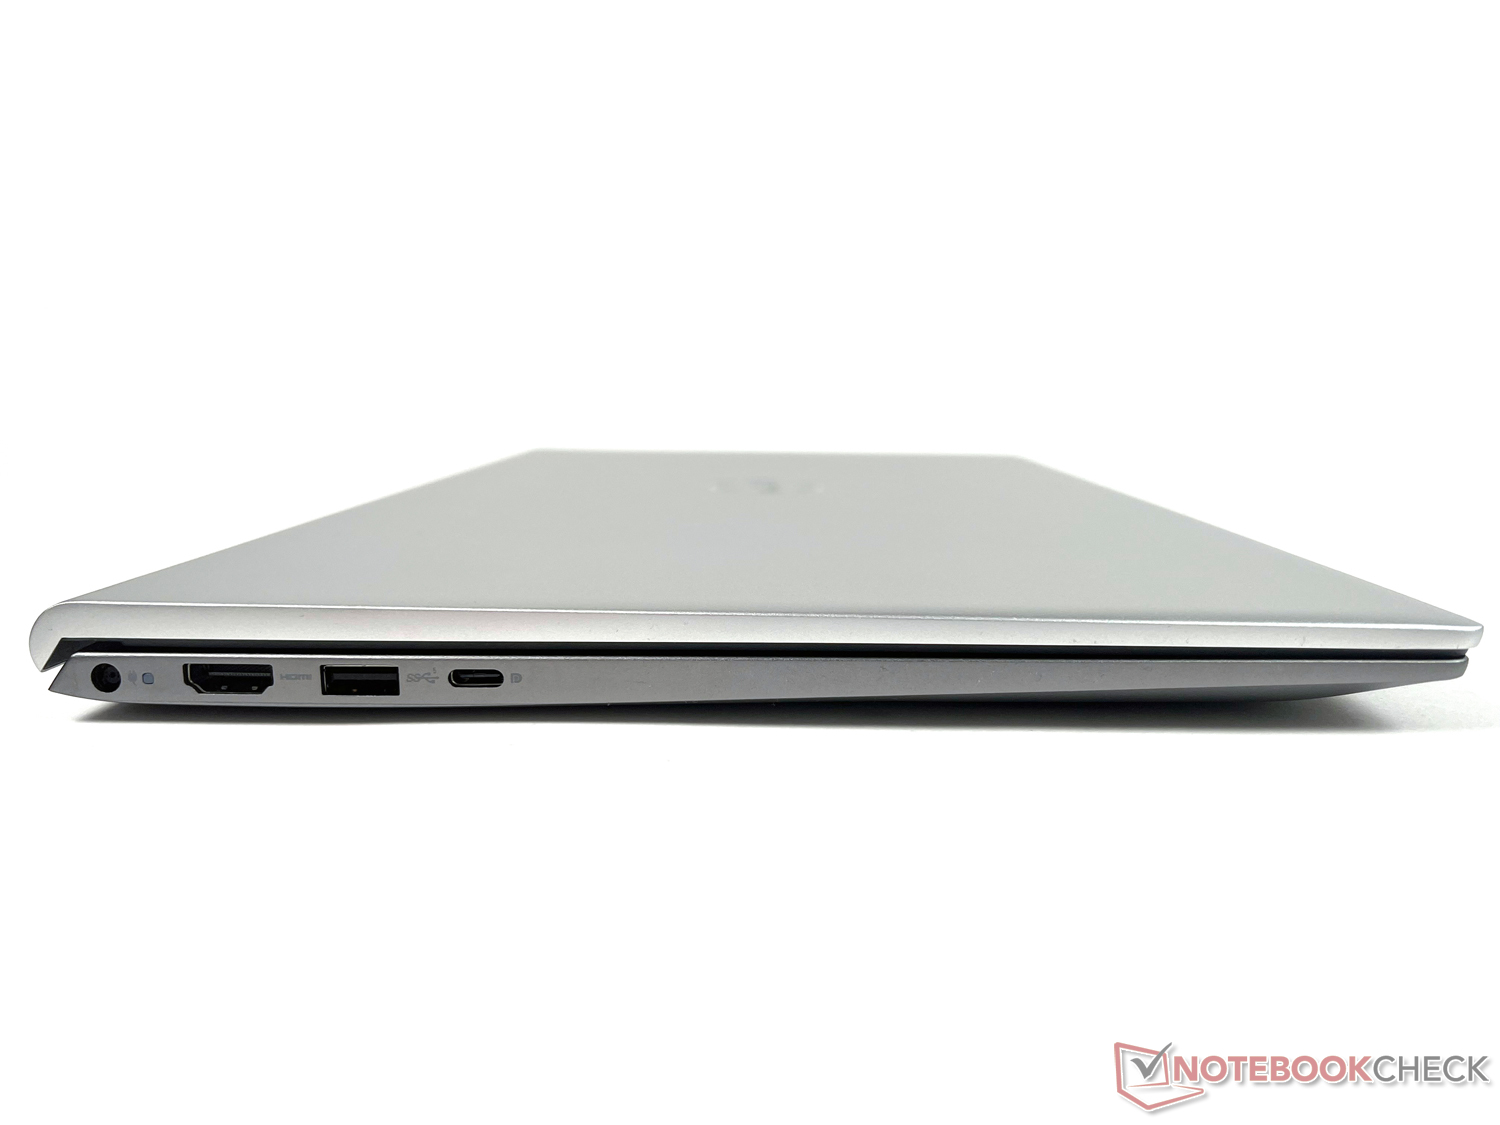
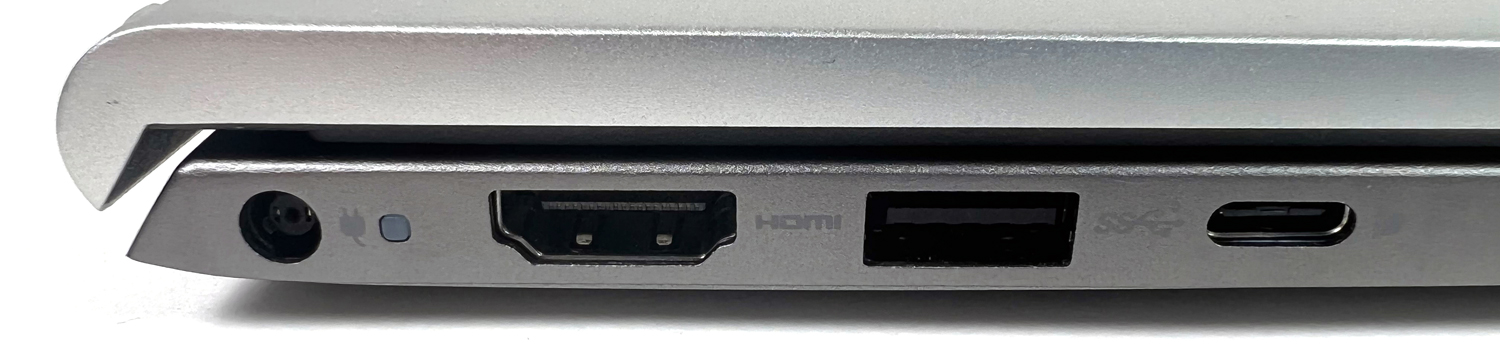
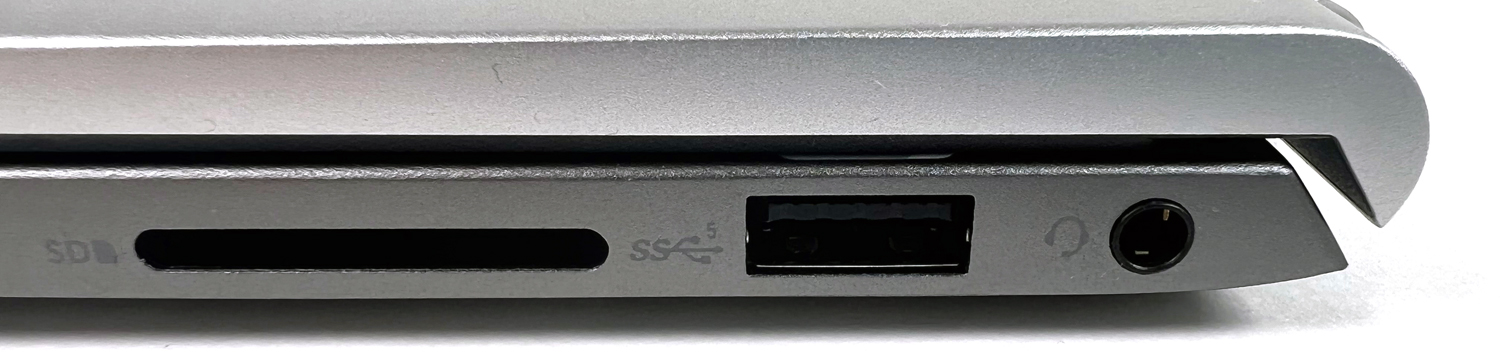
All ports are distributed on the left and right side of the case. An SD card reader is also among them, but lags behind the majority of the comparison field in terms of data rates. WLAN speeds, on the other hand, are decent. Unfortunately, we cannot say the same of the HD camera (1280x720 at 30 fps) with its dual-array microphones, which captures solid images, but not particularly accurately with an average DeltaE of just over 25 colors.
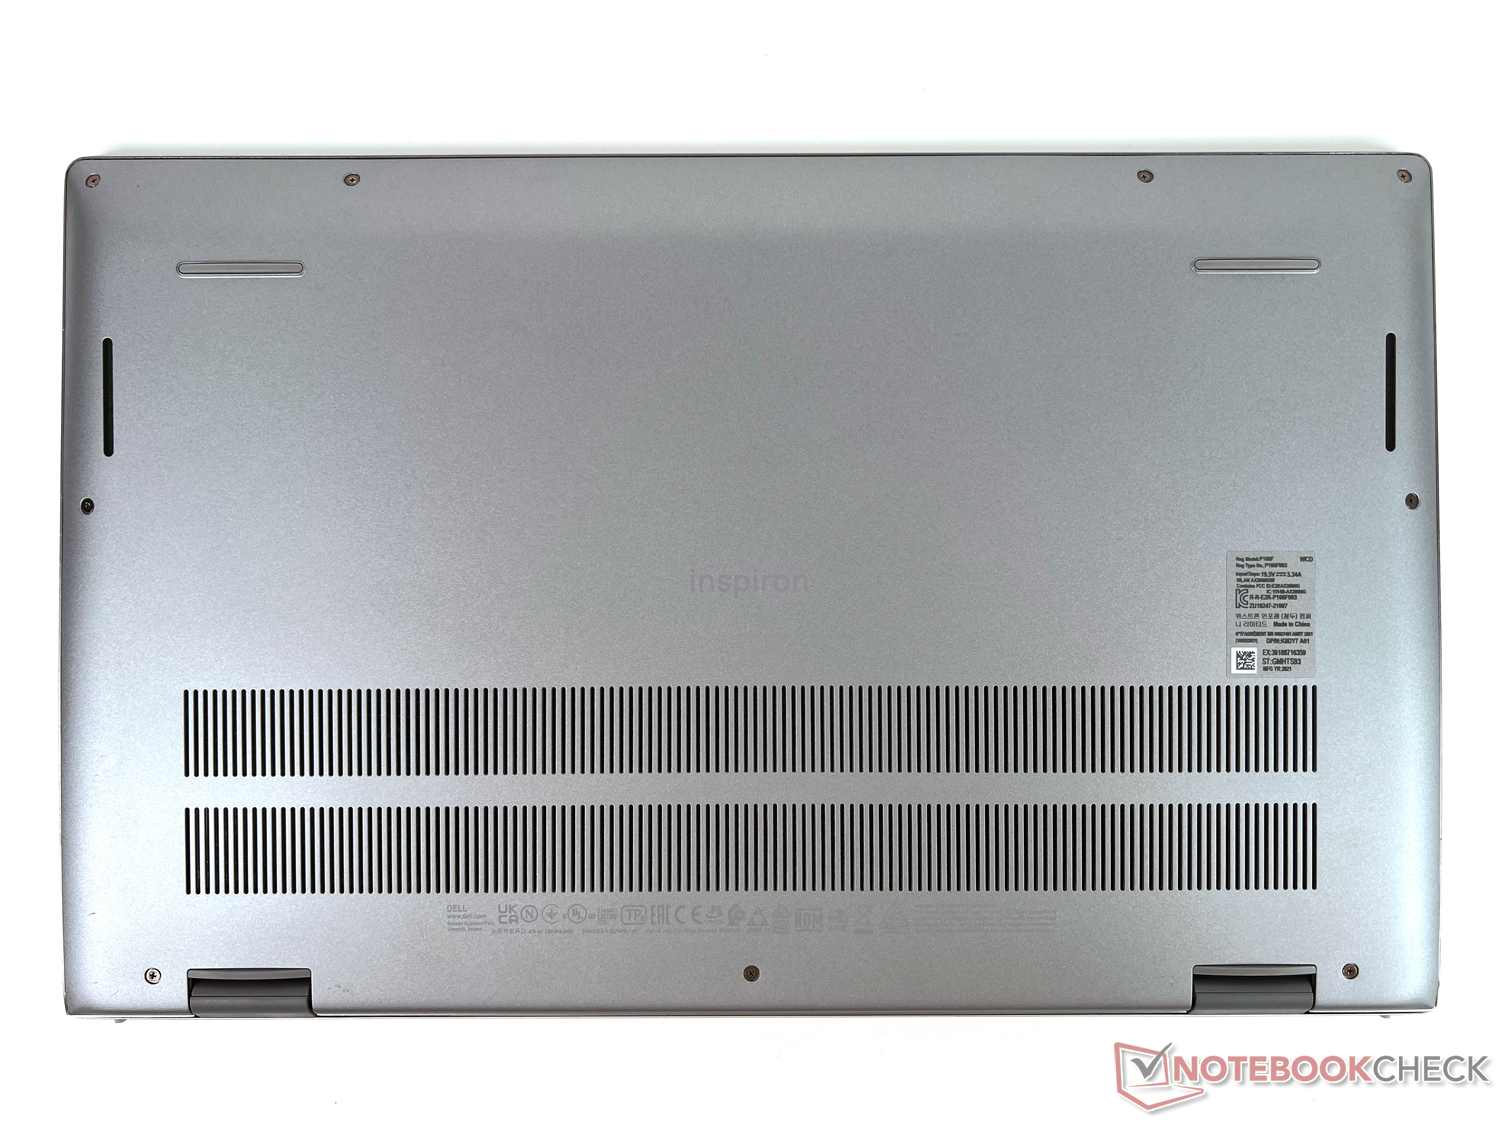
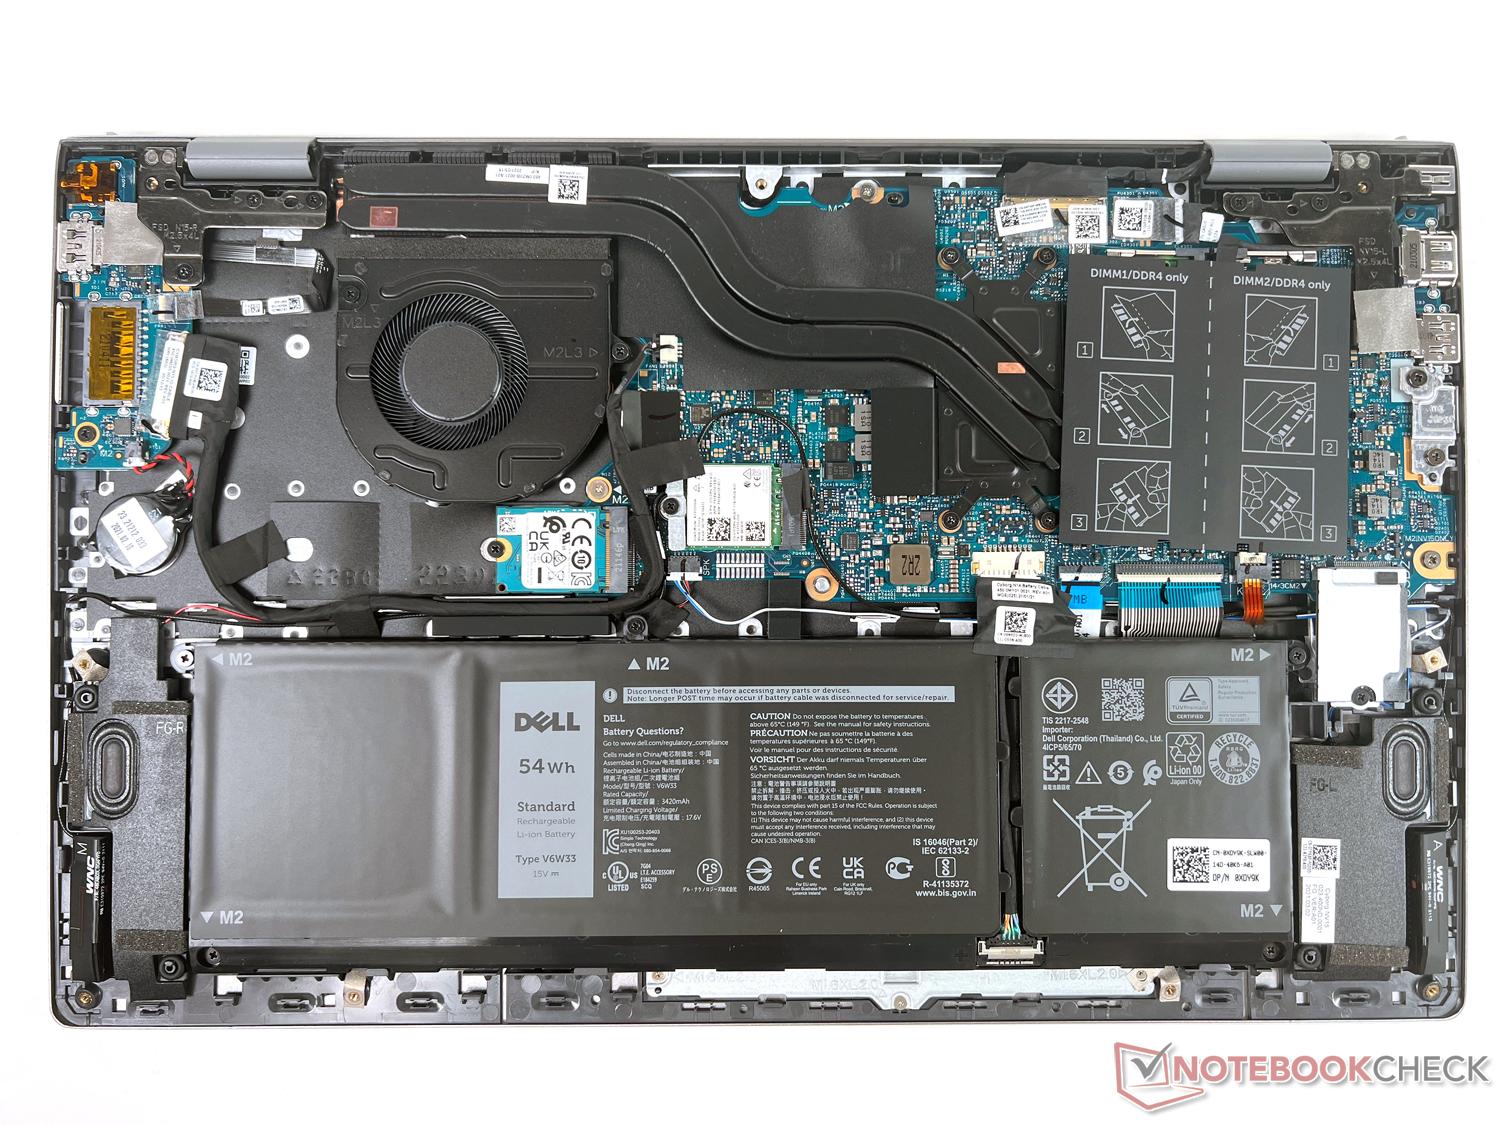
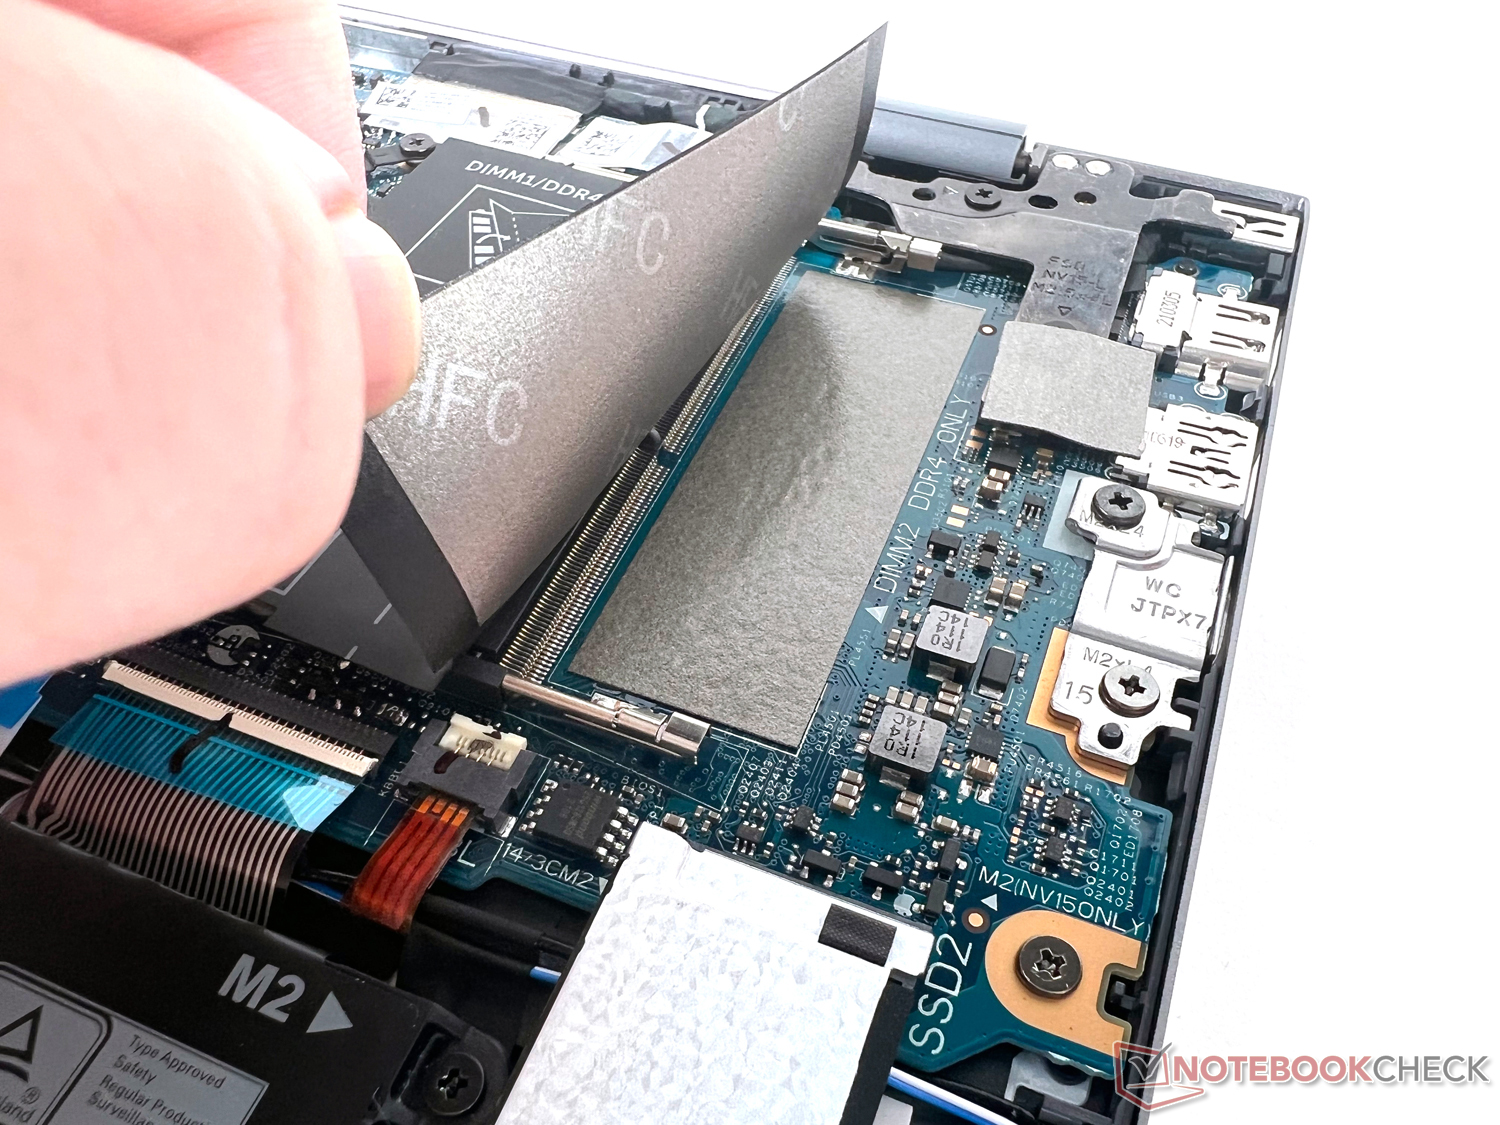
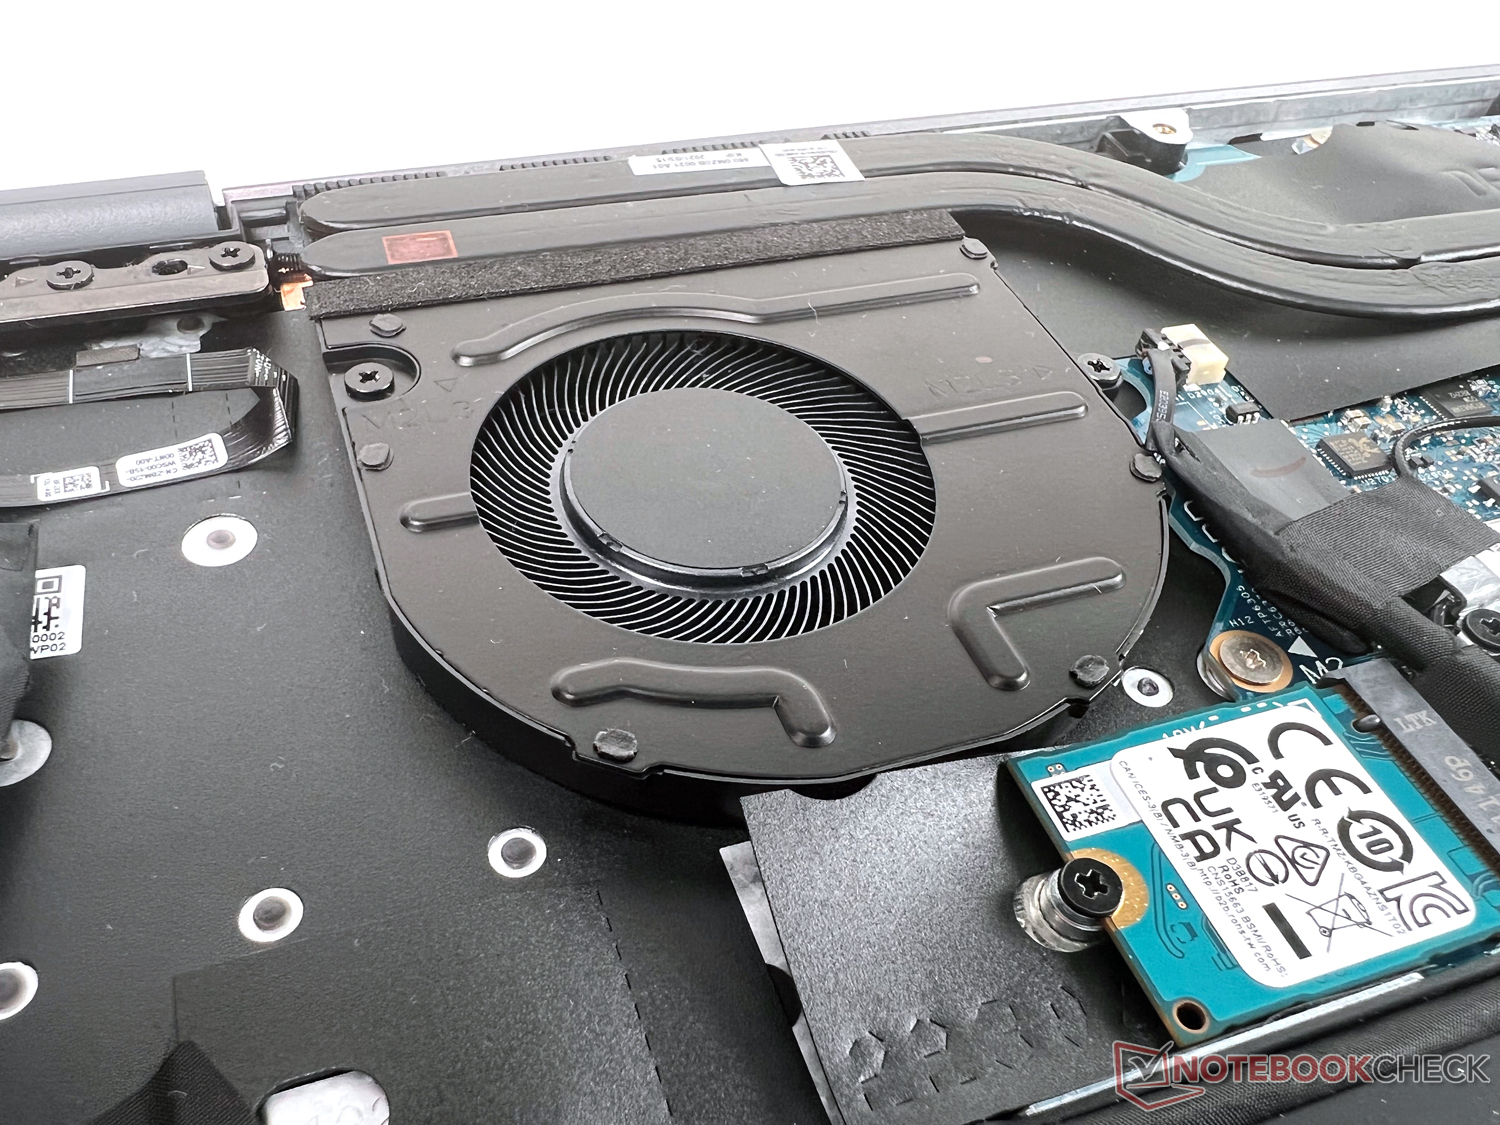
After unscrewing the baseplate, you can change the battery, clean the fan and increase the RAM thanks to a free slot.
| SD Card Reader | |
| average JPG Copy Test (av. of 3 runs) | |
| Average of class Office (19.8 - 198.5, n=22, last 2 years) | |
| Asus VivoBook 15 OLED M513UA-L1282W (AV Pro SD microSD 128 GB V60) | |
| Dell Inspiron 15 5515-H8P8F (AV Pro SD microSD 128 GB V60) | |
| Dell Inspiron 15 Plus (AV PRO microSD 128 GB V60) | |
| Dell Inspiron 15 3000 3511 (AV Pro V60) | |
| maximum AS SSD Seq Read Test (1GB) | |
| Average of class Office (27.4 - 249, n=21, last 2 years) | |
| Asus VivoBook 15 OLED M513UA-L1282W (AV Pro SD microSD 128 GB V60) | |
| Dell Inspiron 15 5515-H8P8F (AV Pro SD microSD 128 GB V60) | |
| Dell Inspiron 15 3000 3511 (AV Pro V60) | |


Input Devices: The large keyboard impresses
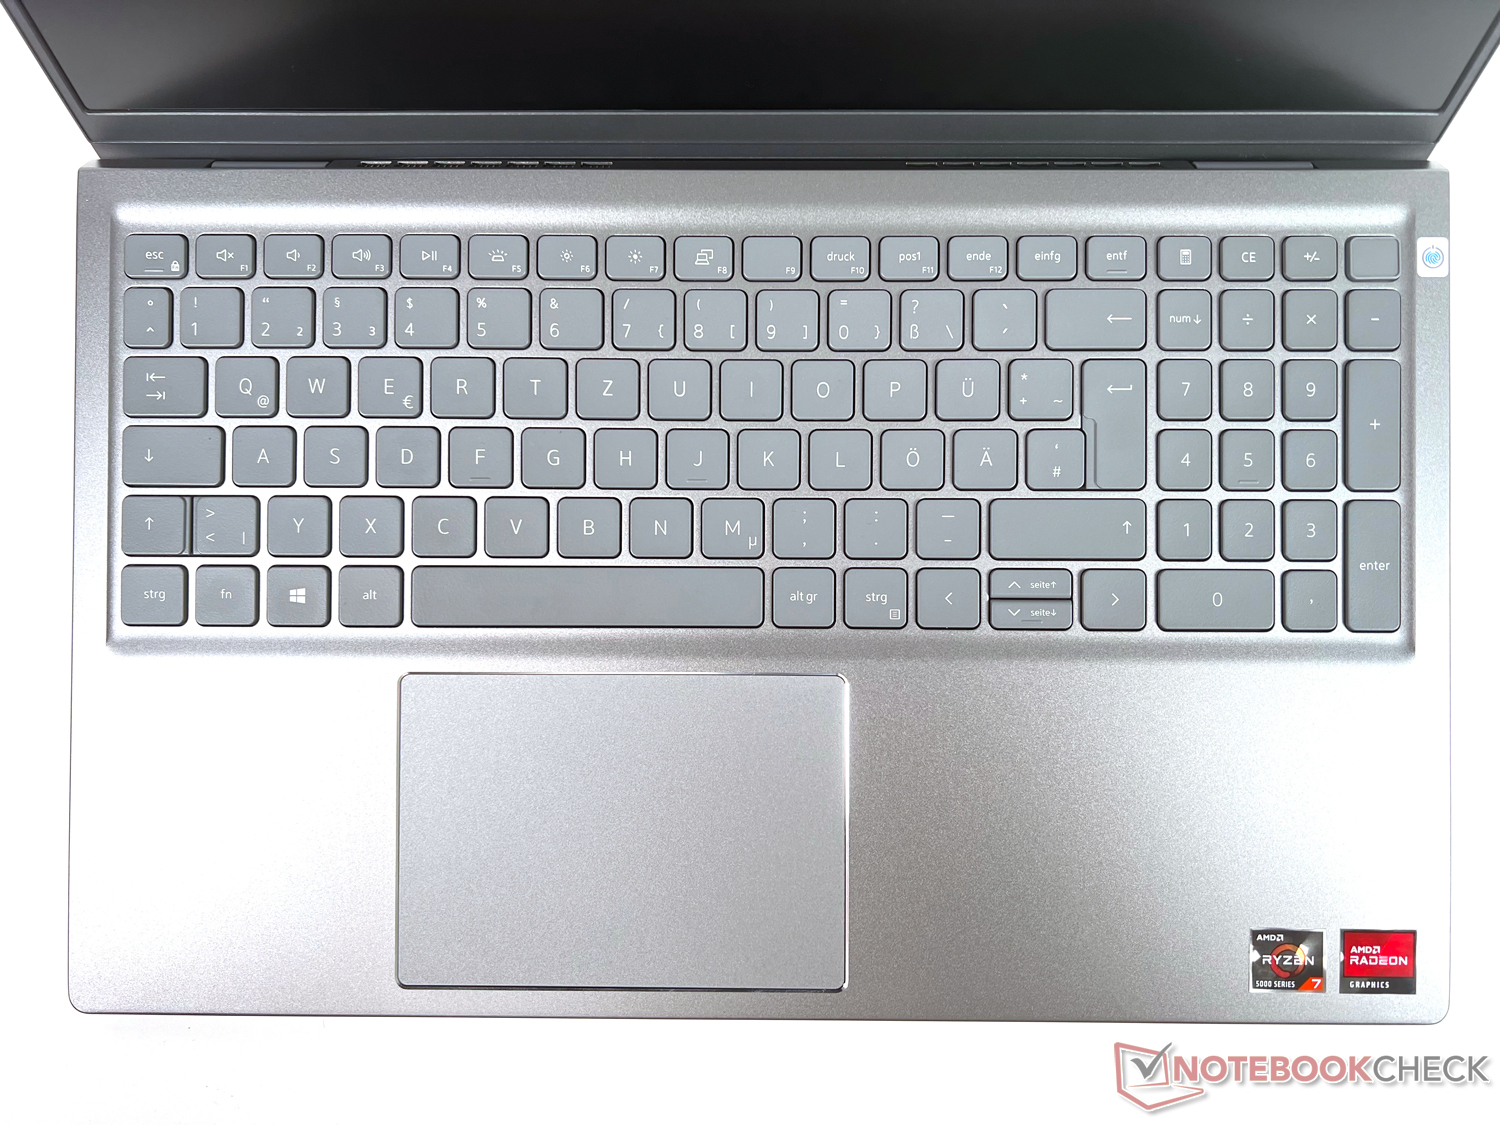
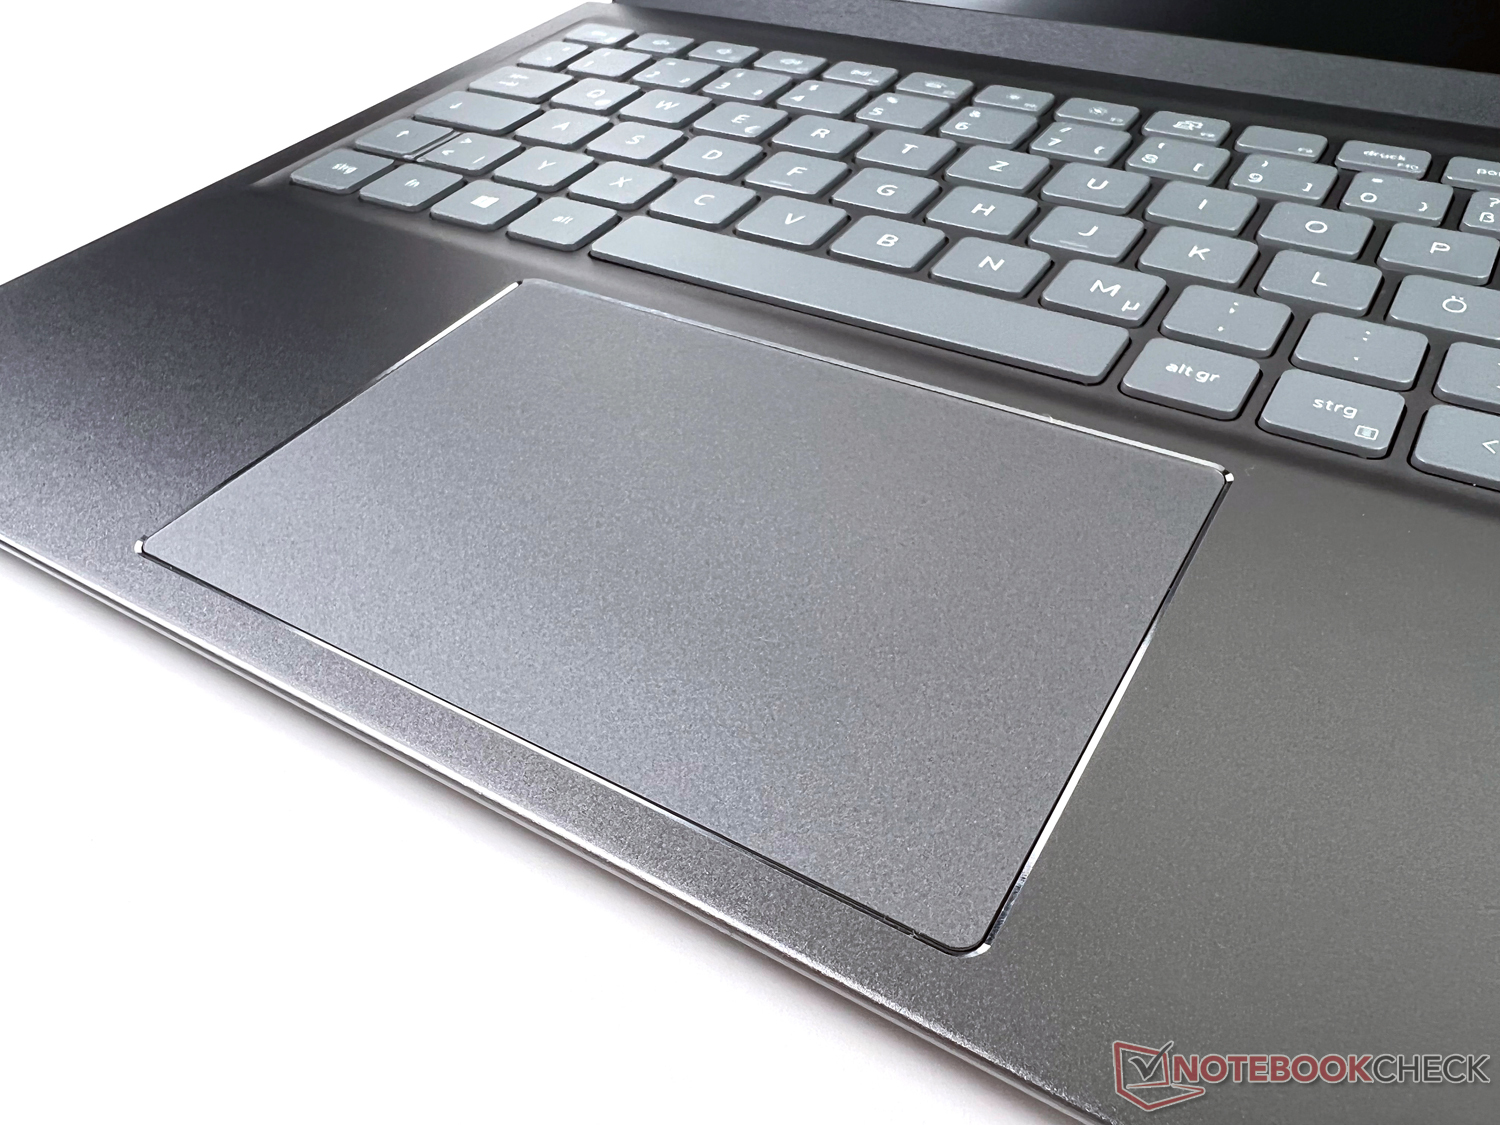
Dell utilitzes nearly all of the 15.6-inch device's dimensions, installing a keyboard and numpad which correspond to the width of the entire case - apart from the near 1.5 cm thin edges on the left and right. This allows for roughly 1.7x1.7 cm keys that are easy to type on. Noise development remains within limits.
Unfortunately, the same cannot be said of the touchpad, which has been placed slightly off-center under the space bar. The two click surfaces on the lower edge, which are not haptically separated from each other, produce clearly audible feedback. Otherwise operation is impeccable: fingers glide well over the smooth and haptically pleasant surface.
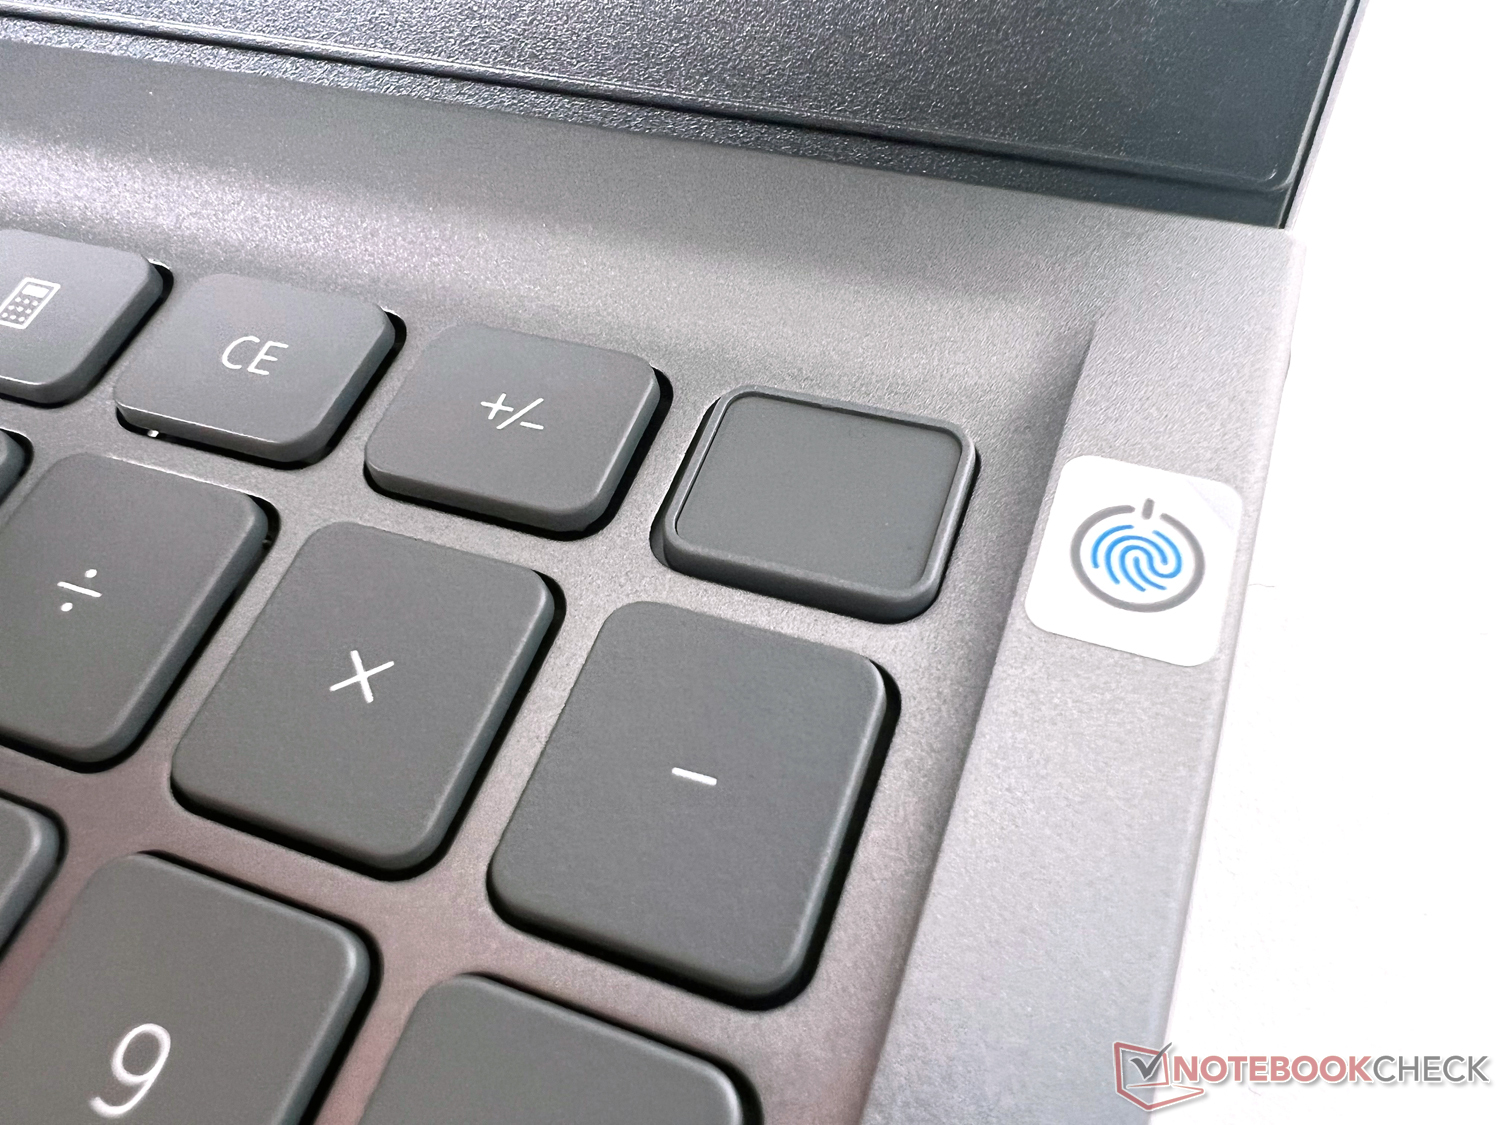
Dell places the usual additional functions for controlling the three-stage (bright, dark, off) keyboard backlight, media playback and more on the F1 to F12 keys. A fingerprint sensor is also located on the top right.
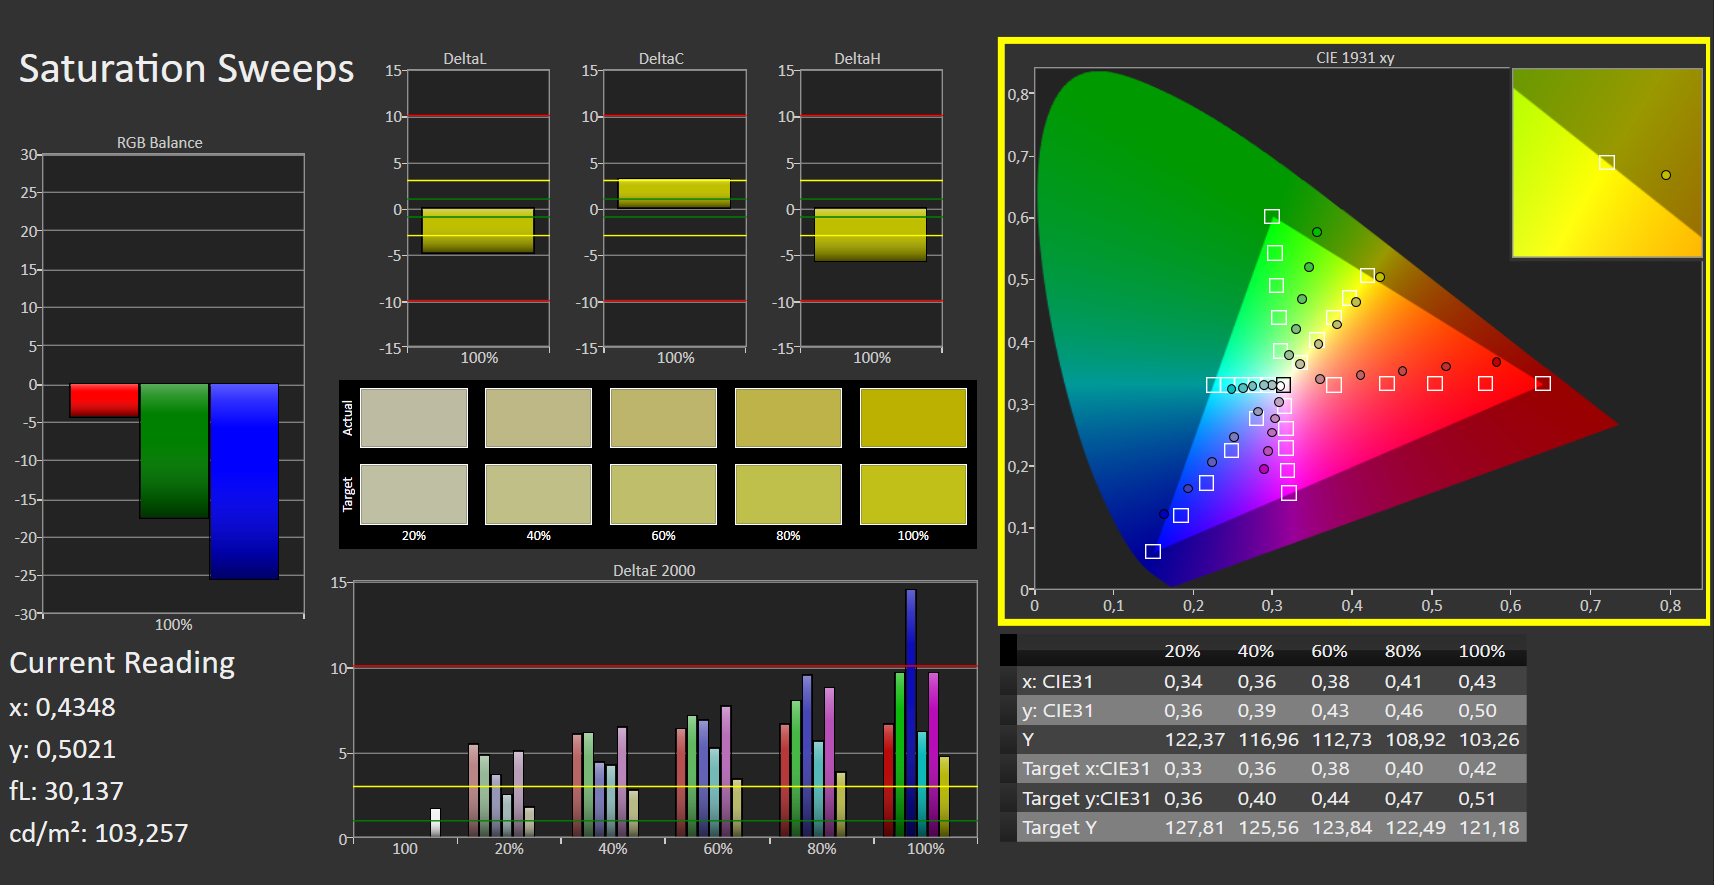
Display: Neither bright nor color accurate

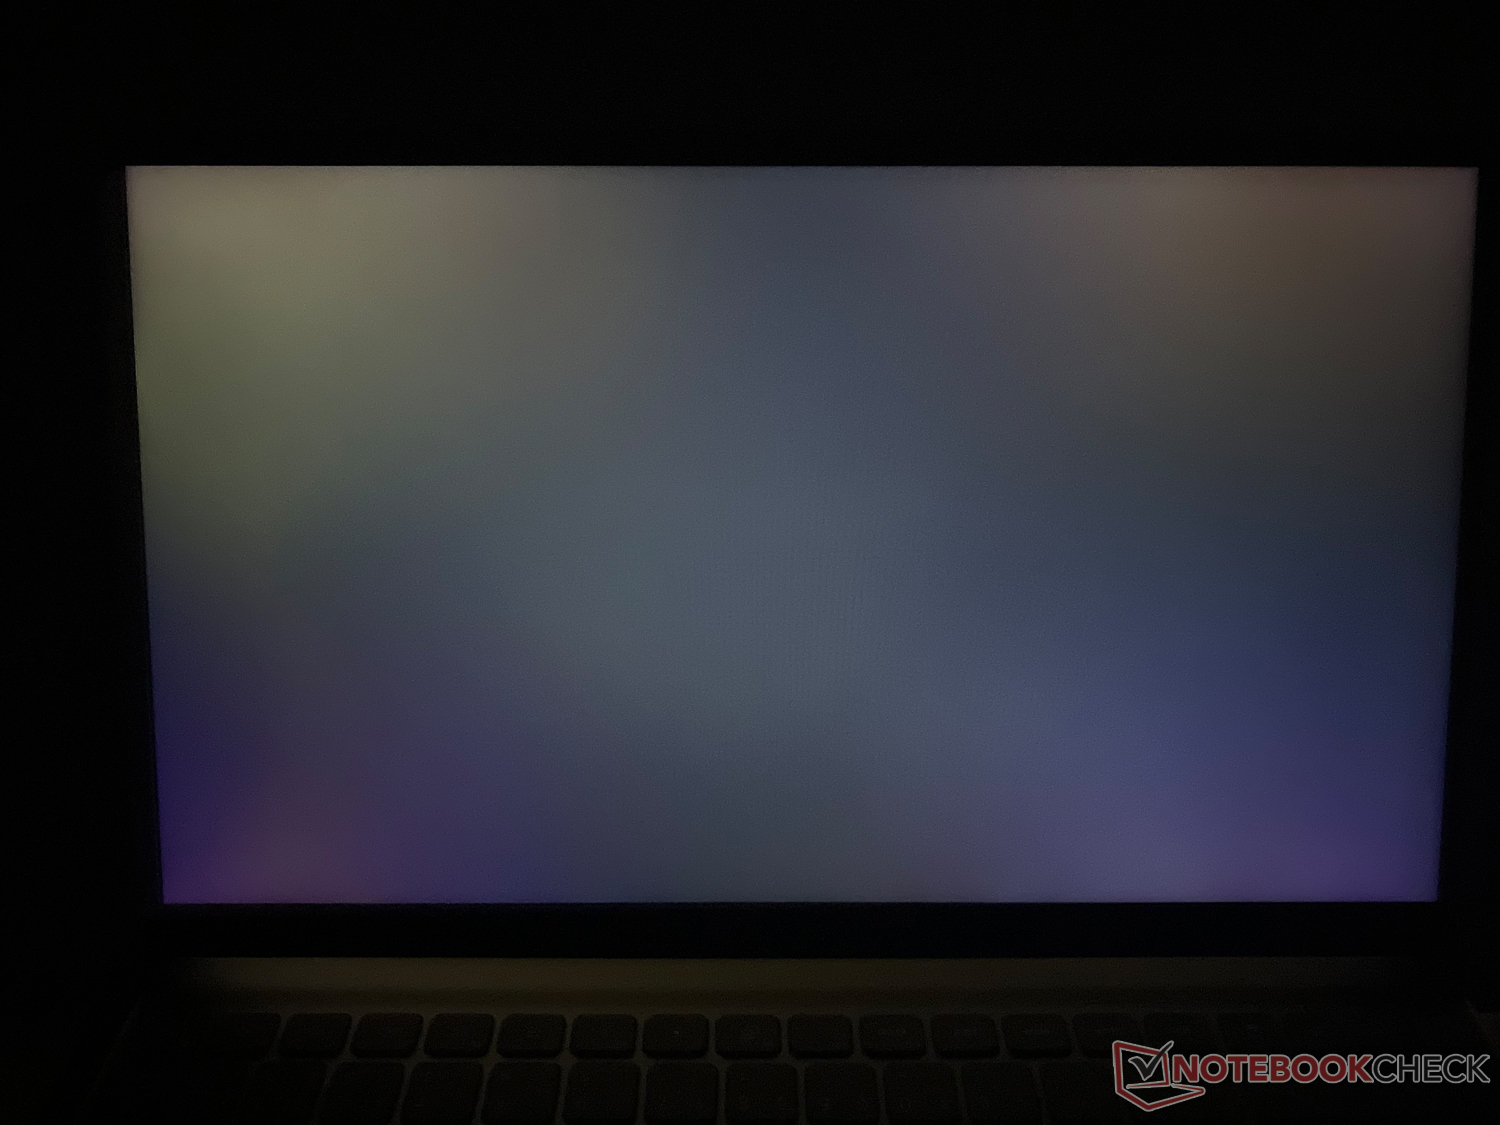
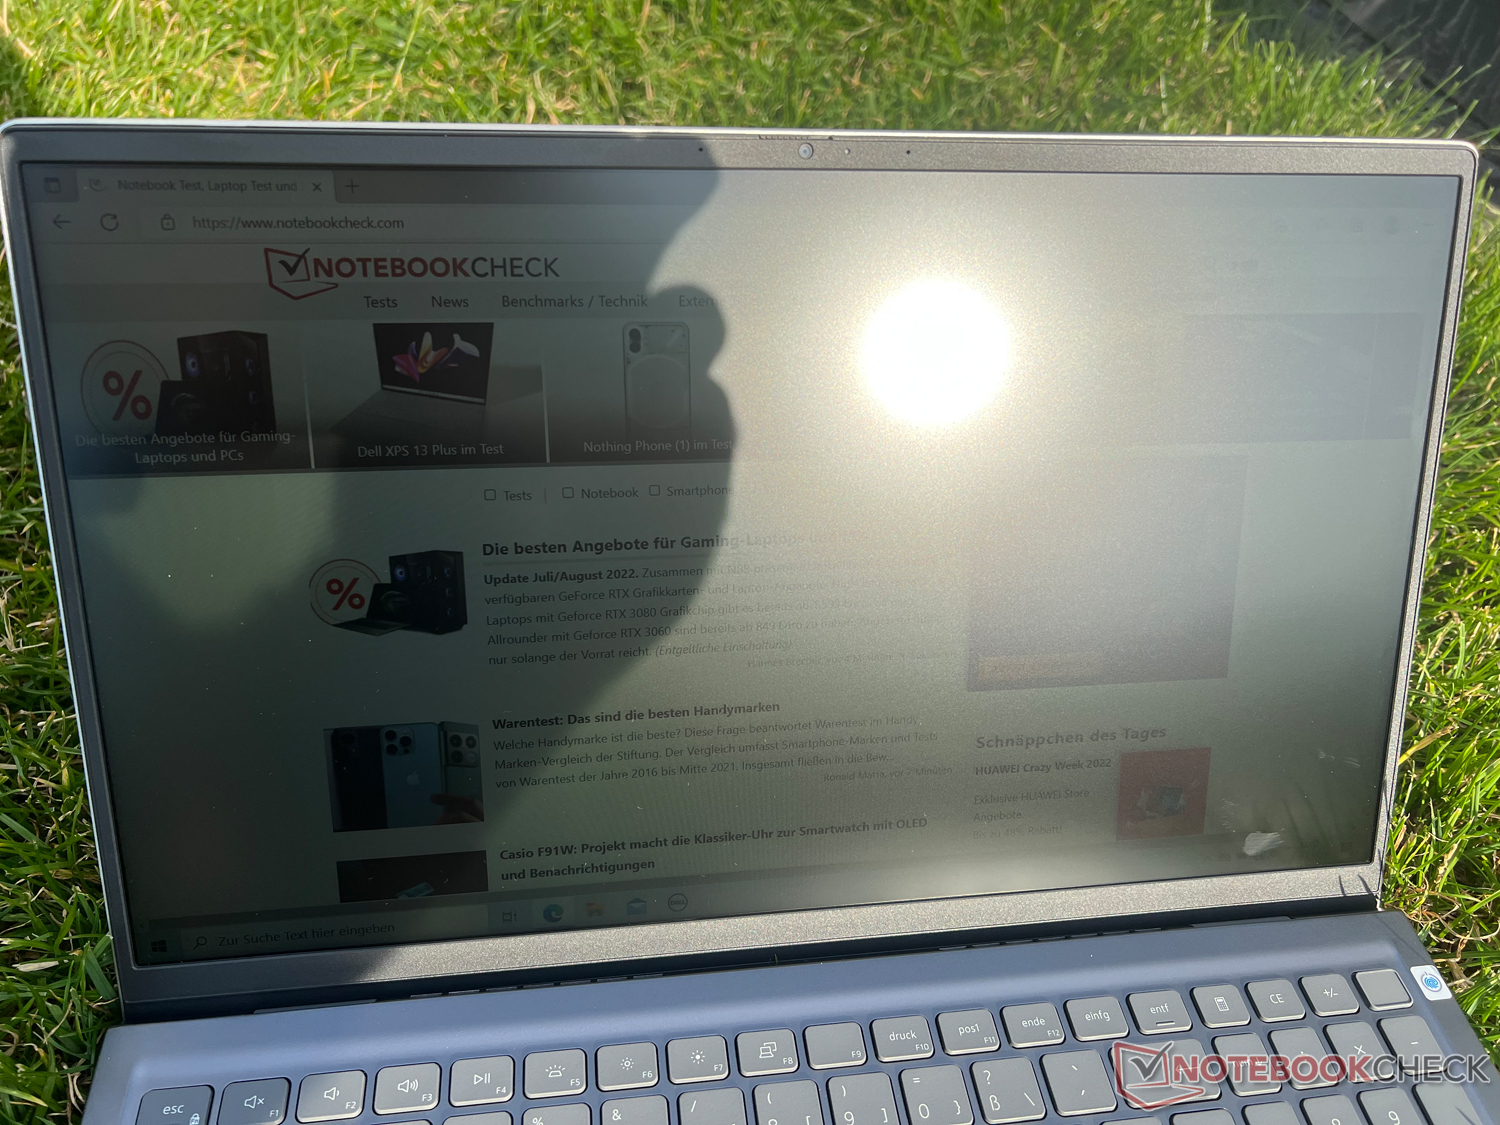
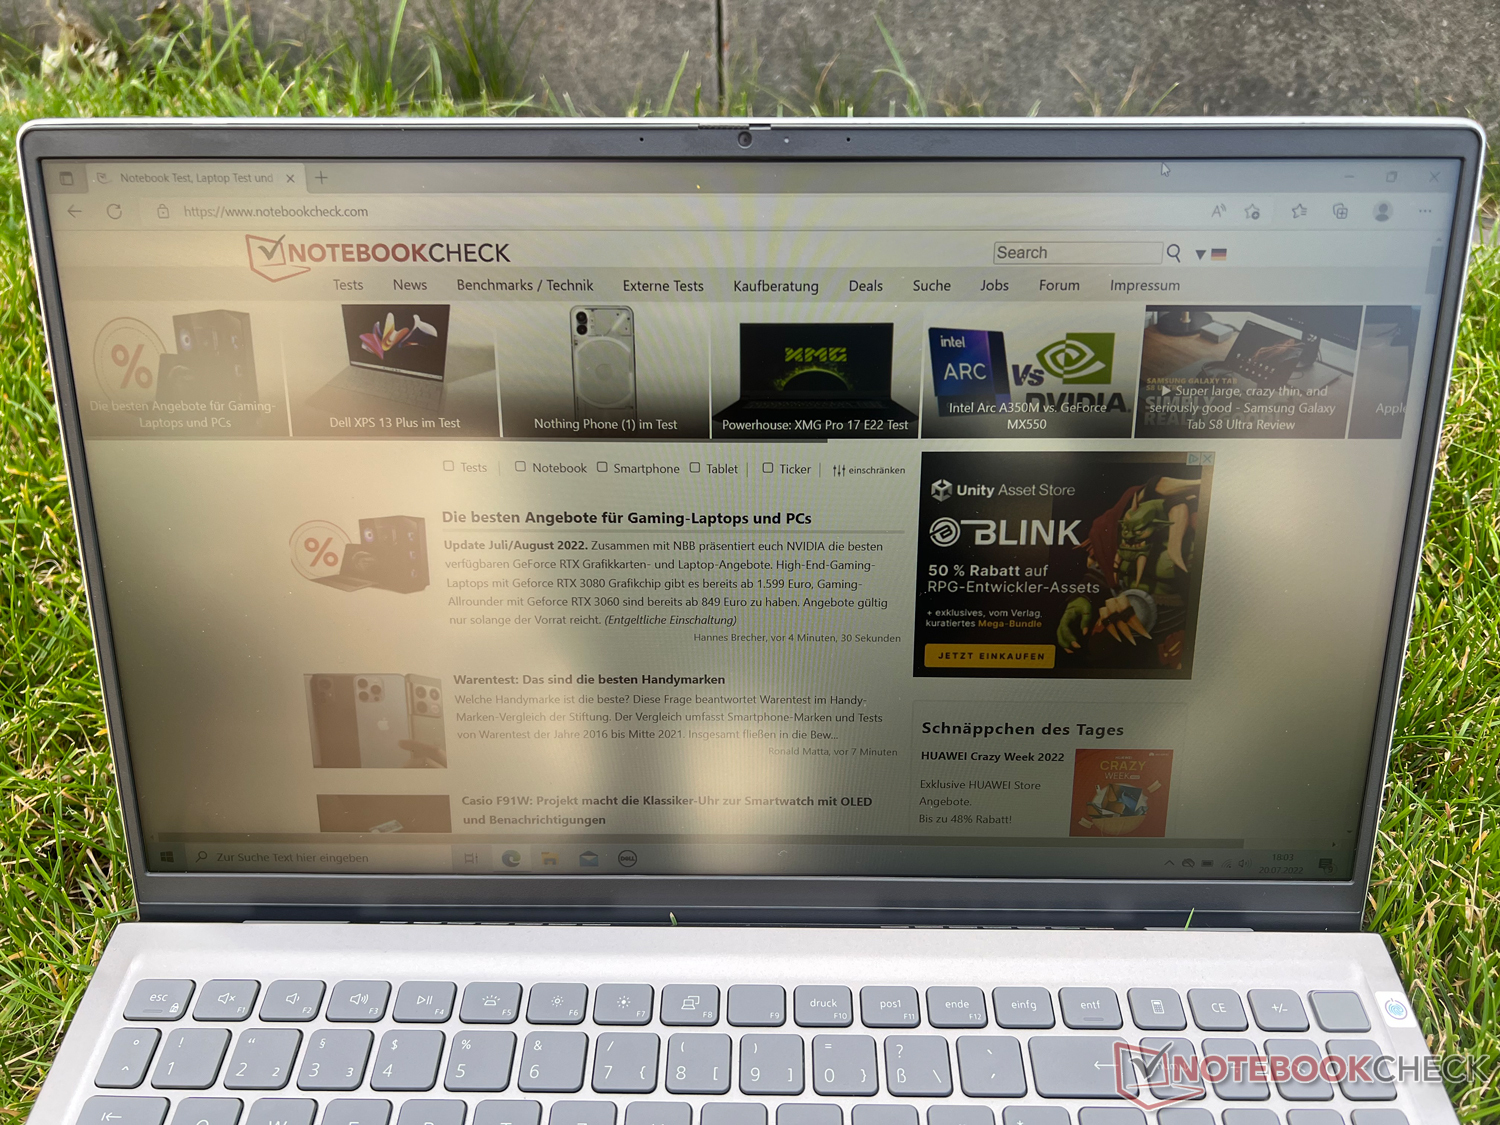
The 15.6-inch display with an aspect ratio of 16:9 has a Full HD resolution (1920x1080). It is matte and thus basically suitable for outdoor use. Unfortunately, the rather negligible brightness values of approximately 240 cd/m² throws a spanner in the works. So there are more suitable devices for regular outdoor use. We also noticed PWM flickering at 1250 Hz at a set brightness of 90% and below, which shouldn't cause any problems in everyday use.
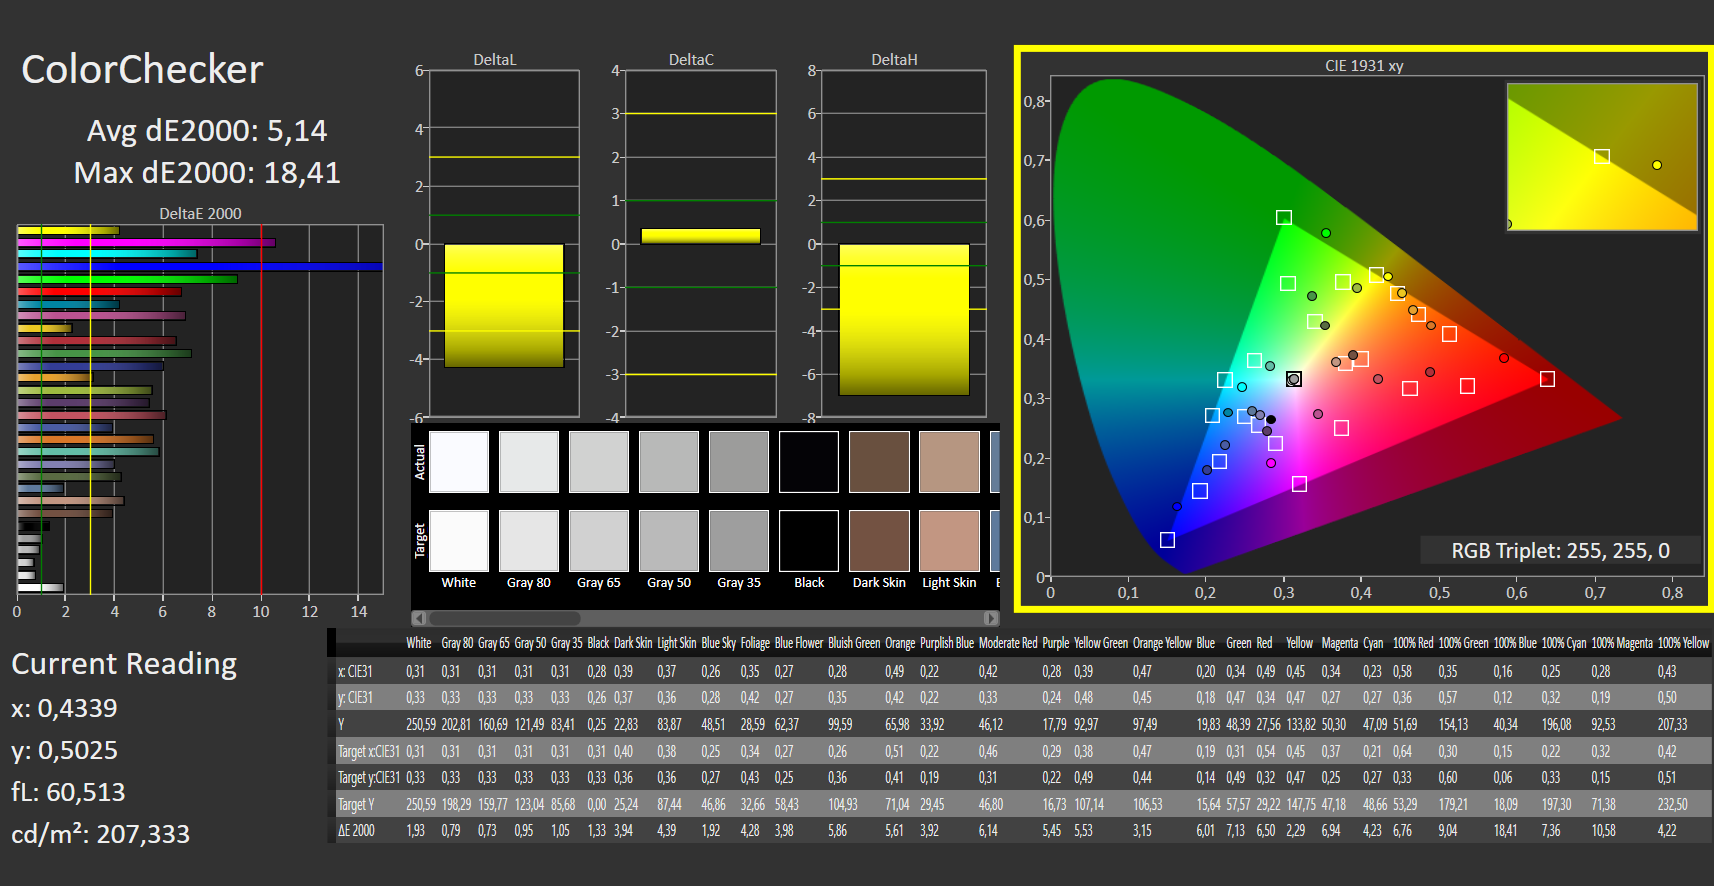
Otherwise the performance of the IPS panel from BOE is average in most of the measured values, sometimes even better than the comparison models - apart from Asus' OLED model, of course. However, the weak color space coverage and the rather large deviation in color reproduction are clear points of criticism. The display is therefore unsuitable for professional graphics and video editing - this also applies to the rest of the hardware...
| |||||||||||||||||||||||||
Brightness Distribution: 87 %
Center on Battery: 251 cd/m²
Contrast: 1091:1 (Black: 0.23 cd/m²)
ΔE ColorChecker Calman: 5.14 | ∀{0.5-29.43 Ø4.72}
ΔE Greyscale Calman: 1.08 | ∀{0.09-98 Ø4.97}
54.37% sRGB (Argyll 1.6.3 3D)
37.79% AdobeRGB 1998 (Argyll 1.6.3 3D)
37.79% AdobeRGB 1998 (Argyll 3D)
54.37% sRGB (Argyll 3D)
36.58% Display P3 (Argyll 3D)
Gamma: 2.43
CCT: 6534 K
| Dell Inspiron 15 5515-H8P8F BOE NV15N4V, IPS, 1920x1080, 15.6" | Acer Aspire 5 A515-45-R4R1 CEC PANDA LM156LF-CL13, IPS, 1920x1080, 15.6" | Asus VivoBook 15 OLED M513UA-L1282W Samsung ATNA56YX03-0, OLED, 1920x1080, 15.6" | Huawei MateBook D 15 Ryzen 5 5500U B156HAN02.8, IPS, 1920x1080, 15.6" | Dell Inspiron 15 3000 3511 BOE NV15T06, IPS, 1920x1080, 15.6" | Dell Inspiron 15 Plus Dell INSPIRON LGD06A6, IPS, 1920x1080, 15.6" | |
|---|---|---|---|---|---|---|
| Display | 4% | 138% | 16% | 9% | 74% | |
| Display P3 Coverage (%) | 36.58 | 38.09 4% | 99.9 173% | 42.3 16% | 40.1 10% | 64.1 75% |
| sRGB Coverage (%) | 54.37 | 57.3 5% | 100 84% | 63.4 17% | 58.8 8% | 92.8 71% |
| AdobeRGB 1998 Coverage (%) | 37.79 | 39.35 4% | 97.6 158% | 43.7 16% | 41.5 10% | 66.2 75% |
| Response Times | 14% | 95% | -14% | 26% | 29% | |
| Response Time Grey 50% / Grey 80% * (ms) | 44 ? | 38 ? 14% | 2 ? 95% | 51.2 ? -16% | 31.6 ? 28% | 31.6 ? 28% |
| Response Time Black / White * (ms) | 31 ? | 27 ? 13% | 2 ? 94% | 34.4 ? -11% | 24 ? 23% | 21.6 ? 30% |
| PWM Frequency (Hz) | 1250 ? | |||||
| Screen | 1% | 448% | -26% | -51% | -47% | |
| Brightness middle (cd/m²) | 251 | 229 -9% | 366 46% | 299 19% | 239.9 -4% | 298 19% |
| Brightness (cd/m²) | 241 | 224 -7% | 371 54% | 280 16% | 230 -5% | 285 18% |
| Brightness Distribution (%) | 87 | 73 -16% | 96 10% | 89 2% | 87 0% | 86 -1% |
| Black Level * (cd/m²) | 0.23 | 0.12 48% | 0.01 96% | 0.2 13% | 0.21 9% | 0.4 -74% |
| Contrast (:1) | 1091 | 1908 75% | 36600 3255% | 1495 37% | 1142 5% | 745 -32% |
| Colorchecker dE 2000 * | 5.14 | 3.76 27% | 1.9 63% | 5.2 -1% | 6.34 -23% | 3.68 28% |
| Colorchecker dE 2000 max. * | 18.41 | 5.97 68% | 4.26 77% | 20.8 -13% | 21.03 -14% | 7.39 60% |
| Greyscale dE 2000 * | 1.08 | 3.01 -179% | 1.27 -18% | 4.1 -280% | 5.1 -372% | 5.3 -391% |
| Gamma | 2.43 91% | 2.41 91% | 2.44 90% | 2.2 100% | 2.41 91% | 2.102 105% |
| CCT | 6534 99% | 6484 100% | 6338 103% | 6548 99% | 6169 105% | 6143 106% |
| Color Space (Percent of AdobeRGB 1998) (%) | 37.79 | |||||
| Color Space (Percent of sRGB) (%) | 54.37 | |||||
| Colorchecker dE 2000 calibrated * | 4.44 | 2.3 | 4.2 | 2.08 | 2.61 | |
| Total Average (Program / Settings) | 6% /
4% | 227% /
322% | -8% /
-14% | -5% /
-25% | 19% /
-7% |
* ... smaller is better

Display Response Times
| ↔ Response Time Black to White | ||
|---|---|---|
| 31 ms ... rise ↗ and fall ↘ combined | ↗ 16 ms rise |  |
| ↘ 15 ms fall | ||
| The screen shows slow response rates in our tests and will be unsatisfactory for gamers. In comparison, all tested devices range from 0.1 (minimum) to 240 (maximum) ms. » 84 % of all devices are better. This means that the measured response time is worse than the average of all tested devices (19.8 ms). | ||
| ↔ Response Time 50% Grey to 80% Grey | ||
| 44 ms ... rise ↗ and fall ↘ combined | ↗ 22 ms rise |  |
| ↘ 22 ms fall | ||
| The screen shows slow response rates in our tests and will be unsatisfactory for gamers. In comparison, all tested devices range from 0.165 (minimum) to 636 (maximum) ms. » 73 % of all devices are better. This means that the measured response time is worse than the average of all tested devices (31 ms). | ||
Screen Flickering / PWM (Pulse-Width Modulation)
| Screen flickering / PWM detected | 1250 Hz | ≤ 90 % brightness setting |  |
The display backlight flickers at 1250 Hz (worst case, e.g., utilizing PWM) Flickering detected at a brightness setting of 90 % and below. There should be no flickering or PWM above this brightness setting. The frequency of 1250 Hz is quite high, so most users sensitive to PWM should not notice any flickering. In comparison: 52 % of all tested devices do not use PWM to dim the display. If PWM was detected, an average of 7747 (minimum: 5 - maximum: 343500) Hz was measured. | |||
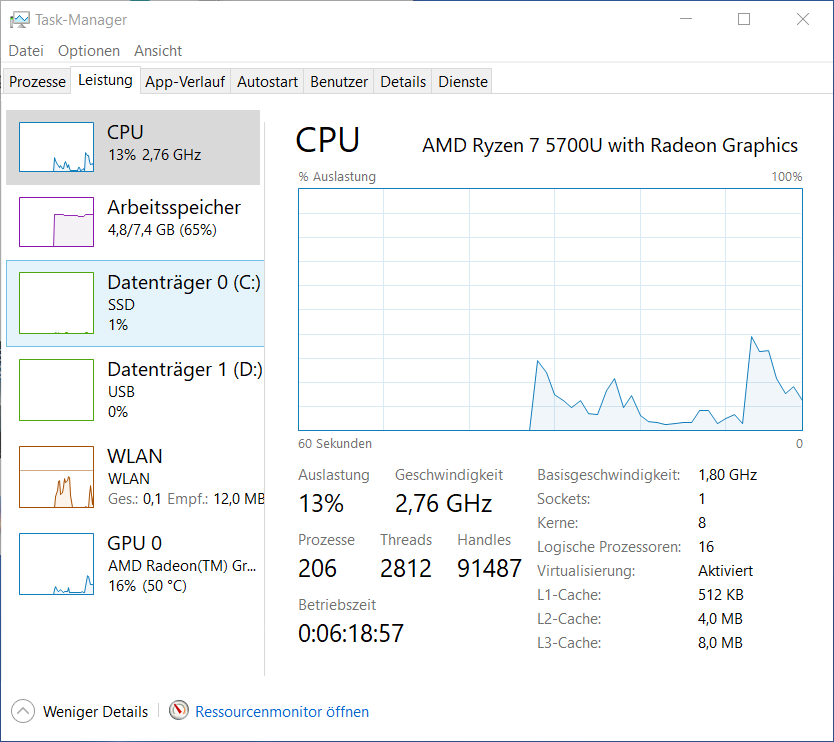
Performance: The Dell Inspiron 15 5515 wastes potential with the AMD Ryzen 7
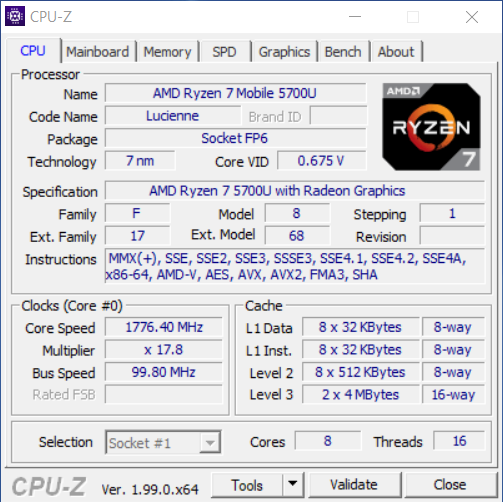
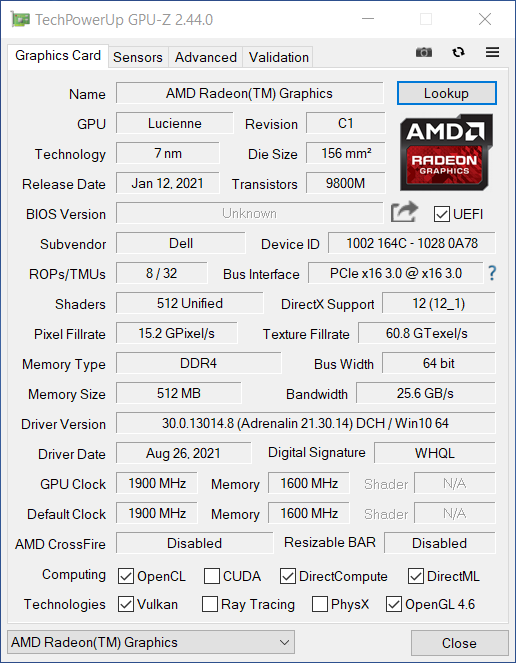
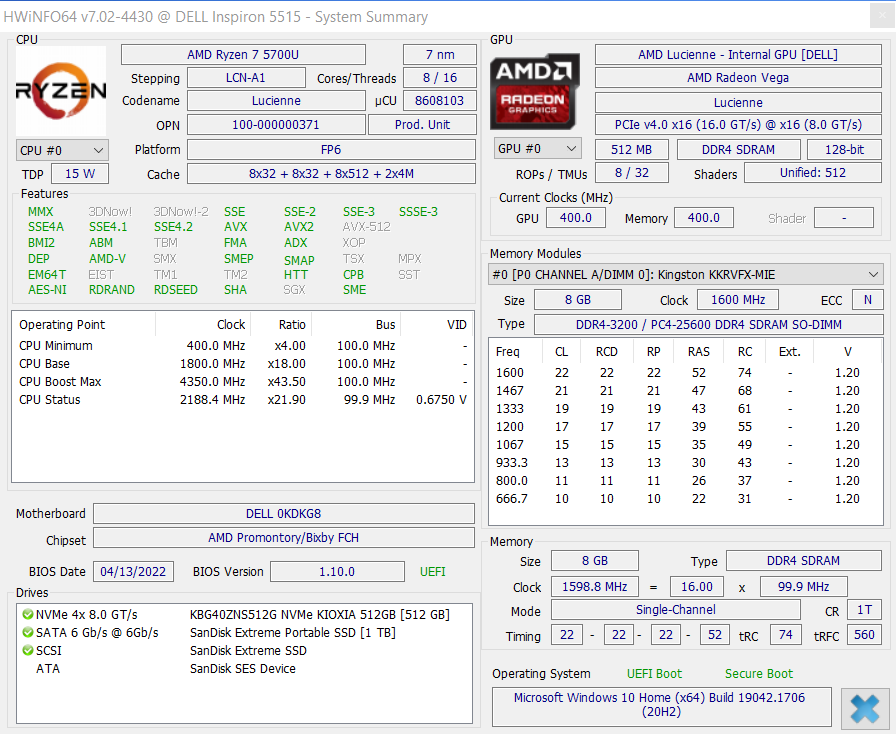
The present review sample is equipped with the AMD Ryzen 7 5700U with eight cores, the integrated AMD Radeon RX Vega 8 iGPU, 8 GB DDR4 RAM (single-channel) and a 512 GB M.2 PCIe NVMe SSD.
Alternatively, Dell also offers the Inspiron 15 with the same CPU with 16 GB of RAM and 1 TB of storage. The model series is also available with a number of other processors from AMD and Intel.
Testing Conditions
Dell provides the AMD CPU with 27 watts PL2 (Short Burst) and 11 watts PL1 (Sustained). The Dell software does not offer different performance modes. Testing was mostly carried out under the Windows performance modes "Best Performance" and "Standard" in the AMD Radeon software.
Processor
The AMD Ryzen 7 5700U octa-core CPU consists of eight Zen 2 cores, so not of the new Zen 3 architecture. The cores have a maximum clock of 4.3 GHz and a base clock of 1.8 GHz. The processor, launched in early 2021, offers 8 MB of level 3 cache.
The CPU starts very strongly in the Cinebench R15 endurance test, but then falls behind the performance of the competing models with the same CPU and even below the Huawei MateBook D 15 with the weaker AMD Ryzen 5 5500U. On the other hand, it clearly outperforms the other two Dell models.
This also reflected in the CPU's performance rating, since it has to concede defeat to the aforementioned competitors and usually ranks below the CPU average. At least in the Cinebench multi-core benchmarks, the Dell Inspiron 15 5515-H8P8F performs very well.
Cinebench R15 Multi Sustained Load
Cinebench R23: Multi Core | Single Core
Cinebench R20: CPU (Multi Core) | CPU (Single Core)
Cinebench R15: CPU Multi 64Bit | CPU Single 64Bit
Blender: v2.79 BMW27 CPU
7-Zip 18.03: 7z b 4 | 7z b 4 -mmt1
Geekbench 5.5: Multi-Core | Single-Core
HWBOT x265 Benchmark v2.2: 4k Preset
LibreOffice : 20 Documents To PDF
R Benchmark 2.5: Overall mean
| CPU Performance rating | |
| Average of class Office | |
| Asus VivoBook 15 OLED M513UA-L1282W | |
| Average AMD Ryzen 7 5700U | |
| Dell Inspiron 15 Plus | |
| Acer Aspire 5 A515-45-R4R1 | |
| Huawei MateBook D 15 Ryzen 5 5500U | |
| Dell Inspiron 15 5515-H8P8F | |
| Dell Inspiron 15 3000 3511 | |
| Cinebench R23 / Multi Core | |
| Average of class Office (1673 - 22808, n=74, last 2 years) | |
| Dell Inspiron 15 5515-H8P8F | |
| Asus VivoBook 15 OLED M513UA-L1282W | |
| Average AMD Ryzen 7 5700U (4861 - 10139, n=20) | |
| Acer Aspire 5 A515-45-R4R1 | |
| Dell Inspiron 15 Plus | |
| Huawei MateBook D 15 Ryzen 5 5500U | |
| Dell Inspiron 15 3000 3511 | |
| Cinebench R23 / Single Core | |
| Average of class Office (708 - 2130, n=74, last 2 years) | |
| Dell Inspiron 15 Plus | |
| Dell Inspiron 15 3000 3511 | |
| Acer Aspire 5 A515-45-R4R1 | |
| Asus VivoBook 15 OLED M513UA-L1282W | |
| Average AMD Ryzen 7 5700U (1177 - 1268, n=20) | |
| Huawei MateBook D 15 Ryzen 5 5500U | |
| Dell Inspiron 15 5515-H8P8F | |
| Cinebench R20 / CPU (Multi Core) | |
| Average of class Office (648 - 8840, n=73, last 2 years) | |
| Asus VivoBook 15 OLED M513UA-L1282W | |
| Dell Inspiron 15 5515-H8P8F | |
| Average AMD Ryzen 7 5700U (1887 - 3877, n=21) | |
| Acer Aspire 5 A515-45-R4R1 | |
| Huawei MateBook D 15 Ryzen 5 5500U | |
| Dell Inspiron 15 Plus | |
| Dell Inspiron 15 3000 3511 | |
| Cinebench R20 / CPU (Single Core) | |
| Average of class Office (345 - 816, n=73, last 2 years) | |
| Dell Inspiron 15 Plus | |
| Dell Inspiron 15 3000 3511 | |
| Acer Aspire 5 A515-45-R4R1 | |
| Dell Inspiron 15 5515-H8P8F | |
| Asus VivoBook 15 OLED M513UA-L1282W | |
| Average AMD Ryzen 7 5700U (471 - 495, n=21) | |
| Huawei MateBook D 15 Ryzen 5 5500U | |
| Cinebench R15 / CPU Multi 64Bit | |
| Average of class Office (250 - 3380, n=75, last 2 years) | |
| Dell Inspiron 15 5515-H8P8F | |
| Asus VivoBook 15 OLED M513UA-L1282W | |
| Average AMD Ryzen 7 5700U (856 - 1691, n=20) | |
| Acer Aspire 5 A515-45-R4R1 | |
| Huawei MateBook D 15 Ryzen 5 5500U | |
| Dell Inspiron 15 Plus | |
| Dell Inspiron 15 3000 3511 | |
| Cinebench R15 / CPU Single 64Bit | |
| Average of class Office (99.5 - 313, n=75, last 2 years) | |
| Dell Inspiron 15 Plus | |
| Acer Aspire 5 A515-45-R4R1 | |
| Dell Inspiron 15 5515-H8P8F | |
| Average AMD Ryzen 7 5700U (181 - 190, n=19) | |
| Asus VivoBook 15 OLED M513UA-L1282W | |
| Dell Inspiron 15 3000 3511 | |
| Huawei MateBook D 15 Ryzen 5 5500U | |
| Blender / v2.79 BMW27 CPU | |
| Dell Inspiron 15 3000 3511 | |
| Dell Inspiron 15 Plus | |
| Acer Aspire 5 A515-45-R4R1 | |
| Huawei MateBook D 15 Ryzen 5 5500U | |
| Dell Inspiron 15 5515-H8P8F | |
| Average AMD Ryzen 7 5700U (292 - 557, n=20) | |
| Average of class Office (158 - 1940, n=74, last 2 years) | |
| Asus VivoBook 15 OLED M513UA-L1282W | |
| 7-Zip 18.03 / 7z b 4 | |
| Average of class Office (7098 - 76886, n=75, last 2 years) | |
| Asus VivoBook 15 OLED M513UA-L1282W | |
| Average AMD Ryzen 7 5700U (29095 - 47501, n=20) | |
| Huawei MateBook D 15 Ryzen 5 5500U | |
| Acer Aspire 5 A515-45-R4R1 | |
| Dell Inspiron 15 5515-H8P8F | |
| Dell Inspiron 15 Plus | |
| Dell Inspiron 15 3000 3511 | |
| 7-Zip 18.03 / 7z b 4 -mmt1 | |
| Average of class Office (3387 - 6469, n=75, last 2 years) | |
| Dell Inspiron 15 Plus | |
| Acer Aspire 5 A515-45-R4R1 | |
| Asus VivoBook 15 OLED M513UA-L1282W | |
| Average AMD Ryzen 7 5700U (4402 - 4620, n=20) | |
| Dell Inspiron 15 5515-H8P8F | |
| Dell Inspiron 15 3000 3511 | |
| Huawei MateBook D 15 Ryzen 5 5500U | |
| Geekbench 5.5 / Multi-Core | |
| Average of class Office (1483 - 16999, n=71, last 2 years) | |
| Asus VivoBook 15 OLED M513UA-L1282W | |
| Average AMD Ryzen 7 5700U (4254 - 7635, n=19) | |
| Huawei MateBook D 15 Ryzen 5 5500U | |
| Acer Aspire 5 A515-45-R4R1 | |
| Dell Inspiron 15 Plus | |
| Dell Inspiron 15 5515-H8P8F | |
| Dell Inspiron 15 3000 3511 | |
| Geekbench 5.5 / Single-Core | |
| Average of class Office (811 - 2148, n=71, last 2 years) | |
| Dell Inspiron 15 Plus | |
| Asus VivoBook 15 OLED M513UA-L1282W | |
| Acer Aspire 5 A515-45-R4R1 | |
| Average AMD Ryzen 7 5700U (1105 - 1205, n=19) | |
| Dell Inspiron 15 3000 3511 | |
| Dell Inspiron 15 5515-H8P8F | |
| Huawei MateBook D 15 Ryzen 5 5500U | |
| HWBOT x265 Benchmark v2.2 / 4k Preset | |
| Average of class Office (2.21 - 26, n=74, last 2 years) | |
| Asus VivoBook 15 OLED M513UA-L1282W | |
| Average AMD Ryzen 7 5700U (6.08 - 12.1, n=20) | |
| Huawei MateBook D 15 Ryzen 5 5500U | |
| Acer Aspire 5 A515-45-R4R1 | |
| Dell Inspiron 15 Plus | |
| Dell Inspiron 15 5515-H8P8F | |
| Dell Inspiron 15 3000 3511 | |
| LibreOffice / 20 Documents To PDF | |
| Huawei MateBook D 15 Ryzen 5 5500U | |
| Dell Inspiron 15 5515-H8P8F | |
| Average AMD Ryzen 7 5700U (52.4 - 75.5, n=20) | |
| Dell Inspiron 15 3000 3511 | |
| Acer Aspire 5 A515-45-R4R1 | |
| Asus VivoBook 15 OLED M513UA-L1282W | |
| Average of class Office (39.9 - 102.3, n=74, last 2 years) | |
| Dell Inspiron 15 Plus | |
| R Benchmark 2.5 / Overall mean | |
| Dell Inspiron 15 3000 3511 | |
| Dell Inspiron 15 5515-H8P8F | |
| Huawei MateBook D 15 Ryzen 5 5500U | |
| Dell Inspiron 15 Plus | |
| Acer Aspire 5 A515-45-R4R1 | |
| Average AMD Ryzen 7 5700U (0.567 - 0.641, n=20) | |
| Asus VivoBook 15 OLED M513UA-L1282W | |
| Average of class Office (0.4047 - 0.888, n=74, last 2 years) | |
* ... smaller is better
AIDA64: FP32 Ray-Trace | FPU Julia | CPU SHA3 | CPU Queen | FPU SinJulia | FPU Mandel | CPU AES | CPU ZLib | FP64 Ray-Trace | CPU PhotoWorxx
| Performance rating | |
| Average of class Office | |
| Asus VivoBook 15 OLED M513UA-L1282W | |
| Average AMD Ryzen 7 5700U | |
| Dell Inspiron 15 5515-H8P8F | |
| Huawei MateBook D 15 Ryzen 5 5500U | |
| Dell Inspiron 15 Plus | |
| Acer Aspire 5 A515-45-R4R1 | |
| Dell Inspiron 15 3000 3511 | |
| AIDA64 / FP32 Ray-Trace | |
| Average of class Office (2083 - 31245, n=81, last 2 years) | |
| Asus VivoBook 15 OLED M513UA-L1282W | |
| Dell Inspiron 15 5515-H8P8F | |
| Average AMD Ryzen 7 5700U (5679 - 12346, n=20) | |
| Dell Inspiron 15 Plus | |
| Huawei MateBook D 15 Ryzen 5 5500U | |
| Dell Inspiron 15 3000 3511 | |
| Acer Aspire 5 A515-45-R4R1 | |
| AIDA64 / FPU Julia | |
| Average of class Office (8191 - 125394, n=81, last 2 years) | |
| Asus VivoBook 15 OLED M513UA-L1282W | |
| Dell Inspiron 15 5515-H8P8F | |
| Average AMD Ryzen 7 5700U (39042 - 69580, n=20) | |
| Acer Aspire 5 A515-45-R4R1 | |
| Huawei MateBook D 15 Ryzen 5 5500U | |
| Dell Inspiron 15 Plus | |
| Dell Inspiron 15 3000 3511 | |
| AIDA64 / CPU SHA3 | |
| Average of class Office (433 - 5755, n=81, last 2 years) | |
| Dell Inspiron 15 Plus | |
| Asus VivoBook 15 OLED M513UA-L1282W | |
| Dell Inspiron 15 5515-H8P8F | |
| Average AMD Ryzen 7 5700U (1103 - 2231, n=20) | |
| Dell Inspiron 15 3000 3511 | |
| Huawei MateBook D 15 Ryzen 5 5500U | |
| Acer Aspire 5 A515-45-R4R1 | |
| AIDA64 / CPU Queen | |
| Asus VivoBook 15 OLED M513UA-L1282W | |
| Dell Inspiron 15 5515-H8P8F | |
| Average AMD Ryzen 7 5700U (57016 - 99178, n=20) | |
| Huawei MateBook D 15 Ryzen 5 5500U | |
| Dell Inspiron 15 Plus | |
| Average of class Office (22784 - 115197, n=67, last 2 years) | |
| Acer Aspire 5 A515-45-R4R1 | |
| Dell Inspiron 15 3000 3511 | |
| AIDA64 / FPU SinJulia | |
| Asus VivoBook 15 OLED M513UA-L1282W | |
| Dell Inspiron 15 5515-H8P8F | |
| Average AMD Ryzen 7 5700U (6837 - 14169, n=20) | |
| Huawei MateBook D 15 Ryzen 5 5500U | |
| Average of class Office (1378 - 18321, n=81, last 2 years) | |
| Dell Inspiron 15 Plus | |
| Acer Aspire 5 A515-45-R4R1 | |
| Dell Inspiron 15 3000 3511 | |
| AIDA64 / FPU Mandel | |
| Average of class Office (4601 - 66922, n=81, last 2 years) | |
| Asus VivoBook 15 OLED M513UA-L1282W | |
| Dell Inspiron 15 5515-H8P8F | |
| Average AMD Ryzen 7 5700U (20179 - 36523, n=20) | |
| Acer Aspire 5 A515-45-R4R1 | |
| Huawei MateBook D 15 Ryzen 5 5500U | |
| Dell Inspiron 15 Plus | |
| Dell Inspiron 15 3000 3511 | |
| AIDA64 / CPU AES | |
| Dell Inspiron 15 Plus | |
| Dell Inspiron 15 3000 3511 | |
| Asus VivoBook 15 OLED M513UA-L1282W | |
| Dell Inspiron 15 5515-H8P8F | |
| Average AMD Ryzen 7 5700U (26066 - 64646, n=20) | |
| Average of class Office (4854 - 155900, n=81, last 2 years) | |
| Huawei MateBook D 15 Ryzen 5 5500U | |
| Acer Aspire 5 A515-45-R4R1 | |
| AIDA64 / CPU ZLib | |
| Average of class Office (114.6 - 1366, n=81, last 2 years) | |
| Asus VivoBook 15 OLED M513UA-L1282W | |
| Dell Inspiron 15 5515-H8P8F | |
| Average AMD Ryzen 7 5700U (440 - 776, n=20) | |
| Acer Aspire 5 A515-45-R4R1 | |
| Huawei MateBook D 15 Ryzen 5 5500U | |
| Dell Inspiron 15 Plus | |
| Dell Inspiron 15 3000 3511 | |
| AIDA64 / FP64 Ray-Trace | |
| Average of class Office (1109 - 17834, n=81, last 2 years) | |
| Asus VivoBook 15 OLED M513UA-L1282W | |
| Dell Inspiron 15 5515-H8P8F | |
| Average AMD Ryzen 7 5700U (2985 - 6784, n=20) | |
| Dell Inspiron 15 Plus | |
| Huawei MateBook D 15 Ryzen 5 5500U | |
| Dell Inspiron 15 3000 3511 | |
| Acer Aspire 5 A515-45-R4R1 | |
| AIDA64 / CPU PhotoWorxx | |
| Average of class Office (11090 - 65229, n=81, last 2 years) | |
| Huawei MateBook D 15 Ryzen 5 5500U | |
| Average AMD Ryzen 7 5700U (6903 - 25066, n=20) | |
| Asus VivoBook 15 OLED M513UA-L1282W | |
| Acer Aspire 5 A515-45-R4R1 | |
| Dell Inspiron 15 3000 3511 | |
| Dell Inspiron 15 Plus | |
| Dell Inspiron 15 5515-H8P8F | |
System Performance
The fact that the Dell Inspiron 15 5515 does not exhaust the potential of its CPU can also be seen in the system benchmarks. Coupled with a manageable amount of RAM as well as a rather slow SSD, the result is only a midfield ranking in the end - and again behind the aforementioned contenders with 5700U/5500U CPUs from AMD. This is not even enough for a consistent ranking above the office average. Nevertheless, solid work with common applications is possible for this device class, such as office applications and the like.
CrossMark: Overall | Productivity | Creativity | Responsiveness
| PCMark 10 / Score | |
| Average of class Office (2601 - 9298, n=66, last 2 years) | |
| Asus VivoBook 15 OLED M513UA-L1282W | |
| Average AMD Ryzen 7 5700U, AMD Radeon RX Vega 8 (Ryzen 4000/5000) (4325 - 5518, n=15) | |
| Dell Inspiron 15 Plus | |
| Huawei MateBook D 15 Ryzen 5 5500U | |
| Acer Aspire 5 A515-45-R4R1 | |
| Dell Inspiron 15 5515-H8P8F | |
| Dell Inspiron 15 3000 3511 | |
| PCMark 10 / Essentials | |
| Average of class Office (3245 - 11594, n=66, last 2 years) | |
| Asus VivoBook 15 OLED M513UA-L1282W | |
| Average AMD Ryzen 7 5700U, AMD Radeon RX Vega 8 (Ryzen 4000/5000) (8025 - 10091, n=15) | |
| Huawei MateBook D 15 Ryzen 5 5500U | |
| Acer Aspire 5 A515-45-R4R1 | |
| Dell Inspiron 15 3000 3511 | |
| Dell Inspiron 15 Plus | |
| Dell Inspiron 15 5515-H8P8F | |
| PCMark 10 / Productivity | |
| Average of class Office (5336 - 17243, n=66, last 2 years) | |
| Dell Inspiron 15 Plus | |
| Asus VivoBook 15 OLED M513UA-L1282W | |
| Average AMD Ryzen 7 5700U, AMD Radeon RX Vega 8 (Ryzen 4000/5000) (7001 - 8457, n=15) | |
| Acer Aspire 5 A515-45-R4R1 | |
| Dell Inspiron 15 5515-H8P8F | |
| Huawei MateBook D 15 Ryzen 5 5500U | |
| Dell Inspiron 15 3000 3511 | |
| PCMark 10 / Digital Content Creation | |
| Average of class Office (2049 - 13541, n=66, last 2 years) | |
| Asus VivoBook 15 OLED M513UA-L1282W | |
| Huawei MateBook D 15 Ryzen 5 5500U | |
| Dell Inspiron 15 Plus | |
| Average AMD Ryzen 7 5700U, AMD Radeon RX Vega 8 (Ryzen 4000/5000) (3738 - 5964, n=15) | |
| Dell Inspiron 15 3000 3511 | |
| Dell Inspiron 15 5515-H8P8F | |
| Acer Aspire 5 A515-45-R4R1 | |
| CrossMark / Overall | |
| Average of class Office (381 - 2010, n=73, last 2 years) | |
| Asus VivoBook 15 OLED M513UA-L1282W | |
| Huawei MateBook D 15 Ryzen 5 5500U | |
| Average AMD Ryzen 7 5700U, AMD Radeon RX Vega 8 (Ryzen 4000/5000) (866 - 1183, n=8) | |
| Dell Inspiron 15 5515-H8P8F | |
| CrossMark / Productivity | |
| Average of class Office (464 - 1880, n=73, last 2 years) | |
| Asus VivoBook 15 OLED M513UA-L1282W | |
| Huawei MateBook D 15 Ryzen 5 5500U | |
| Average AMD Ryzen 7 5700U, AMD Radeon RX Vega 8 (Ryzen 4000/5000) (931 - 1191, n=8) | |
| Dell Inspiron 15 5515-H8P8F | |
| CrossMark / Creativity | |
| Average of class Office (319 - 2361, n=73, last 2 years) | |
| Asus VivoBook 15 OLED M513UA-L1282W | |
| Huawei MateBook D 15 Ryzen 5 5500U | |
| Average AMD Ryzen 7 5700U, AMD Radeon RX Vega 8 (Ryzen 4000/5000) (907 - 1197, n=8) | |
| Dell Inspiron 15 5515-H8P8F | |
| CrossMark / Responsiveness | |
| Average of class Office (360 - 1820, n=73, last 2 years) | |
| Asus VivoBook 15 OLED M513UA-L1282W | |
| Huawei MateBook D 15 Ryzen 5 5500U | |
| Average AMD Ryzen 7 5700U, AMD Radeon RX Vega 8 (Ryzen 4000/5000) (605 - 1159, n=8) | |
| Dell Inspiron 15 5515-H8P8F | |
| PCMark 8 Home Score Accelerated v2 | 3927 points | |
| PCMark 8 Creative Score Accelerated v2 | 5088 points | |
| PCMark 8 Work Score Accelerated v2 | 5242 points | |
| PCMark 10 Score | 4775 points | |
Help | ||
| AIDA64 / Memory Copy | |
| Average of class Office (20075 - 110930, n=78, last 2 years) | |
| Asus VivoBook 15 OLED M513UA-L1282W | |
| Huawei MateBook D 15 Ryzen 5 5500U | |
| Average AMD Ryzen 7 5700U (15867 - 39326, n=20) | |
| Acer Aspire 5 A515-45-R4R1 | |
| Dell Inspiron 15 Plus | |
| Dell Inspiron 15 3000 3511 | |
| Dell Inspiron 15 5515-H8P8F | |
| AIDA64 / Memory Read | |
| Average of class Office (10084 - 128030, n=79, last 2 years) | |
| Asus VivoBook 15 OLED M513UA-L1282W | |
| Average AMD Ryzen 7 5700U (17632 - 47190, n=20) | |
| Huawei MateBook D 15 Ryzen 5 5500U | |
| Acer Aspire 5 A515-45-R4R1 | |
| Dell Inspiron 15 Plus | |
| Dell Inspiron 15 3000 3511 | |
| Dell Inspiron 15 5515-H8P8F | |
| AIDA64 / Memory Write | |
| Average of class Office (20073 - 119858, n=79, last 2 years) | |
| Asus VivoBook 15 OLED M513UA-L1282W | |
| Average AMD Ryzen 7 5700U (11554 - 47048, n=20) | |
| Huawei MateBook D 15 Ryzen 5 5500U | |
| Acer Aspire 5 A515-45-R4R1 | |
| Dell Inspiron 15 Plus | |
| Dell Inspiron 15 3000 3511 | |
| Dell Inspiron 15 5515-H8P8F | |
| AIDA64 / Memory Latency | |
| Average of class Office (7.6 - 162.9, n=74, last 2 years) | |
| Dell Inspiron 15 5515-H8P8F | |
| Average AMD Ryzen 7 5700U (84.9 - 113, n=20) | |
| Dell Inspiron 15 3000 3511 | |
| Huawei MateBook D 15 Ryzen 5 5500U | |
| Asus VivoBook 15 OLED M513UA-L1282W | |
| Dell Inspiron 15 Plus | |
| Acer Aspire 5 A515-45-R4R1 | |
* ... smaller is better
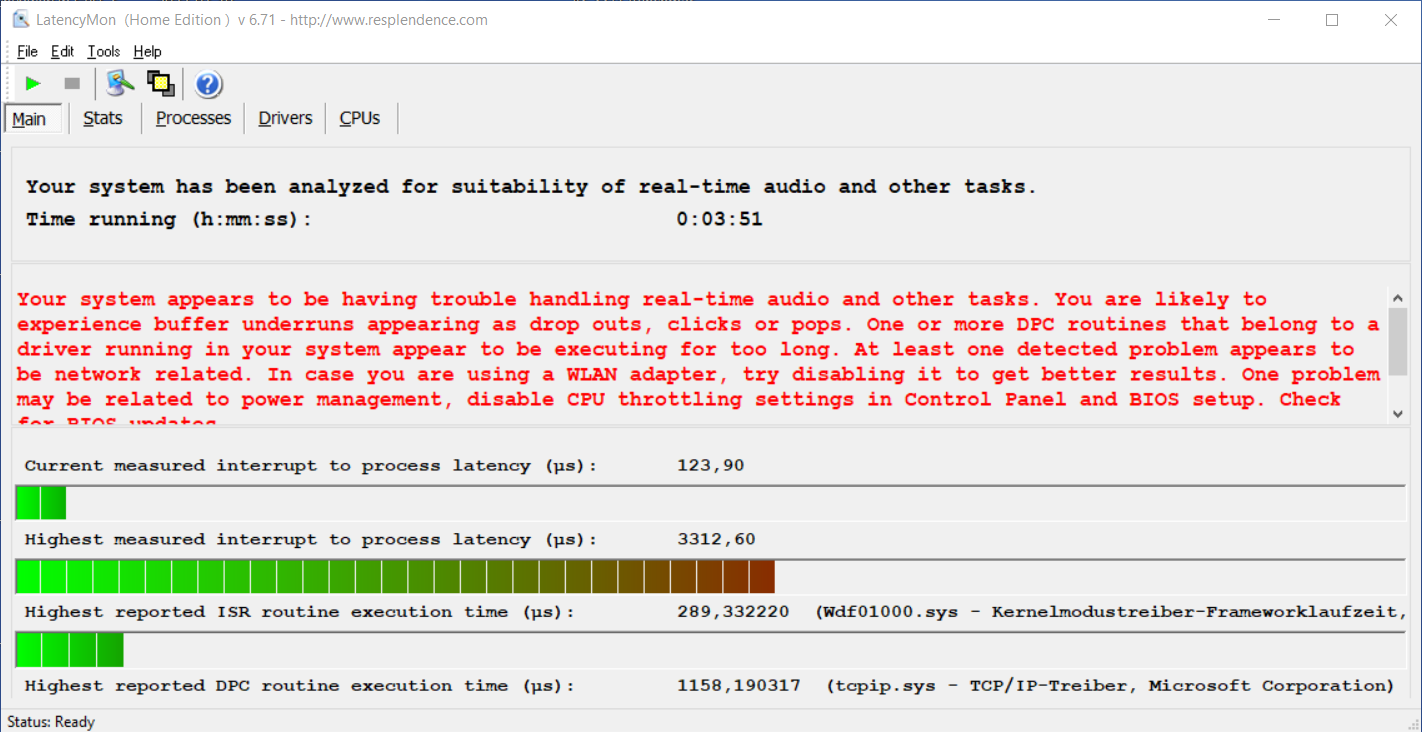
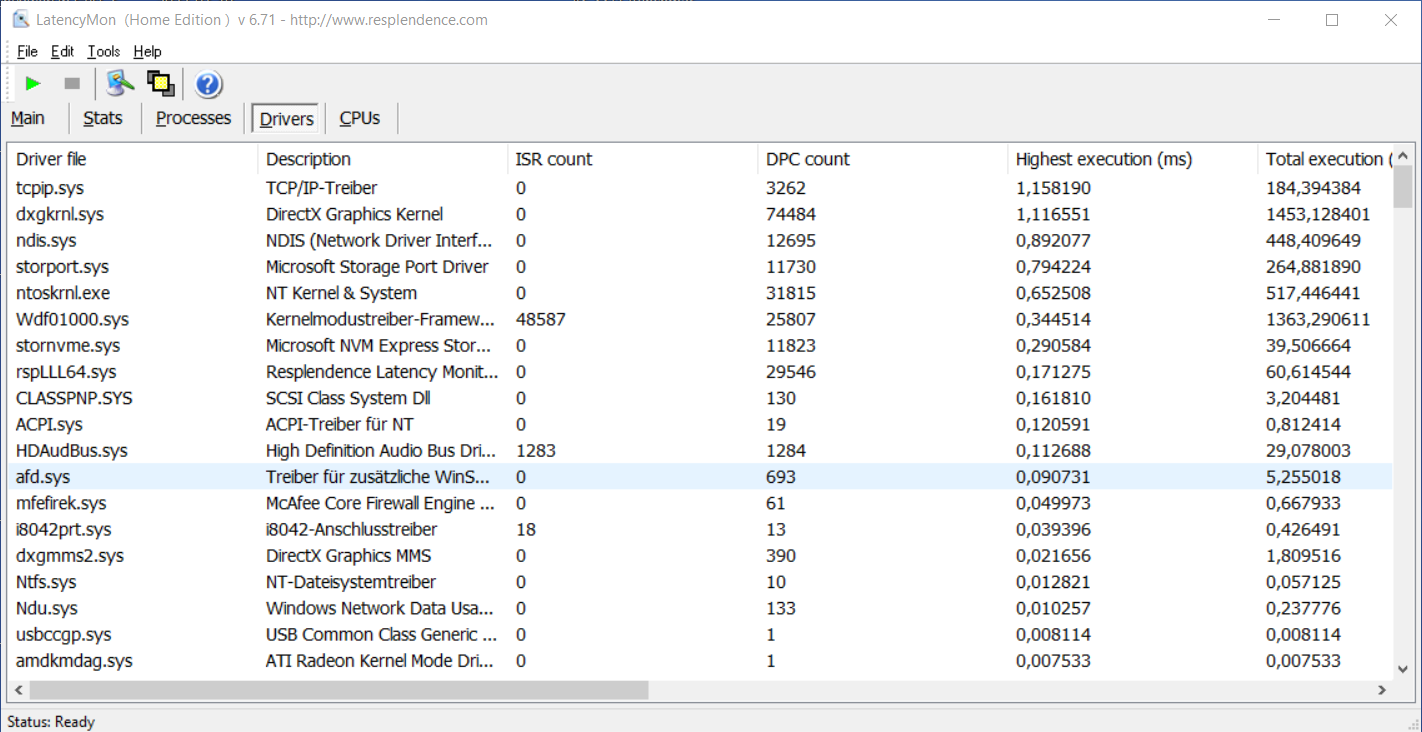
DPC Latency
Under testing, the Dell Inspiron 15 5515 revealed quite high latencies. Although this is only a snapshot, it can be taken as an indication of possible problems in real-time audio and video editing.
| DPC Latencies / LatencyMon - interrupt to process latency (max), Web, Youtube, Prime95 | |
| Dell Inspiron 15 3000 3511 | |
| Dell Inspiron 15 5515-H8P8F | |
| Acer Aspire 5 A515-45-R4R1 | |
| Dell Inspiron 15 Plus | |
| Huawei MateBook D 15 Ryzen 5 5500U | |
| Asus VivoBook 15 OLED M513UA-L1282W | |
* ... smaller is better
Storage Devices
As already briefly mentioned, Dell did not do itself any favors by choosing the SSD from Toshiba, which reveals significant weaknesses in performance values and often lags behind the field - especially in the endurance test (i.e. Sustained Performance Read).

* ... smaller is better
Sustained Performance Read: DiskSpd Read Loop, Queue Depth 8
Graphics Card
A dedicated graphics solution cannot be expected in this price range and does not make sense for such an office model. The AMD Radeon RX Vega 8 iGPU provides sufficient performance for normal operation, even if, as in the case of the CPU, it clearly lags behind the competition as well as its own GPU average. Dell wastes further potential here.
The laptop's gaming qualities are not worth mentioning, since even older games hardly run smoothly on the worst graphics settings. At least the low performance hardly drops in battery mode and remains almost stable at 3,407 points in 3DMark 11.
| 3DMark 11 Performance | 3353 points | |
| 3DMark Cloud Gate Standard Score | 13147 points | |
| 3DMark Fire Strike Score | 1572 points | |
| 3DMark Time Spy Score | 620 points | |
Help | ||
Witcher 3 FPS Chart
| low | med. | high | ultra | |
|---|---|---|---|---|
| The Witcher 3 (2015) | 27.2 | 19.6 | 8.7 | 7.07 |
| Dota 2 Reborn (2015) | 67.9 | 49.9 | 25.5 | 23.3 |
| X-Plane 11.11 (2018) | 26.9 | 21.1 | 19.1 |
Emissions & Energy Management: Pleasantly quiet and enduring Dell laptop
System Noise
The Dell Inspiron 15 5515 is silent in idle mode. Under load, the installed fan revs up to a maximum of 40 dB(A). This is audible, but not particularly annoying, especially since the noise is constant and does not fluctuate. Almost all other comparison devices are louder in operation. We did not detect any other kind of noise from the Dell Inspiron 15 5515-H8P8F.
Noise level
| Idle |
| 25.4 / 25.4 / 25.4 dB(A) |
| Load |
| 34 / 40 dB(A) |
 | ||
30 dB silent 40 dB(A) audible 50 dB(A) loud |
||
min: | ||
| Dell Inspiron 15 5515-H8P8F Vega 8, R7 5700U, Toshiba KBG40ZNS512G NVMe | Acer Aspire 5 A515-45-R4R1 Vega 8, R7 5700U, Micron 2210 MTFDHBA512QFD | Asus VivoBook 15 OLED M513UA-L1282W Vega 8, R7 5700U, Intel SSD 670p SSDPEKNU512GZ | Huawei MateBook D 15 Ryzen 5 5500U Vega 7, R5 5500U, Phison PS5013 311CD0512GB | Dell Inspiron 15 3000 3511 Iris Xe G7 80EUs, i5-1135G7, SK Hynix BC711 HFM256GD3GX013N | Dell Inspiron 15 Plus GeForce RTX 3050 4GB Laptop GPU, i5-11400H, Micron 2450 512GB MTFDKBA512TFK | |
|---|---|---|---|---|---|---|
| Noise | -4% | -6% | -2% | 11% | -16% | |
| off / environment * (dB) | 25.4 | 25 2% | 26 -2% | 24.1 5% | 23.2 9% | 26 -2% |
| Idle Minimum * (dB) | 25.4 | 25 2% | 26 -2% | 24.1 5% | 23.3 8% | 26 -2% |
| Idle Average * (dB) | 25.4 | 25 2% | 26 -2% | 24.1 5% | 23.3 8% | 28 -10% |
| Idle Maximum * (dB) | 25.4 | 29.5 -16% | 26.2 -3% | 28 -10% | 23.3 8% | 32 -26% |
| Load Average * (dB) | 34 | 38.6 -14% | 41.4 -22% | 35.9 -6% | 23.3 31% | 47 -38% |
| Load Maximum * (dB) | 40 | 38.6 3% | 41.4 -3% | 43.9 -10% | 39.2 2% | 48 -20% |
| Witcher 3 ultra * (dB) | 35.9 | 31.5 | 46 |
* ... smaller is better
Temperature
The fact that Dell does not fully utilize the CPU has a negative impact on performance, but should be positive for temperature development. However, this is only conditionally true. The Acer Aspire 5 A515 with the same CPU stays cooler, for example. Under load, the Dell laptop heats up to 33 °C on average, with only the area in the front center of the display bordering on the critical range. The device reaches around 30 °C in idle mode - quite warm, but not too hot.
(+) The maximum temperature on the upper side is 39.4 °C / 103 F, compared to the average of 34.3 °C / 94 F, ranging from 21.2 to 62.5 °C for the class Office.
(-) The bottom heats up to a maximum of 45.4 °C / 114 F, compared to the average of 36.8 °C / 98 F
(+) In idle usage, the average temperature for the upper side is 29.5 °C / 85 F, compared to the device average of 29.5 °C / 85 F.
(+) The palmrests and touchpad are cooler than skin temperature with a maximum of 29.4 °C / 84.9 F and are therefore cool to the touch.
(±) The average temperature of the palmrest area of similar devices was 27.5 °C / 81.5 F (-1.9 °C / -3.4 F).
| Dell Inspiron 15 5515-H8P8F AMD Ryzen 7 5700U, AMD Radeon RX Vega 8 (Ryzen 4000/5000) | Acer Aspire 5 A515-45-R4R1 AMD Ryzen 7 5700U, AMD Radeon RX Vega 8 (Ryzen 4000/5000) | Asus VivoBook 15 OLED M513UA-L1282W AMD Ryzen 7 5700U, AMD Radeon RX Vega 8 (Ryzen 4000/5000) | Huawei MateBook D 15 Ryzen 5 5500U AMD Ryzen 5 5500U, AMD Radeon RX Vega 7 | Dell Inspiron 15 3000 3511 Intel Core i5-1135G7, Intel Iris Xe Graphics G7 80EUs | Dell Inspiron 15 Plus Intel Core i5-11400H, NVIDIA GeForce RTX 3050 4GB Laptop GPU | |
|---|---|---|---|---|---|---|
| Heat | 6% | 2% | 12% | 3% | -14% | |
| Maximum Upper Side * (°C) | 39.4 | 40 -2% | 39.6 -1% | 40.6 -3% | 37.8 4% | 50 -27% |
| Maximum Bottom * (°C) | 45.4 | 42.8 6% | 48.4 -7% | 43.9 3% | 55.6 -22% | 51 -12% |
| Idle Upper Side * (°C) | 33.2 | 32.4 2% | 30.9 7% | 25.6 23% | 26.2 21% | 38 -14% |
| Idle Bottom * (°C) | 35.1 | 29.4 16% | 32.3 8% | 26.2 25% | 32 9% | 36 -3% |
* ... smaller is better
Speakers
The installed stereo speakers deliver a solid result, but lack bass. Overall, the reproduction is quite linear and balanced, although not particularly loud at just under 82 dB.
Dell Inspiron 15 5515-H8P8F audio analysis
(±) | speaker loudness is average but good (81.7 dB)
Bass 100 - 315 Hz
(-) | nearly no bass - on average 21.6% lower than median
(±) | linearity of bass is average (13.9% delta to prev. frequency)
Mids 400 - 2000 Hz
(+) | balanced mids - only 1.5% away from median
(+) | mids are linear (3.8% delta to prev. frequency)
Highs 2 - 16 kHz
(±) | higher highs - on average 7% higher than median
(+) | highs are linear (6.8% delta to prev. frequency)
Overall 100 - 16.000 Hz
(±) | linearity of overall sound is average (18% difference to median)
Compared to same class
» 30% of all tested devices in this class were better, 7% similar, 63% worse
» The best had a delta of 7%, average was 21%, worst was 53%
Compared to all devices tested
» 38% of all tested devices were better, 8% similar, 54% worse
» The best had a delta of 4%, average was 23%, worst was 134%
Apple MacBook Pro 16 2021 M1 Pro audio analysis
(+) | speakers can play relatively loud (84.7 dB)
Bass 100 - 315 Hz
(+) | good bass - only 3.8% away from median
(+) | bass is linear (5.2% delta to prev. frequency)
Mids 400 - 2000 Hz
(+) | balanced mids - only 1.3% away from median
(+) | mids are linear (2.1% delta to prev. frequency)
Highs 2 - 16 kHz
(+) | balanced highs - only 1.9% away from median
(+) | highs are linear (2.7% delta to prev. frequency)
Overall 100 - 16.000 Hz
(+) | overall sound is linear (4.6% difference to median)
Compared to same class
» 0% of all tested devices in this class were better, 0% similar, 100% worse
» The best had a delta of 5%, average was 17%, worst was 45%
Compared to all devices tested
» 0% of all tested devices were better, 0% similar, 100% worse
» The best had a delta of 4%, average was 23%, worst was 134%
Power Consumption
Dell provides an adequately sized power supply of 65 watts with the Inspiron 15 5515. The device consumes up to 54 watts under load and a maximum of 8 watts in idle mode. In the stress test, the power consumption drops over time due to the lowered performance.
| Off / Standby | |
| Idle | |
| Load |
|
Key:
min: | |
Power consumption Witcher 3 / Stress test
Power consumption with an external monitor
Battery Life
Among the comparison models, the Dell notebook proves to be an marathon runner under testing. This is mainly thanks to the comparatively larger battery: Ten hours and more of surfing or media consumption are handled with ease. Even under load, the device lasts almost 2.5 hours - also thanks to the low power development.
| Dell Inspiron 15 5515-H8P8F R7 5700U, Vega 8, 54 Wh | Acer Aspire 5 A515-45-R4R1 R7 5700U, Vega 8, 48 Wh | Asus VivoBook 15 OLED M513UA-L1282W R7 5700U, Vega 8, 42 Wh | Huawei MateBook D 15 Ryzen 5 5500U R5 5500U, Vega 7, 56 Wh | Dell Inspiron 15 3505-PXHPW R5 3450U, Vega 8, 42 Wh | Dell Inspiron 15 3000 3511 i5-1135G7, Iris Xe G7 80EUs, 40 Wh | Average of class Office | |
|---|---|---|---|---|---|---|---|
| Battery runtime | -13% | -38% | -16% | -57% | -43% | 14% | |
| H.264 (h) | 10.8 | 8.8 -19% | 15.5 ? 44% | ||||
| WiFi v1.3 (h) | 10.5 | 10.9 4% | 6.5 -38% | 8.8 -16% | 4.5 -57% | 6.4 -39% | 13 ? 24% |
| Load (h) | 2.4 | 1.8 -25% | 1.3 -46% | 1.808 ? -25% | |||
| Reader / Idle (h) | 12.8 | 24.5 ? |
Pros
Cons
Verdict: Dell Inspiron 15 5515 proves to be a solid office notebook

Thanks to the large battery, the battery life is one of the most positive aspects of the Dell Inspiron 15 5515. There is also the high-quality workmanship, a relatively light aluminum case and pleasant operation as well as the usual selection of ports.
The Inspiron 15 5515 is a good device for simple office work, but also has potential that remains under-utilized.
Dell does not fully exploit the potential of the CPU and iGPU. The SSD is also slow and the display could be brighter. But for the usual everyday work on a office notebook in this price range, these factors do not really negatively affect its appeal.
At the end of the day, the Dell Inspiron 15 5515-H8P8F recieves a solid rating that, aside from its gaming performance and camera, is reflected by the absence of any real abnormalities. If you're looking for more performance, you'll be happy with the Asus VivoBook 15 OLED or the Acer Aspire 5 A515, which are also equipped with the AMD Ryzen 7 5700U.
Price and Availability
At the time of writing (29.07.2022), availability of the Inspiron 15 5515 appears to be sporadic around the globe. We found, for example, a variant with beefier hardware specifications (16 GB RAM and 1 TB SSD) and Windows 11 Home in Canada via Amazon for CA$ 2,099.99. Readers are thus advised to check regularly (where applicable) via Dell's website or Amazon for availability.
Dell Inspiron 15 5515-H8P8F
- 07/26/2022 v7 (old)
Marcus Schwarten
Price comparison

