Dell Inspiron 14 Plus 7420 laptop review: For power users on a budget
Dell has introduced three separate 14-inch Inspiron 14 7420 models for 2022: the standard Inspiron 14 7420, Inspiron 14 7420 2-in-1, and Inspiron 14 7420 Plus. This review focuses on the Plus model which carries much faster Core H-series processors and discrete Nvidia GeForce RTX graphics designed for power users dissatisfied with the usual Core-U series Ultrabooks.
Our specific review unit comes with the Alder Lake-H Core i7-12700H CPU and GeForce RTX 3050 GPU for approximately $1400 USD retail. Other SKUs with the Core i5-12500H, RTX 3050 Ti or integrated graphics, and smaller 54 Wh battery are planned, but all configurations come with the same 2.2K 2240 x 1400 resolution panel.
Competitors include other high-performance 14-inch laptops like the Asus VivoBook Pro 14, HP Pavilion 14 Plus, Schenker Vision 14, HP Envy 14, or the Lenovo IdeaPad 5 Pro 14. The Razer Blade 14 and Asus Zephyrus G14 can also be considered alternatives, but they are significantly more expensive.
More Dell reviews:
Potential Competitors in Comparison
Rating | Date | Model | Weight | Height | Size | Resolution | Price |
|---|---|---|---|---|---|---|---|
| 87.2 % v7 (old) | 08 / 2022 | Dell Inspiron 14 Plus 7420 i7-12700H, GeForce RTX 3050 4GB Laptop GPU | 1.7 kg | 18.87 mm | 14.00" | 2240x1400 | |
| 86.3 % v7 (old) | 07 / 2022 | Asus Vivobook Pro 14 M3401QC-KM007T R5 5600H, GeForce RTX 3050 4GB Laptop GPU | 1.5 kg | 19 mm | 14.00" | 2880x1800 | |
| 83.7 % v7 (old) | 06 / 2022 | Dell Inspiron 14 7420 2-in-1 i7-1255U, Iris Xe G7 96EUs | 1.6 kg | 17.86 mm | 14.00" | 1920x1200 | |
| 87.7 % v7 (old) | 01 / 2022 | Schenker Vision 14 i7-11370H, GeForce RTX 3050 Ti Laptop GPU | 1.1 kg | 15.6 mm | 14.00" | 2880x1800 | |
v (old) | 10 / 2021 | Asus Zenbook 14X UX5400E i7-1165G7, GeForce MX450 | 1.4 kg | 16.9 mm | 14.00" | 2880x1800 | |
| 82.3 % v7 (old) | 07 / 2021 | MSI Summit E14 A11SCS i7-1185G7, GeForce GTX 1650 Ti Max-Q | 1.3 kg | 16 mm | 14.00" | 3840x2160 | |
| 86.5 % v7 (old) | 02 / 2021 | HP Envy 14-eb0010nr i5-1135G7, GeForce GTX 1650 Ti Max-Q | 1.6 kg | 17.9 mm | 14.00" | 1920x1200 |
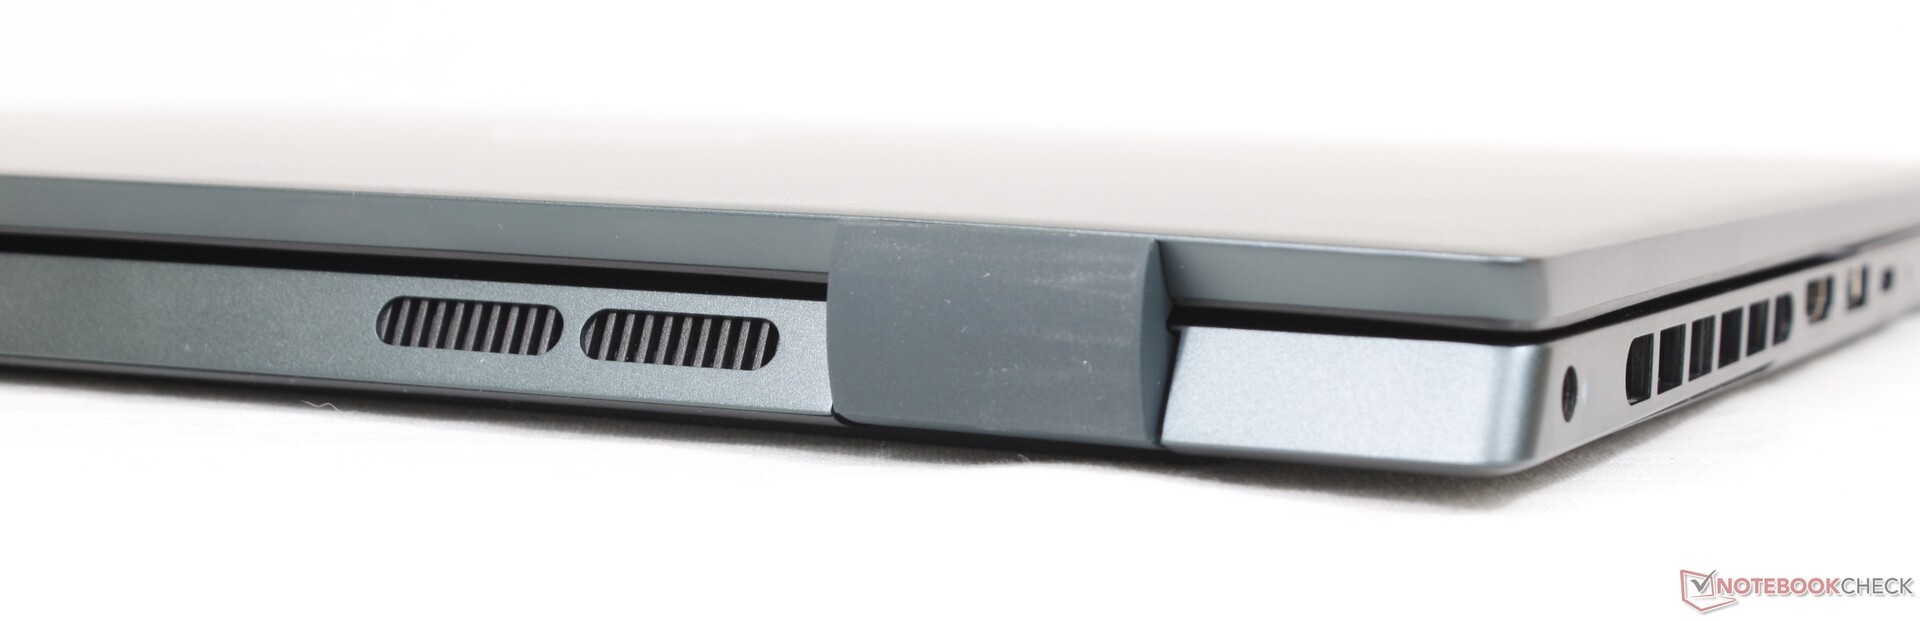
Case — A Miniature Inspiron 16 7620
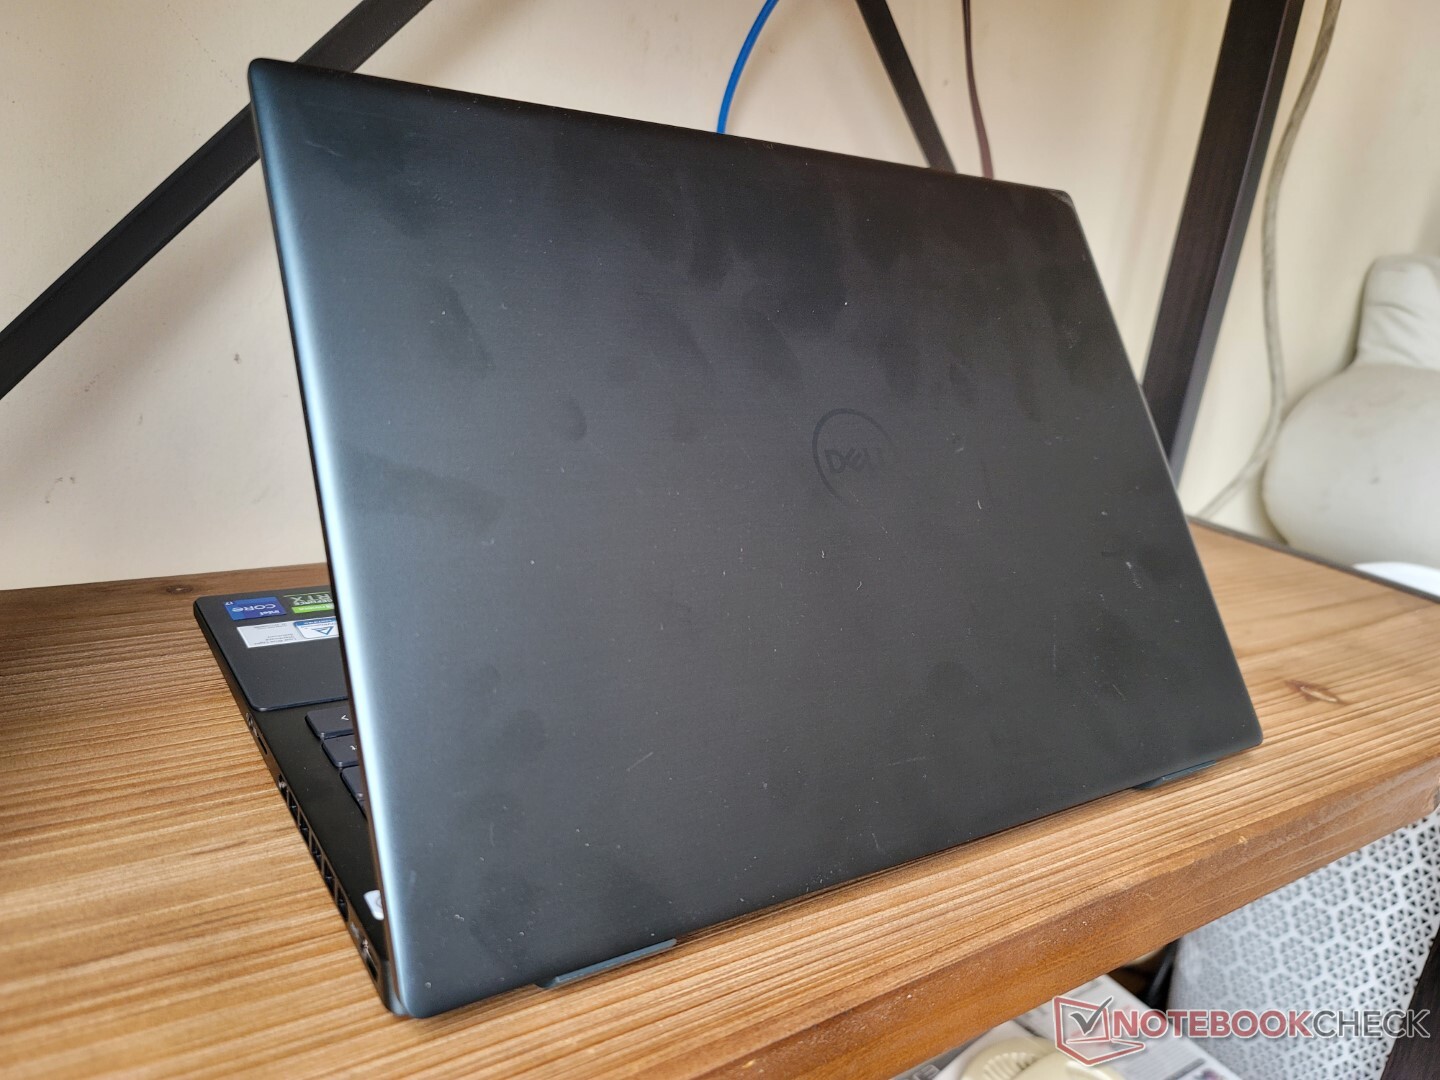
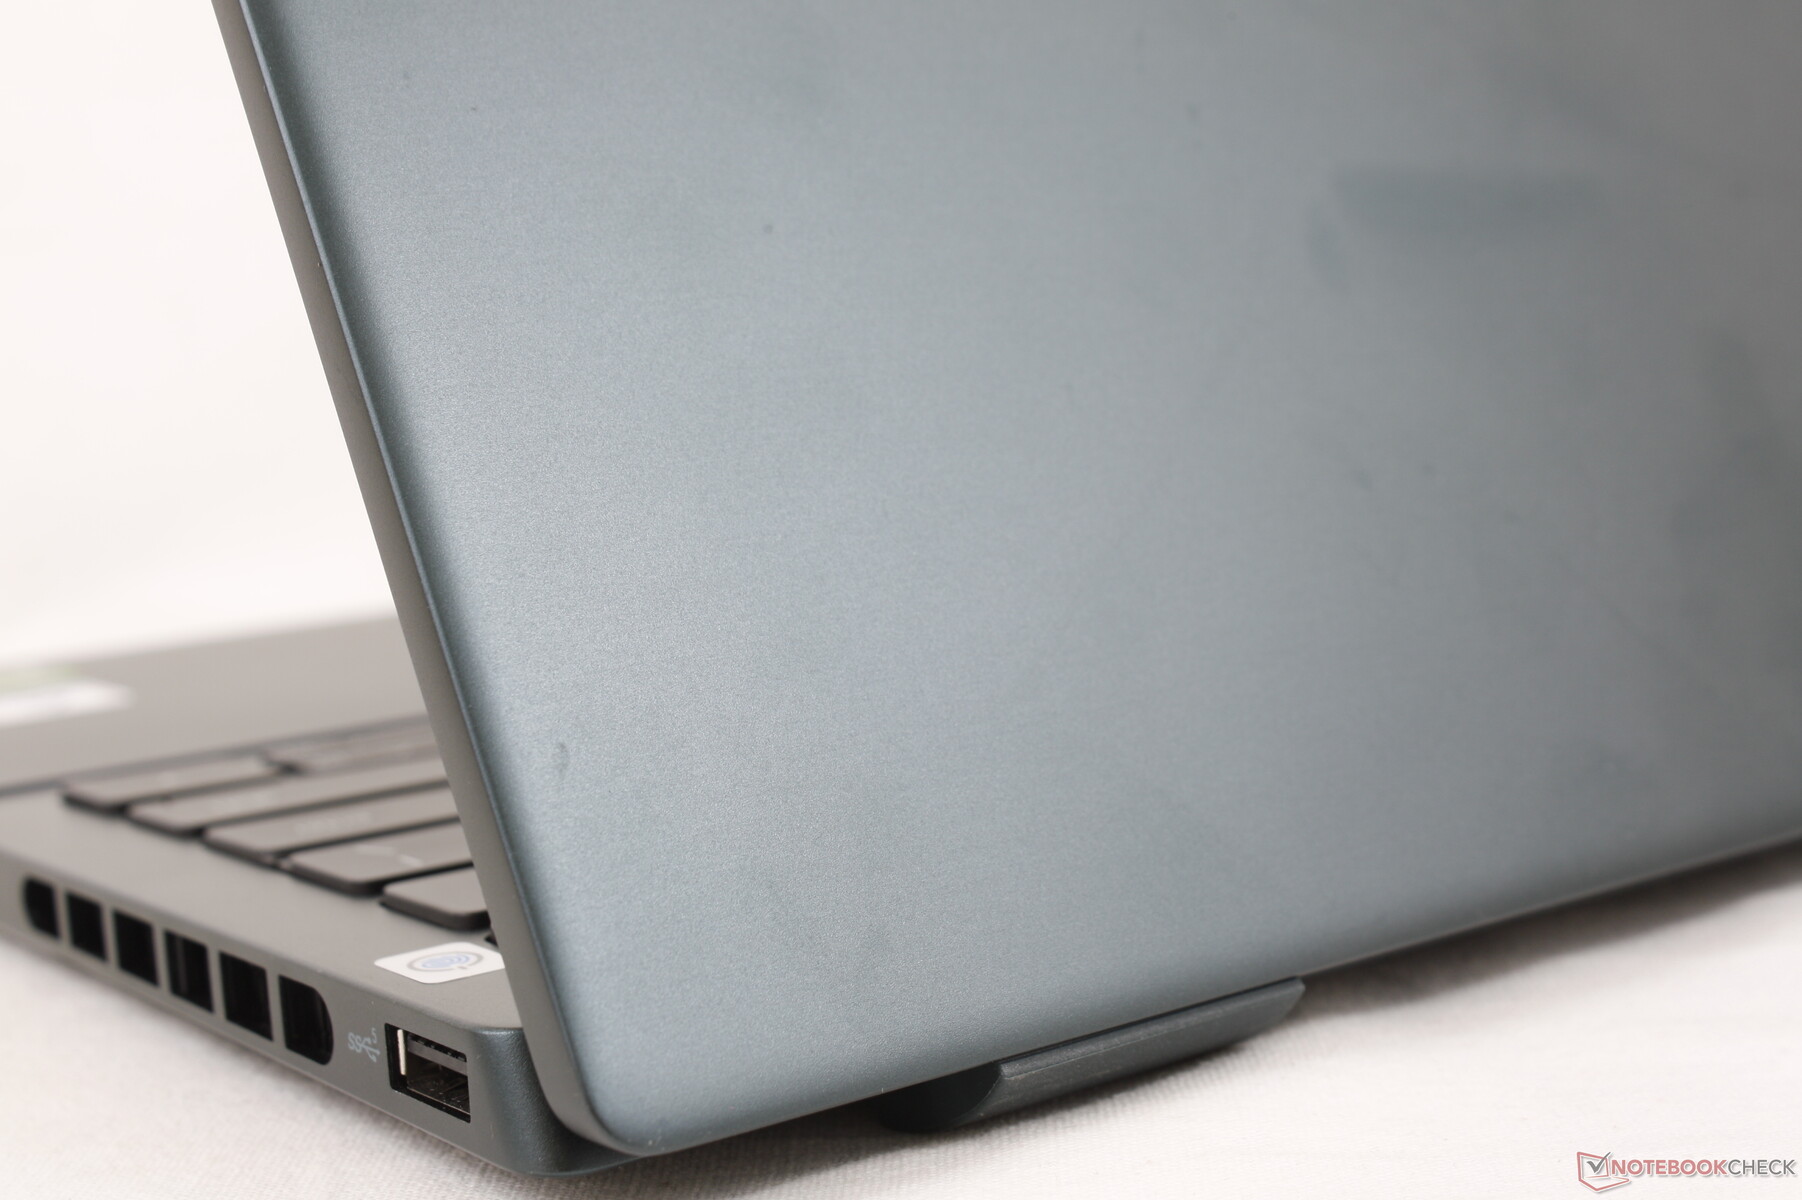
The chassis can be best described as a smaller version of the Inspiron 16 7620 Plus since they both share the same visual design language. The materials used for the metal chassis and layer of Mylar over the clickpad and palm rests are similar to the larger Inspiron as a result. It's a smooth matte feel from top to bottom that almost mimics the smooth metal outer lid of an XPS 15.
The weakest aspect of the skeleton is perhaps the lid as it twists quite readily. Minor creaking is audible when twisting the base and applying pressure on the keyboard center will slightly warp its surface as well. Though this model retails for almost as much as a Dell XPS 15, don't expect it to be built as strongly as one.
One might expect the Inspiron 14 Plus 7620 to be larger and heavier than the Inspiron 14 7620 2-in-1, but that's not really the case. Its footprint is identical to the 2-in-1 version while being just a hair thicker and heavier despite the significantly more powerful hardware inside. Nonetheless, it's still heavier and larger than most other 14-inch laptops like the HP Envy 14, Asus Zenbook 14X, or Schenker Vision 14 all of which also carry discrete Nvidia graphics.
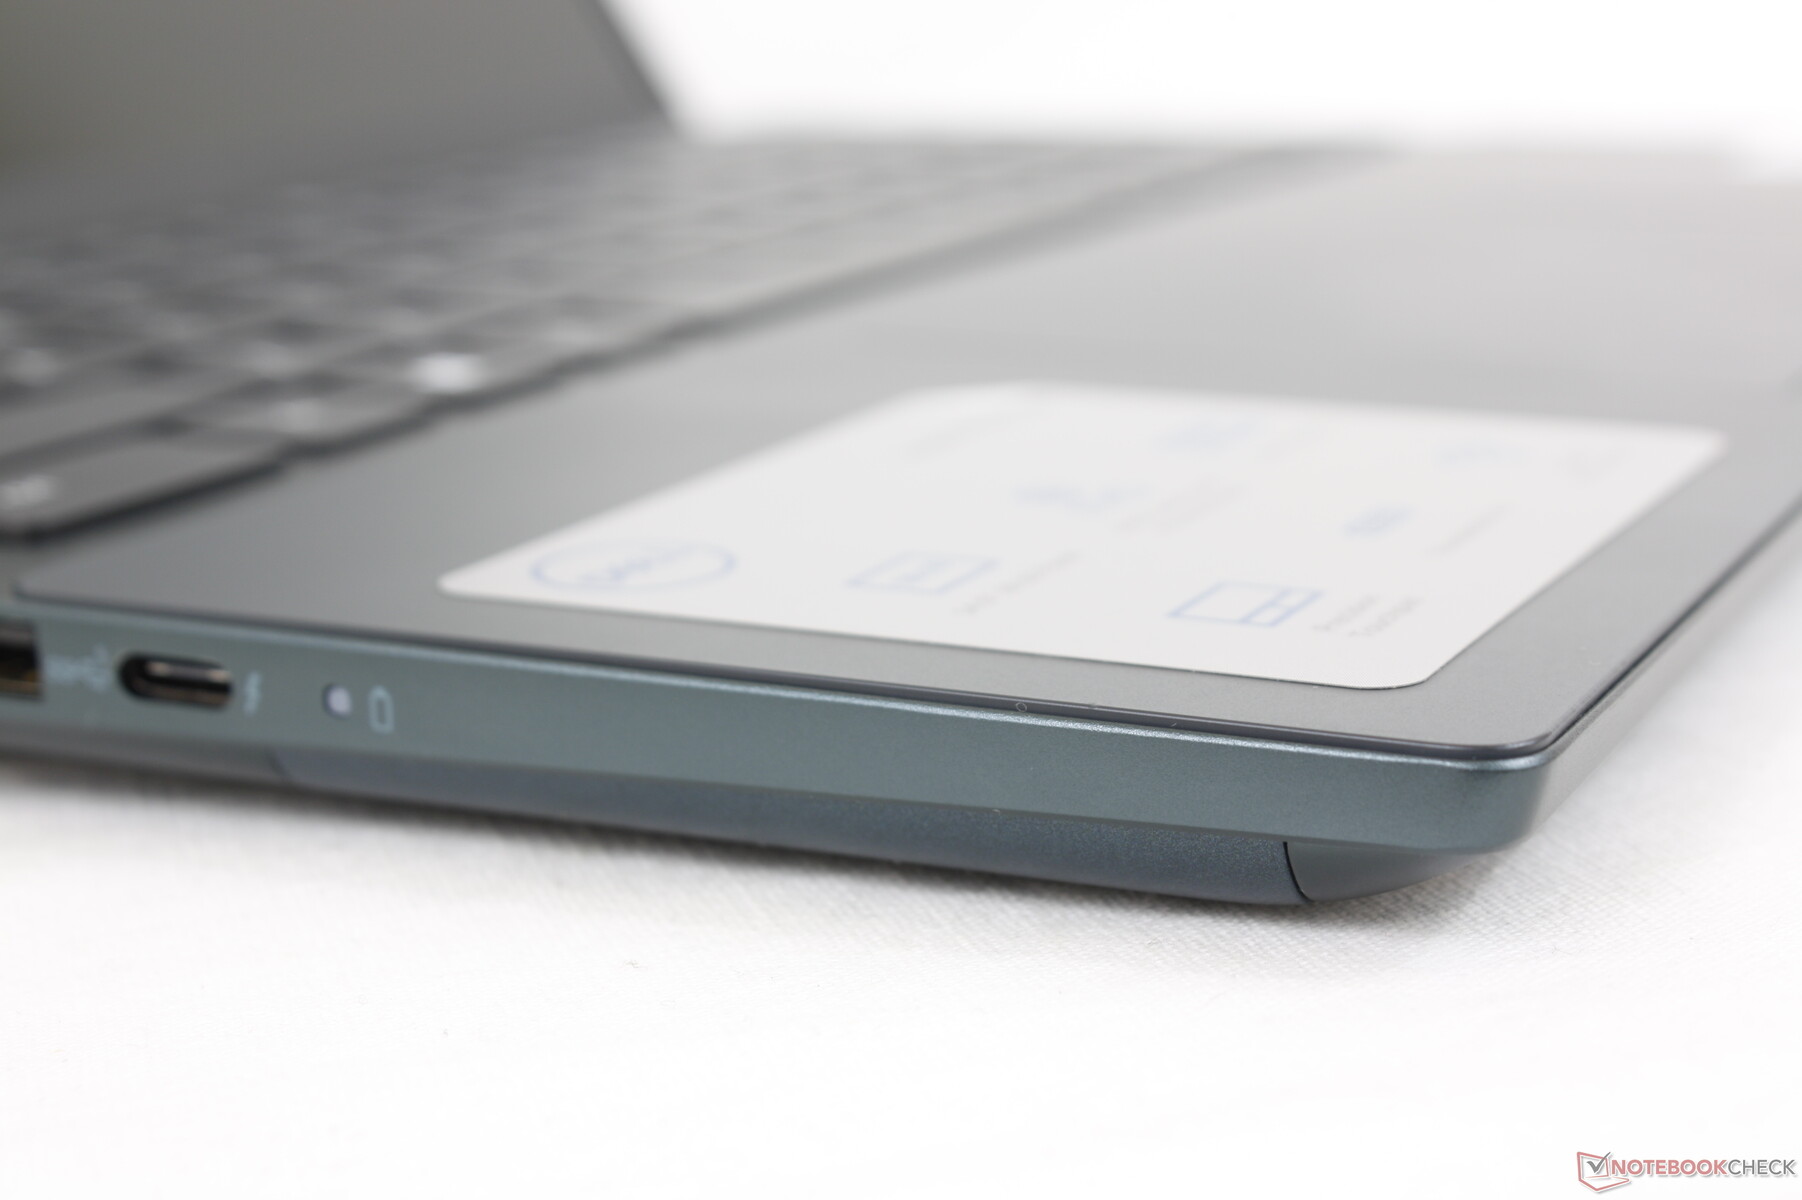
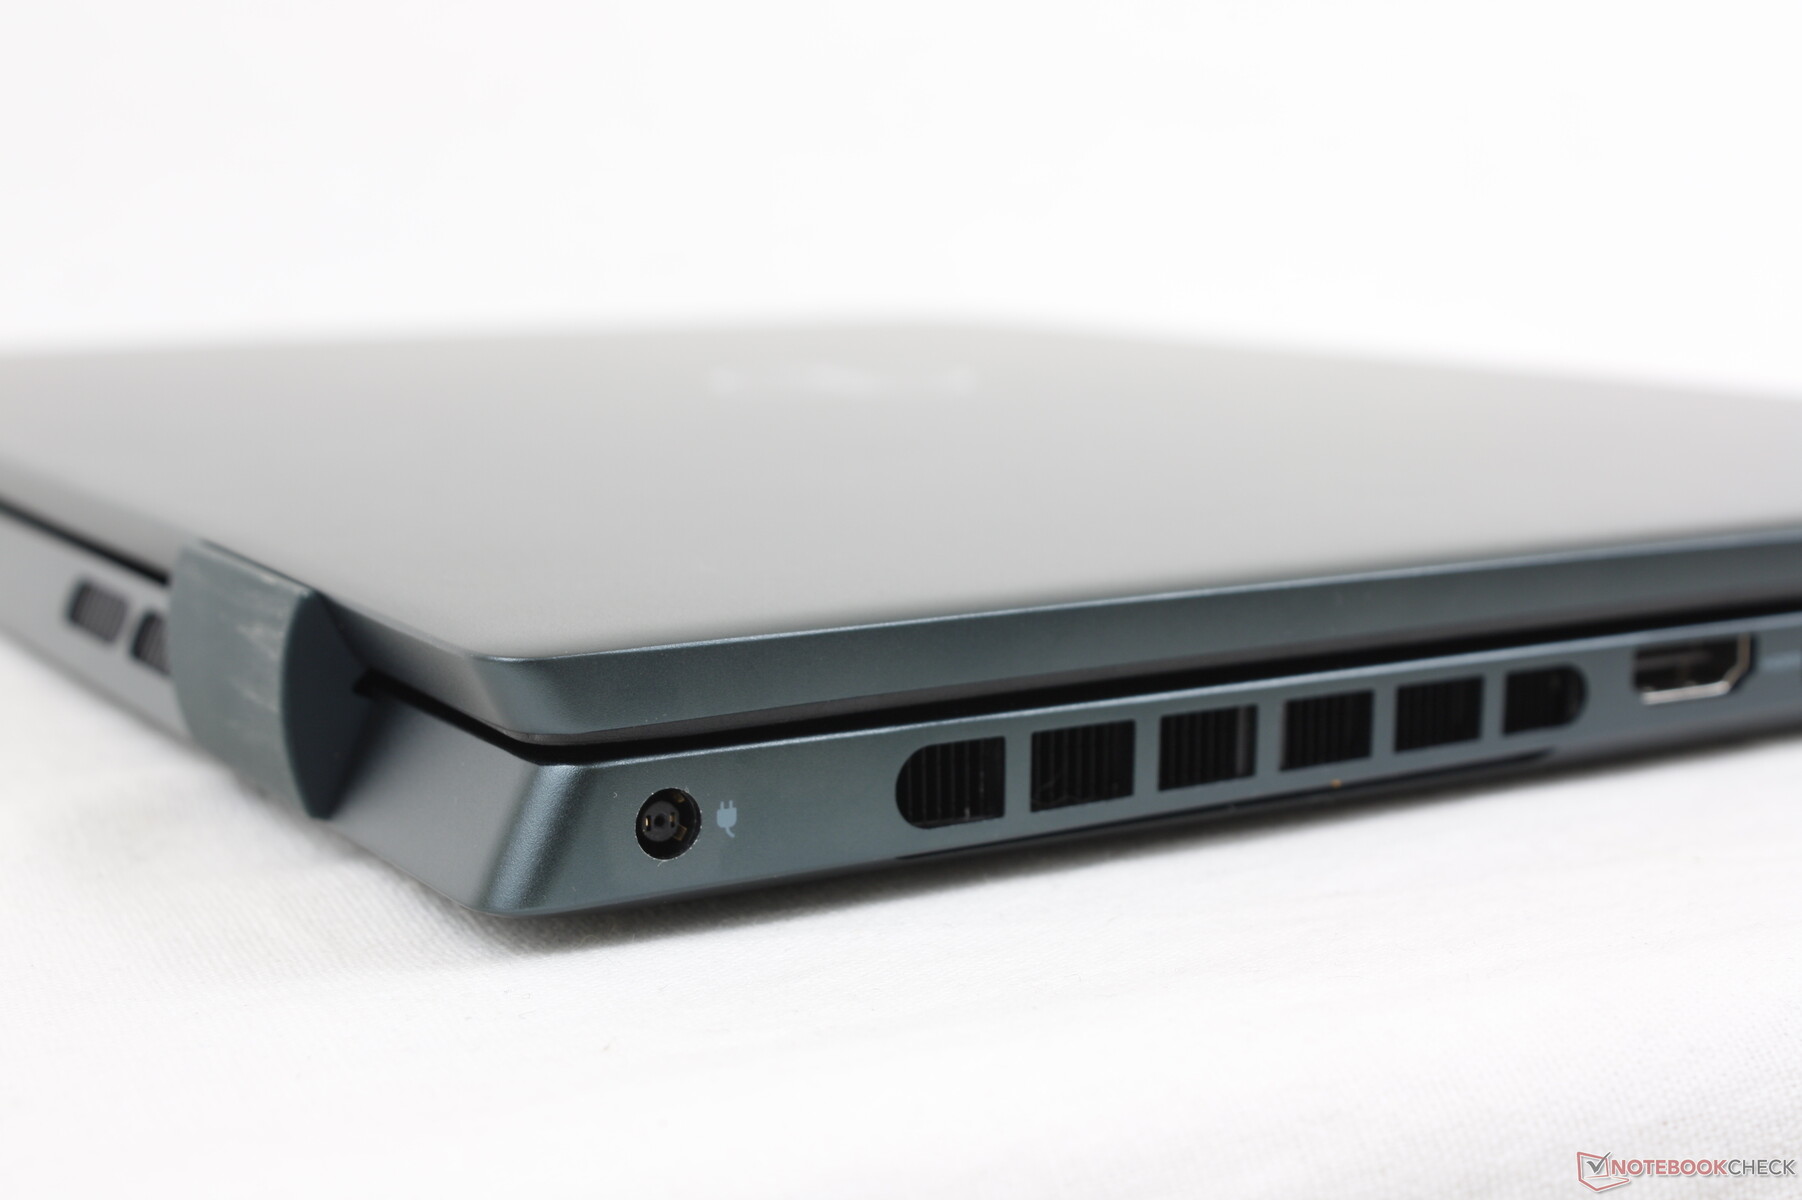
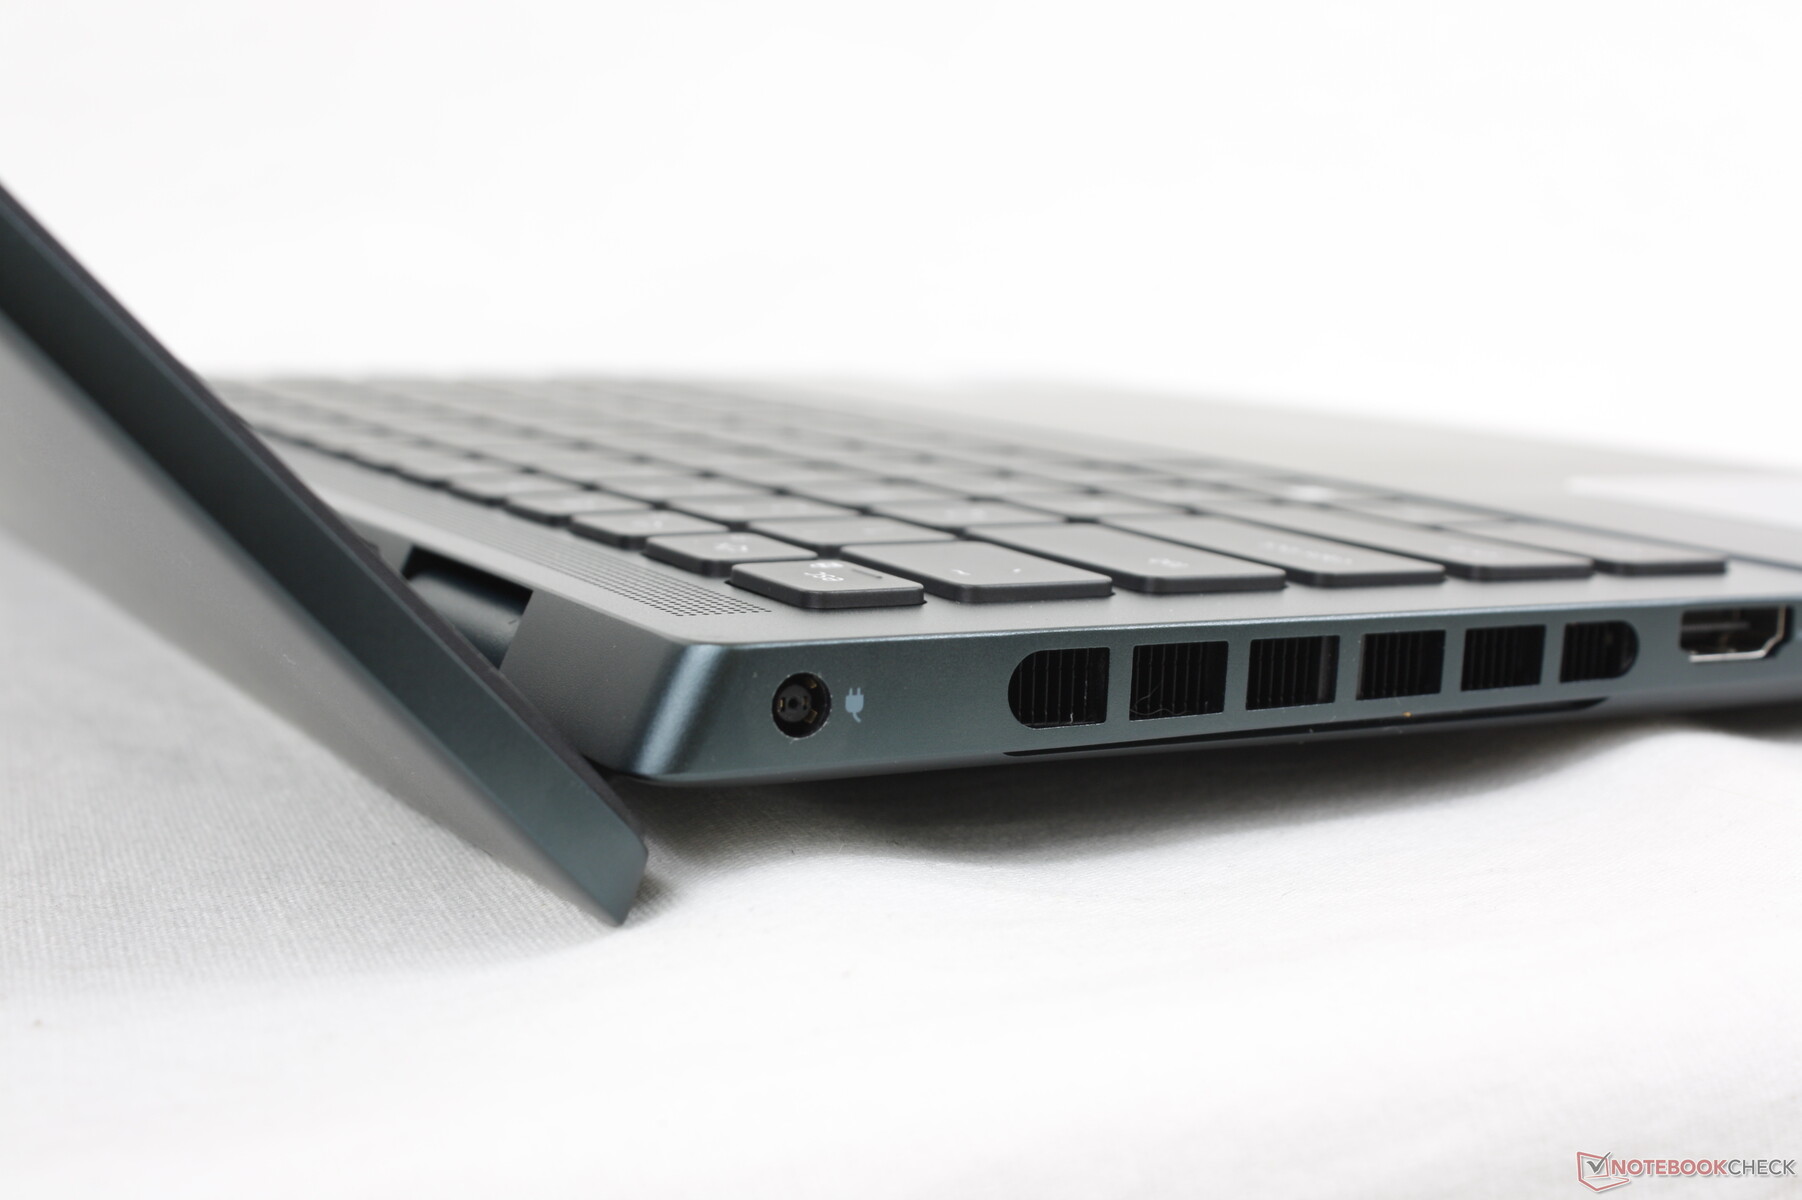
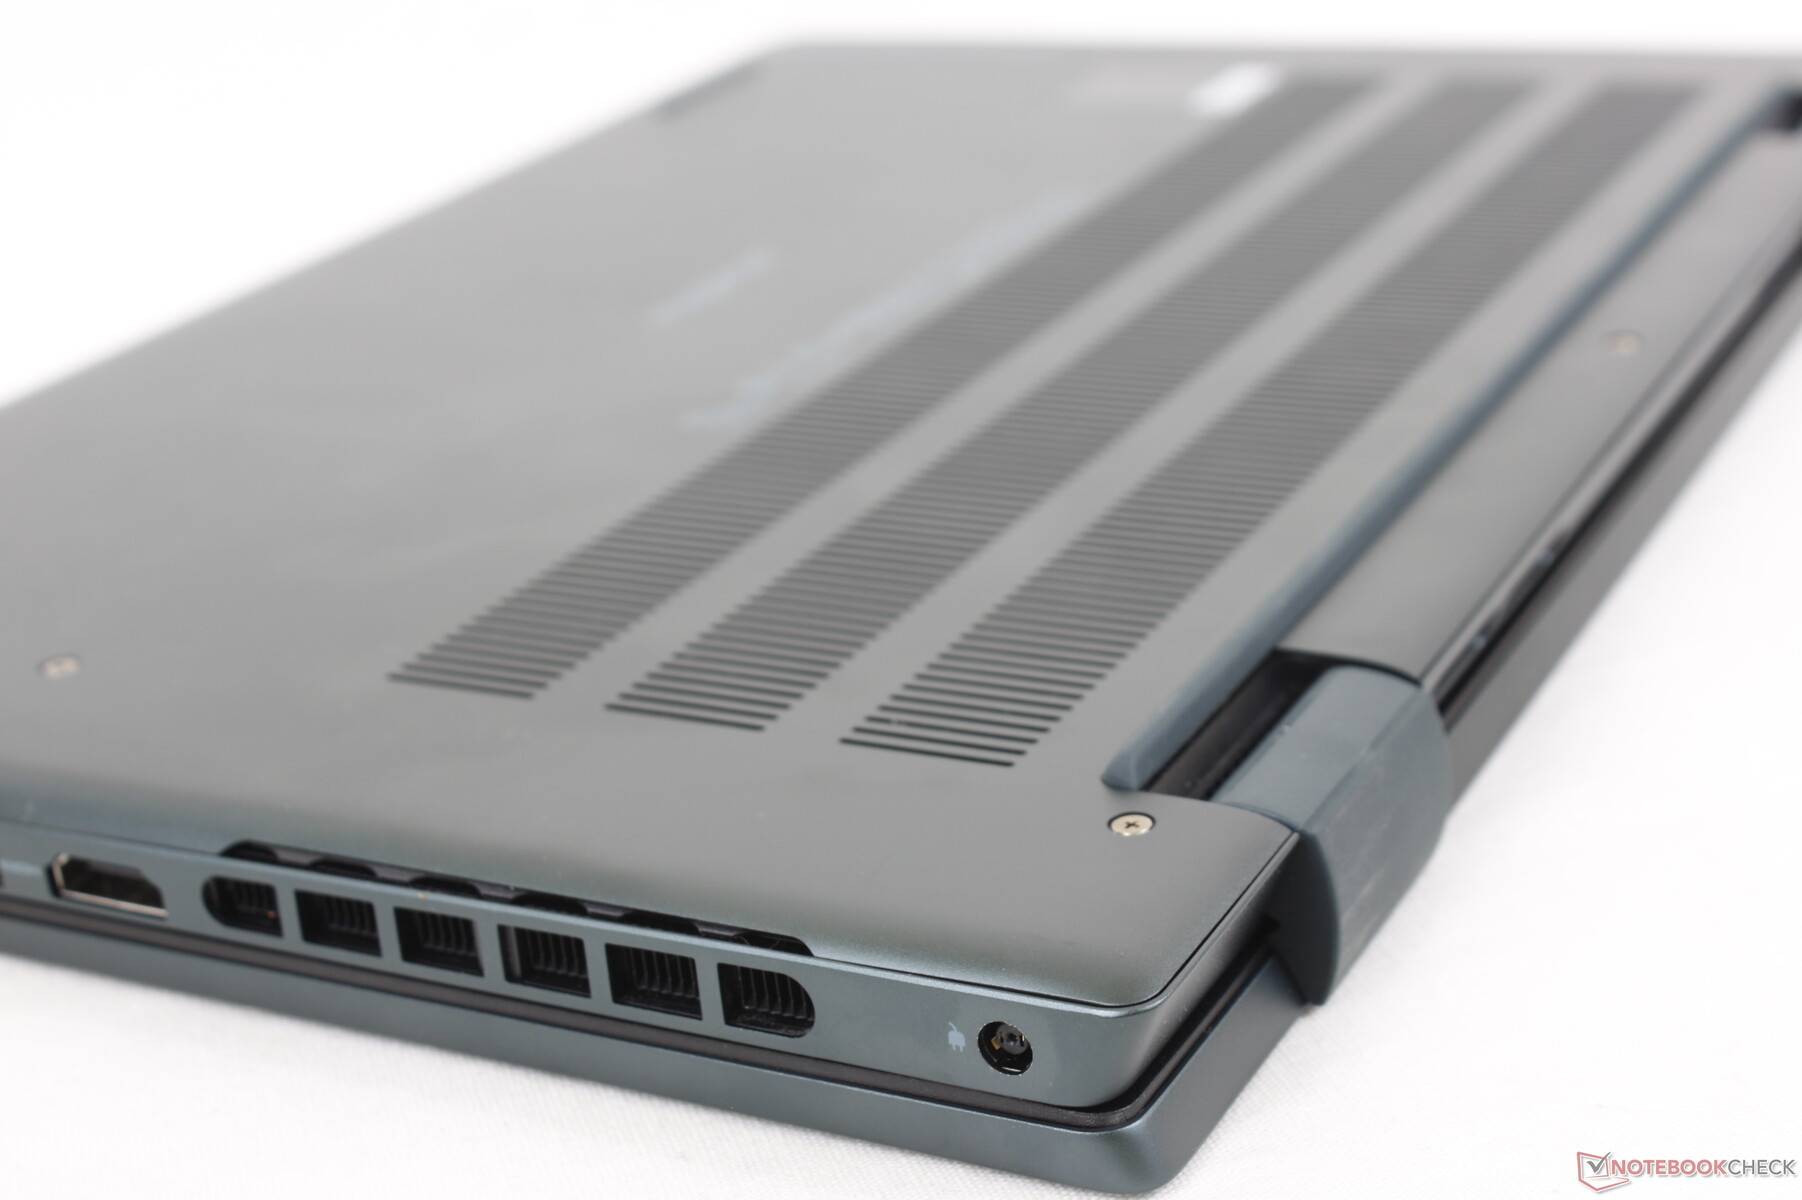
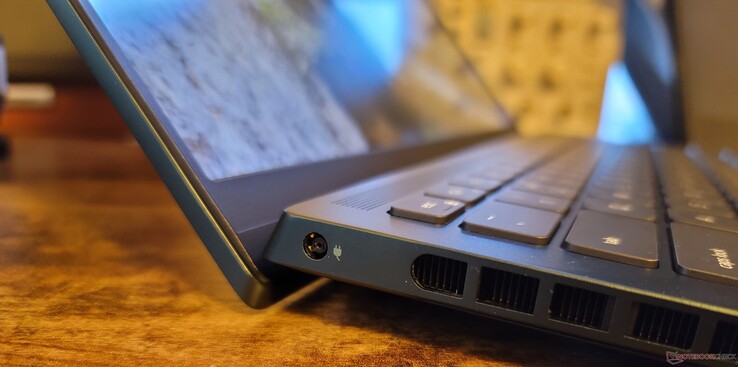
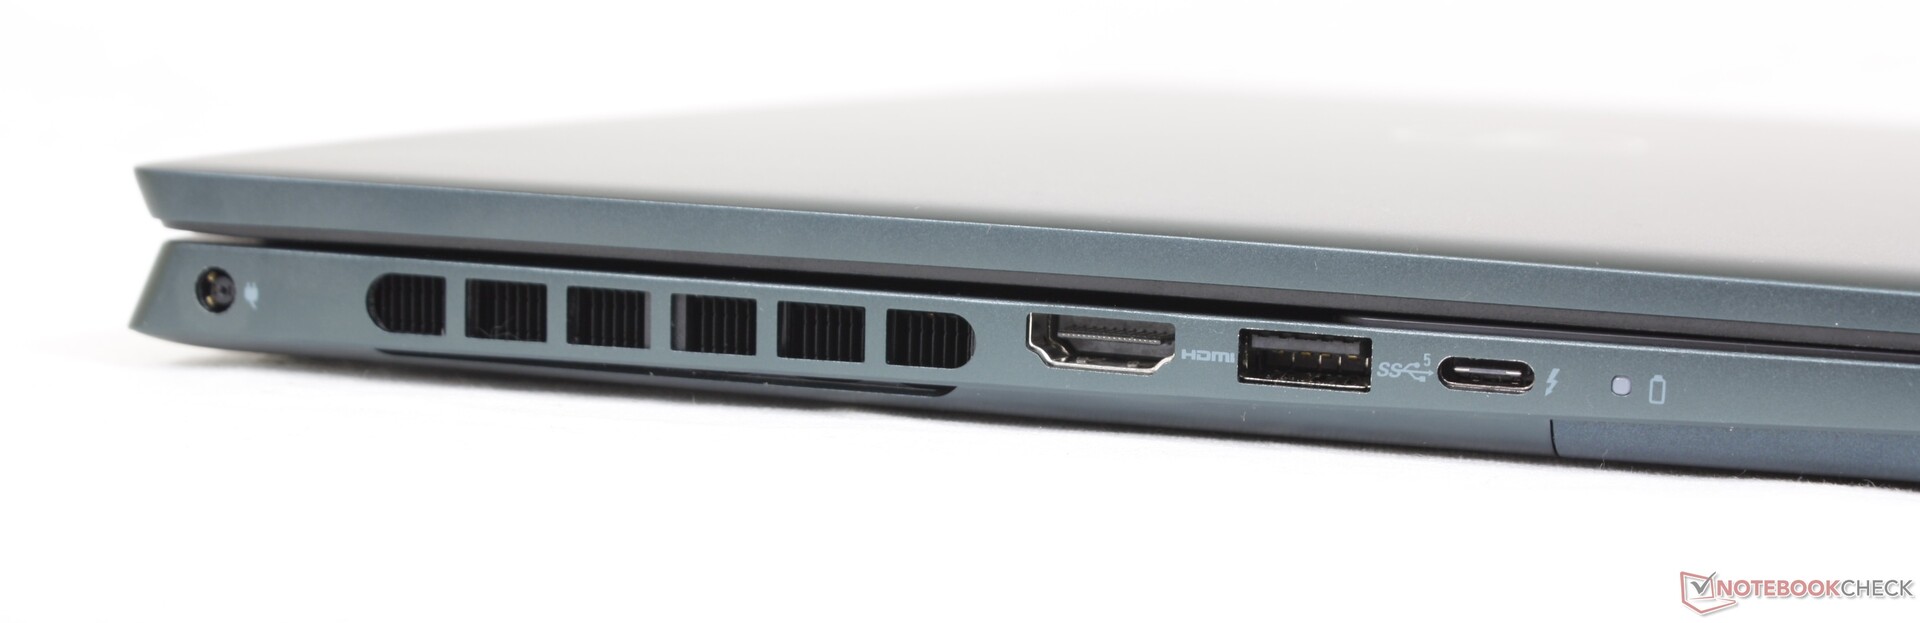
Connectivity — Thunderbolt 4 Support
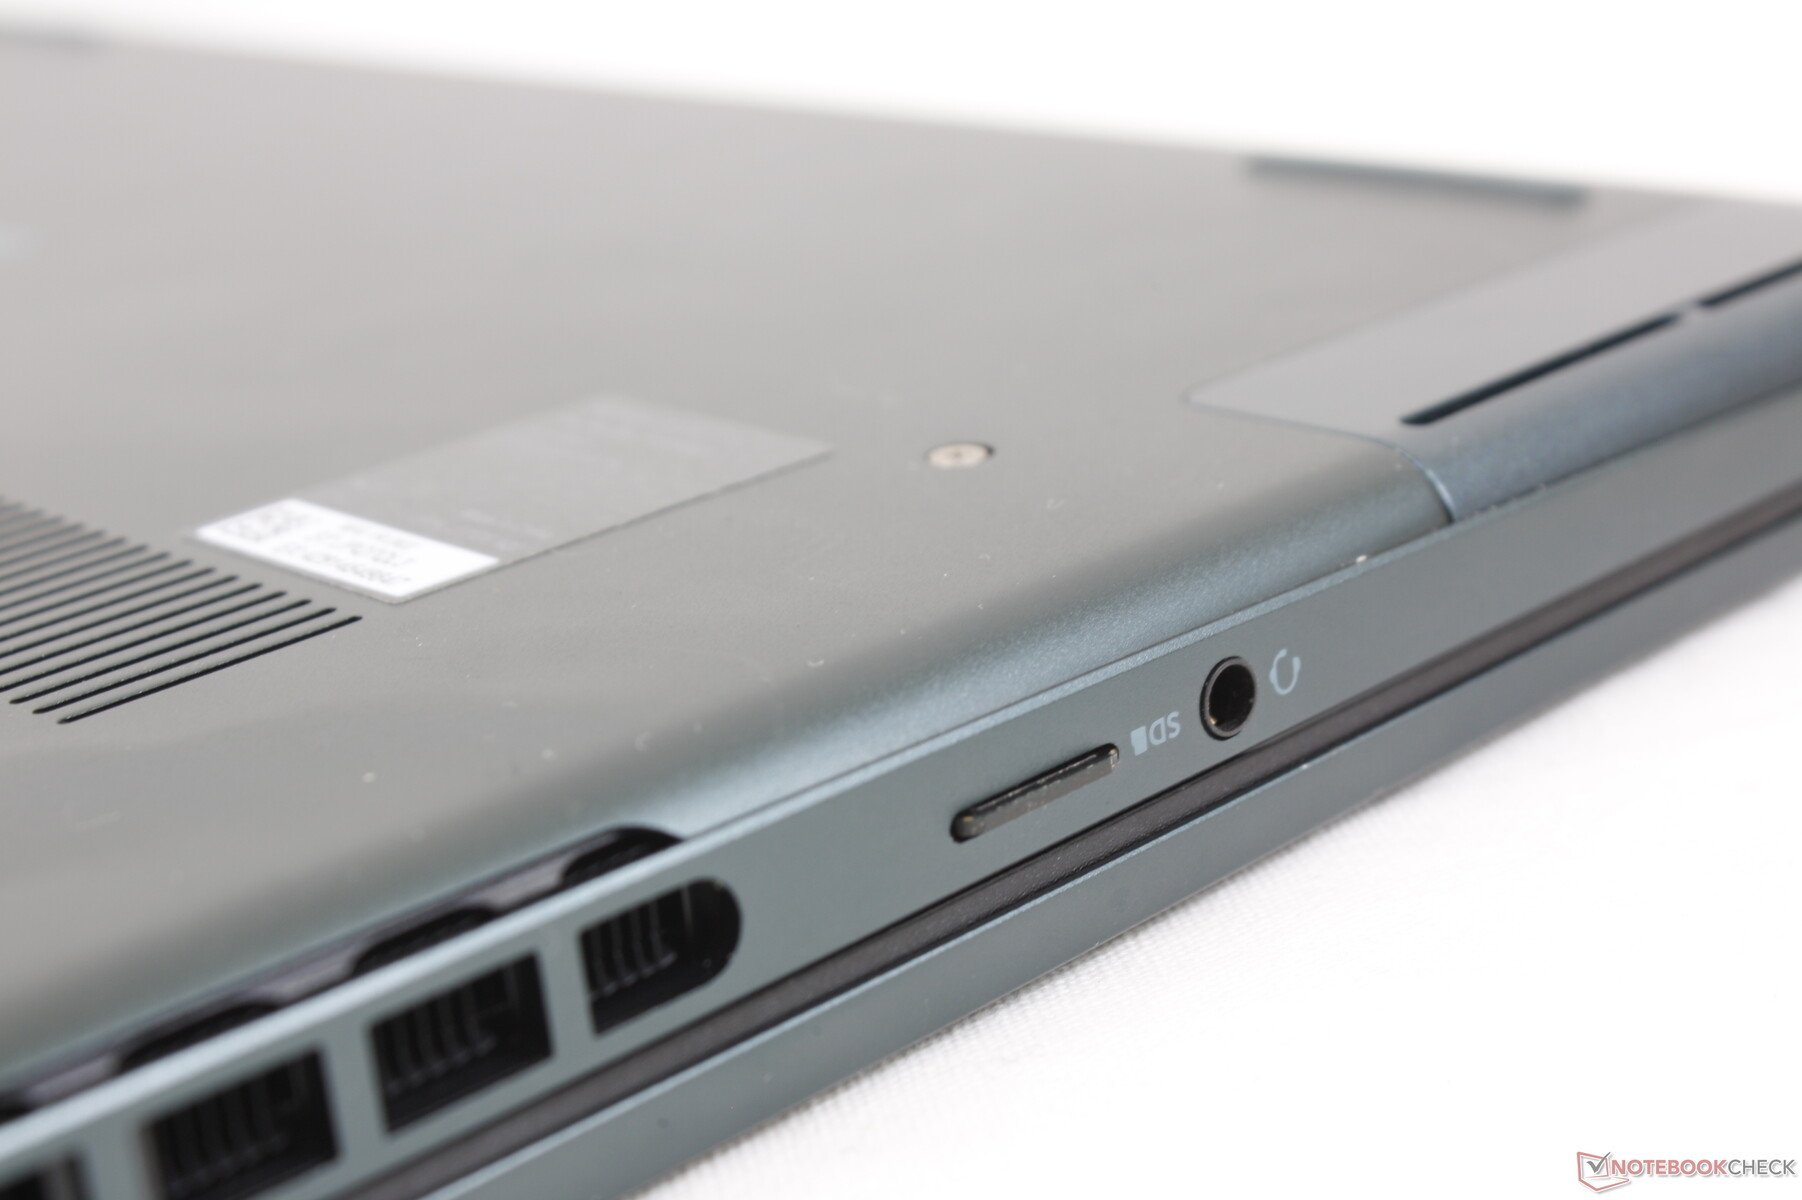
Port options are identical to the Inspiron 16 Plus 7620 albeit the full-size SD reader has been swapped for a smaller microSD one. We appreciate the support for Thunderbolt 4 as neither the competing HP Pavilion Plus 14 nor Asus Vivobook Pro 14 OLED support Thunderbolt even though they have USB-C ports.

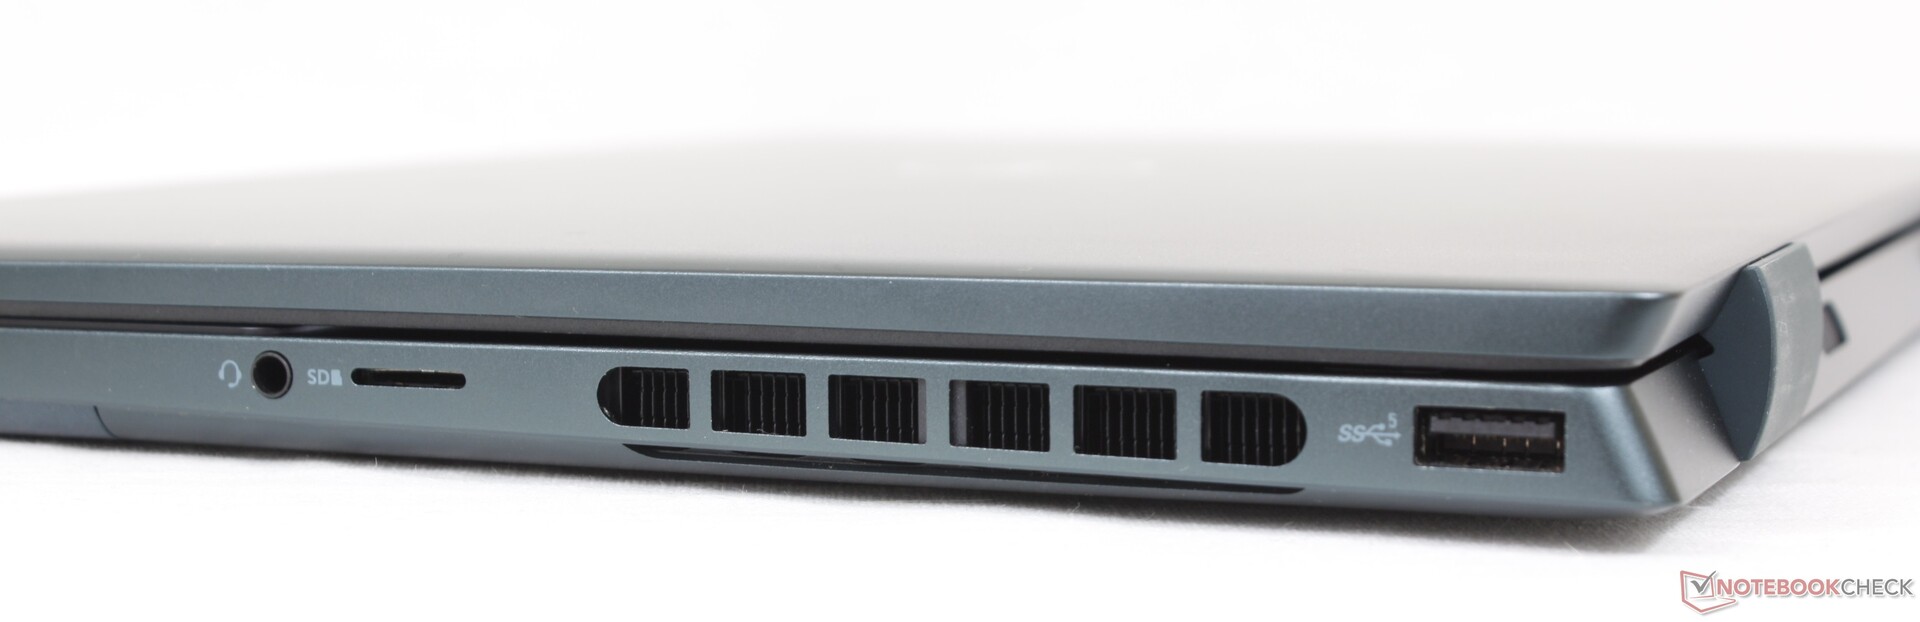
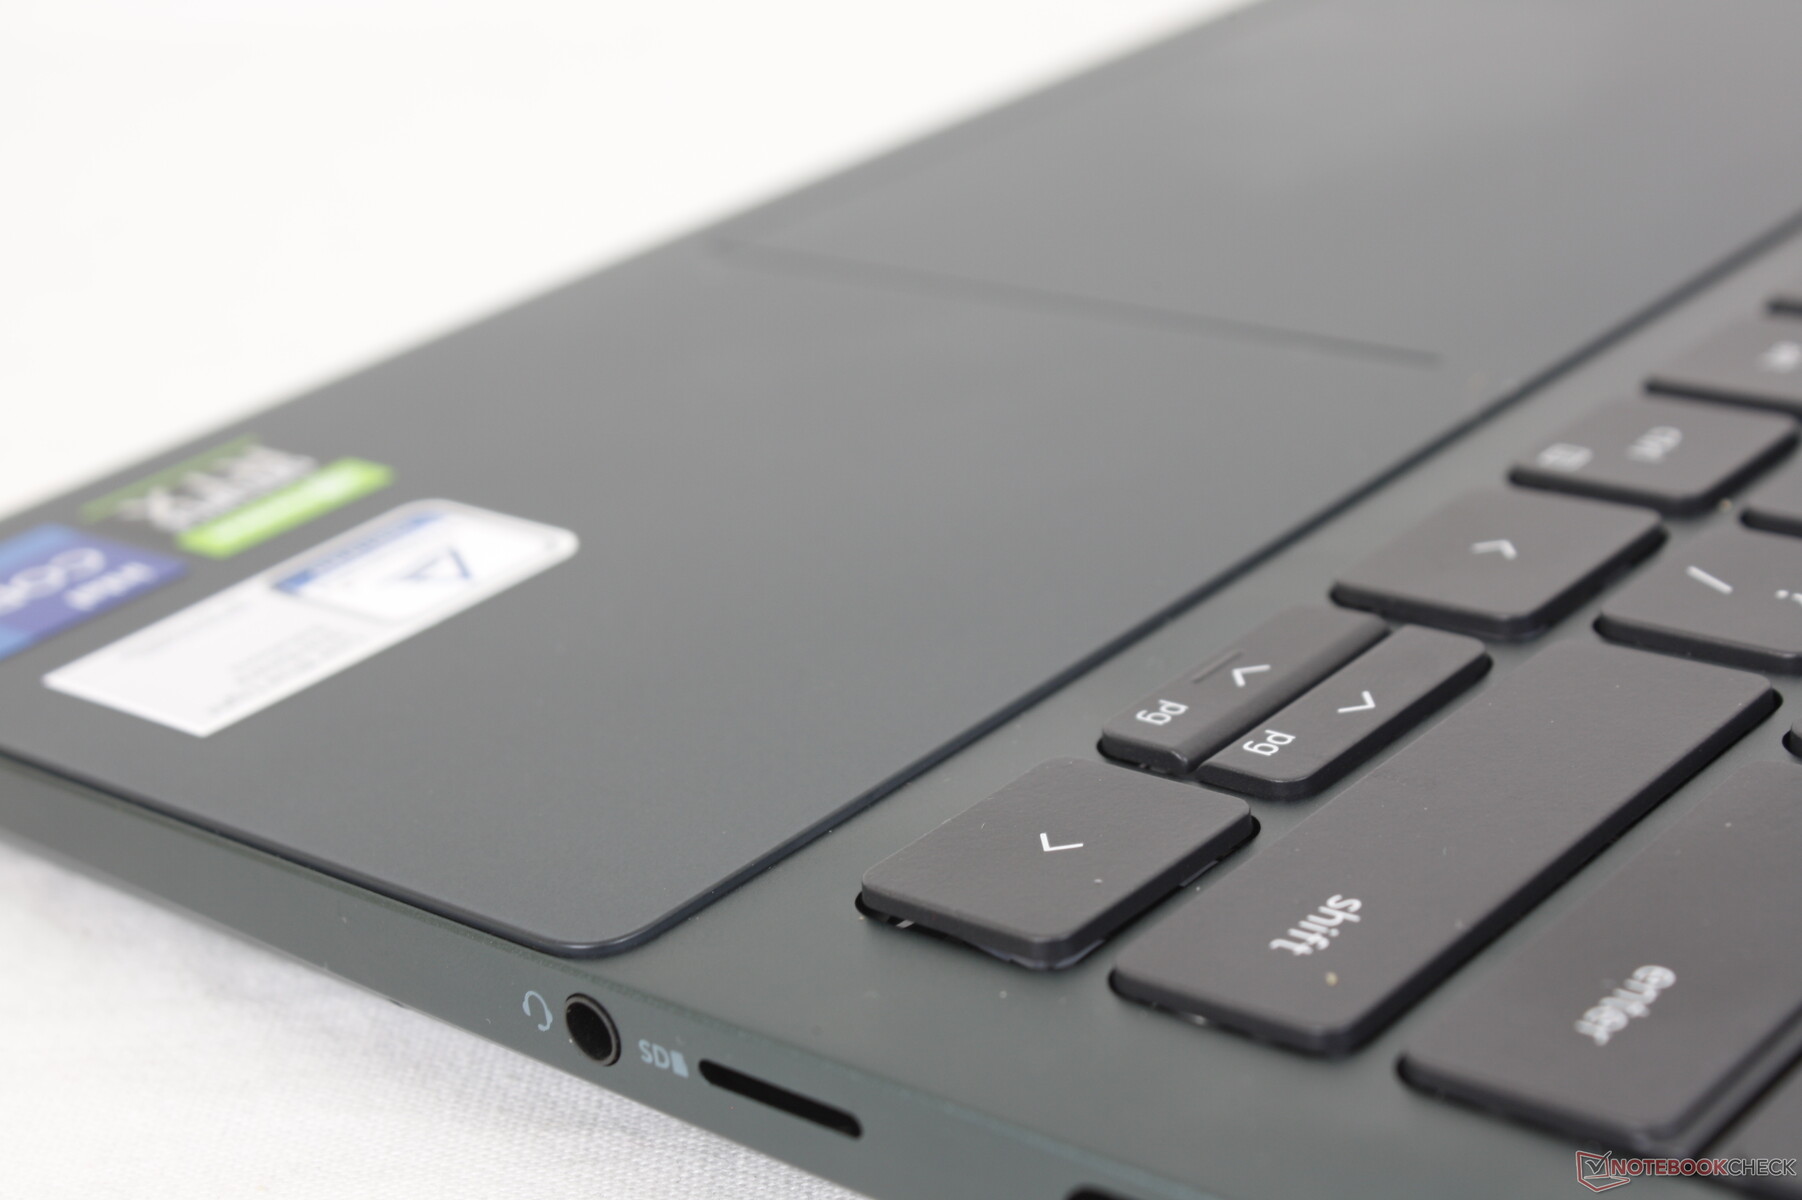
SD Card Reader
Transfer rates from the integrated spring-loaded MicroSD reader are slow much like what we observed on the Inspiron 14 7420 2-in-1. Moving 1 GB of pictures from our UHS-II test card to desktop takes about 45 seconds.
| SD Card Reader | |
| average JPG Copy Test (av. of 3 runs) | |
| MSI Summit E14 A11SCS (AV Pro V60) | |
| Schenker Vision 14 (Angelbird AV Pro V60) | |
| HP Envy 14-eb0010nr (Toshiba Exceria Pro M501 microSDXC 32GB) | |
| Asus Zenbook 14X UX5400E (AV Pro SD microSD 128 GB V60) | |
| Asus Vivobook Pro 14 M3401QC-KM007T (AV Pro SD microSD 128 GB V60) | |
| Dell Inspiron 14 Plus 7420 (AV PRO microSD 128 GB V60) | |
| Dell Inspiron 14 7420 2-in-1 (Toshiba Exceria Pro SDXC 64 GB UHS-II) | |
| maximum AS SSD Seq Read Test (1GB) | |
| MSI Summit E14 A11SCS (AV Pro V60) | |
| Schenker Vision 14 (Angelbird AV Pro V60) | |
| HP Envy 14-eb0010nr (Toshiba Exceria Pro M501 microSDXC 32GB) | |
| Asus Zenbook 14X UX5400E (AV Pro SD microSD 128 GB V60) | |
| Asus Vivobook Pro 14 M3401QC-KM007T (AV Pro SD microSD 128 GB V60) | |
| Dell Inspiron 14 Plus 7420 (AV PRO microSD 128 GB V60) | |
| Dell Inspiron 14 7420 2-in-1 (Toshiba Exceria Pro SDXC 64 GB UHS-II) | |
Communication
An Intel AX211 comes standard for Wi-Fi 6E and Bluetooth 5.2 connectivity. Though we experienced no issues when paired to our 6 GHz network, transmit rates would be slightly more unsteady than receive rates as shown by the graph below.
| Networking | |
| iperf3 transmit AX12 | |
| Schenker Vision 14 | |
| HP Envy 14-eb0010nr | |
| MSI Summit E14 A11SCS | |
| Asus Zenbook 14X UX5400E | |
| iperf3 receive AX12 | |
| Schenker Vision 14 | |
| MSI Summit E14 A11SCS | |
| HP Envy 14-eb0010nr | |
| Asus Zenbook 14X UX5400E | |
| iperf3 receive AXE11000 6GHz | |
| Dell Inspiron 14 Plus 7420 | |
| Dell Inspiron 14 7420 2-in-1 | |
| Asus Vivobook Pro 14 M3401QC-KM007T | |
| iperf3 transmit AXE11000 6GHz | |
| Dell Inspiron 14 Plus 7420 | |
| Dell Inspiron 14 7420 2-in-1 | |
| Asus Vivobook Pro 14 M3401QC-KM007T | |
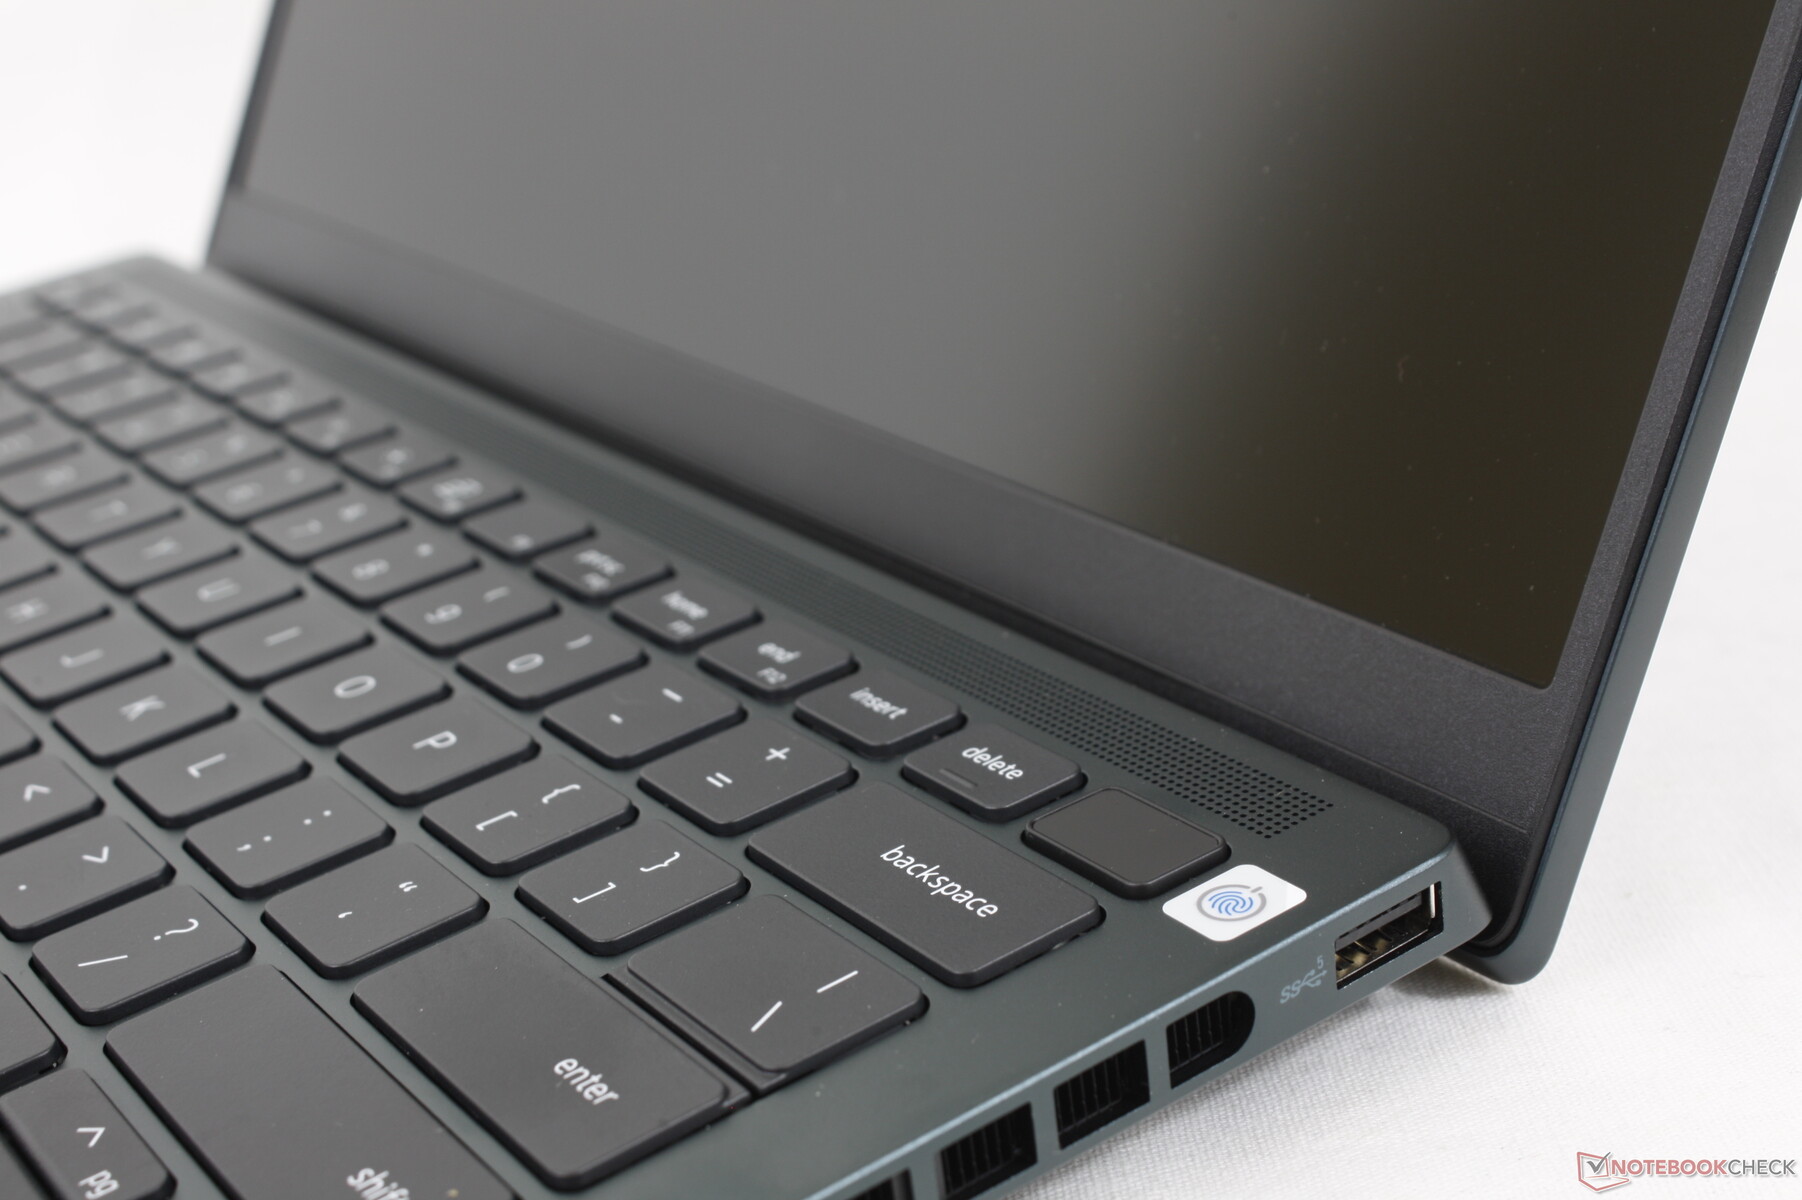
Webcam
the 2 MP webcam offers a similar picture quality as the 2 MP webcam on the standard Inspiron 14 7420 2-in-1. A physical privacy shutter comes standard while Windows Hello and IR are not supported.


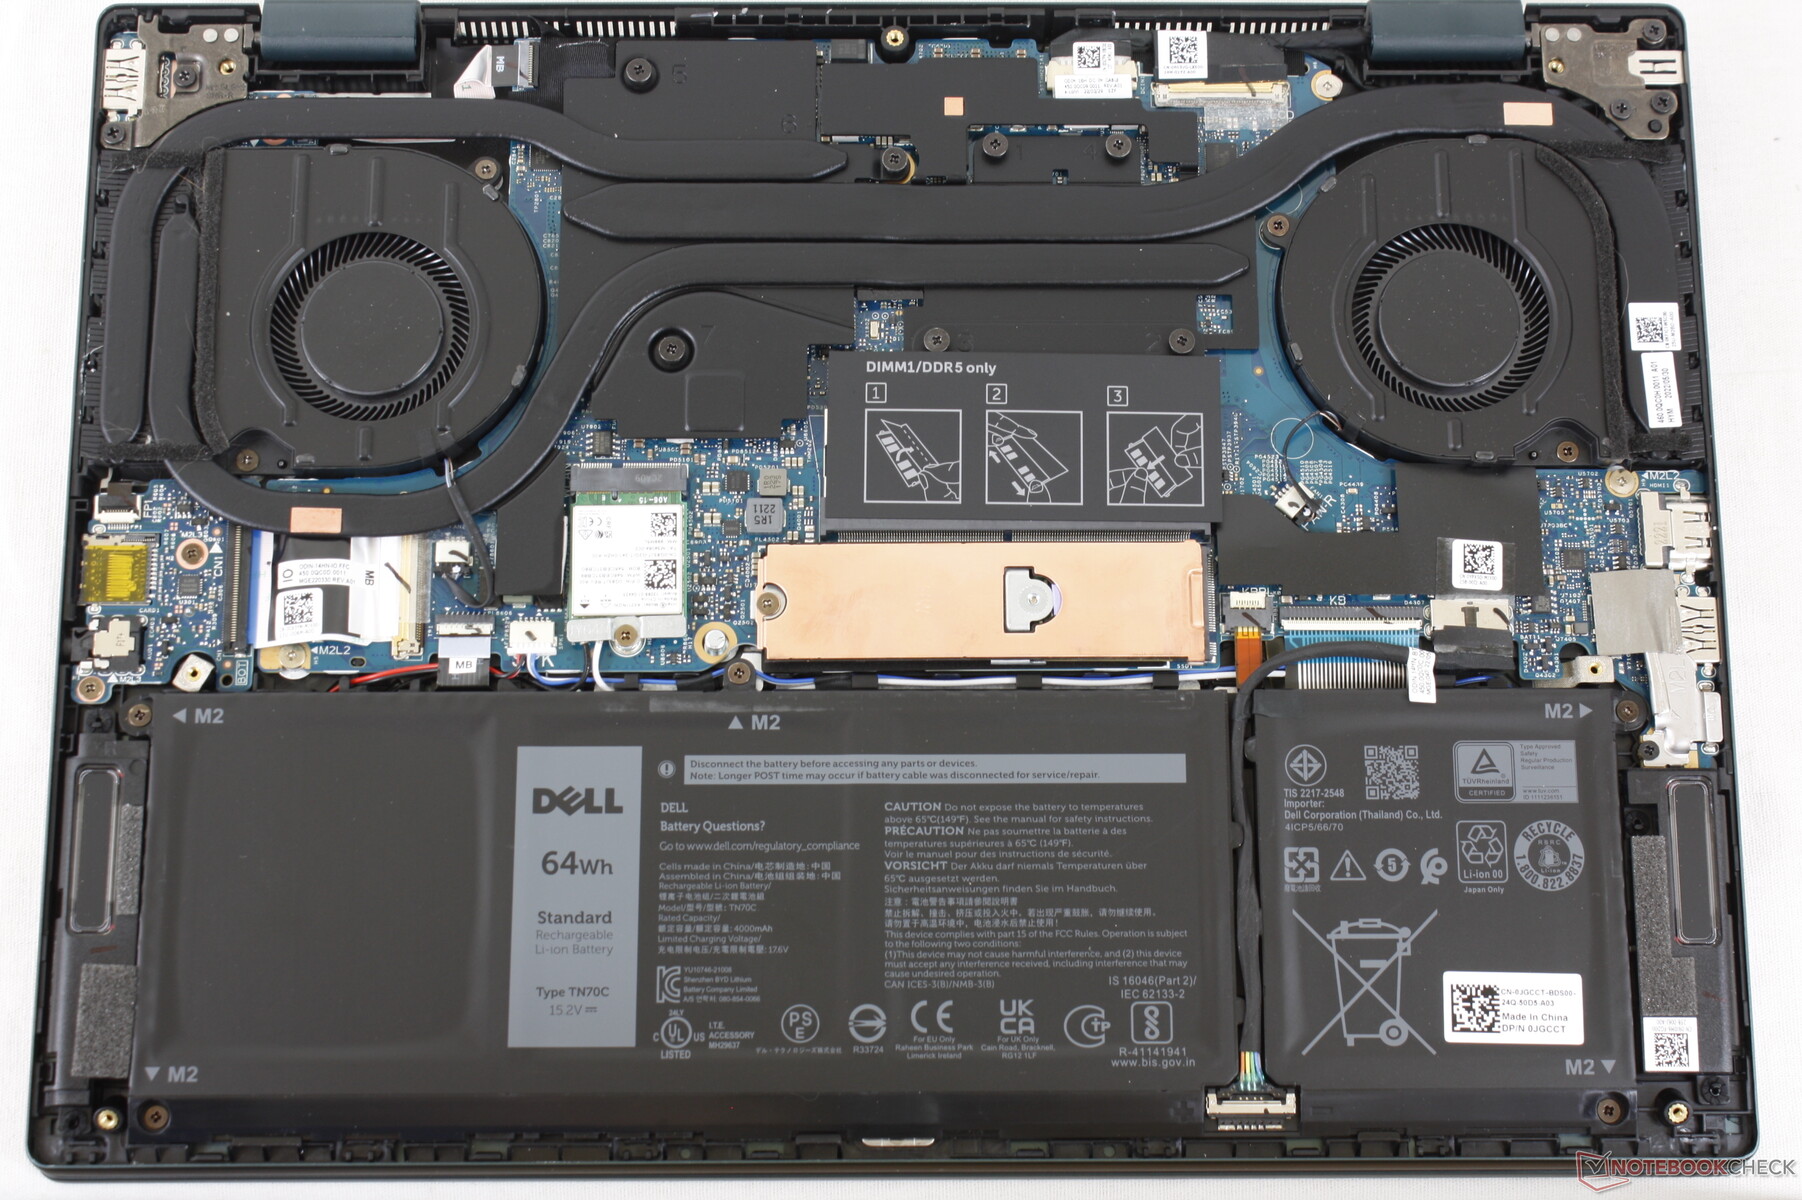
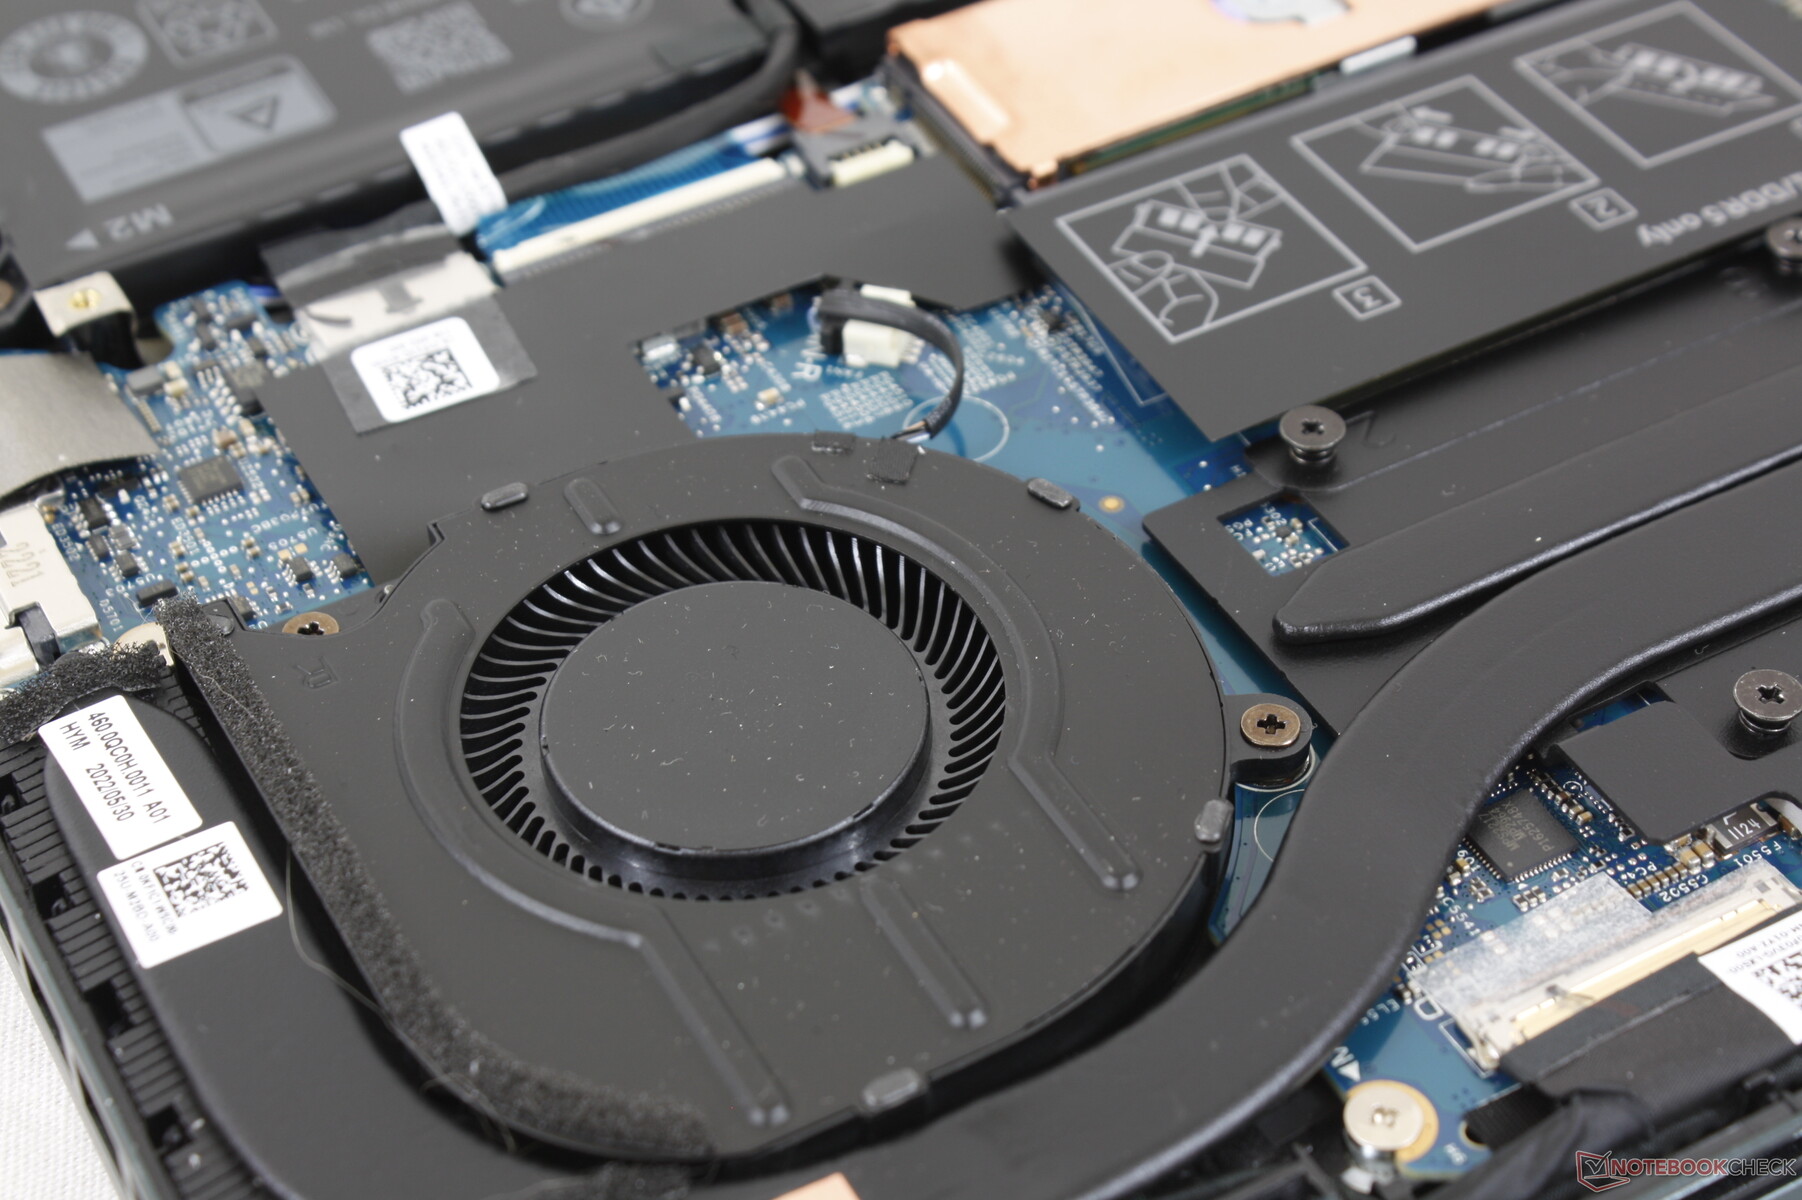
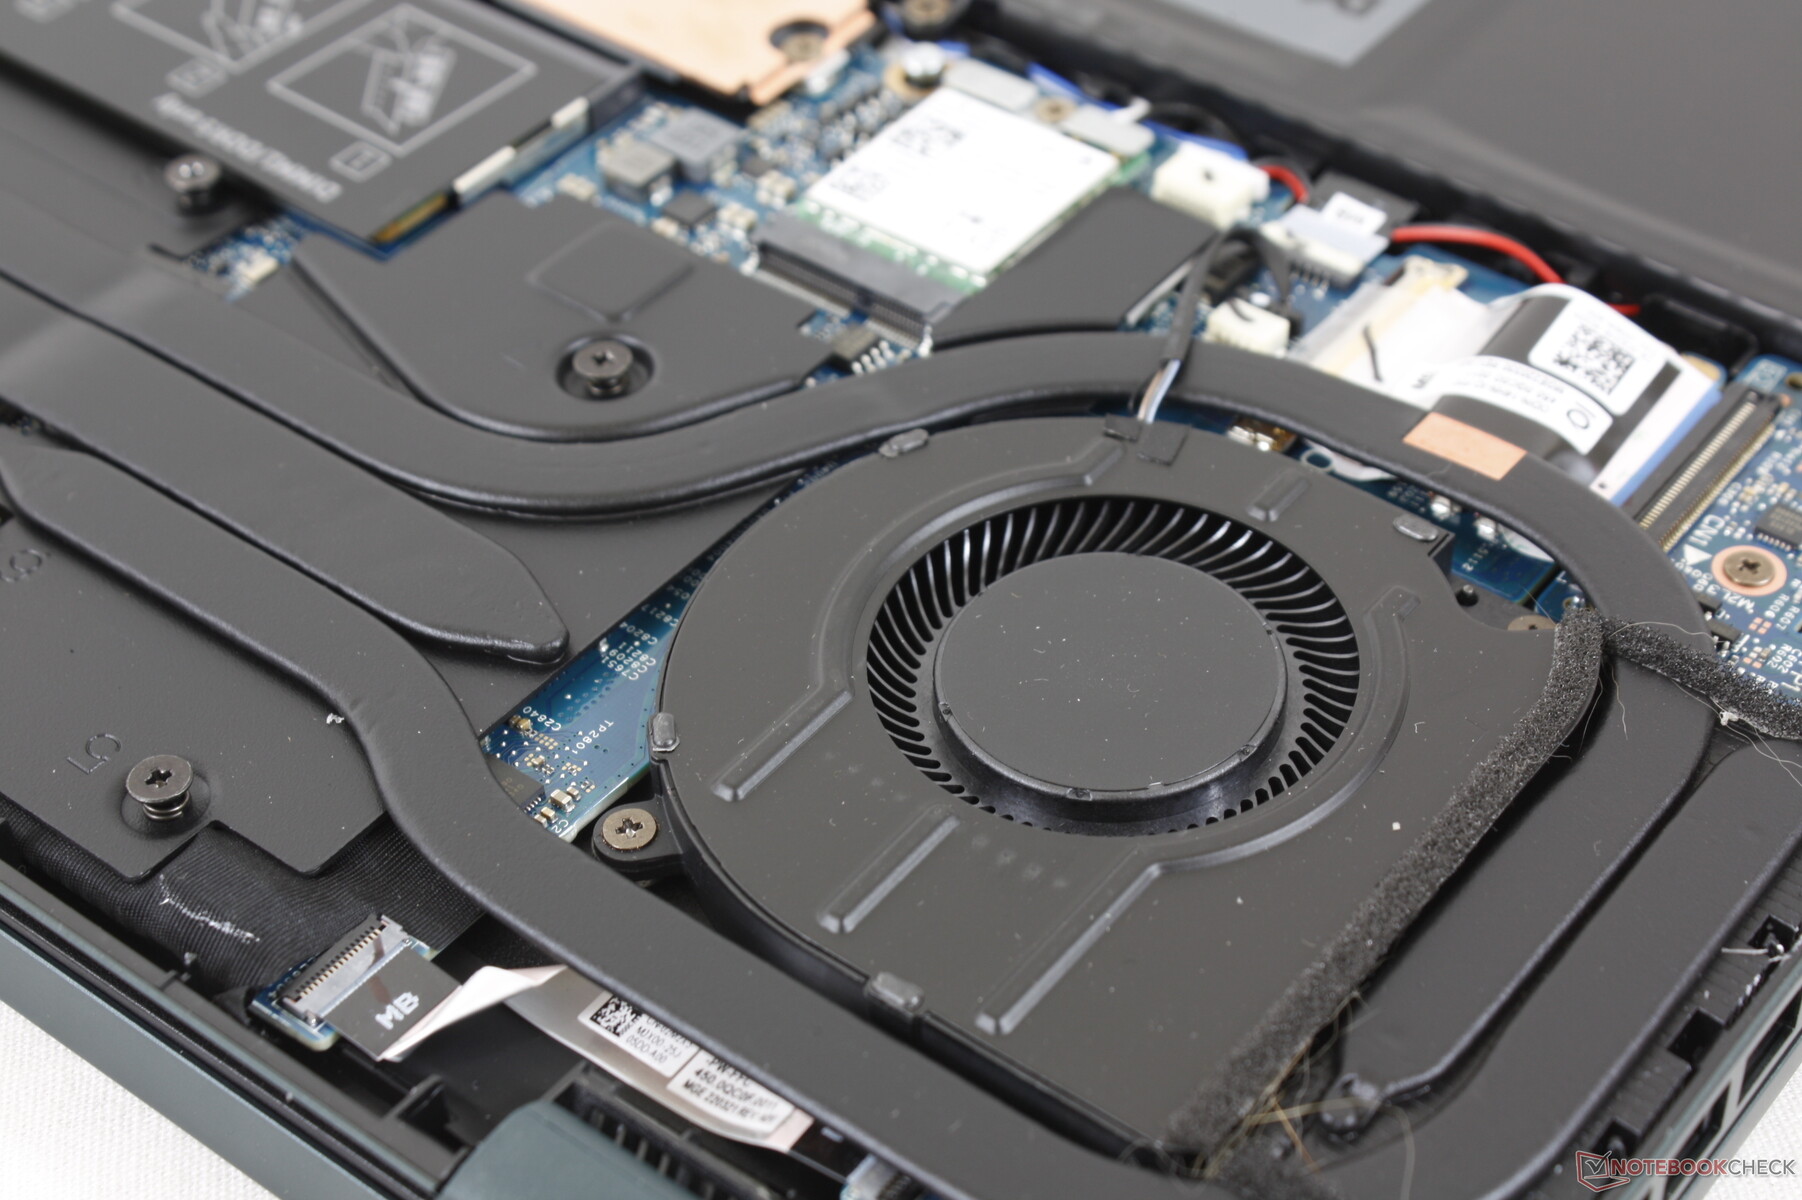
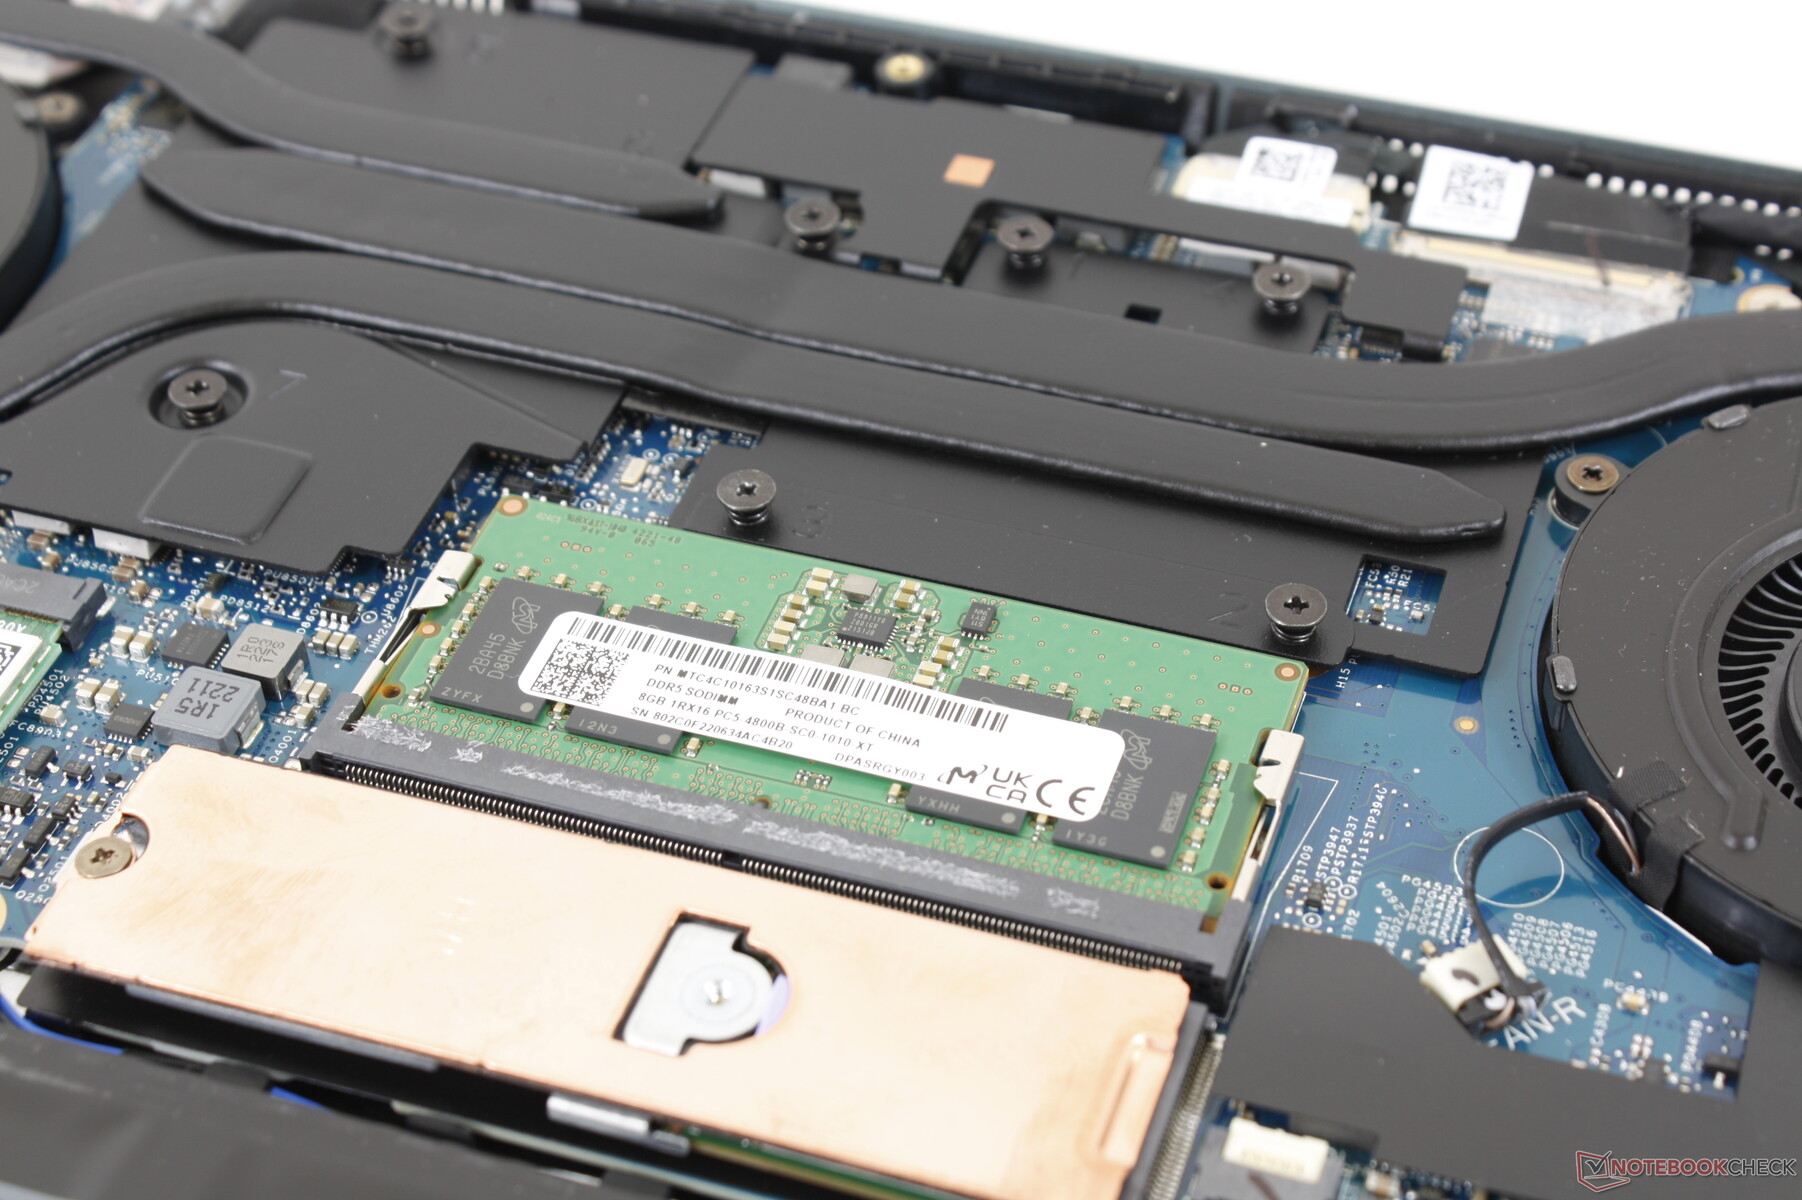
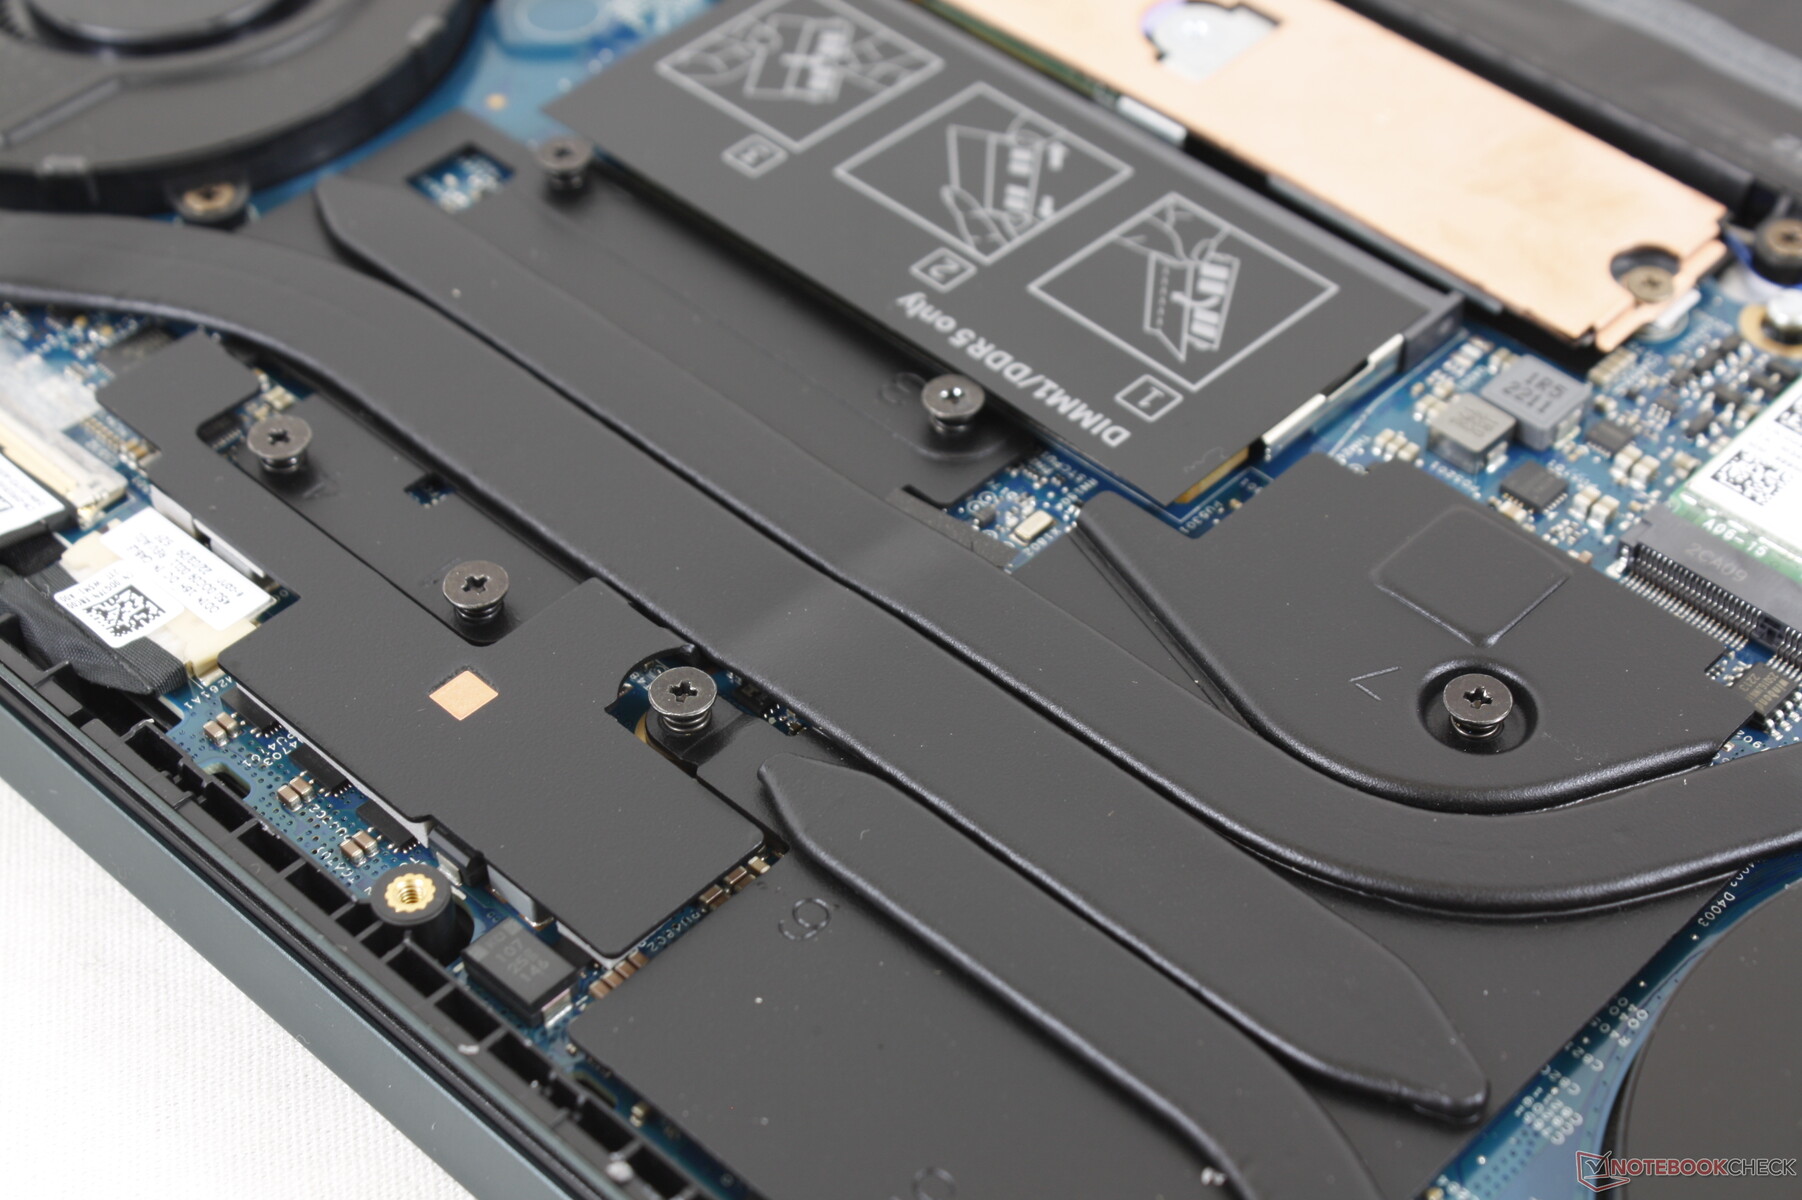
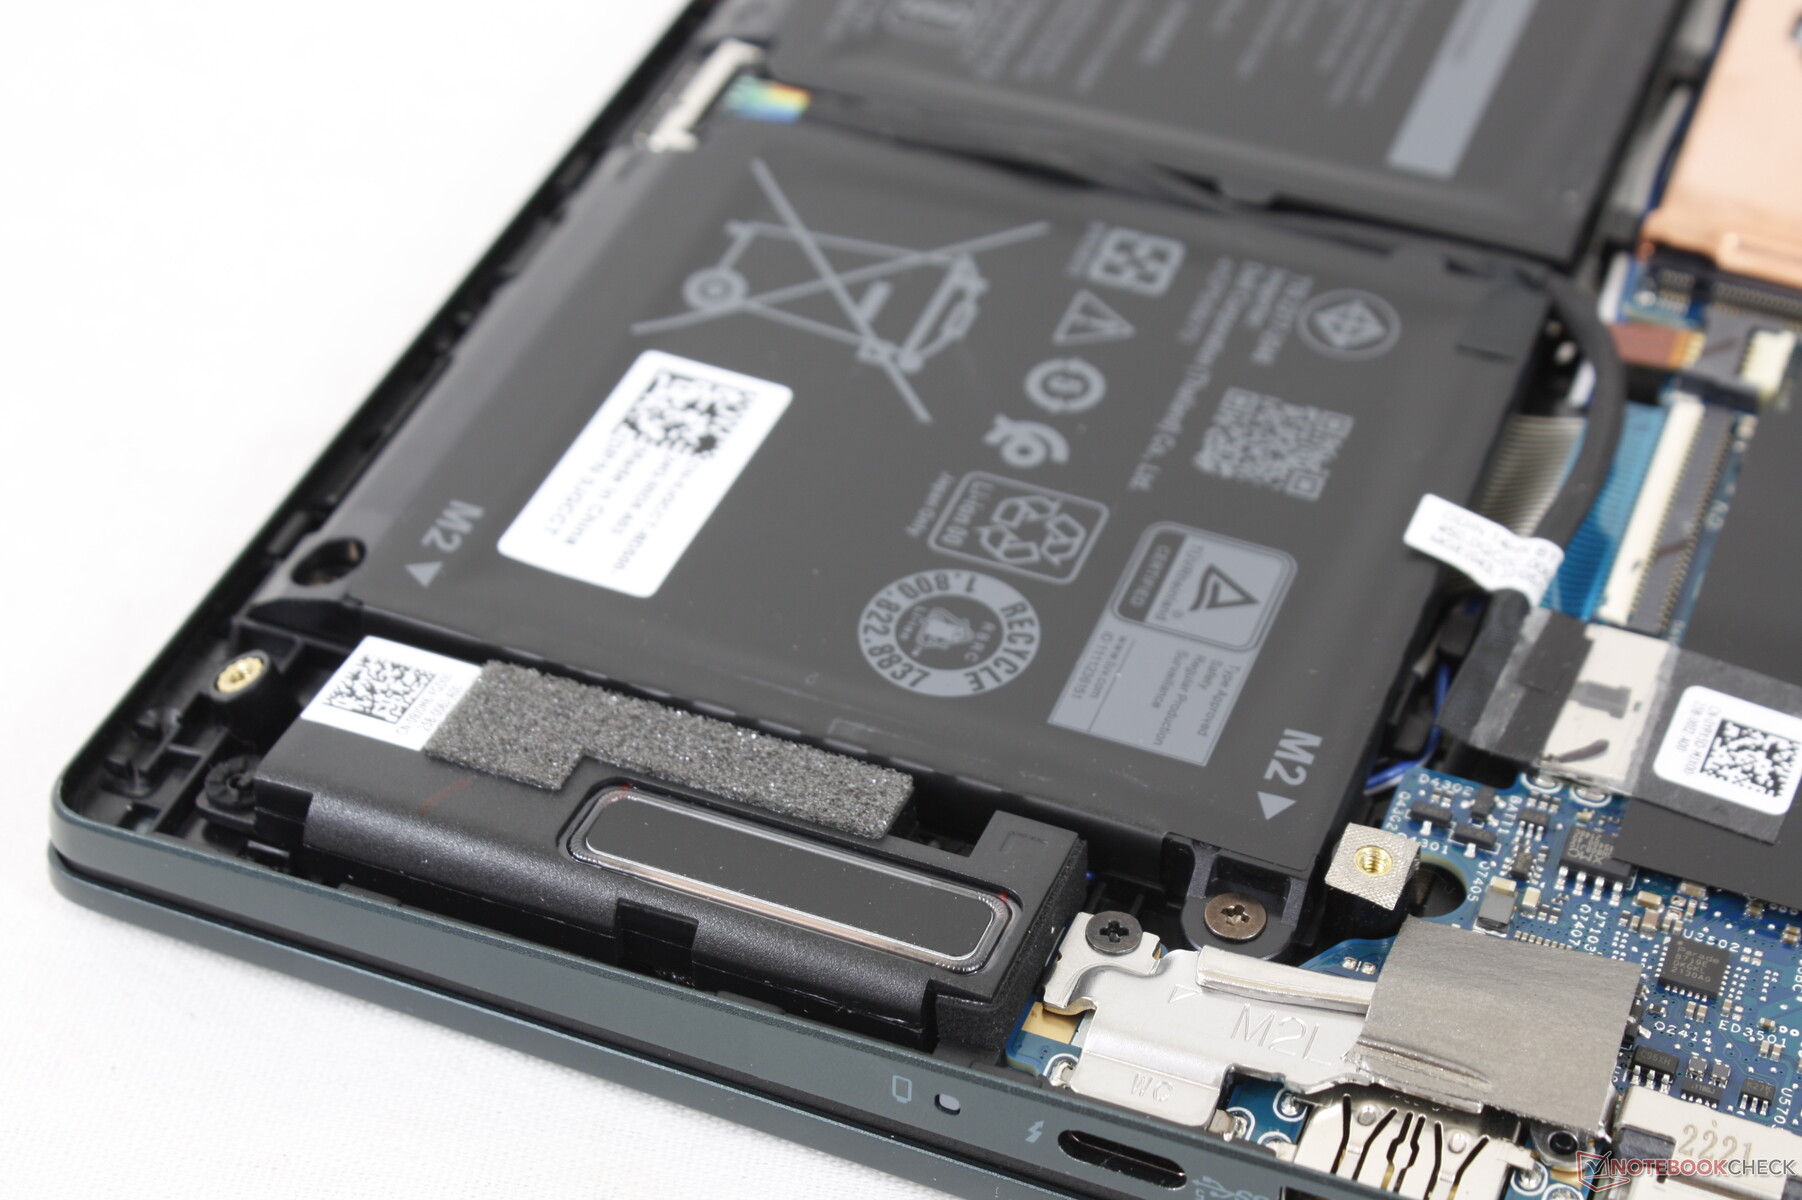
Maintenance
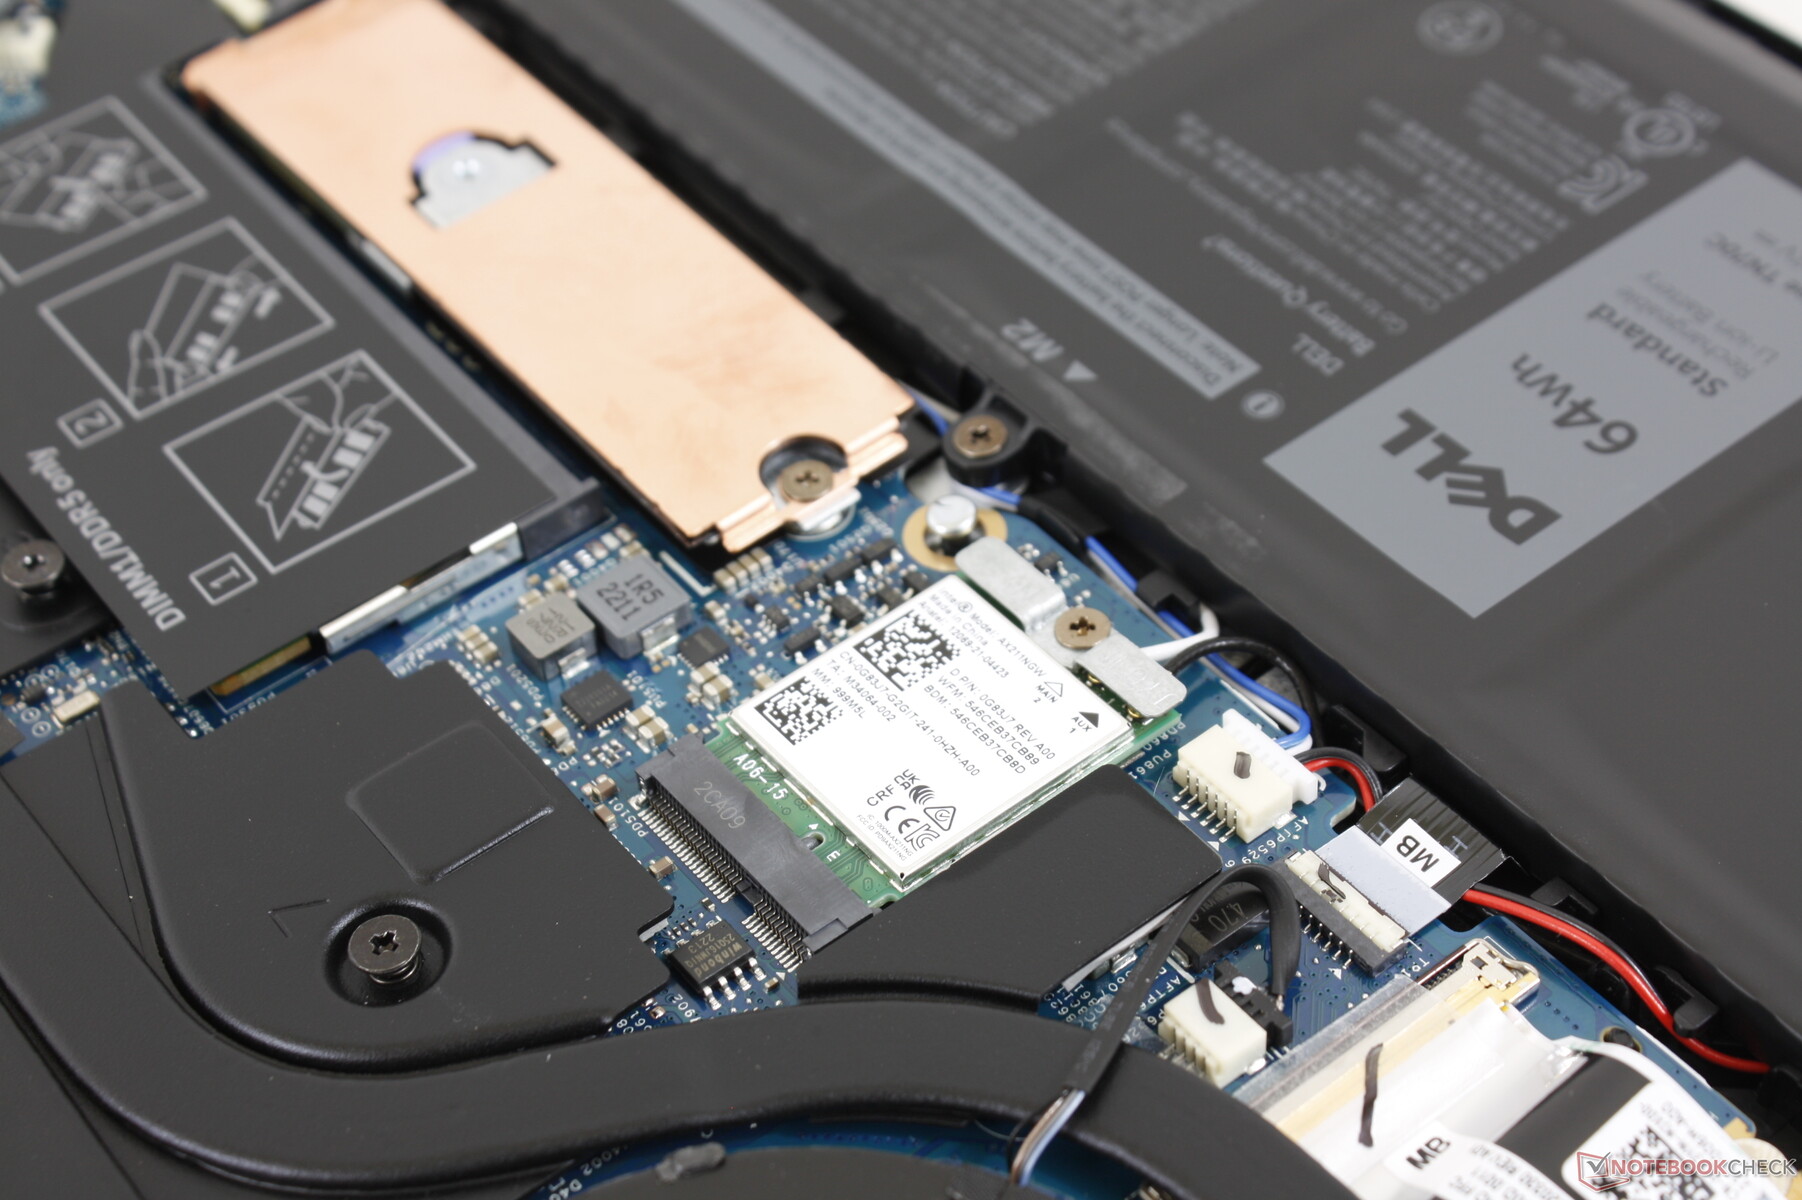
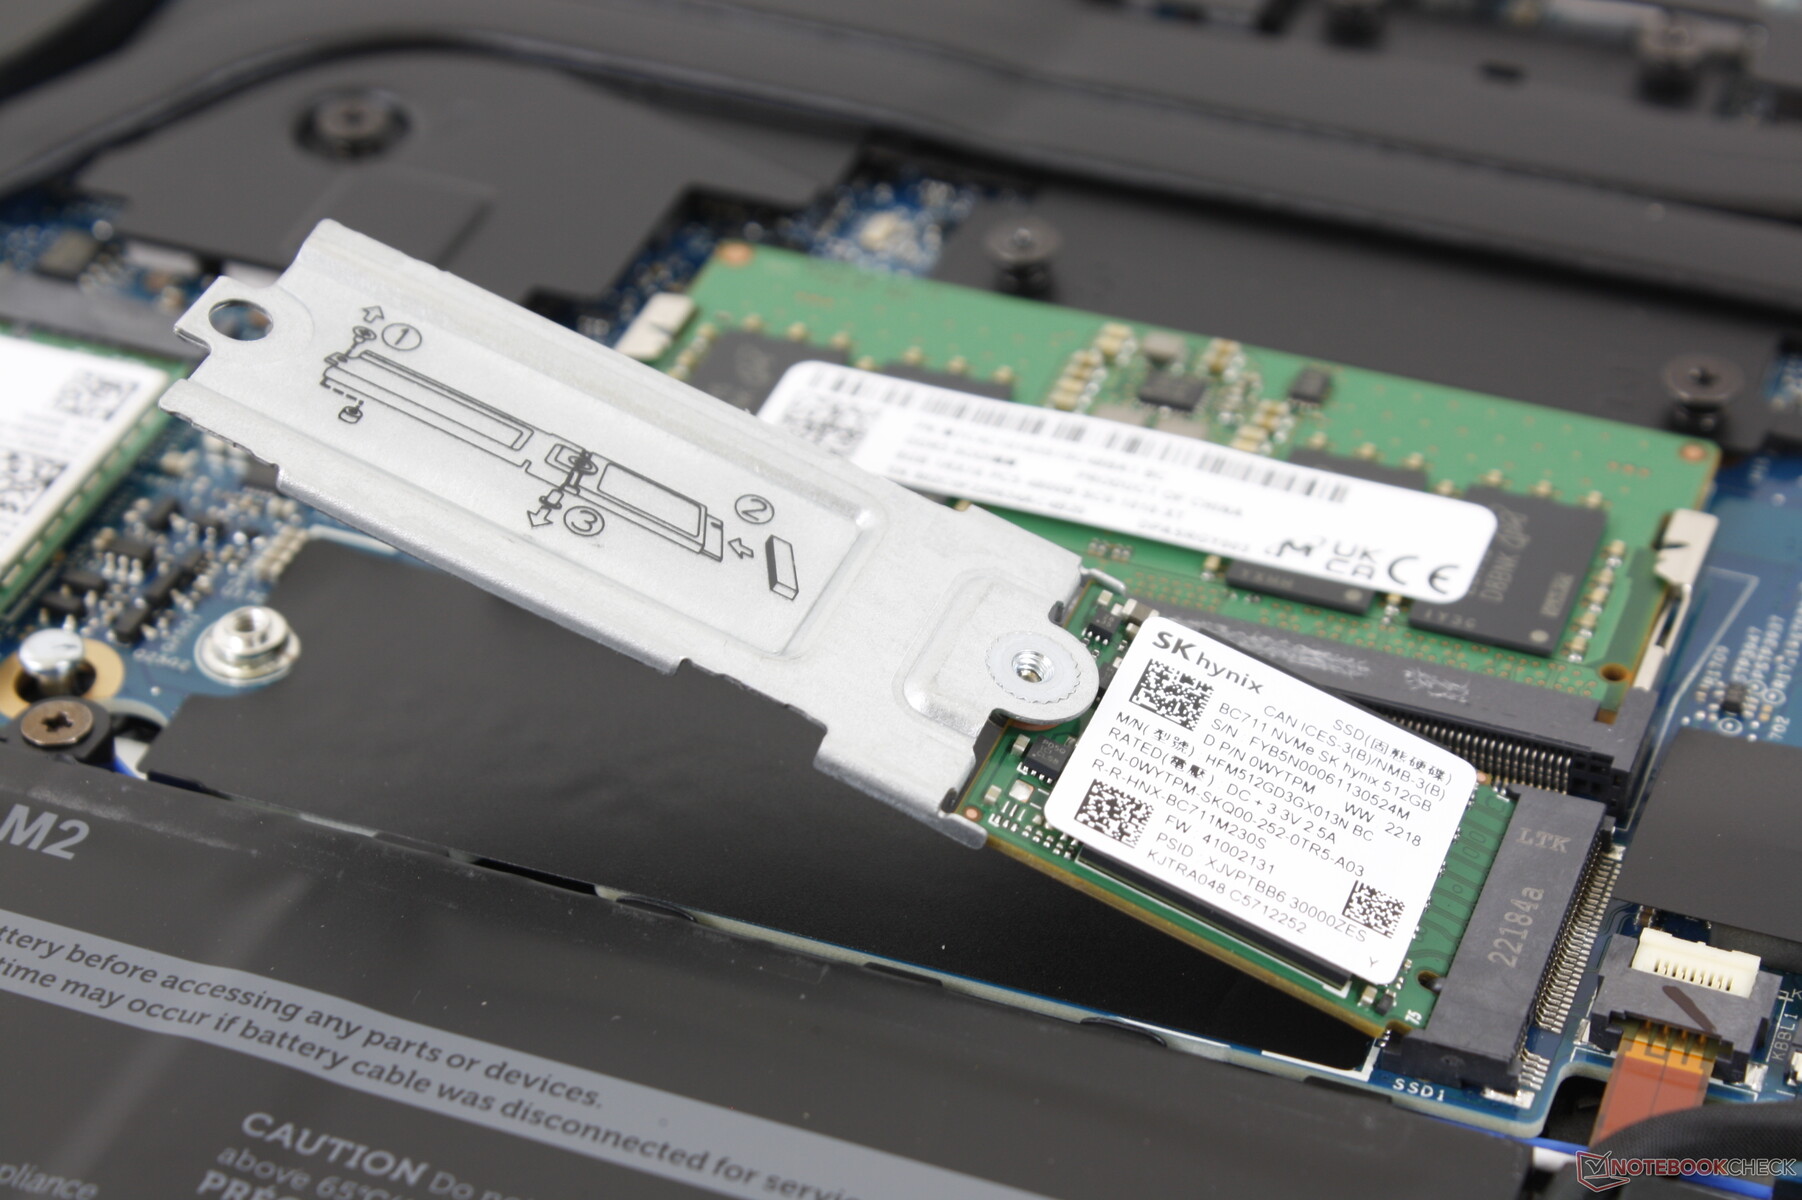
The bottom panel pops off fairly easily with a Philips screwdriver and a sharp plastic edge. Once inside, users can service the battery, 1x M.2 2280 storage slot, 1x DDR5 SODIMM slot, and M.2 WLAN module. Note that 8 GB of RAM comes soldered on all SKUs meaning users can add just a single module for a maximum RAM capacity of 40 GB.
Accessories and Warranty
There are no extras in the box other than the AC adapter and paperwork. The usual one-year limited warranty applies if purchased in the US.
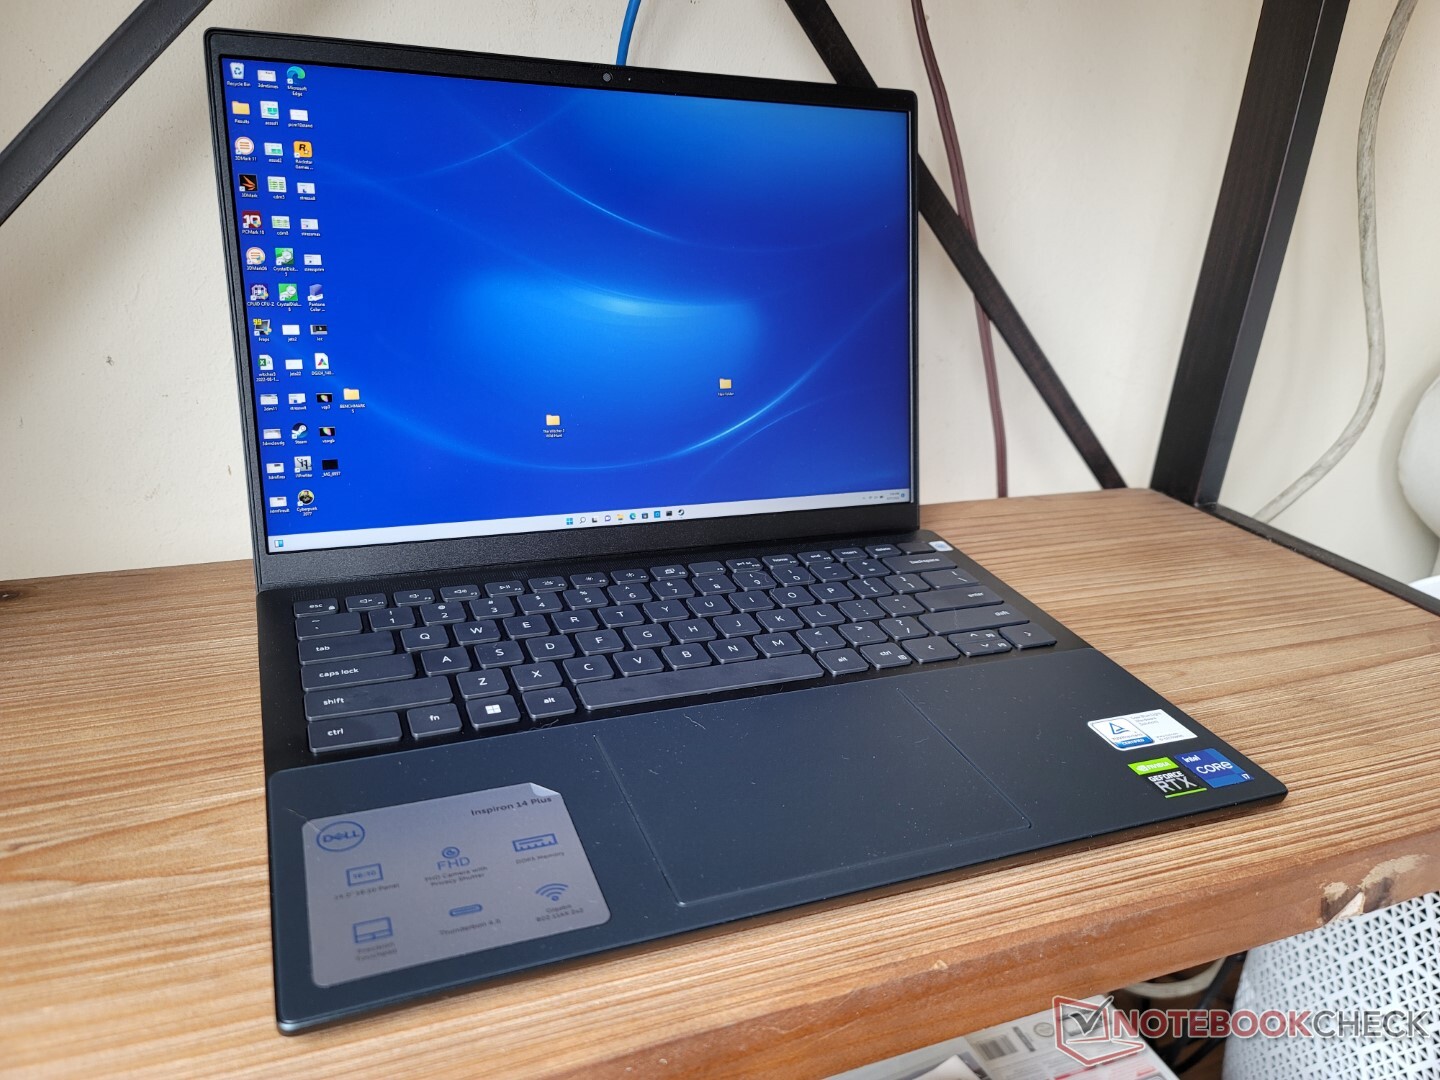
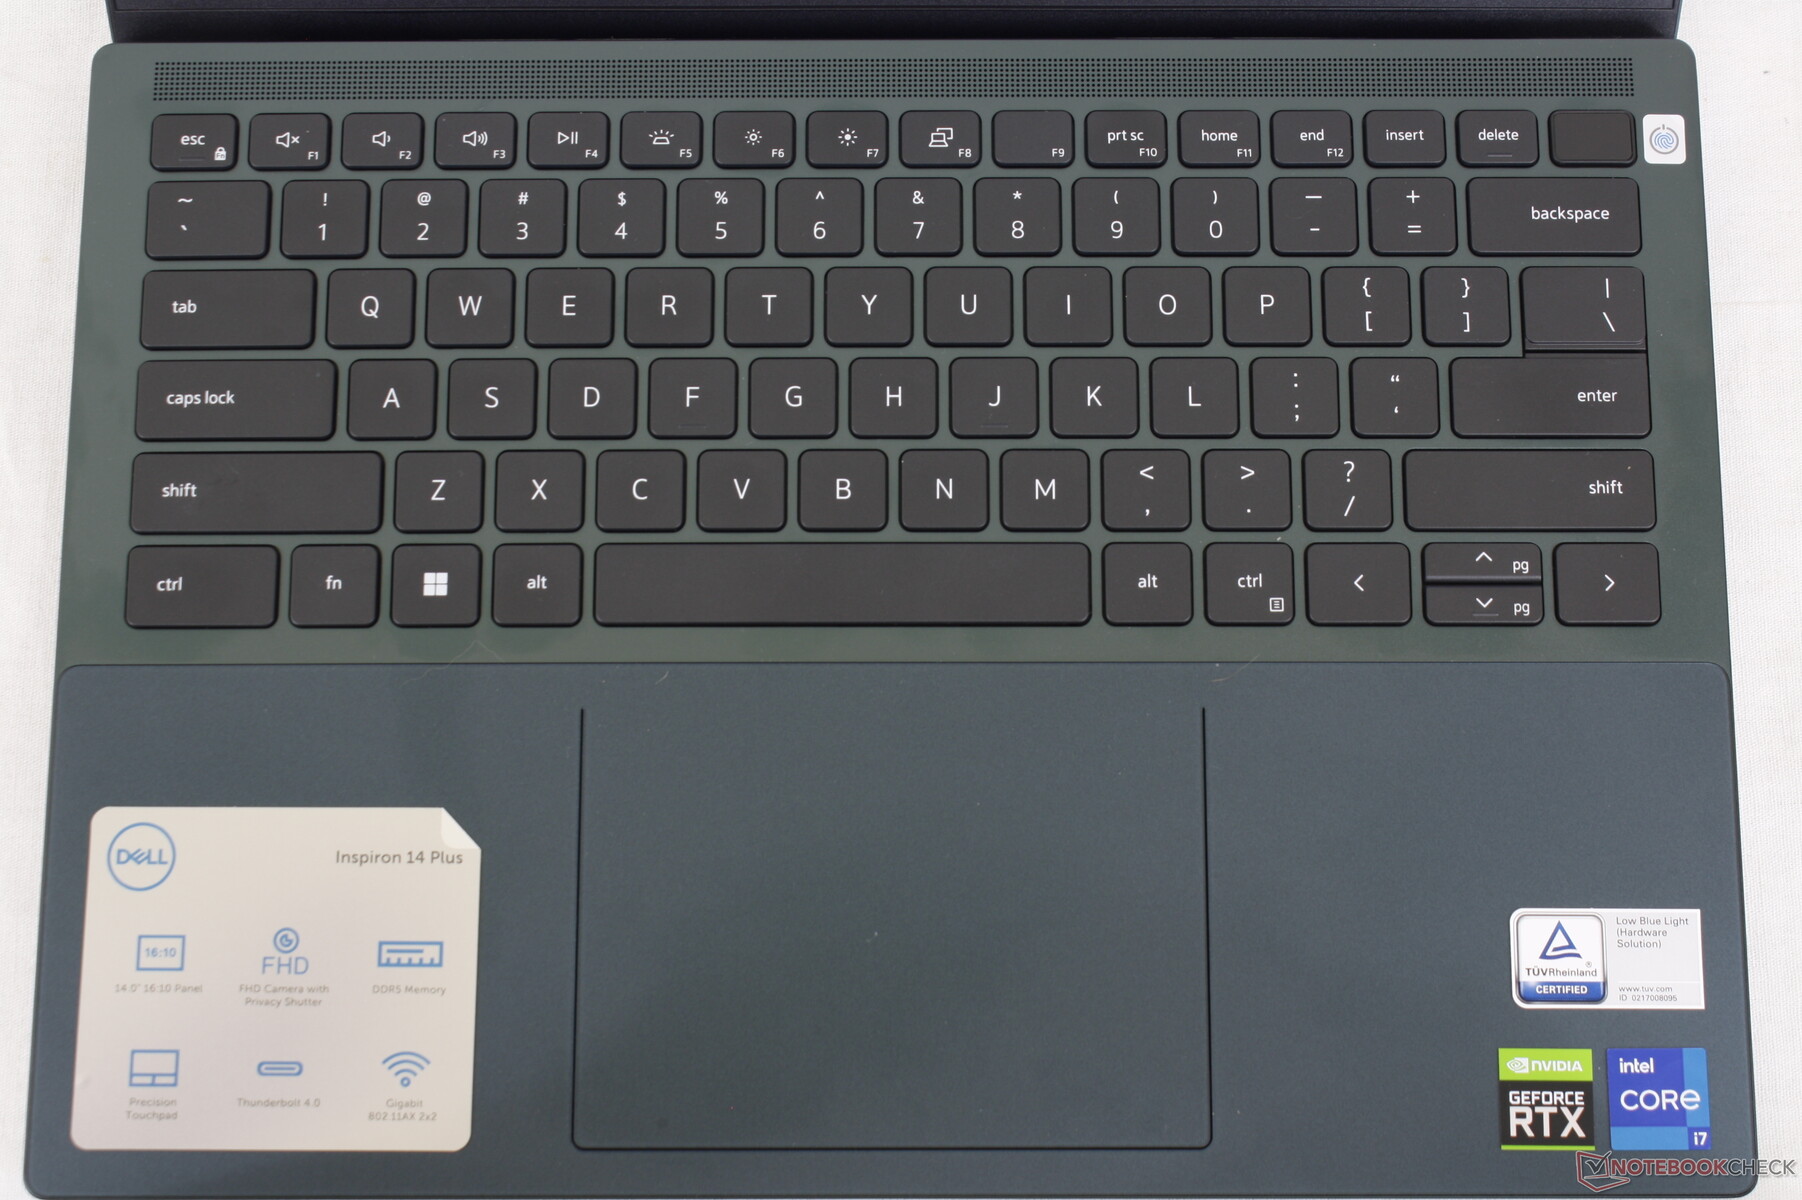
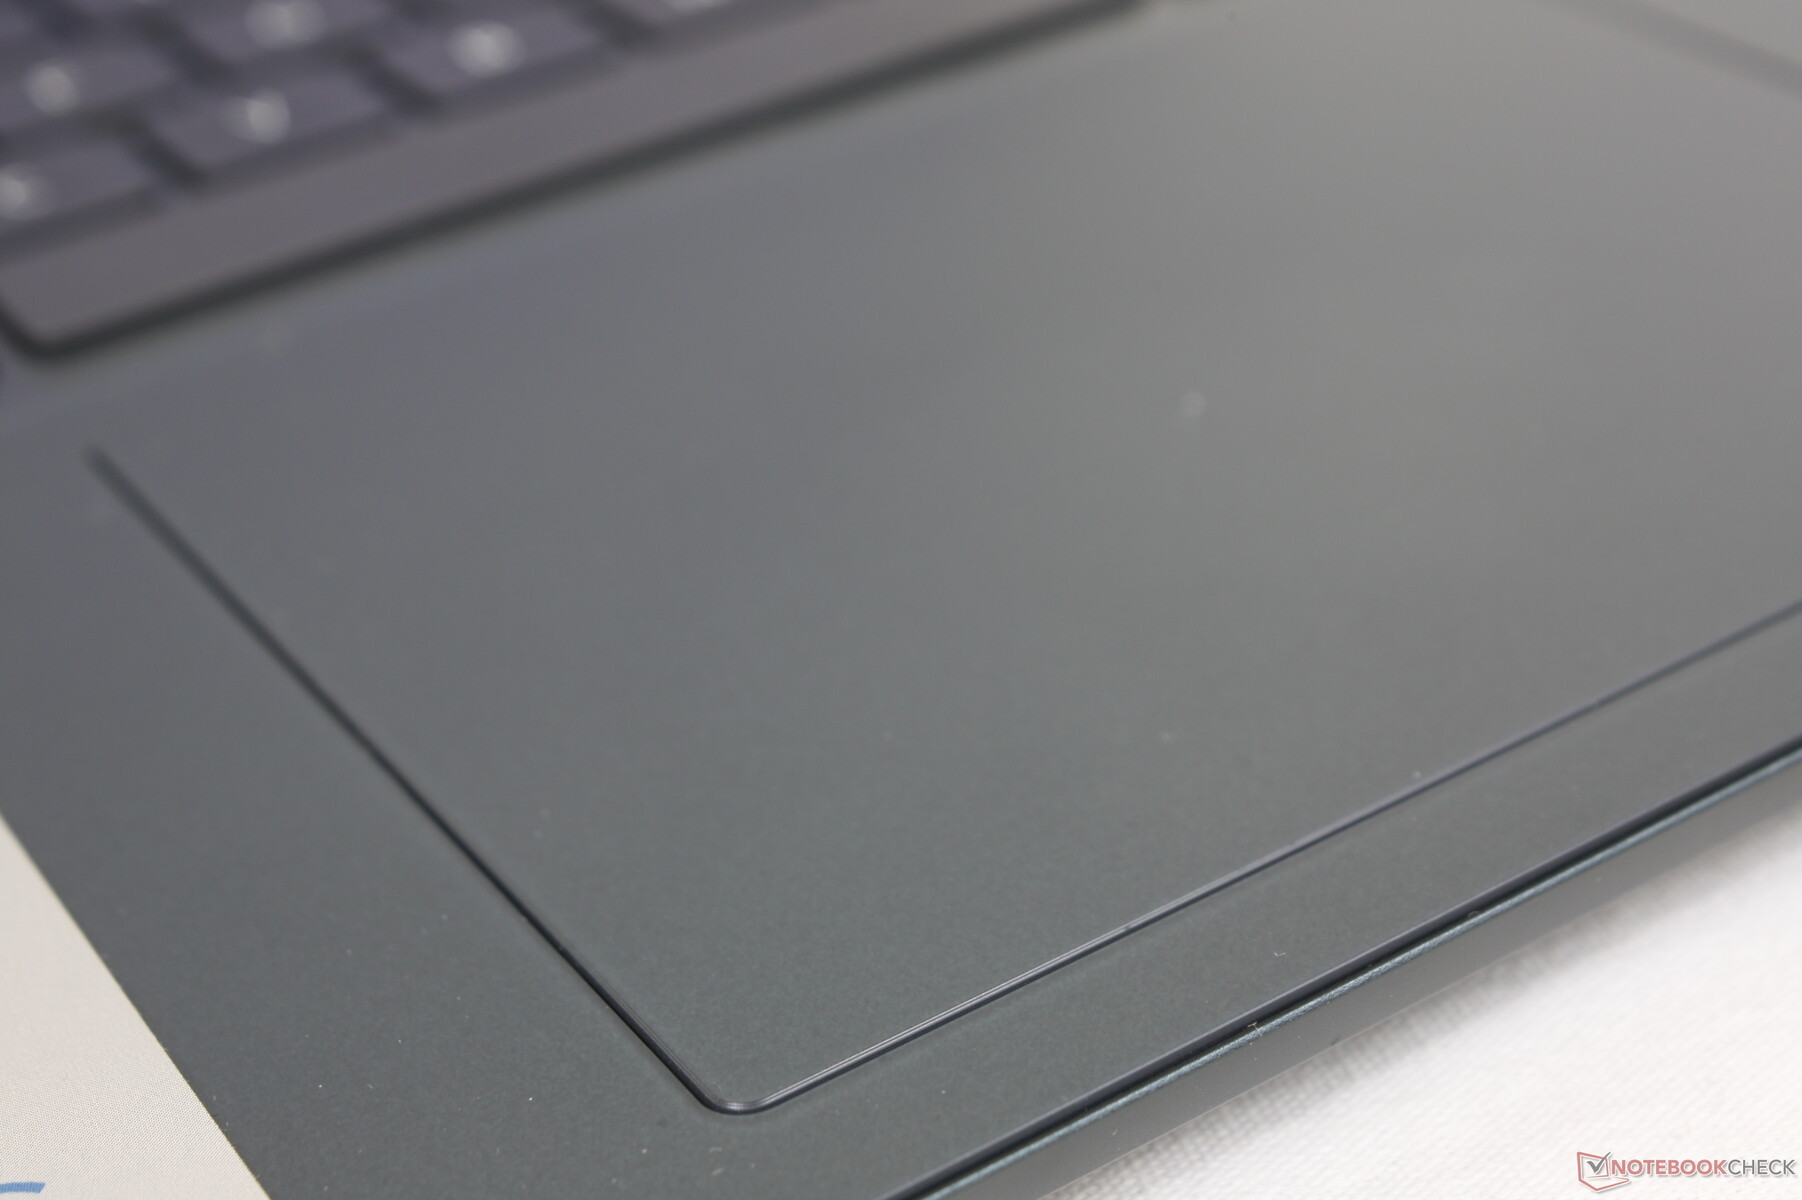
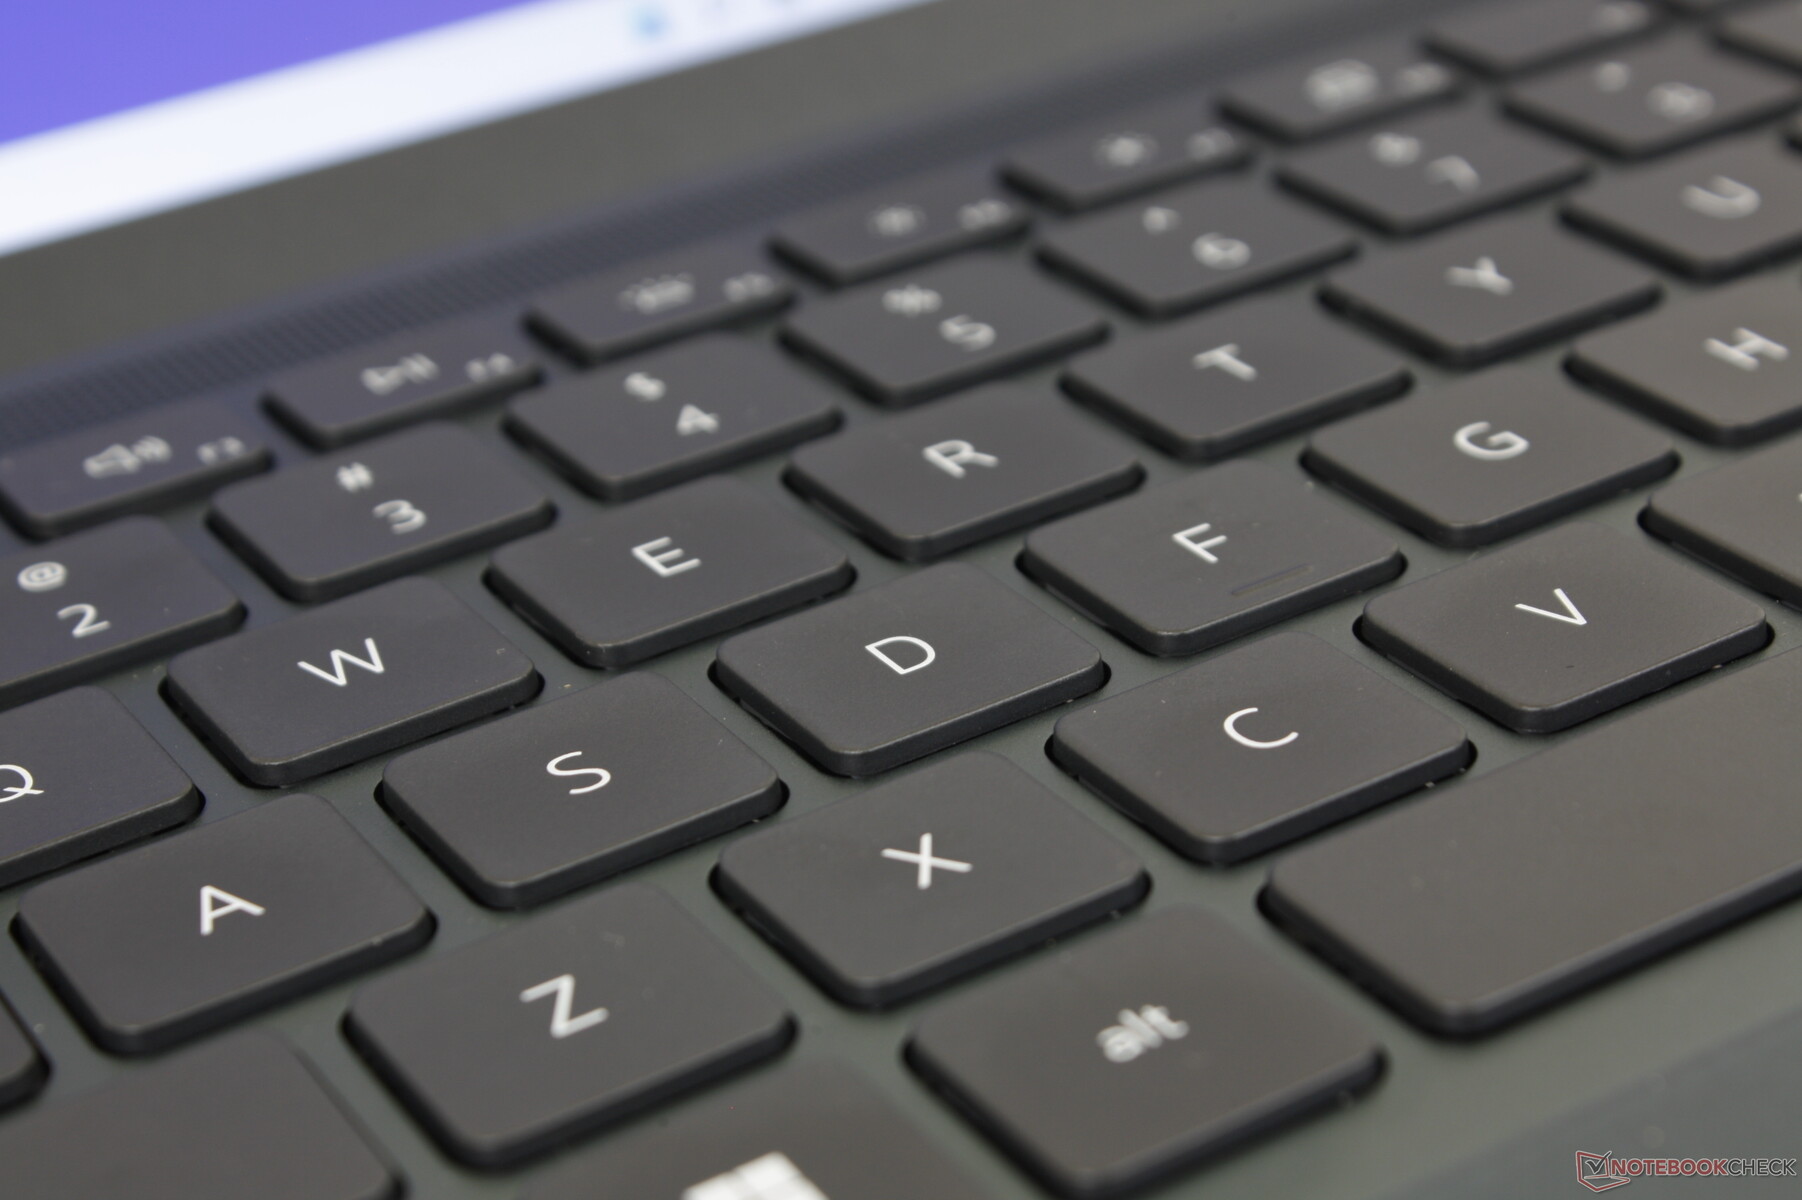
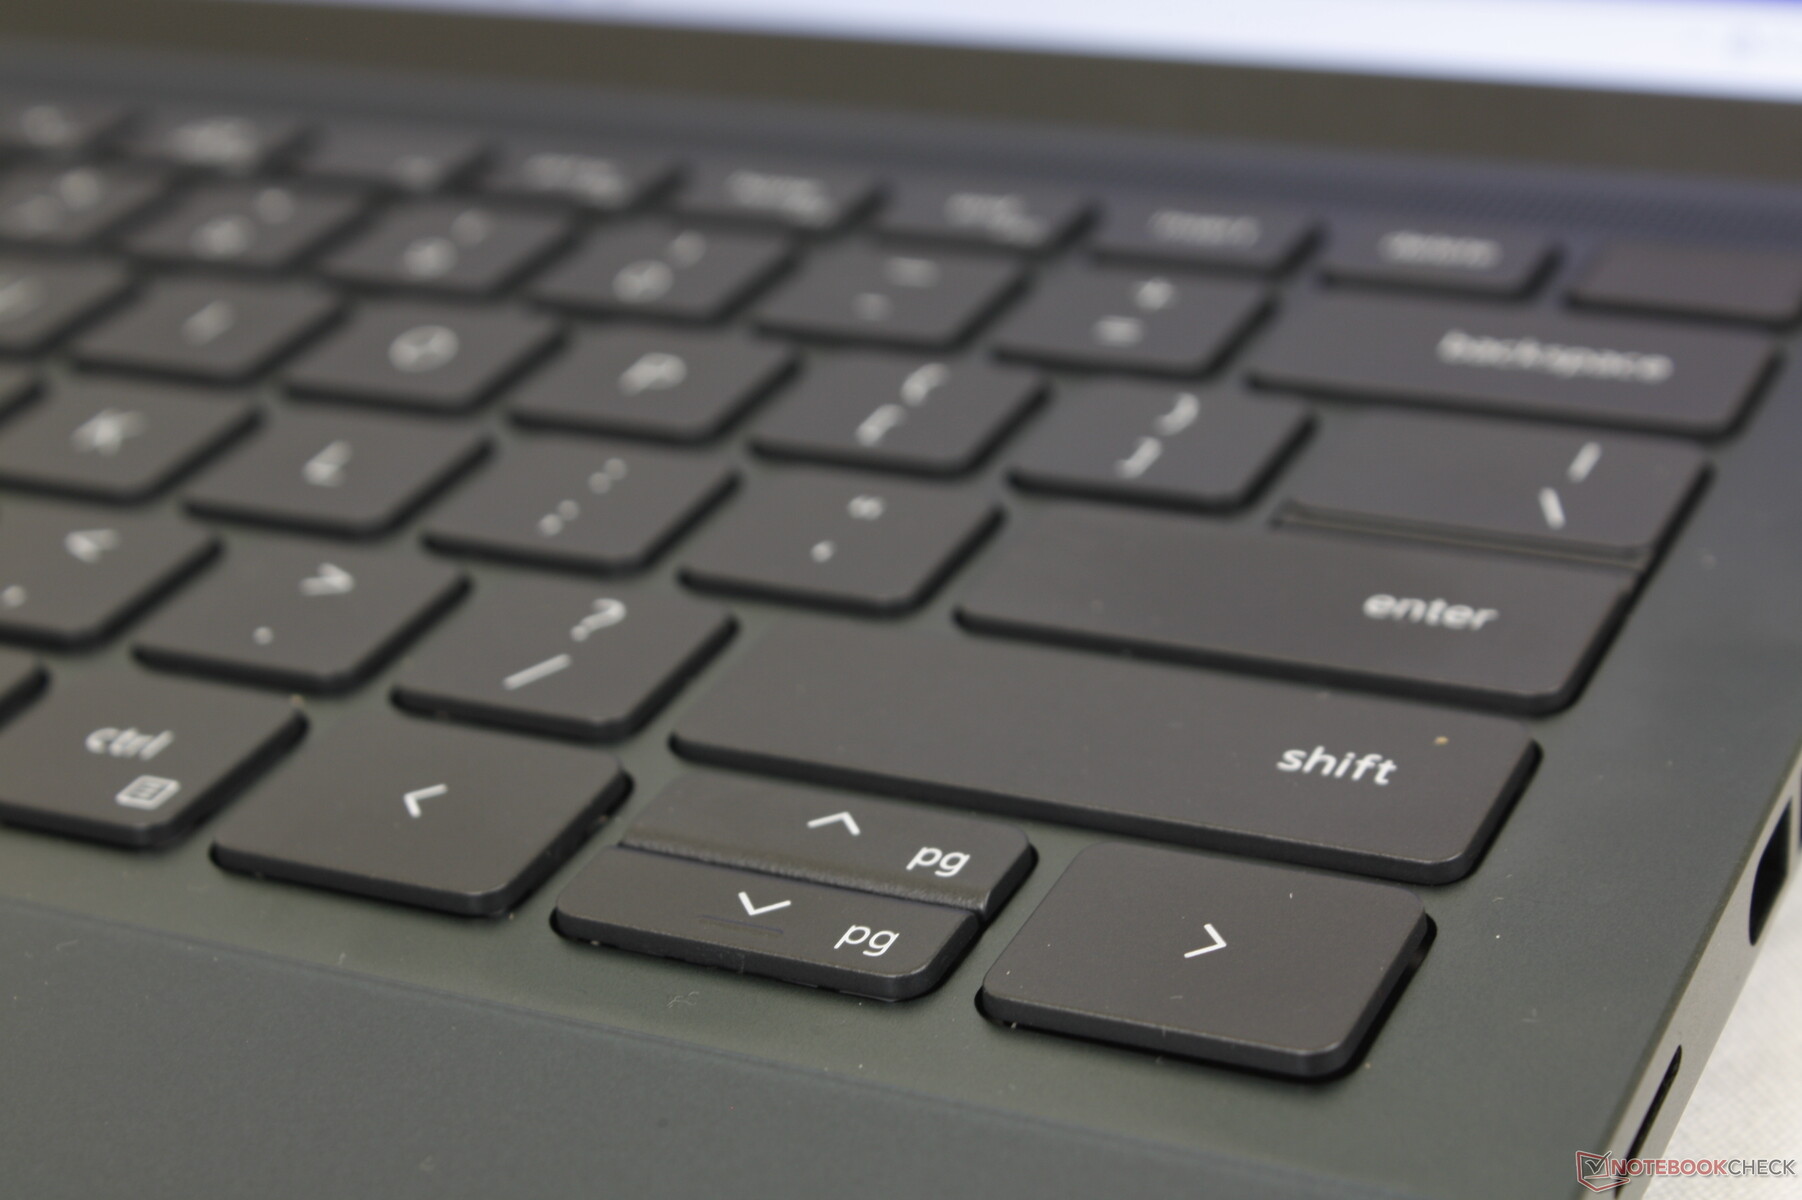
Input Devices — Been Here, Seen That
Keyboard and Touchpad
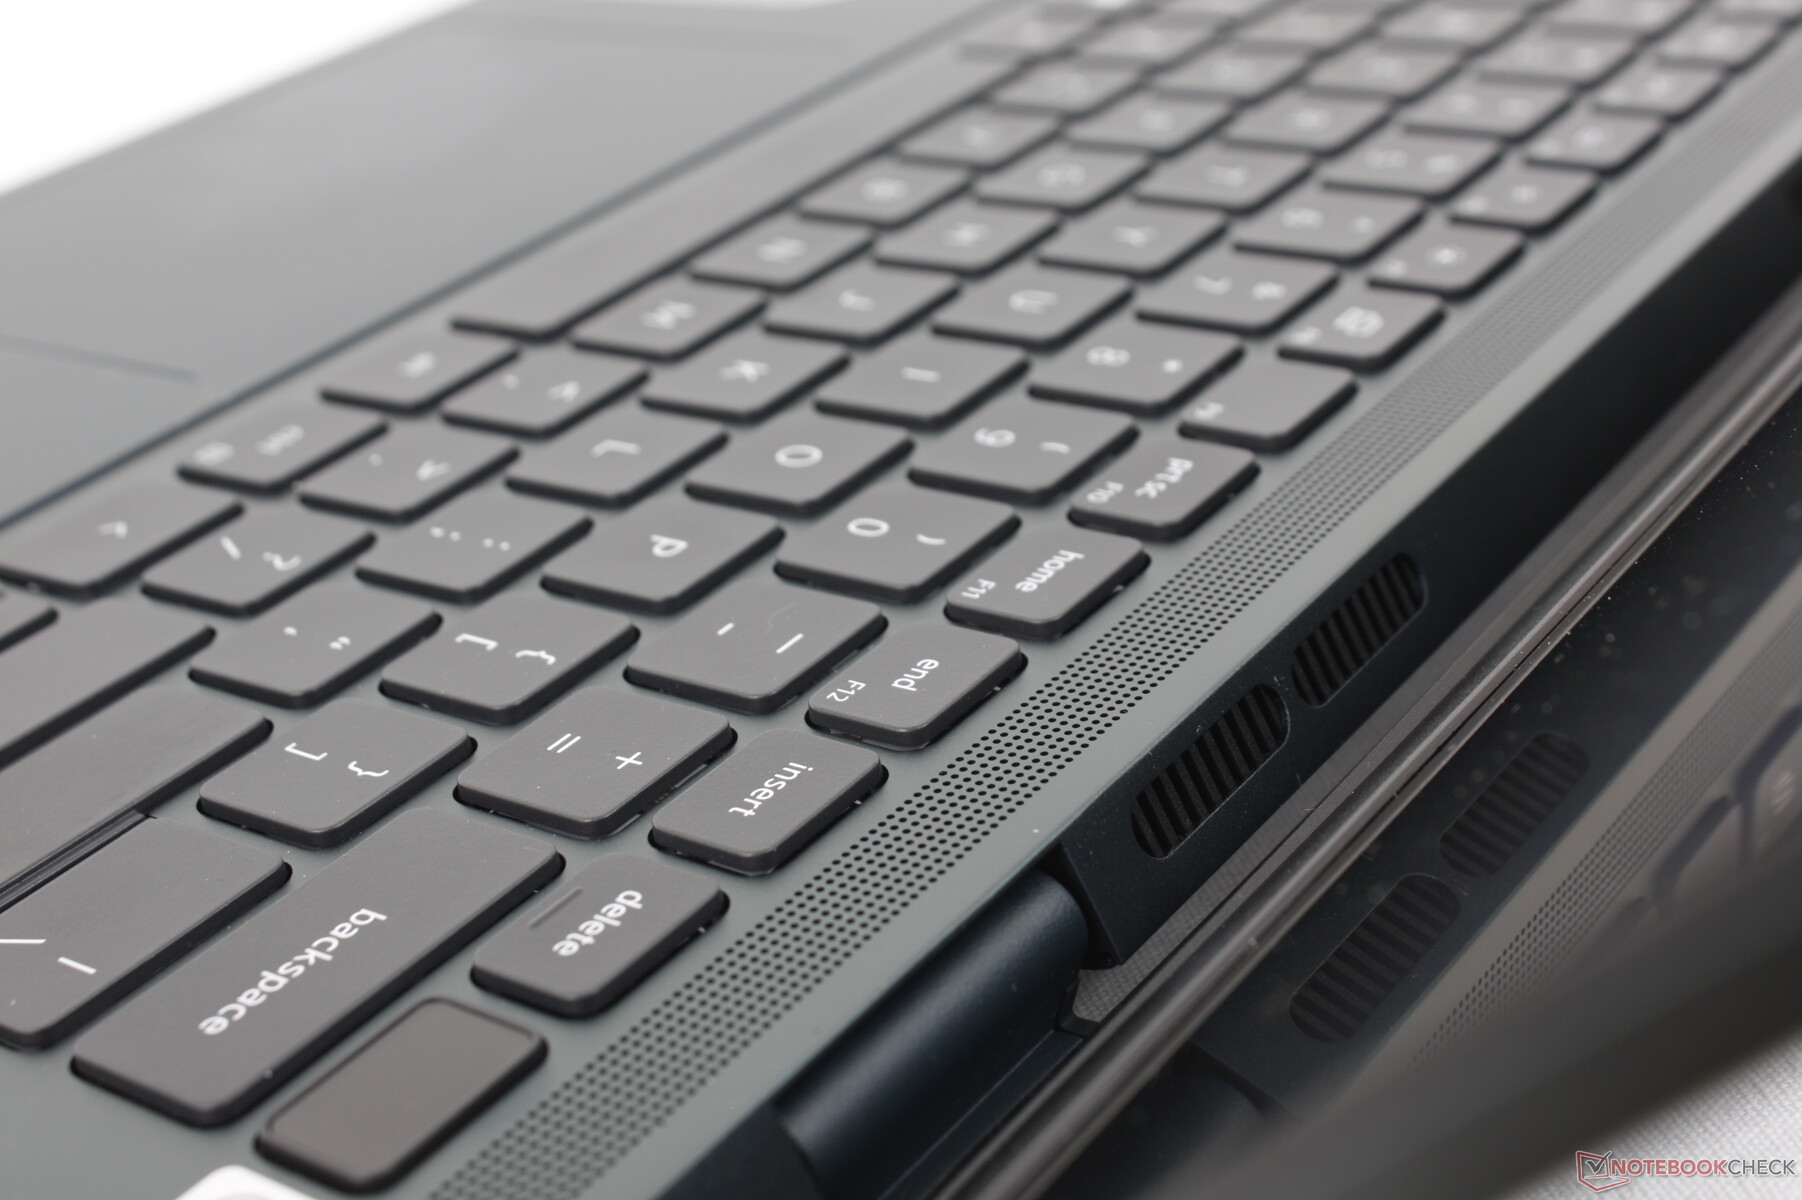
The typing experience is the same as on the Inspiron 16 Plus 7620, Inspiron 16 7620 2-in-1, or Inspiron 14 7420 2-in-1 as all four models share the same keyboard keys and Mylar clickpad. Even the primary and secondary key symbols and size of the clickpad (11.5 x 8 cm) are identical between the models regardless of any screen size differences. In short, the keys have adequate feedback and moderate clatter save for the Space key which feels a bit too shallow. Similarly, the clickpad surface works reliably for standard cursor control while its integrated keys are too soft and spongy when dragging and dropping.
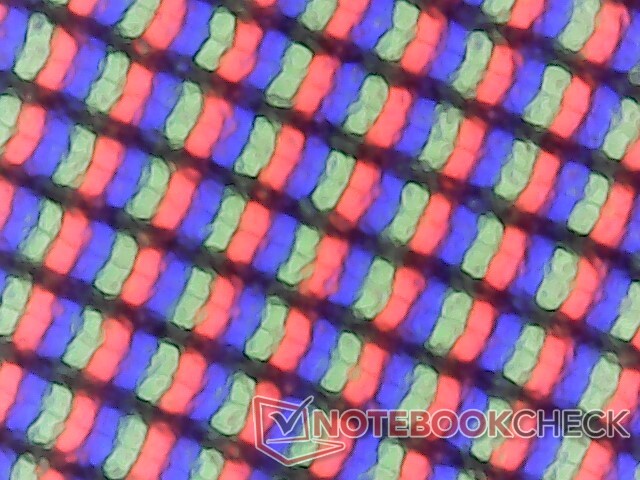
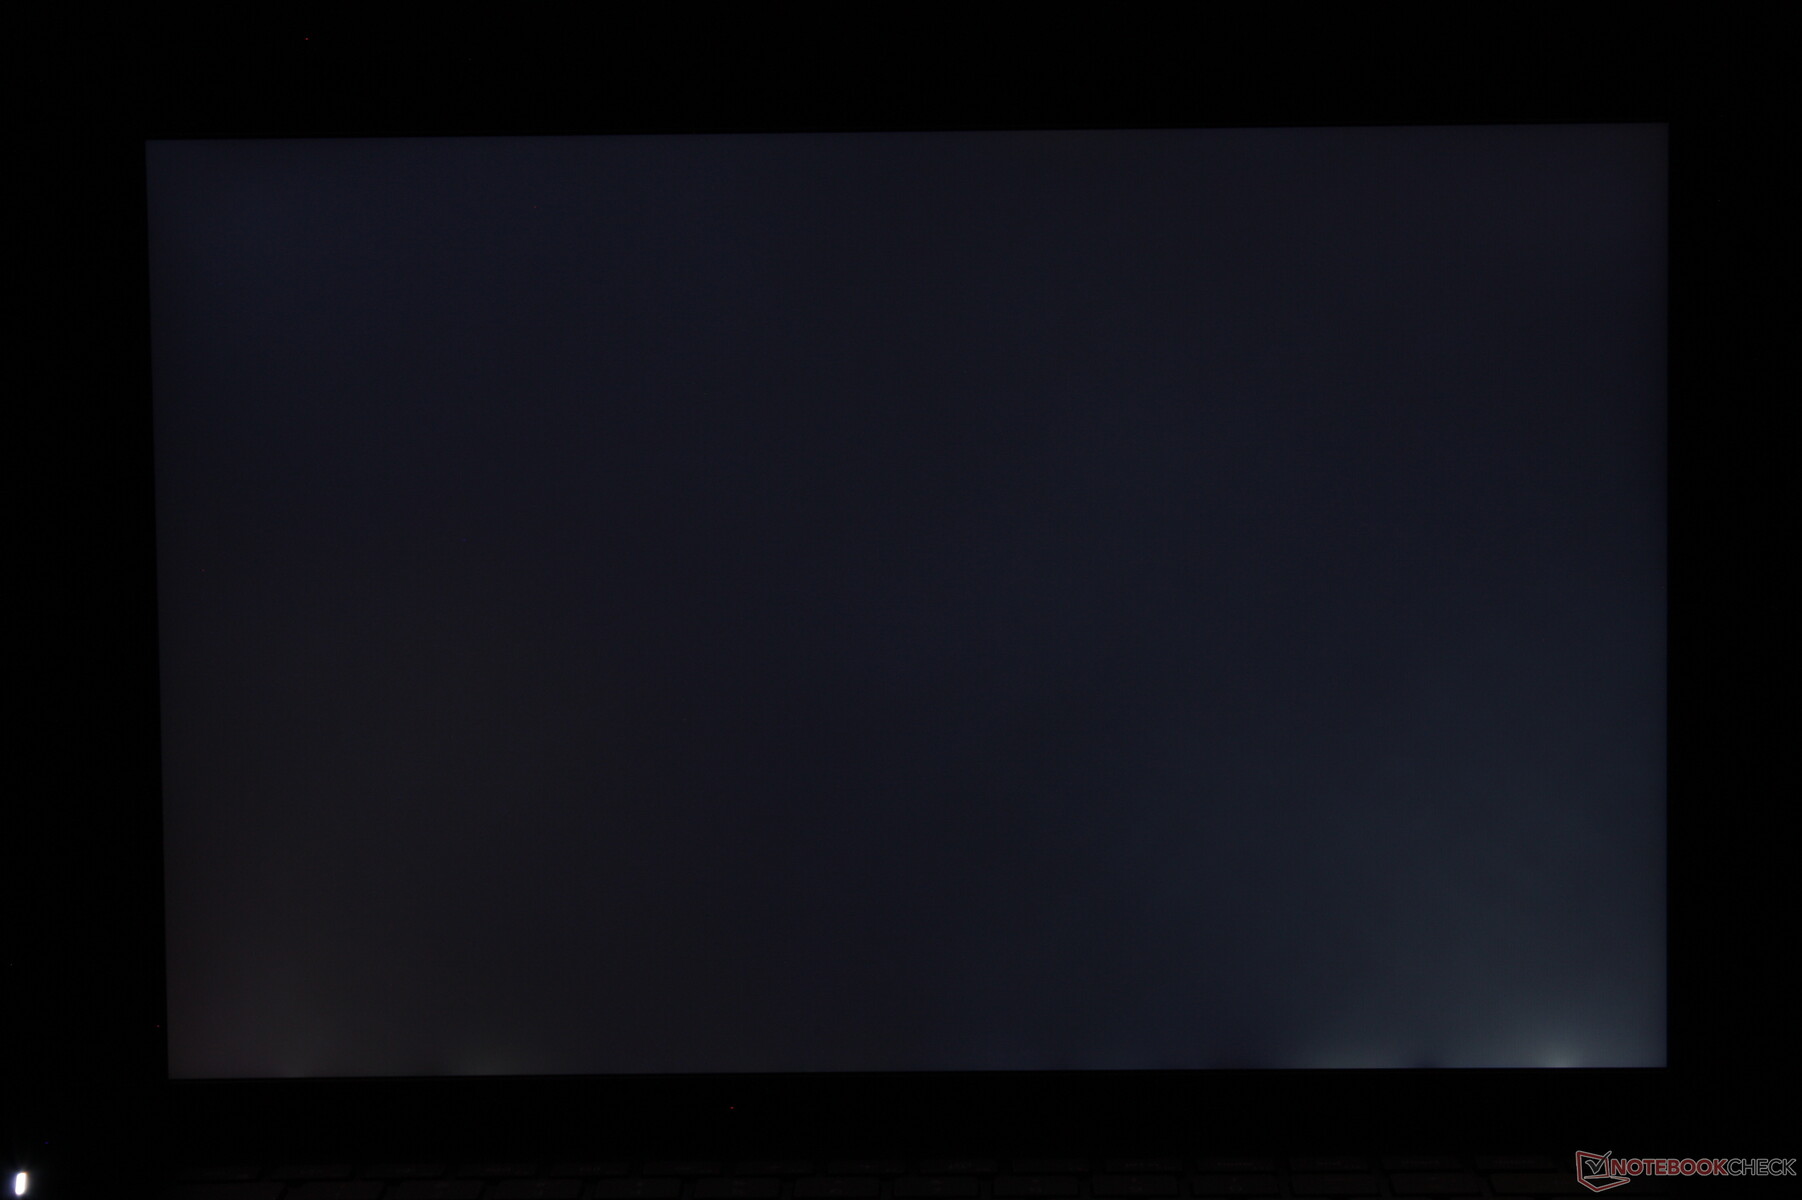
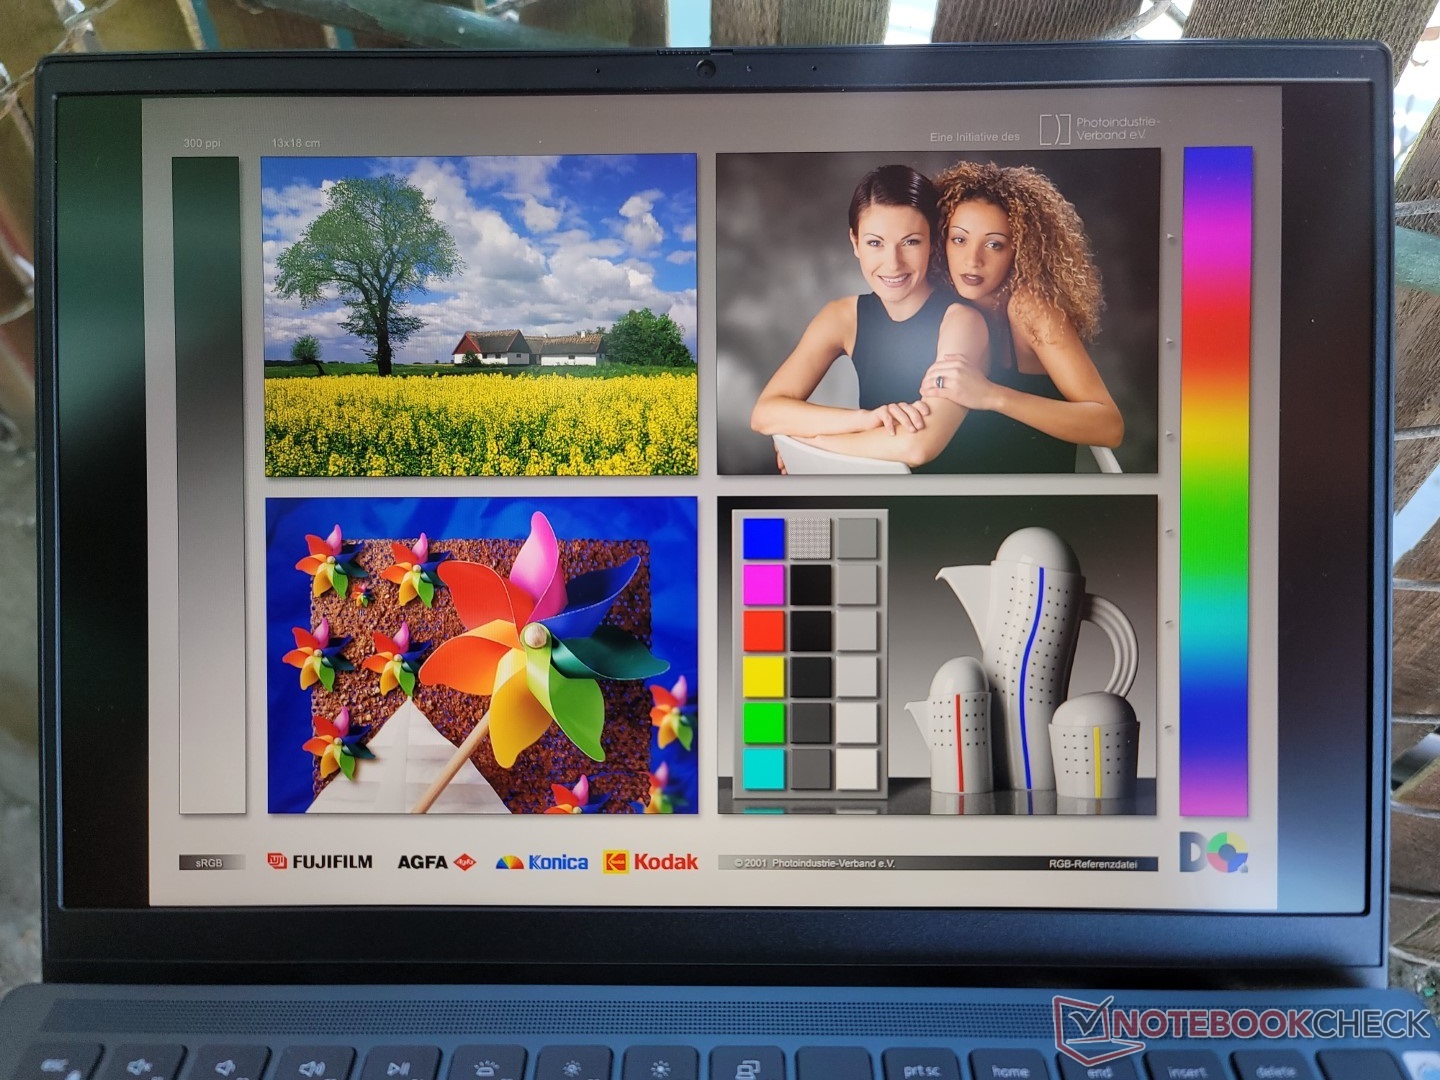
Display — Full sRGB Coverage and 60 Hz
While other 14-inch laptops typically aim for 1200p, 1800p, or 2160p native resolutions, the Inspiron 14 Plus 7420 come standard with a relatively uncommon 2.2K or 2240 x 1400 panel instead. Core attributes are otherwise solid including the full sRGB coverage, ~1000:1 contrast ratio, and decent response times for its size class. It's a bummer that OLED or glossy options aren't available to boost colors or sharpness even further.
| |||||||||||||||||||||||||
Brightness Distribution: 85 %
Center on Battery: 331.1 cd/m²
Contrast: 1142:1 (Black: 0.29 cd/m²)
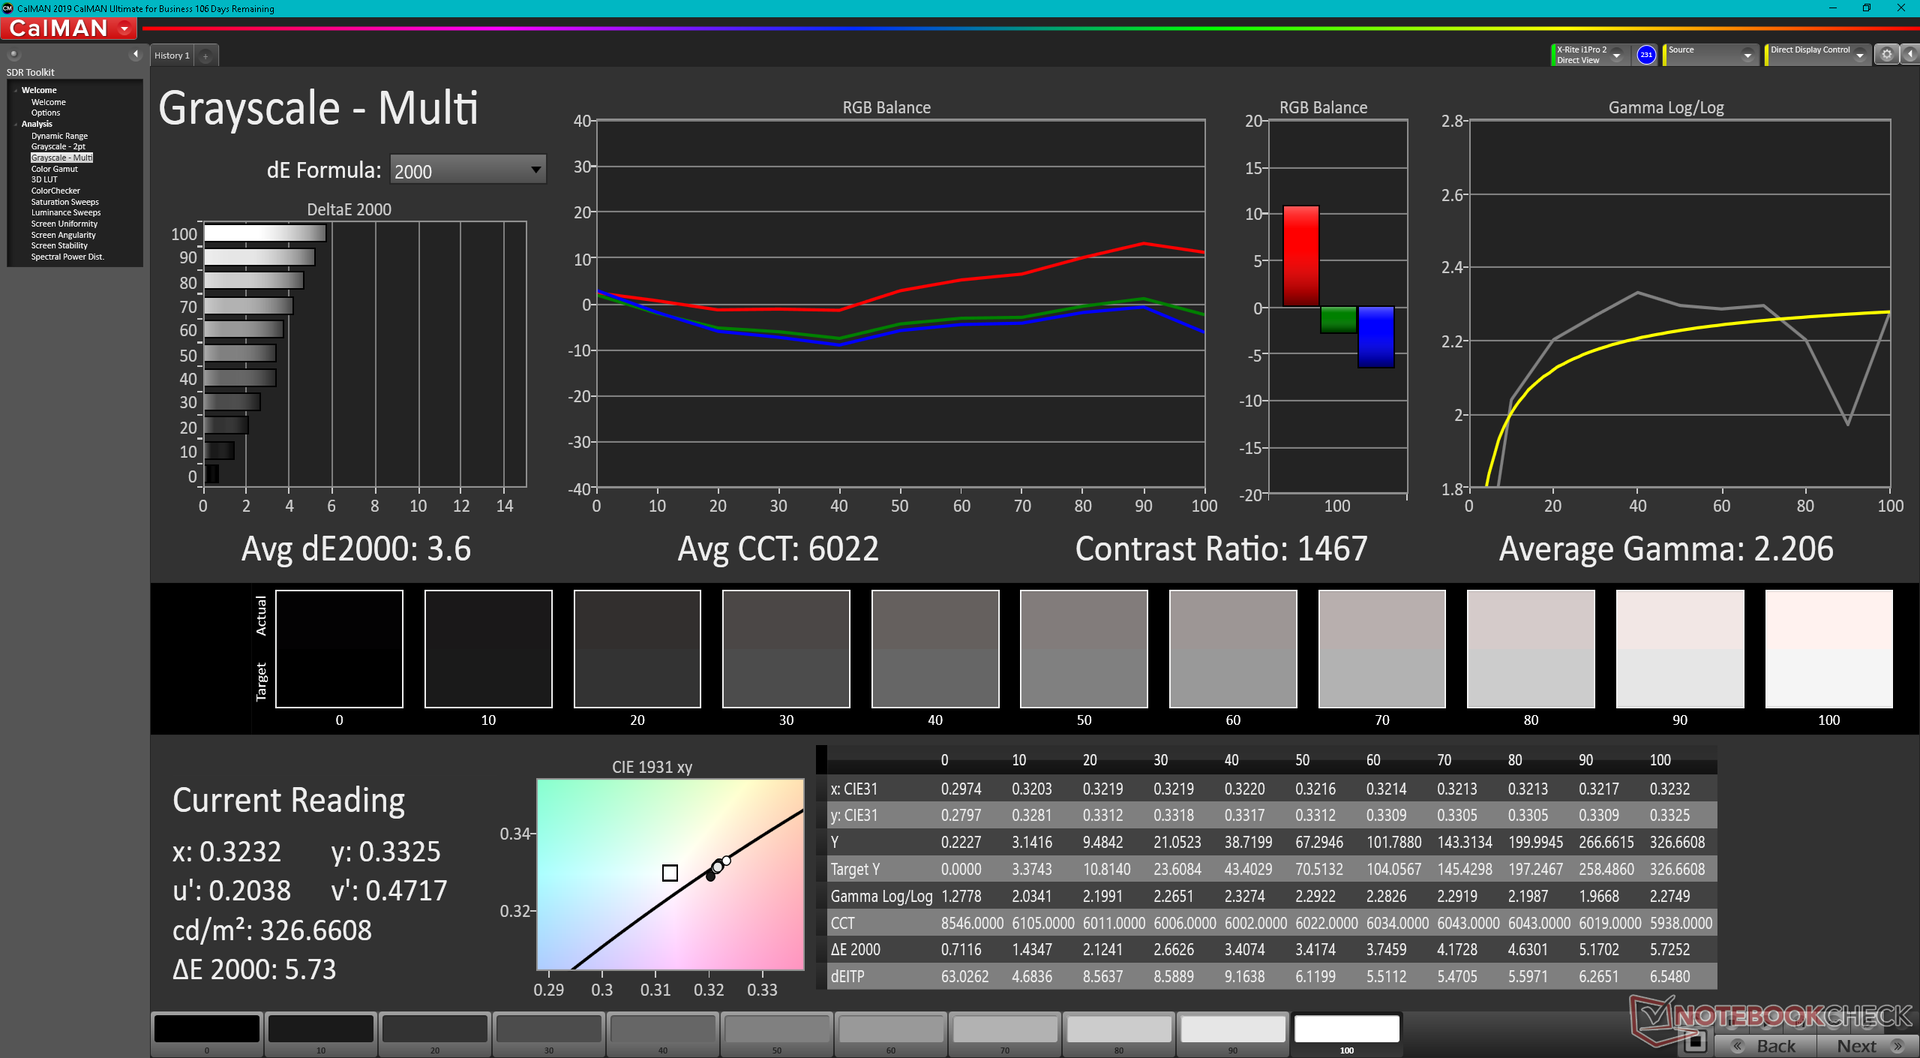
ΔE ColorChecker Calman: 2.23 | ∀{0.5-29.43 Ø4.71}
calibrated: 0.63
ΔE Greyscale Calman: 3.6 | ∀{0.09-98 Ø4.96}
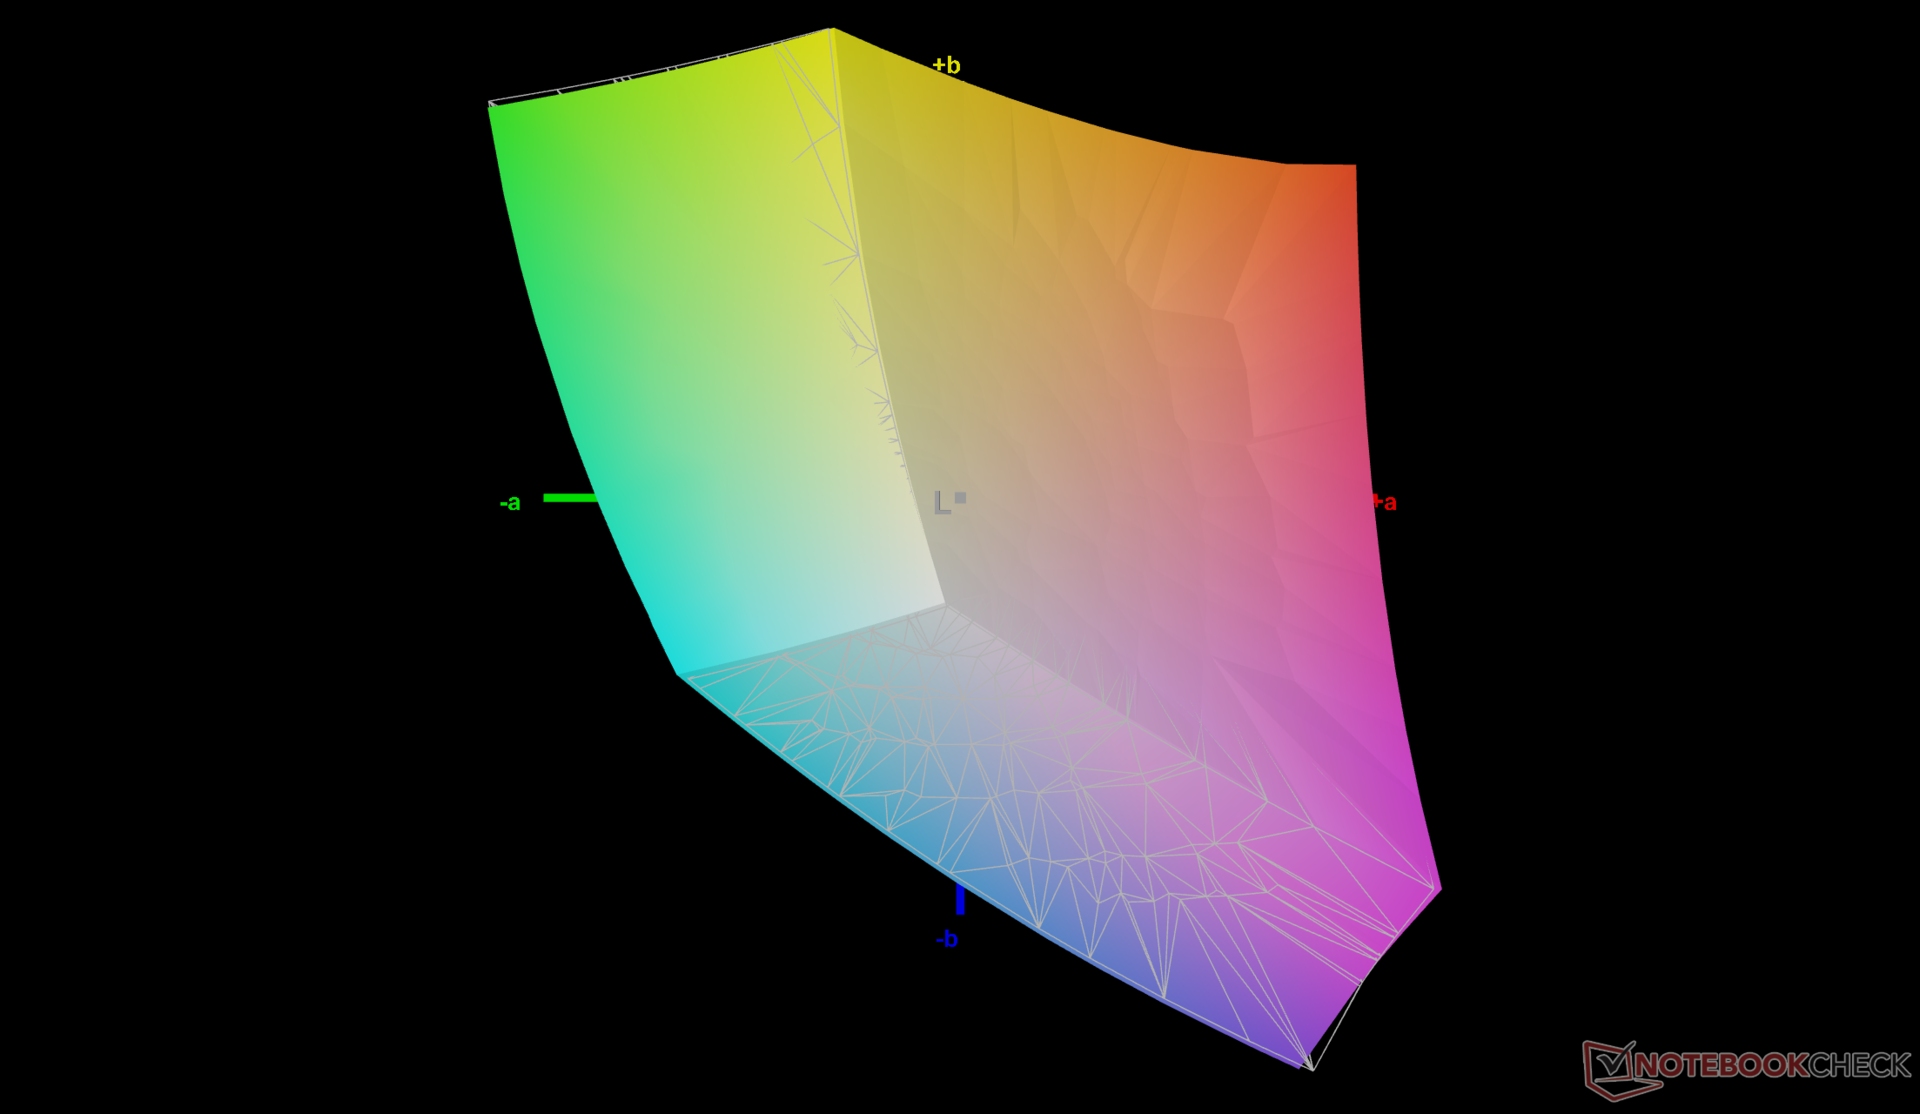
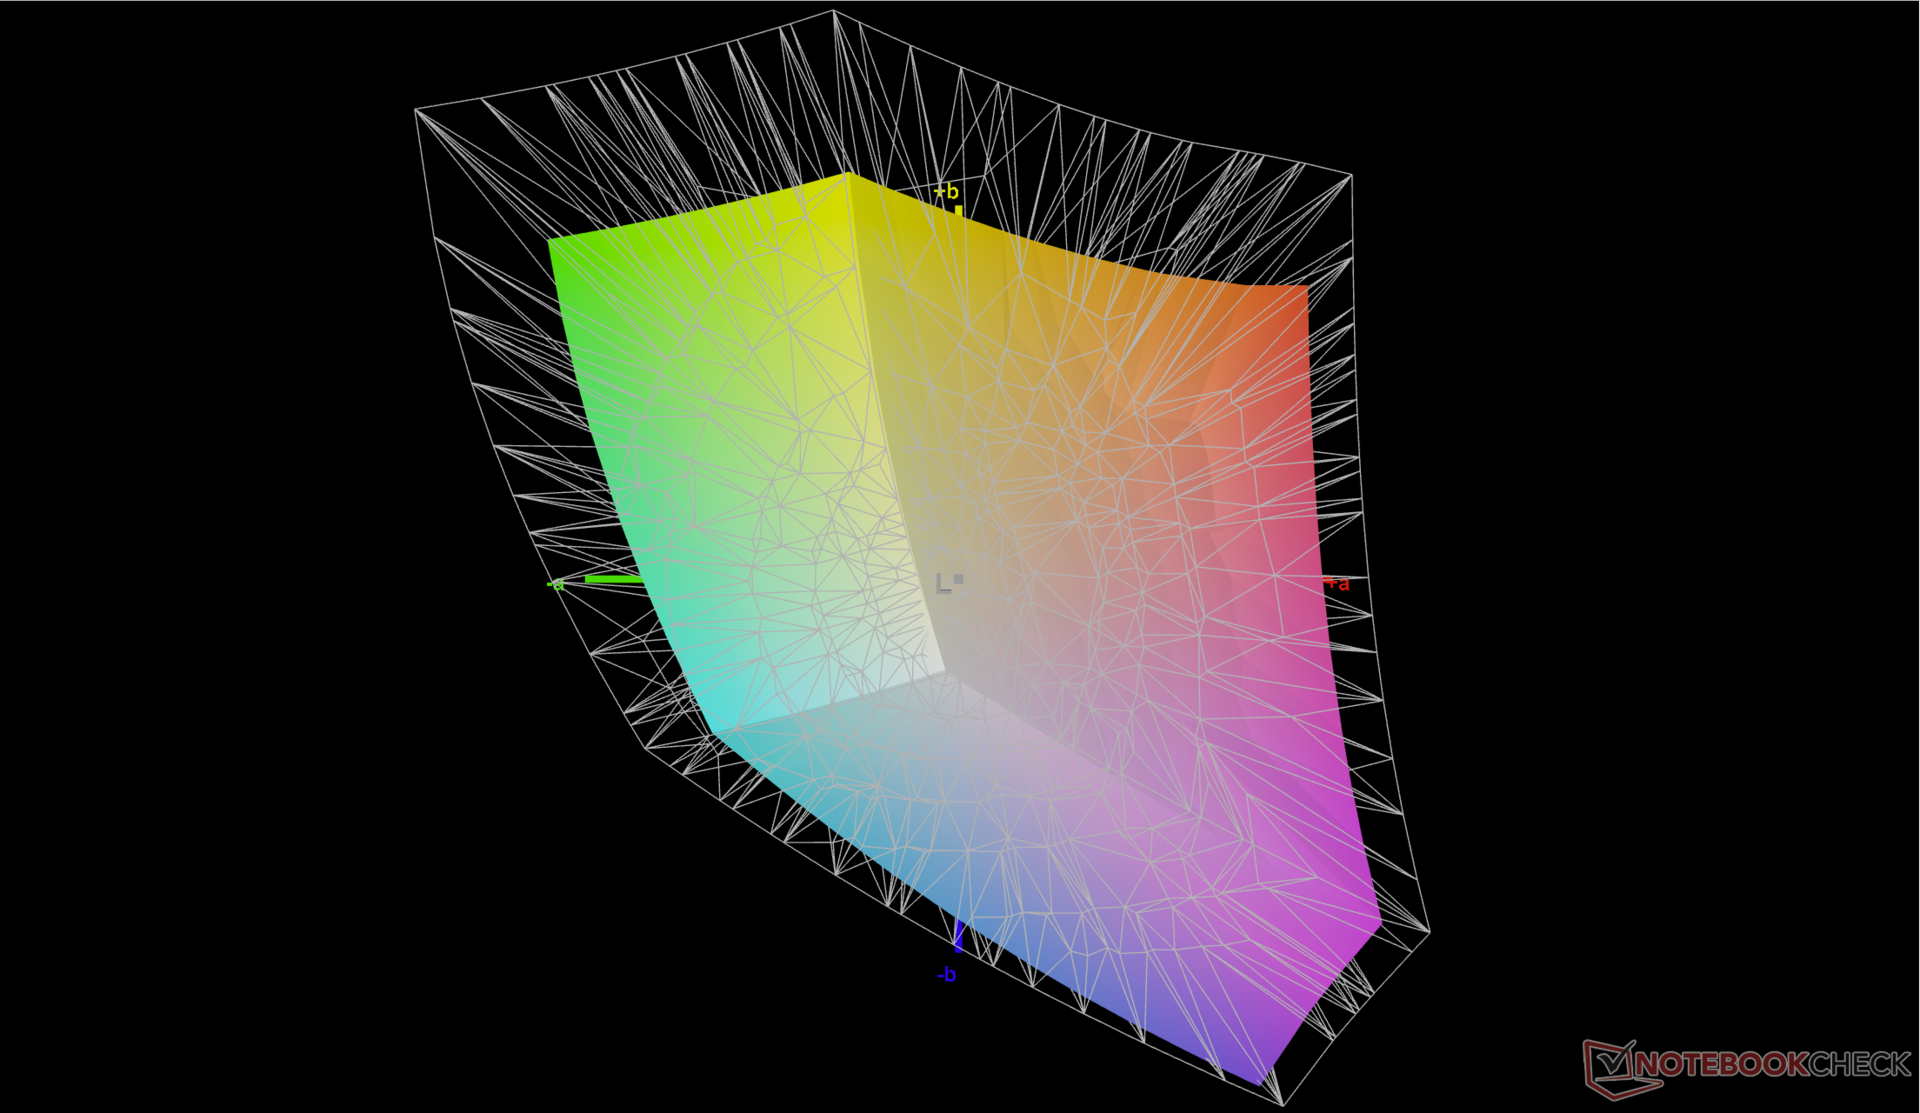
69.5% AdobeRGB 1998 (Argyll 3D)
99.3% sRGB (Argyll 3D)
68.8% Display P3 (Argyll 3D)
Gamma: 2.21
CCT: 6022 K
| Dell Inspiron 14 Plus 7420 InfoVision 140NWHE, IPS, 2240x1400, 14" | Asus Vivobook Pro 14 M3401QC-KM007T SAMSUNG: SDC4171, OLED, 2880x1800, 14" | Dell Inspiron 14 7420 2-in-1 BOE NV14N42, IPS, 1920x1200, 14" | Schenker Vision 14 MNE007ZA1, IPS, 2880x1800, 14" | Asus Zenbook 14X UX5400E Samsung SDC4154, OLED, 2880x1800, 14" | MSI Summit E14 A11SCS AU Optronics AUO123B, IPS, 3840x2160, 14" | HP Envy 14-eb0010nr AU Optronics AUOF392, IPS, 1920x1200, 14" | |
|---|---|---|---|---|---|---|---|
| Display | 27% | -43% | 5% | 28% | 24% | 8% | |
| Display P3 Coverage (%) | 68.8 | 99.41 44% | 38.6 -44% | 74.3 8% | 100 45% | 87.5 27% | 77.1 12% |
| sRGB Coverage (%) | 99.3 | 99.94 1% | 56.2 -43% | 97.6 -2% | 100 1% | 100 1% | 99.8 1% |
| AdobeRGB 1998 Coverage (%) | 69.5 | 94.79 36% | 39.9 -43% | 75.7 9% | 96 38% | 99.4 43% | 76.7 10% |
| Response Times | 89% | 13% | -2% | 93% | -47% | -95% | |
| Response Time Grey 50% / Grey 80% * (ms) | 32.8 ? | 3 ? 91% | 27.2 ? 17% | 40.4 ? -23% | 2 ? 94% | 52 ? -59% | 61.2 ? -87% |
| Response Time Black / White * (ms) | 22.8 ? | 3 ? 87% | 20.8 ? 9% | 18.4 ? 19% | 2 ? 91% | 30.8 ? -35% | 46 ? -102% |
| PWM Frequency (Hz) | 360 | ||||||
| Screen | 41% | -113% | -8% | 13% | -70% | -8% | |
| Brightness middle (cd/m²) | 331.1 | 384 16% | 269.4 -19% | 407 23% | 379 14% | 593.3 79% | 412 24% |
| Brightness (cd/m²) | 326 | 385 18% | 260 -20% | 407 25% | 381 17% | 571 75% | 392 20% |
| Brightness Distribution (%) | 85 | 98 15% | 89 5% | 94 11% | 93 9% | 87 2% | 81 -5% |
| Black Level * (cd/m²) | 0.29 | 0.07 76% | 0.41 -41% | 0.25 14% | 0.1 66% | 0.53 -83% | 0.32 -10% |
| Contrast (:1) | 1142 | 5486 380% | 657 -42% | 1628 43% | 3790 232% | 1119 -2% | 1288 13% |
| Colorchecker dE 2000 * | 2.23 | 1.75 22% | 6.53 -193% | 2.6 -17% | 2.3 -3% | 4.42 -98% | 1.88 16% |
| Colorchecker dE 2000 max. * | 5.44 | 3.41 37% | 19.76 -263% | 4.4 19% | 4.16 24% | 7.16 -32% | 3.06 44% |
| Colorchecker dE 2000 calibrated * | 0.63 | 2.32 -268% | 3.13 -397% | 2 -217% | 2.42 -284% | 4.3 -583% | 1.96 -211% |
| Greyscale dE 2000 * | 3.6 | 1.06 71% | 5.4 -50% | 2.7 25% | 2.12 41% | 3.2 11% | 2.2 39% |
| Gamma | 2.21 100% | 2.39 92% | 2.05 107% | 2.18 101% | 2.42 91% | 2.04 108% | 2.1 105% |
| CCT | 6022 108% | 6440 101% | 6007 108% | 6316 103% | 6737 96% | 6650 98% | |
| Color Space (Percent of AdobeRGB 1998) (%) | 68.7 | ||||||
| Color Space (Percent of sRGB) (%) | 99.8 | ||||||
| Total Average (Program / Settings) | 52% /
45% | -48% /
-80% | -2% /
-5% | 45% /
28% | -31% /
-47% | -32% /
-17% |
* ... smaller is better
The display is not calibrated at factory and so its colors are not as accurate as they could be. Color temperature in particular is too warm at around 6000 compared to the 6500 target of the sRGB standard. After a proper calibration with our X-Rite colorimeter, average grayscale and color DeltaE values would improve from 3.6 and 2.23 to just 0.8 and 0.63, respectively. We recommend an end-user calibration to fully exploit the 100 percent sRGB coverage of the panel.

Display Response Times
| ↔ Response Time Black to White | ||
|---|---|---|
| 22.8 ms ... rise ↗ and fall ↘ combined | ↗ 12 ms rise | 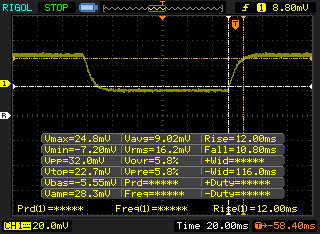 |
| ↘ 10.8 ms fall | ||
| The screen shows good response rates in our tests, but may be too slow for competitive gamers. In comparison, all tested devices range from 0.1 (minimum) to 240 (maximum) ms. » 51 % of all devices are better. This means that the measured response time is worse than the average of all tested devices (19.8 ms). | ||
| ↔ Response Time 50% Grey to 80% Grey | ||
| 32.8 ms ... rise ↗ and fall ↘ combined | ↗ 16 ms rise | 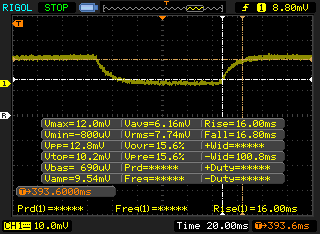 |
| ↘ 16.8 ms fall | ||
| The screen shows slow response rates in our tests and will be unsatisfactory for gamers. In comparison, all tested devices range from 0.165 (minimum) to 636 (maximum) ms. » 45 % of all devices are better. This means that the measured response time is similar to the average of all tested devices (30.9 ms). | ||
Screen Flickering / PWM (Pulse-Width Modulation)
| Screen flickering / PWM not detected | 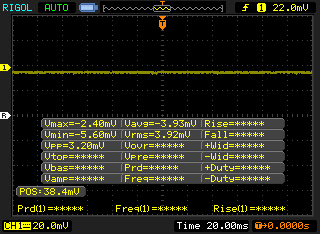 | ||
In comparison: 52 % of all tested devices do not use PWM to dim the display. If PWM was detected, an average of 7744 (minimum: 5 - maximum: 343500) Hz was measured. | |||
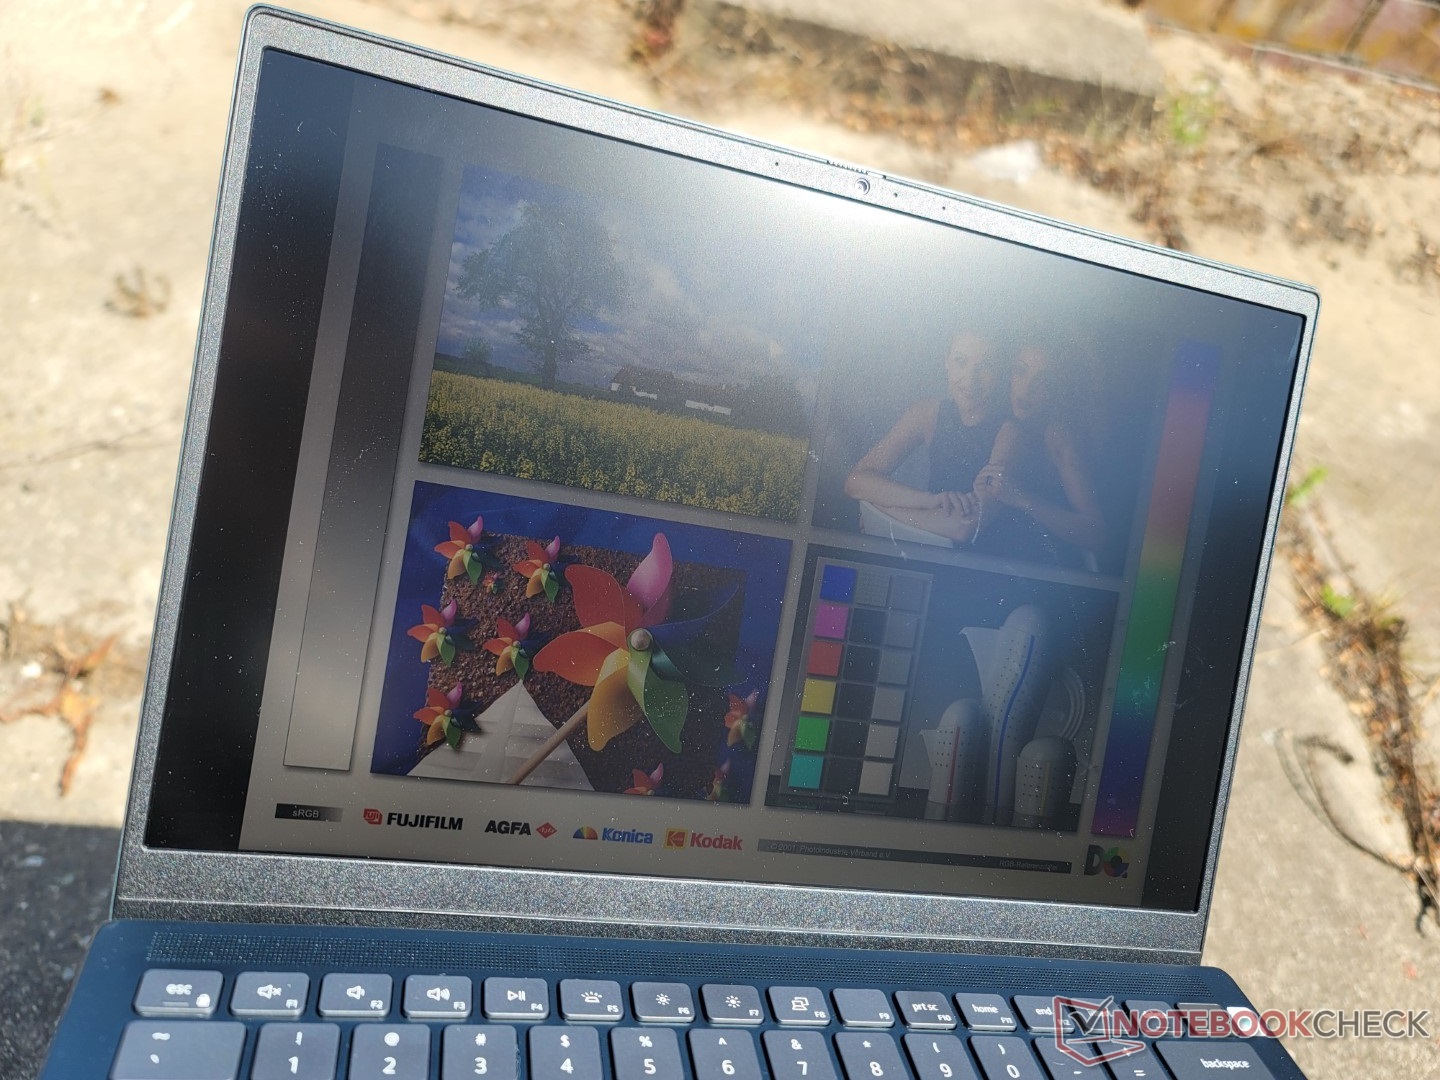
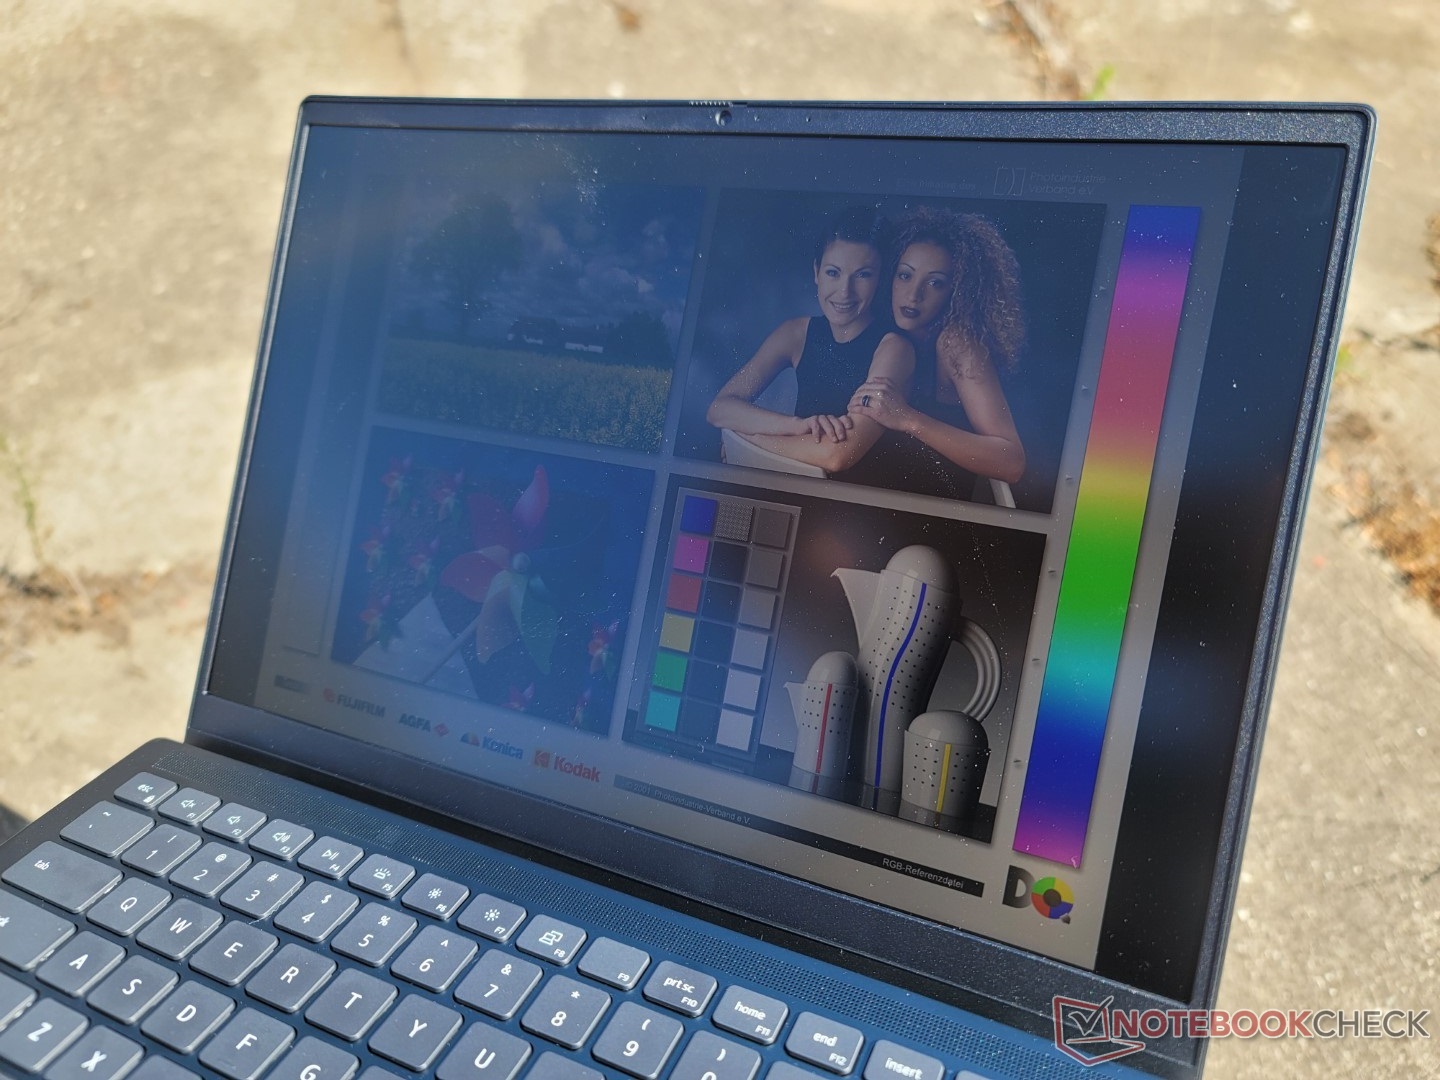
Outdoor visibility is underwhelming as the display averages only 300 nits at its maximum setting. You'll want to work under shade whenever possible if outdoors or the screen becomes washed out under brighter ambient lighting. The MSI Summit E14 carries a significantly brighter screen while still offering discrete GPU options in comparison.
Performance — Supercharged 14-incher
Testing Conditions
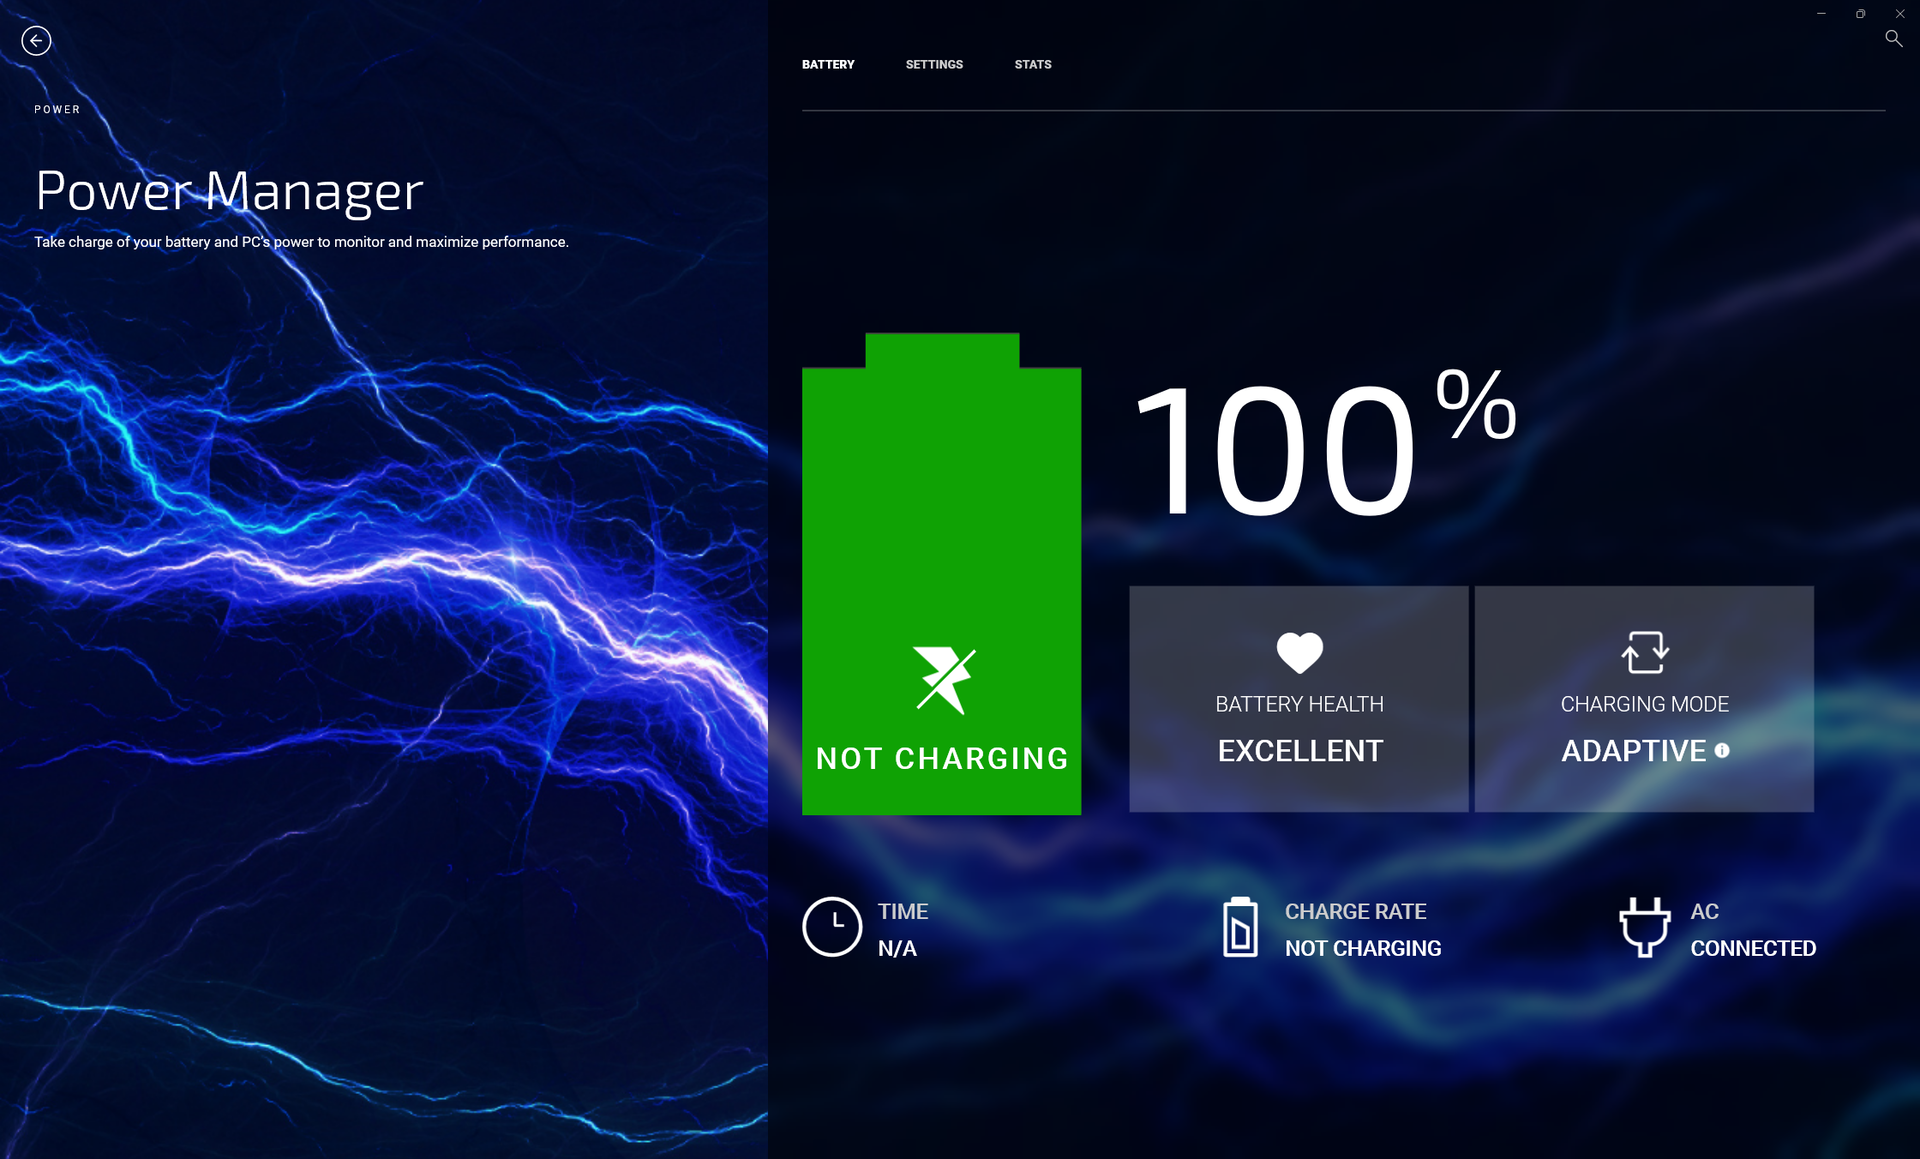
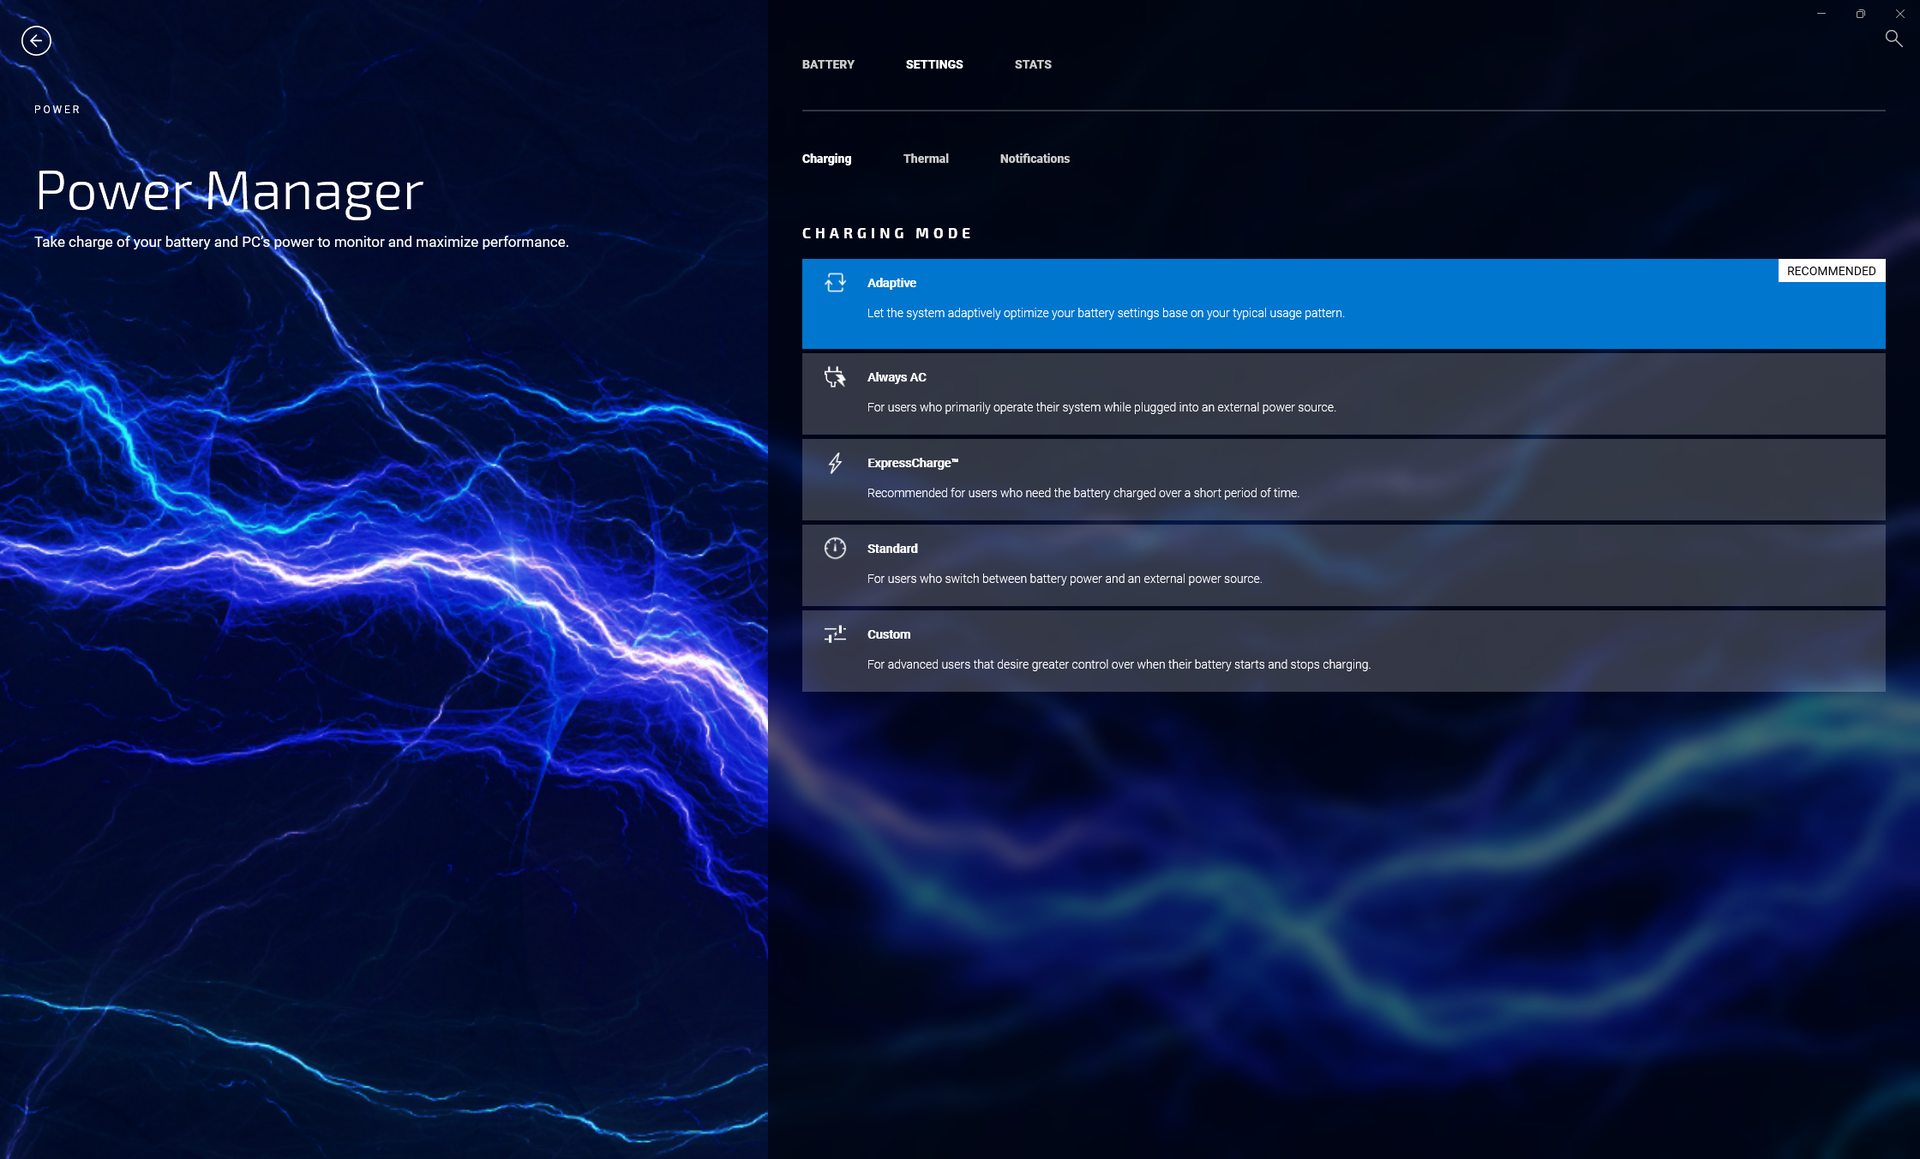
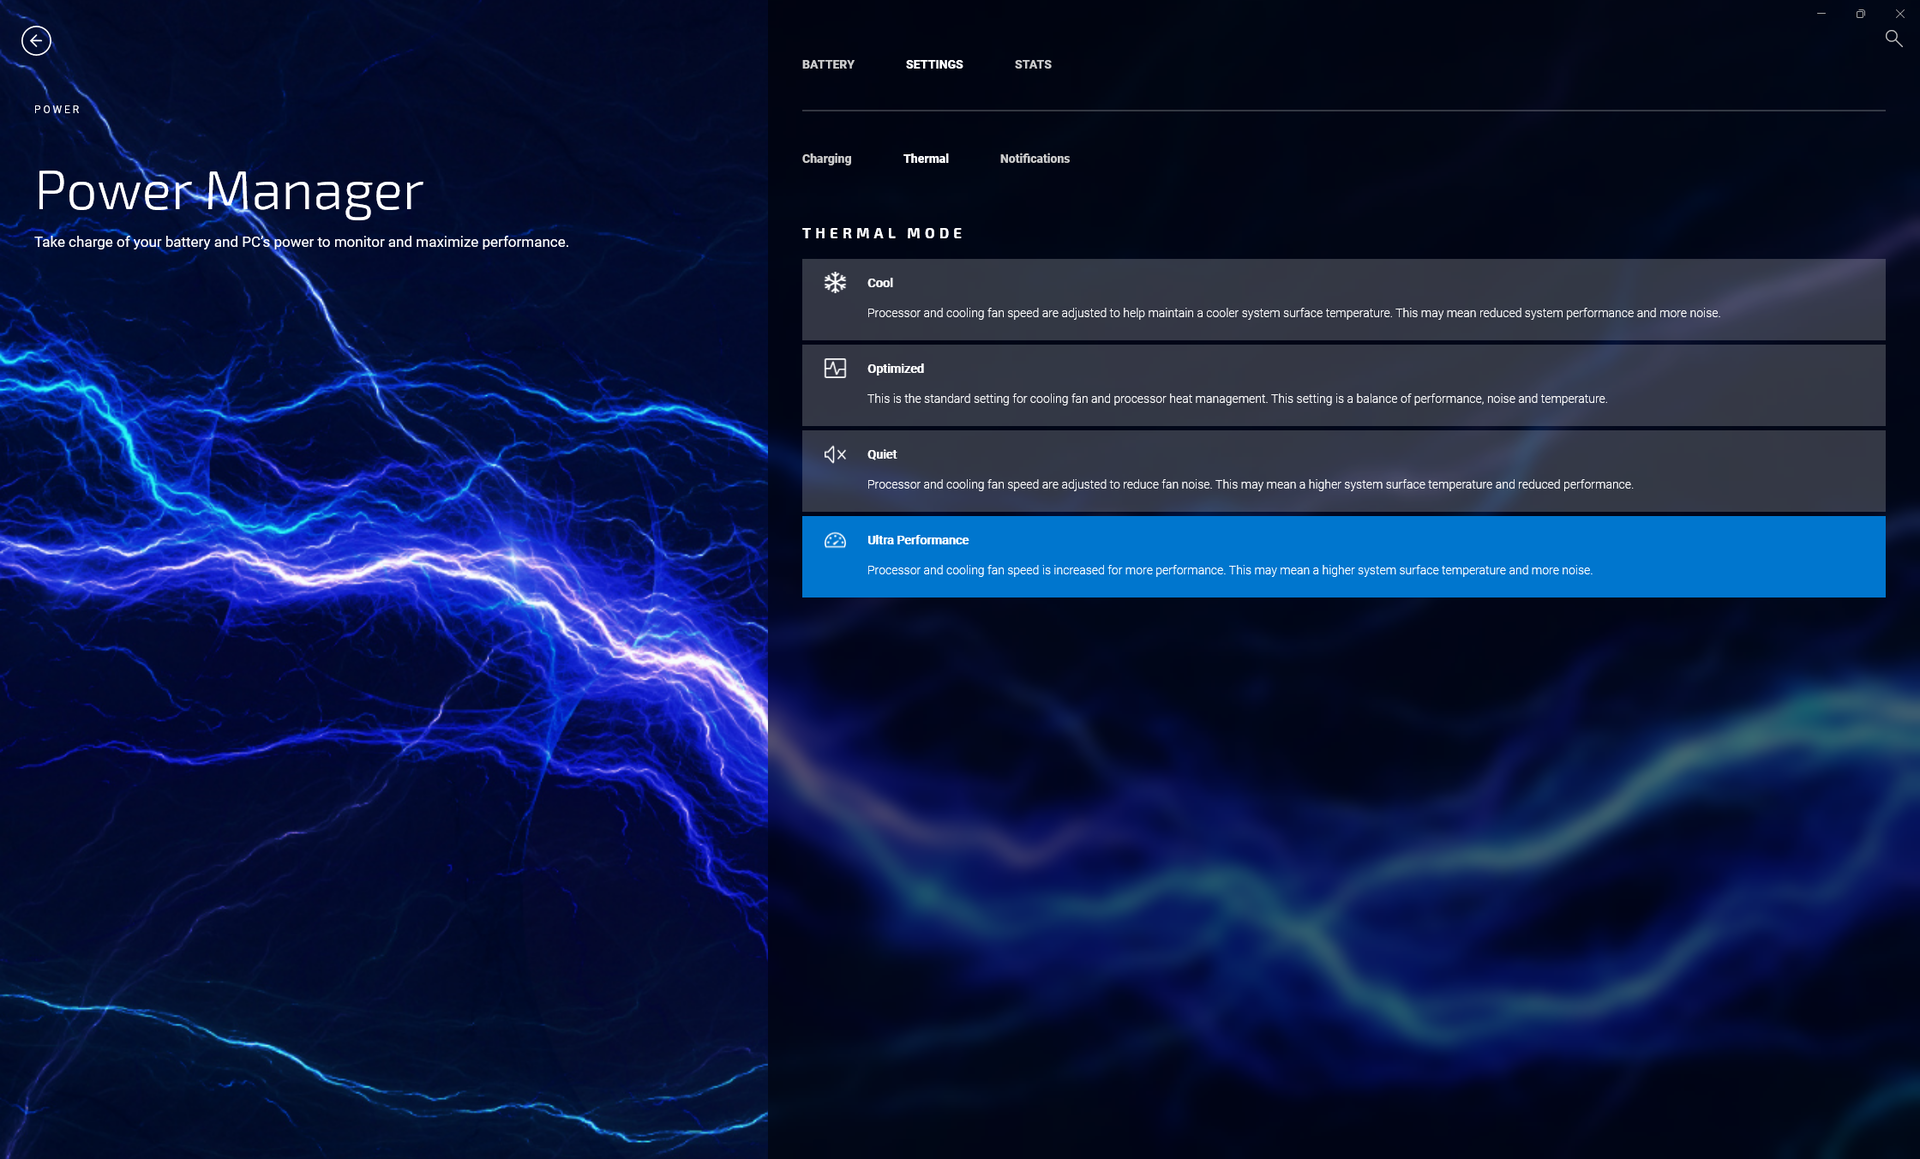
We set our unit Ultra Performance mode via the My Dell software prior to running any benchmarks below. It's recommended that owners become familiar with My Dell as it serves as a portal to warranty support, battery charging behavior, system performance, and more as shown by the screenshots below.
Standard Optimus is supported for switching between the integrated and discrete GeForce RTX 3050 GPUs. Advanced Optimus, MUX, and WhisperMode are not supported.
Processor
CPU performance can be analyzed from a glass half full or glass half empty perspective. From the pessimistic point of view, the 45 W Core i7-12700H in the Dell is somewhat disappointing as its multi-thread performance is about 10 percent slower than other laptops equipped with the same processor. From the optimistic point of view, the Dell is significantly faster than most other 14-inch laptops where 15 W, 25 W, or 35 W CPUs are more common. This is one of the smaller laptops you can get with the Core i7-12700H, but the flip side is that its Turbo Boost performance is subsequently more limited when compared to larger laptops with the same processor option. After all, the Core i7-12700H is frequently found on full-fledged gaming laptops as well. The 16-inch Lenovo Legion Slim 7 with the same CPU, for example, offers 30 percent faster performance than our Inspiron 14 Plus.
The limited Turbo Boost performance of our CPU can be demonstrated by running CineBench R15 xT in a loop. As shown by the graph below, our initial score of 2410 points would dip by 21 percent by the third or fourth loop to represent a notable performance drop.
Cinebench R15 Multi Loop
Cinebench R23: Multi Core | Single Core
Cinebench R15: CPU Multi 64Bit | CPU Single 64Bit
Blender: v2.79 BMW27 CPU
7-Zip 18.03: 7z b 4 | 7z b 4 -mmt1
Geekbench 5.5: Multi-Core | Single-Core
HWBOT x265 Benchmark v2.2: 4k Preset
LibreOffice : 20 Documents To PDF
R Benchmark 2.5: Overall mean
* ... smaller is better
AIDA64: FP32 Ray-Trace | FPU Julia | CPU SHA3 | CPU Queen | FPU SinJulia | FPU Mandel | CPU AES | CPU ZLib | FP64 Ray-Trace | CPU PhotoWorxx
| Performance rating | |
| Average Intel Core i7-12700H | |
| Dell Inspiron 14 Plus 7420 | |
| Asus Vivobook Pro 14 M3401QC-KM007T | |
| Schenker Vision 14 | |
| Asus Zenbook 14X UX5400E | |
| MSI Summit E14 A11SCS | |
| Dell Inspiron 14 7420 2-in-1 | |
| AIDA64 / FP32 Ray-Trace | |
| Dell Inspiron 14 Plus 7420 | |
| Average Intel Core i7-12700H (2585 - 17957, n=64) | |
| Asus Vivobook Pro 14 M3401QC-KM007T | |
| Schenker Vision 14 | |
| Asus Zenbook 14X UX5400E | |
| MSI Summit E14 A11SCS | |
| Dell Inspiron 14 7420 2-in-1 | |
| AIDA64 / FPU Julia | |
| Asus Vivobook Pro 14 M3401QC-KM007T | |
| Dell Inspiron 14 Plus 7420 | |
| Average Intel Core i7-12700H (12439 - 90760, n=64) | |
| Schenker Vision 14 | |
| Asus Zenbook 14X UX5400E | |
| MSI Summit E14 A11SCS | |
| Dell Inspiron 14 7420 2-in-1 | |
| AIDA64 / CPU SHA3 | |
| Average Intel Core i7-12700H (833 - 4242, n=64) | |
| Dell Inspiron 14 Plus 7420 | |
| Schenker Vision 14 | |
| Asus Vivobook Pro 14 M3401QC-KM007T | |
| Asus Zenbook 14X UX5400E | |
| MSI Summit E14 A11SCS | |
| Dell Inspiron 14 7420 2-in-1 | |
| AIDA64 / CPU Queen | |
| Average Intel Core i7-12700H (57923 - 103202, n=63) | |
| Dell Inspiron 14 Plus 7420 | |
| Asus Vivobook Pro 14 M3401QC-KM007T | |
| Dell Inspiron 14 7420 2-in-1 | |
| Schenker Vision 14 | |
| Asus Zenbook 14X UX5400E | |
| MSI Summit E14 A11SCS | |
| AIDA64 / FPU SinJulia | |
| Average Intel Core i7-12700H (3249 - 9939, n=64) | |
| Asus Vivobook Pro 14 M3401QC-KM007T | |
| Dell Inspiron 14 Plus 7420 | |
| Schenker Vision 14 | |
| Asus Zenbook 14X UX5400E | |
| MSI Summit E14 A11SCS | |
| Dell Inspiron 14 7420 2-in-1 | |
| AIDA64 / FPU Mandel | |
| Asus Vivobook Pro 14 M3401QC-KM007T | |
| Dell Inspiron 14 Plus 7420 | |
| Average Intel Core i7-12700H (7135 - 44760, n=64) | |
| Schenker Vision 14 | |
| MSI Summit E14 A11SCS | |
| Asus Zenbook 14X UX5400E | |
| Dell Inspiron 14 7420 2-in-1 | |
| AIDA64 / CPU AES | |
| Asus Vivobook Pro 14 M3401QC-KM007T | |
| Average Intel Core i7-12700H (31839 - 144360, n=64) | |
| Schenker Vision 14 | |
| Asus Zenbook 14X UX5400E | |
| Dell Inspiron 14 Plus 7420 | |
| MSI Summit E14 A11SCS | |
| Dell Inspiron 14 7420 2-in-1 | |
| AIDA64 / CPU ZLib | |
| Average Intel Core i7-12700H (305 - 1171, n=64) | |
| Dell Inspiron 14 Plus 7420 | |
| Asus Vivobook Pro 14 M3401QC-KM007T | |
| Dell Inspiron 14 7420 2-in-1 | |
| Schenker Vision 14 | |
| Asus Zenbook 14X UX5400E | |
| MSI Summit E14 A11SCS | |
| AIDA64 / FP64 Ray-Trace | |
| Dell Inspiron 14 Plus 7420 | |
| Average Intel Core i7-12700H (1437 - 9692, n=64) | |
| Asus Vivobook Pro 14 M3401QC-KM007T | |
| Schenker Vision 14 | |
| Asus Zenbook 14X UX5400E | |
| MSI Summit E14 A11SCS | |
| Dell Inspiron 14 7420 2-in-1 | |
| AIDA64 / CPU PhotoWorxx | |
| MSI Summit E14 A11SCS | |
| Dell Inspiron 14 Plus 7420 | |
| Average Intel Core i7-12700H (12863 - 52207, n=64) | |
| Asus Zenbook 14X UX5400E | |
| Schenker Vision 14 | |
| Dell Inspiron 14 7420 2-in-1 | |
| Asus Vivobook Pro 14 M3401QC-KM007T | |
System Performance
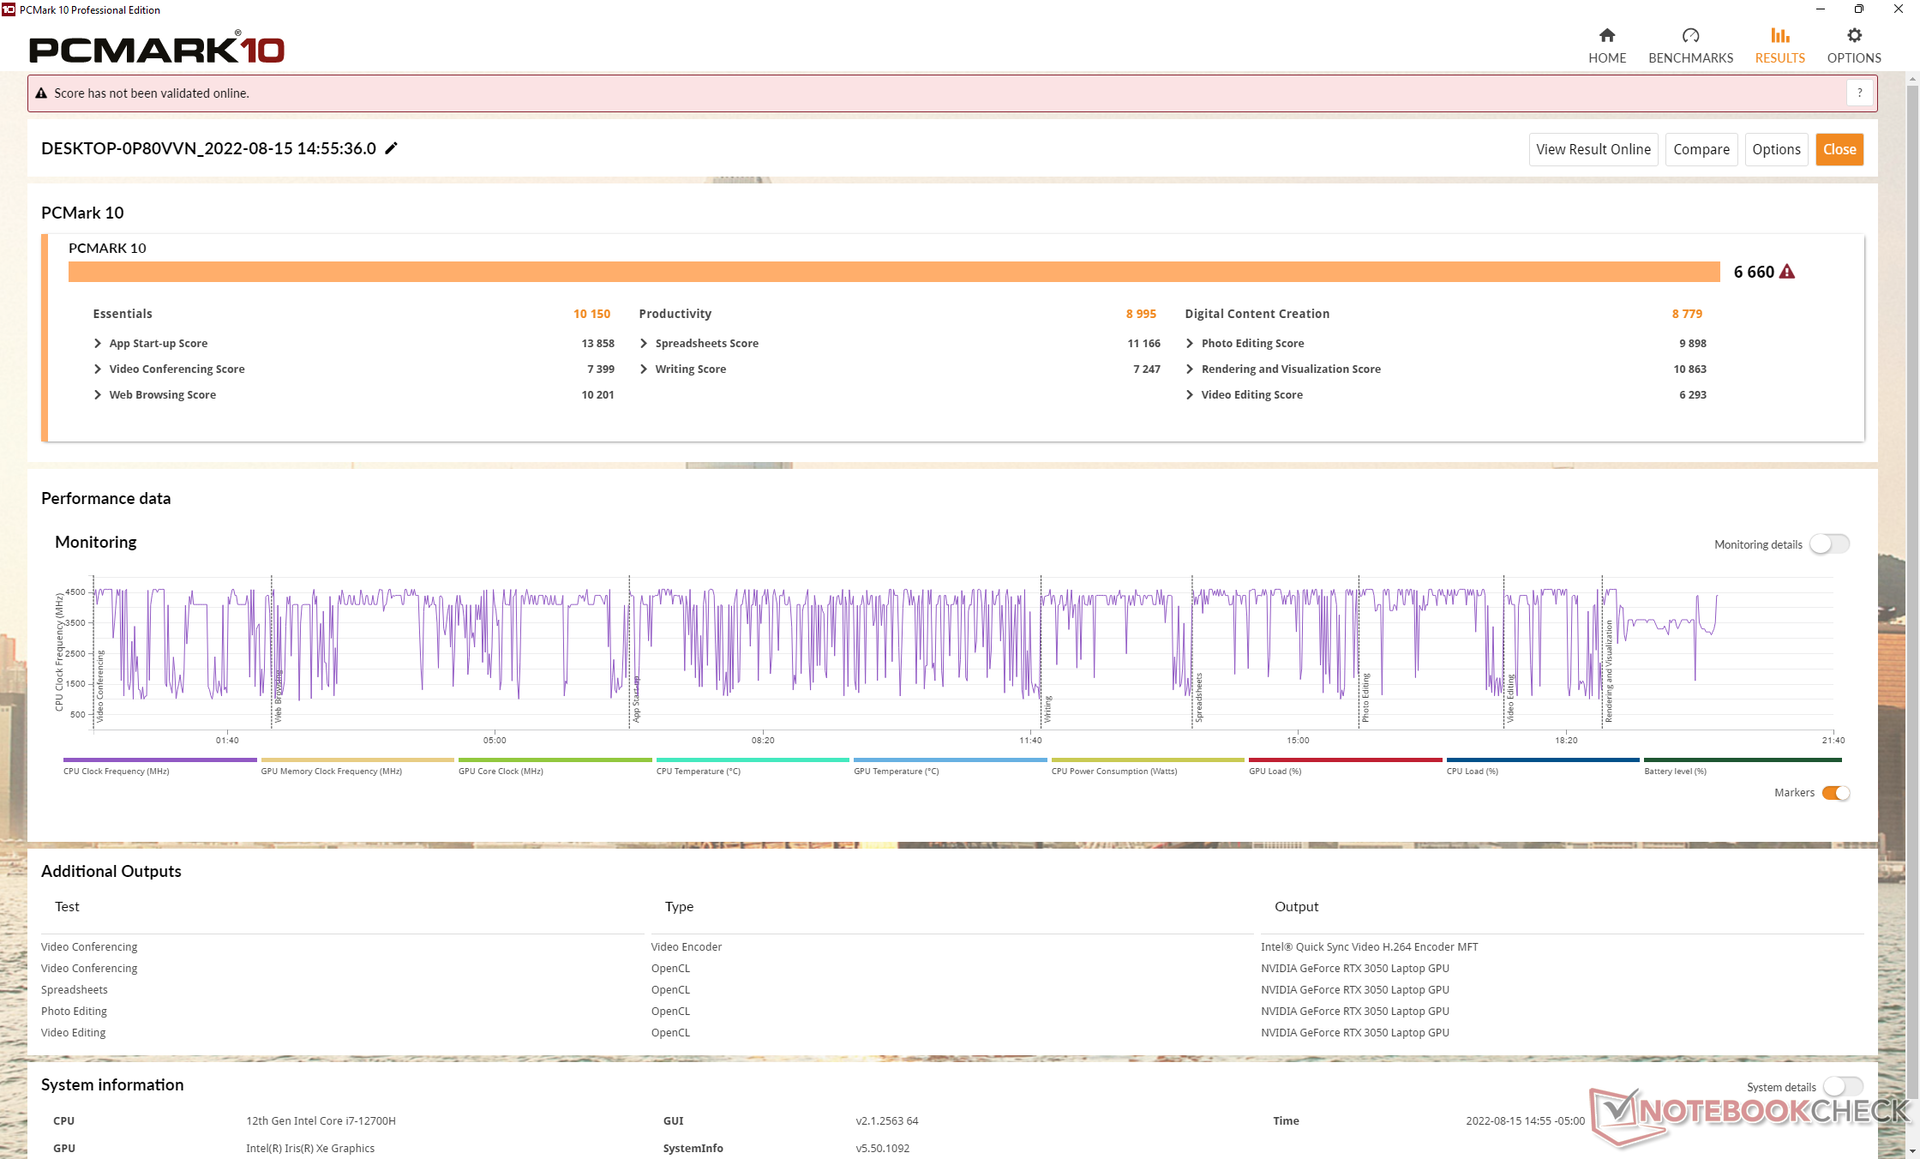
PCMark 10 results are excellent and higher than even competitors like the Schenker Vision 14 with faster RTX 3050 Ti graphics or the Asus Vivobook Pro 14 with the AMD Ryzen 5600H CPU. There's no doubt that the Core i7-12700H is playing a huge part in boosting the overall performance of the Inspiron 14 Plus 7420 over most other 14-inch multimedia laptops.
CrossMark: Overall | Productivity | Creativity | Responsiveness
| PCMark 10 / Score | |
| Average Intel Core i7-12700H, NVIDIA GeForce RTX 3050 4GB Laptop GPU (6660 - 6879, n=3) | |
| Dell Inspiron 14 Plus 7420 | |
| Schenker Vision 14 | |
| Asus Vivobook Pro 14 M3401QC-KM007T | |
| HP Envy 14-eb0010nr | |
| MSI Summit E14 A11SCS | |
| Dell Inspiron 14 7420 2-in-1 | |
| Asus Zenbook 14X UX5400E | |
| PCMark 10 / Essentials | |
| Average Intel Core i7-12700H, NVIDIA GeForce RTX 3050 4GB Laptop GPU (10150 - 10369, n=3) | |
| Dell Inspiron 14 7420 2-in-1 | |
| Dell Inspiron 14 Plus 7420 | |
| Asus Vivobook Pro 14 M3401QC-KM007T | |
| Schenker Vision 14 | |
| HP Envy 14-eb0010nr | |
| MSI Summit E14 A11SCS | |
| Asus Zenbook 14X UX5400E | |
| PCMark 10 / Productivity | |
| Average Intel Core i7-12700H, NVIDIA GeForce RTX 3050 4GB Laptop GPU (8995 - 9397, n=3) | |
| Dell Inspiron 14 Plus 7420 | |
| Schenker Vision 14 | |
| Asus Zenbook 14X UX5400E | |
| HP Envy 14-eb0010nr | |
| MSI Summit E14 A11SCS | |
| Asus Vivobook Pro 14 M3401QC-KM007T | |
| Dell Inspiron 14 7420 2-in-1 | |
| PCMark 10 / Digital Content Creation | |
| Average Intel Core i7-12700H, NVIDIA GeForce RTX 3050 4GB Laptop GPU (8779 - 9203, n=3) | |
| Dell Inspiron 14 Plus 7420 | |
| Asus Vivobook Pro 14 M3401QC-KM007T | |
| Schenker Vision 14 | |
| Dell Inspiron 14 7420 2-in-1 | |
| HP Envy 14-eb0010nr | |
| MSI Summit E14 A11SCS | |
| Asus Zenbook 14X UX5400E | |
| CrossMark / Overall | |
| Average Intel Core i7-12700H, NVIDIA GeForce RTX 3050 4GB Laptop GPU (1717 - 1857, n=3) | |
| Dell Inspiron 14 Plus 7420 | |
| Schenker Vision 14 | |
| Dell Inspiron 14 7420 2-in-1 | |
| Asus Vivobook Pro 14 M3401QC-KM007T | |
| CrossMark / Productivity | |
| Average Intel Core i7-12700H, NVIDIA GeForce RTX 3050 4GB Laptop GPU (1620 - 1735, n=3) | |
| Dell Inspiron 14 Plus 7420 | |
| Schenker Vision 14 | |
| Dell Inspiron 14 7420 2-in-1 | |
| Asus Vivobook Pro 14 M3401QC-KM007T | |
| CrossMark / Creativity | |
| Average Intel Core i7-12700H, NVIDIA GeForce RTX 3050 4GB Laptop GPU (1911 - 2067, n=3) | |
| Dell Inspiron 14 Plus 7420 | |
| Dell Inspiron 14 7420 2-in-1 | |
| Schenker Vision 14 | |
| Asus Vivobook Pro 14 M3401QC-KM007T | |
| CrossMark / Responsiveness | |
| Average Intel Core i7-12700H, NVIDIA GeForce RTX 3050 4GB Laptop GPU (1481 - 1651, n=3) | |
| Schenker Vision 14 | |
| Dell Inspiron 14 Plus 7420 | |
| Dell Inspiron 14 7420 2-in-1 | |
| Asus Vivobook Pro 14 M3401QC-KM007T | |
| PCMark 10 Score | 6660 points | |
Help | ||
| AIDA64 / Memory Copy | |
| MSI Summit E14 A11SCS | |
| Asus Zenbook 14X UX5400E | |
| Dell Inspiron 14 Plus 7420 | |
| Average Intel Core i7-12700H (25615 - 80511, n=64) | |
| Schenker Vision 14 | |
| Dell Inspiron 14 7420 2-in-1 | |
| Asus Vivobook Pro 14 M3401QC-KM007T | |
| AIDA64 / Memory Read | |
| Dell Inspiron 14 Plus 7420 | |
| MSI Summit E14 A11SCS | |
| Asus Zenbook 14X UX5400E | |
| Average Intel Core i7-12700H (25586 - 79442, n=64) | |
| Schenker Vision 14 | |
| Asus Vivobook Pro 14 M3401QC-KM007T | |
| Dell Inspiron 14 7420 2-in-1 | |
| AIDA64 / Memory Write | |
| Asus Zenbook 14X UX5400E | |
| MSI Summit E14 A11SCS | |
| Dell Inspiron 14 Plus 7420 | |
| Average Intel Core i7-12700H (23679 - 88660, n=64) | |
| Schenker Vision 14 | |
| Dell Inspiron 14 7420 2-in-1 | |
| Asus Vivobook Pro 14 M3401QC-KM007T | |
| AIDA64 / Memory Latency | |
| Dell Inspiron 14 Plus 7420 | |
| Asus Zenbook 14X UX5400E | |
| MSI Summit E14 A11SCS | |
| Asus Vivobook Pro 14 M3401QC-KM007T | |
| Average Intel Core i7-12700H (76.2 - 133.9, n=62) | |
| Schenker Vision 14 | |
| Dell Inspiron 14 7420 2-in-1 | |
* ... smaller is better
DPC Latency
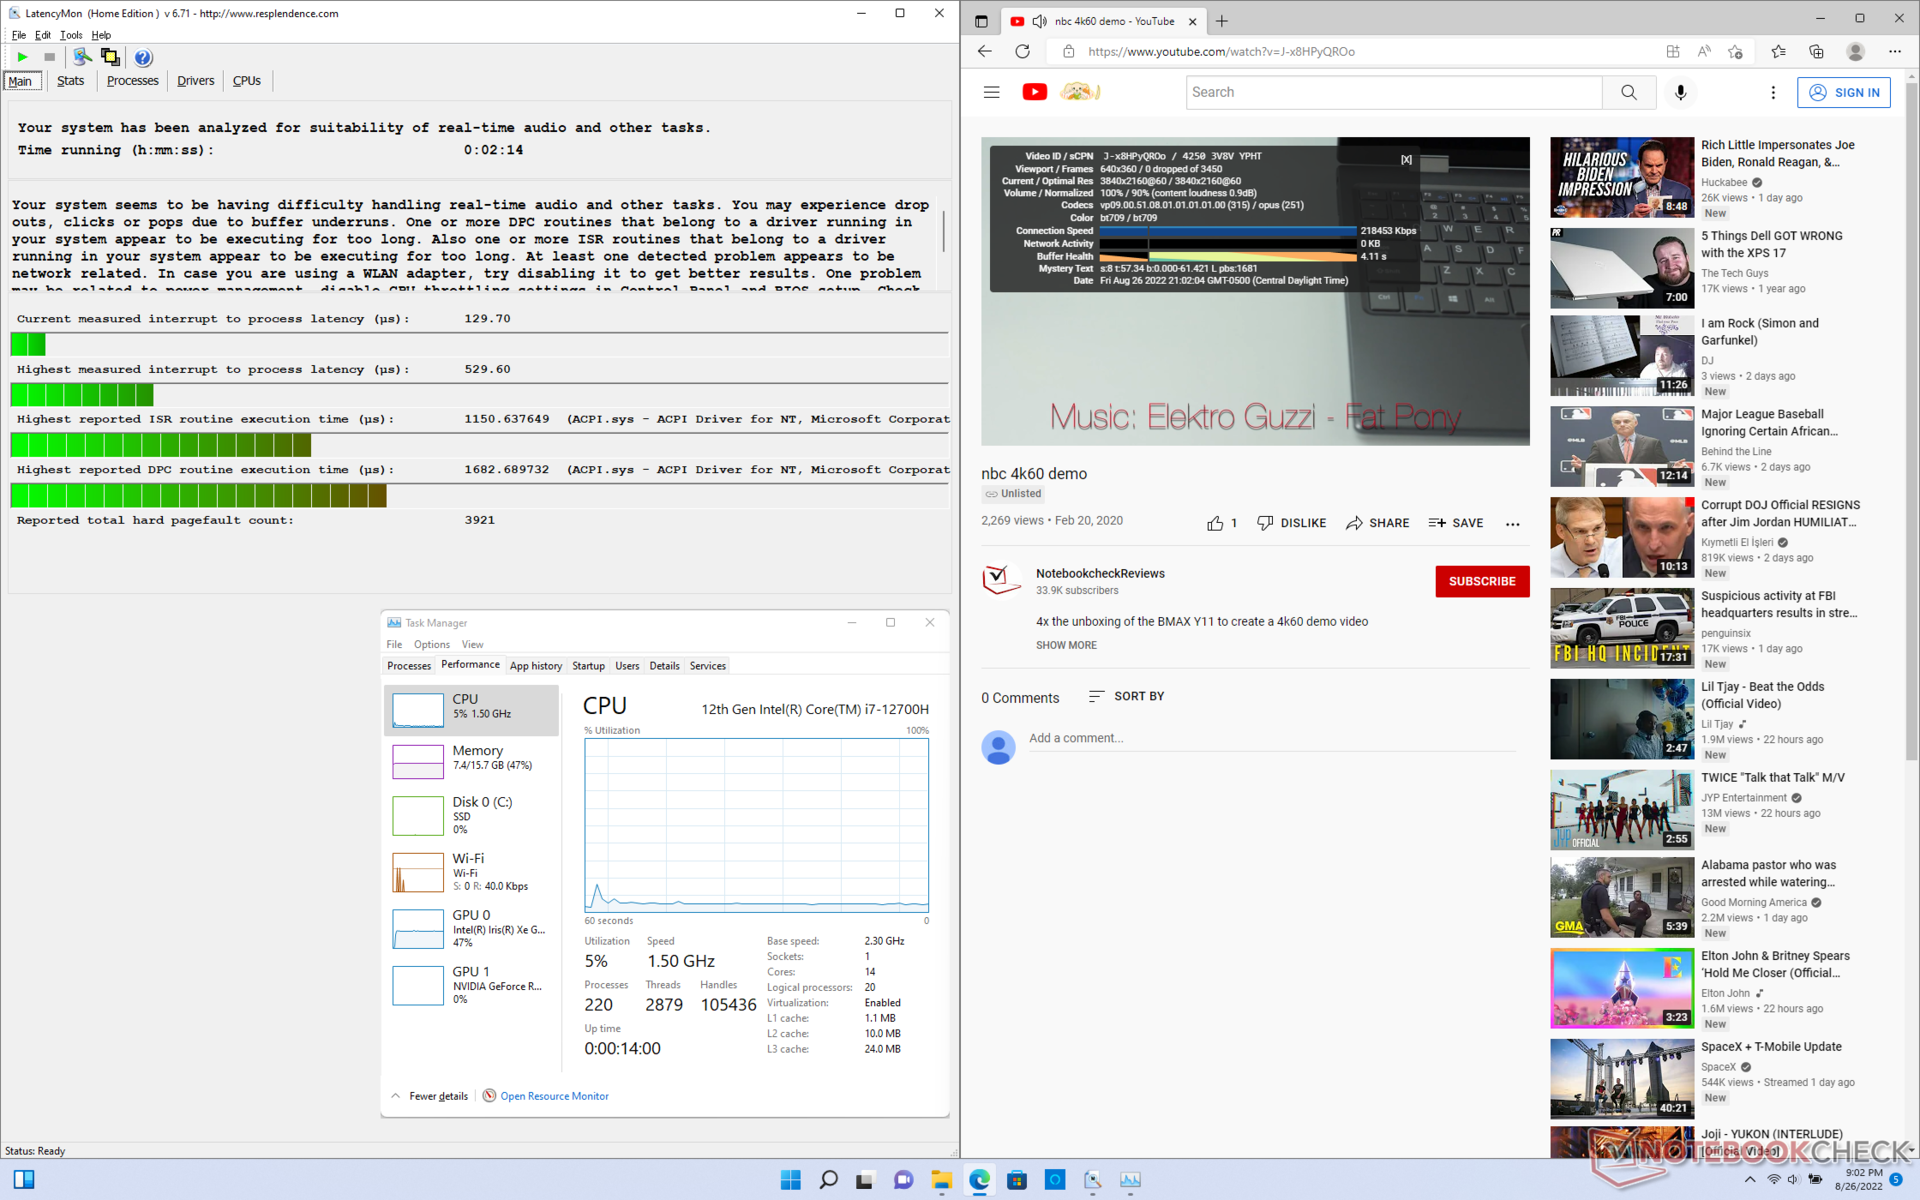
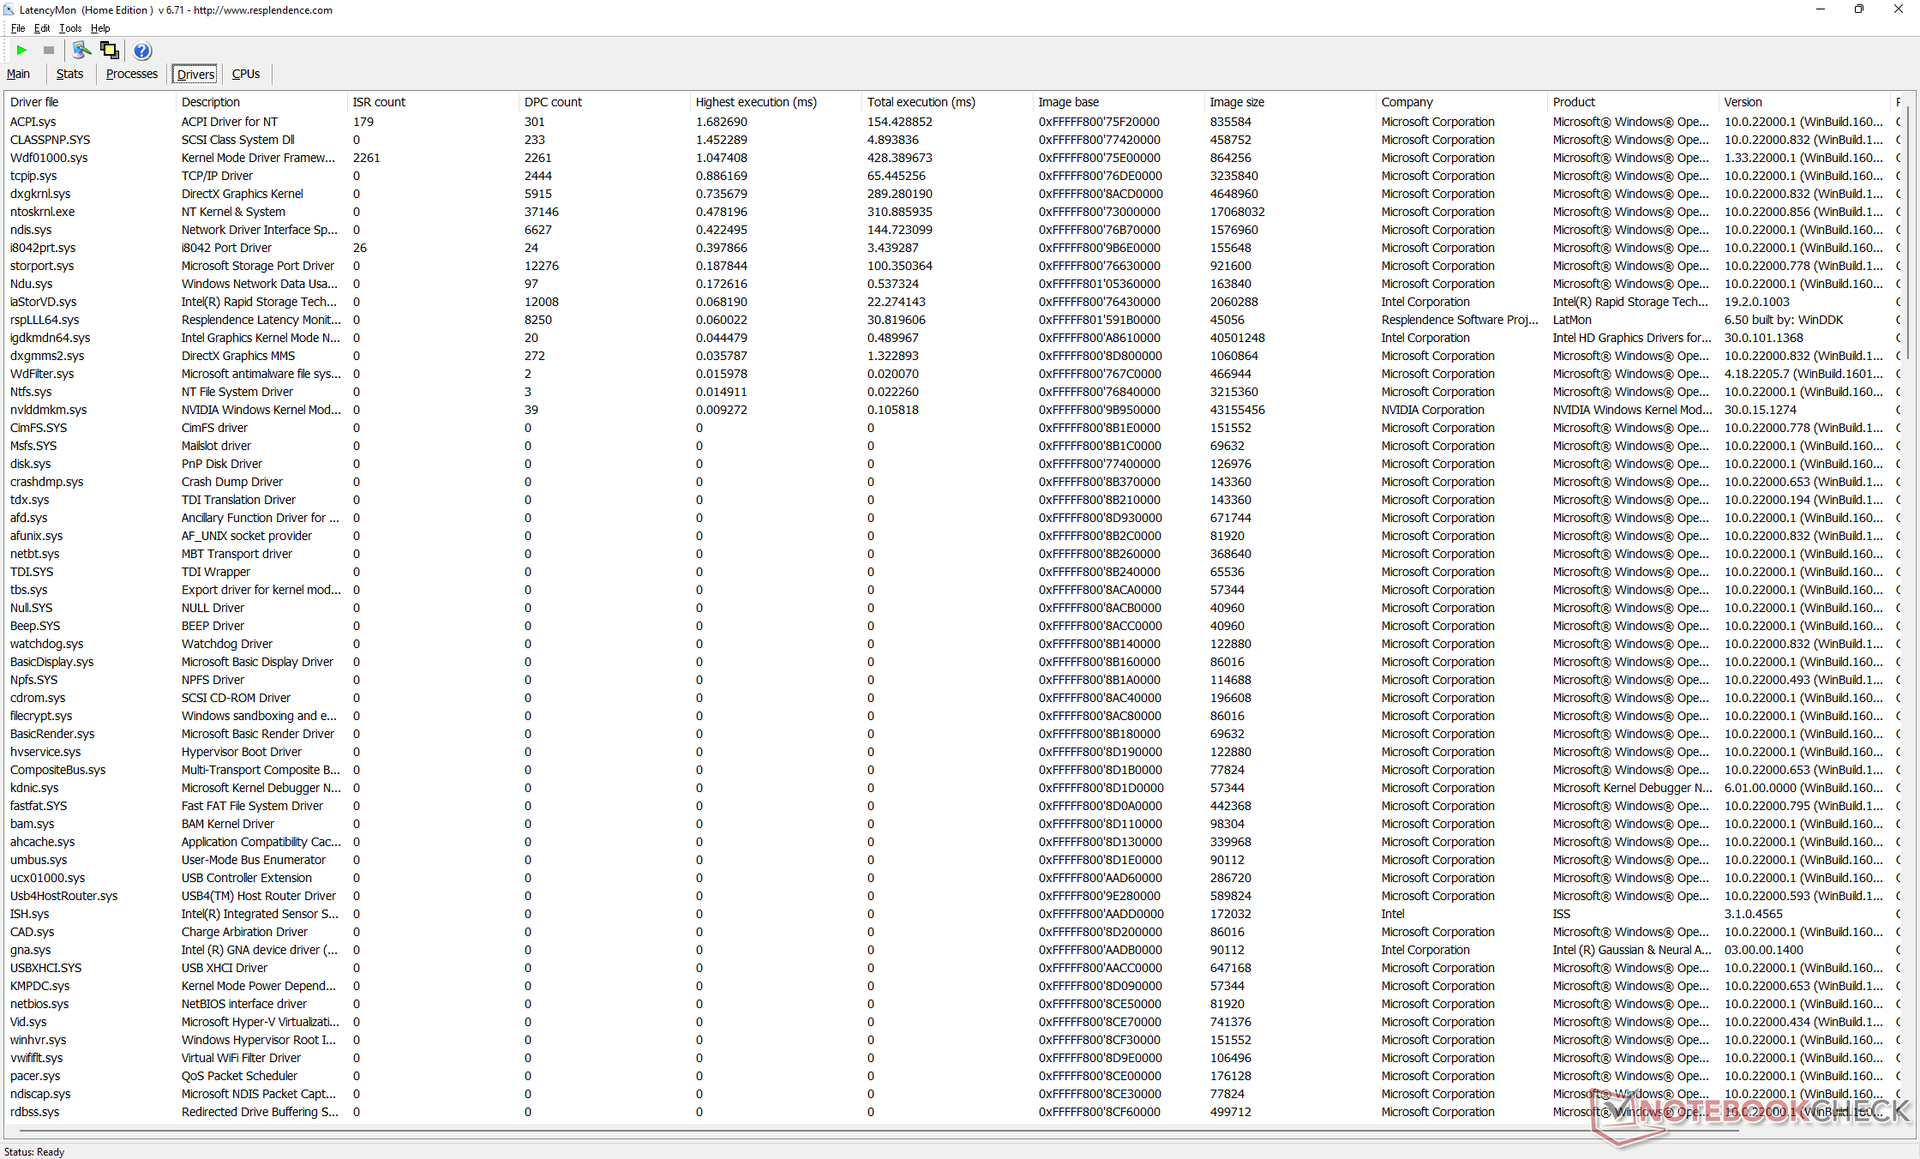
LatencyMon shows minor DPC issues when opening multiple browser tabs of our homepage. 4K video playback at 60 FPS is otherwise smooth and without any dropped frames at all.
| DPC Latencies / LatencyMon - interrupt to process latency (max), Web, Youtube, Prime95 | |
| HP Envy 14-eb0010nr | |
| Schenker Vision 14 | |
| MSI Summit E14 A11SCS | |
| Asus Vivobook Pro 14 M3401QC-KM007T | |
| Asus Zenbook 14X UX5400E | |
| Dell Inspiron 14 7420 2-in-1 | |
| Dell Inspiron 14 Plus 7420 | |
* ... smaller is better
Storage Devices — Heat Spreader Included
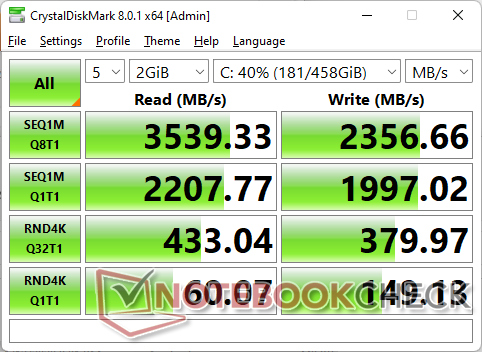
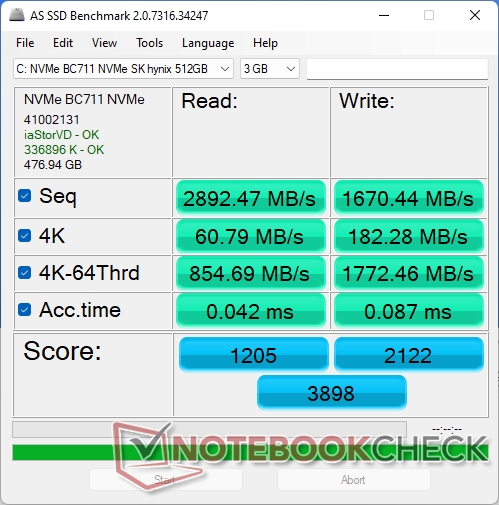
Our unit ships with a 512 GB SK Hynix BC711 PCIe3 NVMe SSD offering sequential read rates of up to 3600 MB/s. The drive would exhibit no performance throttling issues when running DiskSpd in a loop as it comes with its own heat spreader pre-installed. In comparison, most other OEMs do not include one with their budget or even midrange laptop models. It would have been nice to see faster PCIe4 options on the Inspiron 14 Plus 7420, however.

* ... smaller is better
Disk Throttling: DiskSpd Read Loop, Queue Depth 8
GPU Performance — Fast For The Size And Price
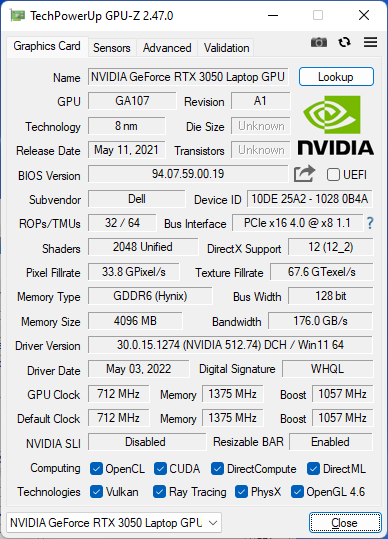
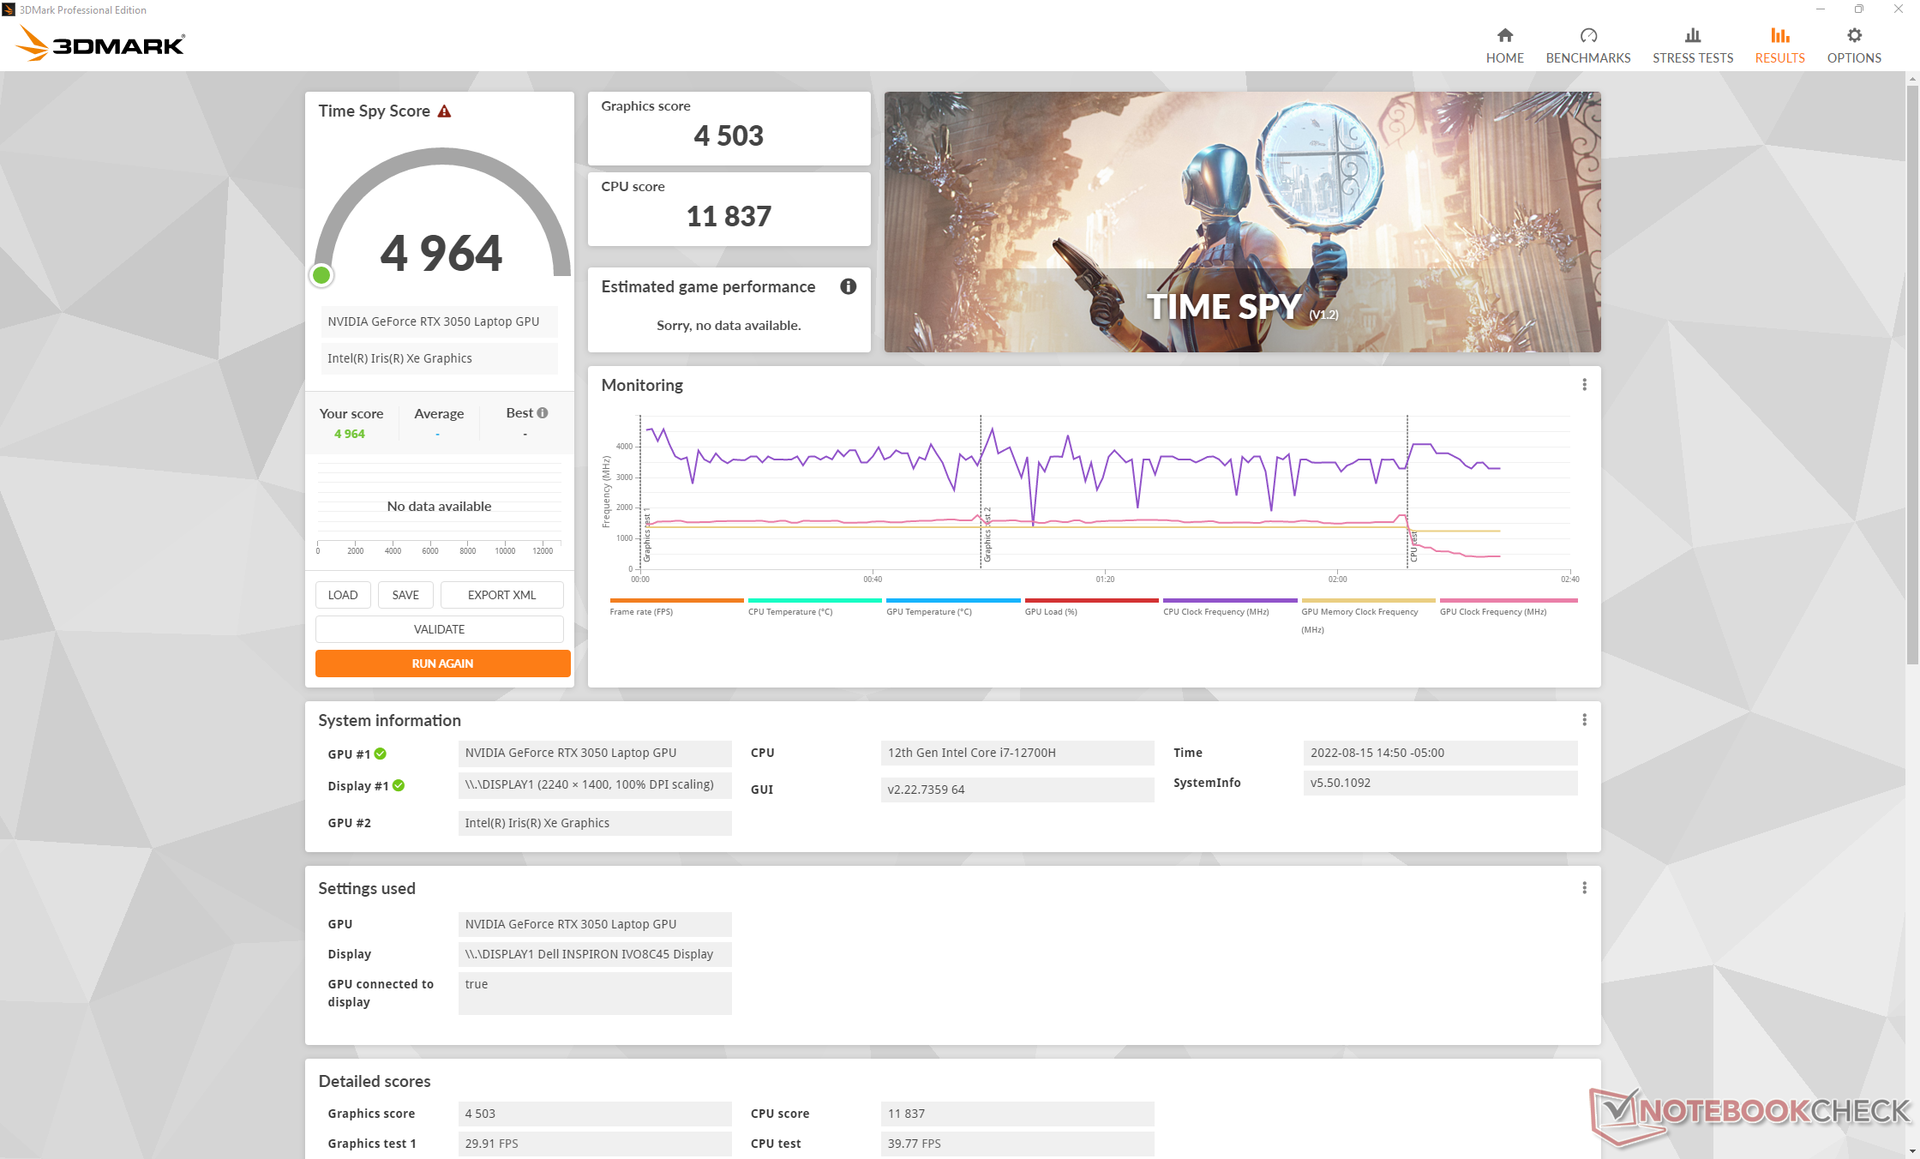
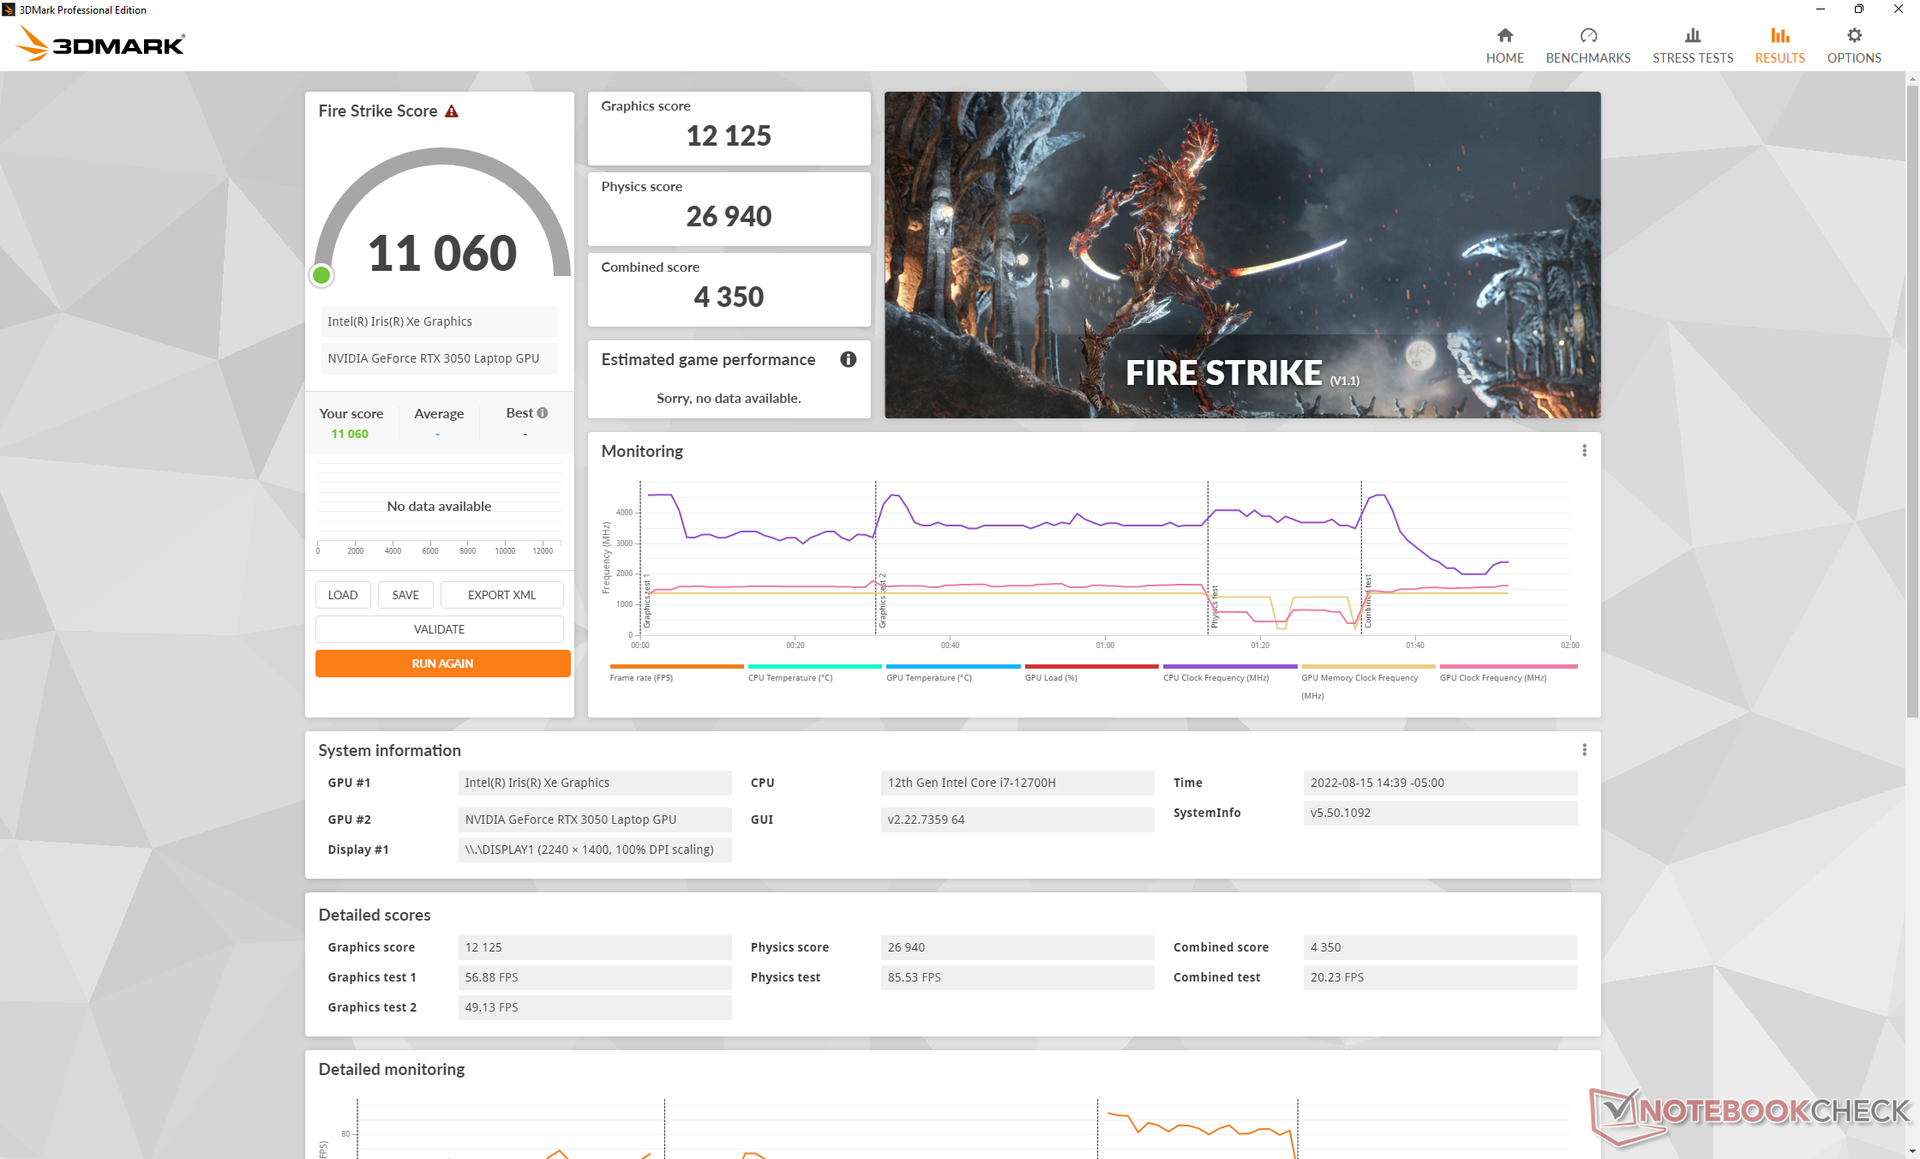
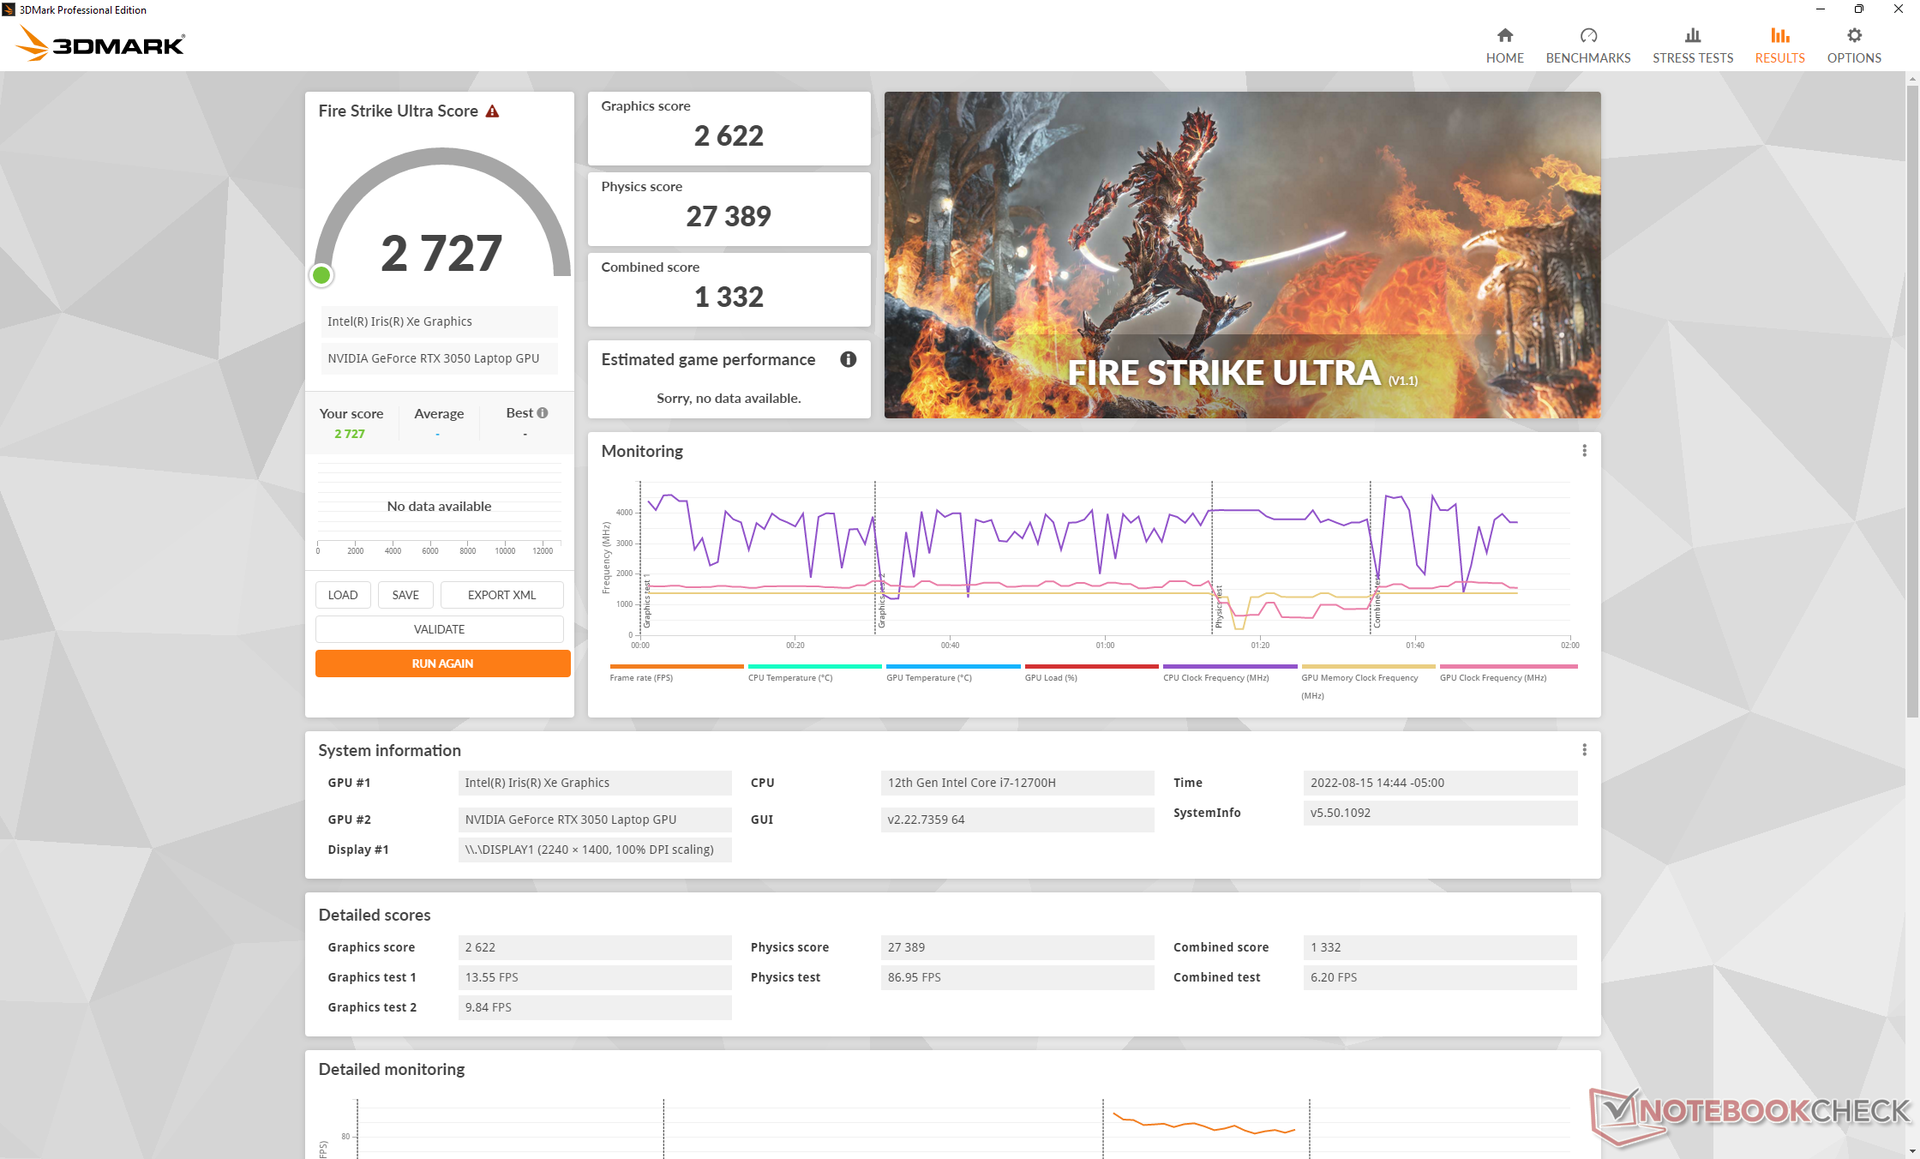
Graphics performance is where we expect it to be relative to other laptops with the same GeForce RTX 3050 GPU. In fact, results are pretty much on par with the RTX 3050 Ti as found on the Schenker Vision 14 or Asus ROG Flow Z13. Dell may introduce SKUs with the RTX 3050 Ti in the near future, but we don't recommend it as it will likely just be marginally faster than our base RTX 3050 SKU at best.
Users upgrading from the much older GTX 1650 Ti Max-Q will see significant improvements of about 50 percent.
Keep in mind that graphics performance is reduced if running on Dell Optimized mode instead of Dell Ultra Performance mode. A Fire Strike test on Optimized mode would return a graphics score of 10966 points compared to 12125 points when on Ultra Performance mode.
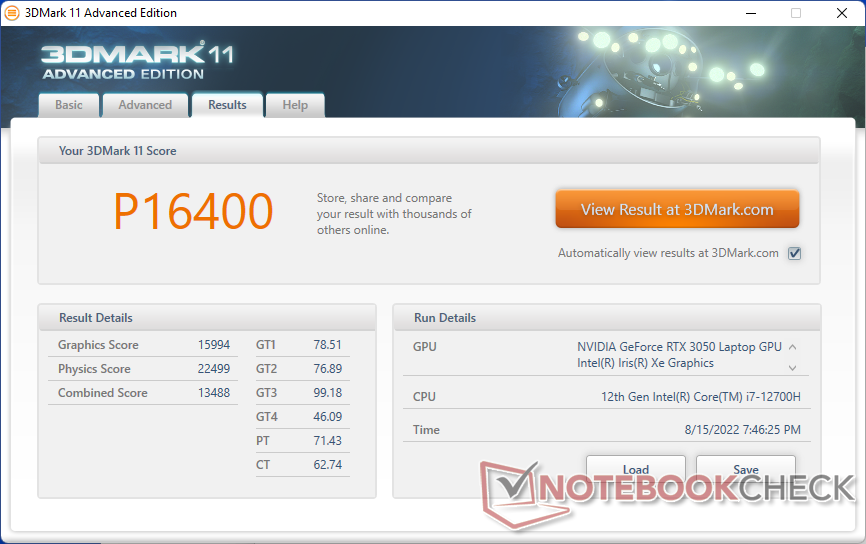
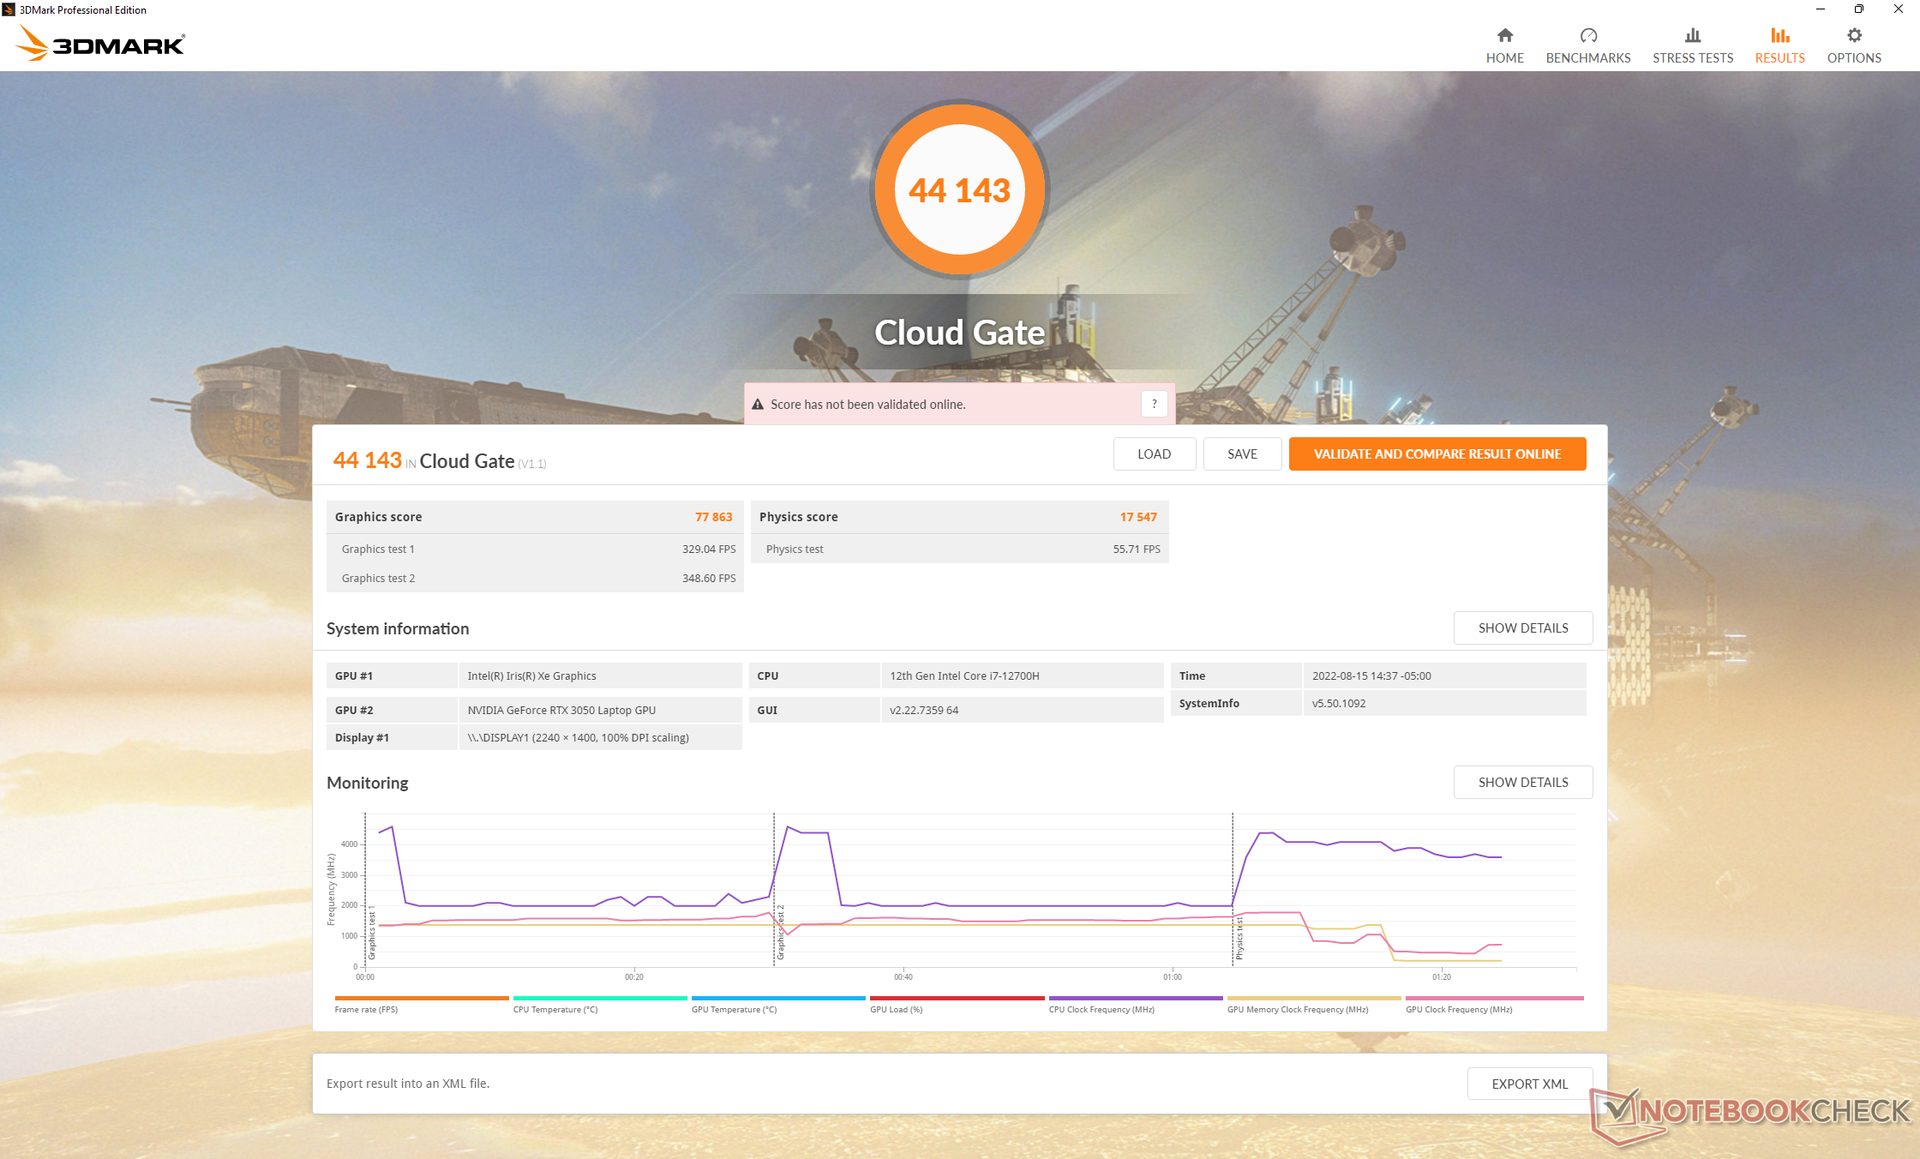

| 3DMark 11 Performance | 16400 points | |
| 3DMark Cloud Gate Standard Score | 44143 points | |
| 3DMark Fire Strike Score | 11060 points | |
| 3DMark Time Spy Score | 4964 points | |
Help | ||
Witcher 3 FPS Chart
| low | med. | high | ultra | |
|---|---|---|---|---|
| GTA V (2015) | 181.8 | 161.4 | 111.5 | 61.8 |
| The Witcher 3 (2015) | 222.2 | 150.4 | 83.5 | 46 |
| Dota 2 Reborn (2015) | 174.4 | 158.7 | 145 | 134.4 |
| Final Fantasy XV Benchmark (2018) | 113.5 | 66.1 | 47.4 | |
| X-Plane 11.11 (2018) | 137.8 | 117.2 | 94.4 | |
| Strange Brigade (2018) | 263 | 118.2 | 94.7 | 82.4 |
| Cyberpunk 2077 1.6 (2022) | 68.6 | 55 | 41 | 33.8 |
Emissions — Loud Like A Gamer
System Noise
The twin fans in the system are sensitive to high loads. When initiating 3DMark 06, for example, fan noise would pick up quickly before stabilizing at around 47 dB(A) towards the end of the first benchmark scene compared to 43 dB(A) on the Schenker Vision 14 or 35 dB(A) on the HP Envy 14 each with discrete GeForce graphics.
Running games on Ultra Performance mode would result in a fan noise of almost 52 dB(A) which is comparable to many dedicated gaming laptops with faster graphics. Fan noise would drop to 48 dB(A) if gaming on Dell Optimized mode instead, but this entails a small cut to graphics performance as mentioned above. Thus, users must endure the maximum RPMs of the fans if they wish to squeeze the full 50 W power envelope of the GeForce GPU.
Thankfully, the fans are pretty quiet at 26.5 dB(A) against a silent background of 23.2 dB(A) during more mundane tasks like web browsing or video streaming. Only when higher loads are introduced will they begin to ramp up very quickly.
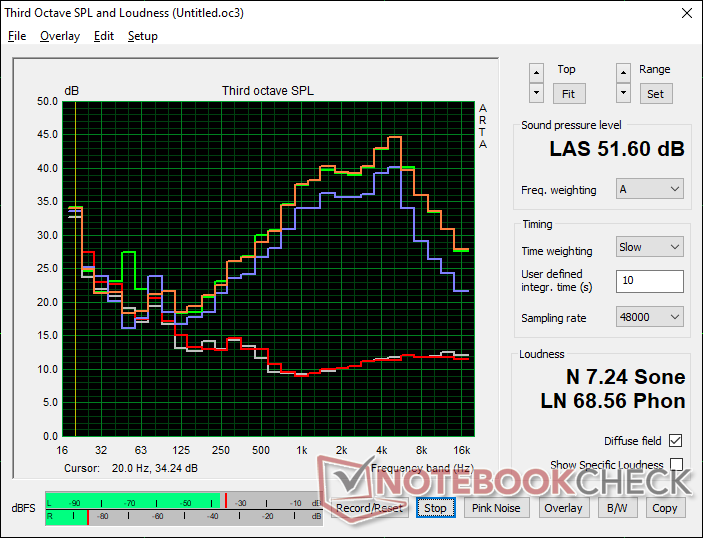
Noise level
| Idle |
| 23.2 / 23.2 / 23.2 dB(A) |
| Load |
| 47.5 / 51.7 dB(A) |
 | ||
30 dB silent 40 dB(A) audible 50 dB(A) loud |
||
min: | ||
| Dell Inspiron 14 Plus 7420 GeForce RTX 3050 4GB Laptop GPU, i7-12700H, SK Hynix BC711 512GB HFM512GD3GX013N | Asus Vivobook Pro 14 M3401QC-KM007T GeForce RTX 3050 4GB Laptop GPU, R5 5600H, Intel SSD 670p SSDPEKNU512GZ | Dell Inspiron 14 7420 2-in-1 Iris Xe G7 96EUs, i7-1255U, WDC PC SN530 SDBPMPZ-512G | Schenker Vision 14 GeForce RTX 3050 Ti Laptop GPU, i7-11370H, Samsung SSD 980 Pro 1TB MZ-V8P1T0BW | Asus Zenbook 14X UX5400E GeForce MX450, i7-1165G7, SK Hynix HFM001TD3JX013N | HP Envy 14-eb0010nr GeForce GTX 1650 Ti Max-Q, i5-1135G7, Samsung SSD PM981a MZVLB256HBHQ | |
|---|---|---|---|---|---|---|
| Noise | -14% | 7% | 0% | -0% | 3% | |
| off / environment * (dB) | 23.2 | 25.4 -9% | 23.1 -0% | 24.3 -5% | 26 -12% | 25.9 -12% |
| Idle Minimum * (dB) | 23.2 | 25.4 -9% | 24.7 -6% | 24.3 -5% | 26 -12% | 26 -12% |
| Idle Average * (dB) | 23.2 | 25.4 -9% | 24.7 -6% | 24.3 -5% | 26 -12% | 26 -12% |
| Idle Maximum * (dB) | 23.2 | 30.9 -33% | 24.7 -6% | 25.9 -12% | 26.3 -13% | 26 -12% |
| Load Average * (dB) | 47.5 | 56 -18% | 27.7 42% | 43.3 9% | 37.1 22% | 34.9 27% |
| Witcher 3 ultra * (dB) | 51.7 | 45.1 13% | 44.6 14% | 34.5 33% | ||
| Load Maximum * (dB) | 51.7 | 56 -8% | 45.1 13% | 49.5 4% | 38 26% | 48.7 6% |
* ... smaller is better
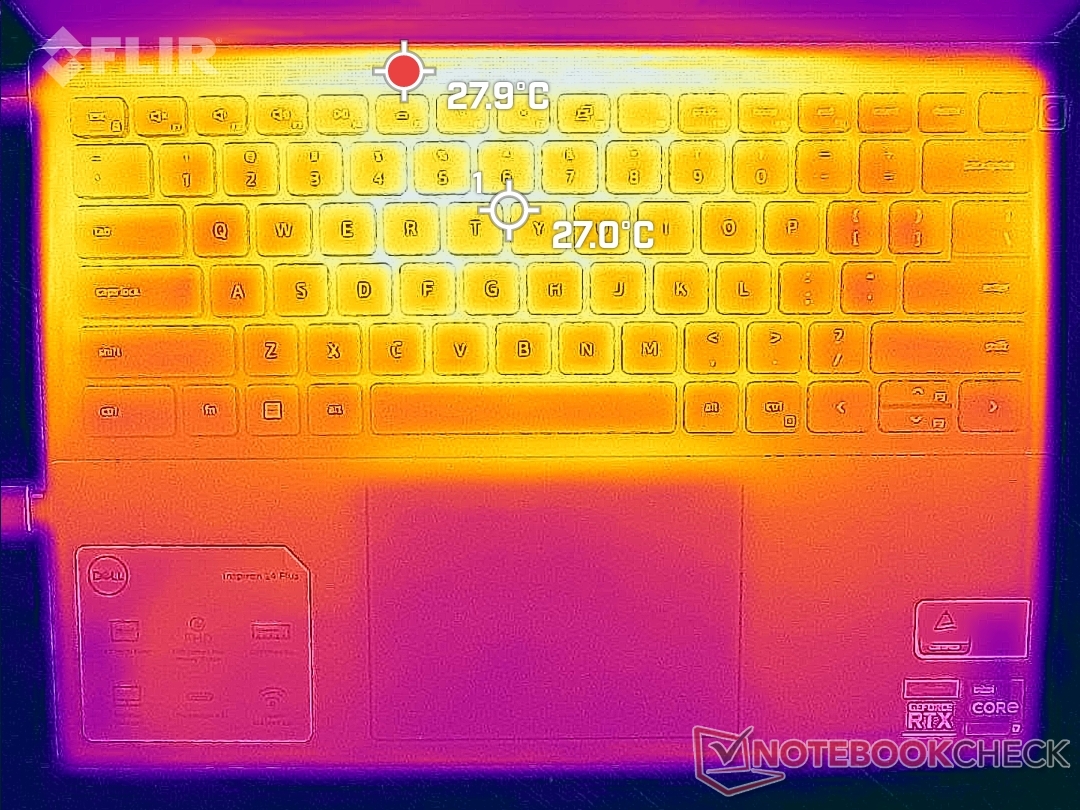
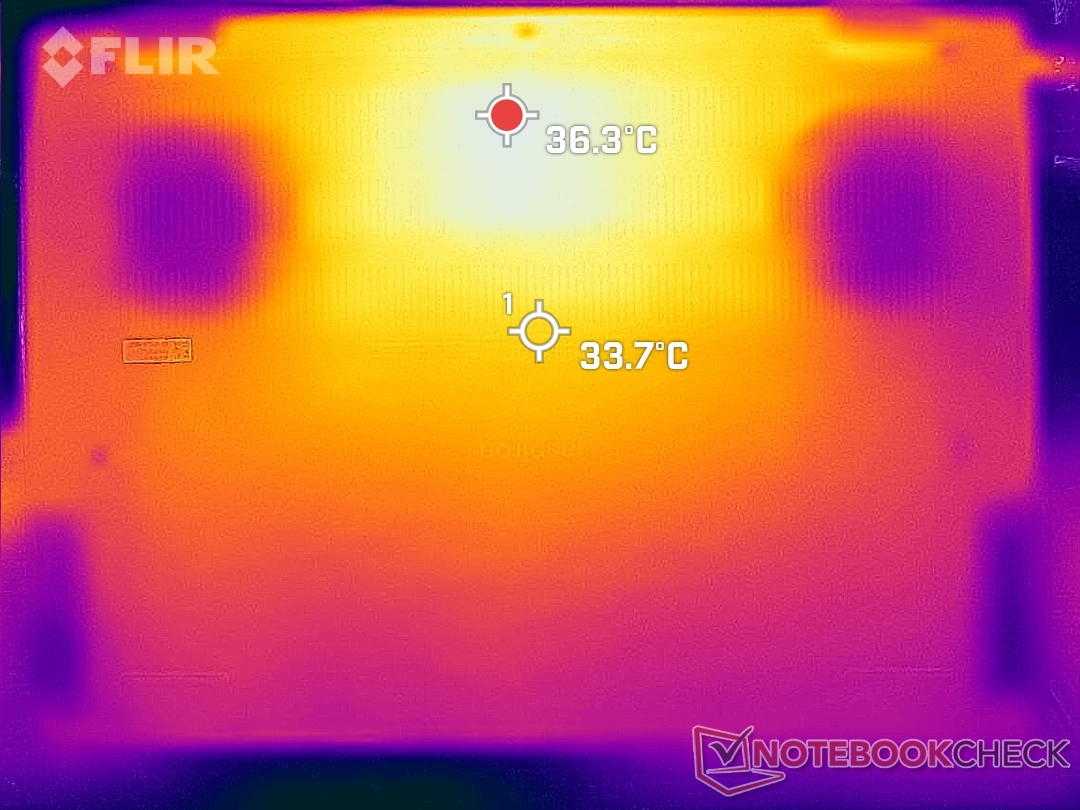
Temperature
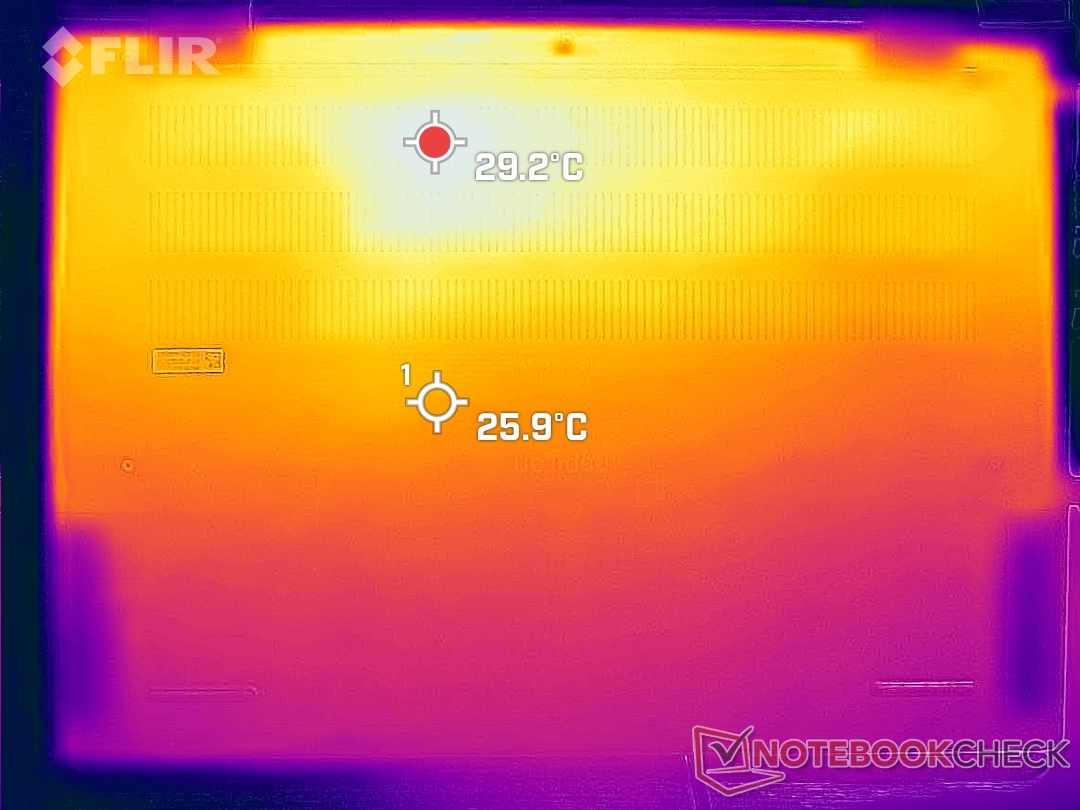
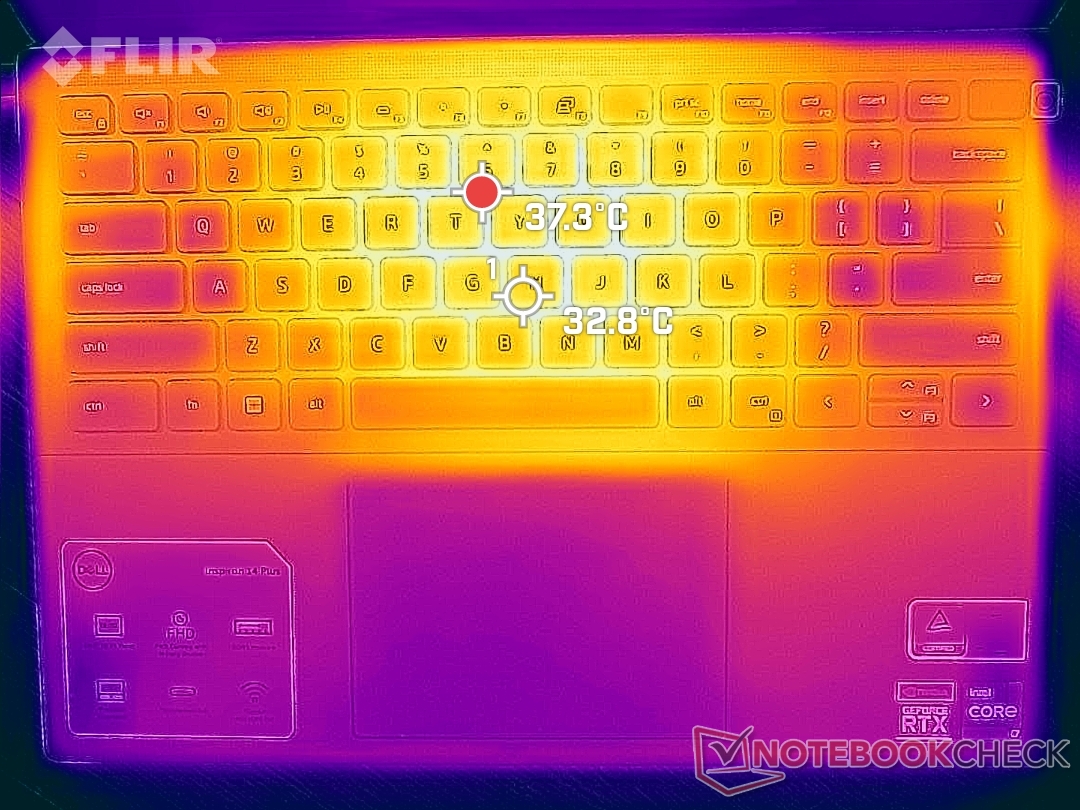
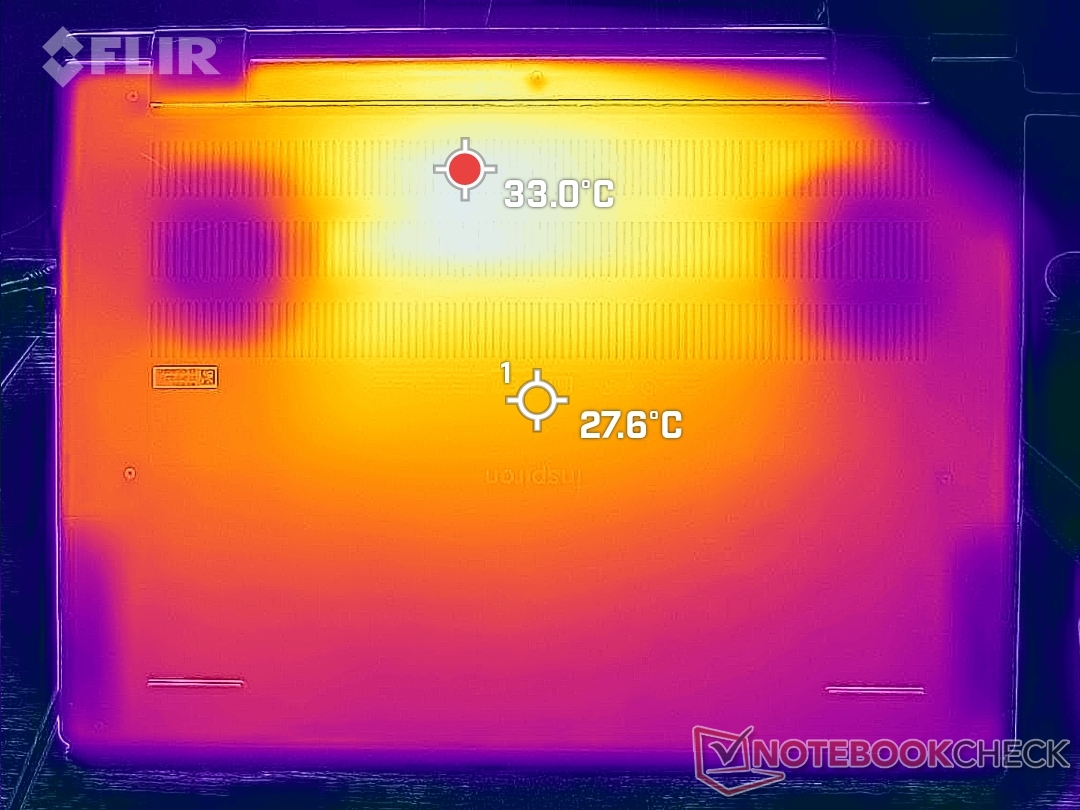
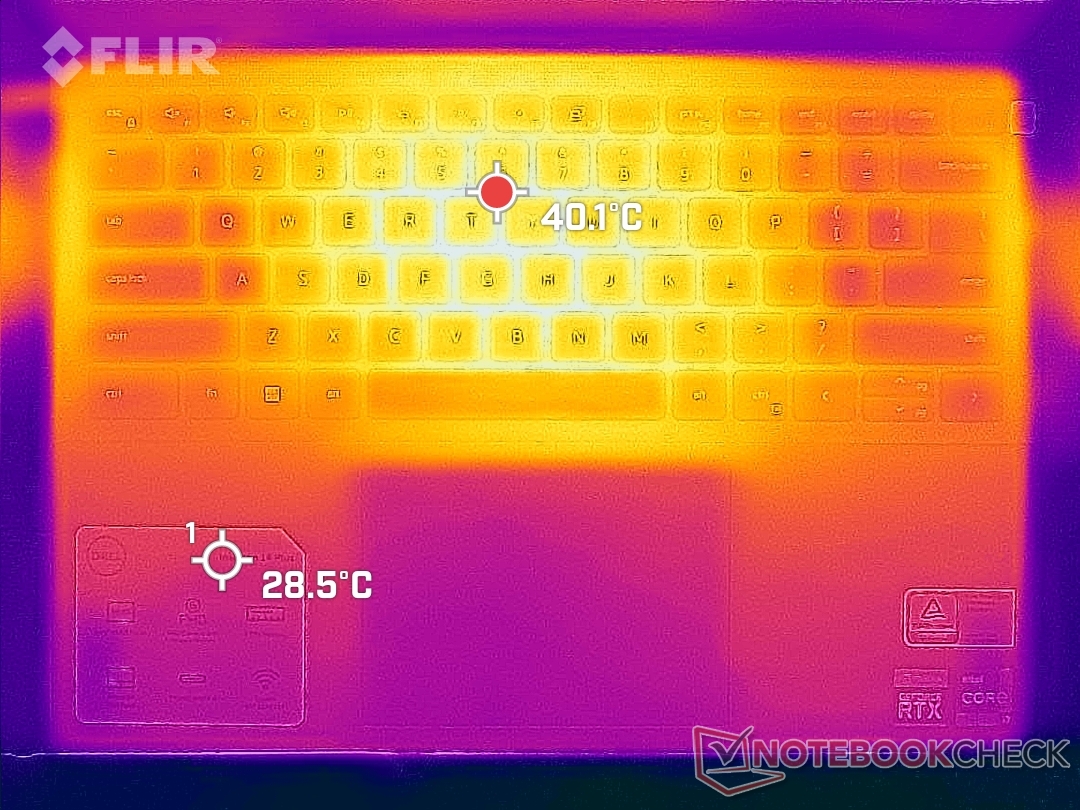
Surface temperatures when idling are warm at around 28 C on both the top and bottom which is similar to other thin multimedia laptops with discrete graphics like the Asus Vivobook Pro 14 or Schenker Vision 14. When gaming, hot spots can reach just over 40 C near the keyboard center and rear of the chassis while the pam rests remain more comfortable at the sub 30 C range. Hot spots here are generally cooler than on the aforementioned Asus or Schenker which can can reach 45 C to 55 C.
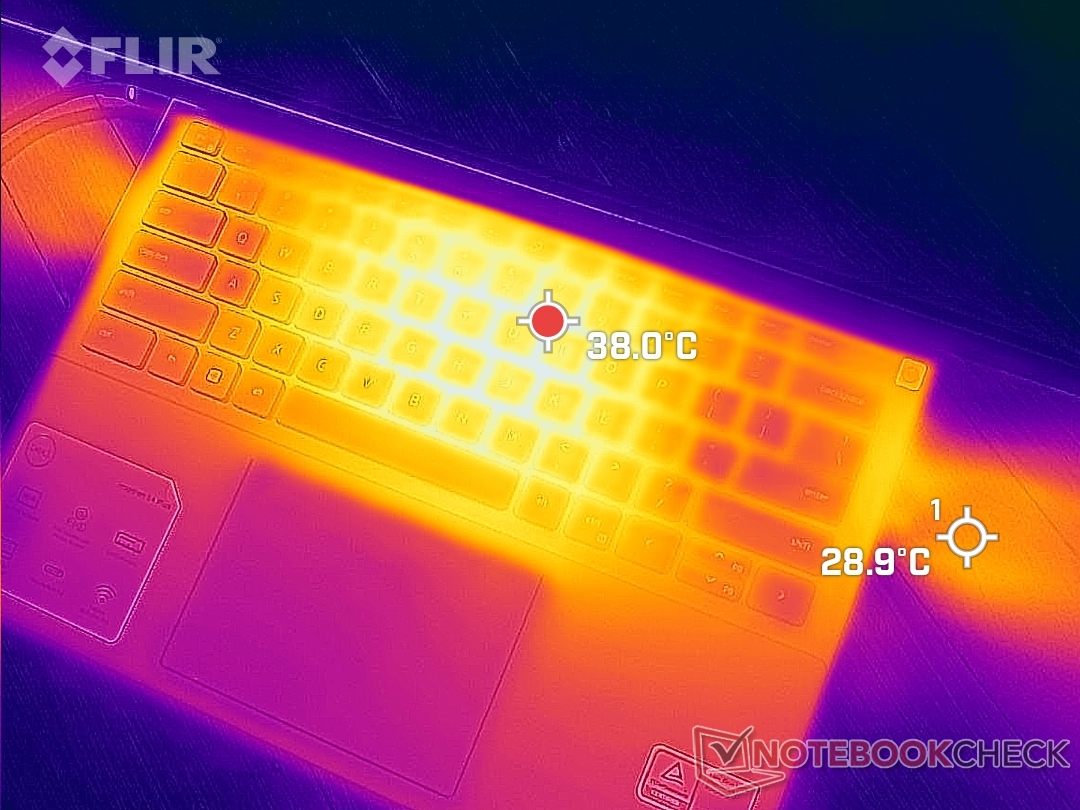
(±) The maximum temperature on the upper side is 40 °C / 104 F, compared to the average of 36.8 °C / 98 F, ranging from 21 to 71 °C for the class Multimedia.
(+) The bottom heats up to a maximum of 36.4 °C / 98 F, compared to the average of 39.1 °C / 102 F
(+) In idle usage, the average temperature for the upper side is 24.2 °C / 76 F, compared to the device average of 31.3 °C / 88 F.
(+) Playing The Witcher 3, the average temperature for the upper side is 28.6 °C / 83 F, compared to the device average of 31.3 °C / 88 F.
(+) The palmrests and touchpad are cooler than skin temperature with a maximum of 29.4 °C / 84.9 F and are therefore cool to the touch.
(±) The average temperature of the palmrest area of similar devices was 28.7 °C / 83.7 F (-0.7 °C / -1.2 F).
| Dell Inspiron 14 Plus 7420 Intel Core i7-12700H, NVIDIA GeForce RTX 3050 4GB Laptop GPU | Asus Vivobook Pro 14 M3401QC-KM007T AMD Ryzen 5 5600H, NVIDIA GeForce RTX 3050 4GB Laptop GPU | Dell Inspiron 14 7420 2-in-1 Intel Core i7-1255U, Intel Iris Xe Graphics G7 96EUs | Schenker Vision 14 Intel Core i7-11370H, NVIDIA GeForce RTX 3050 Ti Laptop GPU | Asus Zenbook 14X UX5400E Intel Core i7-1165G7, NVIDIA GeForce MX450 | MSI Summit E14 A11SCS Intel Core i7-1185G7, NVIDIA GeForce GTX 1650 Ti Max-Q | HP Envy 14-eb0010nr Intel Core i5-1135G7, NVIDIA GeForce GTX 1650 Ti Max-Q | |
|---|---|---|---|---|---|---|---|
| Heat | -25% | -5% | -23% | -17% | -33% | -19% | |
| Maximum Upper Side * (°C) | 40 | 42.3 -6% | 38.2 4% | 49.7 -24% | 42.4 -6% | 49.4 -23% | 41.2 -3% |
| Maximum Bottom * (°C) | 36.4 | 49.6 -36% | 45.6 -25% | 56 -54% | 47.7 -31% | 60.6 -66% | 45.6 -25% |
| Idle Upper Side * (°C) | 27 | 34.2 -27% | 27.4 -1% | 28.8 -7% | 32.3 -20% | 30.6 -13% | 31.8 -18% |
| Idle Bottom * (°C) | 29.2 | 37.9 -30% | 28.4 3% | 30.6 -5% | 31.9 -9% | 37.4 -28% | 37.8 -29% |
* ... smaller is better
Stress Test
Running Prime95 to stress the CPU would cause clock rates, temperature, and board power draw to spike to 3.5 GHz, 100 C, and 80 W, respectively, for about 10 seconds or so. Thereafter, clock rates, temperature, and board power draw would steadily decline before stabilizing at 1.9 GHz, 80 C, and 38 W, respectively, in order to keep temperatures in check. The performance drop is relatively steep as the HP Pavilion Plus 14 with the same CPU is able to maintain a faster 2.2 to 2.9 GHz range when subjected to the same test.
Running Witcher 3 shows the GeForce GPU stabilizing at 1590 MHz, 74 C, and 50 W. In comparison, the RTX 3050 Ti in the larger Inspiron 16 Plus would stabilize at 1627 MHz, 84 C, and 63 W. Core temperatures are unsurprisingly high since this is one of the few 14-inch laptops to come with both a Core H-series CPU and a GeForce RTX GPU. Changing the power profile from Ultra Performance to Optimized will drop the GPU power draw to around 45 W or less.
Running on battery power limits performance. A Fire Strike test on batteries would return Physics and Graphics scores of just 9493 and 7637 points, respectively, compared to 26940 and 12125 points when on mains.
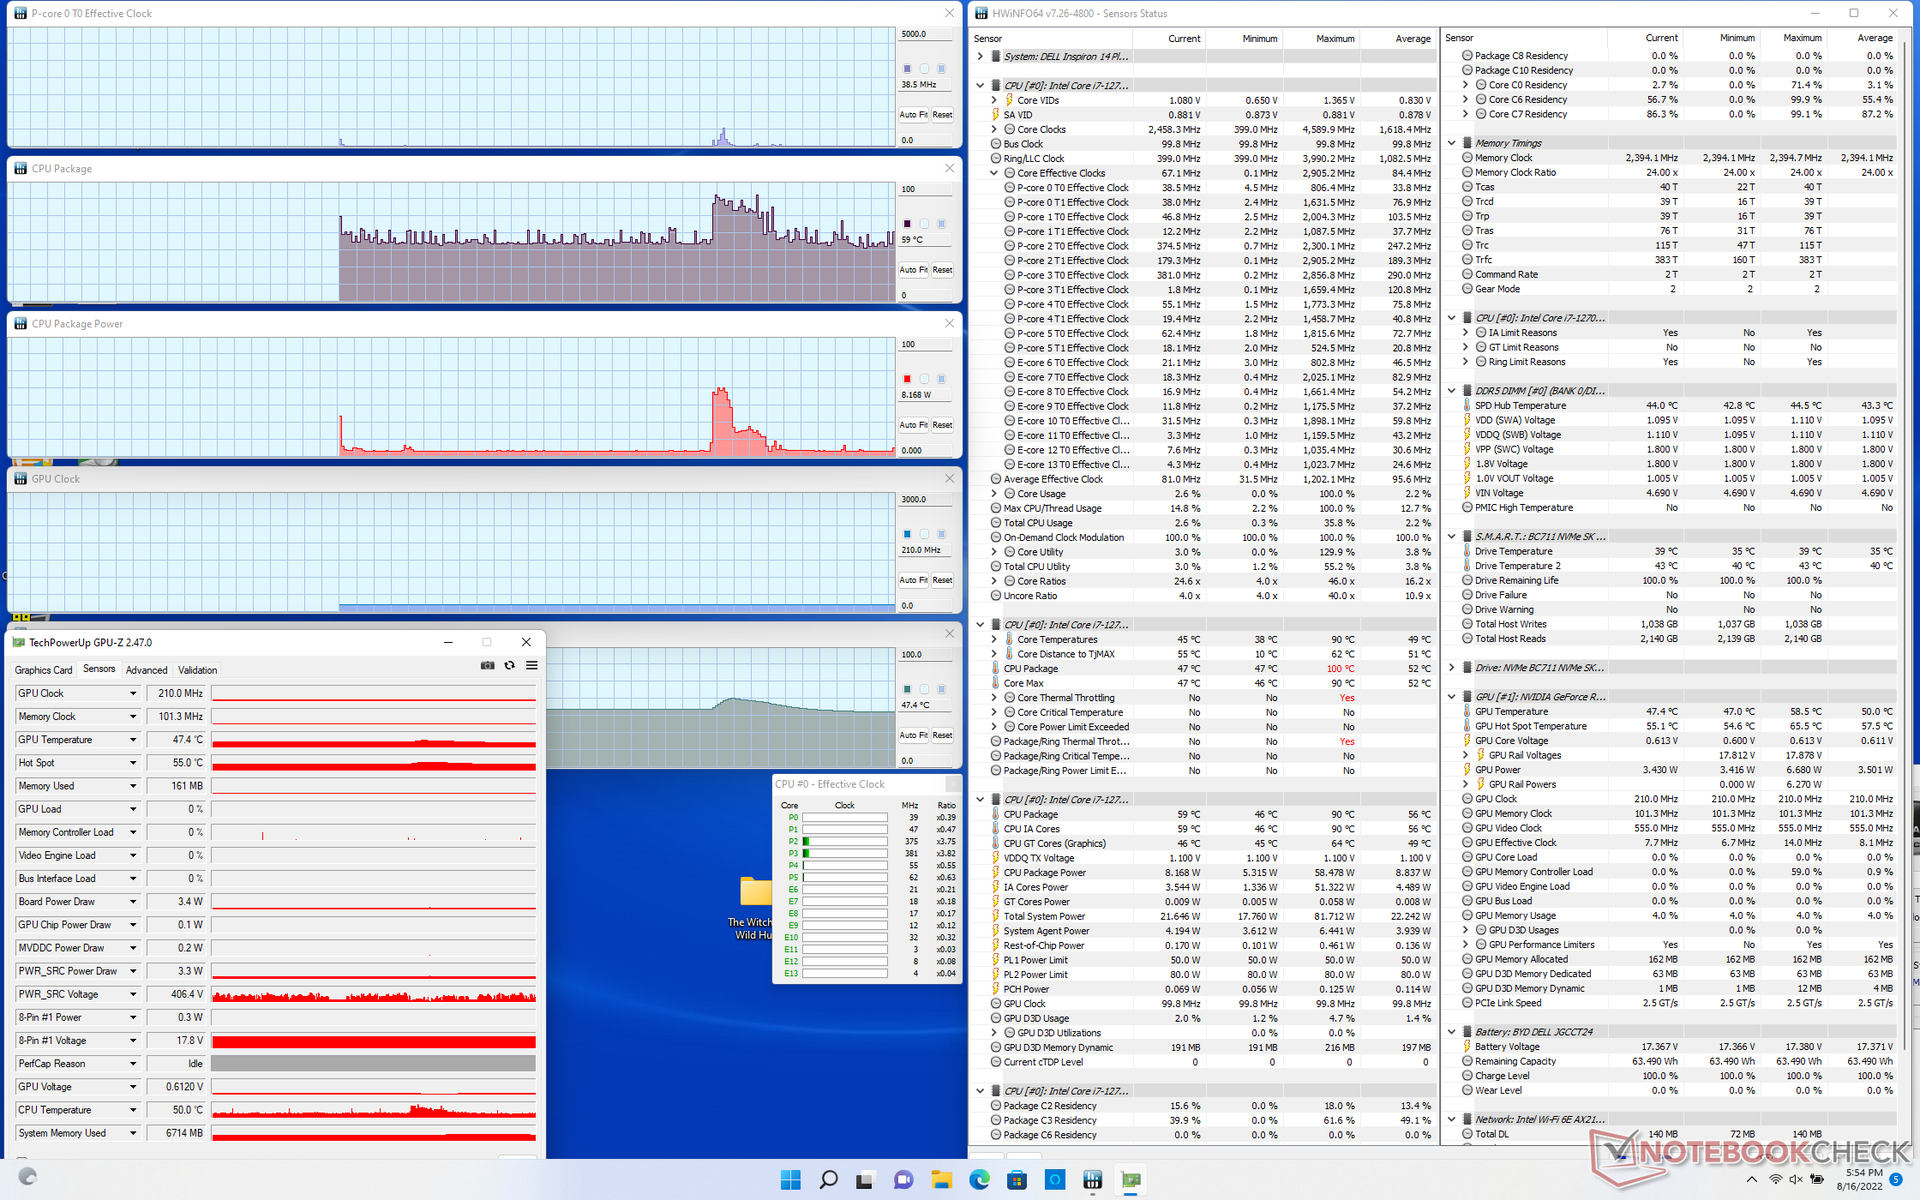
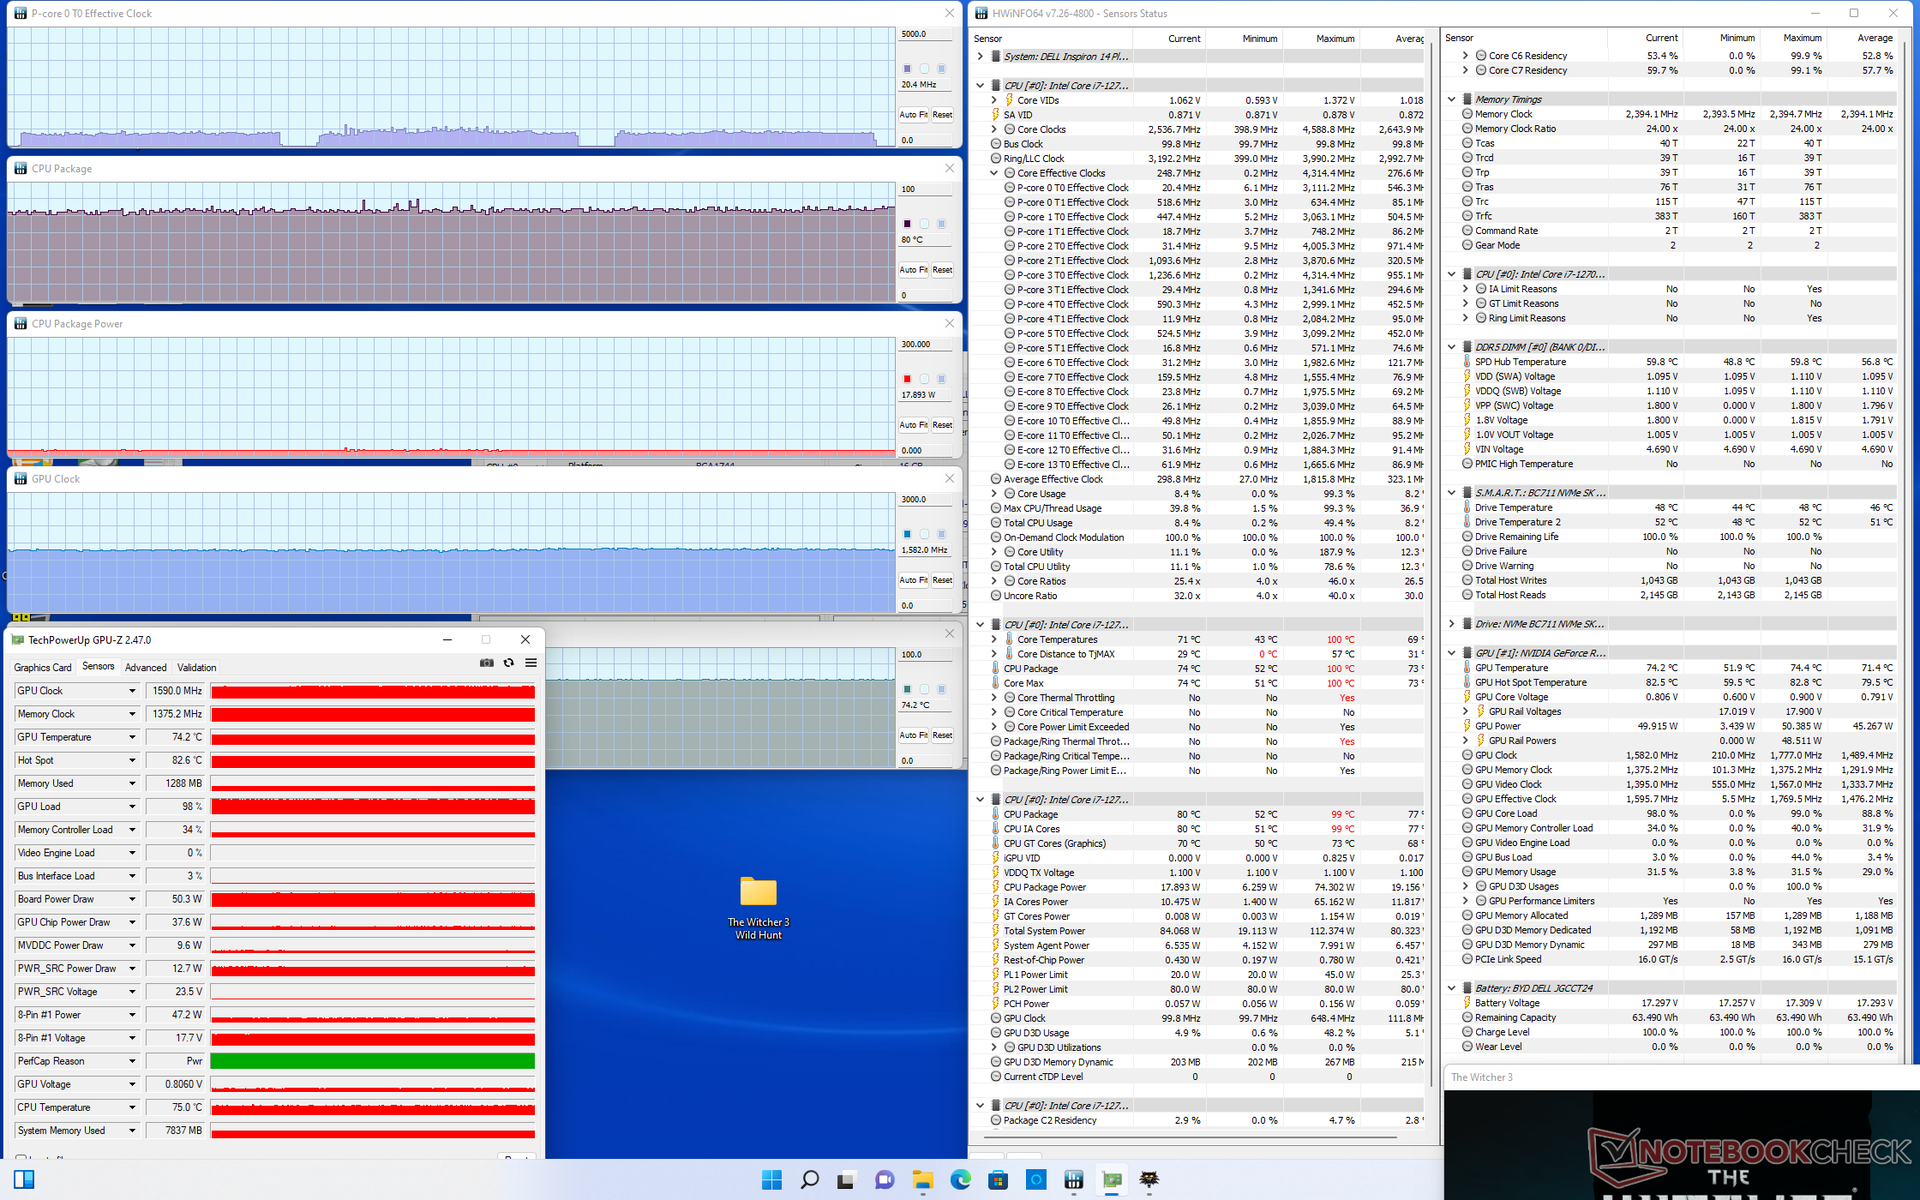
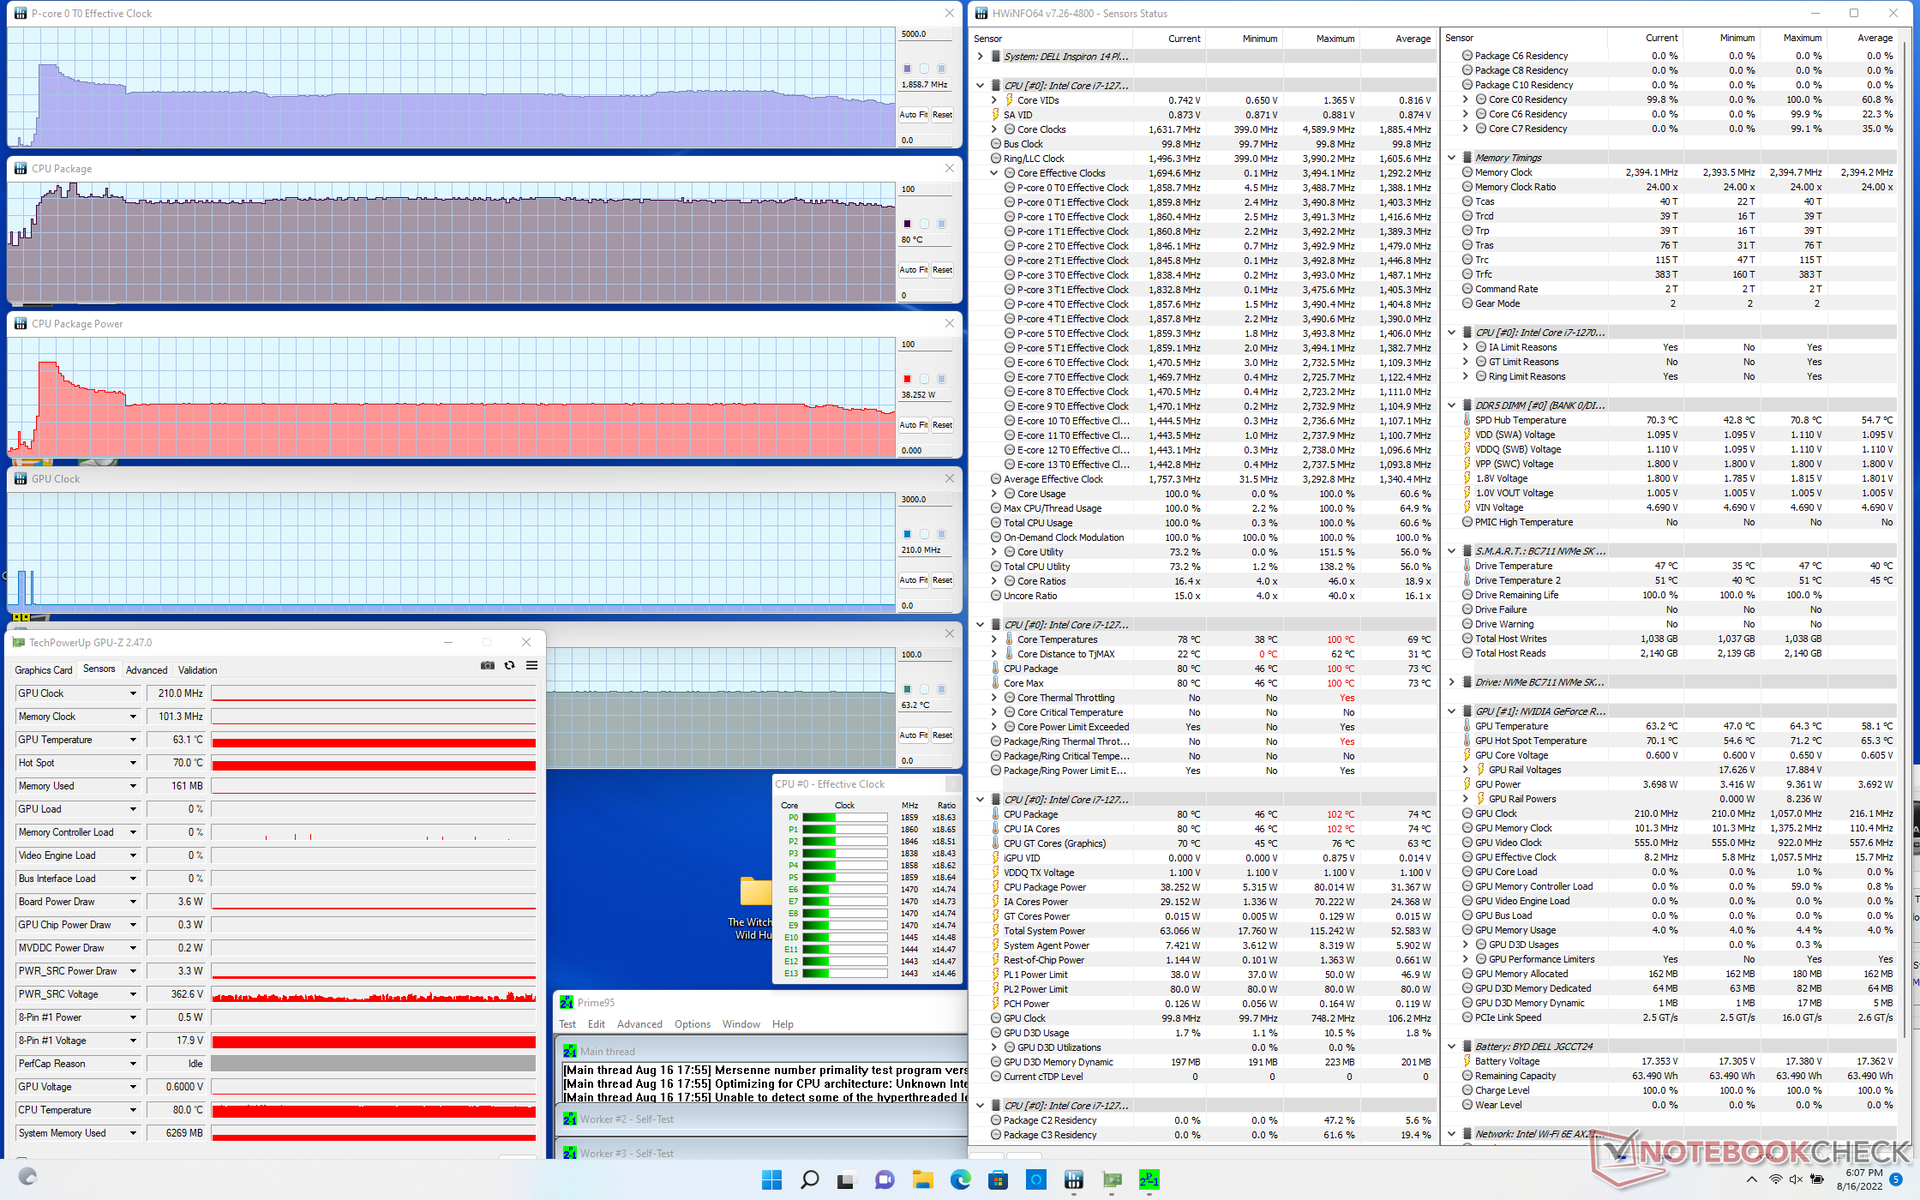
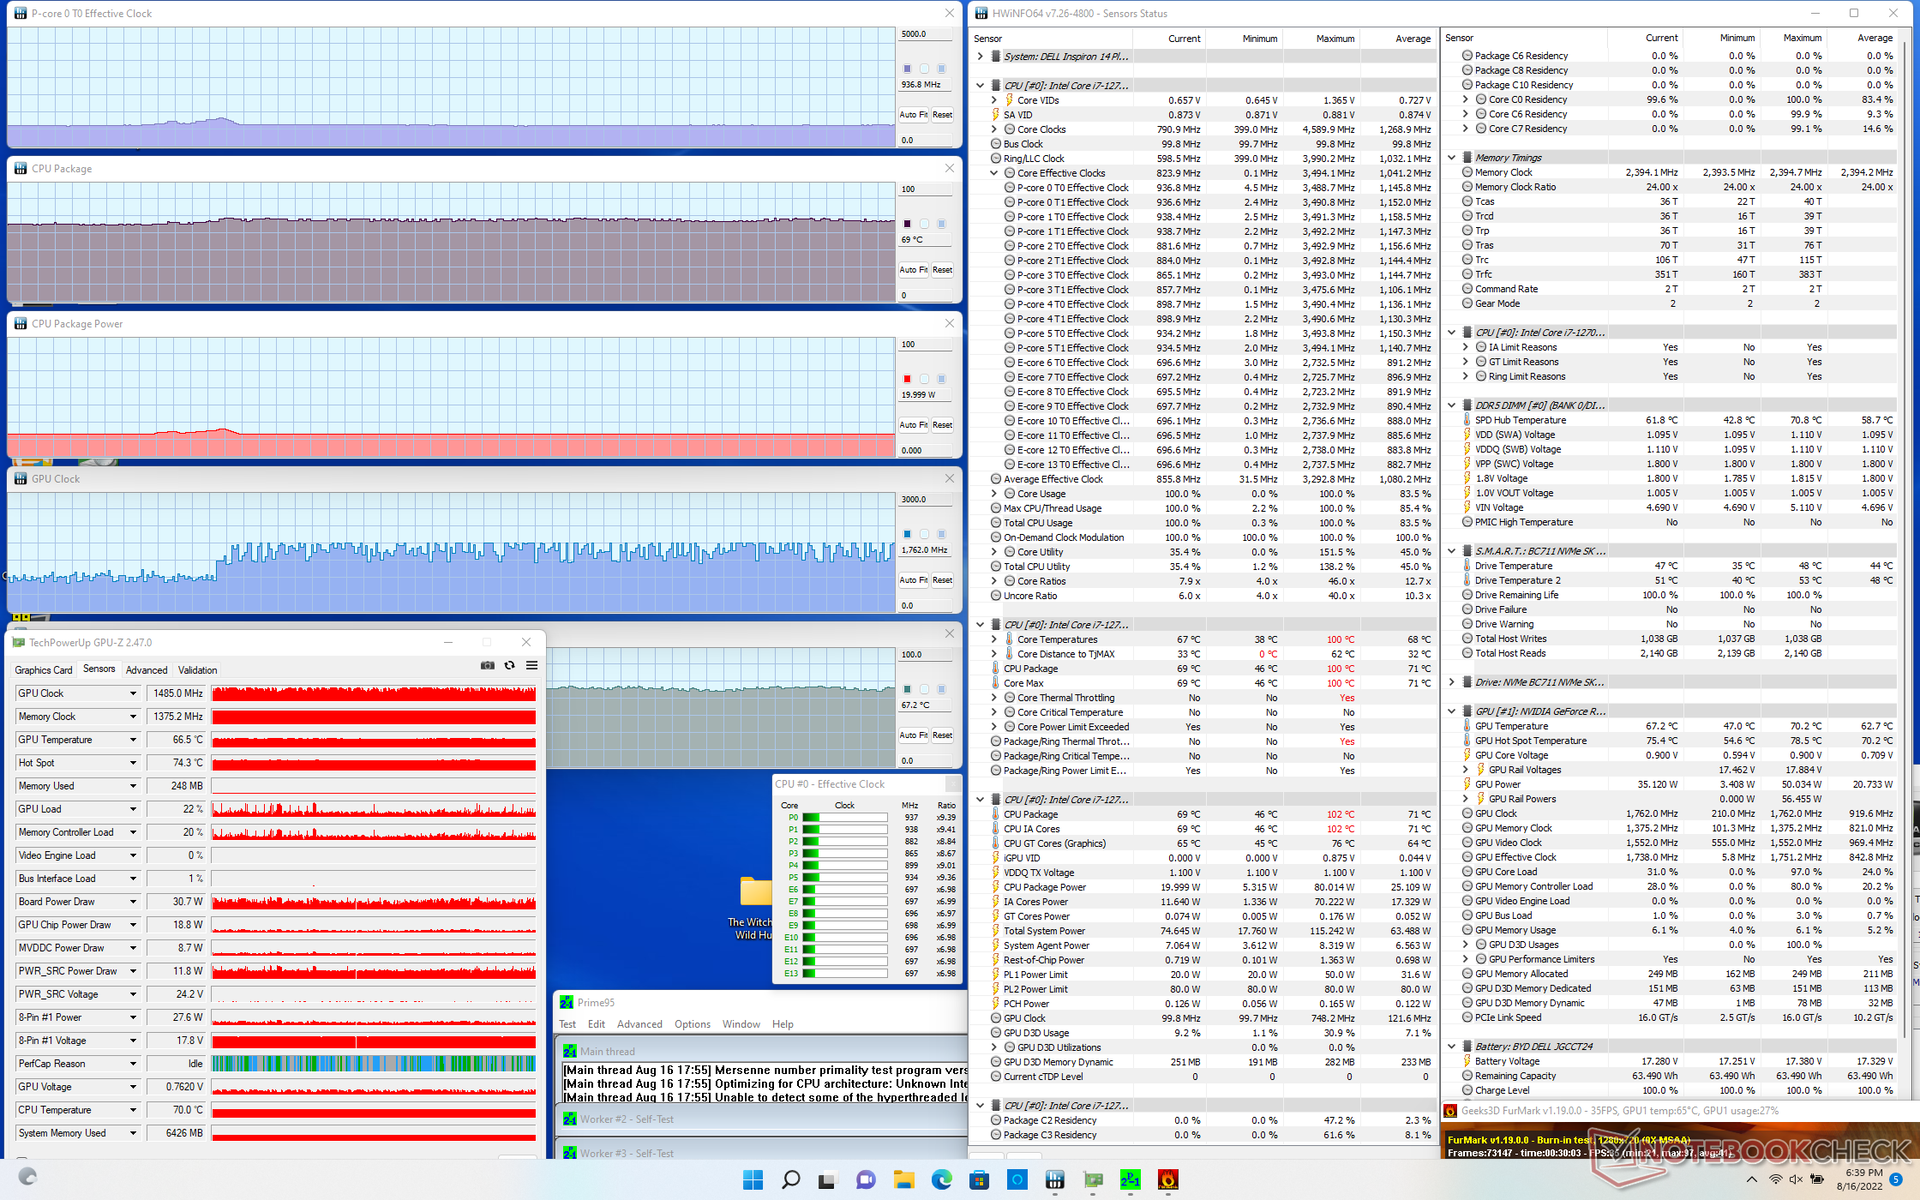
| CPU Clock (GHz) | GPU Clock (MHz) | Average CPU Temperature (°C) | Average GPU Temperature (°C) | |
| System Idle | -- | -- | 59 | 47 |
| Prime95 Stress | 1.9 | -- | 80 | 63 |
| Prime95 + FurMark Stress | 0.9 | ~1485 | 69 | 67 |
| Witcher 3 Stress | ~1.1 | 1590 | 80 | 74 |
Speakers
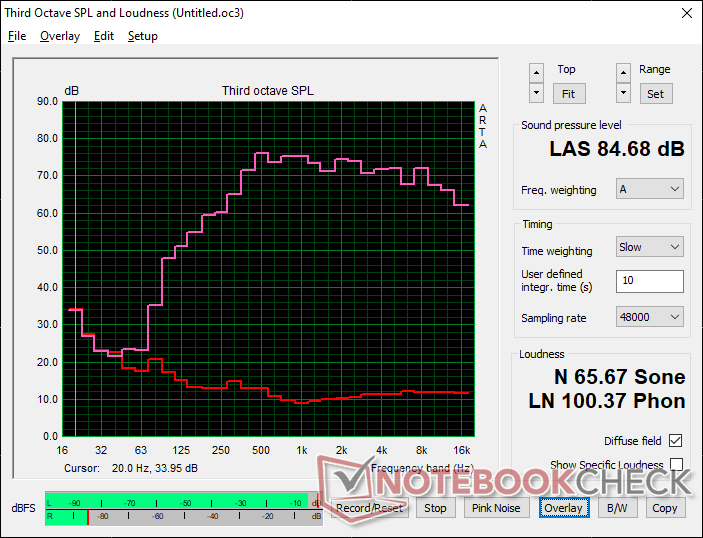
Dell Inspiron 14 Plus 7420 audio analysis
(+) | speakers can play relatively loud (84.7 dB)
Bass 100 - 315 Hz
(±) | reduced bass - on average 14.7% lower than median
(±) | linearity of bass is average (8.3% delta to prev. frequency)
Mids 400 - 2000 Hz
(+) | balanced mids - only 2.6% away from median
(+) | mids are linear (4.8% delta to prev. frequency)
Highs 2 - 16 kHz
(+) | balanced highs - only 1.8% away from median
(+) | highs are linear (4.4% delta to prev. frequency)
Overall 100 - 16.000 Hz
(+) | overall sound is linear (10.4% difference to median)
Compared to same class
» 15% of all tested devices in this class were better, 1% similar, 84% worse
» The best had a delta of 5%, average was 17%, worst was 45%
Compared to all devices tested
» 5% of all tested devices were better, 1% similar, 93% worse
» The best had a delta of 4%, average was 23%, worst was 134%
Apple MacBook Pro 16 2021 M1 Pro audio analysis
(+) | speakers can play relatively loud (84.7 dB)
Bass 100 - 315 Hz
(+) | good bass - only 3.8% away from median
(+) | bass is linear (5.2% delta to prev. frequency)
Mids 400 - 2000 Hz
(+) | balanced mids - only 1.3% away from median
(+) | mids are linear (2.1% delta to prev. frequency)
Highs 2 - 16 kHz
(+) | balanced highs - only 1.9% away from median
(+) | highs are linear (2.7% delta to prev. frequency)
Overall 100 - 16.000 Hz
(+) | overall sound is linear (4.6% difference to median)
Compared to same class
» 0% of all tested devices in this class were better, 0% similar, 100% worse
» The best had a delta of 5%, average was 17%, worst was 45%
Compared to all devices tested
» 0% of all tested devices were better, 0% similar, 100% worse
» The best had a delta of 4%, average was 23%, worst was 134%
Energy Management — Demanding Little Machine
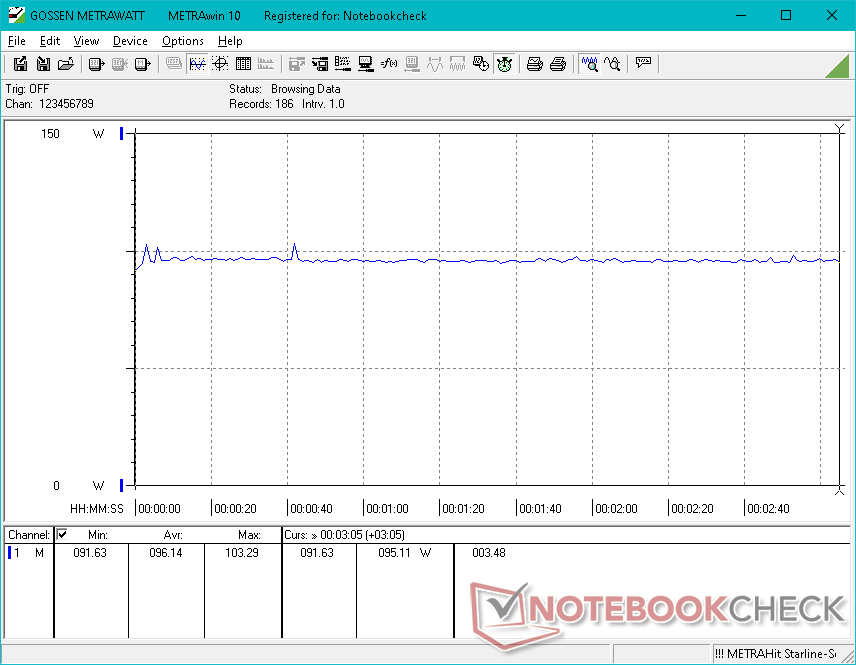
Power Consumption
Power consumption on Power Saver mode ranges between 6 W if on the minimum brightness setting to 10 W if on the maximum setting. Changing the power profile to Ultra Performance mode with the Nvidia GPU active raises the idling power consumption to 20 W which is about twice that of most slower 14-inch laptops powered by U-series CPUs.
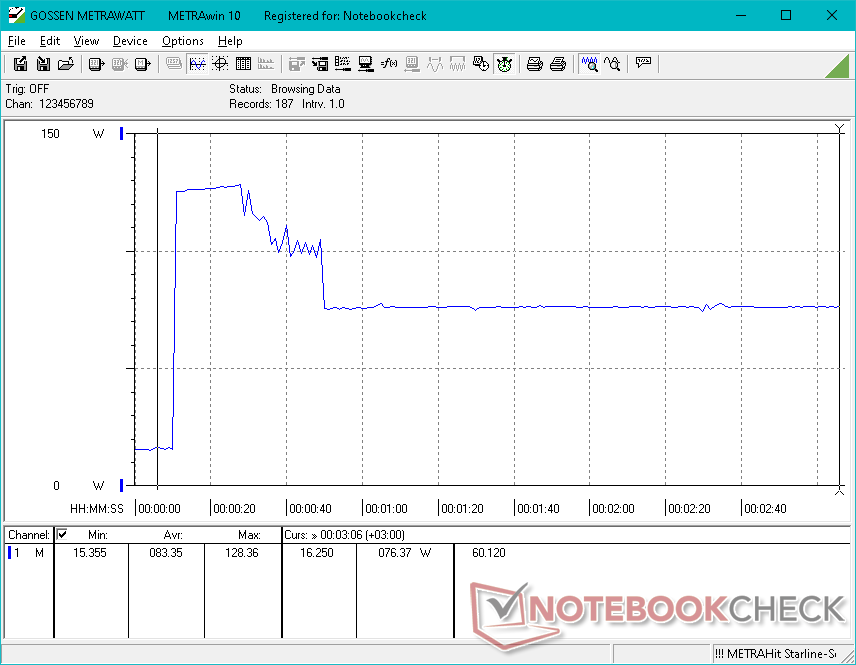
Gaming demands between 96 W and 106 W compared to just 40 W or 50 W on traditional U-series-powered alternatives. The Intel 12th gen H-series is known to be very demanding on top of an already demanding discrete GPU. Thus, it's no wonder that the Inspiron 14 Plus runs both louder and warmer than the average 14-inch laptop.
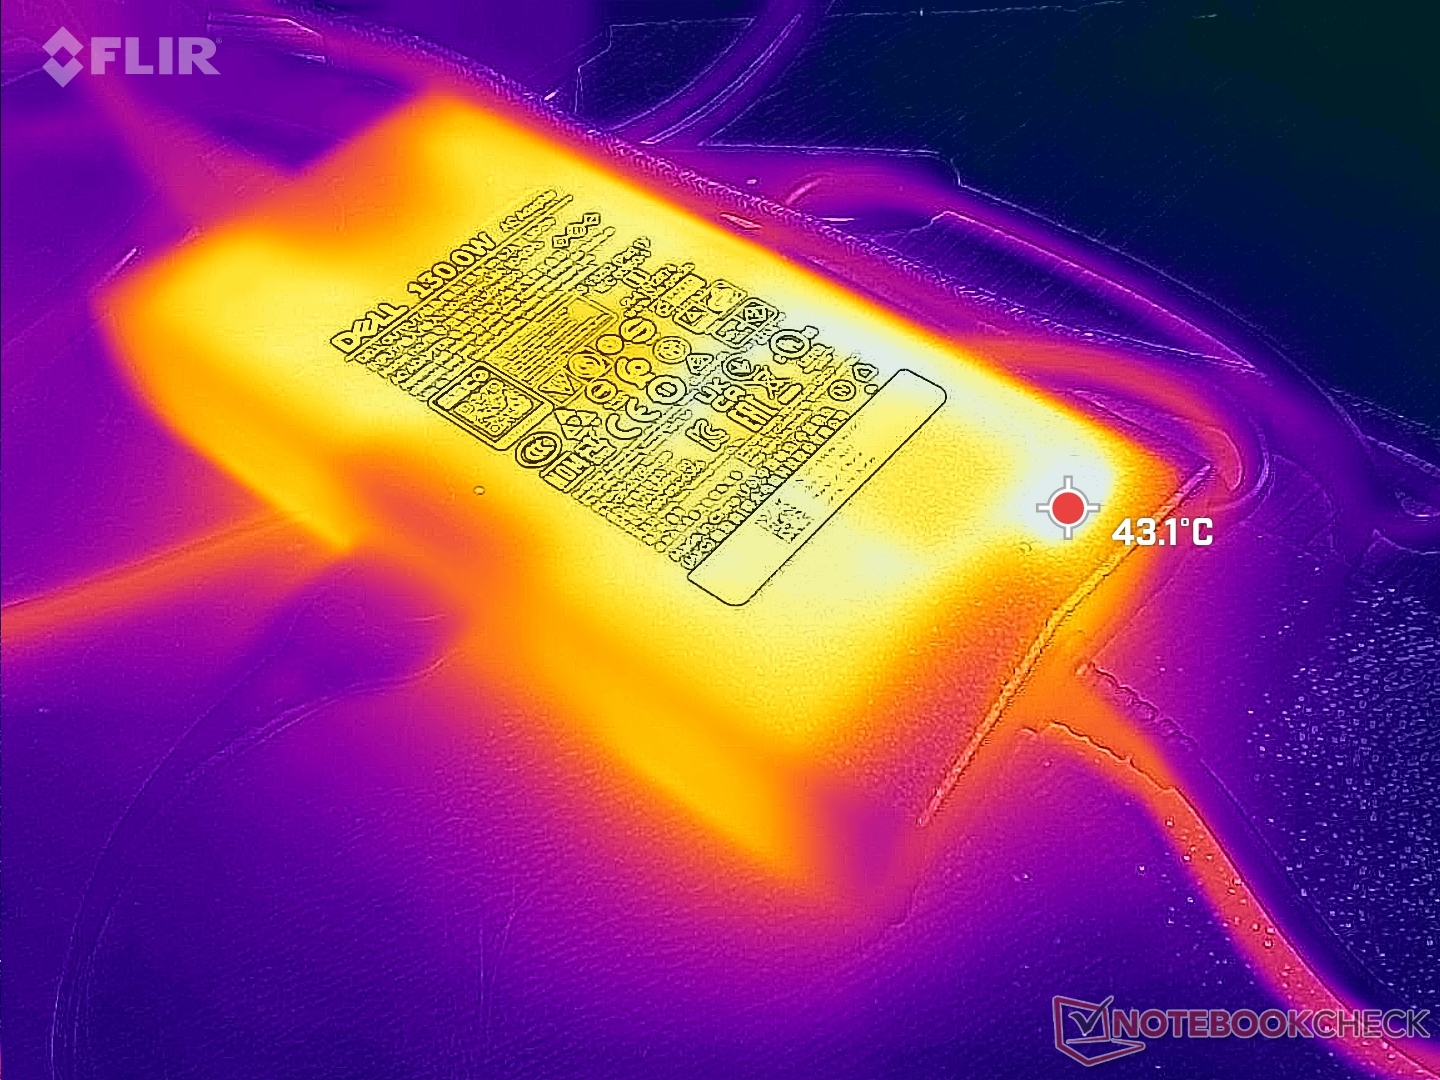
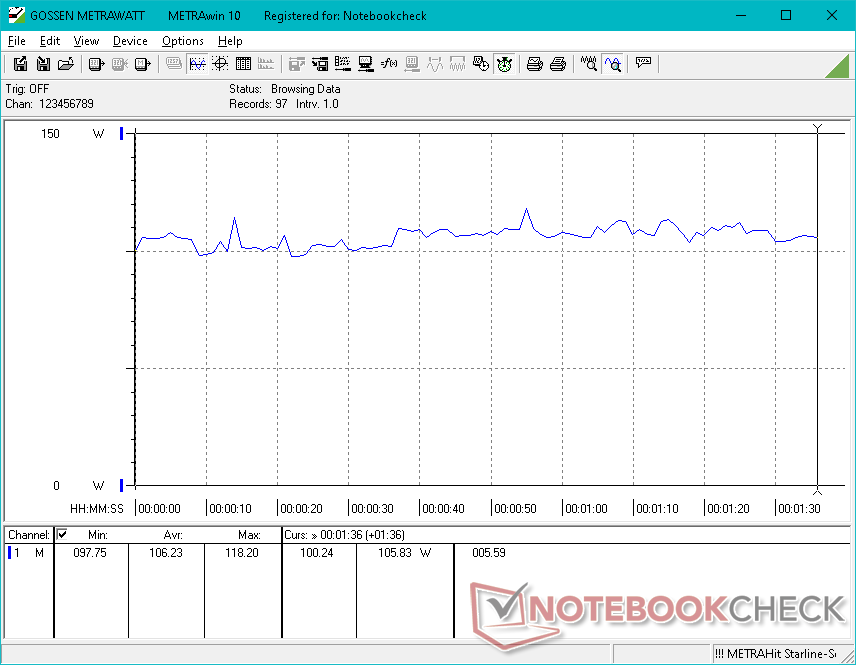
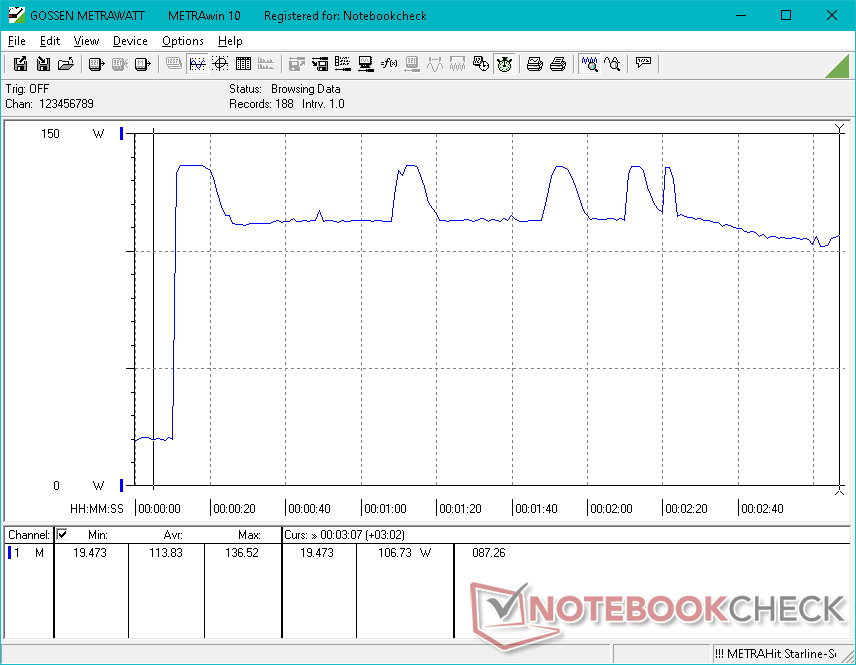
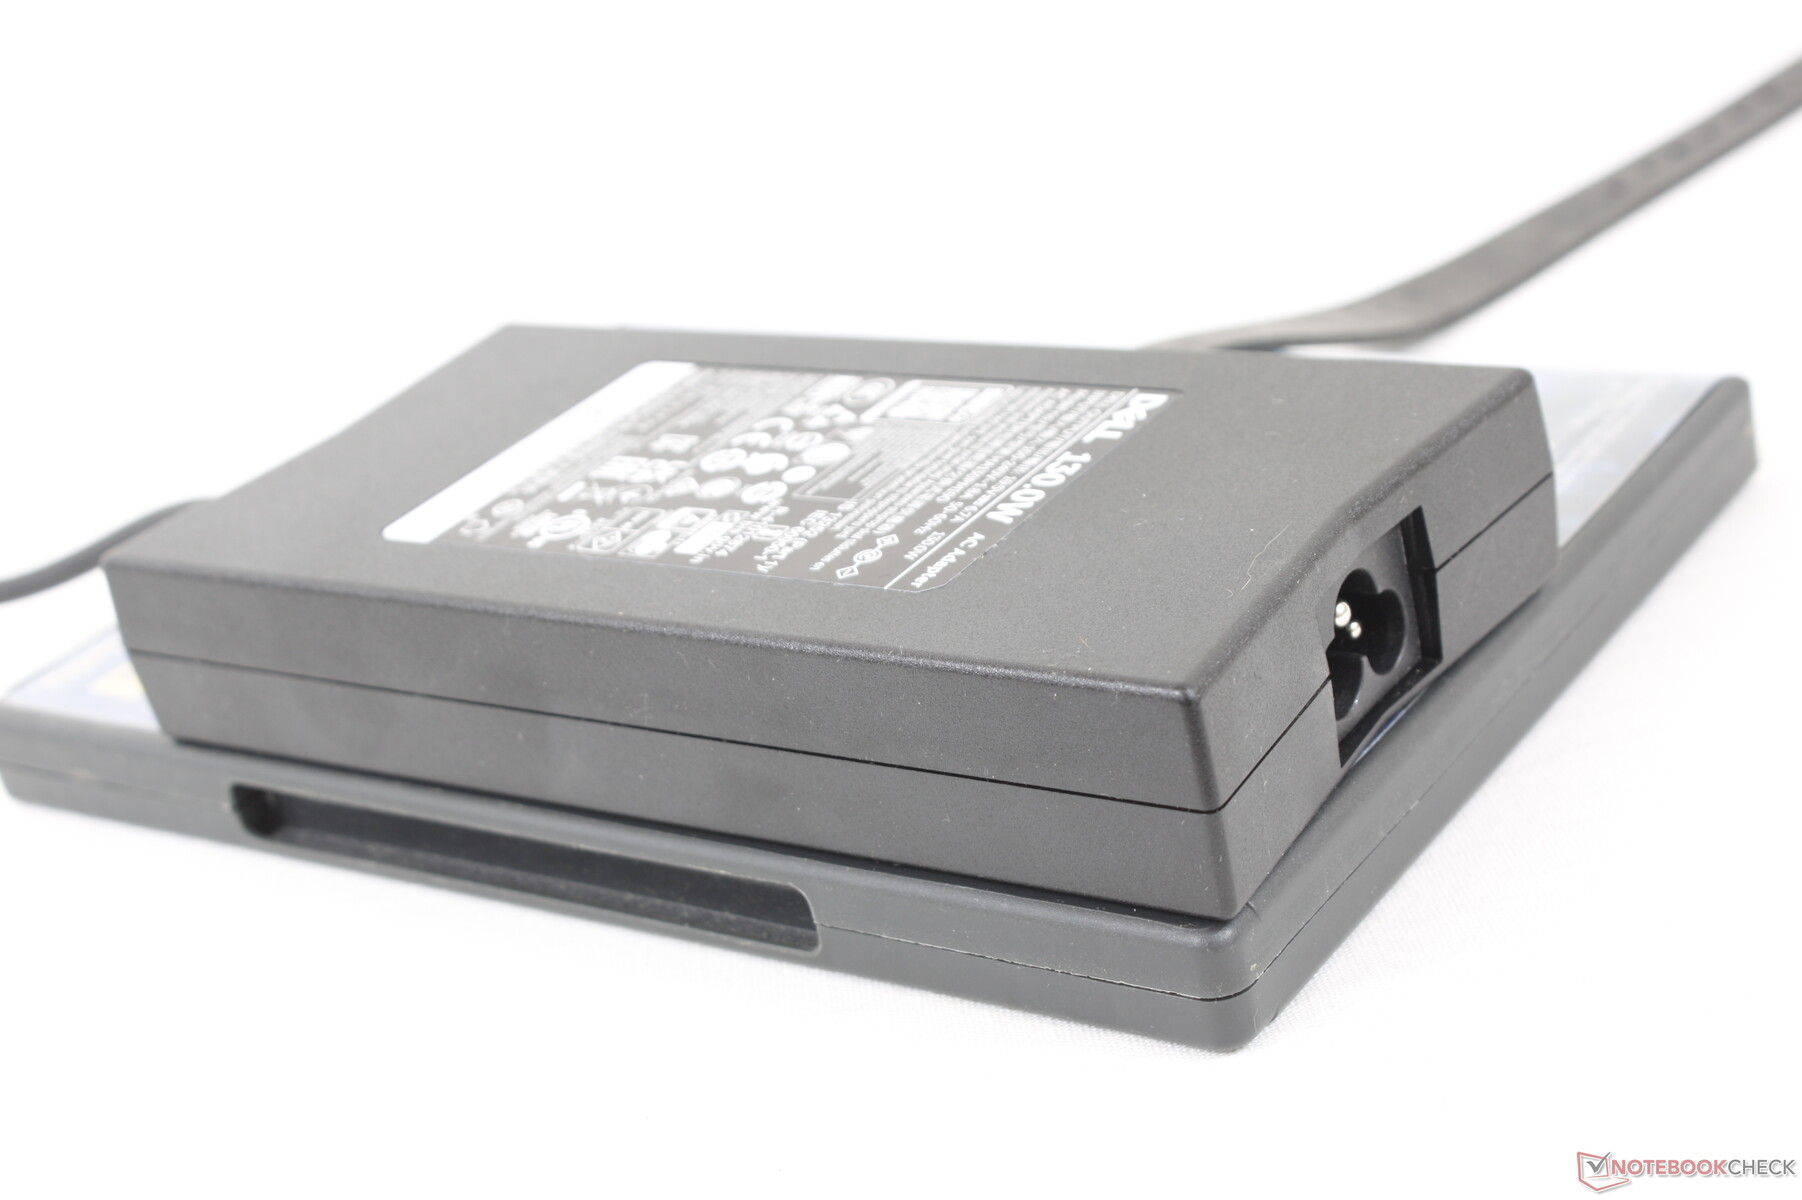
We're able to record a maximum draw of 137 W from the medium-sized (~15.3 x 7.5 x 2.6 cm) 130 W AC adapter when running both Prime95 and FurMark simultaneously. Consumption tends to cycle between 110 W and 137 W as shown by our screenshot below. Expect a slower charge rate if running such taxing loads.
| Off / Standby | |
| Idle | |
| Load |
|
Key:
min: | |
| Dell Inspiron 14 Plus 7420 i7-12700H, GeForce RTX 3050 4GB Laptop GPU, SK Hynix BC711 512GB HFM512GD3GX013N, IPS, 2240x1400, 14" | Asus Vivobook Pro 14 M3401QC-KM007T R5 5600H, GeForce RTX 3050 4GB Laptop GPU, Intel SSD 670p SSDPEKNU512GZ, OLED, 2880x1800, 14" | Dell Inspiron 14 7420 2-in-1 i7-1255U, Iris Xe G7 96EUs, WDC PC SN530 SDBPMPZ-512G, IPS, 1920x1200, 14" | Schenker Vision 14 i7-11370H, GeForce RTX 3050 Ti Laptop GPU, Samsung SSD 980 Pro 1TB MZ-V8P1T0BW, IPS, 2880x1800, 14" | Asus Zenbook 14X UX5400E i7-1165G7, GeForce MX450, SK Hynix HFM001TD3JX013N, OLED, 2880x1800, 14" | MSI Summit E14 A11SCS i7-1185G7, GeForce GTX 1650 Ti Max-Q, Phison 1TB SM2801T24GKBB4S-E162, IPS, 3840x2160, 14" | HP Envy 14-eb0010nr i5-1135G7, GeForce GTX 1650 Ti Max-Q, Samsung SSD PM981a MZVLB256HBHQ, IPS, 1920x1200, 14" | |
|---|---|---|---|---|---|---|---|
| Power Consumption | 22% | 44% | 8% | 24% | -10% | 5% | |
| Idle Minimum * (Watt) | 6.3 | 6.6 -5% | 5.2 17% | 6.7 -6% | 7.2 -14% | 9.9 -57% | 4.2 33% |
| Idle Average * (Watt) | 10.3 | 9.6 7% | 8.2 20% | 12.6 -22% | 10.4 -1% | 17.4 -69% | 18.3 -78% |
| Idle Maximum * (Watt) | 20 | 7.3 63% | 9.9 50% | 15.4 23% | 11 45% | 22.5 -13% | 19.2 4% |
| Load Average * (Watt) | 106.2 | 73 31% | 44.4 58% | 85.7 19% | 61.7 42% | 85.6 19% | 72.9 31% |
| Witcher 3 ultra * (Watt) | 96.1 | 74.4 23% | 35 64% | 83 14% | 53.6 44% | 70.9 26% | 61.5 36% |
| Load Maximum * (Watt) | 136.5 | 119 13% | 62.5 54% | 110.9 19% | 96 30% | 91.1 33% | 127.8 6% |
* ... smaller is better
Power Consumption Witcher 3 / Stresstest
Power Consumption external Monitor
Battery Life
Runtimes are better than expected at over 7 hours of real-world WLAN usage which is very close to what we recorded on the slower Inspiron 14 7420 2-in-1 with no dedicated graphics at all. However, note that our results reflect only the 64 Wh configuration and not the lesser 54 Wh configuration which should have slightly shorter battery life.
Charging from empty to full capacity with the included barrel AC adapter takes about 2 hours. Charging via third-party USB-C AC adapters is supported.
| Dell Inspiron 14 Plus 7420 i7-12700H, GeForce RTX 3050 4GB Laptop GPU, 64 Wh | Asus Vivobook Pro 14 M3401QC-KM007T R5 5600H, GeForce RTX 3050 4GB Laptop GPU, 63 Wh | Dell Inspiron 14 7420 2-in-1 i7-1255U, Iris Xe G7 96EUs, 54 Wh | Schenker Vision 14 i7-11370H, GeForce RTX 3050 Ti Laptop GPU, 53 Wh | Asus Zenbook 14X UX5400E i7-1165G7, GeForce MX450, 63 Wh | MSI Summit E14 A11SCS i7-1185G7, GeForce GTX 1650 Ti Max-Q, 52 Wh | HP Envy 14-eb0010nr i5-1135G7, GeForce GTX 1650 Ti Max-Q, 63.3 Wh | |
|---|---|---|---|---|---|---|---|
| Battery runtime | 47% | 58% | 16% | 65% | -24% | 83% | |
| Reader / Idle (h) | 11.9 | 11.5 -3% | 15.9 34% | 34 186% | 6.6 -45% | 27.7 133% | |
| WiFi v1.3 (h) | 7.2 | 9.5 32% | 7.6 6% | 5.5 -24% | 5.4 -25% | 4.5 -37% | 10.8 50% |
| Load (h) | 0.9 | 1.9 111% | 2.1 133% | 1.4 56% | 1.2 33% | 1 11% | 1.5 67% |
| H.264 (h) | 6.8 |
Pros
Cons
Verdict — Plus-size Performance, Plus-size Weight
If you're looking to maximize CPU and GPU performance on your next 14-inch laptop, then consider the pricier Razer Blade 14 or Asus Zephyrus G14. If you're looking for a thin-and-light 14-inch Ultrabook, then the Asus Zenbook 14 or LG Gram 14 may be better options. For the best of both worlds, however, the Dell Inspiron 14 Plus 7420 rides a fine line between extreme performance and portability while keeping prices at reasonable levels. Frequent travelers who rely on performance beyond what the Core U-series and integrated graphics series can offer will find the Dell to be a solid solution.
Packing this much power into a 14-inch chassis comes with the usual drawbacks: warmer temperatures, louder fan noise, heavier weight, and higher power consumption than most other laptops in the 14-inch category. Of these four disadvantages, we believe weight could be improved upon the most as the competing Asus Vivobook Pro 14 ships with AMD H-series CPUs and the same GeForce RTX 3050 GPU while weighing a couple hundred grams lighter. The fans are at least excellent at staying quiet during lower processing loads and so they are only loud when running demanding applications.
The Inspiron 14 Plus 7420 may be heavy, but it'll get the job done at faster speeds than your typical Ultrabook.
Other drawbacks include the spongy clickpad and flexible lid. For such a heavy 14-inch laptop, a more rigid lid would have been appreciated. The performance advantage over most 14-inch laptops in this price range is otherwise the main highlight of the system.
Price and Availability
The Inspiron 14 Plus 7420 clamshell is now shipping on Amazon and Newegg For $1300 and $1400 USD, respectively. However, configurations are currently limited to integrated graphics only. We recommend purchasing directly from Dell if you want the GeForce RTX 3050 SKU.
Dell Inspiron 14 Plus 7420
- 08/30/2022 v7 (old)
Allen Ngo
Price comparison
