Asus ZenBook 14X OLED AMD laptop in review: Lots of color, lots of battery life, low price

Asus bets on OLED: Many laptop series are equipped with an OLED display by default. It's not only the high-end Zenbooks that are benefiting from more color and contrast, but also Vivobooks, such as the Vivobook Pro 14 M3401QC.
This brings OLED and 3K/4K into lower price regions, and more manufacturers will follow suit. Mid-range customers will start to seriously consider buying OLED when the difference to devices without OLED only amounts to 200 to 300 Euros (~$204 to ~$305).
That said, Asus doesn't present mid-range hardware and workmanship with the Zenbook 14X. The chassis is exceptionally solid and of high quality. The input devices are first class, and performance with the Ryzen 7 ranks in the top subnotebook league - thanks to the 45-watt processor.
The competition also has OLED, such as the Dell XPS 13 9310 OLED or the Lenovo Yoga Slim 7 Pro 14, which also has a GeForce MX450. In-house, there's the almost identically built Zenbook 14X UX5400EA, which has an MX450 on board in its top configuration.
Since there aren't that many OLED 14-inchers, we'll also consider IPS opponents. The HP Envy 14-eb0010nr with an Intel processor and a GeForce GTX 1650 Ti Max-Q is probably the most interesting for gaming enthusiasts. The Vivobook Pro 14 M3401QC comes with a nominally more powerful RTX 3050 and OLED, but its case isn't as slim and high quality as that of the Zenbook 14X.
Other Asus Zenbooks that we've reviewed:
Asus Zenbook 14X OLED UX5400EA with Tiger Lake MX450
Asus ZenBook 14 UX435EG Tiger Lake MX450 IPS
Asus ZenBook 13 OLED UX325EA Tiger Lake MX450
Asus Zenbook S13 OLED Ryzen 6800U
Possible contenders in comparison
Rating | Date | Model | Weight | Height | Size | Resolution | Price |
|---|---|---|---|---|---|---|---|
| 87.3 % v7 (old) | 07 / 2022 | Asus ZenBook 14X UM5401QA-KN162 R7 5800H, Vega 8 | 1.4 kg | 15.9 mm | 14.00" | 2880x1800 | |
| 88.3 % v7 (old) | 05 / 2021 | Dell XPS 13 9310 OLED i7-1185G7, Iris Xe G7 96EUs | 1.2 kg | 14.8 mm | 13.40" | 3456x2160 | |
| 87.7 % v7 (old) | 04 / 2022 | Asus ZenBook 14X OLED UX5400EA-L7154W i7-1165G7, GeForce MX450 | 1.4 kg | 16.9 mm | 14.00" | 2880x1800 | |
| 86.5 % v7 (old) | 02 / 2021 | HP Envy 14-eb0010nr i5-1135G7, GeForce GTX 1650 Ti Max-Q | 1.6 kg | 17.9 mm | 14.00" | 1920x1200 | |
| 86.3 % v7 (old) | 07 / 2022 | Asus Vivobook Pro 14 M3401QC-KM007T R5 5600H, GeForce RTX 3050 4GB Laptop GPU | 1.5 kg | 19 mm | 14.00" | 2880x1800 | |
| 84.8 % v7 (old) | 03 / 2022 | Lenovo Yoga Slim 7 Pro 14 OLED Ryzen 9 R9 5900HS, GeForce MX450 | 1.4 kg | 17.9 mm | 14.00" | 2880x1800 | |
| 82.2 % v7 (old) | 07 / 2021 | MSI Modern 14 B11SB-085 i7-1165G7, GeForce MX450 | 1.3 kg | 16.9 mm | 14.00" | 1920x1080 |
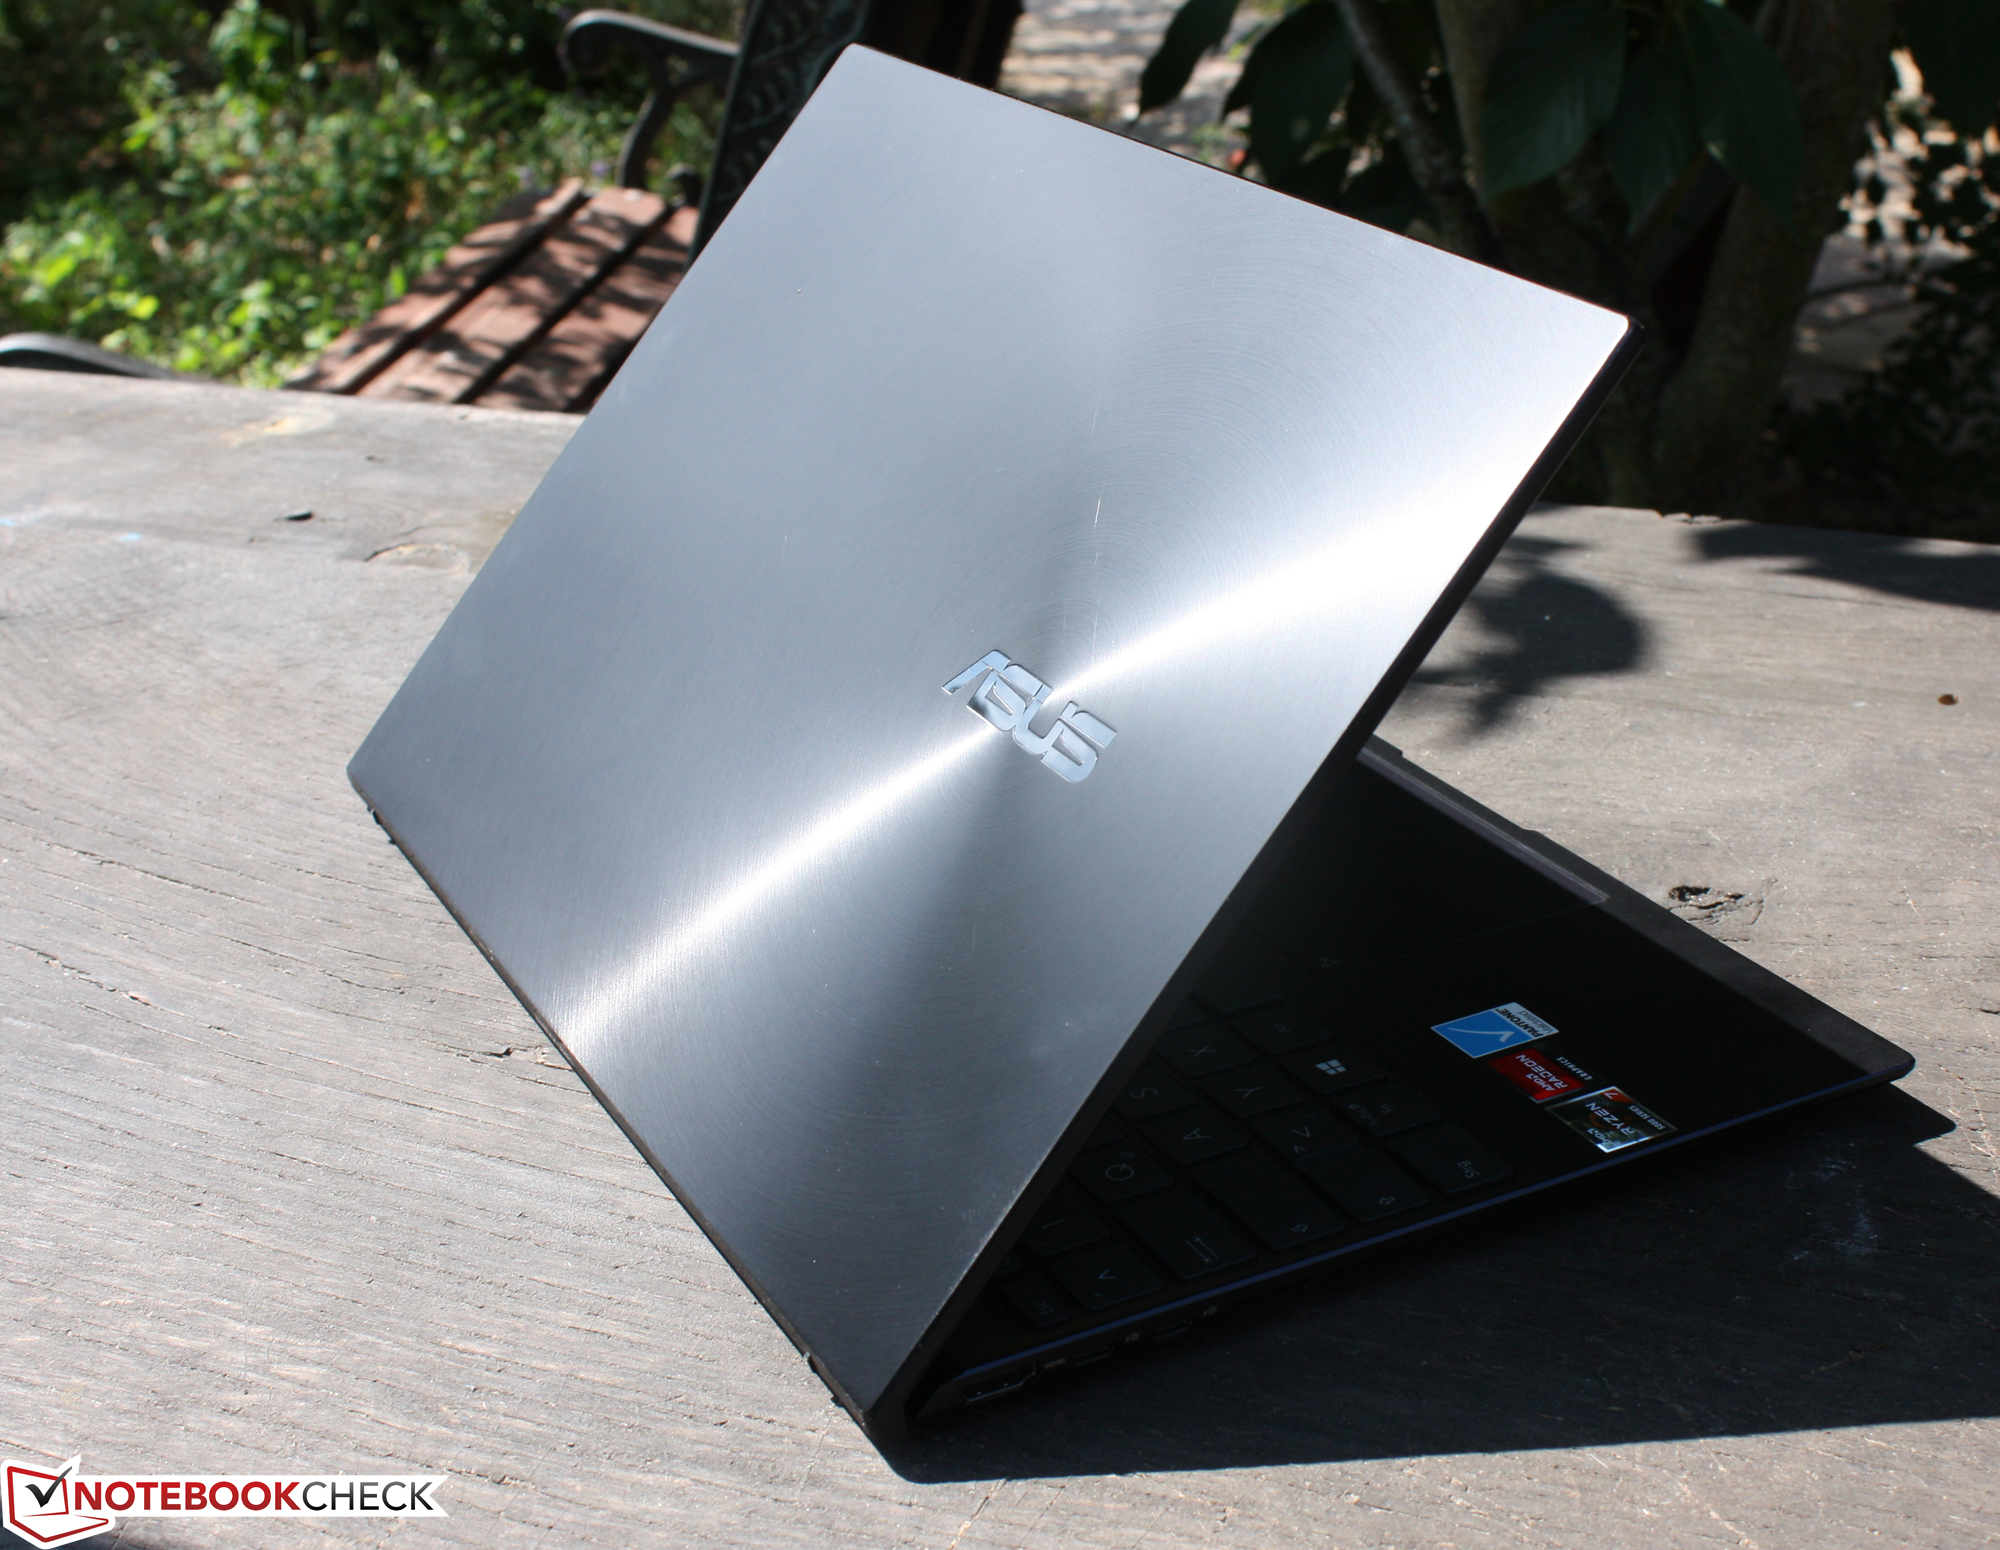
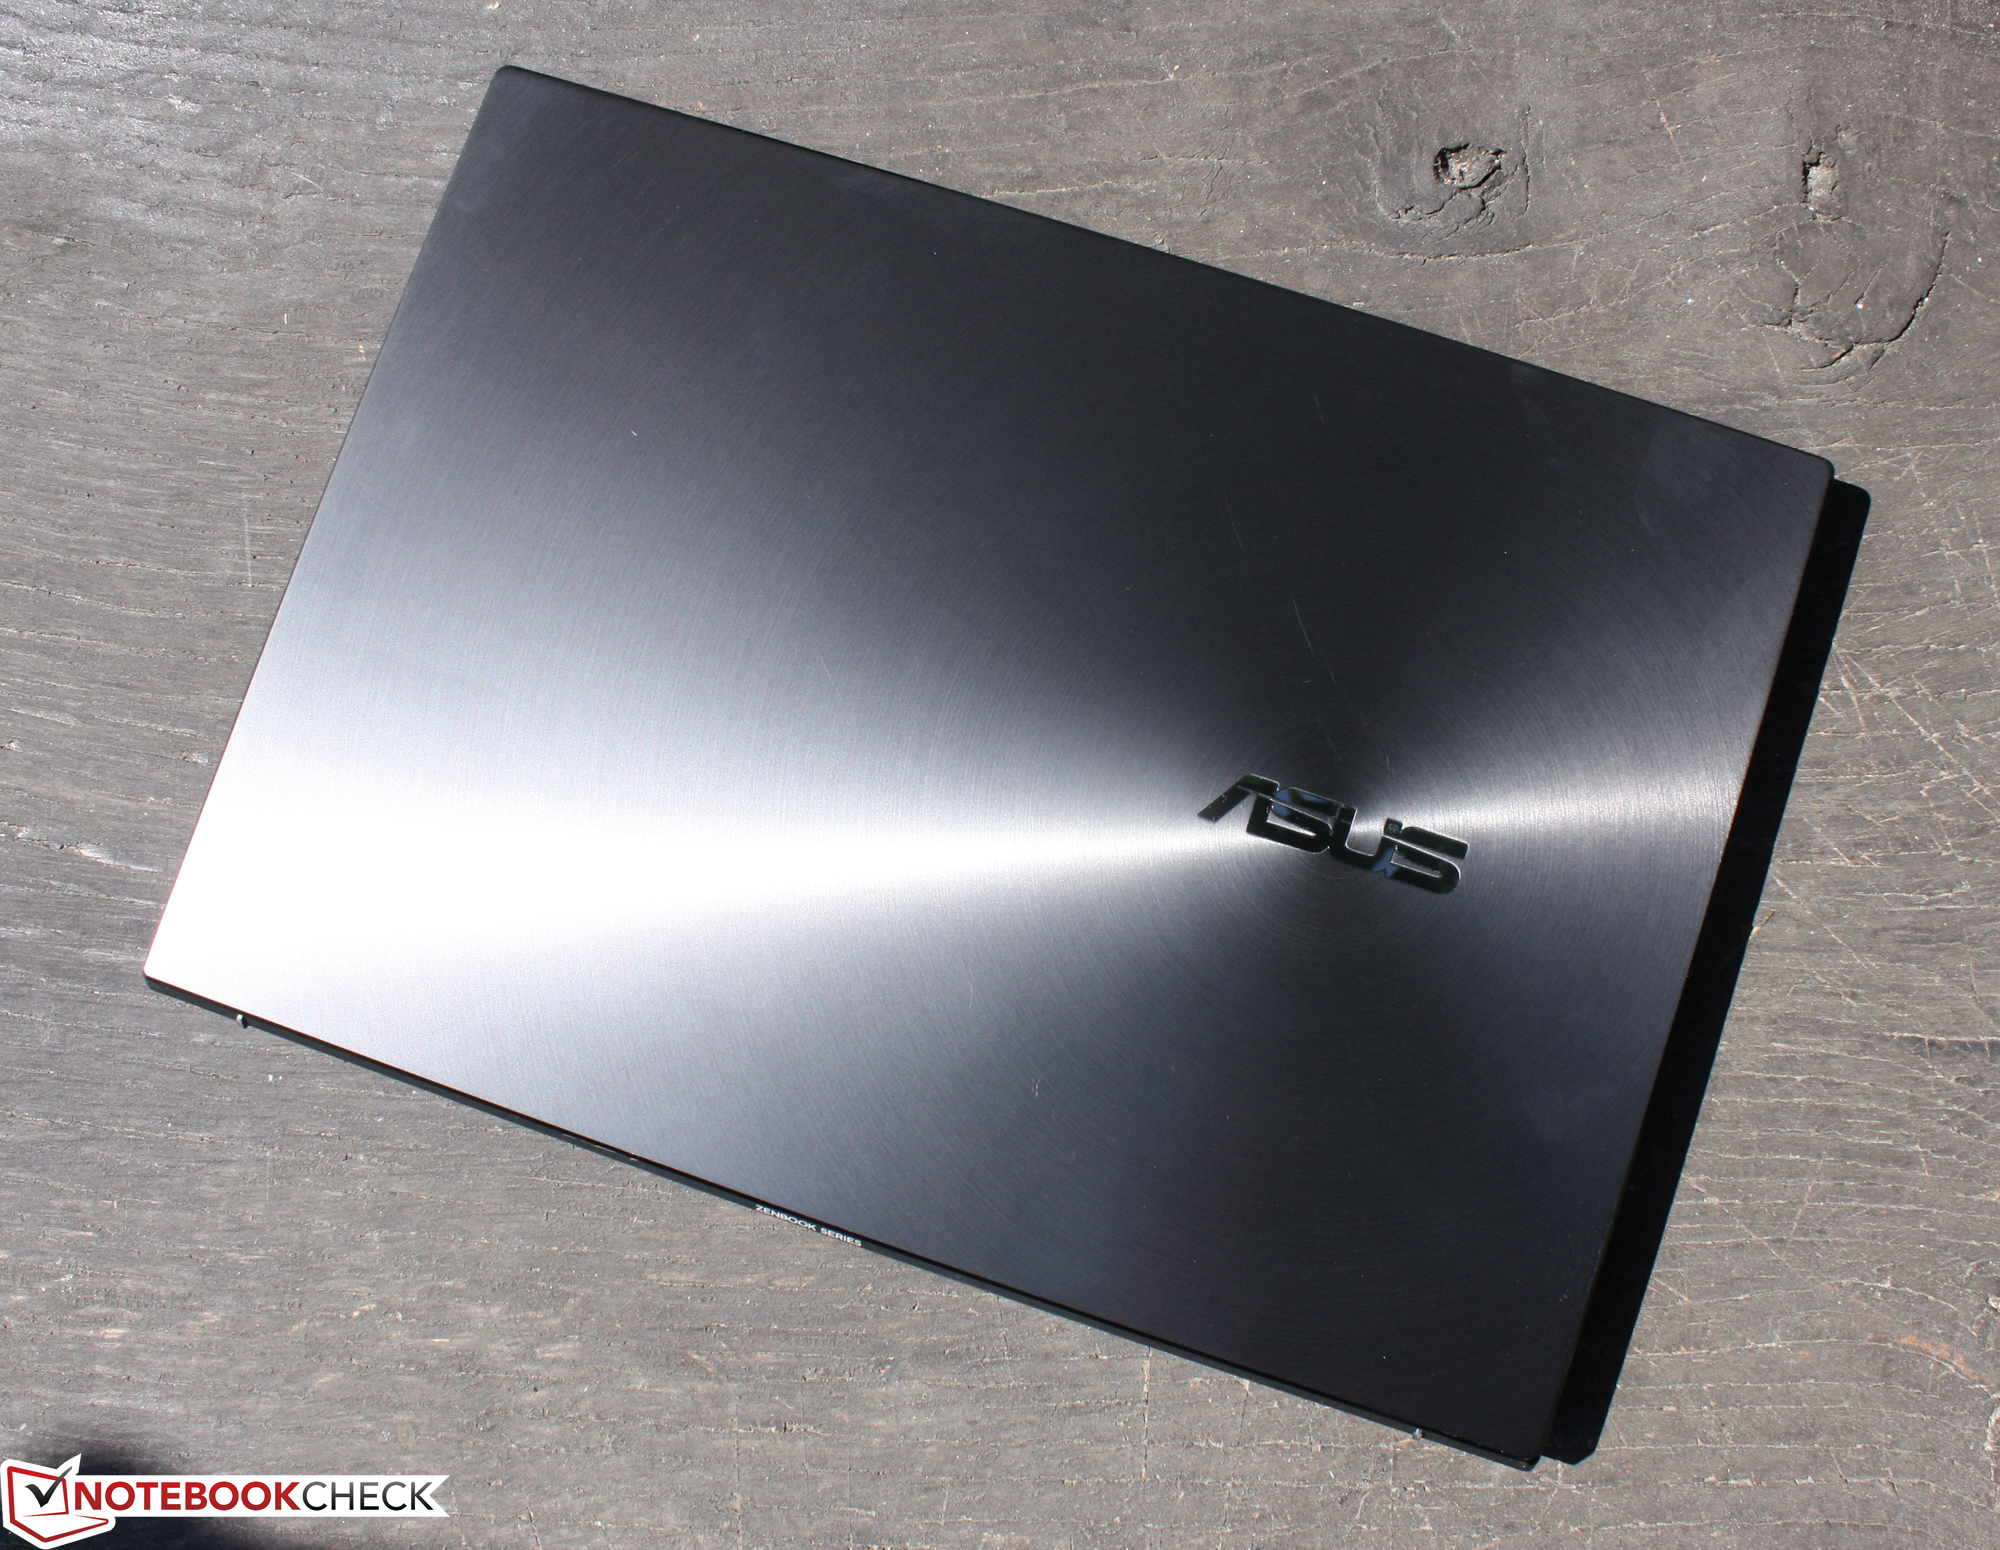
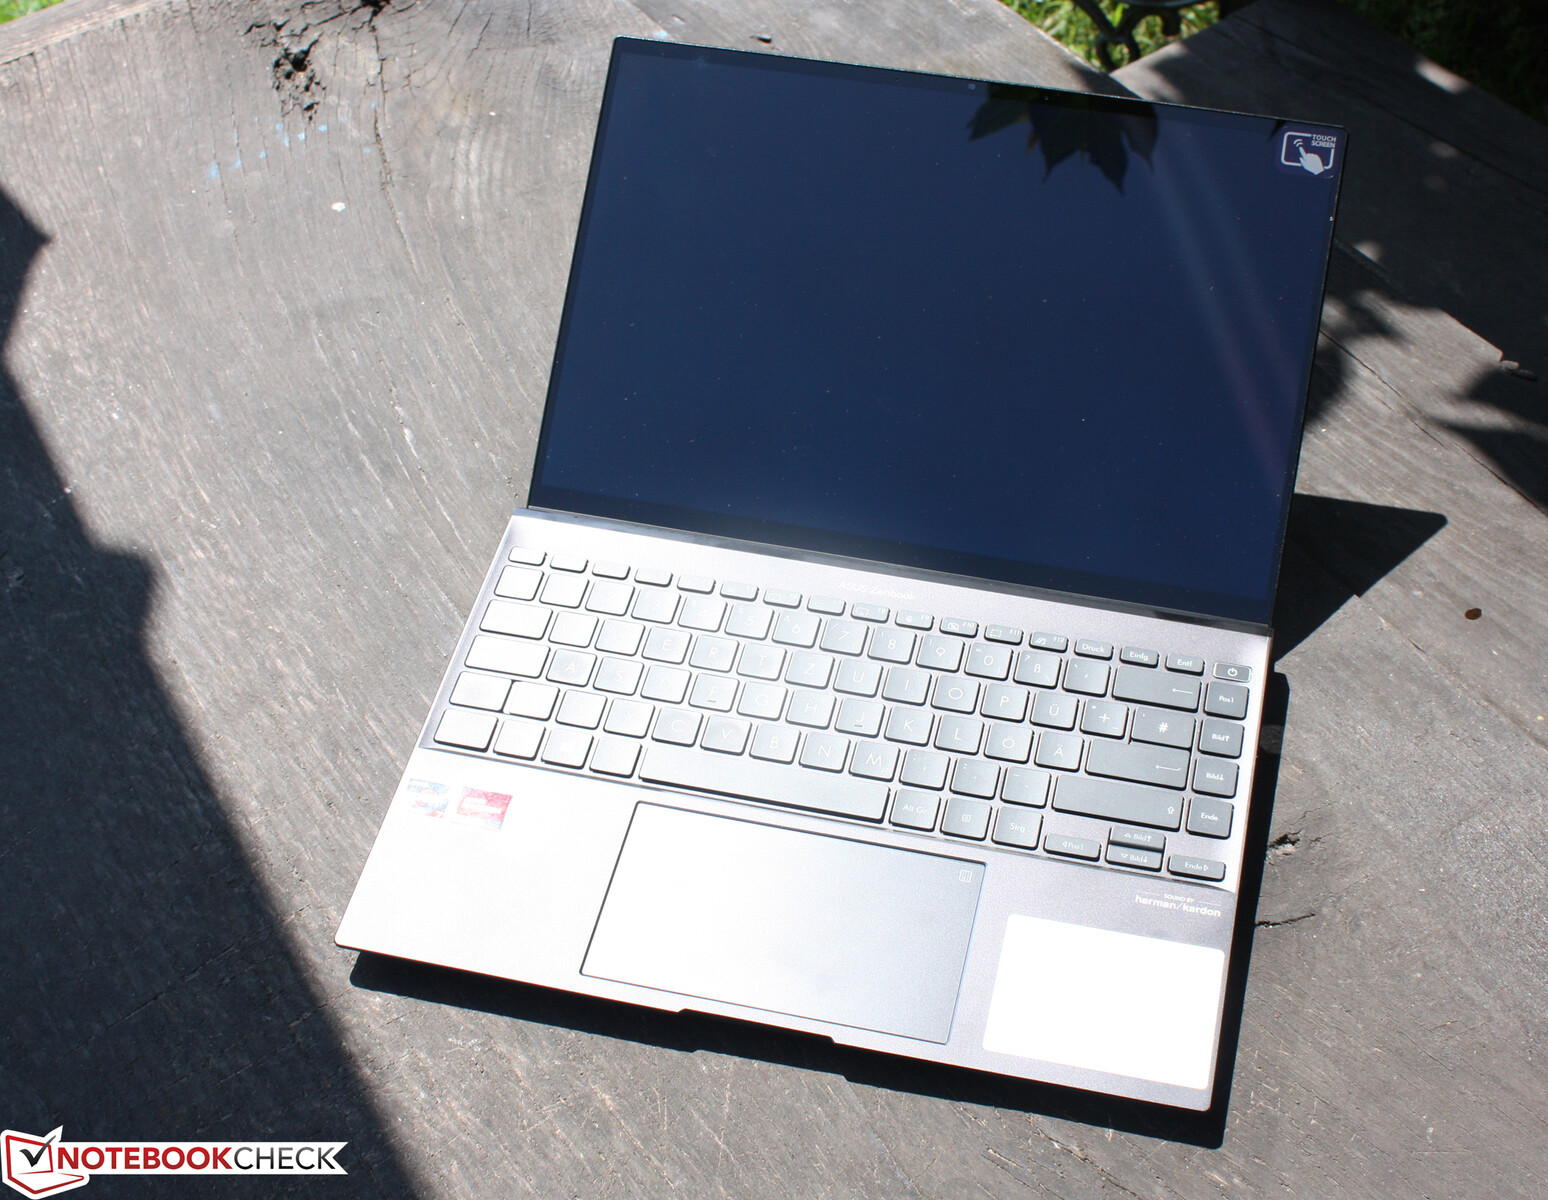
Case - High-quality Asus PC
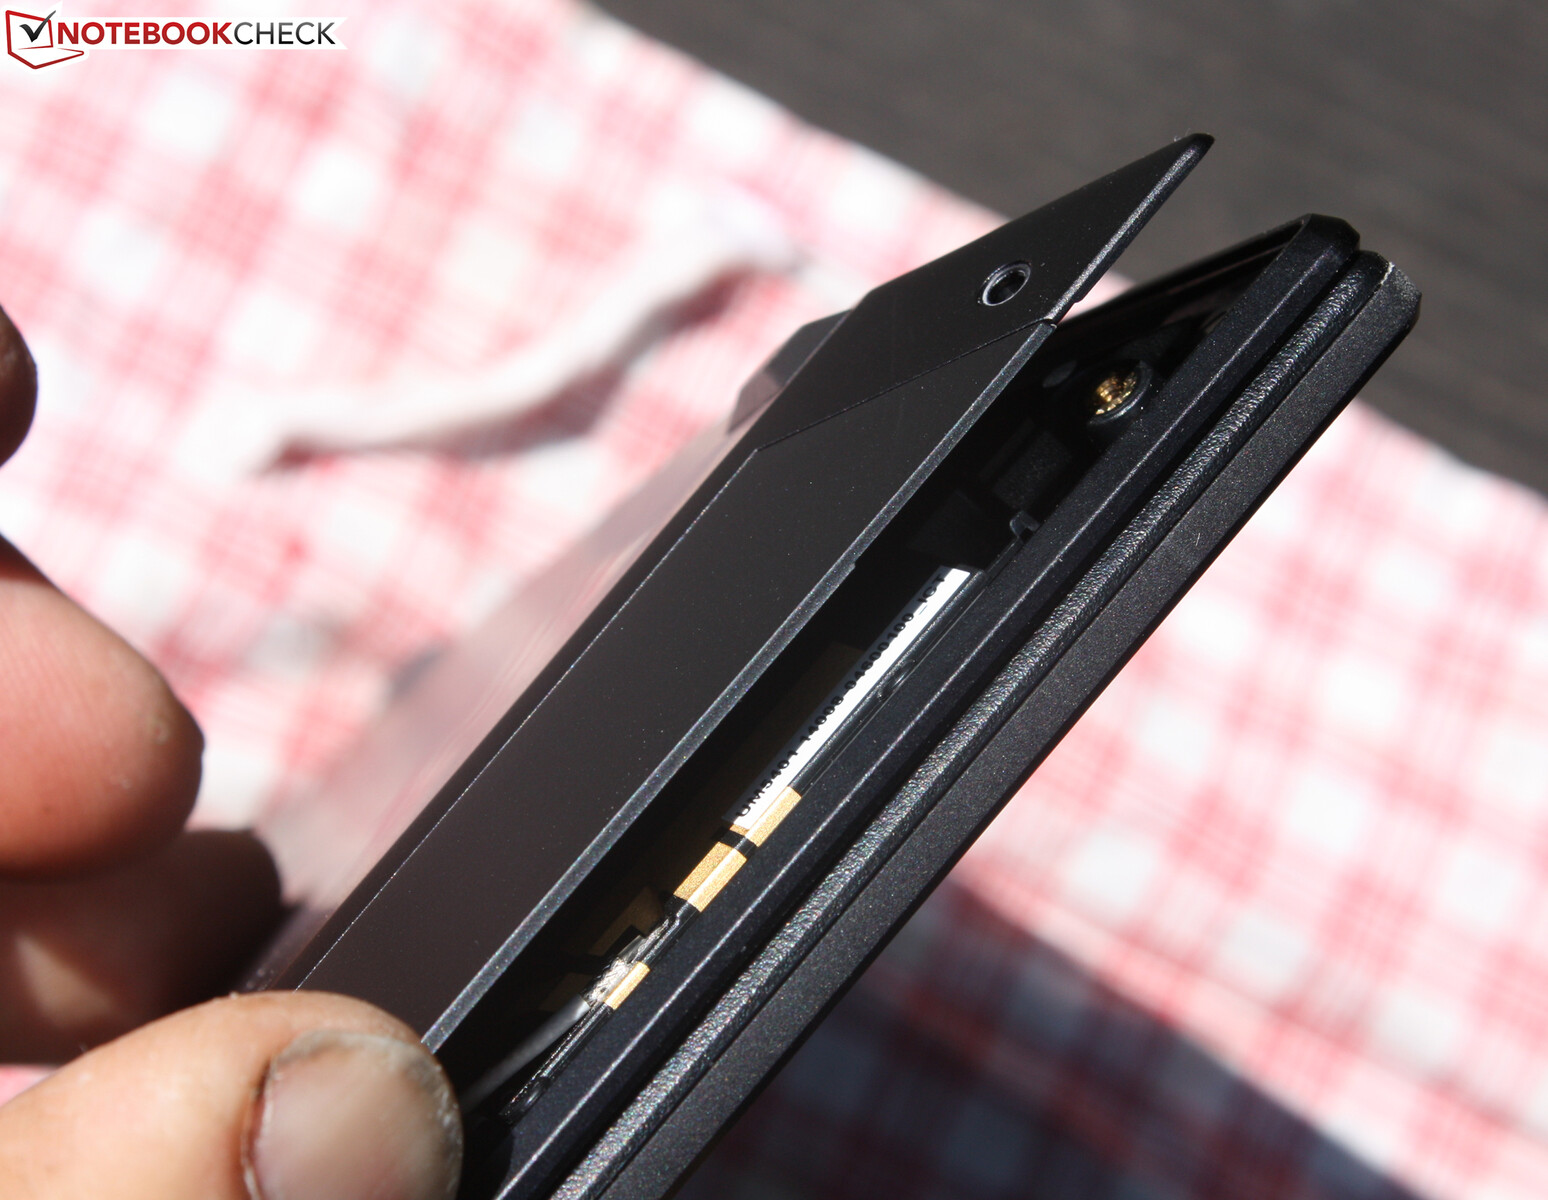
The case is identical to the 14X Intel version, and there aren't even any differences in terms of ports. Asus refrained from making the case as light as possible, but this resulted in a chassis that is resistant to torsion. The lid can't be warped with regular force. The lid's aluminum back forms a seemingly indestructible unit with the built-in display panel. Pressure applied to the back or twisting attempts don't have any effect on the screen.
The solid quality continues with the hinges: The closed position is held magnetically to the base; the small gap above it can be pulled open with one finger. After that, the hinges stay tightly in place, and nothing wobbles or shifts when carrying or lifting the device.
The same applies to the base unit, which is completely made of aluminum, including the removable bottom cover. The keyboard doesn't yield at any point, and the base itself is completely rigid.

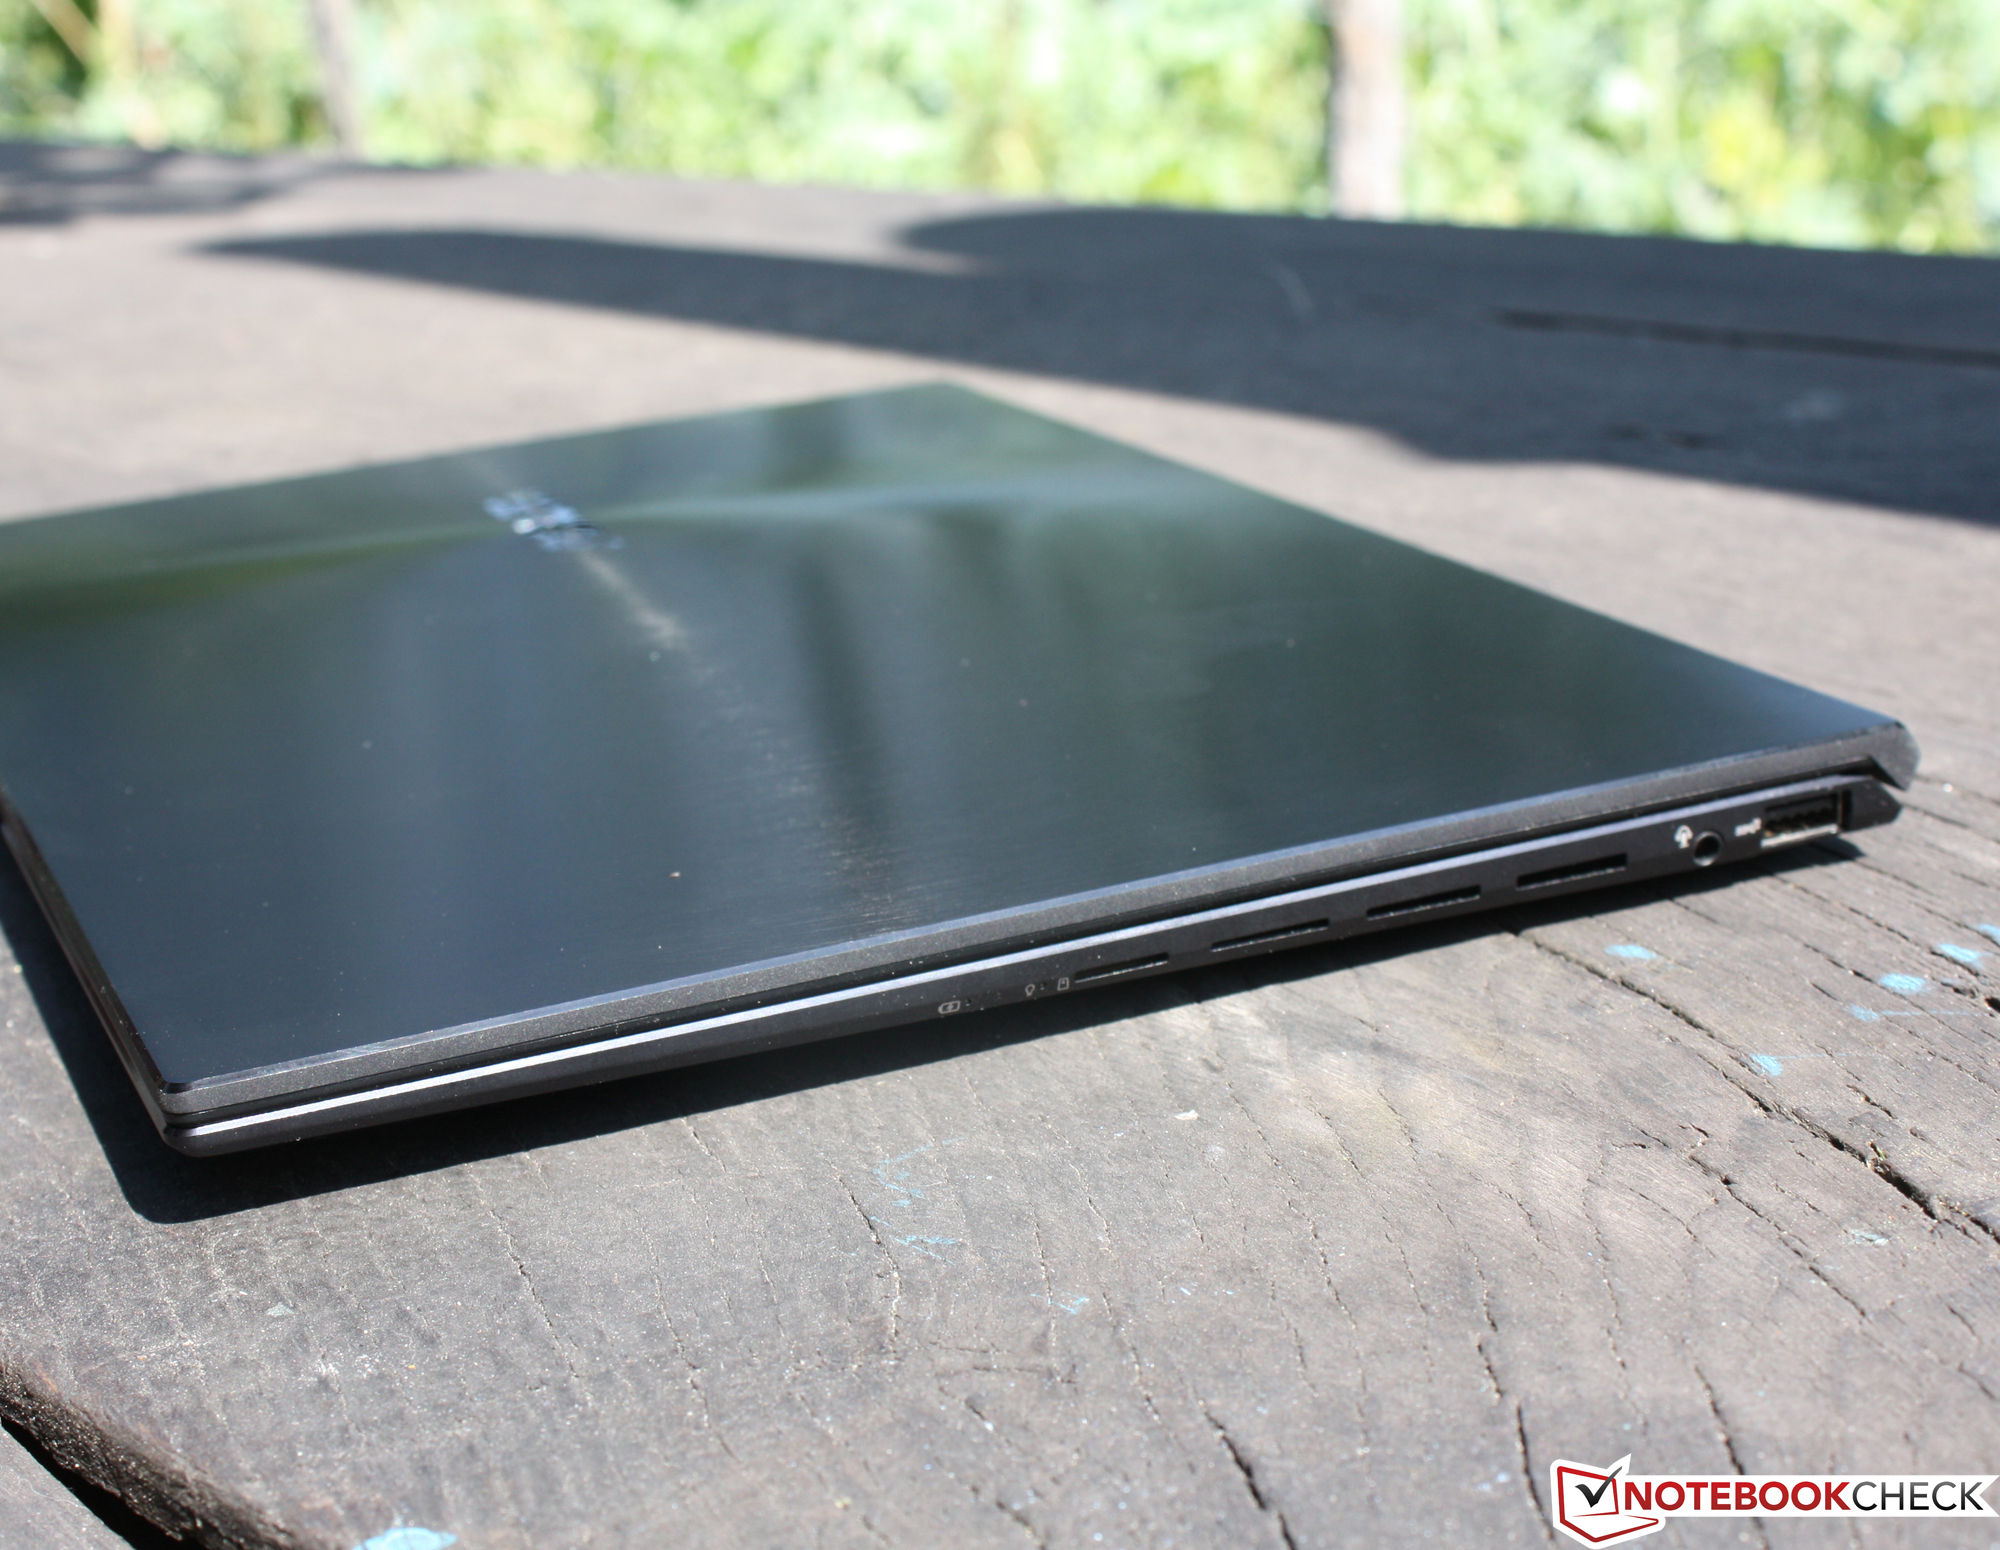
With its 1.406 kg, the Zenbook is one of the heavier subnotebooks. In the comparison field, it's only surpassed by the HP Envy 14-eb0010nr with its 1.6 kg. There's a difference of 100 grams compared to the average of the lighter 14- and 13-inchers. In return, however, you get a sturdier base. The thinnest model in the comparison is the Dell XPS 13 9310 OLED at 14.8 mm and only 1.2 kg. The Zenbook 14X is averagely thin at 17 mm, but Asus isn't setting new standards with it.
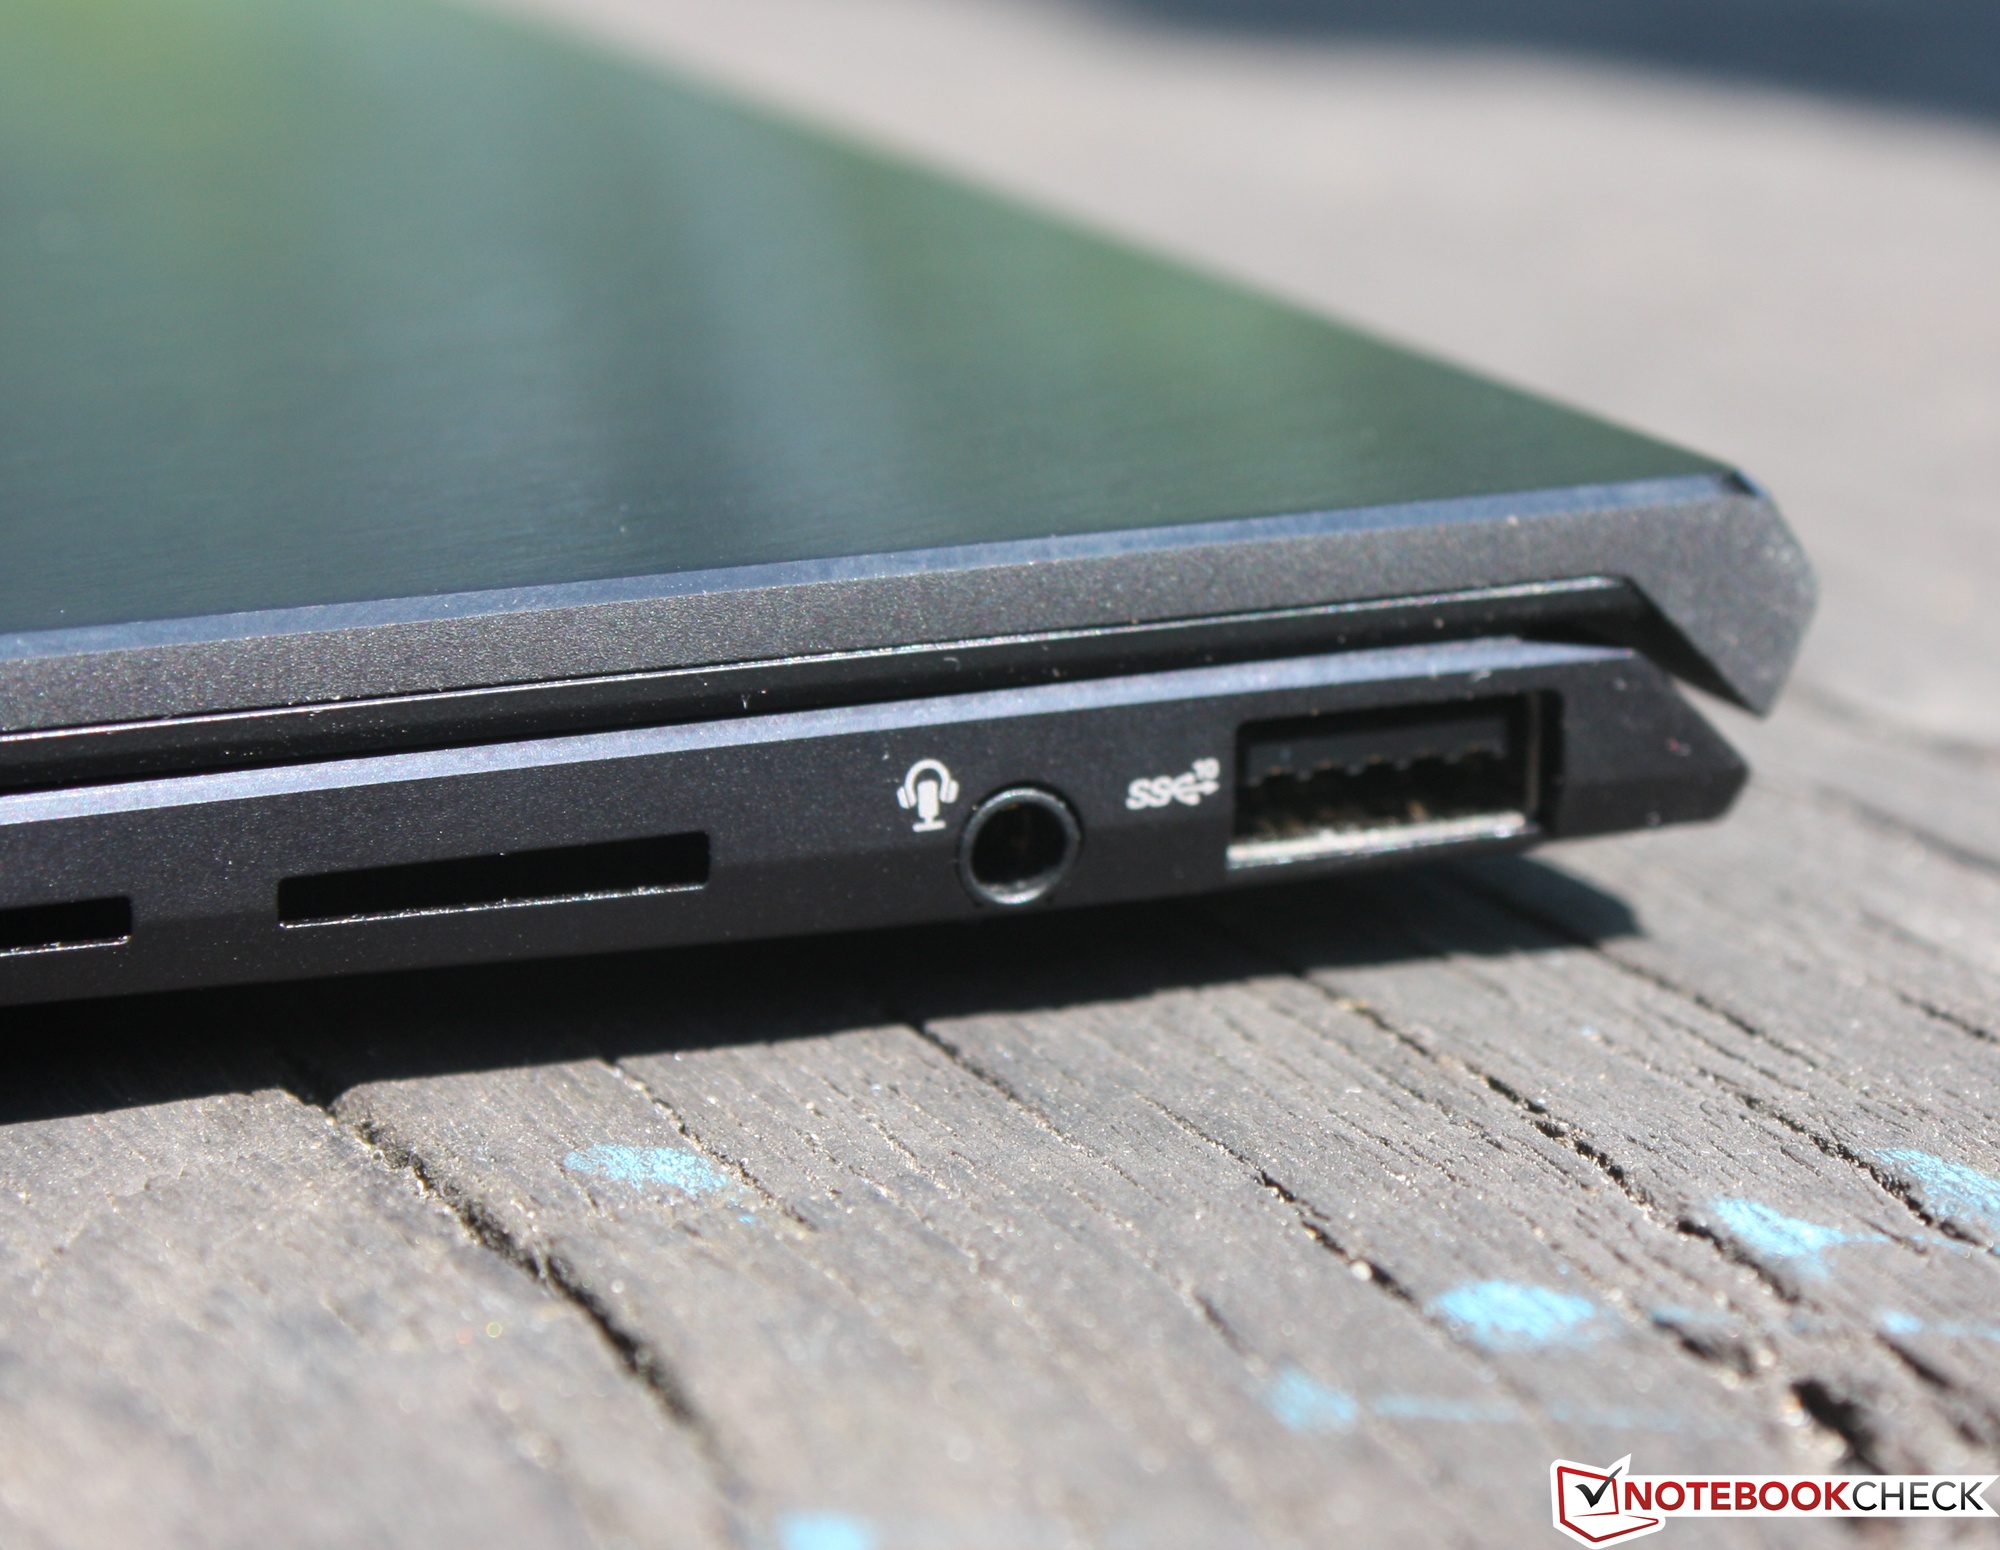
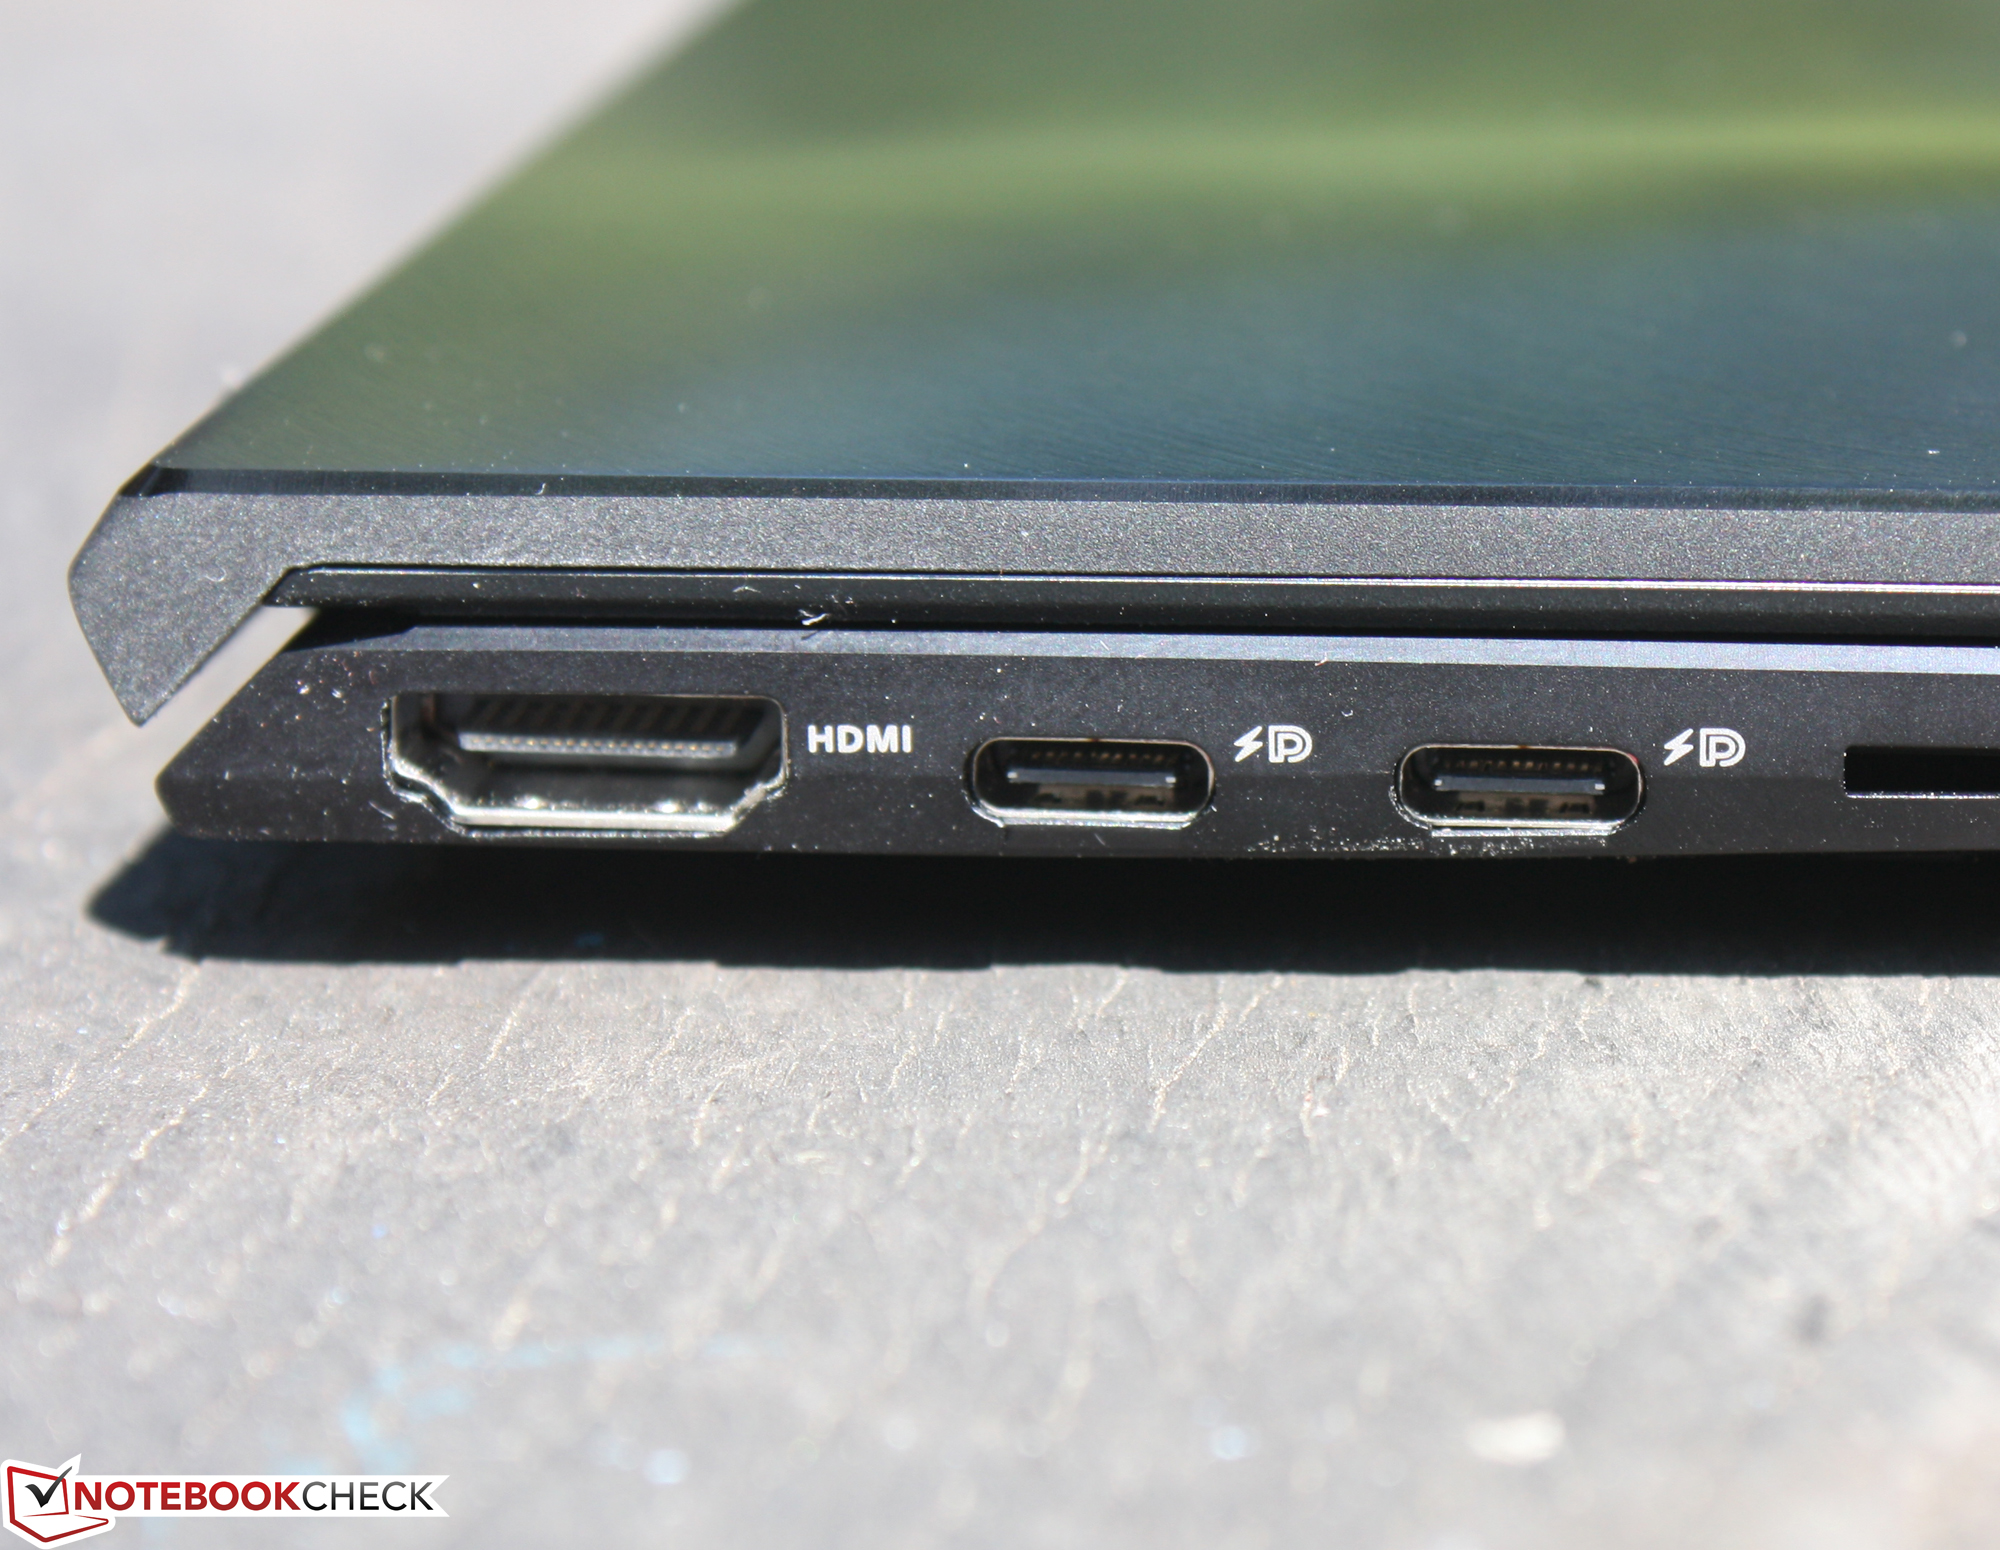
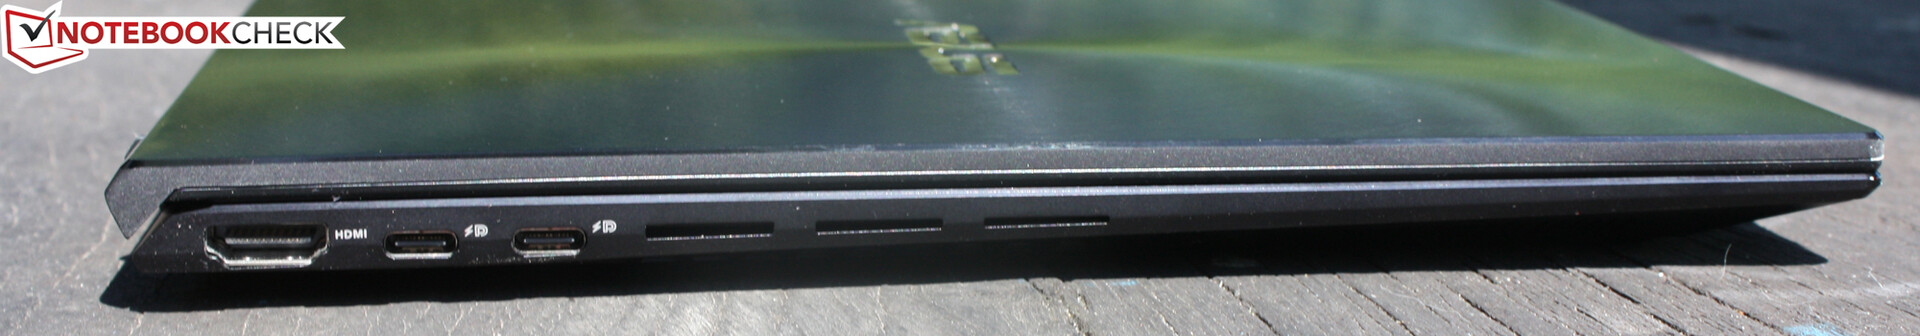
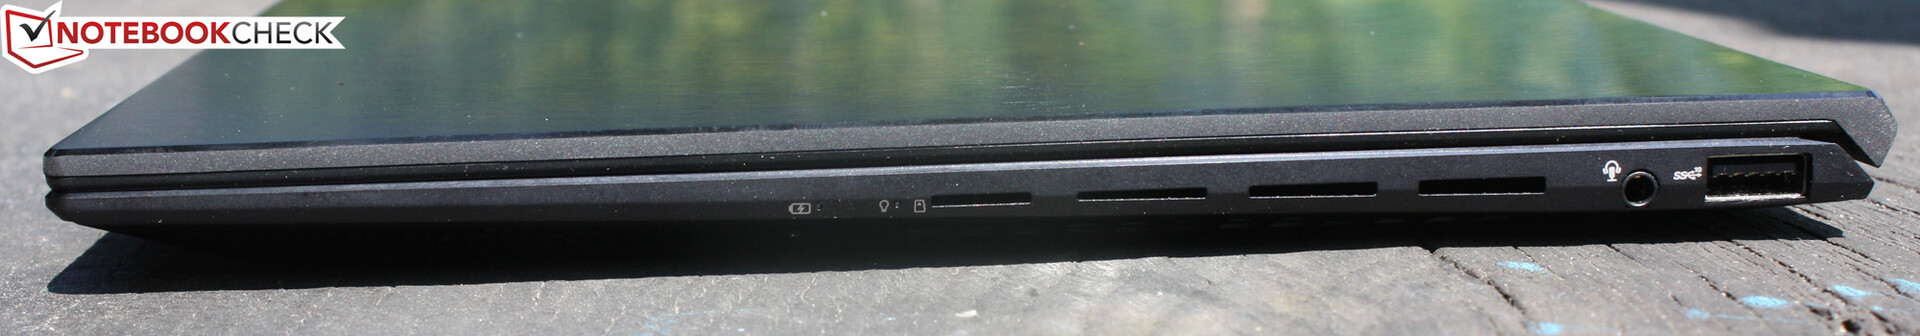
Connectivity - No Thunderbolt
The AMD version doesn't have Thunderbolt ports, but externally, the ports look the same. The two Type-C ports support DisplayPort, which means that three displays can theoretically be connected, since there's also HDMI. In practice, however, this won't be the case because one Type-C will be blocked by the power adapter. There's no longer a hollow connector for a power adapter.
SD card reader
The microSD reader performs averagely, but not as well as in the Dell XPS. We use the AV PRO microSD 128 GB V60 for testing.
| SD Card Reader | |
| average JPG Copy Test (av. of 3 runs) | |
| Dell XPS 13 9310 OLED (AV PRO microSD 128 GB V60) | |
| Asus ZenBook 14X UM5401QA-KN162 (AV Pro SD microSD 128 GB V60) | |
| Average of class Subnotebook (23.7 - 188, n=9, last 2 years) | |
| HP Envy 14-eb0010nr (Toshiba Exceria Pro M501 microSDXC 32GB) | |
| Asus ZenBook 14X OLED UX5400EA-L7154W | |
| Asus Vivobook Pro 14 M3401QC-KM007T (AV Pro SD microSD 128 GB V60) | |
| MSI Modern 14 B11SB-085 (Toshiba Exceria Pro M501 microSDXC 64GB) | |
| maximum AS SSD Seq Read Test (1GB) | |
| Dell XPS 13 9310 OLED (AV PRO microSD 128 GB V60) | |
| Average of class Subnotebook (24.9 - 195, n=8, last 2 years) | |
| Asus ZenBook 14X UM5401QA-KN162 (AV Pro SD microSD 128 GB V60) | |
| HP Envy 14-eb0010nr (Toshiba Exceria Pro M501 microSDXC 32GB) | |
| Asus ZenBook 14X OLED UX5400EA-L7154W | |
| Asus Vivobook Pro 14 M3401QC-KM007T (AV Pro SD microSD 128 GB V60) | |
| MSI Modern 14 B11SB-085 (Toshiba Exceria Pro M501 microSDXC 64GB) | |
Communication
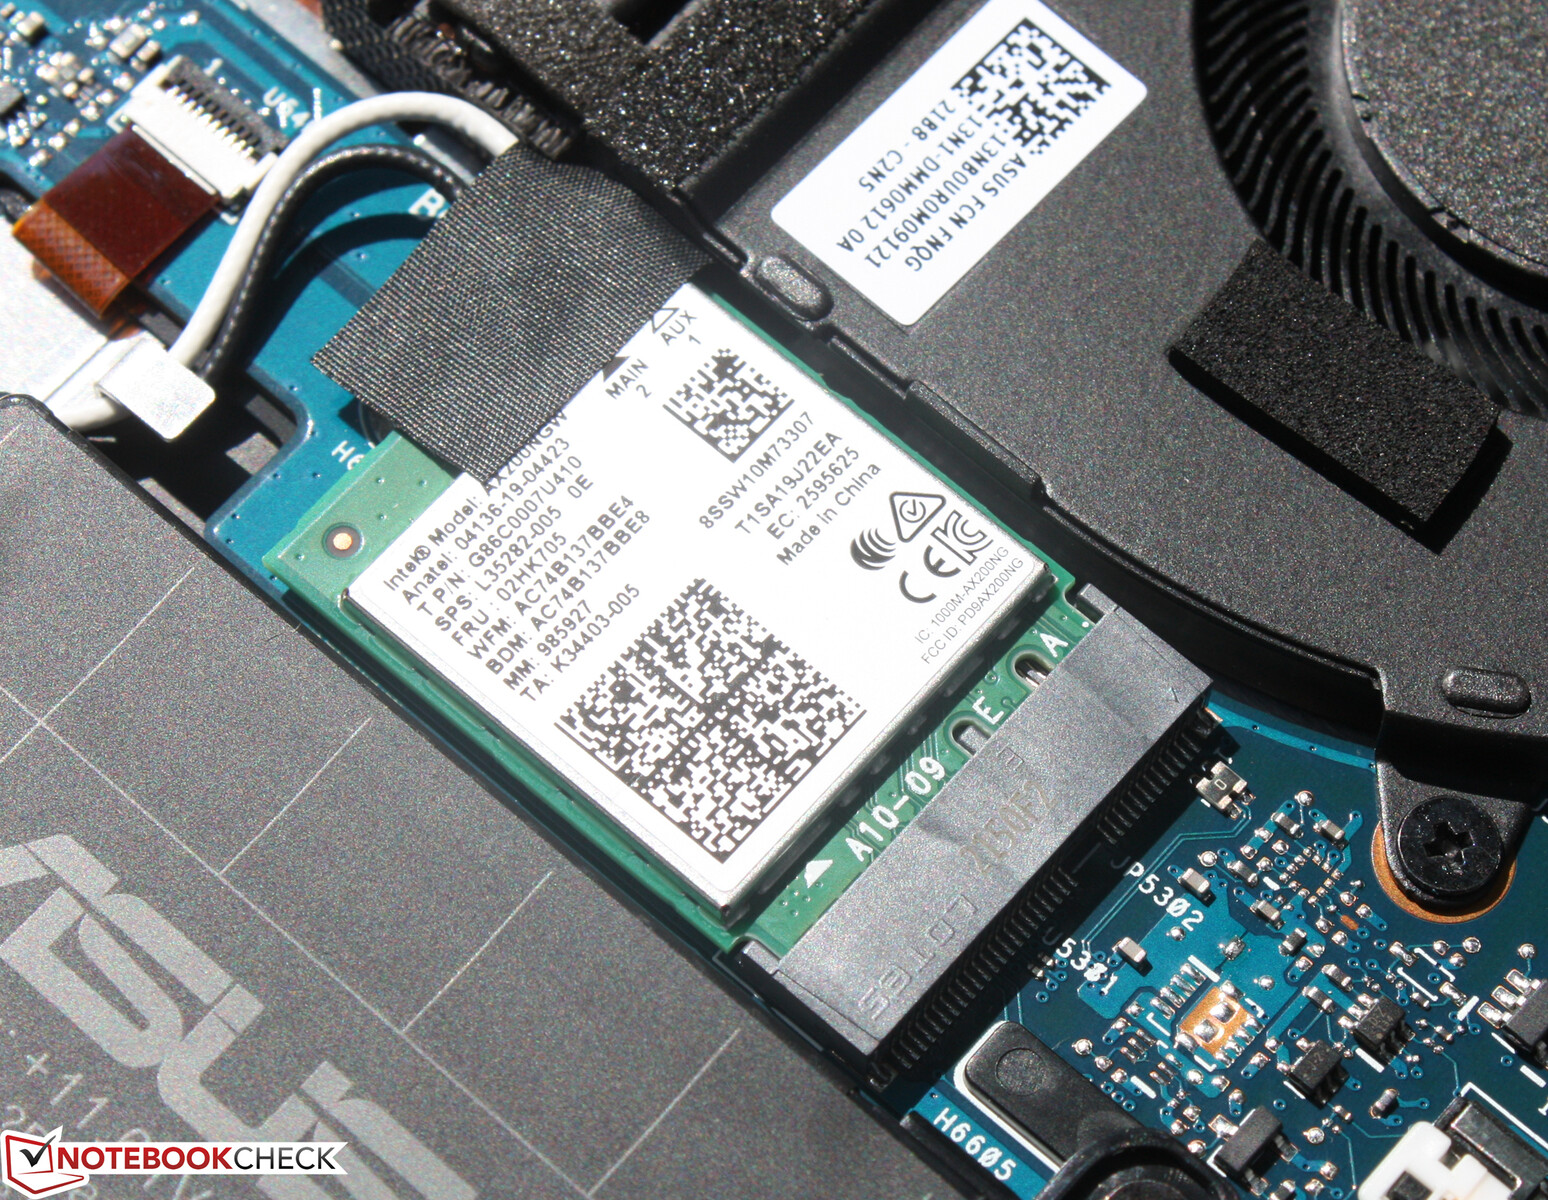
The Intel AX200 Wi-Fi module is plugged in, and it could even be exchanged. We didn't experience any connection problems between the brand-new Asus GT-AXE11000 Wi-Fi 6 router and our Zenbook. Speeds were above average for this chip. The Intel version has an AX201 on board, but it's soldered.
Webcam
The E-Shutter webcam creates low-resolution and noisy 720p images, even under the best lighting conditions. E-shutter means that the camera is switched off electrically when the corresponding F key is pressed. Unfortunately, you can't detect this visually at the camera lens like with mechanical shutters, which show a red "curtain". However, quality isn't any better among the competition, as the Dell XPS 13 shows.


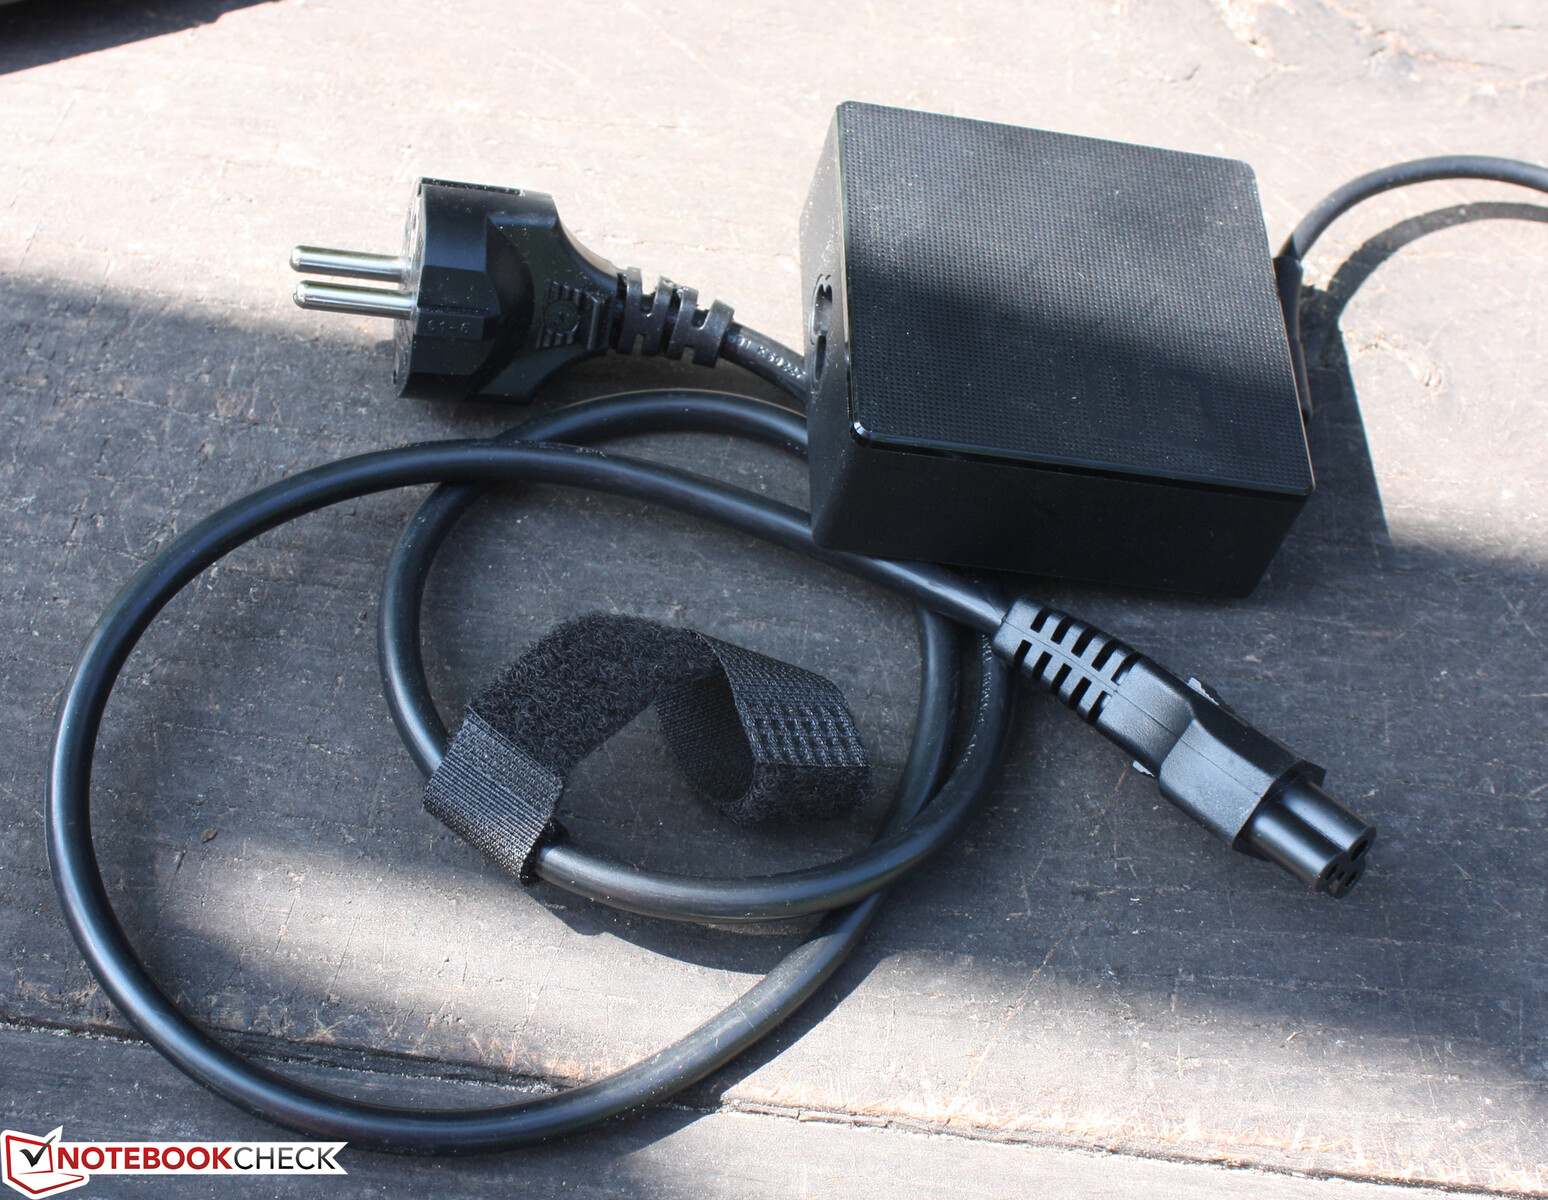
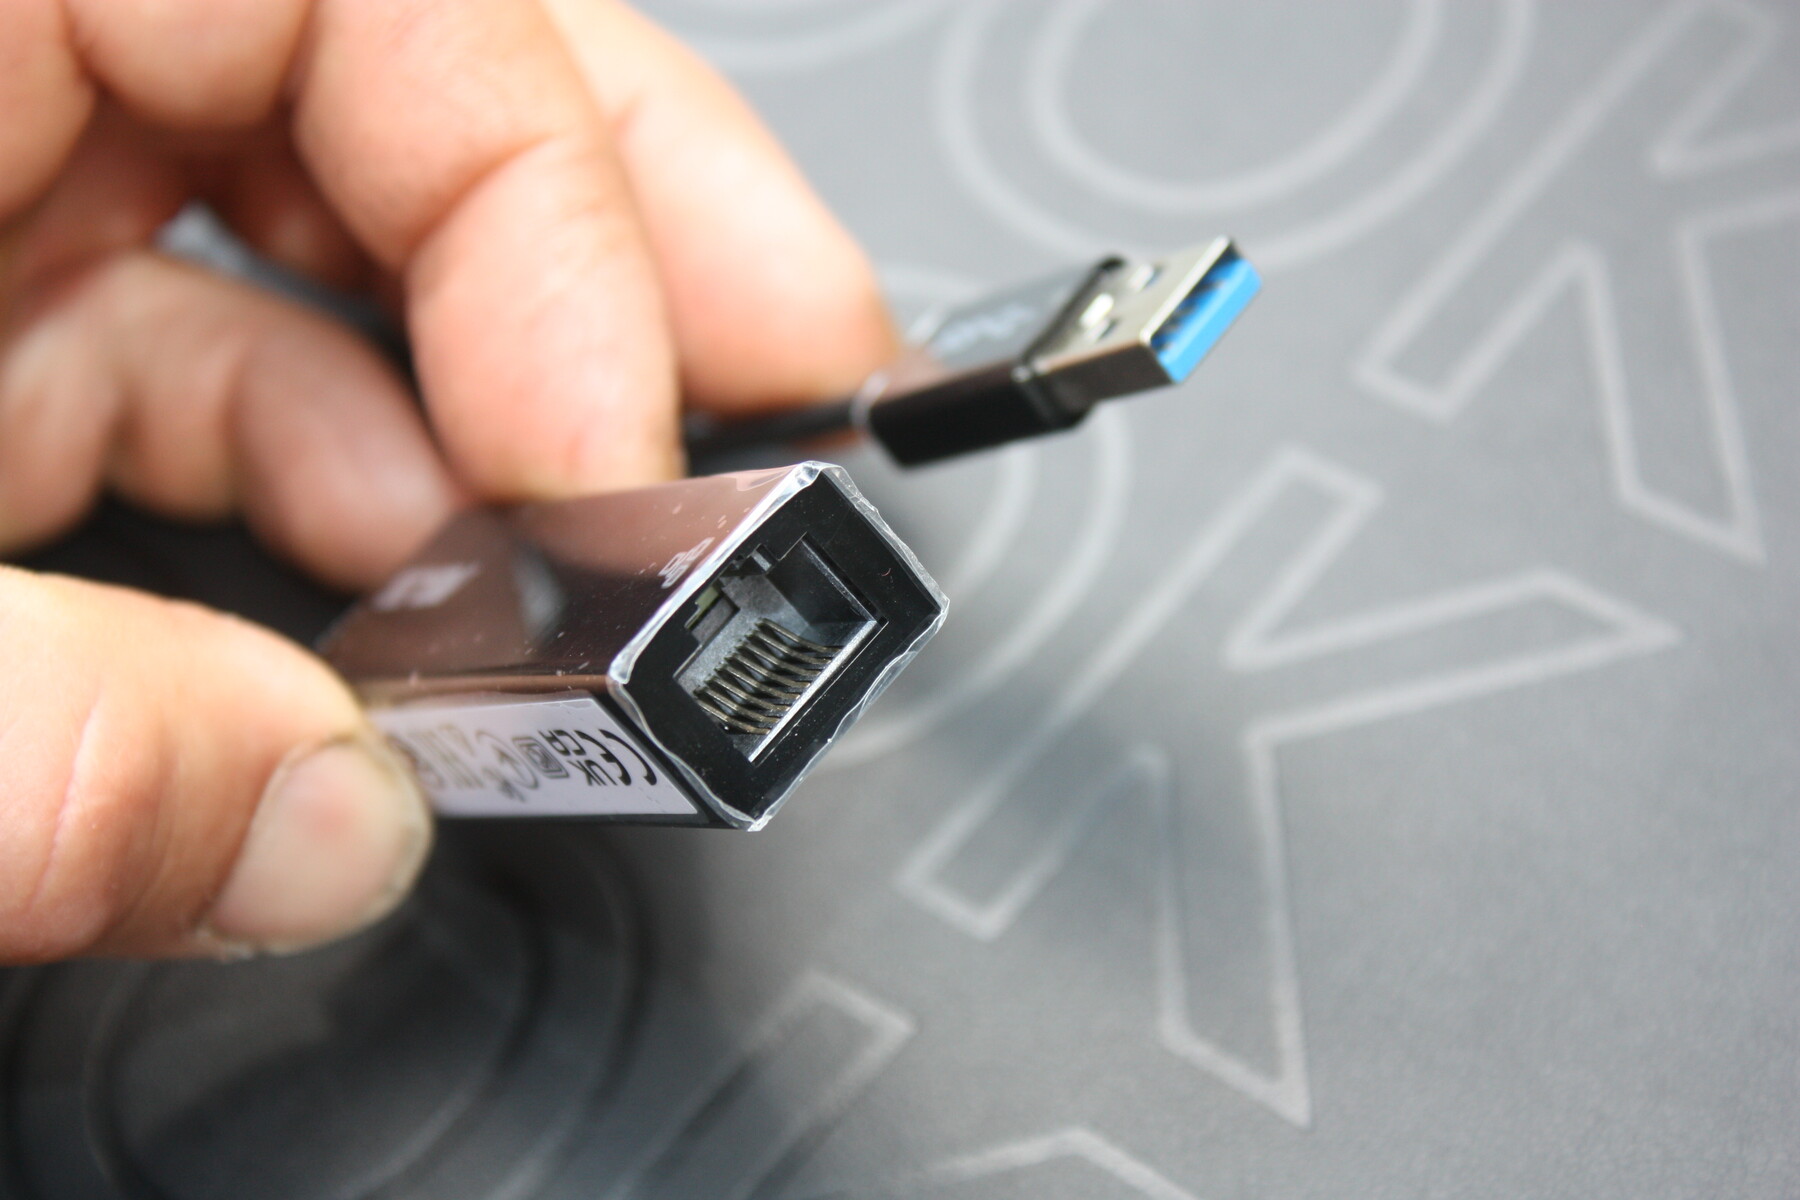
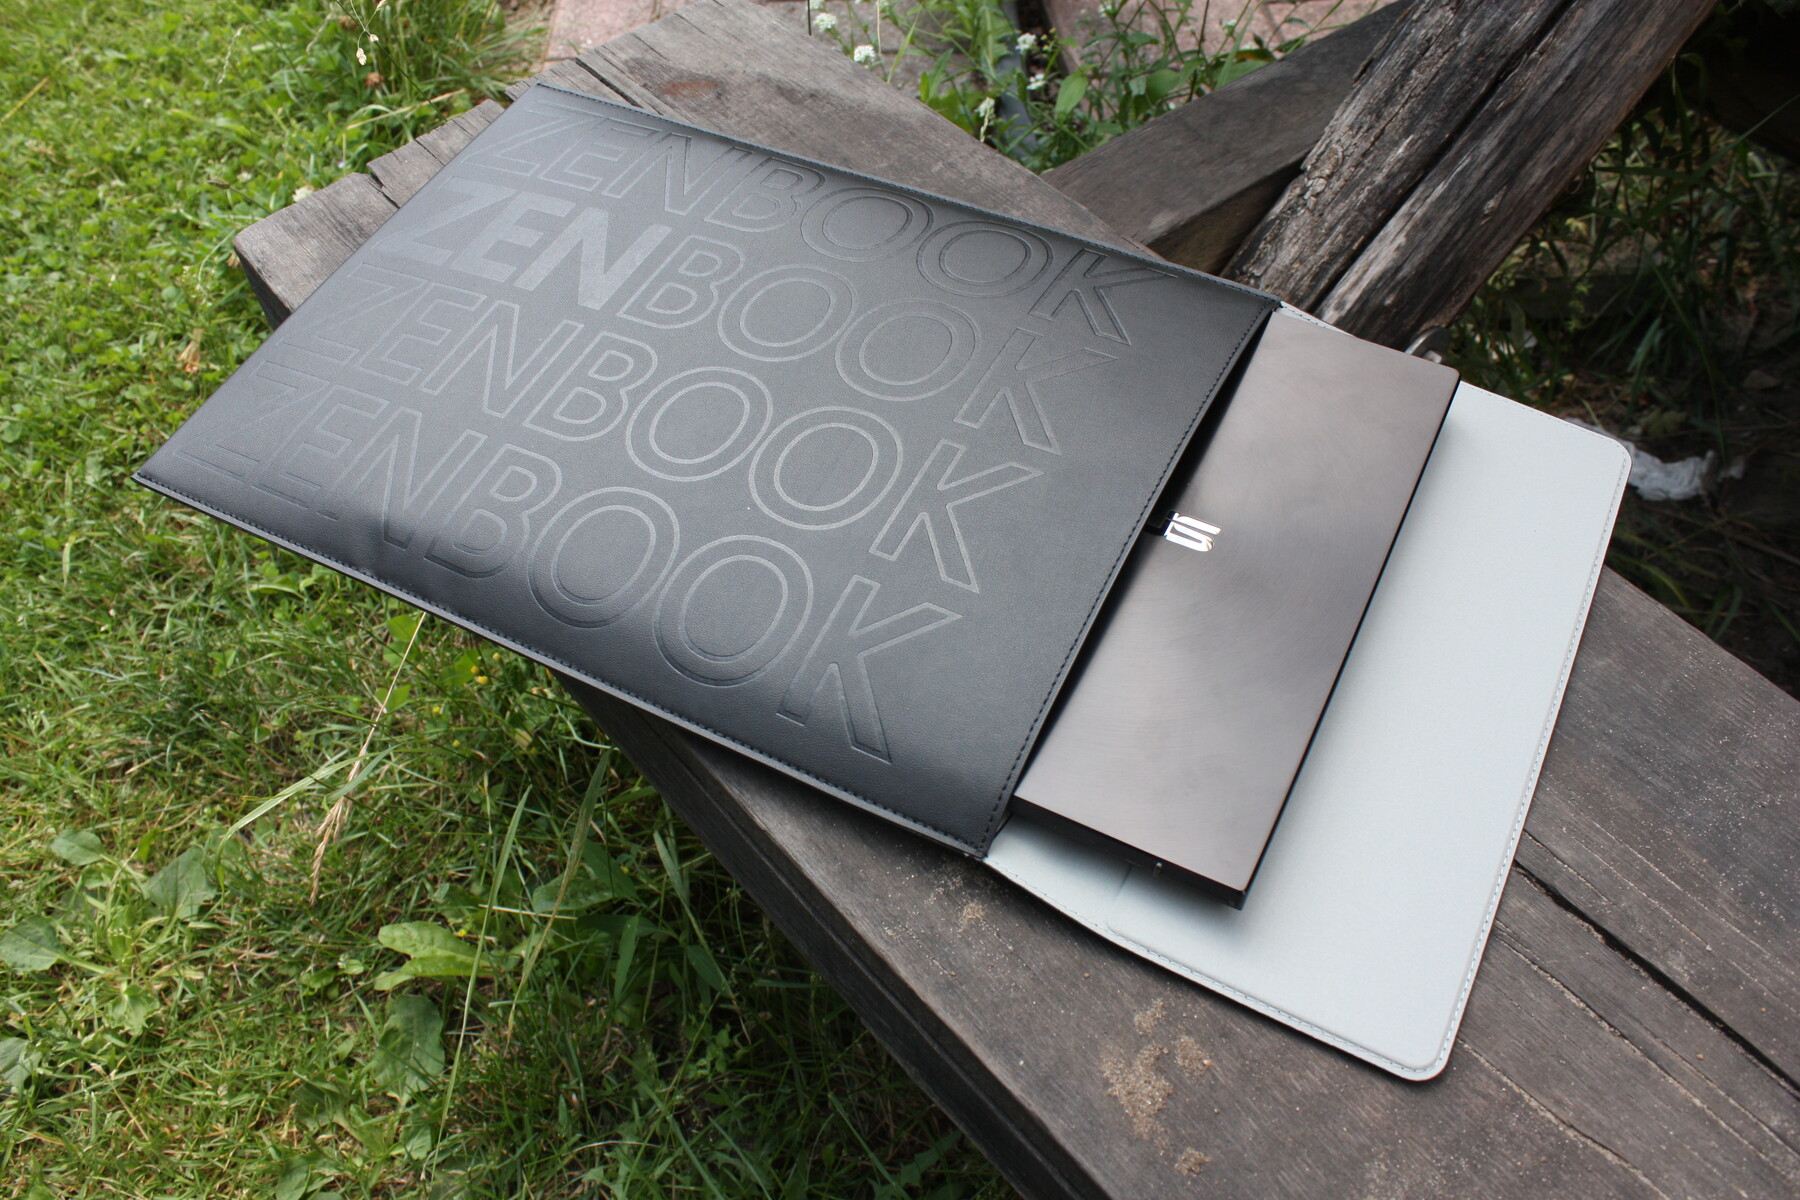
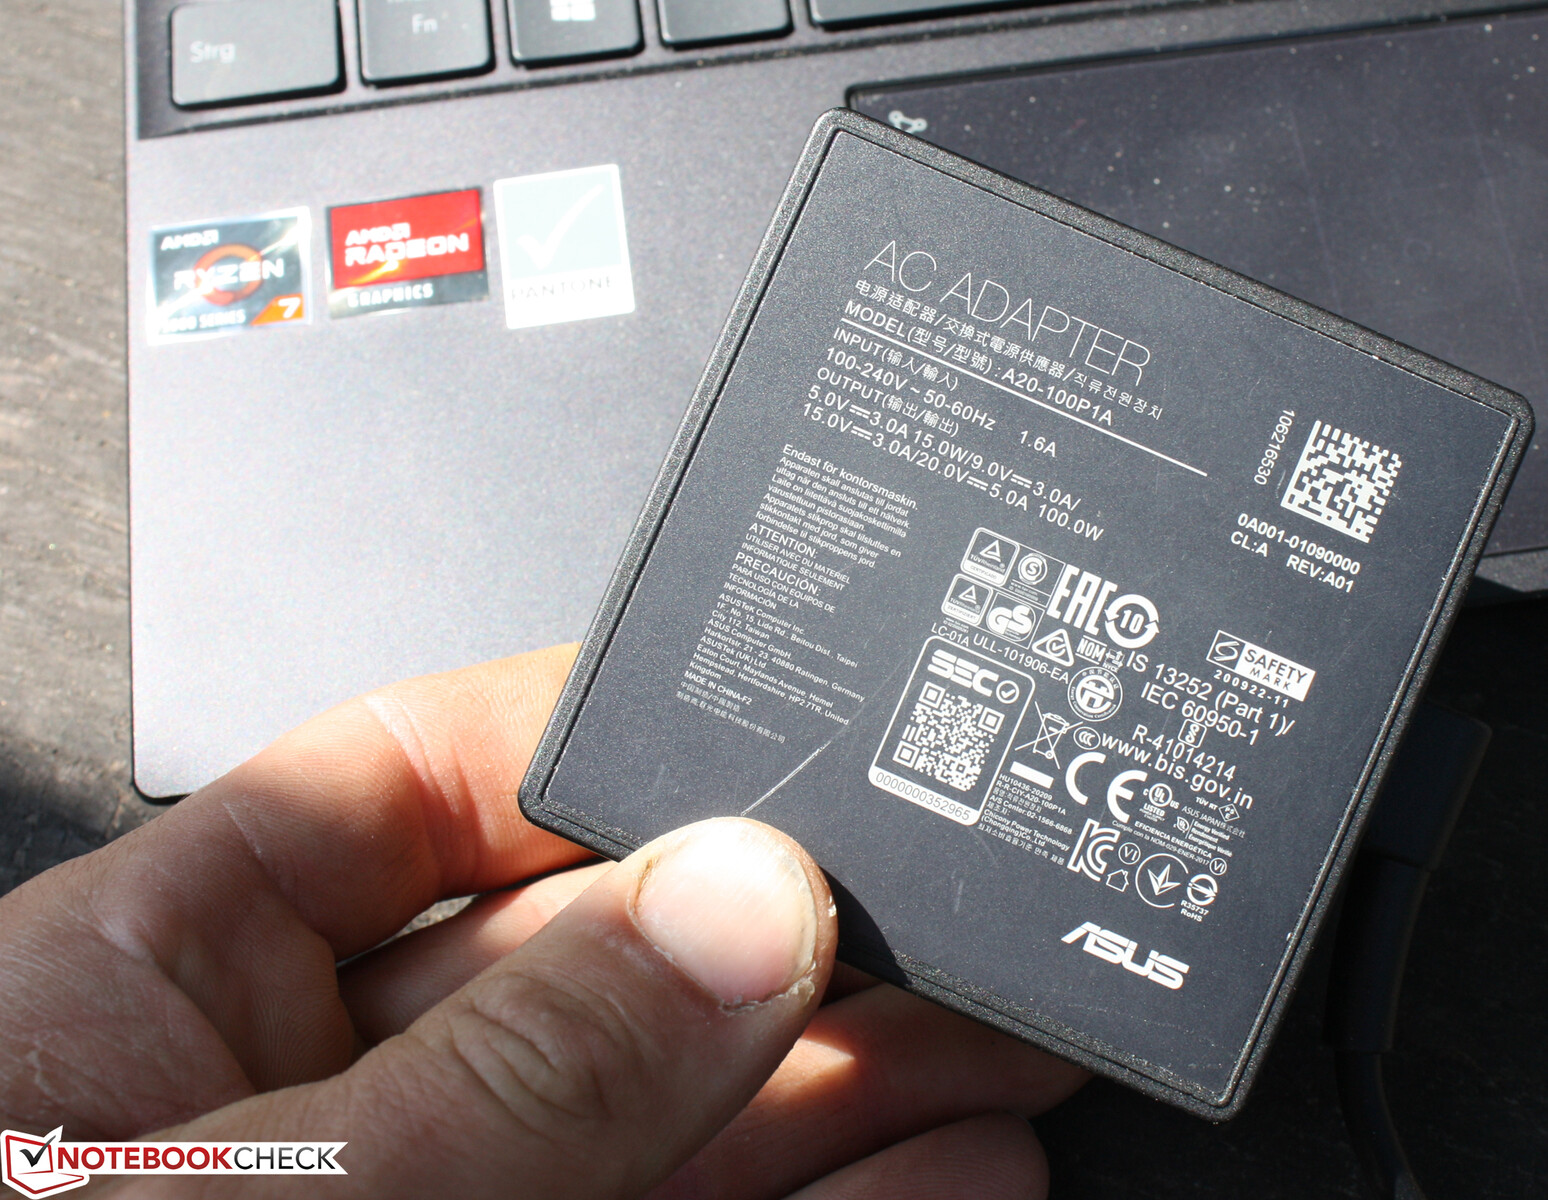
Accessories
The accessories consist of the 100-watt power adapter, a USB Type-A Ethernet dongle, as well as a sleeve for the device. A digitizer pen with a battery and replaceable tips - like with the Intel version of the 14X - isn't included with the AMD version. The Intel and AMD versions of the Zenbook are currently always equipped with a touchscreen.
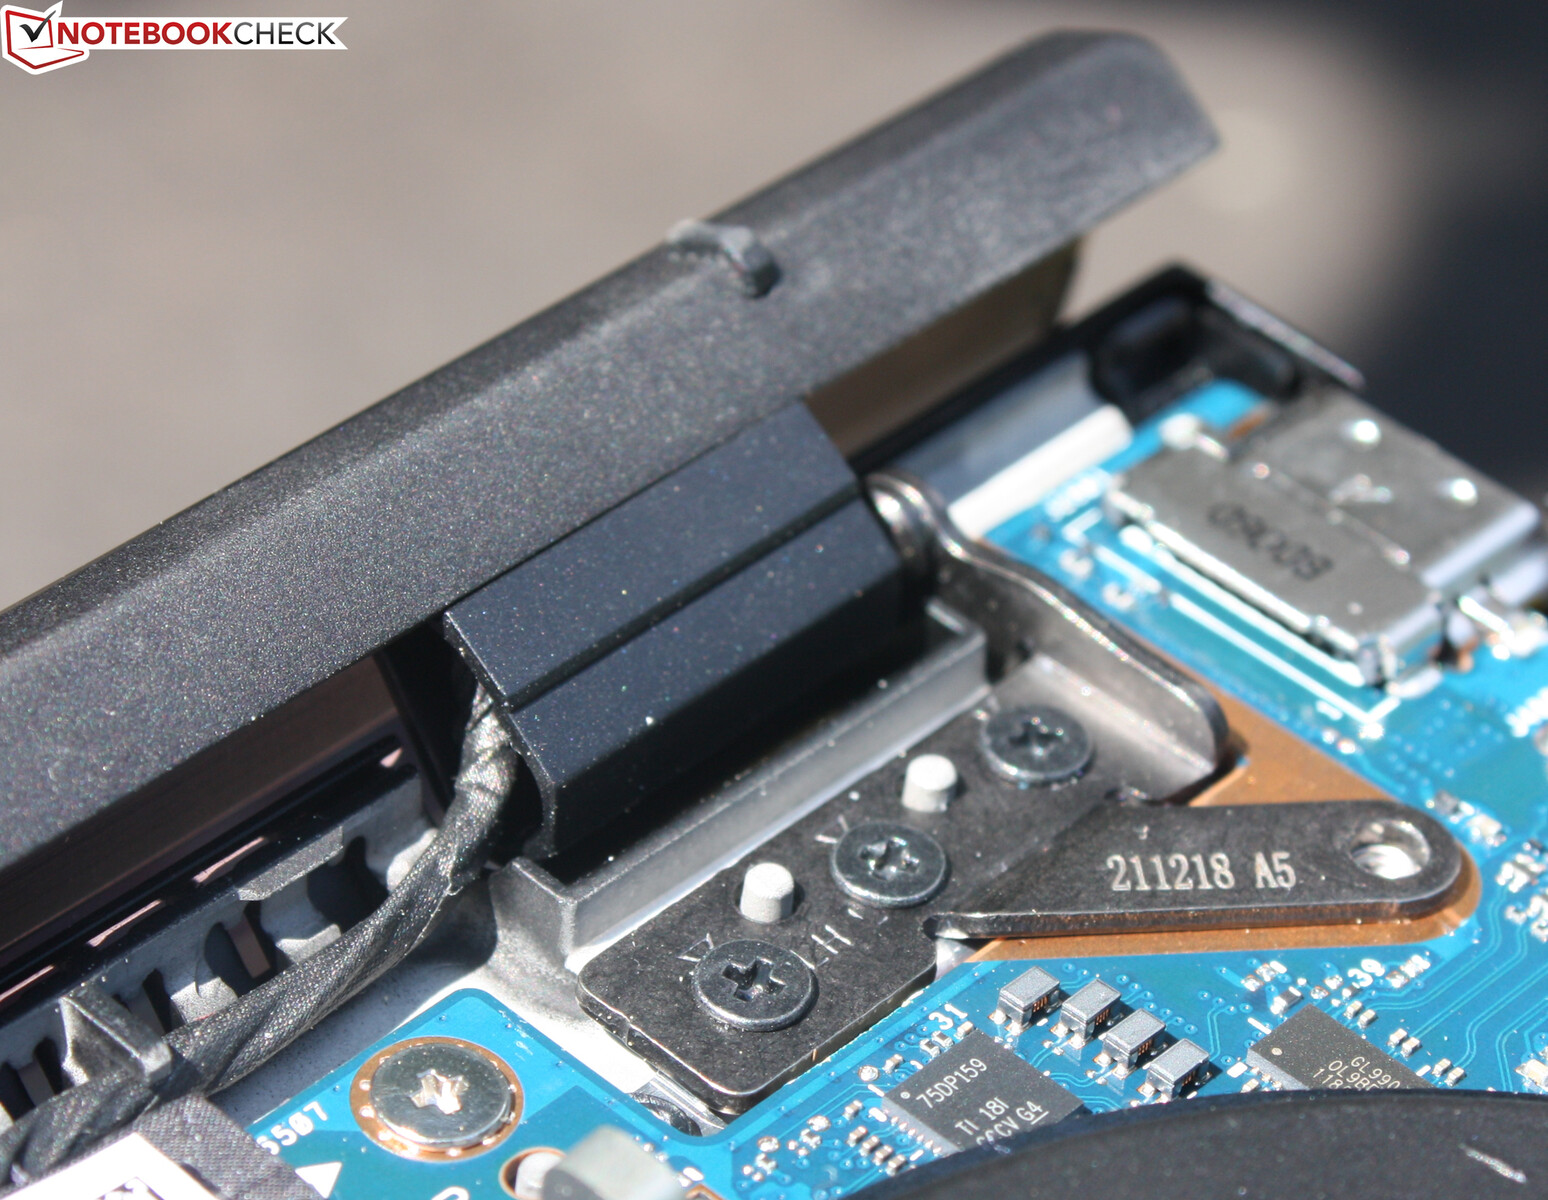
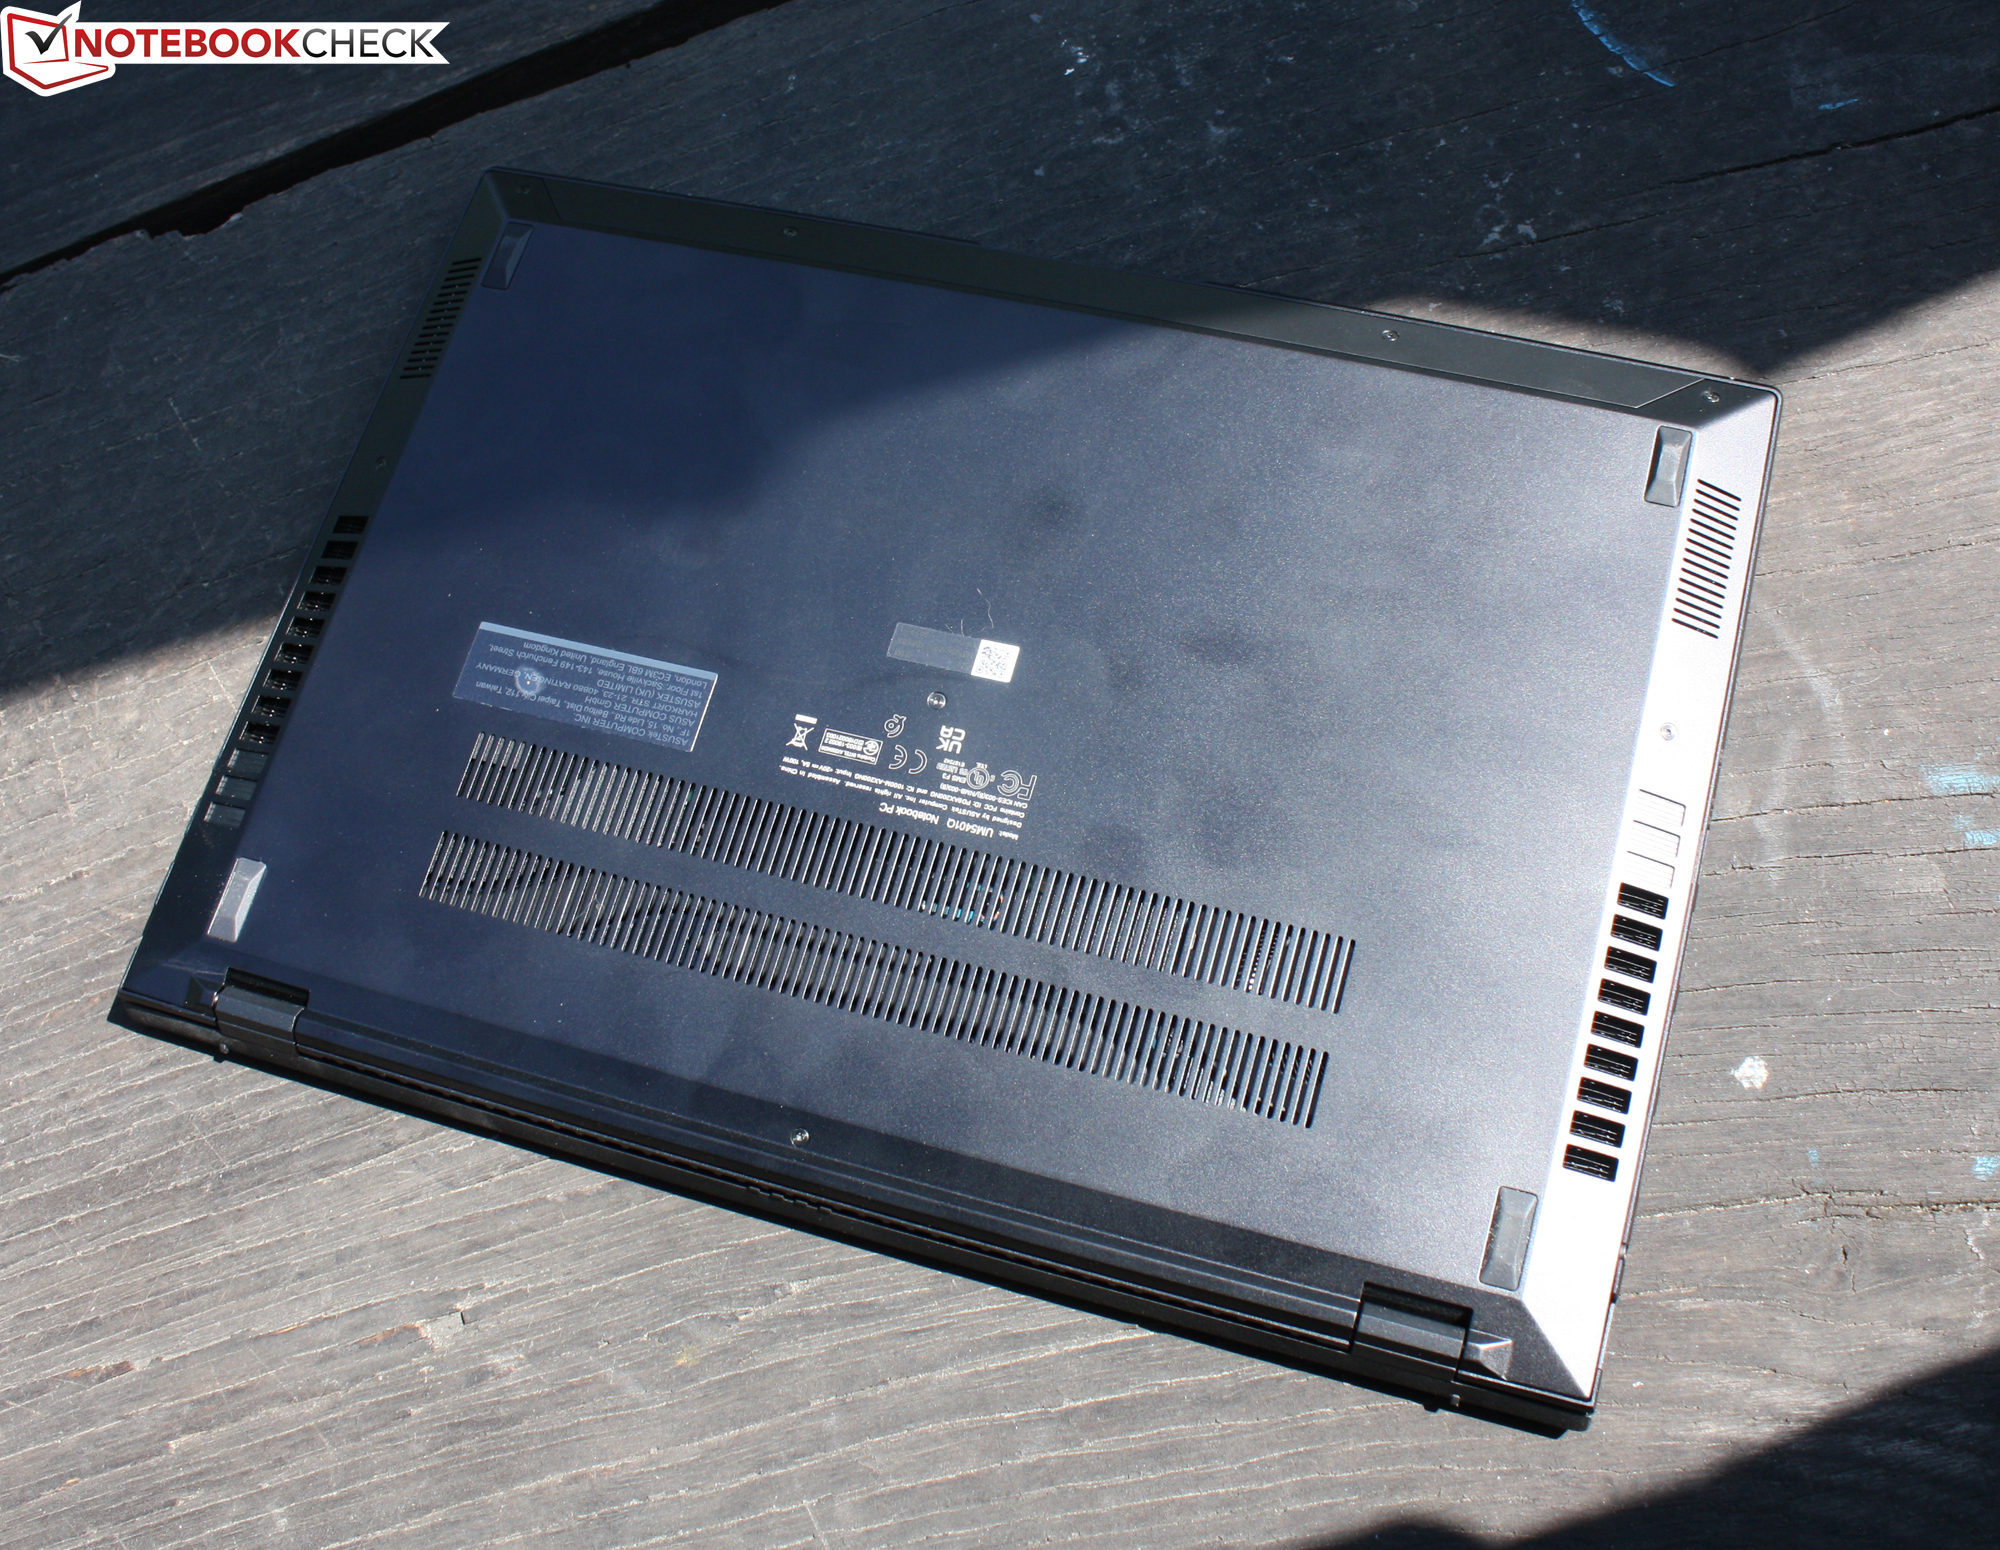
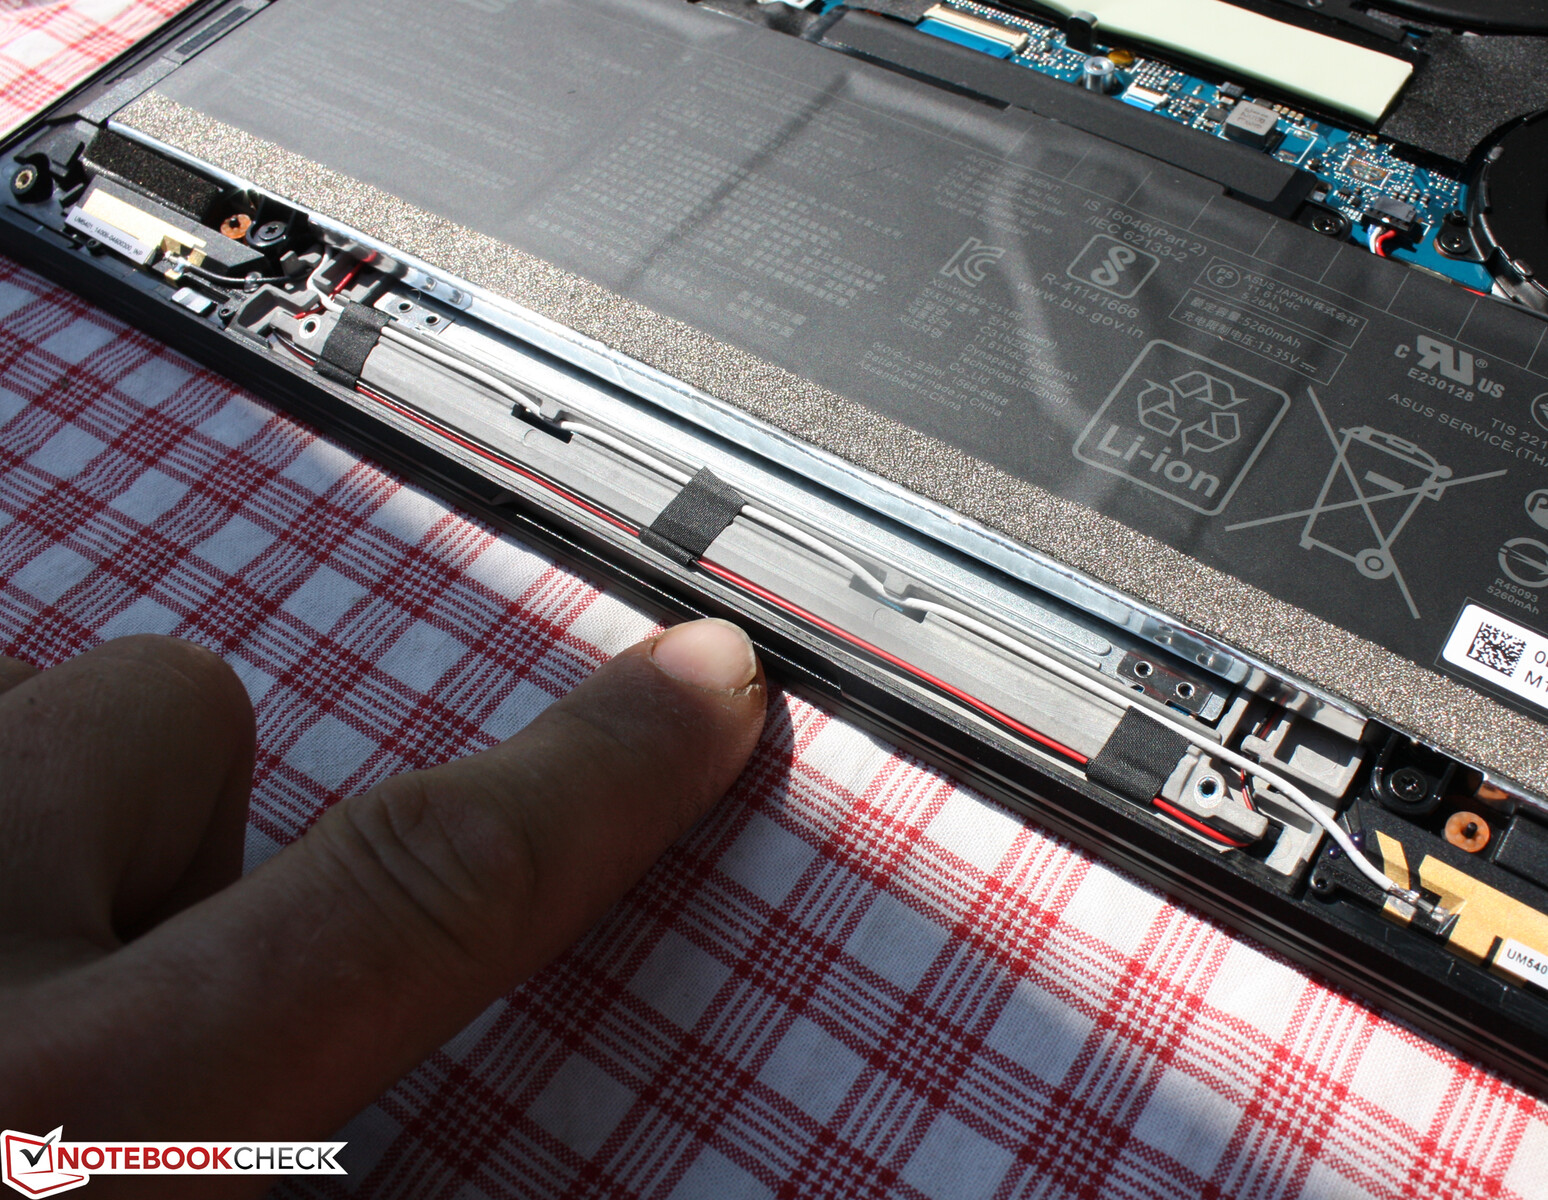
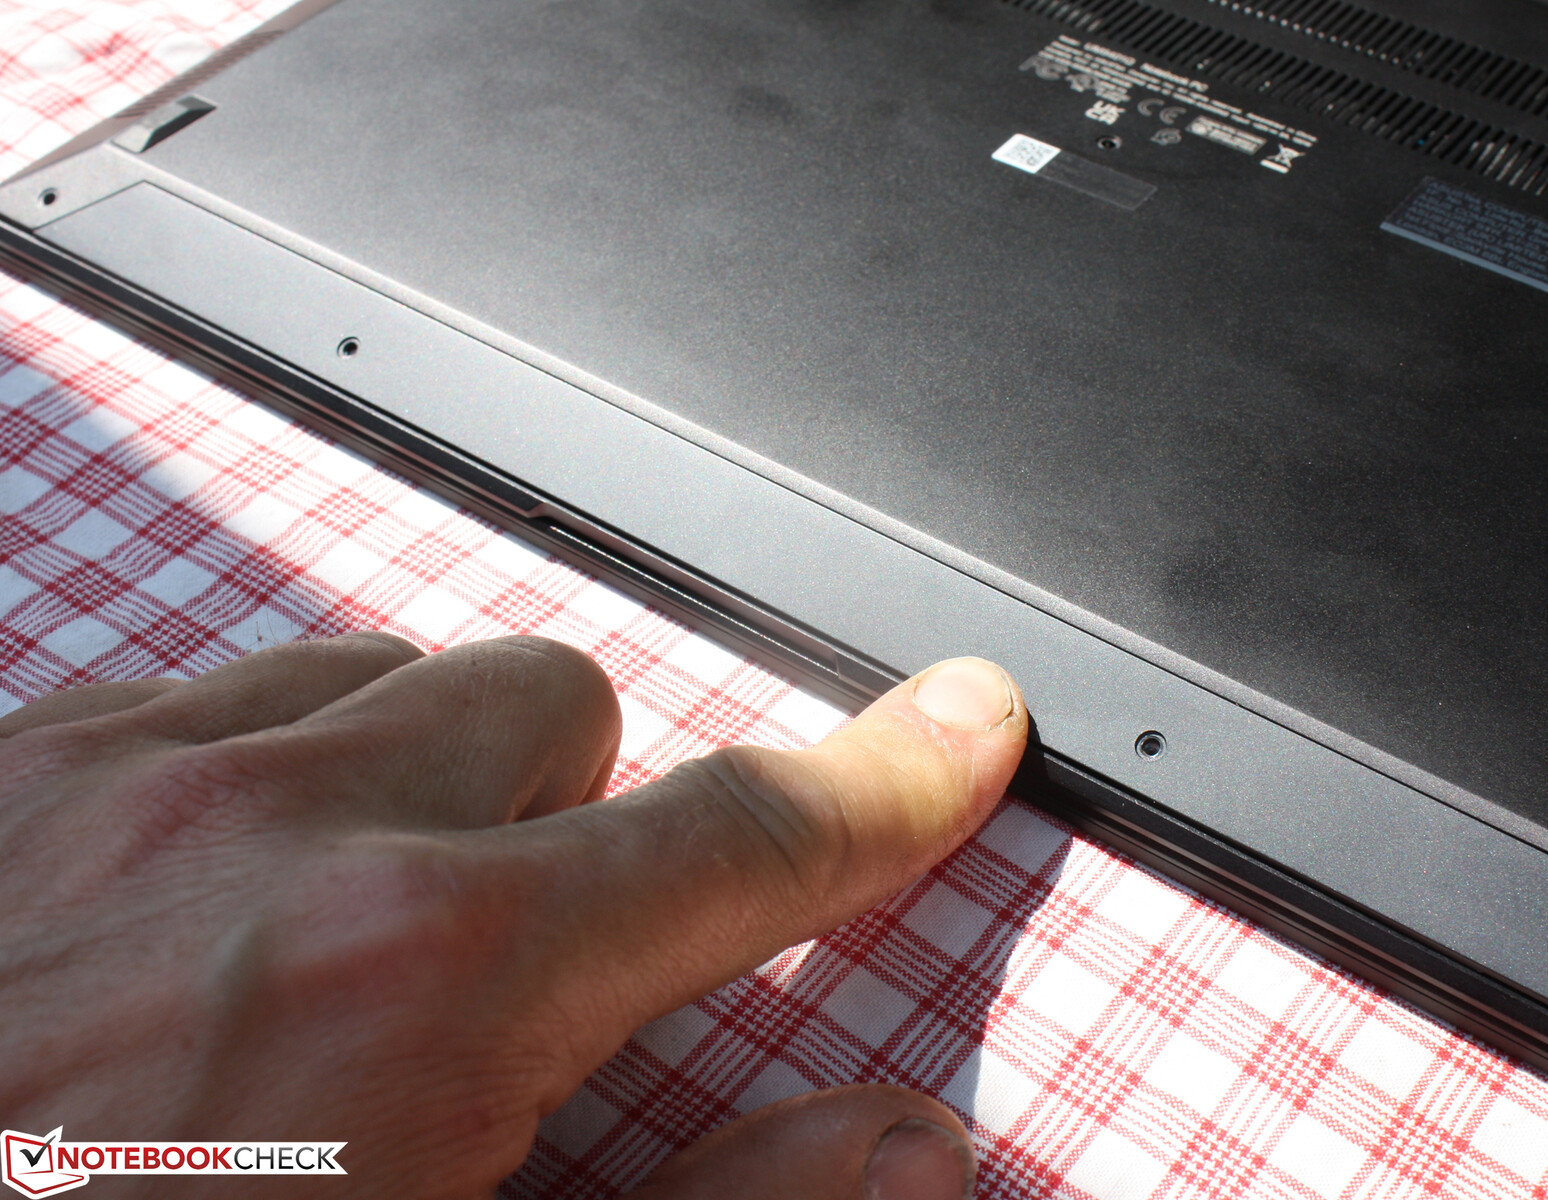
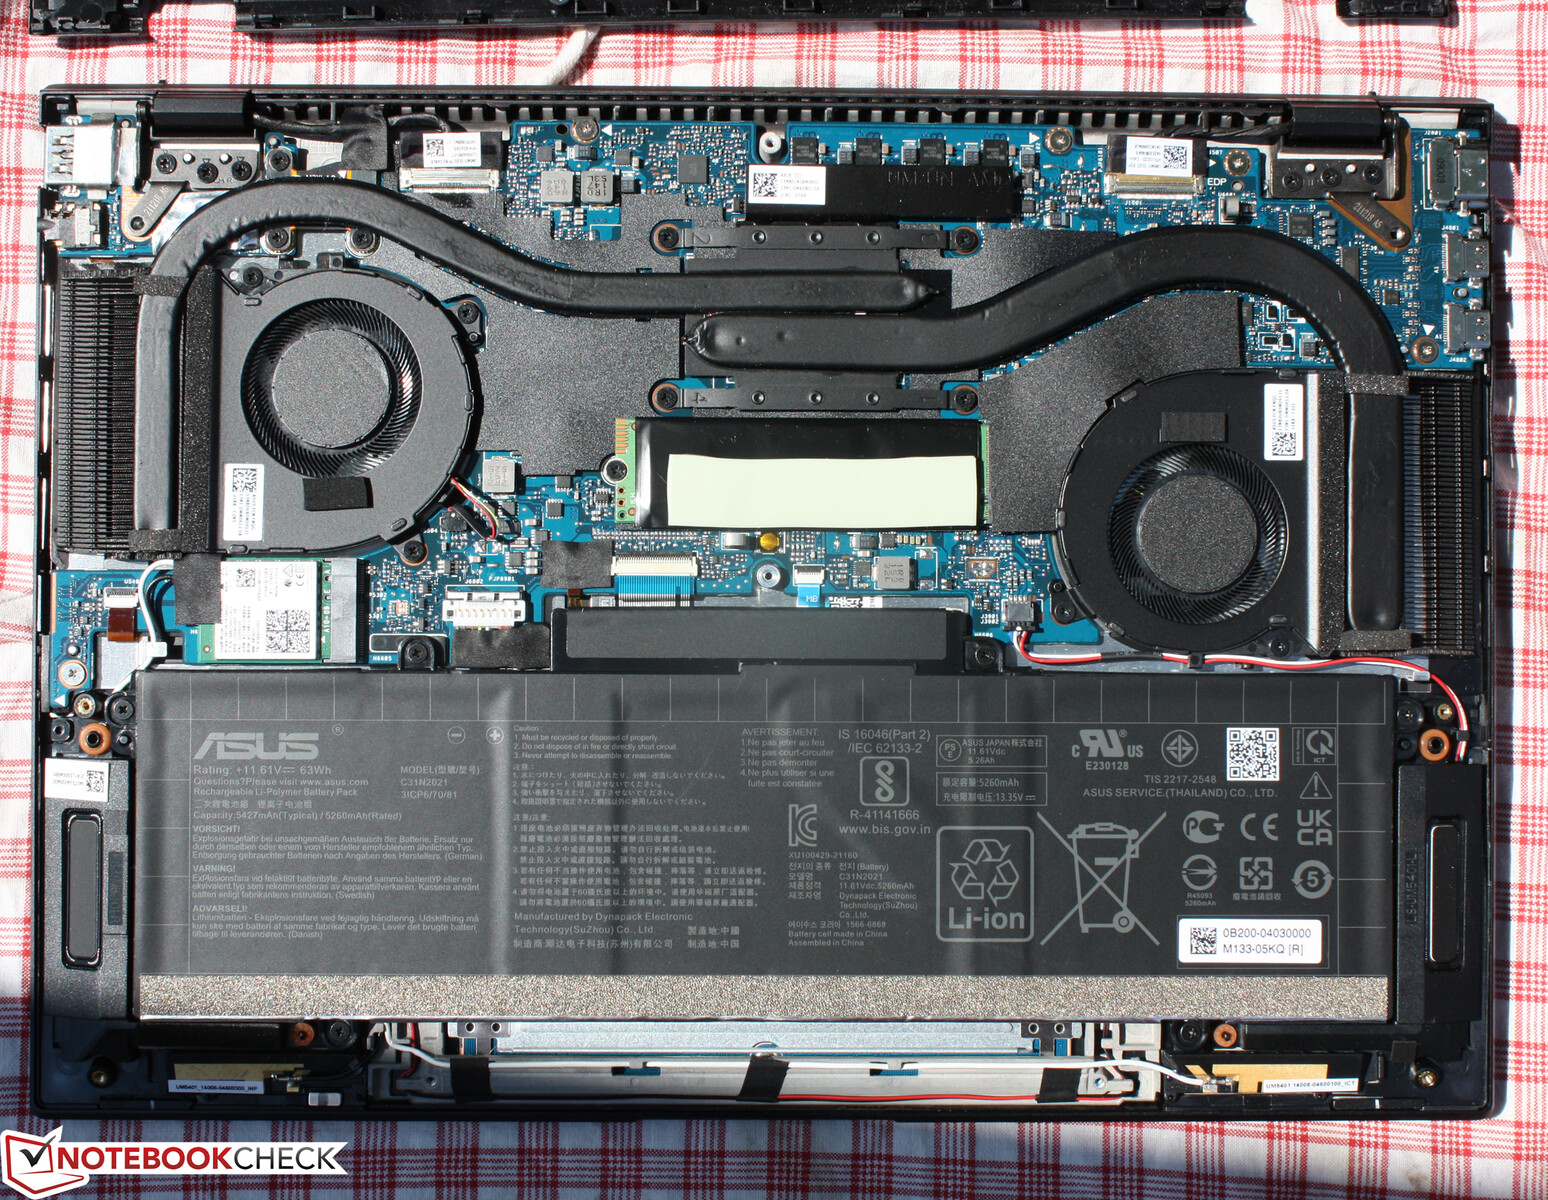
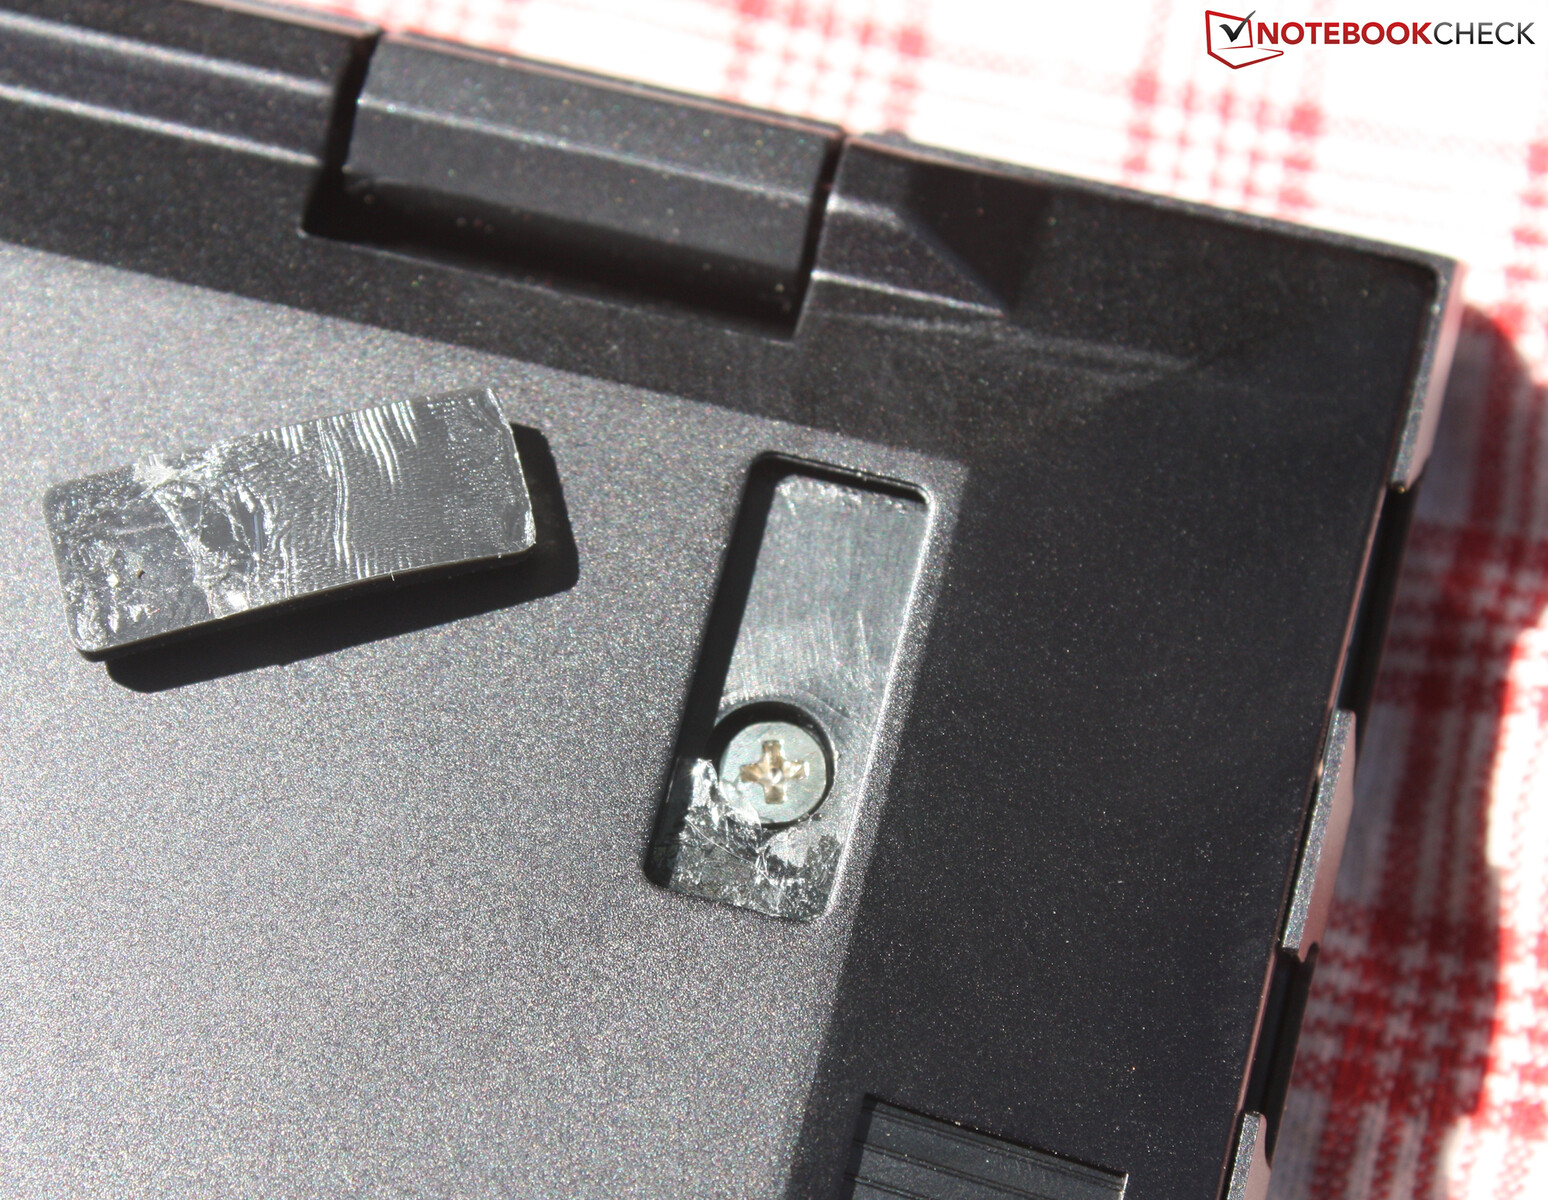
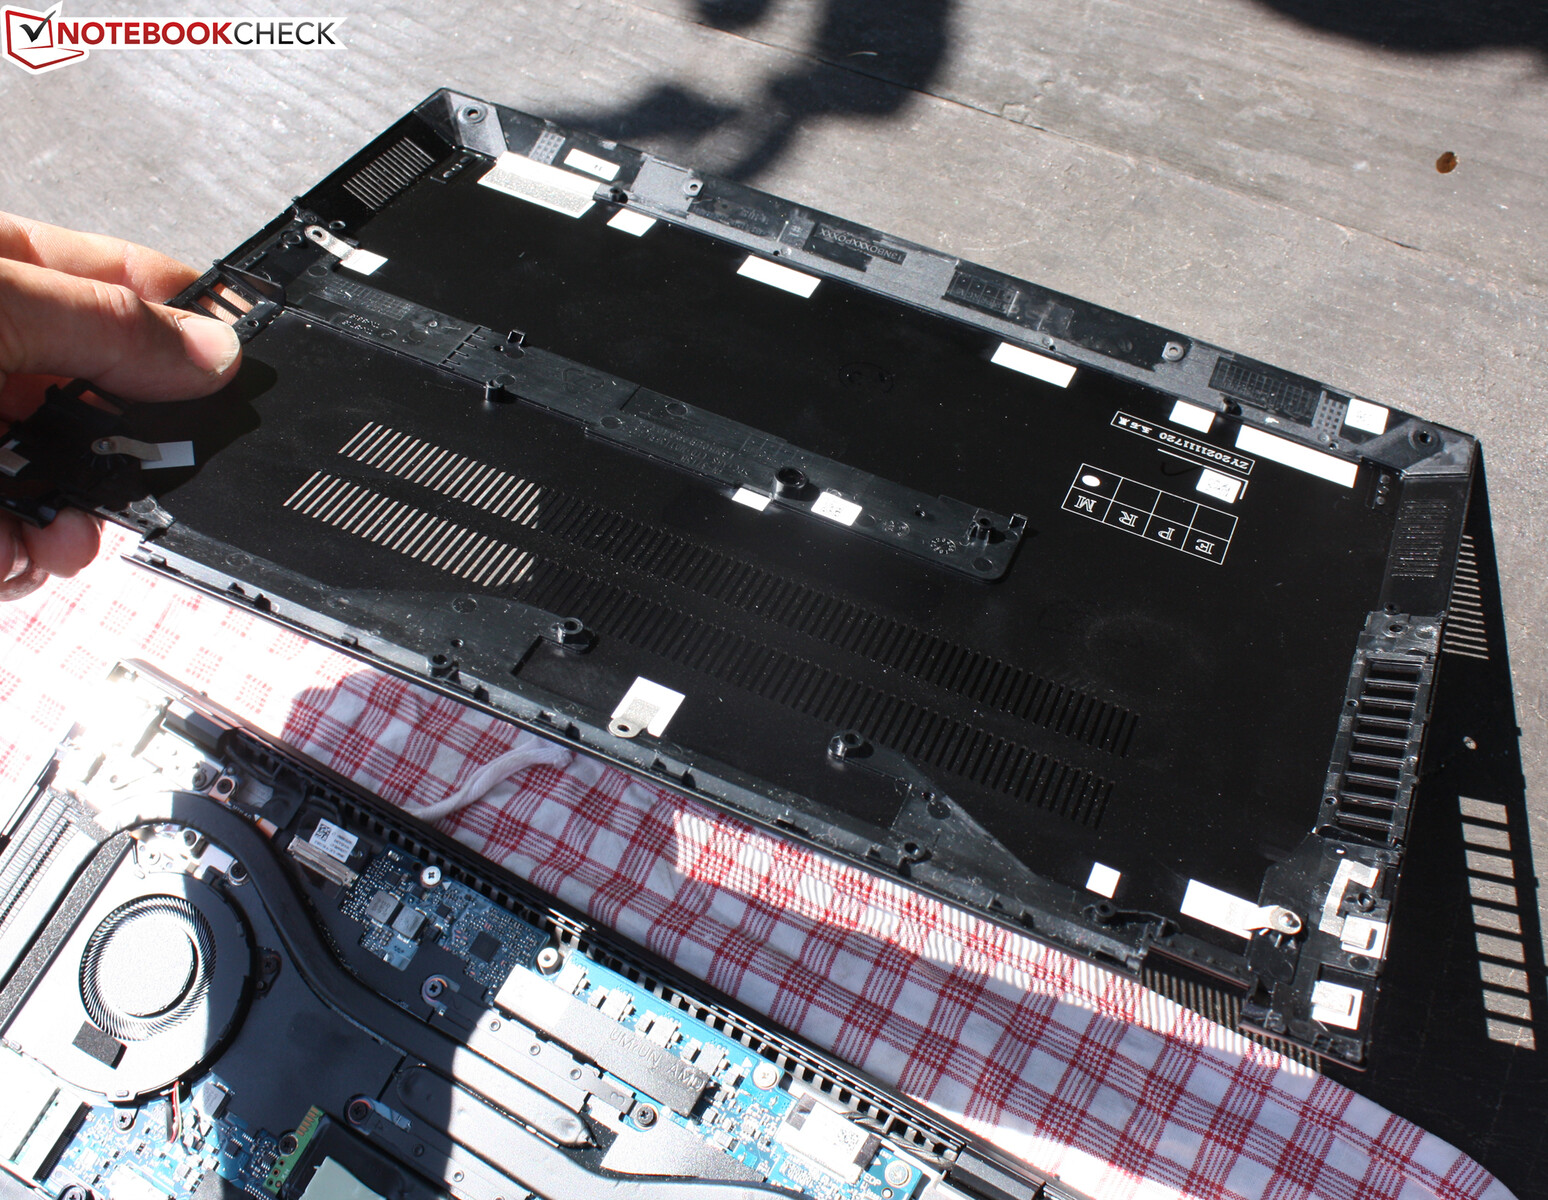
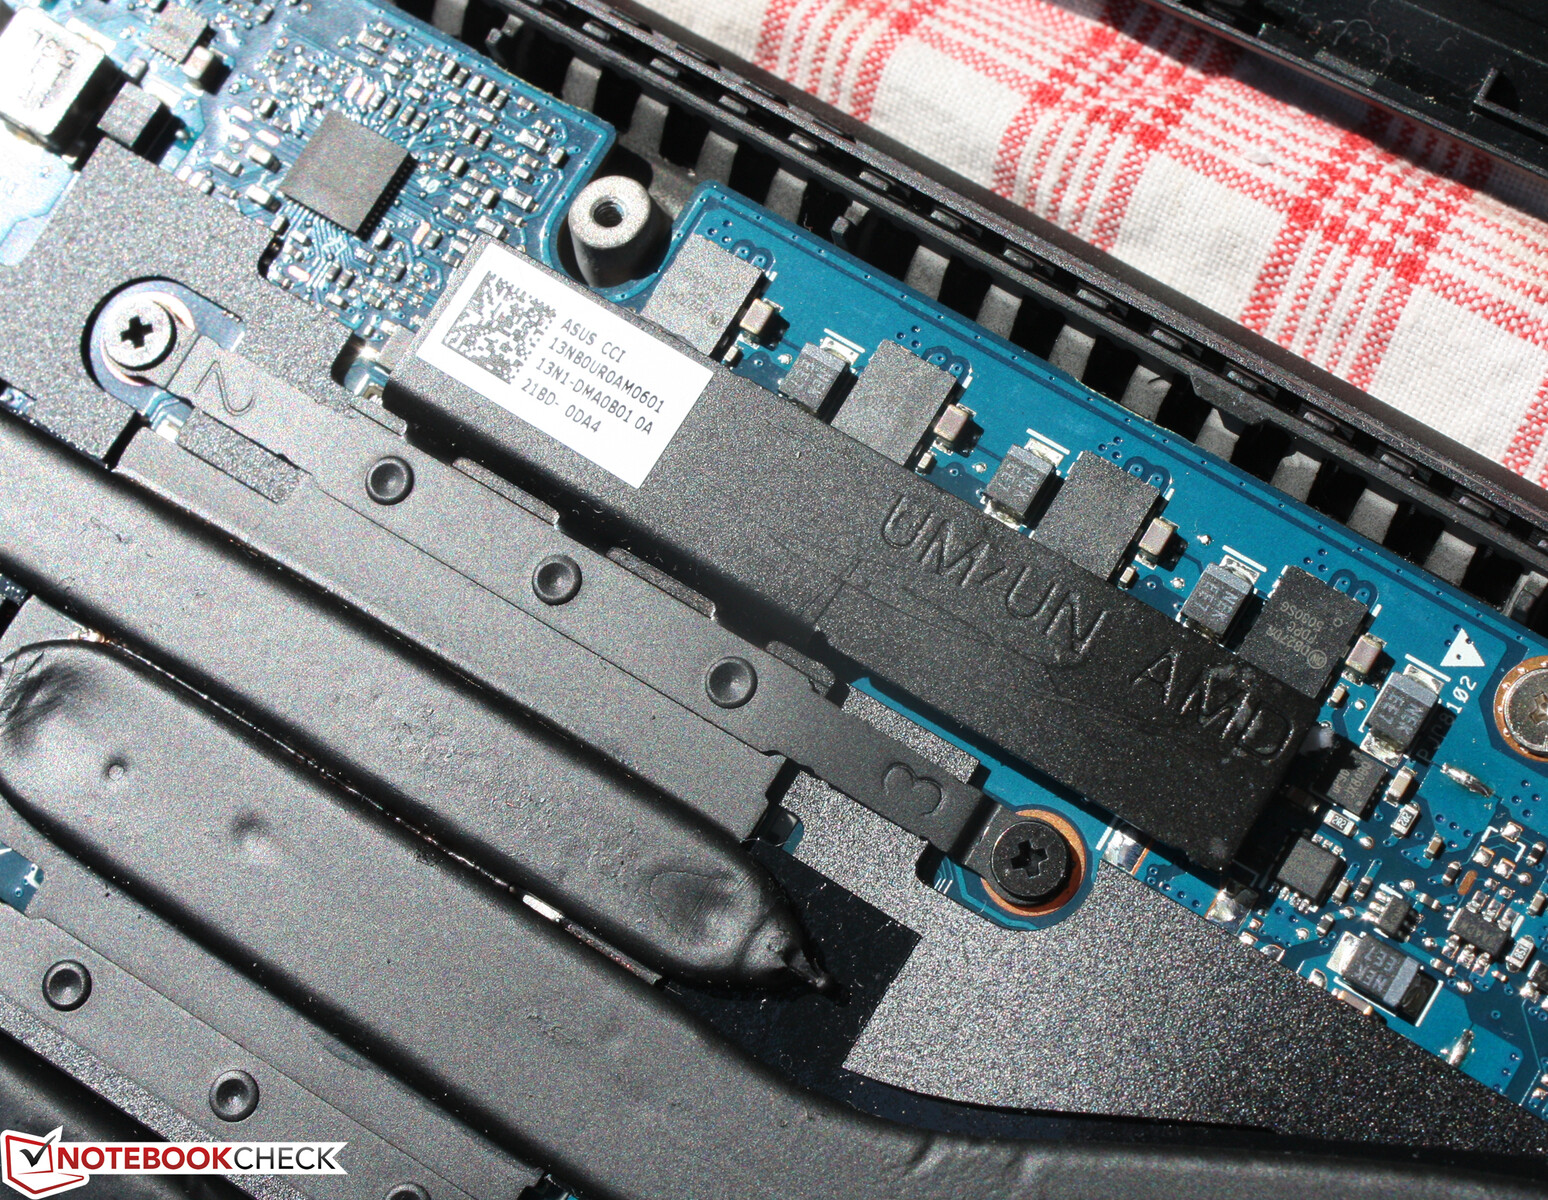
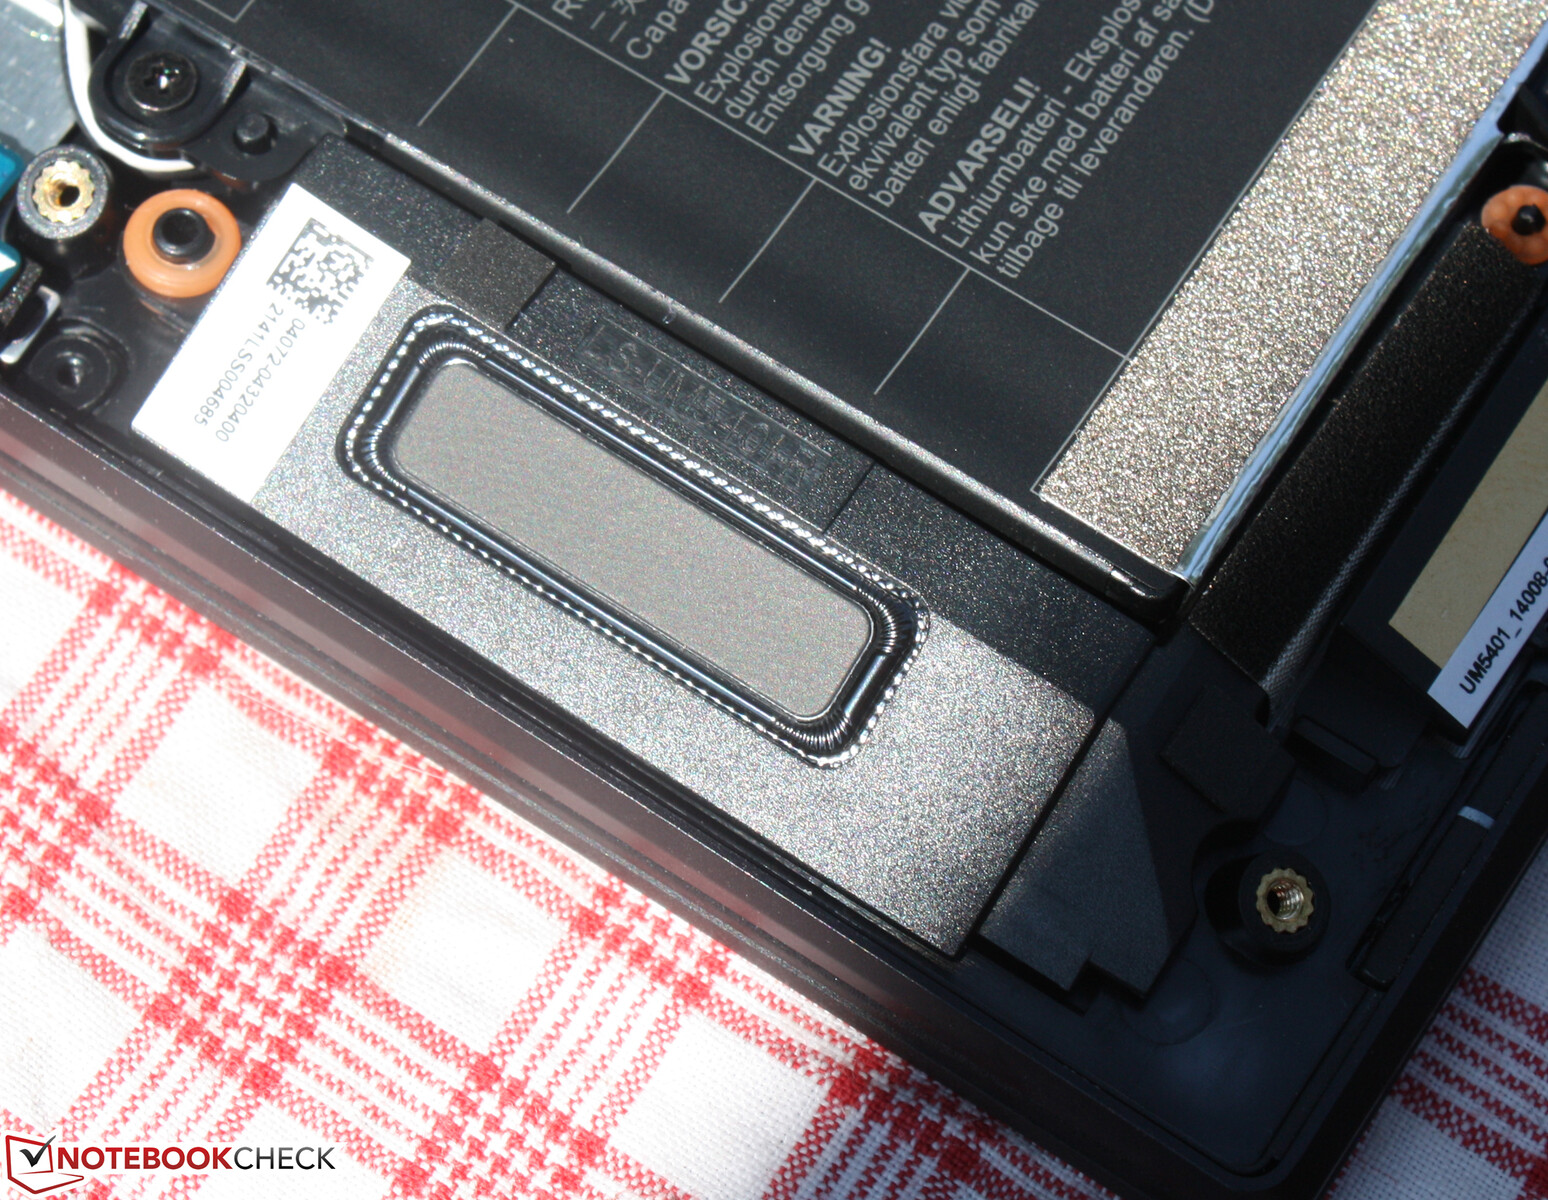
Maintenance
Loosen the screws, open a gap at the front, and you can remove the bottom cover. The Wi-Fi module, battery, and SSD can be replaced, while the RAM is onboard.
Warranty
Asus grants a two-year Pickup & Return warranty in Germany.
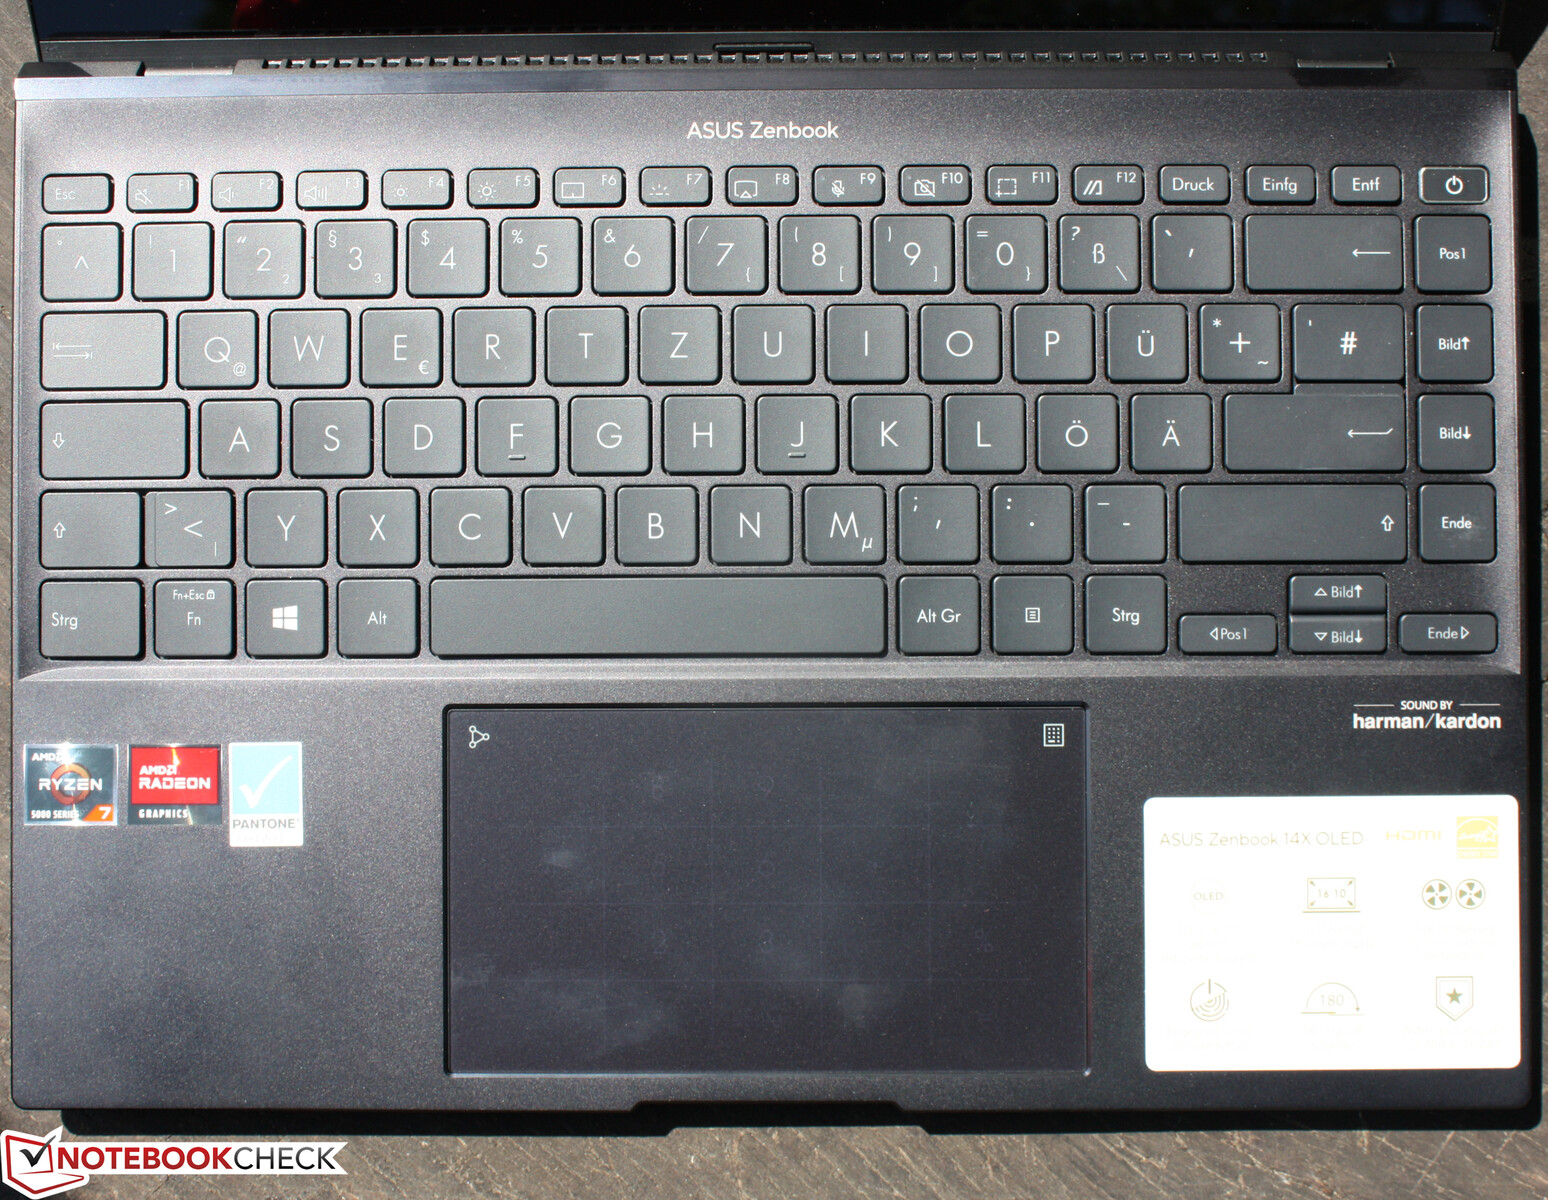
Input devices - Fast typing on the laptop
Keyboard
The matte, anti-slip keys have a distinctive pressure point, a moderate travel, and a firm stroke. Typing is almost silent. Working in dark environments is possible thanks to the three-stage white backlight. A bit of dexterity is required for the arrow keys, which are unusually small for the benefit of the shift key.
The key spacing is quite large by laptop standards (2.5 mm), as the entire width of the base is used here. The right side even has enough space for Page Up/Down and Home/End - an accomplished layout for practical use. The keyboard's firm base is a very positive aspect; nothing yields here, not at any point.
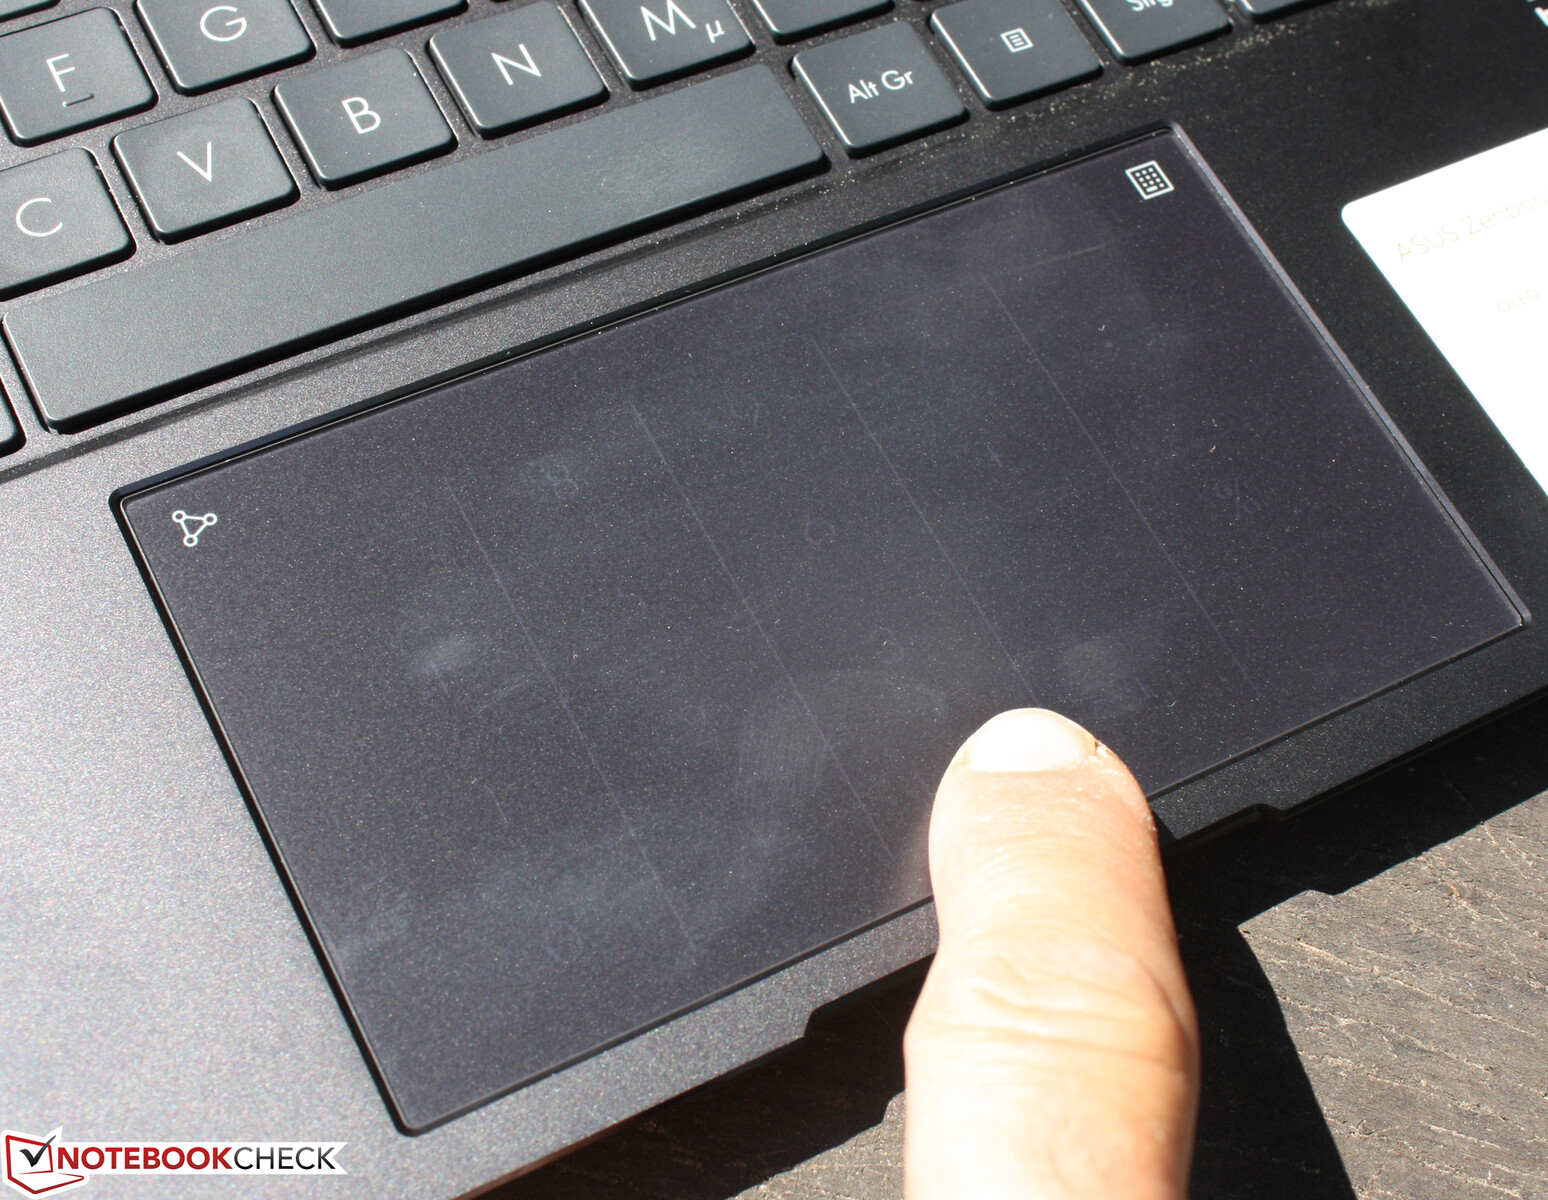
All in all, the result is a spacious keyboard that only lags a bit behind business professionals when it comes to its pressure point. It's definitely possible to type quickly on the Zenbook. Asus complements the keyboard with a numpad that can be enabled on the ClickPad.
Touchpad
The ClickPad is sensitive up to the edges, and it has a short travel. It operates with a dull, quiet noise. The matte surface is smooth, just bordering on slippery. It guides fingers comfortably. We find the short travel to be unsatisfactory, though.
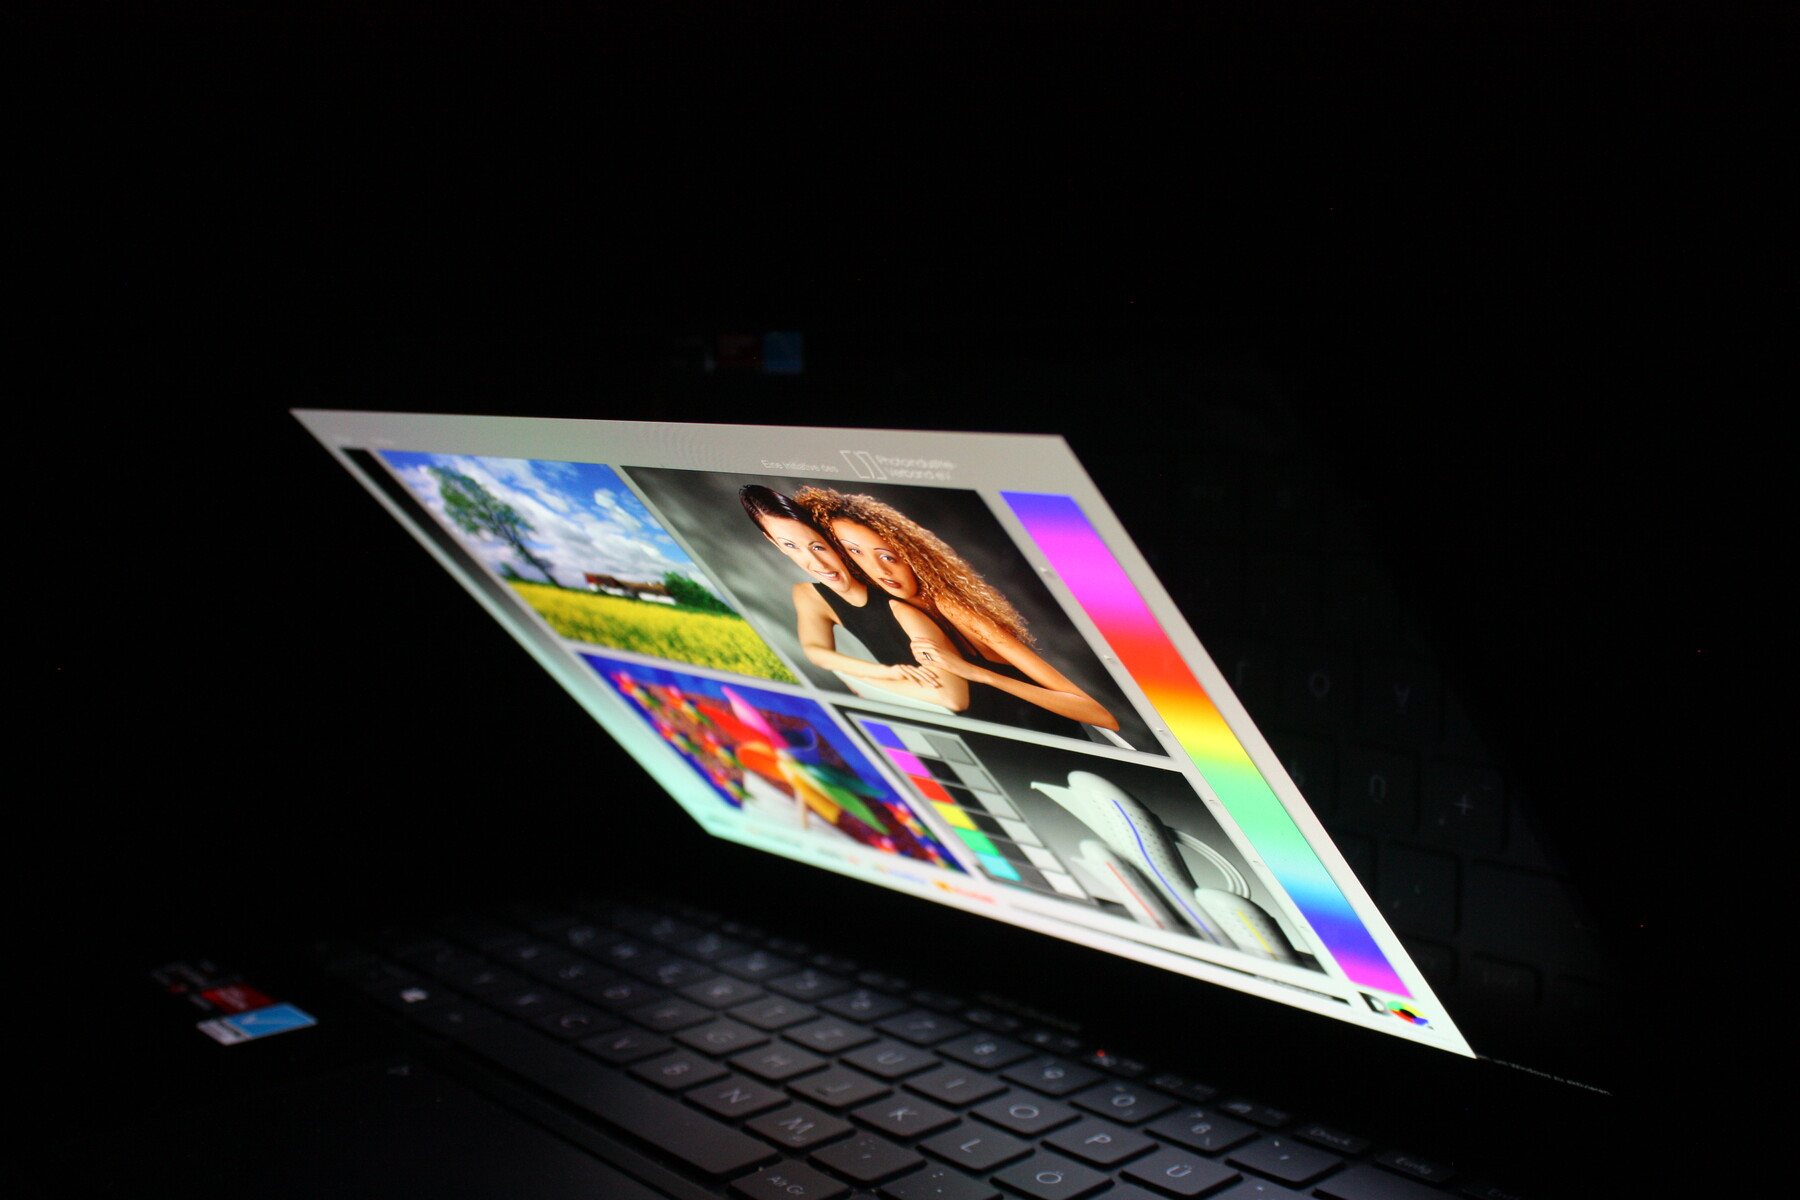
Display - A lot of color, a lot of contrast
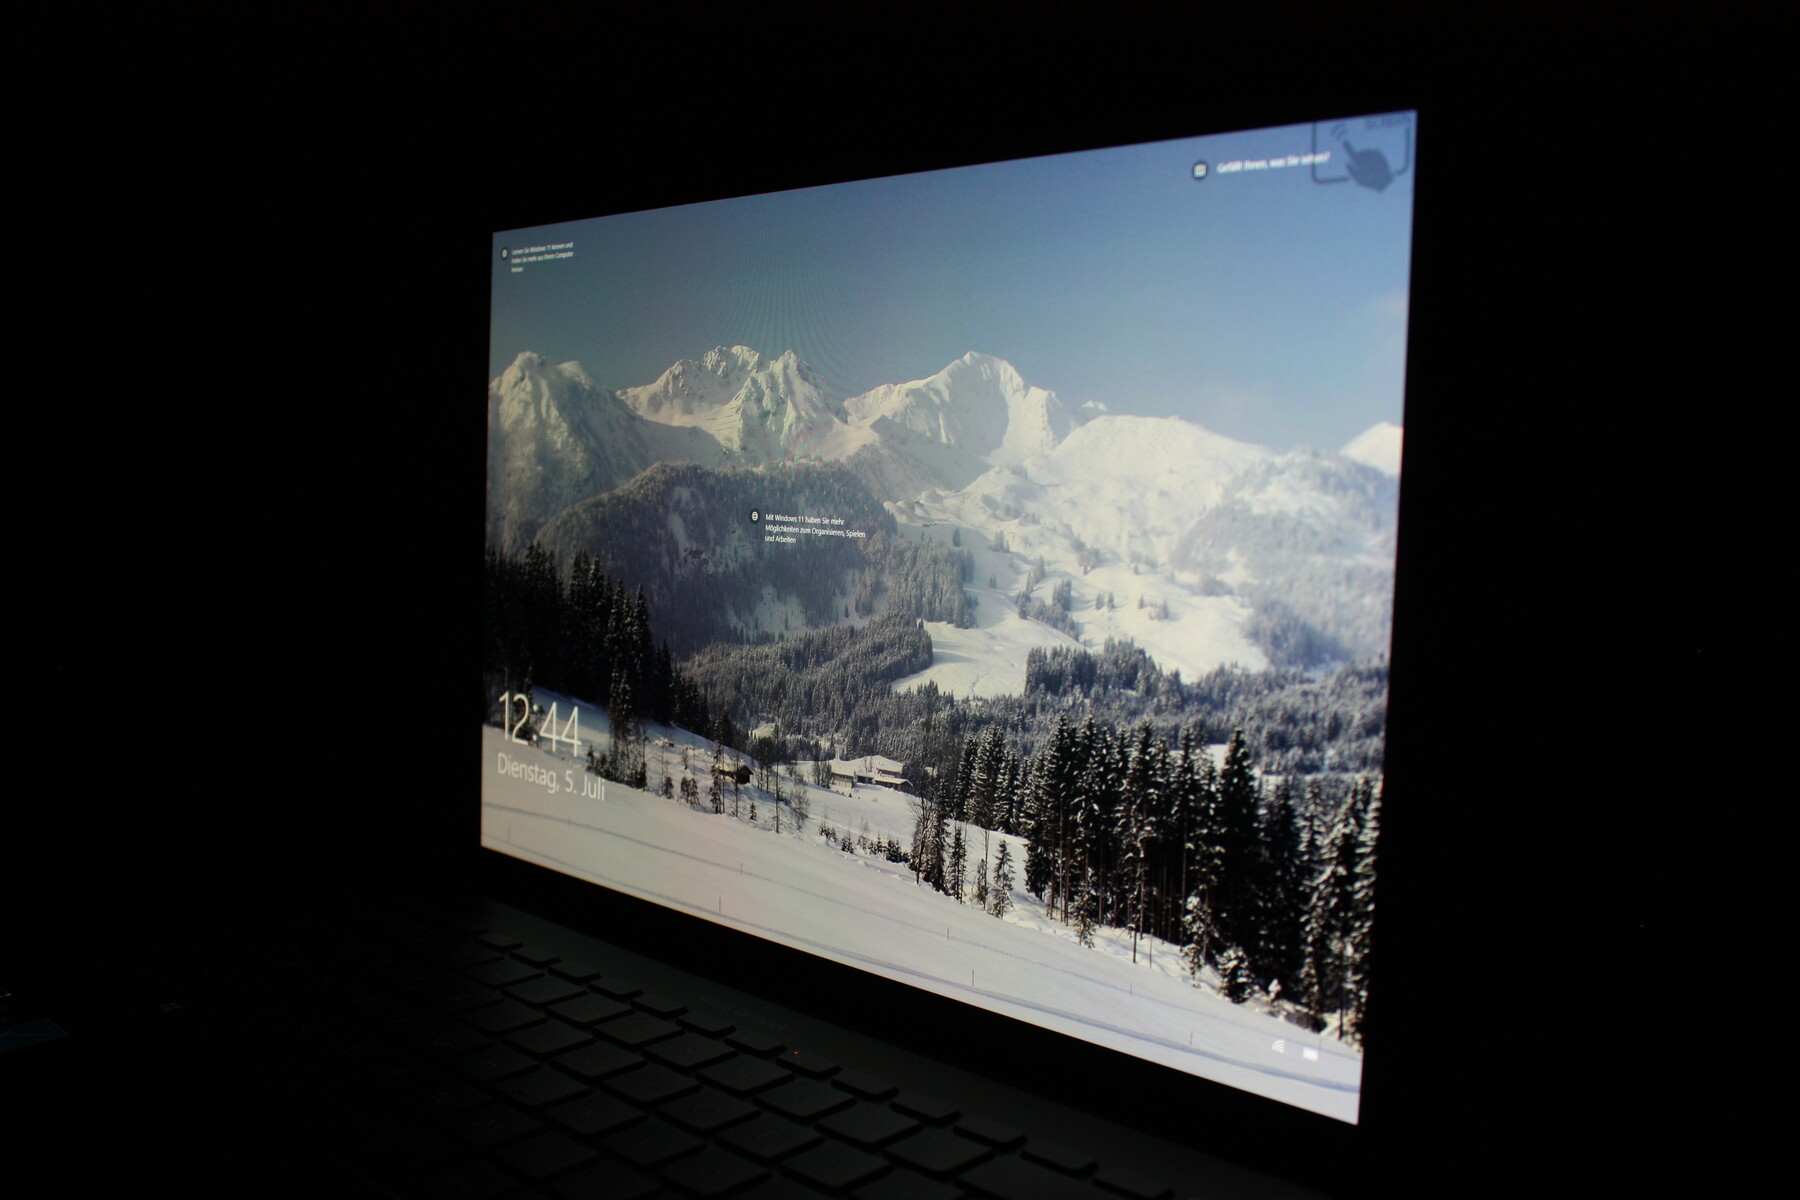
The main argument for buying the Zenbook 14X is its 14-inch OLED panel. Samsung delivers a WQXGA+ panel with 2,880x1,800 pixels (16:10). With a refresh rate of 90 Hz and a response time of 2 milliseconds, the display surpasses any IPS panel.
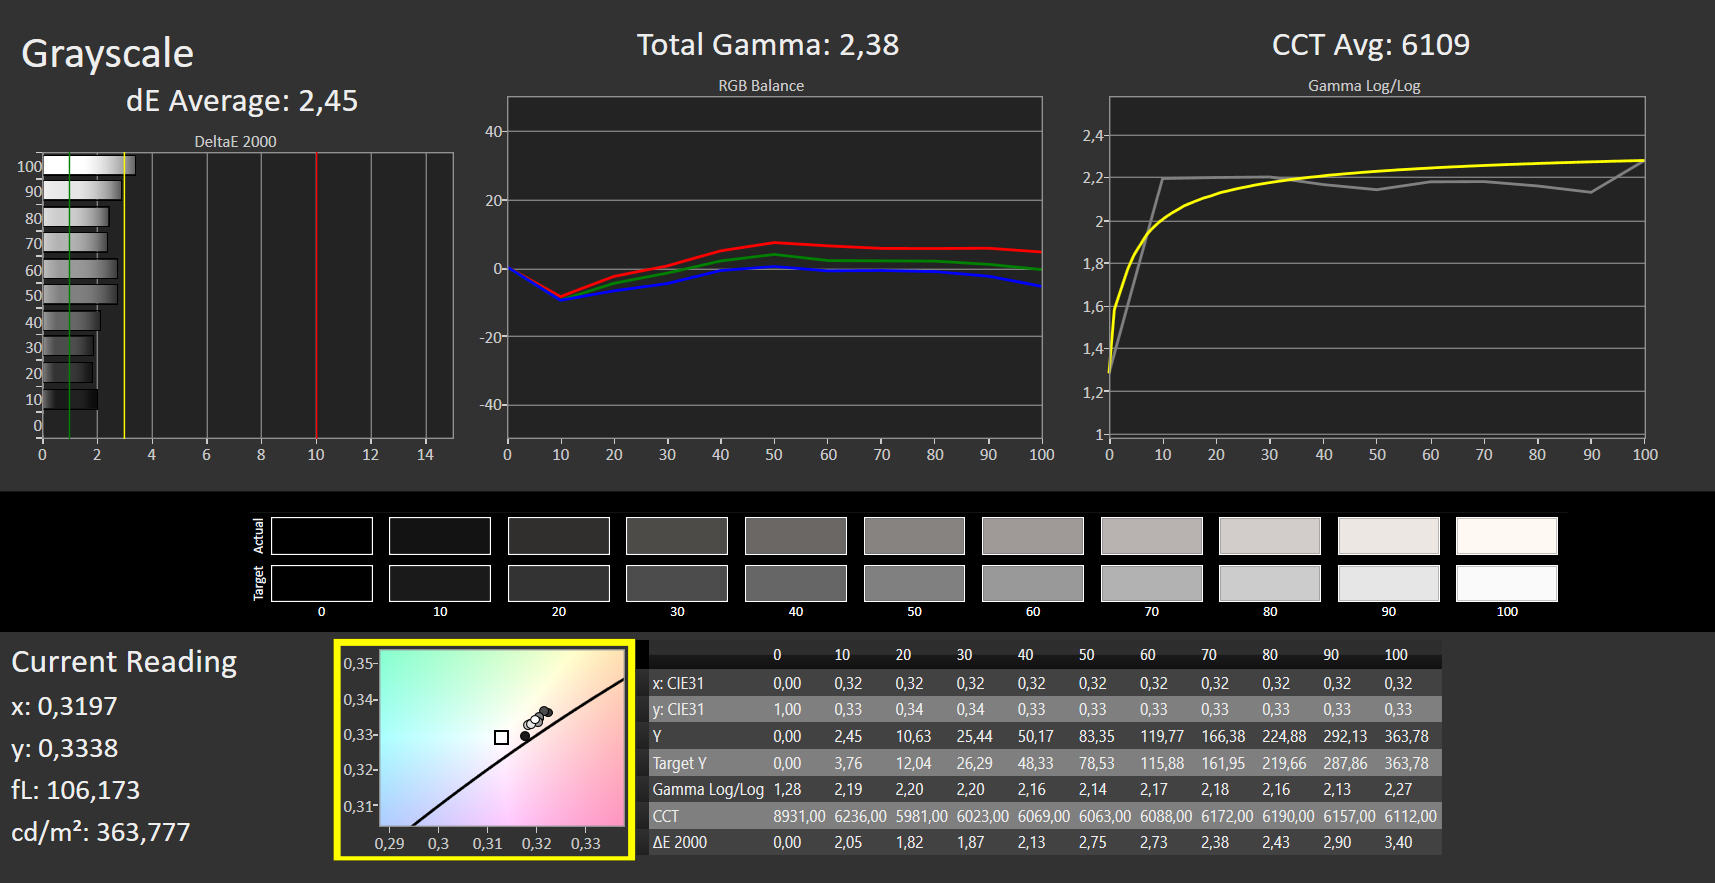
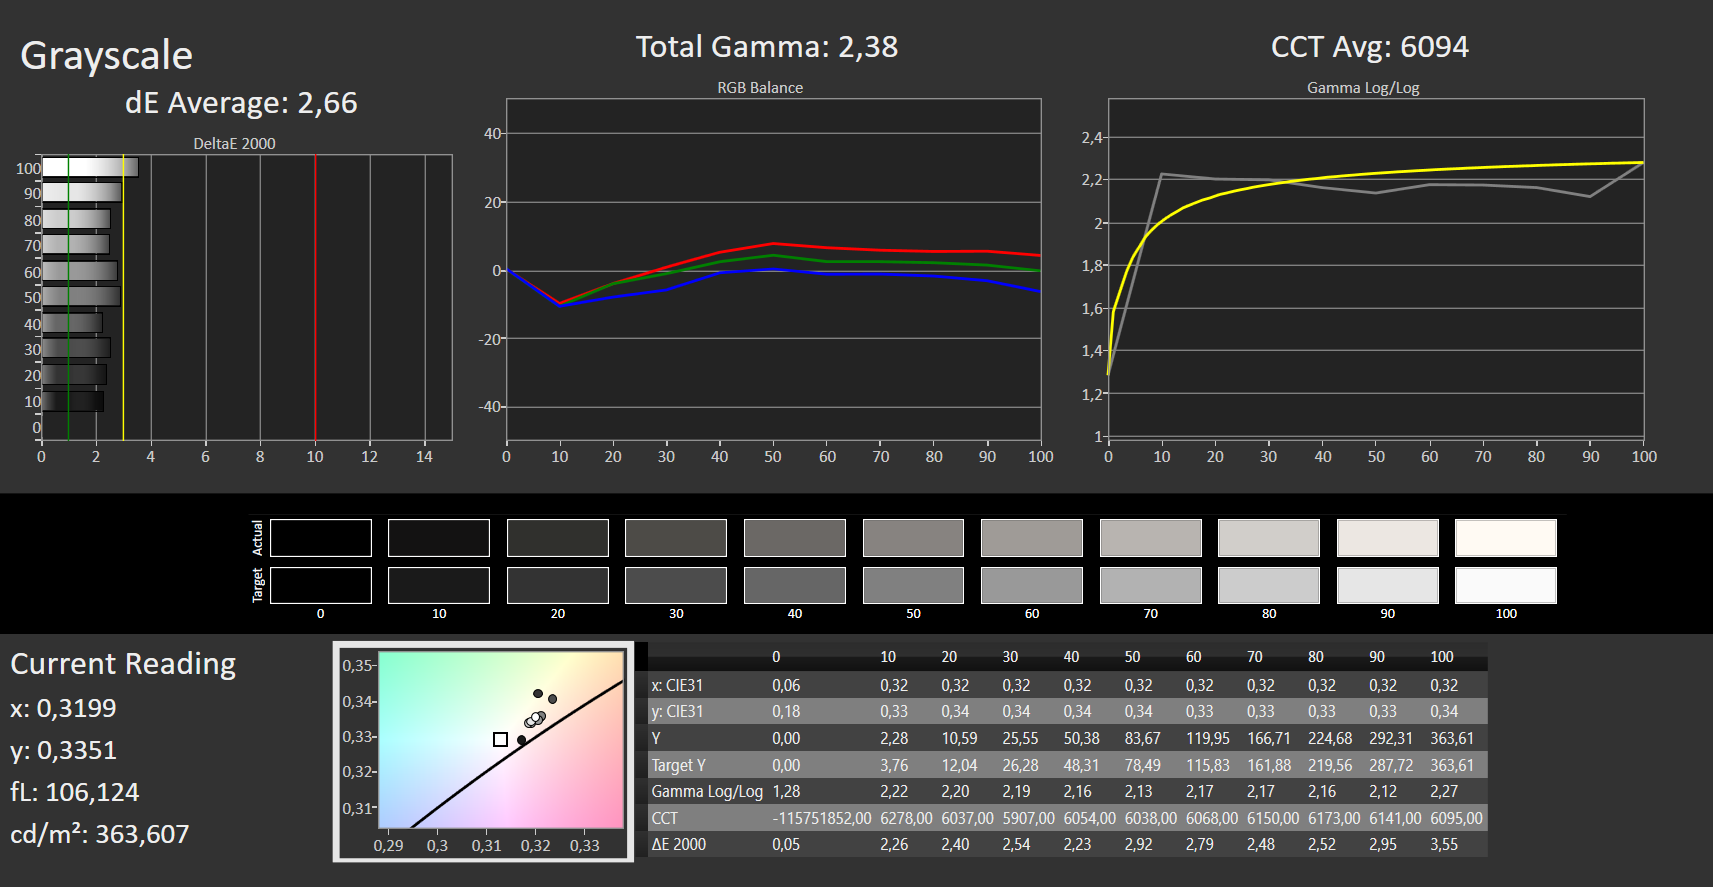
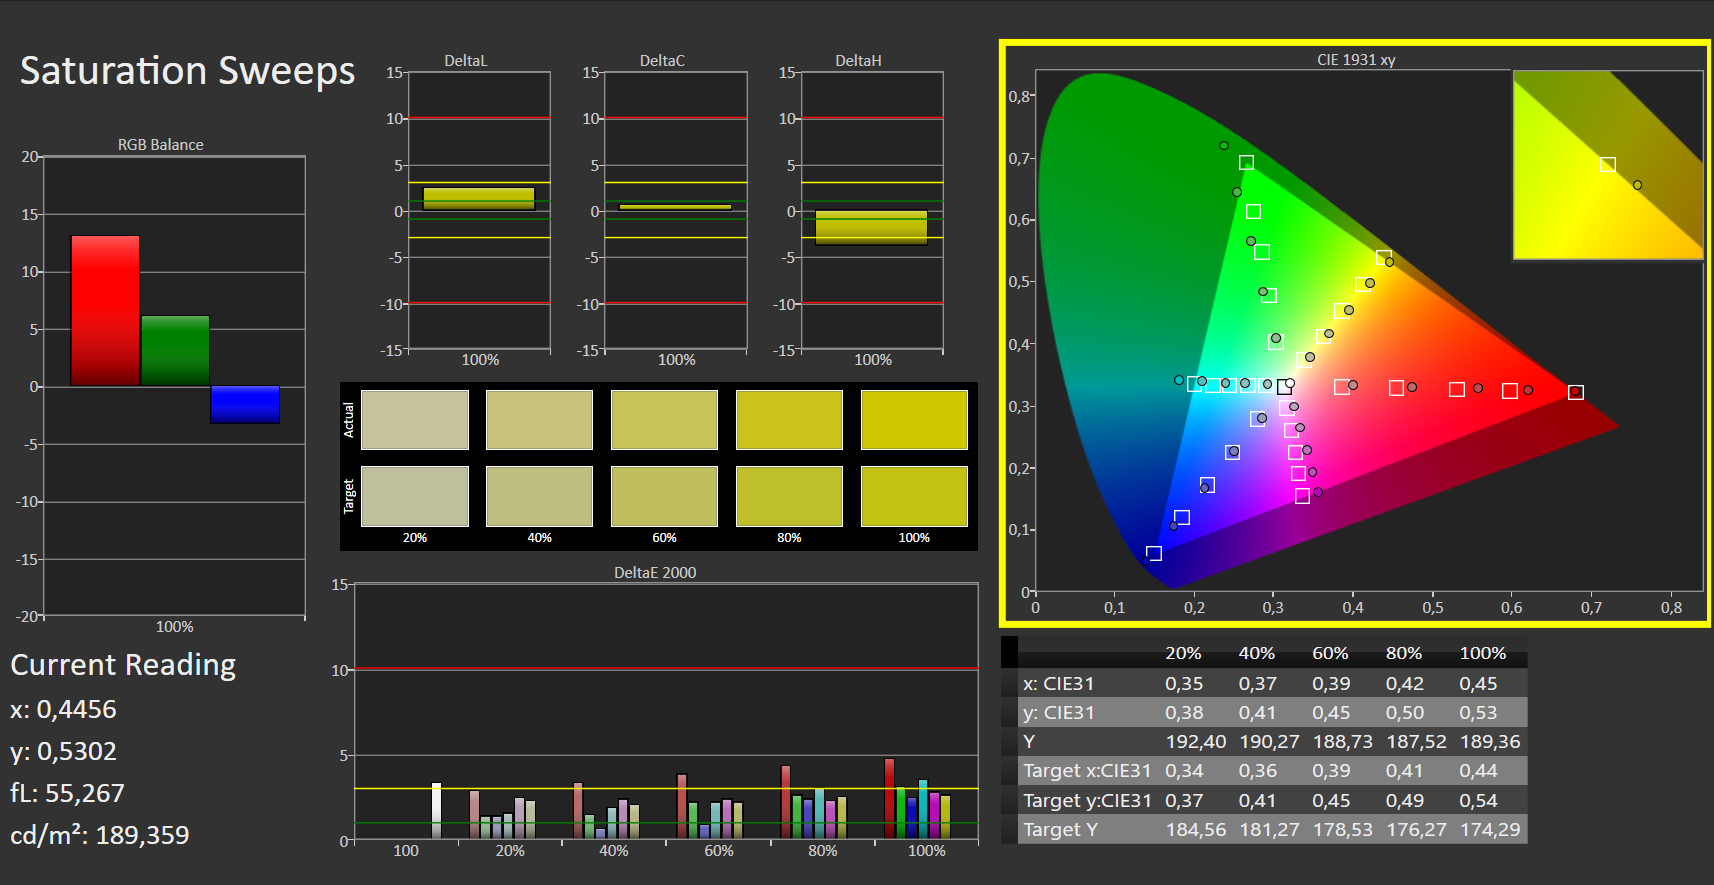
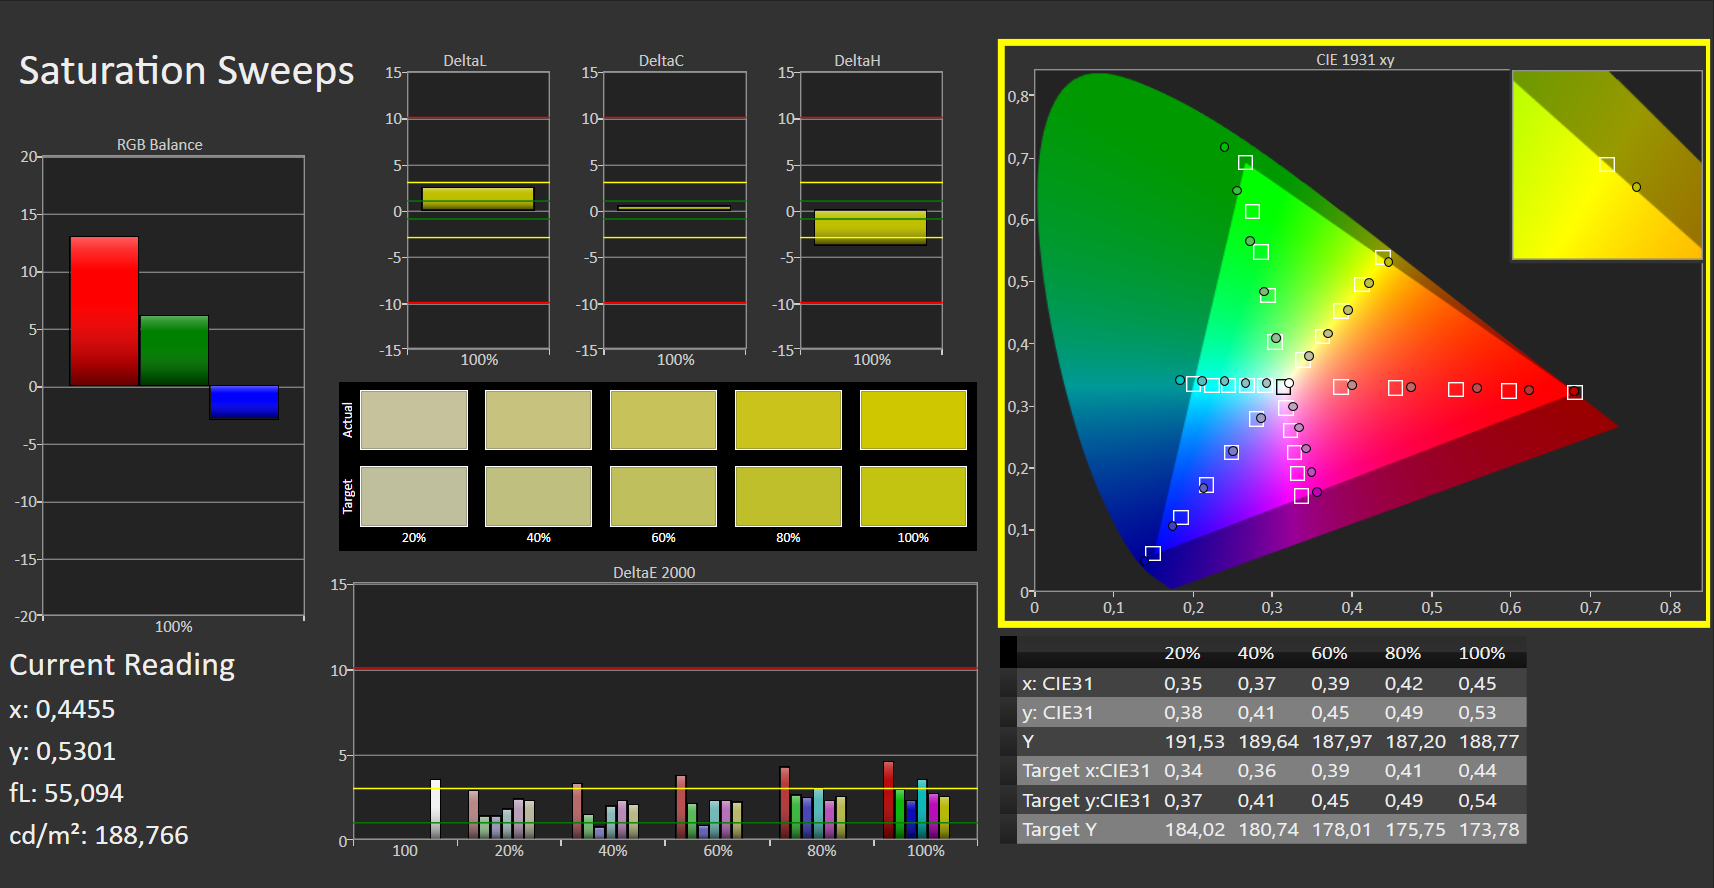
It also promises 100% of the DCI-P3 color gamut, something that we can also confirm through our measurements. Asus reports a brightness of 400 nits, while we measured 366 cd/m² on average and a maximum of 372 cd/m². Nits and cd/m² are converted 1:1, so the manufacturer's advertised brightness is narrowly missed. The brightness is homogeneously distributed, which is typical for OLEDs (97% brightness distribution).
High brightness is harmful for OLED displays anyways, so you shouldn't use it continuously. Asus responds to the issue of burn-in with an OLED screensaver that can't be disabled. It turns on after 15 minutes. Users can deactivate the screensaver after assessing the risk (warning notice). This is exclusively possible via the personal MyAsus settings. This forces the user to create an account.
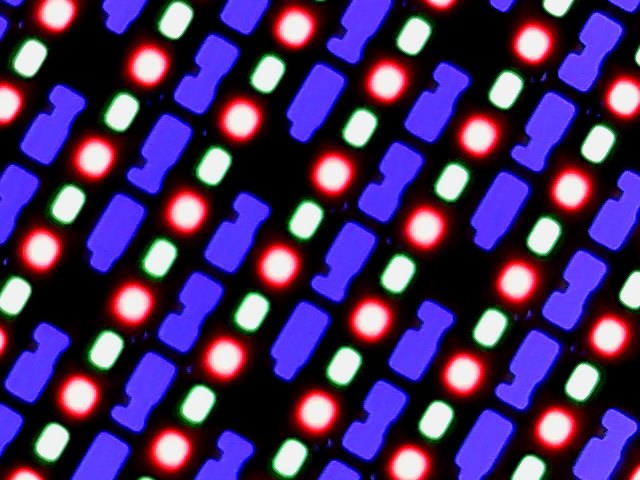
The screen-to-body ratio is 92%; that's very little bezel around a lot of display. The Samsung panel uses DC dimming to reduce brightness. This behavior can also be adjusted in MyAsus.
| |||||||||||||||||||||||||
Brightness Distribution: 97 %
Center on Battery: 363 cd/m²
Contrast: ∞:1 (Black: 0 cd/m²)
ΔE ColorChecker Calman: 2.92 | ∀{0.5-29.43 Ø4.72}
calibrated: 2.92
ΔE Greyscale Calman: 2.45 | ∀{0.09-98 Ø4.97}
98% AdobeRGB 1998 (Argyll 3D)
100% sRGB (Argyll 3D)
100% Display P3 (Argyll 3D)
Gamma: 2.38
CCT: 6109 K
| Asus ZenBook 14X UM5401QA-KN162 Samsung SDC4154 ATNA40YK04-0, OLED, 2880x1800, 14" | Dell XPS 13 9310 OLED Samsung 134XK01, OLED, 3456x2160, 13.4" | Asus ZenBook 14X OLED UX5400EA-L7154W Samsung SDC415B ATNA40YN04-0, OLED, 2880x1800, 14" | HP Envy 14-eb0010nr AU Optronics AUOF392, IPS, 1920x1200, 14" | Asus Vivobook Pro 14 M3401QC-KM007T SAMSUNG: SDC4171, OLED, 2880x1800, 14" | Lenovo Yoga Slim 7 Pro 14 OLED Ryzen 9 LEN140WQ+, OLED, 2880x1800, 14" | MSI Modern 14 B11SB-085 BOE CQ NV140FHM-N4V, IPS, 1920x1080, 14" | |
|---|---|---|---|---|---|---|---|
| Display | 0% | 0% | -15% | -1% | 0% | -53% | |
| Display P3 Coverage (%) | 100 | 99.7 0% | 100 0% | 77.1 -23% | 99.41 -1% | 99.9 0% | 39.9 -60% |
| sRGB Coverage (%) | 100 | 100 0% | 100 0% | 99.8 0% | 99.94 0% | 100 0% | 58.8 -41% |
| AdobeRGB 1998 Coverage (%) | 98 | 97.7 0% | 98 0% | 76.7 -22% | 94.79 -3% | 97.6 0% | 41.2 -58% |
| Response Times | 9% | 17% | -2197% | -25% | 0% | -792% | |
| Response Time Grey 50% / Grey 80% * (ms) | 2 ? | 2.2 ? -10% | 2 ? -0% | 61.2 ? -2960% | 3 ? -50% | 2.4 ? -20% | 25 ? -1150% |
| Response Time Black / White * (ms) | 3 ? | 2.2 ? 27% | 2 ? 33% | 46 ? -1433% | 3 ? -0% | 2.4 20% | 16 ? -433% |
| PWM Frequency (Hz) | 120 ? | 240.4 ? | 240 ? | 360 | 362.3 ? | 92 ? | |
| Screen | -14% | 17% | 18% | 24% | 14% | -49% | |
| Brightness middle (cd/m²) | 363 | 384 6% | 345 -5% | 412 13% | 384 6% | 399 10% | 347 -4% |
| Brightness (cd/m²) | 367 | 387 5% | 348 -5% | 392 7% | 385 5% | 401 9% | 311 -15% |
| Brightness Distribution (%) | 97 | 97 0% | 98 1% | 81 -16% | 98 1% | 98 1% | 81 -16% |
| Black Level * (cd/m²) | 0.32 | 0.07 | 0.001 | 0.12 | |||
| Colorchecker dE 2000 * | 2.92 | 4.56 -56% | 1.92 34% | 1.88 36% | 1.75 40% | 2.5 14% | 5.05 -73% |
| Colorchecker dE 2000 max. * | 5.34 | 7.27 -36% | 4.72 12% | 3.06 43% | 3.41 36% | 4.6 14% | 16.98 -218% |
| Colorchecker dE 2000 calibrated * | 2.92 | 4.52 -55% | 1.96 33% | 2.32 21% | 2.2 25% | ||
| Greyscale dE 2000 * | 2.45 | 1.5 39% | 0.85 65% | 2.2 10% | 1.06 57% | 1.8 27% | 1.63 33% |
| Gamma | 2.38 92% | 2.26 97% | 2.37 93% | 2.1 105% | 2.39 92% | 2.17 101% | 2.3 96% |
| CCT | 6109 106% | 6219 105% | 6475 100% | 6650 98% | 6440 101% | 6368 102% | 6666 98% |
| Color Space (Percent of AdobeRGB 1998) (%) | 87.1 | 68.7 | 38 | ||||
| Color Space (Percent of sRGB) (%) | 100 | 99.8 | 58 | ||||
| Contrast (:1) | 1288 | 5486 | 399000 | 2892 | |||
| Total Average (Program / Settings) | -2% /
-7% | 11% /
12% | -731% /
-359% | -1% /
9% | 5% /
8% | -298% /
-185% |
* ... smaller is better
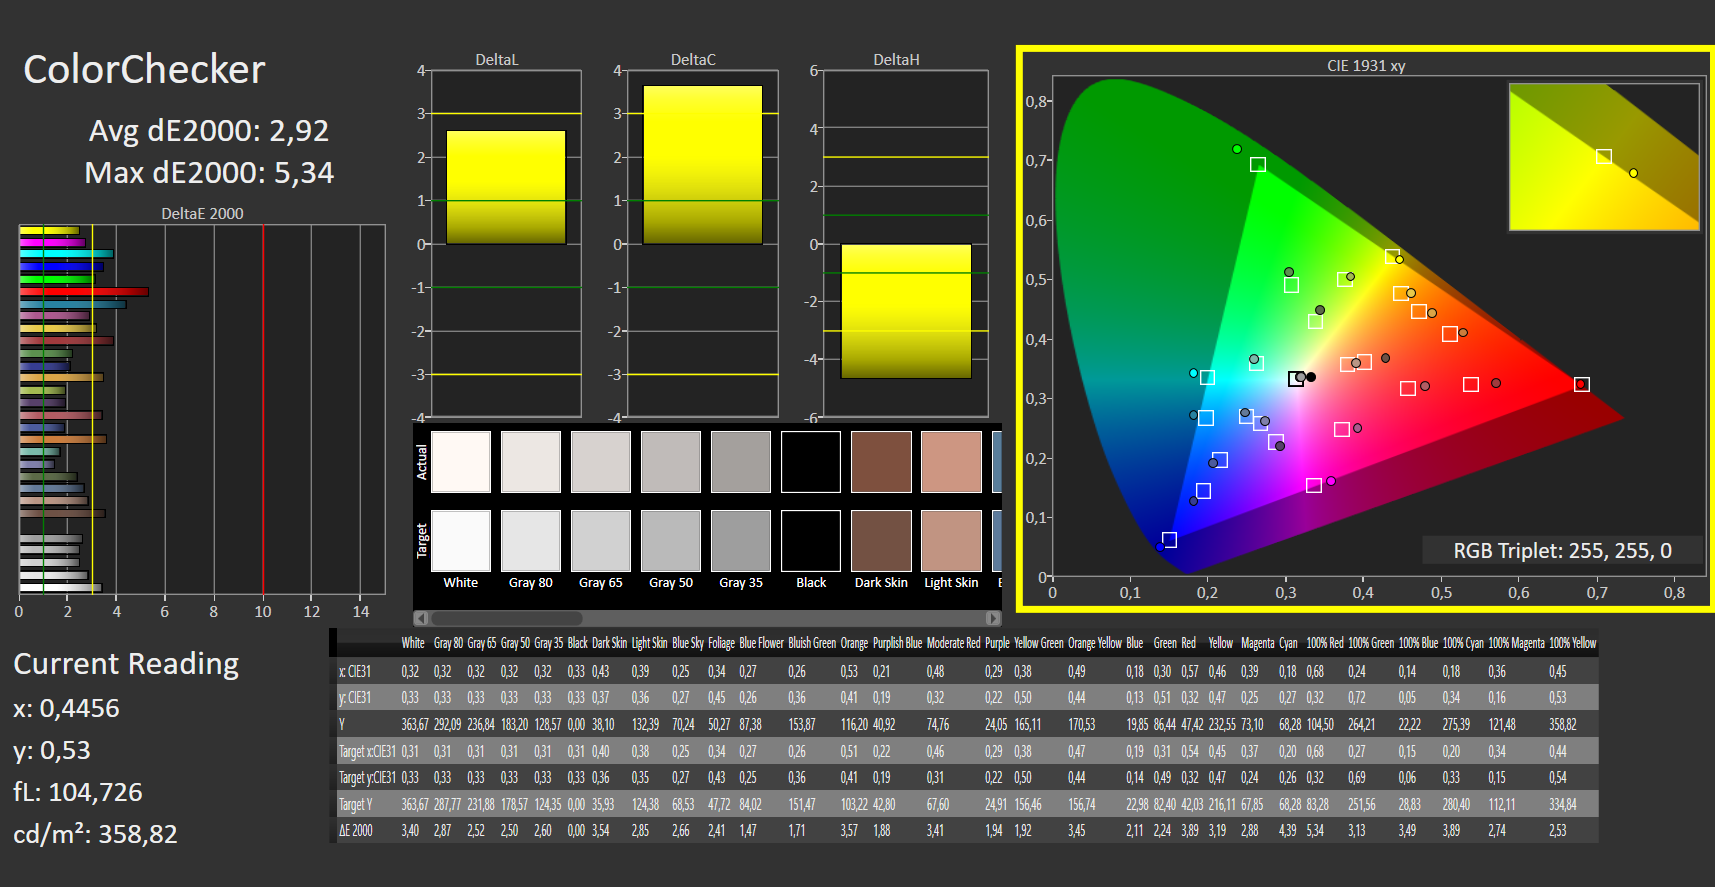
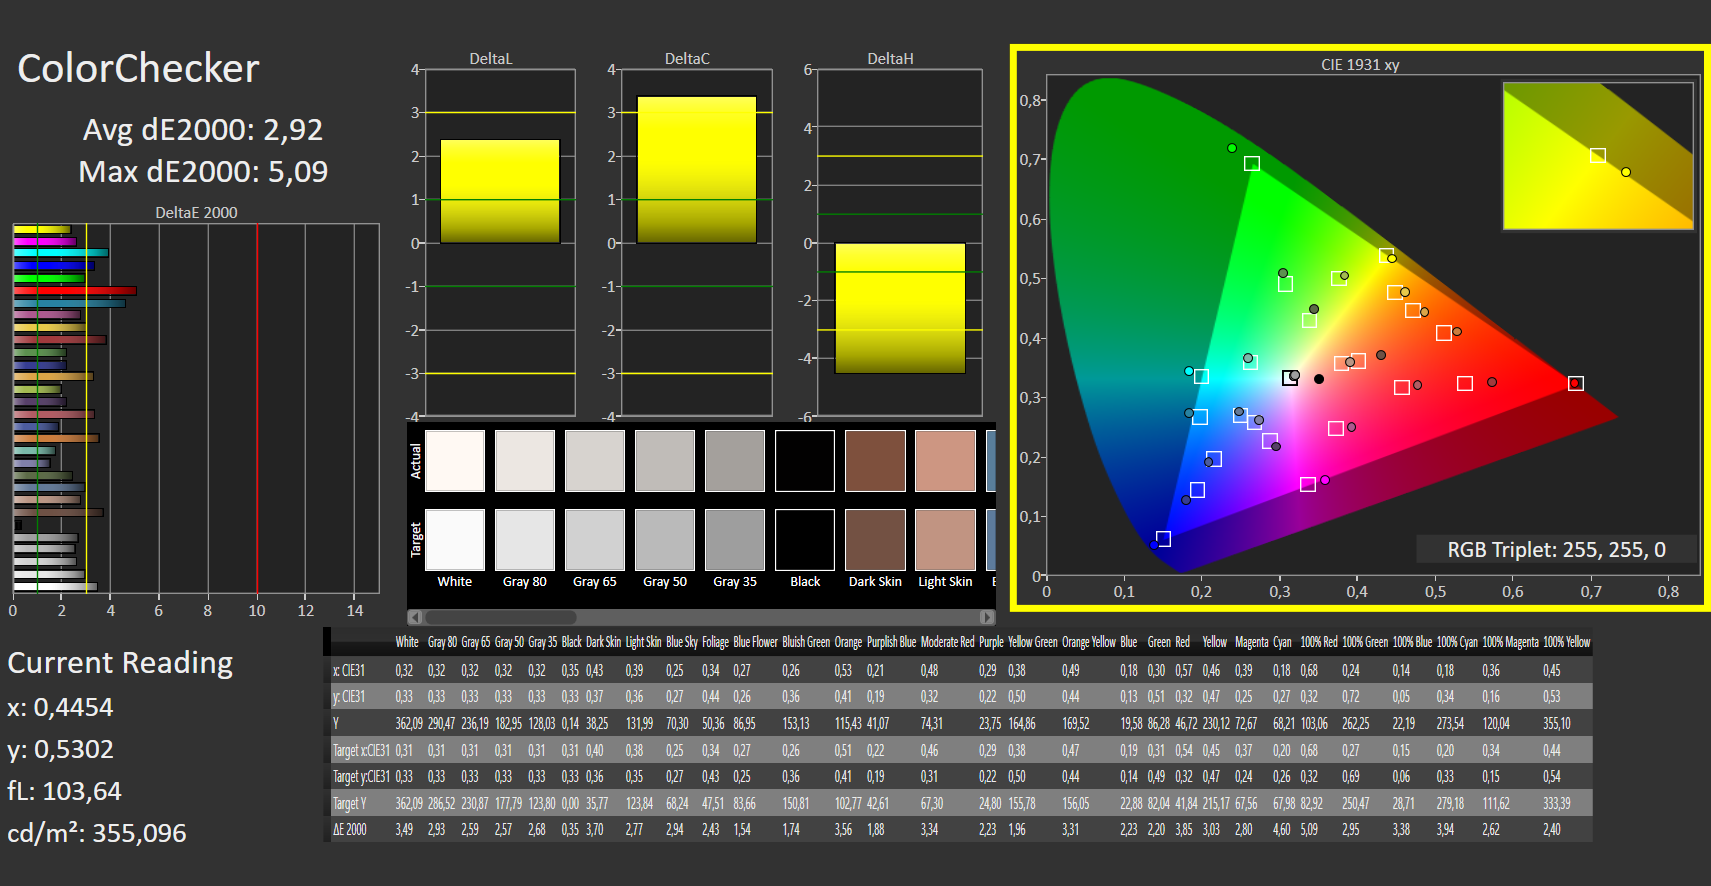
As expected, the OLED display exhibits an outstanding contrast (∞:1); blacks are deep black, and colors are vibrant. As is typical for OLEDs, response times are also excellent. MyAsus handles the matters of color and OLED.
We determined the DeltaE values of the grayscale and colors to be 2.5 and 2.9, respectively, before calibration - these are good rates because they're below 3.0. Calibration doesn't improve the results.
Display Response Times
| ↔ Response Time Black to White | ||
|---|---|---|
| 3 ms ... rise ↗ and fall ↘ combined | ↗ 2 ms rise |  |
| ↘ 1 ms fall | ||
| The screen shows very fast response rates in our tests and should be very well suited for fast-paced gaming. In comparison, all tested devices range from 0.1 (minimum) to 240 (maximum) ms. » 15 % of all devices are better. This means that the measured response time is better than the average of all tested devices (19.8 ms). | ||
| ↔ Response Time 50% Grey to 80% Grey | ||
| 2 ms ... rise ↗ and fall ↘ combined | ↗ 1 ms rise |  |
| ↘ 1 ms fall | ||
| The screen shows very fast response rates in our tests and should be very well suited for fast-paced gaming. In comparison, all tested devices range from 0.165 (minimum) to 636 (maximum) ms. » 10 % of all devices are better. This means that the measured response time is better than the average of all tested devices (31 ms). | ||
Screen Flickering / PWM (Pulse-Width Modulation)
| Screen flickering / PWM detected | 120 Hz | ≤ 50 % brightness setting |      |
The display backlight flickers at 120 Hz (worst case, e.g., utilizing PWM) Flickering detected at a brightness setting of 50 % and below. There should be no flickering or PWM above this brightness setting. The frequency of 120 Hz is very low, so the flickering may cause eyestrain and headaches after extended use. In comparison: 52 % of all tested devices do not use PWM to dim the display. If PWM was detected, an average of 7750 (minimum: 5 - maximum: 343500) Hz was measured. | |||
PWM for brightness reduction is used at 360 Hz for brightness levels from 0 to 5 (for 10, see upper and lower images); above that, DC dimming is used (no image, line instead of waves). This technology is an alternative to PWM, where pixels are switched off for a short time. DC dimming reduces voltage, which is why the pixel emits less brightness. Below 60% brightness, DC dimming would cause a significant deterioration of color reproduction, which is why the OLED panel uses PWM here (360 Hz). Sensitive users might be affected by this, although we rarely set the brightness below 60% in practice. In a normal office environment with daylight, we used a brightness of 70%-80%. The user can adjust the display's dimming level with the "Flicker-free OLED dimming" option.
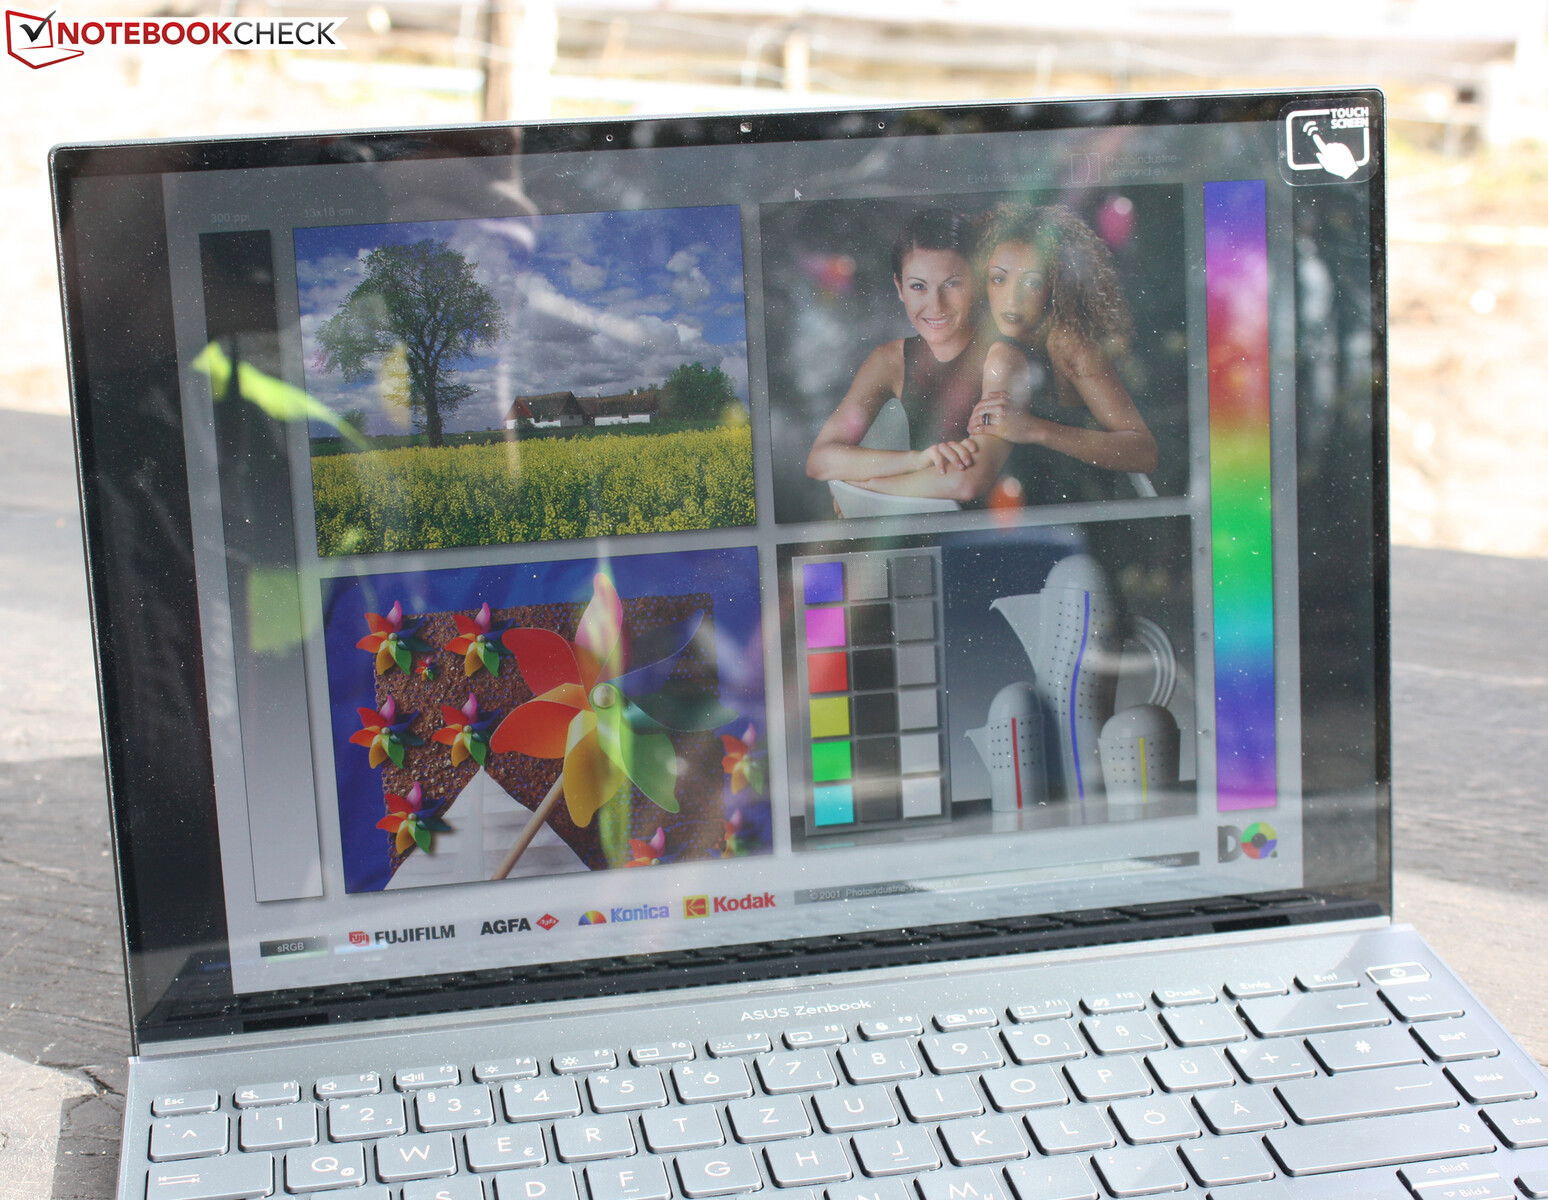
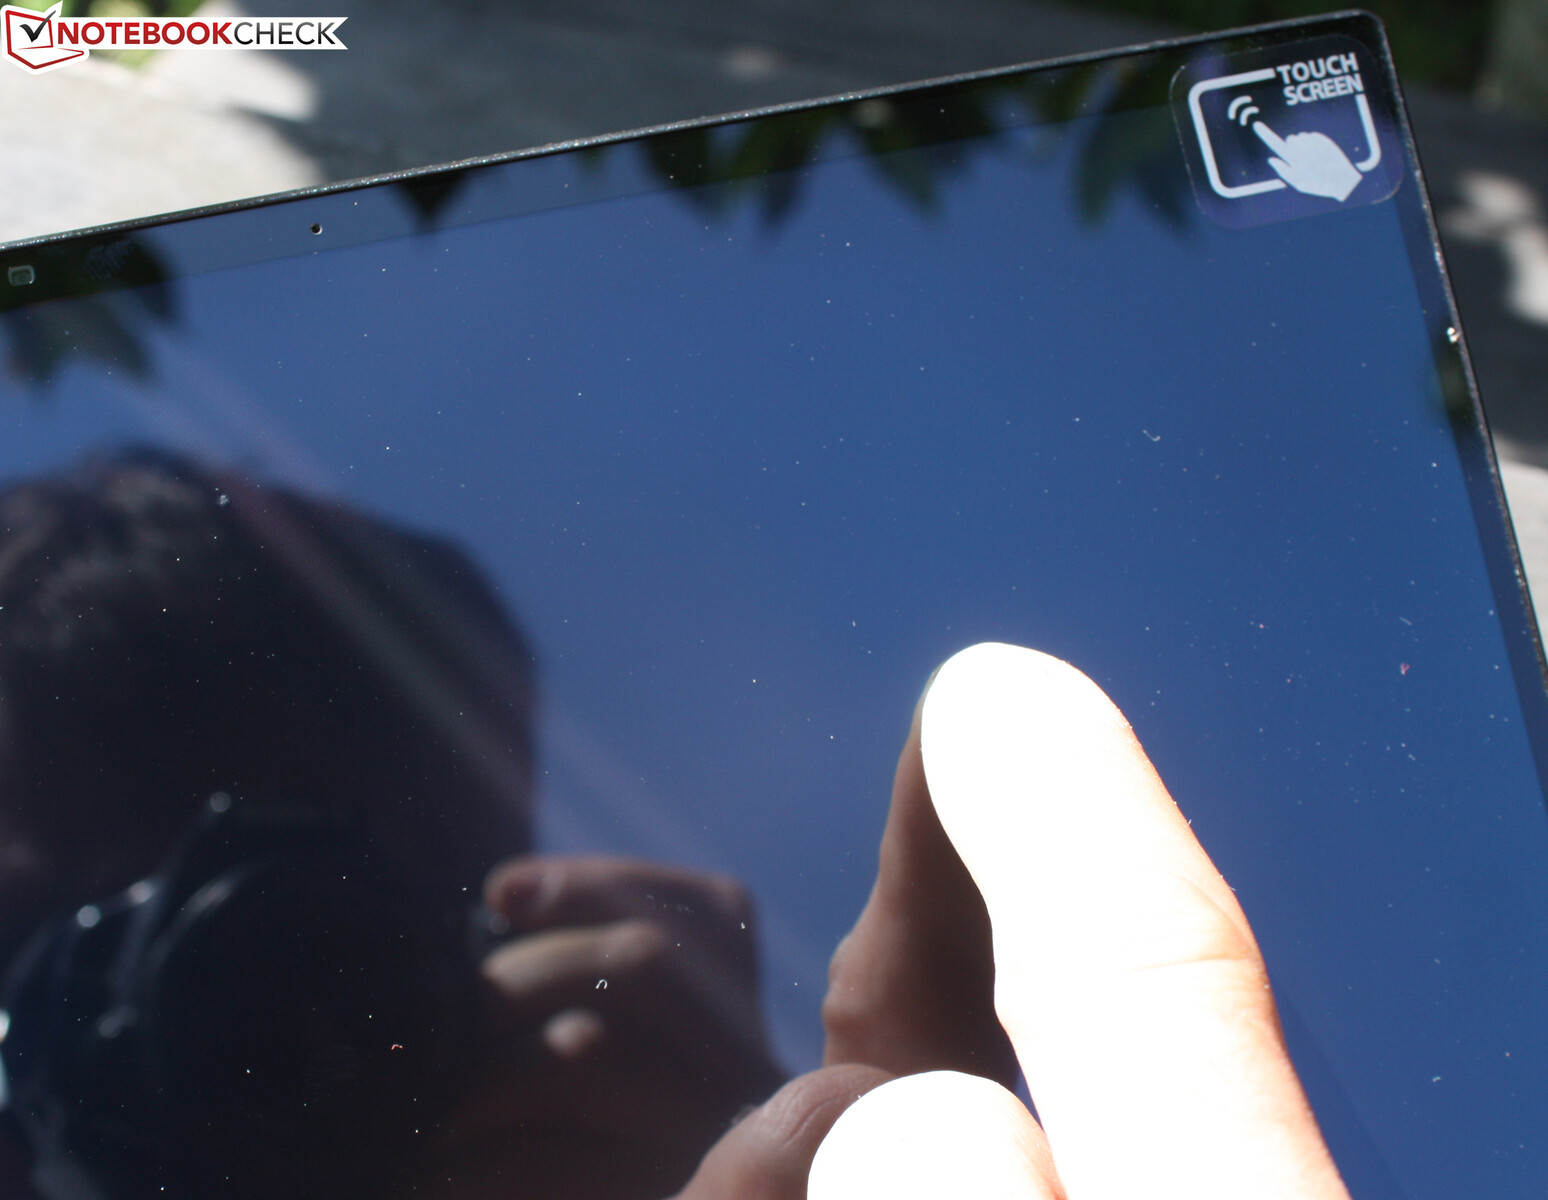
The glare-type surface suffers from reflections outdoors, and even the good brightness doesn't help much. The panel can be used well in shady areas, also because the brightness isn't reduced on battery power (363 cd/m² at the center of the screen).
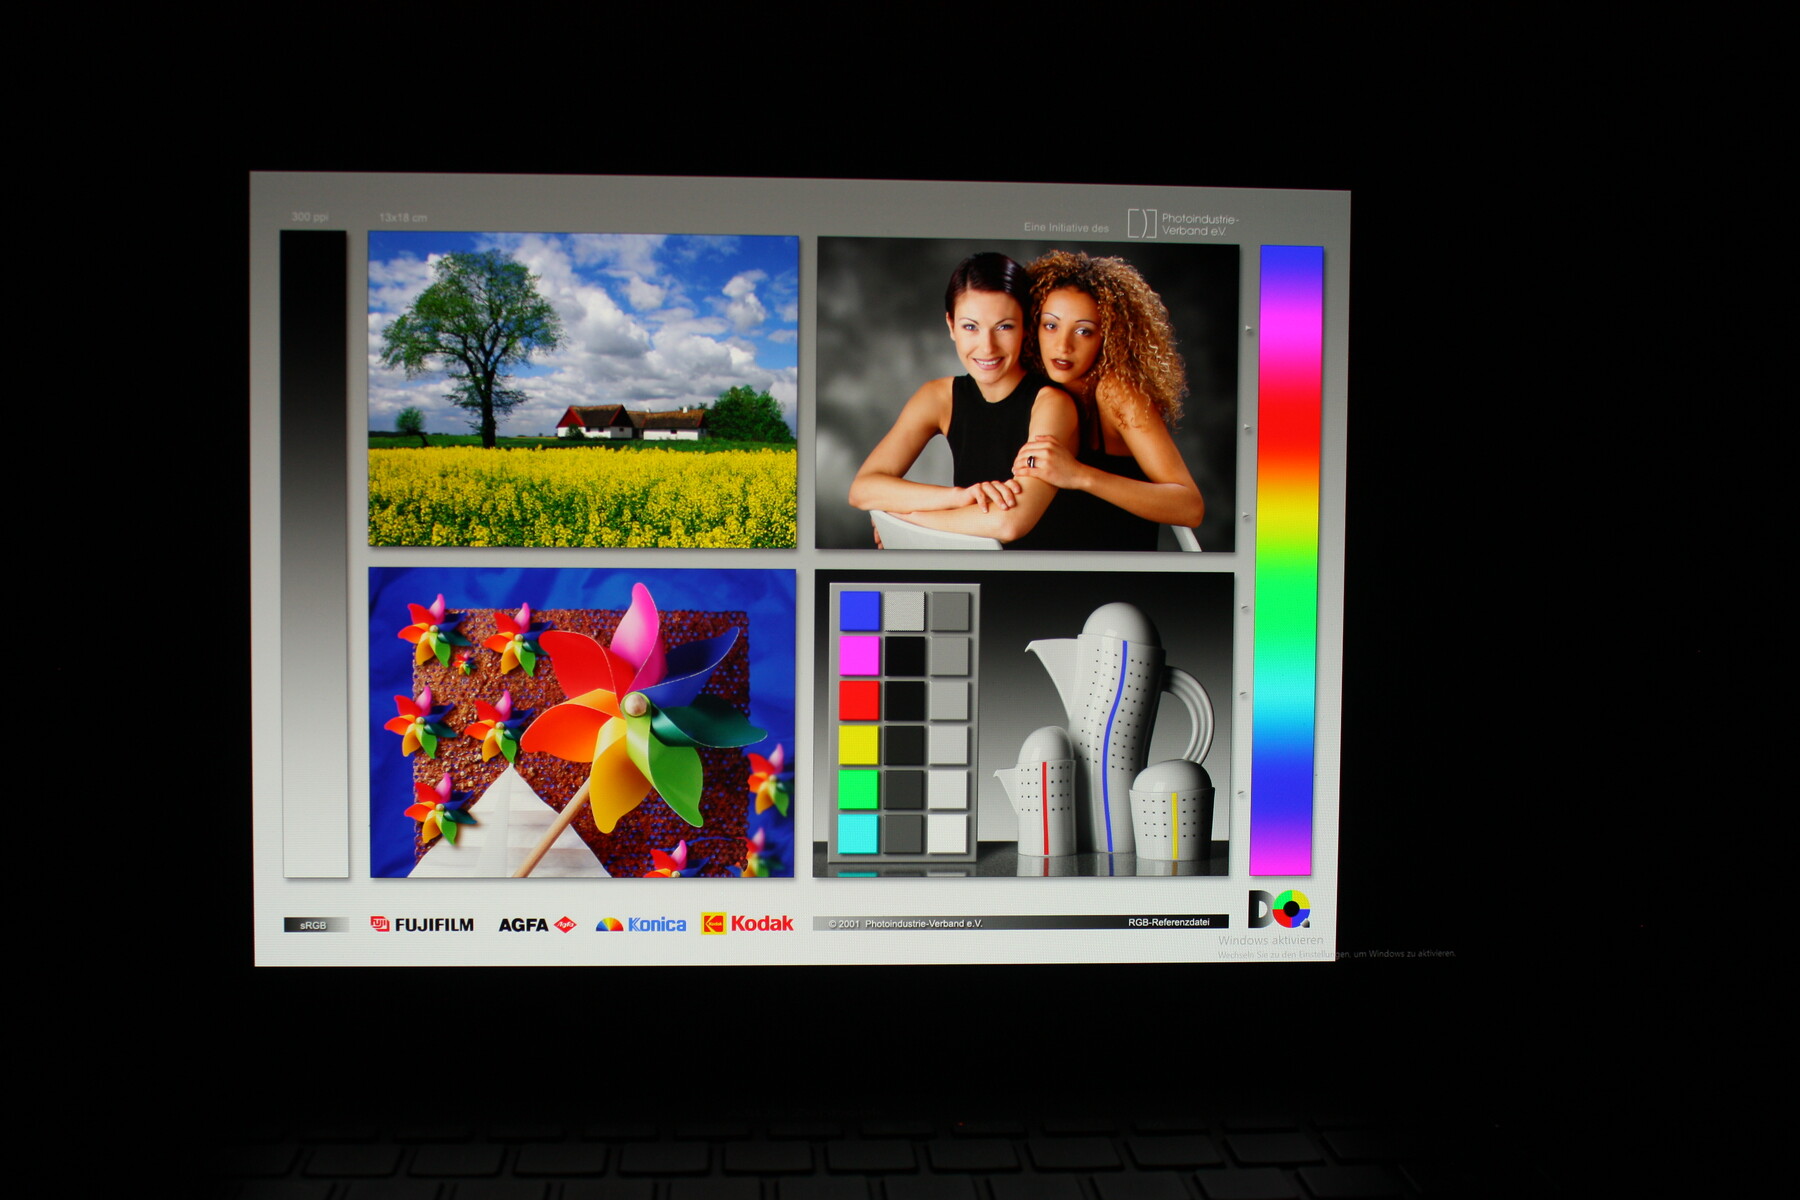
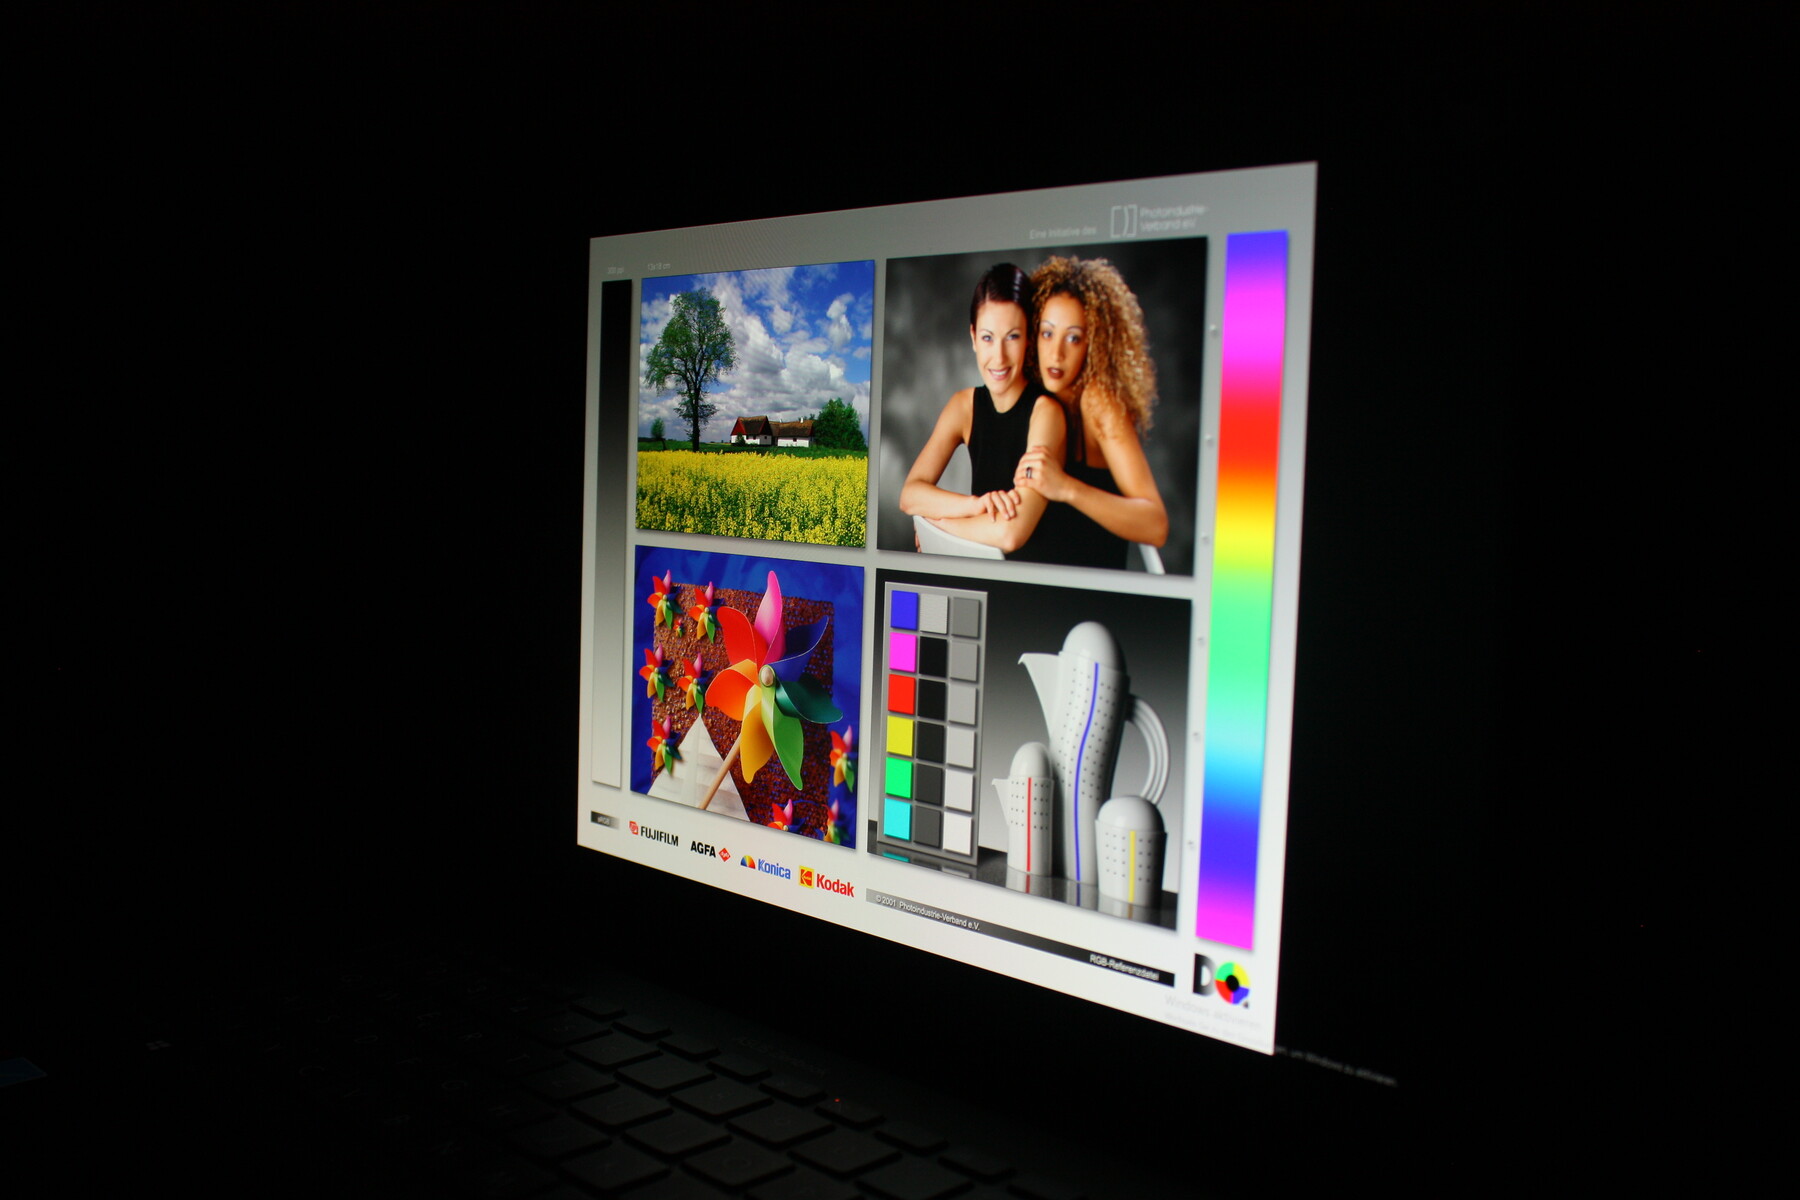
Without a doubt, the viewing angles of OLED panels are the best available. Colors remain stable even from flat angles, and the brightness doesn't lose intensity.
Performance - Greater boost thanks to AMD Ryzen
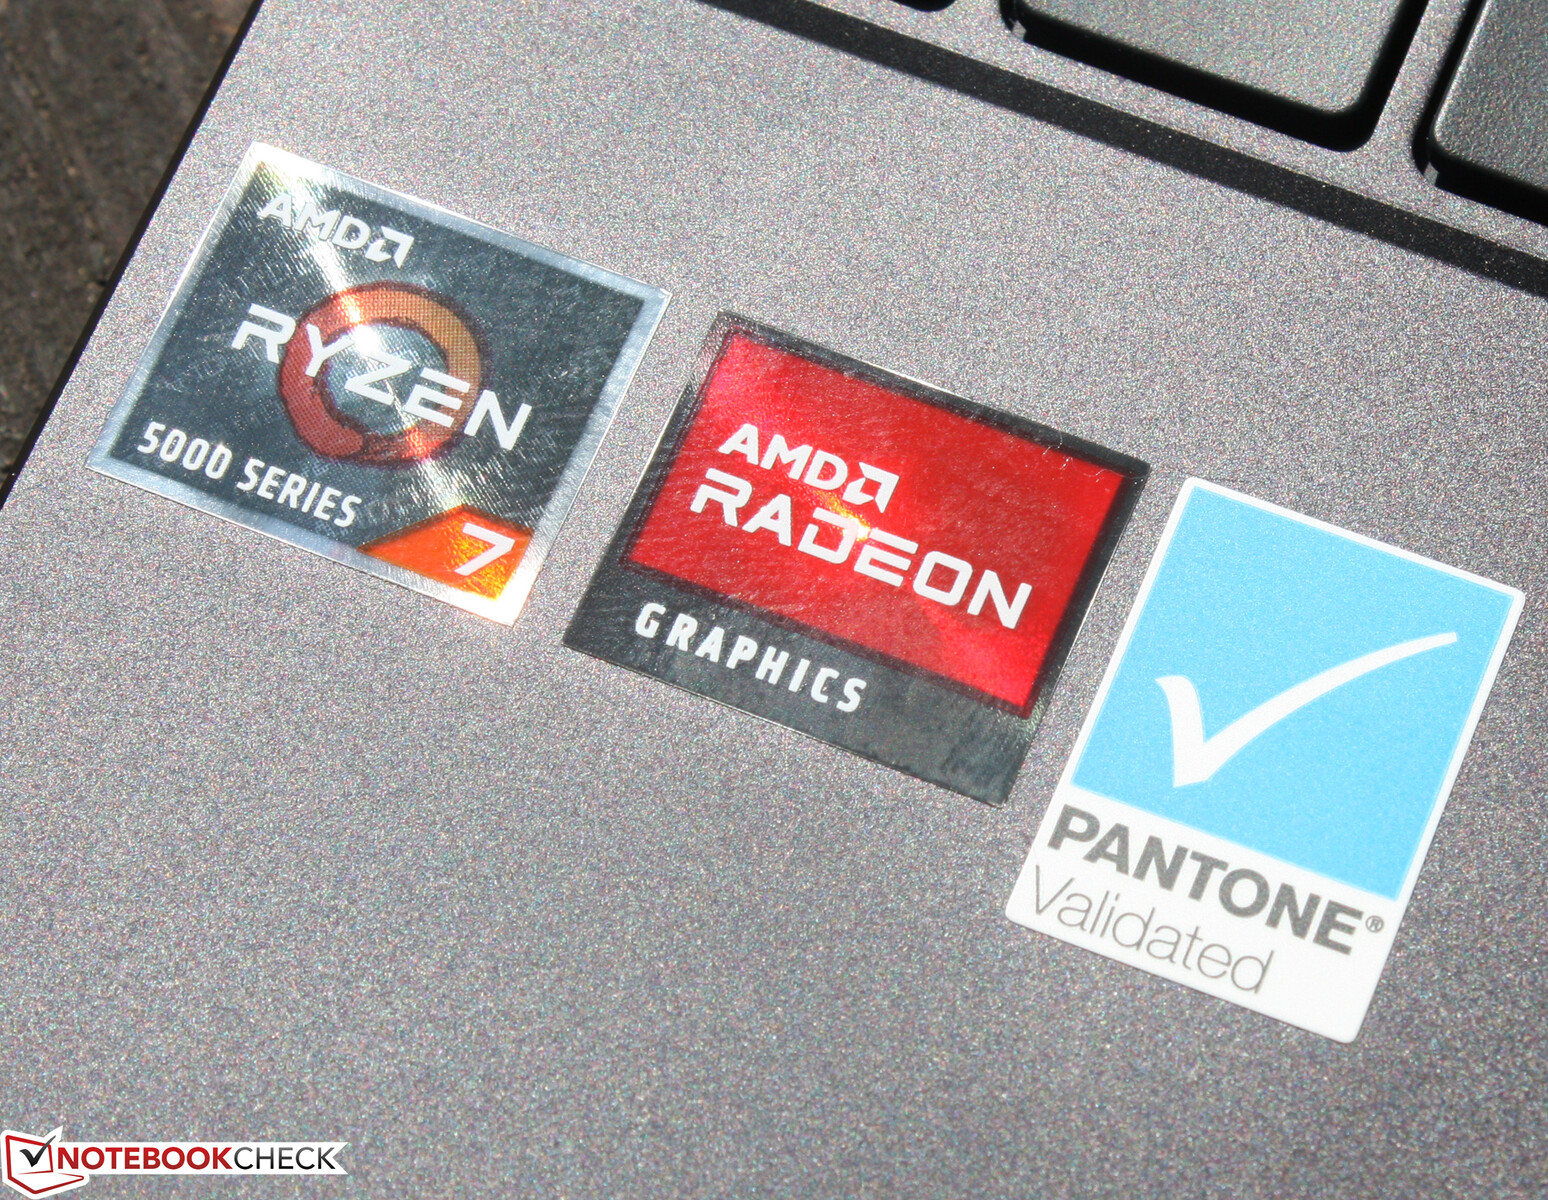
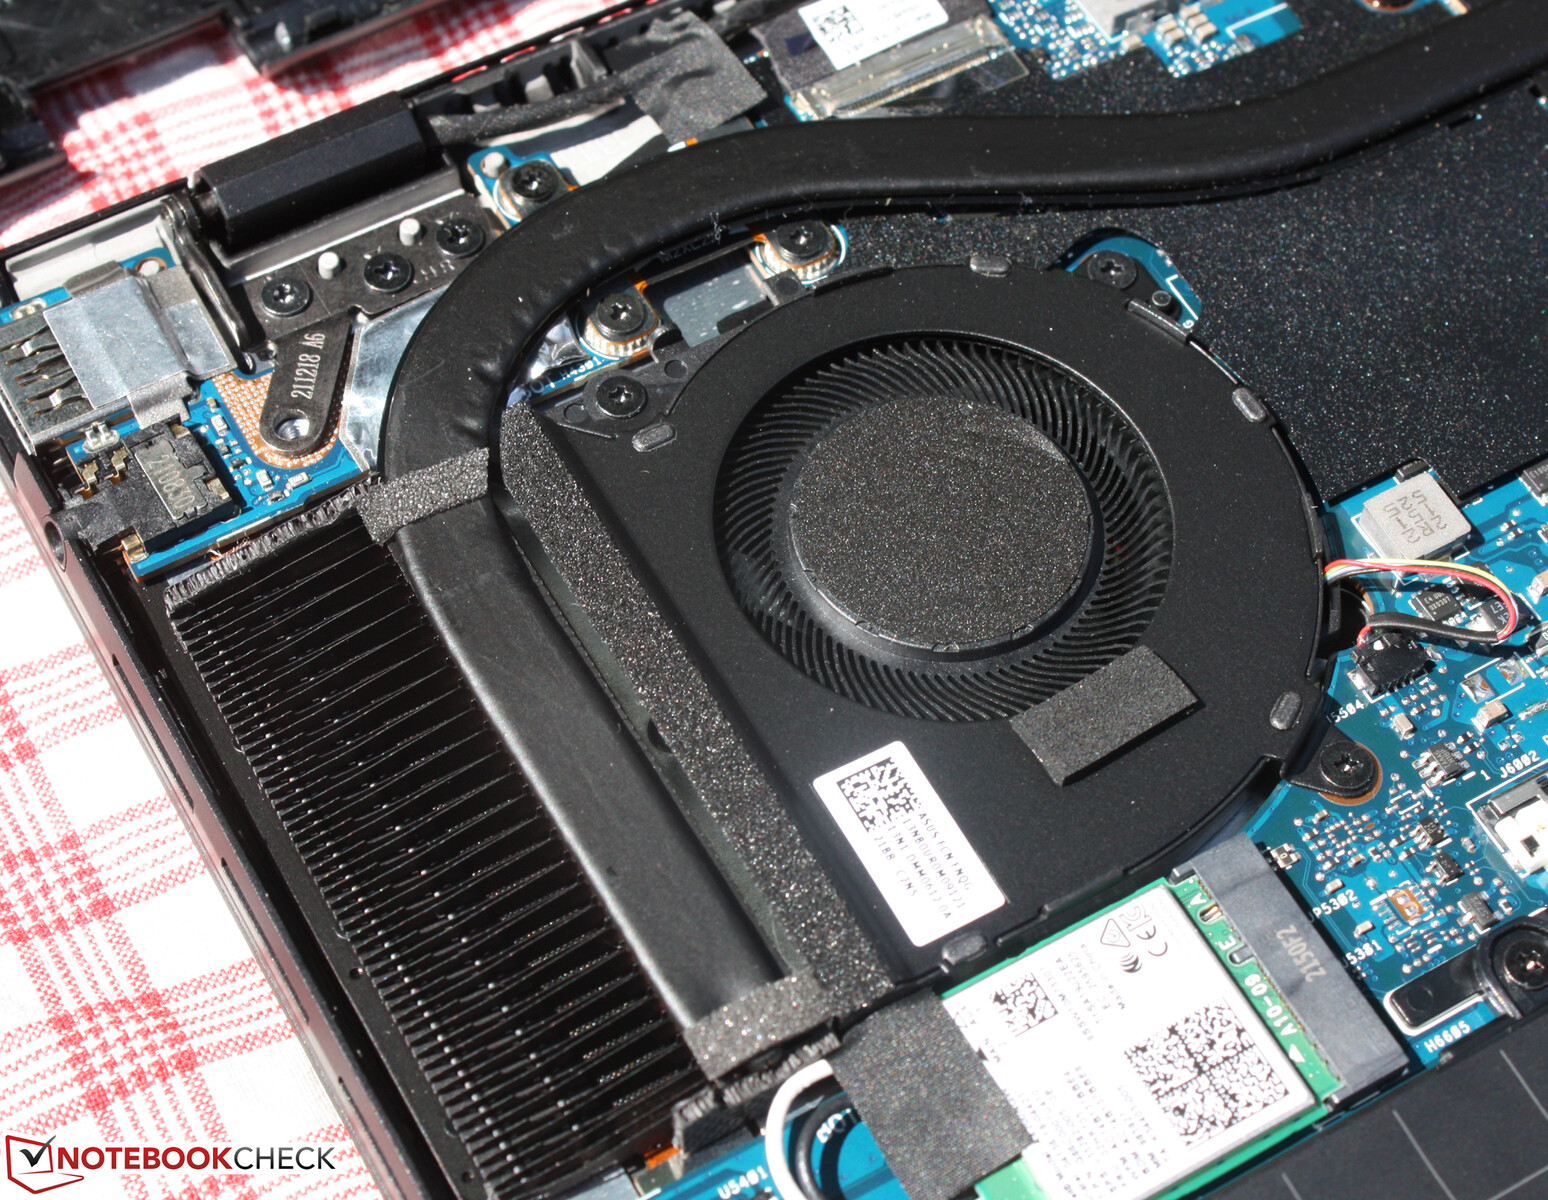
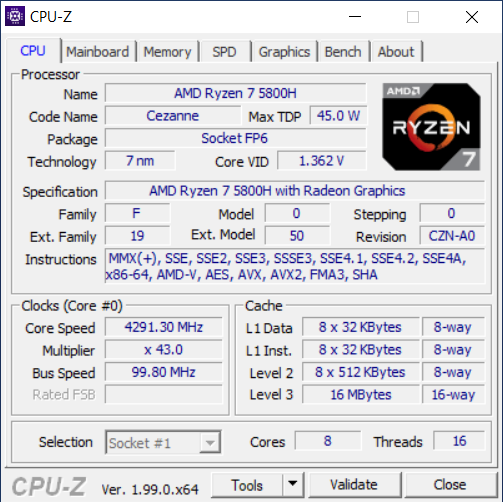
The Ryzen 7 5800H is a processor for large laptops, but that doesn't stop Asus from putting it in a 14-inch device. However, the processor enjoys the luxury of a dual fan, which is unusual for laptop SOCs that don't have dedicated graphics. The chip includes eight Zen 3 cores running at up to 4.4 GHz. The 5800H is the only chip option, excluding the Intel version. Even the 16 GB of RAM (onboard) and the 512 GB SSD seem to be standard; there are no other options.
Test conditions
Three different performance modes can be selected in the MyASUS app. Performance mode, Standard mode, and Whisper mode are available here. Performance mode is only available with an external power source. Depending on the test requirements, we selected different performance modes. In this way, the benchmarks were performed in Performance mode. The battery endurance under load and the energy measurements under average load were carried out in Standard mode. Whisper mode was selected for the battery runtime measurement and the idle energy measurements. The maximum energy consumption was measured in Performance mode. All three performance modes were also tested for noise emissions.
Processor
The AMD Ryzen 7 5800H is a powerful mobile processor with eight cores and 16 threads. In everyday use, the Ryzen 7 can easily handle all loads. In the performance benchmarks, the processor shows the high multi-core performance that typical for AMD, while it's on par with Intel's processors in single-core benchmarks.
In this respect, the AMD processor maintains its high performance even under prolonged load, as the Cinebench R15 loop shows. However, there are some laptops with the AMD Ryzen 7 5800H in our database that draw more performance from the processor (-8% compared to the average). In this Zenbook, the Ryzen 7 is allowed to run at 45 watts even over longer distances, depending on the performance mode. On battery power, the system only allows the processor to run at 24 watts.
Cinebench R15 Multi endurance test
Cinebench R23: Multi Core | Single Core
Cinebench R20: CPU (Multi Core) | CPU (Single Core)
Cinebench R15: CPU Multi 64Bit | CPU Single 64Bit
Blender: v2.79 BMW27 CPU
7-Zip 18.03: 7z b 4 | 7z b 4 -mmt1
Geekbench 5.5: Multi-Core | Single-Core
HWBOT x265 Benchmark v2.2: 4k Preset
LibreOffice : 20 Documents To PDF
R Benchmark 2.5: Overall mean
| CPU Performance rating | |
| Average of class Subnotebook | |
| Average AMD Ryzen 7 5800H | |
| Lenovo Yoga Slim 7 Pro 14 OLED Ryzen 9 | |
| Asus ZenBook 14X UM5401QA-KN162 | |
| Asus Vivobook Pro 14 M3401QC-KM007T | |
| MSI Modern 14 B11SB-085 | |
| Asus ZenBook 14X OLED UX5400EA-L7154W | |
| HP Envy 14-eb0010nr | |
| Dell XPS 13 9310 OLED | |
| Cinebench R23 / Multi Core | |
| Average of class Subnotebook (1555 - 21812, n=59, last 2 years) | |
| Average AMD Ryzen 7 5800H (8812 - 13214, n=29) | |
| Lenovo Yoga Slim 7 Pro 14 OLED Ryzen 9 | |
| Asus ZenBook 14X UM5401QA-KN162 | |
| Asus Vivobook Pro 14 M3401QC-KM007T | |
| HP Envy 14-eb0010nr | |
| Asus ZenBook 14X OLED UX5400EA-L7154W | |
| MSI Modern 14 B11SB-085 | |
| Dell XPS 13 9310 OLED | |
| Cinebench R23 / Single Core | |
| Average of class Subnotebook (358 - 2213, n=60, last 2 years) | |
| MSI Modern 14 B11SB-085 | |
| Lenovo Yoga Slim 7 Pro 14 OLED Ryzen 9 | |
| Dell XPS 13 9310 OLED | |
| Asus ZenBook 14X OLED UX5400EA-L7154W | |
| Asus ZenBook 14X UM5401QA-KN162 | |
| Average AMD Ryzen 7 5800H (1294 - 1441, n=29) | |
| HP Envy 14-eb0010nr | |
| Asus Vivobook Pro 14 M3401QC-KM007T | |
| Cinebench R20 / CPU (Multi Core) | |
| Average of class Subnotebook (579 - 8541, n=56, last 2 years) | |
| Average AMD Ryzen 7 5800H (3430 - 5020, n=31) | |
| Lenovo Yoga Slim 7 Pro 14 OLED Ryzen 9 | |
| Asus ZenBook 14X UM5401QA-KN162 | |
| Asus Vivobook Pro 14 M3401QC-KM007T | |
| HP Envy 14-eb0010nr | |
| Asus ZenBook 14X OLED UX5400EA-L7154W | |
| MSI Modern 14 B11SB-085 | |
| Dell XPS 13 9310 OLED | |
| Cinebench R20 / CPU (Single Core) | |
| Average of class Subnotebook (128 - 832, n=56, last 2 years) | |
| MSI Modern 14 B11SB-085 | |
| Lenovo Yoga Slim 7 Pro 14 OLED Ryzen 9 | |
| Asus ZenBook 14X OLED UX5400EA-L7154W | |
| Dell XPS 13 9310 OLED | |
| Asus ZenBook 14X UM5401QA-KN162 | |
| Average AMD Ryzen 7 5800H (502 - 560, n=30) | |
| Asus Vivobook Pro 14 M3401QC-KM007T | |
| HP Envy 14-eb0010nr | |
| Cinebench R15 / CPU Multi 64Bit | |
| Average of class Subnotebook (327 - 3345, n=56, last 2 years) | |
| Average AMD Ryzen 7 5800H (1487 - 2119, n=28) | |
| Lenovo Yoga Slim 7 Pro 14 OLED Ryzen 9 | |
| Asus ZenBook 14X UM5401QA-KN162 | |
| Asus Vivobook Pro 14 M3401QC-KM007T | |
| Asus ZenBook 14X OLED UX5400EA-L7154W | |
| HP Envy 14-eb0010nr | |
| MSI Modern 14 B11SB-085 | |
| Dell XPS 13 9310 OLED | |
| Cinebench R15 / CPU Single 64Bit | |
| Average of class Subnotebook (72.4 - 322, n=56, last 2 years) | |
| Lenovo Yoga Slim 7 Pro 14 OLED Ryzen 9 | |
| Average AMD Ryzen 7 5800H (209 - 234, n=29) | |
| Dell XPS 13 9310 OLED | |
| Asus ZenBook 14X UM5401QA-KN162 | |
| Asus Vivobook Pro 14 M3401QC-KM007T | |
| Asus ZenBook 14X OLED UX5400EA-L7154W | |
| MSI Modern 14 B11SB-085 | |
| HP Envy 14-eb0010nr | |
| Blender / v2.79 BMW27 CPU | |
| Dell XPS 13 9310 OLED | |
| MSI Modern 14 B11SB-085 | |
| Asus ZenBook 14X OLED UX5400EA-L7154W | |
| HP Envy 14-eb0010nr | |
| Average of class Subnotebook (159 - 2271, n=57, last 2 years) | |
| Asus Vivobook Pro 14 M3401QC-KM007T | |
| Lenovo Yoga Slim 7 Pro 14 OLED Ryzen 9 | |
| Asus ZenBook 14X UM5401QA-KN162 | |
| Average AMD Ryzen 7 5800H (237 - 340, n=29) | |
| 7-Zip 18.03 / 7z b 4 | |
| Average AMD Ryzen 7 5800H (45773 - 59986, n=28) | |
| Asus ZenBook 14X UM5401QA-KN162 | |
| Lenovo Yoga Slim 7 Pro 14 OLED Ryzen 9 | |
| Average of class Subnotebook (11668 - 77867, n=56, last 2 years) | |
| Asus Vivobook Pro 14 M3401QC-KM007T | |
| Asus ZenBook 14X OLED UX5400EA-L7154W | |
| HP Envy 14-eb0010nr | |
| MSI Modern 14 B11SB-085 | |
| Dell XPS 13 9310 OLED | |
| 7-Zip 18.03 / 7z b 4 -mmt1 | |
| Lenovo Yoga Slim 7 Pro 14 OLED Ryzen 9 | |
| Average of class Subnotebook (2643 - 6699, n=58, last 2 years) | |
| Average AMD Ryzen 7 5800H (5038 - 5632, n=29) | |
| Asus ZenBook 14X UM5401QA-KN162 | |
| Asus Vivobook Pro 14 M3401QC-KM007T | |
| MSI Modern 14 B11SB-085 | |
| Asus ZenBook 14X OLED UX5400EA-L7154W | |
| HP Envy 14-eb0010nr | |
| Dell XPS 13 9310 OLED | |
| Geekbench 5.5 / Multi-Core | |
| Average of class Subnotebook (2557 - 17218, n=47, last 2 years) | |
| Asus ZenBook 14X UM5401QA-KN162 | |
| Lenovo Yoga Slim 7 Pro 14 OLED Ryzen 9 | |
| Average AMD Ryzen 7 5800H (6551 - 9062, n=28) | |
| Asus Vivobook Pro 14 M3401QC-KM007T | |
| Dell XPS 13 9310 OLED | |
| Asus ZenBook 14X OLED UX5400EA-L7154W | |
| Asus ZenBook 14X OLED UX5400EA-L7154W | |
| HP Envy 14-eb0010nr | |
| MSI Modern 14 B11SB-085 | |
| Geekbench 5.5 / Single-Core | |
| Average of class Subnotebook (726 - 2224, n=47, last 2 years) | |
| Dell XPS 13 9310 OLED | |
| MSI Modern 14 B11SB-085 | |
| Asus ZenBook 14X OLED UX5400EA-L7154W | |
| Asus ZenBook 14X OLED UX5400EA-L7154W | |
| Lenovo Yoga Slim 7 Pro 14 OLED Ryzen 9 | |
| Asus ZenBook 14X UM5401QA-KN162 | |
| Average AMD Ryzen 7 5800H (1336 - 1505, n=28) | |
| HP Envy 14-eb0010nr | |
| Asus Vivobook Pro 14 M3401QC-KM007T | |
| HWBOT x265 Benchmark v2.2 / 4k Preset | |
| Average AMD Ryzen 7 5800H (11.6 - 16.1, n=29) | |
| Asus ZenBook 14X UM5401QA-KN162 | |
| Average of class Subnotebook (0.97 - 25.1, n=56, last 2 years) | |
| Lenovo Yoga Slim 7 Pro 14 OLED Ryzen 9 | |
| Asus Vivobook Pro 14 M3401QC-KM007T | |
| HP Envy 14-eb0010nr | |
| Asus ZenBook 14X OLED UX5400EA-L7154W | |
| MSI Modern 14 B11SB-085 | |
| Dell XPS 13 9310 OLED | |
| LibreOffice / 20 Documents To PDF | |
| Asus ZenBook 14X OLED UX5400EA-L7154W | |
| Asus Vivobook Pro 14 M3401QC-KM007T | |
| Average AMD Ryzen 7 5800H (47.4 - 113, n=29) | |
| Average of class Subnotebook (39.9 - 220, n=55, last 2 years) | |
| Asus ZenBook 14X UM5401QA-KN162 | |
| MSI Modern 14 B11SB-085 | |
| Lenovo Yoga Slim 7 Pro 14 OLED Ryzen 9 | |
| HP Envy 14-eb0010nr | |
| Dell XPS 13 9310 OLED | |
| R Benchmark 2.5 / Overall mean | |
| HP Envy 14-eb0010nr | |
| Asus ZenBook 14X OLED UX5400EA-L7154W | |
| Asus Vivobook Pro 14 M3401QC-KM007T | |
| Dell XPS 13 9310 OLED | |
| MSI Modern 14 B11SB-085 | |
| Average of class Subnotebook (0.4024 - 1.456, n=57, last 2 years) | |
| Average AMD Ryzen 7 5800H (0.511 - 0.559, n=28) | |
| Asus ZenBook 14X UM5401QA-KN162 | |
| Lenovo Yoga Slim 7 Pro 14 OLED Ryzen 9 | |
* ... smaller is better
AIDA64: FP32 Ray-Trace | FPU Julia | CPU SHA3 | CPU Queen | FPU SinJulia | FPU Mandel | CPU AES | CPU ZLib | FP64 Ray-Trace | CPU PhotoWorxx
| Performance rating | |
| Average AMD Ryzen 7 5800H | |
| Lenovo Yoga Slim 7 Pro 14 OLED Ryzen 9 | |
| Asus ZenBook 14X UM5401QA-KN162 | |
| Average of class Subnotebook | |
| Asus Vivobook Pro 14 M3401QC-KM007T | |
| Asus ZenBook 14X OLED UX5400EA-L7154W | |
| MSI Modern 14 B11SB-085 | |
| Dell XPS 13 9310 OLED | |
| AIDA64 / FP32 Ray-Trace | |
| Average AMD Ryzen 7 5800H (10349 - 15169, n=29) | |
| Average of class Subnotebook (1135 - 32888, n=57, last 2 years) | |
| Lenovo Yoga Slim 7 Pro 14 OLED Ryzen 9 | |
| Asus ZenBook 14X UM5401QA-KN162 | |
| Asus Vivobook Pro 14 M3401QC-KM007T | |
| Asus ZenBook 14X OLED UX5400EA-L7154W | |
| MSI Modern 14 B11SB-085 | |
| Dell XPS 13 9310 OLED | |
| AIDA64 / FPU Julia | |
| Average AMD Ryzen 7 5800H (63663 - 95954, n=29) | |
| Lenovo Yoga Slim 7 Pro 14 OLED Ryzen 9 | |
| Asus ZenBook 14X UM5401QA-KN162 | |
| Asus Vivobook Pro 14 M3401QC-KM007T | |
| Average of class Subnotebook (5218 - 123315, n=57, last 2 years) | |
| Asus ZenBook 14X OLED UX5400EA-L7154W | |
| MSI Modern 14 B11SB-085 | |
| Dell XPS 13 9310 OLED | |
| AIDA64 / CPU SHA3 | |
| Average of class Subnotebook (444 - 5287, n=57, last 2 years) | |
| Average AMD Ryzen 7 5800H (2096 - 3287, n=29) | |
| Lenovo Yoga Slim 7 Pro 14 OLED Ryzen 9 | |
| Asus ZenBook 14X UM5401QA-KN162 | |
| Asus Vivobook Pro 14 M3401QC-KM007T | |
| Asus ZenBook 14X OLED UX5400EA-L7154W | |
| MSI Modern 14 B11SB-085 | |
| Dell XPS 13 9310 OLED | |
| AIDA64 / CPU Queen | |
| Average AMD Ryzen 7 5800H (91846 - 99215, n=29) | |
| Lenovo Yoga Slim 7 Pro 14 OLED Ryzen 9 | |
| Asus ZenBook 14X UM5401QA-KN162 | |
| Asus Vivobook Pro 14 M3401QC-KM007T | |
| Average of class Subnotebook (10579 - 95002, n=49, last 2 years) | |
| Asus ZenBook 14X OLED UX5400EA-L7154W | |
| MSI Modern 14 B11SB-085 | |
| Dell XPS 13 9310 OLED | |
| AIDA64 / FPU SinJulia | |
| Lenovo Yoga Slim 7 Pro 14 OLED Ryzen 9 | |
| Average AMD Ryzen 7 5800H (9962 - 11871, n=29) | |
| Asus ZenBook 14X UM5401QA-KN162 | |
| Asus Vivobook Pro 14 M3401QC-KM007T | |
| Average of class Subnotebook (744 - 18418, n=57, last 2 years) | |
| Asus ZenBook 14X OLED UX5400EA-L7154W | |
| MSI Modern 14 B11SB-085 | |
| Dell XPS 13 9310 OLED | |
| AIDA64 / FPU Mandel | |
| Average AMD Ryzen 7 5800H (36083 - 52732, n=29) | |
| Asus ZenBook 14X UM5401QA-KN162 | |
| Lenovo Yoga Slim 7 Pro 14 OLED Ryzen 9 | |
| Asus Vivobook Pro 14 M3401QC-KM007T | |
| Average of class Subnotebook (3341 - 65433, n=57, last 2 years) | |
| Asus ZenBook 14X OLED UX5400EA-L7154W | |
| MSI Modern 14 B11SB-085 | |
| Dell XPS 13 9310 OLED | |
| AIDA64 / CPU AES | |
| Average AMD Ryzen 7 5800H (50226 - 127832, n=29) | |
| Lenovo Yoga Slim 7 Pro 14 OLED Ryzen 9 | |
| Asus ZenBook 14X UM5401QA-KN162 | |
| Asus Vivobook Pro 14 M3401QC-KM007T | |
| Asus ZenBook 14X OLED UX5400EA-L7154W | |
| Average of class Subnotebook (638 - 96917, n=57, last 2 years) | |
| Dell XPS 13 9310 OLED | |
| MSI Modern 14 B11SB-085 | |
| AIDA64 / CPU ZLib | |
| Average AMD Ryzen 7 5800H (591 - 828, n=29) | |
| Average of class Subnotebook (164.9 - 1379, n=57, last 2 years) | |
| Lenovo Yoga Slim 7 Pro 14 OLED Ryzen 9 | |
| Asus ZenBook 14X UM5401QA-KN162 | |
| Asus Vivobook Pro 14 M3401QC-KM007T | |
| Asus ZenBook 14X OLED UX5400EA-L7154W | |
| MSI Modern 14 B11SB-085 | |
| Dell XPS 13 9310 OLED | |
| AIDA64 / FP64 Ray-Trace | |
| Average of class Subnotebook (610 - 17495, n=57, last 2 years) | |
| Average AMD Ryzen 7 5800H (5457 - 7884, n=29) | |
| Lenovo Yoga Slim 7 Pro 14 OLED Ryzen 9 | |
| Asus ZenBook 14X UM5401QA-KN162 | |
| Asus Vivobook Pro 14 M3401QC-KM007T | |
| Asus ZenBook 14X OLED UX5400EA-L7154W | |
| MSI Modern 14 B11SB-085 | |
| Dell XPS 13 9310 OLED | |
| AIDA64 / CPU PhotoWorxx | |
| Average of class Subnotebook (6569 - 85600, n=57, last 2 years) | |
| Asus ZenBook 14X OLED UX5400EA-L7154W | |
| Dell XPS 13 9310 OLED | |
| Asus ZenBook 14X UM5401QA-KN162 | |
| Lenovo Yoga Slim 7 Pro 14 OLED Ryzen 9 | |
| Average AMD Ryzen 7 5800H (14445 - 25421, n=29) | |
| Asus Vivobook Pro 14 M3401QC-KM007T | |
| MSI Modern 14 B11SB-085 | |
System performance
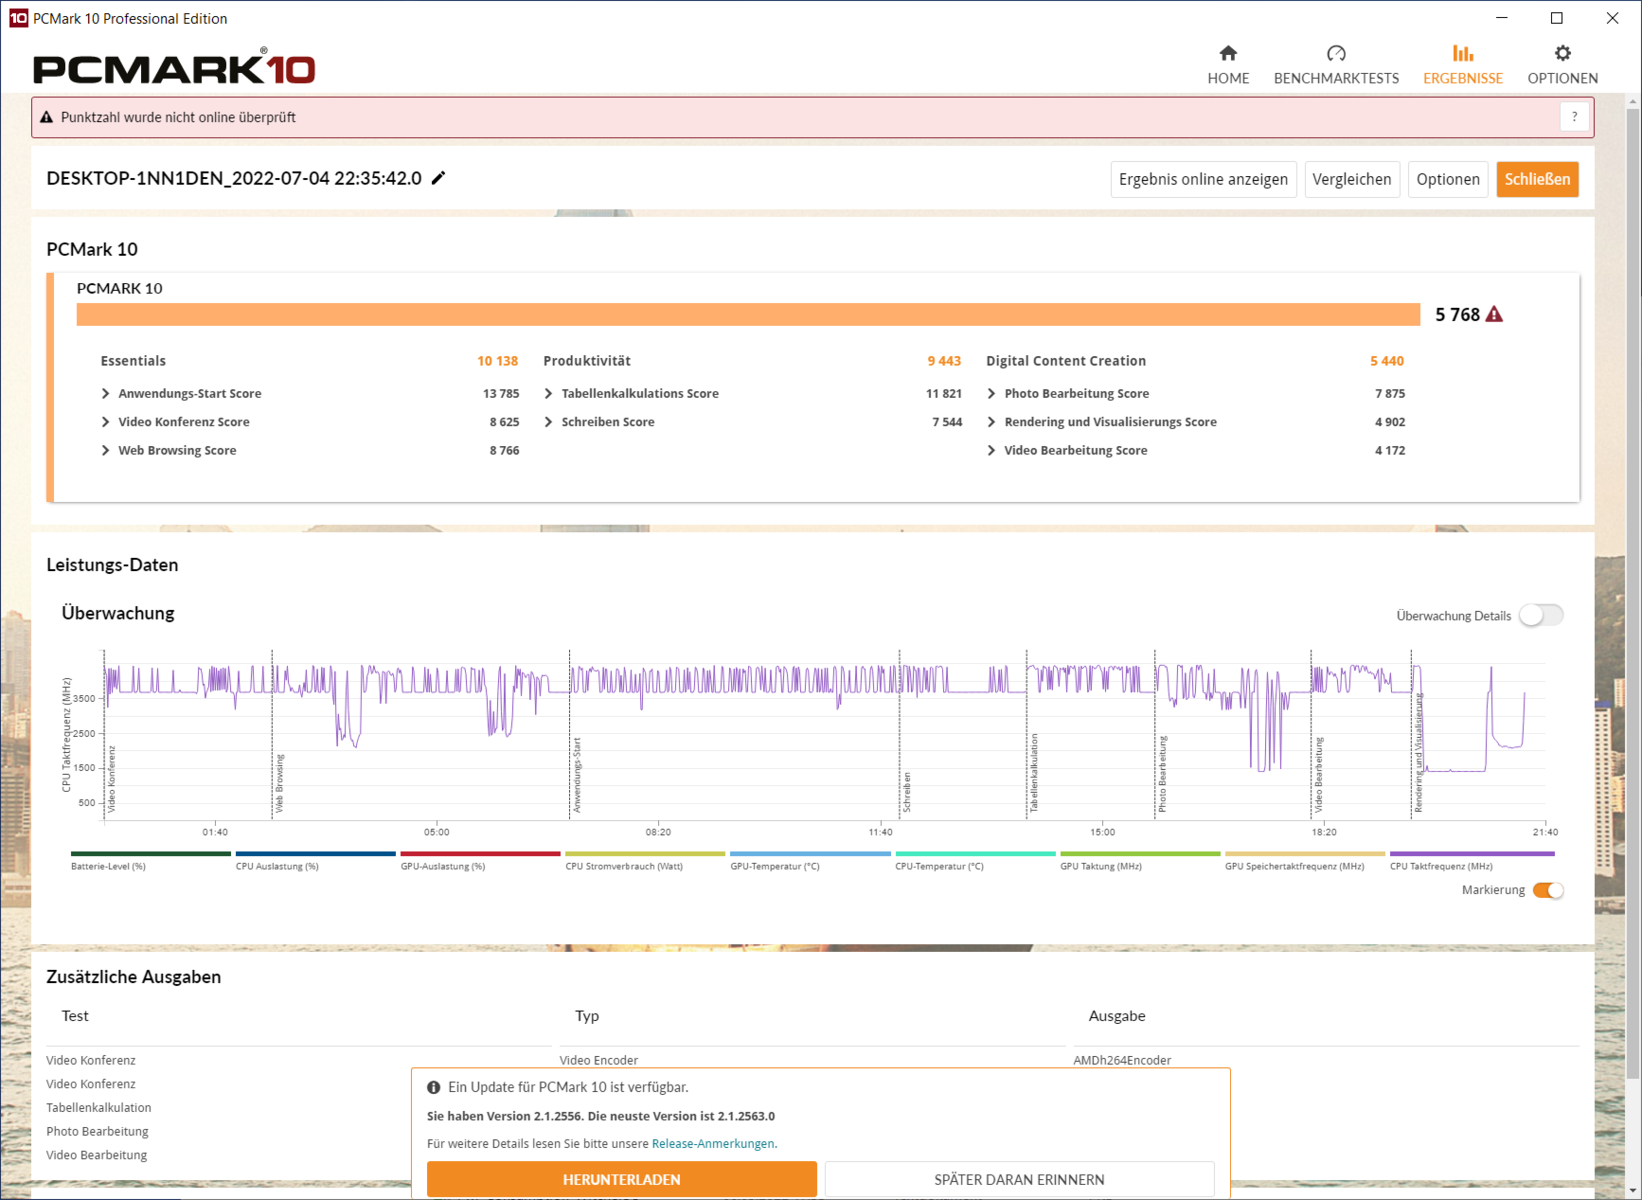
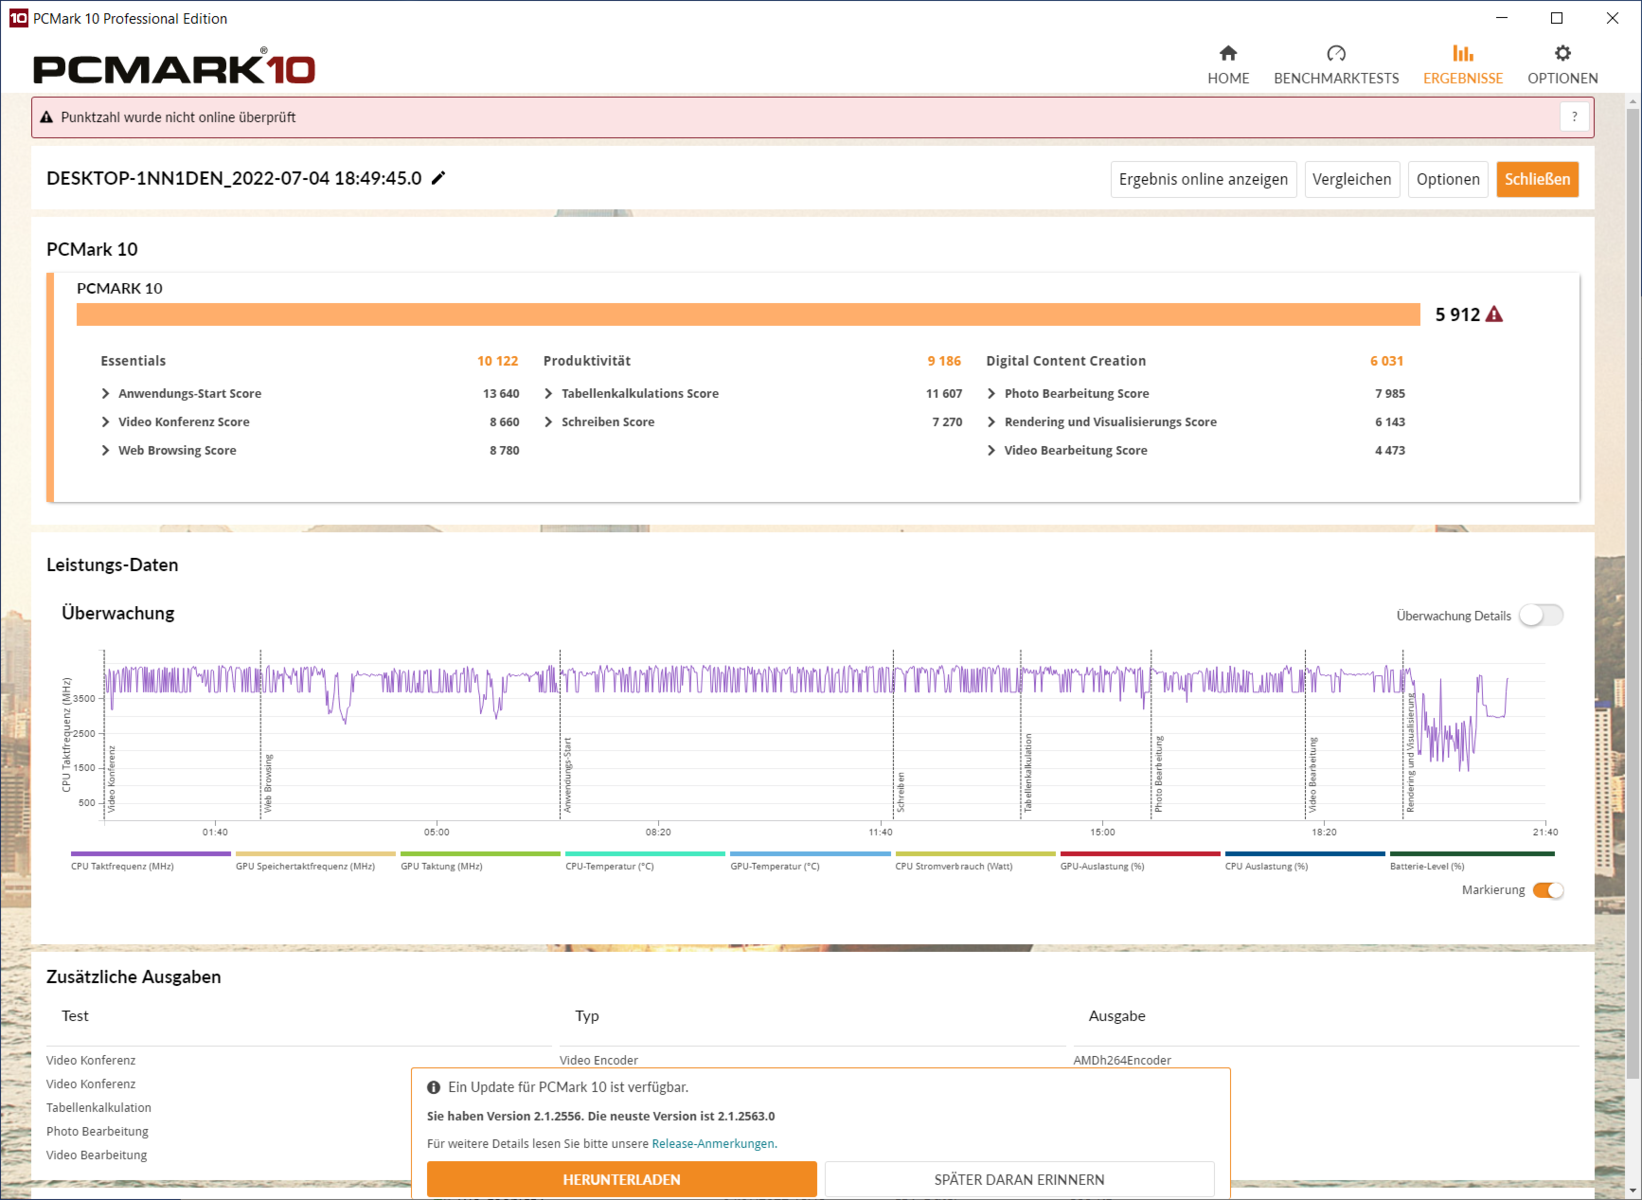
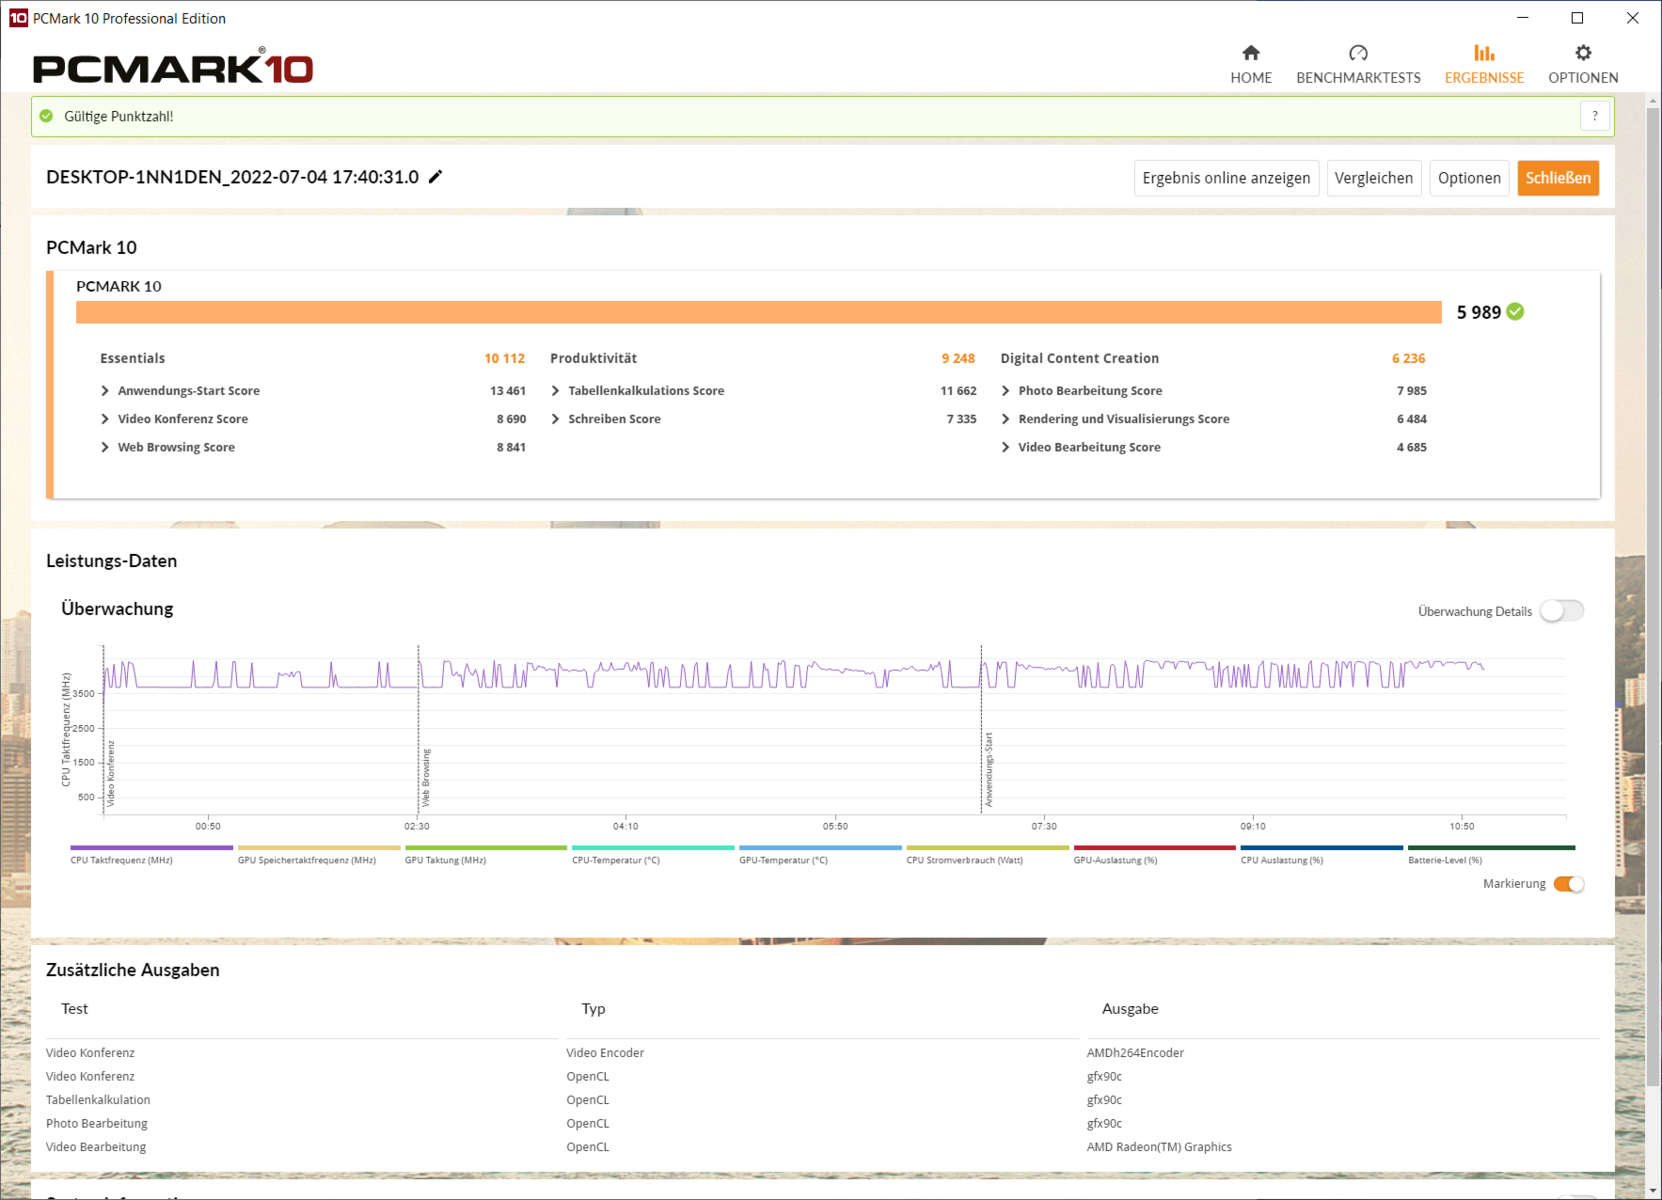
According to PCMark 10, the Zenbook 14X is at the very top in terms of application performance, and it can even take the top spot in productivity ahead of the AMD Ryzen 9 and the XPS 13. This isn't necessarily due to the Intel 670p SSD, as the following section on the SSD will show.
CrossMark: Overall | Productivity | Creativity | Responsiveness
| PCMark 10 / Score | |
| Average of class Subnotebook (4920 - 9939, n=44, last 2 years) | |
| Average AMD Ryzen 7 5800H, AMD Radeon RX Vega 8 (Ryzen 4000/5000) (5989 - 6365, n=5) | |
| Asus ZenBook 14X UM5401QA-KN162 | |
| Lenovo Yoga Slim 7 Pro 14 OLED Ryzen 9 | |
| Asus Vivobook Pro 14 M3401QC-KM007T | |
| Asus ZenBook 14X OLED UX5400EA-L7154W | |
| HP Envy 14-eb0010nr | |
| Dell XPS 13 9310 OLED | |
| MSI Modern 14 B11SB-085 | |
| PCMark 10 / Essentials | |
| Dell XPS 13 9310 OLED | |
| Average of class Subnotebook (8552 - 11646, n=44, last 2 years) | |
| Average AMD Ryzen 7 5800H, AMD Radeon RX Vega 8 (Ryzen 4000/5000) (10112 - 10690, n=5) | |
| Asus ZenBook 14X UM5401QA-KN162 | |
| Lenovo Yoga Slim 7 Pro 14 OLED Ryzen 9 | |
| Asus Vivobook Pro 14 M3401QC-KM007T | |
| Asus ZenBook 14X OLED UX5400EA-L7154W | |
| HP Envy 14-eb0010nr | |
| MSI Modern 14 B11SB-085 | |
| PCMark 10 / Productivity | |
| Average of class Subnotebook (5435 - 16606, n=44, last 2 years) | |
| Average AMD Ryzen 7 5800H, AMD Radeon RX Vega 8 (Ryzen 4000/5000) (9198 - 9729, n=5) | |
| Asus ZenBook 14X UM5401QA-KN162 | |
| Asus ZenBook 14X OLED UX5400EA-L7154W | |
| Lenovo Yoga Slim 7 Pro 14 OLED Ryzen 9 | |
| HP Envy 14-eb0010nr | |
| Asus Vivobook Pro 14 M3401QC-KM007T | |
| MSI Modern 14 B11SB-085 | |
| Dell XPS 13 9310 OLED | |
| PCMark 10 / Digital Content Creation | |
| Average of class Subnotebook (5722 - 13779, n=44, last 2 years) | |
| Asus Vivobook Pro 14 M3401QC-KM007T | |
| Average AMD Ryzen 7 5800H, AMD Radeon RX Vega 8 (Ryzen 4000/5000) (6236 - 6730, n=5) | |
| Lenovo Yoga Slim 7 Pro 14 OLED Ryzen 9 | |
| Asus ZenBook 14X UM5401QA-KN162 | |
| HP Envy 14-eb0010nr | |
| Asus ZenBook 14X OLED UX5400EA-L7154W | |
| Dell XPS 13 9310 OLED | |
| MSI Modern 14 B11SB-085 | |
| CrossMark / Overall | |
| Average of class Subnotebook (365 - 2356, n=59, last 2 years) | |
| Lenovo Yoga Slim 7 Pro 14 OLED Ryzen 9 | |
| Average AMD Ryzen 7 5800H, AMD Radeon RX Vega 8 (Ryzen 4000/5000) (1352 - 1429, n=3) | |
| Asus ZenBook 14X UM5401QA-KN162 | |
| Asus Vivobook Pro 14 M3401QC-KM007T | |
| Asus ZenBook 14X OLED UX5400EA-L7154W | |
| CrossMark / Productivity | |
| Average of class Subnotebook (364 - 2277, n=59, last 2 years) | |
| Lenovo Yoga Slim 7 Pro 14 OLED Ryzen 9 | |
| Average AMD Ryzen 7 5800H, AMD Radeon RX Vega 8 (Ryzen 4000/5000) (1356 - 1408, n=3) | |
| Asus ZenBook 14X UM5401QA-KN162 | |
| Asus Vivobook Pro 14 M3401QC-KM007T | |
| Asus ZenBook 14X OLED UX5400EA-L7154W | |
| CrossMark / Creativity | |
| Average of class Subnotebook (372 - 2743, n=59, last 2 years) | |
| Average AMD Ryzen 7 5800H, AMD Radeon RX Vega 8 (Ryzen 4000/5000) (1444 - 1523, n=3) | |
| Asus ZenBook 14X UM5401QA-KN162 | |
| Lenovo Yoga Slim 7 Pro 14 OLED Ryzen 9 | |
| Asus Vivobook Pro 14 M3401QC-KM007T | |
| Asus ZenBook 14X OLED UX5400EA-L7154W | |
| CrossMark / Responsiveness | |
| Average of class Subnotebook (312 - 1854, n=59, last 2 years) | |
| Lenovo Yoga Slim 7 Pro 14 OLED Ryzen 9 | |
| Average AMD Ryzen 7 5800H, AMD Radeon RX Vega 8 (Ryzen 4000/5000) (1105 - 1233, n=3) | |
| Asus ZenBook 14X UM5401QA-KN162 | |
| Asus Vivobook Pro 14 M3401QC-KM007T | |
| Asus ZenBook 14X OLED UX5400EA-L7154W | |
| PCMark 10 Score | 5989 points | |
Help | ||
| AIDA64 / Memory Copy | |
| Average of class Subnotebook (14554 - 131023, n=57, last 2 years) | |
| Asus ZenBook 14X OLED UX5400EA-L7154W | |
| Dell XPS 13 9310 OLED | |
| Lenovo Yoga Slim 7 Pro 14 OLED Ryzen 9 | |
| Average AMD Ryzen 7 5800H (34964 - 44180, n=29) | |
| Asus Vivobook Pro 14 M3401QC-KM007T | |
| Asus ZenBook 14X UM5401QA-KN162 | |
| MSI Modern 14 B11SB-085 | |
| AIDA64 / Memory Read | |
| Average of class Subnotebook (15948 - 127174, n=57, last 2 years) | |
| Asus ZenBook 14X OLED UX5400EA-L7154W | |
| Dell XPS 13 9310 OLED | |
| Average AMD Ryzen 7 5800H (39548 - 47260, n=29) | |
| Asus Vivobook Pro 14 M3401QC-KM007T | |
| Lenovo Yoga Slim 7 Pro 14 OLED Ryzen 9 | |
| Asus ZenBook 14X UM5401QA-KN162 | |
| MSI Modern 14 B11SB-085 | |
| AIDA64 / Memory Write | |
| Average of class Subnotebook (15709 - 135141, n=57, last 2 years) | |
| Asus ZenBook 14X OLED UX5400EA-L7154W | |
| Dell XPS 13 9310 OLED | |
| Average AMD Ryzen 7 5800H (28456 - 47022, n=29) | |
| Lenovo Yoga Slim 7 Pro 14 OLED Ryzen 9 | |
| Asus Vivobook Pro 14 M3401QC-KM007T | |
| Asus ZenBook 14X UM5401QA-KN162 | |
| MSI Modern 14 B11SB-085 | |
| AIDA64 / Memory Latency | |
| Dell XPS 13 9310 OLED | |
| Asus ZenBook 14X OLED UX5400EA-L7154W | |
| Lenovo Yoga Slim 7 Pro 14 OLED Ryzen 9 | |
| Asus ZenBook 14X UM5401QA-KN162 | |
| Average of class Subnotebook (6.1 - 159.9, n=55, last 2 years) | |
| Average AMD Ryzen 7 5800H (76.3 - 105.1, n=29) | |
| Asus Vivobook Pro 14 M3401QC-KM007T | |
| MSI Modern 14 B11SB-085 | |
* ... smaller is better
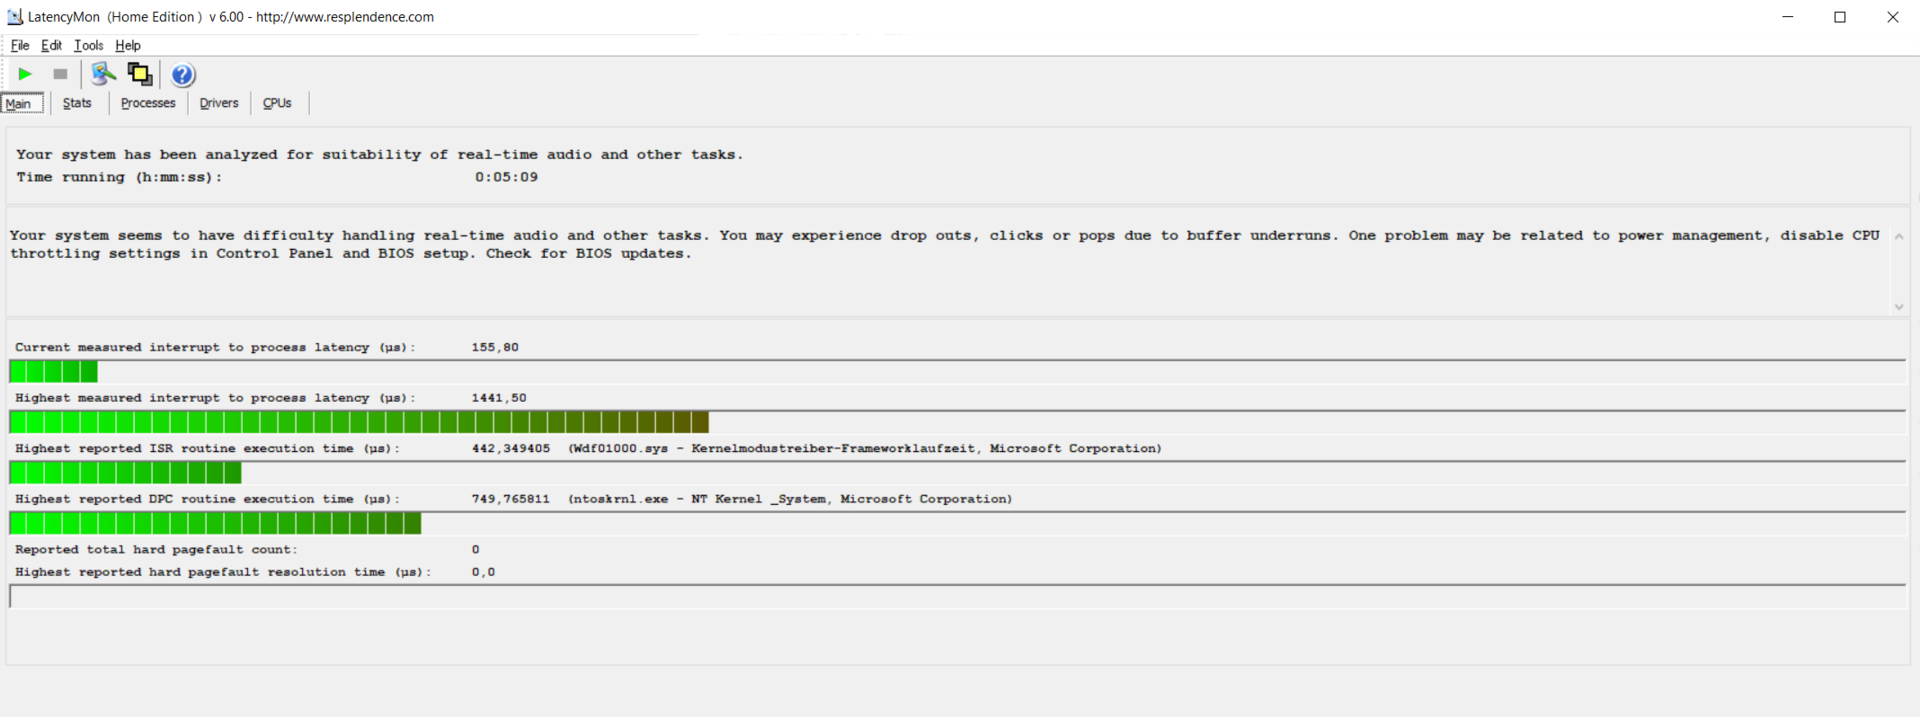
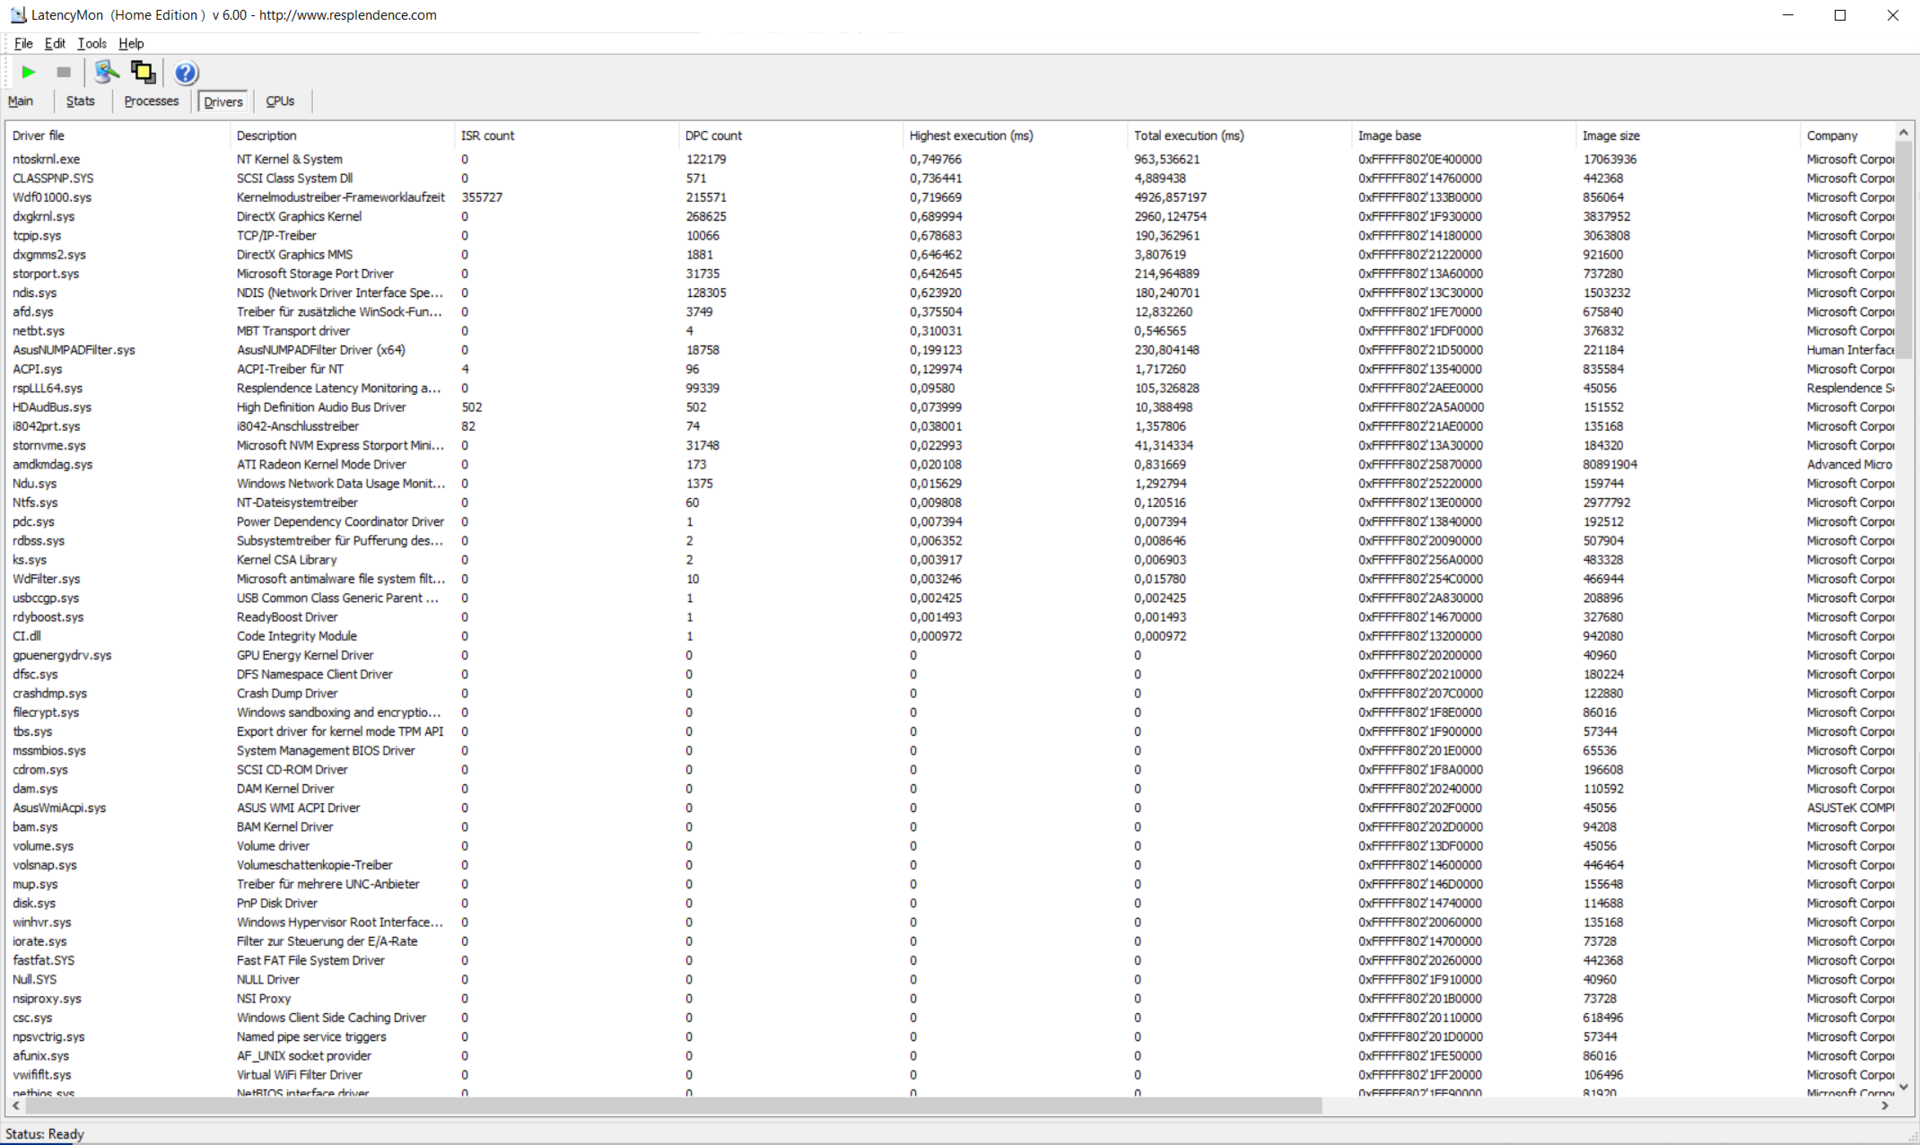
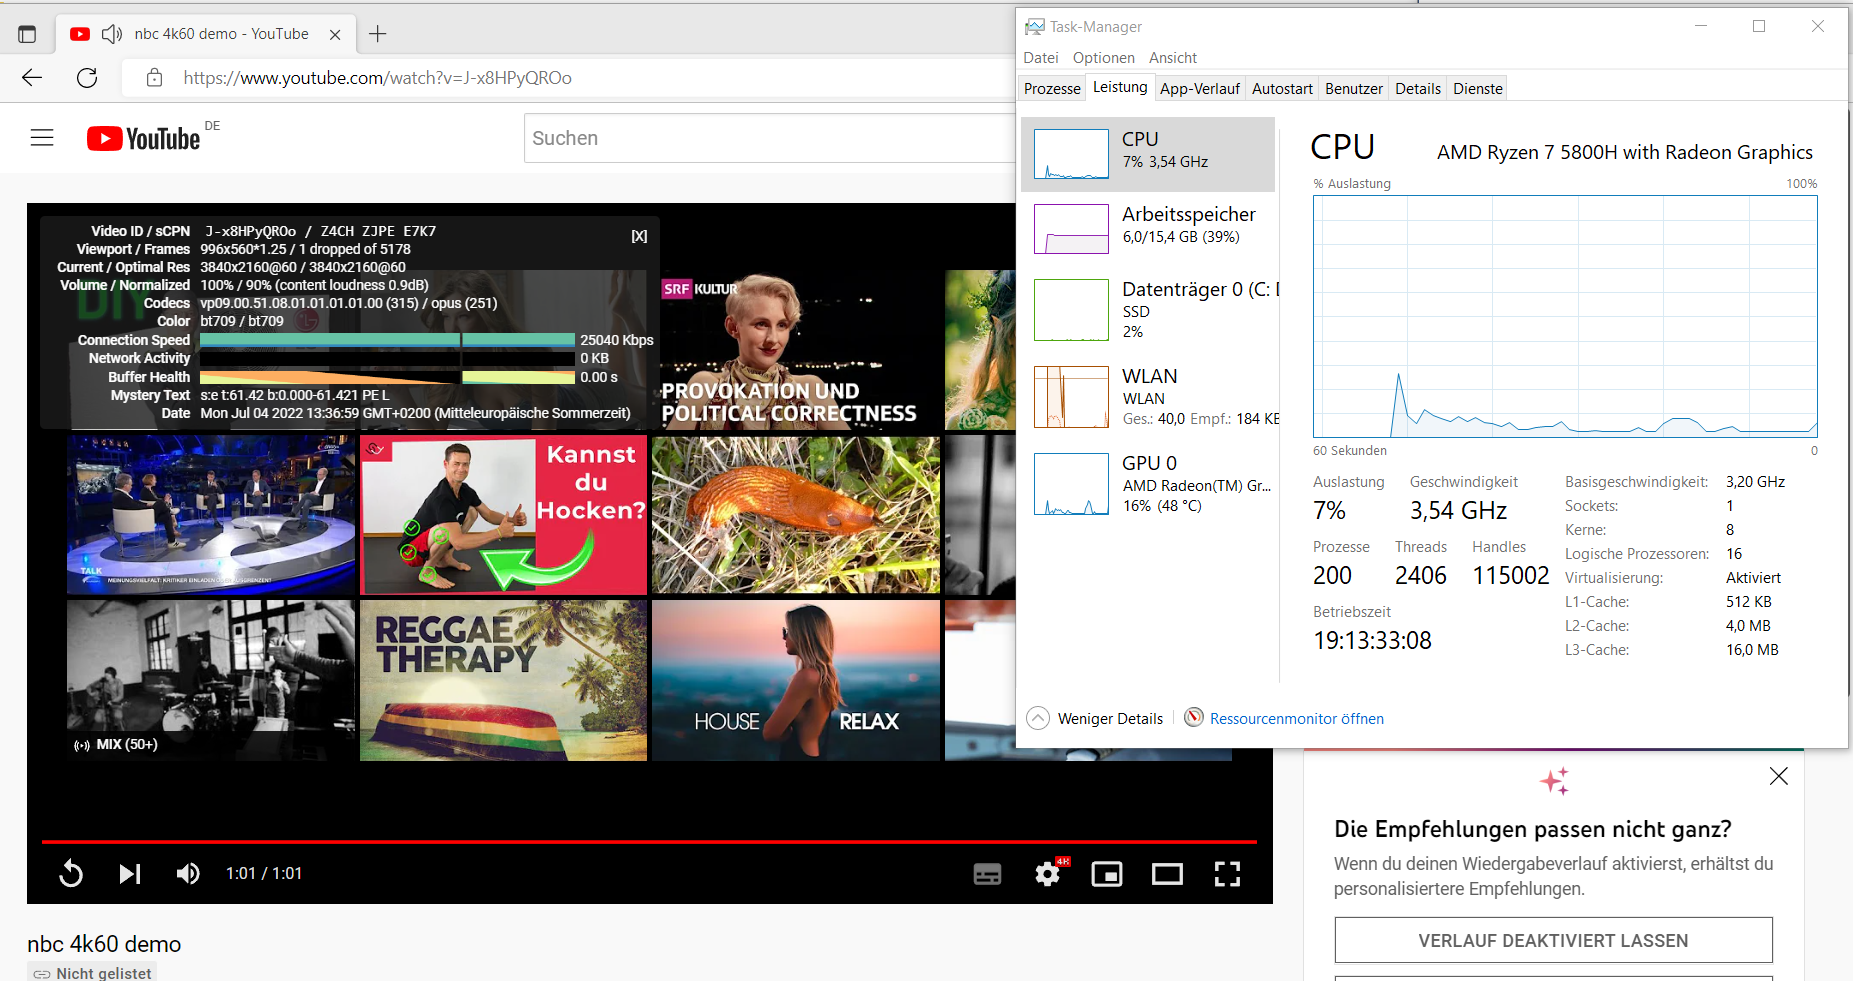
DPC latencies
The latency test with LatencyMon resulted in a latency of slightly less than two milliseconds. Therefore, the laptop is capable of handling real-time applications in our tested hardware and software configuration. Only one frame was dropped during the playback of our 4K 60 Hz YouTube test video.
| DPC Latencies / LatencyMon - interrupt to process latency (max), Web, Youtube, Prime95 | |
| HP Envy 14-eb0010nr | |
| Lenovo Yoga Slim 7 Pro 14 OLED Ryzen 9 | |
| Asus ZenBook 14X OLED UX5400EA-L7154W | |
| Asus ZenBook 14X UM5401QA-KN162 | |
| Dell XPS 13 9310 OLED | |
| Asus Vivobook Pro 14 M3401QC-KM007T | |
| MSI Modern 14 B11SB-085 | |
* ... smaller is better
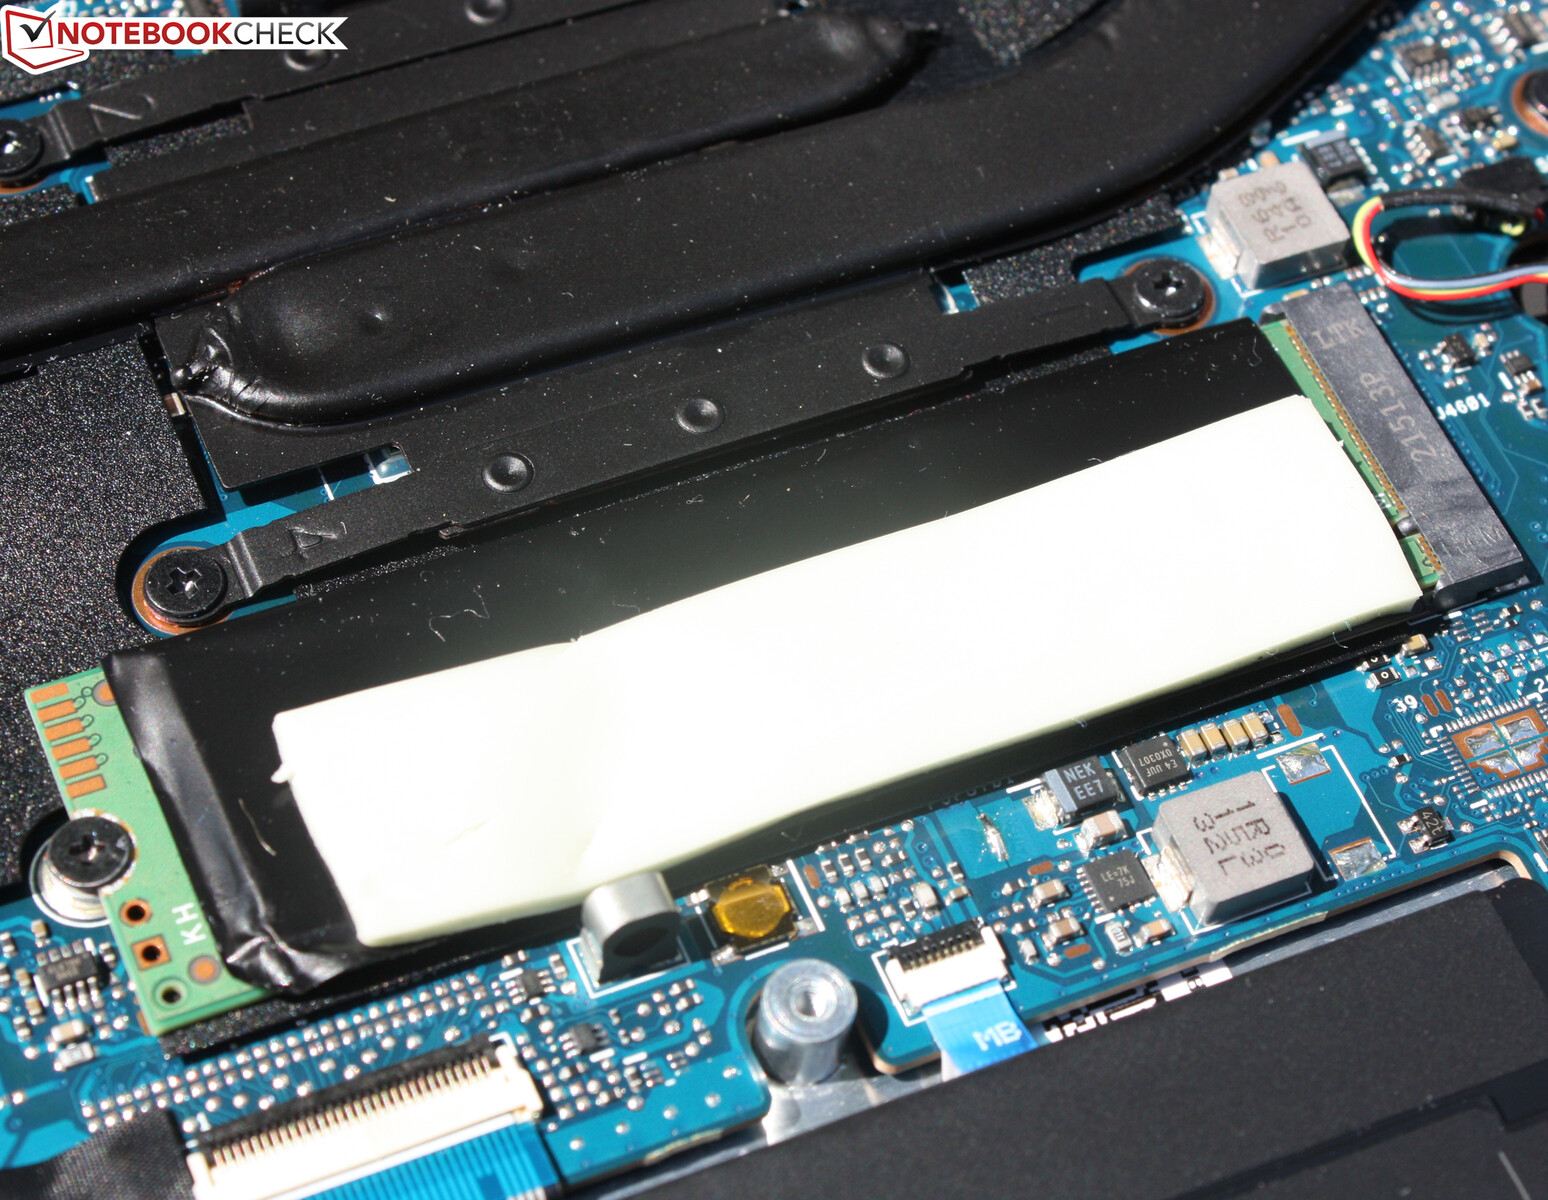
Storage
The built-in Intel 670p SSD ranks in the midfield. In our benchmarks table of SSDs and HDDs, the Intel SSD takes one of the lower places.

* ... smaller is better
Continuous load read: DiskSpd Read Loop, Queue Depth 8
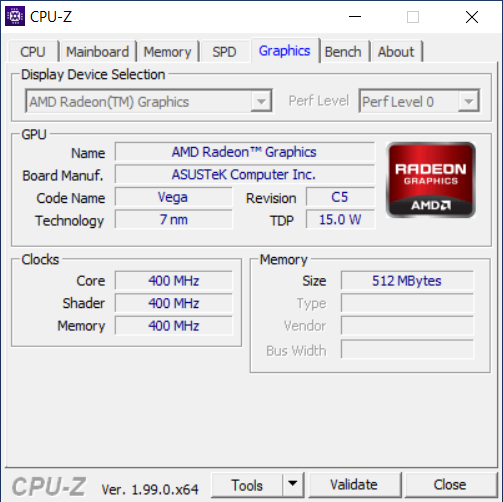
Graphics card
The built-in Vega 8 iGPU is one of the more powerful iGPUs, and it can bring many games smoothly onto the screen - at low resolutions and settings. Running at maximum speed (1,900 MHz) for a long time is possible - this is shown in our The Witcher 3 test. However, this only applies when the "Performance mode" profile is active and the laptop is plugged in. The benchmark results correspond to the average of the Vega 8 iGPU that we've determined so far.
| 3DMark 11 Performance | 6542 points | |
| 3DMark Cloud Gate Standard Score | 23278 points | |
| 3DMark Fire Strike Score | 3554 points | |
| 3DMark Time Spy Score | 1444 points | |
Help | ||
Gaming performance
The FPS drops to its knees in modern titles like Ghostwire Tokyo, where playable rates aren't even possible at low settings. Things look different in older titles; at best, 25 to 35 FPS is possible when using Medium settings at Full HD resolution. The Radeon iGPU's performance is average for its design. Users who aren't satisfied with that can consider the Intel 14X sibling model with the MX450, or the Asus Vivobook Pro 14 M3401QC, which isn't as slim, but it does come with an OLED panel.
| Ghostwire Tokyo - 1920x1080 Low Settings | |
| Asus Vivobook Pro 14 M3401QC-KM007T | |
| Asus ZenBook 14X OLED UX5400EA-L7154W | |
| Asus ZenBook 14X UM5401QA-KN162 | |
| Average AMD Radeon RX Vega 8 (Ryzen 4000/5000) (13 - 21.3, n=4) | |
Regardless of this being a gaming device or not, we tested the iGPU's stability once. The Witcher 3 runs at Full HD resolution and Ultra settings in a loop here. We unplug the laptop halfway through the test. At first, the iGPU constantly allows itself its 2,000 MHz clock rate, which is accompanied by a moderate temperature of 62 °C (~144 °F). The clock rate has to drop on battery power, even in Performance mode. It now fluctuates between 1,400 and 1,800 MHz.
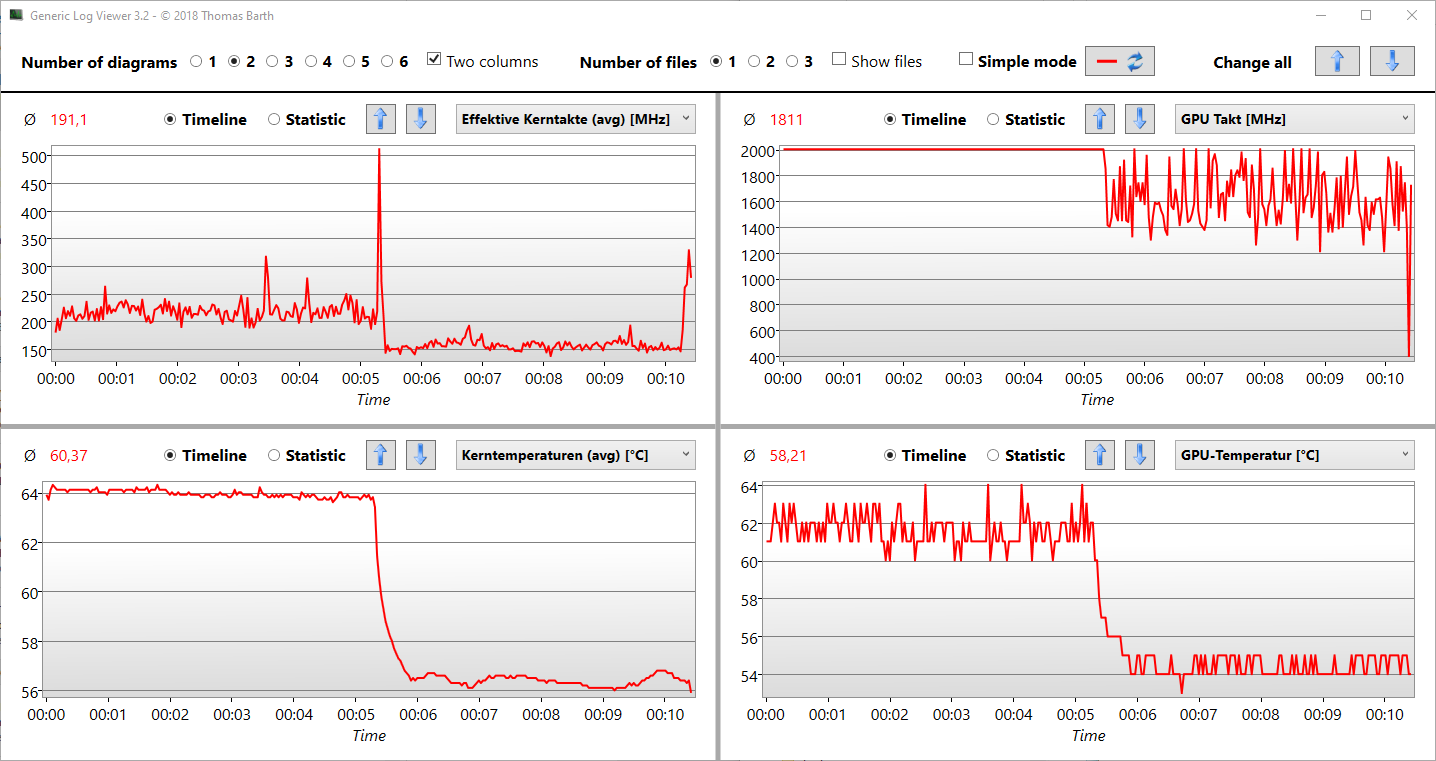
The Witcher 3 FPS diagram
| low | med. | high | ultra | 4K | |
|---|---|---|---|---|---|
| GTA V (2015) | 101 | 34 | |||
| The Witcher 3 (2015) | 68.1 | 44 | 21 | 14.4 | |
| Dota 2 Reborn (2015) | 117.5 | 100.2 | 58.1 | 53.6 | 14.9 |
| Final Fantasy XV Benchmark (2018) | 38.1 | 19.2 | |||
| X-Plane 11.11 (2018) | 50.1 | 39.2 | 35.2 | 25.3 | |
| Far Cry 5 (2018) | 46 | 26 | 22 | ||
| Strange Brigade (2018) | 83.7 | 32.6 | 27.8 | 23.2 | |
| Ghostwire Tokyo (2022) | 17.6 | 16.6 |
Emissions - A silent Windows laptop upon request
Noise emissions
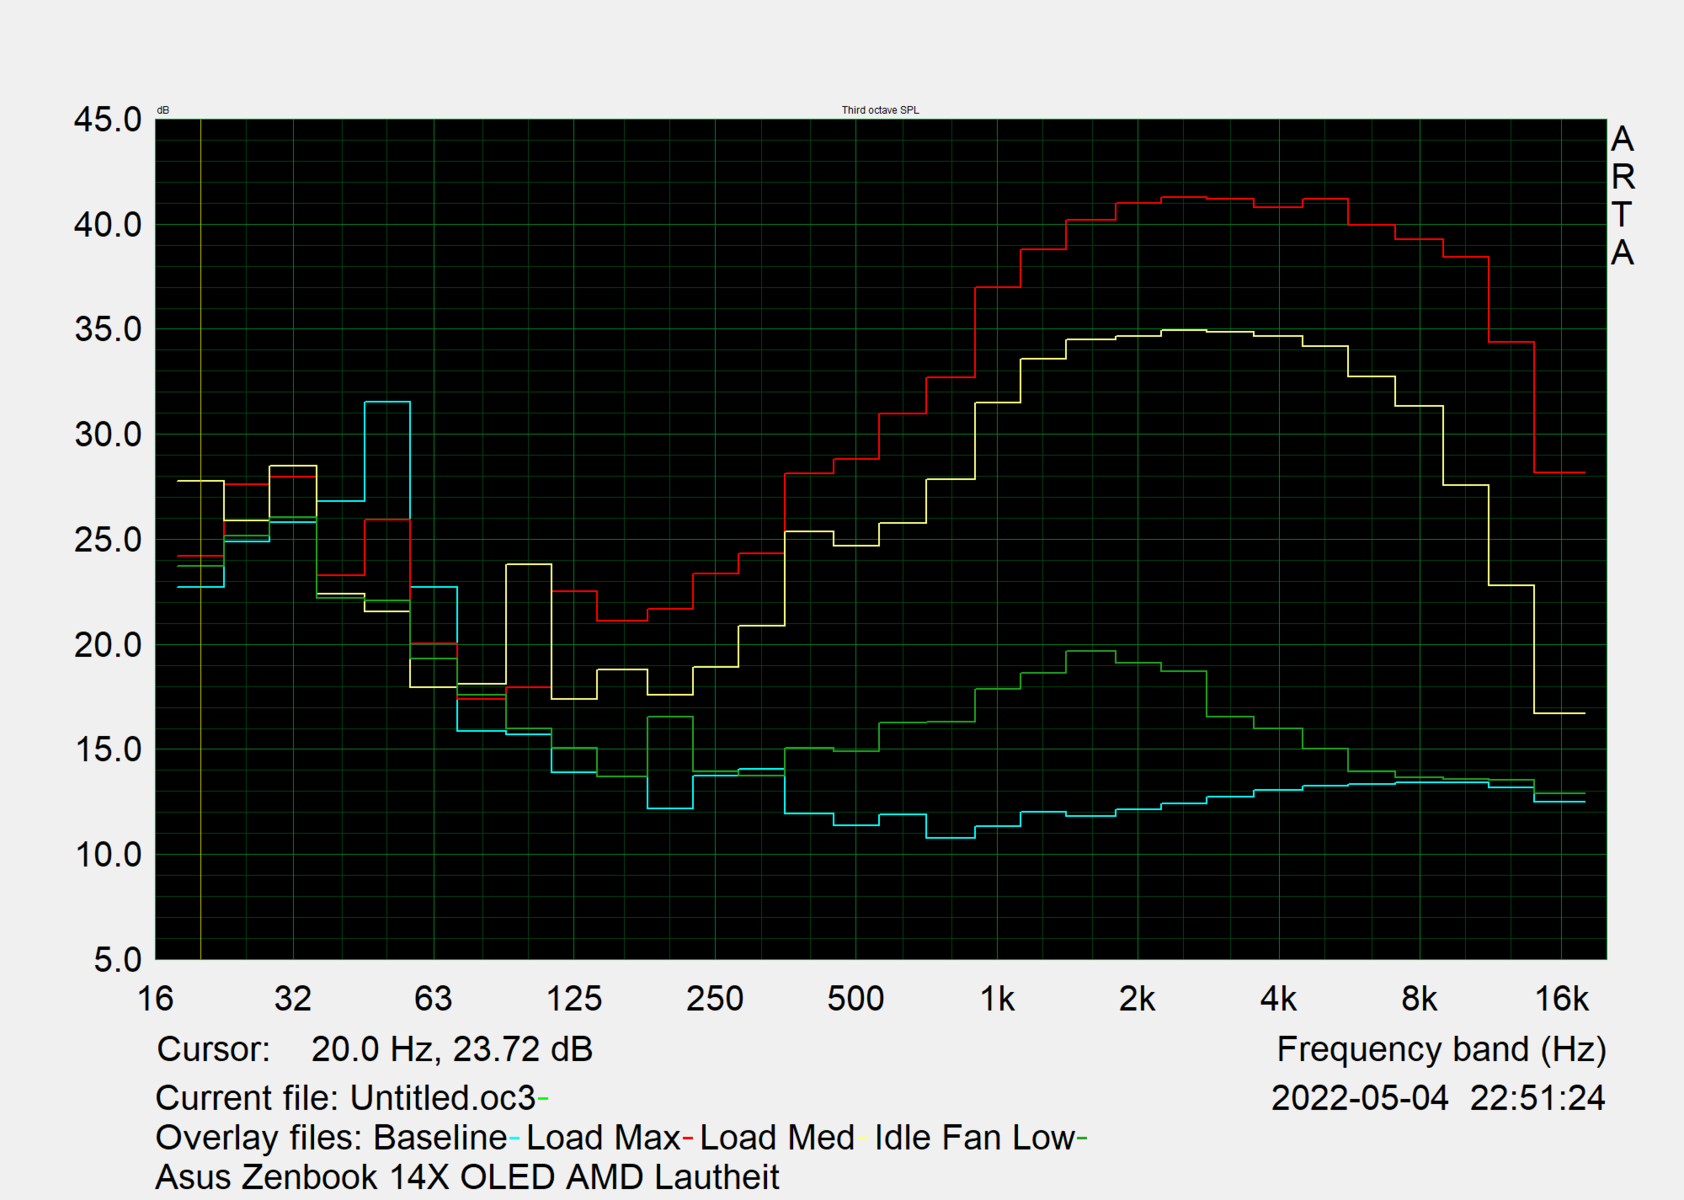
The Zenbook doesn't generate an excessive amount of noise over the entire load range. The fan is silent in everyday use (office, Internet), and there's no noise. This also applies to Performance mode, so users don't have to be constantly switching back and forth. The sound pressure level rises up to 45 dB(A) under load - that's a bit louder than the Intel version.
Positive: It takes a relatively long time for the fan to kick in at all. Noise development under load can be reduced by using the "Whisper mode" performance profile - at the expense of processing power. However, the drop in performance is small as we saw above in the PCMarks.
Noise level
| Idle |
| 24.6 / 24.6 / 24.6 dB(A) |
| Load |
| 45 / 51.5 dB(A) |
 | ||
30 dB silent 40 dB(A) audible 50 dB(A) loud |
||
min: | ||
| Asus ZenBook 14X UM5401QA-KN162 Vega 8, R7 5800H, Intel SSD 670p SSDPEKNU512GZ | Dell XPS 13 9310 OLED Iris Xe G7 96EUs, i7-1185G7, Toshiba XG6 KXG60ZNV512G | Asus ZenBook 14X OLED UX5400EA-L7154W GeForce MX450, i7-1165G7, Intel Optane Memory H10 with Solid State Storage 32GB + 1TB HBRPEKNX0203AH(L/H) | HP Envy 14-eb0010nr GeForce GTX 1650 Ti Max-Q, i5-1135G7, Samsung SSD PM981a MZVLB256HBHQ | Asus Vivobook Pro 14 M3401QC-KM007T GeForce RTX 3050 4GB Laptop GPU, R5 5600H, Intel SSD 670p SSDPEKNU512GZ | Lenovo Yoga Slim 7 Pro 14 OLED Ryzen 9 GeForce MX450, R9 5900HS, SK Hynix PC711 1TB HFS001TDE9X084N | MSI Modern 14 B11SB-085 GeForce MX450, i7-1165G7, Kingston OM8PCP3512F-AB | |
|---|---|---|---|---|---|---|---|
| Noise | 11% | -0% | 1% | -11% | 2% | -5% | |
| off / environment * (dB) | 24.6 | 24.8 -1% | 26.6 -8% | 25.9 -5% | 25.4 -3% | 24.7 -0% | 26 -6% |
| Idle Minimum * (dB) | 24.6 | 25 -2% | 26.6 -8% | 26 -6% | 25.4 -3% | 24.7 -0% | 26 -6% |
| Idle Average * (dB) | 24.6 | 25 -2% | 26.6 -8% | 26 -6% | 25.4 -3% | 24.7 -0% | 26 -6% |
| Idle Maximum * (dB) | 24.6 | 25 -2% | 27.2 -11% | 26 -6% | 30.9 -26% | 27.3 -11% | 26 -6% |
| Load Average * (dB) | 45 | 25.3 44% | 40.1 11% | 34.9 22% | 56 -24% | 41 9% | 46.3 -3% |
| Load Maximum * (dB) | 51.5 | 35.8 30% | 40.4 22% | 48.7 5% | 56 -9% | 43.5 16% | 52.9 -3% |
| Witcher 3 ultra * (dB) | 35.8 | 34.5 | 43.5 | 46.3 |
* ... smaller is better
Temperature
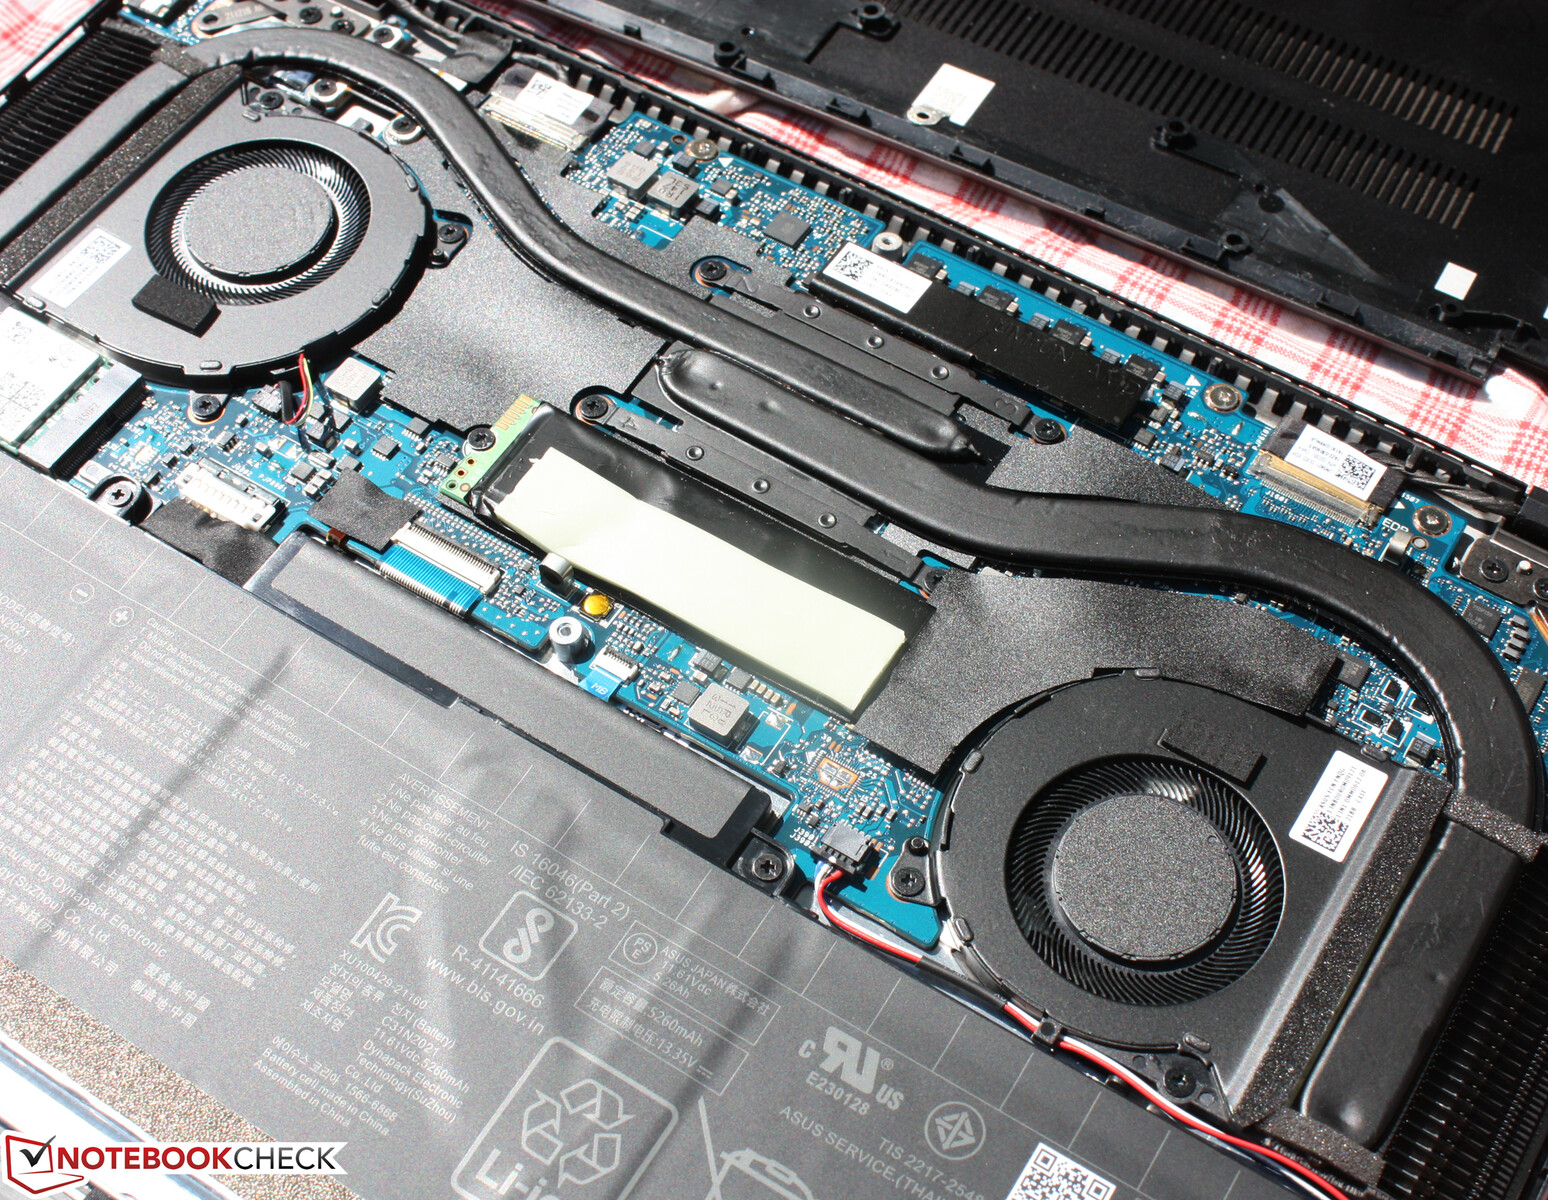
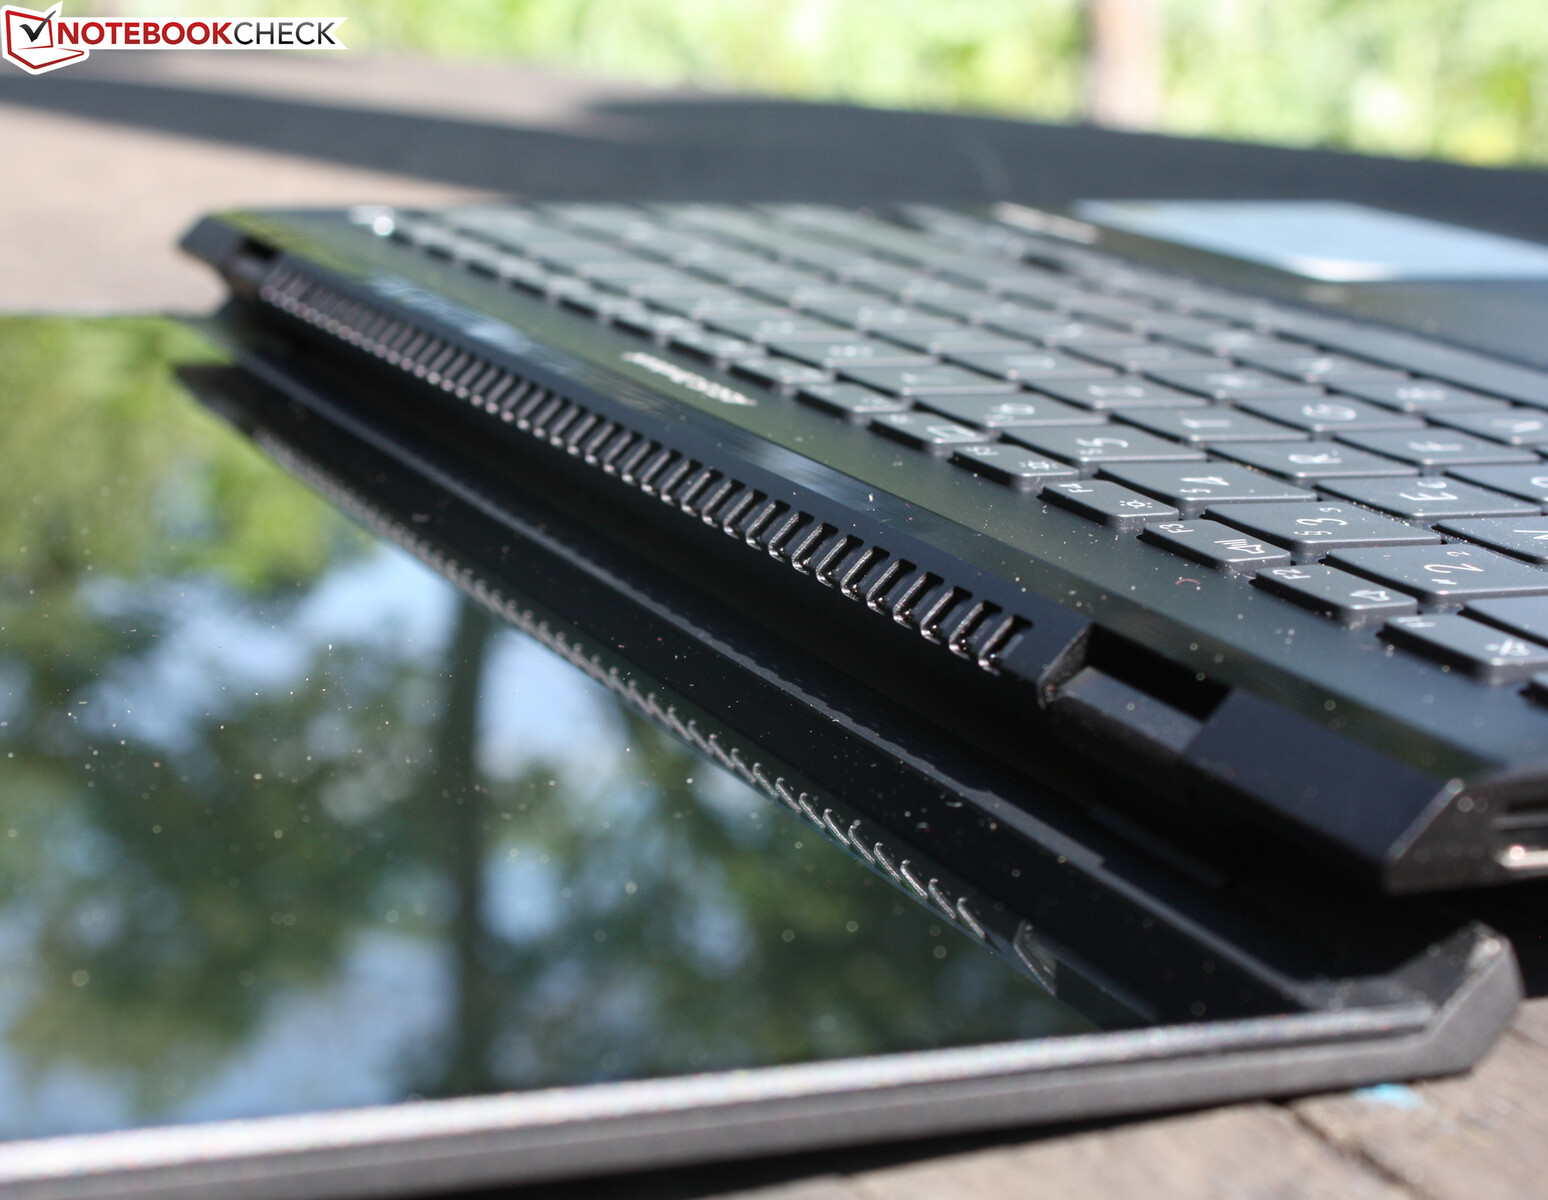
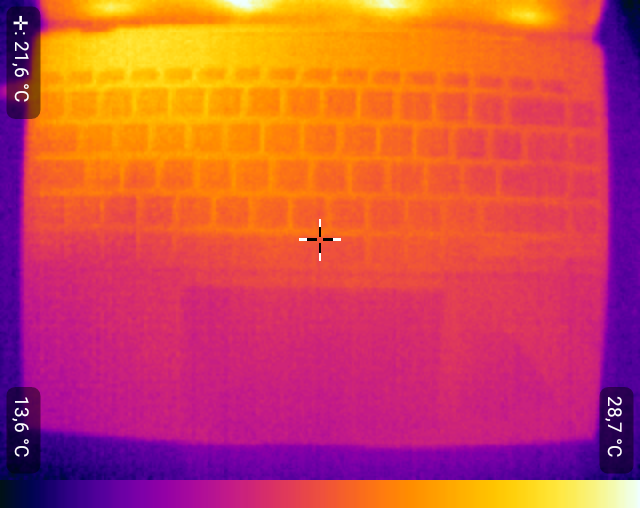
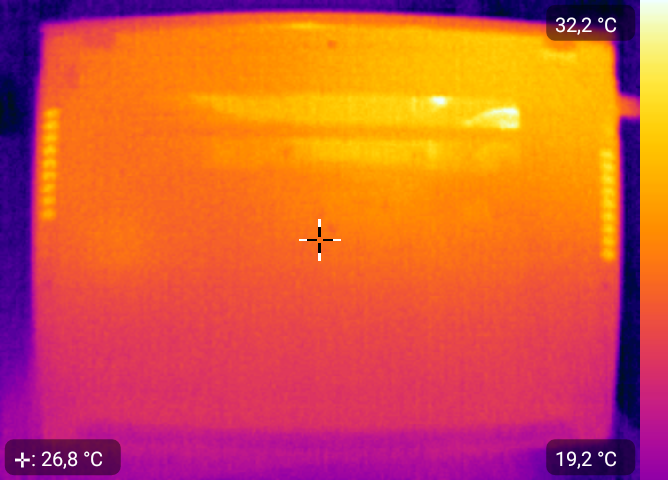
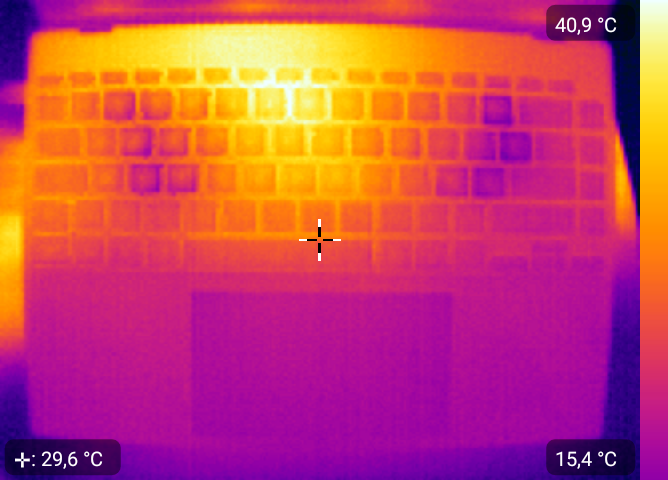
The temperatures are within the green zone in everyday use (office, Internet). During the stress test, the temperatures increases in certain areas. The dual fans do a good job; they draw air in above the keyboard and blow the waste heat out of the case through the right and left sides. This way, the palm rest always remains cool.
(±) The maximum temperature on the upper side is 42.5 °C / 109 F, compared to the average of 35.9 °C / 97 F, ranging from 21.4 to 59 °C for the class Subnotebook.
(±) The bottom heats up to a maximum of 43.7 °C / 111 F, compared to the average of 39.2 °C / 103 F
(+) In idle usage, the average temperature for the upper side is 28.7 °C / 84 F, compared to the device average of 30.8 °C / 87 F.
(+) The palmrests and touchpad are cooler than skin temperature with a maximum of 30.7 °C / 87.3 F and are therefore cool to the touch.
(-) The average temperature of the palmrest area of similar devices was 28.2 °C / 82.8 F (-2.5 °C / -4.5 F).

| Asus ZenBook 14X UM5401QA-KN162 AMD Ryzen 7 5800H, AMD Radeon RX Vega 8 (Ryzen 4000/5000) | Dell XPS 13 9310 OLED Intel Core i7-1185G7, Intel Iris Xe Graphics G7 96EUs | Asus ZenBook 14X OLED UX5400EA-L7154W Intel Core i7-1165G7, NVIDIA GeForce MX450 | HP Envy 14-eb0010nr Intel Core i5-1135G7, NVIDIA GeForce GTX 1650 Ti Max-Q | Asus Vivobook Pro 14 M3401QC-KM007T AMD Ryzen 5 5600H, NVIDIA GeForce RTX 3050 4GB Laptop GPU | Lenovo Yoga Slim 7 Pro 14 OLED Ryzen 9 AMD Ryzen 9 5900HS, NVIDIA GeForce MX450 | MSI Modern 14 B11SB-085 Intel Core i7-1165G7, NVIDIA GeForce MX450 | |
|---|---|---|---|---|---|---|---|
| Heat | 2% | -11% | -5% | -11% | -9% | -17% | |
| Maximum Upper Side * (°C) | 42.5 | 46.6 -10% | 49.1 -16% | 41.2 3% | 42.3 -0% | 44.5 -5% | 55.6 -31% |
| Maximum Bottom * (°C) | 43.7 | 46 -5% | 50.4 -15% | 45.6 -4% | 49.6 -14% | 56.4 -29% | 67.8 -55% |
| Idle Upper Side * (°C) | 31.1 | 26.6 14% | 33.6 -8% | 31.8 -2% | 34.2 -10% | 29.1 6% | 28.3 9% |
| Idle Bottom * (°C) | 32 | 29.2 9% | 33.6 -5% | 37.8 -18% | 37.9 -18% | 34 -6% | 28.9 10% |
* ... smaller is better
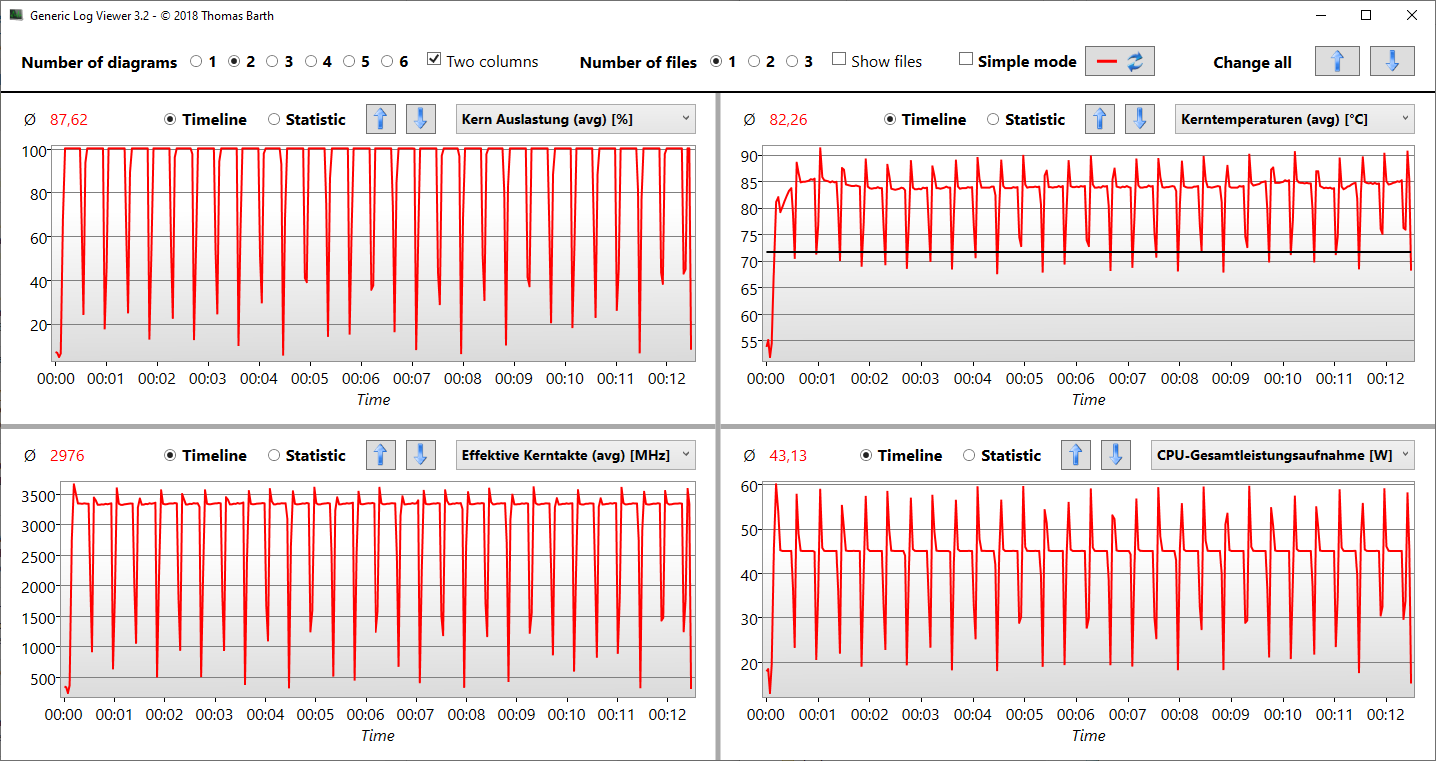
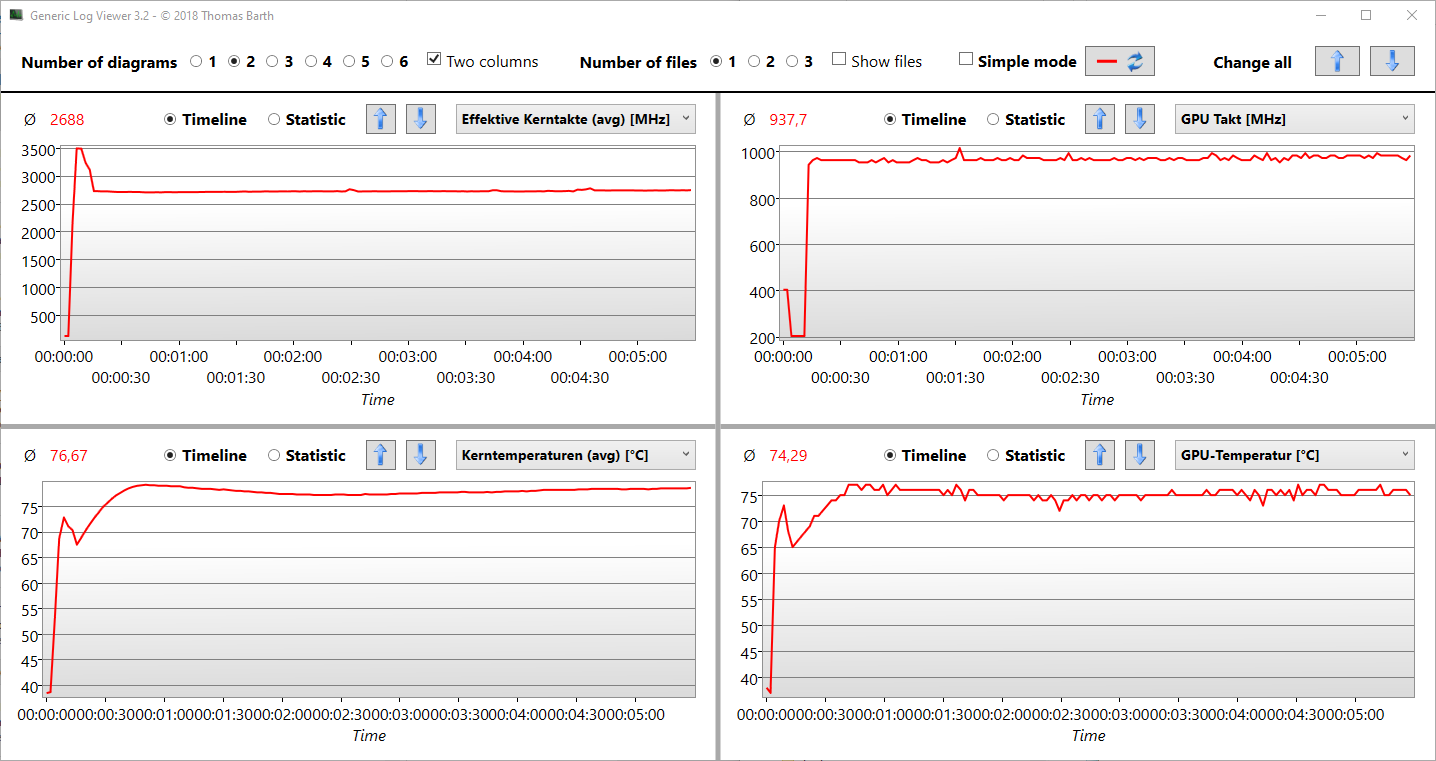
Stress test
The CPU and GPU begin the stress test (Prime95 and FurMark) at 3.5 GHz and 930 MHz, respectively. In this case, the priority is on the CPU, and the iGPU has to take a back seat when there are bottlenecks. As the test progresses, the clock rates drop to 2.7 GHz (CPU), while the iGPU stays at 900 MHz. The stress test represents an extreme scenario. We use this test to check whether the system remains stable under full load.
Speakers
The Zenbook delivers volume, a certain amount of lows and basses, and it reproduces highs in a balanced way. The small speakers sit under the palm rest to the right and left and use the surface as a reflector. In this respect, sound is better on the hard surface of a table than on a carpet. The dual-array microphone picks up voices without noise, which is ideal for video calls and conferences.
Asus ZenBook 14X UM5401QA-KN162 audio analysis
(-) | not very loud speakers (65.71 dB)
Bass 100 - 315 Hz
(-) | nearly no bass - on average 15.7% lower than median
(±) | linearity of bass is average (12.6% delta to prev. frequency)
Mids 400 - 2000 Hz
(+) | balanced mids - only 3.6% away from median
(+) | mids are linear (4.1% delta to prev. frequency)
Highs 2 - 16 kHz
(+) | balanced highs - only 2.8% away from median
(+) | highs are linear (4.8% delta to prev. frequency)
Overall 100 - 16.000 Hz
(±) | linearity of overall sound is average (17.1% difference to median)
Compared to same class
» 43% of all tested devices in this class were better, 9% similar, 48% worse
» The best had a delta of 5%, average was 18%, worst was 53%
Compared to all devices tested
» 31% of all tested devices were better, 8% similar, 61% worse
» The best had a delta of 4%, average was 23%, worst was 134%
Dell XPS 13 9310 OLED audio analysis
(±) | speaker loudness is average but good (81.3 dB)
Bass 100 - 315 Hz
(±) | reduced bass - on average 11.6% lower than median
(±) | linearity of bass is average (12.1% delta to prev. frequency)
Mids 400 - 2000 Hz
(±) | higher mids - on average 5.1% higher than median
(+) | mids are linear (3.3% delta to prev. frequency)
Highs 2 - 16 kHz
(+) | balanced highs - only 2.6% away from median
(+) | highs are linear (3.3% delta to prev. frequency)
Overall 100 - 16.000 Hz
(+) | overall sound is linear (13.4% difference to median)
Compared to same class
» 23% of all tested devices in this class were better, 5% similar, 72% worse
» The best had a delta of 5%, average was 18%, worst was 53%
Compared to all devices tested
» 14% of all tested devices were better, 4% similar, 83% worse
» The best had a delta of 4%, average was 23%, worst was 134%
Energy management - Power-hungry on occasion, frugal in the long run
Energy consumption
The maximum idle power consumption is 11 watts, which is on par with other OLED devices. Among other things, the maximum achievable brightness plays a role here, which is lower in our Zenbook than in the Yoga Slim or the Dell XPS 13. Unfortunate: The OLED-forced screensaver causes an unnecessarily high extra consumption of 6-8 watts in idle.
The Witcher 3 Ultra, i.e. maximum gaming load, is 54 watts, which is due to the moderately powerful iGPU. There's no peak at the beginning in graphics load, but there is for the processor part of the stress test with Prime95 and FurMark. The 100-watt power adapter isn't overtaxed during maximum load in the stress test. We measure 81 watts for a very short time at the start, and it then settles at 65-70 watts.
Power consumption with an external monitor shows one thing across the board: The SoC allows itself a 5-second peak of 80-85 watts at the start during CPU load, and then it constantly drops to 60-65 watts. Such a high initial kick-off isn't observed in the Intel Core i7-1185G7 (Dell XPS 13, Zenbook 14X Intel).
| Off / Standby | |
| Idle | |
| Load |
|
Key:
min: | |
| Asus ZenBook 14X UM5401QA-KN162 R7 5800H, Vega 8, Intel SSD 670p SSDPEKNU512GZ, OLED, 2880x1800, 14" | Dell XPS 13 9310 OLED i7-1185G7, Iris Xe G7 96EUs, Toshiba XG6 KXG60ZNV512G, OLED, 3456x2160, 13.4" | Asus ZenBook 14X OLED UX5400EA-L7154W i7-1165G7, GeForce MX450, Intel Optane Memory H10 with Solid State Storage 32GB + 1TB HBRPEKNX0203AH(L/H), OLED, 2880x1800, 14" | HP Envy 14-eb0010nr i5-1135G7, GeForce GTX 1650 Ti Max-Q, Samsung SSD PM981a MZVLB256HBHQ, IPS, 1920x1200, 14" | Asus Vivobook Pro 14 M3401QC-KM007T R5 5600H, GeForce RTX 3050 4GB Laptop GPU, Intel SSD 670p SSDPEKNU512GZ, OLED, 2880x1800, 14" | Lenovo Yoga Slim 7 Pro 14 OLED Ryzen 9 R9 5900HS, GeForce MX450, SK Hynix PC711 1TB HFS001TDE9X084N, OLED, 2880x1800, 14" | MSI Modern 14 B11SB-085 i7-1165G7, GeForce MX450, Kingston OM8PCP3512F-AB, IPS, 1920x1080, 14" | Average AMD Radeon RX Vega 8 (Ryzen 4000/5000) | Average of class Subnotebook | |
|---|---|---|---|---|---|---|---|---|---|
| Power Consumption | 22% | -17% | -40% | -15% | -39% | 6% | 19% | 29% | |
| Idle Minimum * (Watt) | 6.7 | 5.7 15% | 8.1 -21% | 4.2 37% | 6.6 1% | 9.5 -42% | 3 55% | 5.3 ? 21% | 3.78 ? 44% |
| Idle Average * (Watt) | 9.3 | 6 35% | 10 -8% | 18.3 -97% | 9.6 -3% | 14.1 -52% | 6.3 32% | 7.85 ? 16% | 6.57 ? 29% |
| Idle Maximum * (Watt) | 11.1 | 12.3 -11% | 11 1% | 19.2 -73% | 7.3 34% | 14.9 -34% | 10.3 7% | 9.31 ? 16% | 7.94 ? 28% |
| Load Average * (Watt) | 53.5 | 44.4 17% | 67.8 -27% | 72.9 -36% | 73 -36% | 79.5 -49% | 66 -23% | 44.2 ? 17% | 41.9 ? 22% |
| Witcher 3 ultra * (Watt) | 54.8 | 36.5 33% | 57 -4% 72.3 -32% | 61.5 -12% | 74.4 -36% | 73.5 -34% | 66.6 -22% | ||
| Load Maximum * (Watt) | 81 | 47.8 41% | 104 -28% | 127.8 -58% | 119 -47% | 98.5 -22% | 90.6 -12% | 58.9 ? 27% | 64.4 ? 20% |
* ... smaller is better
Energy consumption during our The Witcher 3 test / stress test
Energy consumption with an external monitor
Battery life
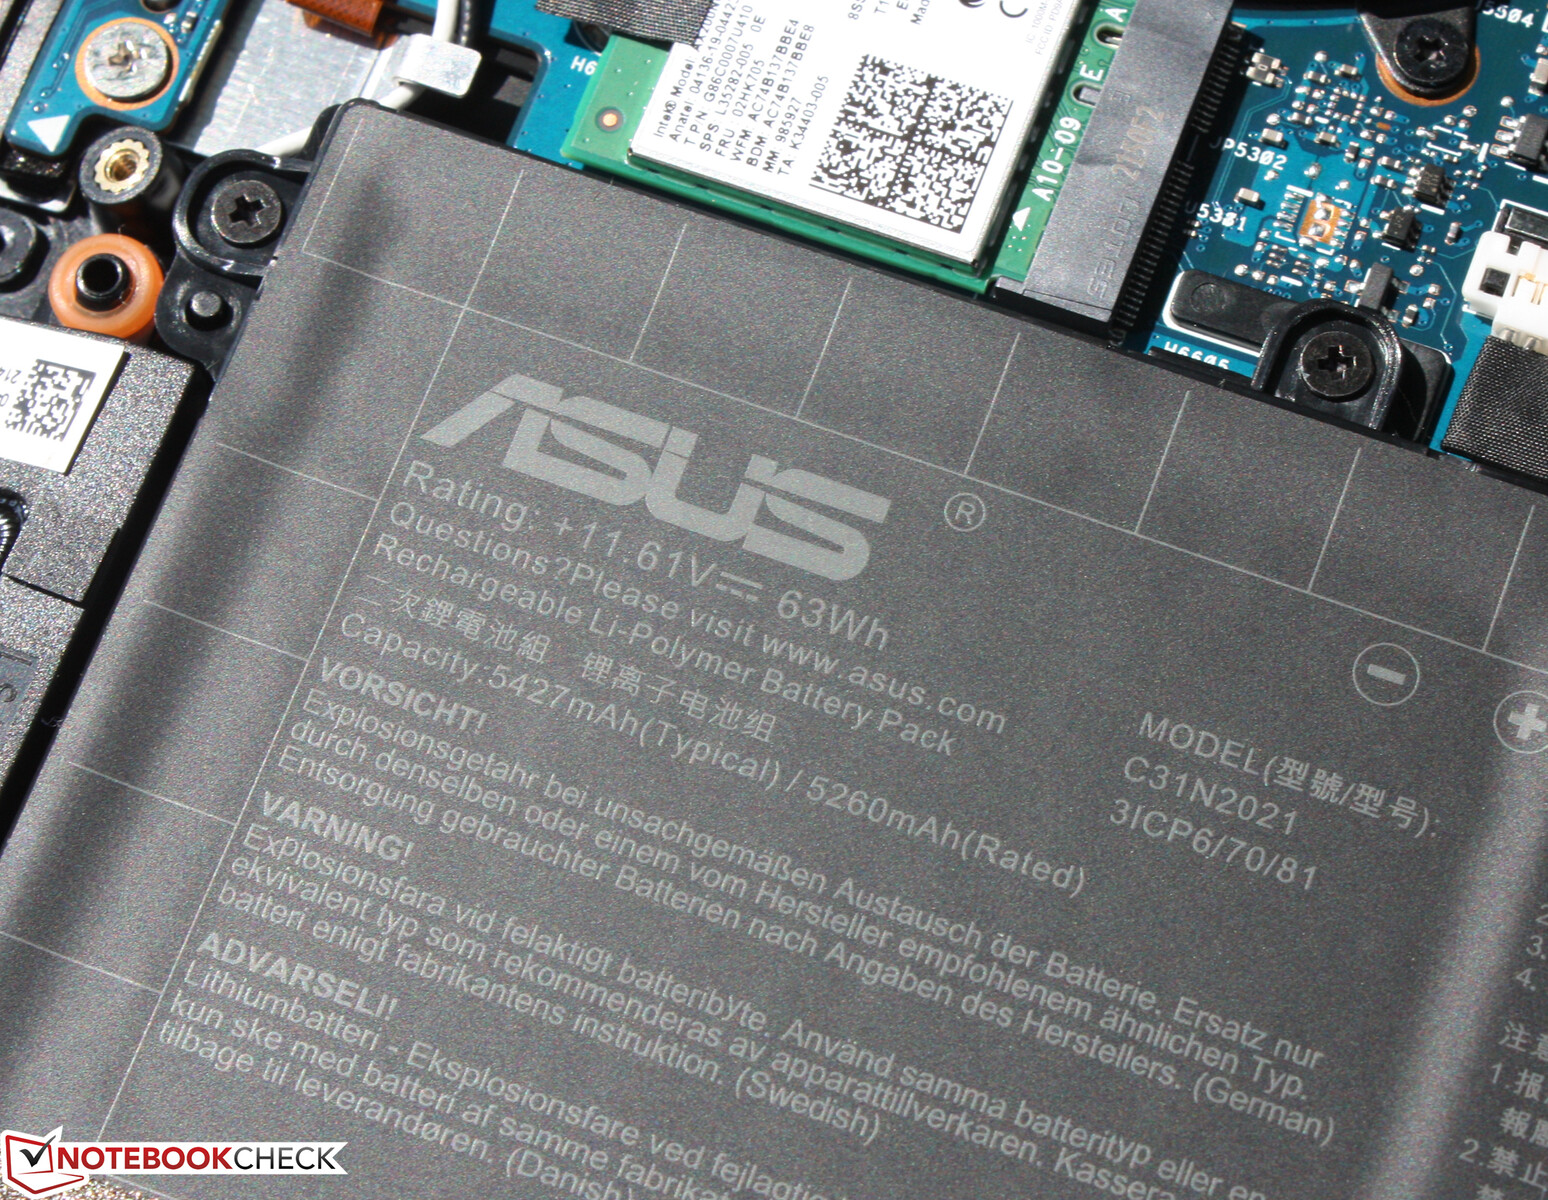
The 14-incher achieves a runtime of a good 8 hours in our real-world Wi-Fi test. A script is used to reproduce the load caused by accessing websites. The Intel version doesn't last as long: 5:30 hours with the same capacity. This is a very good result for an OLED 14-incher; other OLED models last 20% to 30% less.
| Asus ZenBook 14X UM5401QA-KN162 R7 5800H, Vega 8, 63 Wh | Dell XPS 13 9310 OLED i7-1185G7, Iris Xe G7 96EUs, 52 Wh | Asus ZenBook 14X OLED UX5400EA-L7154W i7-1165G7, GeForce MX450, 63 Wh | HP Envy 14-eb0010nr i5-1135G7, GeForce GTX 1650 Ti Max-Q, 63.3 Wh | Asus Vivobook Pro 14 M3401QC-KM007T R5 5600H, GeForce RTX 3050 4GB Laptop GPU, 63 Wh | Lenovo Yoga Slim 7 Pro 14 OLED Ryzen 9 R9 5900HS, GeForce MX450, 61 Wh | MSI Modern 14 B11SB-085 i7-1165G7, GeForce MX450, 52.4 Wh | Average of class Subnotebook | |
|---|---|---|---|---|---|---|---|---|
| Battery runtime | -22% | -20% | 12% | 17% | -34% | 5% | 46% | |
| WiFi v1.3 (h) | 8.3 | 6.5 -22% | 5.6 -33% | 10.8 30% | 9.5 14% | 5.5 -34% | 8.7 5% | 14 ? 69% |
| Load (h) | 1.6 | 1.5 -6% | 1.5 -6% | 1.9 19% | 1.969 ? 23% | |||
| Reader / Idle (h) | 11.3 | 27.7 | 11.5 | 28.6 ? | ||||
| Witcher 3 ultra (h) | 1.6 |
Pros
Cons
Verdict - Better battery life than with Intel

The AMD version of the ZenBook 14X OLED (UM5401QA-XXX) maintains the success of the Intel version, but it focuses on the price. The result is a high-quality entry-level ZenBook for around 1,000 Euros (~$1,022) that offers significantly longer battery life with an identical display and build quality. The case, input devices, and ports are identical to the Intel version except for the lack of Thunderbolt. The Intel version has the advantage of Thunderbolt 4 and a small dedicated MX450 GPU. This allows games to run a bit more smoothly.
The processing power leaves the Intel counterpart behind; the Ryzen APU has more boost and a higher constant processing power during longer periods of time. This comes along with higher volume under load - but this can be adjusted using the performance modes provided by Asus. If desired, the Zenbook 14X AMD can be as quiet as a whisper, even during high activity. The performance losses due to conservative settings are low.
Users who opt for the Zenbook 14X will get a lot of display coupled with strong 45-watt processing power, and a sturdy, high-quality build.
As before, we have to criticize the mandatory account for MyAsus: Users who don't register for one can't access essential performance, battery, and OLED settings. This is the only place where Performance mode can be activated, and the only place where we could disable the annoying OLED screensaver.
For 300 Euros (~$306) more, there's the entry-level Intel version of the Zenbook 14X without a dGPU, but it already comes with a Core i7 and 512 GB of storage. If you want the MX450, you'll have to spend a minimum of 1,800 Euros (~$1,833). This big leap in price makes the AMD version (UM5401QA-XXX) interesting, even if Thunderbolt isn't included.
If OLED doesn't play a big role, then powerful 14-inchers like the Asus Zenbook 14 UX435EG (MX450) or the HP Envy 14-eb0010nr (GTX 1650 Ti Max-Q) come into question, where the Envy 14 has the better IPS display and the best graphics card by far in the comparison field.
Price and availability
Asus ZenBook 14X UM5401QA-KN162
- 08/30/2022 v7 (old)
Sebastian Jentsch
Price comparison

