Asus Zenbook 14X OLED pre-production unit review: That's some punchy colors!

Asus has made brightness a top priority for 2021: Many of its laptop series will now be equipped with an OLED display by default. This brings the OLED technology and 3K/4K resolution into the lower price ranges. Mid-range customers will start to seriously consider buying OLED panels now that the difference to devices without OLED is no longer 500 Euros (~$581) but only 200 to 300 Euros (~$232 to ~$349).
That said, Asus doesn't offer mid-range hardware and workmanship with the Zenbook 14X. The chassis has above-average sturdiness and quality. The input devices including the ScreenPad (ClickPad = 2nd display) are first class, and the performance with the Core i7 and the GeForce MX450 is almost top of the line in the subnotebook league.
However, the competition doesn't sleep either and offers a powerful rival in the form of the Dell XPS 13 9310 OLED, for example. Is the only difference the absence of a dGPU? Do we have nothing but praise for the Zenbook 14X, or are there a few points of criticism? Find out in our review.
Possible contenders in comparison
Rating | Date | Model | Weight | Height | Size | Resolution | Price |
|---|---|---|---|---|---|---|---|
v (old) | 10 / 2021 | Asus Zenbook 14X UX5400E i7-1165G7, GeForce MX450 | 1.4 kg | 16.9 mm | 14.00" | 2880x1800 | |
| 88.3 % v7 (old) | 05 / 2021 | Dell XPS 13 9310 OLED i7-1185G7, Iris Xe G7 96EUs | 1.2 kg | 14.8 mm | 13.40" | 3456x2160 | |
v (old) | 09 / 2021 | Asus ZenBook 13 OLED UM325UA R7 5700U, Vega 8 | 1.1 kg | 14.8 mm | 13.30" | 1920x1080 | |
| 86.5 % v7 (old) | 02 / 2021 | HP Envy 14-eb0010nr i5-1135G7, GeForce GTX 1650 Ti Max-Q | 1.6 kg | 17.9 mm | 14.00" | 1920x1200 | |
| 85.3 % v7 (old) | 05 / 2021 | HP Envy 13-ba1475ng i7-1165G7, GeForce MX450 | 1.3 kg | 17 mm | 13.30" | 1920x1080 | |
| 84.1 % v7 (old) | 01 / 2021 | Asus Zenbook 14 UX435EG i7-1165G7, GeForce MX450 | 1.3 kg | 16.9 mm | 14.00" | 1920x1080 | |
| 84.2 % v7 (old) | 01 / 2021 | Lenovo IdeaPad Slim 9i 14ITL5 i7-1165G7, Iris Xe G7 96EUs | 1.3 kg | 14.6 mm | 14.00" | 3840x2160 | |
| 82.2 % v7 (old) | 07 / 2021 | MSI Modern 14 B11SB-085 i7-1165G7, GeForce MX450 | 1.3 kg | 16.9 mm | 14.00" | 1920x1080 |
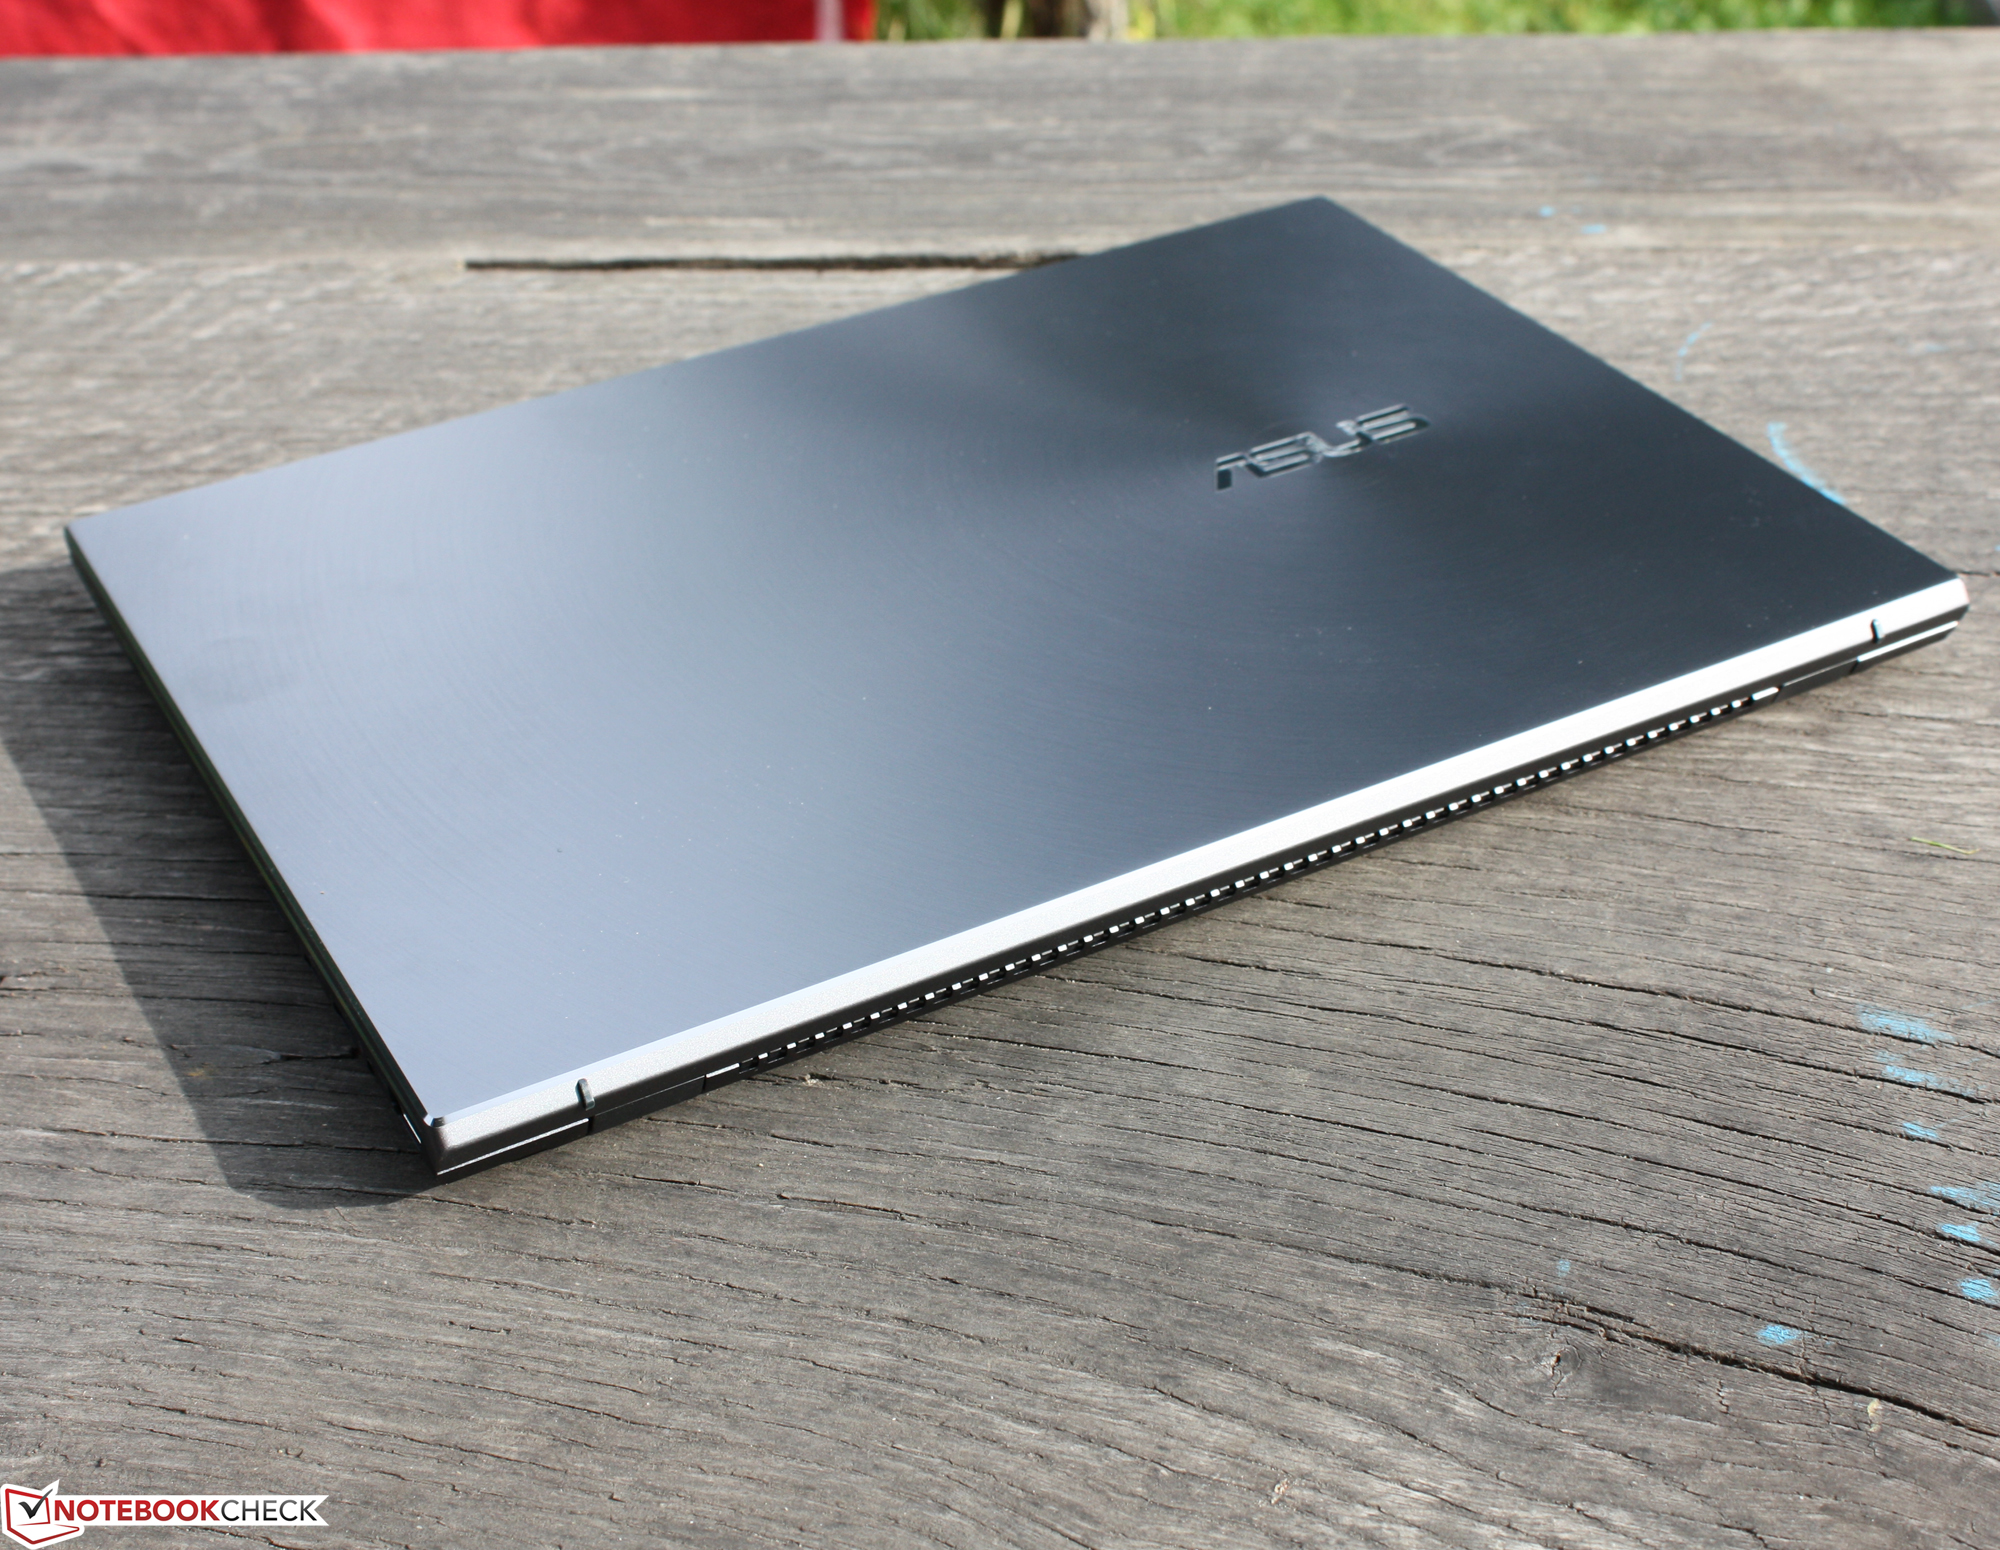
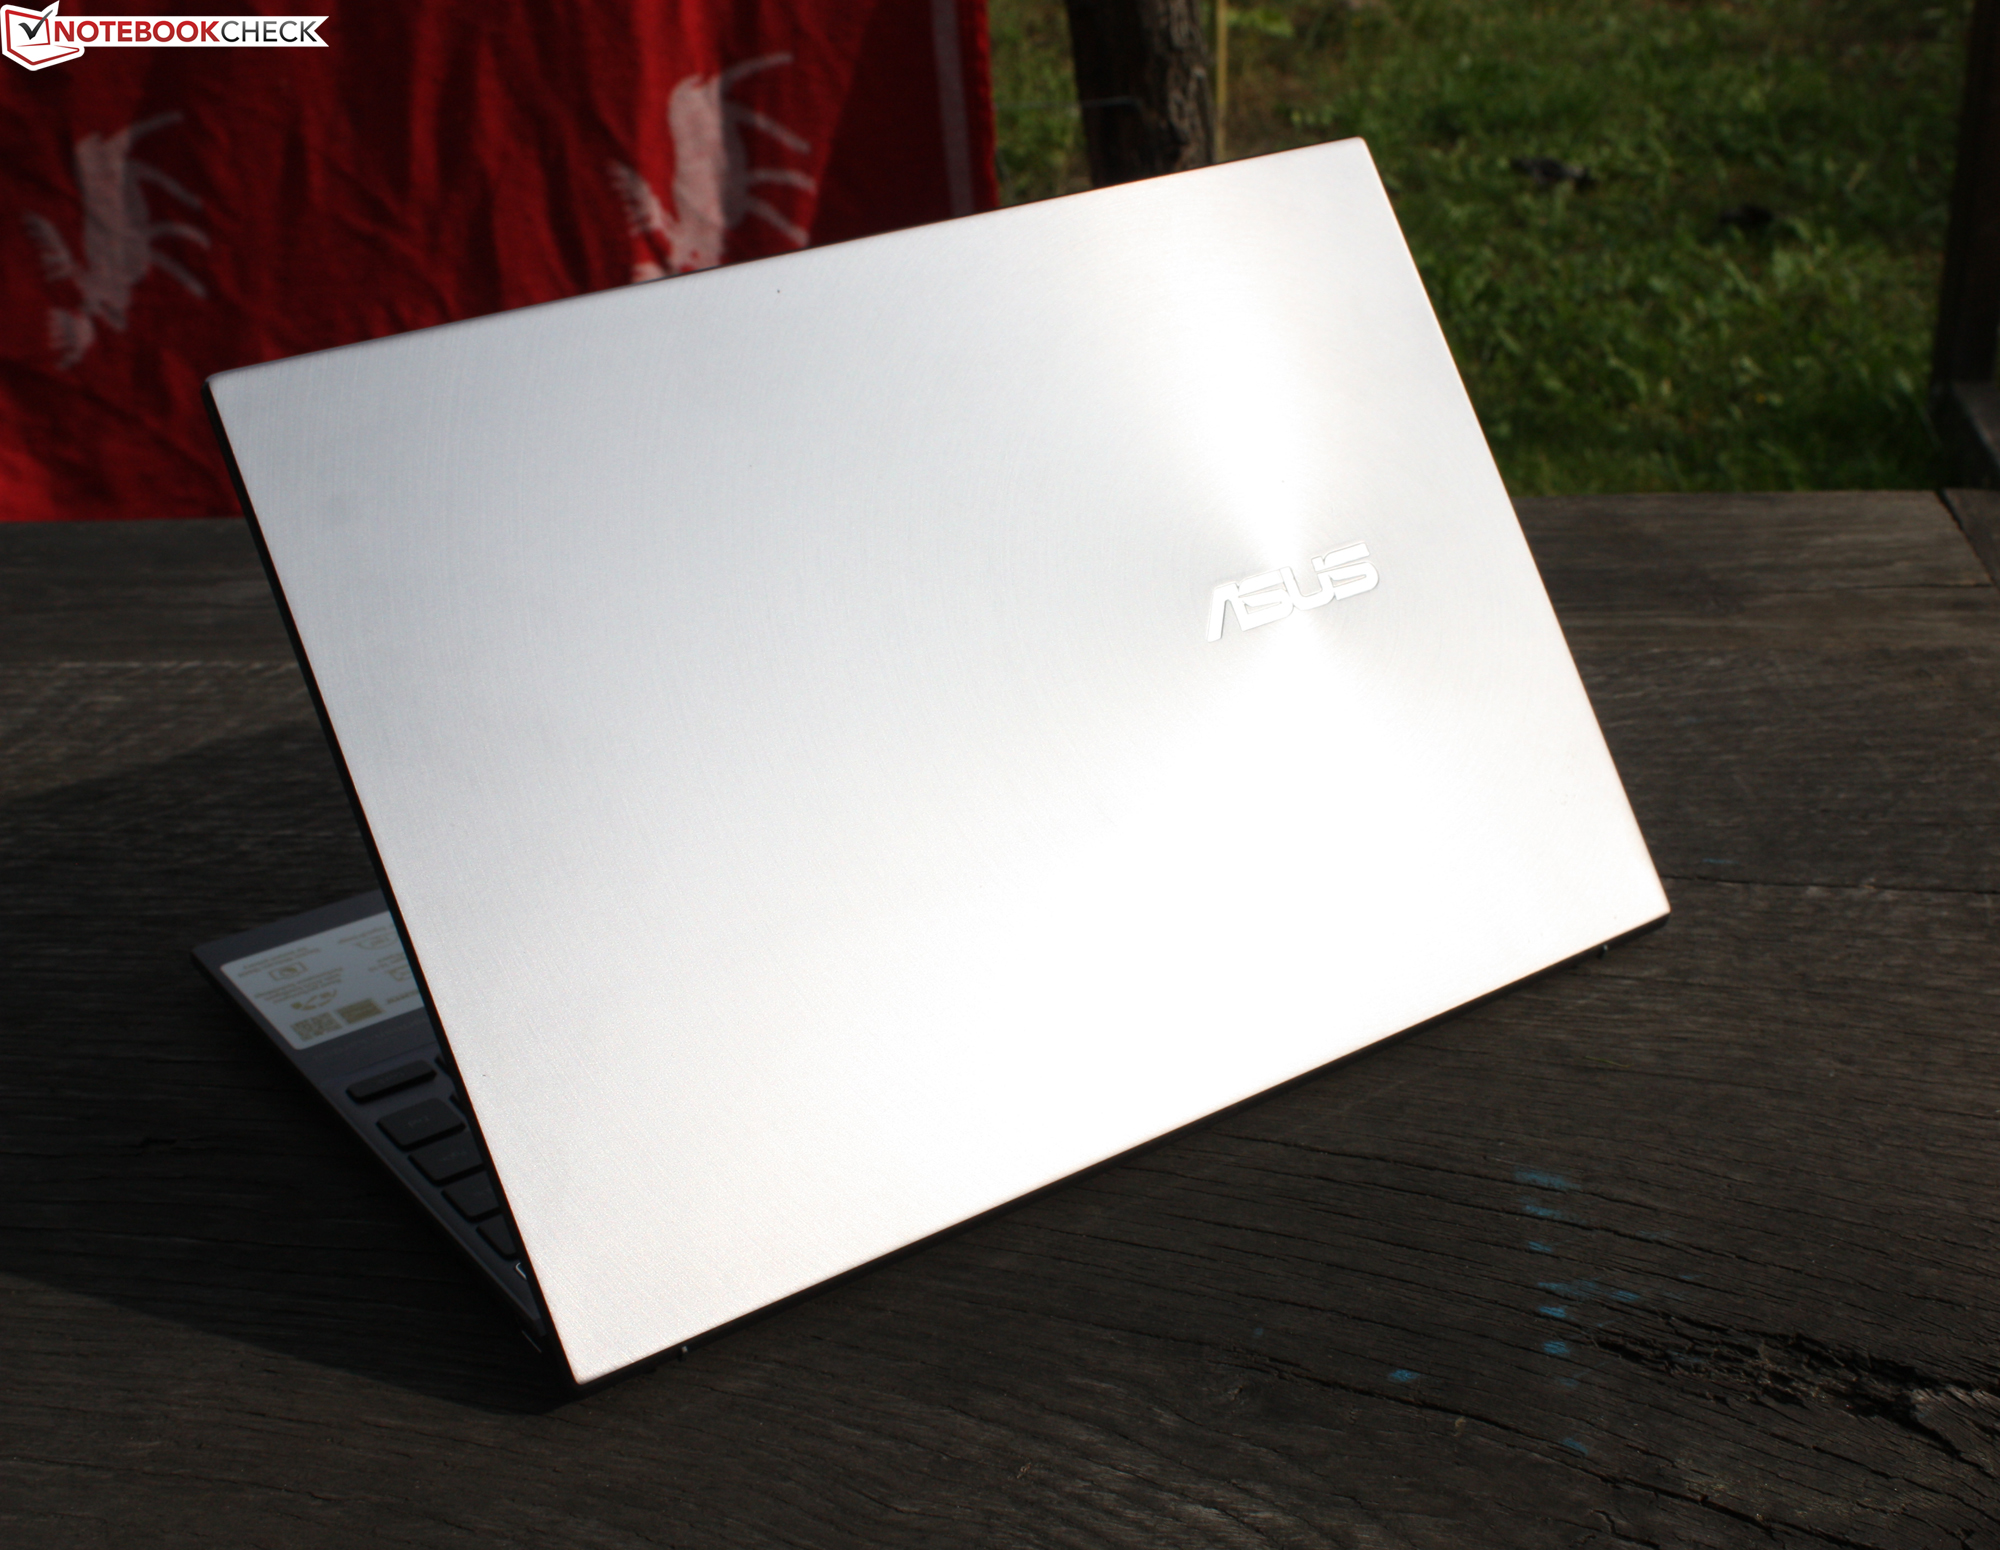
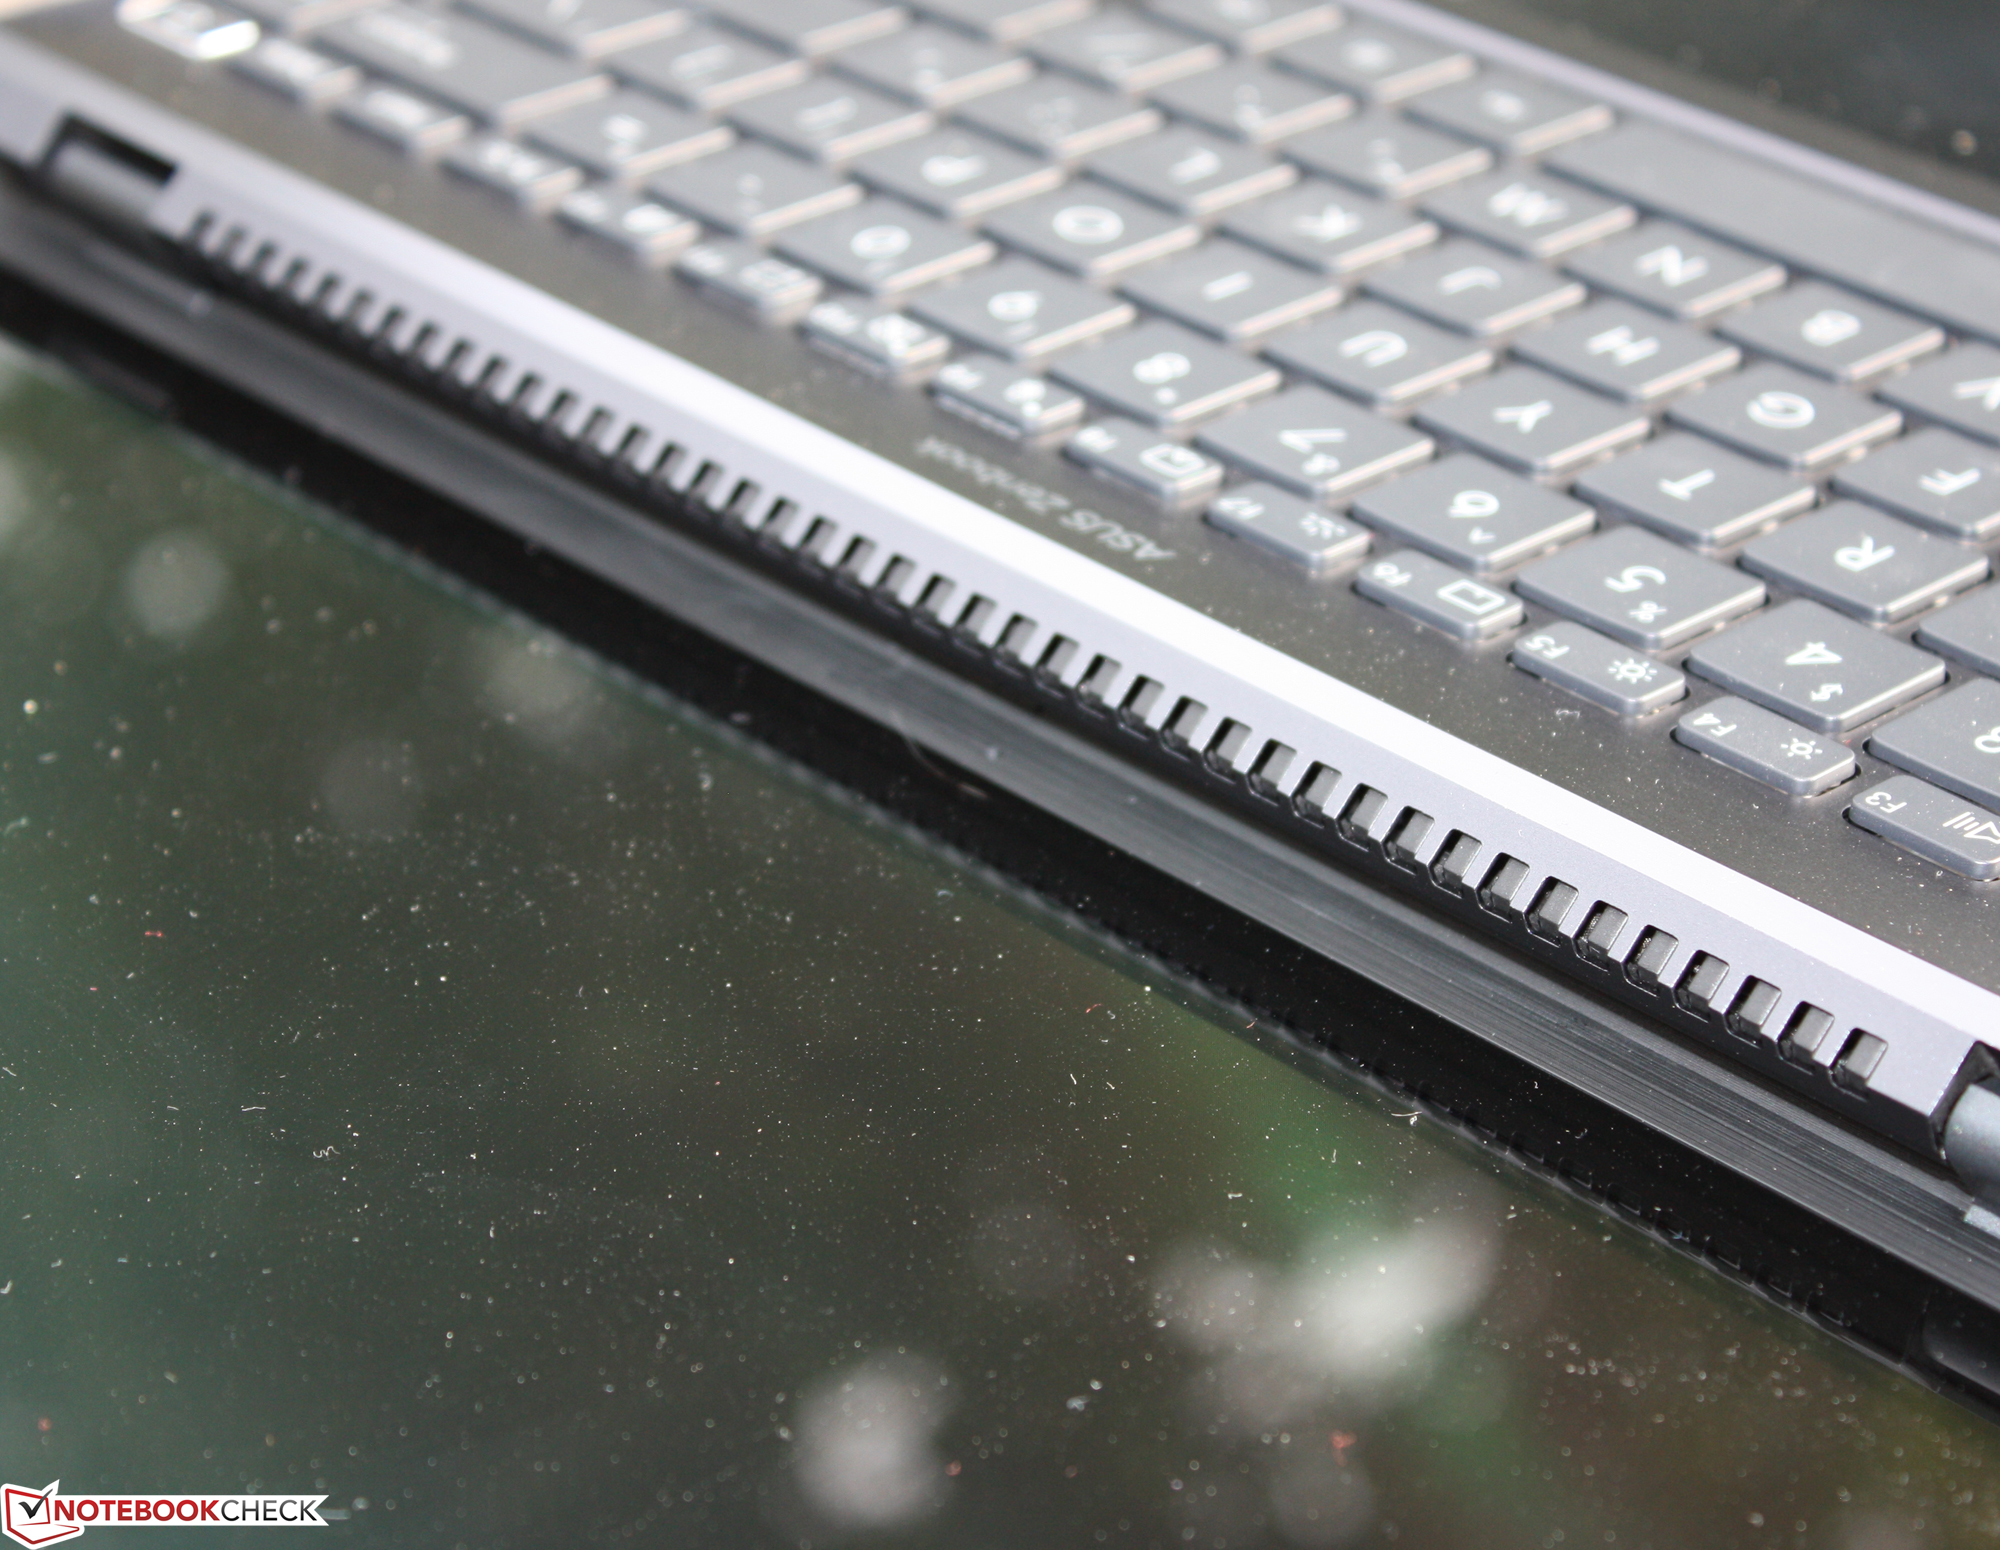
Case - High-quality laptop
The case alone is already rather impressive. Asus hasn't gone for the lightest possible case, but in return, it achieves an exceptionally torsion-resistant chassis. The lid can't be pressed in when applying normal force! That is extremely rare - even in the highest-quality subnotebooks. The aluminum back of the lid forms a seemingly indestructible unit with the integrated display panel (non-touch).
The rigorous quality extends to the hinges: The closed position is held magnetically to the base, and the lid can then be opened with one finger. After this, the hinges provide such a firm grip that everything stays in place when carrying or lifting the device.
The base, which is completely made of aluminum, is no different. It can only be pressed in a bit from underneath at certain points. The keyboard doesn't flex at any point, and the base itself is completely firm.
With its 1.4 kg, the Zenbook is among the heavier models. Only the HP Envy 14-eb0010nr exceeds it with 1.6 kg. The difference to the average of the lighter 14-inch and 13-inch devices is 100 grams. However, you receive a sturdier chassis in return. The thinnest model in our comparison is the Dell XPS 13 9310 OLED with 14.8 mm and only 1.2 kg.
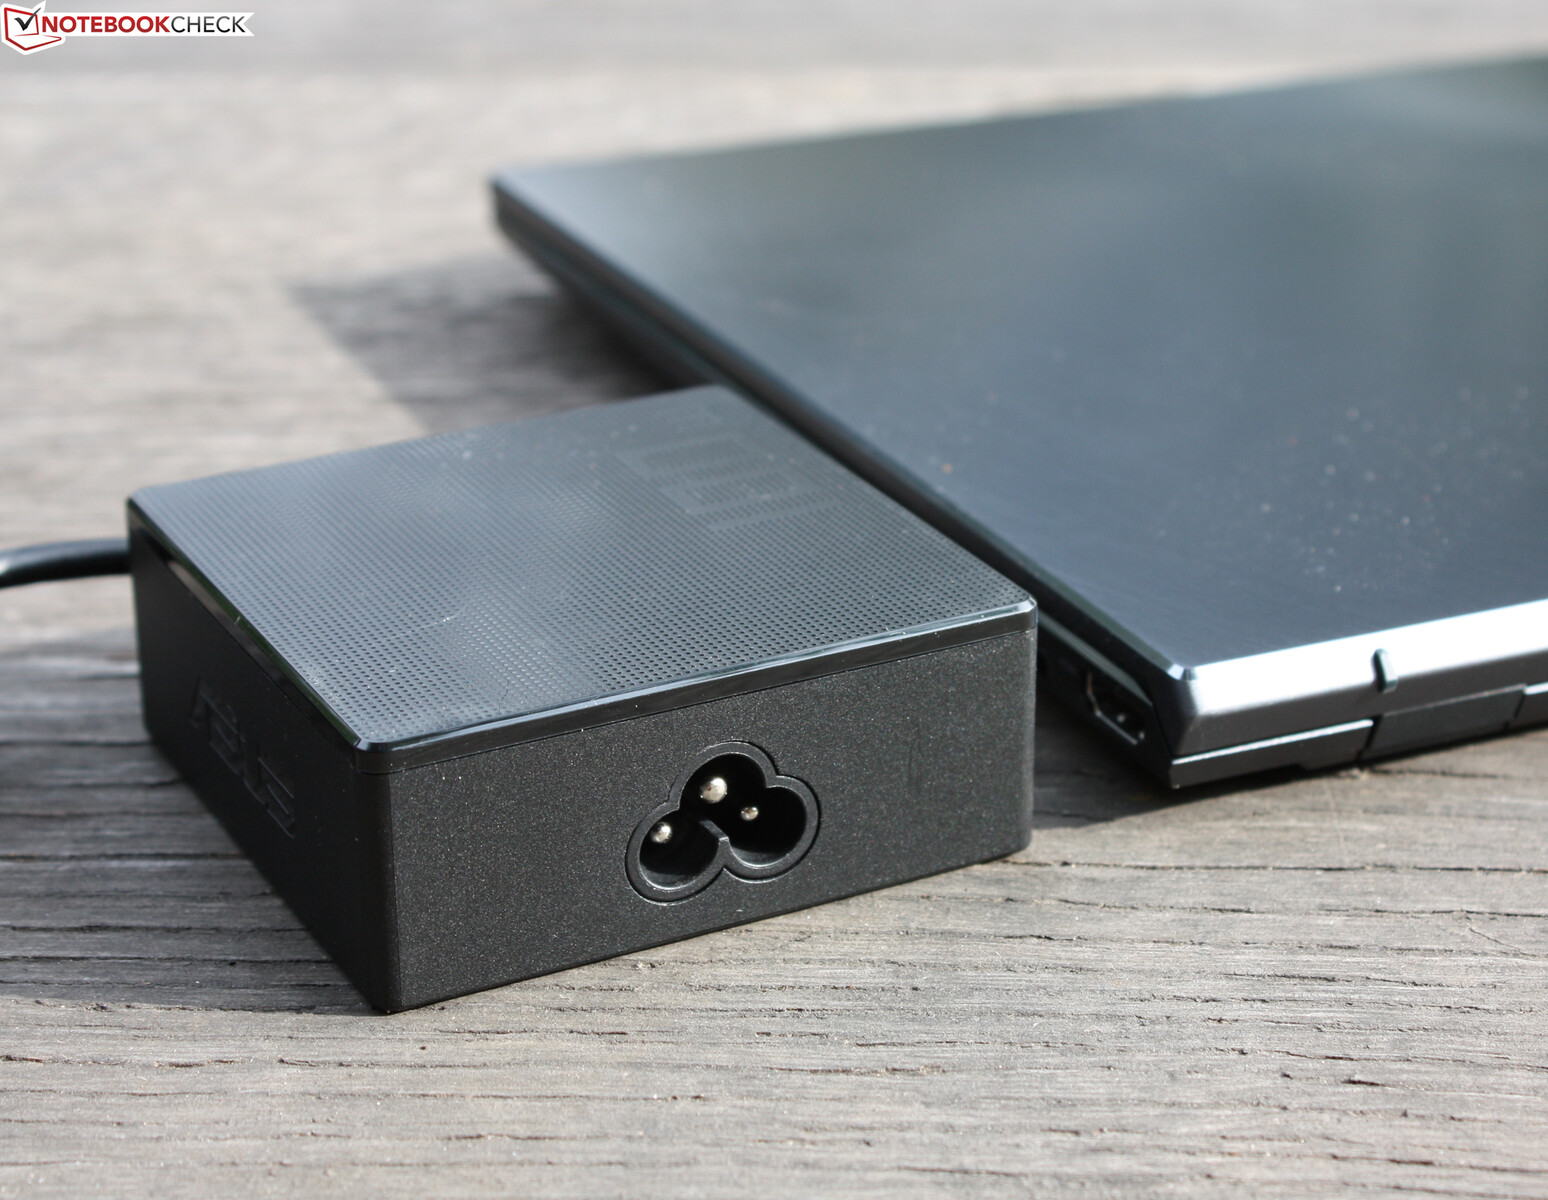
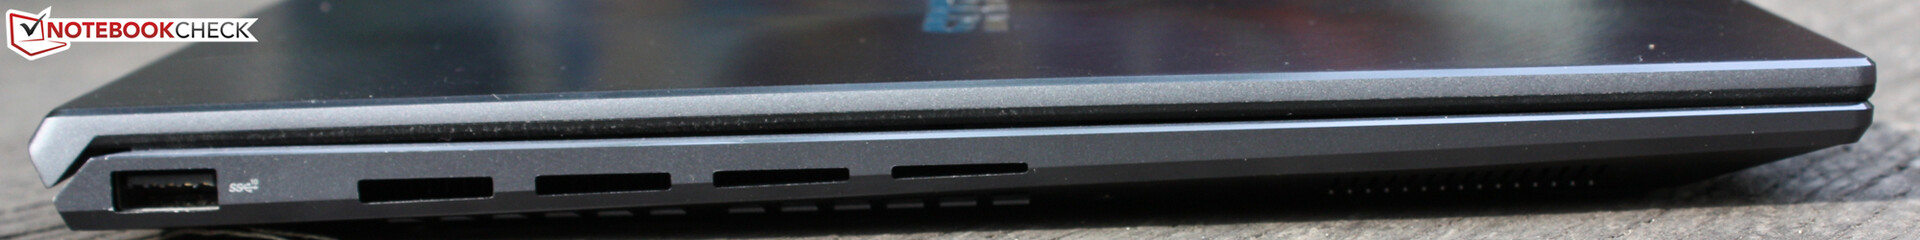
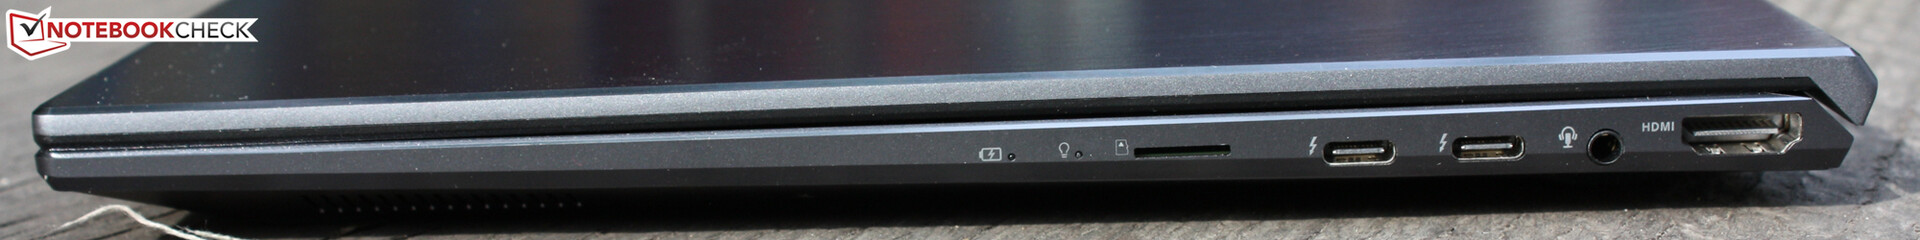
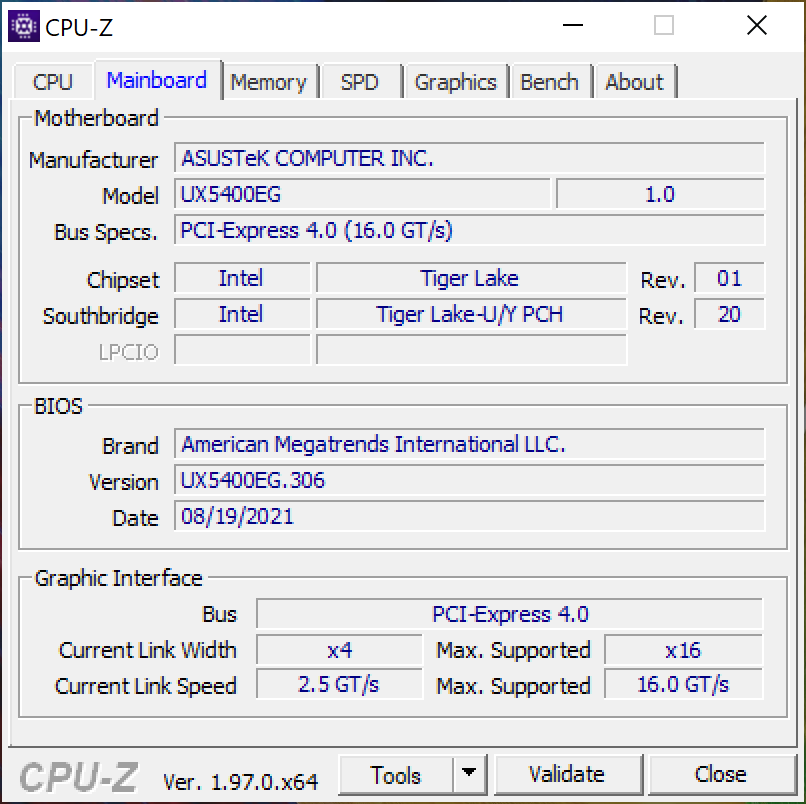
Connectivity - Asus device with Thunderbolt 4
Asus provides two Type-C Thunderbolt 4 ports. They can output an image signal (DisplayPort) as well be used to connect the power adapter (100 watts). Including HDMI, three displays can be connected. In practice, however, it will be limited to two if the Type-C charger is used at the same time.
SD card reader
Like its counterparts, the micro SD reader performs averagely, but not very well. We tested it with the 128 GB AV PRO V60 microSD.
| SD Card Reader | |
| average JPG Copy Test (av. of 3 runs) | |
| Dell XPS 13 9310 OLED (AV PRO microSD 128 GB V60) | |
| Asus Zenbook 14 UX435EG (Toshiba Exceria Pro M501 microSDXC 64GB) | |
| HP Envy 13-ba1475ng (AV Pro V60) | |
| Average of class Subnotebook (23.7 - 188, n=9, last 2 years) | |
| HP Envy 14-eb0010nr (Toshiba Exceria Pro M501 microSDXC 32GB) | |
| Asus Zenbook 14X UX5400E (AV Pro SD microSD 128 GB V60) | |
| MSI Modern 14 B11SB-085 (Toshiba Exceria Pro M501 microSDXC 64GB) | |
| maximum AS SSD Seq Read Test (1GB) | |
| Dell XPS 13 9310 OLED (AV PRO microSD 128 GB V60) | |
| Average of class Subnotebook (24.9 - 195, n=8, last 2 years) | |
| Asus Zenbook 14 UX435EG (Toshiba Exceria Pro M501 microSDXC 64GB) | |
| HP Envy 13-ba1475ng (AV Pro V60) | |
| HP Envy 14-eb0010nr (Toshiba Exceria Pro M501 microSDXC 32GB) | |
| Asus Zenbook 14X UX5400E (AV Pro SD microSD 128 GB V60) | |
| MSI Modern 14 B11SB-085 (Toshiba Exceria Pro M501 microSDXC 64GB) | |
Communication
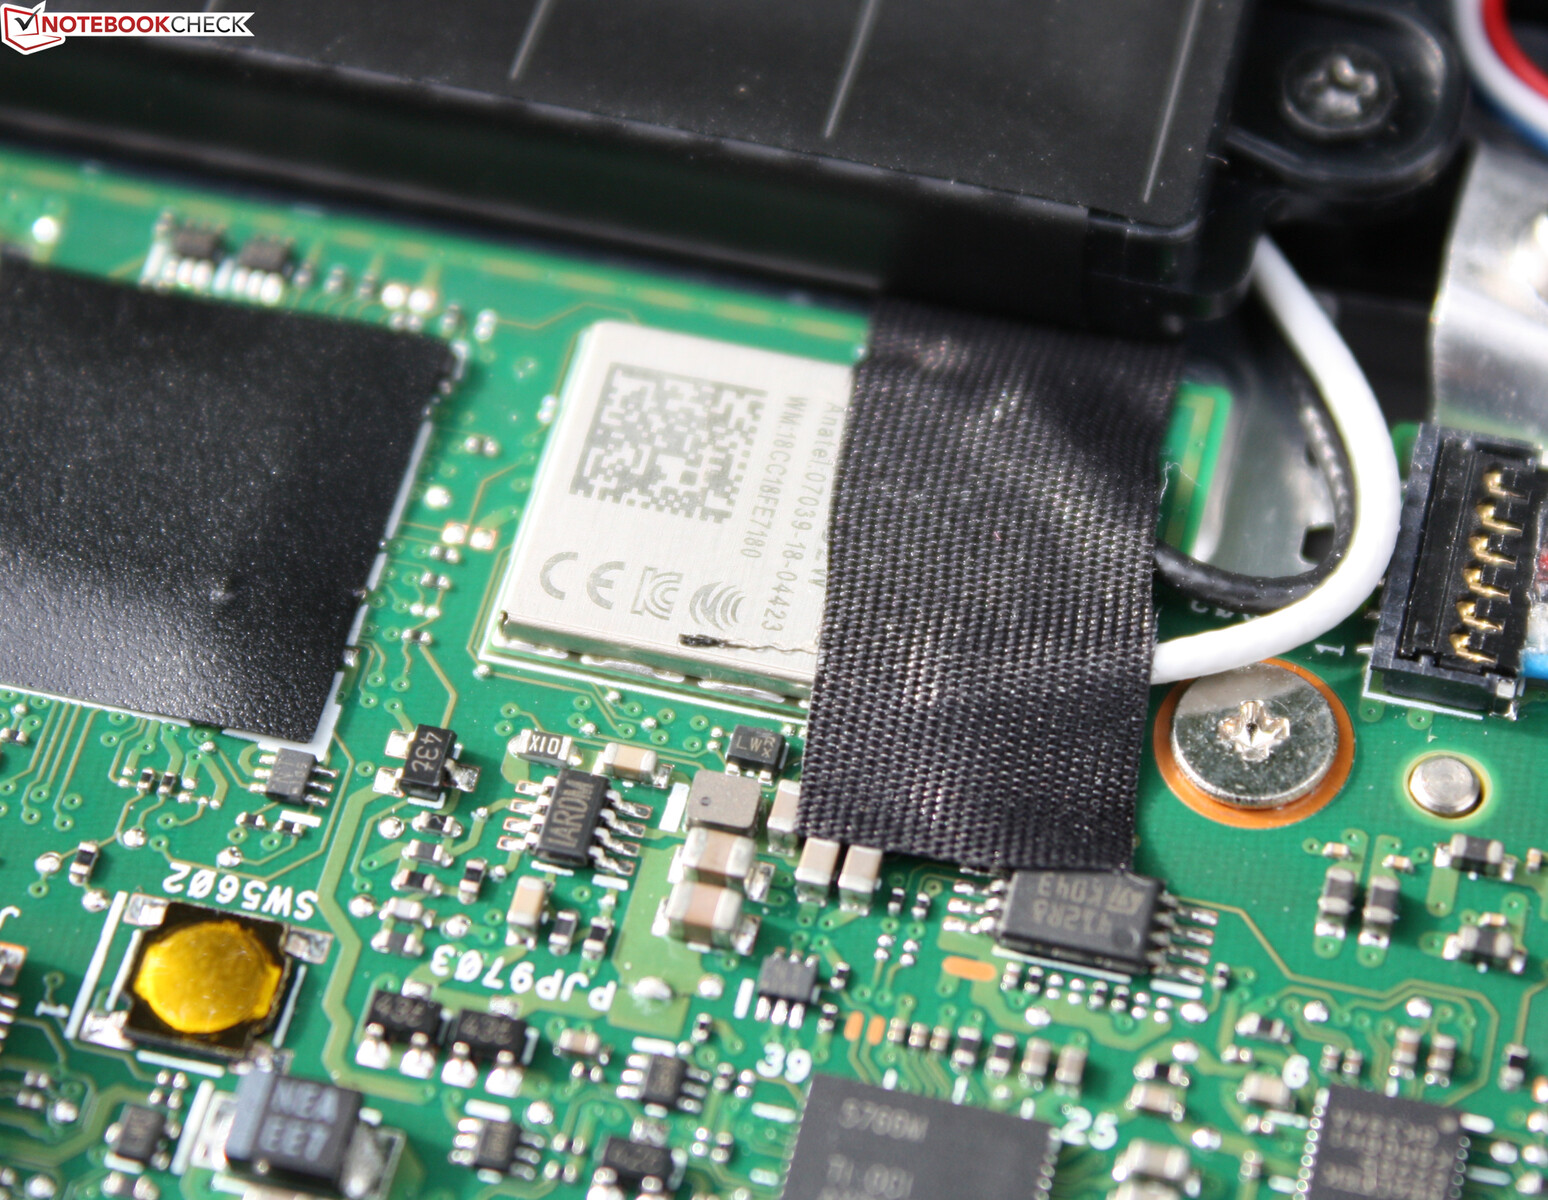
The Intel AX201 Wi-Fi chip is integrated into the device, so it can't be replaced. In our test, the transfer rates are repeatedly clearly below average, so they don't represent what an AX201 is usually capable of. We attribute this to a suboptimal driver configuration in our pre-production sample and expect better results in production models.
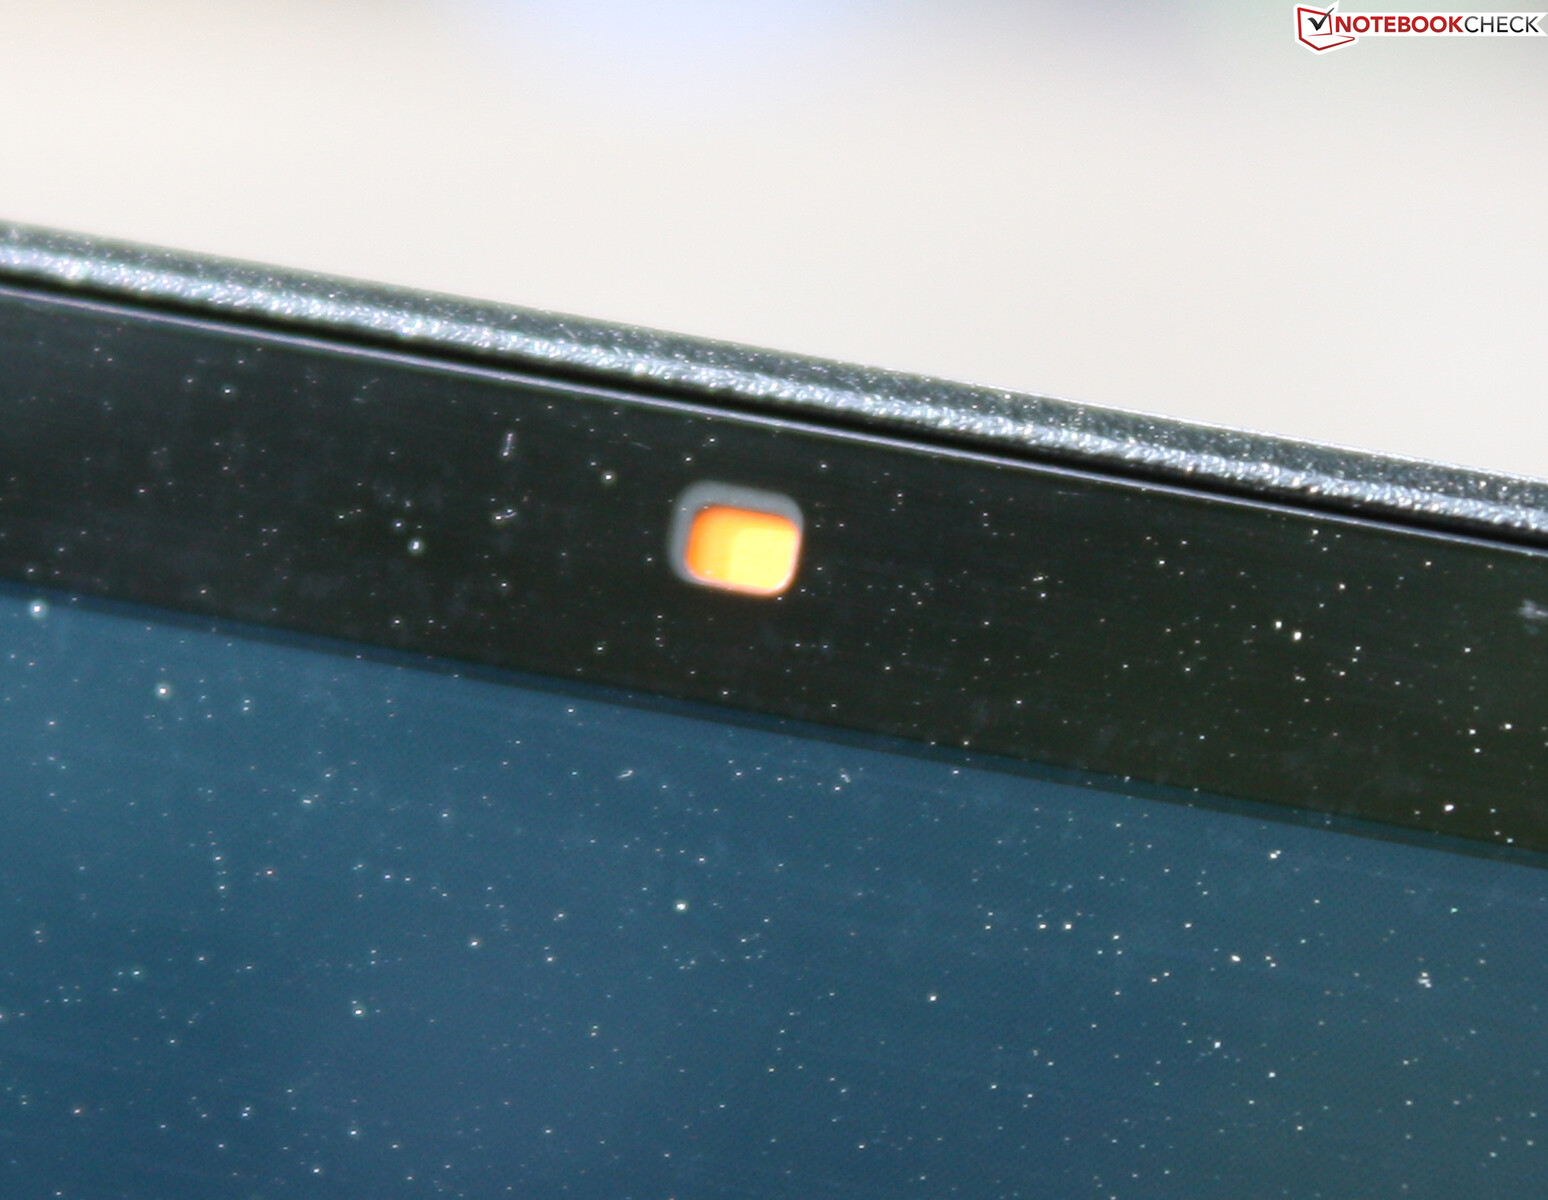
Webcam
The webcam in our review sample was unresponsive, and the electronic shutter (orange shutter in front of the camera) didn't respond to the corresponding Fn keys. We presume that this is a pre-production error.
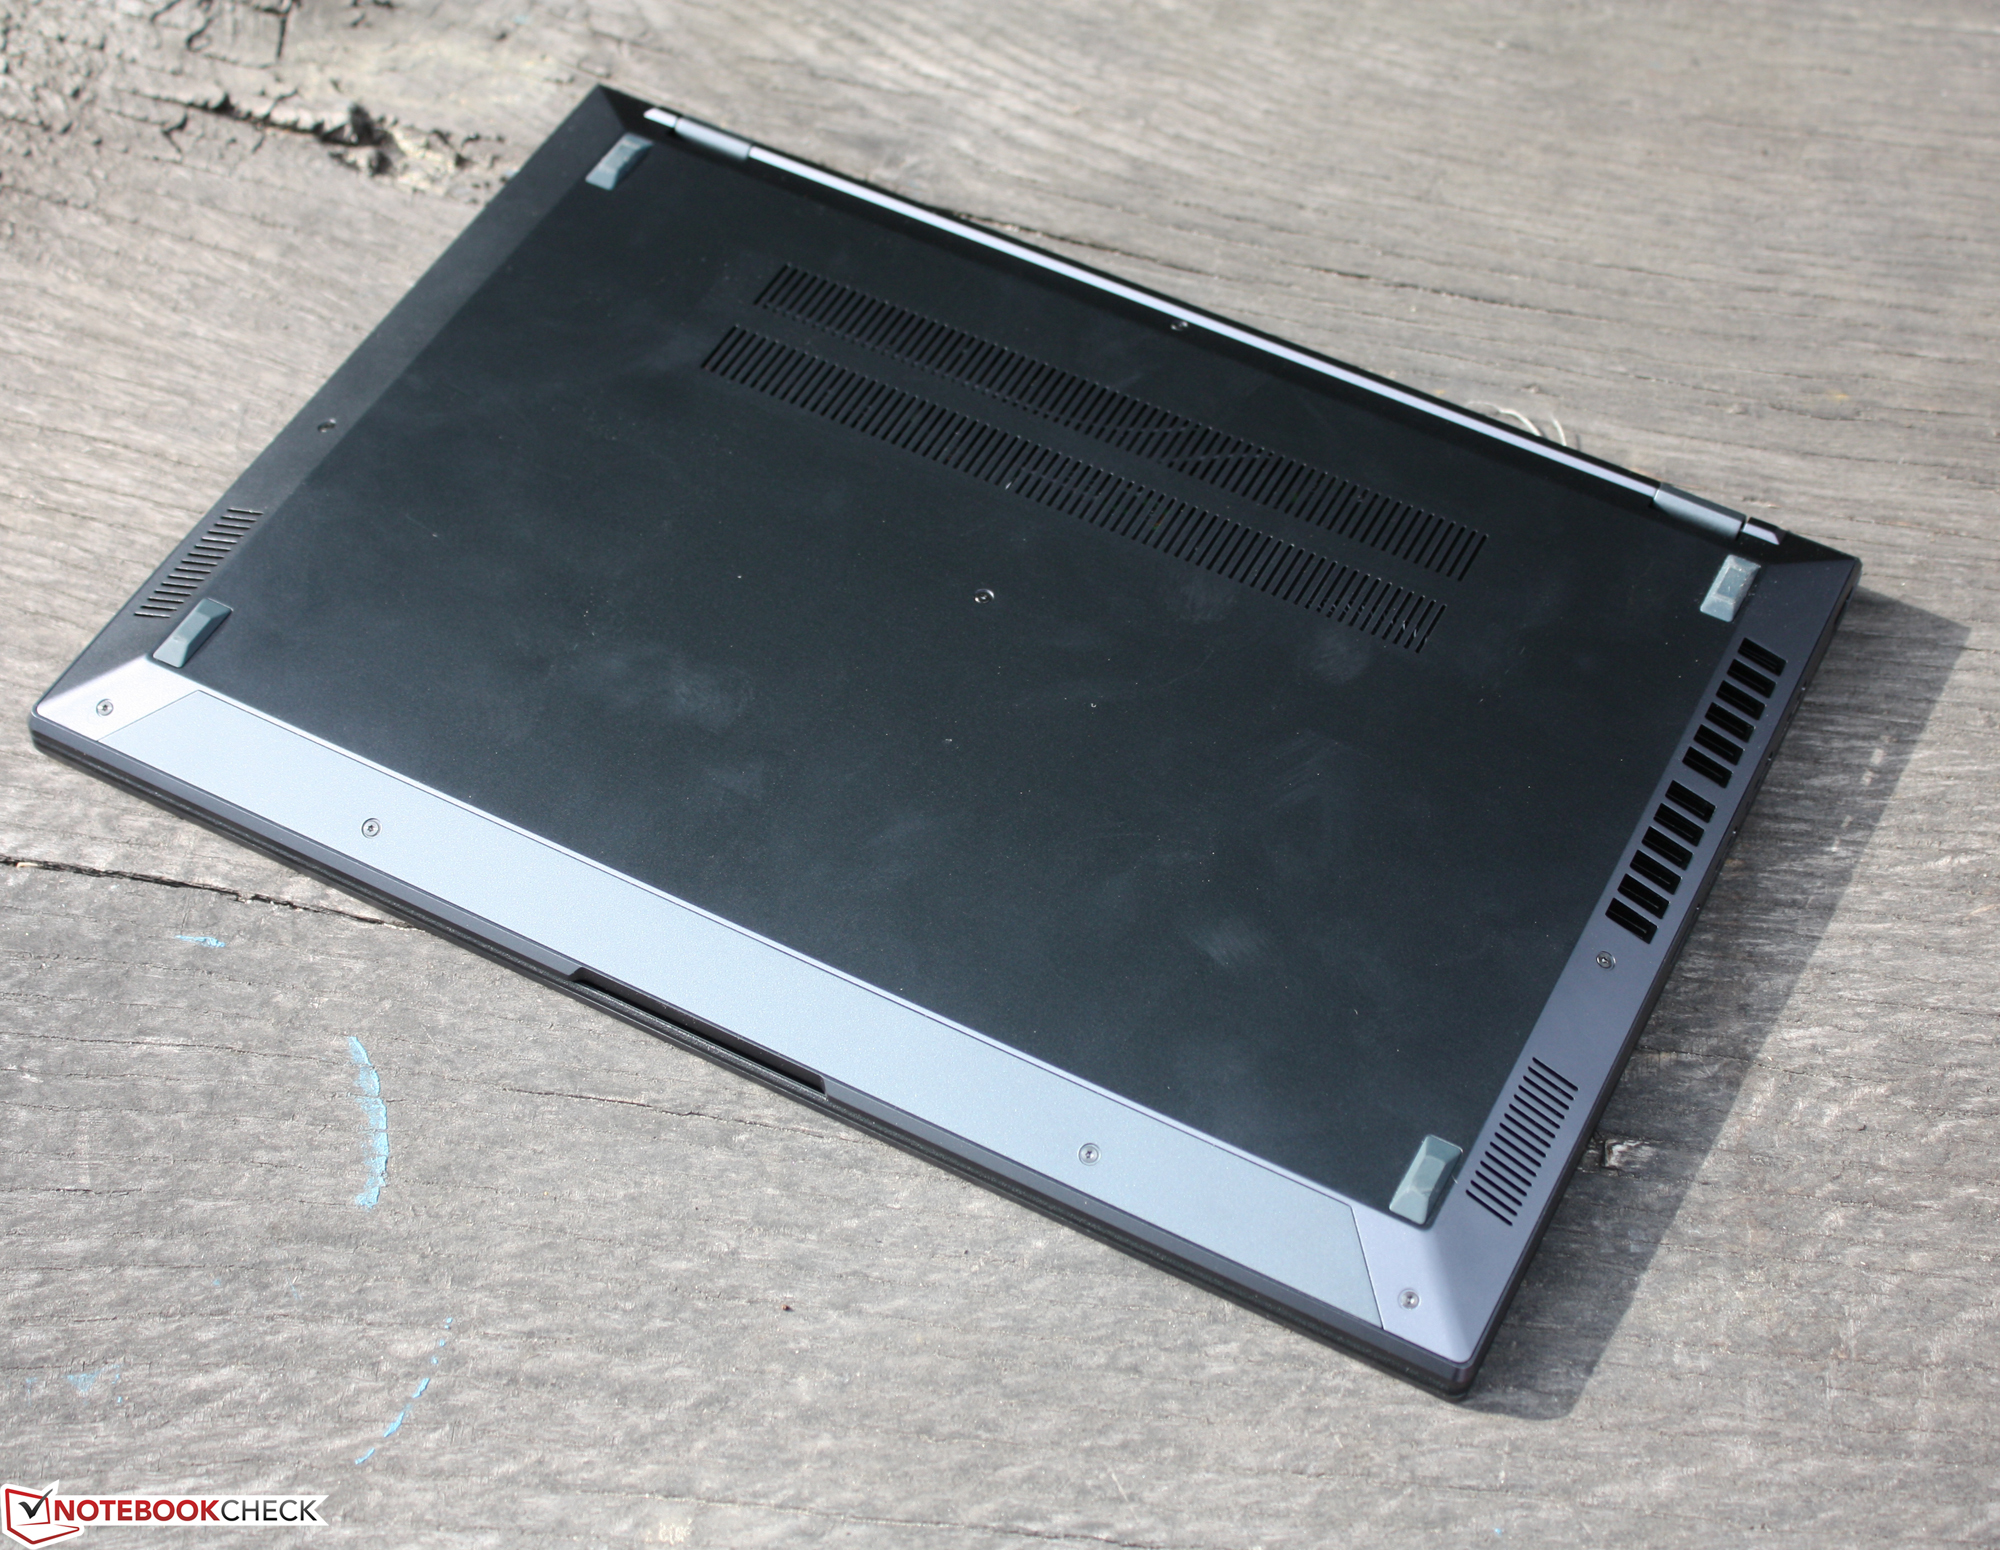
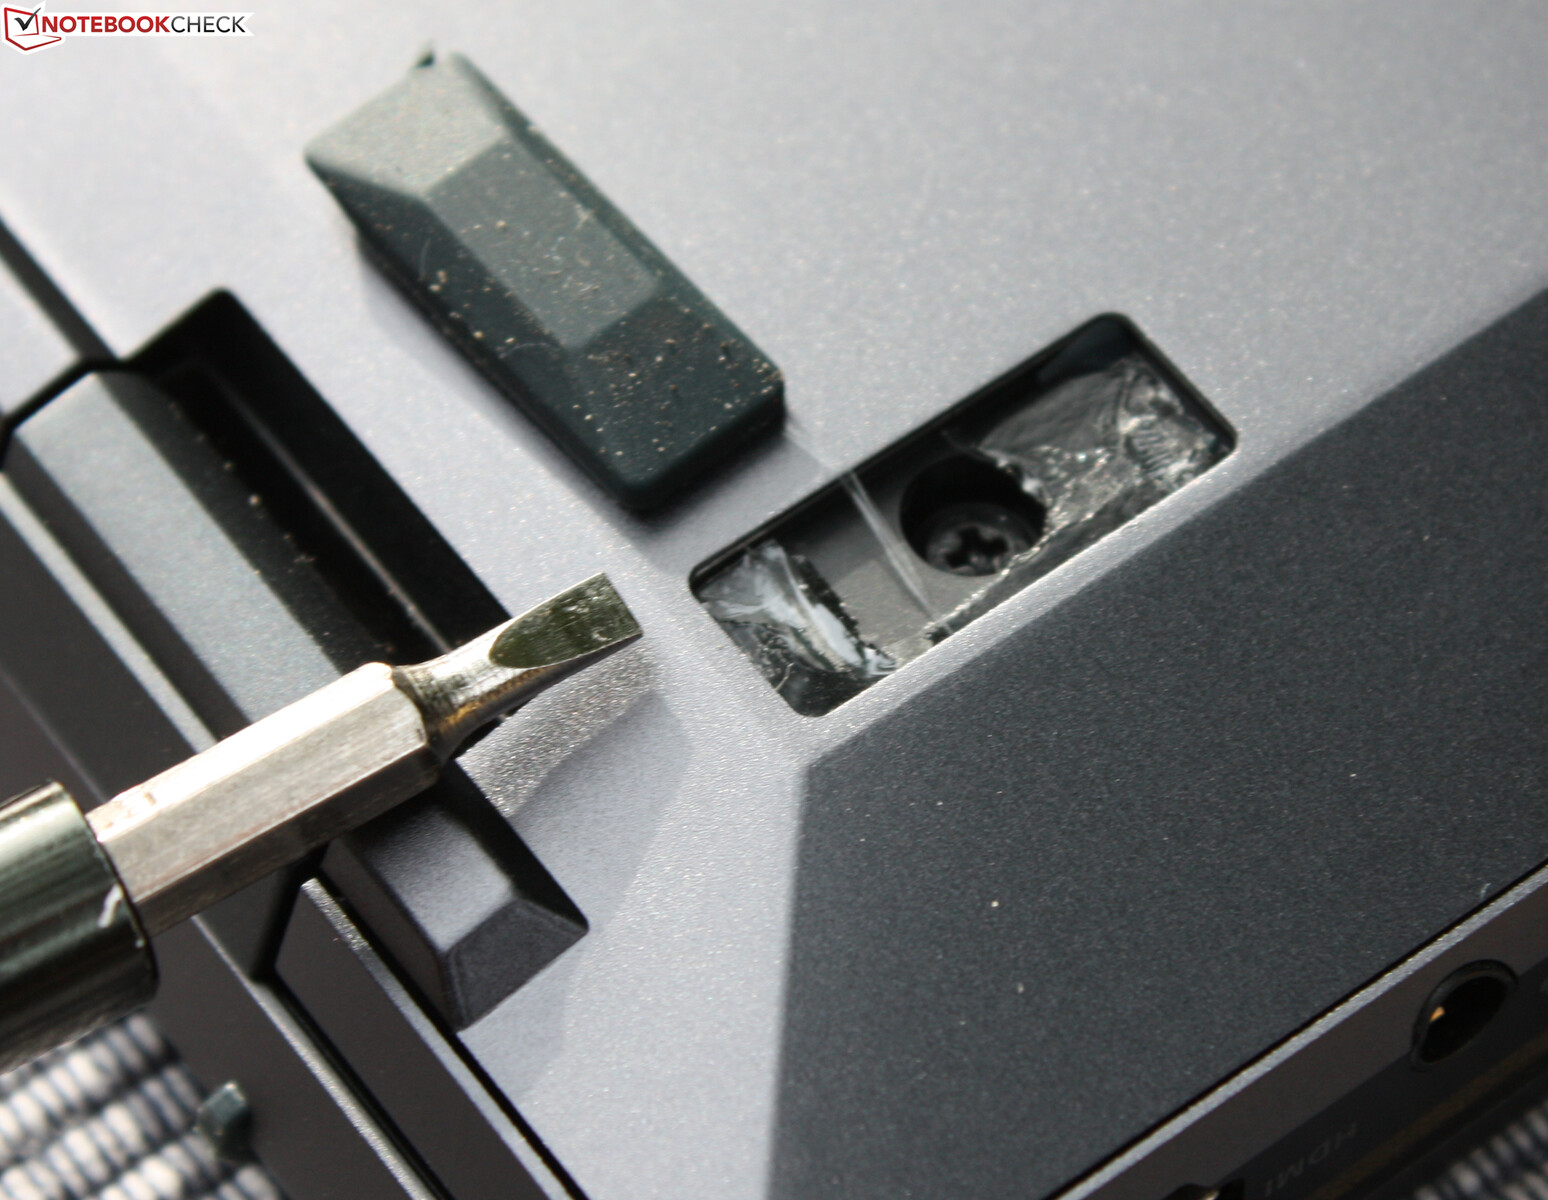
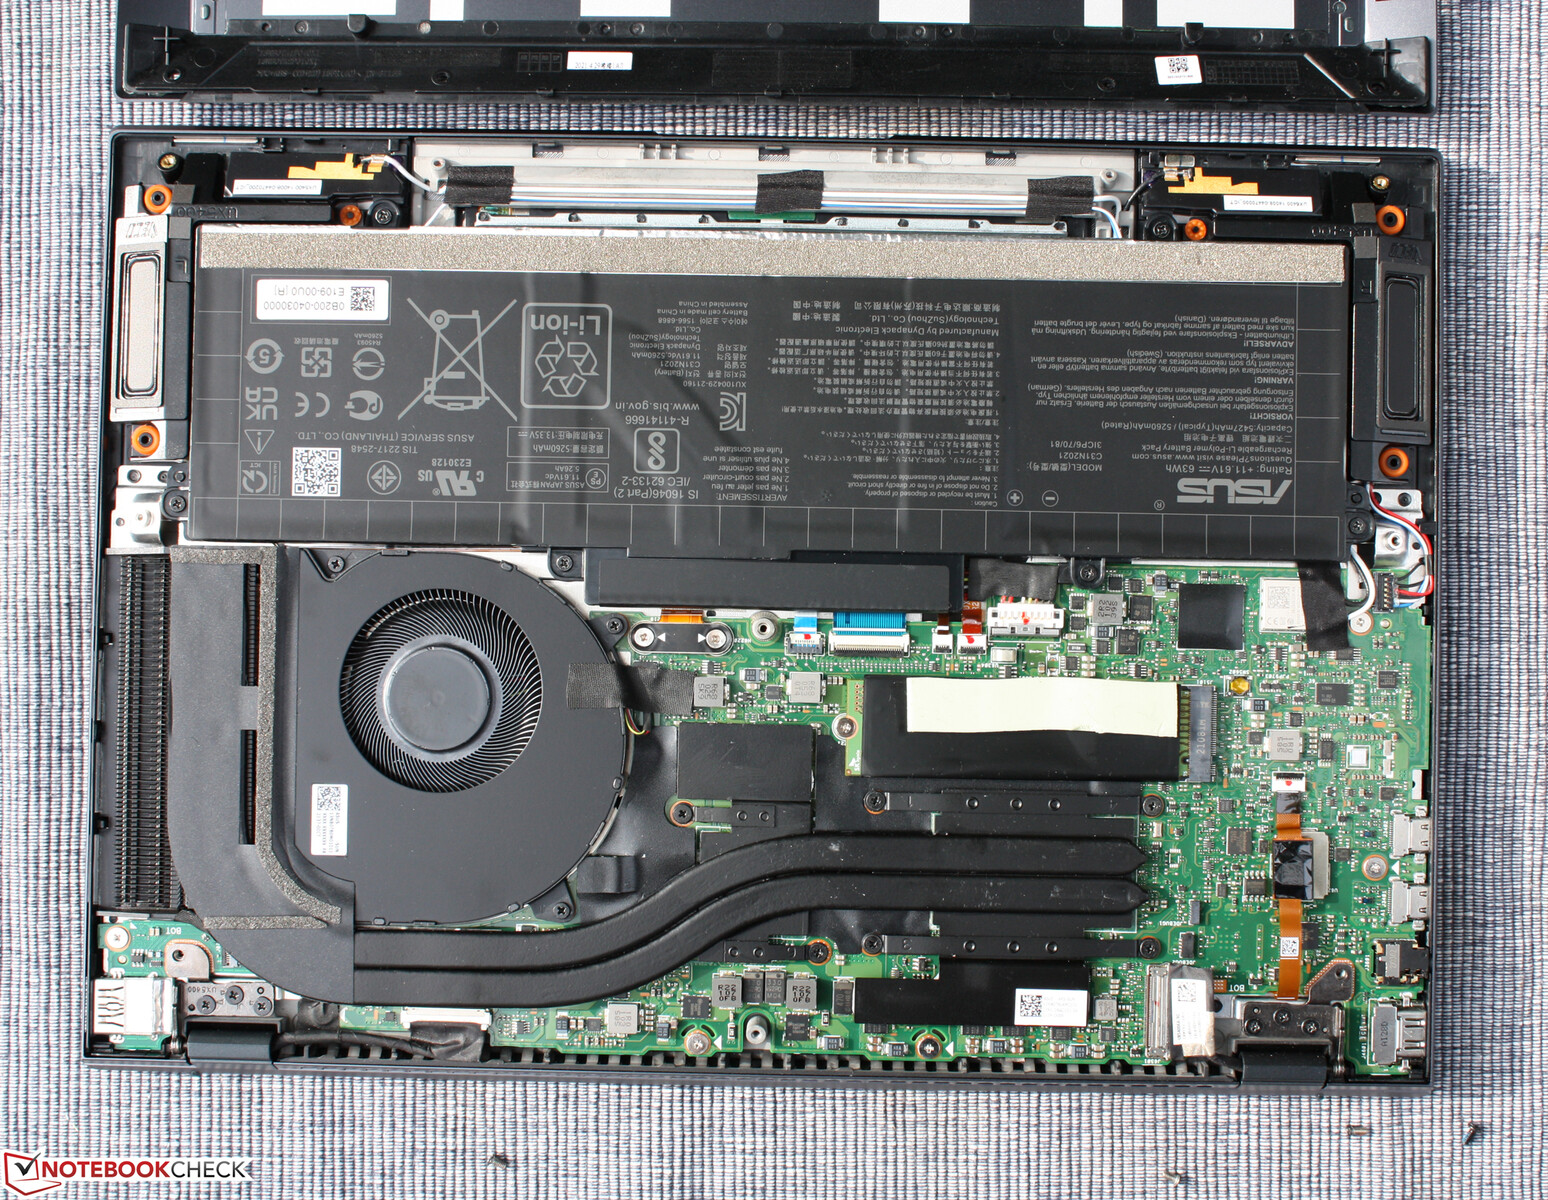
Maintenance
Opening the Zenbook is complicated because of the screws that hide under the rubber feet. Afterwards, the lid can be lifted off easily. However, there's not much to maintain here, since both the Wi-Fi module and RAM are soldered (no socket).
Security
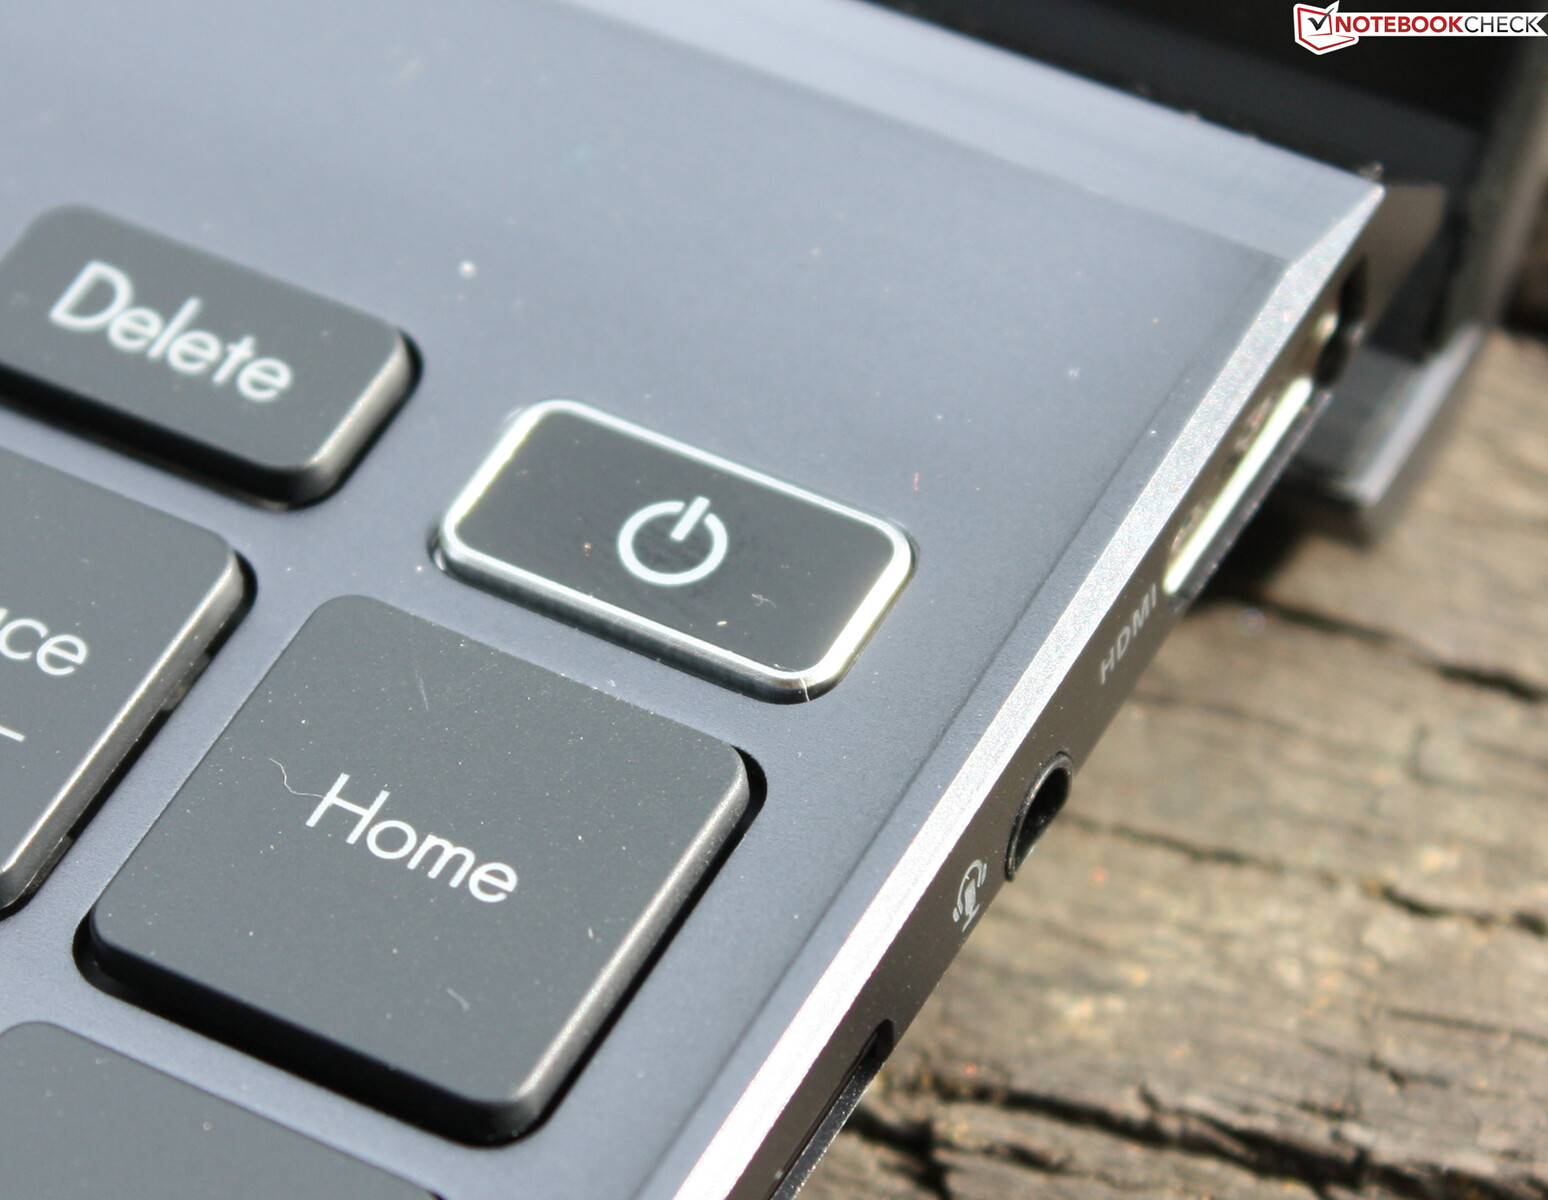
The power button has a fingerprint sensor that is very inconspicuous: You can log in quickly with the physical sensor, and no space is wasted for a separate fingerprint module. The TPM (Trusted Platform Module) firmware on the motherboard has been standard for a while and is a basic requirement for Windows 11. In some ways, this crypto processor behaves like a permanently installed smart card, but it's tied to the local computer instead of a user.
Warranty
The Zenbook 14X is not available in stores in Germany yet. Asus normally offers a two-year Pickup and Return warranty in Germany.
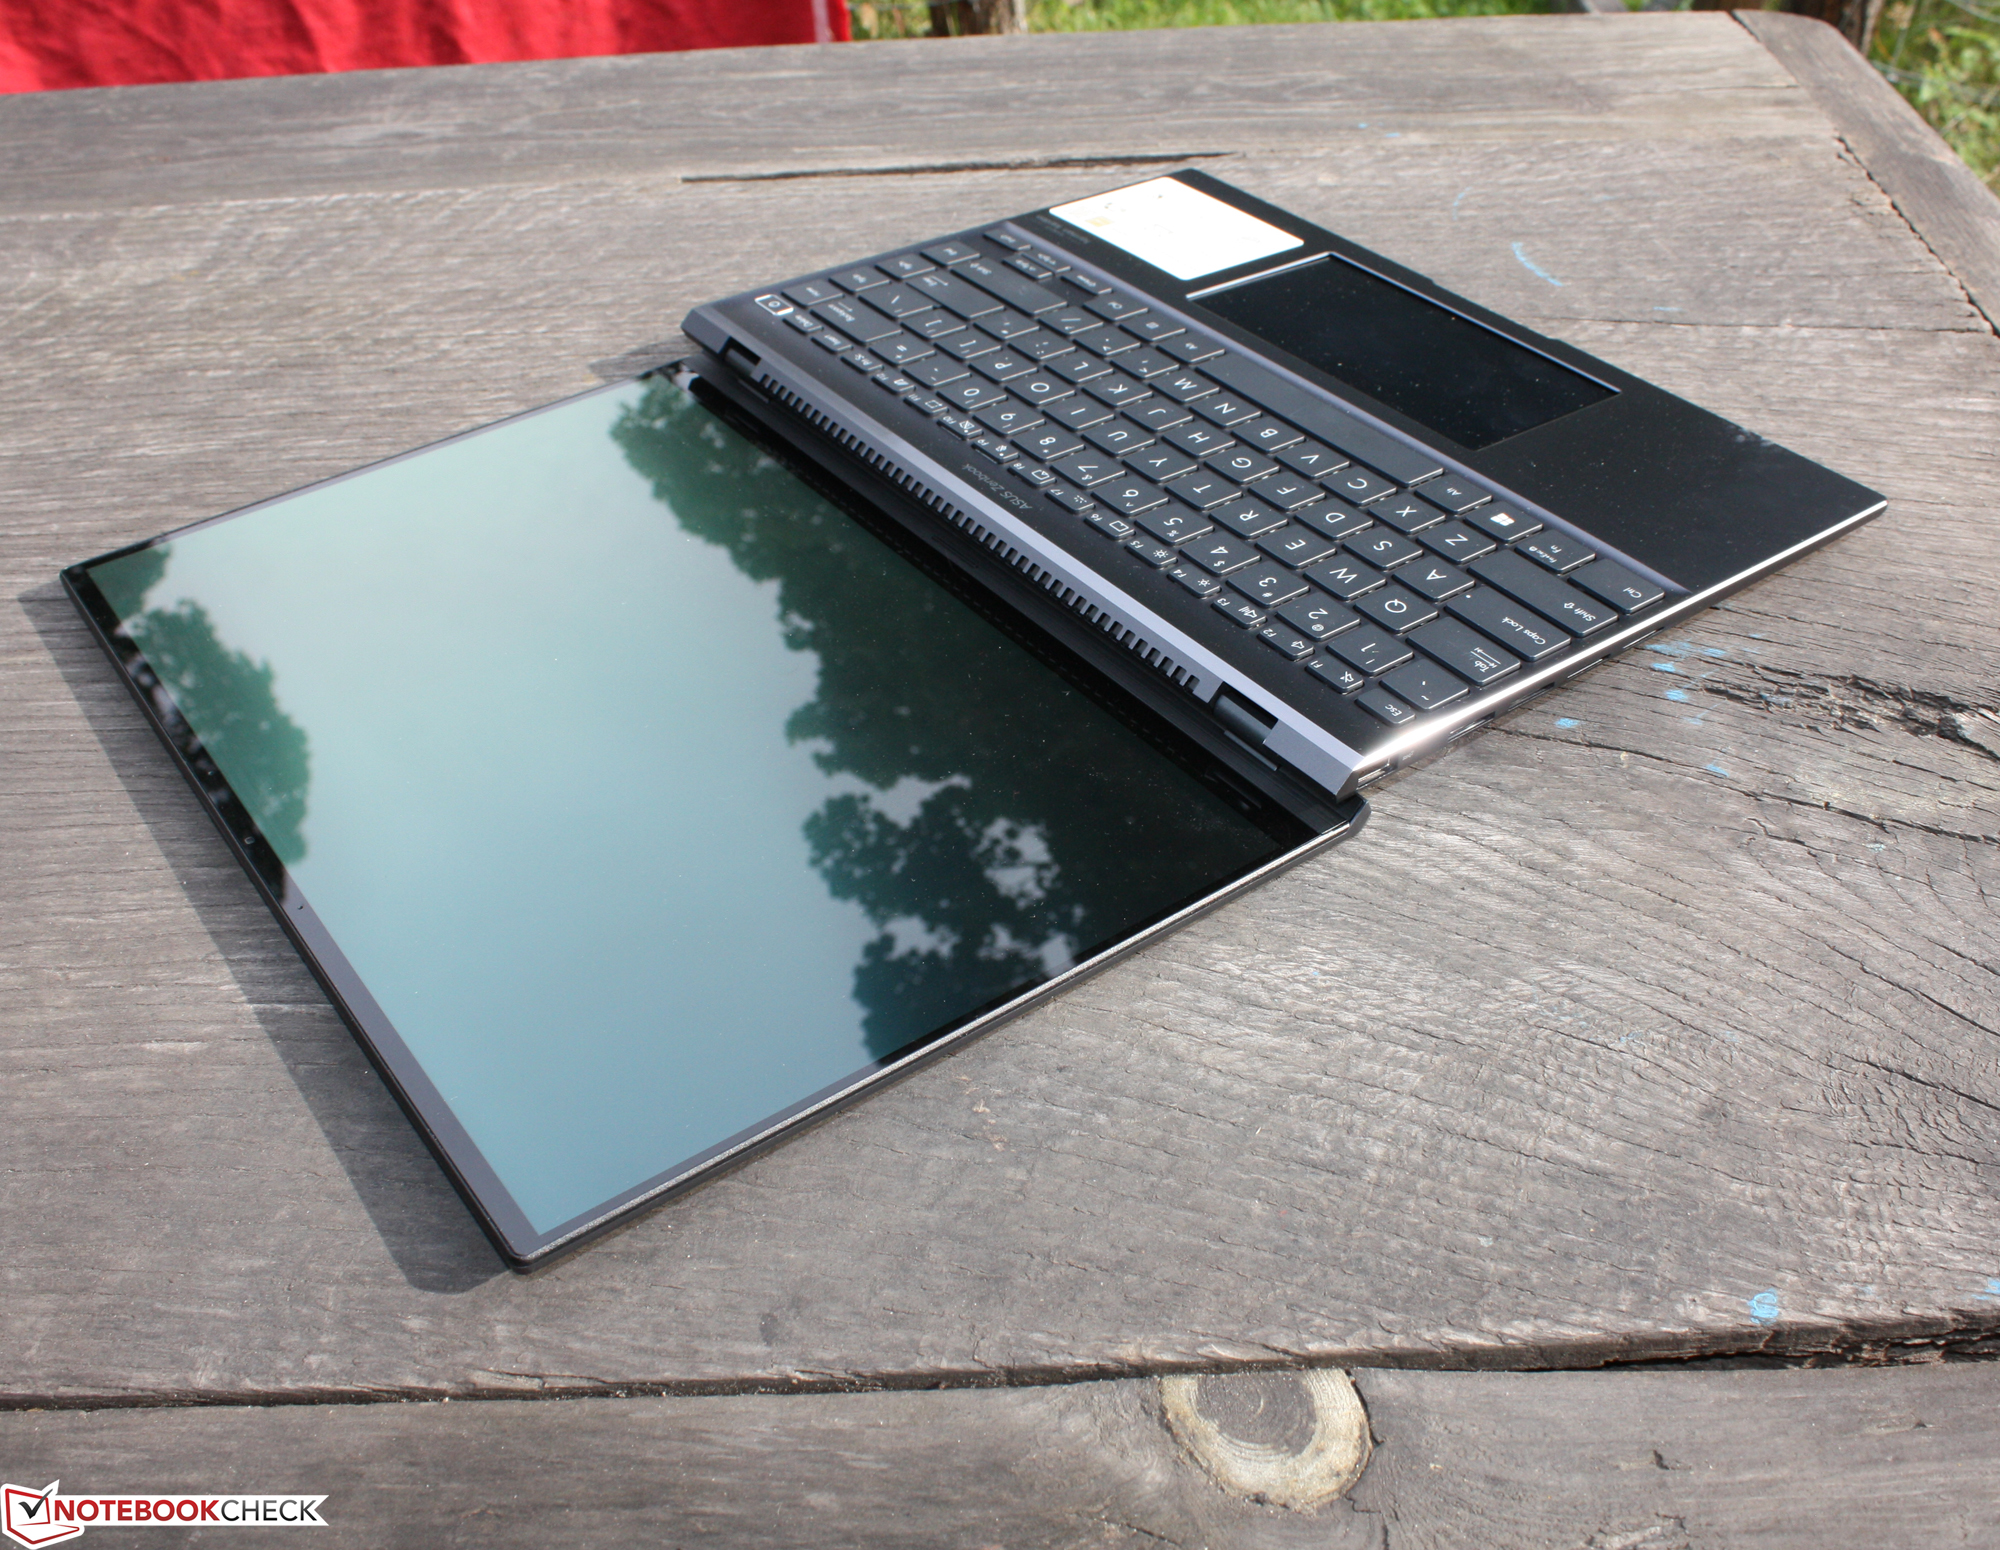
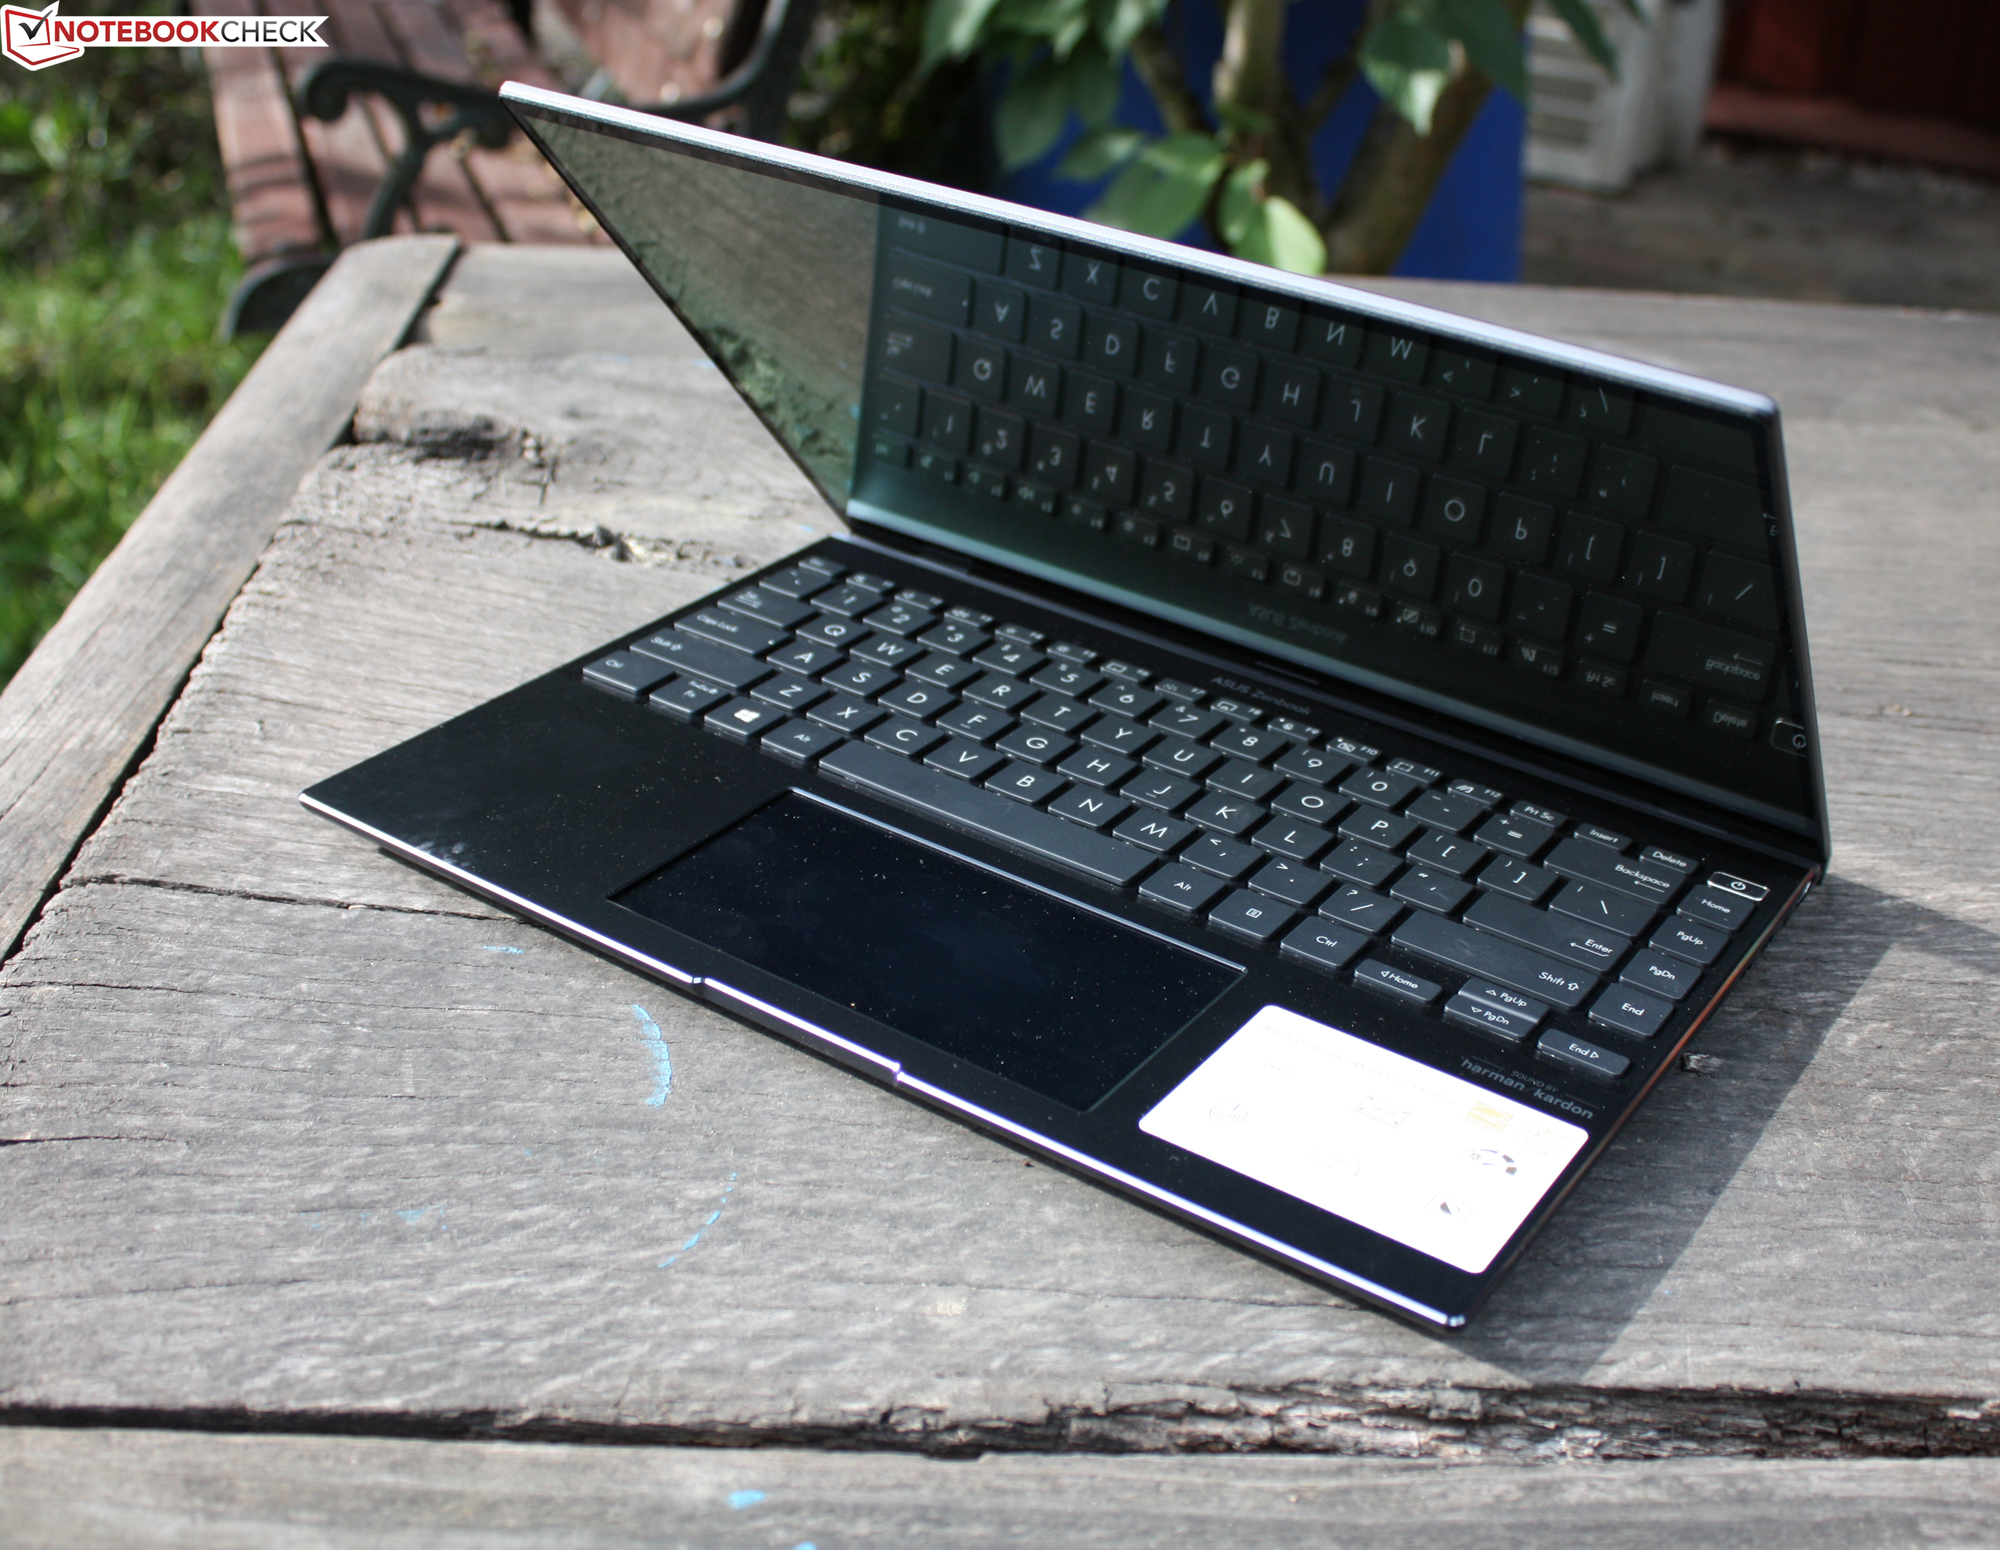
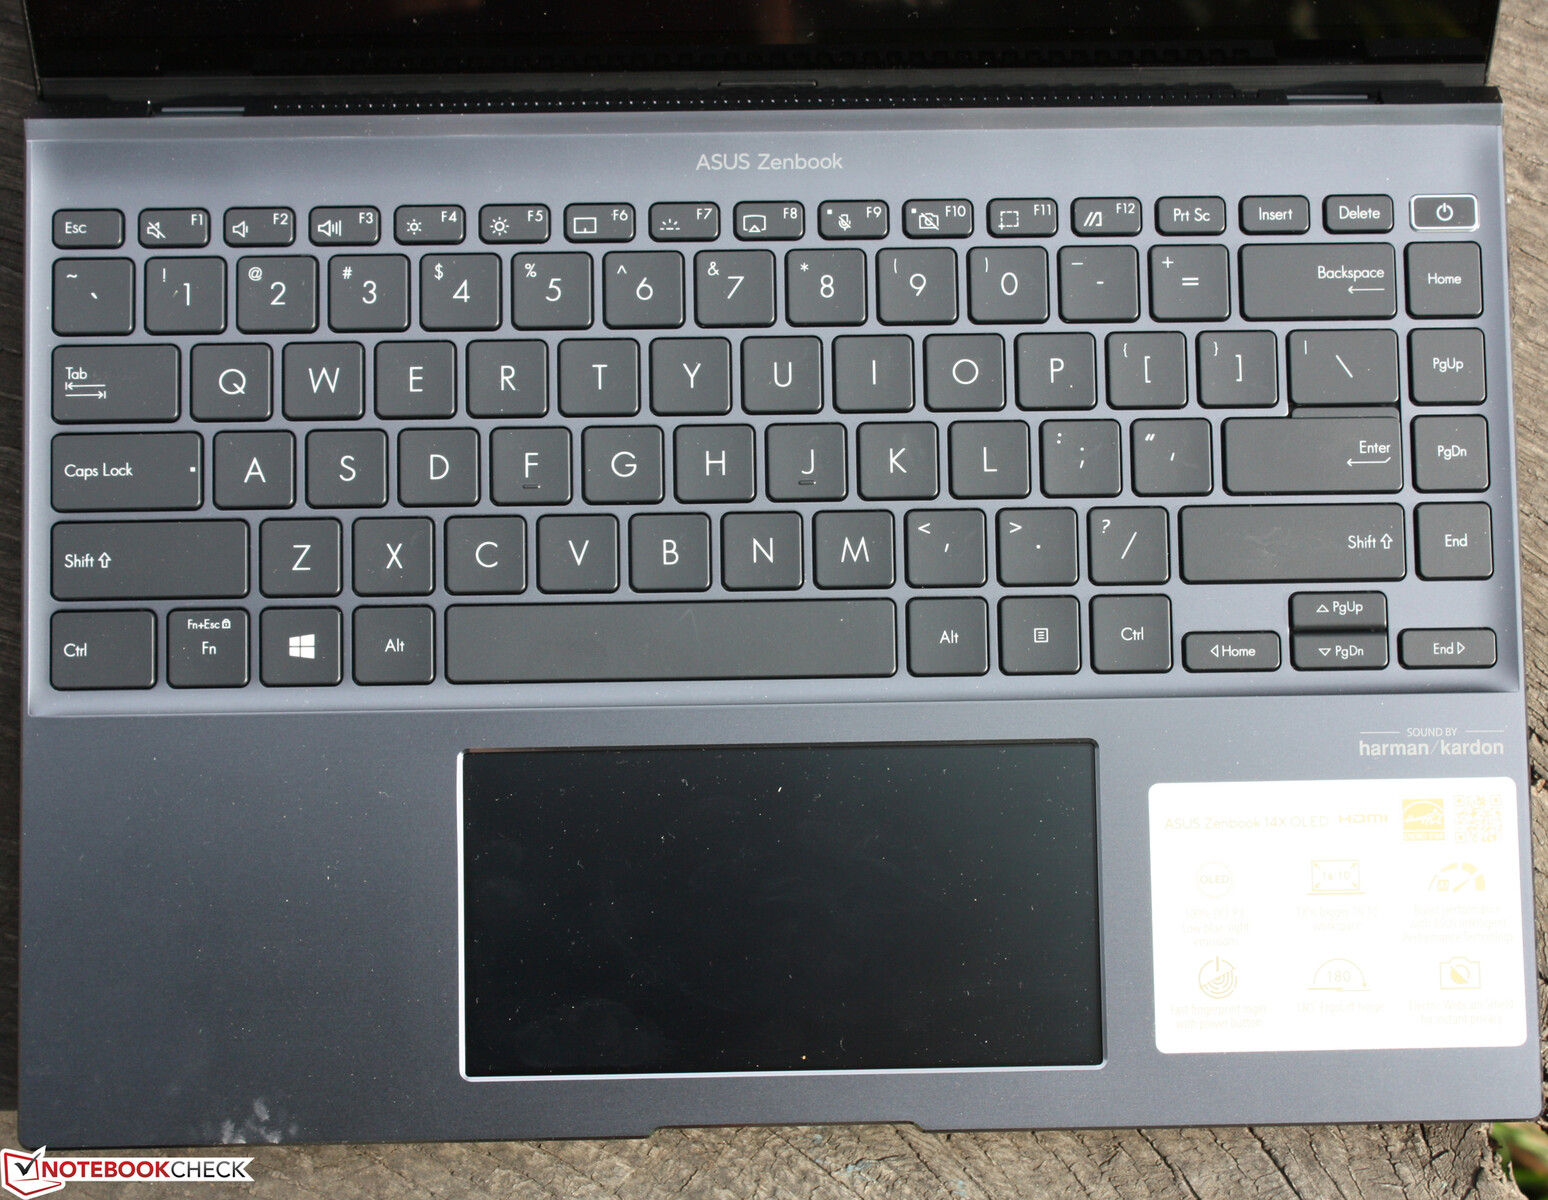
Input devices - Productive dual display
The matte, non-slip keys have a pronounced pressure point, a moderate travel, and a firm stroke. Typing is almost silent. Working in darker environments is possible thanks to the three-stage white backlight.
Overall, the wide keyboard with its large Shift, Ctrl and directional keys allows the user to type quickly. The spacing between the keys is quite large by laptop standards (2.5 mm). The keyboard's firm base is a very positive aspect. Nothing flexes here at any point.
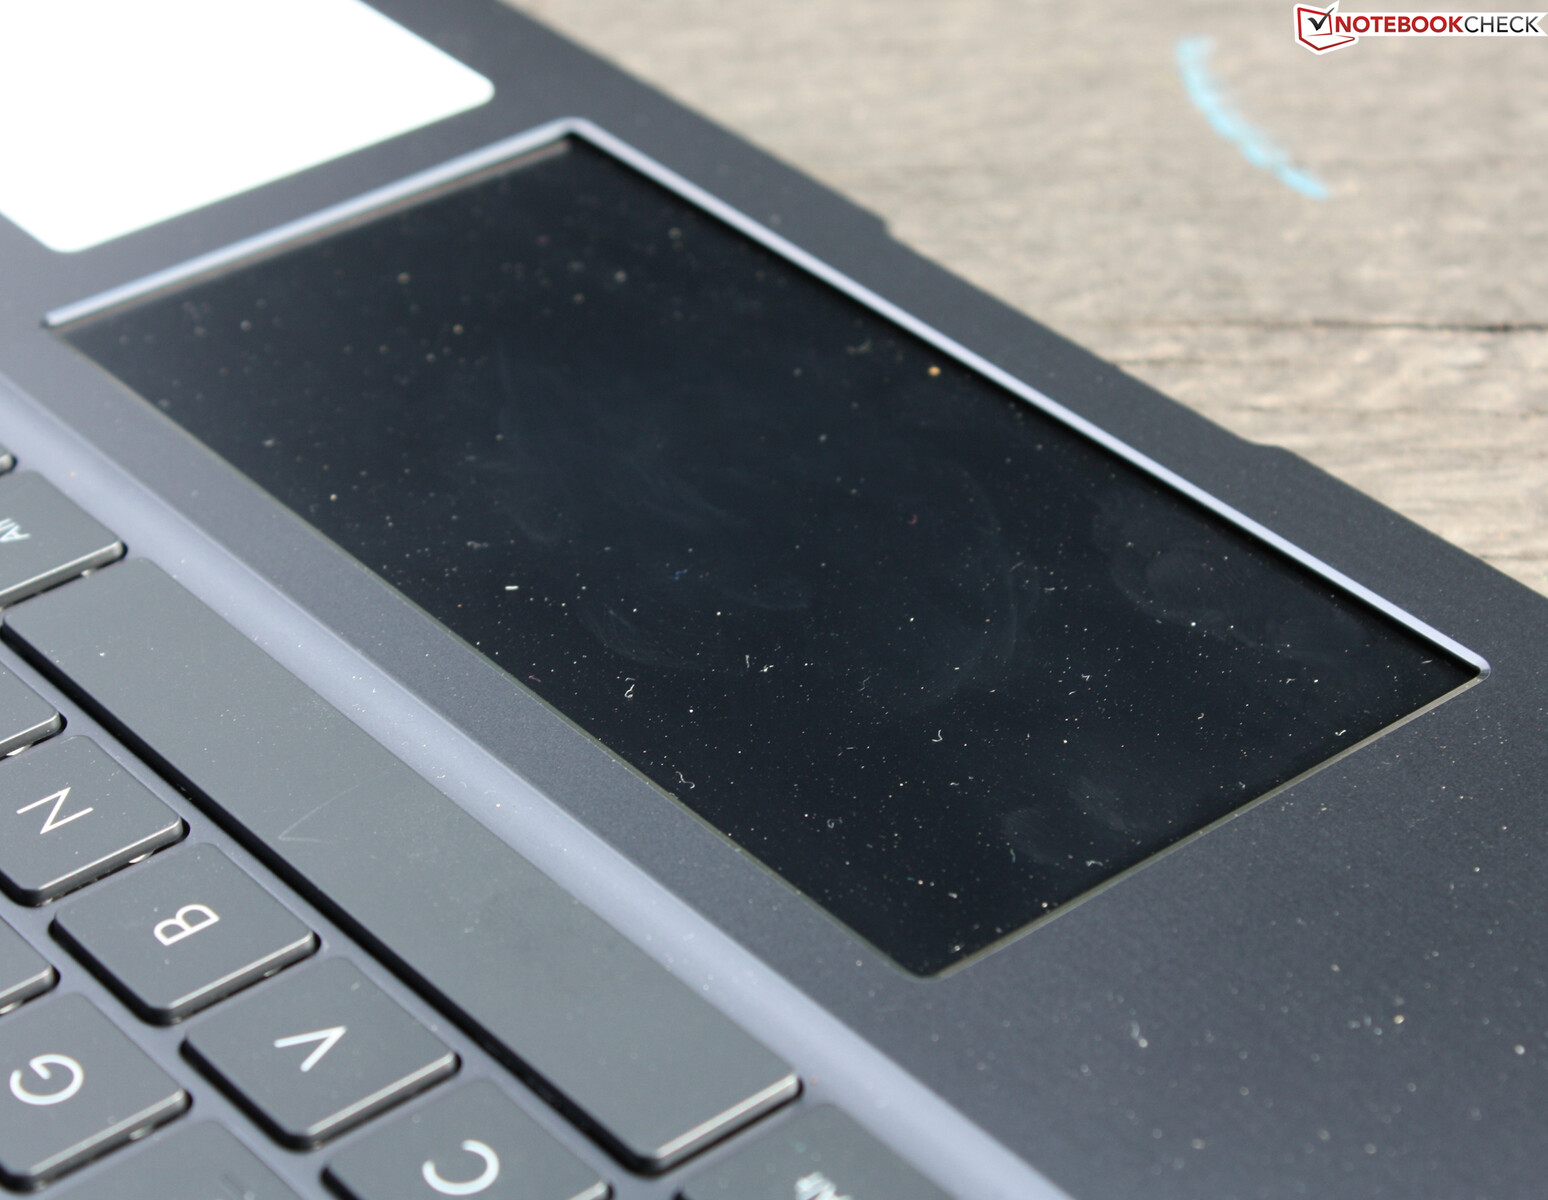
Touchpad
The ClickPad is sensitive up to the edges and offers a short travel. It operates with a dull, quiet noise. The matte surface is quite smooth, but not slippery. It provides a comfortable surface for fingers to glide on. We find the short stroke unsatisfactory, but that's a matter of personal taste.
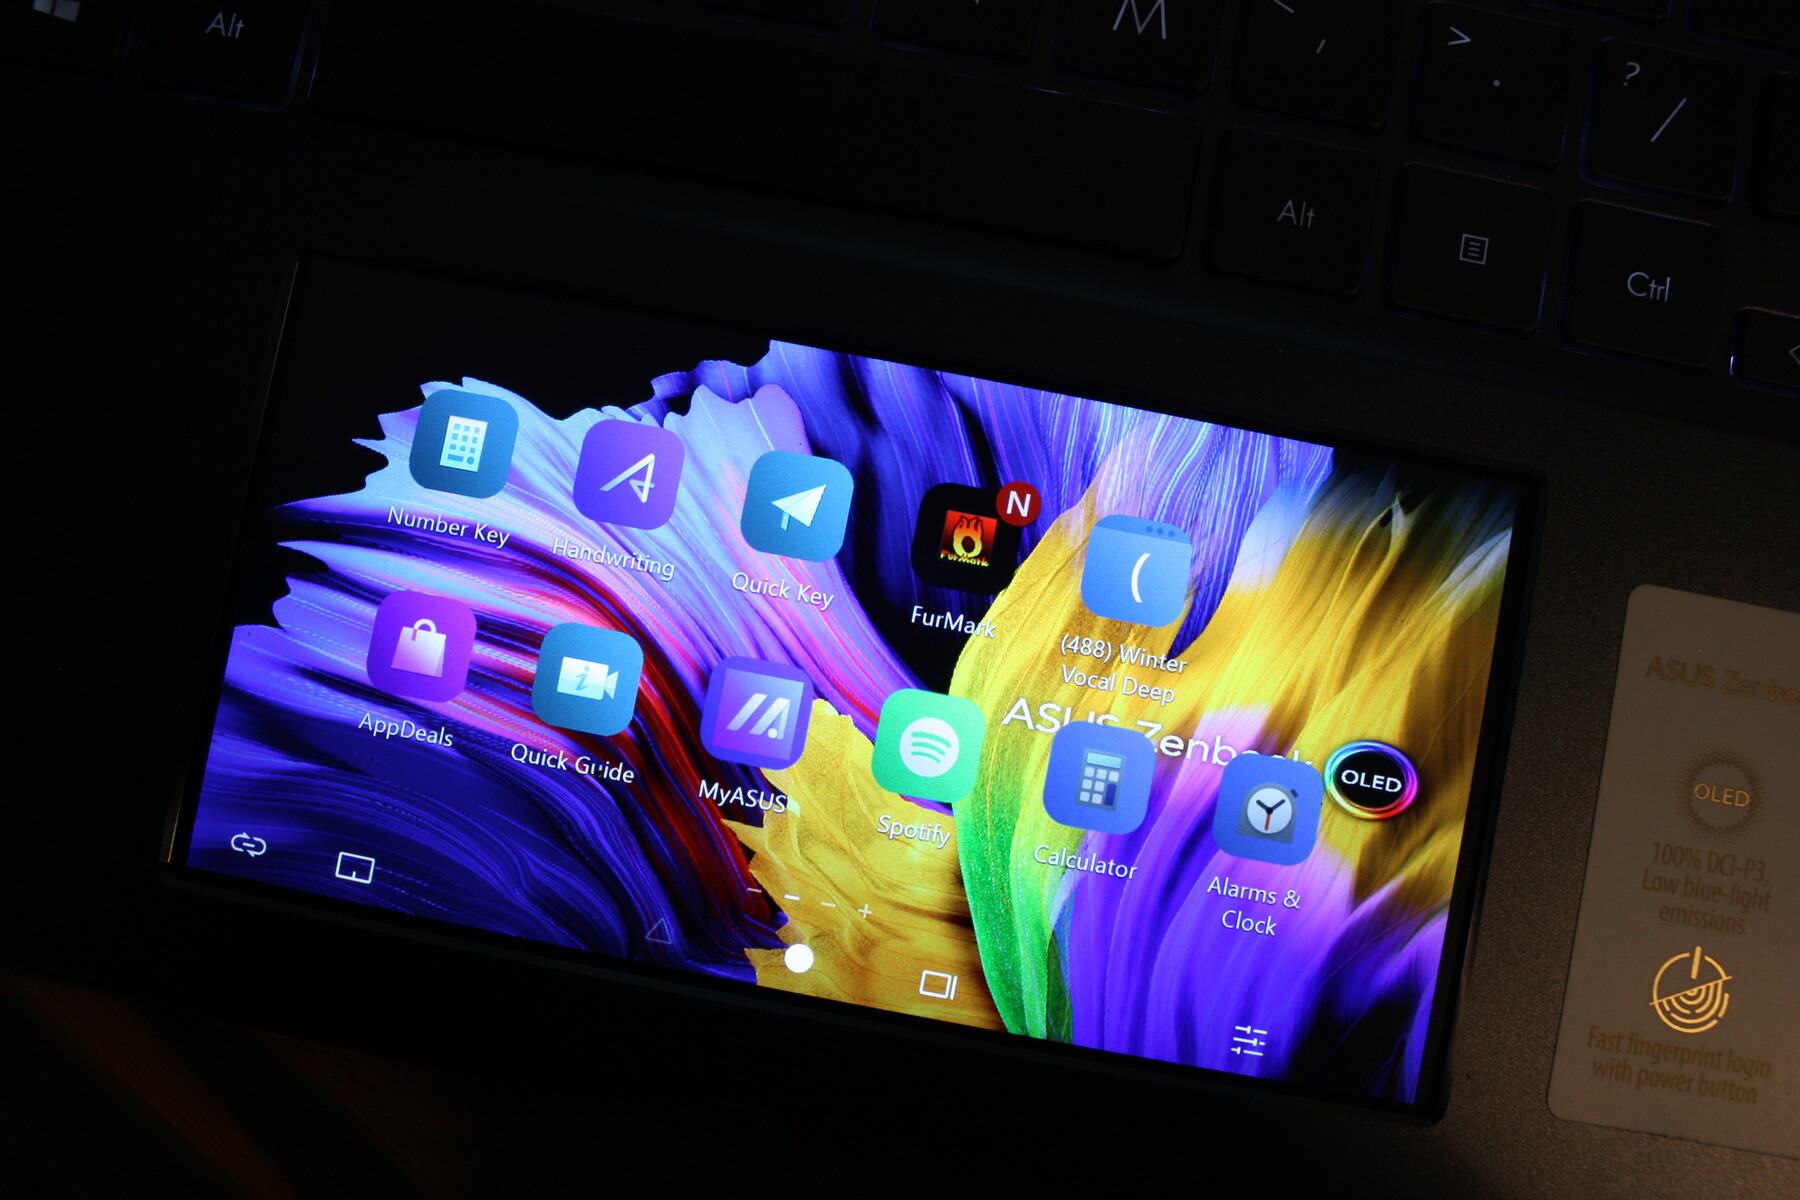
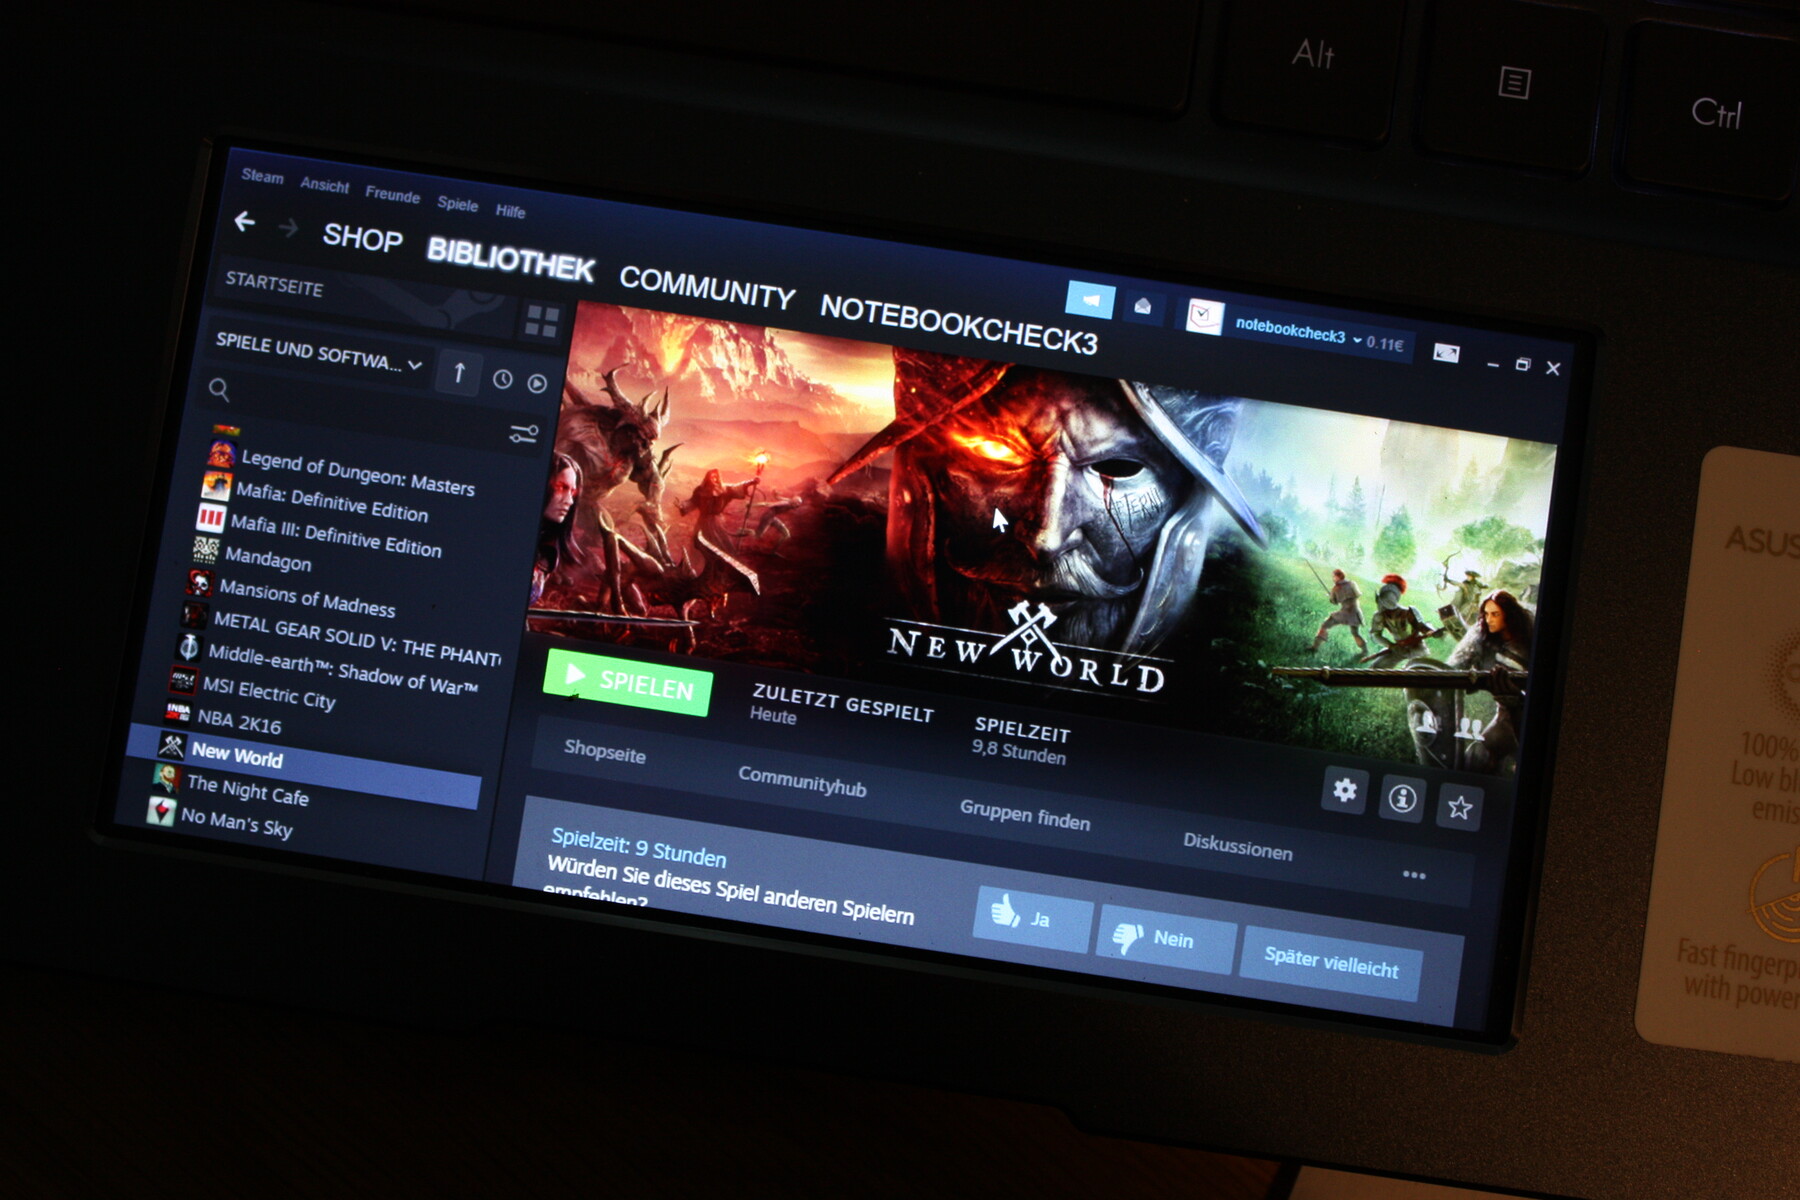
The pad can turn into a display when desired: The pad function can be used on the fly with an overlay or for longer periods of time by deactivating the display function (Fn+F6).
The ScreenPad 2.0 is matte and has a resolution of Full HD+ (2160x1080). This is an IPS panel. In Windows, the secondary display operates as an extended desktop like any HDMI-connected monitor would. You can drag windows into it such as the Steam app, an editor, or the tools from Photoshop, for example.
Digital signatures take place on the ScreenPad, since the OLED panel is non-touch after all. Asus has preloaded groups on the ScreenPad. Each group can be populated with applications that are useful on the small display: Handwriting, number pad, app store, calculator, or Spotify, for instance.
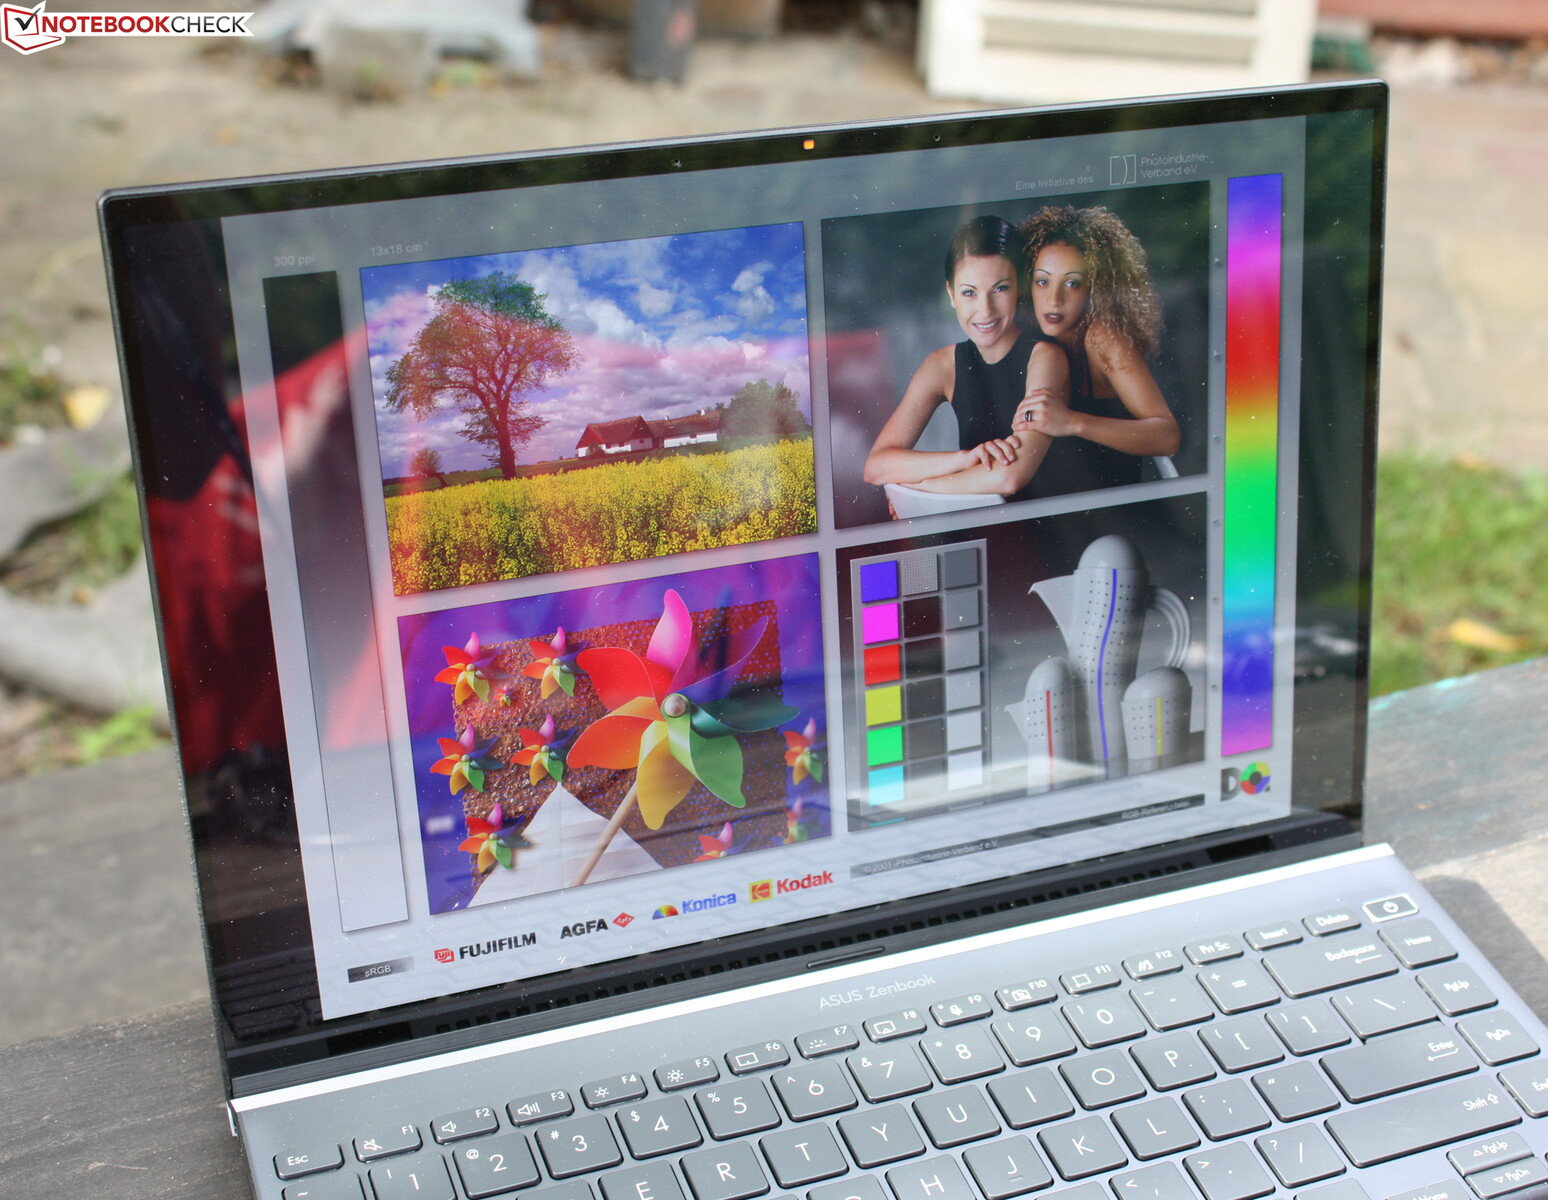
Display
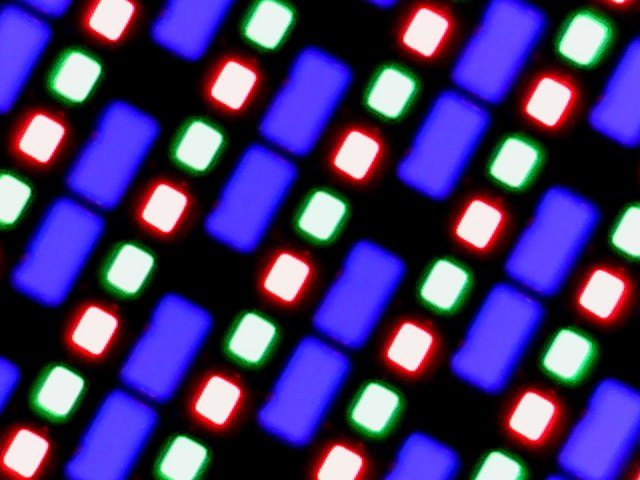
The main argument for buying the Zenbook 14X is its 14-inch OLED panel. Samsung provides a WQXGA+ panel with 2880x1800 pixels (16:10). With a refresh rate of 90 Hz and a response time of 0.2 milliseconds, the vibrant display outshines any IPS model.
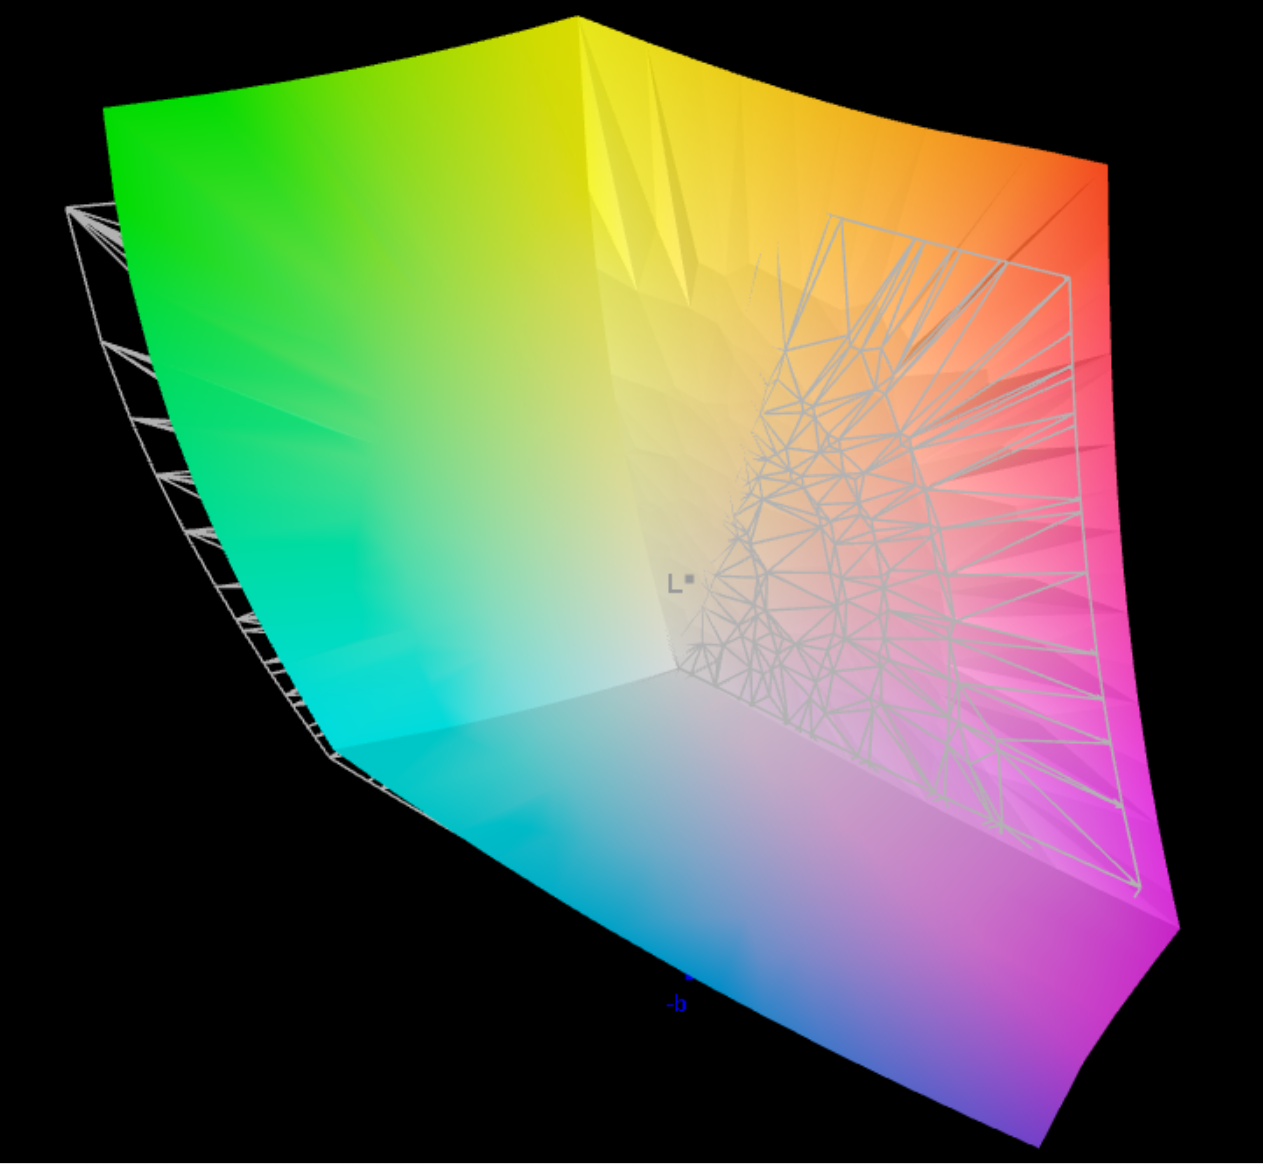
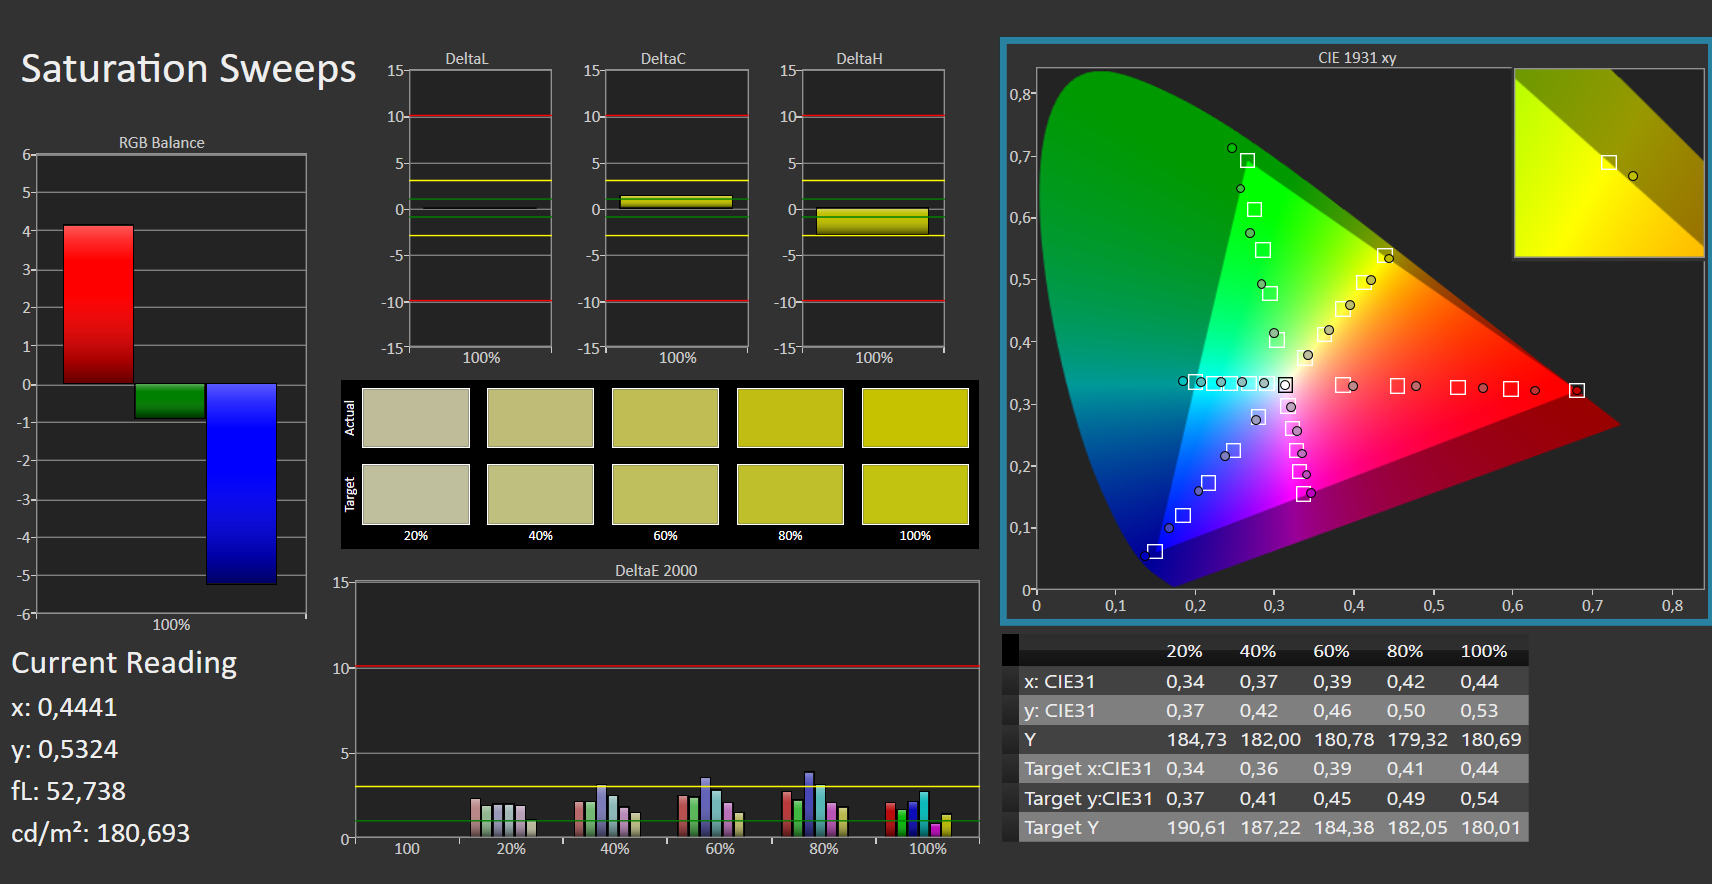
It also promises 100% of the DCI-P3 color gamut, and we can confirm this with our measurements. Asus states that the brightness reaches 500 nits; we measured 381 cd/m² on average and a maximum of 401 cd/m². Nits and cd/m² are converted 1:1, which means that we weren't able to measure the brightness advertised by the manufacturer. Brightness is distributed homogeneously.
High brightness levels are harmful for OLED displays anyway, so they shouldn't be used on a permanent basis. Regarding the issue of burn-in, Asus responds with an OLED screensaver that can't be disabled. It activates after 15 minutes and is important for protecting the panel. According to the manufacturer, users can disable the screensaver after having been informed of the associated risks (warning message). This should be possible via the personal MyAsus Settings (account required). We didn't find an option to turn off the screen saver in the Windows 10 display settings.
The screen-to-body ratio is 92%, which is a very narrow bezel around a lot of display. The Samsung panel makes use of DC dimming to reduce brightness.
Asus has three panel options in its lineup for the Zenbook 14X: the WQXGA+ (2880x1800) non-touch version as in our review unit, the same panel but with touch functionality, and a 4K touch (3840x2400) option. Specifications such as HDR True Black 600, 100% DCI-P3, and a screen-to-body ratio of 92% are identical in all variants.
| |||||||||||||||||||||||||
Brightness Distribution: 93 %
Center on Battery: 379 cd/m²
Contrast: 3790:1 (Black: 0.1 cd/m²)
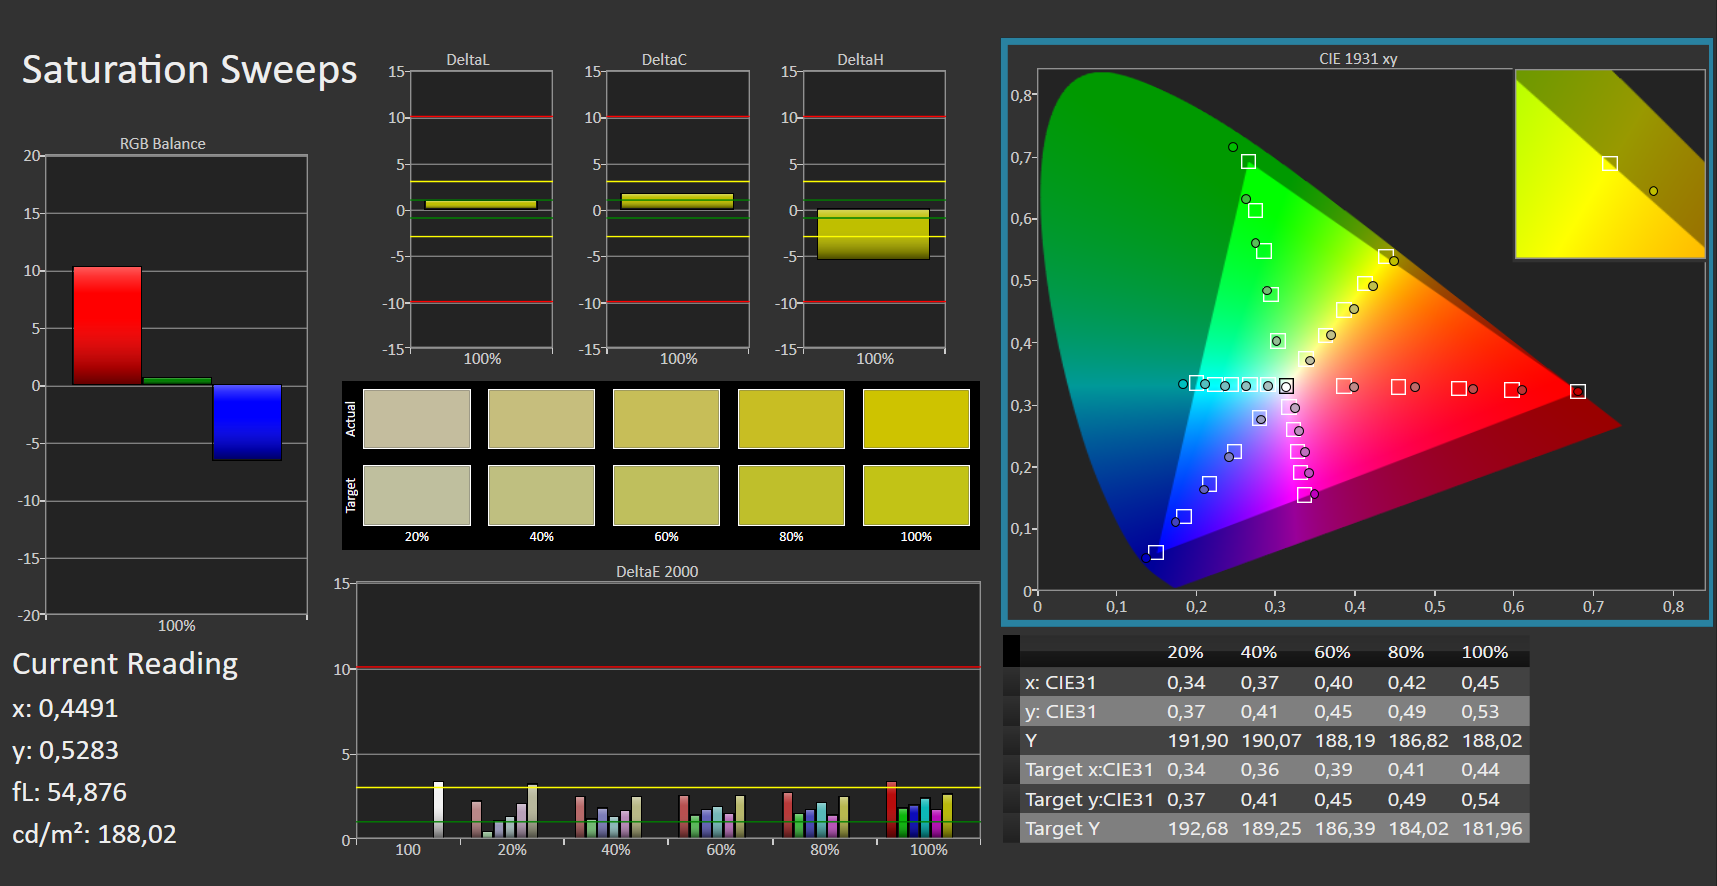
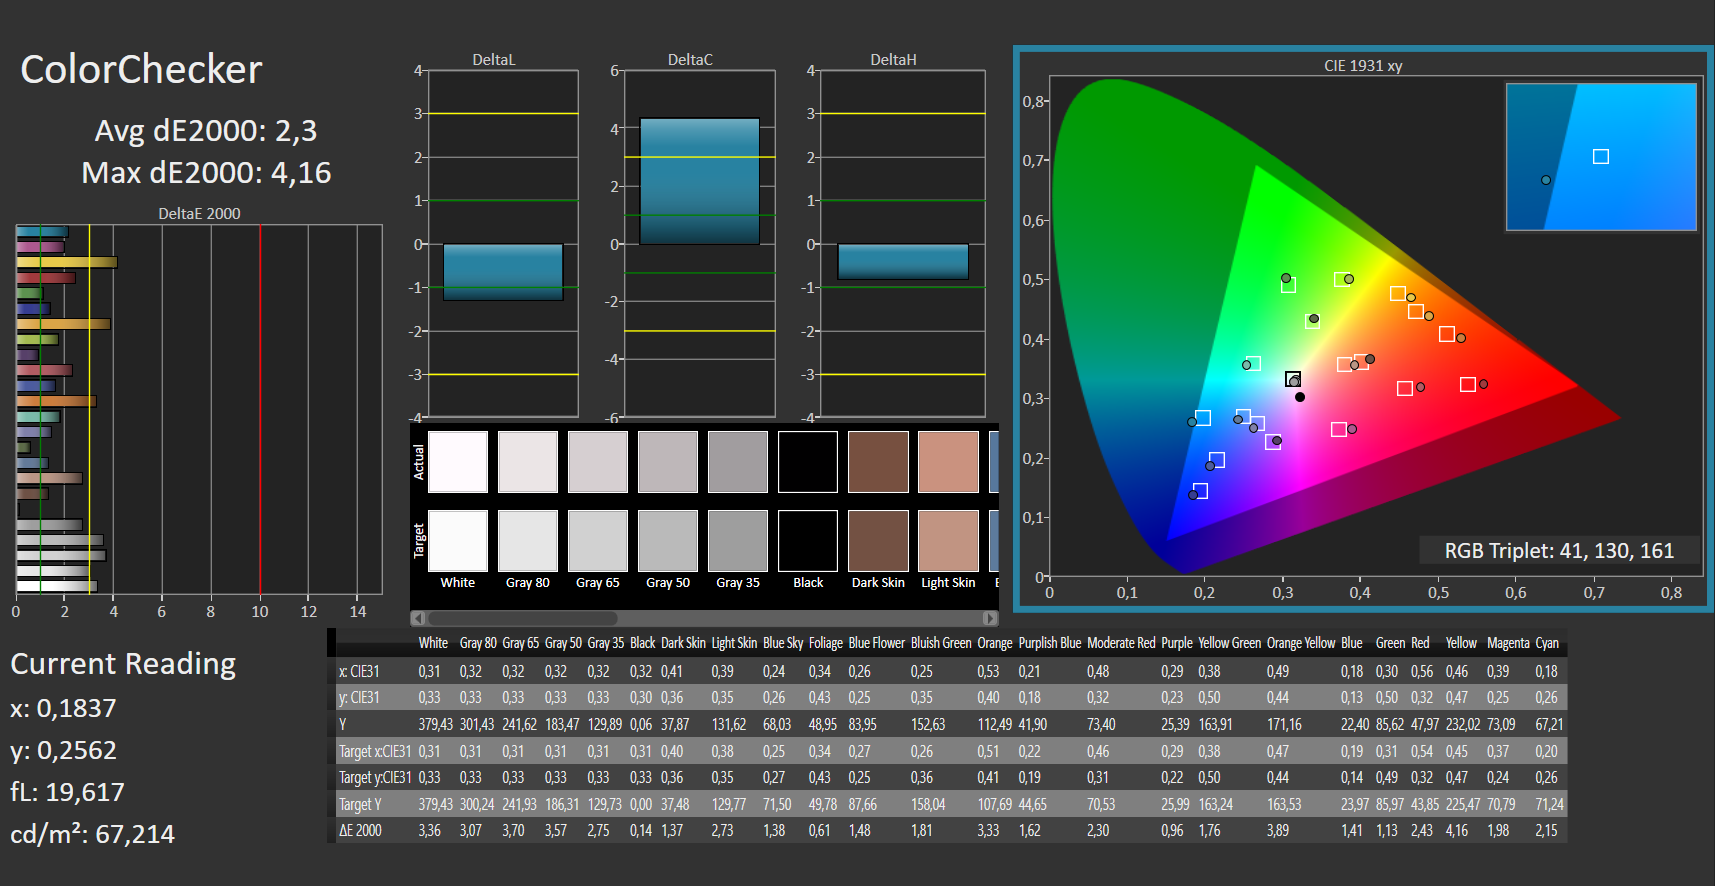
ΔE ColorChecker Calman: 2.3 | ∀{0.5-29.43 Ø4.71}
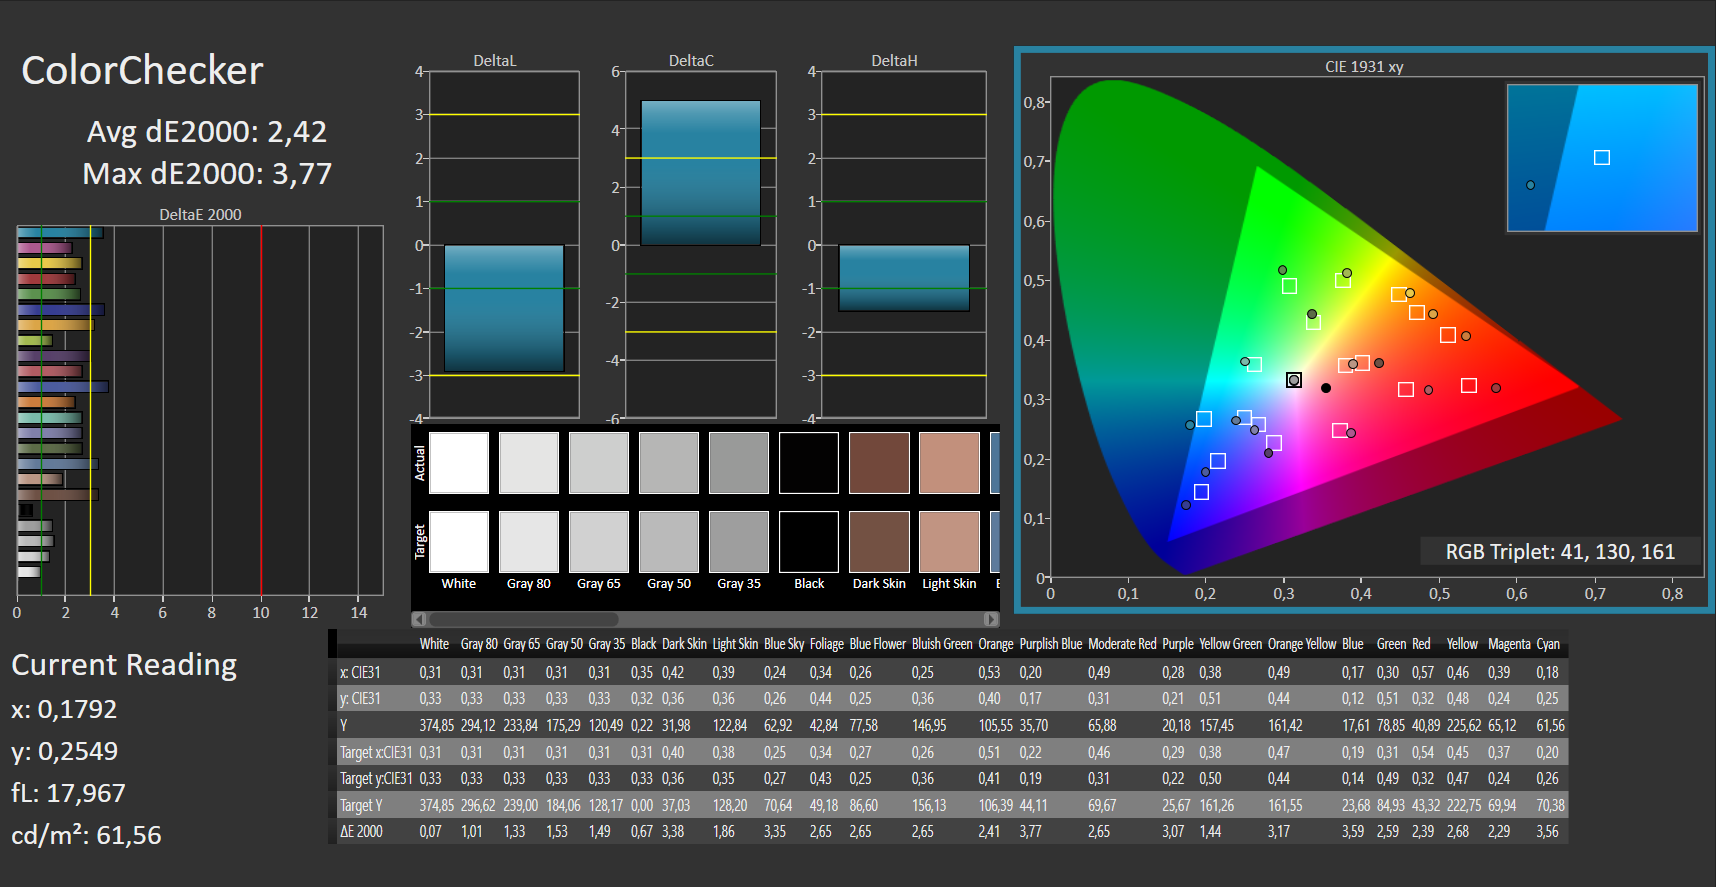
calibrated: 2.42
ΔE Greyscale Calman: 2.12 | ∀{0.09-98 Ø4.96}
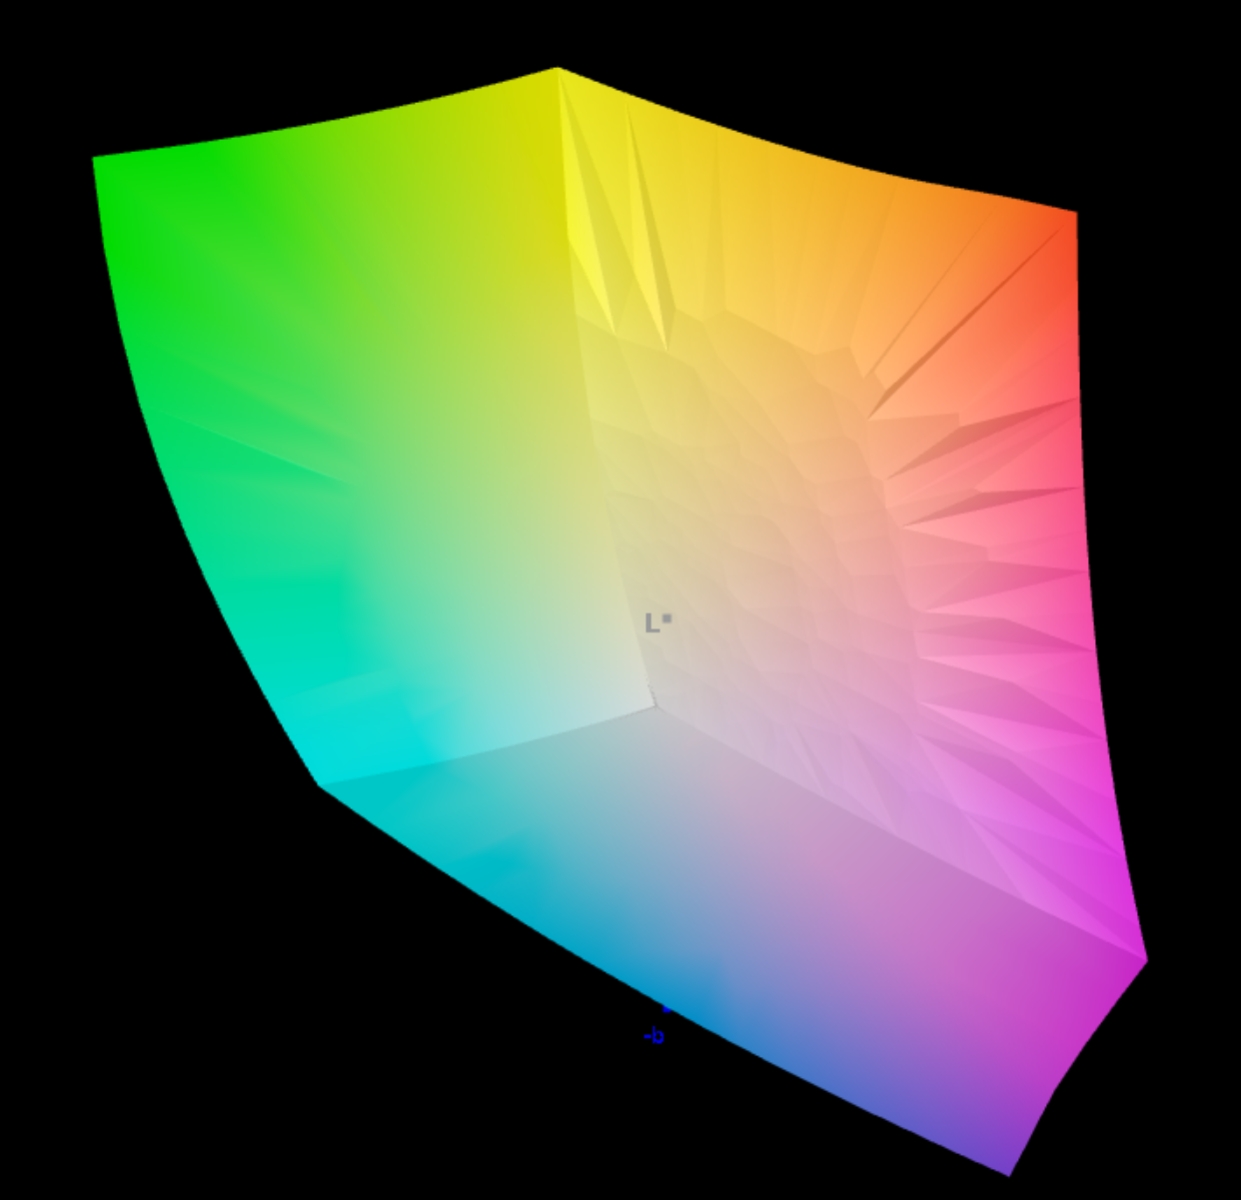
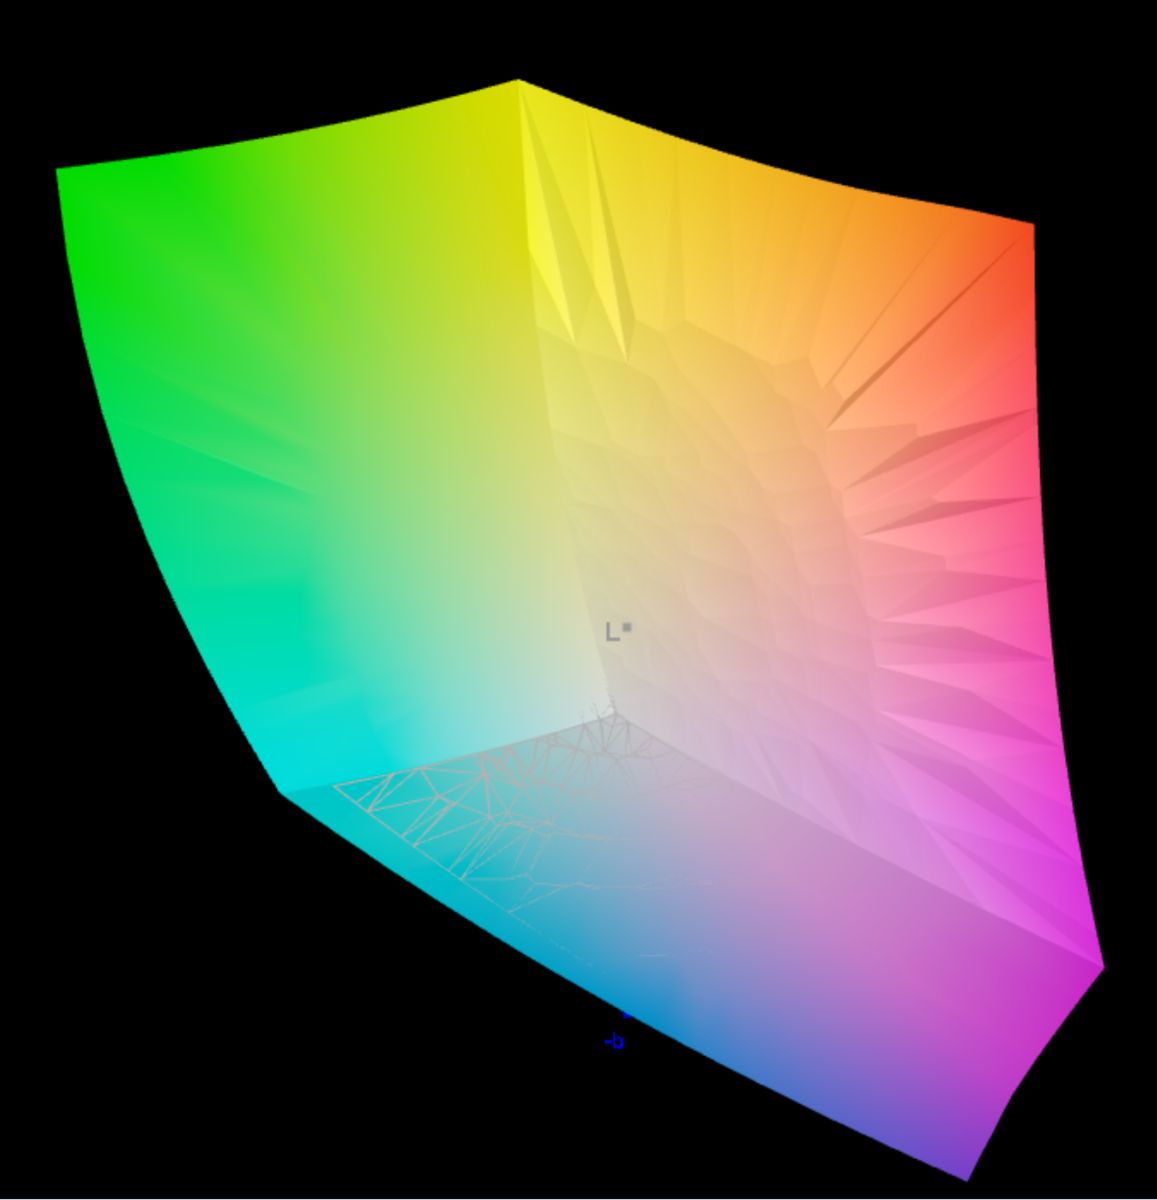
96% AdobeRGB 1998 (Argyll 3D)
100% sRGB (Argyll 3D)
100% Display P3 (Argyll 3D)
Gamma: 2.42
| Asus Zenbook 14X UX5400E Samsung SDC4154, OLED, 2880x1800, 14" | Dell XPS 13 9310 OLED Samsung 134XK01, OLED, 3456x2160, 13.4" | Asus Zenbook 14 UX435EG Au Optronics B140HAN03.2, IPS, 1920x1080, 14" | MSI Modern 14 B11SB-085 BOE CQ NV140FHM-N4V, IPS, 1920x1080, 14" | HP Envy 14-eb0010nr AU Optronics AUOF392, IPS, 1920x1200, 14" | Lenovo IdeaPad Slim 9i 14ITL5 B140ZAN01.7, IPS, 3840x2160, 14" | |
|---|---|---|---|---|---|---|
| Display | 1% | -28% | -53% | -14% | -10% | |
| Display P3 Coverage (%) | 100 | 99.7 0% | 60.9 -39% | 39.9 -60% | 77.1 -23% | 87.4 -13% |
| sRGB Coverage (%) | 100 | 100 0% | 90.4 -10% | 58.8 -41% | 99.8 0% | 99.9 0% |
| AdobeRGB 1998 Coverage (%) | 96 | 97.7 2% | 62.3 -35% | 41.2 -57% | 76.7 -20% | 81.1 -16% |
| Response Times | -10% | -1575% | -925% | -2580% | -2040% | |
| Response Time Grey 50% / Grey 80% * (ms) | 2 ? | 2.2 ? -10% | 39 ? -1850% | 25 ? -1150% | 61.2 ? -2960% | 48.4 ? -2320% |
| Response Time Black / White * (ms) | 2 ? | 2.2 ? -10% | 28 ? -1300% | 16 ? -700% | 46 ? -2200% | 37.2 ? -1760% |
| PWM Frequency (Hz) | 240.4 ? | 92 ? | ||||
| Screen | -32% | -84% | -61% | -25% | -66% | |
| Brightness middle (cd/m²) | 379 | 384 1% | 323 -15% | 347 -8% | 412 9% | 475.8 26% |
| Brightness (cd/m²) | 381 | 387 2% | 313 -18% | 311 -18% | 392 3% | 463 22% |
| Brightness Distribution (%) | 93 | 97 4% | 80 -14% | 81 -13% | 81 -13% | 89 -4% |
| Black Level * (cd/m²) | 0.1 | 0.36 -260% | 0.12 -20% | 0.32 -220% | 0.44 -340% | |
| Contrast (:1) | 3790 | 897 -76% | 2892 -24% | 1288 -66% | 1081 -71% | |
| Colorchecker dE 2000 * | 2.3 | 4.56 -98% | 4.86 -111% | 5.05 -120% | 1.88 18% | 3.81 -66% |
| Colorchecker dE 2000 max. * | 4.16 | 7.27 -75% | 7.52 -81% | 16.98 -308% | 3.06 26% | 6.96 -67% |
| Colorchecker dE 2000 calibrated * | 2.42 | 4.52 -87% | 3.64 -50% | 1.96 19% | 2.55 -5% | |
| Greyscale dE 2000 * | 2.12 | 1.5 29% | 4.83 -128% | 1.63 23% | 2.2 -4% | 4.1 -93% |
| Gamma | 2.42 91% | 2.26 97% | 2.64 83% | 2.3 96% | 2.1 105% | 2.14 103% |
| CCT | 6219 105% | 7405 88% | 6666 98% | 6650 98% | 6564 99% | |
| Color Space (Percent of AdobeRGB 1998) (%) | 87.1 | 57.5 | 38 | 68.7 | 72.4 | |
| Color Space (Percent of sRGB) (%) | 100 | 90.3 | 58 | 99.8 | 99.9 | |
| Total Average (Program / Settings) | -14% /
-20% | -562% /
-285% | -346% /
-192% | -873% /
-388% | -705% /
-336% |
* ... smaller is better
As one would expect, the OLED display features an outstanding contrast (3,790:1); blacks are deep, and colors are vibrant. As typical for OLEDs, the response times are also excellent. PWM for brightness reduction sets in at brightness levels of 50% and below, making the display flicker at a frequency of 362 Hz. Sensitive users might be affected by this, although we rarely adjusted brightness below 50% in practice. In normal office usage in daylight, we operated at 60-70%.
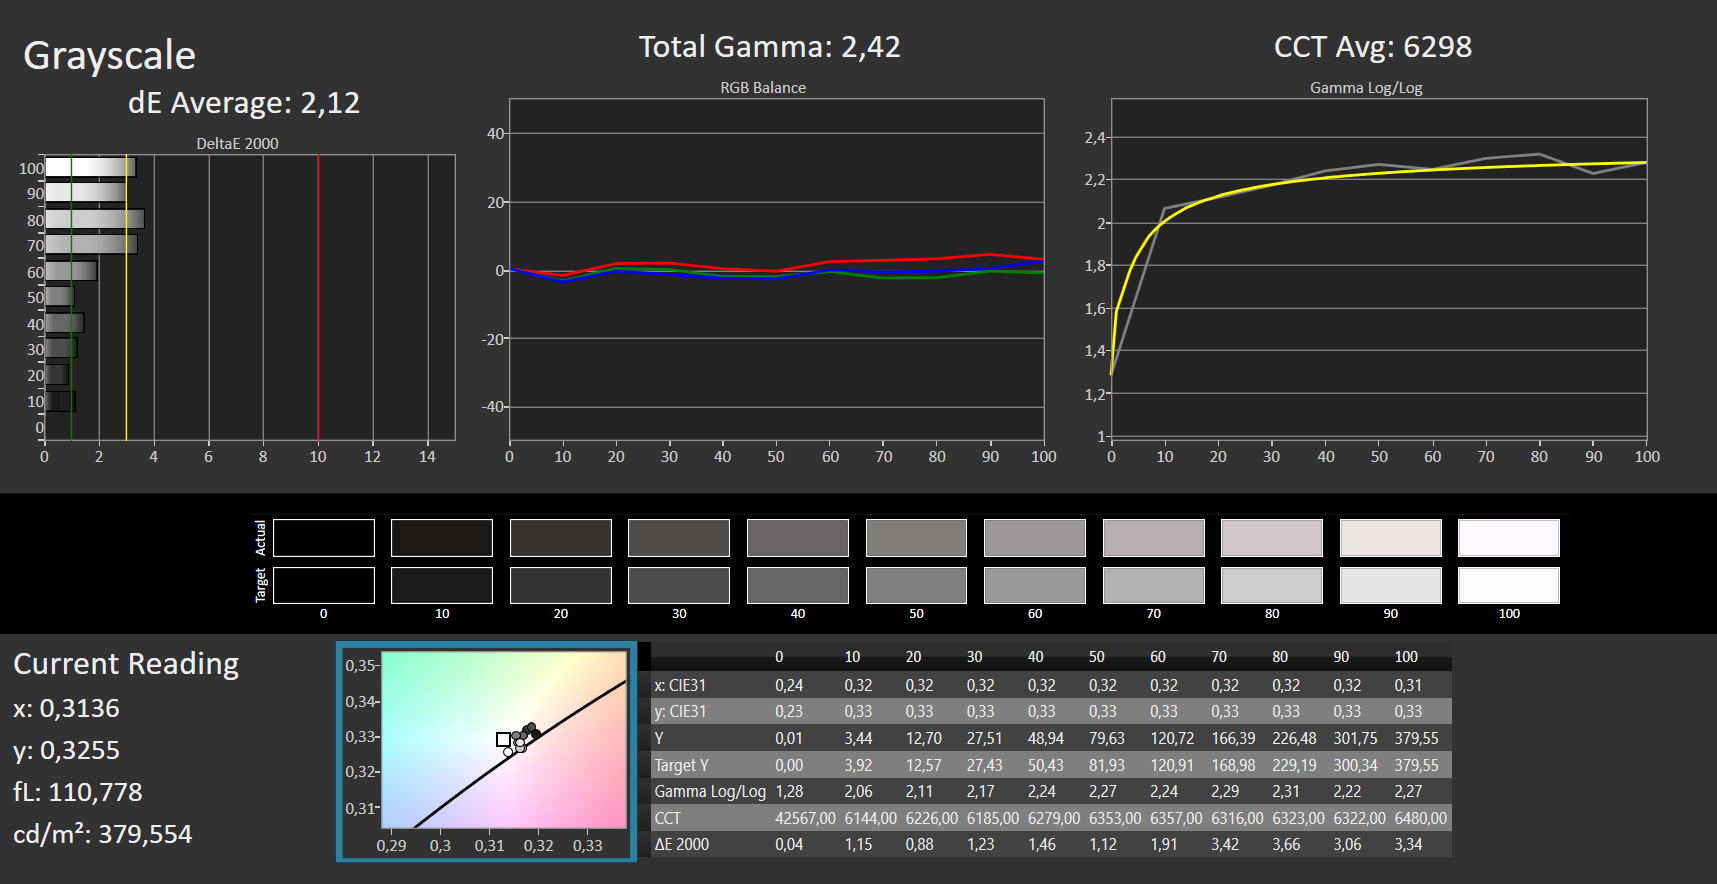
We measured the grayscale and color DeltaE values before calibration at 2.4 and 2.3, respectively - very good values as they are below 3.0. Calibration improved grayscales a bit (1.8), but colors became worse (2.4). In short: You can skip calibration, because the factory-calibrated panel can't be improved.

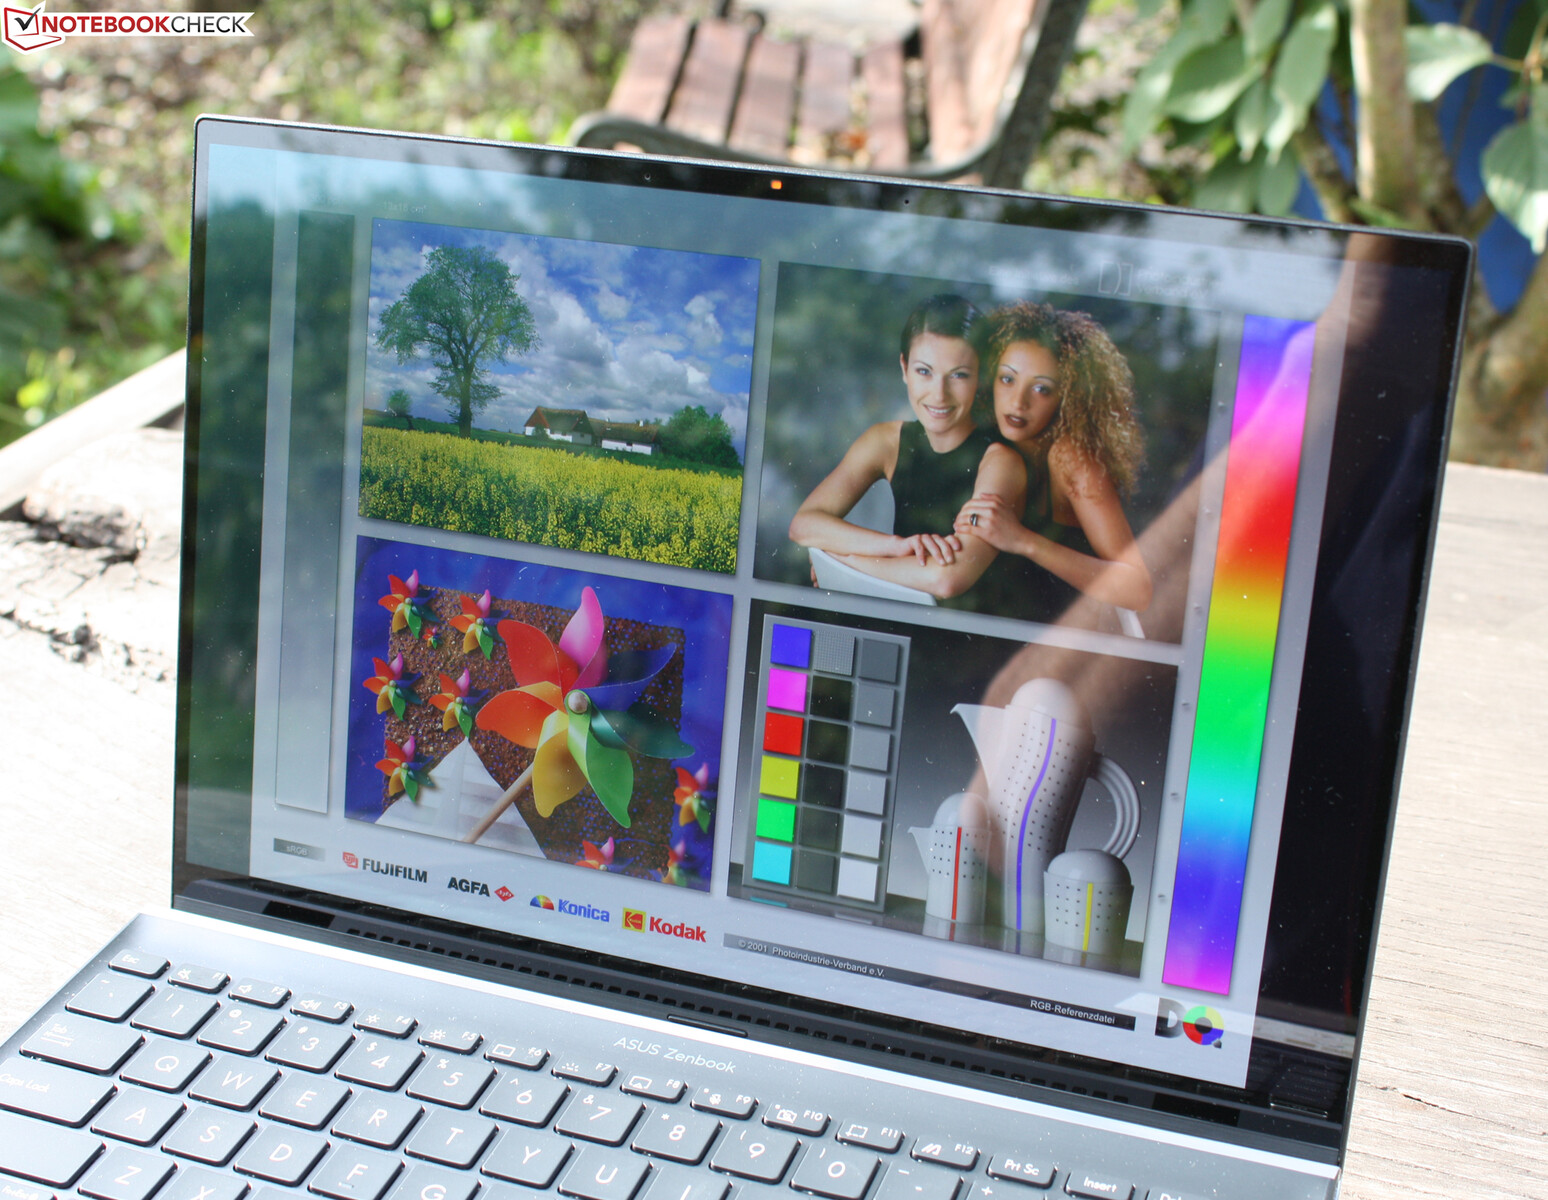
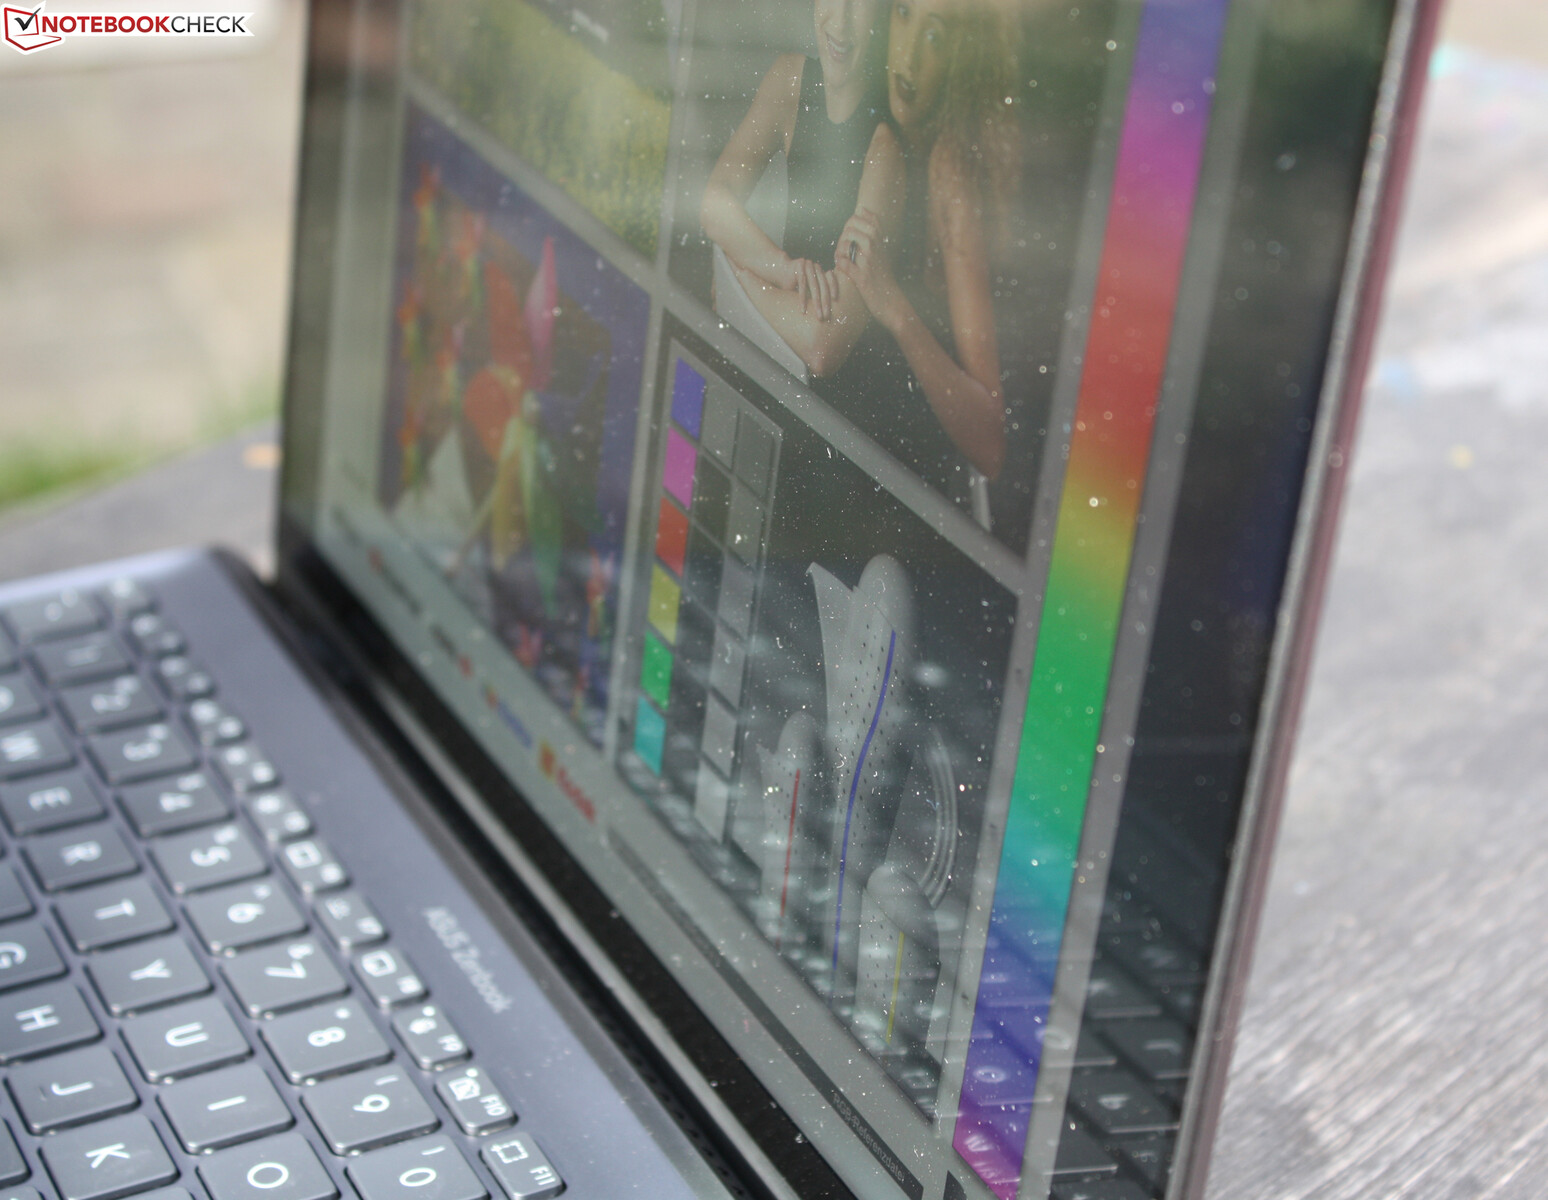
The glossy surface (non-touch) suffers from reflections outdoors, and the high brightness doesn't help much here. The panel can be used well in shaded areas, partly also because the brightness doesn't decrease on battery power (379 cd/m² at the center of the display).
Display Response Times
| ↔ Response Time Black to White | ||
|---|---|---|
| 2 ms ... rise ↗ and fall ↘ combined | ↗ 1 ms rise |  |
| ↘ 1 ms fall | ||
| The screen shows very fast response rates in our tests and should be very well suited for fast-paced gaming. In comparison, all tested devices range from 0.1 (minimum) to 240 (maximum) ms. » 11 % of all devices are better. This means that the measured response time is better than the average of all tested devices (19.8 ms). | ||
| ↔ Response Time 50% Grey to 80% Grey | ||
| 2 ms ... rise ↗ and fall ↘ combined | ↗ 1 ms rise |  |
| ↘ 1 ms fall | ||
| The screen shows very fast response rates in our tests and should be very well suited for fast-paced gaming. In comparison, all tested devices range from 0.165 (minimum) to 636 (maximum) ms. » 10 % of all devices are better. This means that the measured response time is better than the average of all tested devices (31 ms). | ||
Screen Flickering / PWM (Pulse-Width Modulation)
| Screen flickering / PWM not detected | ≤ 50 % brightness setting |  | |
In comparison: 52 % of all tested devices do not use PWM to dim the display. If PWM was detected, an average of 7747 (minimum: 5 - maximum: 343500) Hz was measured. | |||
There's no question that OLED panels provide the best viewing angles available. Even from flat angles, colors remain stable, and brightness doesn't lose intensity.
Performance - MX450 with bottlenecks
Asus has opted for the Tiger Lake 28-watt Intel Core i7-1165G7 (2.8 GHz) with an integrated Intel Iris Xe G7 graphics card (Gen 12). The latter is complemented by the Nvidia Intel Core i7-1165G7, which can be disabled (Optimus). There will be a variant with the i5-1135G7 (2.4 GHz) for price-conscious buyers, which will also be combined with the MX450. The target group consists of professional users who are looking for a respectable, portable laptop with a high-end display and all-round performance for both work and play.
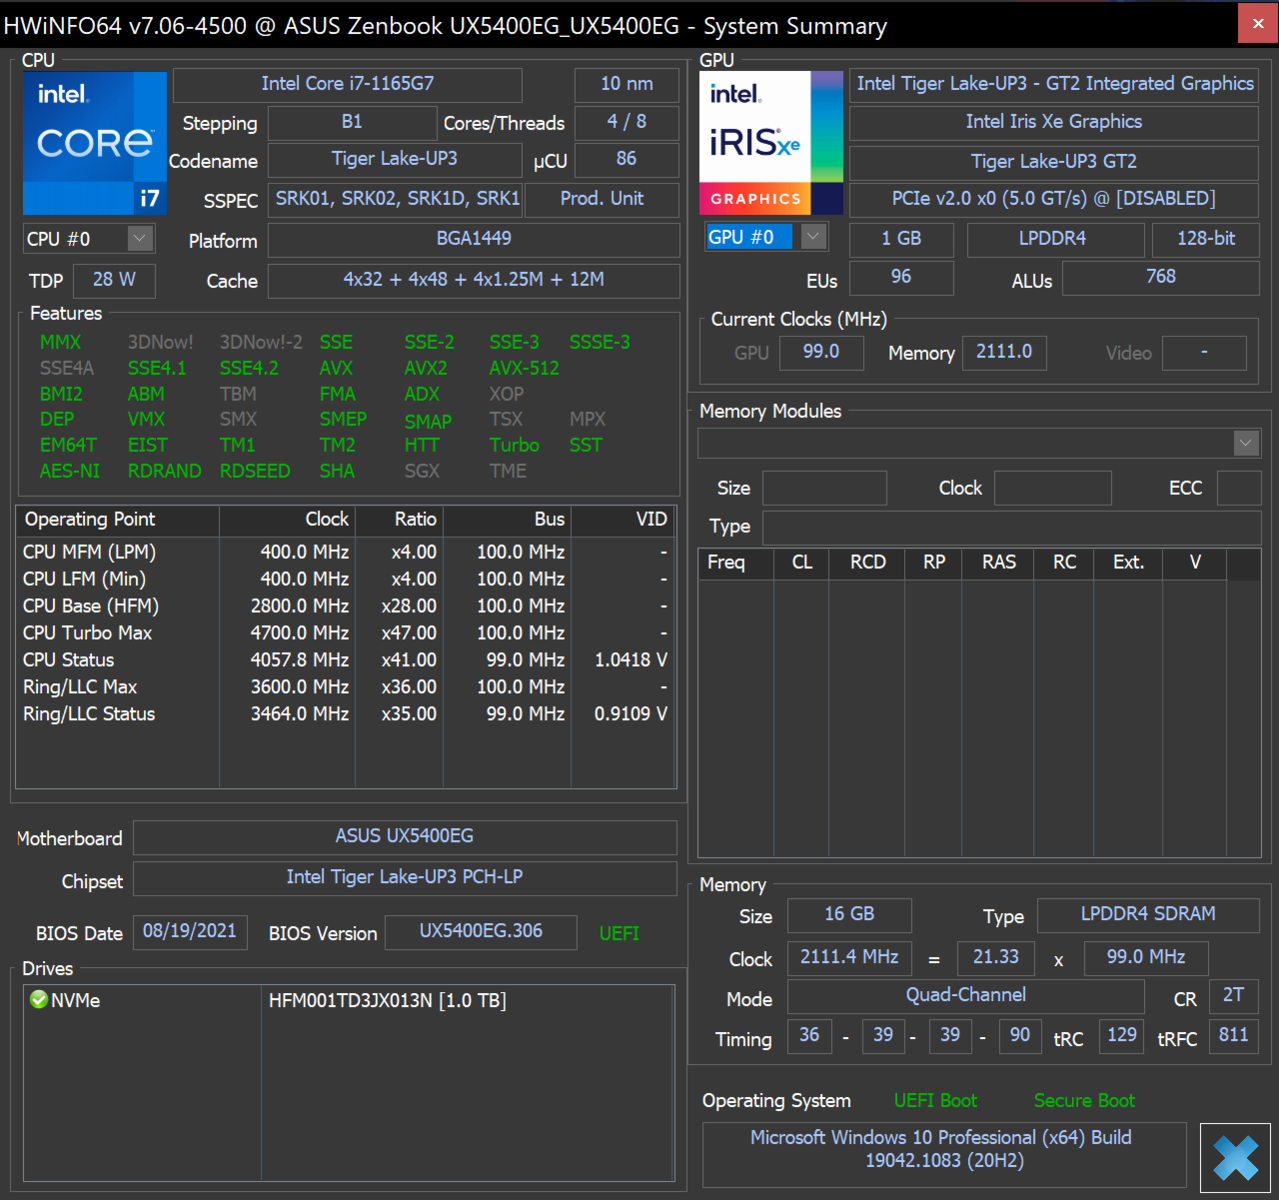
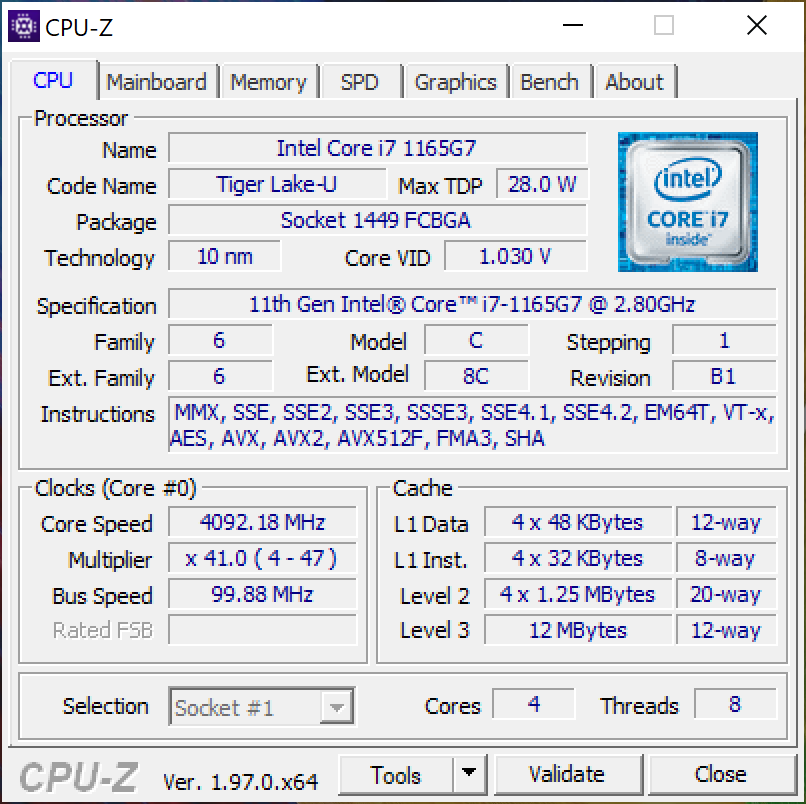
Processor
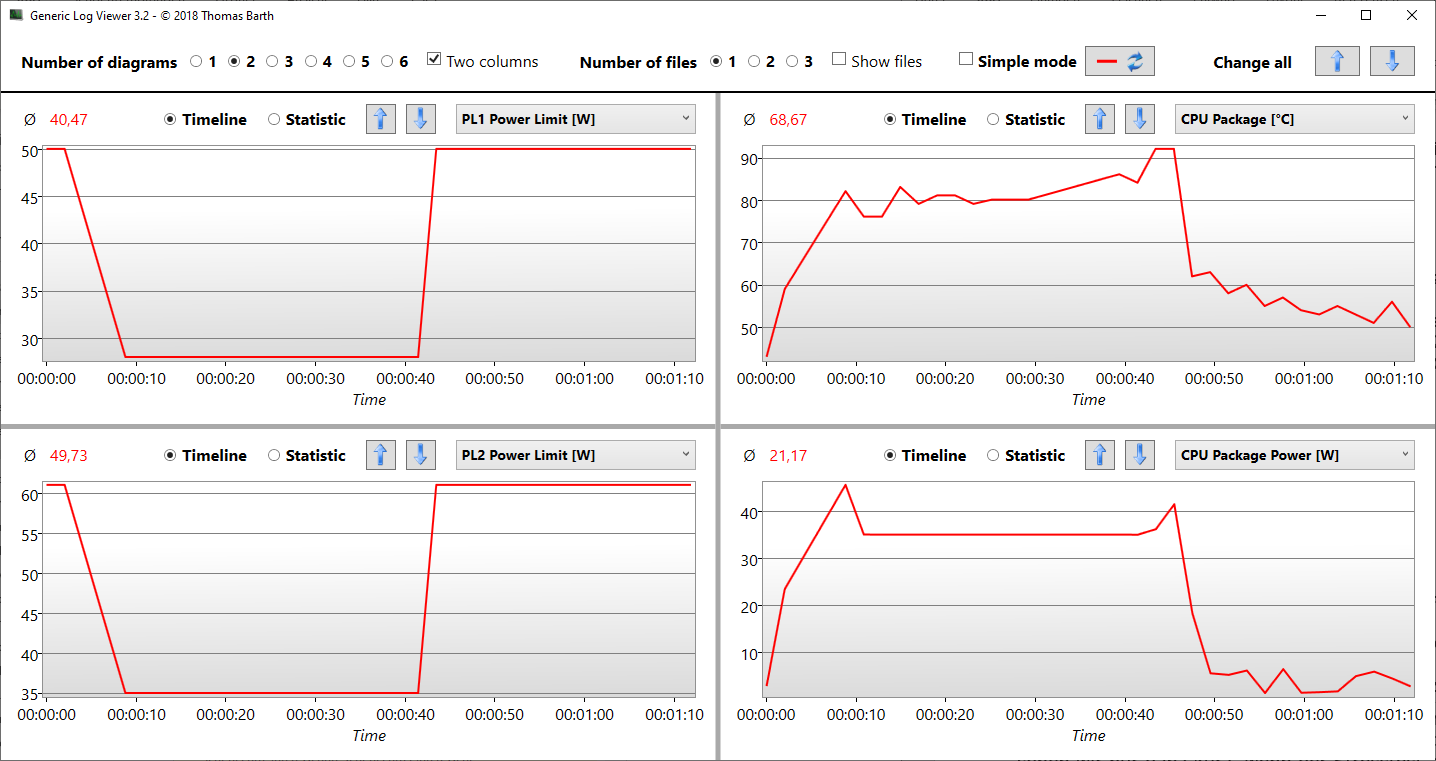
The Core i7-1165G7 (2.8 GHz) has a PL1 of 50 watts and a PL2 (short term) of 61 watts. In practice, the processor only operates with 61 watts for seconds, the PL2 value briefly touches the 60-watt mark when Cinebench R15 is run once (100% CPU load). The PL1 value is maintained at 50 watts for a short time only as well, dropping to 28 watts within five seconds. The CPU package consumes an average of 35 watts, with a peak of up to 45 watts at the beginning.
This changes on battery power, where the PL1/PL2 values aren't used at all; the CPU package power consumption briefly scratches the 20-watt mark and then runs at a constant 7 watts. The result: Instead of 951 points, only 284 points (30%) are achieved in the R15 test.
The loop shows that the Zenbook 14X's Turbo stability is suboptimal, which is largely congruent with the other i7-1165G7 devices. As we have often seen, the Ryzen 7 5700U plays in a completely different league in this respect, but its Turbo also weakens after the first run.
In all Cinebench tests, the i7-1165G7 lags behind the Ryzen 7 5700U in multi-core scenarios by a significant margin (-24%). The situation is the other way around in single-core mode, with the i7 leading by a wide margin (+17%). All in all, the SoC's performance is slightly above average compared to other models with the same chipset.
Cinebench R15 Multi endurance test
Cinebench R20: CPU (Multi Core) | CPU (Single Core)
Cinebench R15: CPU Multi 64Bit | CPU Single 64Bit
Blender: v2.79 BMW27 CPU
7-Zip 18.03: 7z b 4 | 7z b 4 -mmt1
Geekbench 5.5: Multi-Core | Single-Core
HWBOT x265 Benchmark v2.2: 4k Preset
LibreOffice : 20 Documents To PDF
R Benchmark 2.5: Overall mean
| Cinebench R23 / Multi Core | |
| Average of class Subnotebook (1555 - 21812, n=60, last 2 years) | |
| Asus ZenBook 13 OLED UM325UA | |
| HP Envy 14-eb0010nr | |
| Asus Zenbook 14X UX5400E | |
| MSI Modern 14 B11SB-085 | |
| Lenovo IdeaPad Slim 9i 14ITL5 | |
| Average Intel Core i7-1165G7 (2525 - 6862, n=64) | |
| Dell XPS 13 9310 OLED | |
| HP Envy 13-ba1475ng | |
| Asus Zenbook 14 UX435EG | |
| Cinebench R23 / Single Core | |
| Average of class Subnotebook (358 - 2213, n=61, last 2 years) | |
| Lenovo IdeaPad Slim 9i 14ITL5 | |
| MSI Modern 14 B11SB-085 | |
| Asus Zenbook 14X UX5400E | |
| Dell XPS 13 9310 OLED | |
| Average Intel Core i7-1165G7 (1110 - 1539, n=59) | |
| HP Envy 13-ba1475ng | |
| HP Envy 14-eb0010nr | |
| Asus ZenBook 13 OLED UM325UA | |
| Cinebench R20 / CPU (Multi Core) | |
| Average of class Subnotebook (579 - 8541, n=57, last 2 years) | |
| Asus ZenBook 13 OLED UM325UA | |
| Asus Zenbook 14X UX5400E | |
| HP Envy 14-eb0010nr | |
| MSI Modern 14 B11SB-085 | |
| Average Intel Core i7-1165G7 (1060 - 2657, n=81) | |
| Dell XPS 13 9310 OLED | |
| HP Envy 13-ba1475ng | |
| Lenovo IdeaPad Slim 9i 14ITL5 | |
| Asus Zenbook 14 UX435EG | |
| Cinebench R20 / CPU (Single Core) | |
| Average of class Subnotebook (128 - 832, n=57, last 2 years) | |
| MSI Modern 14 B11SB-085 | |
| Asus Zenbook 14X UX5400E | |
| Dell XPS 13 9310 OLED | |
| Average Intel Core i7-1165G7 (442 - 589, n=81) | |
| Asus Zenbook 14 UX435EG | |
| HP Envy 13-ba1475ng | |
| Lenovo IdeaPad Slim 9i 14ITL5 | |
| HP Envy 14-eb0010nr | |
| Asus ZenBook 13 OLED UM325UA | |
| Cinebench R15 / CPU Multi 64Bit | |
| Average of class Subnotebook (327 - 3345, n=57, last 2 years) | |
| Asus ZenBook 13 OLED UM325UA | |
| Asus Zenbook 14X UX5400E | |
| HP Envy 14-eb0010nr | |
| MSI Modern 14 B11SB-085 | |
| Average Intel Core i7-1165G7 (553 - 1027, n=86) | |
| Lenovo IdeaPad Slim 9i 14ITL5 | |
| Dell XPS 13 9310 OLED | |
| Asus Zenbook 14 UX435EG | |
| HP Envy 13-ba1475ng | |
| Cinebench R15 / CPU Single 64Bit | |
| Average of class Subnotebook (72.4 - 322, n=57, last 2 years) | |
| Dell XPS 13 9310 OLED | |
| Average Intel Core i7-1165G7 (115 - 230, n=78) | |
| Asus Zenbook 14 UX435EG | |
| HP Envy 13-ba1475ng | |
| Lenovo IdeaPad Slim 9i 14ITL5 | |
| MSI Modern 14 B11SB-085 | |
| HP Envy 14-eb0010nr | |
| Asus Zenbook 14X UX5400E | |
| Asus ZenBook 13 OLED UM325UA | |
| Blender / v2.79 BMW27 CPU | |
| Asus Zenbook 14 UX435EG | |
| HP Envy 13-ba1475ng | |
| Dell XPS 13 9310 OLED | |
| Average Intel Core i7-1165G7 (468 - 1138, n=80) | |
| Lenovo IdeaPad Slim 9i 14ITL5 | |
| MSI Modern 14 B11SB-085 | |
| Asus Zenbook 14X UX5400E | |
| HP Envy 14-eb0010nr | |
| Asus ZenBook 13 OLED UM325UA | |
| Average of class Subnotebook (159 - 2271, n=58, last 2 years) | |
| 7-Zip 18.03 / 7z b 4 | |
| Average of class Subnotebook (11668 - 77867, n=57, last 2 years) | |
| Asus ZenBook 13 OLED UM325UA | |
| Lenovo IdeaPad Slim 9i 14ITL5 | |
| HP Envy 14-eb0010nr | |
| MSI Modern 14 B11SB-085 | |
| Average Intel Core i7-1165G7 (15347 - 27405, n=80) | |
| Asus Zenbook 14X UX5400E | |
| Asus Zenbook 14 UX435EG | |
| Dell XPS 13 9310 OLED | |
| HP Envy 13-ba1475ng | |
| 7-Zip 18.03 / 7z b 4 -mmt1 | |
| Average of class Subnotebook (2643 - 6699, n=59, last 2 years) | |
| Lenovo IdeaPad Slim 9i 14ITL5 | |
| MSI Modern 14 B11SB-085 | |
| Asus Zenbook 14 UX435EG | |
| Average Intel Core i7-1165G7 (4478 - 5507, n=80) | |
| HP Envy 13-ba1475ng | |
| HP Envy 14-eb0010nr | |
| Asus Zenbook 14X UX5400E | |
| Asus ZenBook 13 OLED UM325UA | |
| Dell XPS 13 9310 OLED | |
| Geekbench 5.5 / Multi-Core | |
| Average of class Subnotebook (2557 - 17218, n=48, last 2 years) | |
| Asus ZenBook 13 OLED UM325UA | |
| Dell XPS 13 9310 OLED | |
| Lenovo IdeaPad Slim 9i 14ITL5 | |
| Asus Zenbook 14X UX5400E | |
| Asus Zenbook 14 UX435EG | |
| Average Intel Core i7-1165G7 (3078 - 5926, n=77) | |
| HP Envy 13-ba1475ng | |
| HP Envy 14-eb0010nr | |
| MSI Modern 14 B11SB-085 | |
| Geekbench 5.5 / Single-Core | |
| Average of class Subnotebook (726 - 2224, n=48, last 2 years) | |
| Lenovo IdeaPad Slim 9i 14ITL5 | |
| Dell XPS 13 9310 OLED | |
| Asus Zenbook 14 UX435EG | |
| Average Intel Core i7-1165G7 (1302 - 1595, n=77) | |
| MSI Modern 14 B11SB-085 | |
| Asus Zenbook 14X UX5400E | |
| HP Envy 13-ba1475ng | |
| HP Envy 14-eb0010nr | |
| Asus ZenBook 13 OLED UM325UA | |
| HWBOT x265 Benchmark v2.2 / 4k Preset | |
| Average of class Subnotebook (0.97 - 25.1, n=57, last 2 years) | |
| Asus ZenBook 13 OLED UM325UA | |
| HP Envy 14-eb0010nr | |
| Asus Zenbook 14X UX5400E | |
| Lenovo IdeaPad Slim 9i 14ITL5 | |
| MSI Modern 14 B11SB-085 | |
| Dell XPS 13 9310 OLED | |
| Average Intel Core i7-1165G7 (1.39 - 8.47, n=80) | |
| HP Envy 13-ba1475ng | |
| Asus Zenbook 14 UX435EG | |
| LibreOffice / 20 Documents To PDF | |
| Asus ZenBook 13 OLED UM325UA | |
| Average of class Subnotebook (39.9 - 220, n=56, last 2 years) | |
| HP Envy 13-ba1475ng | |
| Asus Zenbook 14 UX435EG | |
| MSI Modern 14 B11SB-085 | |
| Asus Zenbook 14X UX5400E | |
| HP Envy 14-eb0010nr | |
| Lenovo IdeaPad Slim 9i 14ITL5 | |
| Average Intel Core i7-1165G7 (21.5 - 88.1, n=78) | |
| Dell XPS 13 9310 OLED | |
| R Benchmark 2.5 / Overall mean | |
| HP Envy 14-eb0010nr | |
| Asus Zenbook 14X UX5400E | |
| HP Envy 13-ba1475ng | |
| Asus ZenBook 13 OLED UM325UA | |
| Dell XPS 13 9310 OLED | |
| Average Intel Core i7-1165G7 (0.552 - 1.002, n=80) | |
| MSI Modern 14 B11SB-085 | |
| Asus Zenbook 14 UX435EG | |
| Lenovo IdeaPad Slim 9i 14ITL5 | |
| Average of class Subnotebook (0.4024 - 1.456, n=58, last 2 years) | |
* ... smaller is better
System performance
According to PCMark 10, the Zenbook 14X is at the forefront in terms of application performance, especially when it comes to productivity. The benchmark takes advantage of the super fast SK Hynix SSD here.
| PCMark 10 / Score | |
| Average of class Subnotebook (4920 - 9939, n=45, last 2 years) | |
| HP Envy 14-eb0010nr | |
| Average Intel Core i7-1165G7, NVIDIA GeForce MX450 (4823 - 5814, n=9) | |
| Asus Zenbook 14X UX5400E | |
| Dell XPS 13 9310 OLED | |
| HP Envy 13-ba1475ng | |
| Asus Zenbook 14 UX435EG | |
| Lenovo IdeaPad Slim 9i 14ITL5 | |
| MSI Modern 14 B11SB-085 | |
| PCMark 10 / Essentials | |
| Dell XPS 13 9310 OLED | |
| Average of class Subnotebook (8552 - 11646, n=45, last 2 years) | |
| Lenovo IdeaPad Slim 9i 14ITL5 | |
| Average Intel Core i7-1165G7, NVIDIA GeForce MX450 (8088 - 9955, n=9) | |
| Asus Zenbook 14 UX435EG | |
| HP Envy 13-ba1475ng | |
| HP Envy 14-eb0010nr | |
| Asus Zenbook 14X UX5400E | |
| MSI Modern 14 B11SB-085 | |
| PCMark 10 / Productivity | |
| Average of class Subnotebook (5435 - 16606, n=45, last 2 years) | |
| Asus Zenbook 14X UX5400E | |
| Average Intel Core i7-1165G7, NVIDIA GeForce MX450 (7826 - 9292, n=9) | |
| Asus Zenbook 14 UX435EG | |
| HP Envy 14-eb0010nr | |
| HP Envy 13-ba1475ng | |
| MSI Modern 14 B11SB-085 | |
| Dell XPS 13 9310 OLED | |
| Lenovo IdeaPad Slim 9i 14ITL5 | |
| PCMark 10 / Digital Content Creation | |
| Average of class Subnotebook (5722 - 13779, n=45, last 2 years) | |
| HP Envy 14-eb0010nr | |
| Dell XPS 13 9310 OLED | |
| Average Intel Core i7-1165G7, NVIDIA GeForce MX450 (4812 - 5878, n=9) | |
| Asus Zenbook 14X UX5400E | |
| Lenovo IdeaPad Slim 9i 14ITL5 | |
| HP Envy 13-ba1475ng | |
| Asus Zenbook 14 UX435EG | |
| MSI Modern 14 B11SB-085 | |
| PCMark 10 Score | 5234 points | |
Help | ||
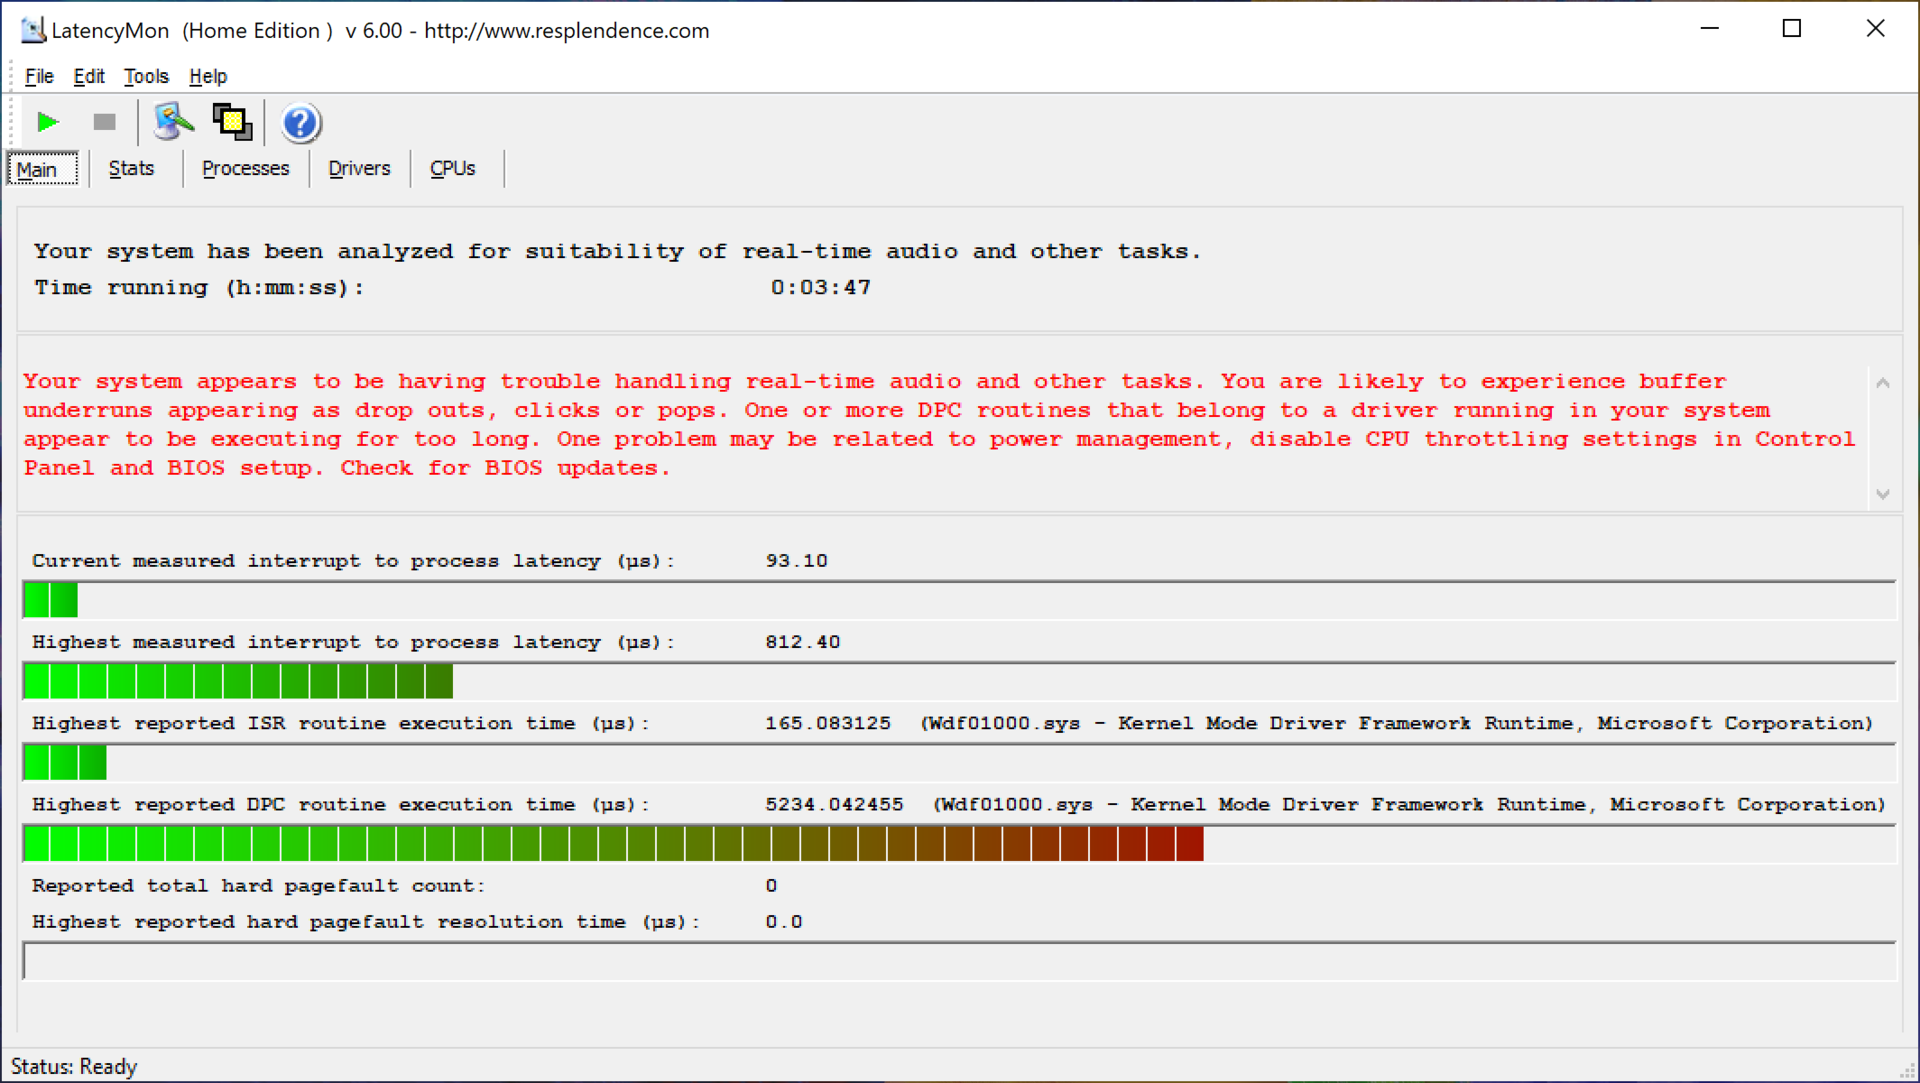
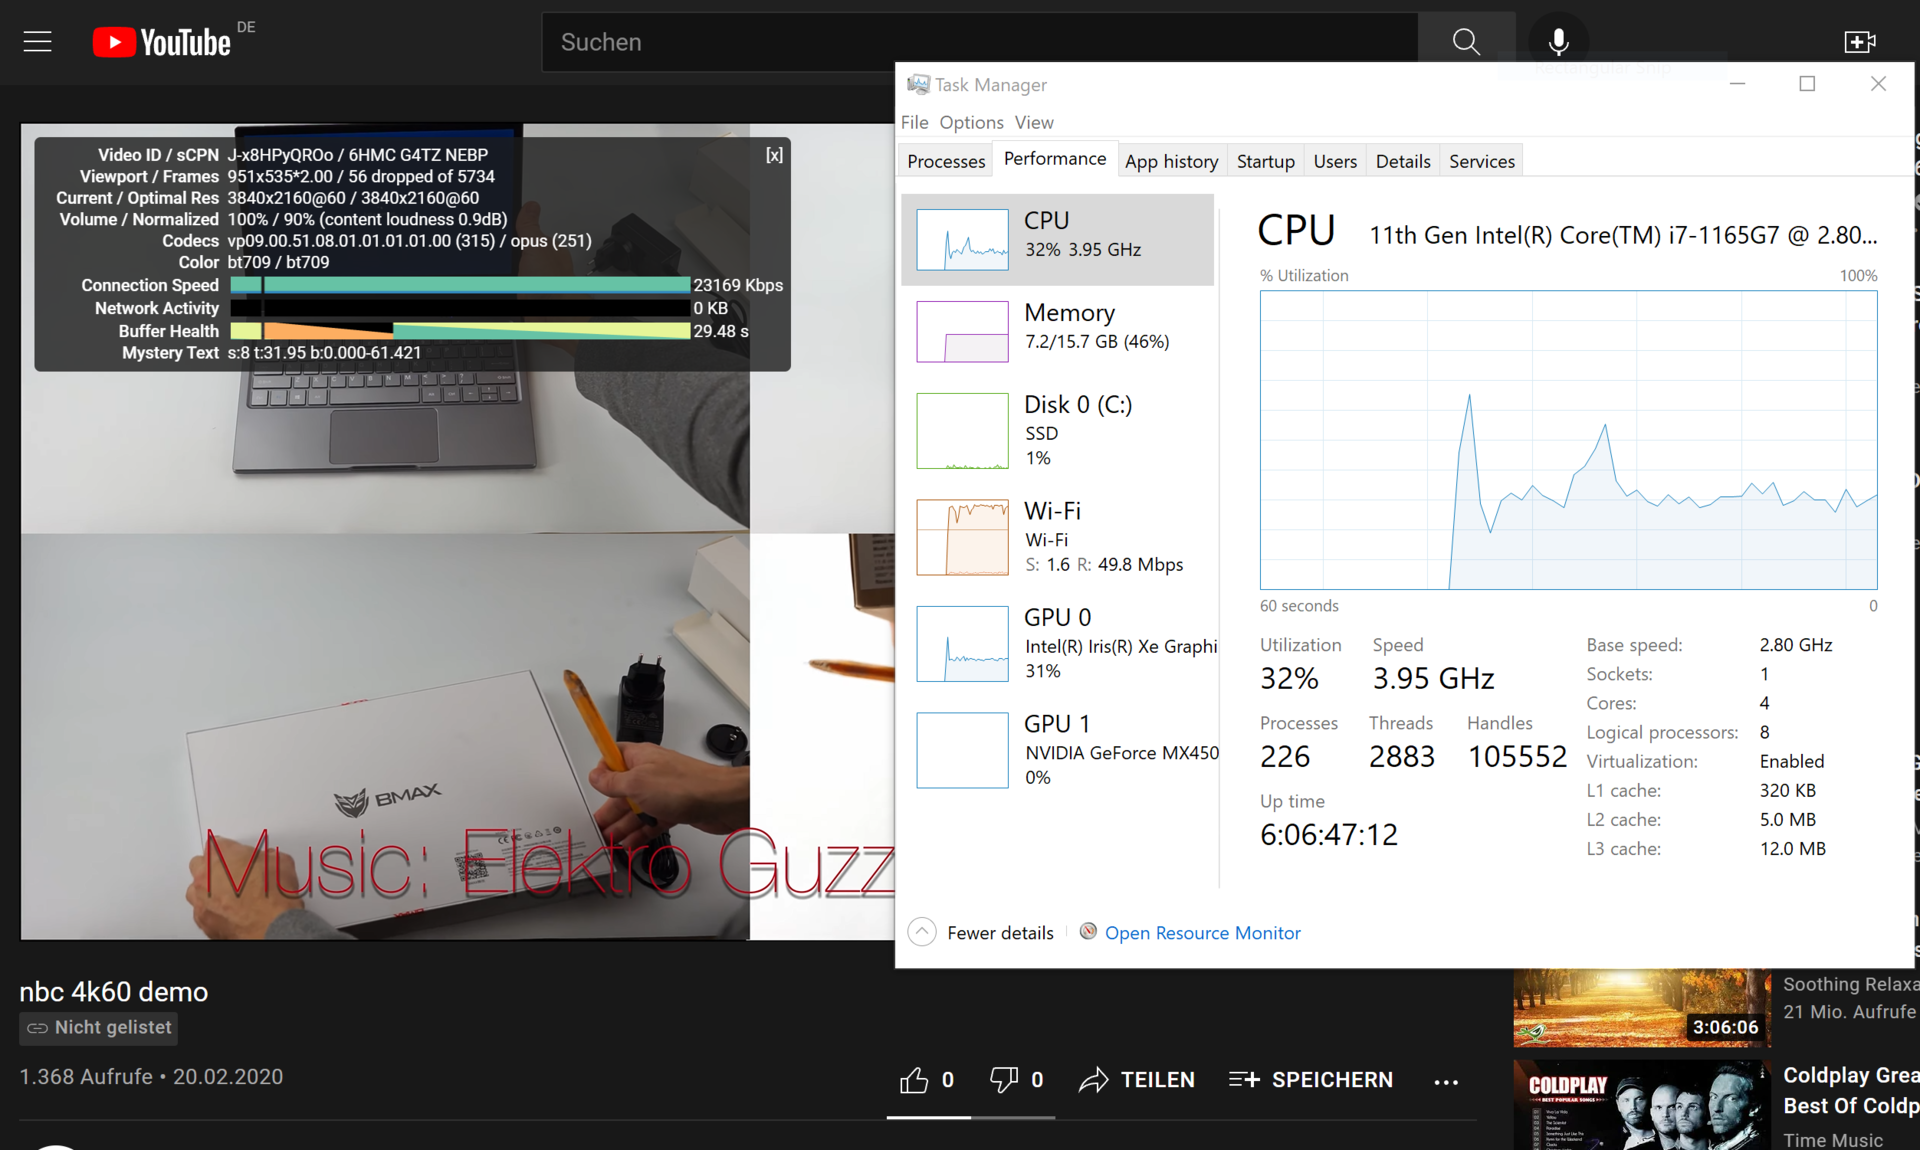
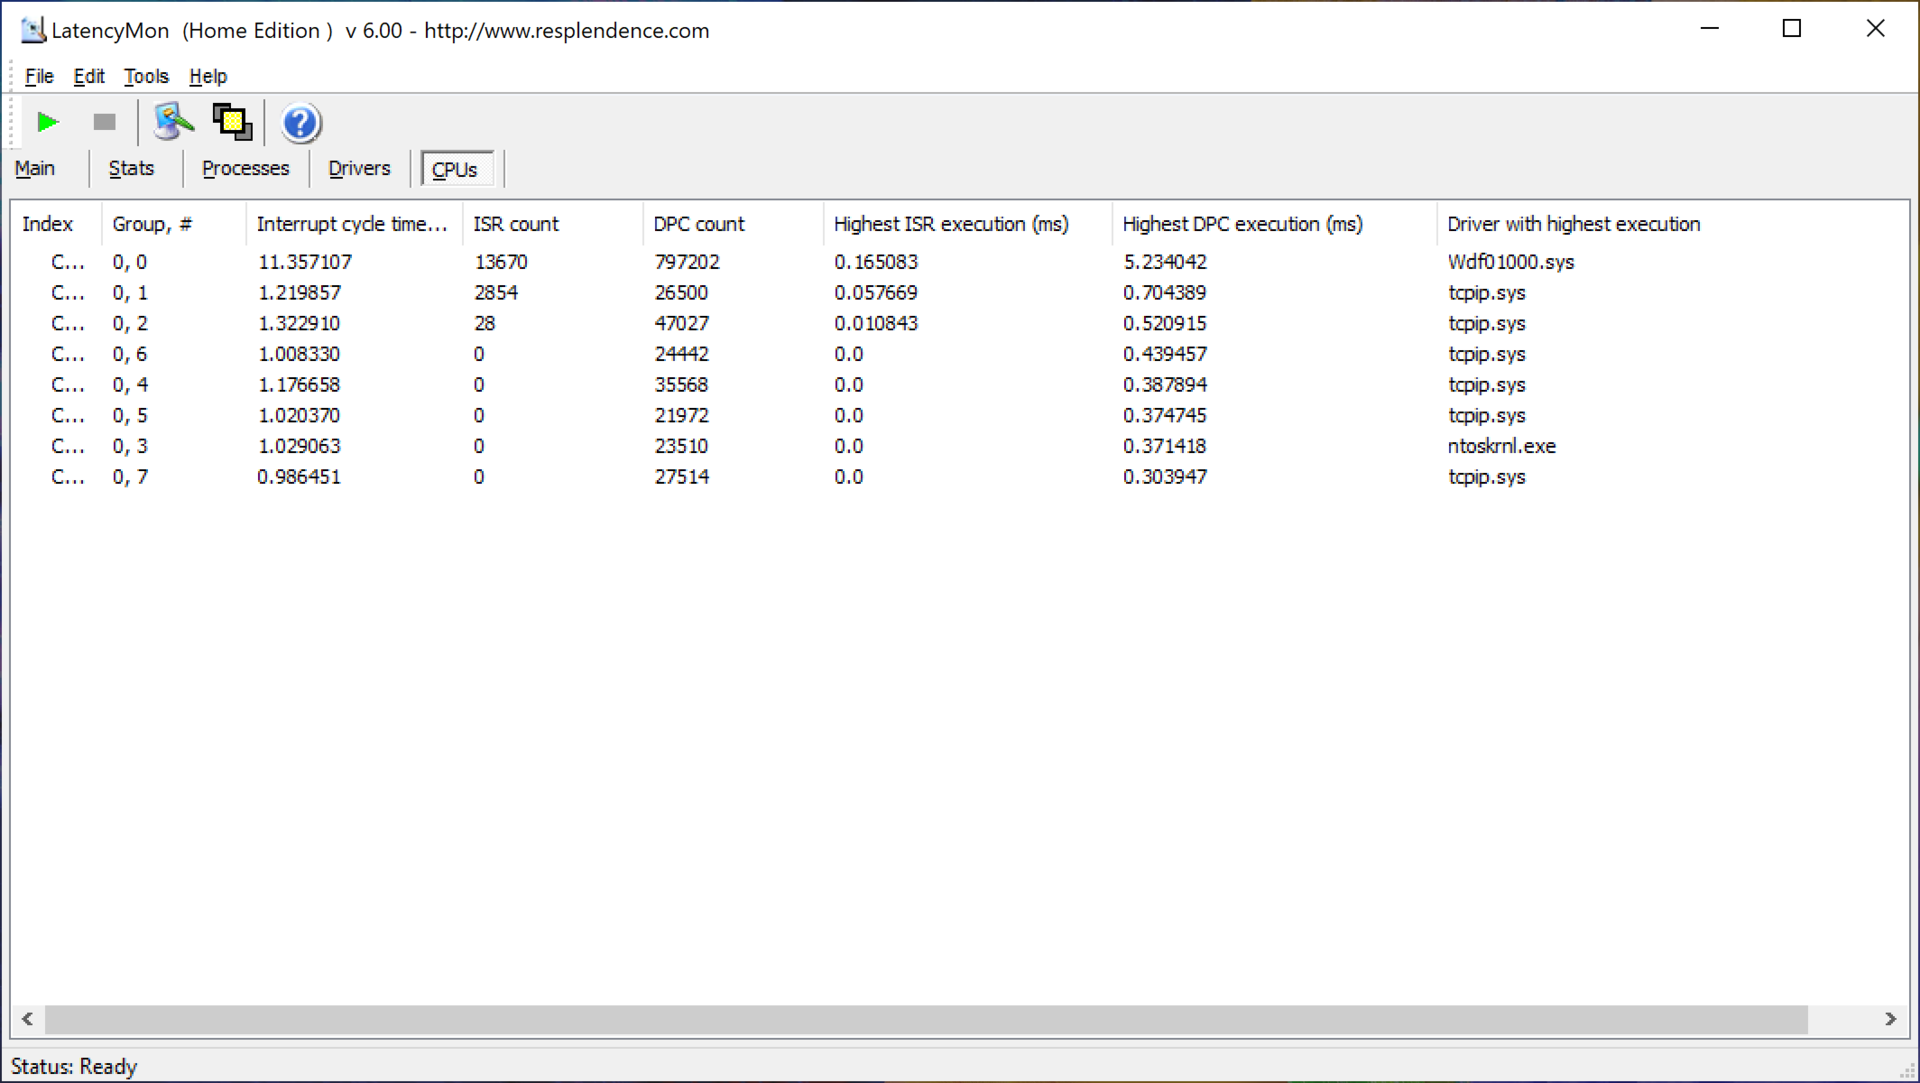
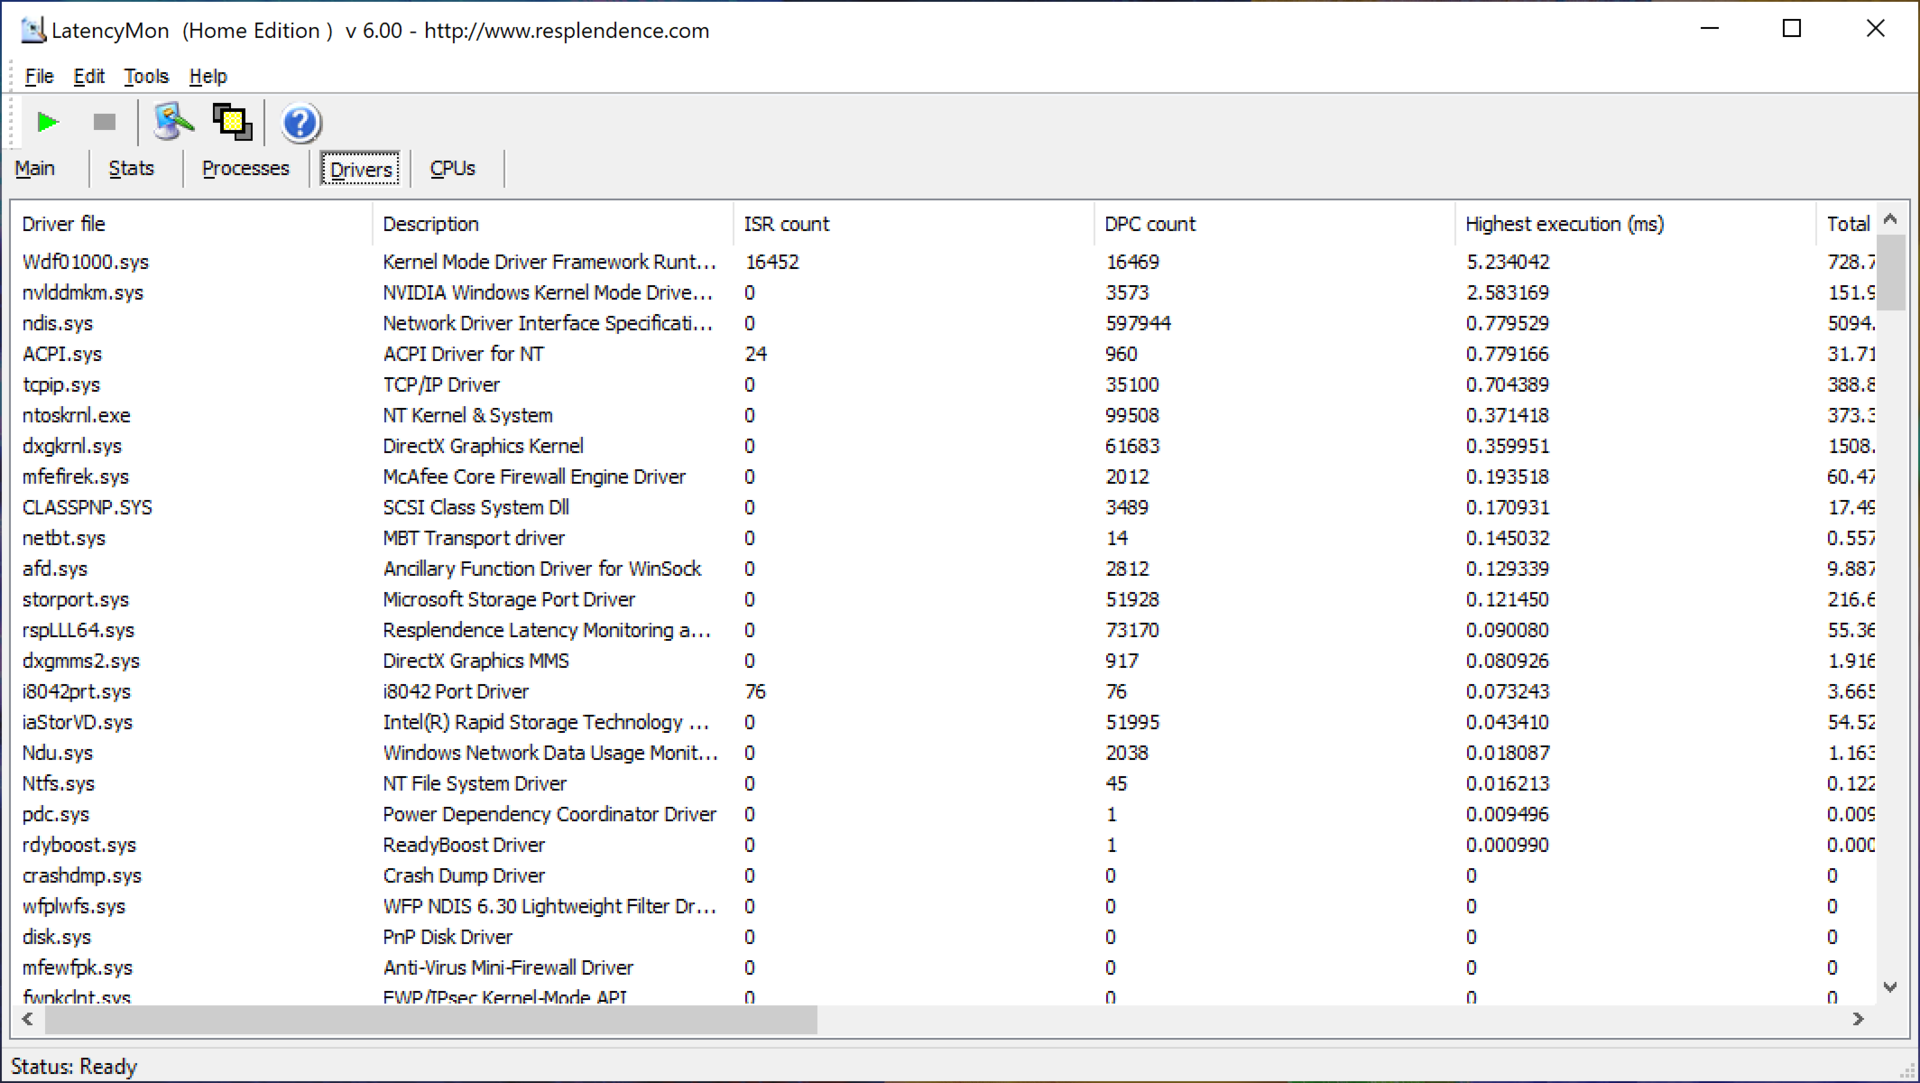
DPC latencies
In our standardized latency test (web browsing, YouTube 4K playback, CPU load), the Zenbook shows problems with elevated latencies. This is due to Kernel Mode drivers. The existing driver configuration is not suitable for real-time audio applications. There were 56 dropped frames during video playback.
| DPC Latencies / LatencyMon - interrupt to process latency (max), Web, Youtube, Prime95 | |
| HP Envy 14-eb0010nr | |
| Dell XPS 13 9310 OLED | |
| Lenovo IdeaPad Slim 9i 14ITL5 | |
| MSI Modern 14 B11SB-085 | |
| HP Envy 13-ba1475ng | |
| Asus Zenbook 14X UX5400E | |
| Asus Zenbook 14 UX435EG | |
* ... smaller is better
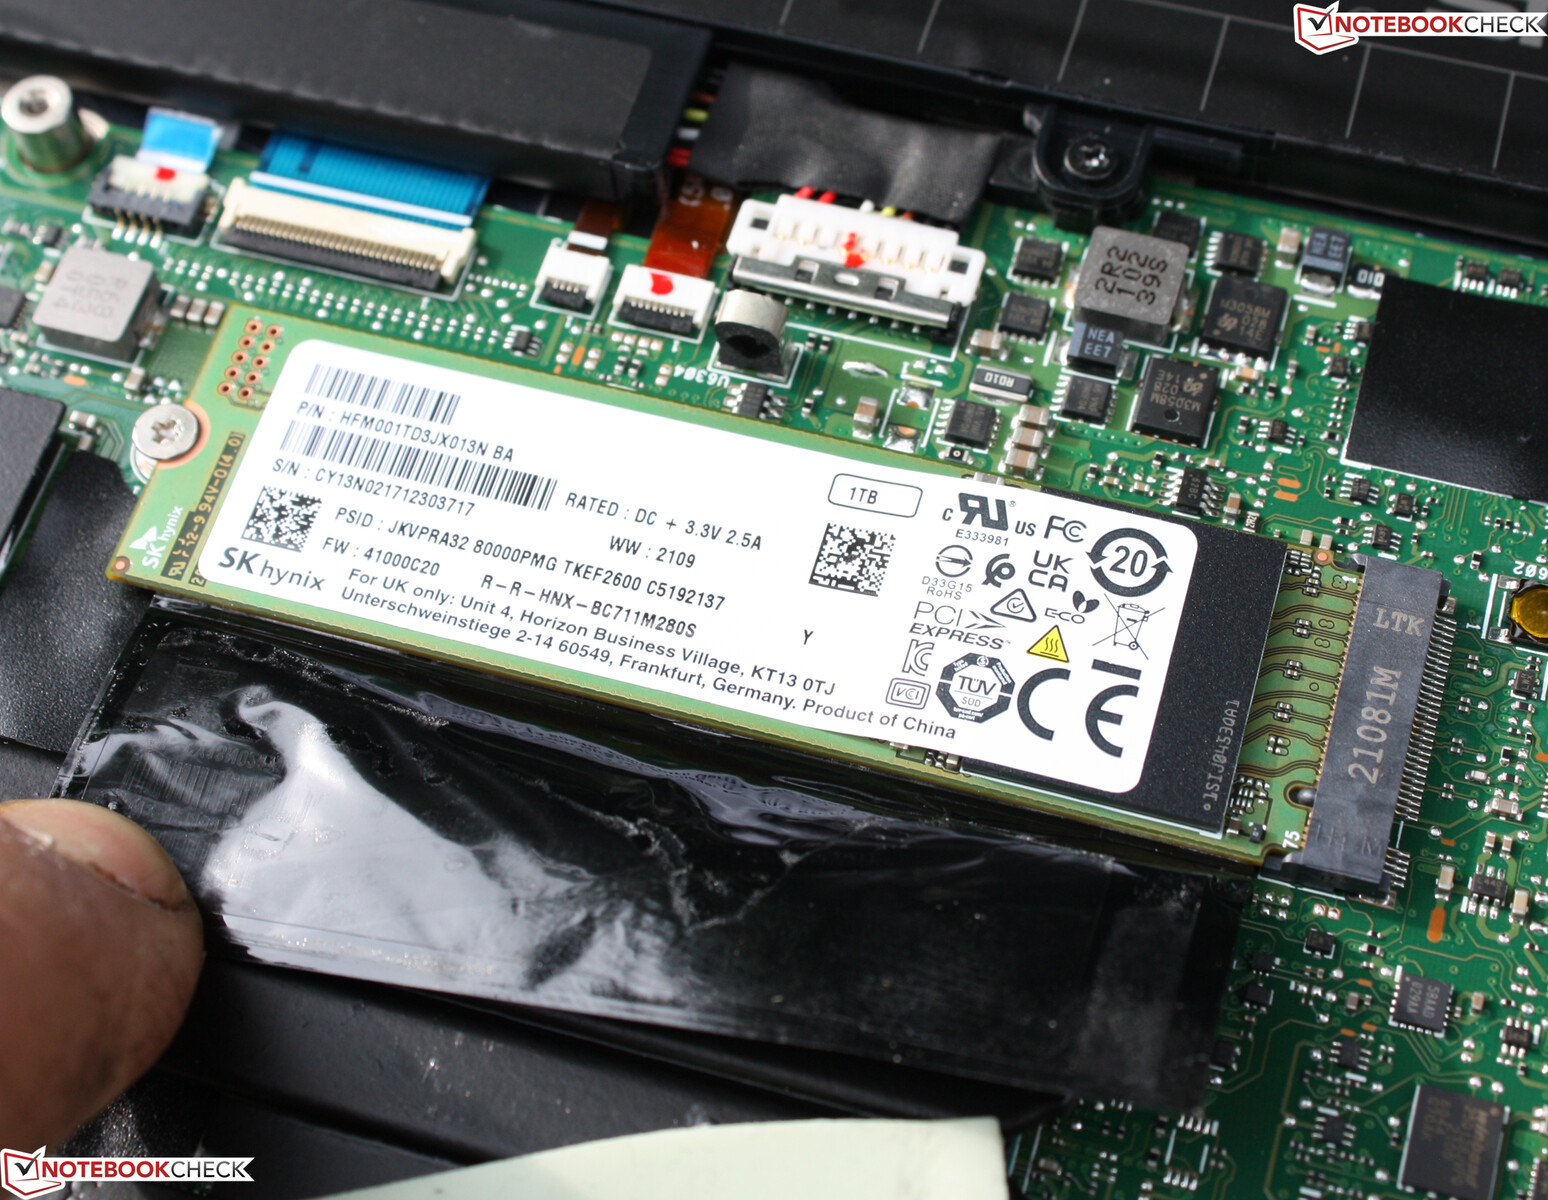
Storage
The 1 TB SK Hynix doesn't disappoint, since it outperforms nearly all contenders in our comparison. Only the Samsung PM981a in the Zenbook 14 UX435EG is about 25% faster. In practice, the differences aren't perceptible anyway; you can only identify them through measurements. Approximately 870 GB is available out of the box.
| Asus Zenbook 14X UX5400E SK Hynix HFM001TD3JX013N | Dell XPS 13 9310 OLED Toshiba XG6 KXG60ZNV512G | Asus Zenbook 14 UX435EG Samsung PM981a MZVLB1T0HBLR | MSI Modern 14 B11SB-085 Kingston OM8PCP3512F-AB | HP Envy 13-ba1475ng Intel SSD 660p SSDPEKNW512G8 | Lenovo IdeaPad Slim 9i 14ITL5 WDC PC SN730 SDBPNTY-512G | Average SK Hynix HFM001TD3JX013N | |
|---|---|---|---|---|---|---|---|
| CrystalDiskMark 5.2 / 6 | -20% | 20% | -19% | -33% | -11% | -2% | |
| Write 4K (MB/s) | 121.6 | 156.8 29% | 211.8 74% | 236.2 94% | 133.5 10% | 131.5 8% | 155.8 ? 28% |
| Read 4K (MB/s) | 57.9 | 39.66 -32% | 50.1 -13% | 47.53 -18% | 39.66 -32% | 36.83 -36% | 57 ? -2% |
| Write Seq (MB/s) | 18545 | 854 -95% | 2938 -84% | 974 -95% | 907 -95% | 1614 -91% | 3943 ? -79% |
| Read Seq (MB/s) | 2085 | 2167 4% | 2639 27% | 1043 -50% | 1481 -29% | 2030 -3% | 2180 ? 5% |
| Write 4K Q32T1 (MB/s) | 414 | 441.1 7% | 656 58% | 603 46% | 446.2 8% | 516 25% | 452 ? 9% |
| Read 4K Q32T1 (MB/s) | 401 | 395.5 -1% | 723 80% | 299.3 -25% | 335.1 -16% | 419.7 5% | 447 ? 11% |
| Write Seq Q32T1 (MB/s) | 2790 | 858 -69% | 3022 8% | 974 -65% | 975 -65% | 2705 -3% | 2859 ? 2% |
| Read Seq Q32T1 (MB/s) | 3219 | 3258 1% | 3561 11% | 1983 -38% | 1874 -42% | 3390 5% | 3515 ? 9% |
| AS SSD | -15% | 29% | -40% | -50% | -22% | 7% | |
| Seq Read (MB/s) | 2637 | 2694 2% | 2861 8% | 1610 -39% | 1608 -39% | 2068 -22% | 2839 ? 8% |
| Seq Write (MB/s) | 1243 | 1407 13% | 2837 128% | 931 -25% | 659 -47% | 1414 14% | 1917 ? 54% |
| 4K Read (MB/s) | 54.7 | 54.4 -1% | 60.3 10% | 36.18 -34% | 51.3 -6% | 46.99 -14% | 53 ? -3% |
| 4K Write (MB/s) | 128.4 | 195.8 52% | 164.2 28% | 170.5 33% | 151.8 18% | 211.9 65% | 127.3 ? -1% |
| 4K-64 Read (MB/s) | 1011 | 1092 8% | 1598 58% | 457.3 -55% | 322.1 -68% | 1027 2% | 1369 ? 35% |
| 4K-64 Write (MB/s) | 1432 | 1269 -11% | 1572 10% | 914 -36% | 800 -44% | 978 -32% | 1939 ? 35% |
| Access Time Read * (ms) | 0.031 | 0.064 -106% | 0.046 -48% | 0.092 -197% | 0.077 -148% | 0.057 -84% | 0.0468 ? -51% |
| Access Time Write * (ms) | 0.028 | 0.062 -121% | 0.021 25% | 0.019 32% | 0.046 -64% | 0.066 -136% | 0.0532 ? -90% |
| Score Read (Points) | 1330 | 1416 6% | 1945 46% | 655 -51% | 534 -60% | 1281 -4% | 1706 ? 28% |
| Score Write (Points) | 1685 | 1606 -5% | 2020 20% | 1178 -30% | 1018 -40% | 1331 -21% | 2258 ? 34% |
| Score Total (Points) | 3637 | 3692 2% | 4966 37% | 2144 -41% | 1797 -51% | 3243 -11% | 4797 ? 32% |
| Copy ISO MB/s (MB/s) | 1782 | 2414 | 1277 | 961 | 1891 | 1908 ? | |
| Copy Program MB/s (MB/s) | 1023 | 575 | 438.4 | 753 | 604 | 665 ? | |
| Copy Game MB/s (MB/s) | 1148 | 1408 | 977 | 896 | 1422 | 1349 ? | |
| Total Average (Program / Settings) | -18% /
-17% | 25% /
25% | -30% /
-31% | -42% /
-43% | -17% /
-18% | 3% /
3% |
* ... smaller is better

Continuous load read: DiskSpd Read Loop, Queue Depth 8
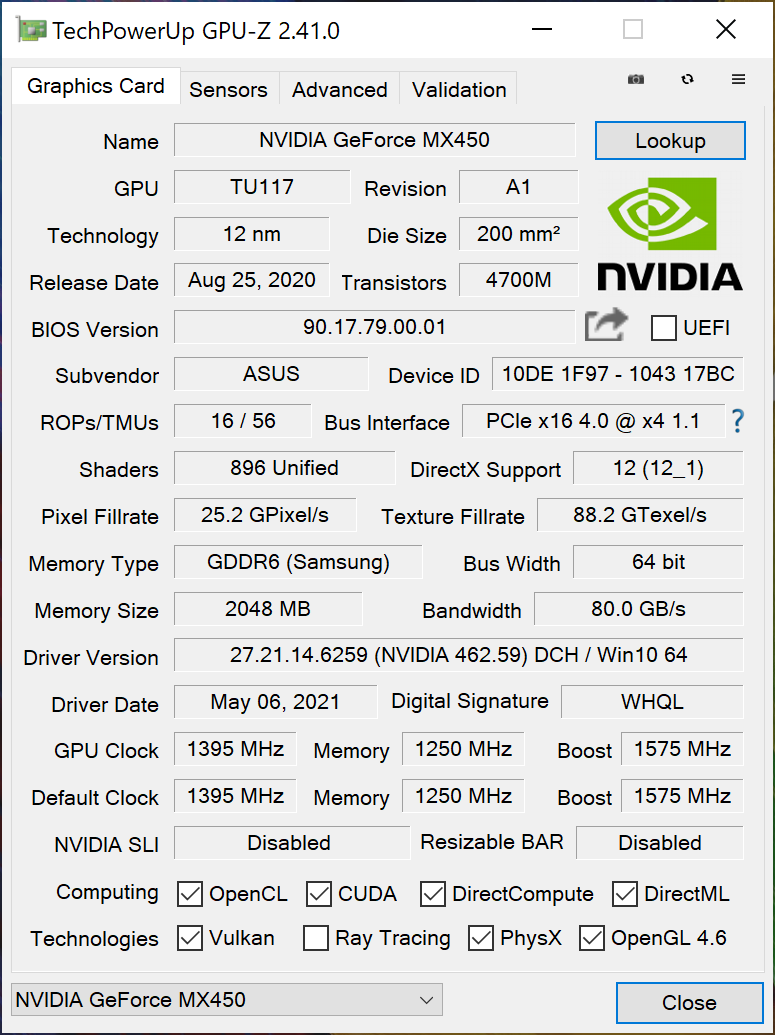
Graphics card
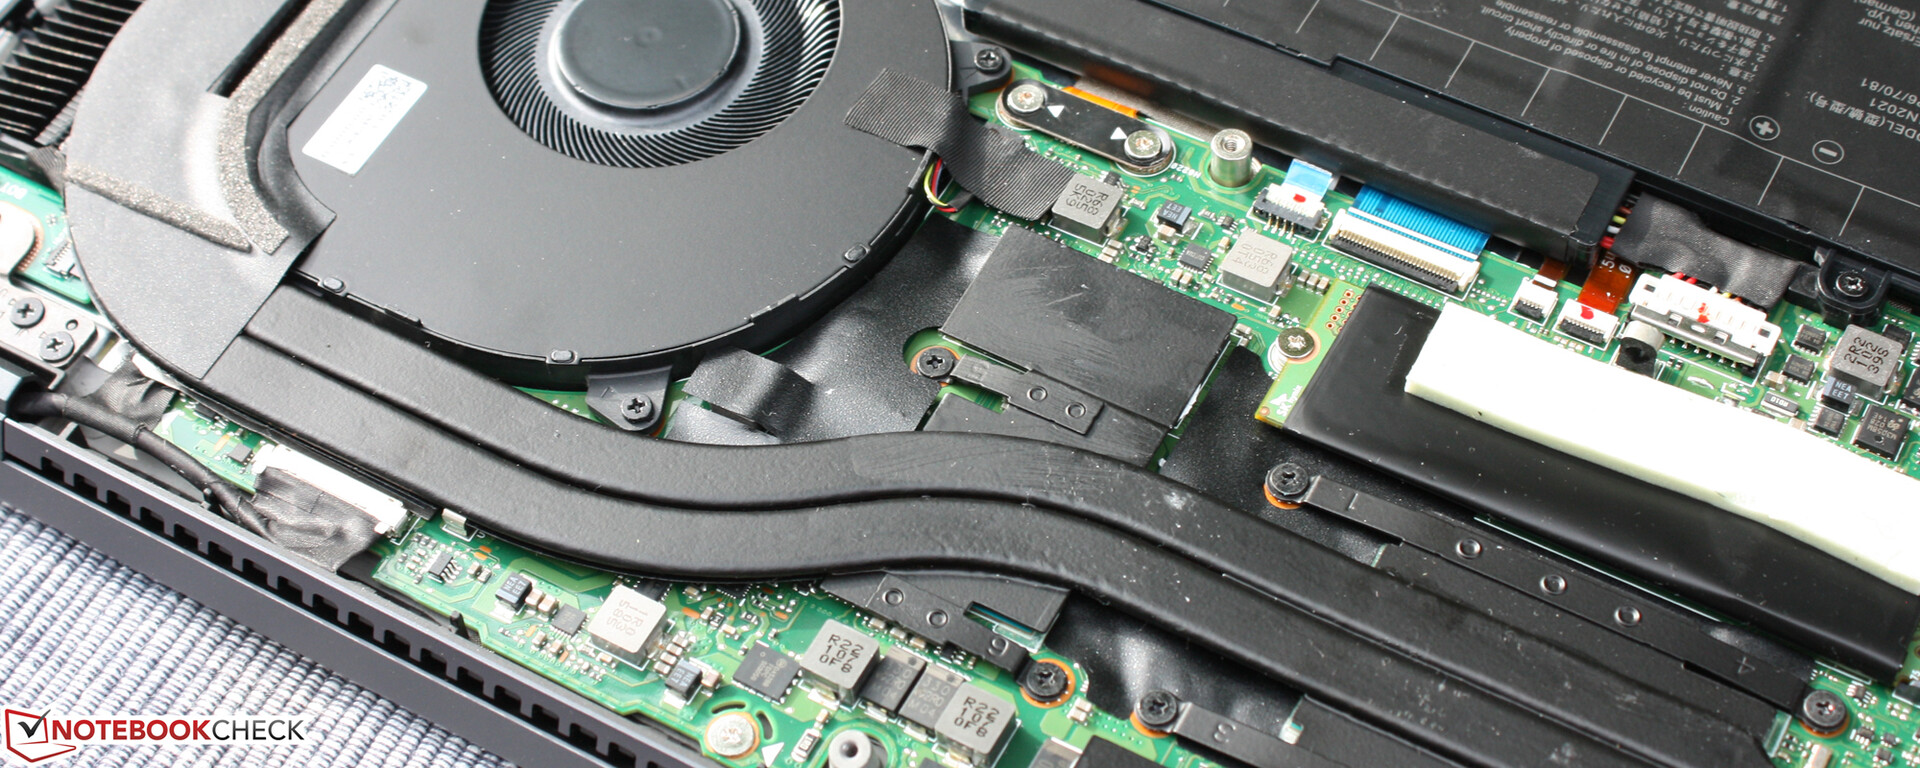
The MX450 installed (Turing TU117M) is the second most powerful variant, the N18S-G5, which offers a 64-bit connection and 1,395 to 1,575 MHz along with GDDR6. It operates with up to 25 watts. Nevertheless, the manufacturer refrains from using a second fan.
- N18S-G5-B: GBD-128 package, 1,395-1,575 MHz, GDDR6 5,001 MHz, 28.5 W
- N18S-G5: GB2E-64 package, 1,395-1,575 MHz, GDDR6 5,001 MHz, 25 W
- N18S-G5: GB2E-64 package, 1,395-1,575 MHz, GDDR5 3,501 MHz, 25 W
- N18S-LP: GB2E-64 package, 720-930 MHz, GDDR6 5,001 MHz, 12 W
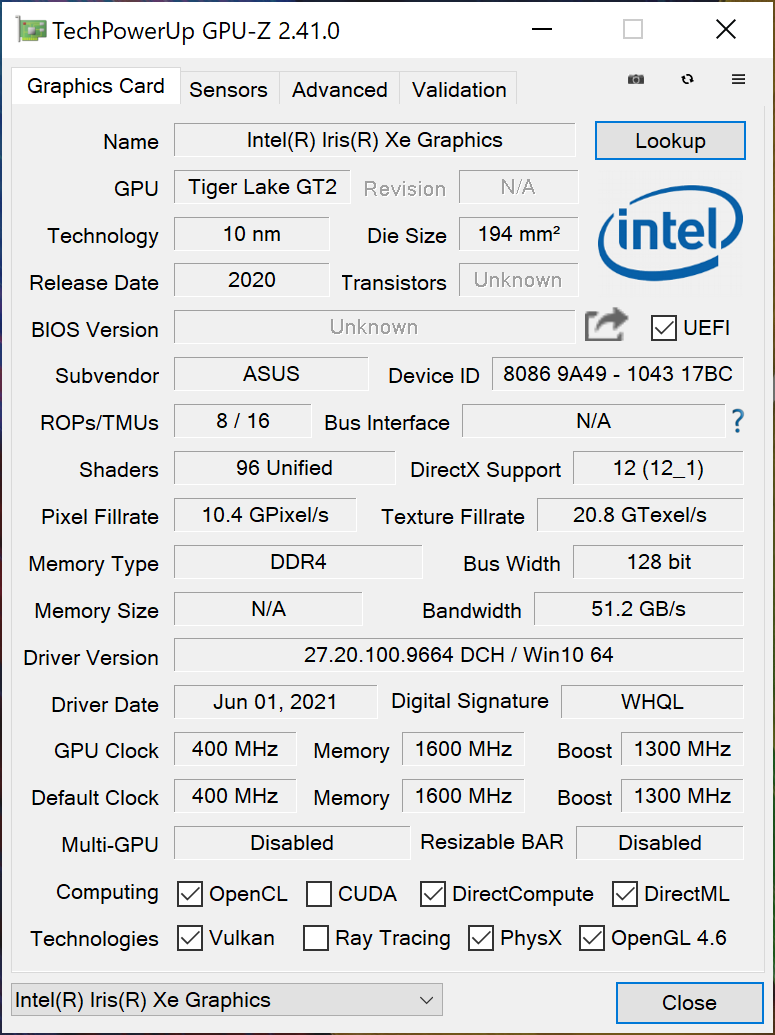
Besides the GeForce MX450 GPU, you also get the integrated Intel Iris Xe 96EUs graphics. The MX450 is at the top in the synthetic benchmarks, and it's on par with the Iris Xe Graphics G7 96EUs or outperforms it by almost 10% in some cases. The MX450 beats the Vega 8 (ZenBook 13 OLED UM325UA) by about 40-50%.
| 3DMark Fire Strike Score | 4892 points | |
| 3DMark Time Spy Score | 1810 points | |
Help | ||
Gaming performance
In the real gaming benchmarks, the MX450 performs moderately. In The Witcher 3 Ultra, the dGPU performs below average: The MSI Modern 14 B11SB-085 and the HP Envy 13-ba1475ng equipped with the same dGPU are about 20% ahead, and even an Iris Xe Graphics G7 96EUs is a tad faster at times (Dell XPS 13 9310 OLED).
The MX450 runs better in Far Cry 5, Strange Brigade, and New World, and it even outperforms an Iris Xe Graphics G7 96EUs by 50% (Strange Brigade). We lack comparison rates in Far Cry 5, but the MX450 performs better than its own average here. The recent New World is still just playable at 32 FPS at Full HD resolution and medium details, but you can't switch to 3K.
| The Witcher 3 - 1920x1080 High Graphics & Postprocessing (Nvidia HairWorks Off) | |
| HP Envy 14-eb0010nr | |
| Average of class Subnotebook (25.6 - 64, n=13, last 2 years) | |
| HP Envy 13-ba1475ng | |
| Average NVIDIA GeForce MX450 (21 - 46, n=16) | |
| MSI Modern 14 B11SB-085 | |
| Lenovo IdeaPad Slim 9i 14ITL5 | |
| Dell XPS 13 9310 OLED | |
| Asus Zenbook 14 UX435EG | |
| Asus Zenbook 14X UX5400E | |
| Far Cry 5 - 1920x1080 Medium Preset AA:T | |
| Average of class Subnotebook (21 - 59, n=24, last 2 years) | |
| Asus Zenbook 14X UX5400E | |
| Average NVIDIA GeForce MX450 (24 - 41, n=7) | |
| Asus Zenbook 14 UX435EG | |
| Strange Brigade - 1920x1080 high AA:high AF:8 | |
| HP Envy 14-eb0010nr | |
| Average of class Subnotebook (22.8 - 114.9, n=50, last 2 years) | |
| Asus Zenbook 14X UX5400E | |
| Average NVIDIA GeForce MX450 (19.2 - 46.7, n=12) | |
| MSI Modern 14 B11SB-085 | |
| Dell XPS 13 9310 OLED | |
| New World - 1920x1080 Medium Video Quality | |
| Asus Zenbook 14X UX5400E | |
| Average NVIDIA GeForce MX450 (25.9 - 32, n=2) | |
We looked at The Witcher 3 in the Ultra setting (Full HD). The FPS keep jumping from 18 to 26 FPS in equal intervals, staying at each level for almost 2 minutes. The video clock rate and temperature increase synchronously following the same cycle. The temperature management apparently allows the dGPU to jump from 1,300 to 1,575 MHz when the temperature drops below 65 °C (~149 °F) for a certain amount of time. The rapid increase in GPU temperatures in turn causes the clock rates to drop in two stages (1,450, 1,250 MHz). Thermals don't seem to work optimally with the single fan and the heat pipes that aren't separated, because we rarely observe such an abrupt increase and decrease of clock speeds.
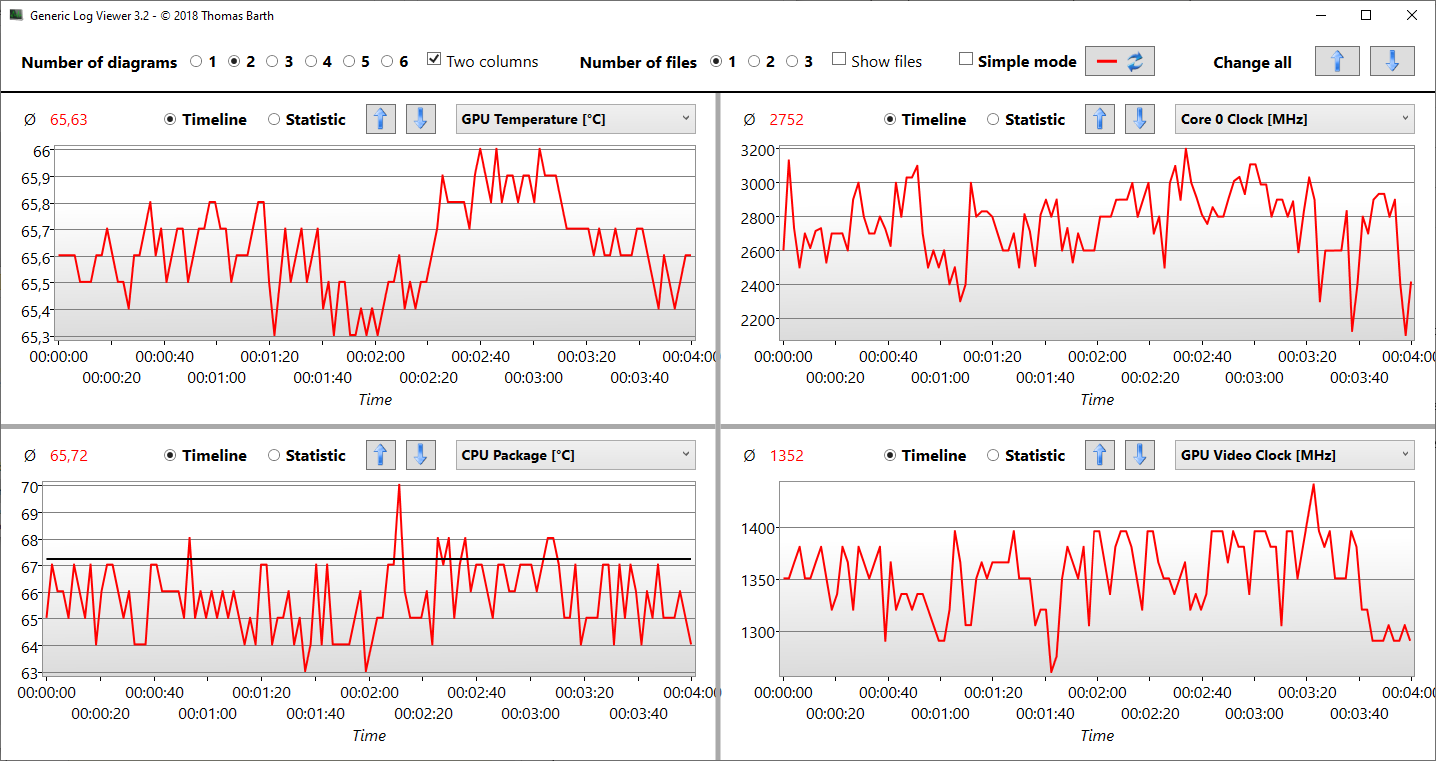
This seems to be an isolated case, since the thermals and video clock rates don't show any abnormal changes in New World (Medium, Full HD). See Logviewer.
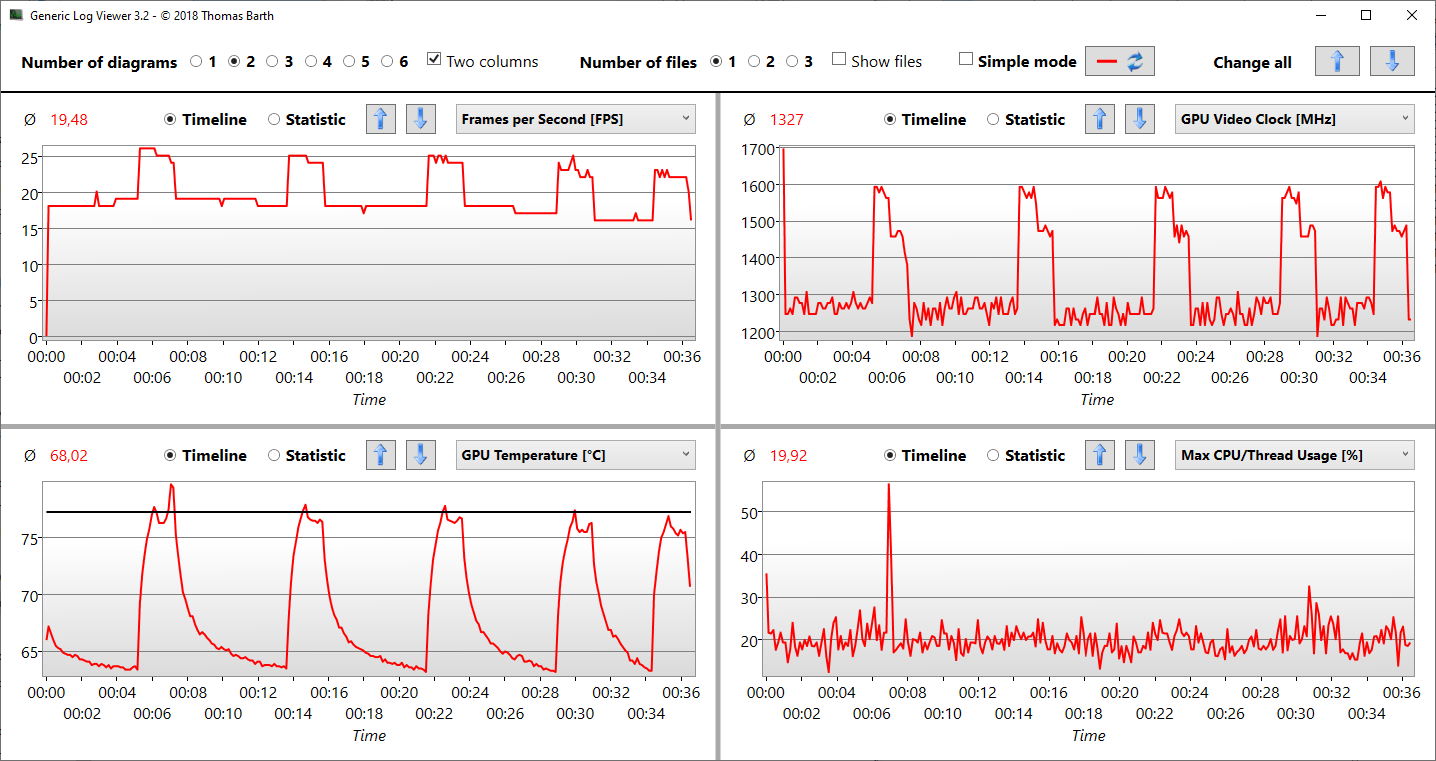
The Witcher 3 FPS diagram
| low | med. | high | ultra | QHD | 4K | |
|---|---|---|---|---|---|---|
| GTA V (2015) | 53 | 23.4 | 11 | |||
| The Witcher 3 (2015) | 28.1 | 22.9 | ||||
| Dota 2 Reborn (2015) | 36.1 | 35.5 | 35.4 | 34.9 | 33.3 | |
| X-Plane 11.11 (2018) | 62.7 | 51.3 | 41.4 | 40.1 | ||
| Far Cry 5 (2018) | 36 | 30 | 27 | 19 | ||
| Strange Brigade (2018) | 44.8 | 36 | ||||
| New World (2021) | 41.6 | 32 | 20.1 | 12.5 | 8.7 |
Emissions - Quiet Asus Zenbook
Noise emissions
The fan noise is quite good: You don't notice anything in idle usage, but the fan is still partly active, although you can only hear it if you place you ear close to the device. We measured 38 and 37 dB(A) under load, very low rates for a laptop with a dGPU. Load Medium refers to The Witcher 3 running at Full HD and Ultra settings. We can see that the thermal performance of the dGPU reaches its limits, which not only leads to fluctuations in GPU clock rates, but also to varying fan speeds. The 37 dB(A) is the maximum here. In the stress test with Prime95 and FurMark, 38 dB(A) is reached. The fan noise is harmless; the fan speeds up imperceptibly and then gently decreases again.
Noise level
| Idle |
| 26 / 26 / 26.3 dB(A) |
| Load |
| 37.1 / 38 dB(A) |
 | ||
30 dB silent 40 dB(A) audible 50 dB(A) loud |
||
min: | ||
Temperature
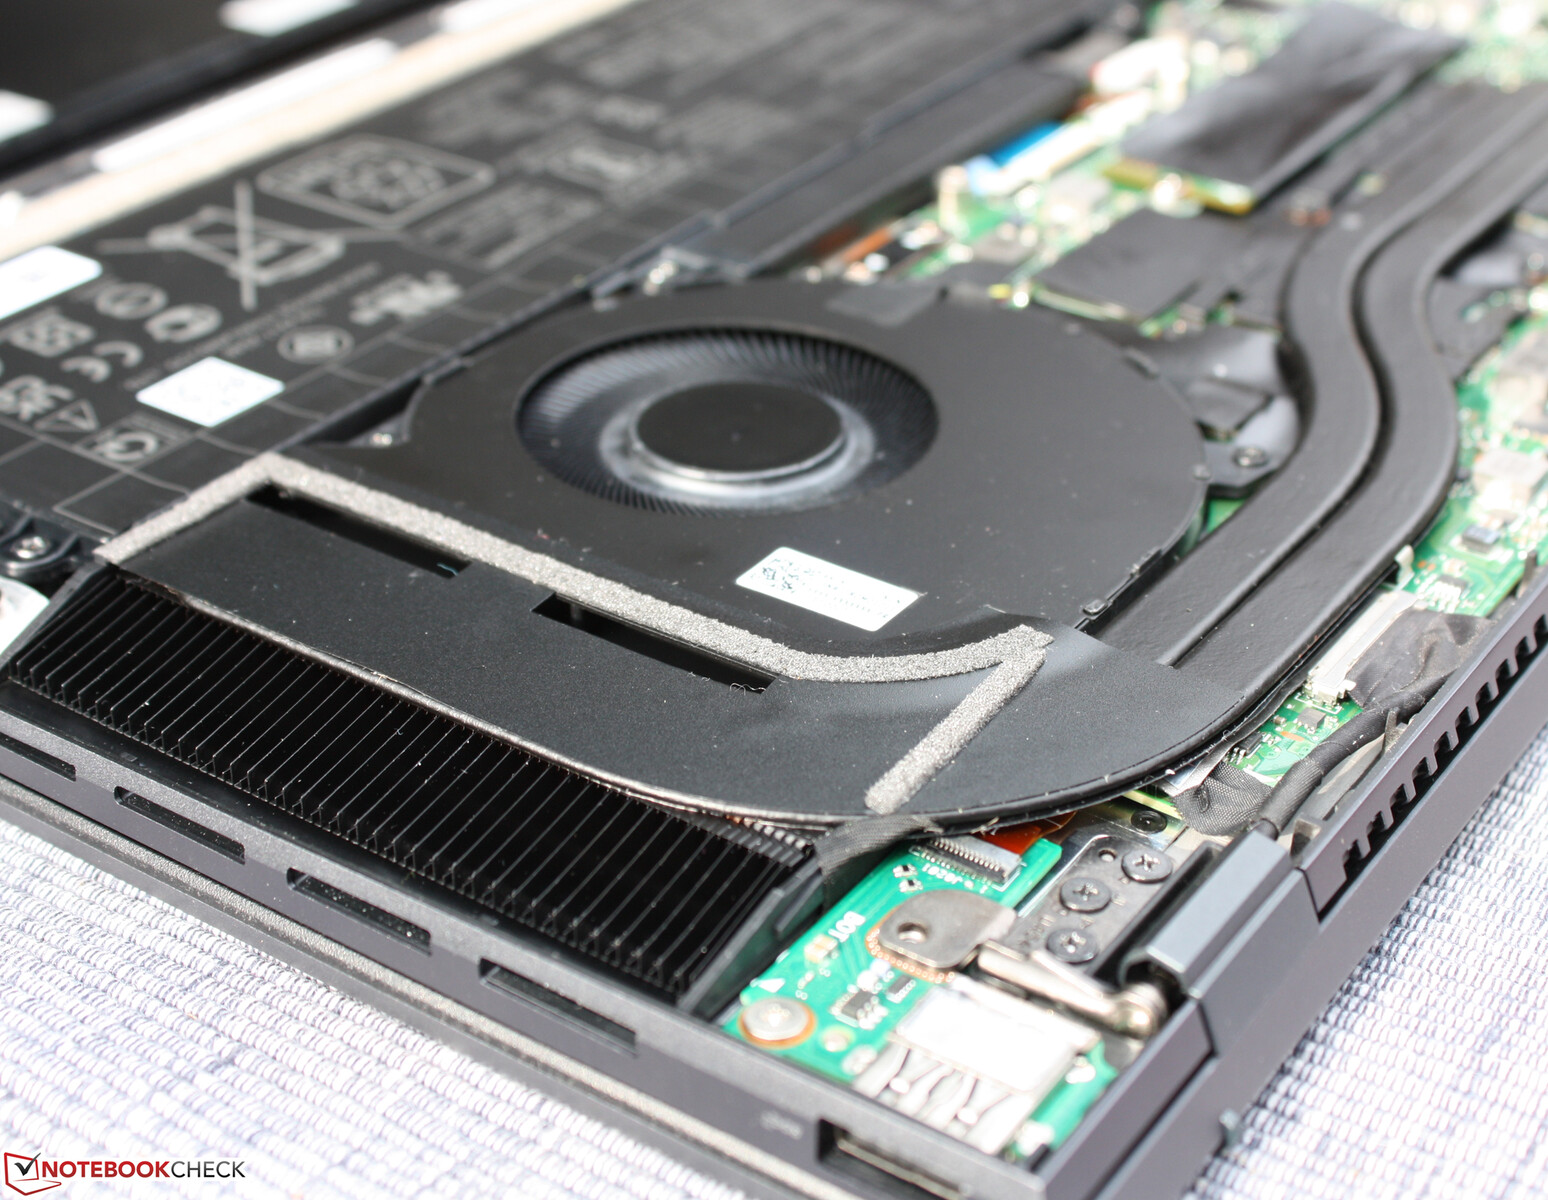
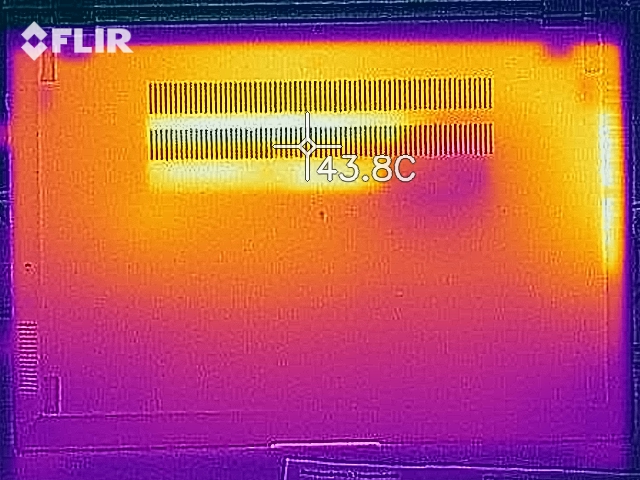
In the office scenario, we had a device on the table that was lukewarm at most at all times. The air outlet is on the left side, and the intake is between the hinges.
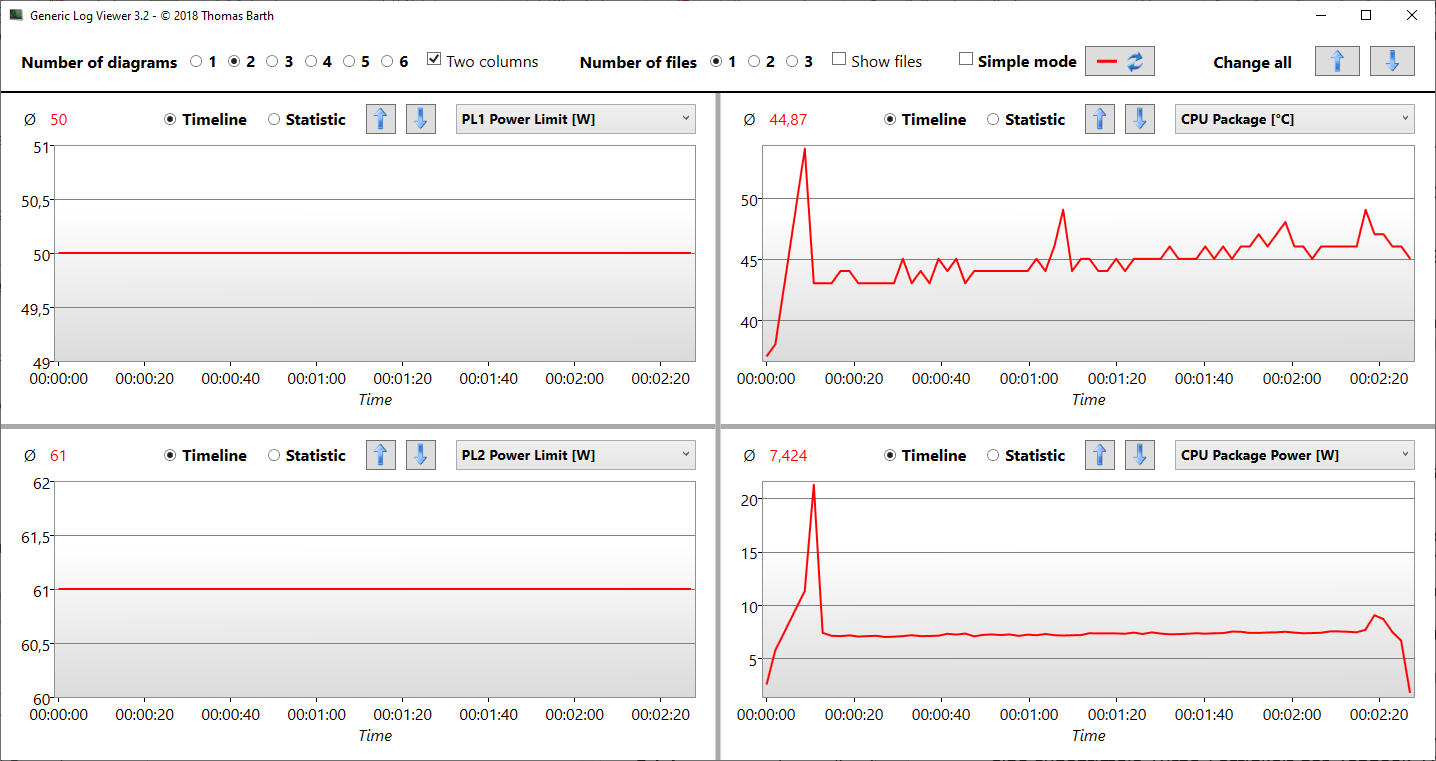
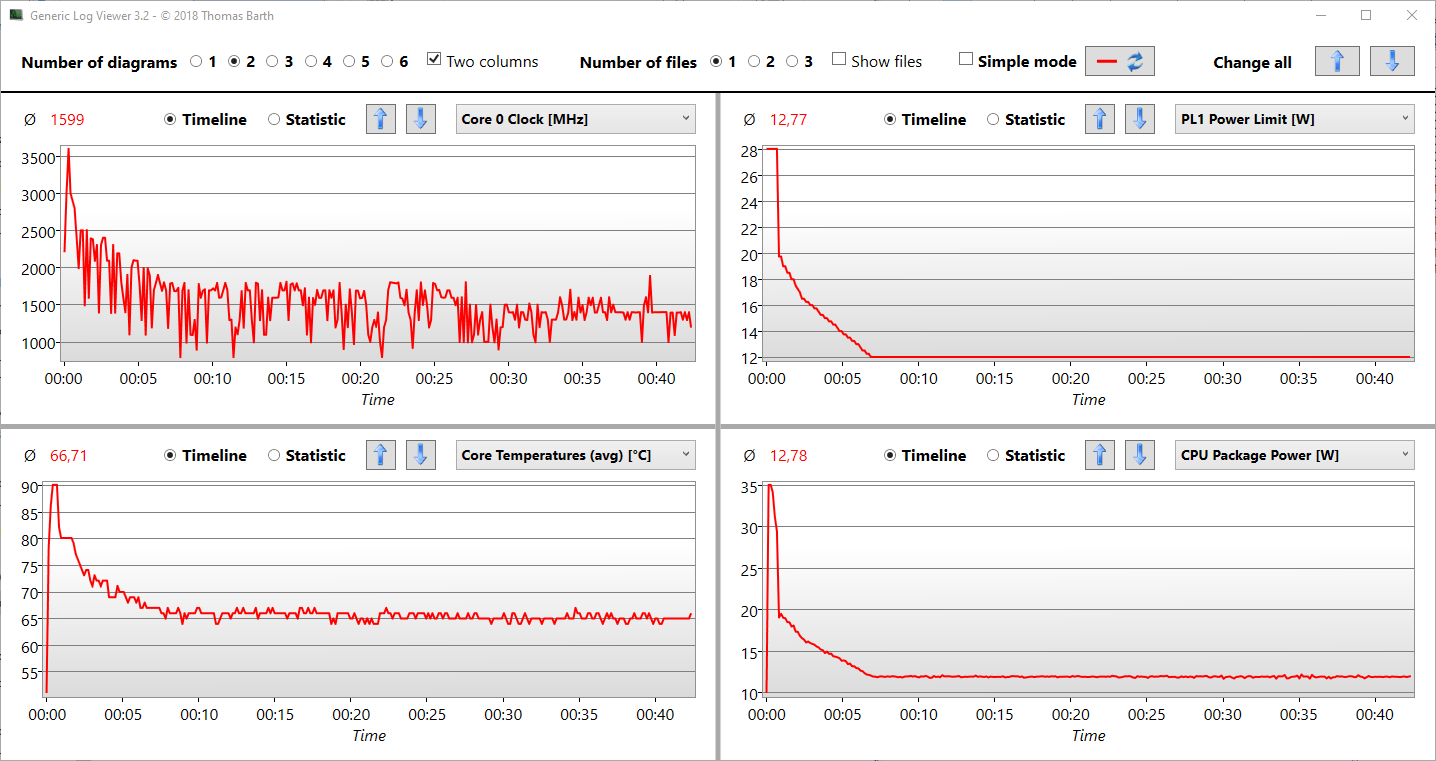
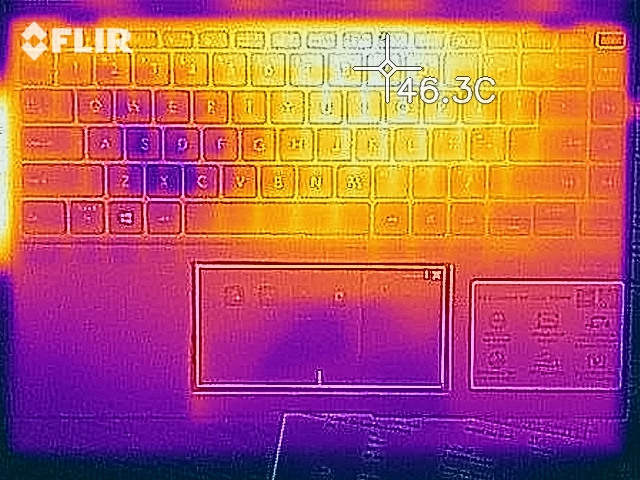
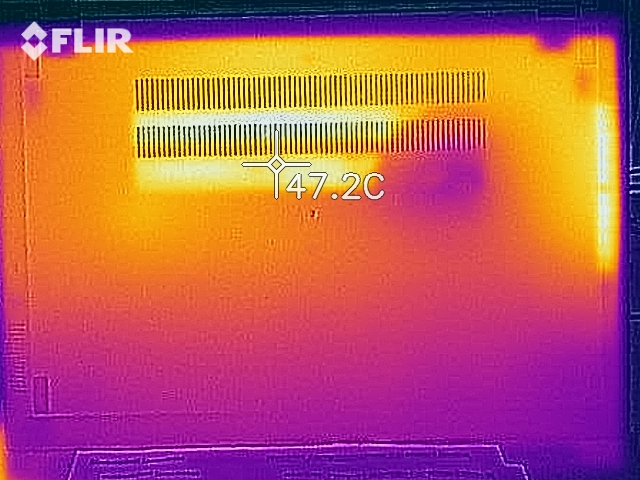
Our stress test with Prime95 and FurMark examines how the system handles maximum load over time. The surface temperatures still rise here (48 °C (~118 °F) at the top), and the core temperatures settle at 65 °C (~149 °F) after a peak of 90 °C (~194 °F). In this case, the package power is only 12 watts after seven minutes, 5 watts could only be maintained for a few seconds. There is no performance drop immediately after the stress test.
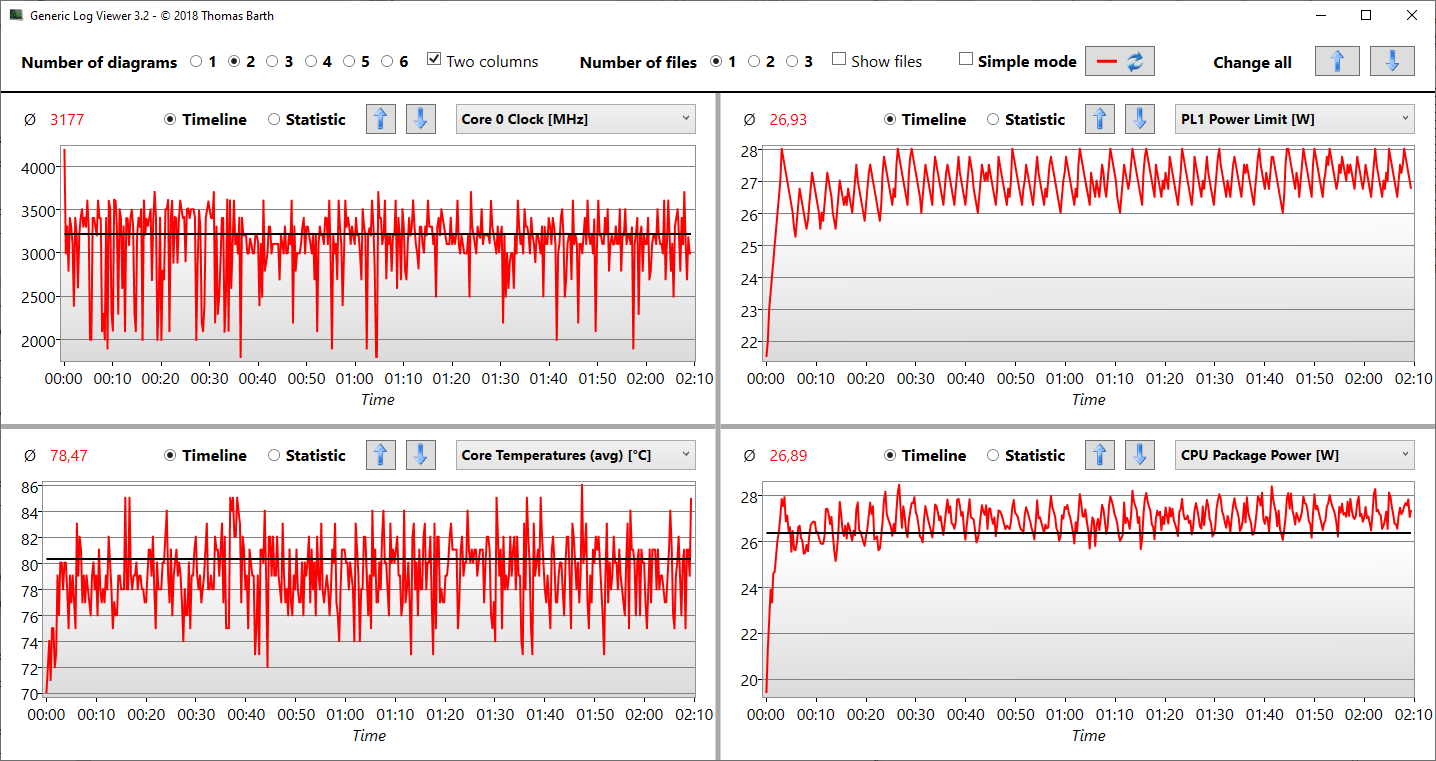
We performed the same analysis using only Prime95 and noticed that the Zenbook didn't struggle nearly as much. A package power of just under 27 °C (~81 °F) is held constant (also PL1). During this test, 90 °C (~194 °F) was never reached, and the SoC fluctuated around 78 °C (~172 °F).
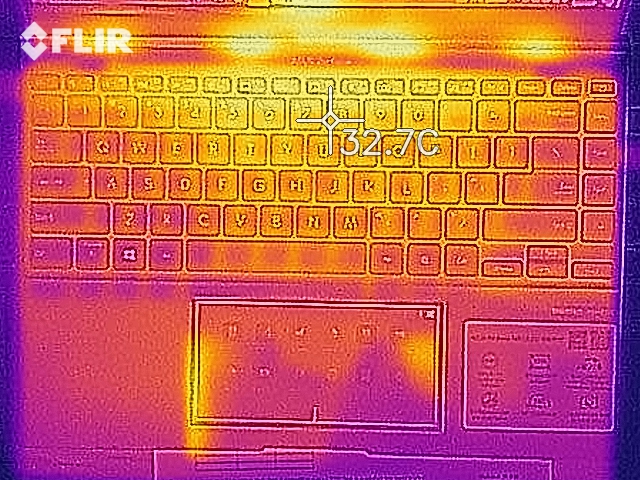
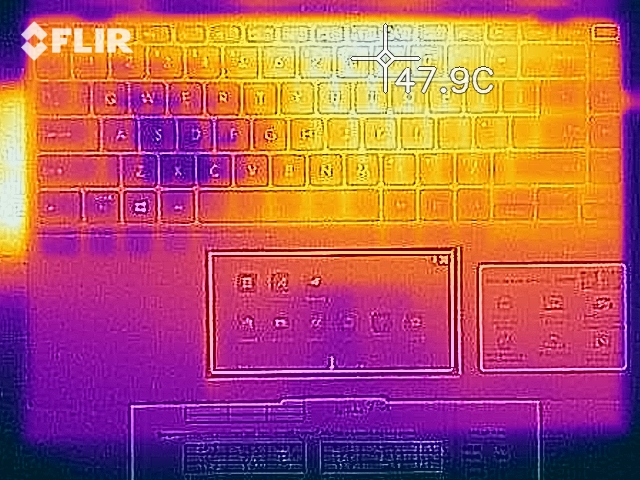
(±) The maximum temperature on the upper side is 42.4 °C / 108 F, compared to the average of 35.9 °C / 97 F, ranging from 21.4 to 59 °C for the class Subnotebook.
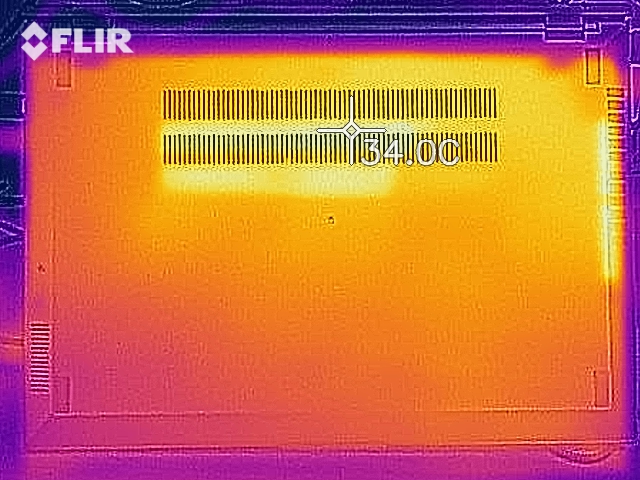
(-) The bottom heats up to a maximum of 47.7 °C / 118 F, compared to the average of 39.2 °C / 103 F
(+) In idle usage, the average temperature for the upper side is 29.3 °C / 85 F, compared to the device average of 30.8 °C / 87 F.
(±) Playing The Witcher 3, the average temperature for the upper side is 35.8 °C / 96 F, compared to the device average of 30.8 °C / 87 F.
(+) The palmrests and touchpad are reaching skin temperature as a maximum (33 °C / 91.4 F) and are therefore not hot.
(-) The average temperature of the palmrest area of similar devices was 28.2 °C / 82.8 F (-4.8 °C / -8.6 F).
Speakers
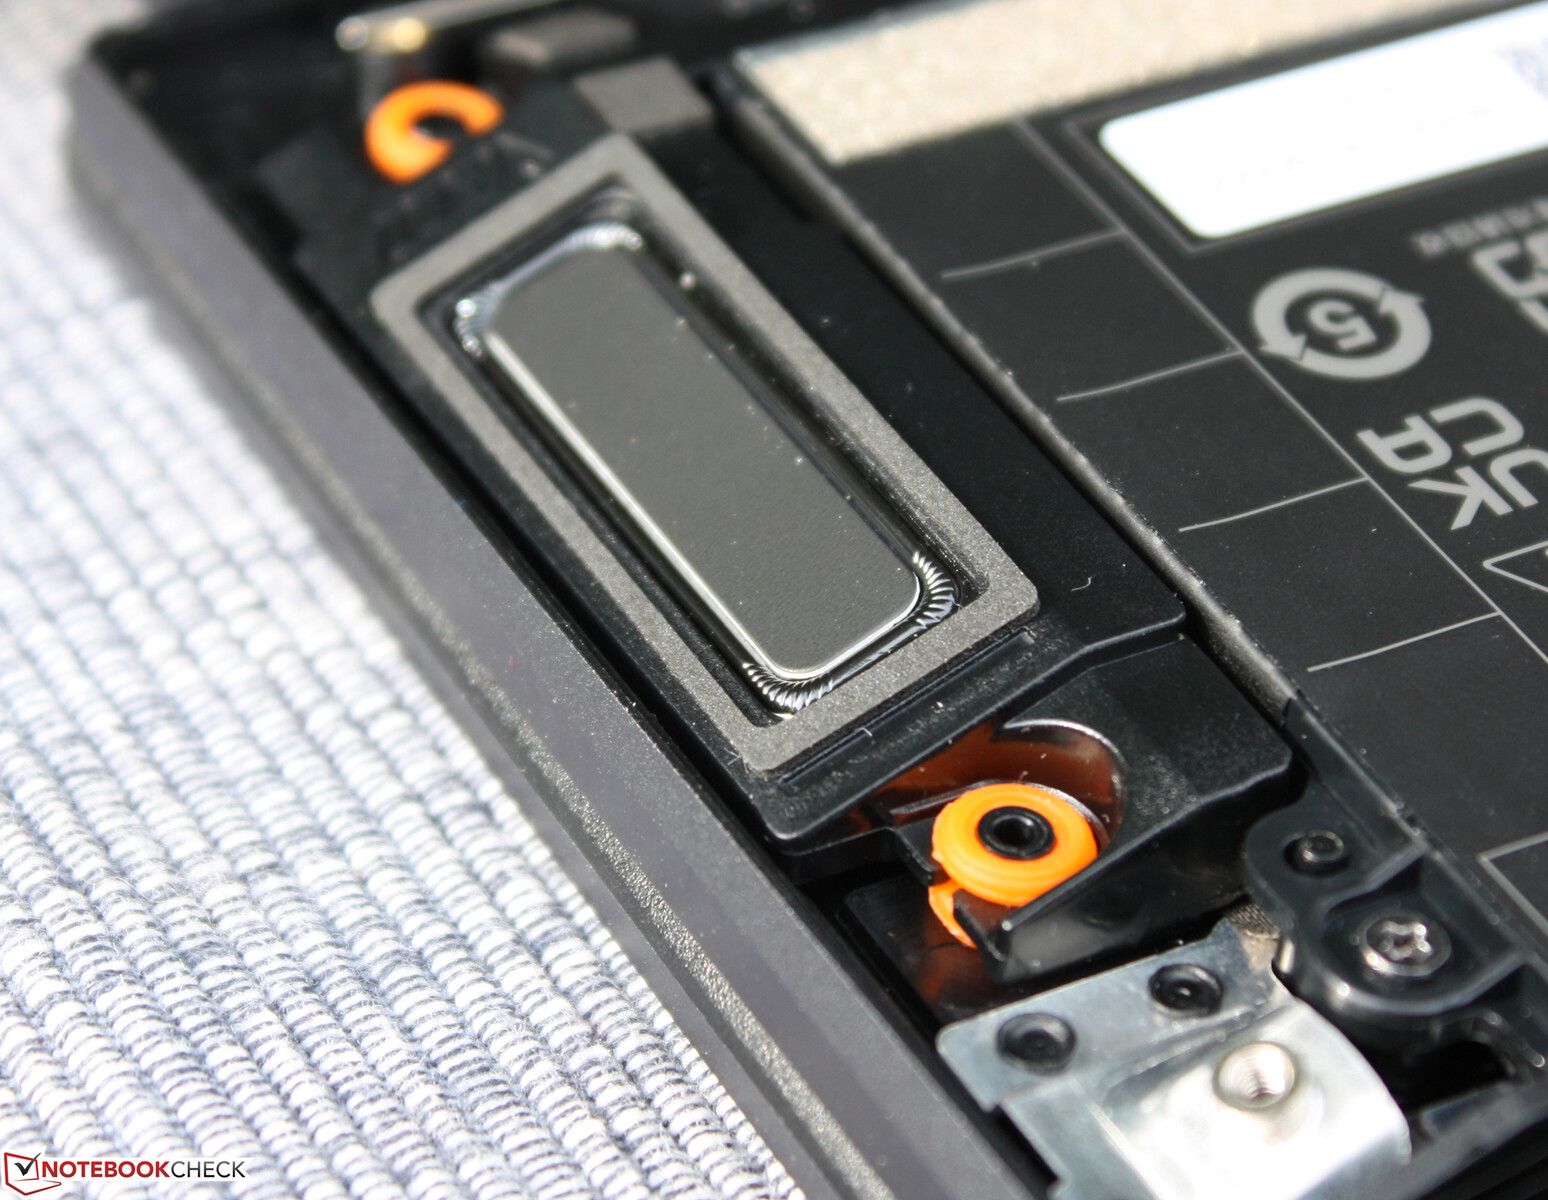
Speakers like these are rare! The Zenbook delivers volume, a certain amount of depth and bass, and reproduces highs in a balanced way. The small speakers are located on the right and left sides under the palm rest, using the surface as a reflector. In this respect, sound is better when the device is placed on a hard table than on a soft carpet.
The dual-array microphone picks up voices without noise, which is ideal for video calls and conferences.
Asus Zenbook 14X UX5400E audio analysis
(±) | speaker loudness is average but good (76.7 dB)
Bass 100 - 315 Hz
(±) | reduced bass - on average 14.5% lower than median
(±) | linearity of bass is average (11.6% delta to prev. frequency)
Mids 400 - 2000 Hz
(+) | balanced mids - only 2.5% away from median
(+) | mids are linear (4.6% delta to prev. frequency)
Highs 2 - 16 kHz
(+) | balanced highs - only 2.3% away from median
(+) | highs are linear (3.6% delta to prev. frequency)
Overall 100 - 16.000 Hz
(+) | overall sound is linear (10.4% difference to median)
Compared to same class
» 8% of all tested devices in this class were better, 3% similar, 89% worse
» The best had a delta of 5%, average was 18%, worst was 53%
Compared to all devices tested
» 5% of all tested devices were better, 1% similar, 93% worse
» The best had a delta of 4%, average was 23%, worst was 134%
Dell XPS 13 9310 OLED audio analysis
(±) | speaker loudness is average but good (81.3 dB)
Bass 100 - 315 Hz
(±) | reduced bass - on average 11.6% lower than median
(±) | linearity of bass is average (12.1% delta to prev. frequency)
Mids 400 - 2000 Hz
(±) | higher mids - on average 5.1% higher than median
(+) | mids are linear (3.3% delta to prev. frequency)
Highs 2 - 16 kHz
(+) | balanced highs - only 2.6% away from median
(+) | highs are linear (3.3% delta to prev. frequency)
Overall 100 - 16.000 Hz
(+) | overall sound is linear (13.4% difference to median)
Compared to same class
» 23% of all tested devices in this class were better, 5% similar, 72% worse
» The best had a delta of 5%, average was 18%, worst was 53%
Compared to all devices tested
» 14% of all tested devices were better, 4% similar, 82% worse
» The best had a delta of 4%, average was 23%, worst was 134%
Energy management
Energy consumption
This must be due to the OLED technology. The idle power consumption is 7.2 watts, which is 40-50% more than the competition with IPS displays at the same size. The Dell XPS 13 9310 OLED has this small problem as well. This persists when it comes to the average idle consumption (10.4 watts) and the maximum idle consumption (11 watts), although the latter doesn't seem to be all that high compared to the competition.
Unfortunate for the carbon footprint: The OLED screensaver, which can't be disabled under normal circumstances, results in an unnecessarily high power consumption of 9-12 watts in idle usage, and this using a brightness of 150 cd/m³ (-3 levels) and no keyboard backlighting!
The Witcher 3 Ultra represents the maximum gaming load for the MX450, which we measure at 53 watts. This is an average; due to the GPU clock speeds throttling, power consumption fluctuates between 45 watts and 73 watts here.
The 100-watt power adapter really has to work hard under maximum load in the stress test; it has to supply 96 watts at the beginning. As the stress test shows, power consumption is significantly lower in this case as well due to throttling, namely 60 watts after about two minutes.
| Off / Standby | |
| Idle | |
| Load |
|
Key:
min: | |
| Asus Zenbook 14X UX5400E i7-1165G7, GeForce MX450, SK Hynix HFM001TD3JX013N, OLED, 2880x1800, 14" | Dell XPS 13 9310 OLED i7-1185G7, Iris Xe G7 96EUs, Toshiba XG6 KXG60ZNV512G, OLED, 3456x2160, 13.4" | Asus Zenbook 14 UX435EG i7-1165G7, GeForce MX450, Samsung PM981a MZVLB1T0HBLR, IPS, 1920x1080, 14" | MSI Modern 14 B11SB-085 i7-1165G7, GeForce MX450, Kingston OM8PCP3512F-AB, IPS, 1920x1080, 14" | HP Envy 14-eb0010nr i5-1135G7, GeForce GTX 1650 Ti Max-Q, Samsung SSD PM981a MZVLB256HBHQ, IPS, 1920x1200, 14" | Lenovo IdeaPad Slim 9i 14ITL5 i7-1165G7, Iris Xe G7 96EUs, WDC PC SN730 SDBPNTY-512G, IPS, 3840x2160, 14" | Average NVIDIA GeForce MX450 | Average of class Subnotebook | |
|---|---|---|---|---|---|---|---|---|
| Power Consumption | 27% | 22% | 13% | -29% | 20% | 15% | 35% | |
| Idle Minimum * (Watt) | 7.2 | 5.7 21% | 3.4 53% | 3 58% | 4.2 42% | 4.5 37% | 4.91 ? 32% | 3.76 ? 48% |
| Idle Average * (Watt) | 10.4 | 6 42% | 7.6 27% | 6.3 39% | 18.3 -76% | 10.5 -1% | 8.36 ? 20% | 6.54 ? 37% |
| Idle Maximum * (Watt) | 11 | 12.3 -12% | 14.2 -29% | 10.3 6% | 19.2 -75% | 10.6 4% | 11.1 ? -1% | 7.89 ? 28% |
| Load Average * (Watt) | 61.7 | 44.4 28% | 56 9% | 66 -7% | 72.9 -18% | 44.2 28% | 58.4 ? 5% | 42 ? 32% |
| Witcher 3 ultra * (Watt) | 53.6 | 36.5 32% | 41 24% | 66.6 -24% | 61.5 -15% | 45.8 15% | ||
| Load Maximum * (Watt) | 96 | 47.8 50% | 50.4 47% | 90.6 6% | 127.8 -33% | 61.9 36% | 76.2 ? 21% | 64.8 ? 32% |
* ... smaller is better
Energy consumption during The Witcher 3 / stress test
Battery life
The Zenbook 14X's battery life is modest. The Wi-Fi test only lasts 5:21 hours, even though we manually disabled the screensaver. If the screensaver is used in the browser test, the runtime is much lower at 2:22 hours. The Zenbook has to make do with 63 Wh, but this is the usual configuration, even among the competition.
| Asus Zenbook 14X UX5400E i7-1165G7, GeForce MX450, 63 Wh | Asus Zenbook 14 UX435EG i7-1165G7, GeForce MX450, 63 Wh | MSI Modern 14 B11SB-085 i7-1165G7, GeForce MX450, 52.4 Wh | HP Envy 14-eb0010nr i5-1135G7, GeForce GTX 1650 Ti Max-Q, 63.3 Wh | Lenovo IdeaPad Slim 9i 14ITL5 i7-1165G7, Iris Xe G7 96EUs, 63.5 Wh | Average of class Subnotebook | |
|---|---|---|---|---|---|---|
| Battery runtime | 4% | 61% | 35% | 63% | 69% | |
| Reader / Idle (h) | 34 | 18.5 -46% | 27.7 -19% | 40.1 18% | 28.6 ? -16% | |
| WiFi v1.3 (h) | 5.4 | 8.5 57% | 8.7 61% | 10.8 100% | 11 104% | 14 ? 159% |
| Load (h) | 1.2 | 1.2 0% | 1.5 25% | 2 67% | 1.969 ? 64% | |
| H.264 (h) | 10.1 | 15.4 ? |
Pros
Cons
Verdict - Vibrant colors, stumbling performance

With the Zenbook 14X, Asus has a subnotebook in its lineup that is - for the most part - a joy to use. For starters, there's the vivid and bright OLED panel with a 3K resolution that reproduces the common color spaces with ease and accuracy.
But the Zenbook is also in the lead in terms of workmanship, input devices, and ports with 2x Thunderbolt 4 connections and ScreenPad 2.0. It's just a pleasure to use the Zenbook 14X, since it's a solid and very well-built subnotebook.
While we can fully praise it in most disciplines, battery life, power consumption, and performance development deserve some criticism.
A battery runtime of just over 5 hours is below average for a modern high-end subnotebook. The compulsory OLED screensaver leads to a high power consumption of 9-12 watts in idle use. The single fan is required to cool the MX450 and the Intel i7 at the same time, which makes graphics performance fluctuate in some games and doesn't allow the processor to be in top form under sustained load. We are eager to see whether the production model will perform better here.
Price and availability
At the time of writing, the Asus Zenbook 14X UX5400E doesn't seem to be available in the United States yet. We reviewed a pre-production unit with an English keyboard. Therefore, it's difficult to make price comparisons with the competition.
Users who can do without the performance of a dGPU but want an OLED display should take a closer look at the Dell XPS 13 9310 OLED. Battery life and PWM were points of criticism there. Next, there's the Asus ZenBook 13 OLED UM325UA, which we haven't reviewed yet. Technically, it promises to be a very interesting and comparatively affordable device with its Ryzen 5000 and a Full HD OLED display (approx. 1,500 Euros (~$1,746)).
If OLED technology isn't that important, high-performance 14-inchers like the Asus Zenbook 14 UX435EG (MX450) or the HP Envy 14-eb0010nr (GTX 1650 Ti Max-Q) are worth considering, with the Envy 14 having the better IPS display. However, prospective buyers should take a close look at these models because there are other reasons apart from the OLED technology which cause their rating to be 5-6% lower than that of the Asus Zenbook 14X UX5400E under review.
Price comparison

