Notebookcheck Logo

New World Performance Analysis

Waiting at Login Screen Simulator 2021. Even if New World is a good game, its launch has been one of the biggest disasters in the gaming world this year. Nonetheless, we took great pains to conduct our usual performance analysis.
New World

Technology

It is quite annoying, to say the least, that Amazon’s servers got overwhelmed when it released its AAA title. Despite Amazon’s massive server infrastructure, some gamers had to wait for hours to log into servers with just 100 to 1000 players. An additional aggravating factor is that there is no way to transfer your character from one server to another.

New World
New World

We were forced to create new characters and delete the old ones to conduct these benchmarks because the game only allows players to have two characters in any given region. Each time we created a new character, we skipped the tutorial and hoped that our character would end up in the right place. This is why the scope of our performance analysis has been reduced considerably.

New World
New World

Once you get into the actual game, though, things improve significantly. The game runs very well. We did not encounter any performance drops or lag spikes.

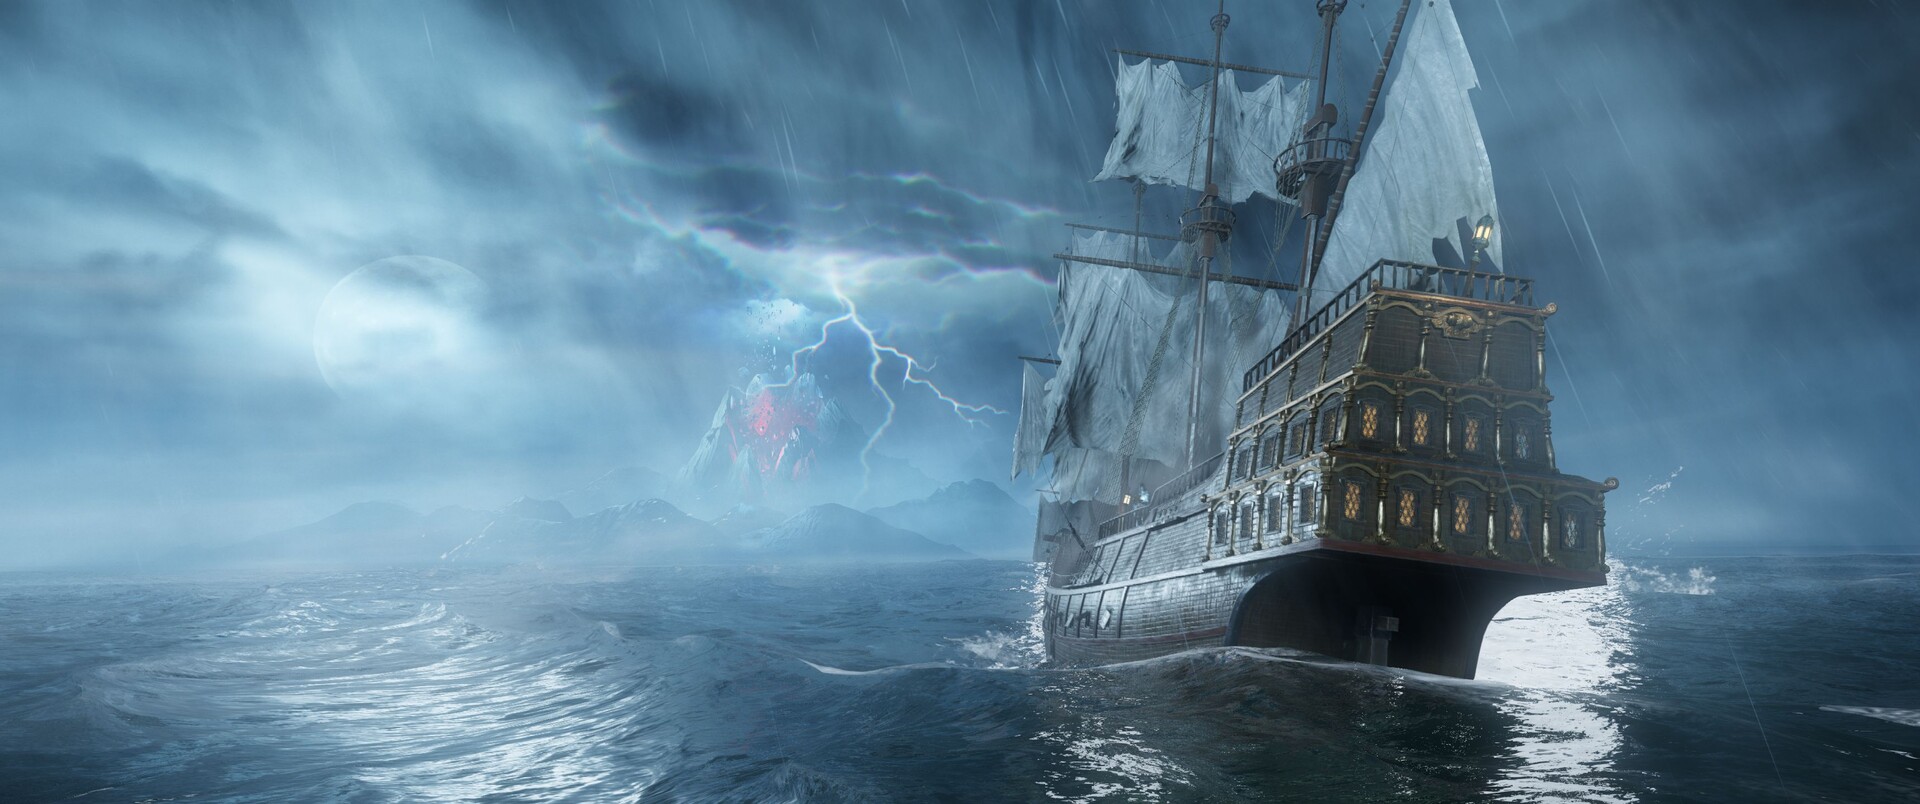
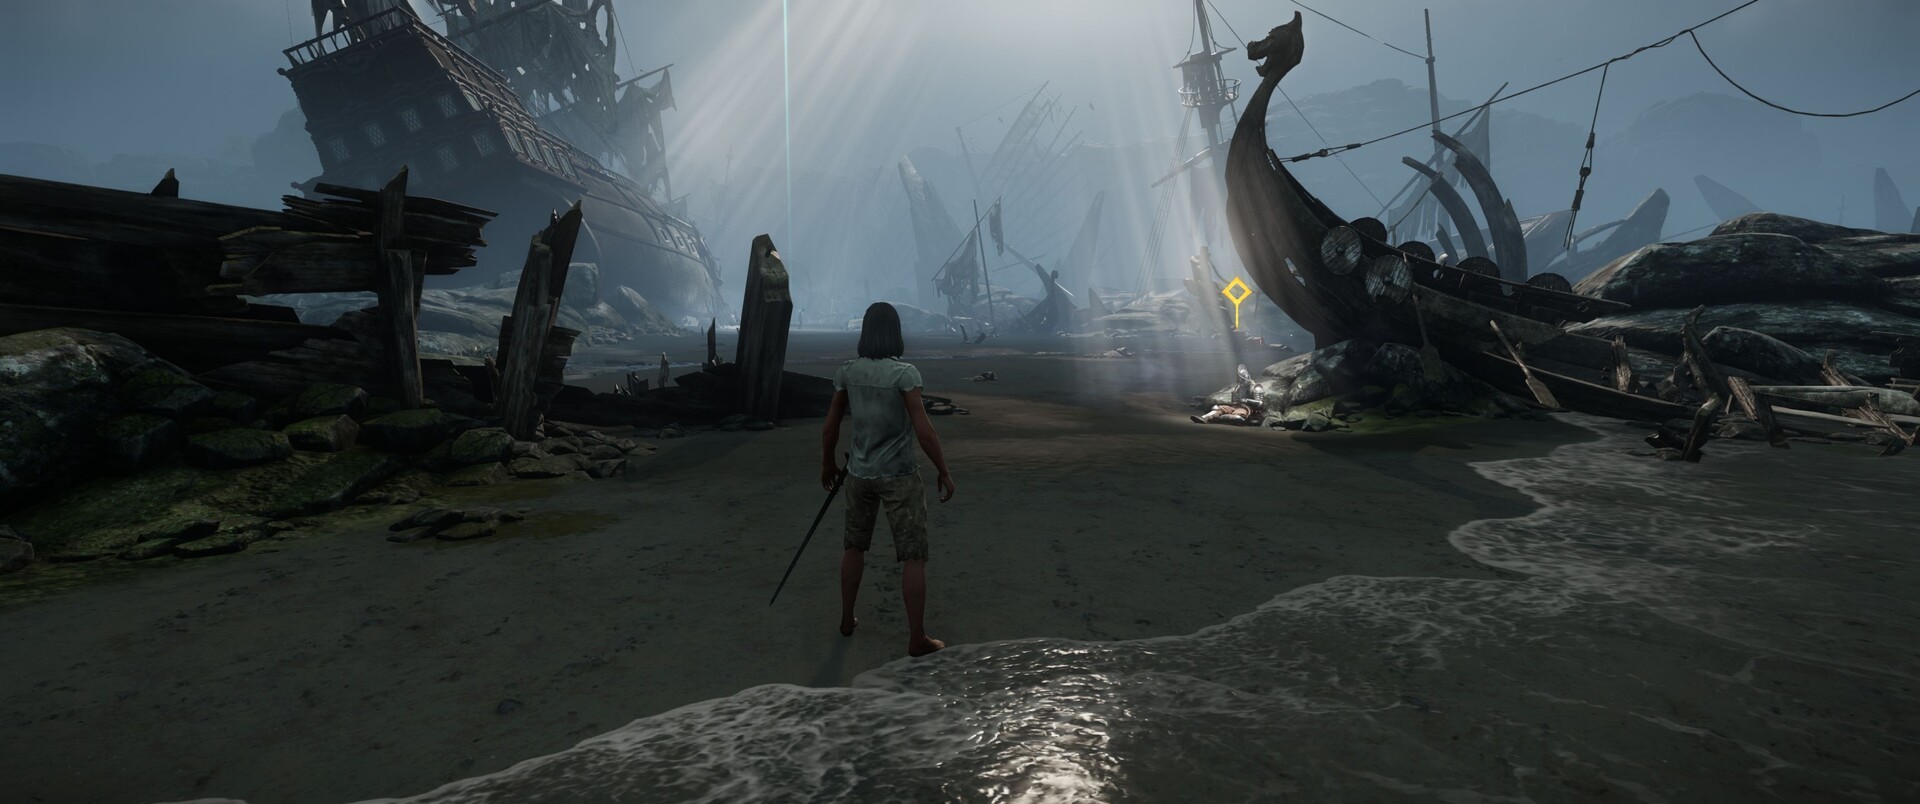
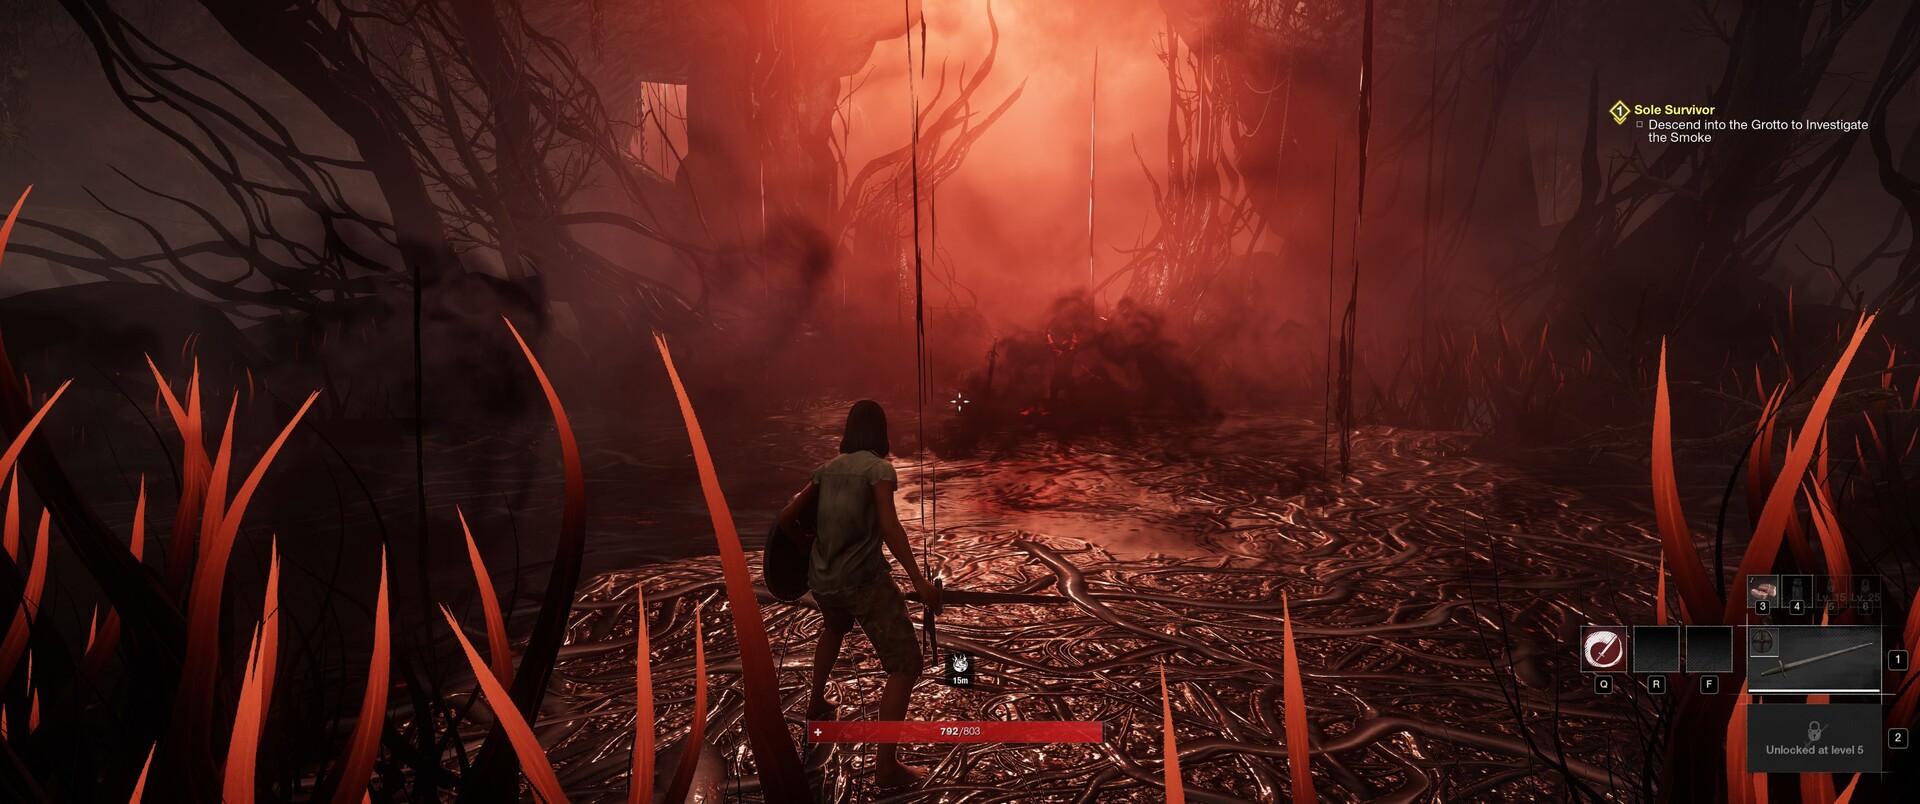
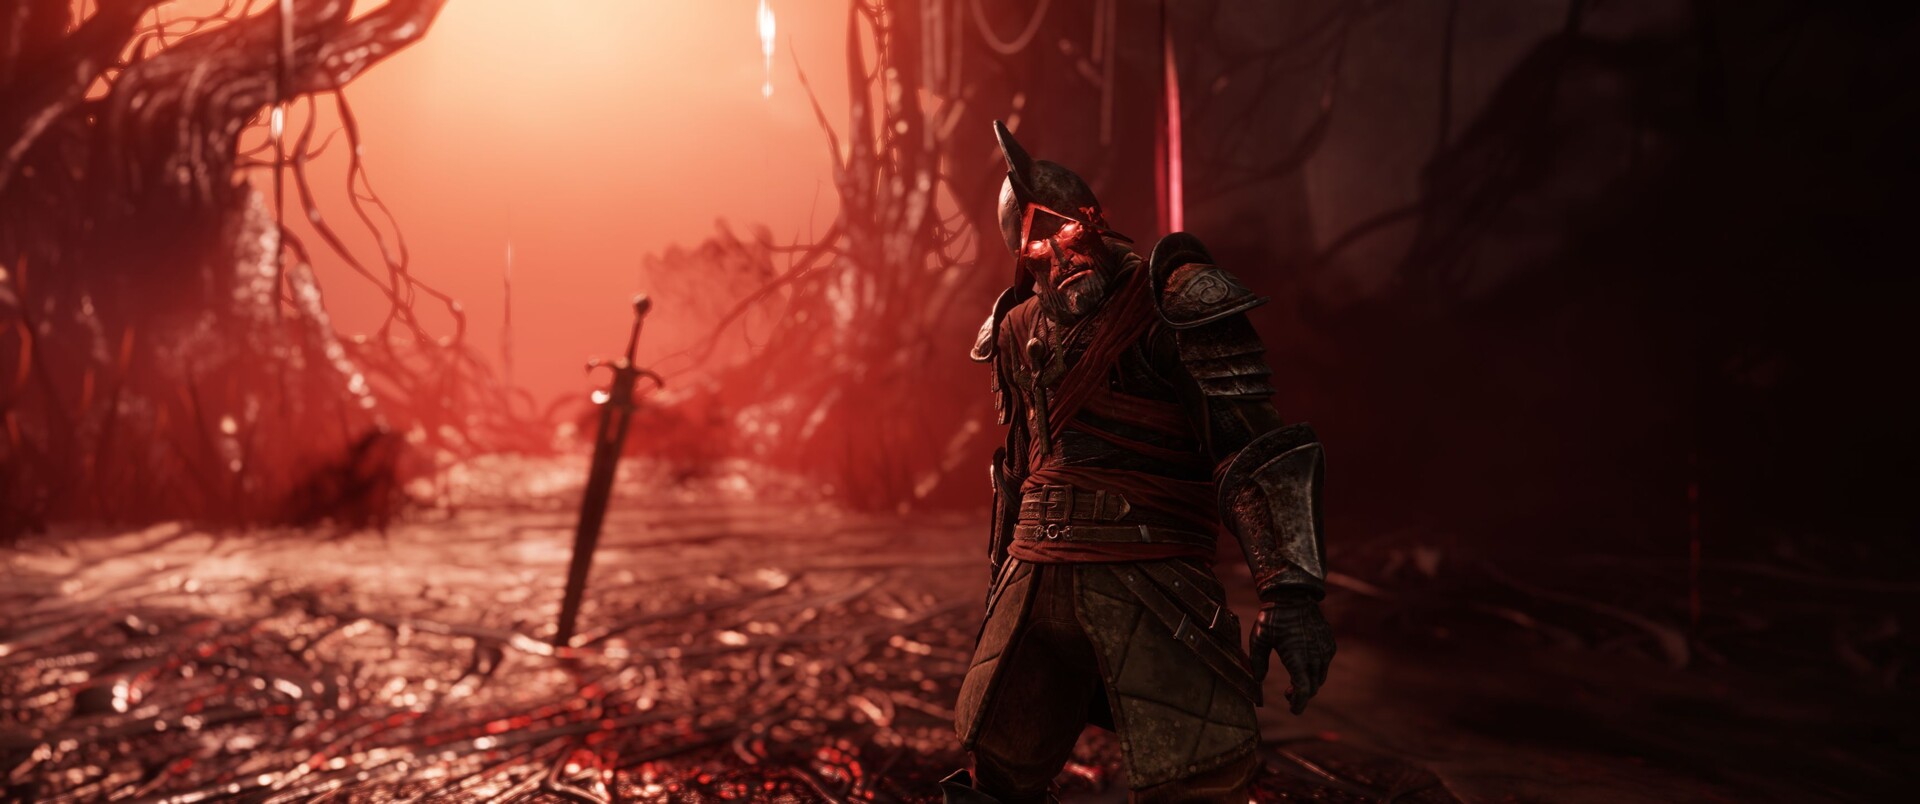
The game leaves a very good impression. The animations appear smooth, controls are not clunky, the menu is laid out very well. Moreover, the levels and character design and combat system are quite impressive. The story is also very good, compared to other titles in this genre. All in all, New World creatively blends colonisation with monsters (as in the pirate games, for example).

New World
New World

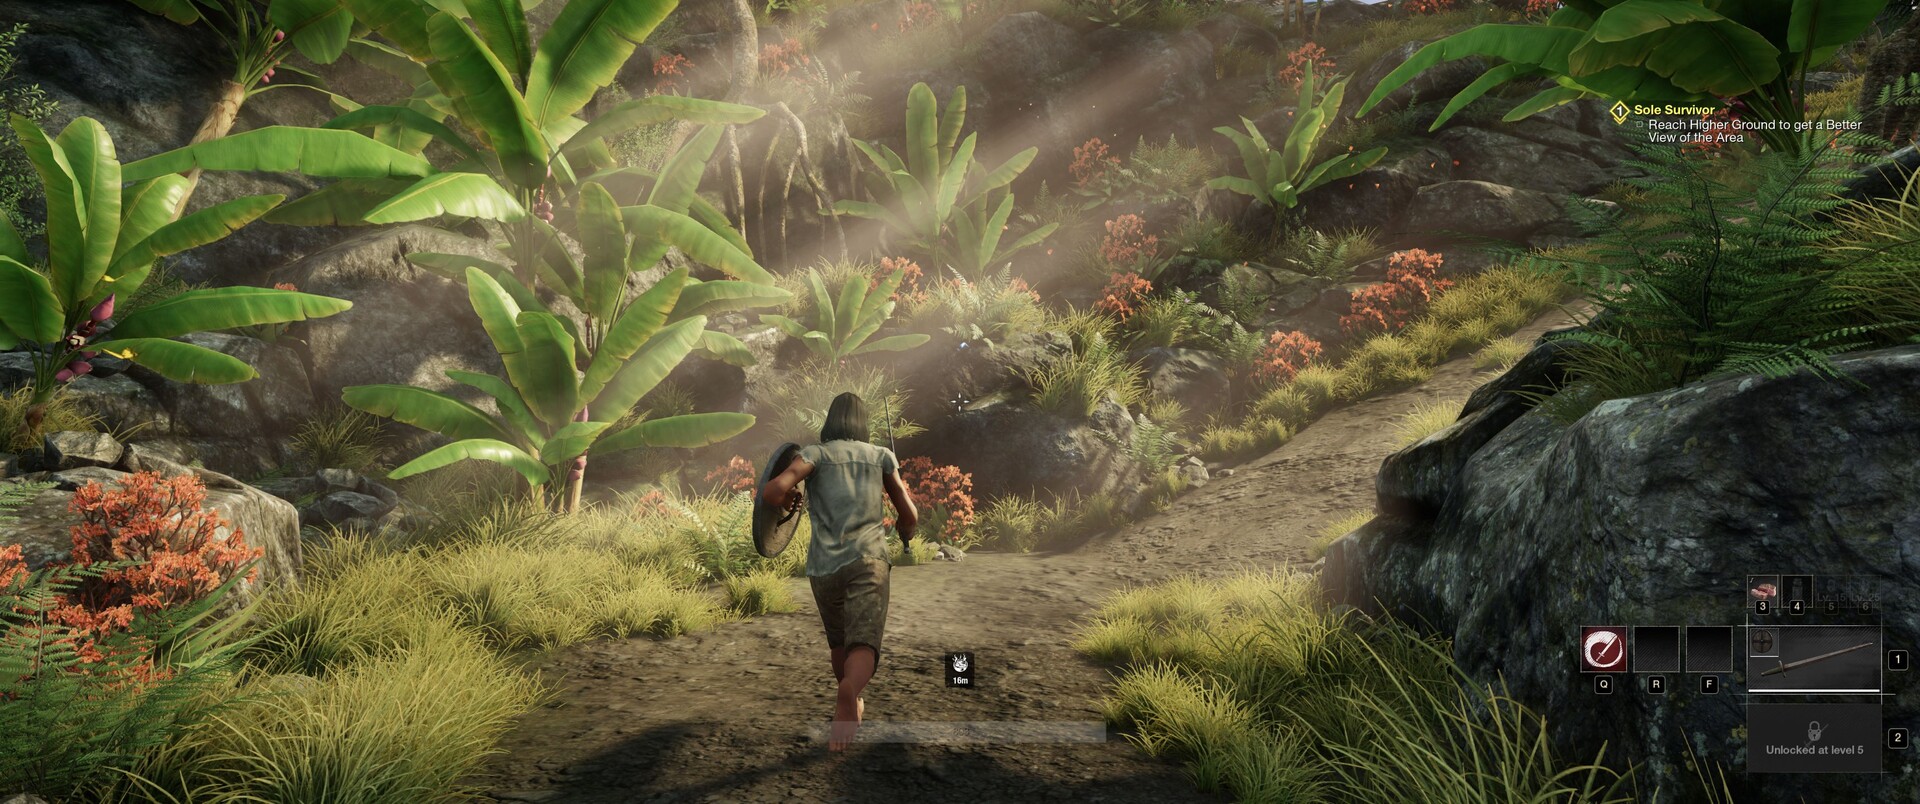
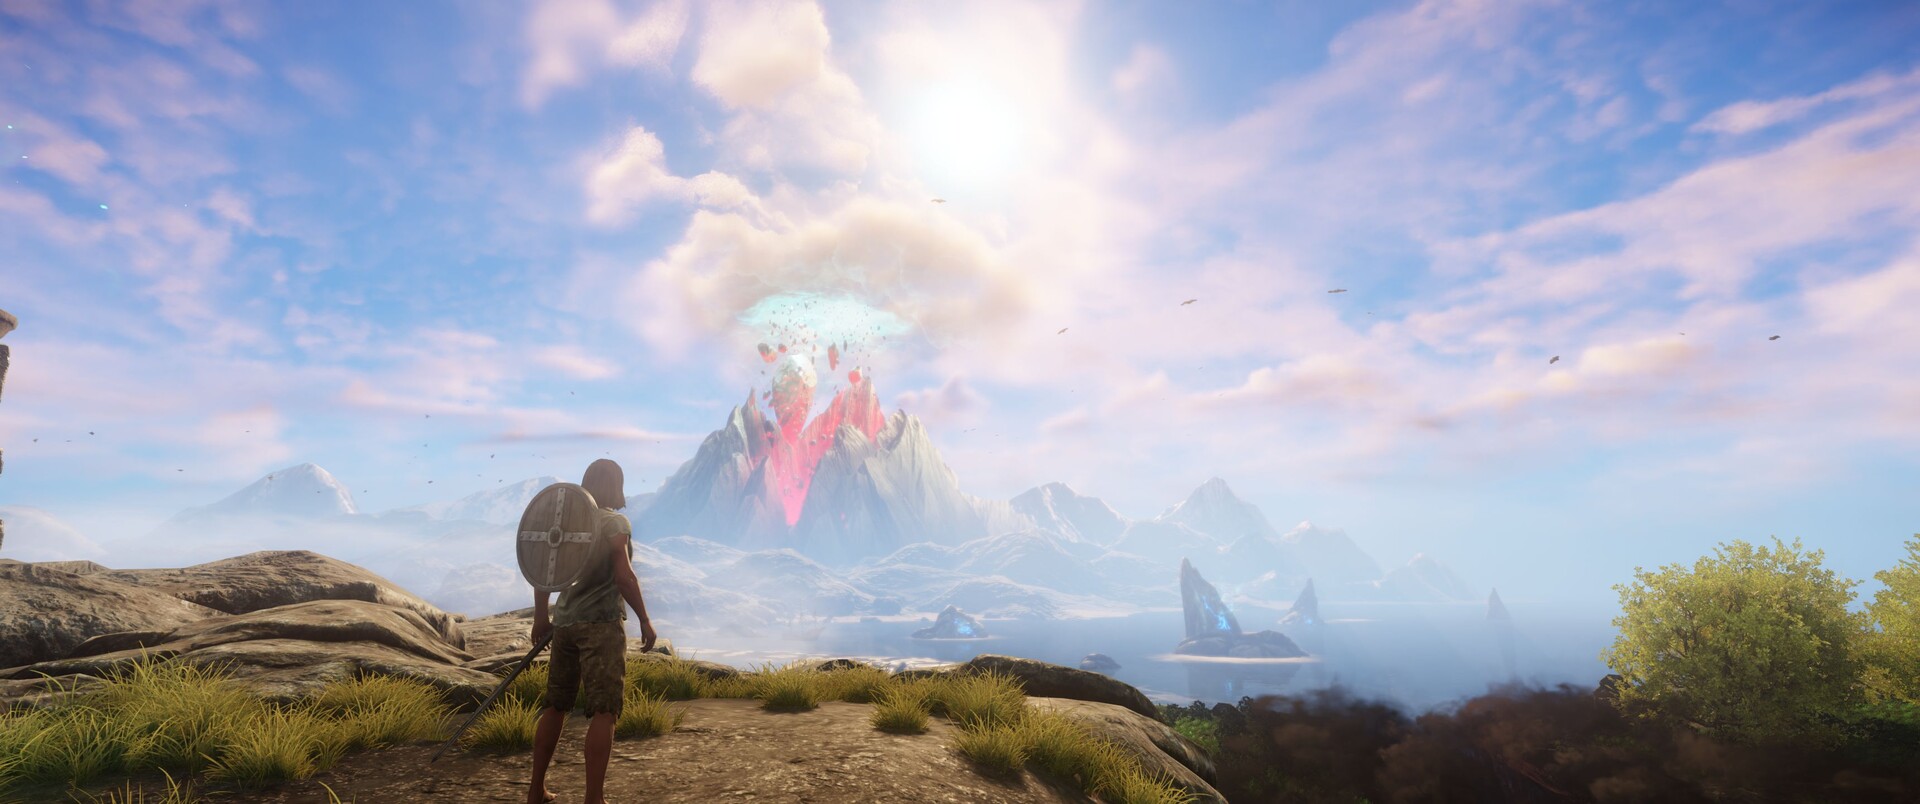
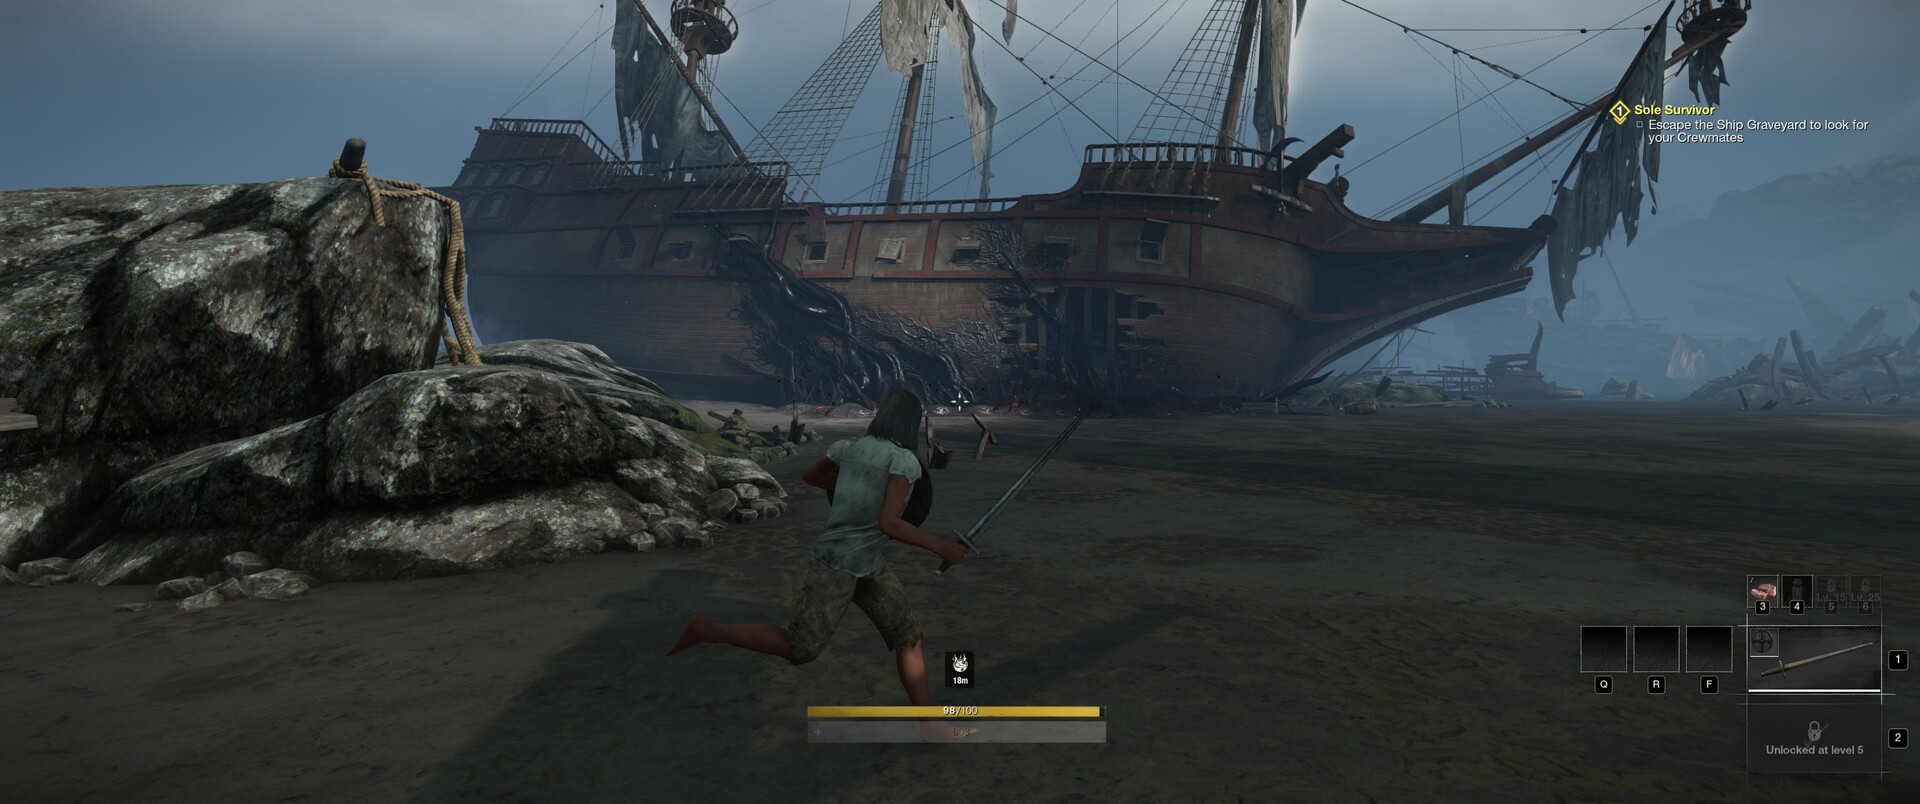
New World is a very visually striking title. It looks better than most other MMOs. Textures, lighting and effects all impress. The beautiful day-night cycle makes the game feels very atmospheric.

New World
New World

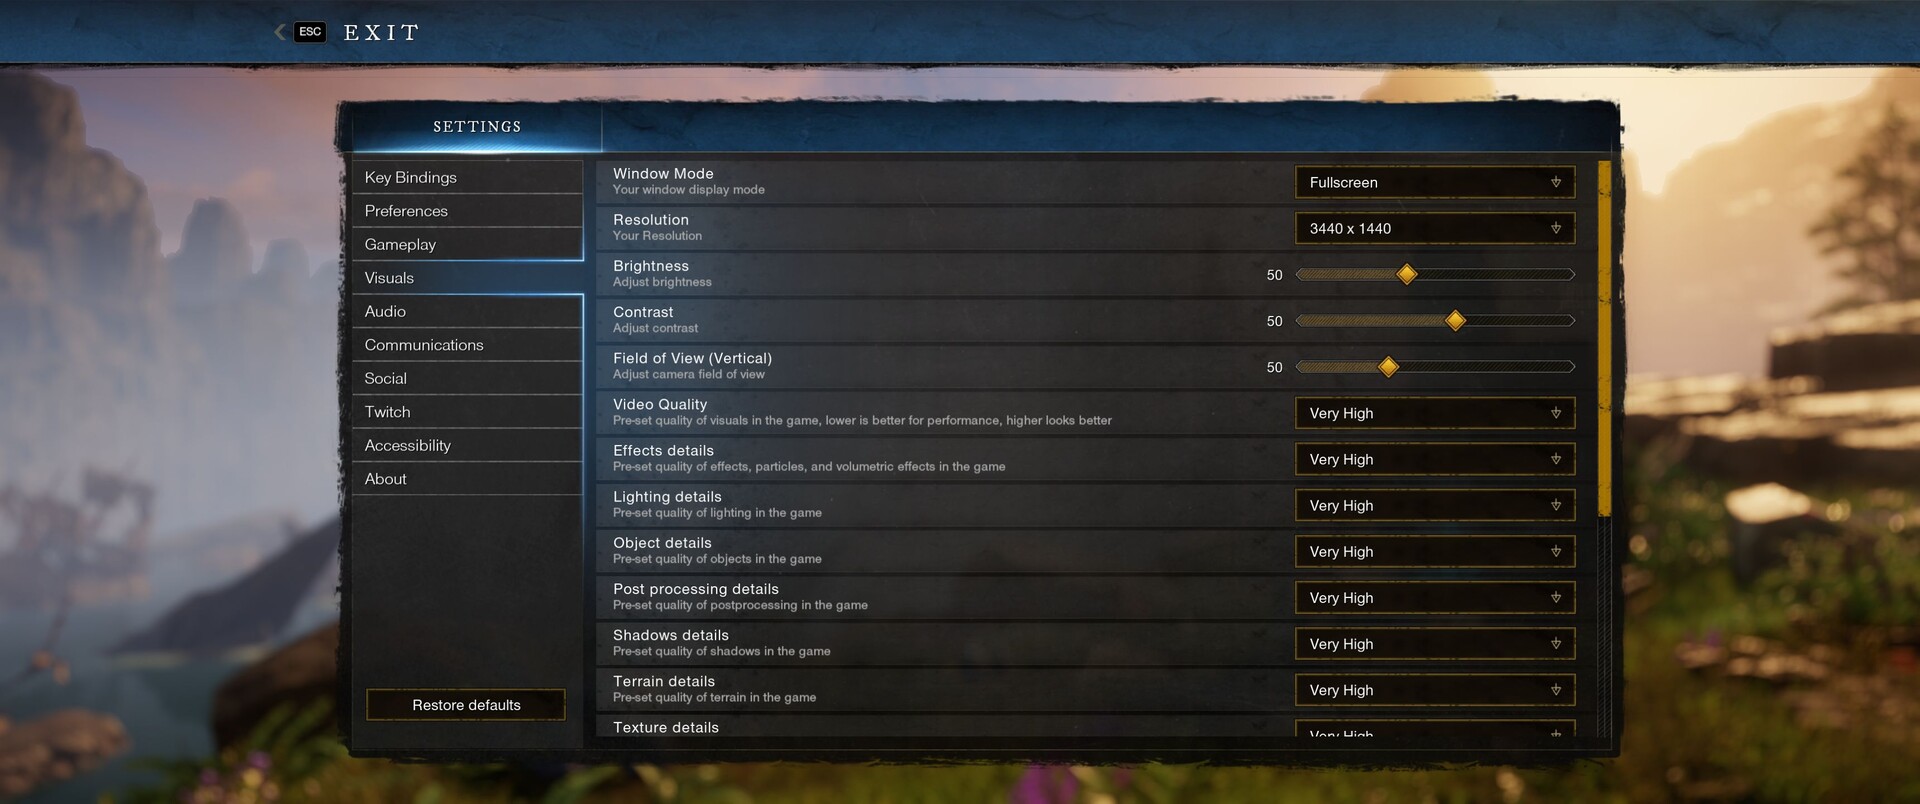
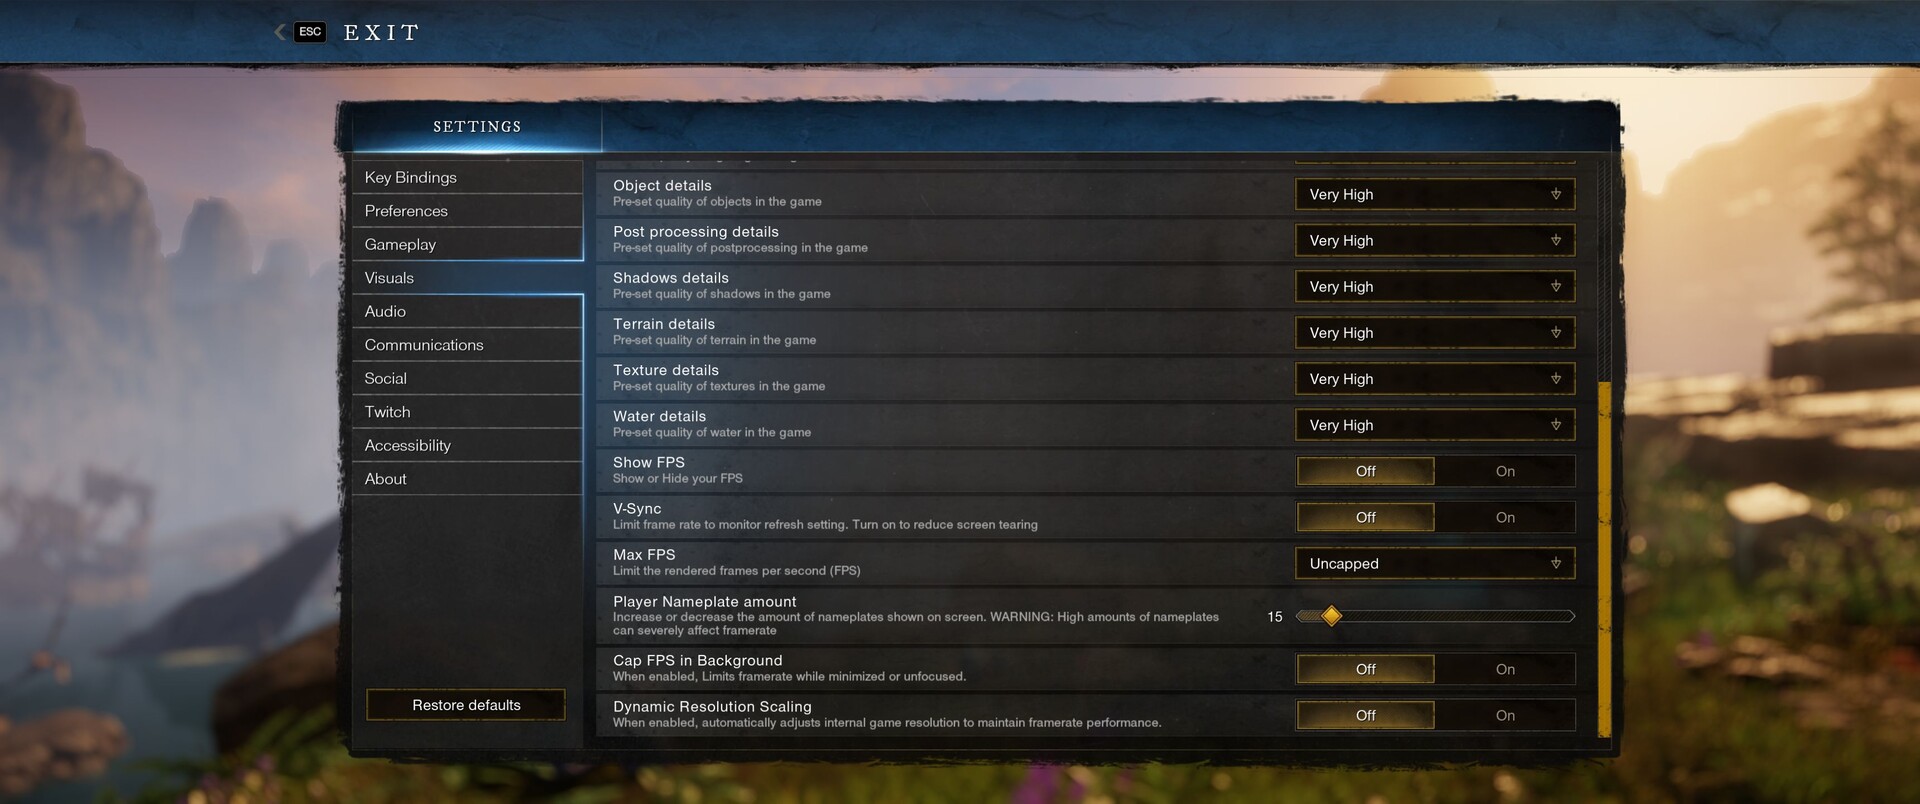
The graphics menu is very comprehensive. The Visuals tab contains more than 20 settings. In the first section, the field of view, resolution, brightness and contrast can be changed. There are more than 10 settings in the second section. In the last section, users can enable vertical synchronisation and dynamic resolution scaling. The frame rate can also be capped, and the number of nameplates that can appear at the same time can be adjusted.

We conducted our benchmarks with all options disabled (except for V-Sync). Fortunately, the graphics changes do not require a restart. If that were not the case, then fine-tuning graphics settings would have been quite challenging, given all of the server-side issues.

New World
New World

Benchmark

As can be seen from the video below, our benchmark tales place in the starting location, which is known as First Light. We run from the gate to the well and back. The entire run takes about 45 seconds. We capture frame rate data with CapFrameX.

Because a lot of players are present at starting locations on popular servers, these benchmarks should generally be viewed as the worst-case scenario. New World is a very CPU-demanding game, which means that high-end GPUs can get bottlenecked by the CPU. Lowering graphics settings can also lead to CPU bottlenecks.

Results

The benchmarks were conducted mainly using the laptops which our partners MSI and XMG (Schenker Technologies) lent us.

FHD (1920x1080)

Despite the size of the game, MMO flare and impressive visuals, New World has rather modest system requirements. Sure, it cannot run on low-end GPUs with 2 GB of VRAM such as the GeForce MX450. However, lower mid-range graphics cards with 4 GB of VRAM (GeForce GTX 16501650 Ti) can handle the game at medium, or even higher, settings. Of course, such GPUs cannot provide a rock-solid 60 FPS experience. To achieve decent frame rates at the highest settings, gamers will need a Radeon RX 5600M or GeForce GTX 1660 Ti/GeForce RTX 3050 Ti.

New World
    1920x1080 Low Video Quality     1920x1080 Medium Video Quality     1920x1080 High Video Quality     1920x1080 Very High Video Quality
NVIDIA GeForce RTX 3070 Laptop GPU, i7-11800H
XMG Neo 17 @140 W TGP
99.8 (42.6min, 46.6P0.1, 56.3P1) fps ∼17%
84.6 (36.9min, 39.5P0.1, 47.3P1) fps ∼18%
81.7 (34.7min, 35.8P0.1, 44.8P1) fps ∼19%
79.4 (31.8min, 37.5P0.1, 46.8P1) fps ∼19%
NVIDIA GeForce RTX 3080 Laptop GPU, i7-11800H
XMG Neo 15 @165 W TGP
90.2 (37.5min, 41.7P0.1, 51.3P1) fps ∼15%
83.3 (33.6min, 37.5P0.1, 47P1) fps ∼18%
80.8 (23min, 35.3P0.1, 42.7P1) fps ∼19%
74.9 (26.1min, 33.4P0.1, 40.3P1) fps ∼18%
NVIDIA GeForce RTX 3080, i9-9900K
MSI GeForce RTX 3080 Gaming X Trio
87.6 (33min, 37.8P0.1, 47.6P1) fps ∼15%
74.8 (31.7min, 33.1P0.1, 38.5P1) fps ∼16%
70.8 (29.8min, 31.9P0.1, 37.7P1) fps ∼16%
70.6 (26.2min, 31.2P0.1, 37.2P1) fps ∼17%
NVIDIA GeForce RTX 3070, i9-9900K
MSI GeForce RTX 3070 Ventus 3X
86.6 (37.7min, 41.3P0.1, 51.5P1) fps ∼15%
78.2 (35.5min, 39P0.1, 47.3P1) fps ∼17%
73.4 (27.4min, 34.3P0.1, 41.5P1) fps ∼17%
68.6 (30.1min, 33.3P0.1, 39.5P1) fps ∼16%
NVIDIA GeForce RTX 3060 Laptop GPU, i7-11800H
XMG Core 15 @130 W TGP
86.1 (28.6min, 35.6P0.1, 48.6P1) fps ∼15%
71 (25.3min, 31.2P0.1, 37P1) fps ∼15%
66.1 (21.5min, 30P0.1, 36.2P1) fps ∼15%
62.3 (23.3min, 27.6P0.1, 32.3P1) fps ∼15%
NVIDIA GeForce RTX 3090, i9-9900K
MSI GeForce RTX 3090 Suprim X
85.8 (33.3min, 38.3P0.1, 48.5P1) fps ∼15%
74.5 (28.5min, 31.4P0.1, 38.2P1) fps ∼16%
72.4 (31.3min, 33.2P0.1, 38.3P1) fps ∼17%
70.1 (28.4min, 31.1P0.1, 38P1) fps ∼16%
NVIDIA GeForce RTX 3050 Ti Laptop GPU, i7-11800H
XMG Focus 17 @75 W TGP
72.8 (33.5min, 36.9P0.1, 43.9P1) fps ∼12%
62.8 (33.7min, 34.9P0.1, 39.2P1) fps ∼14%
59.4 (27min, 31.8P0.1, 39.4P1) fps ∼14%
47.6 (23.5min, 25.9P0.1, 31.5P1) fps ∼11%
AMD Radeon RX 5600M, R7 4800H
Dell G5 15 SE
69.4 (21.3min, 31P0.1, 42.7P1) fps ∼12%
55.7 (32.3min, 33.2P0.1, 36.6P1) fps ∼12%
50.7 (25.8min, 28.2P0.1, 31.7P1) fps ∼12%
44.7 (18.1min, 21.2P0.1, 26.6P1) fps ∼11%
NVIDIA GeForce GTX 1660 Ti Mobile, i7-9750H
MSI GP65 Leopard 9SD
66.8 (26.8min, 29.3P0.1, 35.1P1) fps ∼11%
57.9 (19.5min, 23P0.1, 29.2P1) fps ∼13%
55.9 (16.5min, 24P0.1, 30.5P1) fps ∼13%
50 (18.6min, 19.9P0.1, 24.8P1) fps ∼12%
NVIDIA GeForce GTX 1650 Ti Mobile, i7-10750H
MSI GP75
62.3 (29.5min, 31.7P0.1, 37.9P1) fps ∼11%
53.7 (27.3min, 29.8P0.1, 35.2P1) fps ∼12%
48.6 (23.4min, 28.4P0.1, 31.3P1) fps ∼11%
36.4 (15.9min, 19.1P0.1, 22.2P1) fps ∼9%
NVIDIA GeForce GTX 1650 Mobile, i7-10750H
MSI GL75
54.3 (18.6min, 23.7P0.1, 29.4P1) fps ∼9%
44.4 (14.8min, 20.6P0.1, 23.6P1) fps ∼10%
41.9 (15.6min, 16.3P0.1, 22.2P1) fps ∼10%
30.6 (9.86min, 12.8P0.1, 19.9P1) fps ∼7%
NVIDIA GeForce MX450, i7-11370H
Xiaomi RedmiBook Pro 15
33.7 (2.84min, 7.84P0.1, 15.9P1) fps ∼6%
25.9 (12.4min, 13.3P0.1, 16P1) fps ∼6%
21.8 (12.9min, 13.7P0.1, 15.5P1) fps ∼5%
9.54 (6.81min, 6.82P0.1, 6.96P1) fps ∼2%

QHD (2560x1440)

The GeForce RTX 3060 will allow gamers to enjoy New World at high settings at 1440p.

New World
    2560x1440 Very High Video Quality
NVIDIA GeForce RTX 3090, i9-9900K
MSI GeForce RTX 3090 Suprim X
70 (25.2min, 34.3P0.1, 39.4P1) fps ∼17%
NVIDIA GeForce RTX 3080, i9-9900K
MSI GeForce RTX 3080 Gaming X Trio
69.7 (27.4min, 32.3P0.1, 37.9P1) fps ∼17%
NVIDIA GeForce RTX 3080 Laptop GPU, i7-11800H
XMG Neo 15 @165 W TGP
67.2 (29.5min, 31.2P0.1, 37P1) fps ∼17%
NVIDIA GeForce RTX 3070 Laptop GPU, i7-11800H
XMG Neo 17 @140 W TGP
66.4 (33.6min, 34.9P0.1, 41.5P1) fps ∼17%
NVIDIA GeForce RTX 3070, i9-9900K
MSI GeForce RTX 3070 Ventus 3X
66.2 (19.1min, 31P0.1, 40P1) fps ∼17%
NVIDIA GeForce RTX 3060 Laptop GPU, i7-11800H
XMG Core 15 @130 W TGP
52.9 (6.59min, 27P0.1, 32.1P1) fps ∼13%
NVIDIA GeForce GTX 1660 Ti Mobile, i7-9750H
MSI GP65 Leopard 9SD
38 (18.7min, 20.3P0.1, 23.7P1) fps ∼9%
AMD Radeon RX 5600M, R7 4800H
Dell G5 15 SE
32.6 (11.7min, 12P0.1, 18.7P1) fps ∼8%
NVIDIA GeForce RTX 3050 Ti Laptop GPU, i7-11800H
XMG Focus 17 @75 W TGP
32.4 (9.77min, 13.3P0.1, 19.9P1) fps ∼8%
NVIDIA GeForce GTX 1650 Ti Mobile, i7-10750H
MSI GP75
25.3 (12.7min, 15.6P0.1, 18.4P1) fps ∼6%
NVIDIA GeForce GTX 1650 Mobile, i7-10750H
MSI GL75
18.1 (5.5min, 9.59P0.1, 12.9P1) fps ∼5%

UHD (3840x2160)

At 4K, the title becomes really demanding. Even the GeForce RTX 3070 (Mobile) and RTX 3080 (Mobile) struggle to achieves decent frame rates at 4K at the highest settings.

New World
    3840x2160 Very High Video Quality
NVIDIA GeForce RTX 3090, i9-9900K
MSI GeForce RTX 3090 Suprim X
69.1 (25.9min, 28.7P0.1, 36.1P1) fps ∼20%
NVIDIA GeForce RTX 3080, i9-9900K
MSI GeForce RTX 3080 Gaming X Trio
68.1 (27.1min, 29.9P0.1, 35.7P1) fps ∼20%
NVIDIA GeForce RTX 3070, i9-9900K
MSI GeForce RTX 3070 Ventus 3X
52.6 (25.5min, 30.7P0.1, 35.8P1) fps ∼15%
NVIDIA GeForce RTX 3080 Laptop GPU, i7-11800H
XMG Neo 15 @165 W TGP
42.9 (20.5min, 20.9P0.1, 27.3P1) fps ∼12%
NVIDIA GeForce RTX 3070 Laptop GPU, i7-11800H
XMG Neo 17 @140 W TGP
40 (19.4min, 23.6P0.1, 27.4P1) fps ∼11%
NVIDIA GeForce RTX 3060 Laptop GPU, i7-11800H
XMG Core 15 @130 W TGP
29.7 (17.8min, 18P0.1, 20P1) fps ∼9%
NVIDIA GeForce GTX 1660 Ti Mobile, i7-9750H
MSI GP65 Leopard 9SD
17.8 (5.09min, 8.67P0.1, 12.3P1) fps ∼5%
NVIDIA GeForce RTX 3050 Ti Laptop GPU, i7-11800H
XMG Focus 17 @75 W TGP
17.7 (6.86min, 10.5P0.1, 13.3P1) fps ∼5%
AMD Radeon RX 5600M, R7 4800H
Dell G5 15 SE
17.2 (5.26min, 6.07P0.1, 10.2P1) fps ∼5%
NVIDIA GeForce GTX 1650 Ti Mobile, i7-10750H
MSI GP75
12.2 (8.39min, 8.65P0.1, 9.22P1) fps ∼3%
NVIDIA GeForce GTX 1650 Mobile, i7-10750H
MSI GL75
10.4 (7.09min, 7.24P0.1, 7.93P1) fps ∼3%

Note

Because benchmarking video games is very time consuming and is often constrained by installation/activation limits, at the time of publishing, we were able to provide only a part of our performance analysis of New World. Other graphics cards will be added in the coming days and weeks.

Overview

Show Restrictions
PosModel< PrevNext >New World
 New World (2021)
low
1280x720
Low Video Quality
med.
1920x1080
Medium Video Quality
high
1920x1080
High Video Quality
ultra
1920x1080
Very High Video Quality
QHD
2560x1440
Very High Video Quality
4K
3840x2160
Very High Video Quality
NVIDIA GeForce RTX 4090
215
188
183.5
175.3
174.8
149.3
AMD Radeon RX 7900 XTX
210
185.1
168.1
158.8
156.5
103.3
AMD Radeon RX 7900 XT
213
177.8
164.1
156.9
147
84.4
NVIDIA GeForce RTX 4070 Ti
229
191.7
174.9
164.9
153.7
81.4
AMD Radeon RX 6950 XT
146.9
109.7
98.1
98.1
98.6
76.4
NVIDIA GeForce RTX 3090
199
111.75n2
105.2n2
75.3n3
97n2
69.1
NVIDIA GeForce RTX 3080 Ti
194
165
153
142
133
79.2
NVIDIA GeForce RTX 3080 12 GB
173.1
129.2
116.1
113.5
103.9
67.6
NVIDIA GeForce RTX 3080
74.8
70.8
70.6
69.7
68.1
AMD Radeon RX 6800
138
101
89.3
83.3
79
49.5
NVIDIA Titan RTX
180
139
131
123
101
54.5
NVIDIA GeForce RTX 3080 Ti Laptop GPU
126.4
117.75n2
109.5n2
104.75n2
90.4n2
50.6n2
NVIDIA GeForce RTX 3070
166.9
108.85n2
100.85n2
93.05n2
80.6n2
50.75n2
AMD Radeon RX 6750 XT
131.3
108.7
98.8
98.3
86.6
42.6
AMD Radeon RX 6700 XT
130
105
102
95.8
78.4
39.6
NVIDIA GeForce RTX 3080 Laptop GPU
115.5n3
89.5n4
86.05n4
79.45n4
65.25n2
40n2
NVIDIA GeForce RTX 3060 Ti
176.2
131.2
117.8
109.5
76.9
40.3
NVIDIA GeForce RTX 3070 Ti Laptop GPU
103.7n2
93.8n2
84.55n2
64.35n2
32.2
AMD Radeon RX 6800M
111.75n2
92.8n2
81.85n2
69.95n2
34.1
PosModel< PrevNext >New World
low med. high ultra QHD 4K
AMD Radeon RX 6650 XT
156.4
118
108.1
97.8
64
32.6
AMD Radeon RX 6600 XT
149
107
97.4
86.7
57.8
31.4
NVIDIA GeForce RTX 3070 Laptop GPU
121.85n2
96n4
90.9n4
83n4
66.95n2
37.85n2
AMD Radeon RX 6800S
96.3
85.2
75.8
55.7
28.2
NVIDIA GeForce RTX 3060
161
112
105
95.9
65.3
33.7
AMD Radeon RX 6700M
82.2
78.5
73
NVIDIA Titan X Pascal
206
128
116
103
70.7
37.3
NVIDIA GeForce RTX 2070 Super (Desktop)
179
122
116
106
72.7
37.8
AMD Radeon RX 5700 XT (Desktop)
143
103
96.6
85.5
58.5
NVIDIA GeForce RTX 3060 Laptop GPU
103.25n2
75.8n3
73.55n4
68.05n4
53n3
28.95n2
NVIDIA GeForce RTX 2060 Super (Desktop)
173
110
102
89.8
60.1
31.4
Intel Arc A770M
101.9
84.2
77.6
74.8
35.2
AMD Radeon RX 6600
138
93.5
88.3
79.5
51.1
31.4
AMD Radeon RX 5700 (Desktop)
147
94
85.1
74.8
49
29.3
AMD Radeon RX 6600M
113.7
84.6n2
77.65n2
69.9n2
52.4
31.3
NVIDIA GeForce RTX 3050
161
79.1
68.5
61.6
40.9
28.1
AMD Radeon RX 5600 XT (Desktop)
147
88.5
79
68.5
43.8
28.2
NVIDIA GeForce GTX 1660 Super (Desktop)
157
82.6
75.1
46.05n2
41.8
AMD Radeon RX 6500 XT
145
62.1
55.3
43.4
29.8
16.8
AMD Radeon RX 5500 XT (Desktop)
124
59.2
52.5
45.3
32.5
21.3
PosModel< PrevNext >New World
low med. high ultra QHD 4K
AMD Radeon RX 5600M
55.7
50.7
44.7
32.6
17.2
NVIDIA GeForce GTX 1660 Ti Mobile
57.9
55.9
50
38
17.8
NVIDIA GeForce RTX 3050 Ti Laptop GPU
84.3n3
64.5n4
61n4
46.35n4
31.85n2
17.7
NVIDIA GeForce GTX 1660 (Desktop)
143
71.1
65
55.4
36.8
25.2
NVIDIA GeForce GTX 1650 Super (Desktop)
136
66.6
60.8
47.2
33.7
21.2
NVIDIA GeForce RTX 3050 4GB Laptop GPU
95
65.2
60.2
49.2
AMD Radeon RX 6500M
70.3
53
46.2
40.4
NVIDIA GeForce GTX 1060 Mobile
88.6
53.6
40.4
NVIDIA GeForce GTX 1650 Ti Mobile
53.7
48.6
36.4
25.3
12.2
NVIDIA GeForce GTX 1650 (Desktop)
106
50.7
45.9
35.7
28.8
16.1
NVIDIA GeForce GTX 1650 Mobile
44.4
41.9
30.6
18.1
10.4
AMD Radeon 680M
70.4
29.7
28.3
22.9
NVIDIA GeForce MX450
41.6
28.95n2
20.95n2
11.02n2
8.7
NVIDIA GeForce GTX 1050 Mobile
63.2
31.9n2
28.4
22.5
AMD Radeon RX 560X (Laptop)
56
27
24.2
19
Intel Iris Xe Graphics G7 96EUs
40.95n2
23.45n2
20.75n2
17.1
NVIDIA GeForce GT 1030 (Desktop)
35
22.2
17.6
9.91
NVIDIA GeForce MX250
33.3
14.3
12.4
Intel Iris Xe Graphics G7 80EUs
29.4
13
NVIDIA GeForce GT 710
9.76
5.01
PosModel< PrevNext >New World
low med. high ultra QHD 4K
AMD Radeon 540X
26.1
10.7
9.24
AMD Radeon RX Vega 10
18.1
7.96
Intel UHD Graphics Xe G4 48EUs
19.7
AMD Radeon RX Vega 8 (Ryzen 4000/5000)
29.5n2
13.95n2
12.9n2
10.08n2
AMD Radeon RX Vega 7
30.8
13
11.8
10.1
NVIDIA GeForce MX130
12.5
AMD Radeon RX Vega 8 (Ryzen 2000/3000)
17.6
NVIDIA GeForce 930MX
17.8
Intel Iris Graphics 550
14
AMD Radeon RX Vega 6 (Ryzen 2000/3000)
10.2
AMD Radeon RX Vega 5
19.6
Intel UHD Graphics 620
9.22
AMD Radeon R5 M255
12.2
AMD Radeon RX Vega 3
9.36
4.82
NVIDIA GeForce GT 720M
8.08
Intel HD Graphics 4600
6.56
Intel UHD Graphics (Jasper Lake 32 EU)
17
Intel HD Graphics 610
5.73
(-) * Smaller values are better. / n123 Number of benchmarks for this median value / * Approximate position


Legend
5Stutters – This game is very likely to stutter and have poor frame rates. Based on all known benchmarks using the specified graphical settings, average frame rates are expected to fall below 25fps
May Stutter – This graphics card has not been explicitly tested on this game. Based on interpolated information from surrounding graphics cards of similar performance levels, stutters and poor frame rates are expected.
30Fluent – Based on all known benchmarks using the specified graphical settings, this game should run at or above 25fps
40Fluent – Based on all known benchmarks using the specified graphical settings, this game should run at or above 35fps
60Fluent – Based on all known benchmarks using the specified graphical settings, this game should run at or above 58fps
May Run Fluently – This graphics card has not been explicitly tested on this game. Based on interpolated information from surrounding graphics cards of similar performance levels, fluent frame rates are expected.
?Uncertain – This graphics card experienced unexpected performance issues during testing for this game. A slower card may be able to achieve better and more consistent frame rates than this particular GPU running the same benchmark scene.
Uncertain – This graphics card has not been explicitly tested on this game and no reliable interpolation can be made based on the performances of surrounding cards of the same class or family.
The value in the fields displays the average frame rate of all values in the database. Move your cursor over the value to see individual results.

Test Systems

Device GPU CPU RAM OS
XMG Neo 15 Nvidia GeForce RTX 3080 @165 W TGP (16 GB GDDR6) Intel Core i7-11800H 2 x 16 GB DDR4 Windows 10 64 Bit
XMG Neo 17 Nvidia GeForce RTX 3070 @140 W TGP (8 GB GDDR6) Intel Core i7-11800H 2 x 16 GB DDR4 Windows 10 64 Bit
XMG Core 15 Nvidia GeForce RTX 3060 @130 W TGP (6 GB GDDR6) Intel Core i7-11800H 2 x 16 GB DDR4 Windows 10 64 Bit
XMG Focus 17 Nvidia GeForce RTX 3050 Ti @75 W TGP (4 GB GDDR6) Intel Core i7-11800H 2 x 16 GB DDR4 Windows 10 64 Bit
MSI GP65 Nvidia GeForce GTX 1660 Ti (6 GB GDDR6) Intel Core i7-9750H 2 x 8 GB DDR4 Windows 10 64 Bit
MSI GP75 Nvidia GeForce GTX 1650 Ti (4 GB GDDR6) Intel Core i7-10750H 2 x 8 GB DDR4 Windows 10 64 Bit
MSI GL75 Nvidia GeForce GTX 1650 (4 GB GDDR6) Intel Core i7-10750H 2 x 8 GB DDR4 Windows 10 64 Bit
Xiaomi RedmiBook Pro 15 Nvidia GeForce MX450 (2 GB GDDR5) Intel Core i7-11370H 1 x 16 GB DDR4 Windows 10 64 Bit
Dell G5 15 SE AMD Radeon RX 5600M (6 GB GDDR6) AMD Ryzen 7 4800H 2 x 8 GB DDR4 Windows 10 64 Bit
MSI Prestige 14 Evo Intel Iris Xe (96 CUs) Intel Core i7-1185G7 1 x 16 GB DDR4 Windows 10 64 Bit
Desktop PC I MSI GeForce RTX 3090 (24 GB GDDR6X)
MSI GeForce RTX 3080 (10 GB GDDR6X)
MSI GeForce RTX 3070 (8 GB GDDR6)
Intel Core i9-9900K 4 x 8 GB DDR4 Windows 10 64 Bit
Desktop PC II Nvidia GeForce RTX 3090 FE (24 GB GDDR6X)
Nvidia Titan RTX (24 GB GDDR6)
Nvidia GeForce RTX 2070 Super (8 GB GDDR6)
Nvidia GeForce RTX 2060 Super (8 GB GDDR6)
KFA2 GeForce GTX 1660 Super (6 GB GDDR6)
PNY GeForce GTX 1660 (6 GB GDDR5)
KFA2 GeForce GTX 1650 Super (4 GB GDDR6)
KFA2 GeForce GTX 1650 (4 GB GDDR5)
AMD Radeon RX 6700 XT (12 GB DDR6)
AMD Radeon RX 6600 XT (8 GB GDDR6)
AMD Radeon RX 5700 XT (8 GB GDDR6)
AMD Radeon RX 5700 (8 GB GDDR6)
AMD Radeon RX 5600 XT (6 GB GDDR6)
AMD Radeon RX 5500 XT (8 GB GDDR6)
AMD Ryzen 9 5900X 2 x 32 GB DDR4 Windows 10 64 Bit
4K monitors Nvidia drivers AMD drivers
Asus PB287Q, Philips Brilliance 329P9H, Acer Predator XB321HK ForceWare 472.12 Adrenalin 21.9.2
Read all 3 comments / answer
static version load dynamic
Loading Comments
Comment on this article
Please share our article, every link counts!
Florian Glaser, 2021-10- 5 (Update: 2021-10- 5)