Notebookcheck Logo

Sapphire Nitro+ Radeon RX 6650 XT Desktop-GPU Review: Powerful 1080p graphics card with a good cooler

A solid 1080p graphics card The models in AMD's refreshed line-up get you a bit more performance than before. For that performance, though, you will need to dig a little bit deeper in your pockets. Find out whether the extra performance is worth the increased price in this review of the AMD Radeon RX 6650 XT.
Sapphire Nitro+ Radeon RX 6650 XT

The AMD Radeon RX 6650 XT is part of this year's revised line-up of RDNA2 graphics cards. After taking a look at the AMD Radeon RX 6950 XT and the AMD Radeon RX 6750 XT, we now turn our attention to the AMD Radeon RX 6650 XT, which is the AMD Radeon RX 6600 XT's successor.

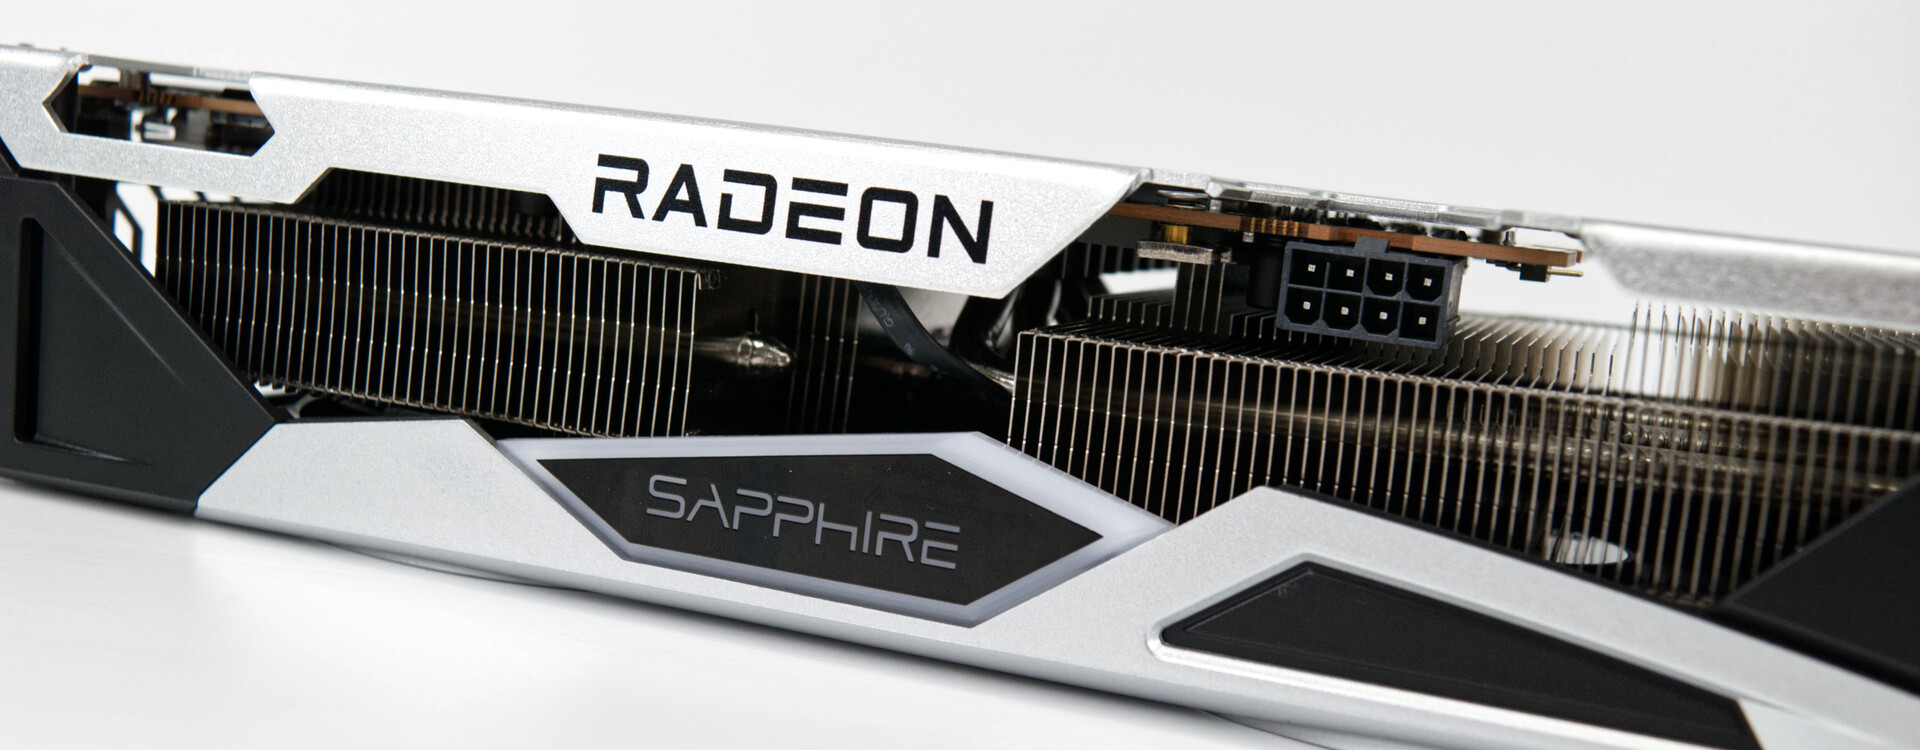
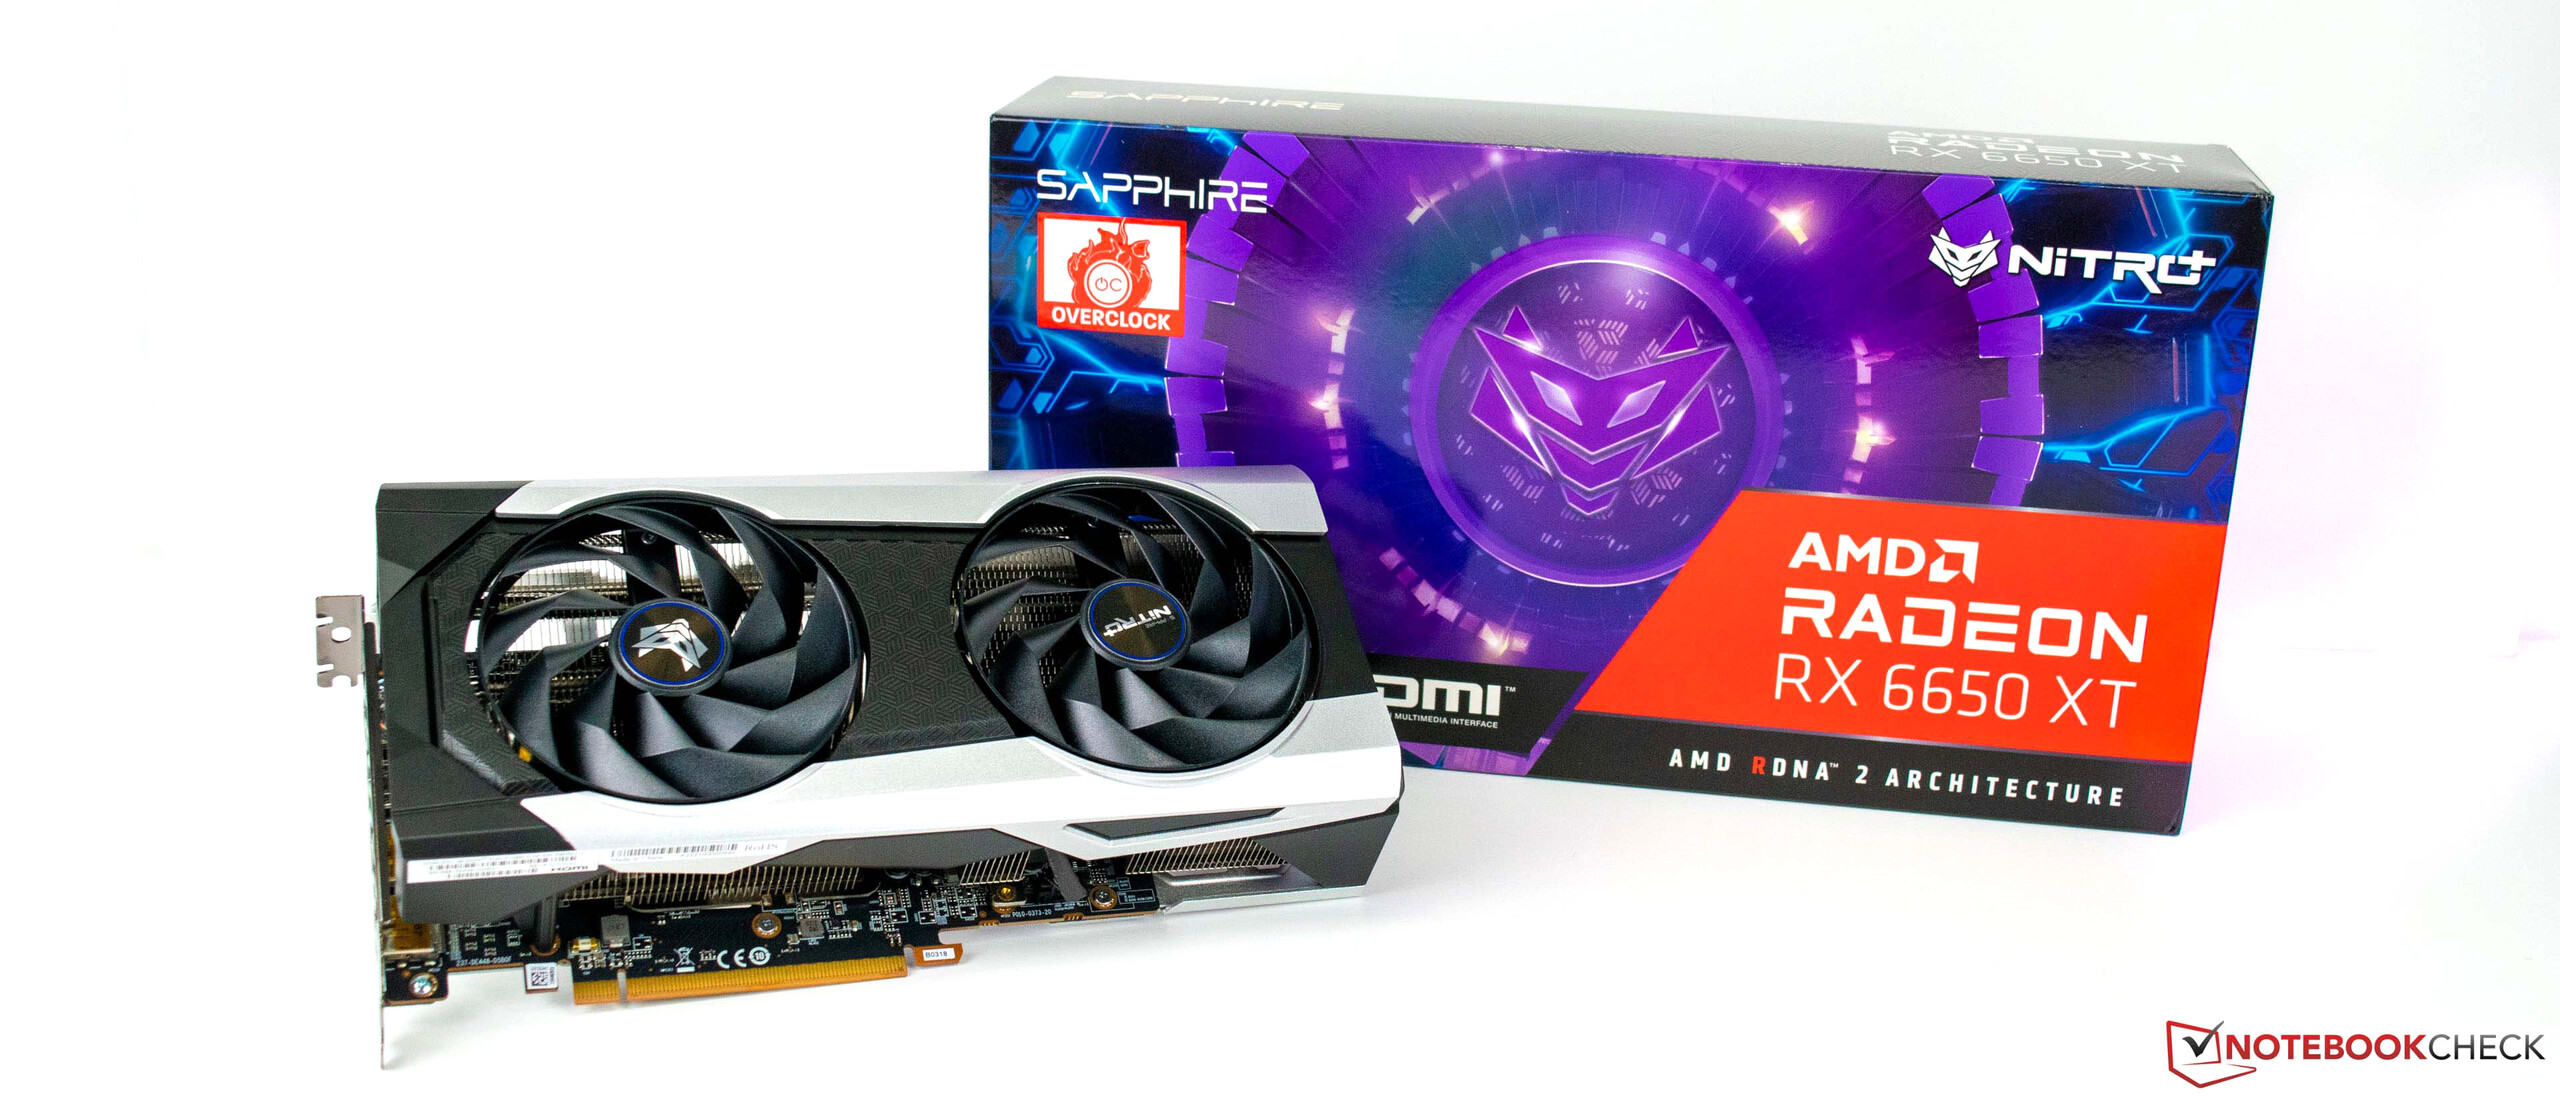
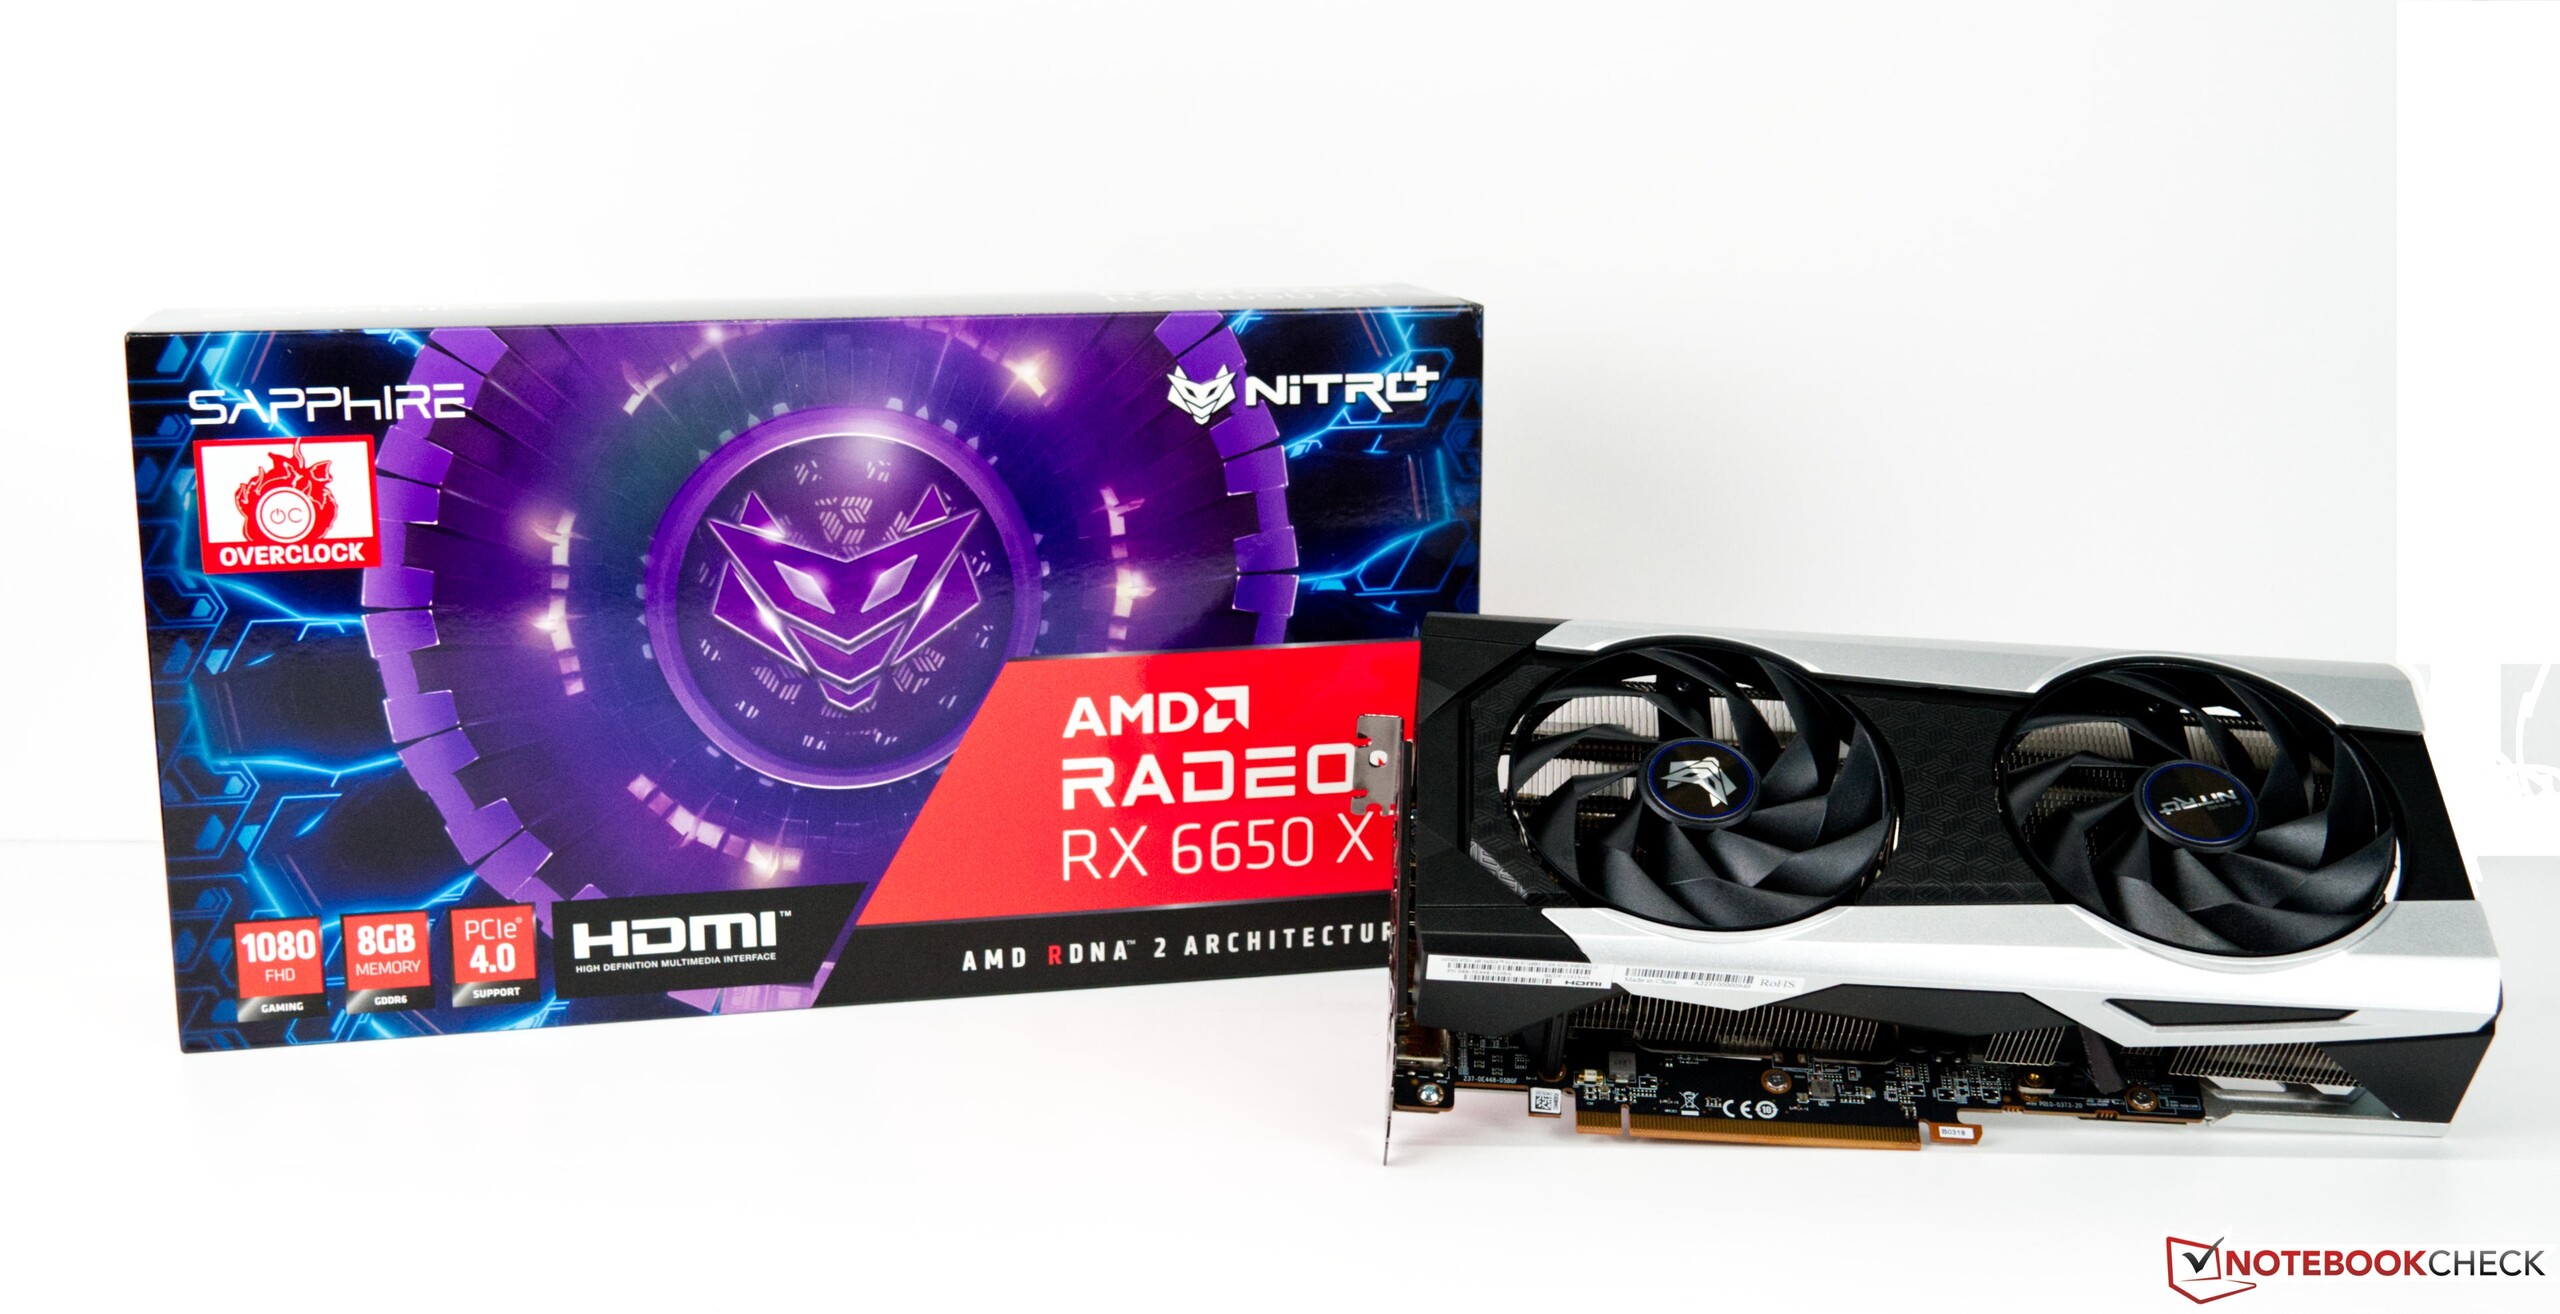
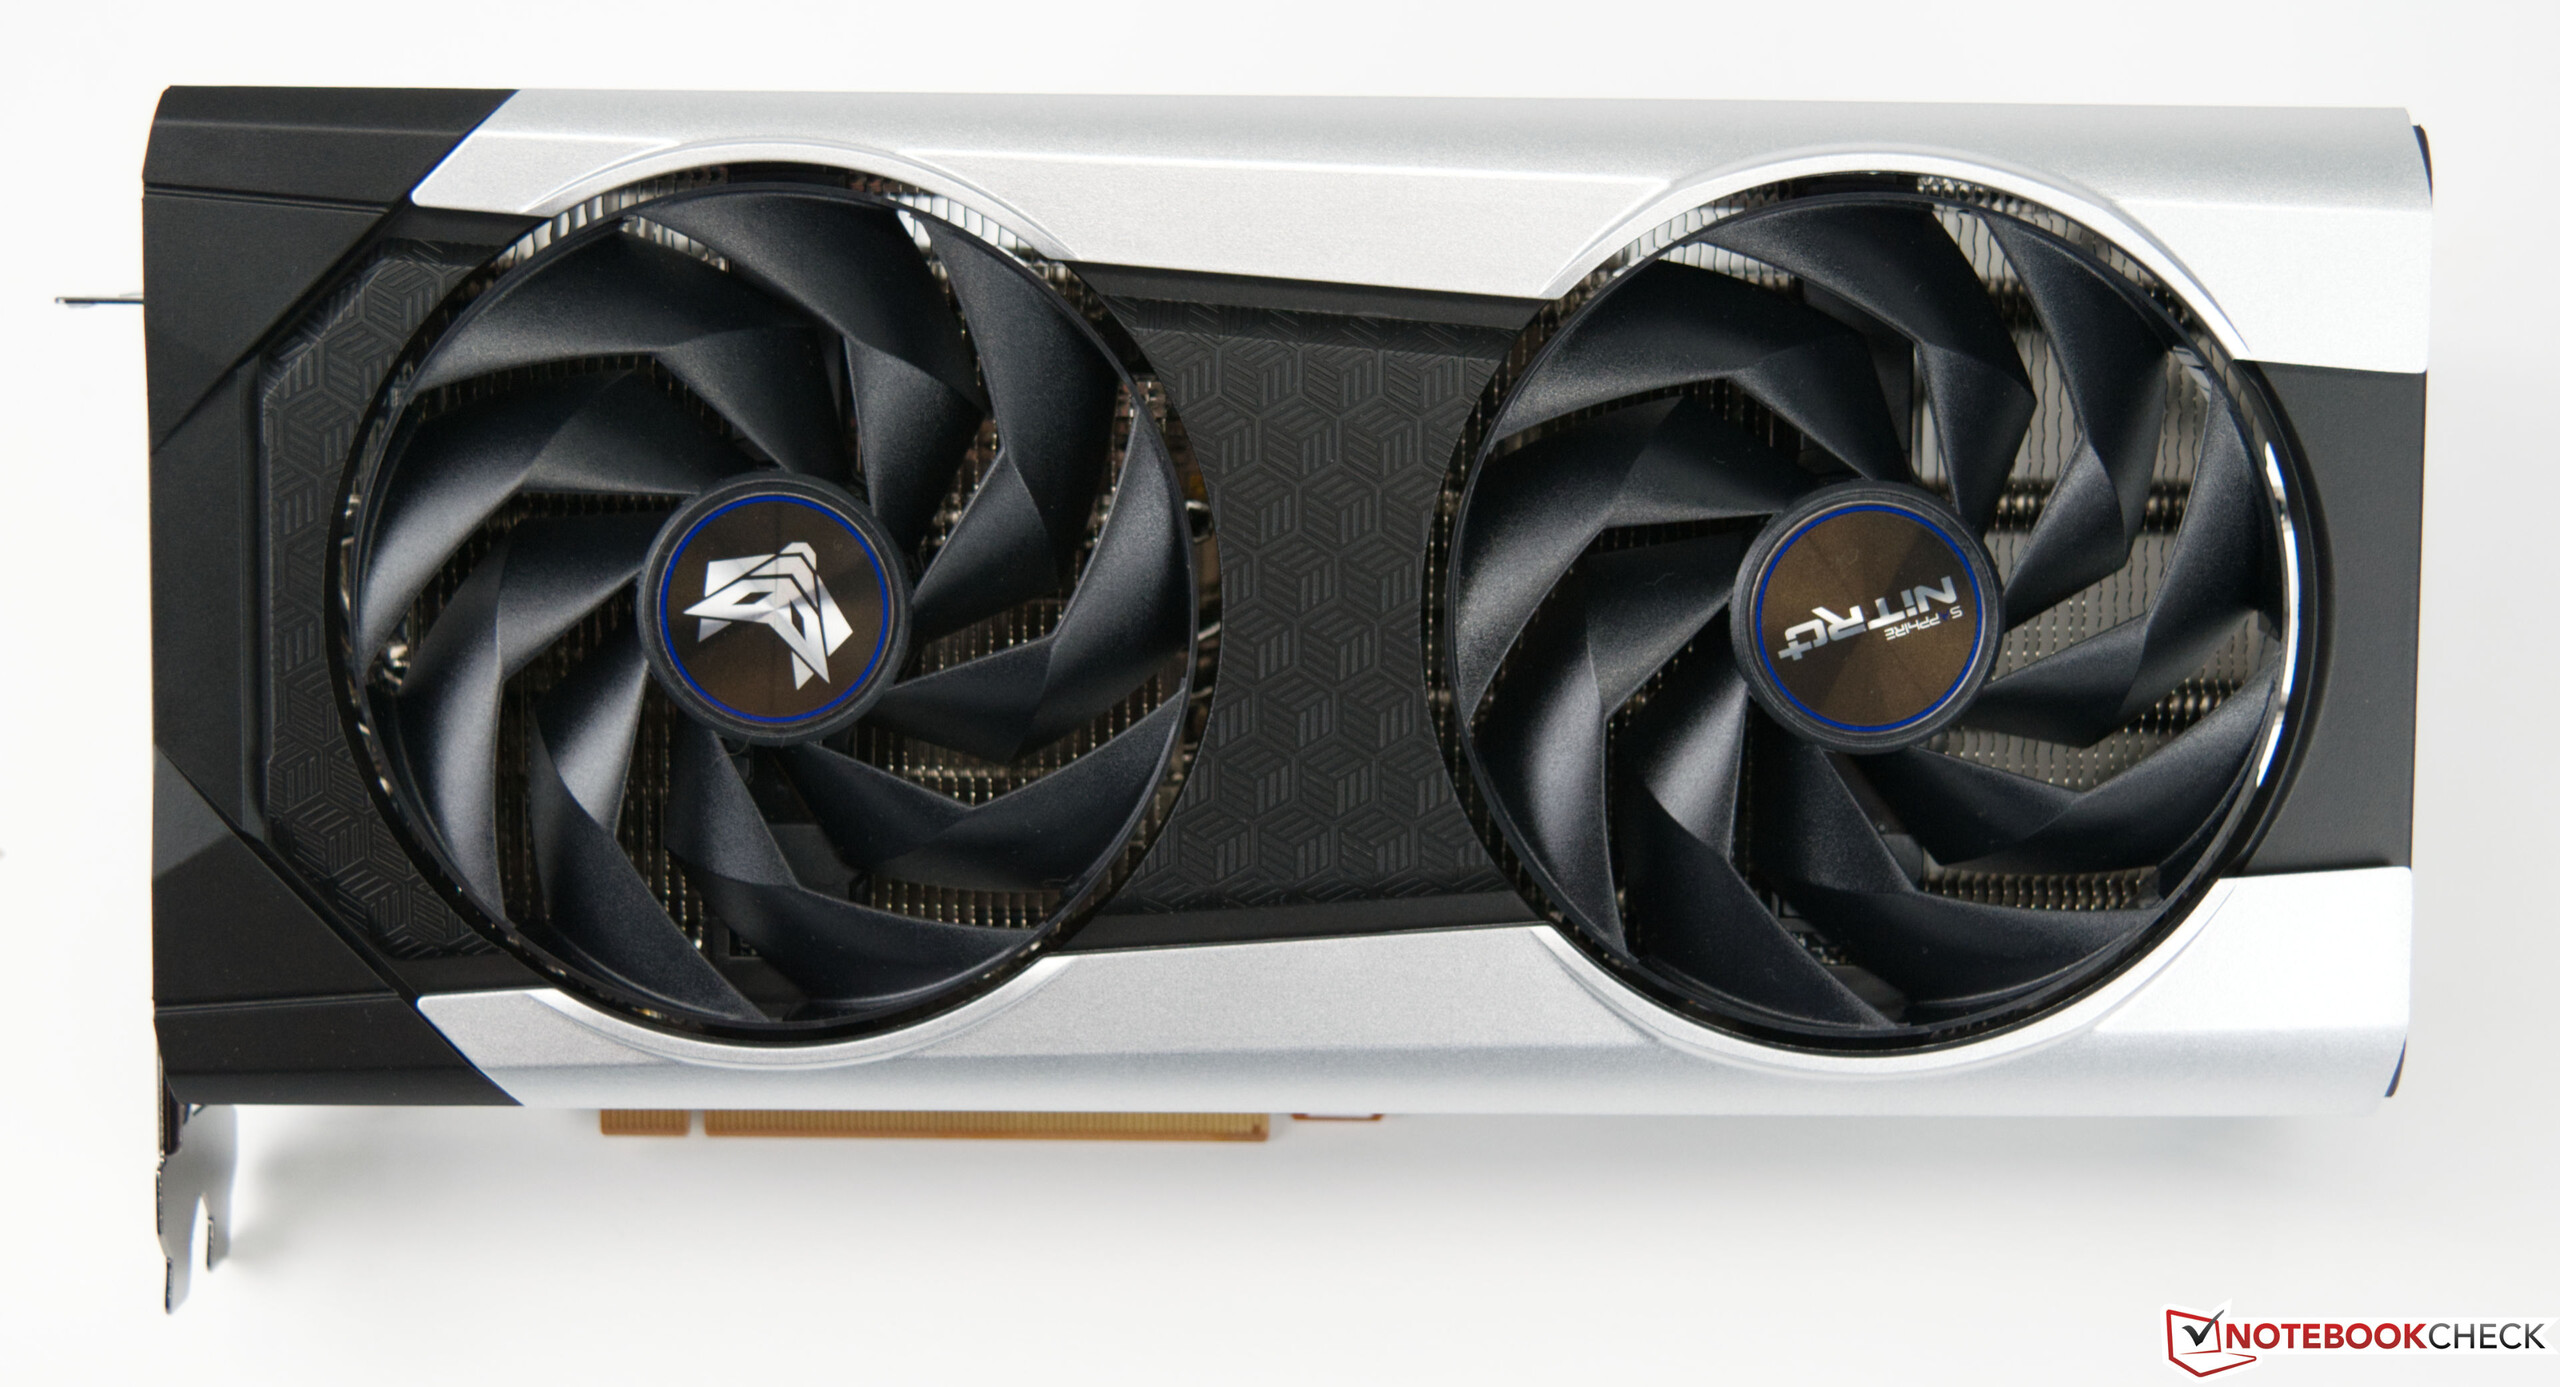
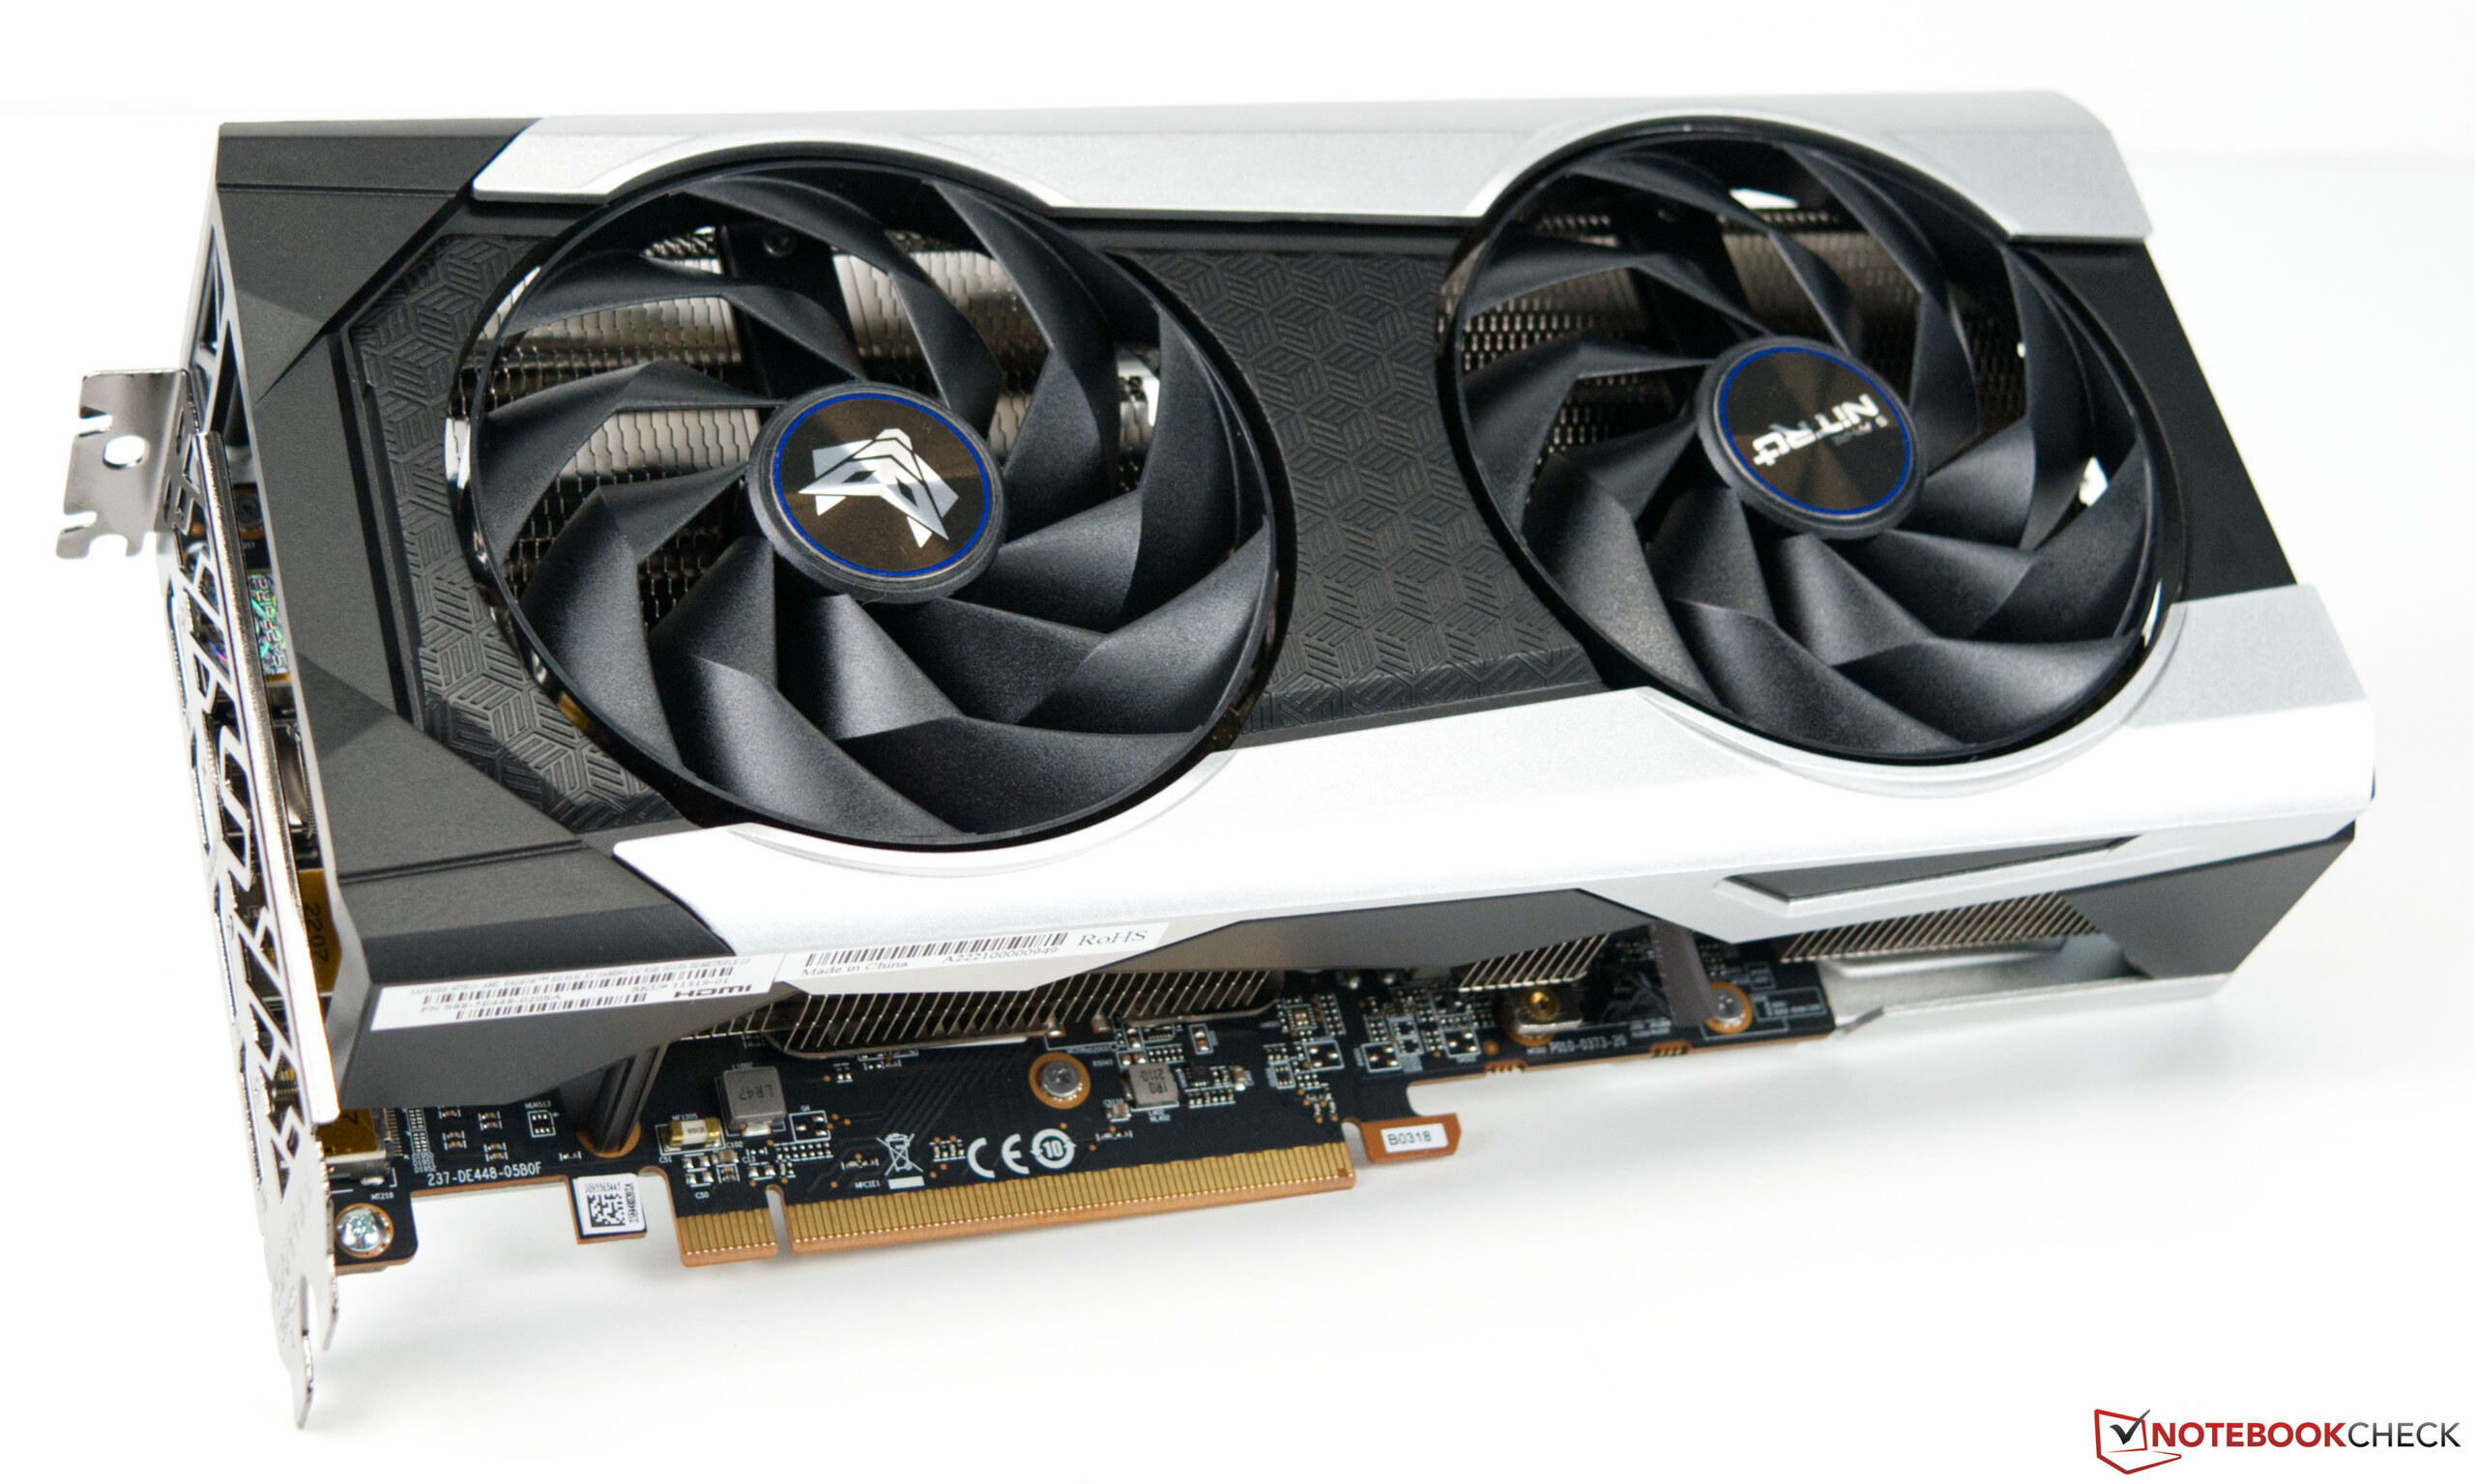
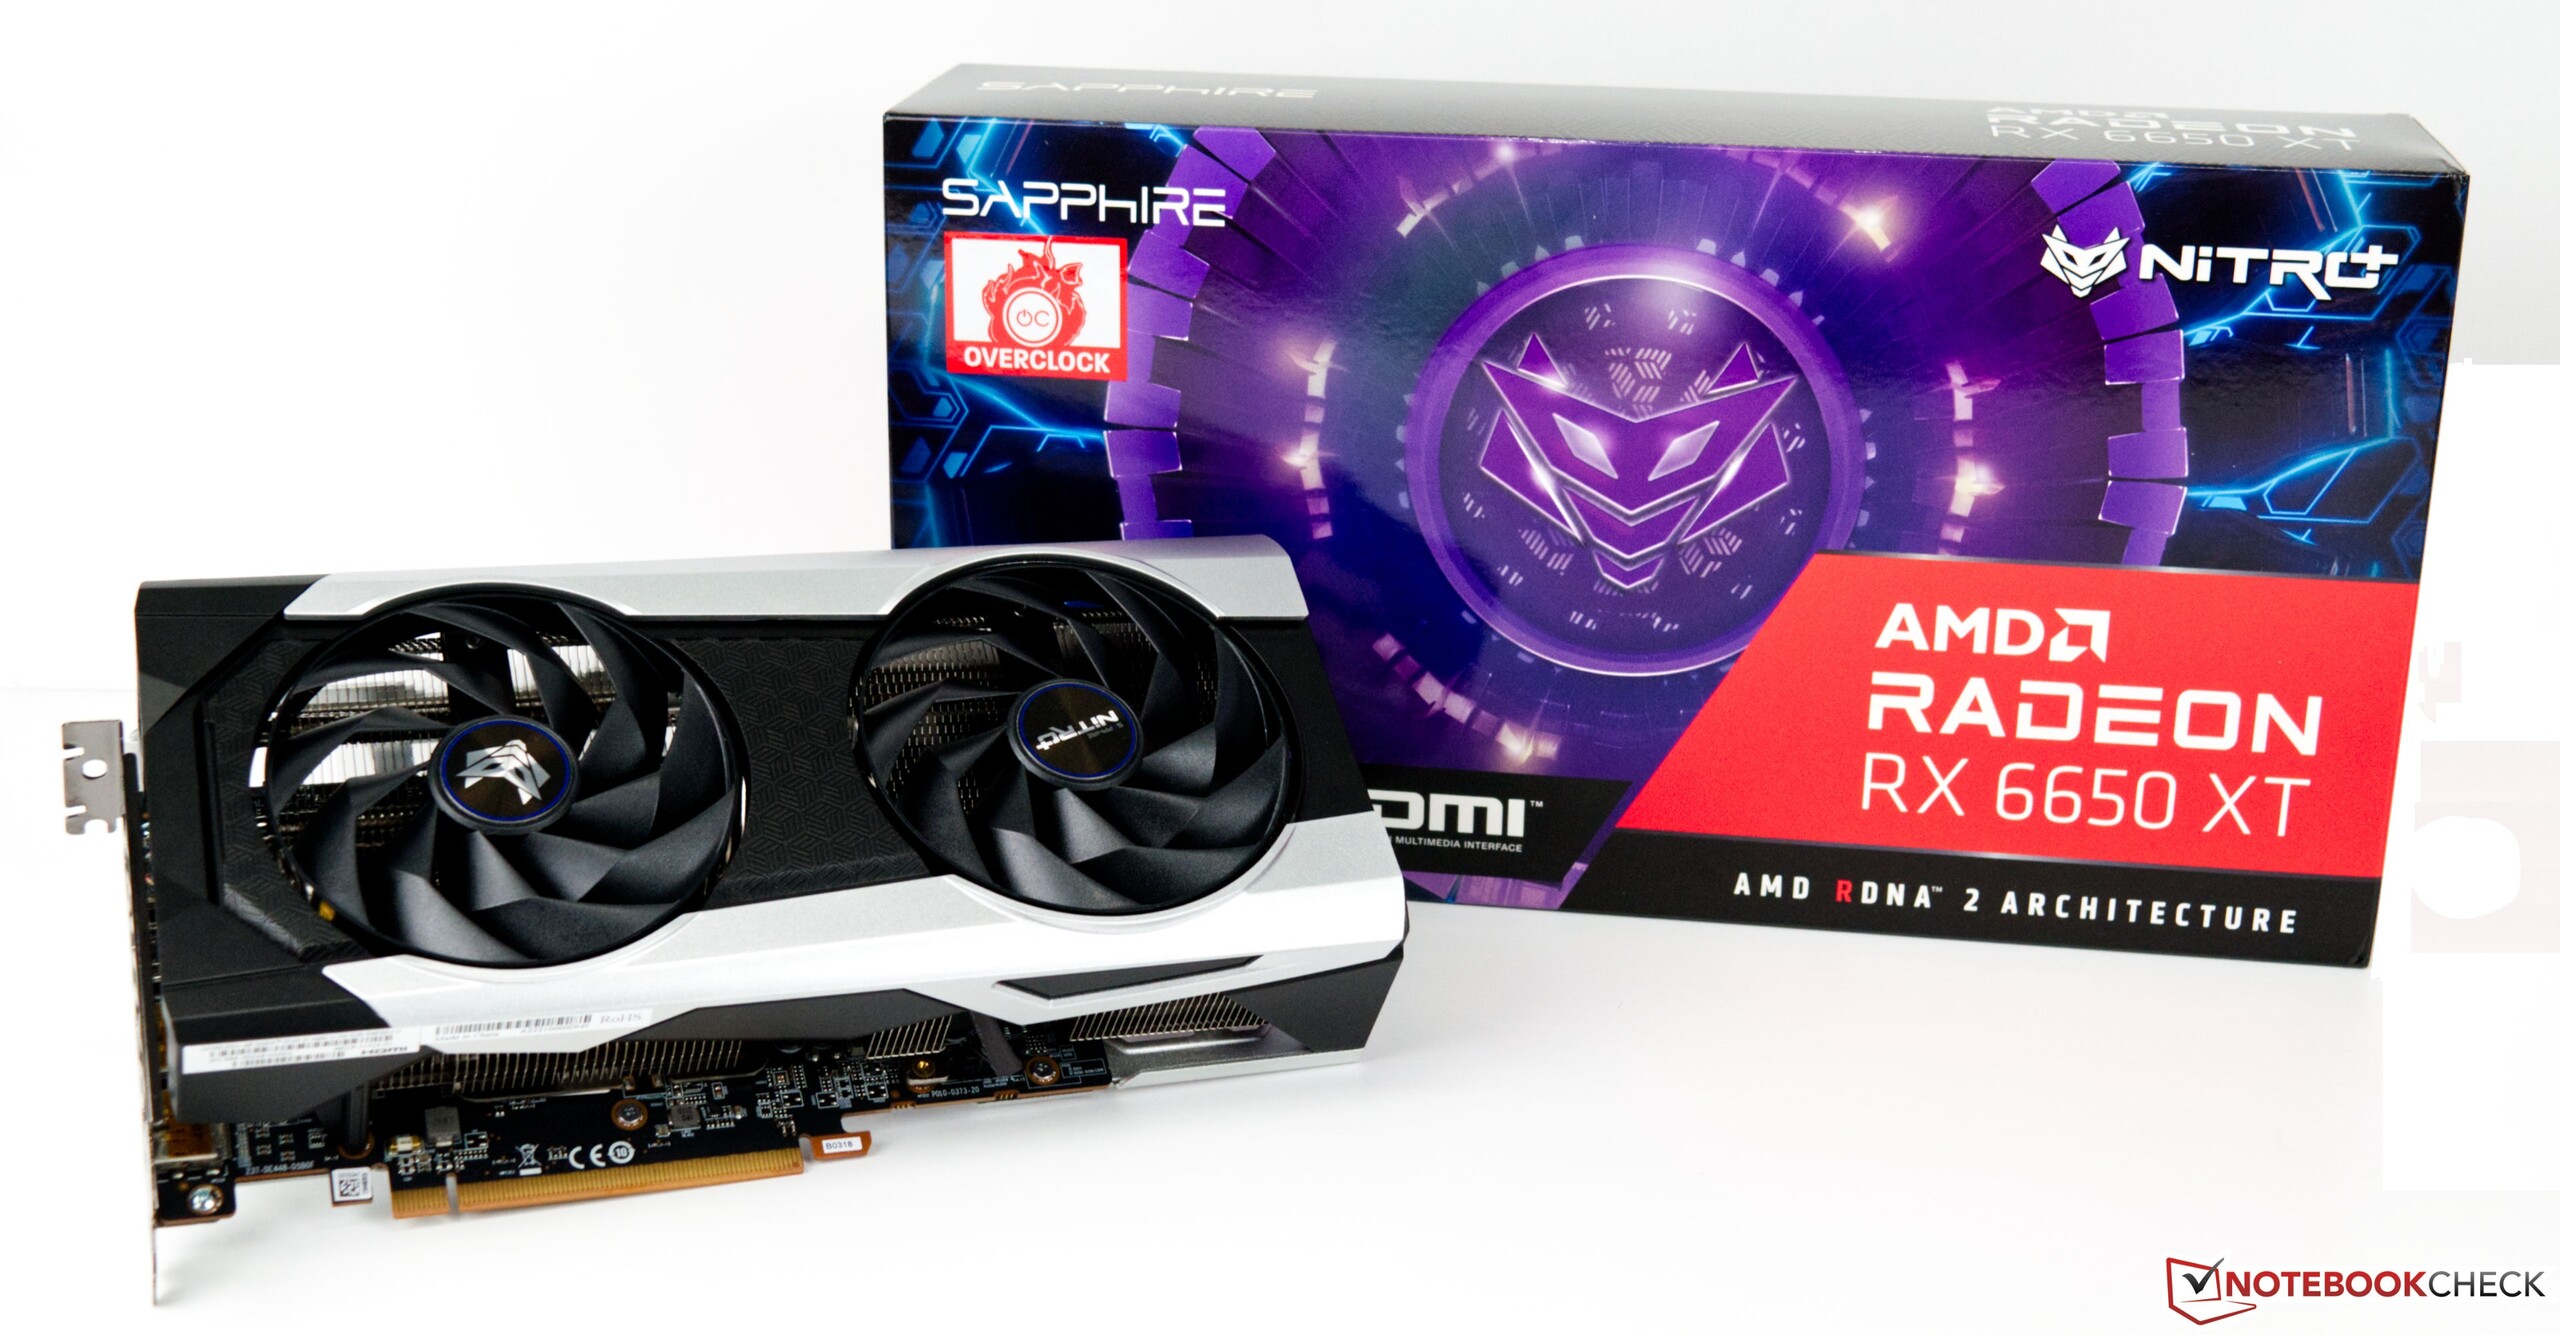
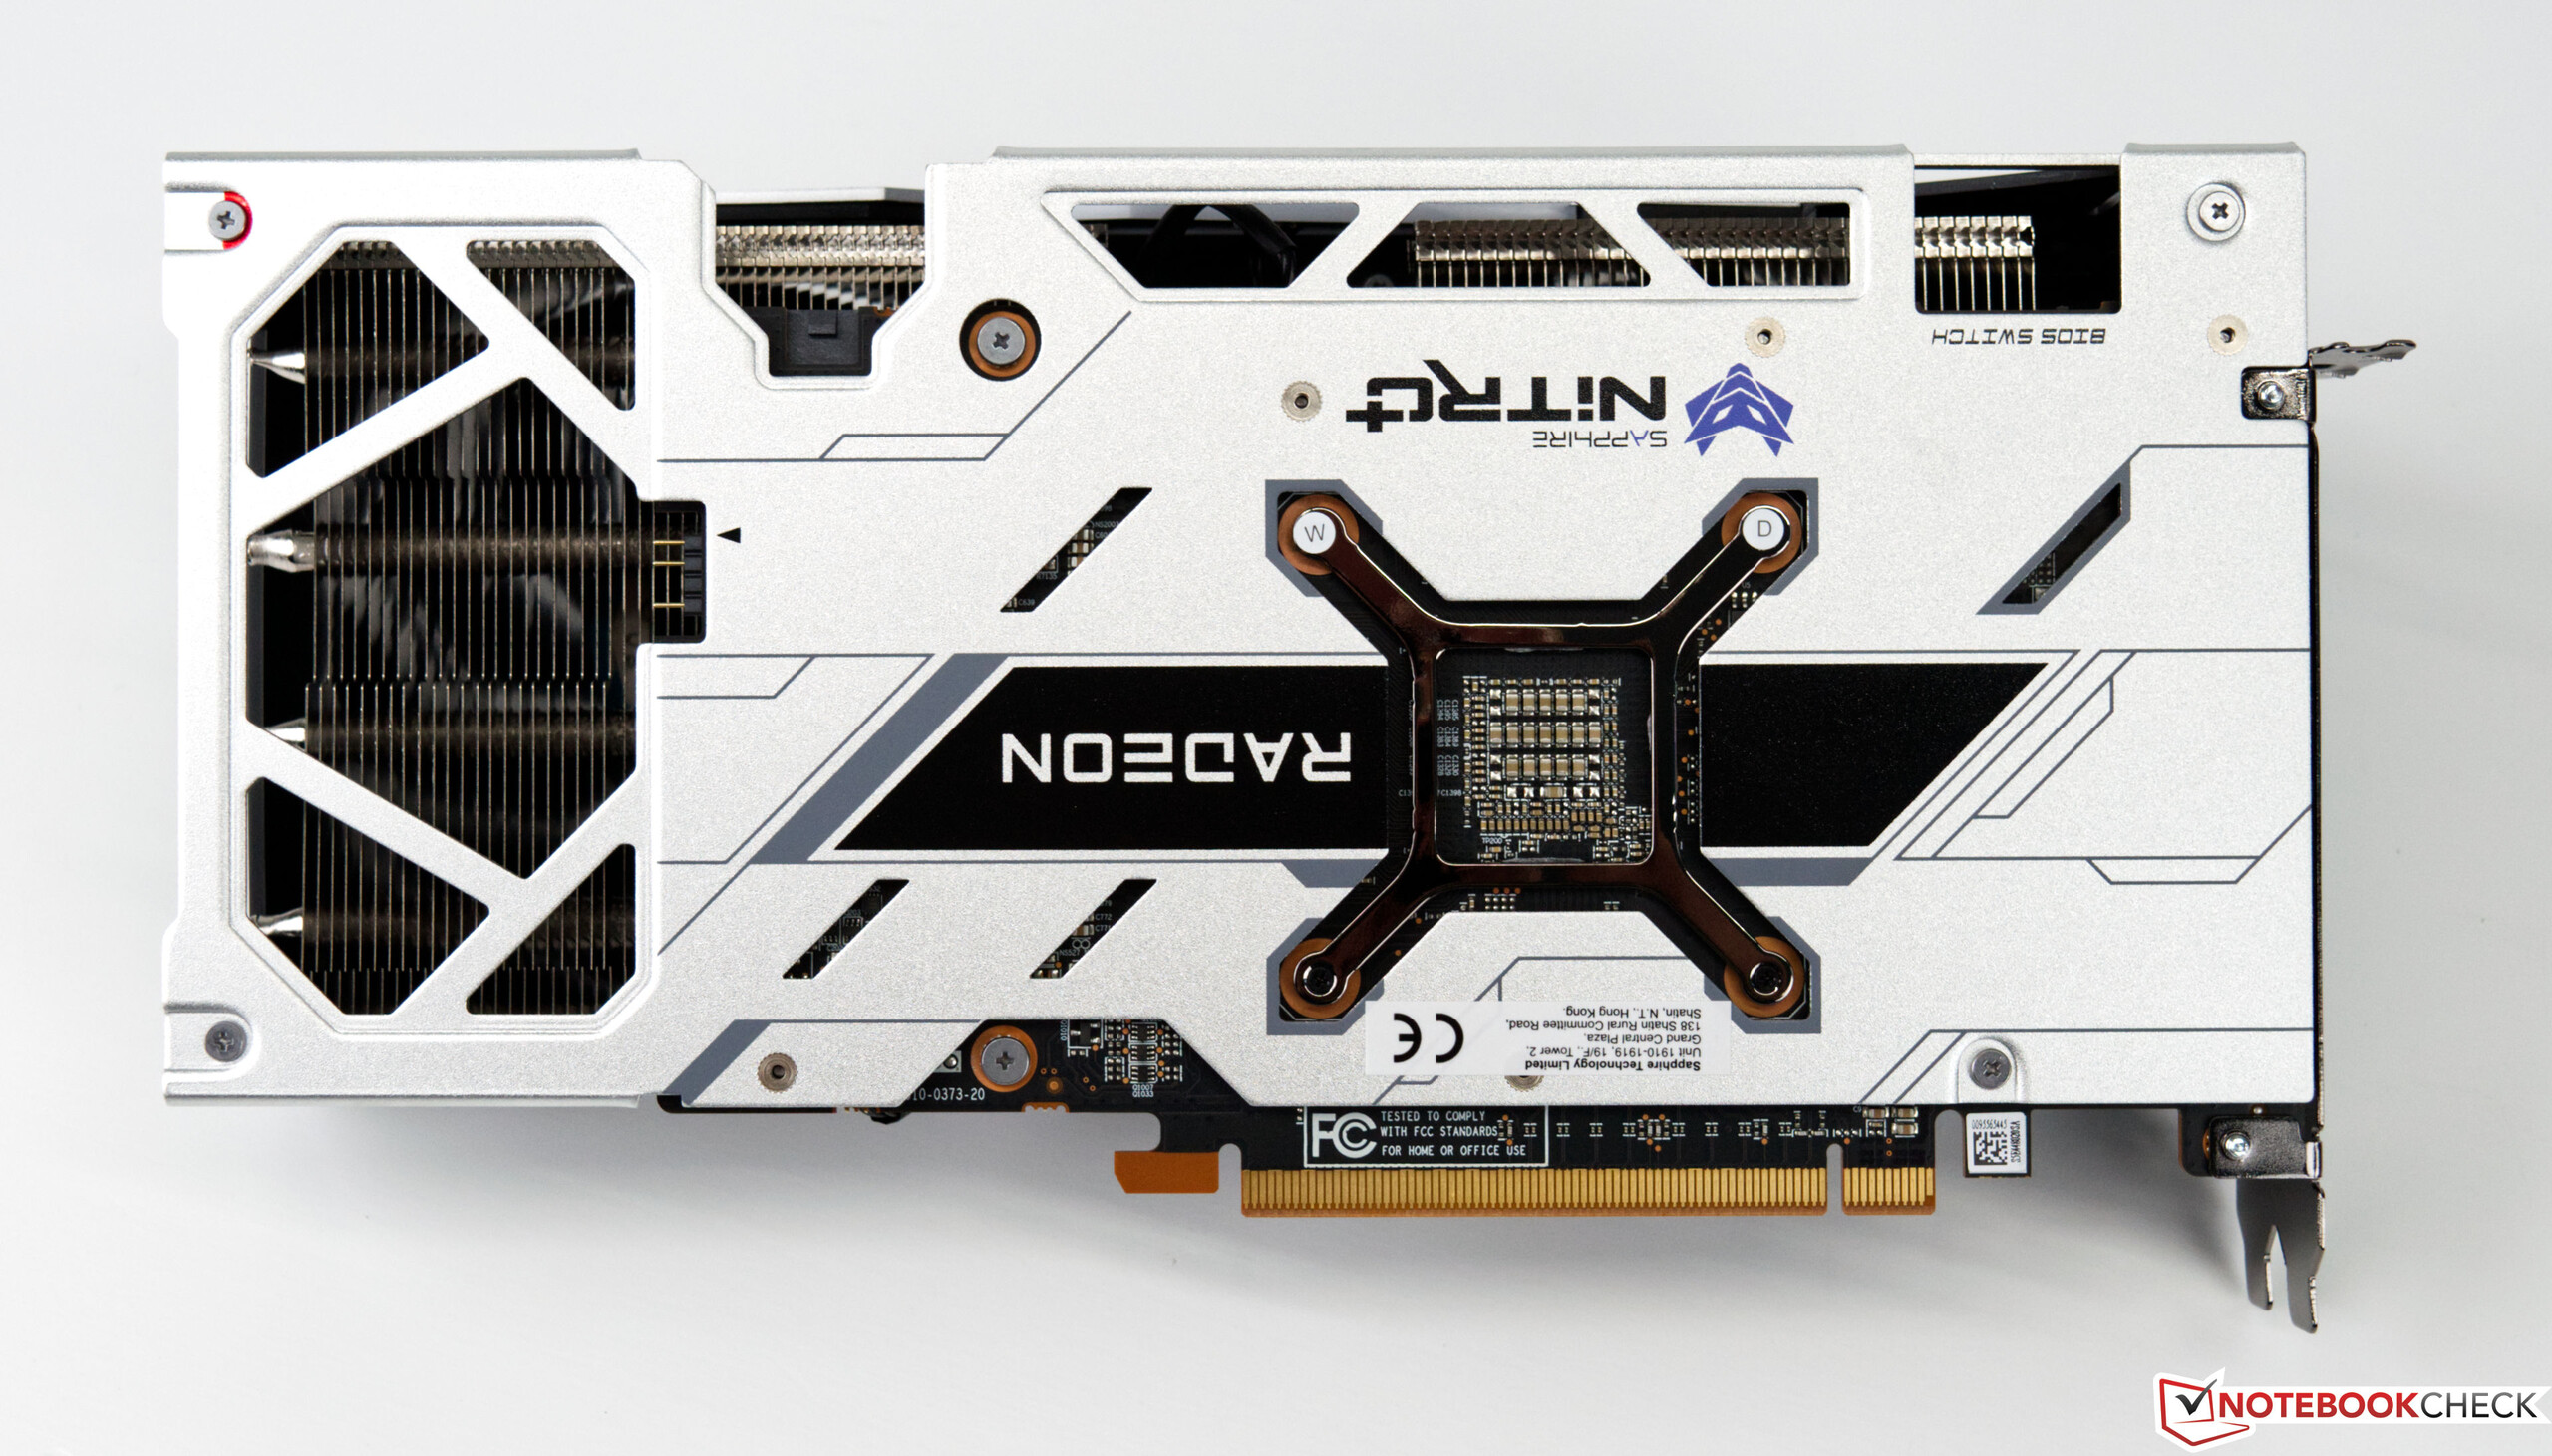
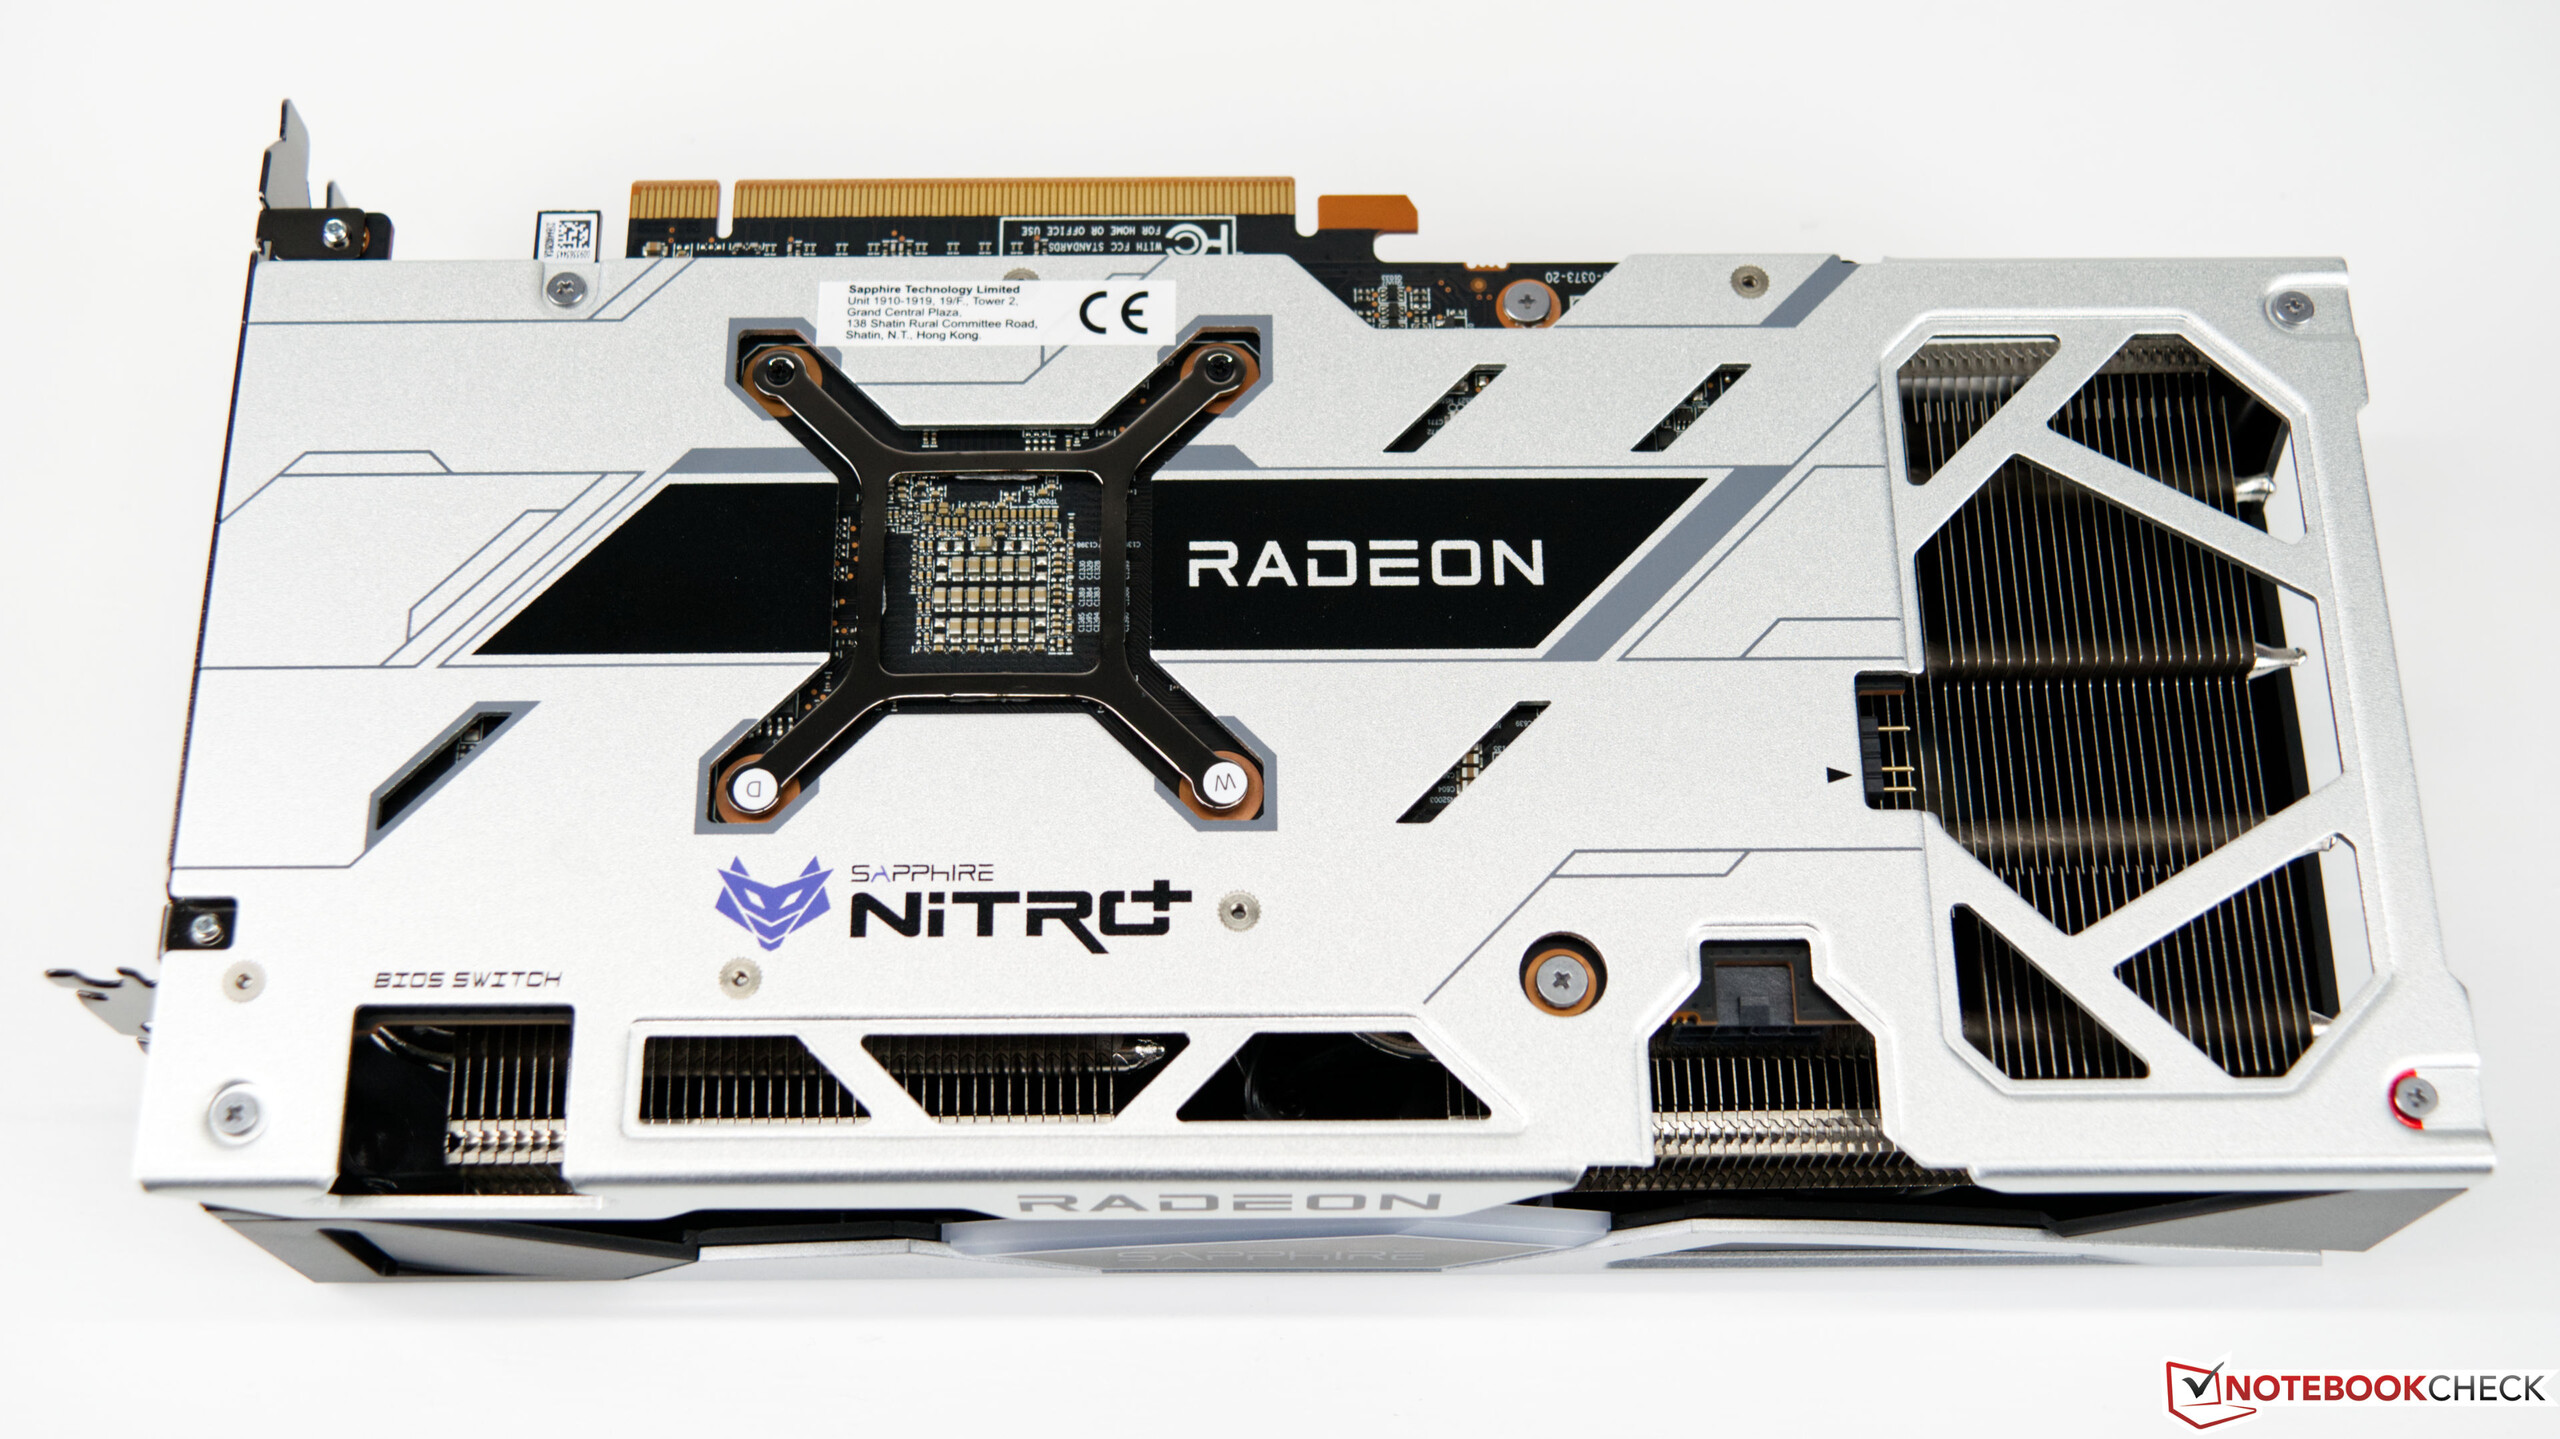
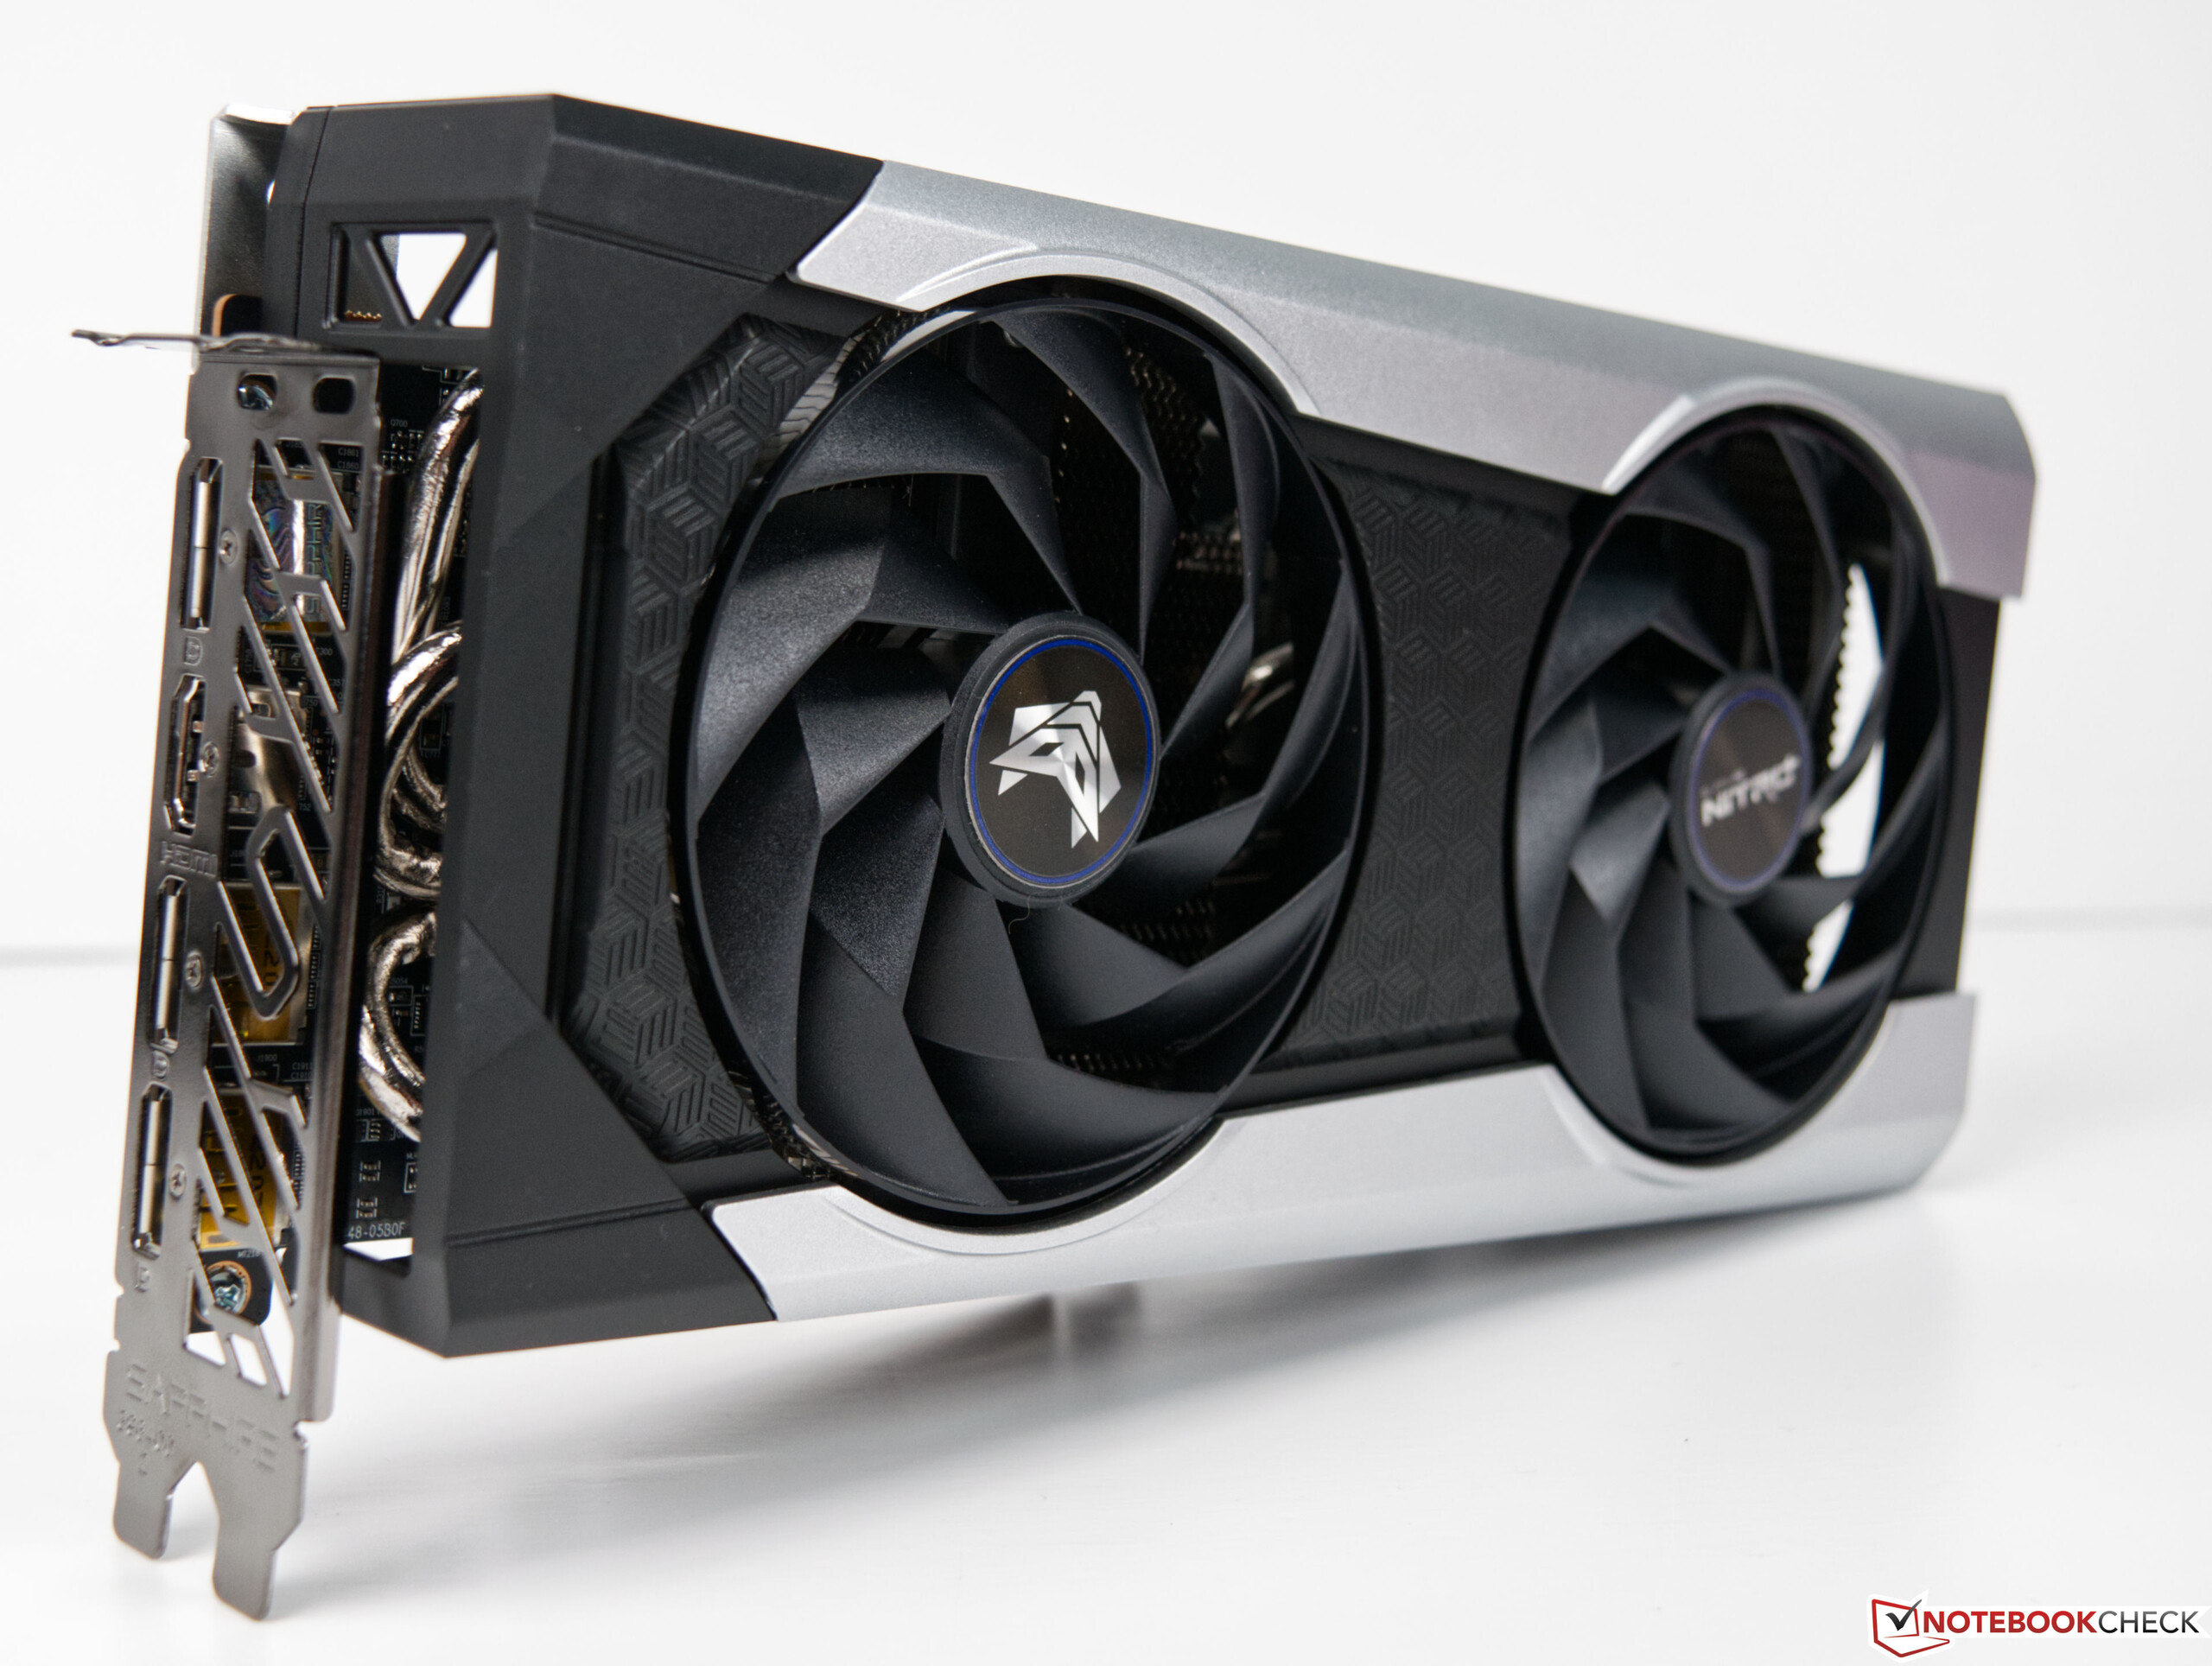
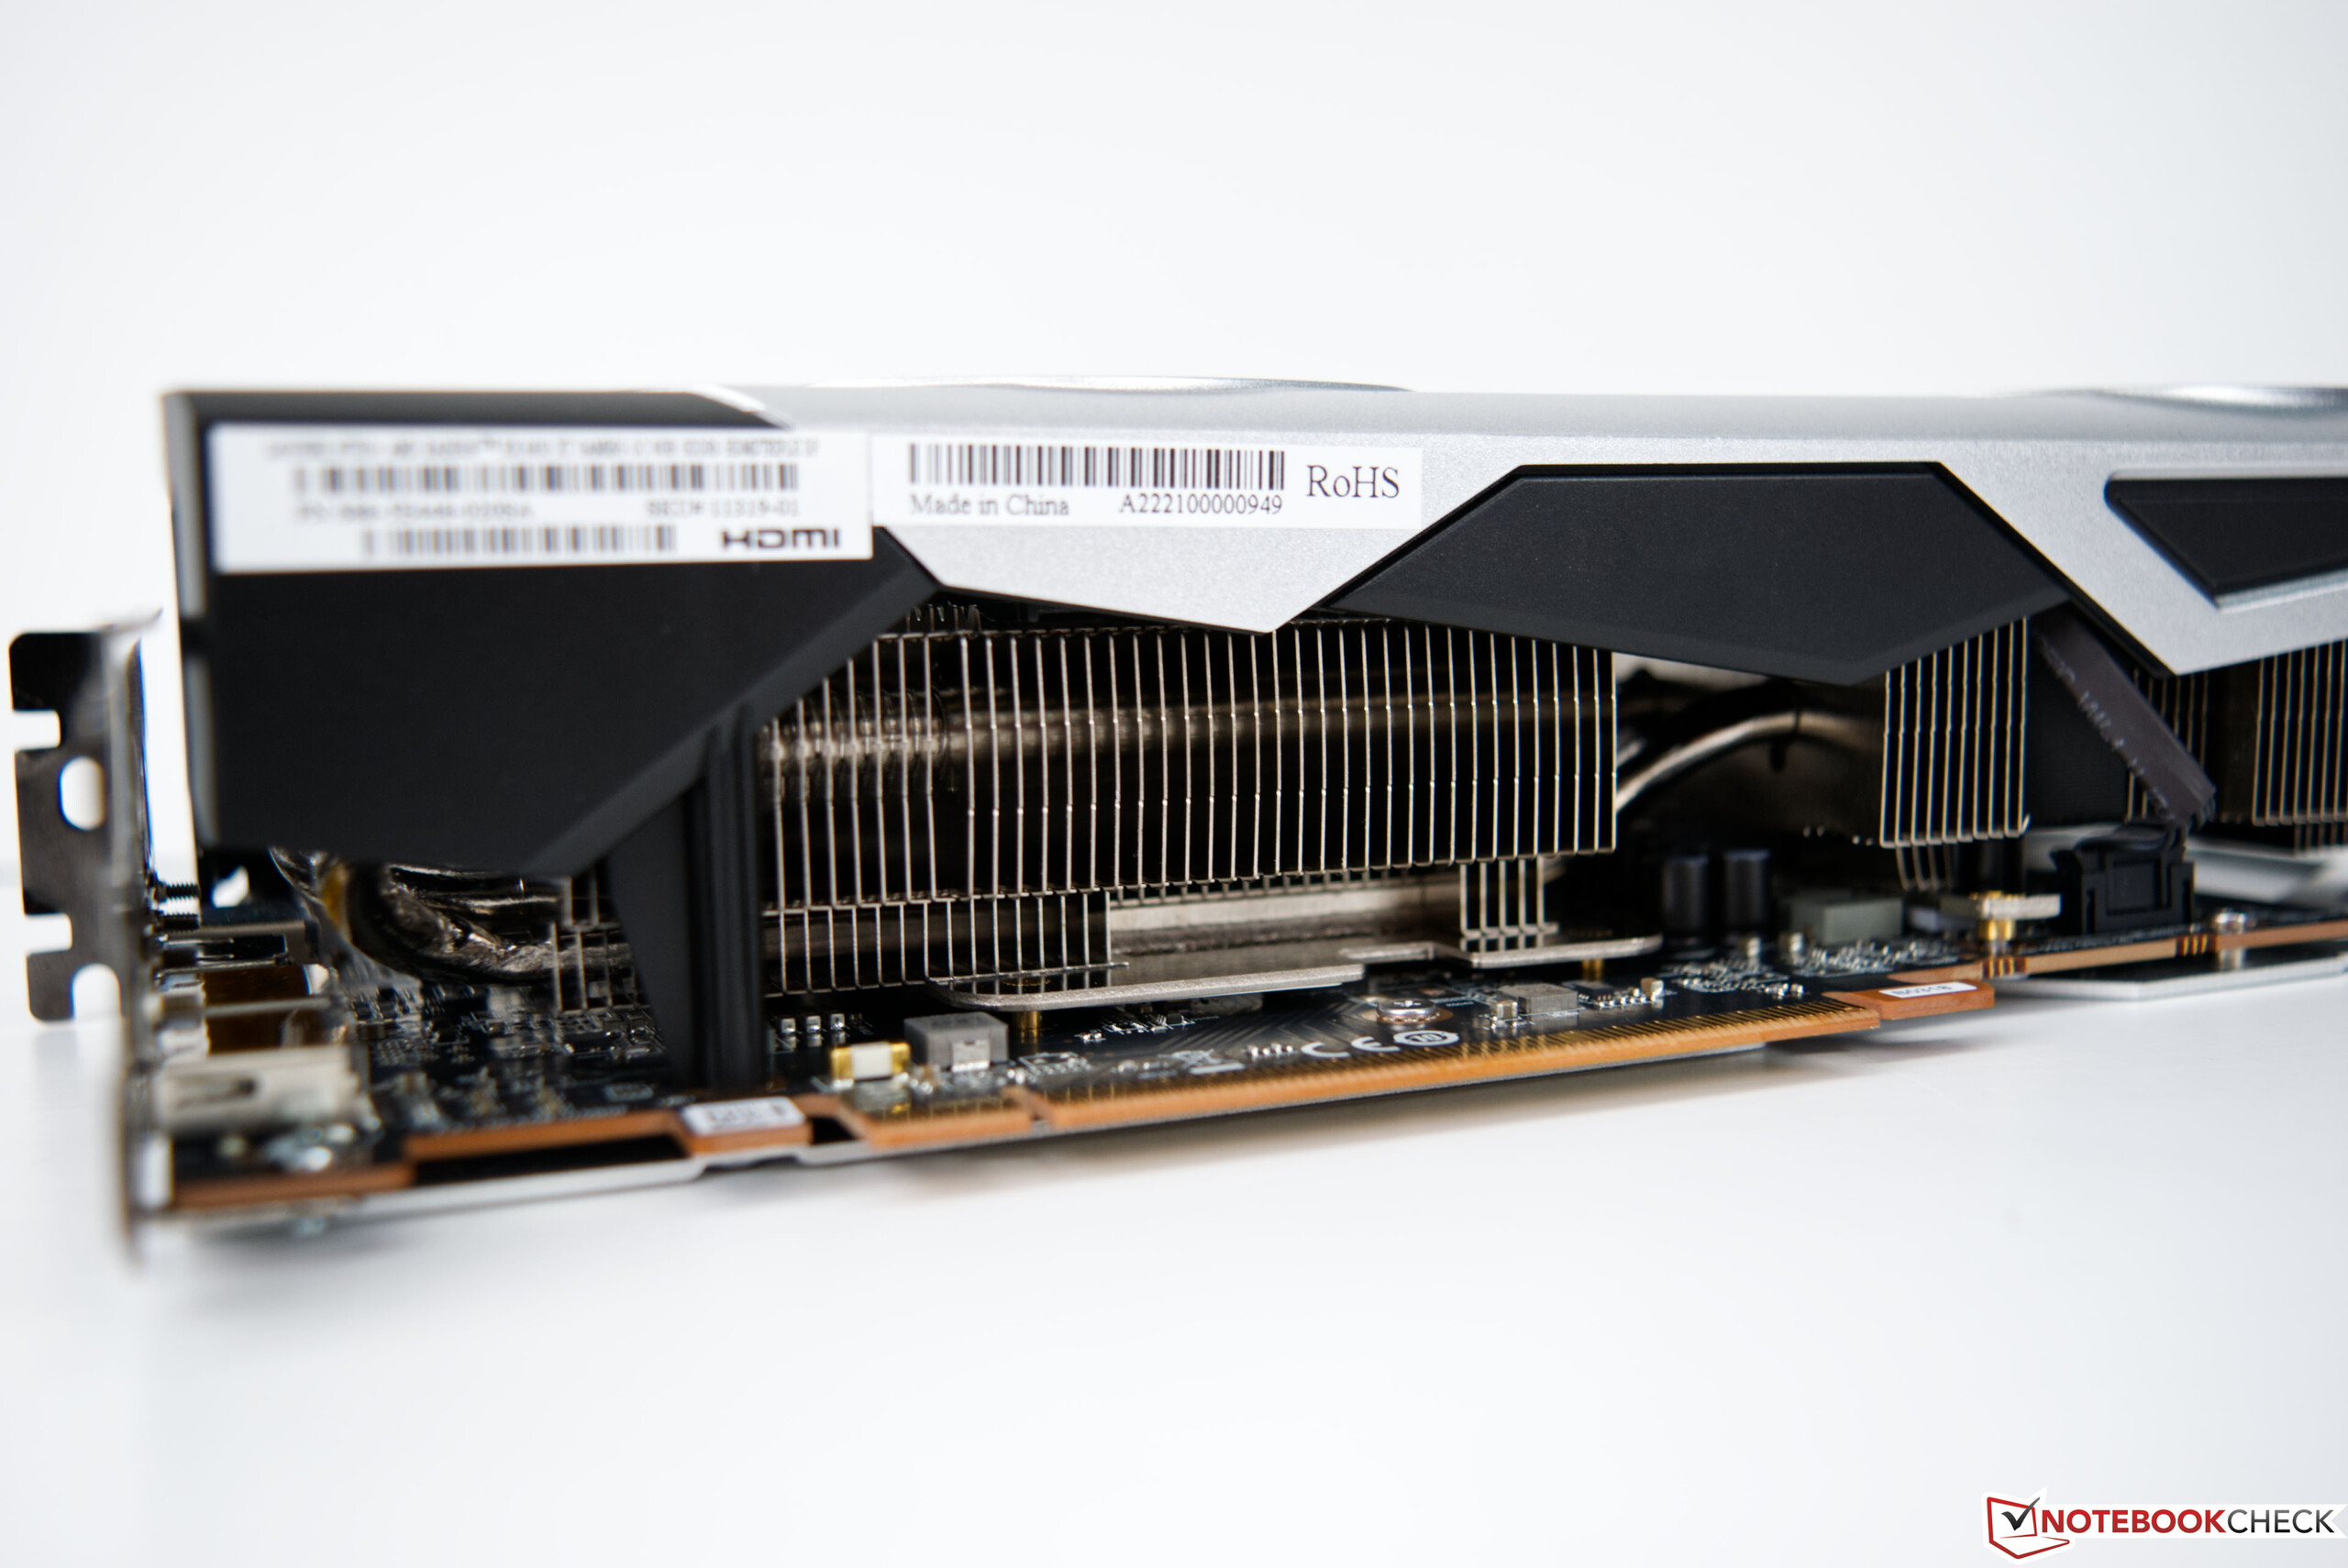
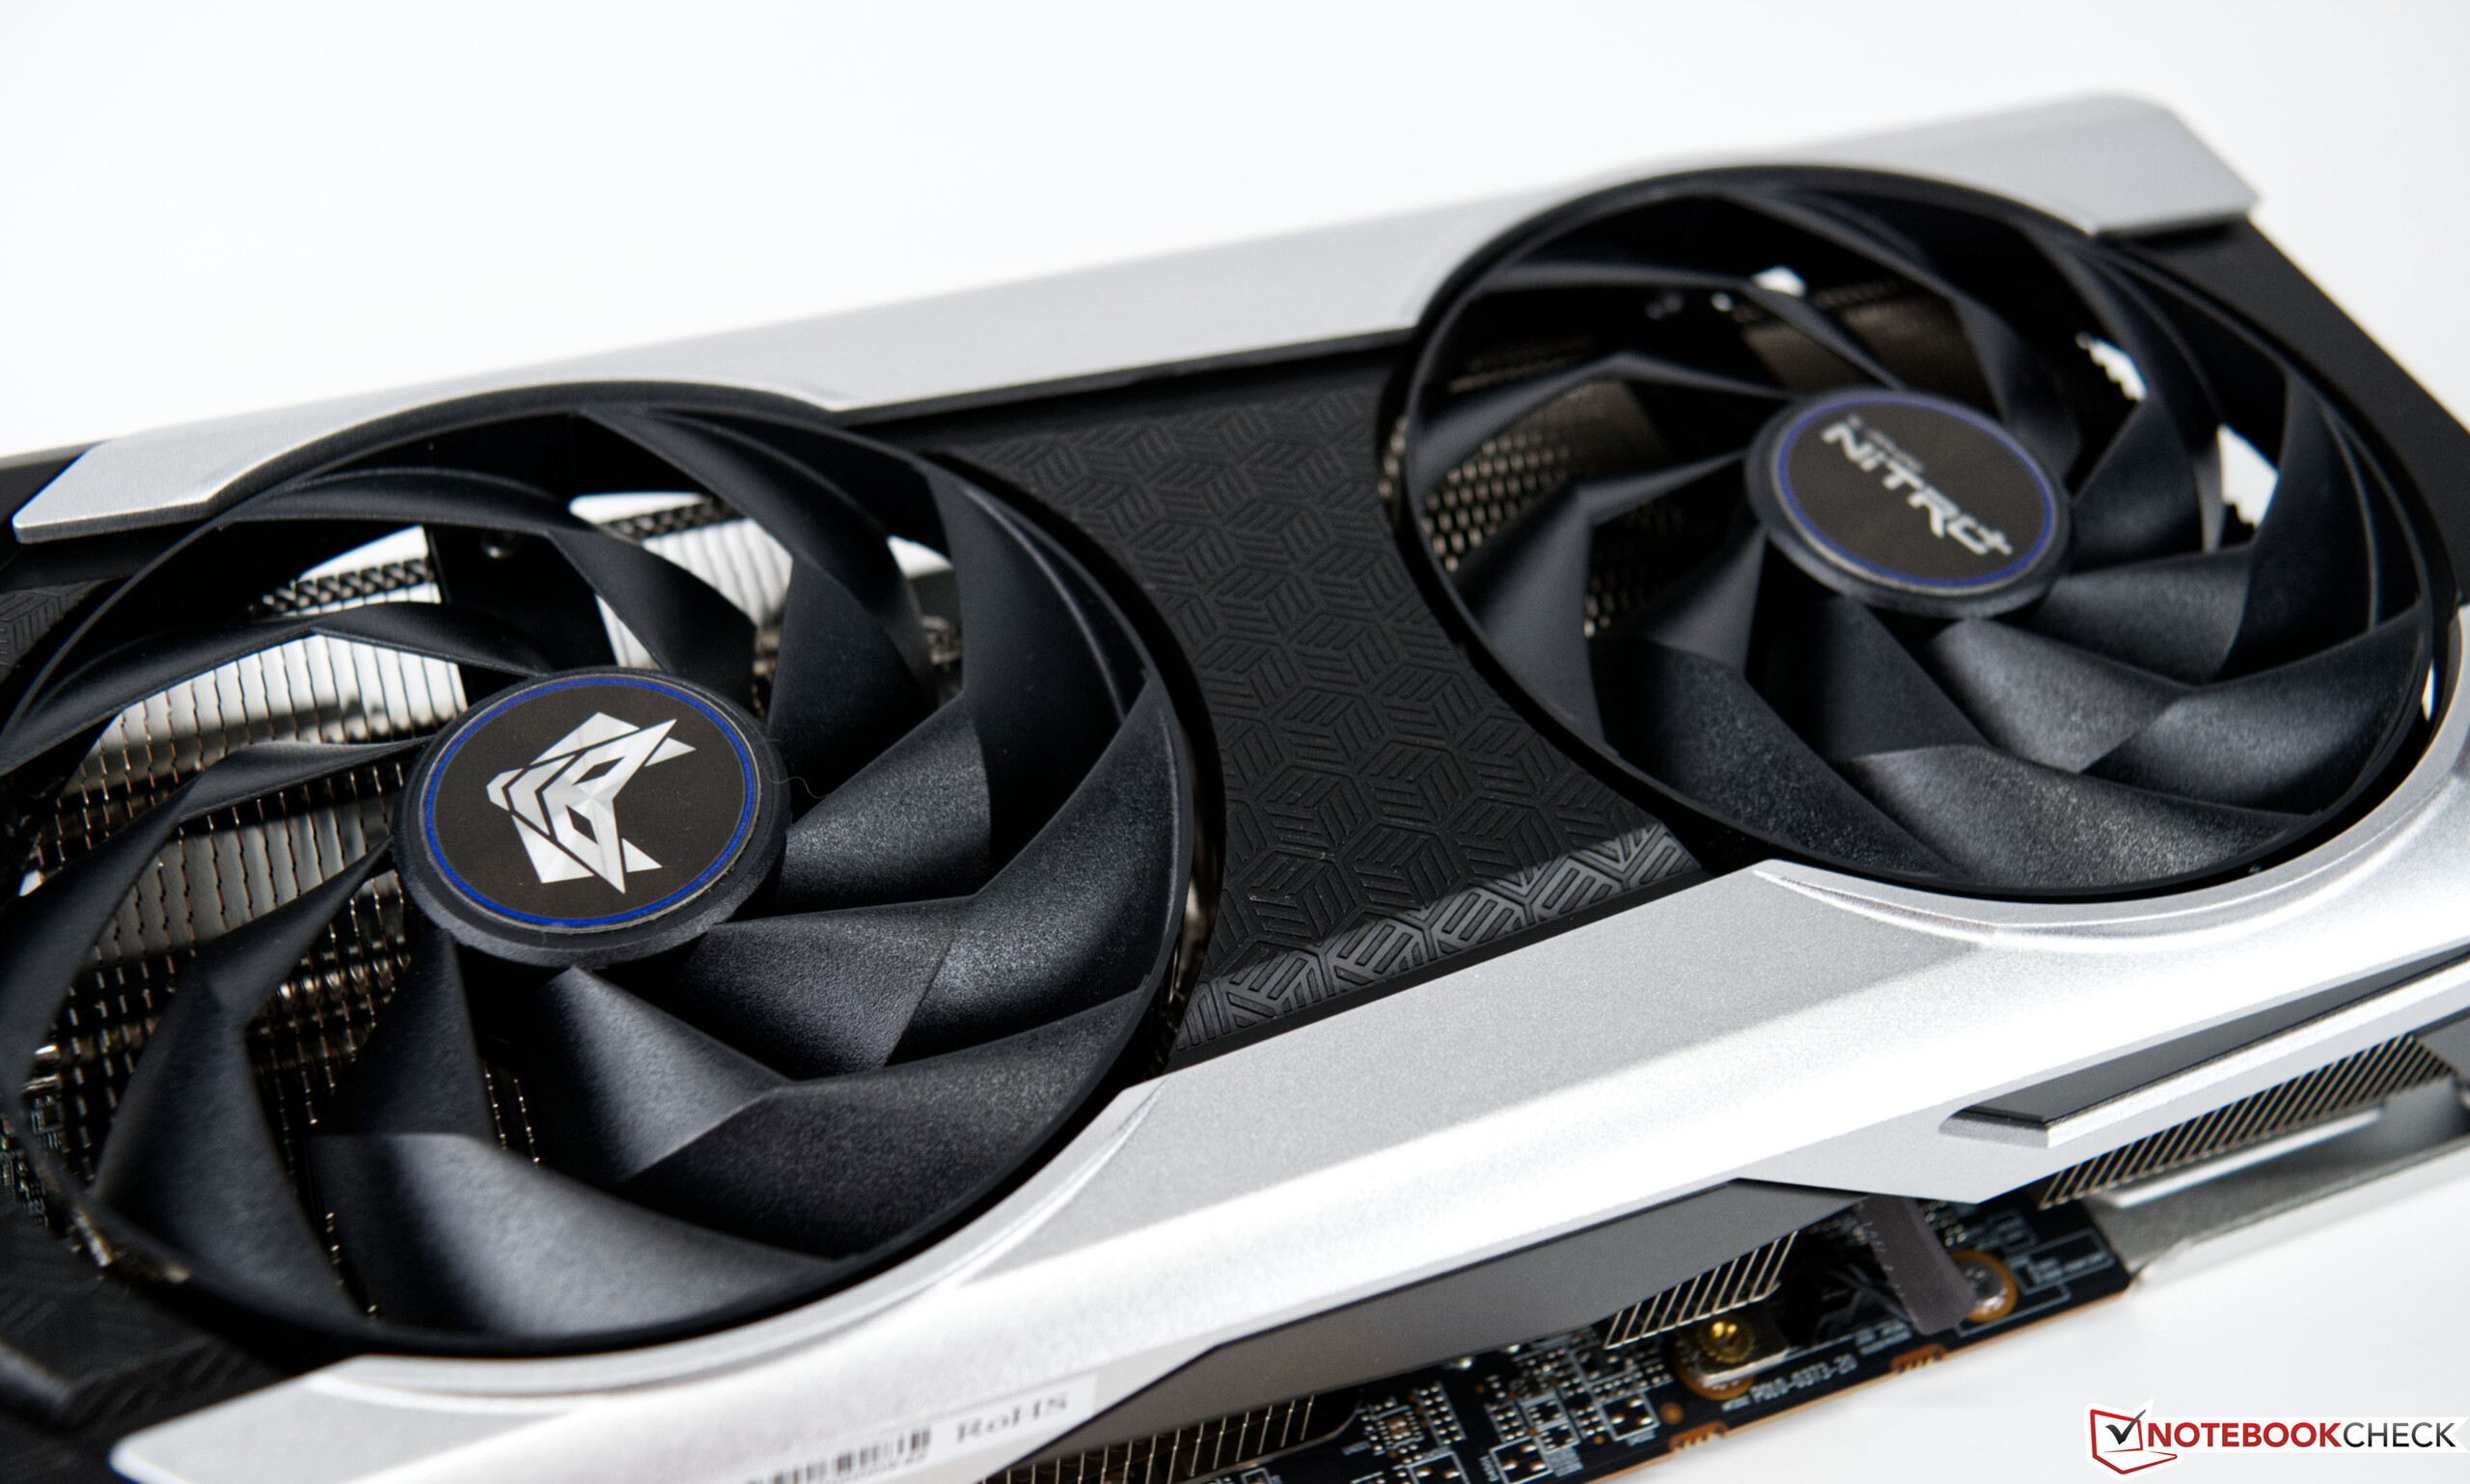
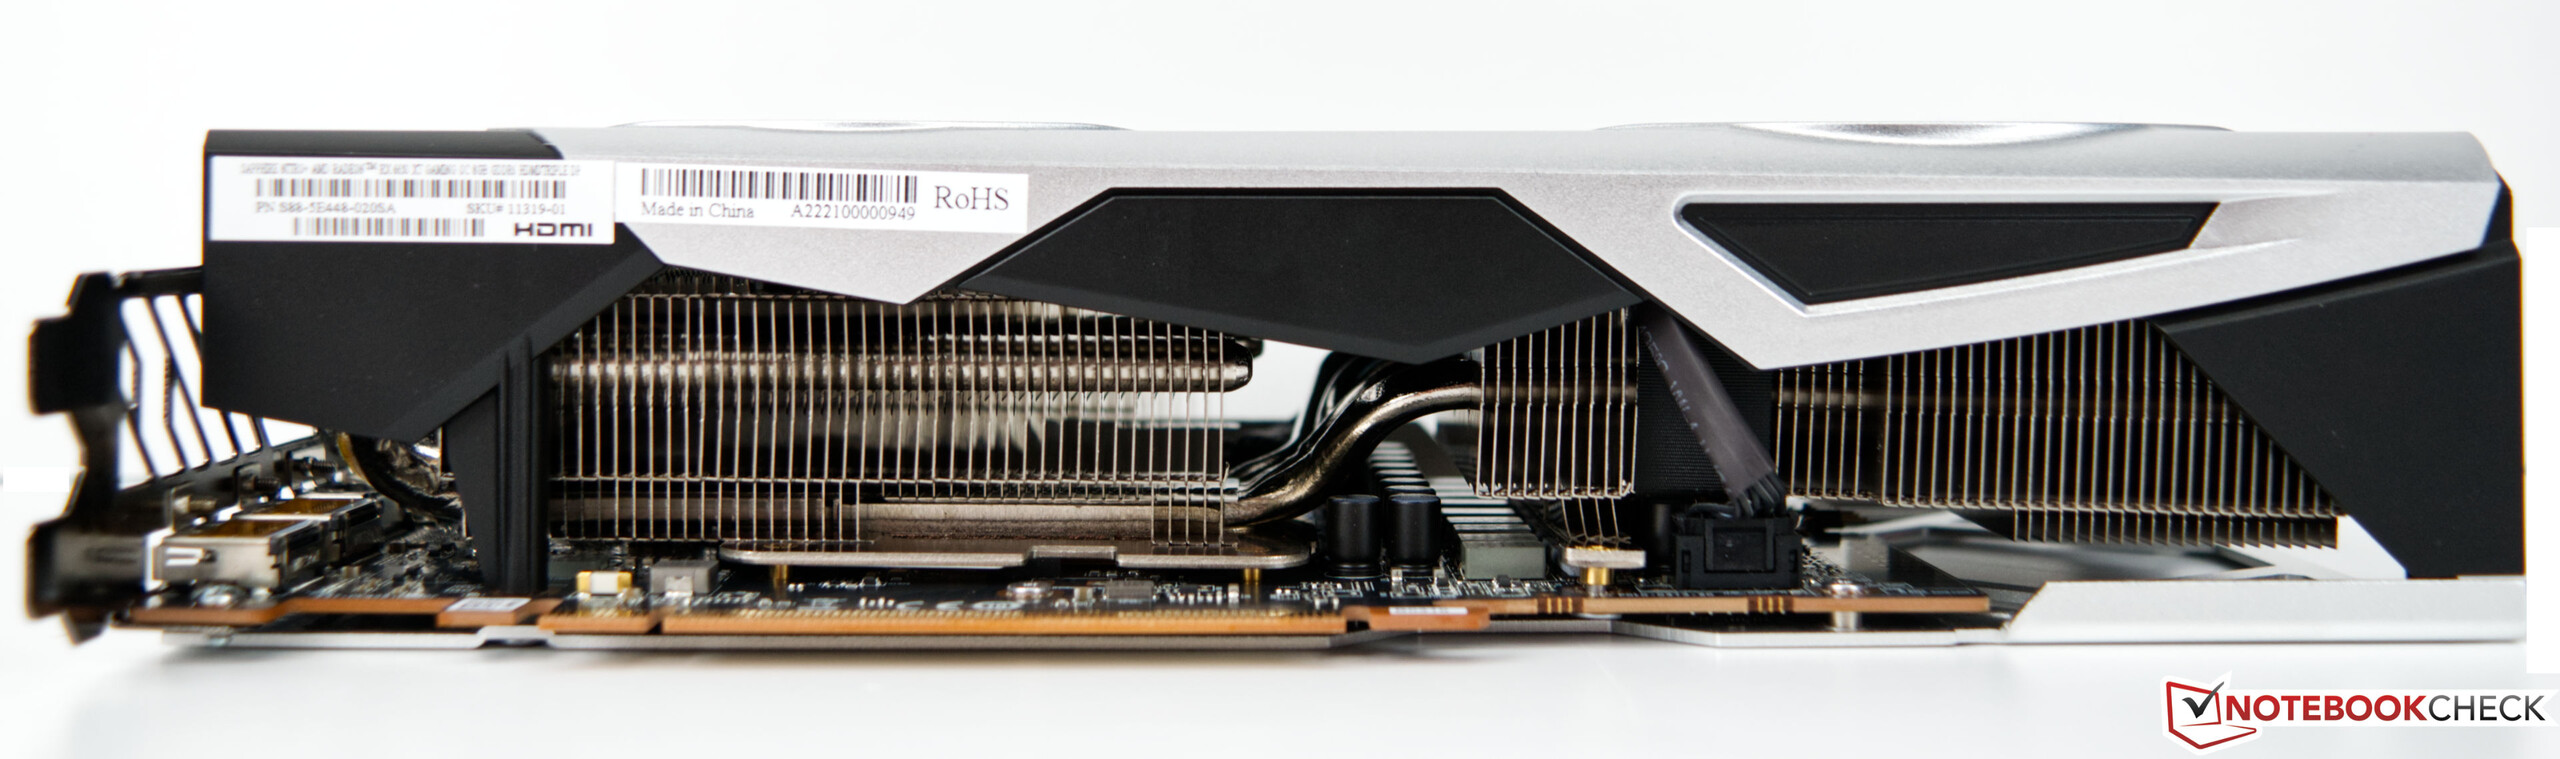
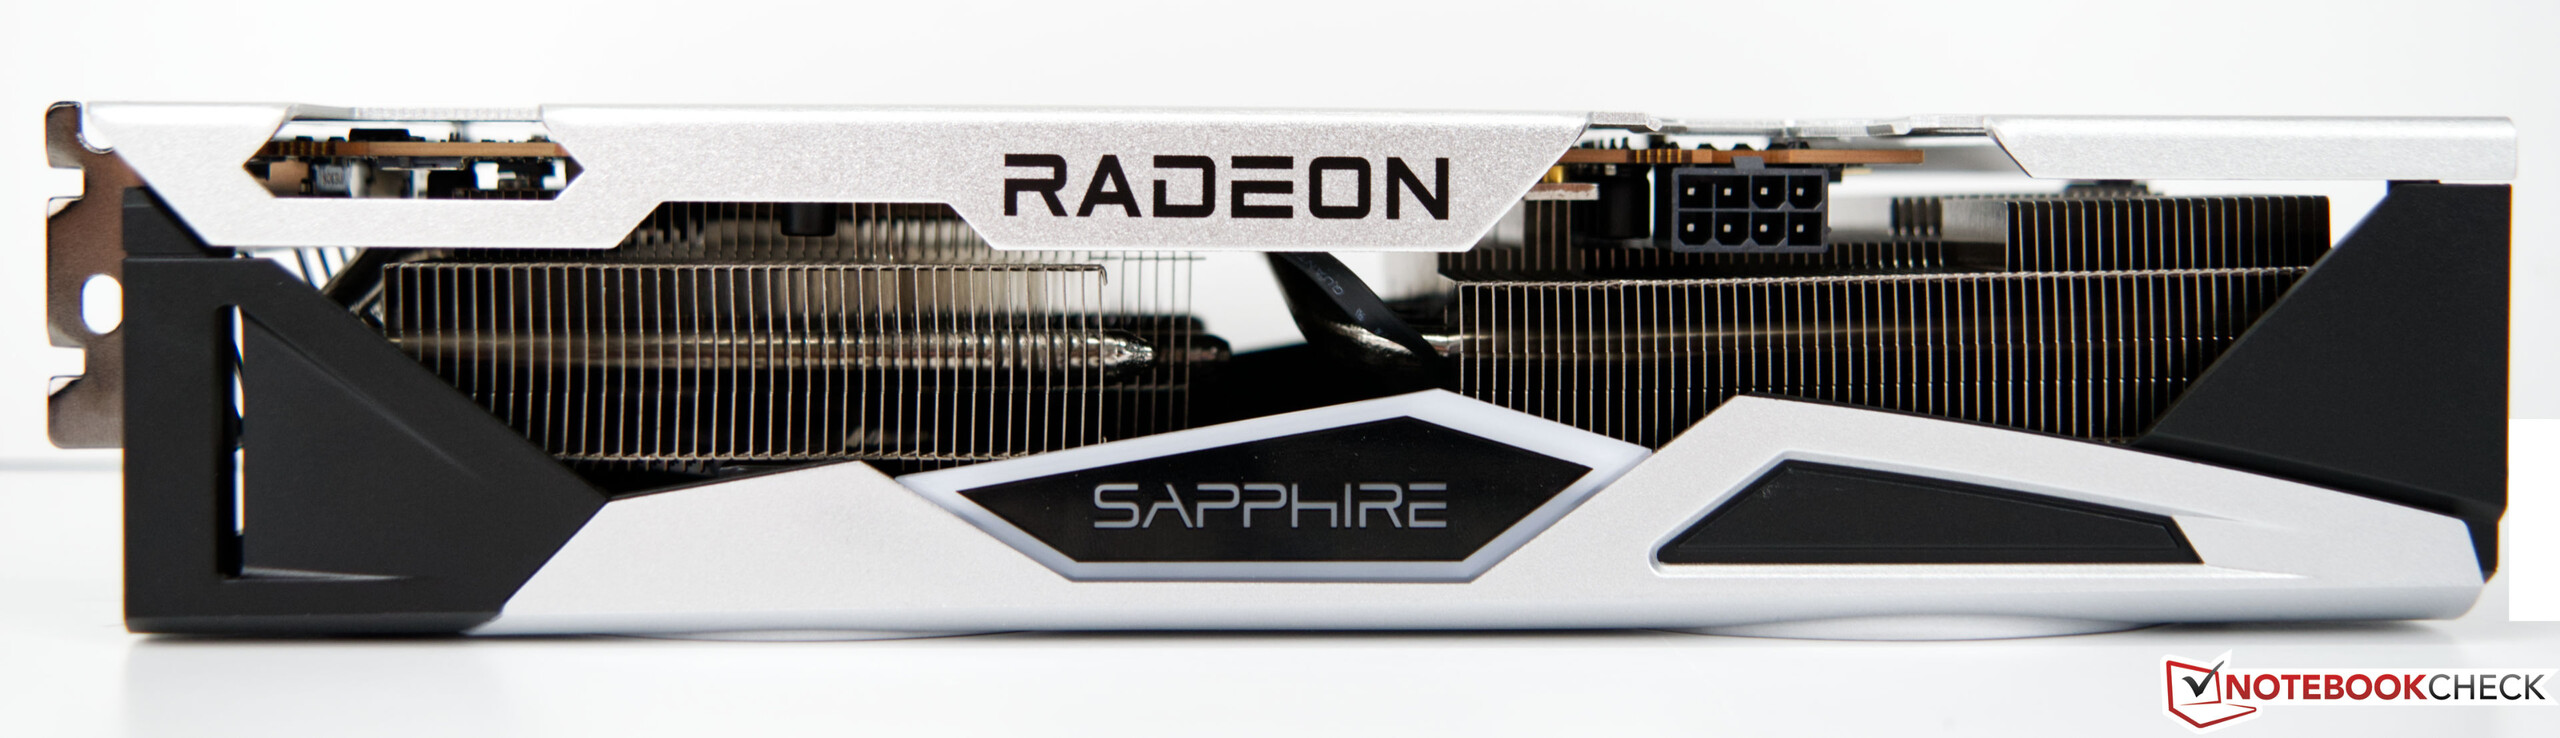
For this review, we make use of the Sapphire Nitro+ Radeon RX 6650 XT. This model fits right into the manufacturer's portfolio, with its well-known design. With the Nitro+ Radeon RX 6650 XT, Sapphire relies on a dual-fan design, which has often proven to be a good cooling solution in the past. Despite the moderate power consumption of 180 watts, Sapphire has installed a very bulky three-slot wide cooler. The length of the graphics card is a more standard 26 cm (10.2") and should therefore fit into most cases. Compatibility could be an issue when it comes to the width, however, and this should be considered.

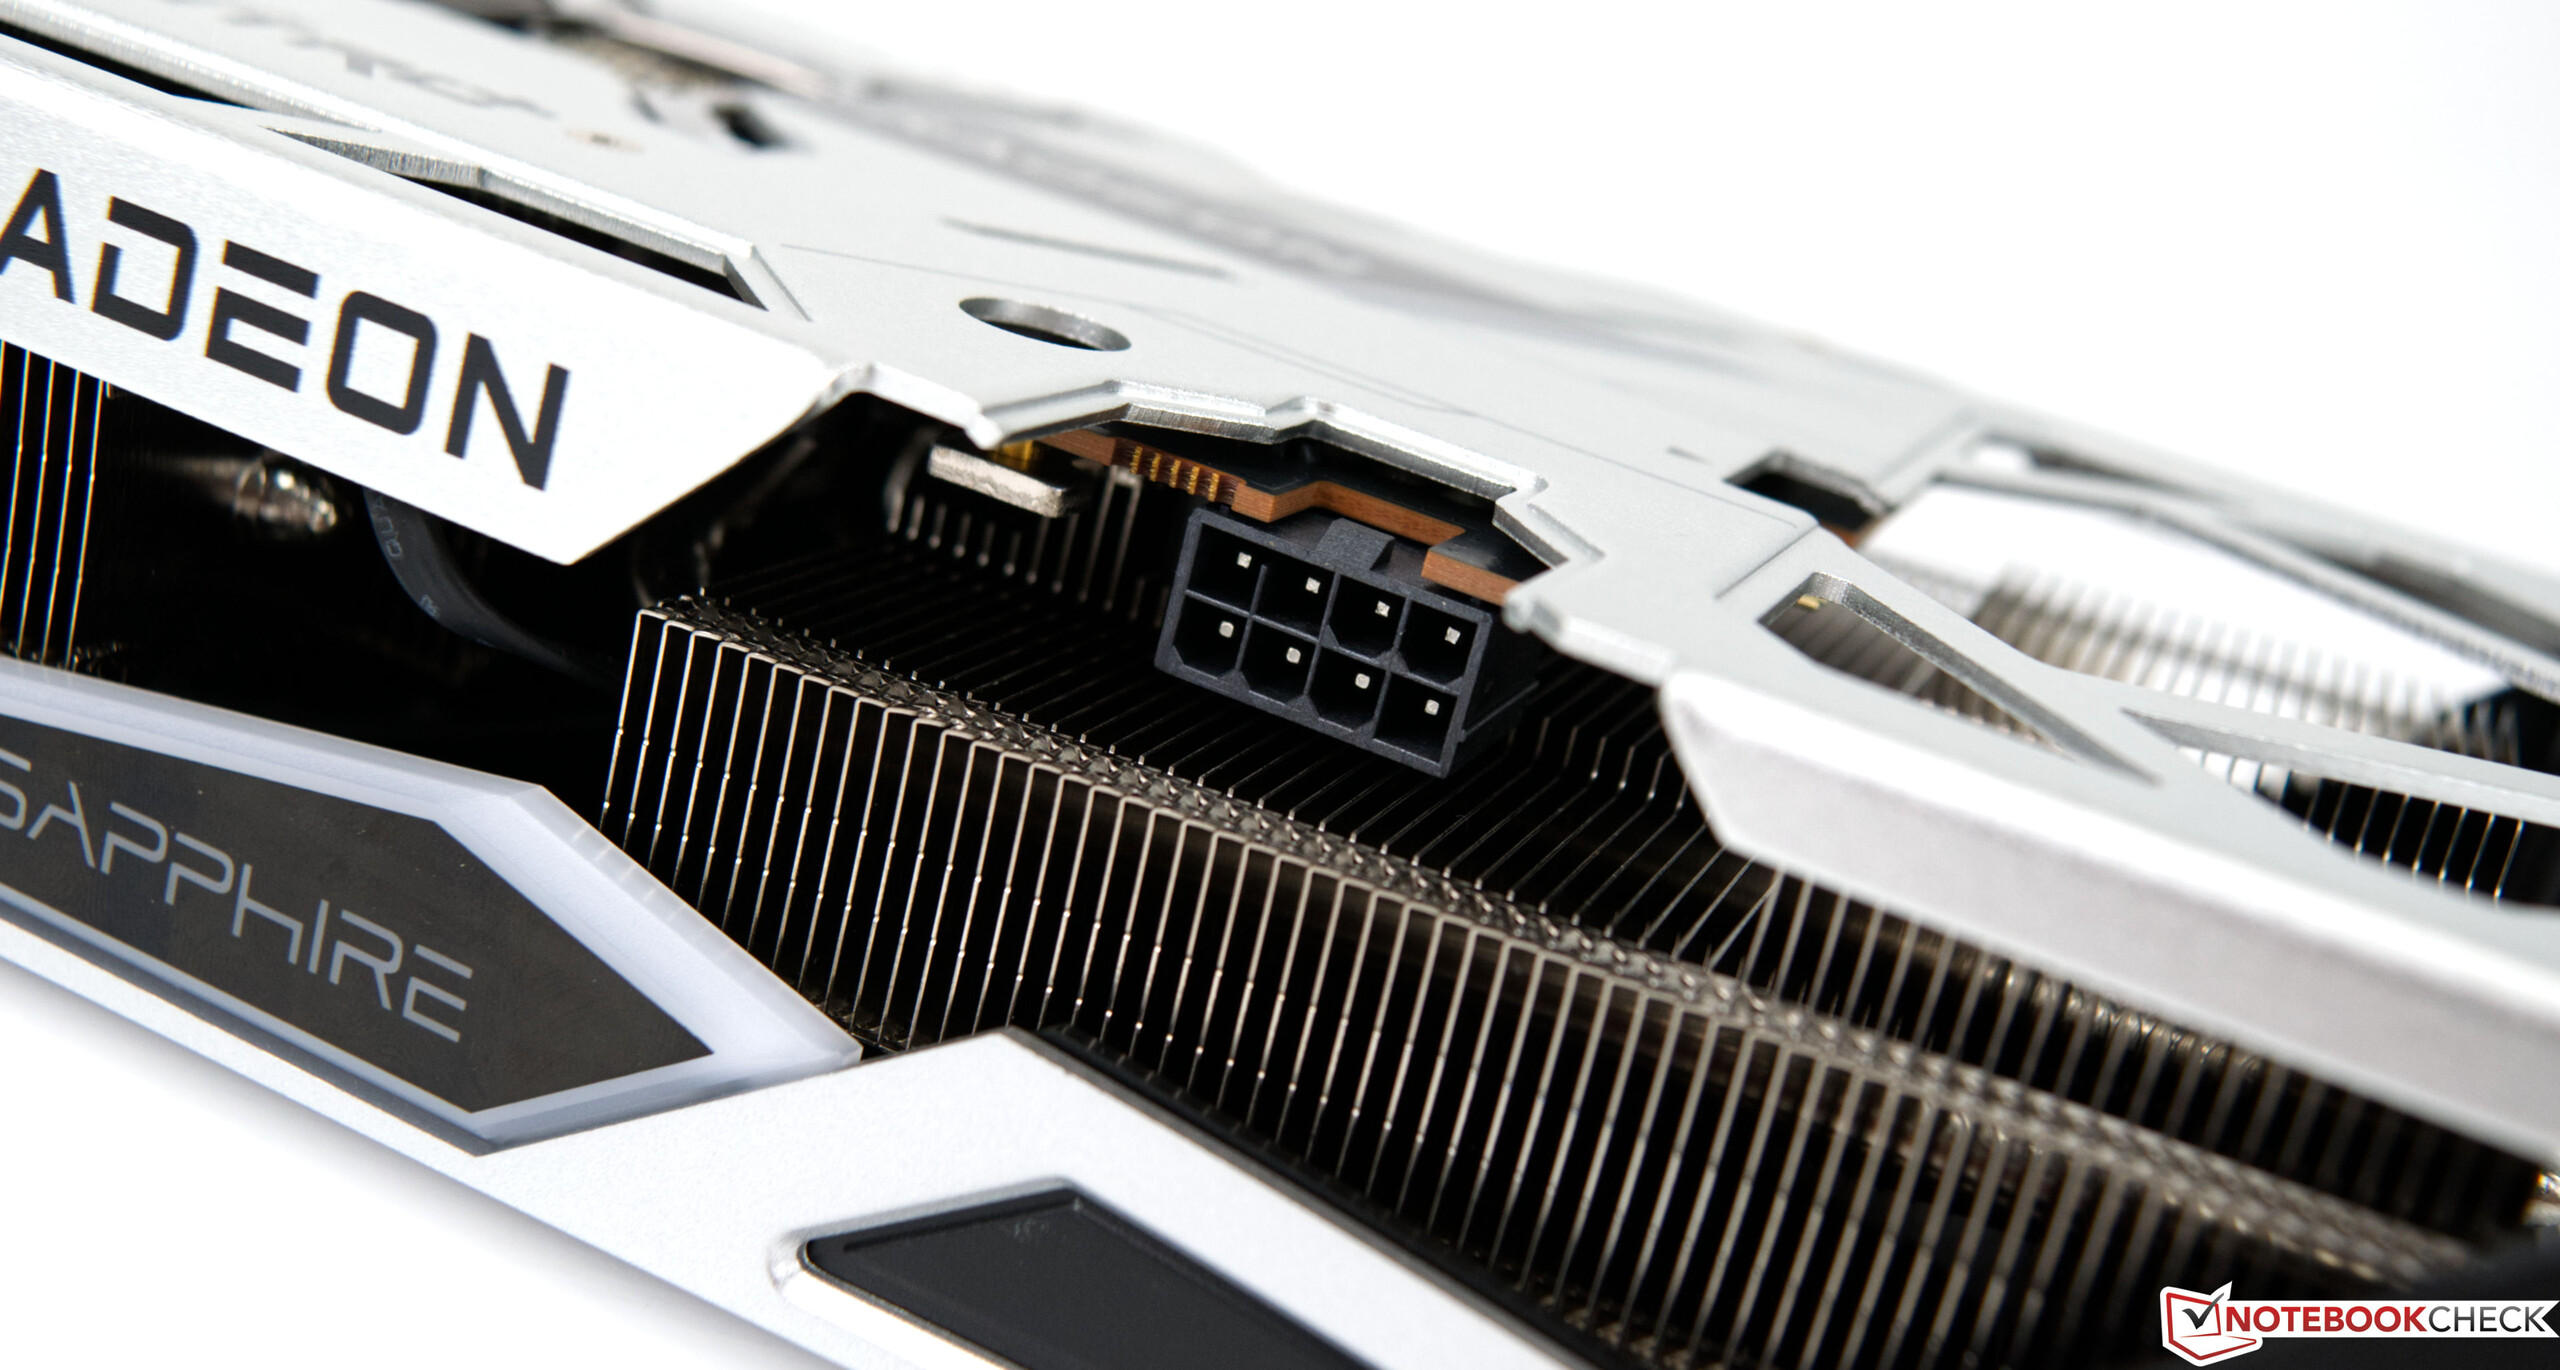
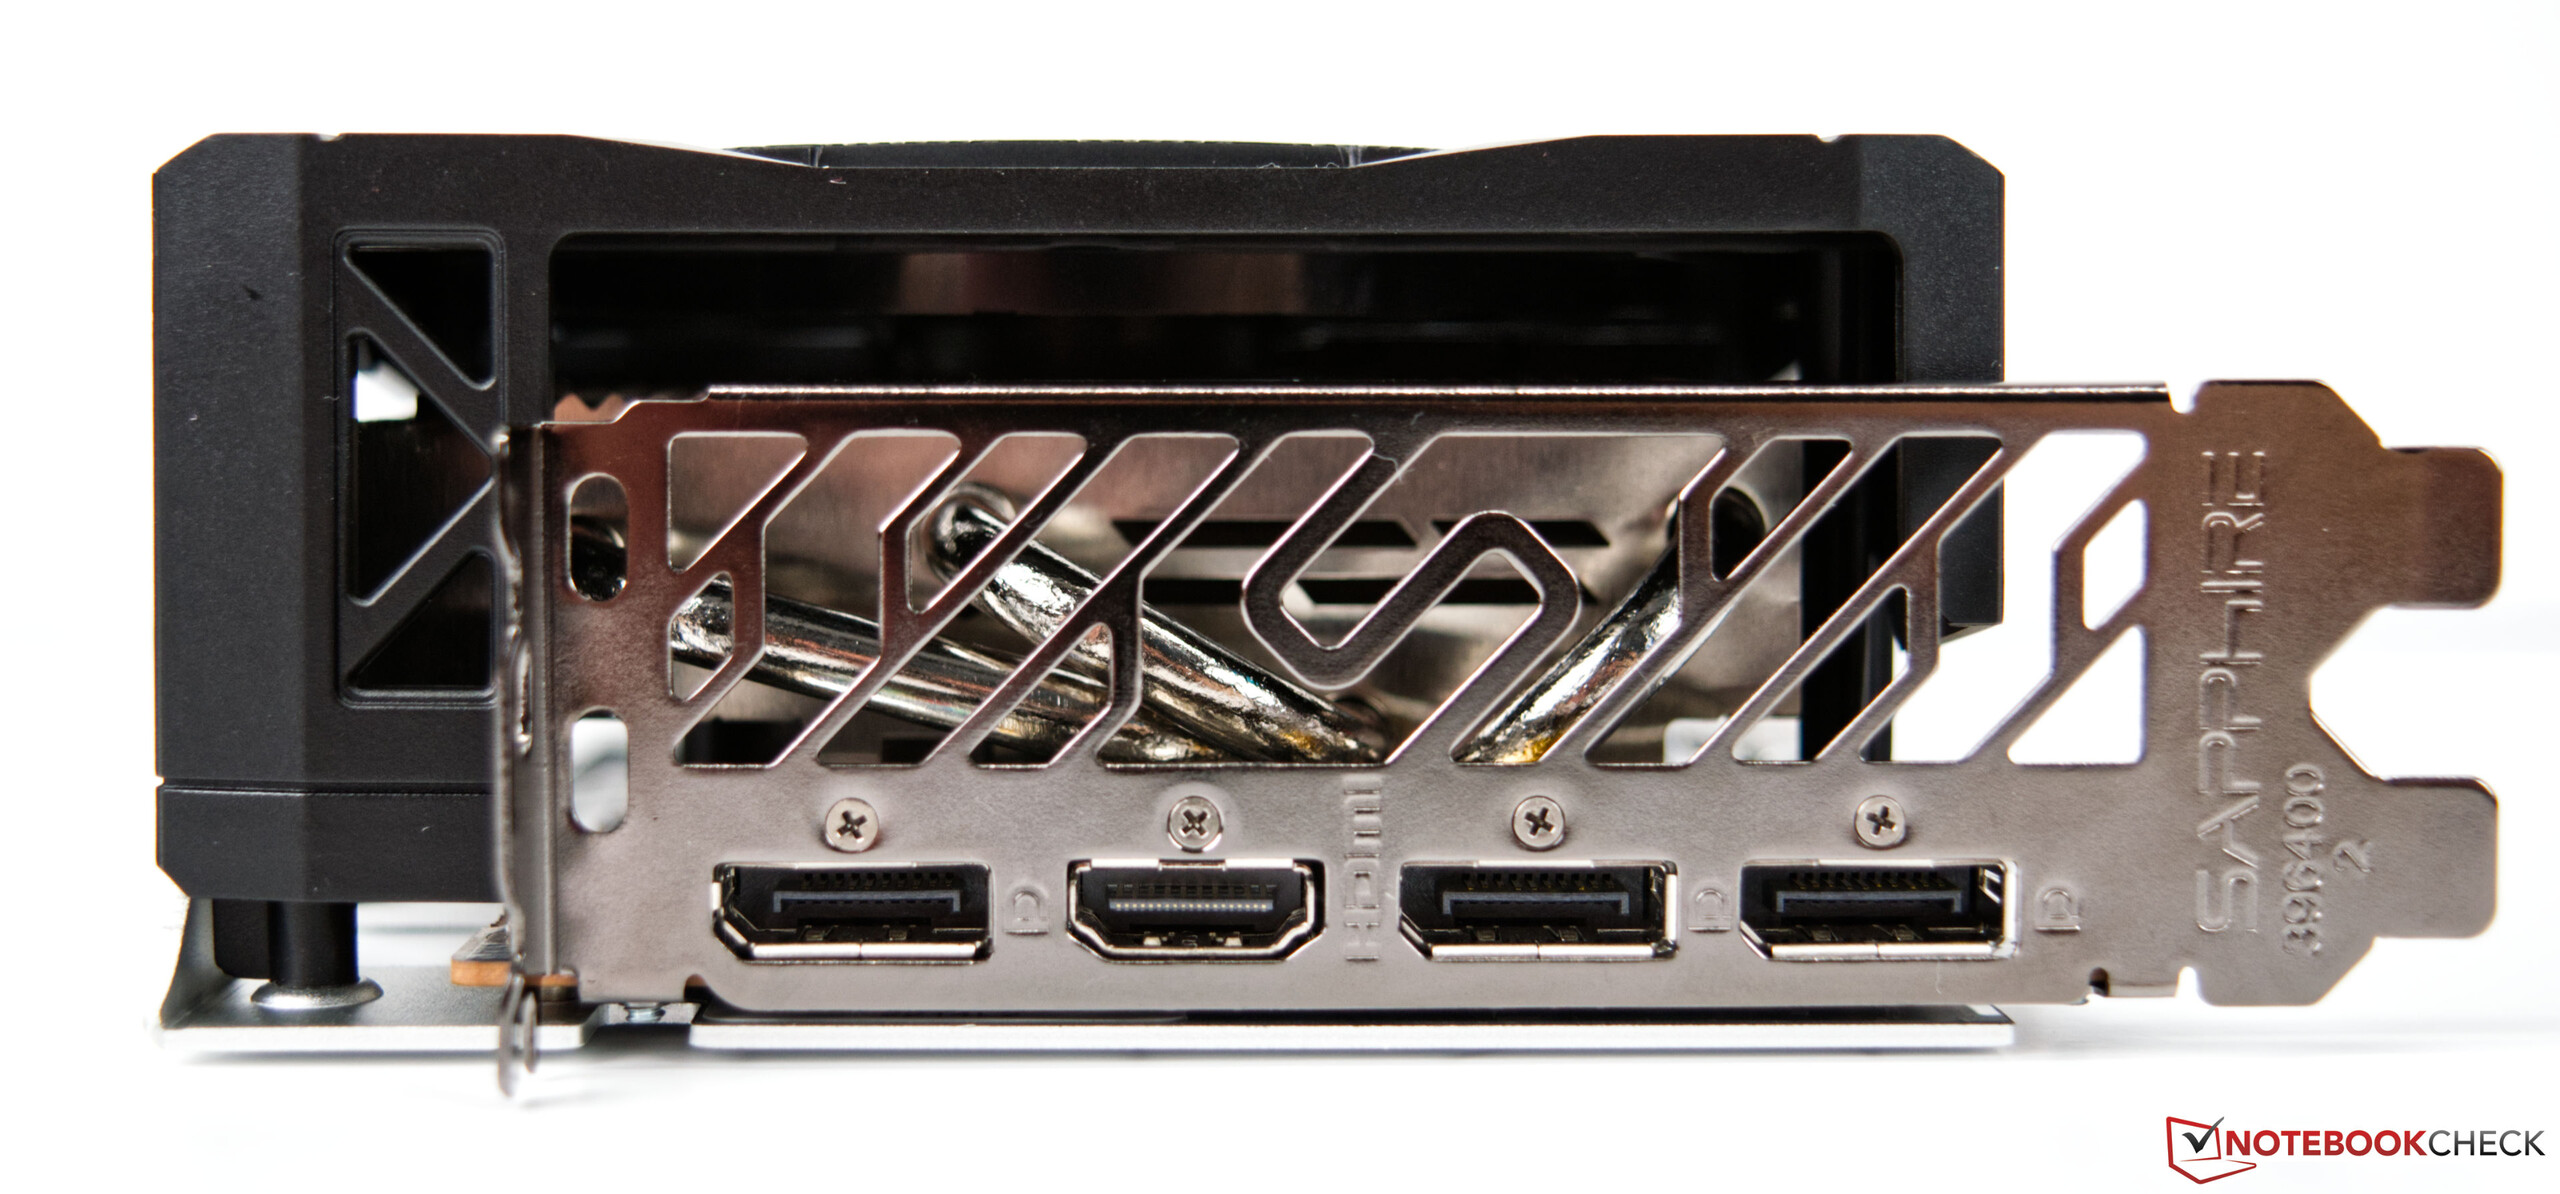
The external connections are quite standard, which means that we have 3x DisplayPort and 1x HDMI available. The triple-slot graphics card requires an internal 8-pin power connector for the power supply.

Comparison of the Radeon RX 6750 XT with other AMD-GPUs

Specifications Radeon RX 6950 XT Radeon RX 6900 XT Radeon RX 6800 XT Radeon RX 6800 Radeon RX 6750 XT Radeon RX 6700 XT Radeon RX 6650 XT Radeon RX 6600 XT
GPU Navi 21 XTX Navi 21 XTX Navi 21 XT Navi 21 XL Navi 22 Navi 22 Navi 23 Navi 23
Manufacturing Process 7 nm 7 nm 7 nm 7 nm 7 nm 7 nm 7 nm 7 nm
Compute Units 80 80 72 60 40 40 32 32
Shading Units 5,120 5,120 4,608 3,840 2,560 2,560 2,048 2,048
Texture Mapping Units 320 320 288 240 160 160 128 128
Ray Accelerators 80 80 72 60 40 40 32 32
Base Clock 1,925 MHz 1,825 MHz 1,825 MHz 1,700 MHz 2,150 MHz 2,321 MHz 2,055 MHz 1,968 MHz
Game Clock 2,116 MHz 2,015 MHz 2,015 MHz 1,815 MHz 2,495 MHz 2,424 MHz 2,410 MHz 2,359 MHz
Boost Clock 2,324 MHz 2,250 MHz 2,250 MHz 2,105 MHz 2,600 MHz 2,581 MHz 2,635 MHz 2,589 MHz
Infinity Cache 128 MB 128 MB 128 MB 128 MB 96 MB 96 MB 32 MB 32 MB
Memory Bus Width 256-bit 256-bit 256-bit 256-bit 192-bit 192-bit 128-bit 128-bit
Memory Bandwidth 576 GB/s 512 GB/s 512 GB/s 512 GB/s 432 GB/s 384 GB/s 280,3 GB/s 256 GB/s
Memory Size 16 GB GDDR6 16 GB GDDR6 16 GB GDDR6 16 GB GDDR6 12 GB GDDR6 12 GB GDDR6 8 GB GDDR6 8 GB GDDR6
TBP 335 W 300 W 300 W 250 W 250 W 230 W 180 W 160 W
Sapphire Nitro+ Radeon RX 6650 XT

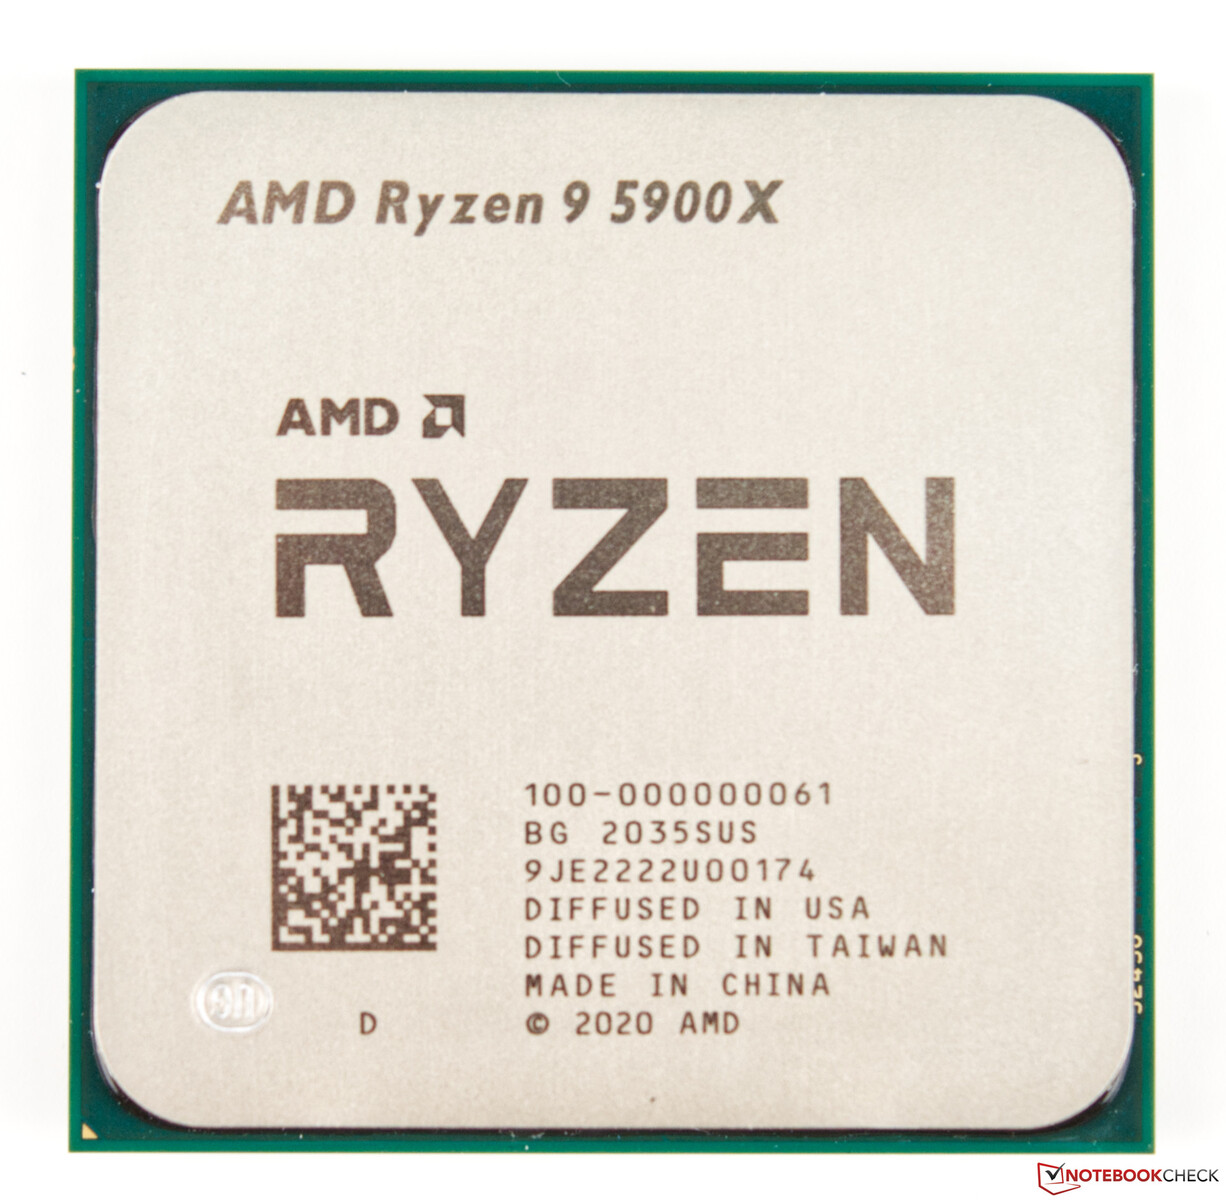
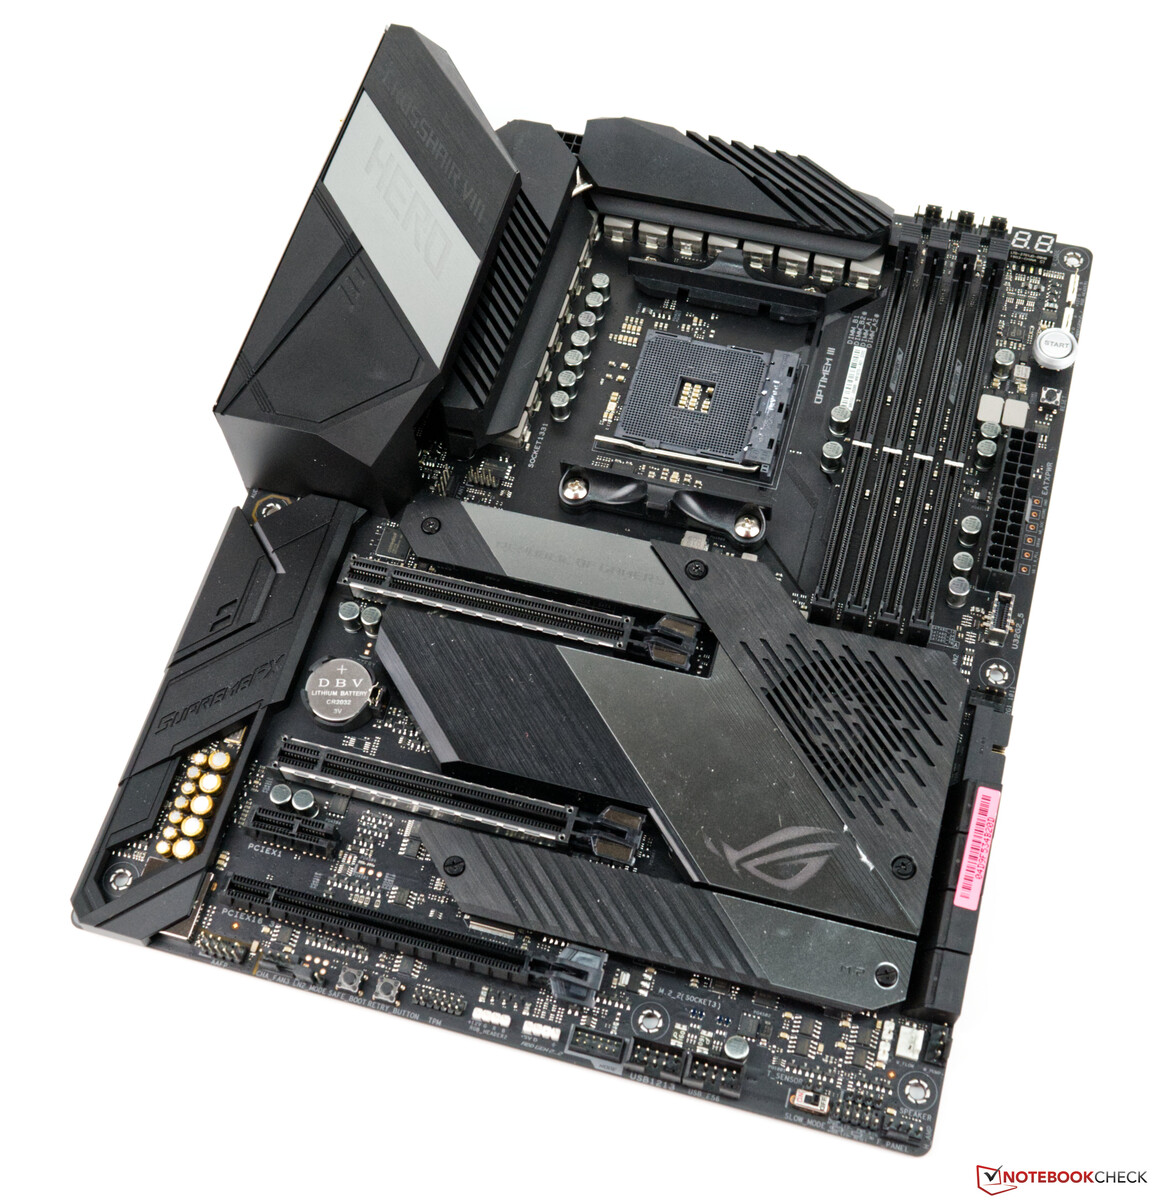
Our test system with the AMD Ryzen 9 5900X as the basis

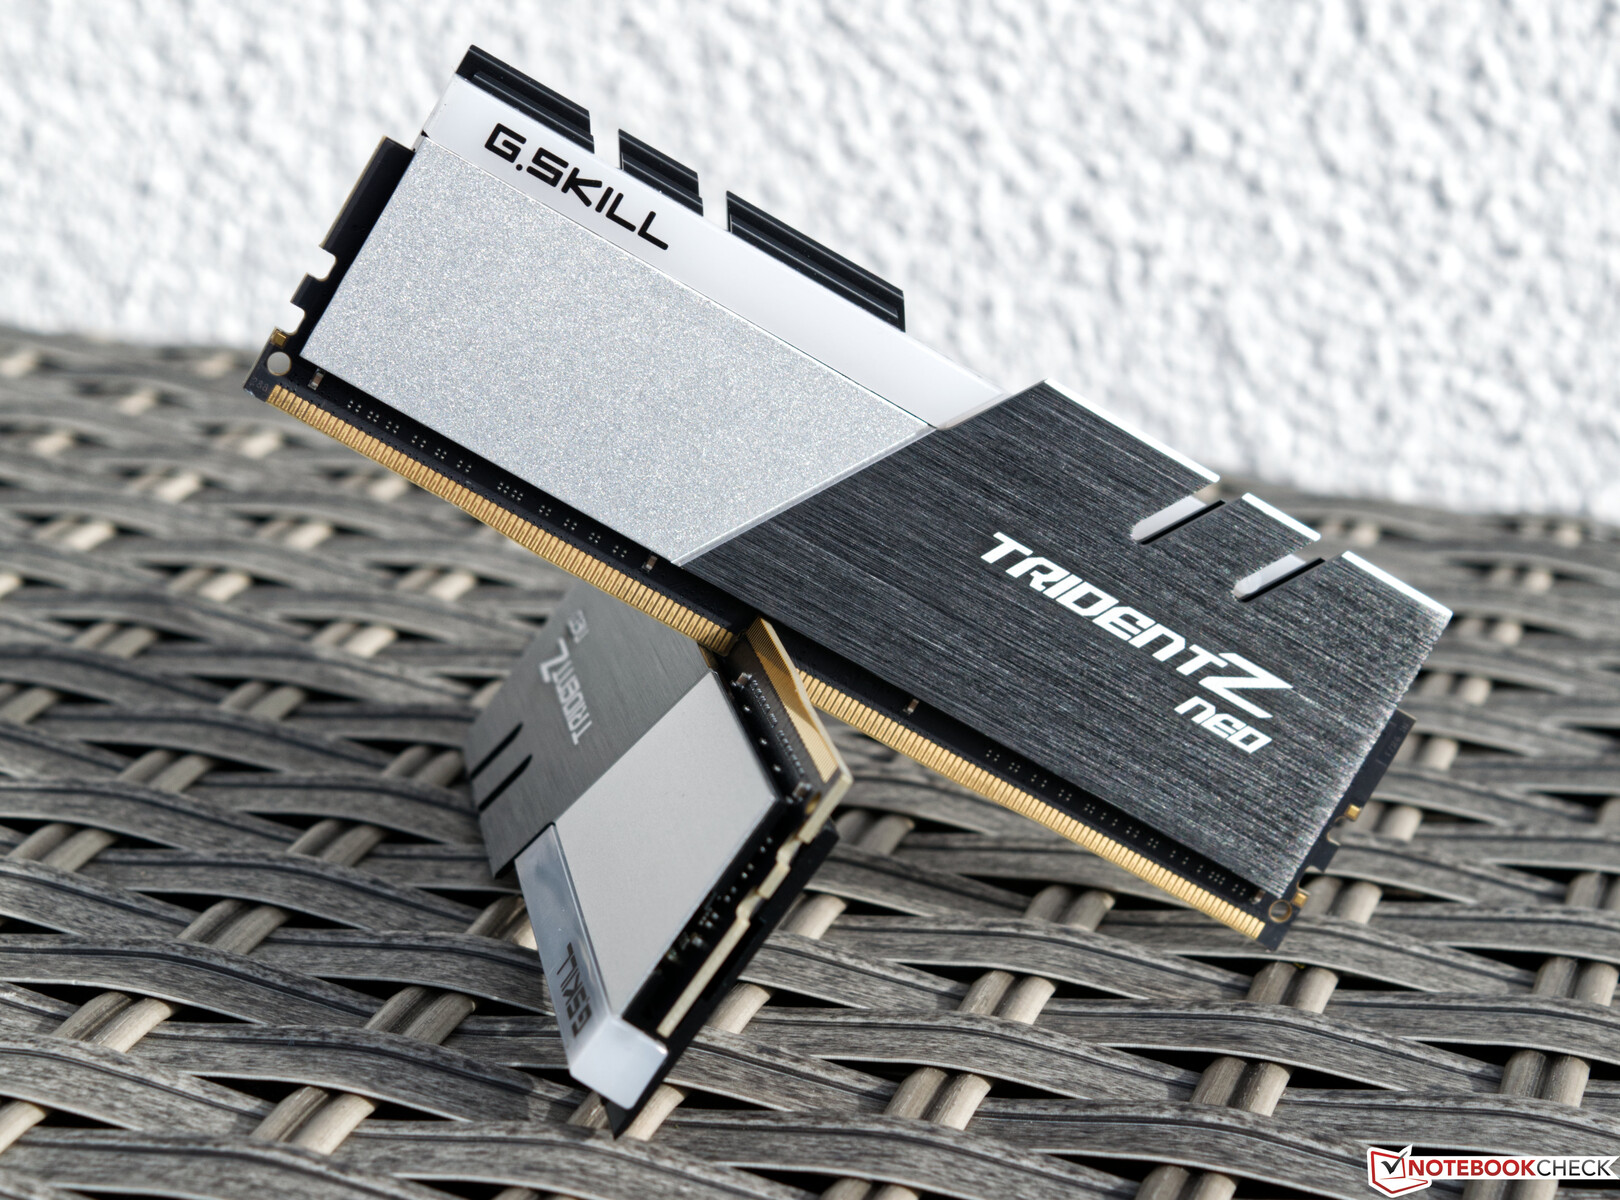
We used an up-to-date AMD platform based on the Asus X570 ROG Crosshair VIII Hero WiFi motherboard as our test system. The CPU (AMD Ryzen 9 5900X) offers good CPU performance, which we paired with an AiO solution (Alphacool Aurora 360) for the cooling. The 32 GB RAM is from G.Skill and was also provided to us, like the AiO. We used the Gigabyte M32UC as a monitor, which does not constrain us due to its UHD capabilities.

AMD Ryzen 9 5900X
AMD Ryzen 9 5900X
Asus X570 ROG Crosshair VIII Hero WiFi
G.Skill Trident Z Neo RGB DDR4-4000

Short overview of the test system:

  • Lian Li O11 Dynamic
  • AMD Ryzen 9 5900X
  • Sapphire Nitro+ Radeon RX 6650 XT (Driver: Adrenalin 22.8.2)
  • Asus X570 ROG Crosshair VIII Hero WiFi (BIOS 2402, Default Settings, XMP 1 für DDR4-4000)
  • Corsair RM1000X 1000-Watt-Netzteil
  • G.Skill Trident Z Neo RGB DDR4-4000 memory kit 2 x 16 GB
  • Corsair MP600 2TB M.2 PCIe-4.0-SSD
  • Crucial MX500 2TB (for games)

Test conditions

As with the other re-worked models from Sapphire, the Sapphire Nitro+ Radeon RX 6650 XT also offers dual-bios, with a slider on the graphics card that can be used to switch between the two versions. A software switch is also possible using the TriXX tool. With a maximum of 2,694 MHz, the boost clock is above AMD's reference model and is thus a good 100 MHz higher than the AMD Radeon RX 6600 XT. In the test, our unit had no problems reaching this high clock rate and maintaining it permanently. For all tests, we ran the graphics card with the performance BIOS, in order to get the best possible performance.

Synthetic benchmarks

We took a look at the synthetic benchmarks in order to get a first impression of the performance of the Sapphire Nitro+ Radeon RX 6650 XT. The slightly higher GPU and VRAM clock rates compared to the AMD Radeon RX 6600 XT are equivalent to a performance increase of almost 10 percent for the newer model. This narrows the gap to the slightly faster AMD Radeon RX 6700 XT, although it isn't able to compete with the Nvidia GeForce RTX 3060 Ti

Performance Rating - Percent
NVIDIA GeForce RTX 3080 12 GB
100 pt
AMD Radeon RX 6800
82.9 pt
NVIDIA GeForce RTX 3070
74 pt
AMD Radeon RX 6700 XT
66.2 pt
NVIDIA GeForce RTX 3060 Ti
65.6 pt
AMD Radeon RX 6650 XT
57.5 pt
AMD Radeon RX 6600 XT
52.5 pt
AMD Radeon RX 6500 XT
26 pt
3DMark
1920x1080 Fire Strike Graphics
NVIDIA GeForce RTX 3080 12 GB
44533 Points +51%
AMD Radeon RX 6800
43786 Points +48%
AMD Radeon RX 6700 XT
35136 Points +19%
NVIDIA GeForce RTX 3070
31096 Points +5%
AMD Radeon RX 6650 XT
29566 Points
AMD Radeon RX 6600 XT
28342 Points -4%
NVIDIA GeForce RTX 3060 Ti
28145 Points -5%
AMD Radeon RX 6500 XT
15344 Points -48%
Fire Strike Extreme Graphics
NVIDIA GeForce RTX 3080 12 GB
22078 Points +63%
AMD Radeon RX 6800
21510 Points +58%
AMD Radeon RX 6700 XT
17009 Points +25%
NVIDIA GeForce RTX 3070
16196 Points +19%
NVIDIA GeForce RTX 3060 Ti
13898 Points +2%
AMD Radeon RX 6650 XT
13581 Points
AMD Radeon RX 6600 XT
13122 Points -3%
AMD Radeon RX 6500 XT
6695 Points -51%
3840x2160 Fire Strike Ultra Graphics
NVIDIA GeForce RTX 3080 12 GB
11340 Points +67%
AMD Radeon RX 6800
10547 Points +56%
NVIDIA GeForce RTX 3070
8483 Points +25%
AMD Radeon RX 6700 XT
8325 Points +23%
NVIDIA GeForce RTX 3060 Ti
7126 Points +5%
AMD Radeon RX 6650 XT
6780 Points
AMD Radeon RX 6600 XT
6515 Points -4%
AMD Radeon RX 6500 XT
3501 Points -48%
2560x1440 Time Spy Graphics
NVIDIA GeForce RTX 3080 12 GB
17956 Points +79%
AMD Radeon RX 6800
16033 Points +60%
NVIDIA GeForce RTX 3070
13579 Points +35%
NVIDIA GeForce RTX 3060 Ti
11590 Points +15%
AMD Radeon RX 6700 XT
11473 Points +14%
AMD Radeon RX 6650 XT
10047 Points
AMD Radeon RX 6600 XT
9565 Points -5%
AMD Radeon RX 6500 XT
4942 Points -51%
Unigine Superposition
1920x1080 1080p High
NVIDIA GeForce RTX 3080 12 GB
24051 Points +74%
AMD Radeon RX 6800
19506 Points +41%
NVIDIA GeForce RTX 3070
17346 Points +26%
AMD Radeon RX 6700 XT
15832 Points +15%
NVIDIA GeForce RTX 3060 Ti
15479 Points +12%
AMD Radeon RX 6650 XT
13809 Points
AMD Radeon RX 6600 XT
13069 Points -5%
AMD Radeon RX 6500 XT
6637 Points -52%
1920x1080 1080p Extreme
NVIDIA GeForce RTX 3080 12 GB
11424 Points +96%
NVIDIA GeForce RTX 3070
8507 Points +46%
AMD Radeon RX 6800
8224 Points +41%
NVIDIA GeForce RTX 3060 Ti
7142 Points +23%
AMD Radeon RX 6700 XT
6804 Points +17%
AMD Radeon RX 6650 XT
5829 Points
AMD Radeon RX 6600 XT
5674 Points -3%
AMD Radeon RX 6500 XT
2810 Points -52%
3840x2160 4k Optimized
NVIDIA GeForce RTX 3080 12 GB
14986 Points +102%
AMD Radeon RX 6800
11757 Points +58%
NVIDIA GeForce RTX 3070
10755 Points +45%
NVIDIA GeForce RTX 3060 Ti
9224 Points +24%
AMD Radeon RX 6700 XT
9106 Points +23%
AMD Radeon RX 6650 XT
7419 Points
AMD Radeon RX 6600 XT
7098 Points -4%
AMD Radeon RX 6500 XT
3745 Points -50%
7680x4320 8k Optimized
NVIDIA GeForce RTX 3080 12 GB
6548 Points +120%
AMD Radeon RX 6800
4709 Points +58%
NVIDIA GeForce RTX 3070
4695 Points +58%
NVIDIA GeForce RTX 3060 Ti
4056 Points +37%
AMD Radeon RX 6700 XT
3586 Points +21%
AMD Radeon RX 6650 XT
2971 Points
AMD Radeon RX 6600 XT
2778 Points -6%
AMD Radeon RX 6500 XT
591 Points -80%
Unigine Heaven 4.0
Extreme Preset OpenGL
NVIDIA GeForce RTX 3080 12 GB
251.4 fps +48%
NVIDIA GeForce RTX 3070
196.1 fps +15%
AMD Radeon RX 6800
178.1 fps +5%
NVIDIA GeForce RTX 3060 Ti
172.3 (11.4min - 371.5max) fps +1%
AMD Radeon RX 6650 XT
169.8 fps
AMD Radeon RX 6700 XT
149.6 fps -12%
AMD Radeon RX 6600 XT
119.3 fps -30%
AMD Radeon RX 6500 XT
62.2 fps -63%
Extreme Preset DX11
NVIDIA GeForce RTX 3080 12 GB
274.3 fps +72%
AMD Radeon RX 6800
221.1 fps +38%
NVIDIA GeForce RTX 3070
202.5 fps +27%
NVIDIA GeForce RTX 3060 Ti
188.6 (43.6min - 434.5max) fps +18%
AMD Radeon RX 6700 XT
184.4 fps +15%
AMD Radeon RX 6650 XT
159.8 fps
AMD Radeon RX 6600 XT
153.2 fps -4%
AMD Radeon RX 6500 XT
76.7 fps -52%
Unigine Valley 1.0
1920x1080 Extreme HD DirectX AA:x8
NVIDIA GeForce RTX 3080 12 GB
203.8 fps +77%
AMD Radeon RX 6800
179.7 fps +56%
NVIDIA GeForce RTX 3070
155.1 fps +35%
NVIDIA GeForce RTX 3060 Ti
153.2 (48.2min - 297.9max) fps +33%
AMD Radeon RX 6700 XT
149.8 fps +30%
AMD Radeon RX 6650 XT
115.1 fps
AMD Radeon RX 6600 XT
110.1 fps -4%
AMD Radeon RX 6500 XT
54.2 fps -53%
1920x1080 Extreme HD Preset OpenGL AA:x8
NVIDIA GeForce RTX 3080 12 GB
186.1 fps +66%
NVIDIA GeForce RTX 3070
142.9 fps +27%
AMD Radeon RX 6800
137.2 fps +22%
NVIDIA GeForce RTX 3060 Ti
132.9 (48.3min - 236.1max) fps +18%
AMD Radeon RX 6700 XT
112.6 fps 0%
AMD Radeon RX 6650 XT
112.2 fps
AMD Radeon RX 6600 XT
83.5 fps -26%
AMD Radeon RX 6500 XT
44.1 fps -61%
3DMark 05 Standard
60080 points
3DMark 06 Standard Score
51180 points
3DMark Vantage P Result
87787 points
3DMark 11 Performance
33582 points
3DMark Ice Storm Standard Score
208609 points
3DMark Cloud Gate Standard Score
67923 points
3DMark Fire Strike Score
26509 points
3DMark Fire Strike Extreme Score
12963 points
3DMark Time Spy Score
10408 points
Help

Game benchmarks

The Witcher 3 frame rates (Ultra preset)
The Witcher 3 frametimes (Ultra preset)

The gaming performance we measured for the Sapphire Nitro+ Radeon RX 6650 XT builds on what has already been seen in the synthetic benchmarks. Slightly improvements relative to the AMD Radeon RX 6600 XT were to be expected, although the Nvidia GeForce RTX 3060 Ti was not able to maintain its lead from the synthetic benchmarks during the gaming tests. Our test card can therefore put some pressure on the GeForce RTX 3060 Ti, although only in a few games.

The AMD Radeon RX 6600 XT has always been advertised as a 1080p gaming graphics card. AMD hasn't changed that specification, despite the fact that the AMD Radeon RX 6650 XT can also master many titles at higher resolutions. Sometimes, however, the performance is actually only good enough for smooth 1080p gaming in the latest games.

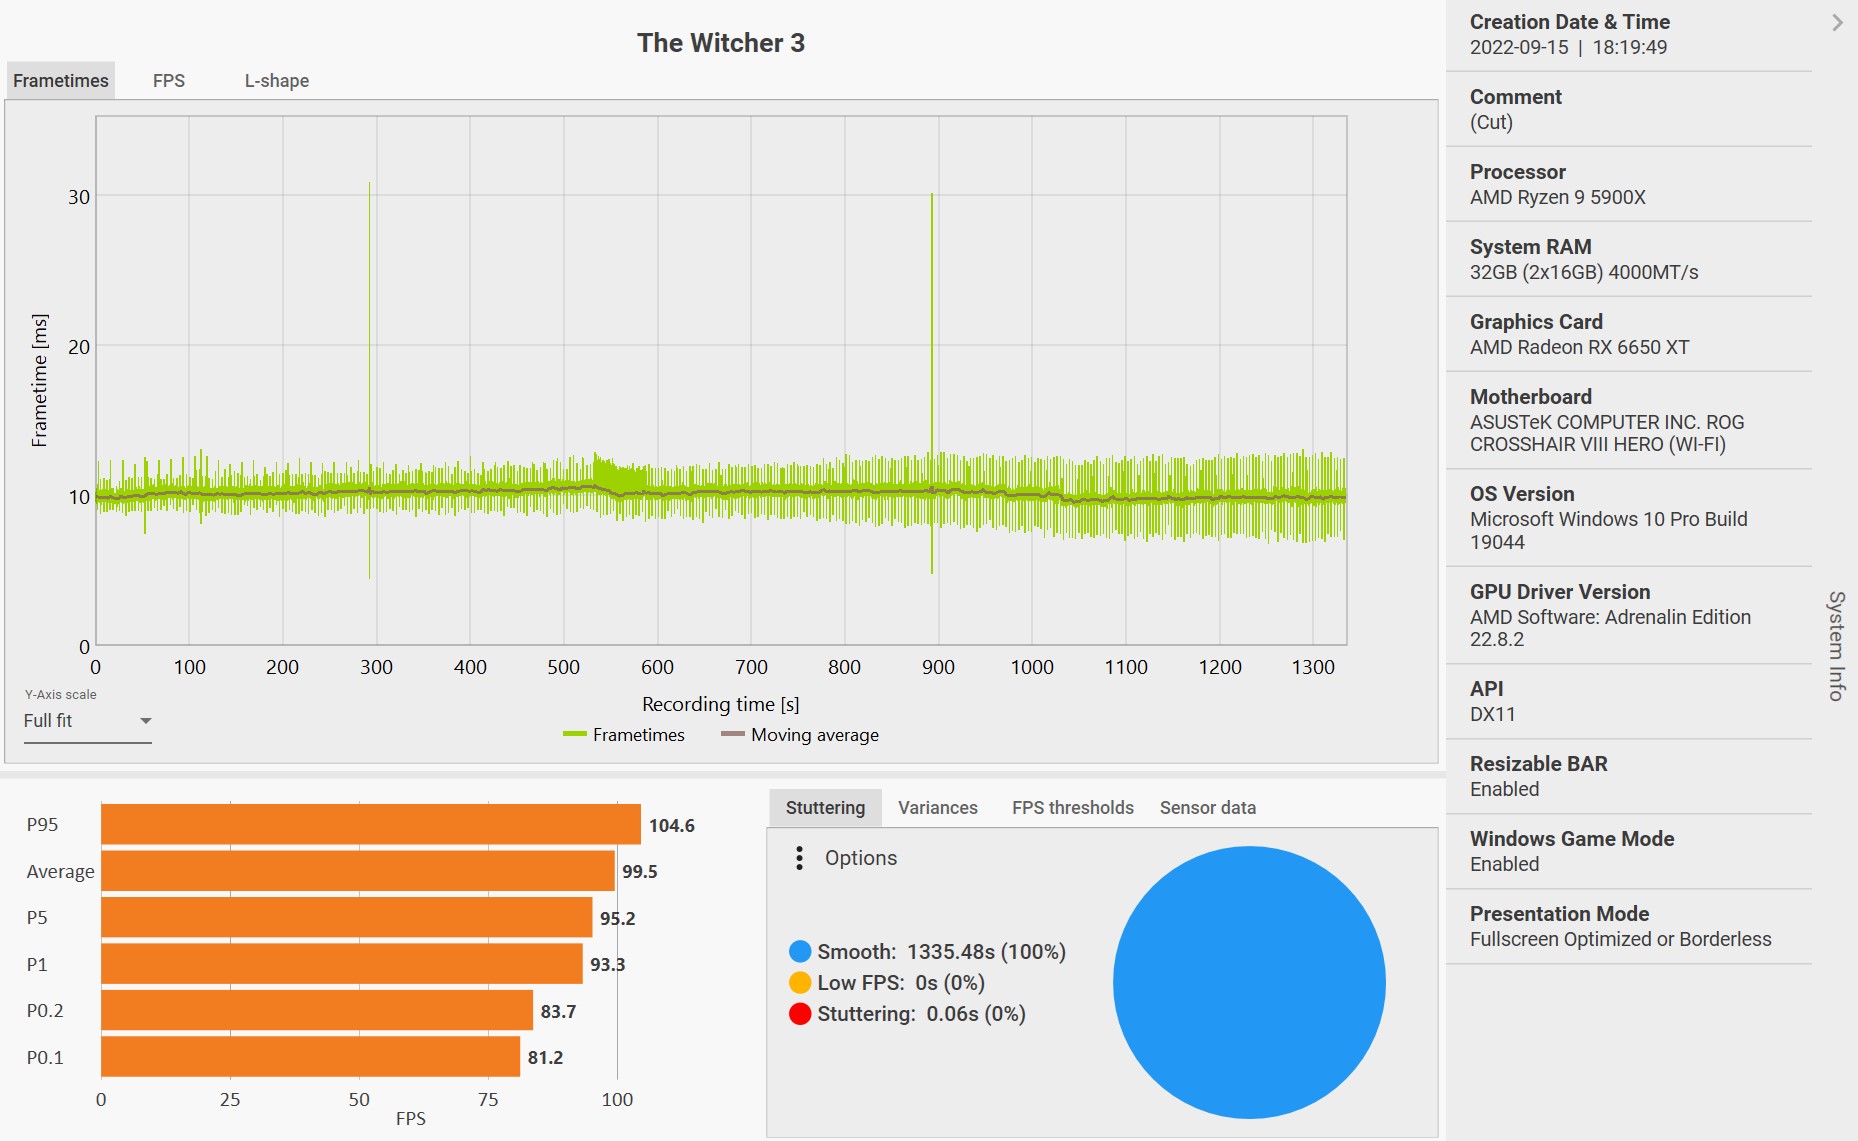
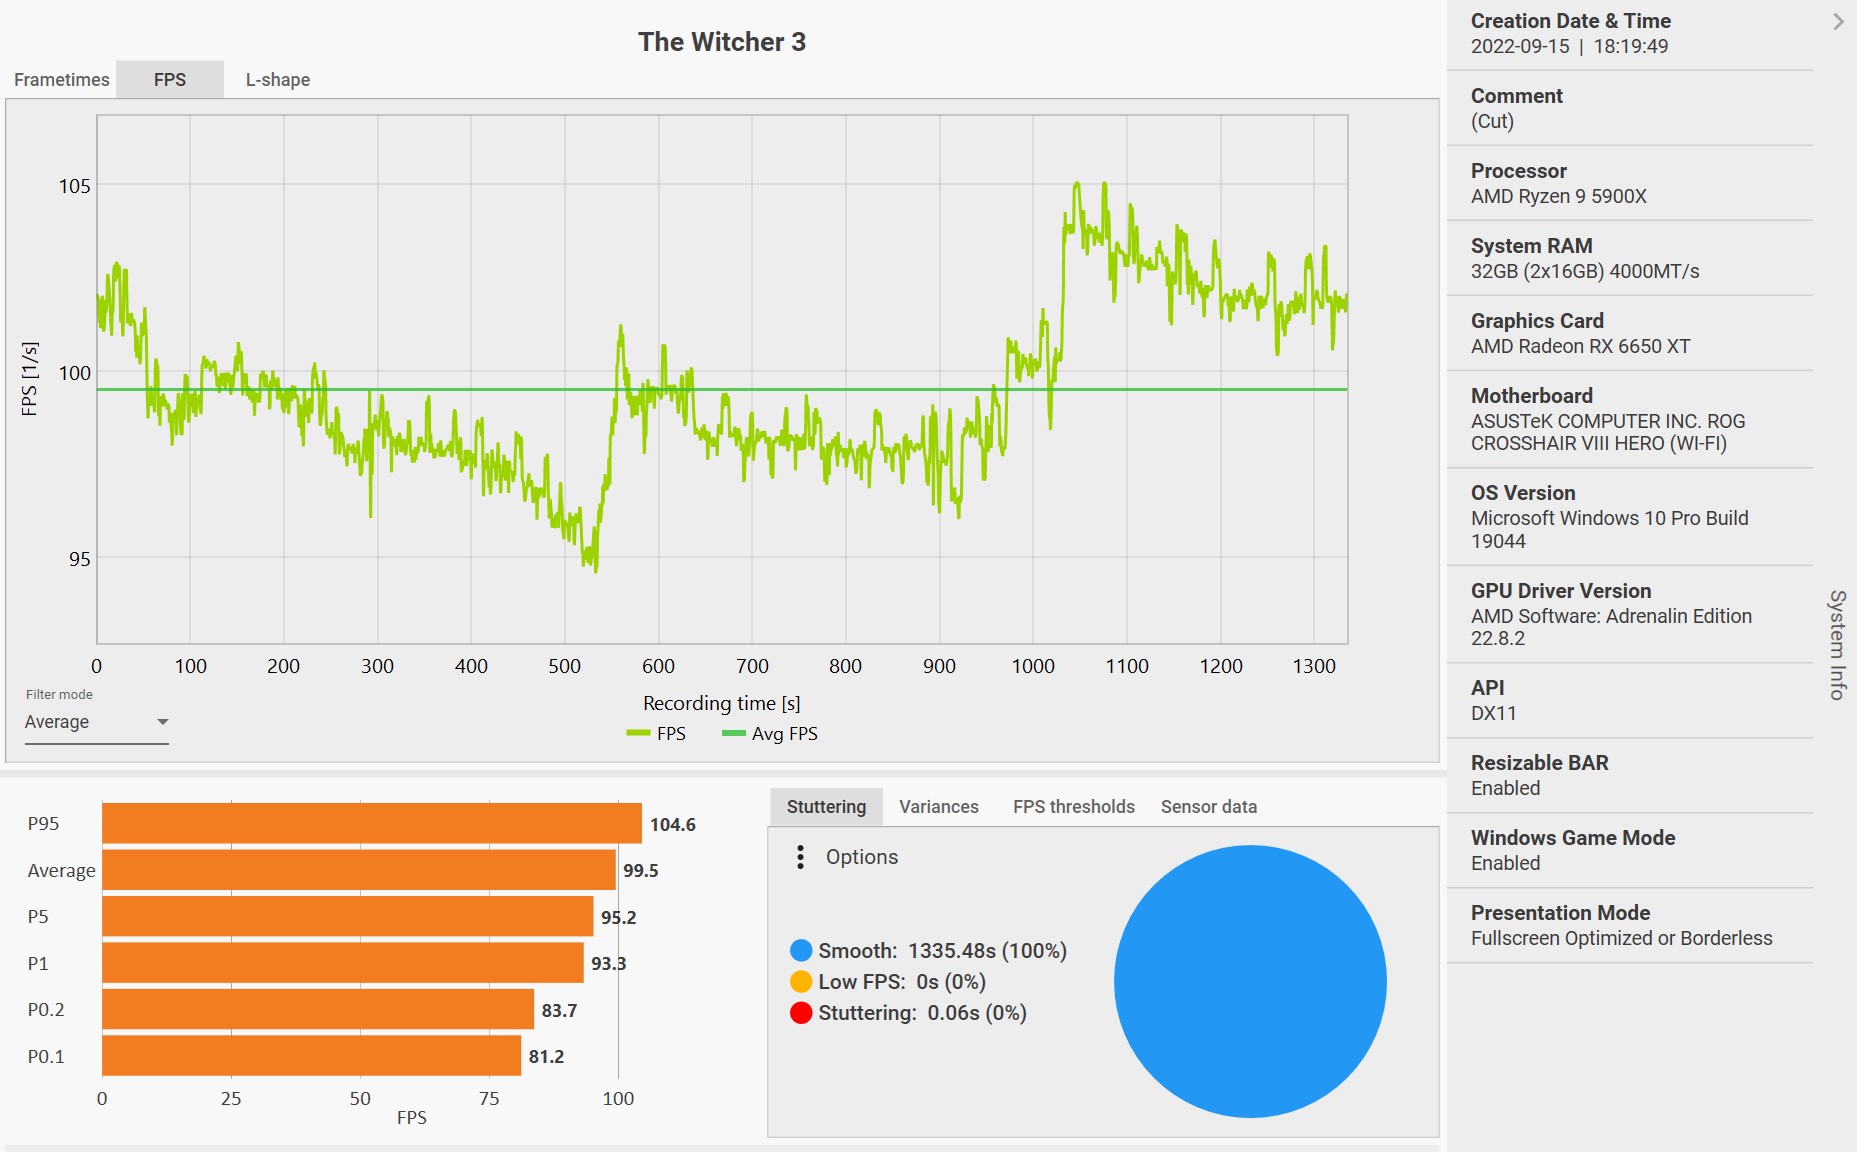
As usual, we measured the frame rate using The Witcher 3 (Ultra preset). The Sapphire Nitro+ Radeon RX 6650 XT does quite well, with a range from about 95 to 105 FPS. We didn't notice any performance loss, even after longer periods of play. There were also no noticeable abnormalities in the frametimes throughout our test. Two small outliers can be seen, although they didn't affect the course of the game.

You can find more benchmarks for the AMD Radeon RX 6650 XT here.

The Witcher 3
1920x1080 Ultra Graphics & Postprocessing (HBAO+)
NVIDIA GeForce RTX 3080 12 GB, AMD Ryzen 9 5900X
165.1 (57.2min, 90.2P0.1, 124.4P1 - 369max) fps +54%
AMD Radeon RX 6800, AMD Ryzen 9 5900X
156 (15.9min, 87.6P0.1, 128P1 - 313max) fps +45%
NVIDIA GeForce RTX 3070, AMD Ryzen 9 5900X
122 (110min - 138max) fps +14%
AMD Radeon RX 6700 XT, AMD Ryzen 9 5900X
117 fps +9%
NVIDIA GeForce RTX 3060 Ti, AMD Ryzen 9 5950X
109 (103min, 105P1 - 113max) fps +1%
AMD Radeon RX 6650 XT, AMD Ryzen 9 5900X
107.4 (9.75min, 56.3P0.1, 91.1P1 - 259max) fps
AMD Radeon RX 6600 XT, AMD Ryzen 9 5900X
98.9 (59.2min, 69.1P0.1, 83.7P1 - 263max) fps -8%
AMD Radeon RX 6500 XT, AMD Ryzen 9 5900X
55.2 (13min, 42.8P0.1, 47.9P1 - 94.3max) fps -49%
3840x2160 High Graphics & Postprocessing (Nvidia HairWorks Off)
NVIDIA GeForce RTX 3080 12 GB, AMD Ryzen 9 5900X
131.8 (48.2min, 72.3P0.1, 107.3P1 - 454max) fps +142%
AMD Radeon RX 6800, AMD Ryzen 9 5900X
96.8 (59.9min, 74.8P0.1, 84.2P1 - 212max) fps +78%
NVIDIA GeForce RTX 3070, AMD Ryzen 9 5900X
88.2 (82min - 97max) fps +62%
NVIDIA GeForce RTX 3060 Ti, AMD Ryzen 9 5950X
81.3 (74min, 74.57P1 - 88max) fps +49%
AMD Radeon RX 6700 XT, AMD Ryzen 9 5900X
63 fps +16%
AMD Radeon RX 6650 XT, AMD Ryzen 9 5900X
54.5 (40.8min, 45.6P0.1, 48.3P1 - 112.8max) fps
AMD Radeon RX 6600 XT, AMD Ryzen 9 5900X
53.9 (39.4min, 43.8P0.1, 47.9P1 - 97.2max) fps -1%
AMD Radeon RX 6500 XT, AMD Ryzen 9 5900X
28.1 (15.8min, 23.4P0.1, 25.1P1 - 224max) fps -48%
Far Cry 5
1920x1080 Ultra Preset AA:T
NVIDIA GeForce RTX 3080 12 GB, AMD Ryzen 9 5900X
151 (111min - 207max) fps +3%
AMD Radeon RX 6650 XT, AMD Ryzen 9 5900X
146 (113min - 183max) fps
AMD Radeon RX 6700 XT, AMD Ryzen 9 5900X
139 (104min - 189max) fps -5%
AMD Radeon RX 6600 XT, AMD Ryzen 9 5900X
133 (104min - 170max) fps -9%
NVIDIA GeForce RTX 3070, AMD Ryzen 9 5900X
127 (90min - 177max) fps -13%
AMD Radeon RX 6800, AMD Ryzen 9 5900X
126 (96min - 170max) fps -14%
AMD Radeon RX 6500 XT, AMD Ryzen 9 5900X
85 (75min - 103max) fps -42%
3840x2160 Ultra Preset AA:T
NVIDIA GeForce RTX 3080 12 GB, AMD Ryzen 9 5900X
102 (93min - 121max) fps +85%
AMD Radeon RX 6800, AMD Ryzen 9 5900X
90 (77min - 109max) fps +64%
AMD Radeon RX 6700 XT, AMD Ryzen 9 5900X
70 (59min - 91max) fps +27%
NVIDIA GeForce RTX 3070, AMD Ryzen 9 5900X
69 (61min - 81max) fps +25%
AMD Radeon RX 6650 XT, AMD Ryzen 9 5900X
55 (47min - 69max) fps
AMD Radeon RX 6600 XT, AMD Ryzen 9 5900X
51 (44min - 65max) fps -7%
AMD Radeon RX 6500 XT, AMD Ryzen 9 5900X
23 (17min - 29max) fps -58%
2560x1440 Ultra Preset AA:T
NVIDIA GeForce RTX 3080 12 GB, AMD Ryzen 9 5900X
147 (110min - 199max) fps +29%
AMD Radeon RX 6700 XT, AMD Ryzen 9 5900X
125 (104min - 146max) fps +10%
AMD Radeon RX 6800, AMD Ryzen 9 5900X
125 (95min - 170max) fps +10%
AMD Radeon RX 6650 XT, AMD Ryzen 9 5900X
114 (97min - 141max) fps
NVIDIA GeForce RTX 3070, AMD Ryzen 9 5900X
113 (89min - 132max) fps -1%
AMD Radeon RX 6600 XT, AMD Ryzen 9 5900X
105 (91min - 131max) fps -8%
AMD Radeon RX 6500 XT, AMD Ryzen 9 5900X
52 (43min - 70max) fps -54%
Far Cry New Dawn
1920x1080 Ultra Preset
AMD Radeon RX 6650 XT, AMD Ryzen 9 5900X
124 (81min - 211max) fps
NVIDIA GeForce RTX 3080 12 GB, AMD Ryzen 9 5900X
118 (80min - 202max) fps -5%
AMD Radeon RX 6700 XT, AMD Ryzen 9 5900X
115 (78min - 195max) fps -7%
AMD Radeon RX 6600 XT, AMD Ryzen 9 5900X
112 (77min - 181max) fps -10%
AMD Radeon RX 6800, AMD Ryzen 9 5900X
107 (71min - 179max) fps -14%
NVIDIA GeForce RTX 3060 Ti, AMD Ryzen 9 5950X
99 (64min - 165max) fps -20%
NVIDIA GeForce RTX 3070, AMD Ryzen 9 5900X
97 (61min - 166max) fps -22%
AMD Radeon RX 6500 XT, AMD Ryzen 9 5900X
82 (61min - 103max) fps -34%
3840x2160 Ultra Preset
NVIDIA GeForce RTX 3080 12 GB, AMD Ryzen 9 5900X
98 (79min - 122max) fps +61%
AMD Radeon RX 6800, AMD Ryzen 9 5900X
86 (70min - 115max) fps +41%
NVIDIA GeForce RTX 3070, AMD Ryzen 9 5900X
70 (52min - 86max) fps +15%
AMD Radeon RX 6700 XT, AMD Ryzen 9 5900X
70 (57min - 91max) fps +15%
NVIDIA GeForce RTX 3060 Ti, AMD Ryzen 9 5950X
65 (53min - 79max) fps +7%
AMD Radeon RX 6650 XT, AMD Ryzen 9 5900X
61 (49min - 79max) fps
AMD Radeon RX 6600 XT, AMD Ryzen 9 5900X
53 (44min - 69max) fps -13%
AMD Radeon RX 6500 XT, AMD Ryzen 9 5900X
28 (22min - 36max) fps -54%
2560x1440 Ultra Preset
NVIDIA GeForce RTX 3080 12 GB, AMD Ryzen 9 5900X
116 (79min - 186max) fps +5%
AMD Radeon RX 6650 XT, AMD Ryzen 9 5900X
111 (79min - 157max) fps
AMD Radeon RX 6700 XT, AMD Ryzen 9 5900X
107 (78min - 162max) fps -4%
AMD Radeon RX 6800, AMD Ryzen 9 5900X
106 (71min - 179max) fps -5%
AMD Radeon RX 6600 XT, AMD Ryzen 9 5900X
98 (76min - 133max) fps -12%
NVIDIA GeForce RTX 3070, AMD Ryzen 9 5900X
94 (64min - 138max) fps -15%
NVIDIA GeForce RTX 3060 Ti, AMD Ryzen 9 5950X
94 (64min - 138max) fps -15%
AMD Radeon RX 6500 XT, AMD Ryzen 9 5900X
57 (44min - 72max) fps -49%
Anno 1800
1920x1080 Ultra Graphics Quality (DX11)
NVIDIA GeForce RTX 3060 Ti, AMD Ryzen 9 5950X
54.2 (37min, 38.4P0.1, 43P1 - 64.7max) fps +3%
AMD Radeon RX 6650 XT, AMD Ryzen 9 5900X
52.7 (26.1min, 27.2P0.1, 39.9P1 - 95.2max) fps
NVIDIA GeForce RTX 3080 12 GB, AMD Ryzen 9 5900X
51.6 (21.1min, 23.8P0.1, 39.5P1 - 71.3max) fps -2%
AMD Radeon RX 6800, AMD Ryzen 9 5900X
48.5 (18.2min, 22.5P0.1, 33.9P1 - 73max) fps -8%
NVIDIA GeForce RTX 3070, AMD Ryzen 9 5900X
46.5 (34min - 66max) fps -12%
AMD Radeon RX 6700 XT, AMD Ryzen 9 5900X
45 fps -15%
AMD Radeon RX 6600 XT, AMD Ryzen 9 5900X
41.4 (16.8min, 17.6P0.1, 35.9P1 - 49.1max) fps -21%
AMD Radeon RX 6500 XT, AMD Ryzen 9 5900X
28.3 (14min, 17.1P0.1, 24.3P1 - 47.6max) fps -46%
3840x2160 Ultra Graphics Quality (DX11)
NVIDIA GeForce RTX 3080 12 GB, AMD Ryzen 9 5900X
47.8 (21min, 24P0.1, 33.3P1 - 65.9max) fps +100%
AMD Radeon RX 6800, AMD Ryzen 9 5900X
41.7 (31.6min, 32.7P0.1, 34P1 - 56.4max) fps +74%
NVIDIA GeForce RTX 3060 Ti, AMD Ryzen 9 5950X
34.4 (20.9min, 20.9P0.1, 22.8P1 - 57.3max) fps +44%
NVIDIA GeForce RTX 3070, AMD Ryzen 9 5900X
34.3 (25min - 40max) fps +44%
AMD Radeon RX 6700 XT, AMD Ryzen 9 5900X
29 fps +21%
AMD Radeon RX 6650 XT, AMD Ryzen 9 5900X
23.9 (16.2min, 16.4P0.1, 18.4P1 - 46max) fps
AMD Radeon RX 6600 XT, AMD Ryzen 9 5900X
21.5 (18min, 18.4P0.1, 18.9P1 - 27.6max) fps -10%
AMD Radeon RX 6500 XT, AMD Ryzen 9 5900X
11.3 (10.1min, 10.5P0.1, 10.7P1 - 13.1max) fps -53%
2560x1440 Ultra Graphics Quality (DX11)
NVIDIA GeForce RTX 3080 12 GB, AMD Ryzen 9 5900X
49.7 (23.2min, 26.1P0.1, 39.3P1 - 64.6max) fps +16%
NVIDIA GeForce RTX 3070, AMD Ryzen 9 5900X
46.2 (37min - 58max) fps +8%
AMD Radeon RX 6800, AMD Ryzen 9 5900X
43.1 (30.9min, 32.8P0.1, 34P1 - 63max) fps 0%
AMD Radeon RX 6650 XT, AMD Ryzen 9 5900X
42.9 (26.7min, 30.8P0.1, 33.6P1 - 72.1max) fps
NVIDIA GeForce RTX 3060 Ti, AMD Ryzen 9 5950X
40.6 (31.3min, 31.3P0.1, 31.7P1 - 43.8max) fps -5%
AMD Radeon RX 6700 XT, AMD Ryzen 9 5900X
40 fps -7%
AMD Radeon RX 6600 XT, AMD Ryzen 9 5900X
37.1 (18.2min, 28.4P0.1, 33.3P1 - 52.6max) fps -14%
AMD Radeon RX 6500 XT, AMD Ryzen 9 5900X
33.5 (27.2min, 27.9P0.1, 29.8P1 - 39.3max) fps -22%
Crysis Remastered
1920x1080 Very High Preset AA:SM
NVIDIA GeForce RTX 3080 12 GB, AMD Ryzen 9 5900X
162.3 (66.5min, 114P0.1, 137.7P1 - 220max) fps +82%
AMD Radeon RX 6650 XT, AMD Ryzen 9 5900X
89.1 (31.6min, 49P0.1, 51.3P1 - 242max) fps
AMD Radeon RX 6700 XT, AMD Ryzen 9 5900X
88 fps -1%
AMD Radeon RX 6800, AMD Ryzen 9 5900X
80.5 (36.5min, 53.3P0.1, 65.8P1 - 123max) fps -10%
AMD Radeon RX 6500 XT, AMD Ryzen 9 5900X
51.3 (20.2min, 21.8P0.1, 23.5P1 - 268max) fps -42%
AMD Radeon RX 6600 XT, AMD Ryzen 9 5900X
50.7 (21.3min, 34.1P0.1, 42.8P1 - 121max) fps -43%
3840x2160 Very High Preset AA:SM
NVIDIA GeForce RTX 3080 12 GB, AMD Ryzen 9 5900X
72.7 (36.4min, 56.1P0.1, 61.1P1 - 100.7max) fps +144%
AMD Radeon RX 6700 XT, AMD Ryzen 9 5900X
38 fps +28%
AMD Radeon RX 6800, AMD Ryzen 9 5900X
30 (25.5min, 25.5P0.1, 27P1 - 35.4max) fps +1%
AMD Radeon RX 6650 XT, AMD Ryzen 9 5900X
29.8 (17.9min, 17.9P0.1, 18P1 - 81max) fps
AMD Radeon RX 6500 XT, AMD Ryzen 9 5900X
18.2 (10.2min, 10.9P0.1, 12.4P1 - 34max) fps -39%
AMD Radeon RX 6600 XT, AMD Ryzen 9 5900X
15.6 (12min, 12P0.1, 13.6P1 - 19.6max) fps -48%
2560x1440 Very High Preset AA:SM
NVIDIA GeForce RTX 3080 12 GB, AMD Ryzen 9 5900X
123.5 (37.7min, 82.9P0.1, 103.9P1 - 177.1max) fps +112%
AMD Radeon RX 6700 XT, AMD Ryzen 9 5900X
67 fps +15%
AMD Radeon RX 6650 XT, AMD Ryzen 9 5900X
58.2 (32.6min, 33.3P0.1, 34.4P1 - 180.5max) fps
AMD Radeon RX 6800, AMD Ryzen 9 5900X
51.8 (41min, 43.2P0.1, 45.6P1 - 83.8max) fps -11%
AMD Radeon RX 6500 XT, AMD Ryzen 9 5900X
36.9 (22.9min, 23.2P0.1, 24P1 - 78.1max) fps -37%
AMD Radeon RX 6600 XT, AMD Ryzen 9 5900X
29.8 (25.8min, 25.8P0.1, 26.7P1 - 43.5max) fps -49%
Dirt 5
1920x1080 Ultra High Preset
NVIDIA GeForce RTX 3080 12 GB, AMD Ryzen 9 5900X
154 fps +57%
AMD Radeon RX 6800, AMD Ryzen 9 5900X
139.2 fps +42%
AMD Radeon RX 6700 XT, AMD Ryzen 9 5900X
114 fps +16%
AMD Radeon RX 6650 XT, AMD Ryzen 9 5900X
98 fps
AMD Radeon RX 6600 XT, AMD Ryzen 9 5900X
92 fps -6%
NVIDIA GeForce RTX 3070, AMD Ryzen 9 5900X
86 (56.3min, 71.4P0.1, 74.7P1 - 152.9max) fps -12%
AMD Radeon RX 6500 XT, AMD Ryzen 9 5900X
34.3 fps -65%
3840x2160 Ultra High Preset
NVIDIA GeForce RTX 3080 12 GB, AMD Ryzen 9 5900X
83 fps +69%
AMD Radeon RX 6800, AMD Ryzen 9 5900X
77.4 fps +58%
AMD Radeon RX 6700 XT, AMD Ryzen 9 5900X
57 fps +16%
NVIDIA GeForce RTX 3070, AMD Ryzen 9 5900X
52.9 (40.2min, 41.7P0.1, 46.4P1 - 72.2max) fps +8%
AMD Radeon RX 6650 XT, AMD Ryzen 9 5900X
49 fps
AMD Radeon RX 6600 XT, AMD Ryzen 9 5900X
47 fps -4%
AMD Radeon RX 6500 XT, AMD Ryzen 9 5900X
14.5 fps -70%
2560x1440 Ultra High Preset
NVIDIA GeForce RTX 3080 12 GB, AMD Ryzen 9 5900X
125 fps +62%
AMD Radeon RX 6800, AMD Ryzen 9 5900X
116.6 fps +51%
AMD Radeon RX 6700 XT, AMD Ryzen 9 5900X
89 fps +16%
AMD Radeon RX 6650 XT, AMD Ryzen 9 5900X
77 fps
NVIDIA GeForce RTX 3070, AMD Ryzen 9 5900X
74 (43.9min, 60.2P0.1, 64.6P1 - 134max) fps -4%
AMD Radeon RX 6600 XT, AMD Ryzen 9 5900X
74 fps -4%
AMD Radeon RX 6500 XT, AMD Ryzen 9 5900X
24.2 fps -69%
F1 2020
1920x1080 Ultra High Preset AA:T AF:16x
NVIDIA GeForce RTX 3080 12 GB, AMD Ryzen 9 5900X
263 (215min - 315max) fps +55%
AMD Radeon RX 6800, AMD Ryzen 9 5900X
222 (161min - 282max) fps +31%
AMD Radeon RX 6700 XT, AMD Ryzen 9 5900X
190 fps +12%
NVIDIA GeForce RTX 3070, AMD Ryzen 9 5900X
179 (153min - 213max) fps +5%
NVIDIA GeForce RTX 3060 Ti, AMD Ryzen 9 5950X
174 (144min - 206max) fps +3%
AMD Radeon RX 6650 XT, AMD Ryzen 9 5900X
169.7 (122min - 215max) fps
AMD Radeon RX 6600 XT, AMD Ryzen 9 5900X
157 (115min - 193max) fps -7%
AMD Radeon RX 6500 XT, AMD Ryzen 9 5900X
92.2 (67min - 116max) fps -46%
3840x2160 Ultra High Preset AA:T AF:16x
NVIDIA GeForce RTX 3080 12 GB, AMD Ryzen 9 5900X
124.6 (107min - 145max) fps +83%
AMD Radeon RX 6800, AMD Ryzen 9 5900X
107 (86min - 128max) fps +57%
NVIDIA GeForce RTX 3070, AMD Ryzen 9 5900X
89.2 (73min - 104max) fps +31%
AMD Radeon RX 6700 XT, AMD Ryzen 9 5900X
83 fps +22%
NVIDIA GeForce RTX 3060 Ti, AMD Ryzen 9 5950X
80 (68min - 92max) fps +17%
AMD Radeon RX 6650 XT, AMD Ryzen 9 5900X
68.2 (55min - 83max) fps
AMD Radeon RX 6600 XT, AMD Ryzen 9 5900X
65.8 (53min - 80max) fps -4%
AMD Radeon RX 6500 XT, AMD Ryzen 9 5900X
31.9 (25min - 39max) fps -53%
2560x1440 Ultra High Preset AA:T AF:16x
NVIDIA GeForce RTX 3080 12 GB, AMD Ryzen 9 5900X
206 (171min - 242max) fps +66%
AMD Radeon RX 6800, AMD Ryzen 9 5900X
175 (131min - 213max) fps +41%
NVIDIA GeForce RTX 3070, AMD Ryzen 9 5900X
146 (121min - 168max) fps +18%
AMD Radeon RX 6700 XT, AMD Ryzen 9 5900X
142 fps +15%
NVIDIA GeForce RTX 3060 Ti, AMD Ryzen 9 5950X
135 (115min - 157max) fps +9%
AMD Radeon RX 6650 XT, AMD Ryzen 9 5900X
123.8 (94min - 152max) fps
AMD Radeon RX 6600 XT, AMD Ryzen 9 5900X
116 (89min - 138max) fps -6%
AMD Radeon RX 6500 XT, AMD Ryzen 9 5900X
66 (51min - 81max) fps -47%
Mafia Definitive Edition
1920x1080 High Preset
NVIDIA GeForce RTX 3080 12 GB, AMD Ryzen 9 5900X
162.7 (71.7min, 80.5P0.1, 103.9P1 - 314max) fps +42%
AMD Radeon RX 6800, AMD Ryzen 9 5900X
132 (34.8min, 55.7P0.1, 77.6P1 - 291max) fps +16%
NVIDIA GeForce RTX 3070, AMD Ryzen 9 5900X
124 (57.4min, 62.8P0.1, 82P1 - 251max) fps +9%
NVIDIA GeForce RTX 3060 Ti, AMD Ryzen 9 5950X
124 (47.9min, 69.8P0.1, 86.6P1 - 235max) fps +9%
AMD Radeon RX 6650 XT, AMD Ryzen 9 5900X
114.2 (60.3min, 74.8P0.1, 95.7P1 - 344max) fps
AMD Radeon RX 6700 XT, AMD Ryzen 9 5900X
112 fps -2%
AMD Radeon RX 6600 XT, AMD Ryzen 9 5900X
106 (33.7min, 59.1P0.1, 73P1 - 230max) fps -7%
AMD Radeon RX 6500 XT, AMD Ryzen 9 5900X
57.9 (31.6min, 32.3P0.1, 35.1P1 - 192max) fps -49%
3840x2160 High Preset
NVIDIA GeForce RTX 3080 12 GB, AMD Ryzen 9 5900X
79.2 (38.9min, 42.3P0.1, 62P1 - 175.6max) fps +132%
AMD Radeon RX 6800, AMD Ryzen 9 5900X
57.3 (31.4min, 33.3P0.1, 34.5P1 - 208max) fps +68%
NVIDIA GeForce RTX 3070, AMD Ryzen 9 5900X
56.6 (34.7min, 37.9P0.1, 44.2P1 - 177max) fps +66%
NVIDIA GeForce RTX 3060 Ti, AMD Ryzen 9 5950X
49.7 (30.1min, 32.7P0.1, 40.9P1 - 120max) fps +46%
AMD Radeon RX 6700 XT, AMD Ryzen 9 5900X
43 fps +26%
AMD Radeon RX 6650 XT, AMD Ryzen 9 5900X
34.1 (27.8min, 29.4P0.1, 31.5P1 - 41.8max) fps
AMD Radeon RX 6600 XT, AMD Ryzen 9 5900X
34 (18.6min, 18.6P0.1, 19.4P1 - 169max) fps 0%
AMD Radeon RX 6500 XT, AMD Ryzen 9 5900X
17.2 (8.85min, 8.93P0.1, 9.34P1 - 141max) fps -50%
2560x1440 High Preset
NVIDIA GeForce RTX 3080 12 GB, AMD Ryzen 9 5900X
136 (30.8min, 70.6P0.1, 95.5P1 - 276max) fps +88%
AMD Radeon RX 6800, AMD Ryzen 9 5900X
111 (35.9min, 61.9P0.1, 74.3P1 - 245max) fps +54%
NVIDIA GeForce RTX 3070, AMD Ryzen 9 5900X
98.7 (45.2min, 55.9P0.1, 69.4P1 - 191max) fps +37%
NVIDIA GeForce RTX 3060 Ti, AMD Ryzen 9 5950X
90.1 (25min, 36.1P0.1, 64.8P1 - 161max) fps +25%
AMD Radeon RX 6700 XT, AMD Ryzen 9 5900X
81 fps +12%
AMD Radeon RX 6650 XT, AMD Ryzen 9 5900X
72.3 (27.8min, 57.1P0.1, 63P1 - 110.1max) fps
AMD Radeon RX 6600 XT, AMD Ryzen 9 5900X
70.3 (33min, 42.9P0.1, 44.8P1 - 206max) fps -3%
AMD Radeon RX 6500 XT, AMD Ryzen 9 5900X
36.2 (19.7min, 20.3P0.1, 20.8P1 - 185max) fps -50%
Watch Dogs Legion
1920x1080 Ultra Preset (DX12)
NVIDIA GeForce RTX 3080 12 GB, AMD Ryzen 9 5900X
95.2 (35.72min, 69.11P1 - 145.12max) fps +46%
AMD Radeon RX 6800, AMD Ryzen 9 5900X
87.7 (36.62min, 64.1P1 - 145.7max) fps +35%
AMD Radeon RX 6700 XT, AMD Ryzen 9 5900X
84.1 (60.29min, 67.02P1 - 118.49max) fps +29%
NVIDIA GeForce RTX 3070, AMD Ryzen 9 5900X
79 (42.91min, 56.59P1 - 121.27max) fps +22%
NVIDIA GeForce RTX 3060 Ti, AMD Ryzen 9 5950X
76.6 (48.47min, 62.15P1 - 115.84max) fps +18%
AMD Radeon RX 6650 XT, AMD Ryzen 9 5900X
65 fps
AMD Radeon RX 6600 XT, AMD Ryzen 9 5900X
61 fps -6%
AMD Radeon RX 6500 XT, AMD Ryzen 9 5900X
24.8 (16.29min, 17.74P1 - 34.41max) fps -62%
3840x2160 Ultra Preset (DX12)
NVIDIA GeForce RTX 3080 12 GB, AMD Ryzen 9 5900X
55.2 (34.2min, 46.23P1 - 81.17max) fps +140%
AMD Radeon RX 6800, AMD Ryzen 9 5900X
44.5 (28.53min, 36.73P1 - 64.84max) fps +93%
NVIDIA GeForce RTX 3070, AMD Ryzen 9 5900X
37 (17.44min, 25.32P1 - 81.3max) fps +61%
AMD Radeon RX 6700 XT, AMD Ryzen 9 5900X
35.3 (21.39min, 30.37P1 - 43.92max) fps +53%
NVIDIA GeForce RTX 3060 Ti, AMD Ryzen 9 5950X
33 (17.58min, 22.09P1 - 51.23max) fps +43%
AMD Radeon RX 6600 XT, AMD Ryzen 9 5900X
24 fps +4%
AMD Radeon RX 6650 XT, AMD Ryzen 9 5900X
23 fps
AMD Radeon RX 6500 XT, AMD Ryzen 9 5900X
9.68 (7.63min, 7.98P1 - 11.83max) fps -58%
2560x1440 Ultra Preset (DX12)
NVIDIA GeForce RTX 3080 12 GB, AMD Ryzen 9 5900X
83.5 (53.47min, 66.41P1 - 132.78max) fps +70%
AMD Radeon RX 6800, AMD Ryzen 9 5900X
72.3 (47.87min, 56.5P1 - 115.42max) fps +48%
NVIDIA GeForce RTX 3070, AMD Ryzen 9 5900X
65.7 (25.01min, 51.86P1 - 96.9max) fps +34%
AMD Radeon RX 6700 XT, AMD Ryzen 9 5900X
61.9 (40.46min, 51.28P1 - 86.31max) fps +26%
NVIDIA GeForce RTX 3060 Ti, AMD Ryzen 9 5950X
59.1 (34.72min, 48.11P1 - 97.67max) fps +21%
AMD Radeon RX 6650 XT, AMD Ryzen 9 5900X
49 fps
AMD Radeon RX 6600 XT, AMD Ryzen 9 5900X
44 fps -10%
AMD Radeon RX 6500 XT, AMD Ryzen 9 5900X
18.5 (13.82min, 14.59P1 - 23.11max) fps -62%
Shadow of the Tomb Raider
1920x1080 Highest Preset AA:T
NVIDIA GeForce RTX 3080 12 GB, AMD Ryzen 9 5900X
196.1 fps +44%
AMD Radeon RX 6800, AMD Ryzen 9 5900X
182 fps +33%
AMD Radeon RX 6700 XT, AMD Ryzen 9 5900X
150 fps +10%
NVIDIA GeForce RTX 3060 Ti, AMD Ryzen 9 5950X
145 fps +6%
NVIDIA GeForce RTX 3070, AMD Ryzen 9 5900X
138 fps +1%
AMD Radeon RX 6650 XT, AMD Ryzen 9 5900X
136.5 fps
AMD Radeon RX 6600 XT, AMD Ryzen 9 5900X
131 fps -4%
AMD Radeon RX 6500 XT, AMD Ryzen 9 5900X
62.2 fps -54%
3840x2160 Highest Preset AA:T
NVIDIA GeForce RTX 3080 12 GB, AMD Ryzen 9 5900X
82.7 fps +107%
AMD Radeon RX 6800, AMD Ryzen 9 5900X
69.6 fps +74%
NVIDIA GeForce RTX 3070, AMD Ryzen 9 5900X
61 fps +53%
NVIDIA GeForce RTX 3060 Ti, AMD Ryzen 9 5950X
56 fps +40%
AMD Radeon RX 6700 XT, AMD Ryzen 9 5900X
54 fps +35%
AMD Radeon RX 6650 XT, AMD Ryzen 9 5900X
40 fps
AMD Radeon RX 6600 XT, AMD Ryzen 9 5900X
39.8 fps 0%
AMD Radeon RX 6500 XT, AMD Ryzen 9 5900X
16.5 fps -59%
2560x1440 Highest Preset AA:T
NVIDIA GeForce RTX 3080 12 GB, AMD Ryzen 9 5900X
146.7 fps +68%
AMD Radeon RX 6800, AMD Ryzen 9 5900X
134 fps +53%
NVIDIA GeForce RTX 3070, AMD Ryzen 9 5900X
108 fps +24%
NVIDIA GeForce RTX 3060 Ti, AMD Ryzen 9 5950X
103 fps +18%
AMD Radeon RX 6700 XT, AMD Ryzen 9 5900X
102 fps +17%
AMD Radeon RX 6650 XT, AMD Ryzen 9 5900X
87.3 fps
AMD Radeon RX 6600 XT, AMD Ryzen 9 5900X
84.4 fps -3%
AMD Radeon RX 6500 XT, AMD Ryzen 9 5900X
39.6 fps -55%
Metro Exodus
1920x1080 Ultra Quality AF:16x
NVIDIA GeForce RTX 3080 12 GB, AMD Ryzen 9 5900X
117.7 (60.06min - 191.39max) fps
AMD Radeon RX 6800, AMD Ryzen 9 5900X
103 (59.98min - 154.85max) fps
NVIDIA GeForce RTX 3070, AMD Ryzen 9 5900X
91.3 (46.36min - 152.74max) fps
AMD Radeon RX 6700 XT, AMD Ryzen 9 5900X
85.3 (48.66min - 131.6max) fps
NVIDIA GeForce RTX 3060 Ti, AMD Ryzen 9 5950X
84.9 (43.89min - 144.89max) fps
AMD Radeon RX 6600 XT, AMD Ryzen 9 5900X
73.1 (42.1min - 107.58max) fps
AMD Radeon RX 6500 XT, AMD Ryzen 9 5900X
40 (23.78min - 55.43max) fps
2560x1440 Ultra Quality AF:16x
NVIDIA GeForce RTX 3080 12 GB, AMD Ryzen 9 5900X
97.9 (53.22min - 169.69max) fps
AMD Radeon RX 6800, AMD Ryzen 9 5900X
86 (51.89min - 123.4max) fps
NVIDIA GeForce RTX 3070, AMD Ryzen 9 5900X
74.4 (38.95min - 129.85max) fps
AMD Radeon RX 6700 XT, AMD Ryzen 9 5900X
68.8 (41.68min - 97.98max) fps
NVIDIA GeForce RTX 3060 Ti, AMD Ryzen 9 5950X
66.2 (36.92min - 129.84max) fps
AMD Radeon RX 6600 XT, AMD Ryzen 9 5900X
56.3 (35.05min - 76.67max) fps
AMD Radeon RX 6500 XT, AMD Ryzen 9 5900X
30.5 (19.49min - 39.38max) fps
3840x2160 Ultra Quality AF:16x
NVIDIA GeForce RTX 3080 12 GB, AMD Ryzen 9 5900X
65.2 (41.36min - 117.12max) fps
AMD Radeon RX 6800, AMD Ryzen 9 5900X
54.6 (37.14min - 70.59max) fps
NVIDIA GeForce RTX 3070, AMD Ryzen 9 5900X
49.1 (30.24min - 89.89max) fps
NVIDIA GeForce RTX 3060 Ti, AMD Ryzen 9 5950X
42.7 (25.98min - 91.32max) fps
AMD Radeon RX 6700 XT, AMD Ryzen 9 5900X
42.3 (27.78min - 56.35max) fps
AMD Radeon RX 6600 XT, AMD Ryzen 9 5900X
34.2 (23min - 43.66max) fps
AMD Radeon RX 6500 XT, AMD Ryzen 9 5900X
13.3 (7.34min - 21.56max) fps
Borderlands 3
1920x1080 Badass Overall Quality (DX11)
NVIDIA GeForce RTX 3080 12 GB, AMD Ryzen 9 5900X
128.5 fps +48%
AMD Radeon RX 6800, AMD Ryzen 9 5900X
100 fps +15%
NVIDIA GeForce RTX 3060 Ti, AMD Ryzen 9 5950X
96 fps +11%
NVIDIA GeForce RTX 3070, AMD Ryzen 9 5900X
95.8 fps +10%
AMD Radeon RX 6700 XT, AMD Ryzen 9 5900X
94.2 fps +9%
AMD Radeon RX 6650 XT, AMD Ryzen 9 5900X
86.8 fps
AMD Radeon RX 6600 XT, AMD Ryzen 9 5900X
81.9 fps -6%
AMD Radeon RX 6500 XT, AMD Ryzen 9 5900X
45 fps -48%
2560x1440 Badass Overall Quality (DX11)
NVIDIA GeForce RTX 3080 12 GB, AMD Ryzen 9 5900X
104 fps +73%
AMD Radeon RX 6800, AMD Ryzen 9 5900X
86.3 fps +44%
NVIDIA GeForce RTX 3070, AMD Ryzen 9 5900X
75.9 fps +27%
NVIDIA GeForce RTX 3060 Ti, AMD Ryzen 9 5950X
70.2 fps +17%
AMD Radeon RX 6700 XT, AMD Ryzen 9 5900X
66.9 fps +12%
AMD Radeon RX 6650 XT, AMD Ryzen 9 5900X
60 fps
AMD Radeon RX 6600 XT, AMD Ryzen 9 5900X
57 fps -5%
AMD Radeon RX 6500 XT, AMD Ryzen 9 5900X
30.6 fps -49%
3840x2160 Badass Overall Quality (DX11)
NVIDIA GeForce RTX 3080 12 GB, AMD Ryzen 9 5900X
59.9 fps +90%
AMD Radeon RX 6800, AMD Ryzen 9 5900X
48.6 fps +54%
NVIDIA GeForce RTX 3070, AMD Ryzen 9 5900X
44.2 fps +40%
NVIDIA GeForce RTX 3060 Ti, AMD Ryzen 9 5950X
38.4 fps +22%
AMD Radeon RX 6700 XT, AMD Ryzen 9 5900X
36.1 fps +15%
AMD Radeon RX 6650 XT, AMD Ryzen 9 5900X
31.5 fps
AMD Radeon RX 6600 XT, AMD Ryzen 9 5900X
29.9 fps -5%
AMD Radeon RX 6500 XT, AMD Ryzen 9 5900X
12 fps -62%
Control
1920x1080 High Quality Preset (DX11)
NVIDIA GeForce RTX 3080 12 GB, AMD Ryzen 9 5900X
166.8 (45.9min, 111.7P0.1, 133.8P1 - 426max) fps +80%
AMD Radeon RX 6800, AMD Ryzen 9 5900X
145 (75.5min, 87.6P0.1, 104P1 - 264max) fps +56%
NVIDIA GeForce RTX 3070, AMD Ryzen 9 5900X
122 (103min - 138max) fps +31%
AMD Radeon RX 6700 XT, AMD Ryzen 9 5900X
115 fps +24%
NVIDIA GeForce RTX 3060 Ti, AMD Ryzen 9 5950X
110 (44.9min, 59.8P0.1, 86.1P1 - 407max) fps +19%
AMD Radeon RX 6650 XT, AMD Ryzen 9 5900X
92.8 (47.3min, 49.5P0.1, 52.5P1 - 333max) fps
AMD Radeon RX 6600 XT, AMD Ryzen 9 5900X
84 fps -9%
AMD Radeon RX 6500 XT, AMD Ryzen 9 5900X
44.9 (35.1min, 36.3P0.1, 38.2P1 - 54.9max) fps -52%
2560x1440 High Quality Preset (DX11)
NVIDIA GeForce RTX 3080 12 GB, AMD Ryzen 9 5900X
112.1 (36.4min, 84.1P0.1, 92.4P1 - 380max) fps +91%
AMD Radeon RX 6800, AMD Ryzen 9 5900X
92.8 (63.5min, 66.5P0.1, 71.5P1 - 138max) fps +58%
NVIDIA GeForce RTX 3070, AMD Ryzen 9 5900X
82.5 (72min - 96max) fps +41%
AMD Radeon RX 6700 XT, AMD Ryzen 9 5900X
72 fps +23%
NVIDIA GeForce RTX 3060 Ti, AMD Ryzen 9 5950X
71.9 (40min, 52.7P0.1, 59.4P1 - 189max) fps +23%
AMD Radeon RX 6650 XT, AMD Ryzen 9 5900X
58.6 (31.2min, 31.4P0.1, 33.2P1 - 216max) fps
AMD Radeon RX 6600 XT, AMD Ryzen 9 5900X
52.6 fps -10%
AMD Radeon RX 6500 XT, AMD Ryzen 9 5900X
27.9 (22.6min, 23.3P0.1, 24.4P1 - 32.3max) fps -52%
3840x2160 High Quality Preset (DX11)
NVIDIA GeForce RTX 3080 12 GB, AMD Ryzen 9 5900X
57.9 (35.7min, 40P0.1, 49.2P1 - 96.5max) fps +104%
AMD Radeon RX 6800, AMD Ryzen 9 5900X
43.8 (35.5min, 36.2P0.1, 37.1P1 - 53.5max) fps +54%
NVIDIA GeForce RTX 3070, AMD Ryzen 9 5900X
42.3 (37min - 49max) fps +49%
NVIDIA GeForce RTX 3060 Ti, AMD Ryzen 9 5950X
36.1 (28min, 28.5P0.1, 30.7P1 - 52.8max) fps +27%
AMD Radeon RX 6700 XT, AMD Ryzen 9 5900X
34 fps +20%
AMD Radeon RX 6650 XT, AMD Ryzen 9 5900X
28.4 (14.9min, 15.4P0.1, 16P1 - 128.4max) fps
AMD Radeon RX 6600 XT, AMD Ryzen 9 5900X
25.6 fps -10%
AMD Radeon RX 6500 XT, AMD Ryzen 9 5900X
11.9 (7.3min, 7.58P0.1, 8.29P1 - 14.8max) fps -58%
Cyberpunk 2077 1.6
3840x2160 Ultra Preset
AMD Radeon RX 6800, AMD Ryzen 9 5900X
31.7 fps +76%
AMD Radeon RX 6700 XT, AMD Ryzen 9 5900X
23.1 fps +28%
AMD Radeon RX 6650 XT, AMD Ryzen 9 5900X
18 fps
AMD Radeon RX 6600 XT, AMD Ryzen 9 5900X
14.1 fps -22%
AMD Radeon RX 6500 XT, AMD Ryzen 9 5900X
3 fps -83%
1920x1080 Ultra Preset
AMD Radeon RX 6800, AMD Ryzen 9 5900X
78.4 fps +1%
AMD Radeon RX 6650 XT, AMD Ryzen 9 5900X
78 fps
AMD Radeon RX 6700 XT, AMD Ryzen 9 5900X
76.9 fps -1%
AMD Radeon RX 6600 XT, AMD Ryzen 9 5900X
68.6 fps -12%
AMD Radeon RX 6500 XT, AMD Ryzen 9 5900X
31.4 fps -60%
2560x1440 Ultra Preset
AMD Radeon RX 6800, AMD Ryzen 9 5900X
70.2 fps +60%
AMD Radeon RX 6700 XT, AMD Ryzen 9 5900X
53.7 fps +22%
AMD Radeon RX 6650 XT, AMD Ryzen 9 5900X
44 fps
AMD Radeon RX 6600 XT, AMD Ryzen 9 5900X
40.2 fps -9%
AMD Radeon RX 6500 XT, AMD Ryzen 9 5900X
16.5 fps -62%
low med. high ultraQHD4K
GTA V (2015) 187.5 187.1 183 107.6 74.9 68.3
The Witcher 3 (2015) 473 334 181.7 107.4 54.5
Dota 2 Reborn (2015) 192.2 164.1 153.4 135.6 90.8
Rise of the Tomb Raider (2016) 434 291 164.9 136.4 56.3
Final Fantasy XV Benchmark (2018) 232 142.3 102 72.7 38.6
X-Plane 11.11 (2018) 111.3 80.4 64 40.1
Far Cry 5 (2018) 195 165 154 146 114 55
Strange Brigade (2018) 576 266 216 188.2 122.3 61.1
Shadow of the Tomb Raider (2018) 278 173.1 158 136.5 87.3 40
Far Cry New Dawn (2019) 164 143 138 124 111 61
Anno 1800 (2019) 143.9 132.3 105.7 52.7 42.9 23.9
Control (2019) 240 135.5 92.8 58.6 28.4
Borderlands 3 (2019) 174 153.4 111.9 86.8 60 31.5
F1 2020 (2020) 436 315 255 169.7 123.8 68.2
Crysis Remastered (2020) 314 250 99.6 89.1 58.2 29.8
Mafia Definitive Edition (2020) 209 114.2 72.3 34.1
Watch Dogs Legion (2020) 137 133 119 65 49 23
Dirt 5 (2020) 309 167 127 98 77 49
F1 2021 (2021) 490 369 267 116.6 80.6 41.4
New World (2021) 156.4 118 108.1 97.8 64 32.6
Far Cry 6 (2021) 165.9 145.5 130.2 110.5 76.4 5.52
Riders Republic (2021) 139 133 119 107 75 34
Forza Horizon 5 (2021) 254 183 169 85 66 42
Farming Simulator 22 (2021) 280 211 174.4 156.6 147.4 87
God of War (2022) 117.4 92.7 64.7 50.8 29.8
Rainbow Six Extraction (2022) 240 180 180 131 87 41
GRID Legends (2022) 260 232 193 155 121 71
Cyberpunk 2077 1.6 (2022) 83 82 79 78 44 18
Ghostwire Tokyo (2022) 229 181.1 166.9 162.2 99.8 44.1
Tiny Tina's Wonderlands (2022) 255 197.4 124.5 96.2 64.6 23.8
Vampire Bloodhunt (2022) 354 253 221 208 134.5 64.3
F1 22 (2022) 286 262 204 50 30 14
The Quarry (2022) 155.7 116 92.8 69.2 44.5 10.4

Compute performance

The raw performance of the graphics card can be seen very clearly in our render tests. The gap to the AMD Radeon RX 6700 XT is negligible at only 4 percent. The Nvidia GeForce RTX 3060 Ti cannot keep up here, and even gets outperformed by 19 percent.

Performance Rating - Percent
AMD Radeon RX 6800
80.5 pt
KFA2 GeForce RTX 3080 SG
76.7 pt
AMD Radeon RX 6700 XT
69.7 pt
Sapphire Nitro+ Radeon RX 6650 XT
67.1 pt
AMD Radeon RX 6600 XT
58.2 pt
MSI GeForce RTX 3070 Gaming X Trio
58 pt
NVIDIA GeForce RTX 3060 Ti Founders Edition
56.4 pt
Sapphire Pulse Radeon RX 6500 XT
37.6 pt
ComputeMark v2.1
1024x600 Normal, QJuliaRayTrace
KFA2 GeForce RTX 3080 SG
15594 Points +138%
MSI GeForce RTX 3070 Gaming X Trio
11816 Points +81%
NVIDIA GeForce RTX 3060 Ti Founders Edition
10072 Points +54%
AMD Radeon RX 6800
9343 Points +43%
AMD Radeon RX 6700 XT
7537 Points +15%
Sapphire Nitro+ Radeon RX 6650 XT
6544 Points
AMD Radeon RX 6600 XT
6423 Points -2%
Sapphire Pulse Radeon RX 6500 XT
5940 Points -9%
1024x600 Normal, Mandel Scalar
KFA2 GeForce RTX 3080 SG
9698 Points +74%
AMD Radeon RX 6800
8520 Points +53%
MSI GeForce RTX 3070 Gaming X Trio
7314 Points +31%
AMD Radeon RX 6700 XT
6430 Points +15%
NVIDIA GeForce RTX 3060 Ti Founders Edition
6087 Points +9%
Sapphire Nitro+ Radeon RX 6650 XT
5571 Points
AMD Radeon RX 6600 XT
5413 Points -3%
Sapphire Pulse Radeon RX 6500 XT
3393 Points -39%
1024x600 Normal, Mandel Vector
KFA2 GeForce RTX 3080 SG
8326 Points +72%
AMD Radeon RX 6800
7283 Points +50%
MSI GeForce RTX 3070 Gaming X Trio
5490 Points +13%
AMD Radeon RX 6700 XT
5478 Points +13%
Sapphire Nitro+ Radeon RX 6650 XT
4844 Points
AMD Radeon RX 6600 XT
4805 Points -1%
NVIDIA GeForce RTX 3060 Ti Founders Edition
4782 Points -1%
Sapphire Pulse Radeon RX 6500 XT
3371 Points -30%
1024x600 Normal, Fluid 2DTexArr
KFA2 GeForce RTX 3080 SG
4175 Points +144%
AMD Radeon RX 6800
3144 Points +84%
MSI GeForce RTX 3070 Gaming X Trio
2704 Points +58%
NVIDIA GeForce RTX 3060 Ti Founders Edition
2619 Points +53%
AMD Radeon RX 6700 XT
2430 Points +42%
Sapphire Nitro+ Radeon RX 6650 XT
1708 Points
AMD Radeon RX 6600 XT
1627 Points -5%
Sapphire Pulse Radeon RX 6500 XT
1273 Points -25%
1024x600 Normal, Fluid 3DTex
KFA2 GeForce RTX 3080 SG
4900 Points +175%
AMD Radeon RX 6800
4674 Points +163%
AMD Radeon RX 6700 XT
3317 Points +86%
MSI GeForce RTX 3070 Gaming X Trio
2776 Points +56%
NVIDIA GeForce RTX 3060 Ti Founders Edition
2685 Points +51%
Sapphire Nitro+ Radeon RX 6650 XT
1779 Points
AMD Radeon RX 6600 XT
1705 Points -4%
Sapphire Pulse Radeon RX 6500 XT
1293 Points -27%
1024x600 Normal, Score
KFA2 GeForce RTX 3080 SG
42692 Points +109%
AMD Radeon RX 6800
32965 Points +61%
MSI GeForce RTX 3070 Gaming X Trio
30100 Points +47%
NVIDIA GeForce RTX 3060 Ti Founders Edition
26245 Points +28%
AMD Radeon RX 6700 XT
25193 Points +23%
Sapphire Nitro+ Radeon RX 6650 XT
20446 Points
AMD Radeon RX 6600 XT
19973 Points -2%
Sapphire Pulse Radeon RX 6500 XT
15271 Points -25%
SPECviewperf 13
Solidworks (sw-04)
AMD Radeon RX 6700 XT
201 fps +2%
AMD Radeon RX 6800
200 fps +2%
Sapphire Nitro+ Radeon RX 6650 XT
197 fps
AMD Radeon RX 6600 XT
184 fps -7%
Sapphire Pulse Radeon RX 6500 XT
142 fps -28%
KFA2 GeForce RTX 3080 SG
108 fps -45%
NVIDIA GeForce RTX 3060 Ti Founders Edition
99.6 fps -49%
MSI GeForce RTX 3070 Gaming X Trio
84.8 fps -57%
Siemens NX (snx-03)
Sapphire Nitro+ Radeon RX 6650 XT
394 fps
AMD Radeon RX 6600 XT
88.1 fps -78%
AMD Radeon RX 6700 XT
87.8 fps -78%
AMD Radeon RX 6800
84.7 fps -79%
Sapphire Pulse Radeon RX 6500 XT
76.4 fps -81%
KFA2 GeForce RTX 3080 SG
26.3 fps -93%
MSI GeForce RTX 3070 Gaming X Trio
22.36 fps -94%
NVIDIA GeForce RTX 3060 Ti Founders Edition
22.3 fps -94%
Showcase (showcase-02)
KFA2 GeForce RTX 3080 SG
228 fps +52%
AMD Radeon RX 6800
194 fps +29%
AMD Radeon RX 6700 XT
150 fps 0%
Sapphire Nitro+ Radeon RX 6650 XT
150 fps
MSI GeForce RTX 3070 Gaming X Trio
145.5 fps -3%
NVIDIA GeForce RTX 3060 Ti Founders Edition
145 fps -3%
AMD Radeon RX 6600 XT
111 fps -26%
Sapphire Pulse Radeon RX 6500 XT
56.3 fps -62%
Medical (medical-02)
AMD Radeon RX 6800
113 fps +7%
Sapphire Nitro+ Radeon RX 6650 XT
106 fps
AMD Radeon RX 6700 XT
104 fps -2%
KFA2 GeForce RTX 3080 SG
102 fps -4%
AMD Radeon RX 6600 XT
89.6 fps -15%
MSI GeForce RTX 3070 Gaming X Trio
81.8 fps -23%
NVIDIA GeForce RTX 3060 Ti Founders Edition
72.2 fps -32%
Sapphire Pulse Radeon RX 6500 XT
58.8 fps -45%
Maya (maya-05)
KFA2 GeForce RTX 3080 SG
460 fps +21%
Sapphire Nitro+ Radeon RX 6650 XT
381 fps
AMD Radeon RX 6800
356 fps -7%
NVIDIA GeForce RTX 3060 Ti Founders Edition
344 fps -10%
AMD Radeon RX 6700 XT
325 fps -15%
AMD Radeon RX 6600 XT
283 fps -26%
MSI GeForce RTX 3070 Gaming X Trio
256.5 fps -33%
Sapphire Pulse Radeon RX 6500 XT
168 fps -56%
Energy (energy-02)
AMD Radeon RX 6800
49.7 fps +15%
Sapphire Nitro+ Radeon RX 6650 XT
43.2 fps
AMD Radeon RX 6700 XT
40 fps -7%
KFA2 GeForce RTX 3080 SG
37.6 fps -13%
AMD Radeon RX 6600 XT
29.8 fps -31%
MSI GeForce RTX 3070 Gaming X Trio
29.12 fps -33%
NVIDIA GeForce RTX 3060 Ti Founders Edition
25.6 fps -41%
Sapphire Pulse Radeon RX 6500 XT
13.8 fps -68%
Creo (creo-02)
KFA2 GeForce RTX 3080 SG
324 fps +20%
Sapphire Nitro+ Radeon RX 6650 XT
271 fps
AMD Radeon RX 6800
269 fps -1%
AMD Radeon RX 6700 XT
248 fps -8%
AMD Radeon RX 6600 XT
242 fps -11%
MSI GeForce RTX 3070 Gaming X Trio
227.7 fps -16%
NVIDIA GeForce RTX 3060 Ti Founders Edition
225 fps -17%
Sapphire Pulse Radeon RX 6500 XT
153 fps -44%
Catia (catia-05)
AMD Radeon RX 6800
420 fps +23%
AMD Radeon RX 6700 XT
398 fps +16%
AMD Radeon RX 6600 XT
353 fps +3%
Sapphire Nitro+ Radeon RX 6650 XT
342 fps
Sapphire Pulse Radeon RX 6500 XT
217 fps -37%
KFA2 GeForce RTX 3080 SG
206 fps -40%
MSI GeForce RTX 3070 Gaming X Trio
168.7 fps -51%
NVIDIA GeForce RTX 3060 Ti Founders Edition
161 fps -53%
3ds Max (3dsmax-06)
KFA2 GeForce RTX 3080 SG
334 fps +12%
AMD Radeon RX 6800
309 fps +4%
Sapphire Nitro+ Radeon RX 6650 XT
298 fps
AMD Radeon RX 6700 XT
265 fps -11%
MSI GeForce RTX 3070 Gaming X Trio
252.1 fps -15%
NVIDIA GeForce RTX 3060 Ti Founders Edition
252 fps -15%
AMD Radeon RX 6600 XT
237 fps -20%
Sapphire Pulse Radeon RX 6500 XT
141 fps -53%
SPECviewperf 12
1900x1060 Solidworks (sw-03)
AMD Radeon RX 6700 XT
163 fps +26%
AMD Radeon RX 6800
149 fps +16%
AMD Radeon RX 6600 XT
145 fps +12%
Sapphire Nitro+ Radeon RX 6650 XT
129 fps
Sapphire Pulse Radeon RX 6500 XT
111 fps -14%
KFA2 GeForce RTX 3080 SG
73.8 fps -43%
NVIDIA GeForce RTX 3060 Ti Founders Edition
71.1 fps -45%
MSI GeForce RTX 3070 Gaming X Trio
61.7 fps -52%
1900x1060 Siemens NX (snx-02)
Sapphire Nitro+ Radeon RX 6650 XT
143 fps
AMD Radeon RX 6700 XT
49.6 fps -65%
AMD Radeon RX 6600 XT
48.8 fps -66%
AMD Radeon RX 6800
46.2 fps -68%
Sapphire Pulse Radeon RX 6500 XT
41.9 fps -71%
MSI GeForce RTX 3070 Gaming X Trio
12.71 fps -91%
NVIDIA GeForce RTX 3060 Ti Founders Edition
12.3 fps -91%
KFA2 GeForce RTX 3080 SG
12 fps -92%
1900x1060 Showcase (showcase-01)
KFA2 GeForce RTX 3080 SG
226 fps +52%
AMD Radeon RX 6800
194 fps +30%
MSI GeForce RTX 3070 Gaming X Trio
153.9 fps +3%
AMD Radeon RX 6700 XT
150 fps +1%
Sapphire Nitro+ Radeon RX 6650 XT
149 fps
NVIDIA GeForce RTX 3060 Ti Founders Edition
144 fps -3%
AMD Radeon RX 6600 XT
111 fps -26%
Sapphire Pulse Radeon RX 6500 XT
56.2 fps -62%
1900x1060 Medical (medical-01)
AMD Radeon RX 6700 XT
66.3 fps +82%
NVIDIA GeForce RTX 3060 Ti Founders Edition
59.4 fps +63%
AMD Radeon RX 6800
58.1 fps +60%
AMD Radeon RX 6600 XT
54.9 fps +51%
KFA2 GeForce RTX 3080 SG
40.3 fps +11%
Sapphire Pulse Radeon RX 6500 XT
39.2 fps +8%
MSI GeForce RTX 3070 Gaming X Trio
36.68 fps +1%
Sapphire Nitro+ Radeon RX 6650 XT
36.4 fps
1900x1060 Maya (maya-04)
NVIDIA GeForce RTX 3060 Ti Founders Edition
197 fps +139%
MSI GeForce RTX 3070 Gaming X Trio
176.4 fps +114%
AMD Radeon RX 6700 XT
145 fps +76%
KFA2 GeForce RTX 3080 SG
139 fps +69%
AMD Radeon RX 6600 XT
124 fps +50%
AMD Radeon RX 6800
124 fps +50%
Sapphire Nitro+ Radeon RX 6650 XT
82.4 fps
Sapphire Pulse Radeon RX 6500 XT
79.9 fps -3%
1900x1060 Energy (energy-01)
AMD Radeon RX 6800
23.9 fps +115%
AMD Radeon RX 6700 XT
18.8 fps +69%
KFA2 GeForce RTX 3080 SG
17.2 fps +55%
AMD Radeon RX 6600 XT
14.7 fps +32%
NVIDIA GeForce RTX 3060 Ti Founders Edition
13.9 fps +25%
MSI GeForce RTX 3070 Gaming X Trio
12.53 fps +13%
Sapphire Nitro+ Radeon RX 6650 XT
11.1 fps
Sapphire Pulse Radeon RX 6500 XT
7.81 fps -30%
1900x1060 Creo (creo-01)
AMD Radeon RX 6700 XT
120 fps +69%
AMD Radeon RX 6800
120 fps +69%
AMD Radeon RX 6600 XT
111 fps +56%
Sapphire Pulse Radeon RX 6500 XT
84.3 fps +19%
KFA2 GeForce RTX 3080 SG
74.4 fps +5%
Sapphire Nitro+ Radeon RX 6650 XT
71.1 fps
NVIDIA GeForce RTX 3060 Ti Founders Edition
57.8 fps -19%
MSI GeForce RTX 3070 Gaming X Trio
57.5 fps -19%
1900x1060 Catia (catia-04)
AMD Radeon RX 6700 XT
259 fps +114%
AMD Radeon RX 6800
242 fps +100%
AMD Radeon RX 6600 XT
218 fps +80%
Sapphire Pulse Radeon RX 6500 XT
137 fps +13%
Sapphire Nitro+ Radeon RX 6650 XT
121 fps
MSI GeForce RTX 3070 Gaming X Trio
111.2 fps -8%
NVIDIA GeForce RTX 3060 Ti Founders Edition
109 fps -10%
KFA2 GeForce RTX 3080 SG
79.1 fps -35%
1900x1060 3ds Max (3dsmax-05)
KFA2 GeForce RTX 3080 SG
334 fps +14%
Sapphire Nitro+ Radeon RX 6650 XT
292 fps
AMD Radeon RX 6800
283 fps -3%
MSI GeForce RTX 3070 Gaming X Trio
267 fps -9%
AMD Radeon RX 6700 XT
253 fps -13%
NVIDIA GeForce RTX 3060 Ti Founders Edition
252 fps -14%
AMD Radeon RX 6600 XT
236 fps -19%
Sapphire Pulse Radeon RX 6500 XT
141 fps -52%
SPECviewperf 2020
3840x2160 Solidworks (solidworks-05)
KFA2 GeForce RTX 3080 SG
175 fps +123%
MSI GeForce RTX 3070 Gaming X Trio
127 fps +62%
NVIDIA GeForce RTX 3060 Ti Founders Edition
109 fps +39%
AMD Radeon RX 6800
97.5 fps +24%
AMD Radeon RX 6700 XT
80.2 fps +2%
Sapphire Nitro+ Radeon RX 6650 XT
78.6 fps
AMD Radeon RX 6600 XT
58.7 fps -25%
Sapphire Pulse Radeon RX 6500 XT
28.4 fps -64%
3840x2160 Siemens NX (snx-04)
Sapphire Nitro+ Radeon RX 6650 XT
259 fps
AMD Radeon RX 6700 XT
85 fps -67%
AMD Radeon RX 6600 XT
81 fps -69%
AMD Radeon RX 6800
81 fps -69%
Sapphire Pulse Radeon RX 6500 XT
64 fps -75%
KFA2 GeForce RTX 3080 SG
21.8 fps -92%
MSI GeForce RTX 3070 Gaming X Trio
19.37 fps -93%
NVIDIA GeForce RTX 3060 Ti Founders Edition
18.2 fps -93%
3840x2160 Medical (medical-03)
AMD Radeon RX 6800
24.1 fps +43%
AMD Radeon RX 6700 XT
18.8 fps +12%
KFA2 GeForce RTX 3080 SG
18.8 fps +12%
Sapphire Nitro+ Radeon RX 6650 XT
16.8 fps
AMD Radeon RX 6600 XT
15.9 fps -5%
MSI GeForce RTX 3070 Gaming X Trio
14.06 fps -16%
NVIDIA GeForce RTX 3060 Ti Founders Edition
11.4 fps -32%
Sapphire Pulse Radeon RX 6500 XT
10 fps -40%
3840x2160 Maya (maya-06)
KFA2 GeForce RTX 3080 SG
314 fps +100%
MSI GeForce RTX 3070 Gaming X Trio
247.1 fps +57%
AMD Radeon RX 6800
233 fps +48%
NVIDIA GeForce RTX 3060 Ti Founders Edition
215 fps +37%
AMD Radeon RX 6700 XT
193 fps +23%
Sapphire Nitro+ Radeon RX 6650 XT
157 fps
AMD Radeon RX 6600 XT
138 fps -12%
Sapphire Pulse Radeon RX 6500 XT
71.6 fps -54%
3840x2160 Energy (energy-03)
AMD Radeon RX 6800
84.1 fps +248%
KFA2 GeForce RTX 3080 SG
37.2 fps +54%
MSI GeForce RTX 3070 Gaming X Trio
26.66 fps +10%
AMD Radeon RX 6700 XT
25.7 fps +6%
Sapphire Nitro+ Radeon RX 6650 XT
24.2 fps
AMD Radeon RX 6600 XT
21.2 fps -12%
NVIDIA GeForce RTX 3060 Ti Founders Edition
14.5 fps -40%
Sapphire Pulse Radeon RX 6500 XT
10.9 fps -55%
3840x2160 Creo (creo-03)
KFA2 GeForce RTX 3080 SG
90 fps +12%
Sapphire Nitro+ Radeon RX 6650 XT
80.4 fps
NVIDIA GeForce RTX 3060 Ti Founders Edition
76.6 fps -5%
MSI GeForce RTX 3070 Gaming X Trio
74.3 fps -8%
AMD Radeon RX 6800
66.5 fps -17%
AMD Radeon RX 6700 XT
61.1 fps -24%
AMD Radeon RX 6600 XT
59.6 fps -26%
Sapphire Pulse Radeon RX 6500 XT
40.2 fps -50%
3840x2160 CATIA (catia-06)
KFA2 GeForce RTX 3080 SG
53.7 fps +34%
AMD Radeon RX 6800
45.3 fps +13%
MSI GeForce RTX 3070 Gaming X Trio
43.17 fps +7%
Sapphire Nitro+ Radeon RX 6650 XT
40.2 fps
AMD Radeon RX 6700 XT
39 fps -3%
NVIDIA GeForce RTX 3060 Ti Founders Edition
37.9 fps -6%
AMD Radeon RX 6600 XT
32.1 fps -20%
Sapphire Pulse Radeon RX 6500 XT
13.8 fps -66%
3840x2160 3ds Max (3dsmax-07)
KFA2 GeForce RTX 3080 SG
128 fps +132%
AMD Radeon RX 6800
95.5 fps +73%
MSI GeForce RTX 3070 Gaming X Trio
86.4 fps +57%
AMD Radeon RX 6700 XT
82.2 fps +49%
NVIDIA GeForce RTX 3060 Ti Founders Edition
80.1 fps +45%
Sapphire Nitro+ Radeon RX 6650 XT
55.2 fps
AMD Radeon RX 6600 XT
53.6 fps -3%
Sapphire Pulse Radeon RX 6500 XT
21.4 fps -61%

Emissions - energy demand and volume

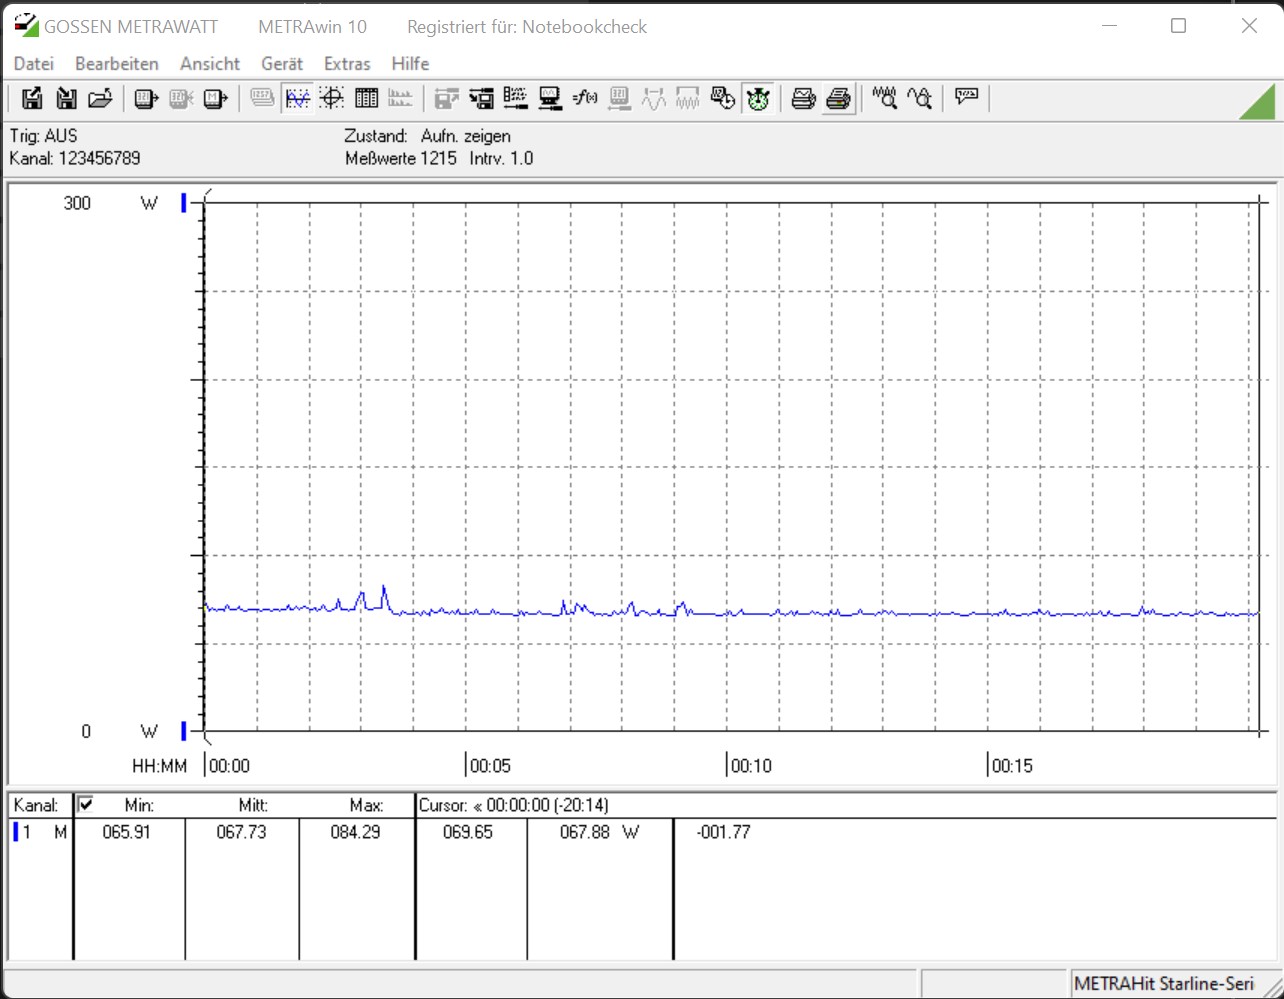
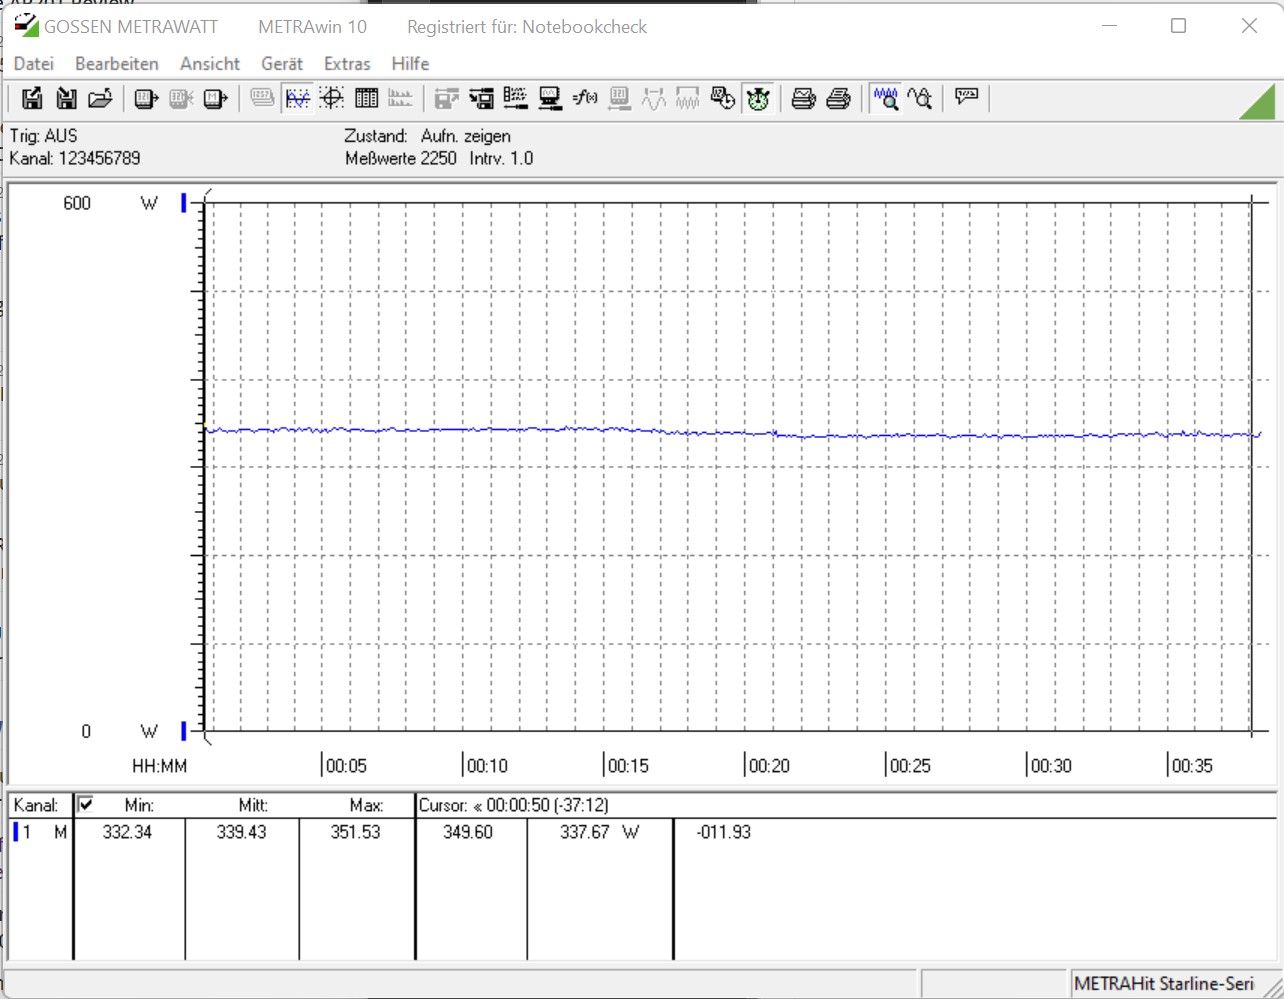
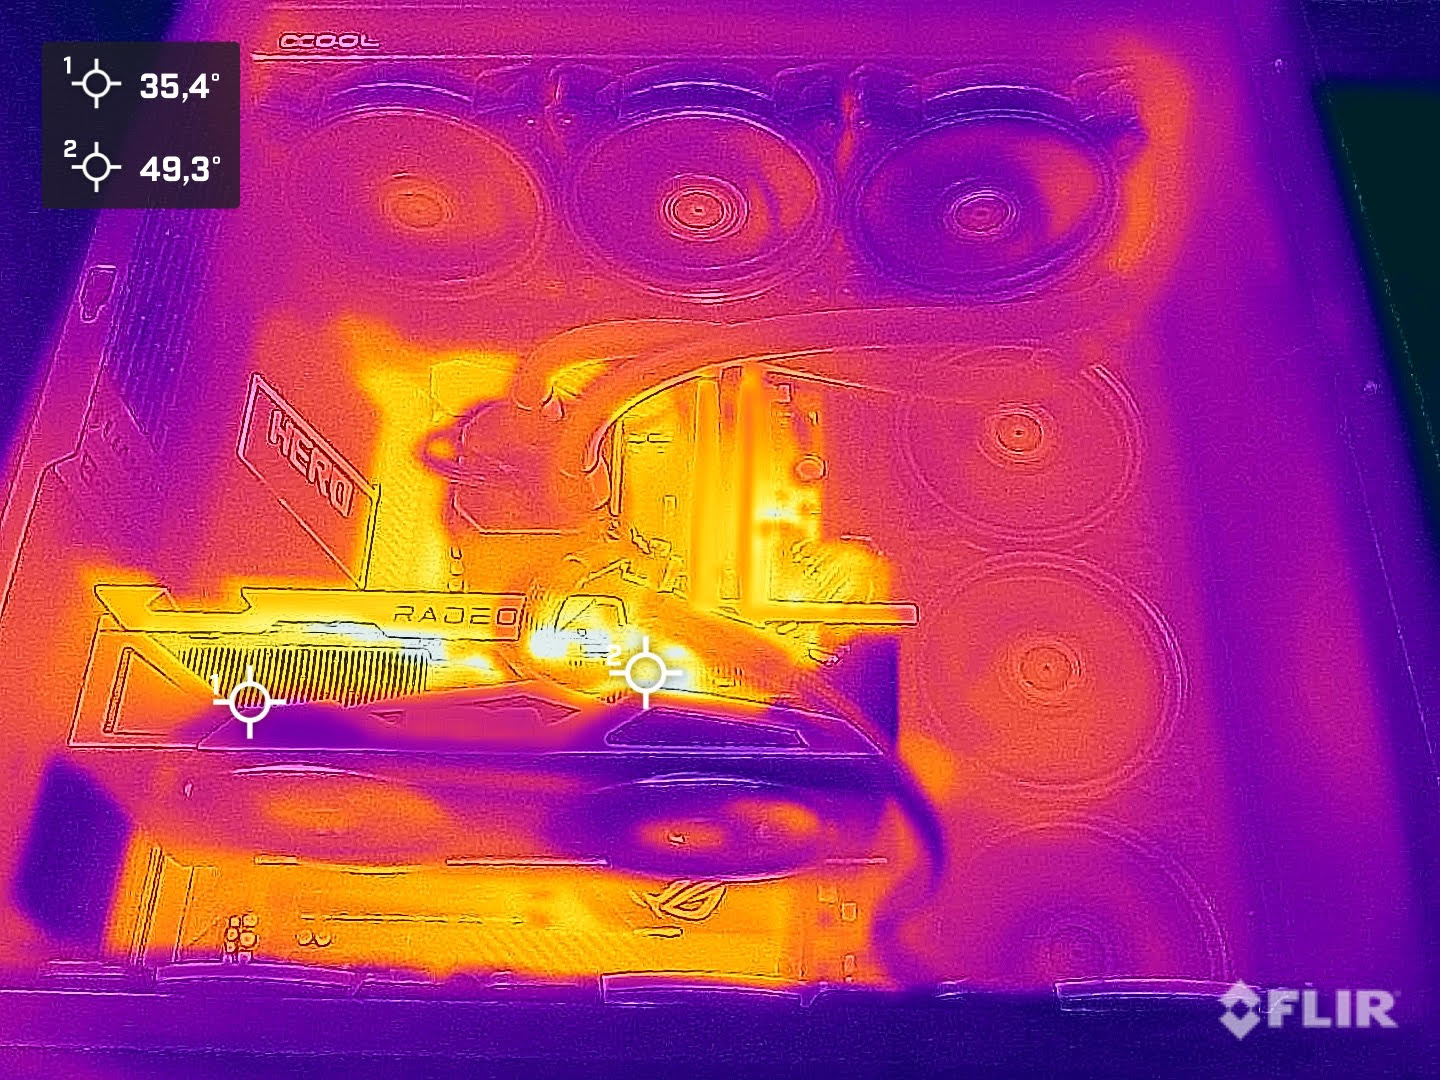
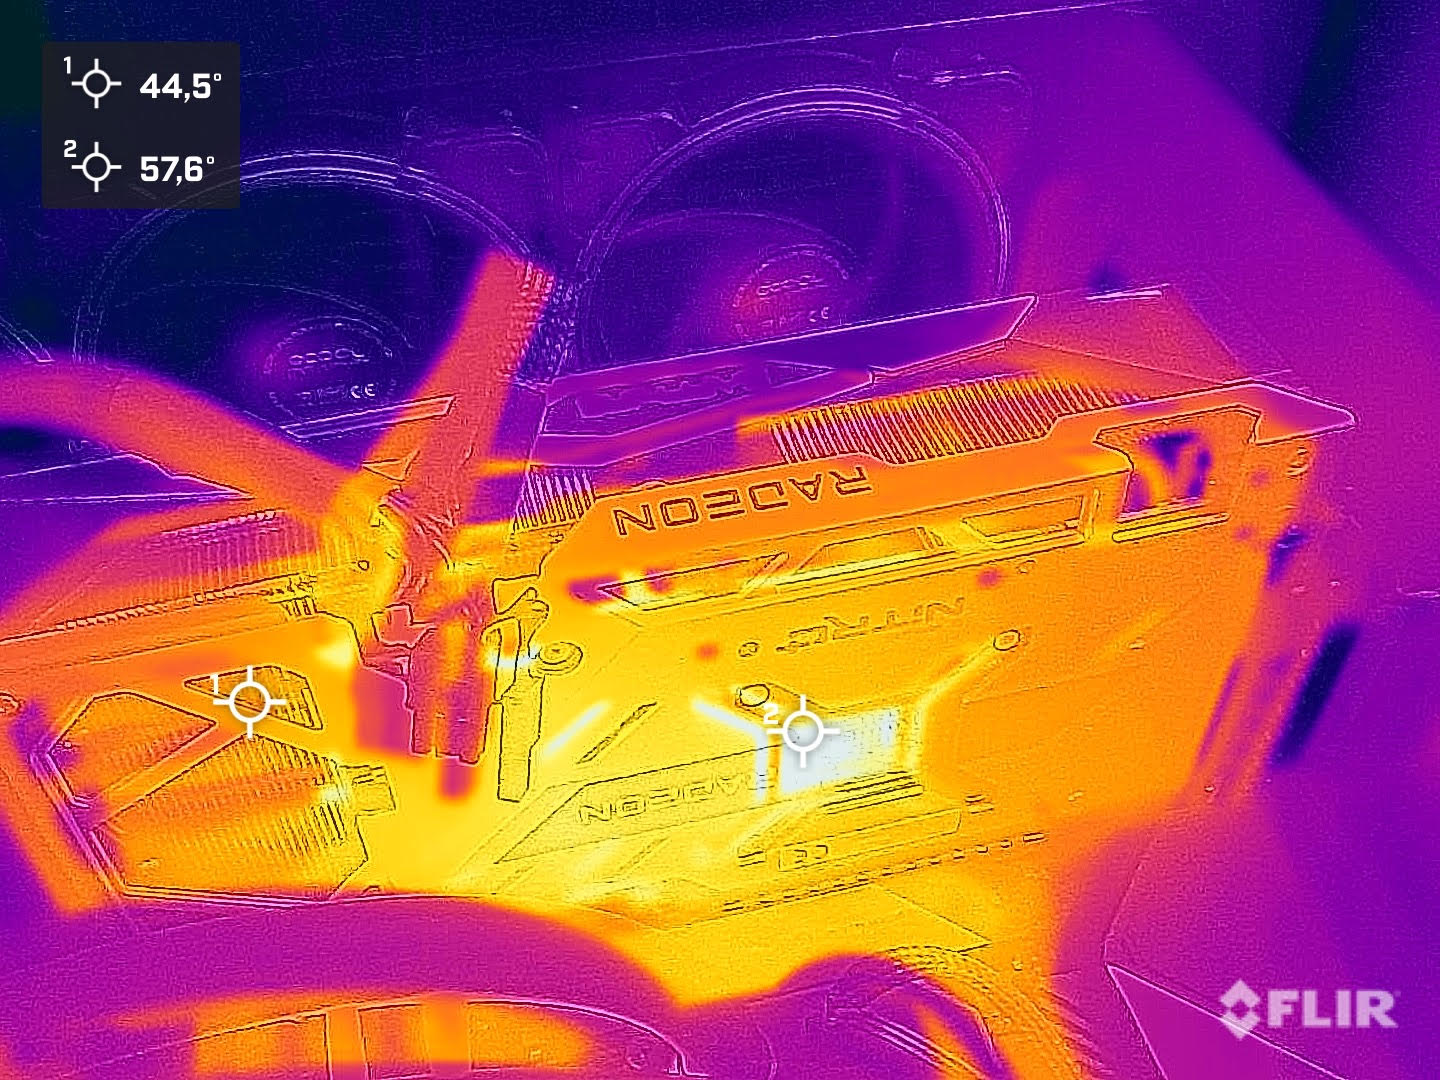
The slightly improved performance of the AMD Radeon RX 6650 XT when compared to the AMD Radeon RX 6600 XT does cause a slightly higher power consumption. We measured an average energy demand of 339 watts when gaming. The manufacturer has used a very good cooler with a large surface area, including a revised fan, which, thanks to the new design, produced a higher airflow and thus enables the graphics card to operate more quietly and cooler.

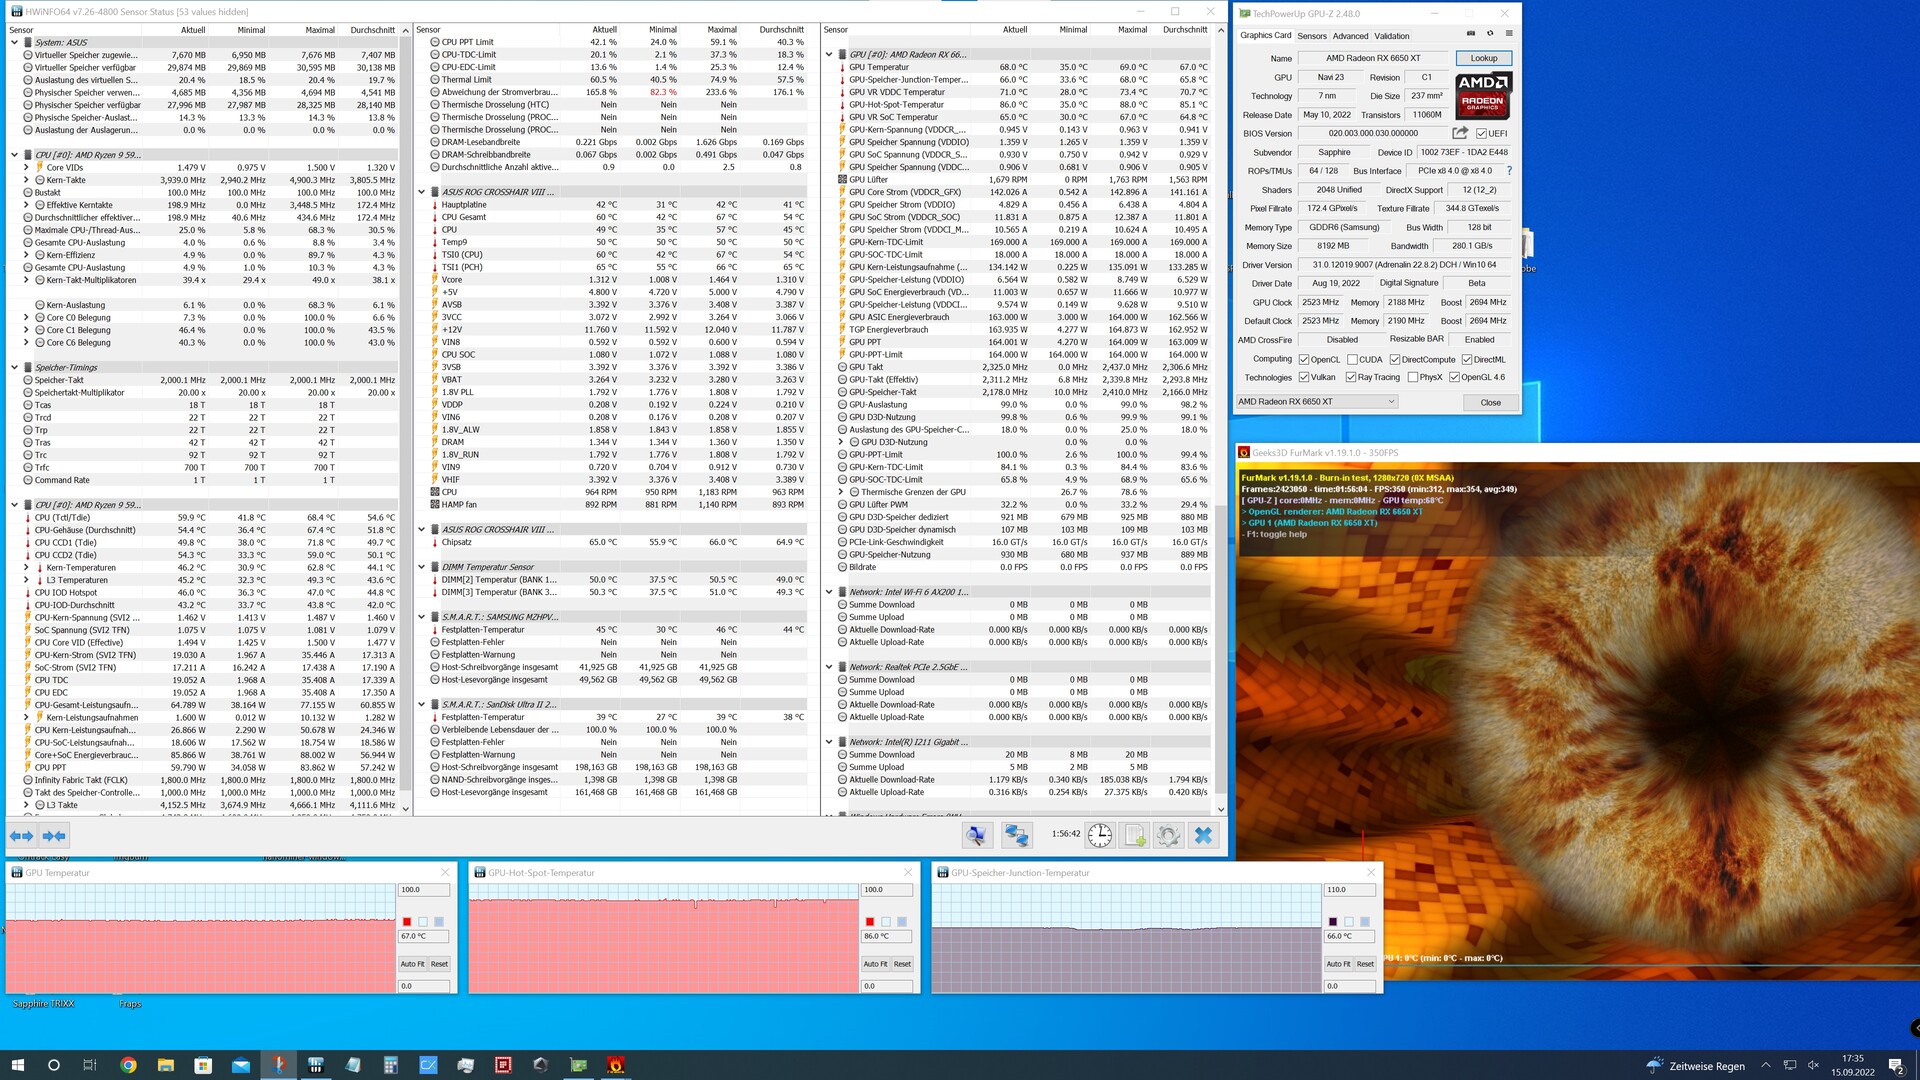
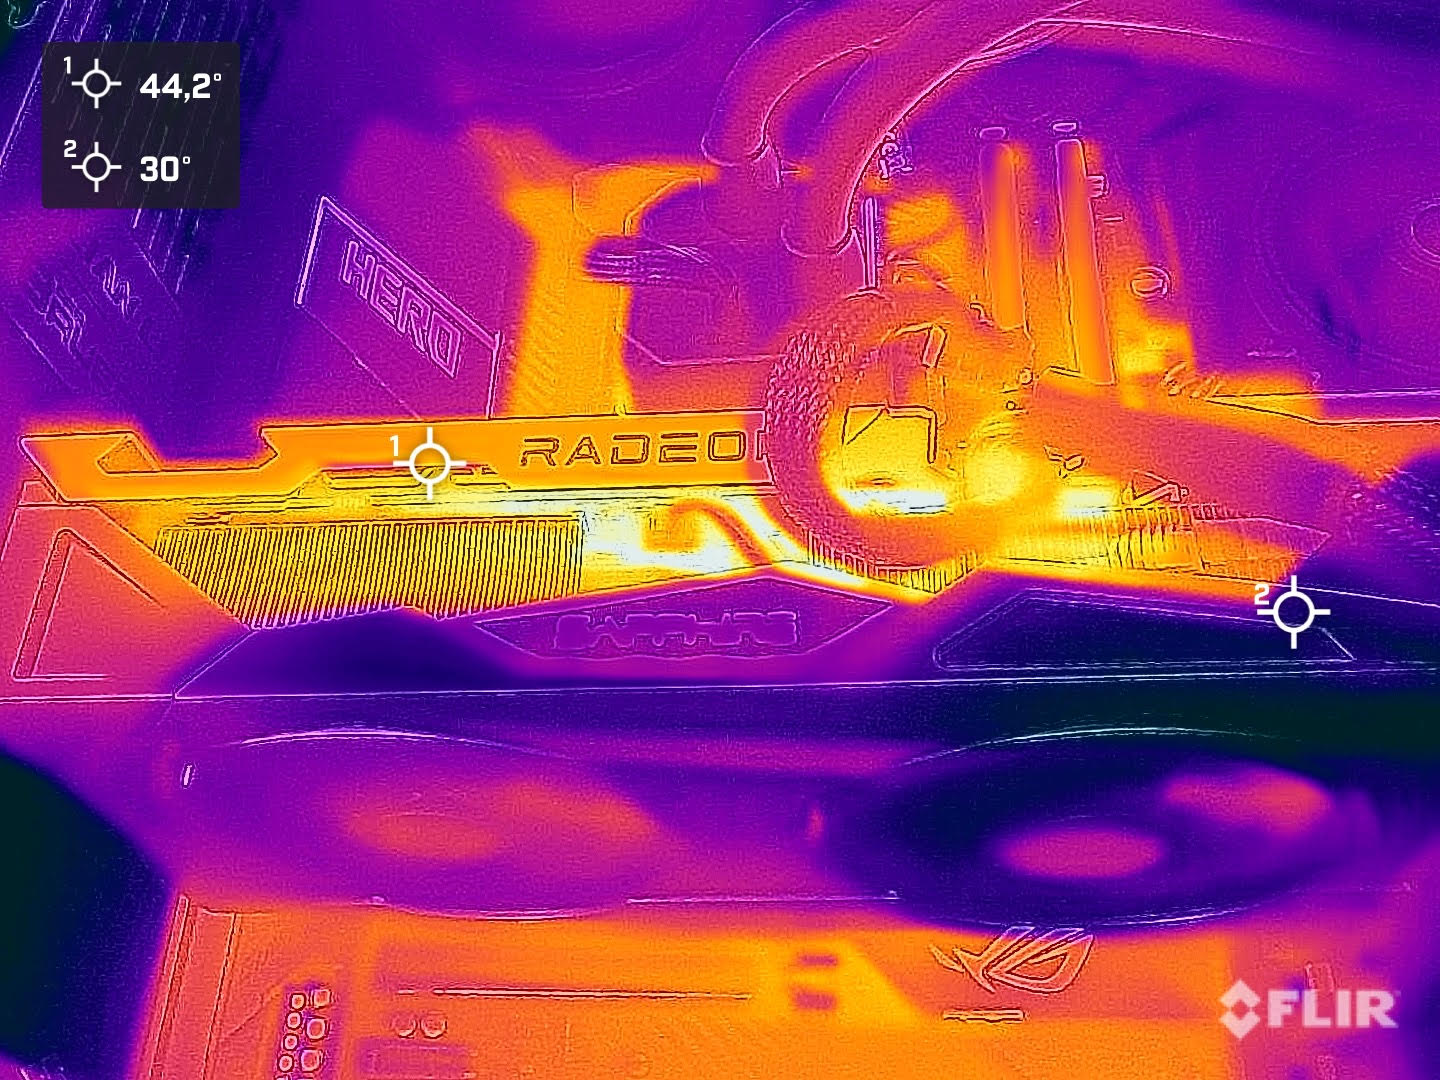
The Sapphire Nitro+ Radeon RX 6650 XT's cooling appears to work very well in our test. The GPU temperature was measured at only 69 °C (156 °F) during our stress test. The two axial fans rotated at just 1700 revolutions per minute, and the graphics card was therefore not audible from within the closed case while under load. The Sapphire Nitro+ Radeon RX 6650 XT also has a fan stop mode.

Power consumption of the test system (Idle)
Power consumption of the test system (FurMark PT 100 percent)
Power consumption of the test system (while gaming - The Witcher 3, Ultra preset)
Stress test FurMark (PT 100 percent)
The Sapphire Nitro+ Radeon RX 6650 XT during the stress test
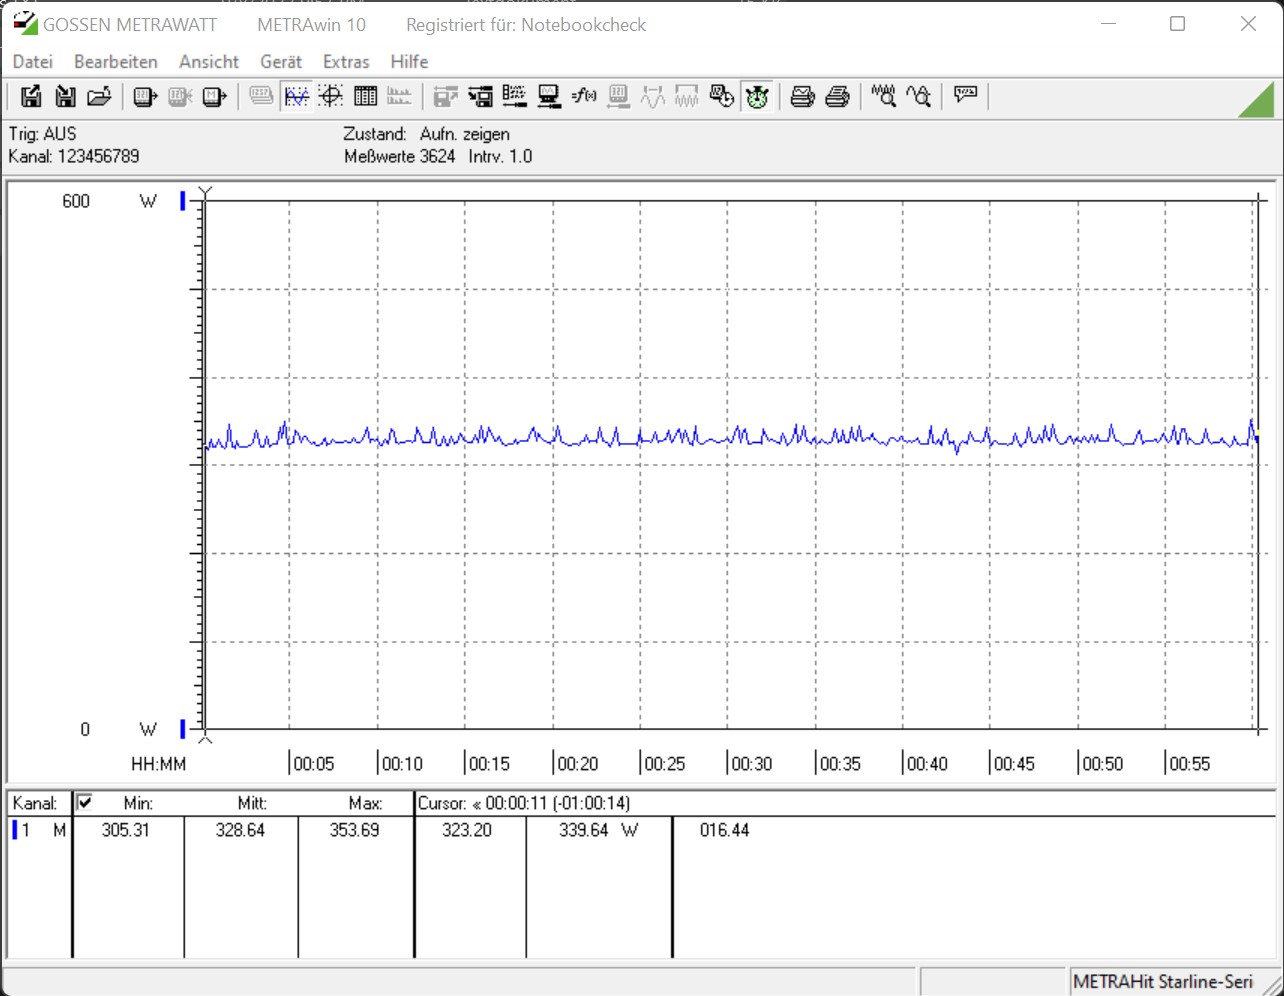
Power Consumption / The Witcher 3 ultra (external Monitor)
KFA2 GeForce RTX 3080 SG
NVIDIA GeForce RTX 3080 12 GB, R9 5900X, Corsair MP600
518 (509min, 510P1 - 539max) Watt * -53%
MSI GeForce RTX 3070 Gaming X Trio
NVIDIA GeForce RTX 3070, R9 5900X, Intel Optane 905P 480GB 2.5 (Idle: 95.1 W)
394.5 (381min - 430max) Watt * -16%
AMD Radeon RX 6800
Radeon RX 6800, R9 5900X, Corsair MP600 (Idle: 81.4 W)
383 (372min, 376P1 - 389max) Watt * -13%
NVIDIA GeForce RTX 3060 Ti Founders Edition
NVIDIA GeForce RTX 3060 Ti, R9 5950X (Idle: 111.39 W)
379 (270min, 364P1 - 409max) Watt * -12%
AMD Radeon RX 6700 XT
Radeon RX 6700 XT, R9 5900X, Corsair MP600 (Idle: 77.1 W)
369 (355min - 377max) Watt * -9%
Sapphire Nitro+ Radeon RX 6650 XT
Radeon RX 6650 XT, R9 5900X, Corsair MP600
339 (332min, 334P1 - 366max) Watt *
AMD Radeon RX 6600 XT
Radeon RX 6600 XT, R9 5900X, Corsair MP600 (Idle: 52 W)
299 (291min, 295P1 - 331max) Watt * +12%
Sapphire Pulse Radeon RX 6500 XT
Radeon RX 6500 XT, R9 5900X, Corsair MP600
219 (214min, 215P1 - 233max) Watt * +35%
Power Consumption / FurMark 1.19 GPU Stress Test (external Monitor)
KFA2 GeForce RTX 3080 SG
NVIDIA GeForce RTX 3080 12 GB, R9 5900X, Corsair MP600
487 (475min, 477P1 - 501max) Watt * -48%
MSI GeForce RTX 3070 Gaming X Trio
NVIDIA GeForce RTX 3070, R9 5900X, Intel Optane 905P 480GB 2.5 (Idle: 95.1 W)
376.9 (369min - 433max) Watt * -15%
AMD Radeon RX 6800
Radeon RX 6800, R9 5900X, Corsair MP600 (Idle: 81.4 W)
363 (337min, 347P1 - 379max) Watt * -10%
NVIDIA GeForce RTX 3060 Ti Founders Edition
NVIDIA GeForce RTX 3060 Ti, R9 5950X (Idle: 111.39 W)
350 (336min, 336P1 - 398max) Watt * -6%
AMD Radeon RX 6700 XT
Radeon RX 6700 XT, R9 5900X, Corsair MP600 (Idle: 77.1 W)
335.2 (317min - 376max) Watt * -2%
Sapphire Nitro+ Radeon RX 6650 XT
Radeon RX 6650 XT, R9 5900X, Corsair MP600
329 (305min, 319P1 - 354max) Watt *
AMD Radeon RX 6600 XT
Radeon RX 6600 XT, R9 5900X, Corsair MP600 (Idle: 52 W)
281 (257min, 274P1 - 319max) Watt * +15%
Sapphire Pulse Radeon RX 6500 XT
Radeon RX 6500 XT, R9 5900X, Corsair MP600
205 (195.1min, 201P1 - 237max) Watt * +38%
Power Consumption / Idle 1min (external Monitor)
KFA2 GeForce RTX 3080 SG
NVIDIA GeForce RTX 3080 12 GB, R9 5900X, Corsair MP600
88.3 (77.7min, 78P1 - 106.9max) Watt * -30%
AMD Radeon RX 6800
Radeon RX 6800, R9 5900X, Corsair MP600
81.5 (79.7min, 79.8P1 - 102max) Watt * -20%
Sapphire Nitro+ Radeon RX 6650 XT
Radeon RX 6650 XT, R9 5900X, Corsair MP600
67.7 (65.9min, 66.1P1 - 83.1max) Watt *
Sapphire Pulse Radeon RX 6500 XT
Radeon RX 6500 XT, R9 5900X, Corsair MP600
63.1 (59.4min, 59.4P1 - 80.9max) Watt * +7%

* ... smaller is better

Energy consumption with the external monitor

020406080100120140160180200220240260280300320340360Tooltip
Sapphire Nitro+ Radeon RX 6650 XT; 1280x720 FurMark 1.19 GPU Stress Test (external Monitor): Ø329 (305-354)
Sapphire Nitro+ Radeon RX 6650 XT; 1920x1080 The Witcher 3 ultra (external Monitor): Ø339 (332-366)
Sapphire Nitro+ Radeon RX 6650 XT; Idle 1min (external Monitor): Ø67.7 (65.9-83.1)

Pros

+ Fast enough for 1080p gaming
+ Fan stop mode
+ High quality construction
+ Powerful cooler
+ Quiet and relatively cool under load
+ Chic design with RGB lighting

Cons

- Lower Raytracing performance when compared to Nvidia models
- Triple-slot cooler - watch out for case compatibility

Verdict - Fast and quiet 1080p graphics card

Sapphire Nitro+ Radeon RX 6650 XT in review - provided by Sapphire Germany (source: Sapphire)

The Sapphire Nitro+ Radeon RX 6650 XT is undoubtedly a very good graphics card when it comes to uncompromising gaming at 1080p. The mild performance advantage it has when compared to the AMD Radeon RX 6600 XT comes, however, at the cost of increased power consumption. AMD has already taken this same route with the new AMD Radeon RX 6750 XT and AMD Radeon RX 6950 XT. The added value for the user is really not clear, given that there is no improvement in terms of efficiency. We would have preferred an increase in performance without raising the TDP, but that would probably require some major adjustments to the chip design.

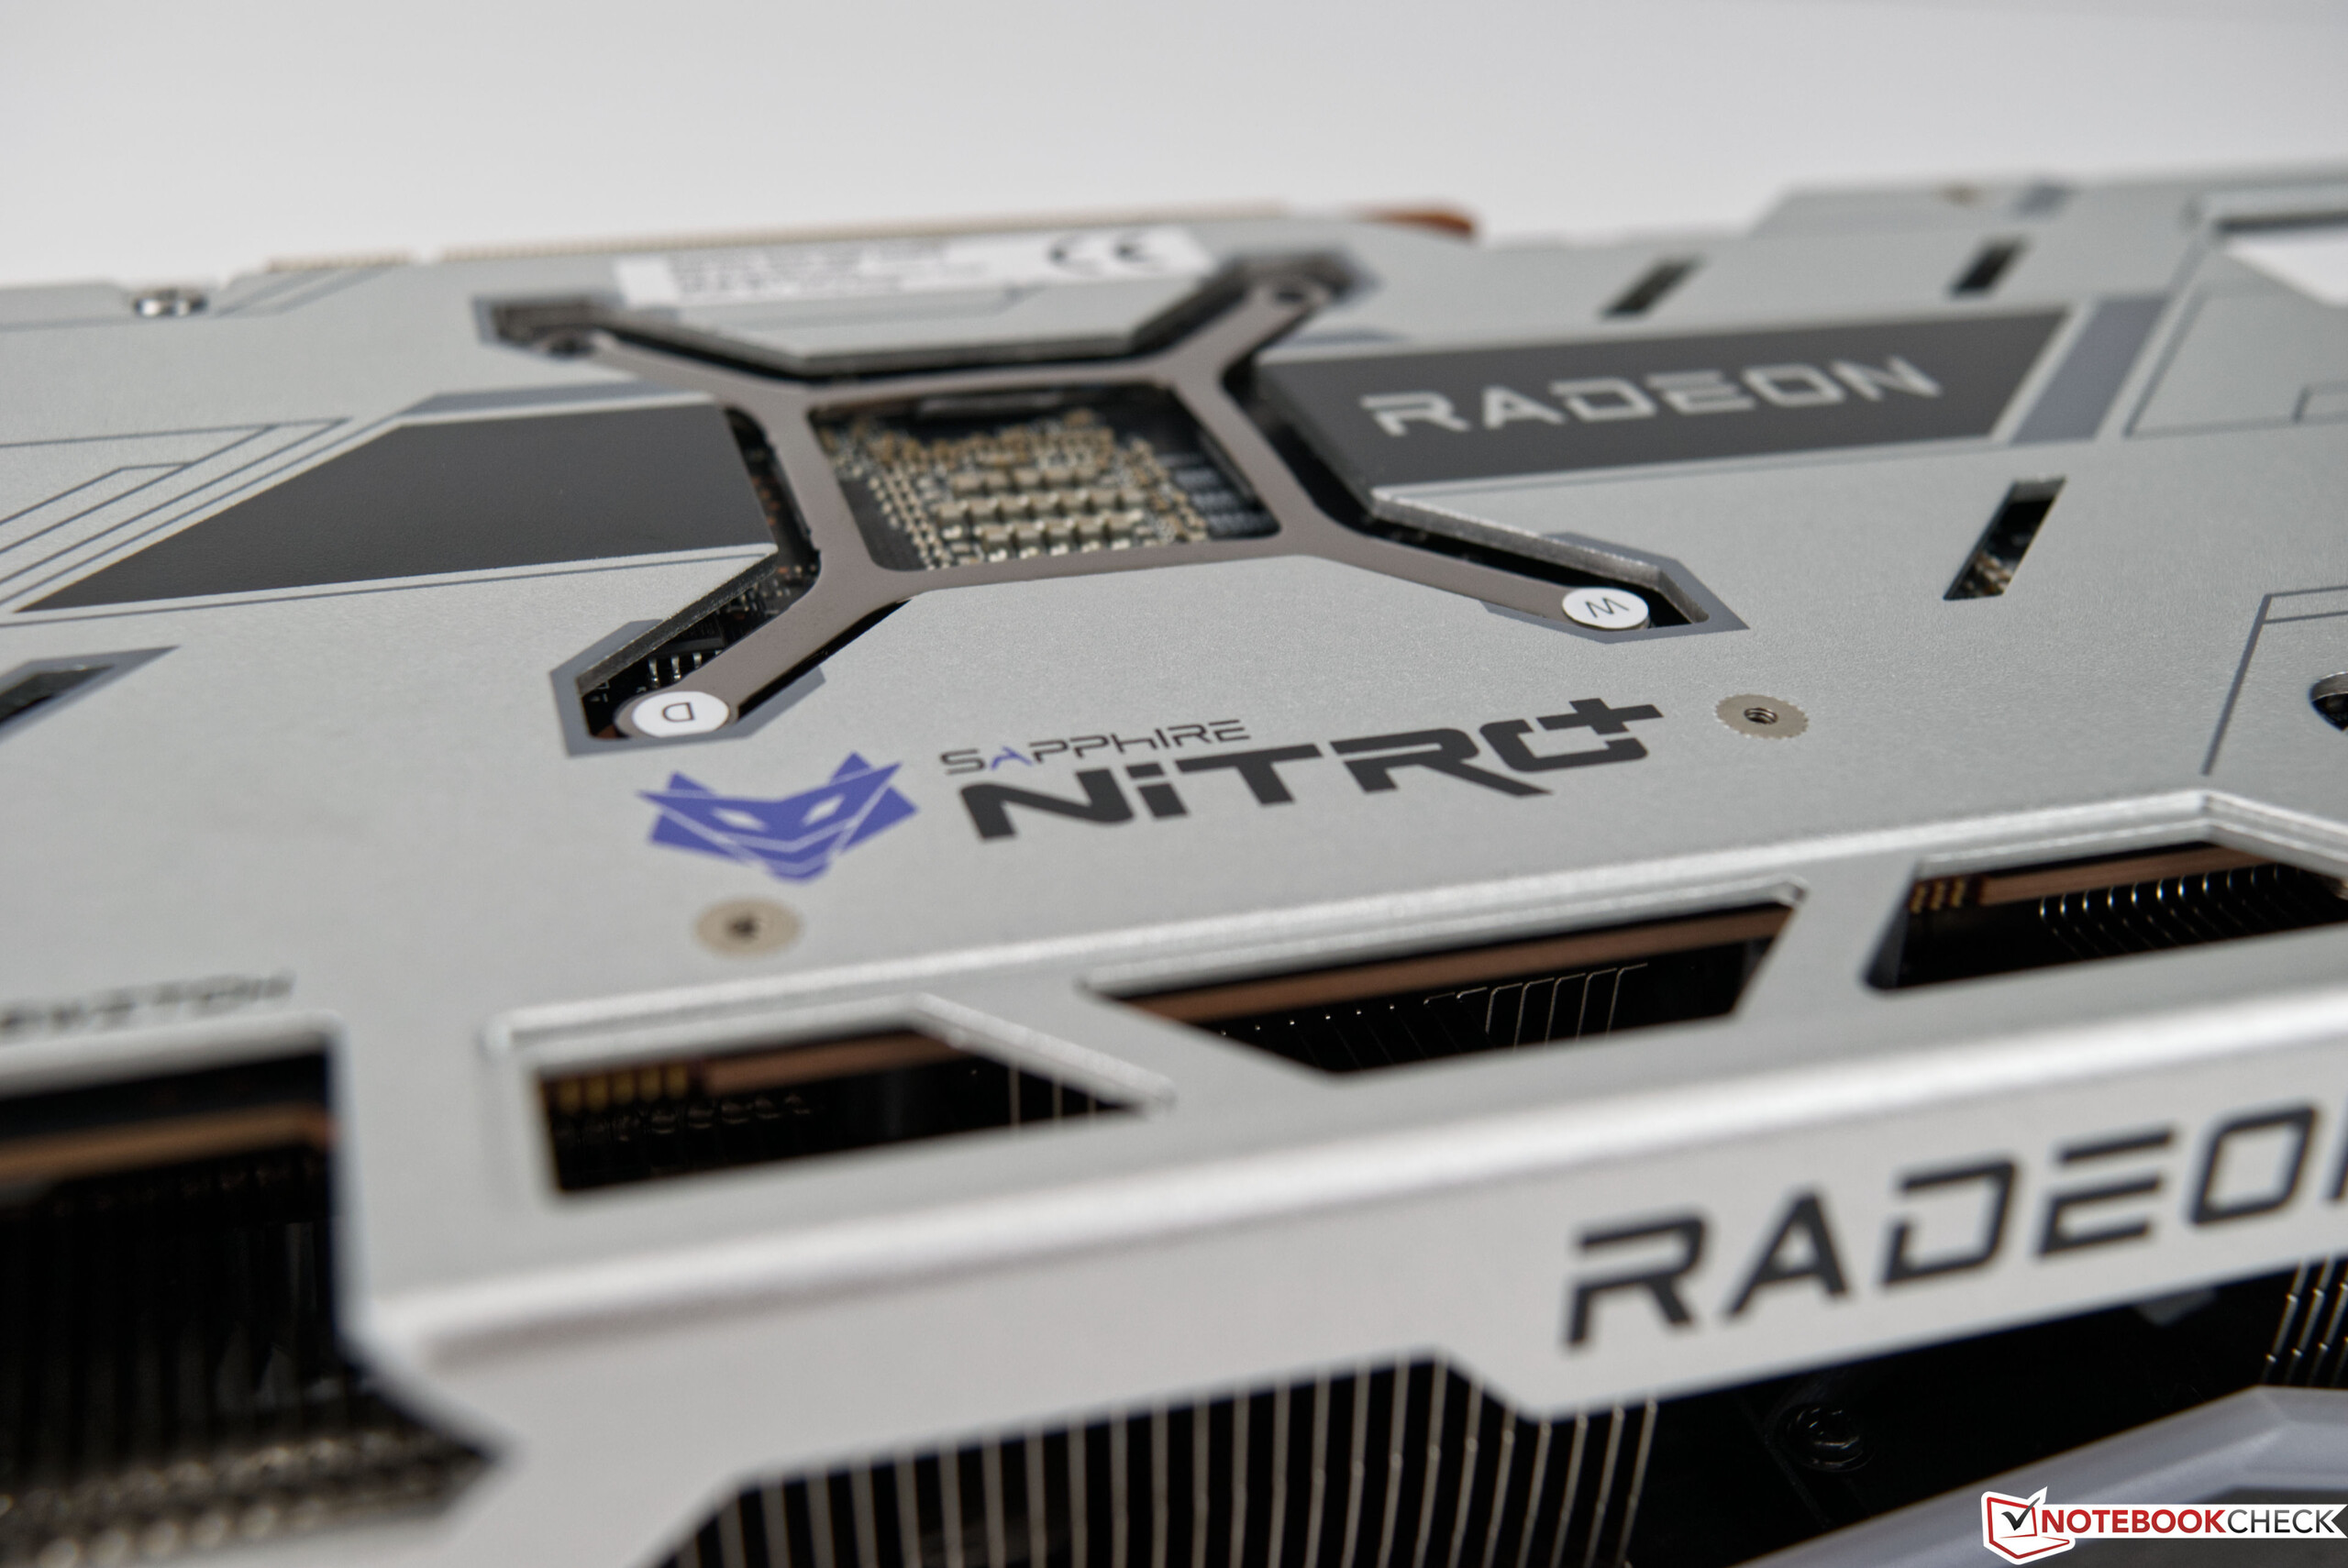
Our test unit from Sapphire won us over with its great design and very good cooling. The large triple-slot cooler offers great cooling potential and kept temperatures cool in all of our test scenarios. With the newly revised design of the fan blades, the manufacturer also shows us that there is always room for improvement. Additionally, the Sapphire Nitro+ Radeon RX 6650 XT is completely silent during 2D operation, thanks to the fan stop mode, although this is not a unique selling point, given that all other manufacturers are now including fan stop modes in their graphics cards.

The Radeon RX 6650 XT is a safe bet if you're looking for a graphics card that can provide good 1080p gaming.

The built-in 8 GB of VRAM is satisfactory for the video memory and is in fact the same as the Nvidia GeForce RTX 3060 Ti. As a direct competitor, the GeForce RTX 3060 Ti costs about the same as the Sapphire Nitro+ Radeon RX 6650 XT, and the gaming performance of both graphics cards is roughly equivalent.

Price and availability

The Sapphire Nitro+ Radeon RX 6650 XT is currently available at notebooksbilliger.de for 469 Euros. The Nvidia GeForce RTX 3060 Ti is also available starting at 459 Euros at notebooksbilliger.de. In the US, the Sapphire Nitro+ Radeon RX 6650 XT can be found at Amazon for US$ 386.99.

Pricecompare

static version load dynamic
Loading comments
Comment on this article
Please share our article, every link counts!
> Expert Reviews and News on Laptops, Smartphones and Tech Innovations > Reviews > Sapphire Nitro+ Radeon RX 6650 XT Desktop-GPU Review: a powerful 1080p graphics card with a good cooler
Sebastian Bade, 2022-09-22 (Update: 2022-09-22)