Notebookcheck Logo

KFA2 GeForce RTX 3080 SG 12GB Desktop Graphics Card Review: A Better RTX 3080 thanks to more VRAM and more Shaders?

More than just more VRAM! Nvidia's GeForce RTX 3080 12 GB is yet another high-end graphics card supposed to succeed the GeForce RTX 3080. It is Nvidia's response to repeated requests for more VRAM, and we take a closer look at this latest RTX incarnation with now 12 GB of VRAM by reviewing a model made by KFA2.
KFA2 GeForce RTX 3080 SG12 GB external ports (Source: KFA2)
GPU-Z
GPU-Z

Nvidia’s RTX 3000-series encompasses graphics cards spanning almost the entire gaming spectrum, from mid-range all the way up to high-end. New models are added regularly, such as for example the GeForce RTX 3080 12 GB. After the RTX 3080’s initial release back in September of 2020 many called for more VRAM as the original card came with just 10 GB. While this was perfectly fine for most games at the time many gamers were worried about their GPU’s future capabilities with yet to be released future games.

The GeForce RTX 3080 12 GB is Nvidia’s response to these repeated requests for more VRAM as it comes with 2 GB more than the original card. It also features a wider memory bus interface without which it would have had to feature a whopping 20 GB of RAM instead. This model appeared regularly in rumor mills but has yet failed to materialize.

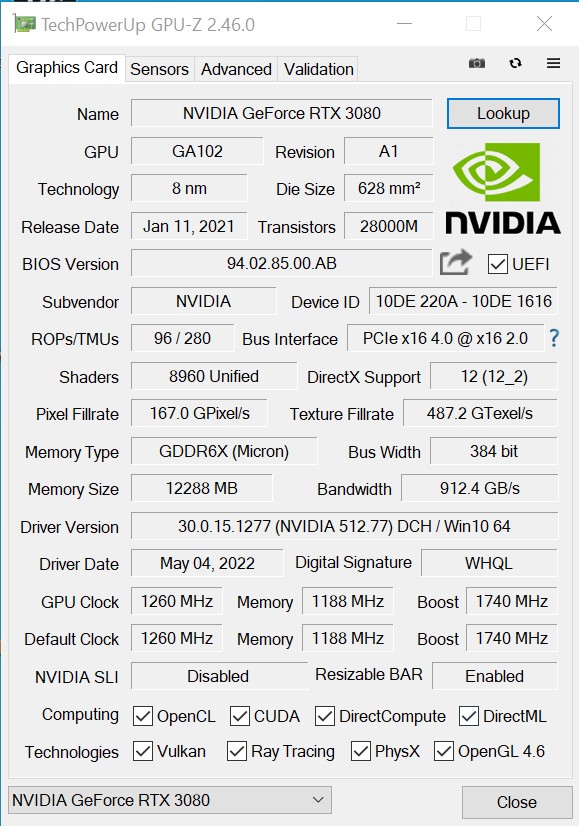
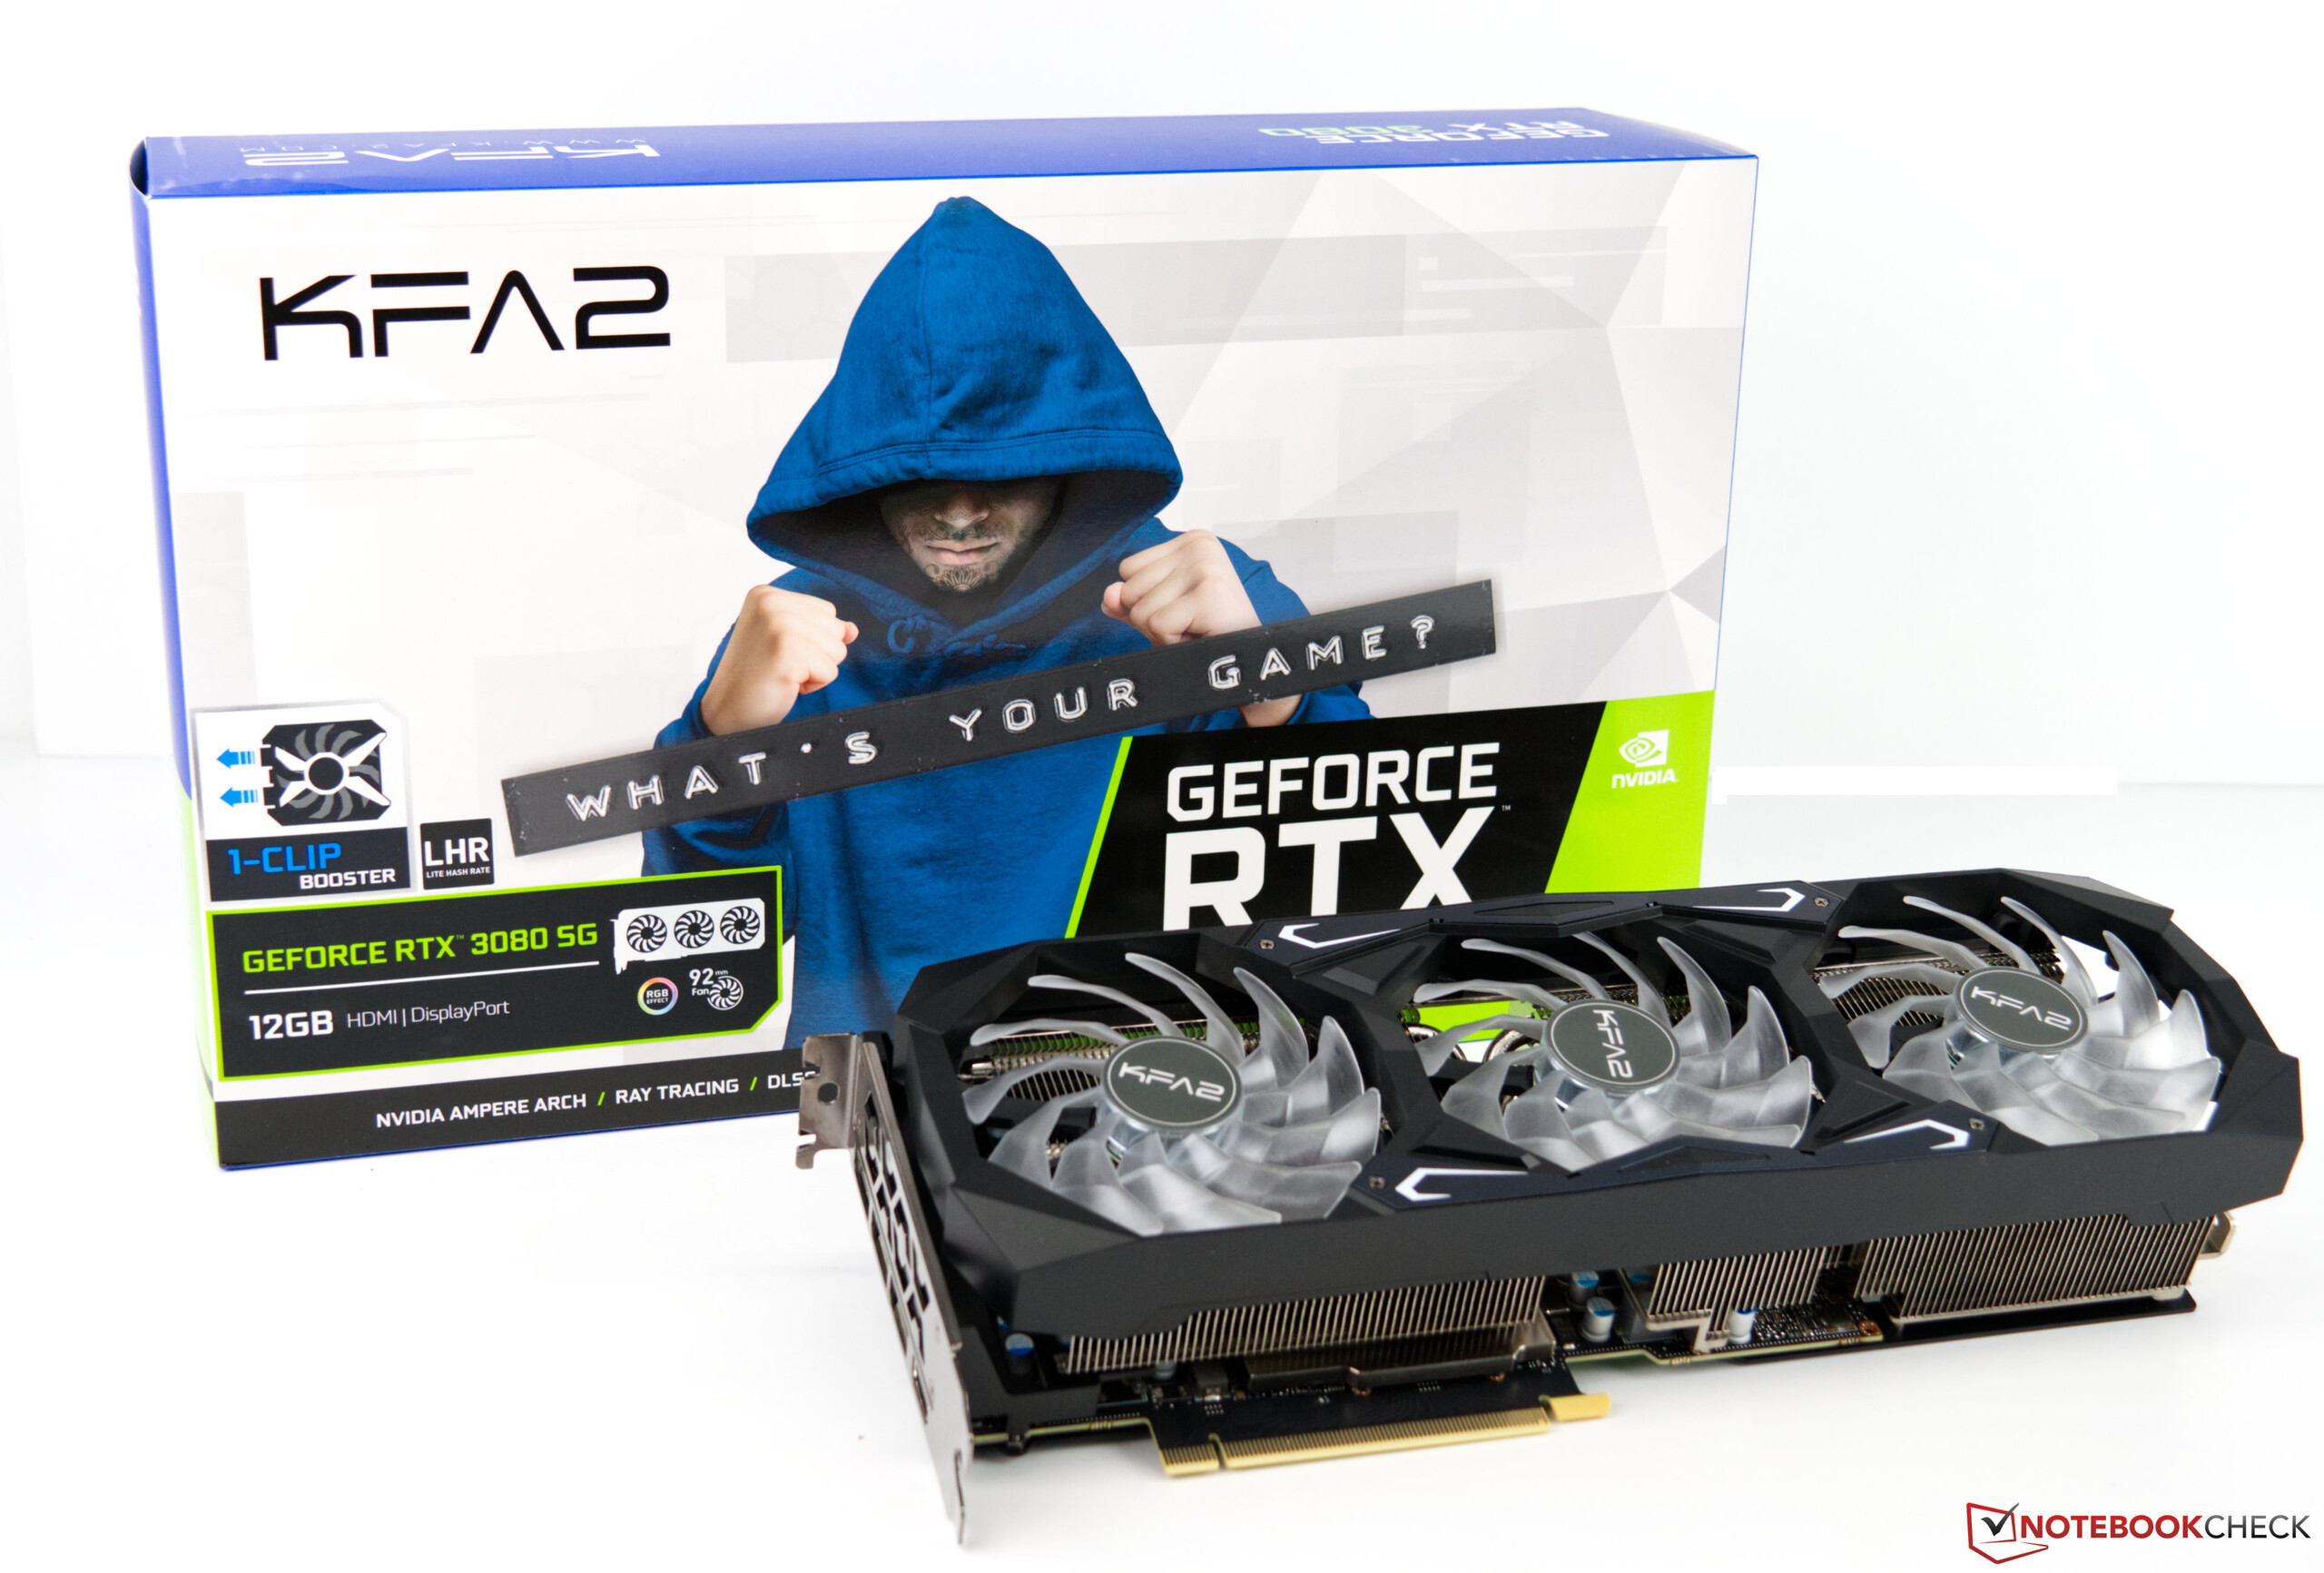
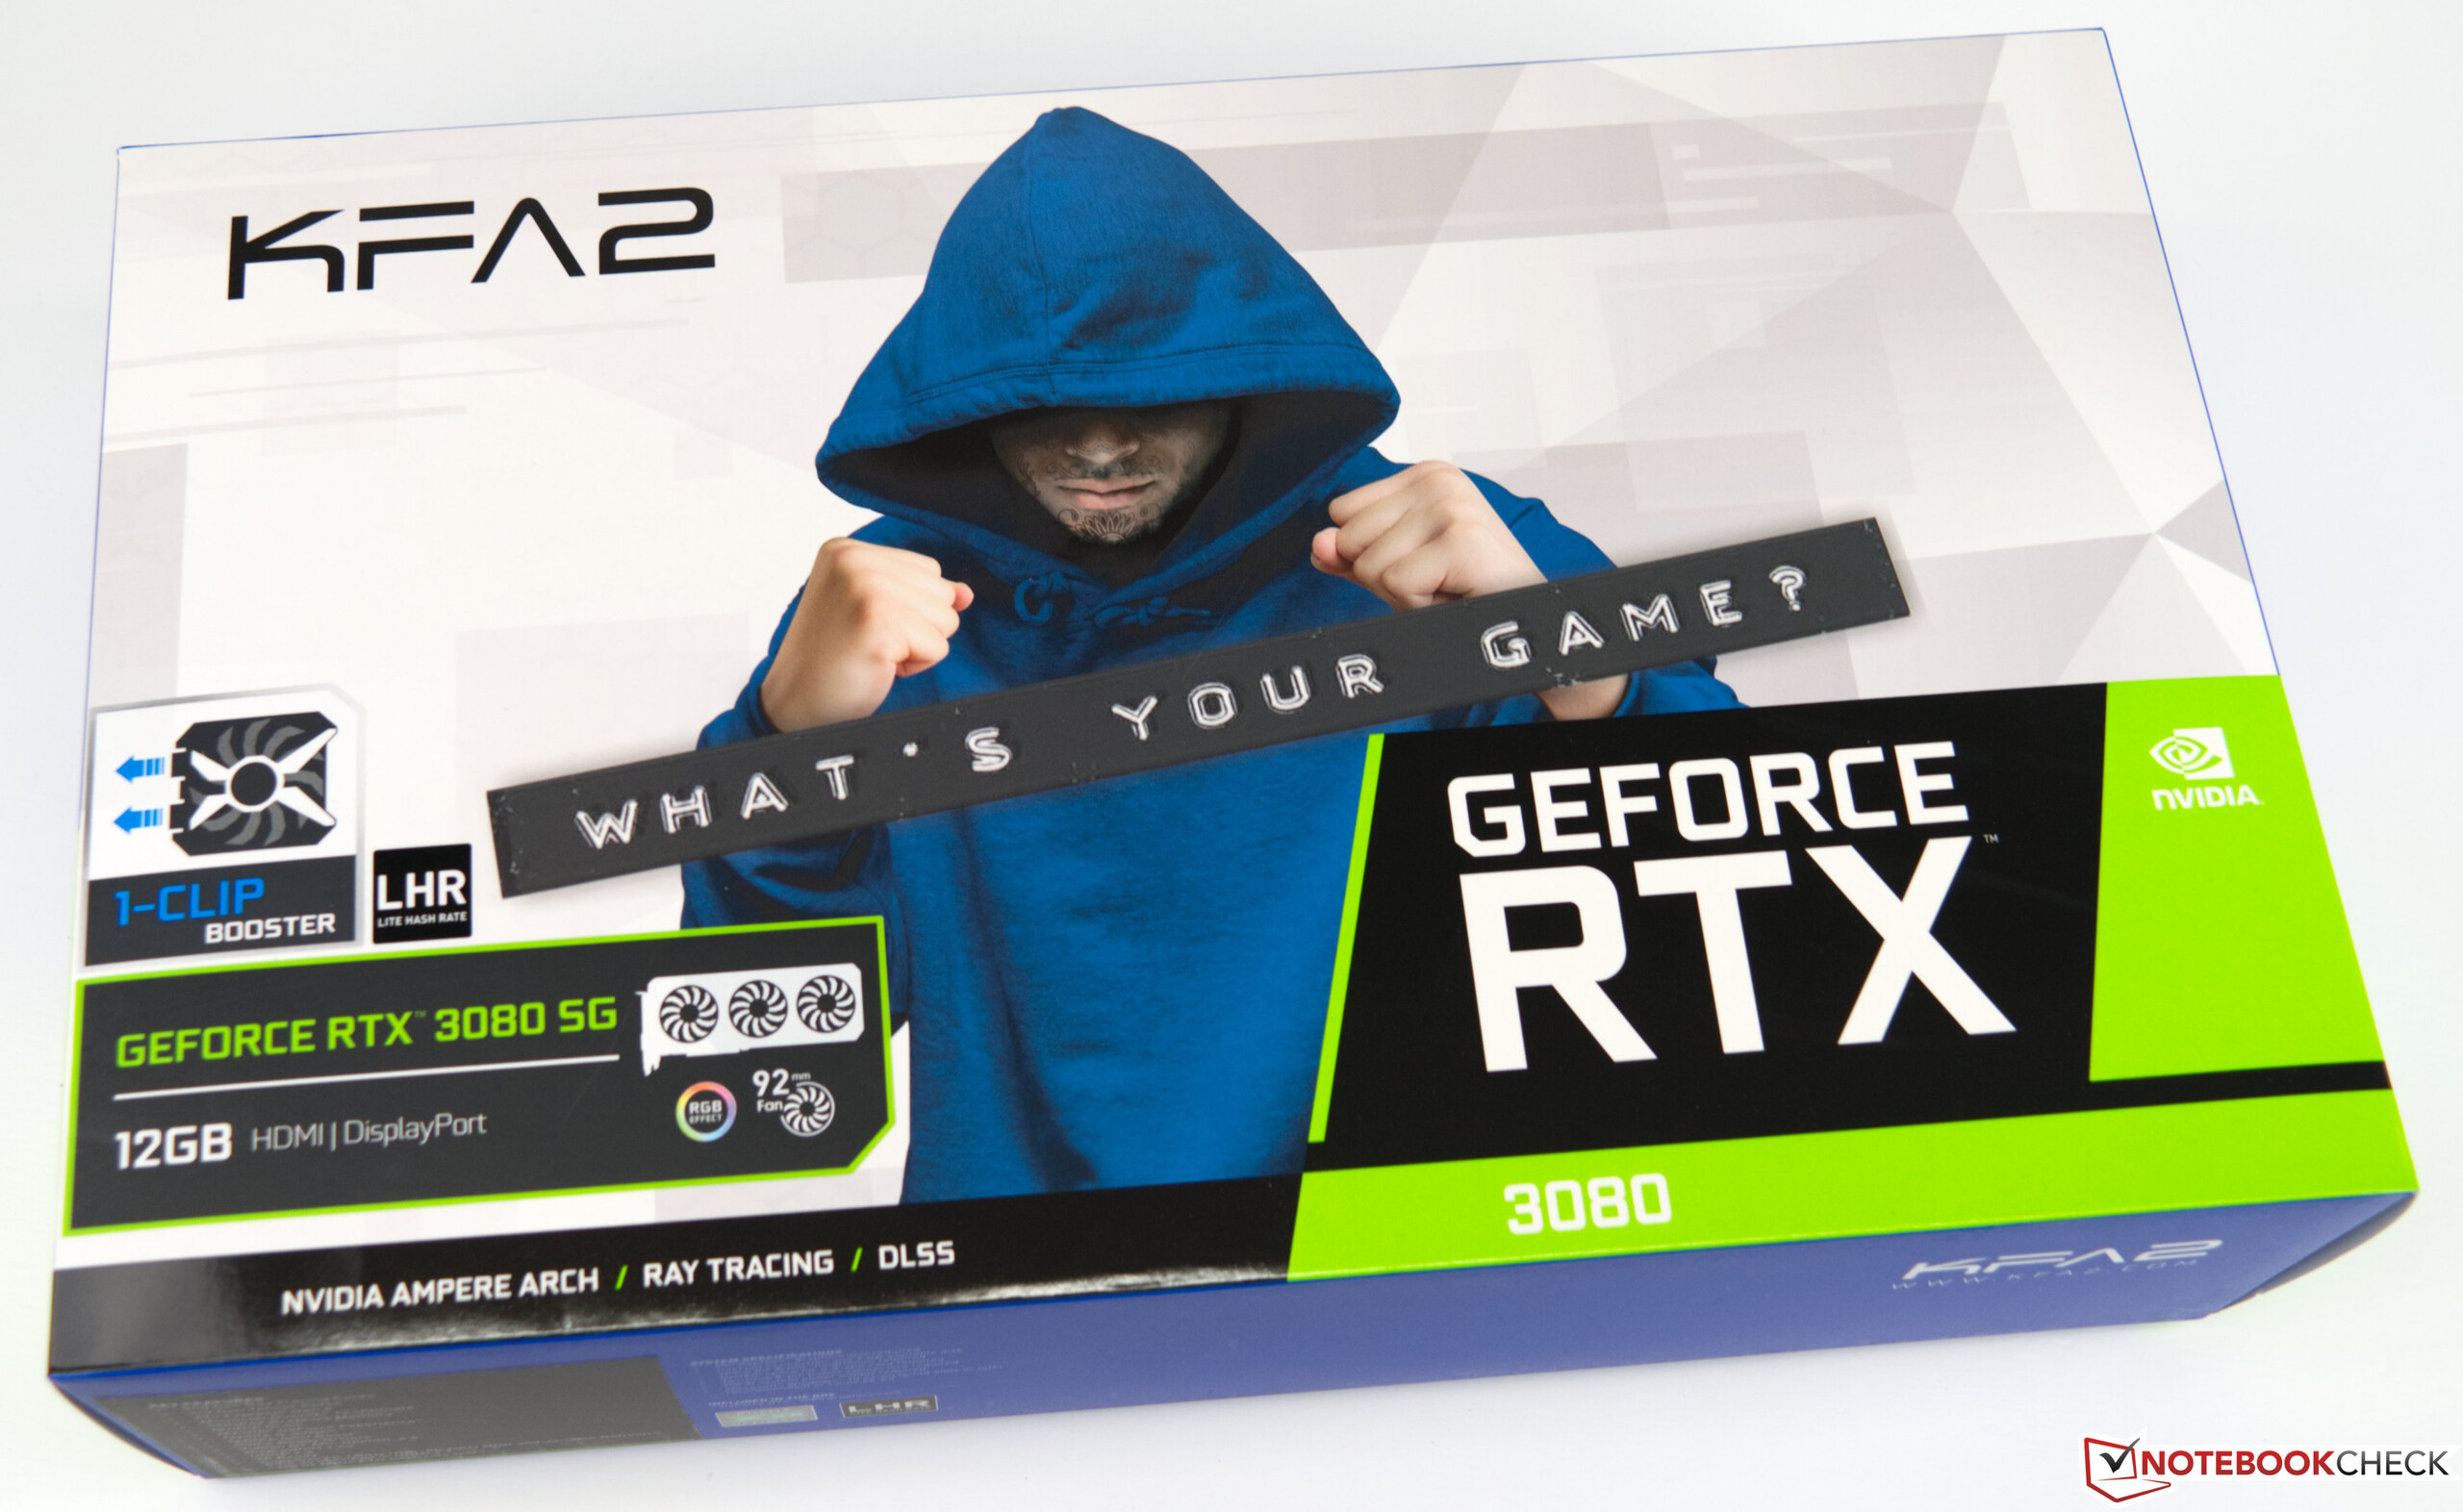
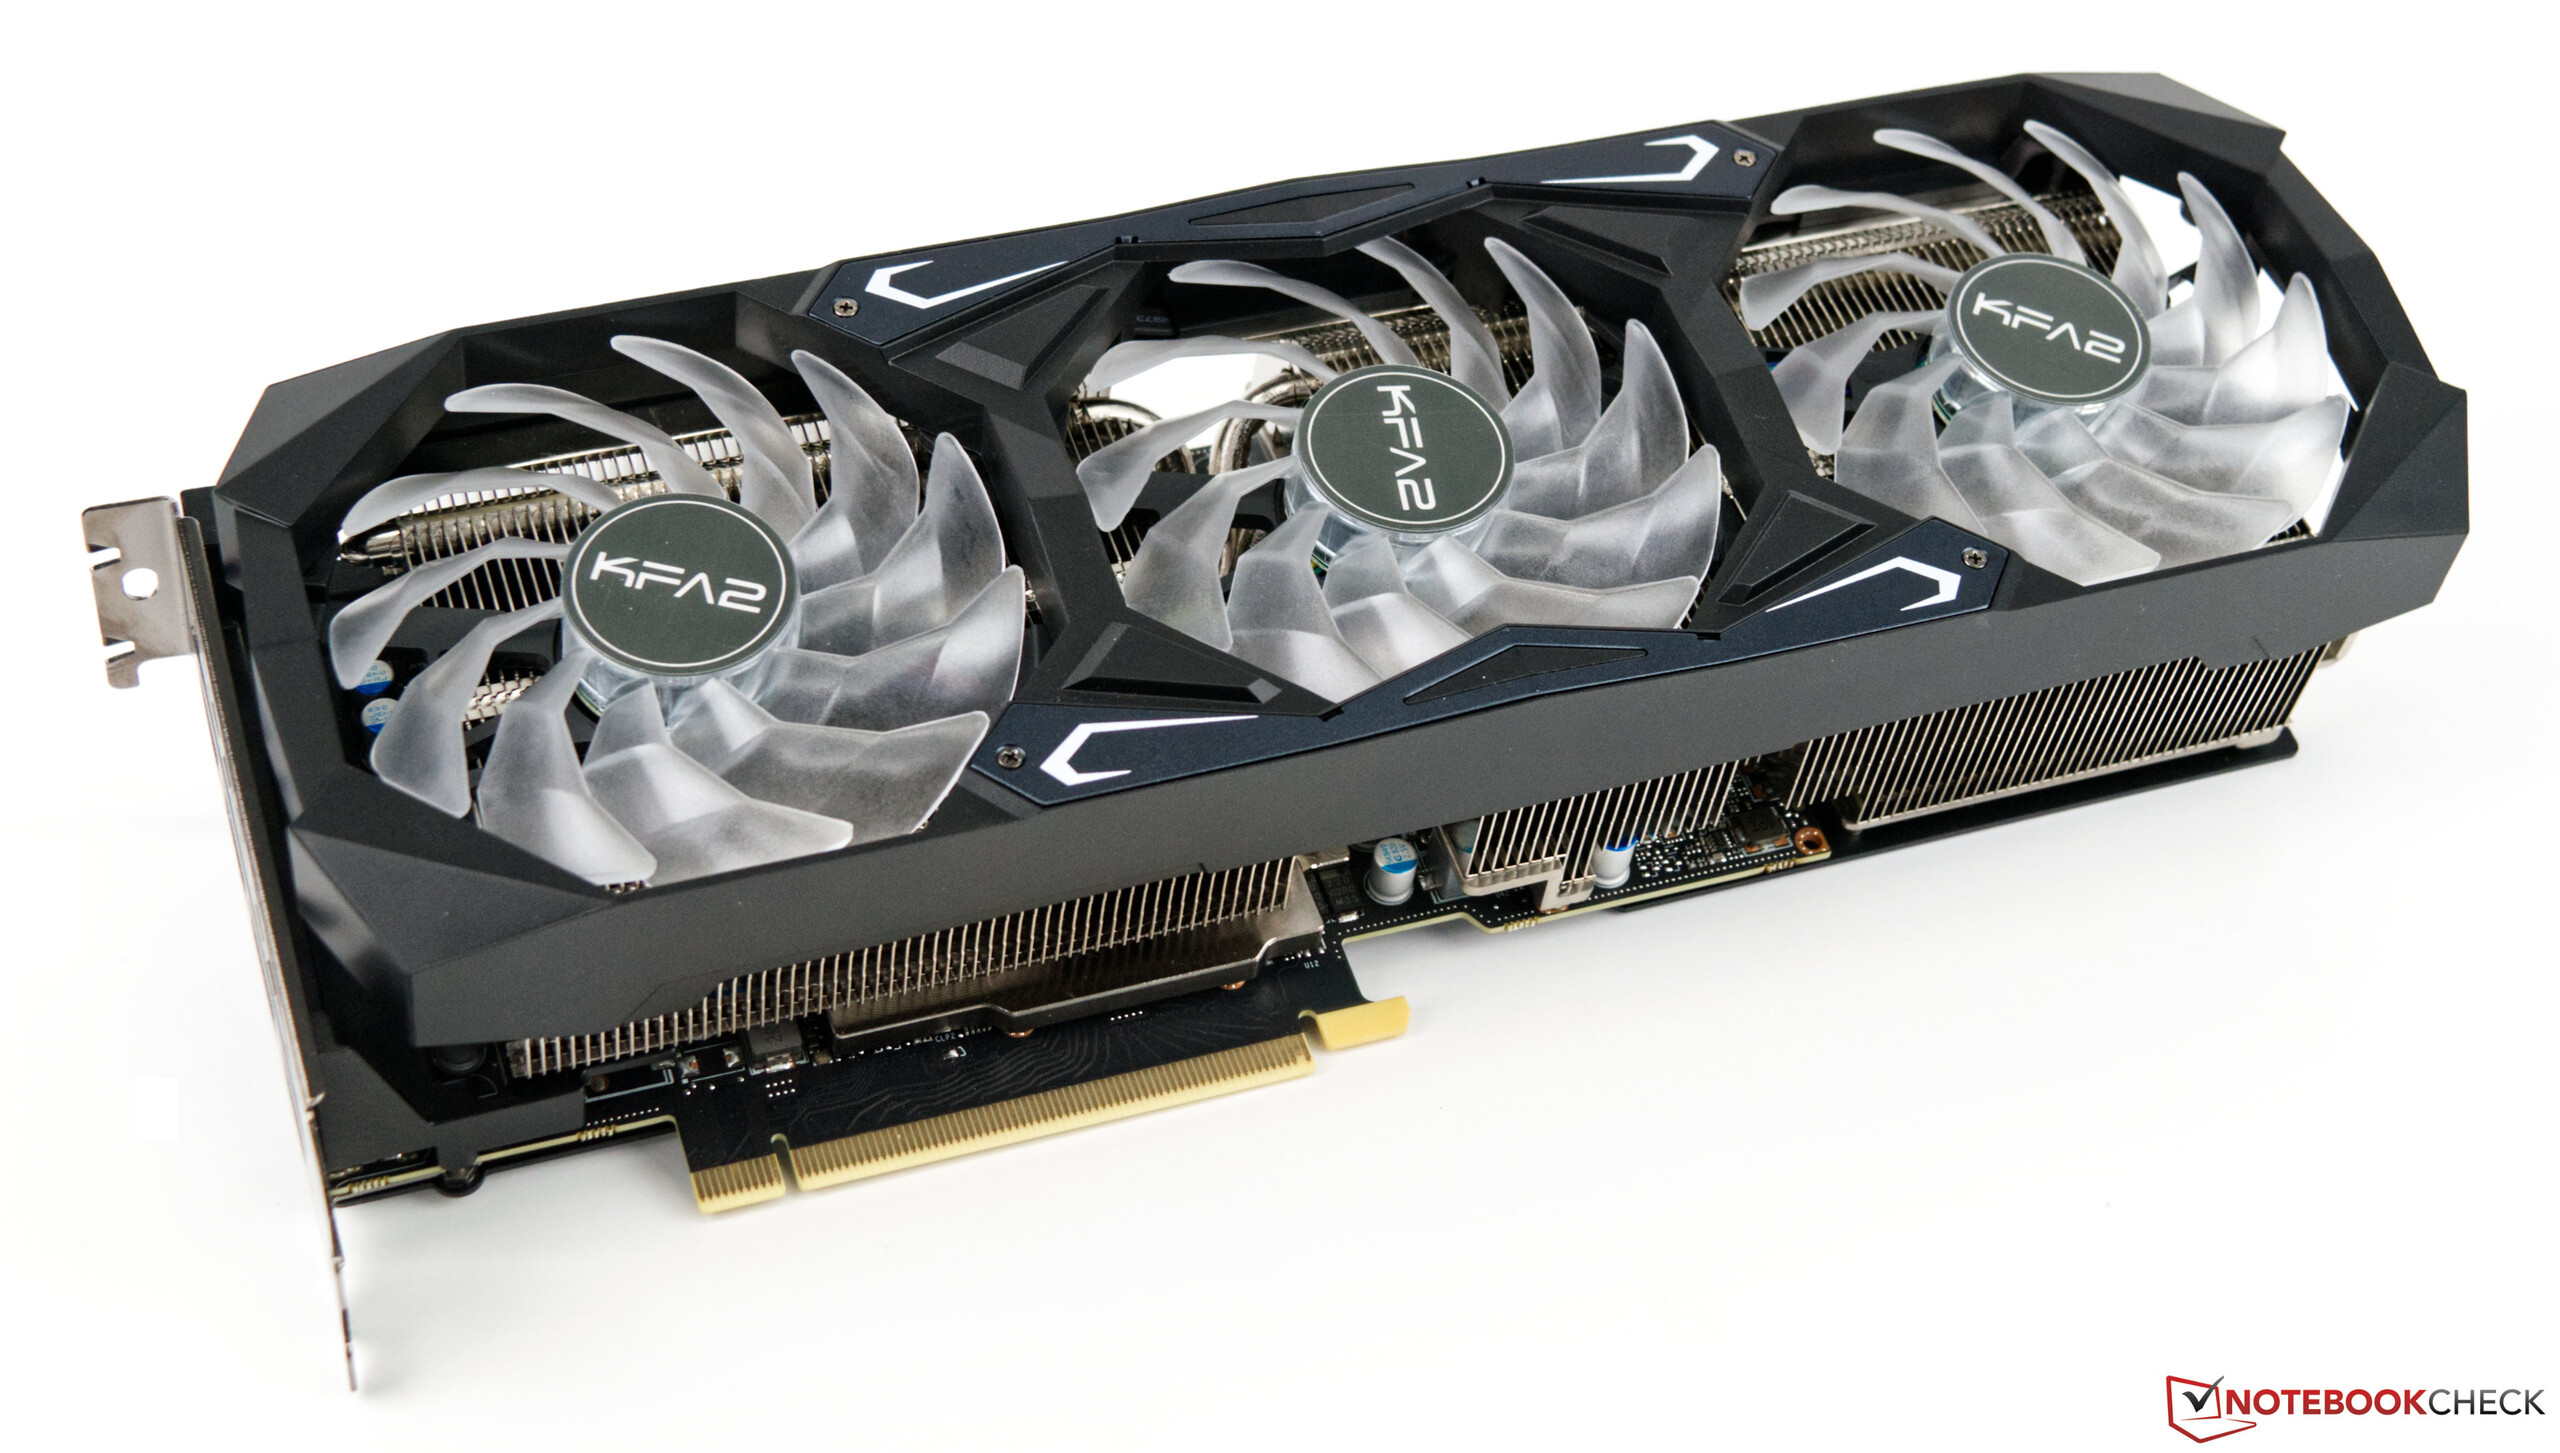
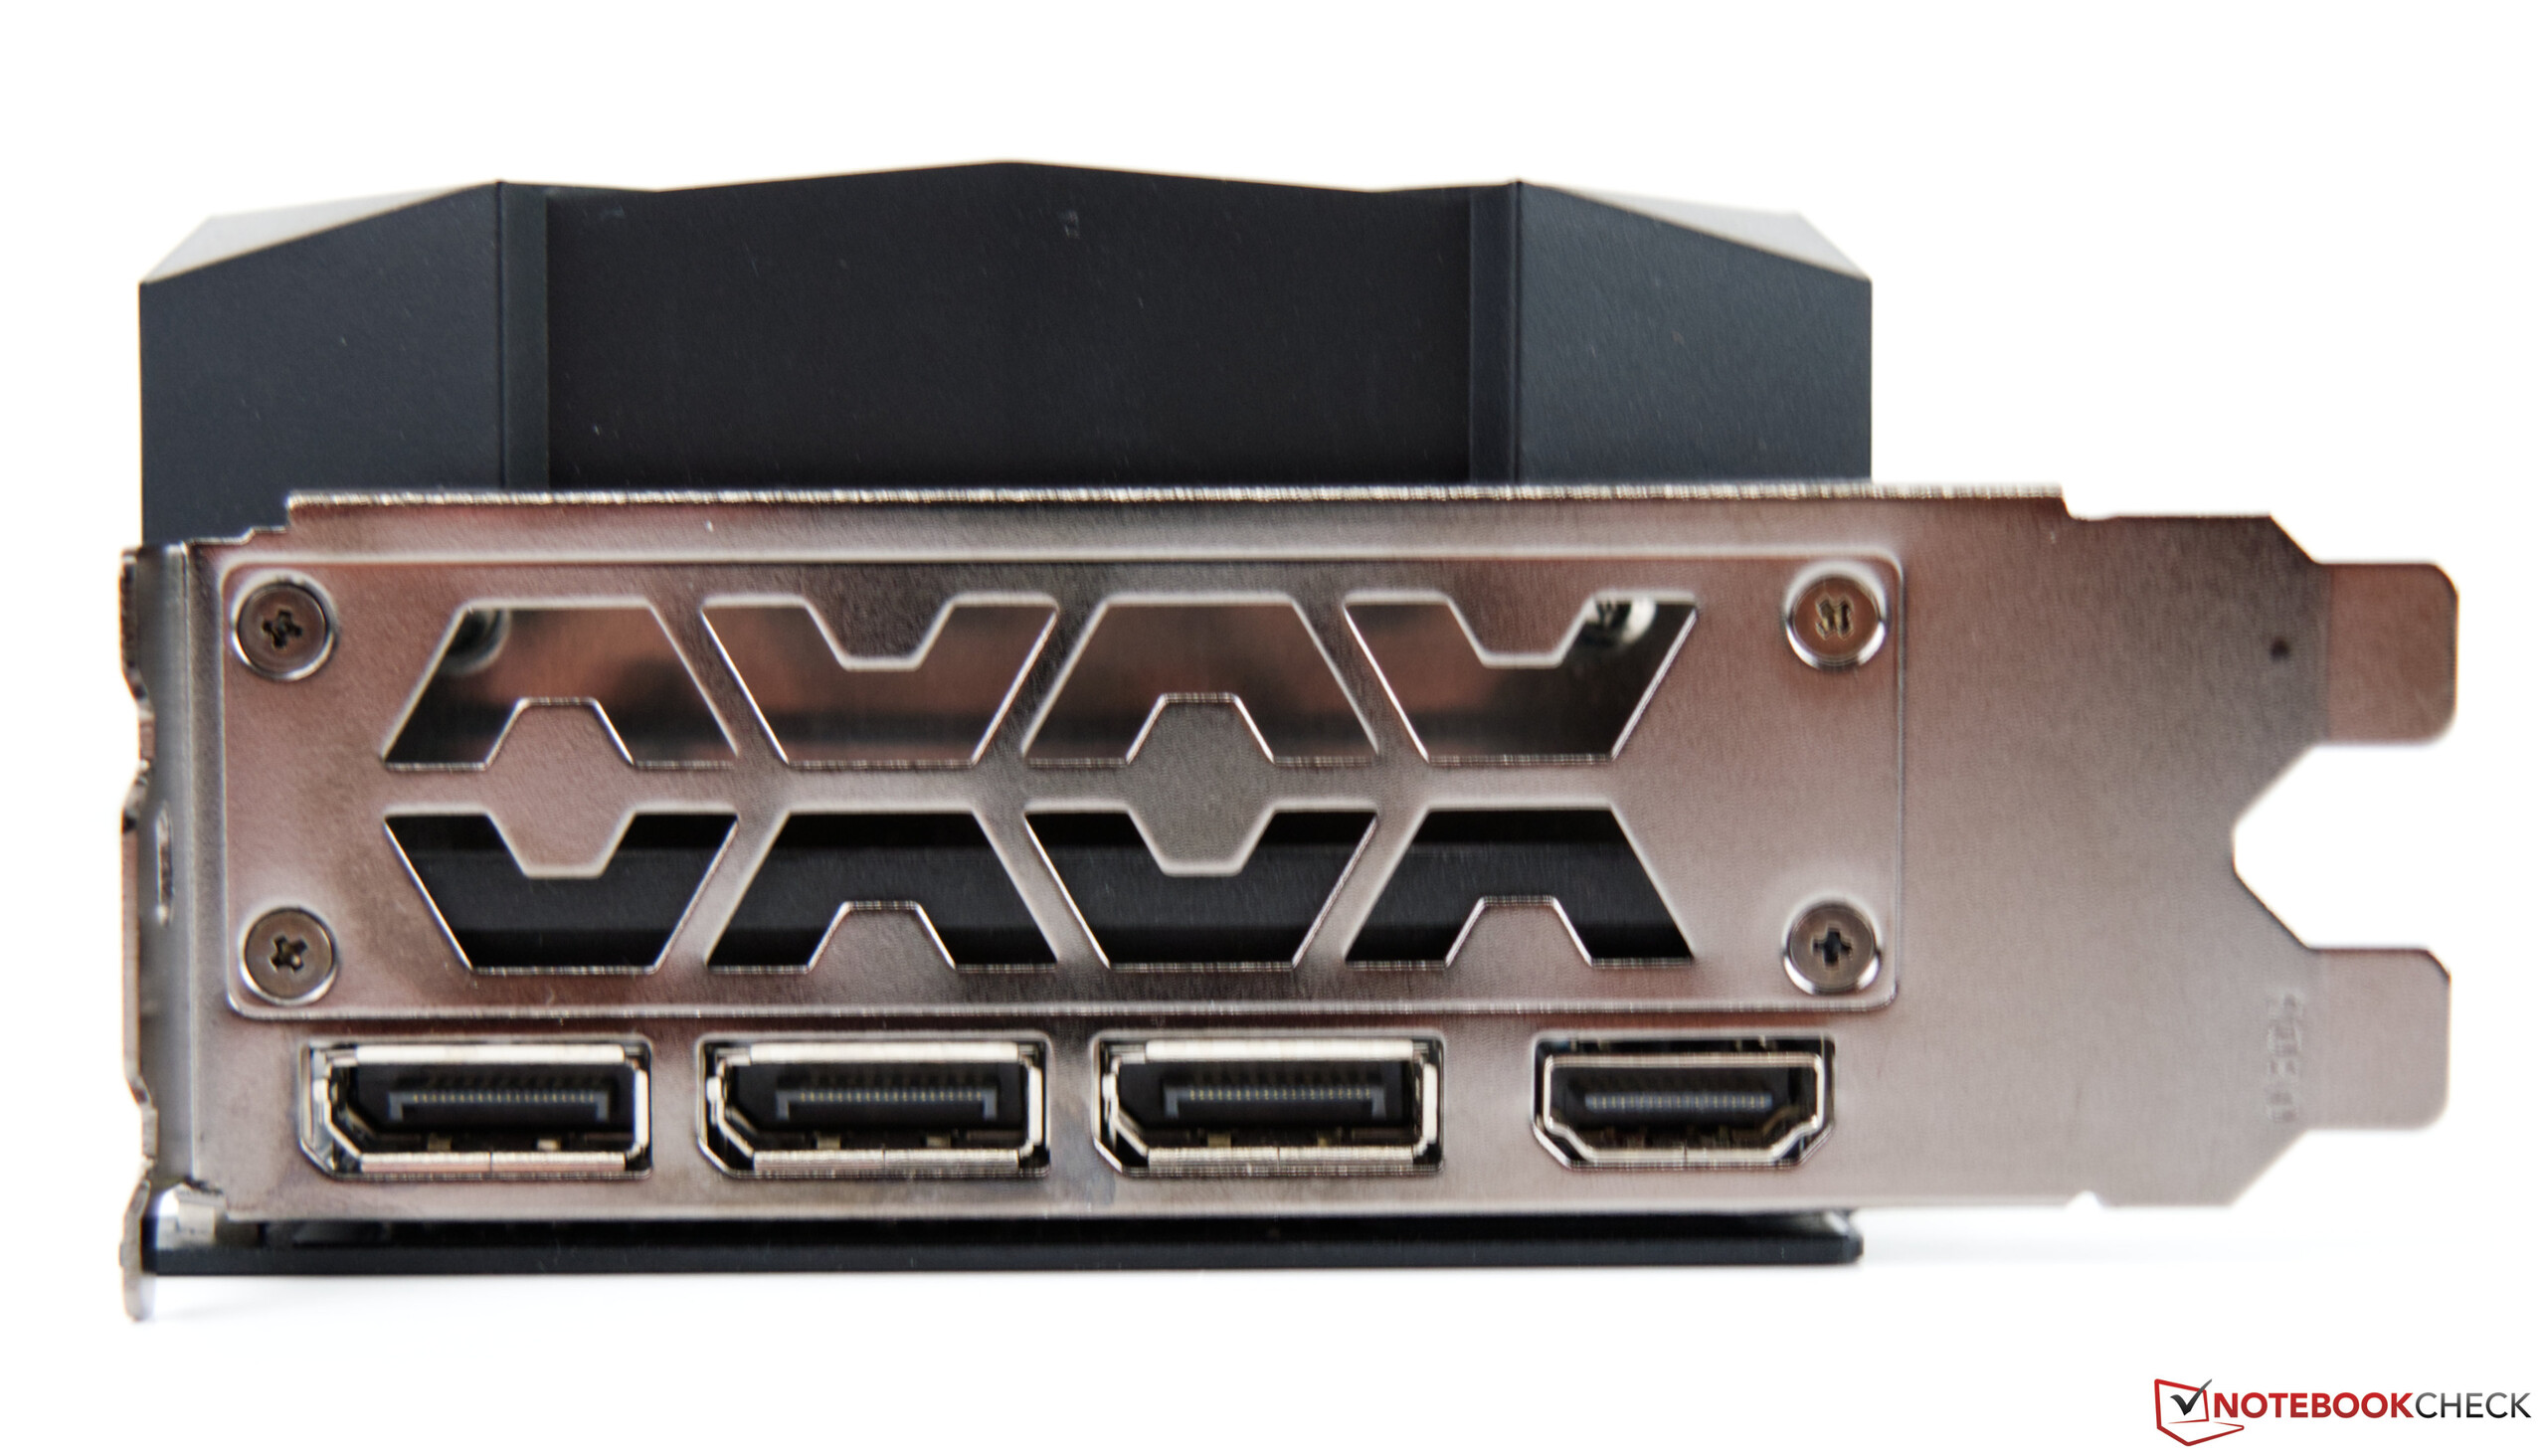
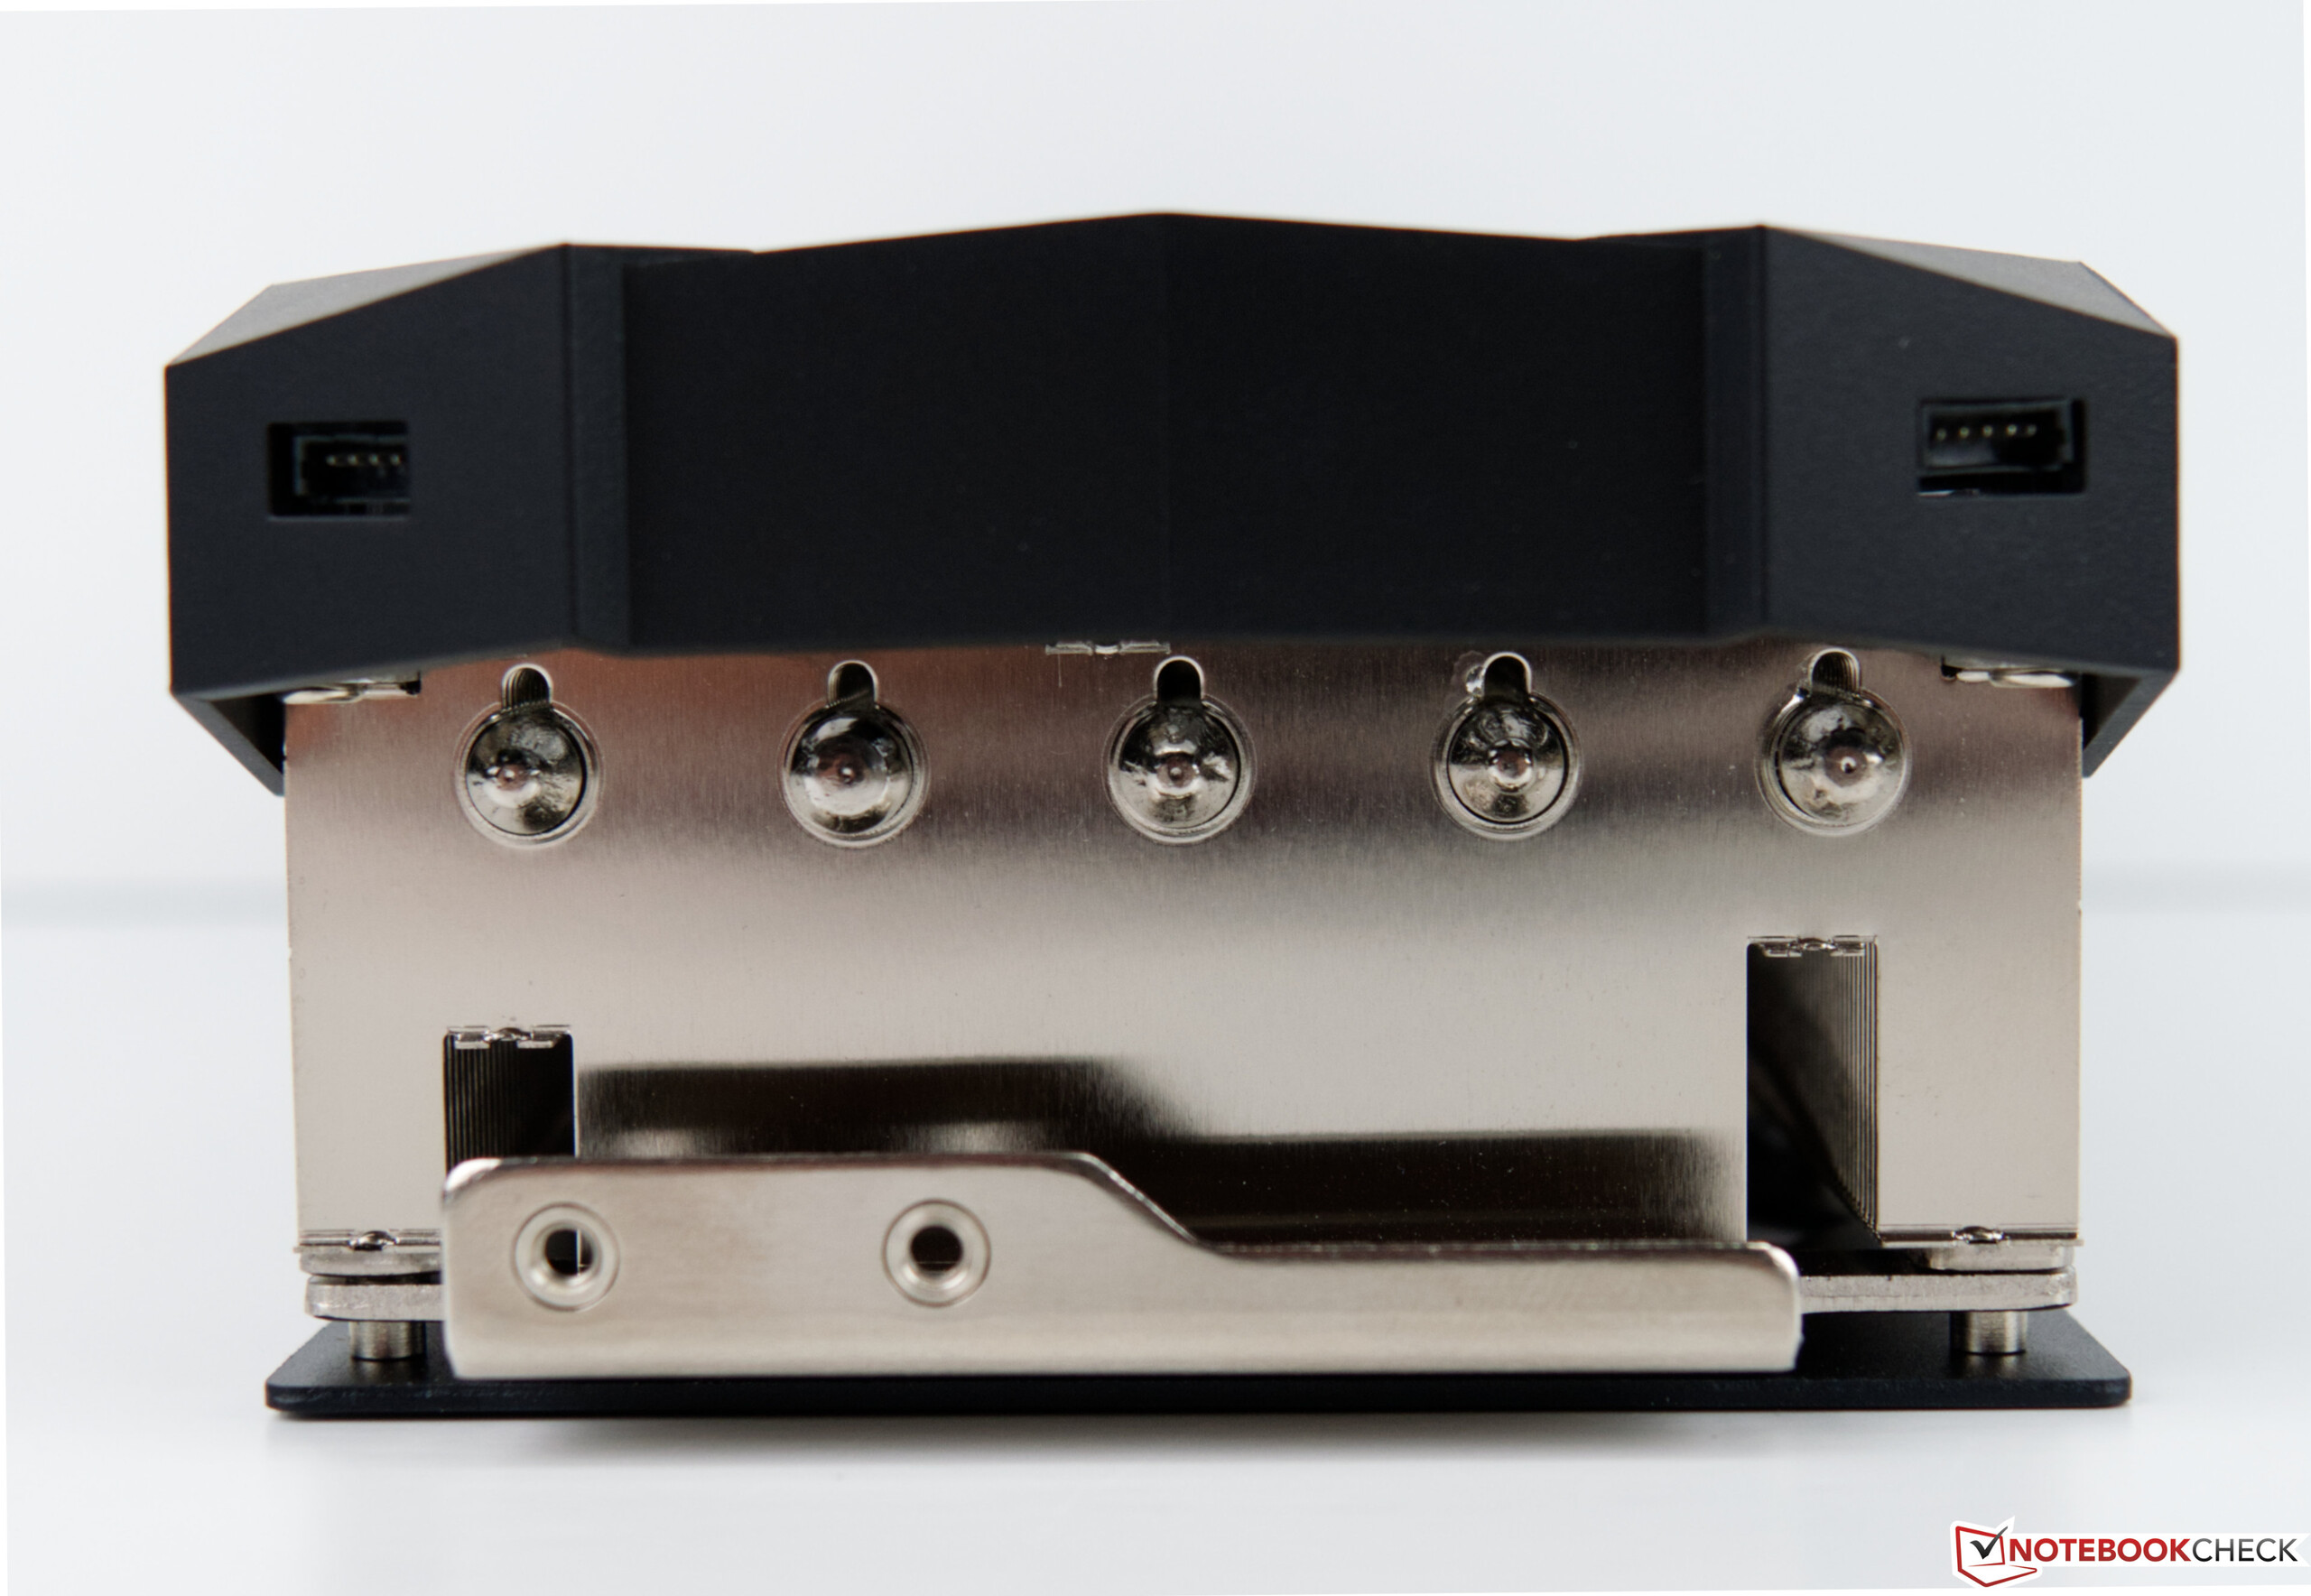
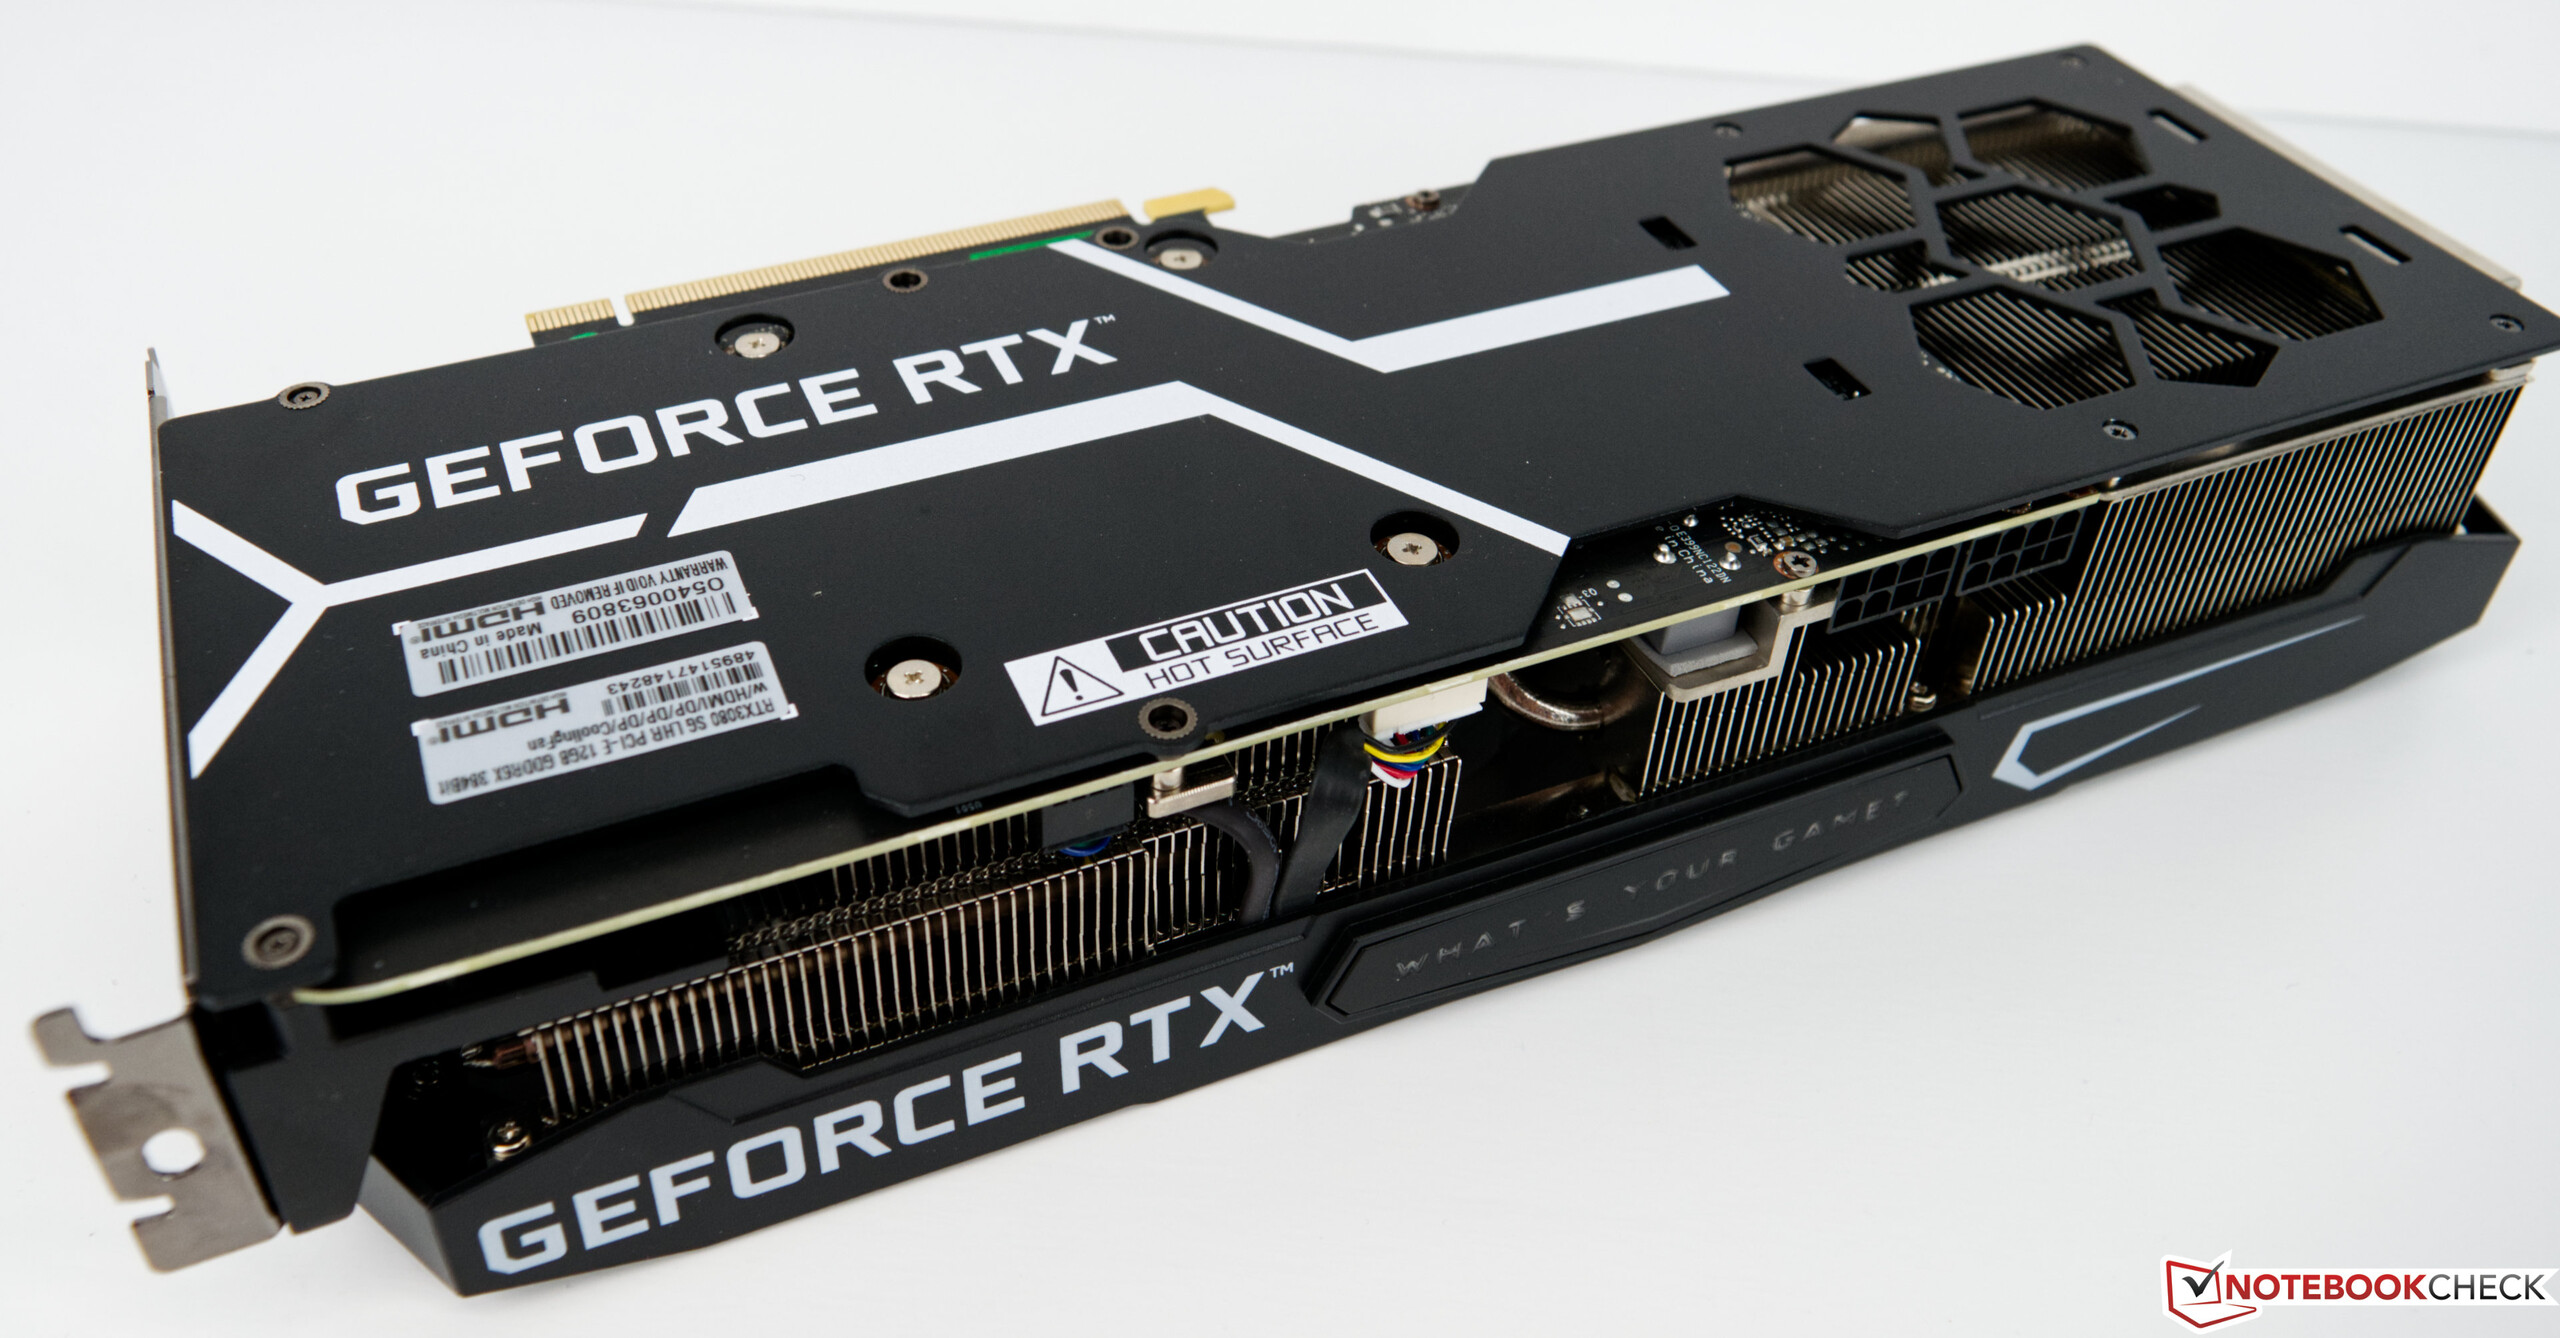
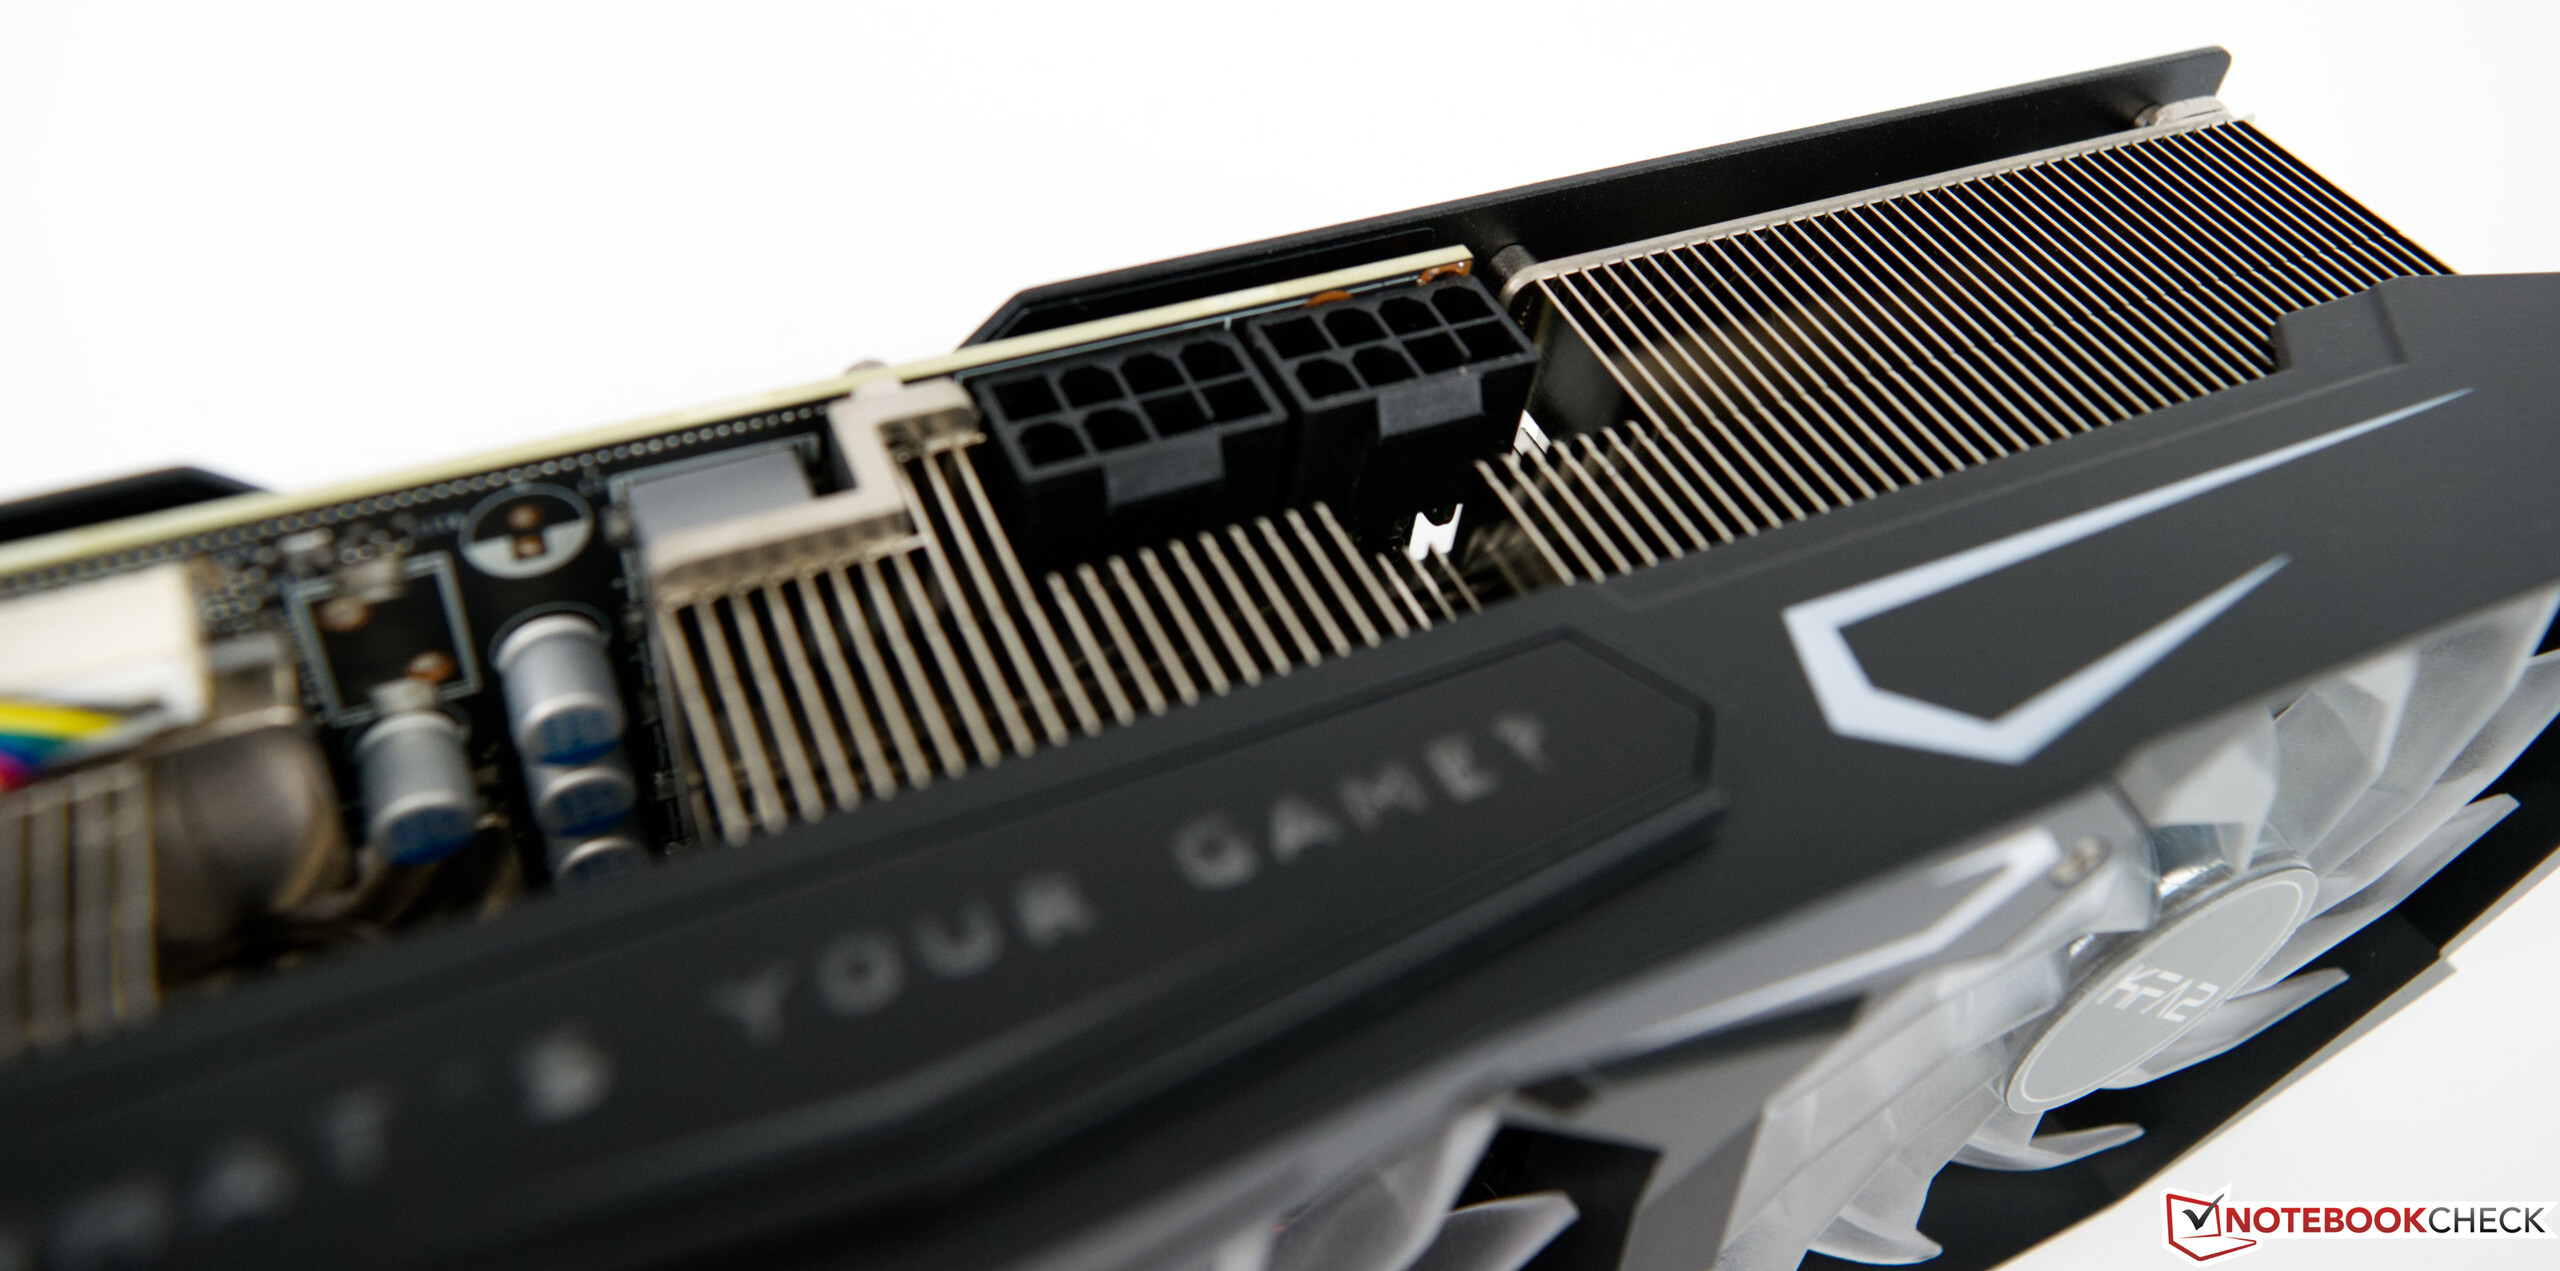
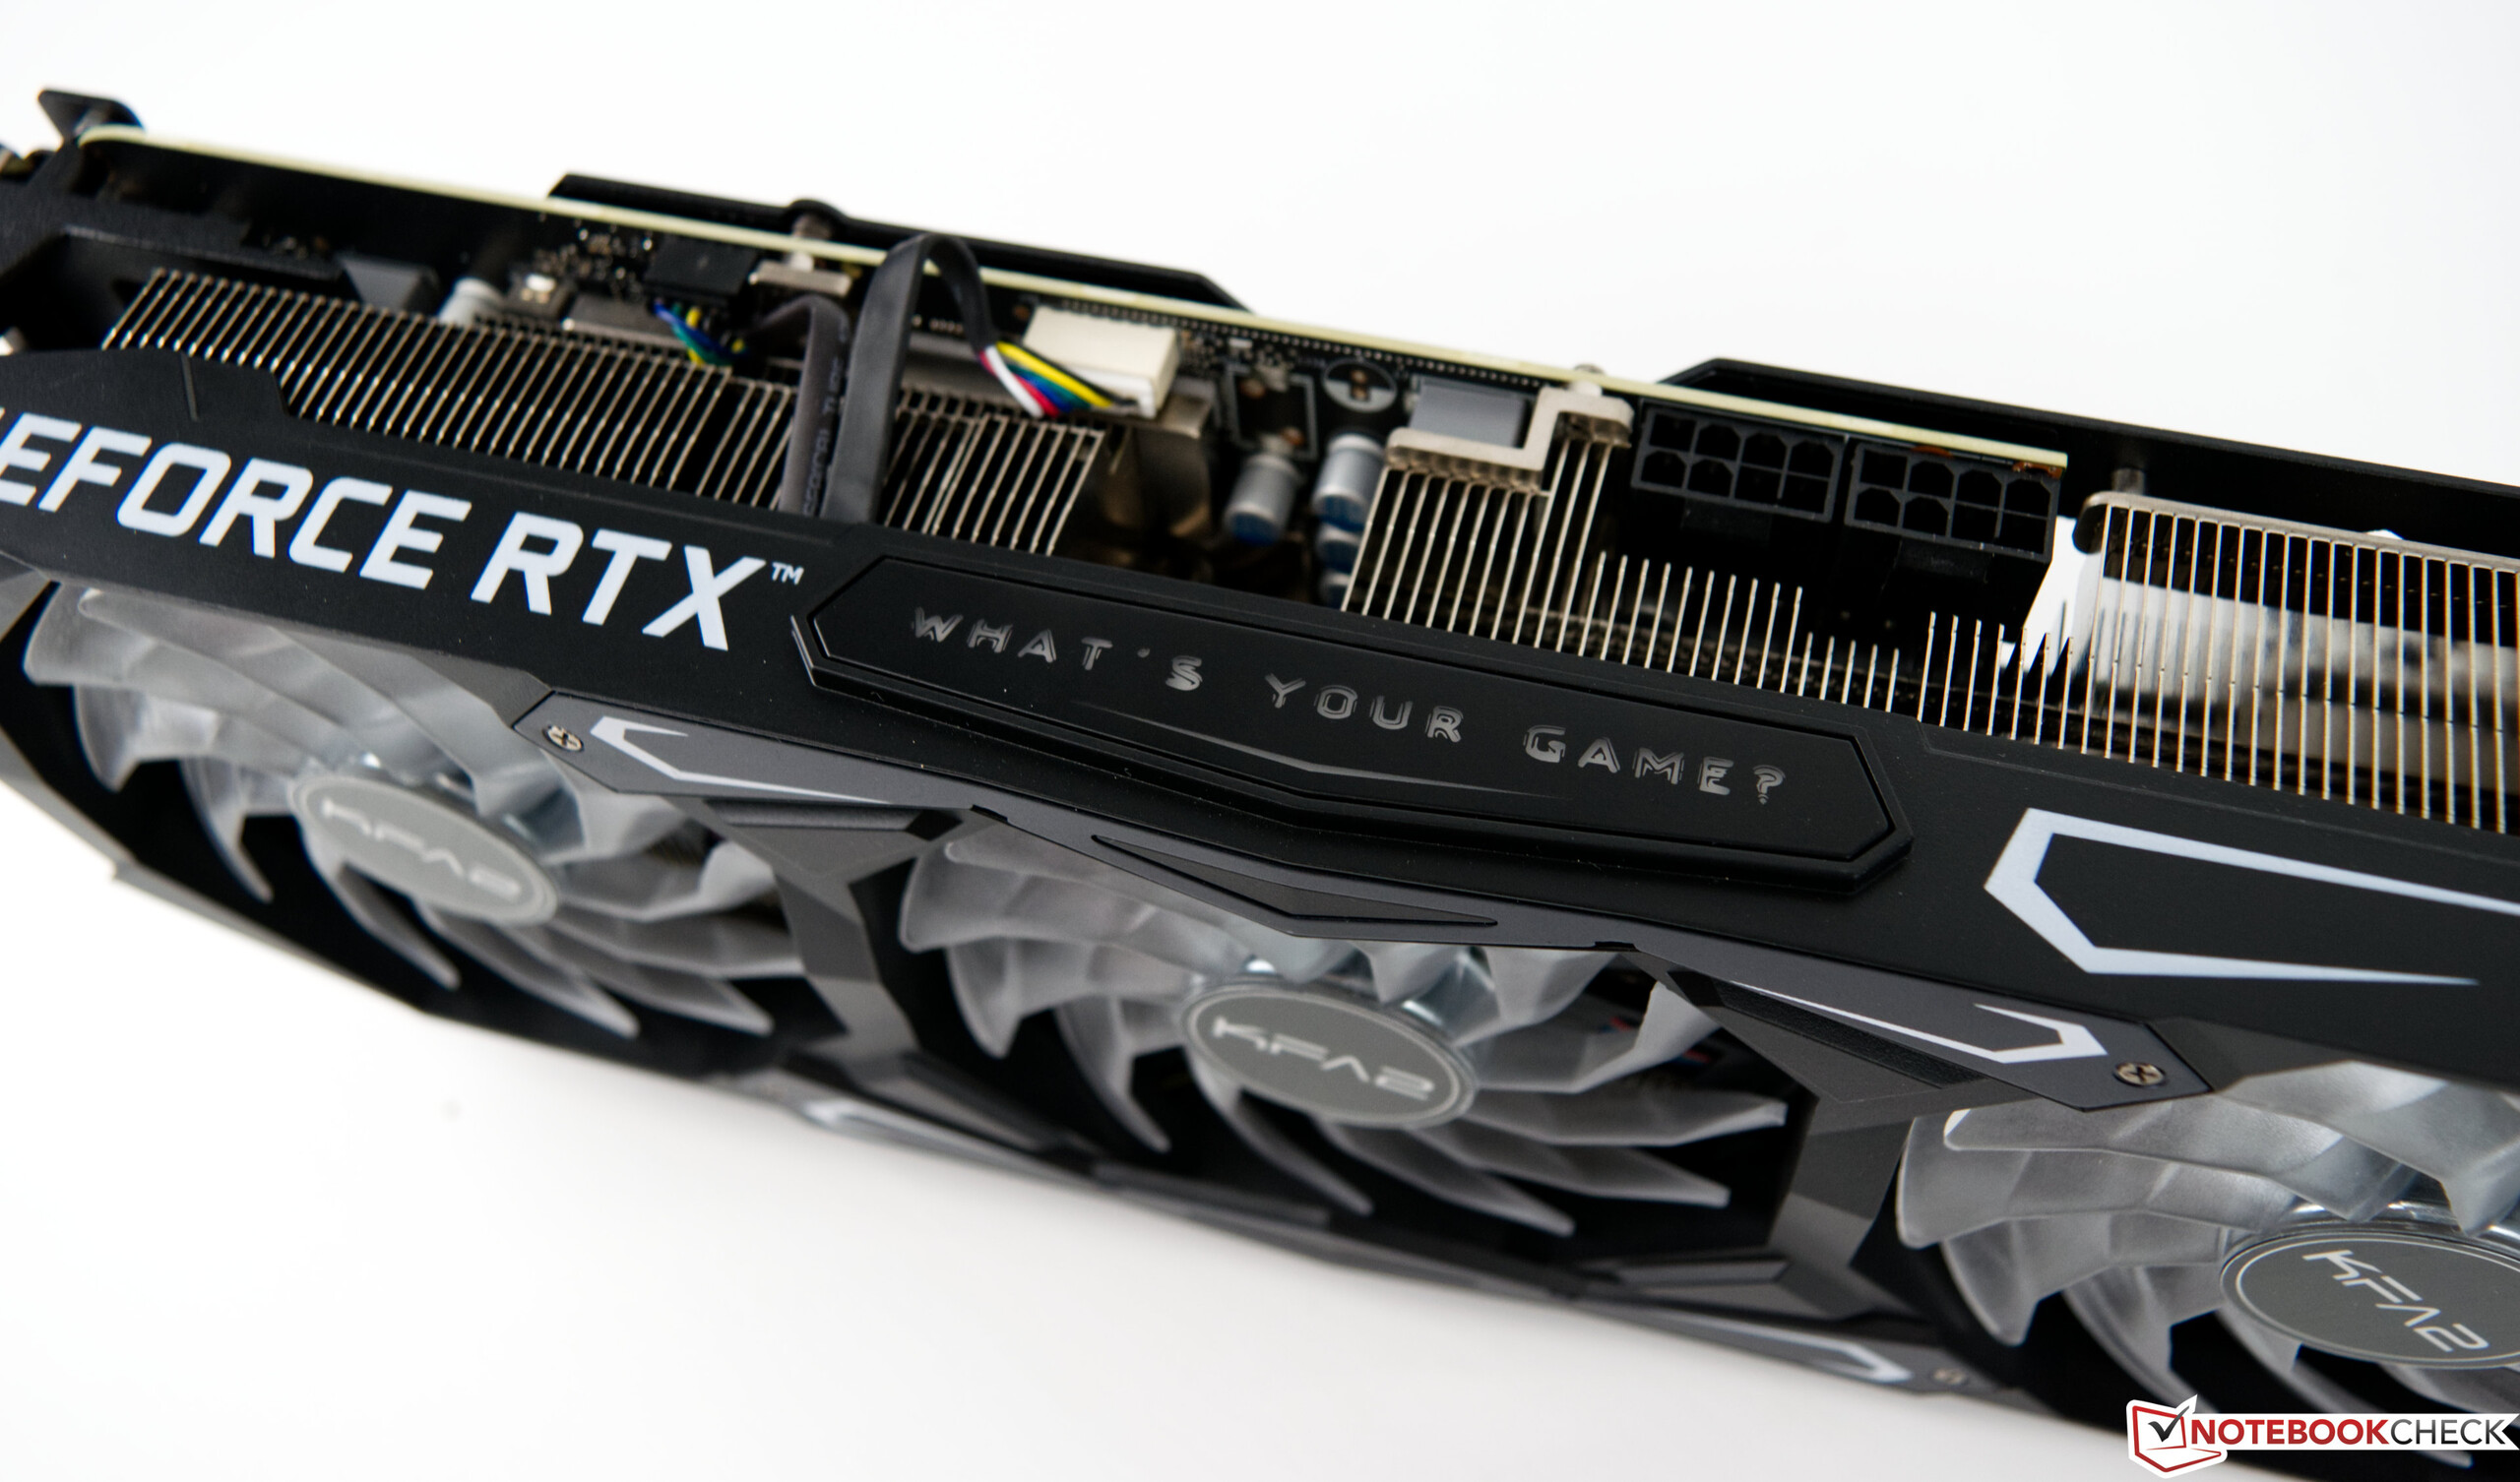
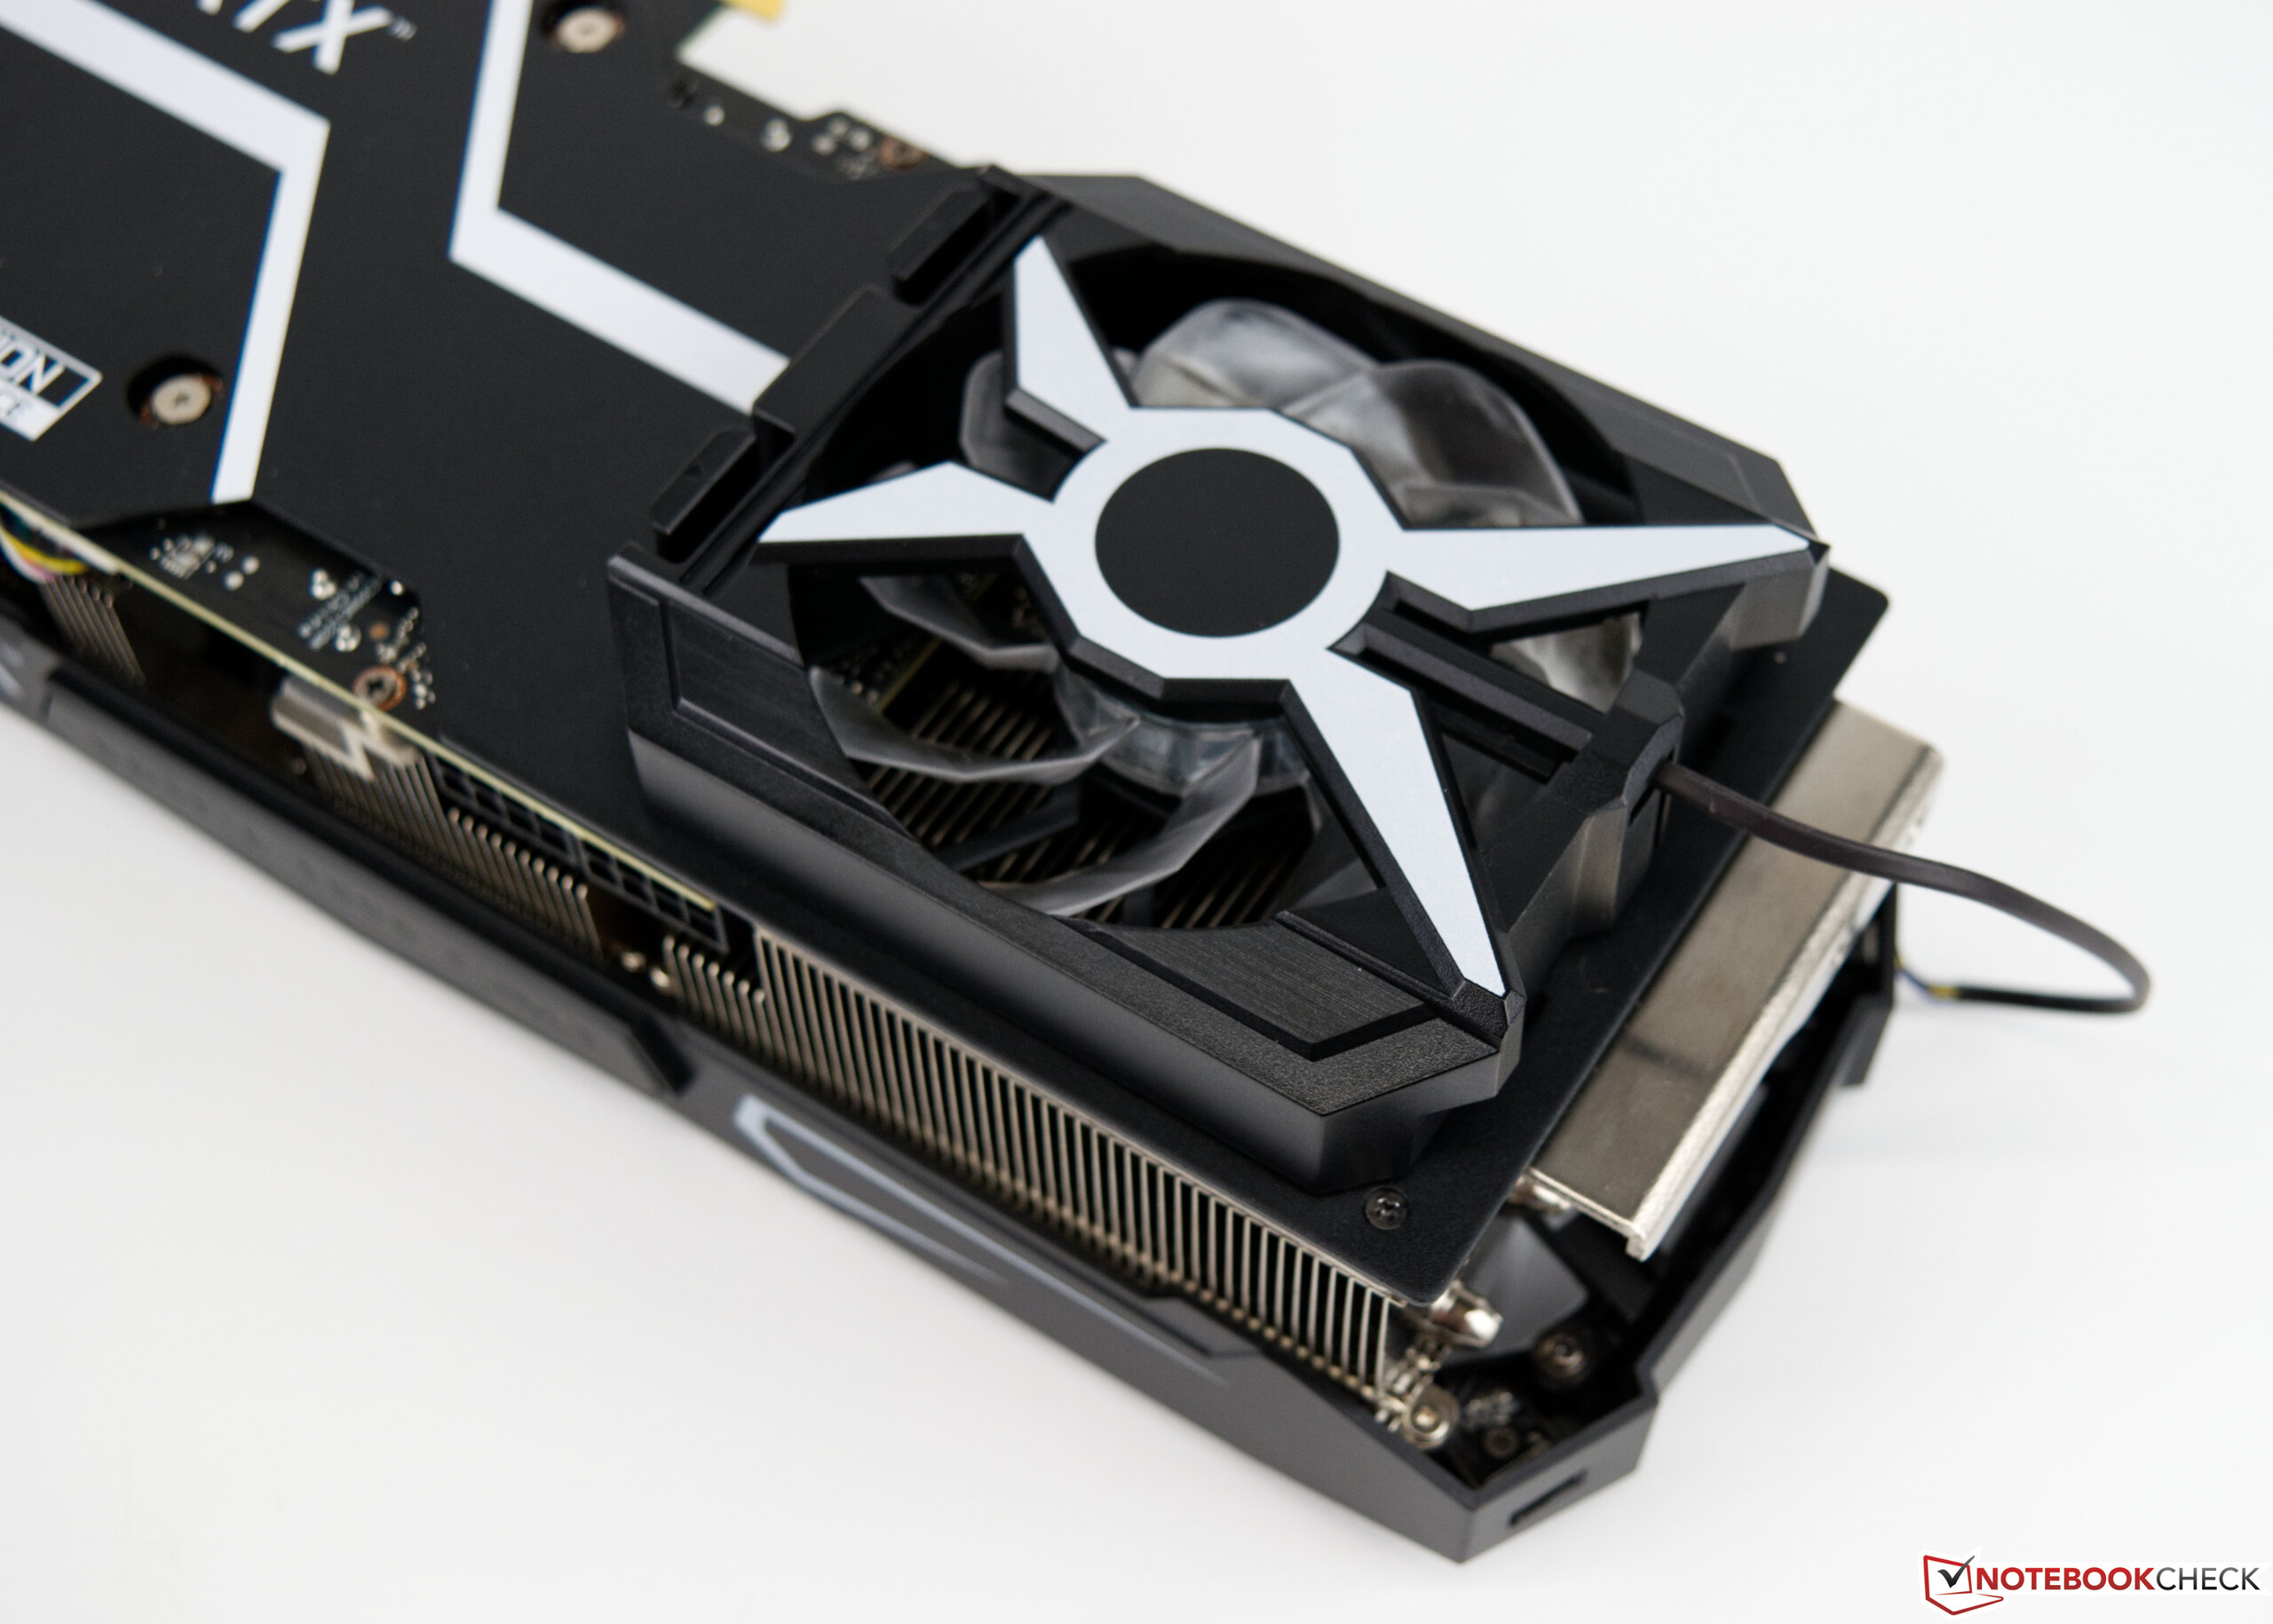
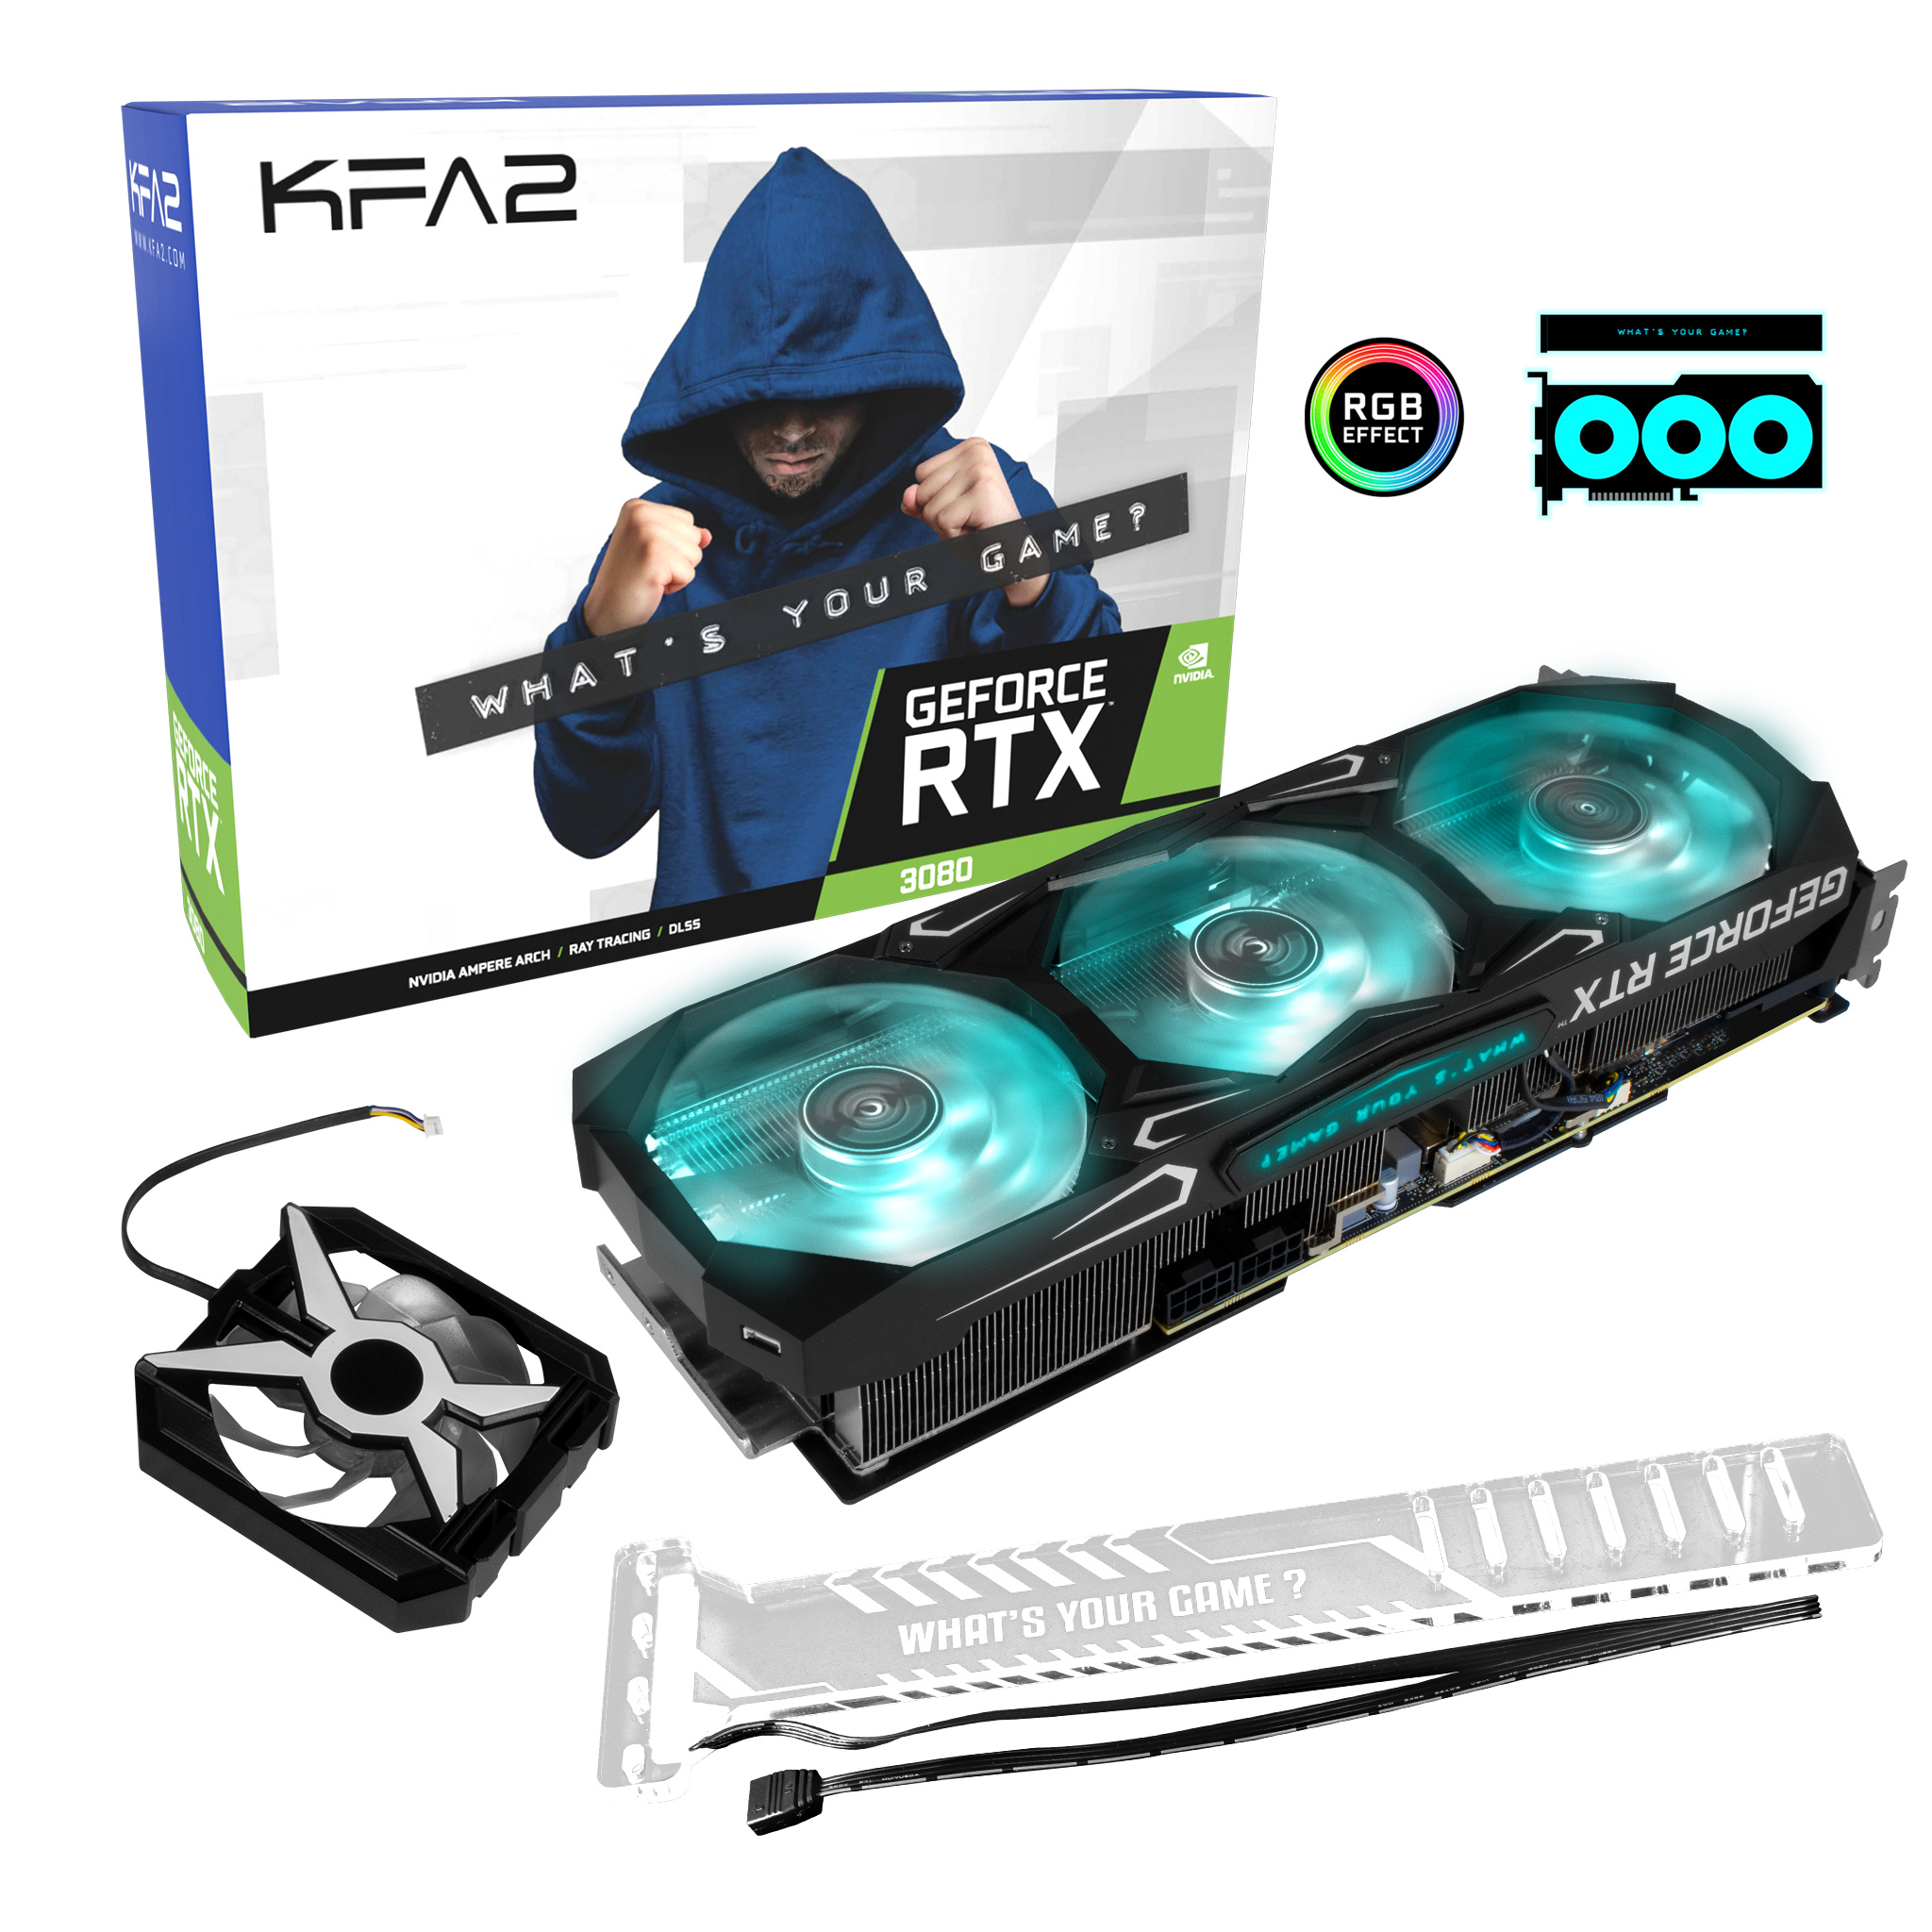
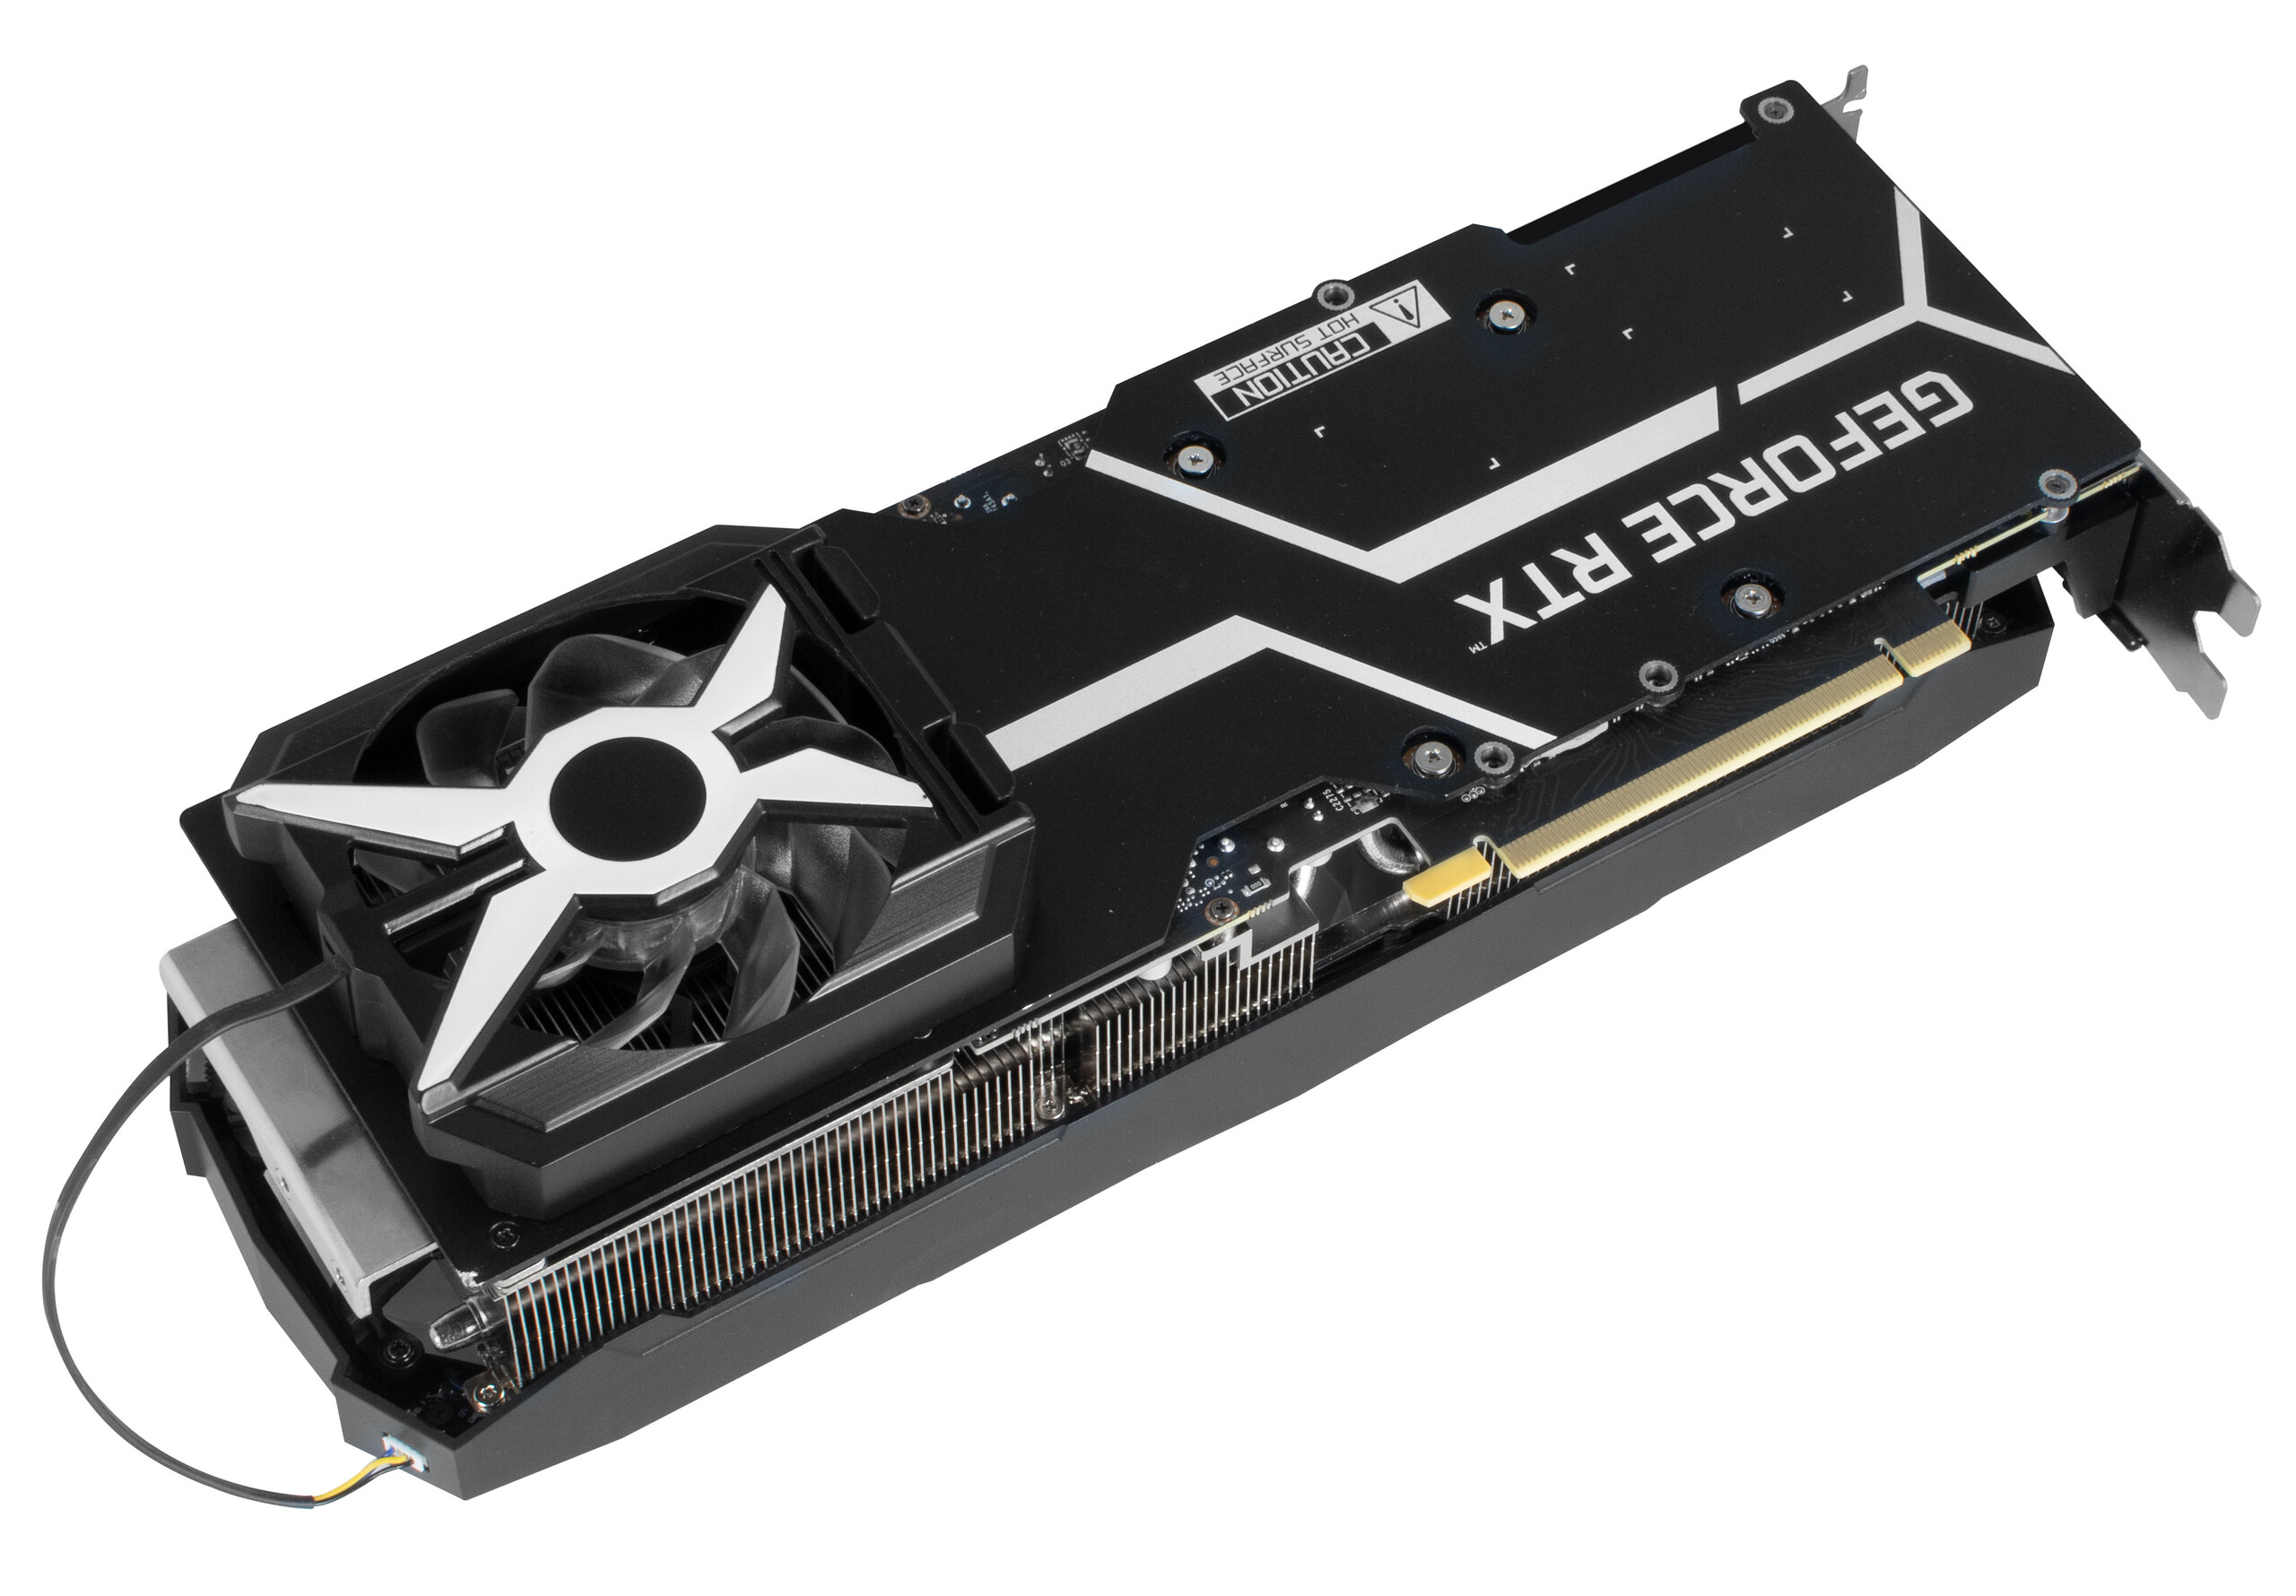
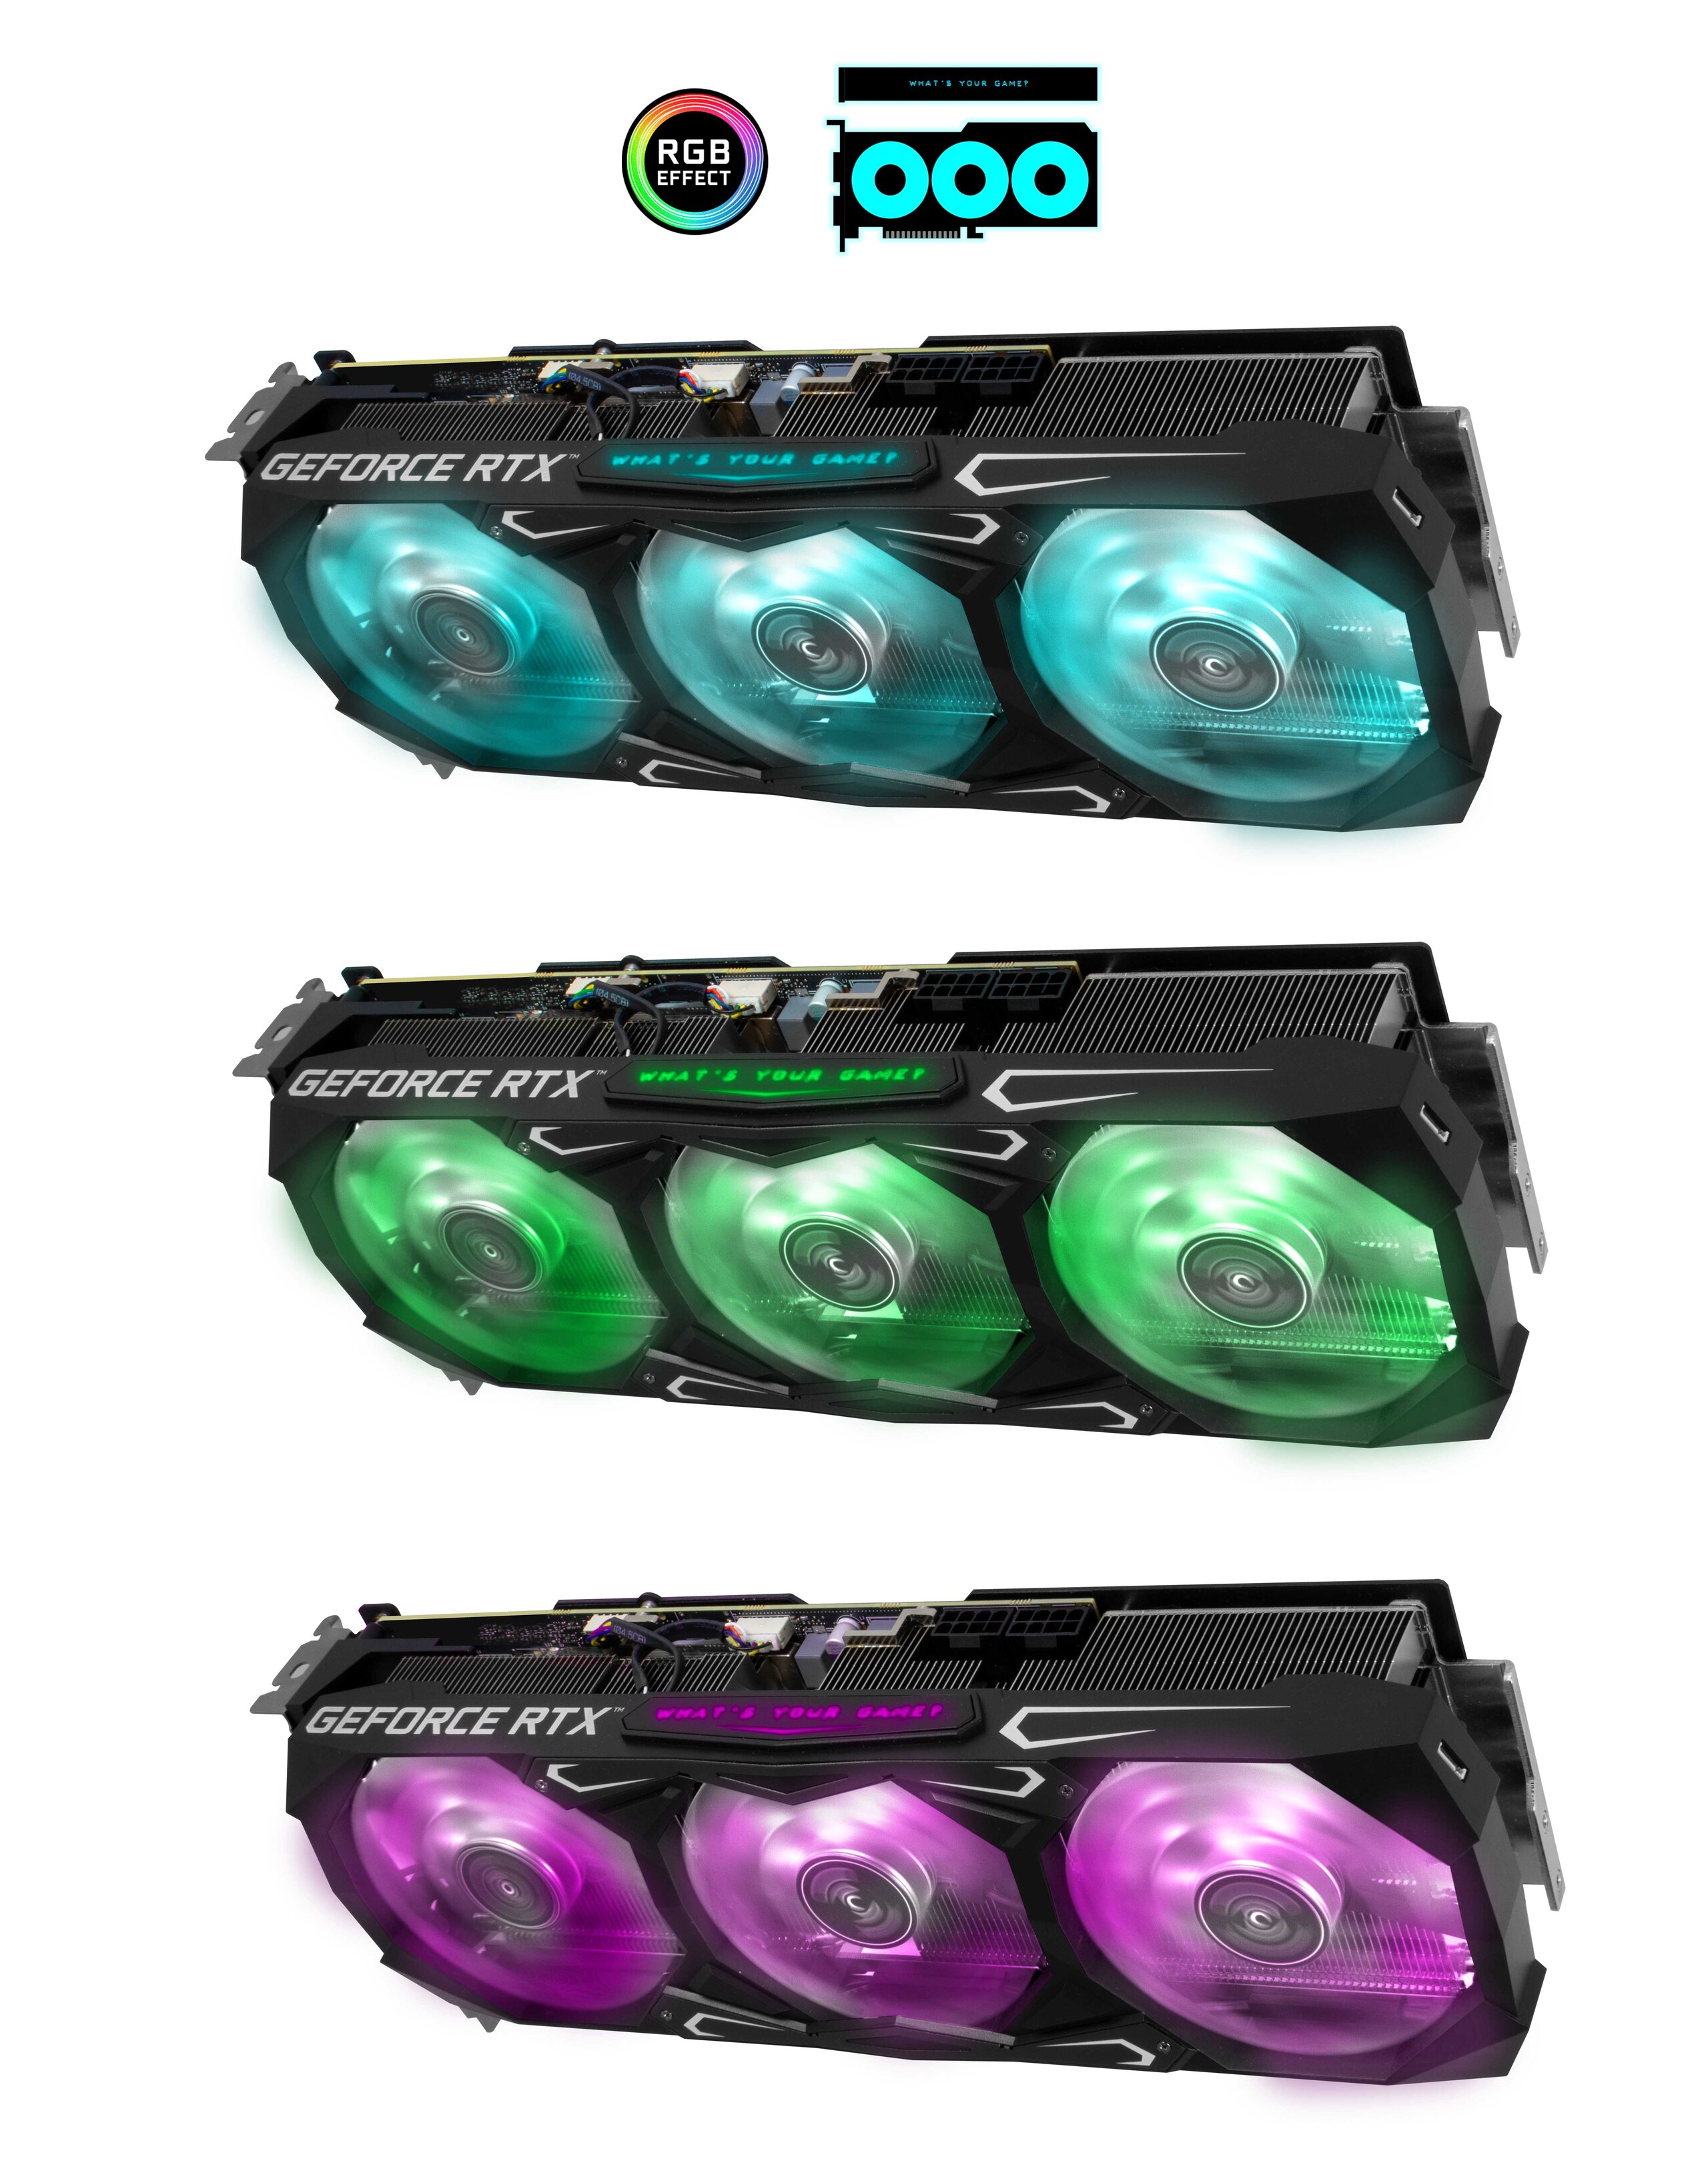
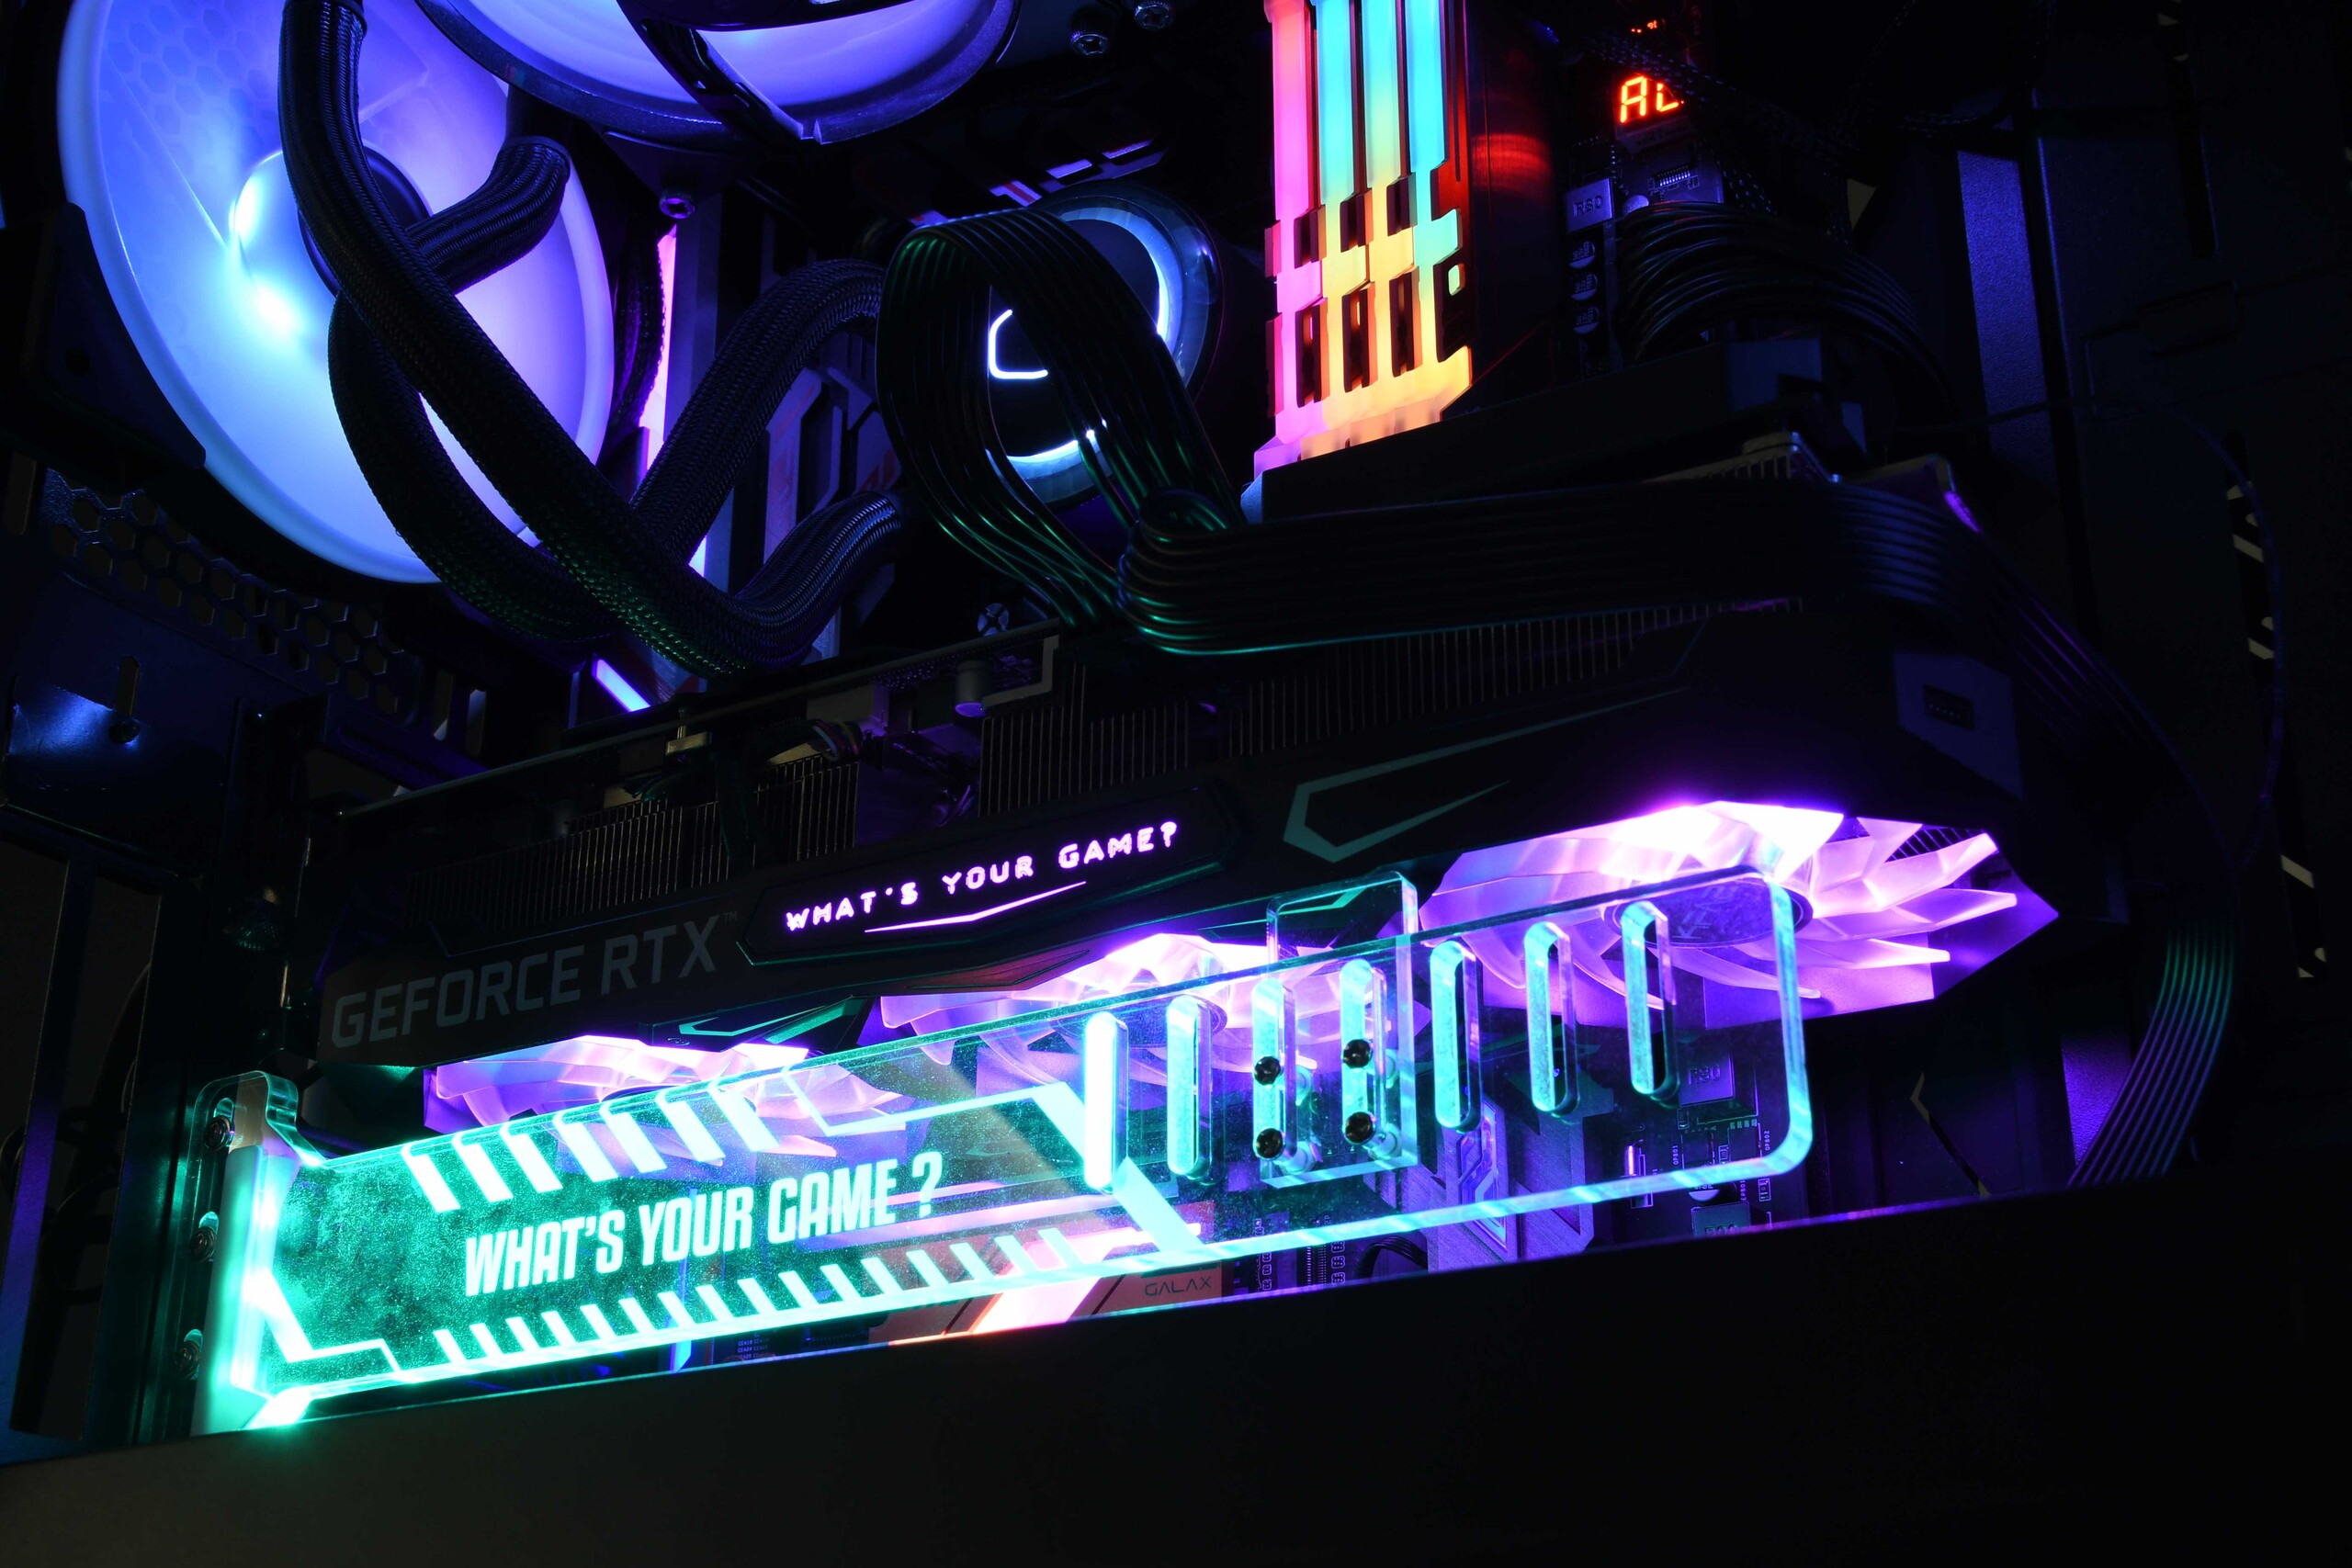
For this review, we received a GeForce RTX 3080 12 GB by KFA2. This particular model is based on the GA102 chip with a total of 8,960 shaders, which should improve performance and help to close or at least narrow the gap to the Nvidia GeForce RTX 3080 Ti. In addition, the KFA2 GeForce RTX 3080 SG 12 GB comes with a rather voluminous cooler designed to dissipate the card’s 350 W of heat reliably and quickly. Keep in mind that its triple-slot design takes up a lot of space and might not fit your case.  The fancy RGB lights help to illuminate and highlight its three 92 mm fans and the “What’s Your Game” slogan printed on the card.

Prices for this card start at around 970 Euros in Europe and around $1,200 in the United States. Considering current supply chain issues, we find this to be an acceptable price for a high-end graphics card. Prices have also dropped slightly in the last couple of weeks, which is a promising sign.

KFA2 GeForce RTX 3080 SG 12GB
KFA2 GeForce RTX 3080 SG 12GB - support bracket
KFA2 GeForce RTX 3080 SG 12GB - optional fan
KFA2 GeForce RTX 3080 SG 12GB mit Lüfter optional
KFA2 GeForce RTX 3080 SG 12GB
KFA2 GeForce RTX 3080 SG 12GB (Source: KFA2)

Our AMD Ryzen 9 5900X-based Test System

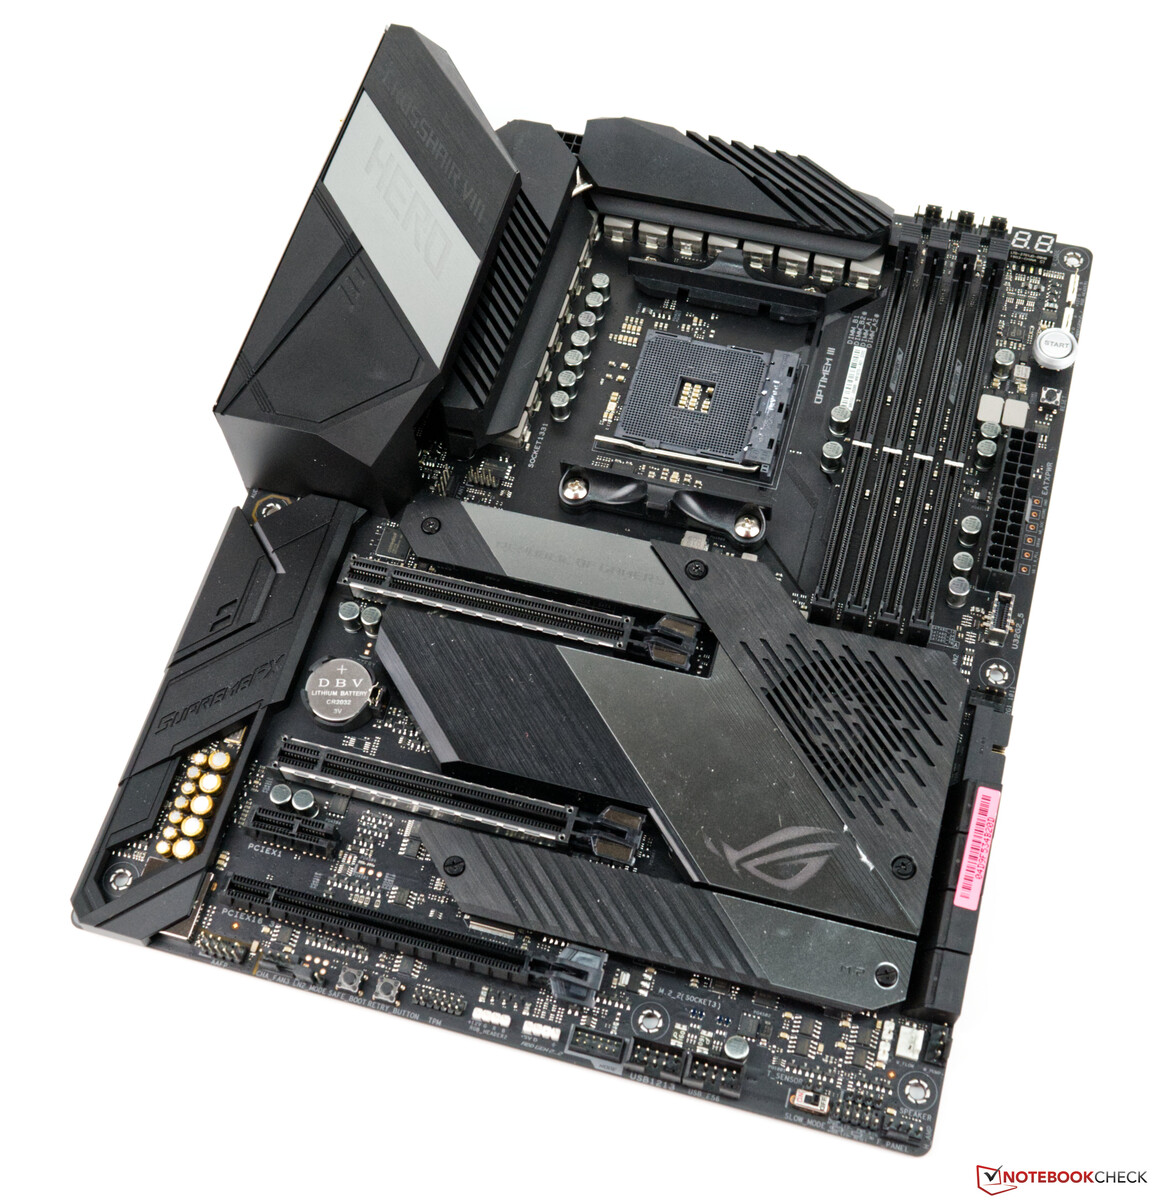
Out test system for this card is based on AMD’s current platform. It features an Asus X570 ROG Crosshair VIII Hero WiFi mainboard, an AMD Ryzen 9 5900X to ensure proper and plentiful CPU performance, an Alphacool Eisbear 360 AiO cooler, and 32 GB of RAM provided by G.Skill. The system outputs its video signal to an Acer Predator XB321HK monitor, which is fully UHD-capable. We would like to thank AMD for providing us with this test platform.

AMD Ryzen 9 5900X
AMD Ryzen 9 5900X
Asus X570 ROG Crosshair VIII Hero WiFi
G.Skill Trident Z Neo RGB DDR4-4000

The following system was used to run the benchmarks below: 

  • Lian Li O11 Dynamic
  • AMD Ryzen 9 5900X
  • KFA2 GeForce RTX 3080 SG 12GB (Nvidia 512.70)
  • Asus X570 ROG Crosshair VIII Hero WiFi (BIOS 2402, Default Settings, XMP 1 for DDR4-4000)
  • Corsair RM1000X 1000 W power supply
  • G.Skill Trident Z Neo RGB DDR4-4000 memory kit 2 x 16 GB
  • Corsair MP600 2TB M.2 PCIe-4.0-SSD
  • Crucial MX500 2TB (for games)

Die Grafikkarten der aktuellen RTX-3000-Serie

Configuration RTX 3090 Ti RTX 3090 RTX 3080 Ti RTX 3080 (12G) RTX 3080 (10G) RTX 3070 Ti RTX 3070 RTX 3060 Ti RTX 3060 RTX 3050
Chip GA102 GA102 GA102 GA102 GA102 GA104 GA104 GA104 GA106 GA106
FinFET Process 8 nm 8 nm 8 nm 8 nm 8 nm 8 nm 8 nm 8 nm 8 nm 8 nm
CUDA Cores 10,752 10,496 10,240 8,960 8,704 6,144 5,888 4,864 3,854 2,560
Texture Units 336 328 320 280 272 192 184 152 112 80
Tensor Cores 336 3. Gen. 328 3. Gen. 320 3. Gen. 280 3. Gen. 272 3. Gen. 192 3. Gen. 184 3. Gen. 152 3. Gen. 112 3. Gen. 80 3. Gen
RT Cores 84 82 80 70 68 48 46 38 28 20
GPU Base Clock 1,560 MHz 1,395 MHz 1,365 MHz 1,260 MHz 1,440 MHz 1,575 MHz 1,500 MHz 1,410 MHz 1,320 MHz 1,552 MHz
GPU Boost Clock 1,860 MHz 1,695 MHz 1,665 MHz 1,710 MHz 1,710 MHz 1,770 MHz 1,750 MHz 1,665 MHz 1,777 MHz 1,777 MHz
Memory Bus 384 bit 384 bit 384 bit 384 bit 320 bit 256 Bit 256 Bit 256 bit 192 bit 128 bit
Memory Bandwidth 1,008 GB/s 936 GB/s 912,4 GB/s 912,4 GB/s 760 GB/s 608,3 GB/s 448 GB/s 448 GB/s 360 GB/s 224 GB/s
Video Memory 24 GB GDDR6X 24 GB GDDR6X 12 GB GDDR6X 12 GB GDDR6X 10 GB GDDR6X 8 GB GDDR6 8 GB GDDR6 8 GB GDDR6 12 GB GDDR6 8 GB GDDR6
Power Consumption 450 W 350 W 350 W 350 W 320 W 290 W 220 W 200 W 170 W 130 W

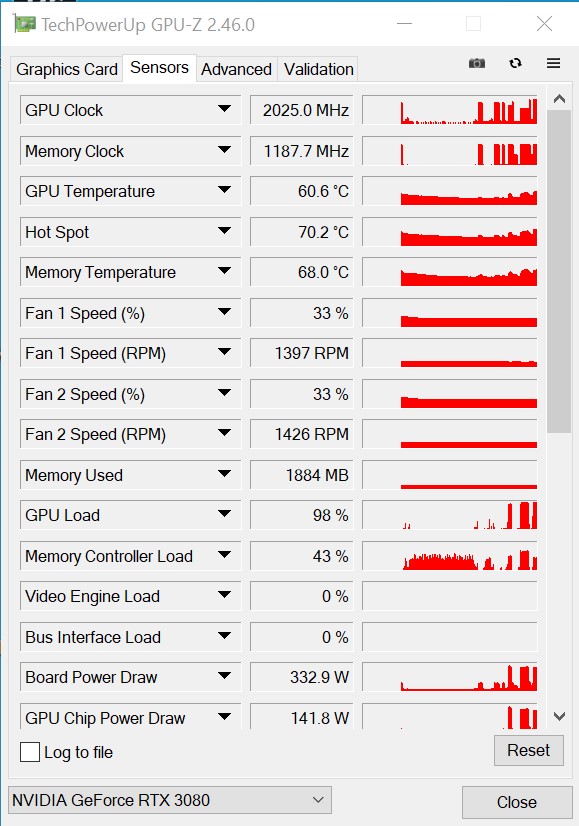
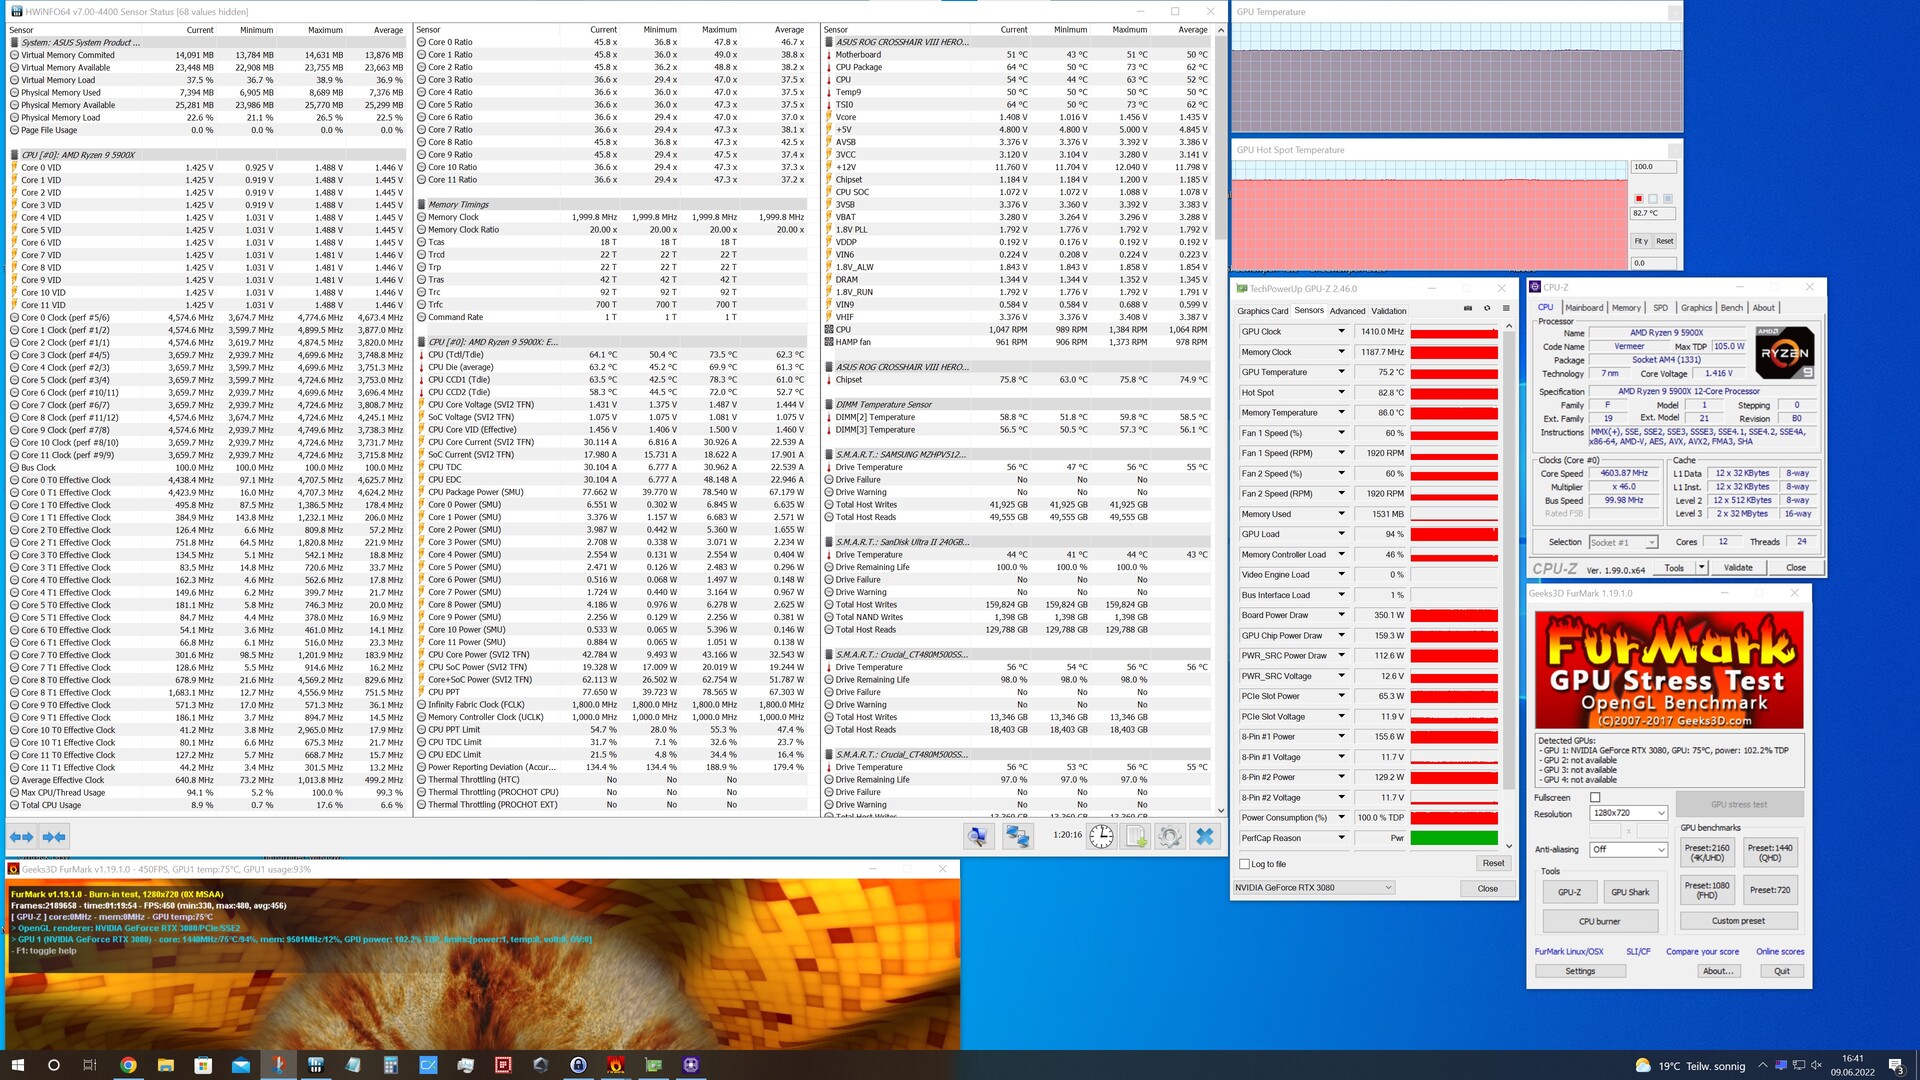
KFA2 GeForce RTX 3080 SG 12 GB Clock Speeds

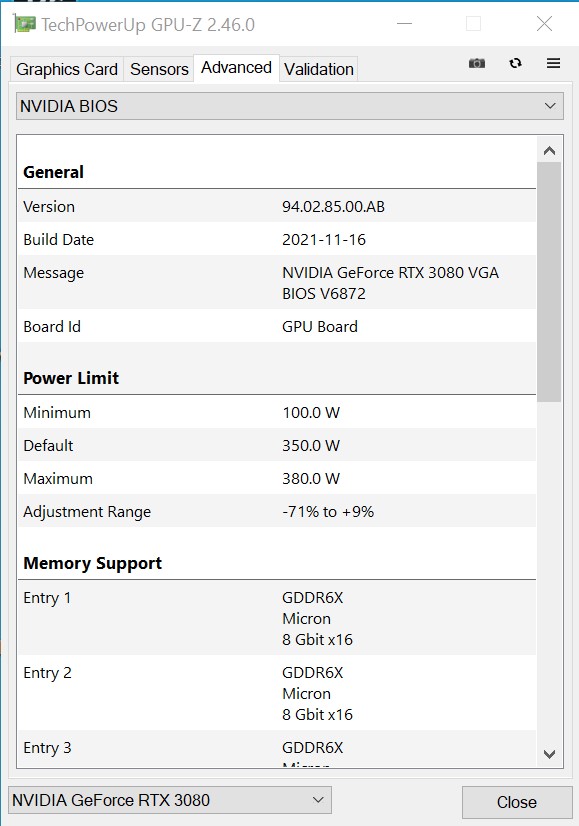
Our KFA2 GeForce RTX 3080 SG 12 GB review unit’s boost clock speeds were only slightly above Nvidia’s specifications. However, we should add that the specified 1,740 MHz boost were consistently surpassed in almost every single test we ran. This model supports a power target increase of up to nine percent resulting in a total maximum power consumption of 380 W.

GPU-Z
GPU-Z
GPU-Z
GPU-Z
GPU-Z
GPU-Z

Synthetic Benchmarks

In our synthetic benchmarks, we find the KFA2 GeForce RTX 3080 SG 12 GB right where we thought we would: in between the GeForce RTX 3080 and the GeForce RTX 3090. Keep in mind that this particular performance gain is courtesy of the card’s additional shader units and less of its extra VRAM. When compared to its AMD-based competitors the KFA2 RTX 3080 SG 12 GB performed about as fast as an AMD Radeon RX 6800 XT.

Performance Rating - Percent
NVIDIA GeForce RTX 3090
95.5 pt
Radeon RX 6900 XT
92.7 pt
KFA2 GeForce RTX 3080 SG 12GB
92.5 pt
Radeon RX 6800 XT
86.9 pt
NVIDIA GeForce RTX 3080
84.6 pt
Radeon RX 6800
77.8 pt
NVIDIA GeForce RTX 3070
69.5 pt
Radeon RX 6700 XT
64.6 pt
Radeon RX 6600 XT
53.3 pt
NVIDIA GeForce RTX 3060
47.9 pt
3DMark
1920x1080 Fire Strike Graphics
Radeon RX 6900 XT
50587 Points +14%
Radeon RX 6800 XT
49735 Points +12%
KFA2 GeForce RTX 3080 SG 12GB
44533 Points
Radeon RX 6800
43786 Points -2%
NVIDIA GeForce RTX 3090
42688 Points -4%
NVIDIA GeForce RTX 3080
37604 Points -16%
Radeon RX 6700 XT
35136 Points -21%
NVIDIA GeForce RTX 3070
31020 Points -30%
Radeon RX 6600 XT
28342 Points -36%
NVIDIA GeForce RTX 3060
21847 Points -51%
Fire Strike Extreme Graphics
Radeon RX 6900 XT
26650 Points +21%
Radeon RX 6800 XT
25015 Points +13%
NVIDIA GeForce RTX 3090
23114 Points +5%
KFA2 GeForce RTX 3080 SG 12GB
22078 Points
Radeon RX 6800
21510 Points -3%
NVIDIA GeForce RTX 3080
20007 Points -9%
Radeon RX 6700 XT
17009 Points -23%
NVIDIA GeForce RTX 3070
15722 Points -29%
Radeon RX 6600 XT
13122 Points -41%
NVIDIA GeForce RTX 3060
10330 Points -53%
3840x2160 Fire Strike Ultra Graphics
Radeon RX 6900 XT
13370 Points +18%
Radeon RX 6800 XT
12626 Points +11%
NVIDIA GeForce RTX 3090
12371 Points +9%
KFA2 GeForce RTX 3080 SG 12GB
11340 Points
NVIDIA GeForce RTX 3080
10645 Points -6%
Radeon RX 6800
10547 Points -7%
Radeon RX 6700 XT
8325 Points -27%
NVIDIA GeForce RTX 3070
8227 Points -27%
Radeon RX 6600 XT
6515 Points -43%
NVIDIA GeForce RTX 3060
5037 Points -56%
2560x1440 Time Spy Graphics
NVIDIA GeForce RTX 3090
19571 Points +9%
Radeon RX 6900 XT
18210 Points +1%
KFA2 GeForce RTX 3080 SG 12GB
17956 Points
NVIDIA GeForce RTX 3080
17604 Points -2%
Radeon RX 6800 XT
17603 Points -2%
Radeon RX 6800
16033 Points -11%
NVIDIA GeForce RTX 3070
13111 Points -27%
Radeon RX 6700 XT
11473 Points -36%
Radeon RX 6600 XT
9565 Points -47%
NVIDIA GeForce RTX 3060
8559 Points -52%
3DMark 11
1280x720 Performance GPU
Radeon RX 6900 XT
59119 Points +4%
NVIDIA GeForce RTX 3090
56689 Points 0%
KFA2 GeForce RTX 3080 SG 12GB
56634 Points
Radeon RX 6800
52384 Points -8%
Radeon RX 6800 XT
52046 Points -8%
NVIDIA GeForce RTX 3080
50087 Points -12%
Radeon RX 6700 XT
43888 Points -23%
NVIDIA GeForce RTX 3070
43005 Points -24%
Radeon RX 6600 XT
39051 Points -31%
NVIDIA GeForce RTX 3060
28072 Points -50%
1280x720 Performance
Radeon RX 6900 XT
42418 Points +2%
KFA2 GeForce RTX 3080 SG 12GB
41410 Points
Radeon RX 6800 XT
38057 Points -8%
NVIDIA GeForce RTX 3090
37897 Points -8%
Radeon RX 6800
37402 Points -10%
NVIDIA GeForce RTX 3080
35399 Points -15%
Radeon RX 6700 XT
34078 Points -18%
NVIDIA GeForce RTX 3070
33248 Points -20%
Radeon RX 6600 XT
31304 Points -24%
NVIDIA GeForce RTX 3060
26986 Points -35%
Unigine Superposition
1280x720 720p Low
KFA2 GeForce RTX 3080 SG 12GB
38209 Points
Radeon RX 6900 XT
37023 Points -3%
Radeon RX 6800 XT
36452 Points -5%
NVIDIA GeForce RTX 3060
34973 Points -8%
Radeon RX 6700 XT
34713 Points -9%
NVIDIA GeForce RTX 3070
34602 Points -9%
NVIDIA GeForce RTX 3090
33329 Points -13%
Radeon RX 6600 XT
33152 Points -13%
Radeon RX 6800
32455 Points -15%
NVIDIA GeForce RTX 3080
32183 Points -16%
1920x1080 1080p High
NVIDIA GeForce RTX 3090
25953 Points +8%
Radeon RX 6900 XT
25029 Points +4%
KFA2 GeForce RTX 3080 SG 12GB
24051 Points
Radeon RX 6800 XT
22265 Points -7%
NVIDIA GeForce RTX 3080
21912 Points -9%
Radeon RX 6800
19506 Points -19%
NVIDIA GeForce RTX 3070
17244 Points -28%
Radeon RX 6700 XT
15832 Points -34%
Radeon RX 6600 XT
13069 Points -46%
NVIDIA GeForce RTX 3060
11222 Points -53%
1920x1080 1080p Extreme
NVIDIA GeForce RTX 3090
12694 Points +11%
KFA2 GeForce RTX 3080 SG 12GB
11424 Points
NVIDIA GeForce RTX 3080
10822 Points -5%
Radeon RX 6900 XT
10683 Points -6%
Radeon RX 6800 XT
10046 Points -12%
NVIDIA GeForce RTX 3070
8365 Points -27%
Radeon RX 6800
8224 Points -28%
Radeon RX 6700 XT
6804 Points -40%
Radeon RX 6600 XT
5674 Points -50%
NVIDIA GeForce RTX 3060
5036 Points -56%
3840x2160 4k Optimized
NVIDIA GeForce RTX 3090
16868 Points +13%
KFA2 GeForce RTX 3080 SG 12GB
14986 Points
Radeon RX 6900 XT
14955 Points 0%
NVIDIA GeForce RTX 3080
14243 Points -5%
Radeon RX 6800 XT
13471 Points -10%
Radeon RX 6800
11757 Points -22%
NVIDIA GeForce RTX 3070
10673 Points -29%
Radeon RX 6700 XT
9106 Points -39%
Radeon RX 6600 XT
7098 Points -53%
NVIDIA GeForce RTX 3060
6774 Points -55%
7680x4320 8k Optimized
NVIDIA GeForce RTX 3090
7521 Points +15%
KFA2 GeForce RTX 3080 SG 12GB
6548 Points
NVIDIA GeForce RTX 3080
6346 Points -3%
Radeon RX 6900 XT
5764 Points -12%
Radeon RX 6800 XT
5256 Points -20%
Radeon RX 6800
4709 Points -28%
NVIDIA GeForce RTX 3070
4639 Points -29%
Radeon RX 6700 XT
3586 Points -45%
NVIDIA GeForce RTX 3060
2830 Points -57%
Radeon RX 6600 XT
2778 Points -58%
Unigine Heaven 4.0
Extreme Preset OpenGL
NVIDIA GeForce RTX 3090
273.7 fps +9%
KFA2 GeForce RTX 3080 SG 12GB
251.4 fps
NVIDIA GeForce RTX 3080
243.2 fps -3%
Radeon RX 6900 XT
206.5 (8.2min - 453.7max) fps -18%
Radeon RX 6800 XT
204 fps -19%
NVIDIA GeForce RTX 3070
192.9 fps -23%
Radeon RX 6800
178.1 fps -29%
Radeon RX 6700 XT
149.6 fps -40%
Radeon RX 6600 XT
119.3 fps -53%
NVIDIA GeForce RTX 3060
117.7 fps -53%
Extreme Preset DX11
NVIDIA GeForce RTX 3090
283.5 fps +3%
KFA2 GeForce RTX 3080 SG 12GB
274.3 fps
Radeon RX 6900 XT
259.5 (49.3min - 537.2max) fps -5%
NVIDIA GeForce RTX 3080
252.5 fps -8%
Radeon RX 6800 XT
247.9 fps -10%
Radeon RX 6800
221.1 fps -19%
NVIDIA GeForce RTX 3070
203.2 fps -26%
Radeon RX 6700 XT
184.4 fps -33%
Radeon RX 6600 XT
153.2 fps -44%
NVIDIA GeForce RTX 3060
133.2 fps -51%
Unigine Valley 1.0
1920x1080 Extreme HD DirectX AA:x8
KFA2 GeForce RTX 3080 SG 12GB
203.8 fps
Radeon RX 6900 XT
200.8 (53.4min - 359.1max) fps -1%
NVIDIA GeForce RTX 3090
196 fps -4%
Radeon RX 6800 XT
190.6 fps -6%
NVIDIA GeForce RTX 3080
181.8 fps -11%
Radeon RX 6800
179.7 fps -12%
NVIDIA GeForce RTX 3070
157 fps -23%
Radeon RX 6700 XT
149.8 fps -26%
Radeon RX 6600 XT
110.1 fps -46%
NVIDIA GeForce RTX 3060
106.7 fps -48%
1920x1080 Extreme HD Preset OpenGL AA:x8
NVIDIA GeForce RTX 3090
187.8 fps +1%
KFA2 GeForce RTX 3080 SG 12GB
186.1 fps
NVIDIA GeForce RTX 3080
172 fps -8%
Radeon RX 6900 XT
167.4 (56.7min - 375.7max) fps -10%
Radeon RX 6800 XT
158.2 fps -15%
NVIDIA GeForce RTX 3070
142.9 fps -23%
Radeon RX 6800
137.2 fps -26%
Radeon RX 6700 XT
112.6 fps -39%
NVIDIA GeForce RTX 3060
91.9 fps -51%
Radeon RX 6600 XT
83.5 fps -55%
SiSoft Sandra 2016
Image Processing
Radeon RX 6800 XT
6196 MPix/s +39%
Radeon RX 6800
4709 MPix/s +6%
KFA2 GeForce RTX 3080 SG 12GB
4460.23 MPix/s
NVIDIA GeForce RTX 3090
4437 MPix/s -1%
NVIDIA GeForce RTX 3080
3813 MPix/s -15%
Radeon RX 6700 XT
3730 MPix/s -16%
Radeon RX 6600 XT
2820 MPix/s -37%
NVIDIA GeForce RTX 3070
2567 MPix/s -42%
NVIDIA GeForce RTX 3060
1642 MPix/s -63%
GP Cryptography (Higher Security AES256+SHA2-512)
NVIDIA GeForce RTX 3090
200.4 GB/s +24%
NVIDIA GeForce RTX 3080
174 GB/s +8%
KFA2 GeForce RTX 3080 SG 12GB
161.59 GB/s
Radeon RX 6800 XT
160.8 GB/s 0%
NVIDIA GeForce RTX 3070
117.8 GB/s -27%
Radeon RX 6700 XT
100.6 GB/s -38%
NVIDIA GeForce RTX 3060
65.7 GB/s -59%
GP Financial Analysis (FP High/Double Precision)
Radeon RX 6800
410 KOPT/s +64%
Radeon RX 6800 XT
381.8 KOPT/s +52%
NVIDIA GeForce RTX 3090
254.4 KOPT/s +2%
KFA2 GeForce RTX 3080 SG 12GB
250.41 KOPT/s
Radeon RX 6700 XT
226.2 KOPT/s -10%
NVIDIA GeForce RTX 3080
220.9 KOPT/s -12%
Radeon RX 6600 XT
182.4 KOPT/s -27%
NVIDIA GeForce RTX 3070
146.5 KOPT/s -41%
NVIDIA GeForce RTX 3060
86.4 KOPT/s -65%
3DMark 05 Standard
62003 points
3DMark 06 Standard Score
48432 points
3DMark Vantage P Result
102294 points
3DMark 11 Performance
41410 points
3DMark Ice Storm Standard Score
224001 points
3DMark Cloud Gate Standard Score
74457 points
3DMark Fire Strike Score
35922 points
3DMark Fire Strike Extreme Score
21299 points
3DMark Time Spy Score
16961 points
Help

Gaming Benchmarks

The Witcher 3 frame times (Ultra)
The Witcher 3 frame rates over time (Ultra)

Our gaming benchmarks were completed very well overall without any issues. All benchmarked games can be enjoyed smoothly in 2160p and maximum details with only some games failing to reach an average of 60 FPS. Compared to the Nvidia GeForce RTX 3080 this new 12 GB card performed between 10 and 15 % faster, which means the KFA2 RTX 3080 SG 12 GB is not only faster than the AMD Radeon RX 6800 XT but almost within striking distance of AMD's Radeon RX 6900 XT.

Thanks to its very high performance the KFA2 GeForce RTX 3080 SG 12 GB is practically made for high-resolution gaming in high details. If you only play in 1080p a GeForce RTX 3080 12 GB might not be the right choice for you. If, however, you want your GPU to last for many a year this top-of-the-line model might just be. The RTX 3080 definitely benefits immensely from having access to 12 GB of VRAM, and it should have been released like this from the beginning. Nevertheless, its competitors offer more with up to 16 GB of VRAM, and Nvidia’s own prohibitively expensive RTX 3090 features up to 24 GB of VRAM. This, however, does not necessarily result in higher performance, as can be seen below. While the RTX 3090 did perform slightly faster than our RTX 3080 12 GB review model the differences between the two do not justify the RTX 3090’s higher price.

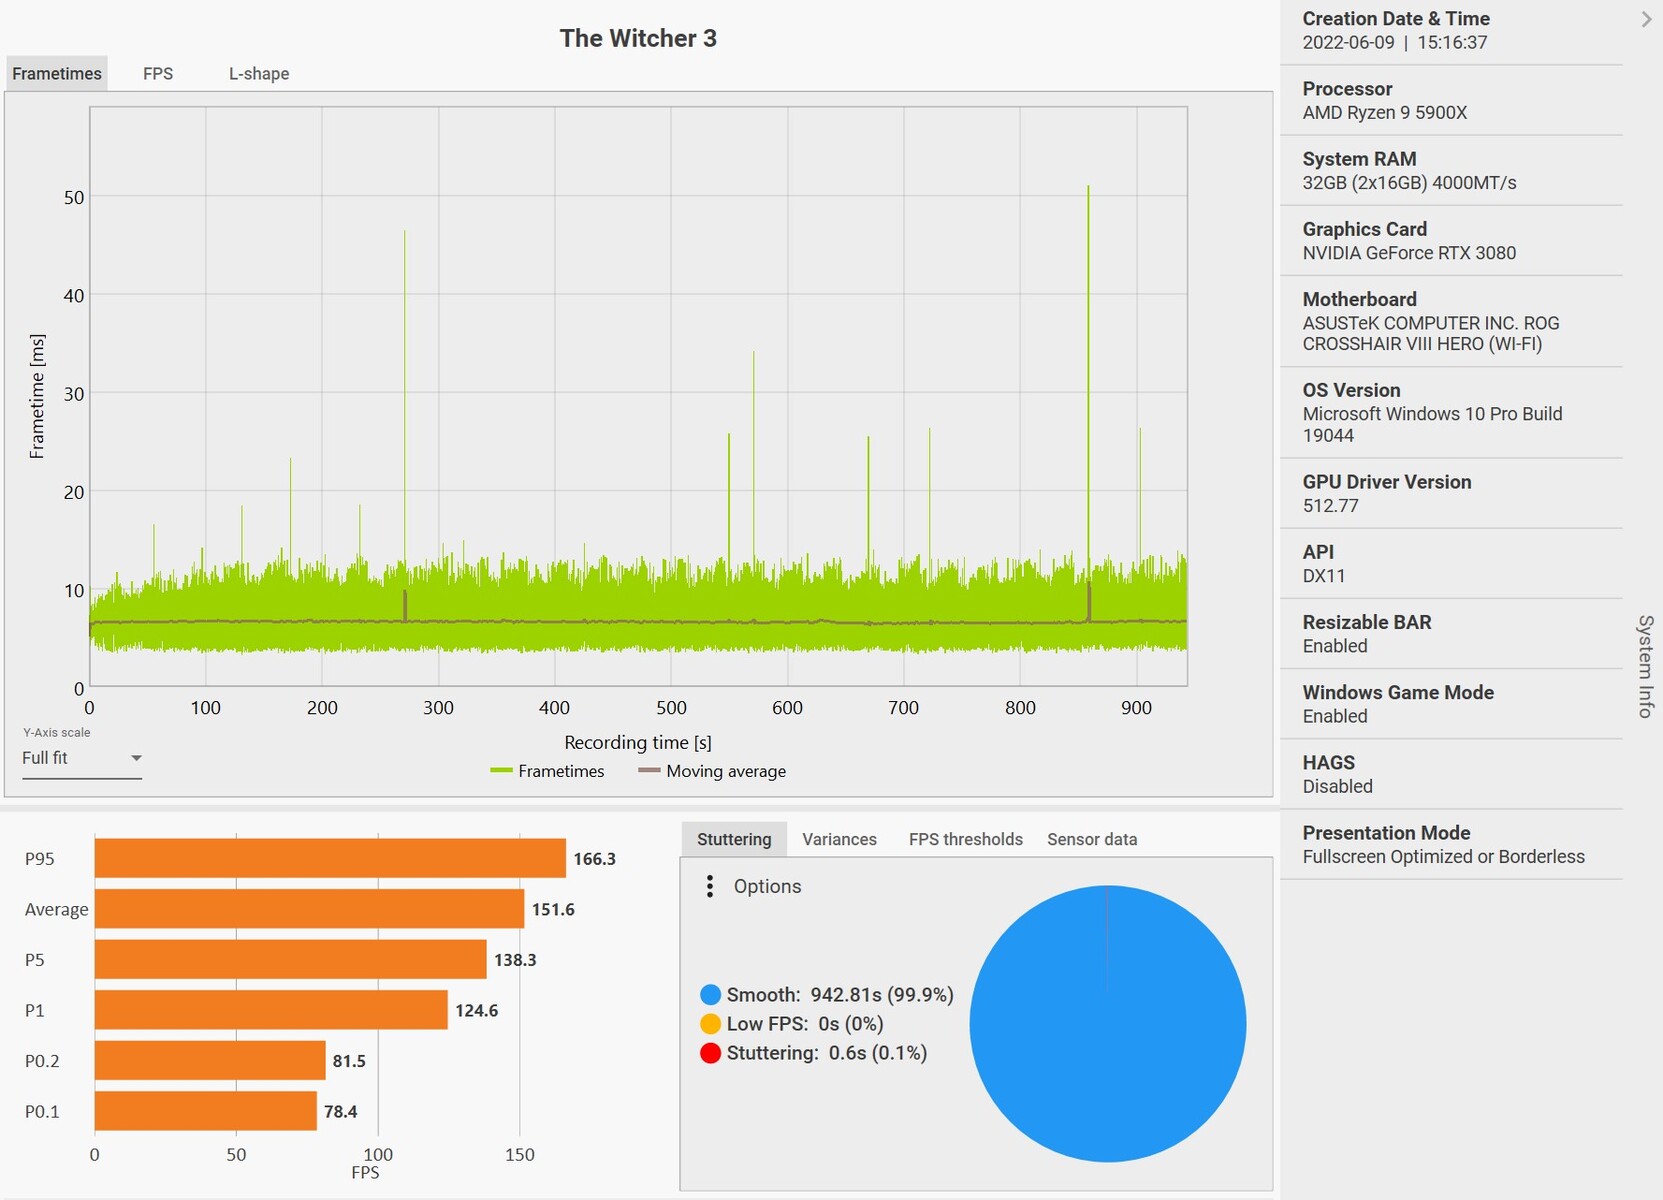
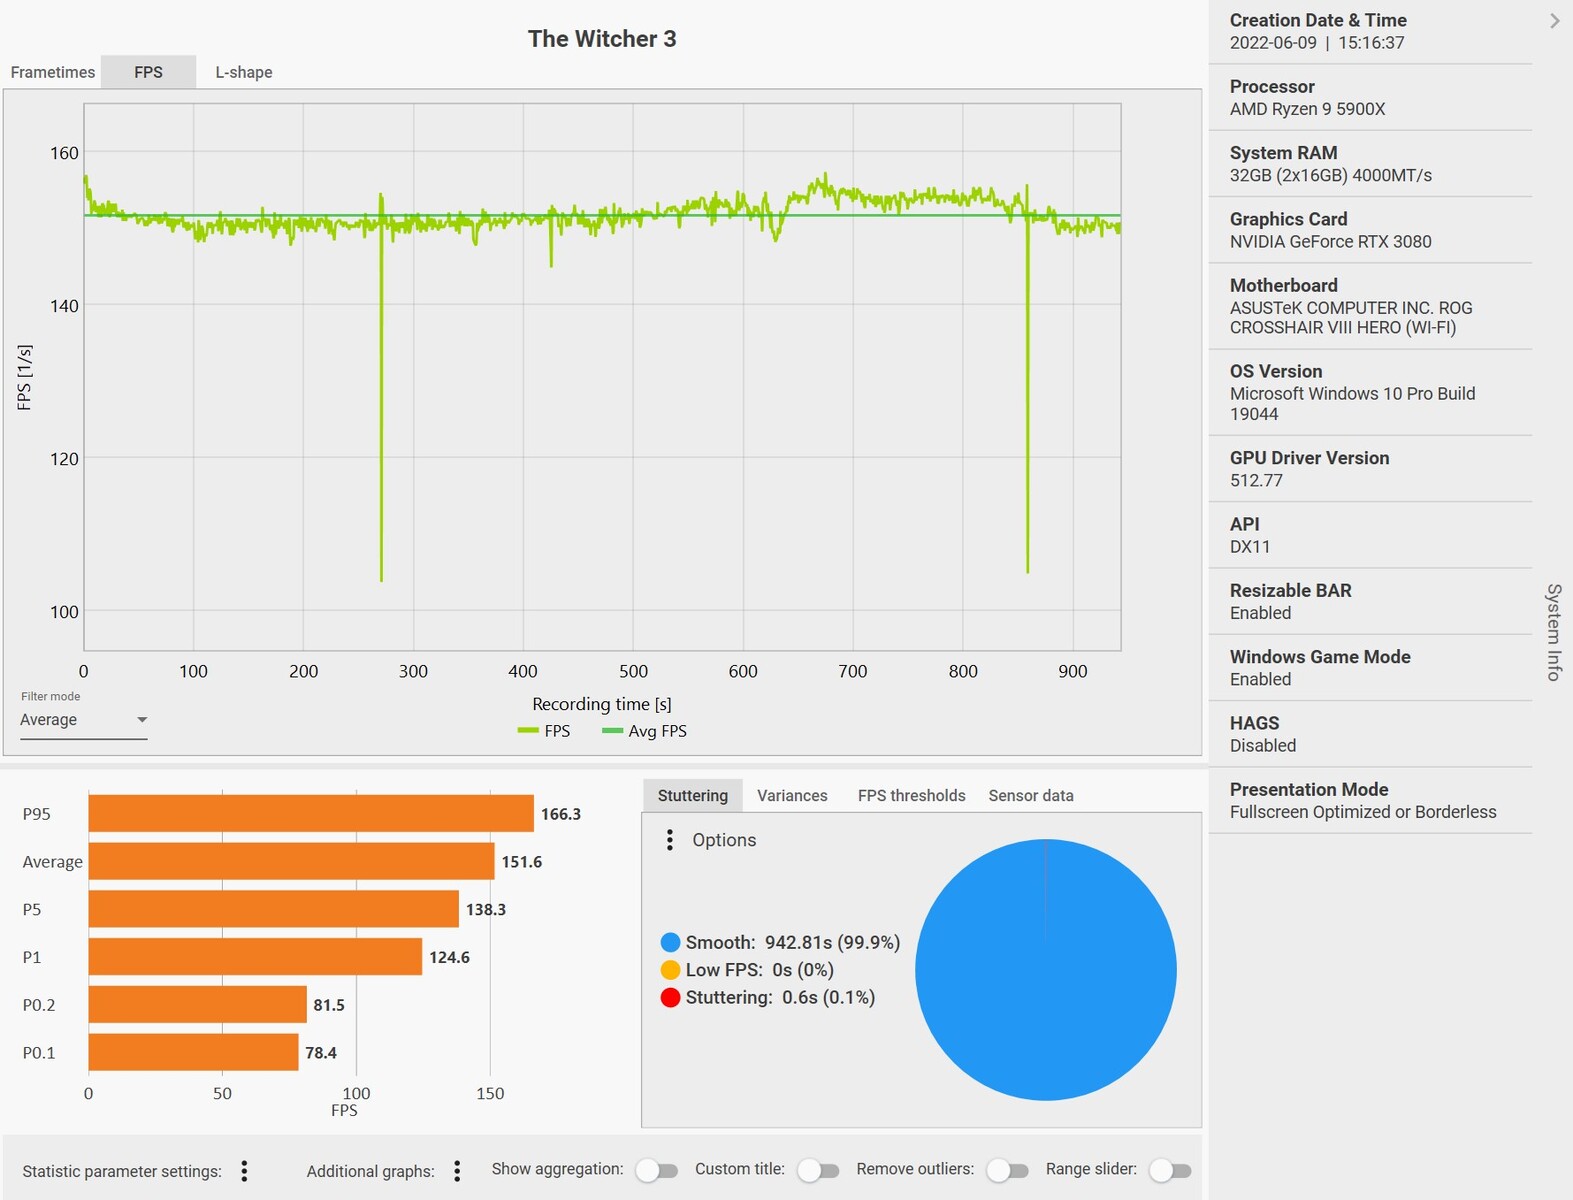
12 GB of VRAM are a good compromise and nowhere near as limiting as previous models. In fact, they are more than plenty, as our The Witcher 3 (1080p, Ultra) recorded frame rates showed. While we did encounter two minor frame drops they were not at all dramatic and, more importantly, not at all noticeable. In other words, they had no tangible effect on the gaming experience, and the benchmark concluded with an average of 151 FPS.

Performance Rating - Percent
MSI GeForce RTX 3090 Suprim X
98.8 pt
KFA2 GeForce RTX 3080 SG
93.9 pt
AMD Radeon RX 6900 XT -2!
92.1 pt
MSI GeForce RTX 3080 Gaming X Trio
86.8 pt
AMD Radeon RX 6800 XT
84.8 pt
AMD Radeon RX 6800
75.1 pt
MSI GeForce RTX 3070 Ventus 3X
66.4 pt
AMD Radeon RX 6700 XT
57 pt
Inno3D GeForce RTX 3060 Twin X2
49.7 pt
AMD Radeon RX 6600 XT
42.8 pt
GTA V - 3840x2160 High/On (Advanced Graphics Off) AA:FX AF:8x
KFA2 GeForce RTX 3080 SG
169.6 (14.8min, 125P1 - 411max) fps
MSI GeForce RTX 3090 Suprim X
164 (2.97min, 111P1 - 329max) fps -3%
MSI GeForce RTX 3080 Gaming X Trio
150 (12.6min, 100P1 - 343max) fps -12%
AMD Radeon RX 6800 XT
134 (15.5min, 55.6P1 - 252max) fps -21%
AMD Radeon RX 6800
119 (7.07min, 83.3P1 - 222max) fps -30%
MSI GeForce RTX 3070 Ventus 3X
117 (9.24min, 76.9P1 - 263max) fps -31%
AMD Radeon RX 6700 XT
96.5 (5.12min, 71.4P1 - 220max) fps -43%
Inno3D GeForce RTX 3060 Twin X2
82.8 (7.27min, 62.5P1 - 242max) fps -51%
AMD Radeon RX 6600 XT
63.8 (8.29min, 47.6P1 - 159max) fps -62%
The Witcher 3 - 3840x2160 High Graphics & Postprocessing (Nvidia HairWorks Off)
KFA2 GeForce RTX 3080 SG
131.8 (48.2min, 72.3P0.1, 107.3P1 - 454max) fps
MSI GeForce RTX 3090 Suprim X
128 (117min - 138max) fps -3%
AMD Radeon RX 6900 XT
122 (105min, 105P1 - 134max) fps -7%
MSI GeForce RTX 3080 Gaming X Trio
114 (106min - 122max) fps -14%
AMD Radeon RX 6800 XT
110 (97min - 117max) fps -17%
AMD Radeon RX 6800
96.8 (59.9min, 74.8P0.1, 84.2P1 - 212max) fps -27%
MSI GeForce RTX 3070 Ventus 3X
90.9 (84min - 101max) fps -31%
Inno3D GeForce RTX 3060 Twin X2
90.3 (38.2min, 59P0.1, 65.7P1 - 295max) fps -31%
AMD Radeon RX 6700 XT
63 fps -52%
AMD Radeon RX 6600 XT
53.9 (39.4min, 43.8P0.1, 47.9P1 - 97.2max) fps -59%
Far Cry 5 - 3840x2160 Ultra Preset AA:T
MSI GeForce RTX 3090 Suprim X
106 (84min - 123max) fps +4%
KFA2 GeForce RTX 3080 SG
102 (93min - 121max) fps
AMD Radeon RX 6800 XT
95 (72min - 124max) fps -7%
MSI GeForce RTX 3080 Gaming X Trio
93 (78min - 109max) fps -9%
AMD Radeon RX 6800
90 (77min - 109max) fps -12%
MSI GeForce RTX 3070 Ventus 3X
70 (63min - 84max) fps -31%
AMD Radeon RX 6700 XT
70 (59min - 91max) fps -31%
AMD Radeon RX 6600 XT
51 (44min - 65max) fps -50%
Inno3D GeForce RTX 3060 Twin X2
48 (43min - 59max) fps -53%
F1 2020 - 3840x2160 Ultra High Preset AA:T AF:16x
MSI GeForce RTX 3090 Suprim X
144 (123min - 166max) fps +16%
AMD Radeon RX 6900 XT
137 (109min - 165max) fps +10%
AMD Radeon RX 6900 XT
136 (110min - 161max) fps +9%
AMD Radeon RX 6800 XT
128 (106min - 152max) fps +3%
KFA2 GeForce RTX 3080 SG
124.6 (107min - 145max) fps
MSI GeForce RTX 3080 Gaming X Trio
114 (100min - 136max) fps -9%
AMD Radeon RX 6800
107 (86min - 128max) fps -14%
MSI GeForce RTX 3070 Ventus 3X
88.7 (76min - 101max) fps -29%
AMD Radeon RX 6700 XT
83 fps -33%
AMD Radeon RX 6600 XT
65.8 (53min - 80max) fps -47%
Inno3D GeForce RTX 3060 Twin X2
60 (51min - 71max) fps -52%
Shadow of the Tomb Raider - 3840x2160 Highest Preset AA:T
MSI GeForce RTX 3090 Suprim X
95.6 fps +16%
MSI GeForce RTX 3080 Gaming X Trio
87.9 fps +6%
AMD Radeon RX 6900 XT
86 fps +4%
AMD Radeon RX 6900 XT
84 fps +2%
KFA2 GeForce RTX 3080 SG
82.7 fps
AMD Radeon RX 6800 XT
79.6 fps -4%
AMD Radeon RX 6800
69.6 fps -16%
MSI GeForce RTX 3070 Ventus 3X
63.5 fps -23%
AMD Radeon RX 6700 XT
54 fps -35%
Inno3D GeForce RTX 3060 Twin X2
42.3 fps -49%
AMD Radeon RX 6600 XT
39.8 fps -52%
GTA V
1920x1080 Highest Settings possible AA:4xMSAA + FX AF:16x
KFA2 GeForce RTX 3080 SG
128.2 (11.2min, 83.3P1 - 222max) fps
AMD Radeon RX 6800 XT
121 (5.54min, 58.8P1 - 271max) fps -6%
AMD Radeon RX 6800
118 (6.63min, 58.8P1 - 205max) fps -8%
AMD Radeon RX 6700 XT
115 (7.08min, 55.6P1 - 210max) fps -10%
MSI GeForce RTX 3090 Suprim X
114 (6.72min, 71.4P1 - 223max) fps -11%
Inno3D GeForce RTX 3060 Twin X2
111 (4.48min, 76.9P1 - 235max) fps -13%
MSI GeForce RTX 3070 Ventus 3X
108 (4.47min, 71.4P1 - 218max) fps -16%
MSI GeForce RTX 3080 Gaming X Trio
104 (7.09min, 62.5P1 - 221max) fps -19%
AMD Radeon RX 6600 XT
94.1 (5.25min, 58.8P1 - 252max) fps -27%
1920x1080 High/On (Advanced Graphics Off) AA:2xMSAA + FX AF:8x
KFA2 GeForce RTX 3080 SG
182 (5.34min, 142.9P1 - 314max) fps
Inno3D GeForce RTX 3060 Twin X2
180 (2.37min, 125P1 - 393max) fps -1%
AMD Radeon RX 6800 XT
179 (3.18min, 66.7P1 - 513max) fps -2%
AMD Radeon RX 6700 XT
179 (3.35min, 83.3P1 - 423max) fps -2%
AMD Radeon RX 6800
177 (4.82min, 83.3P1 - 426max) fps -3%
AMD Radeon RX 6600 XT
176 (3.61min, 83.3P1 - 450max) fps -3%
MSI GeForce RTX 3090 Suprim X
175 (3min, 125P1 - 386max) fps -4%
MSI GeForce RTX 3070 Ventus 3X
170 (3.14min, 100P1 - 356max) fps -7%
MSI GeForce RTX 3080 Gaming X Trio
169 (3.6min, 90.9P1 - 375max) fps -7%
3840x2160 High/On (Advanced Graphics Off) AA:FX AF:8x
KFA2 GeForce RTX 3080 SG
169.6 (14.8min, 125P1 - 411max) fps
MSI GeForce RTX 3090 Suprim X
164 (2.97min, 111P1 - 329max) fps -3%
MSI GeForce RTX 3080 Gaming X Trio
150 (12.6min, 100P1 - 343max) fps -12%
AMD Radeon RX 6800 XT
134 (15.5min, 55.6P1 - 252max) fps -21%
AMD Radeon RX 6800
119 (7.07min, 83.3P1 - 222max) fps -30%
MSI GeForce RTX 3070 Ventus 3X
117 (9.24min, 76.9P1 - 263max) fps -31%
AMD Radeon RX 6700 XT
96.5 (5.12min, 71.4P1 - 220max) fps -43%
Inno3D GeForce RTX 3060 Twin X2
82.8 (7.27min, 62.5P1 - 242max) fps -51%
AMD Radeon RX 6600 XT
63.8 (8.29min, 47.6P1 - 159max) fps -62%
The Witcher 3
1920x1080 Ultra Graphics & Postprocessing (HBAO+)
KFA2 GeForce RTX 3080 SG
165.1 (57.2min, 90.2P0.1, 124.4P1 - 369max) fps
AMD Radeon RX 6900 XT
163.6 (139min - 179max) fps -1%
MSI GeForce RTX 3090 Suprim X
160 (140min - 184max) fps -3%
AMD Radeon RX 6800 XT
160 (138min - 179max) fps -3%
AMD Radeon RX 6800
156 (15.9min, 87.6P0.1, 128P1 - 313max) fps -6%
MSI GeForce RTX 3080 Gaming X Trio
145 (123min - 154max) fps -12%
MSI GeForce RTX 3070 Ventus 3X
121 (112min - 134max) fps -27%
AMD Radeon RX 6700 XT
117 fps -29%
AMD Radeon RX 6600 XT
98.9 (59.2min, 69.1P0.1, 83.7P1 - 263max) fps -40%
Inno3D GeForce RTX 3060 Twin X2
63.3 (22.3min, 40.7P0.1, 51.3P1 - 358max) fps -62%
1920x1080 High Graphics & Postprocessing (Nvidia HairWorks Off)
AMD Radeon RX 6900 XT
323 (269min, 280.2P1 - 350max) fps +1%
KFA2 GeForce RTX 3080 SG
321 (39.5min, 134.4P0.1, 209P1 - 678max) fps
MSI GeForce RTX 3080 Gaming X Trio
320 (290min - 353max) fps 0%
AMD Radeon RX 6800 XT
294 (254min - 323max) fps -8%
MSI GeForce RTX 3090 Suprim X
292 (258min - 325max) fps -9%
AMD Radeon RX 6800
277 (64.9min, 157P0.1, 220P1 - 431max) fps -14%
Inno3D GeForce RTX 3060 Twin X2
179 (36.1min, 119P0.1, 148P1 - 590max) fps -44%
MSI GeForce RTX 3070 Ventus 3X
176 (161min - 189max) fps -45%
AMD Radeon RX 6600 XT
176 (21.5min, 122P0.1, 146P1 - 403max) fps -45%
AMD Radeon RX 6700 XT
174 fps -46%
3840x2160 High Graphics & Postprocessing (Nvidia HairWorks Off)
KFA2 GeForce RTX 3080 SG
131.8 (48.2min, 72.3P0.1, 107.3P1 - 454max) fps
MSI GeForce RTX 3090 Suprim X
128 (117min - 138max) fps -3%
AMD Radeon RX 6900 XT
122 (105min, 105P1 - 134max) fps -7%
MSI GeForce RTX 3080 Gaming X Trio
114 (106min - 122max) fps -14%
AMD Radeon RX 6800 XT
110 (97min - 117max) fps -17%
AMD Radeon RX 6800
96.8 (59.9min, 74.8P0.1, 84.2P1 - 212max) fps -27%
MSI GeForce RTX 3070 Ventus 3X
90.9 (84min - 101max) fps -31%
Inno3D GeForce RTX 3060 Twin X2
90.3 (38.2min, 59P0.1, 65.7P1 - 295max) fps -31%
AMD Radeon RX 6700 XT
63 fps -52%
AMD Radeon RX 6600 XT
53.9 (39.4min, 43.8P0.1, 47.9P1 - 97.2max) fps -59%
Far Cry 6
1920x1080 Ultra Graphics Quality + HD Textures AA:T
AMD Radeon RX 6800
116 (82min - 157max) fps +16%
AMD Radeon RX 6700 XT
102 (73min - 131max) fps +2%
KFA2 GeForce RTX 3080 SG
100.2 (81min - 133max) fps
AMD Radeon RX 6600 XT
99 fps -1%
Inno3D GeForce RTX 3060 Twin X2
88 (76min - 105max) fps -12%
1920x1080 High Graphics Quality AA:T
AMD Radeon RX 6800
126 (90min - 168max) fps +20%
AMD Radeon RX 6700 XT
112 (84min - 146max) fps +7%
AMD Radeon RX 6600 XT
108 fps +3%
KFA2 GeForce RTX 3080 SG
104.7 (88min - 140max) fps
Inno3D GeForce RTX 3060 Twin X2
101 (81min - 119max) fps -4%
3840x2160 Ultra Graphics Quality + HD Textures AA:T
AMD Radeon RX 6800
68.1 (59min - 75max) fps +19%
KFA2 GeForce RTX 3080 SG
57.2 (28min - 69max) fps
AMD Radeon RX 6700 XT
50 (38min - 56max) fps -13%
Inno3D GeForce RTX 3060 Twin X2
38 (25min - 42max) fps -34%
AMD Radeon RX 6600 XT
21 fps -63%
Far Cry 5
1920x1080 Ultra Preset AA:T
KFA2 GeForce RTX 3080 SG
151 (111min - 207max) fps
MSI GeForce RTX 3070 Ventus 3X
143 (108min - 192max) fps -5%
MSI GeForce RTX 3090 Suprim X
141 (106min - 194max) fps -7%
AMD Radeon RX 6700 XT
139 (104min - 189max) fps -8%
MSI GeForce RTX 3080 Gaming X Trio
135 (97min - 188max) fps -11%
AMD Radeon RX 6600 XT
133 (104min - 170max) fps -12%
Inno3D GeForce RTX 3060 Twin X2
132 (109min - 150max) fps -13%
AMD Radeon RX 6800 XT
130 (97min - 185max) fps -14%
AMD Radeon RX 6800
126 (96min - 170max) fps -17%
1920x1080 High Preset AA:T
KFA2 GeForce RTX 3080 SG
162 (126min - 224max) fps
MSI GeForce RTX 3070 Ventus 3X
154 (124min - 205max) fps -5%
MSI GeForce RTX 3090 Suprim X
153 (100min - 215max) fps -6%
AMD Radeon RX 6700 XT
149 (115min - 204max) fps -8%
MSI GeForce RTX 3080 Gaming X Trio
144 (112min - 205max) fps -11%
AMD Radeon RX 6600 XT
141 (114min - 178max) fps -13%
Inno3D GeForce RTX 3060 Twin X2
140 (119min - 161max) fps -14%
AMD Radeon RX 6800 XT
139 (109min - 197max) fps -14%
AMD Radeon RX 6800
134 (102min - 182max) fps -17%
3840x2160 Ultra Preset AA:T
MSI GeForce RTX 3090 Suprim X
106 (84min - 123max) fps +4%
KFA2 GeForce RTX 3080 SG
102 (93min - 121max) fps
AMD Radeon RX 6800 XT
95 (72min - 124max) fps -7%
MSI GeForce RTX 3080 Gaming X Trio
93 (78min - 109max) fps -9%
AMD Radeon RX 6800
90 (77min - 109max) fps -12%
MSI GeForce RTX 3070 Ventus 3X
70 (63min - 84max) fps -31%
AMD Radeon RX 6700 XT
70 (59min - 91max) fps -31%
AMD Radeon RX 6600 XT
51 (44min - 65max) fps -50%
Inno3D GeForce RTX 3060 Twin X2
48 (43min - 59max) fps -53%
Far Cry New Dawn
1920x1080 Ultra Preset
AMD Radeon RX 6900 XT
118 (81min - 192max) fps 0%
KFA2 GeForce RTX 3080 SG
118 (80min - 202max) fps
MSI GeForce RTX 3070 Ventus 3X
116 (77min - 187max) fps -2%
AMD Radeon RX 6700 XT
115 (78min - 195max) fps -3%
AMD Radeon RX 6800 XT
113 (78min - 186max) fps -4%
AMD Radeon RX 6600 XT
112 (77min - 181max) fps -5%
Inno3D GeForce RTX 3060 Twin X2
112 (83min - 146max) fps -5%
MSI GeForce RTX 3080 Gaming X Trio
108 (71min - 183max) fps -8%
AMD Radeon RX 6800
107 (71min - 179max) fps -9%
MSI GeForce RTX 3090 Suprim X
106 (69min - 171max) fps -10%
1920x1080 High Preset
KFA2 GeForce RTX 3080 SG
131 (98min - 200max) fps
MSI GeForce RTX 3070 Ventus 3X
130 (99min - 188max) fps -1%
AMD Radeon RX 6600 XT
127 (97min - 190max) fps -3%
AMD Radeon RX 6700 XT
126 (95min - 192max) fps -4%
Inno3D GeForce RTX 3060 Twin X2
126 (104min - 154max) fps -4%
AMD Radeon RX 6800 XT
124 (96min - 185max) fps -5%
AMD Radeon RX 6900 XT
123 (94min - 184max) fps -6%
MSI GeForce RTX 3080 Gaming X Trio
120 (90min - 181max) fps -8%
AMD Radeon RX 6800
118 (89min - 183max) fps -10%
MSI GeForce RTX 3090 Suprim X
117 (89min - 179max) fps -11%
3840x2160 Ultra Preset
AMD Radeon RX 6900 XT
101 (79min - 135max) fps +3%
KFA2 GeForce RTX 3080 SG
98 (79min - 122max) fps
MSI GeForce RTX 3090 Suprim X
96 (71min - 125max) fps -2%
AMD Radeon RX 6800 XT
94 (75min - 129max) fps -4%
MSI GeForce RTX 3080 Gaming X Trio
88 (71min - 110max) fps -10%
AMD Radeon RX 6800
86 (70min - 115max) fps -12%
MSI GeForce RTX 3070 Ventus 3X
72 (61min - 86max) fps -27%
AMD Radeon RX 6700 XT
70 (57min - 91max) fps -29%
AMD Radeon RX 6600 XT
53 (44min - 69max) fps -46%
Inno3D GeForce RTX 3060 Twin X2
50 (42min - 60max) fps -49%
Anno 1800
1920x1080 Ultra Graphics Quality (DX11)
AMD Radeon RX 6900 XT
87.1 (57.2min, 57.6P0.1, 68.1P1 - 115max) fps +69%
MSI GeForce RTX 3090 Suprim X
54.8 (41min - 85max) fps +6%
MSI GeForce RTX 3080 Gaming X Trio
54 (38min - 82max) fps +5%
MSI GeForce RTX 3070 Ventus 3X
52 (42min - 66max) fps +1%
KFA2 GeForce RTX 3080 SG
51.6 (21.1min, 23.8P0.1, 39.5P1 - 71.3max) fps
AMD Radeon RX 6800 XT
51.2 (45min - 66max) fps -1%
Inno3D GeForce RTX 3060 Twin X2
50.7 (20min, 22.7P0.1, 33.6P1 - 69.6max) fps -2%
AMD Radeon RX 6800
48.5 (18.2min, 22.5P0.1, 33.9P1 - 73max) fps -6%
AMD Radeon RX 6700 XT
45 fps -13%
AMD Radeon RX 6600 XT
41.4 (16.8min, 17.6P0.1, 35.9P1 - 49.1max) fps -20%
1920x1080 High Graphics Quality (DX11)
AMD Radeon RX 6900 XT
139 (73.6min, 89.7P0.1, 97.8P1 - 191max) fps +48%
MSI GeForce RTX 3090 Suprim X
105 (91min - 121max) fps +12%
Inno3D GeForce RTX 3060 Twin X2
105 (51.7min, 62.1P0.1, 83.6P1 - 136max) fps +12%
MSI GeForce RTX 3070 Ventus 3X
100 (85min - 121max) fps +6%
AMD Radeon RX 6800 XT
94.9 (84min - 110max) fps +1%
KFA2 GeForce RTX 3080 SG
94 (49.8min, 66.4P0.1, 76.6P1 - 121.3max) fps
MSI GeForce RTX 3080 Gaming X Trio
93.9 (85min - 115max) fps 0%
AMD Radeon RX 6800
90.2 (39.5min, 62.7P0.1, 70.5P1 - 137max) fps -4%
AMD Radeon RX 6600 XT
89.3 (52.8min, 59.9P0.1, 72P1 - 119max) fps -5%
AMD Radeon RX 6700 XT
87 fps -7%
3840x2160 Ultra Graphics Quality (DX11)
MSI GeForce RTX 3090 Suprim X
52.5 (42min - 63max) fps +10%
AMD Radeon RX 6900 XT
52 (27.3min, 27.5P0.1, 33.6P1 - 75.8max) fps +9%
KFA2 GeForce RTX 3080 SG
47.8 (21min, 24P0.1, 33.3P1 - 65.9max) fps
AMD Radeon RX 6800 XT
45.5 (42min - 49max) fps -5%
MSI GeForce RTX 3080 Gaming X Trio
43.2 (32min - 52max) fps -10%
AMD Radeon RX 6800
41.7 (31.6min, 32.7P0.1, 34P1 - 56.4max) fps -13%
MSI GeForce RTX 3070 Ventus 3X
35 (23min - 40max) fps -27%
AMD Radeon RX 6700 XT
29 fps -39%
Inno3D GeForce RTX 3060 Twin X2
22.8 (5.84min, 7.82P0.1, 14.2P1 - 66.4max) fps -52%
AMD Radeon RX 6600 XT
21.5 (18min, 18.4P0.1, 18.9P1 - 27.6max) fps -55%
Crysis Remastered
1920x1080 Very High Preset AA:SM
KFA2 GeForce RTX 3080 SG
162.3 (66.5min, 114P0.1, 137.7P1 - 220max) fps
MSI GeForce RTX 3090 Suprim X
102 (50.2min, 53.2P0.1, 66.9P1 - 213max) fps -37%
AMD Radeon RX 6800 XT
94.7 (36.3min, 43P0.1, 59.2P1 - 225max) fps -42%
AMD Radeon RX 6700 XT
88 fps -46%
AMD Radeon RX 6800
80.5 (36.5min, 53.3P0.1, 65.8P1 - 123max) fps -50%
MSI GeForce RTX 3070 Ventus 3X
75.8 (46.1min, 48.5P0.1, 54.2P1 - 148max) fps -53%
MSI GeForce RTX 3080 Gaming X Trio
62.1 (41.5min, 41.8P0.1, 44.5P1 - 113max) fps -62%
Inno3D GeForce RTX 3060 Twin X2
57.5 (32.2min, 42.4P0.1, 48.1P1 - 113max) fps -65%
AMD Radeon RX 6600 XT
50.7 (21.3min, 34.1P0.1, 42.8P1 - 121max) fps -69%
1920x1080 High Preset AA:SM
KFA2 GeForce RTX 3080 SG
176.6 (114.6min, 123.7P0.1, 141.1P1 - 260max) fps
AMD Radeon RX 6800 XT
152 (50.5min, 58.8P0.1, 85.4P1 - 282max) fps -14%
MSI GeForce RTX 3090 Suprim X
130 (41.5min, 60.8P0.1, 73.6P1 - 262max) fps -26%
AMD Radeon RX 6700 XT
112 fps -37%
AMD Radeon RX 6800
105 (33.4min, 39P0.1, 72.2P1 - 174max) fps -41%
MSI GeForce RTX 3080 Gaming X Trio
98.9 (41.2min, 48.7P0.1, 59P1 - 216max) fps -44%
MSI GeForce RTX 3070 Ventus 3X
97.7 (36.3min, 39.8P0.1, 53.2P1 - 192max) fps -45%
Inno3D GeForce RTX 3060 Twin X2
77.9 (42.6min, 50P0.1, 63.4P1 - 180max) fps -56%
AMD Radeon RX 6600 XT
67.5 (29.7min, 37.1P0.1, 53.5P1 - 163max) fps -62%
3840x2160 Very High Preset AA:SM
KFA2 GeForce RTX 3080 SG
72.7 (36.4min, 56.1P0.1, 61.1P1 - 100.7max) fps
MSI GeForce RTX 3090 Suprim X
64.9 (44.8min, 49.4P0.1, 54.6P1 - 96.2max) fps -11%
AMD Radeon RX 6800 XT
54.4 (34.7min, 38.5P0.1, 45.5P1 - 74.7max) fps -25%
MSI GeForce RTX 3080 Gaming X Trio
49.2 (36min, 36.9P0.1, 39P1 - 61.3max) fps -32%
MSI GeForce RTX 3070 Ventus 3X
38.9 (21.9min, 28P0.1, 31.1P1 - 58.6max) fps -46%
AMD Radeon RX 6700 XT
38 fps -48%
AMD Radeon RX 6800
30 (25.5min, 25.5P0.1, 27P1 - 35.4max) fps -59%
Inno3D GeForce RTX 3060 Twin X2
22.7 (17.4min, 18.1P0.1, 19.9P1 - 26.7max) fps -69%
AMD Radeon RX 6600 XT
15.6 (12min, 12P0.1, 13.6P1 - 19.6max) fps -79%
F1 2021
1920x1080 Ultra High Preset + Raytracing AA:T AF:16x
KFA2 GeForce RTX 3080 SG
201 (169min, 155P1 - 216max) fps
AMD Radeon RX 6800
167 (131min, 125P1 - 188max) fps -17%
AMD Radeon RX 6700 XT
143 (119min, 120P1 - 162max) fps -29%
Inno3D GeForce RTX 3060 Twin X2
104 (88min, 88P1 - 117max) fps -48%
AMD Radeon RX 6600 XT
97 fps -52%
1920x1080 High Preset AA:T AF:16x
KFA2 GeForce RTX 3080 SG
379 (268min, 208P1 - 440max) fps
AMD Radeon RX 6800
357 (224min, 211P1 - 411max) fps -6%
AMD Radeon RX 6700 XT
323 (242min, 195P1 - 362max) fps -15%
AMD Radeon RX 6600 XT
229 fps -40%
Inno3D GeForce RTX 3060 Twin X2
212 (183min, 170P1 - 231max) fps -44%
3840x2160 Ultra High Preset + Raytracing AA:T AF:16x
KFA2 GeForce RTX 3080 SG
93.5 (82min, 82P1 - 105max) fps
AMD Radeon RX 6800
71.8 (61min, 61P1 - 82max) fps -23%
AMD Radeon RX 6700 XT
56.3 (48min, 48P1 - 65max) fps -40%
Inno3D GeForce RTX 3060 Twin X2
44 (38min, 38P1 - 50max) fps -53%
AMD Radeon RX 6600 XT
31 fps -67%
F1 2020
1920x1080 Ultra High Preset AA:T AF:16x
AMD Radeon RX 6900 XT
291 (222min - 355max) fps +11%
AMD Radeon RX 6900 XT
275 (213min - 338max) fps +5%
AMD Radeon RX 6800 XT
279 (211min - 345max) fps +6%
MSI GeForce RTX 3090 Suprim X
266 (218min - 321max) fps +1%
KFA2 GeForce RTX 3080 SG
263 (215min - 315max) fps
AMD Radeon RX 6800
222 (161min - 282max) fps -16%
AMD Radeon RX 6700 XT
190 fps -28%
MSI GeForce RTX 3070 Ventus 3X
181 (145min - 211max) fps -31%
MSI GeForce RTX 3080 Gaming X Trio
179 (153min - 213max) fps -32%
AMD Radeon RX 6600 XT
157 (115min - 193max) fps -40%
Inno3D GeForce RTX 3060 Twin X2
142 (114min - 171max) fps -46%
1920x1080 High Preset AA:T AF:16x
AMD Radeon RX 6900 XT
395 (324min - 460max) fps +17%
AMD Radeon RX 6800 XT
387 (285min - 448max) fps +14%
KFA2 GeForce RTX 3080 SG
339 (264min - 384max) fps
MSI GeForce RTX 3090 Suprim X
322 (262min - 365max) fps -5%
AMD Radeon RX 6800
314 (230min - 358max) fps -7%
AMD Radeon RX 6700 XT
276 fps -19%
MSI GeForce RTX 3070 Ventus 3X
252 (188min - 279max) fps -26%
MSI GeForce RTX 3080 Gaming X Trio
249 (198min - 283max) fps -27%
AMD Radeon RX 6600 XT
233 (188min - 269max) fps -31%
Inno3D GeForce RTX 3060 Twin X2
208 (181min - 235max) fps -39%
3840x2160 Ultra High Preset AA:T AF:16x
MSI GeForce RTX 3090 Suprim X
144 (123min - 166max) fps +16%
AMD Radeon RX 6900 XT
137 (109min - 165max) fps +10%
AMD Radeon RX 6900 XT
136 (110min - 161max) fps +9%
AMD Radeon RX 6800 XT
128 (106min - 152max) fps +3%
KFA2 GeForce RTX 3080 SG
124.6 (107min - 145max) fps
MSI GeForce RTX 3080 Gaming X Trio
114 (100min - 136max) fps -9%
AMD Radeon RX 6800
107 (86min - 128max) fps -14%
MSI GeForce RTX 3070 Ventus 3X
88.7 (76min - 101max) fps -29%
AMD Radeon RX 6700 XT
83 fps -33%
AMD Radeon RX 6600 XT
65.8 (53min - 80max) fps -47%
Inno3D GeForce RTX 3060 Twin X2
60 (51min - 71max) fps -52%
Mafia Definitive Edition
1920x1080 High Preset
KFA2 GeForce RTX 3080 SG
162.7 (71.7min, 80.5P0.1, 103.9P1 - 314max) fps
MSI GeForce RTX 3090 Suprim X
157 (64.1min, 76.8P0.1, 100P1 - 260max) fps -4%
MSI GeForce RTX 3080 Gaming X Trio
144 (59.7min, 73.4P0.1, 93.2P1 - 295max) fps -11%
AMD Radeon RX 6900 XT
138 (32.8min, 68.1P0.1, 90.2P1 - 334max) fps -15%
MSI GeForce RTX 3070 Ventus 3X
132 (57.5min, 71.1P0.1, 88.3P1 - 259max) fps -19%
AMD Radeon RX 6800
132 (34.8min, 55.7P0.1, 77.6P1 - 291max) fps -19%
AMD Radeon RX 6800 XT
121 (23.7min, 68P0.1, 83.3P1 - 223max) fps -26%
AMD Radeon RX 6700 XT
112 fps -31%
AMD Radeon RX 6600 XT
106 (33.7min, 59.1P0.1, 73P1 - 230max) fps -35%
Inno3D GeForce RTX 3060 Twin X2
103 (45.2min, 51.7P0.1, 68.7P1 - 247max) fps -37%
1920x1080 Medium Preset
KFA2 GeForce RTX 3080 SG
179.1 (65.1min, 90.3P0.1, 114.3P1 - 328max) fps
MSI GeForce RTX 3090 Suprim X
161 (55.2min, 75.7P0.1, 104P1 - 307max) fps -10%
MSI GeForce RTX 3080 Gaming X Trio
159 (60.2min, 70.6P0.1, 103P1 - 328max) fps -11%
AMD Radeon RX 6900 XT
142 (24.3min, 70.6P0.1, 93.2P1 - 330max) fps -21%
AMD Radeon RX 6800
142 (36min, 69.9P0.1, 88P1 - 309max) fps -21%
MSI GeForce RTX 3070 Ventus 3X
140 (54.9min, 70P0.1, 93.4P1 - 241max) fps -22%
AMD Radeon RX 6800 XT
139 (24.5min, 66.6P0.1, 90.7P1 - 298max) fps -22%
AMD Radeon RX 6700 XT
124 fps -31%
AMD Radeon RX 6600 XT
118 (27.9min, 68.1P0.1, 85.6P1 - 216max) fps -34%
Inno3D GeForce RTX 3060 Twin X2
113 (48.1min, 53.1P0.1, 82.7P1 - 218max) fps -37%
3840x2160 High Preset
MSI GeForce RTX 3090 Suprim X
89.1 (42.7min, 53.9P0.1, 62.7P1 - 175max) fps +13%
KFA2 GeForce RTX 3080 SG
79.2 (38.9min, 42.3P0.1, 62P1 - 175.6max) fps
MSI GeForce RTX 3080 Gaming X Trio
78.1 (44.8min, 50.5P0.1, 54.7P1 - 175max) fps -1%
AMD Radeon RX 6900 XT
67 (32.3min, 41.7P0.1, 44.7P1 - 211max) fps -15%
AMD Radeon RX 6800 XT
62.6 (28min, 37.6P0.1, 49.2P1 - 87.3max) fps -21%
AMD Radeon RX 6800
57.3 (31.4min, 33.3P0.1, 34.5P1 - 208max) fps -28%
MSI GeForce RTX 3070 Ventus 3X
55.2 (19.3min, 34.2P0.1, 45.2P1 - 133max) fps -30%
AMD Radeon RX 6700 XT
43 fps -46%
Inno3D GeForce RTX 3060 Twin X2
37 (26.9min, 28.4P0.1, 32P1 - 54.9max) fps -53%
AMD Radeon RX 6600 XT
34 (18.6min, 18.6P0.1, 19.4P1 - 169max) fps -57%
Watch Dogs Legion
1920x1080 Ultra Preset (DX12)
AMD Radeon RX 6900 XT
121 (67.26min, 95.56P1 - 184.97max) fps +27%
AMD Radeon RX 6900 XT
120 (81.32min, 93.02P1 - 209.32max) fps +26%
AMD Radeon RX 6800 XT
112 (75.12min, 87.97P1 - 181.69max) fps +18%
MSI GeForce RTX 3090 Suprim X
103 (30.26min, 75.96P1 - 155.81max) fps +8%
MSI GeForce RTX 3080 Gaming X Trio
99.3 (13.98min, 73.29P1 - 167.32max) fps +4%
KFA2 GeForce RTX 3080 SG
95.2 (35.72min, 69.11P1 - 145.12max) fps
AMD Radeon RX 6800
87.7 (36.62min, 64.1P1 - 145.7max) fps -8%
MSI GeForce RTX 3070 Ventus 3X
86 (37.65min, 66.32P1 - 130.48max) fps -10%
AMD Radeon RX 6700 XT
84.1 (60.29min, 67.02P1 - 118.49max) fps -12%
AMD Radeon RX 6600 XT
61 fps -36%
Inno3D GeForce RTX 3060 Twin X2
59.1 (17.01min, 48.27P1 - 100.5max) fps -38%
1920x1080 High Preset (DX12)
AMD Radeon RX 6900 XT
170 (101.03min, 125.43P1 - 261.76max) fps +58%
AMD Radeon RX 6800 XT
150 (79.26min, 110.06P1 - 227.35max) fps +39%
AMD Radeon RX 6700 XT
134 (76.1min, 102.89P1 - 200.63max) fps +24%
MSI GeForce RTX 3080 Gaming X Trio
113 (41.54min, 82.63P1 - 184.04max) fps +5%
MSI GeForce RTX 3070 Ventus 3X
112 (18.04min, 78.99P1 - 177.29max) fps +4%
MSI GeForce RTX 3090 Suprim X
111 (44.66min, 83.58P1 - 163.27max) fps +3%
KFA2 GeForce RTX 3080 SG
107.8 (32.37min, 79.28P1 - 161.72max) fps
AMD Radeon RX 6600 XT
104 fps -4%
AMD Radeon RX 6800
104 (55.63min, 73.69P1 - 162.54max) fps -4%
Inno3D GeForce RTX 3060 Twin X2
94.7 (56.34min, 74.21P1 - 138.68max) fps -12%
3840x2160 Ultra Preset (DX12)
MSI GeForce RTX 3090 Suprim X
60.3 (34.68min, 51.05P1 - 78.14max) fps +9%
KFA2 GeForce RTX 3080 SG
55.2 (34.2min, 46.23P1 - 81.17max) fps
AMD Radeon RX 6900 XT
53.6 (34.78min, 44.93P1 - 72.47max) fps -3%
AMD Radeon RX 6900 XT
53.5 (33.75min, 44.2P1 - 82.3max) fps -3%
MSI GeForce RTX 3080 Gaming X Trio
53.5 (33.98min, 42.85P1 - 79.6max) fps -3%
AMD Radeon RX 6800 XT
49.3 (32.85min, 41.54P1 - 76.12max) fps -11%
AMD Radeon RX 6800
44.5 (28.53min, 36.73P1 - 64.84max) fps -19%
MSI GeForce RTX 3070 Ventus 3X
39.2 (17.54min, 27.54P1 - 81.17max) fps -29%
AMD Radeon RX 6700 XT
35.3 (21.39min, 30.37P1 - 43.92max) fps -36%
Inno3D GeForce RTX 3060 Twin X2
26.8 (16.98min, 22.9P1 - 32.91max) fps -51%
AMD Radeon RX 6600 XT
24 fps -57%
Shadow of the Tomb Raider
1920x1080 Highest Preset AA:T
AMD Radeon RX 6900 XT
202 fps +3%
AMD Radeon RX 6900 XT
199 fps +1%
KFA2 GeForce RTX 3080 SG
196.1 fps
AMD Radeon RX 6800 XT
194 fps -1%
MSI GeForce RTX 3090 Suprim X
188 fps -4%
AMD Radeon RX 6800
182 fps -7%
MSI GeForce RTX 3080 Gaming X Trio
177 fps -10%
MSI GeForce RTX 3070 Ventus 3X
160 fps -18%
AMD Radeon RX 6700 XT
150 fps -24%
AMD Radeon RX 6600 XT
131 fps -33%
Inno3D GeForce RTX 3060 Twin X2
118 fps -40%
1920x1080 High Preset AA:SM
AMD Radeon RX 6900 XT
213 fps +3%
KFA2 GeForce RTX 3080 SG
207 fps
AMD Radeon RX 6800 XT
204 fps -1%
AMD Radeon RX 6800
196 fps -5%
MSI GeForce RTX 3080 Gaming X Trio
186 fps -10%
MSI GeForce RTX 3090 Suprim X
177 fps -14%
AMD Radeon RX 6700 XT
170 fps -18%
MSI GeForce RTX 3070 Ventus 3X
168 fps -19%
AMD Radeon RX 6600 XT
153 fps -26%
Inno3D GeForce RTX 3060 Twin X2
129 fps -38%
3840x2160 Highest Preset AA:T
MSI GeForce RTX 3090 Suprim X
95.6 fps +16%
MSI GeForce RTX 3080 Gaming X Trio
87.9 fps +6%
AMD Radeon RX 6900 XT
86 fps +4%
AMD Radeon RX 6900 XT
84 fps +2%
KFA2 GeForce RTX 3080 SG
82.7 fps
AMD Radeon RX 6800 XT
79.6 fps -4%
AMD Radeon RX 6800
69.6 fps -16%
MSI GeForce RTX 3070 Ventus 3X
63.5 fps -23%
AMD Radeon RX 6700 XT
54 fps -35%
Inno3D GeForce RTX 3060 Twin X2
42.3 fps -49%
AMD Radeon RX 6600 XT
39.8 fps -52%
low med. high ultraQHD4K
GTA V (2015) 186.9 186.1 182 128.2 129.5 169.6
The Witcher 3 (2015) 425 407 321 165.1 131.8
Dota 2 Reborn (2015) 211.4 186.6 175.8 160.95 156.4
Rise of the Tomb Raider (2016) 441 286 232 197.4 102.2
Final Fantasy XV Benchmark (2018) 223 196.5 156.2 125.5 76.7
X-Plane 11.11 (2018) 159.4 143.2 114.7 98.7
Far Cry 5 (2018) 194 171 162 151 147 102
Strange Brigade (2018) 545 422 356 314 236 141.5
Shadow of the Tomb Raider (2018) 236 209 207 196.1 146.7 82.7
Far Cry New Dawn (2019) 154 136 131 118 116 98
Metro Exodus (2019) 210 178 145 117.7 97.9 65.2
Anno 1800 (2019) 126.6 123.7 94 51.6 49.7 47.8
Control (2019) 240 220 166.8 112.1 57.9
Borderlands 3 (2019) 166.2 150 139.2 128.5 104 59.9
F1 2020 (2020) 412 351 339 263 206 124.6
Horizon Zero Dawn (2020) 216 200 175 155 132 80
Crysis Remastered (2020) 320 346 176.6 162.3 123.5 72.7
Mafia Definitive Edition (2020) 196.6 179.1 162.7 136 79.2
Watch Dogs Legion (2020) 123 118.1 107.8 95.2 83.5 55.2
Dirt 5 (2020) 303 227 194 154 125 83
Immortals Fenyx Rising (2020) 142 140 136 129 112 78
F1 2021 (2021) 509 463 379 201 157.3 93.5
New World (2021) 173.1 129.2 116.1 113.5 103.9 67.6
Far Cry 6 (2021) 150.4 113.4 104.7 100.2 92.2 57.2
Guardians of the Galaxy (2021) 139 148 147 143 141 100
Riders Republic (2021) 236 208 173 162 124 73
Forza Horizon 5 (2021) 257 171 159 106 94 71
Farming Simulator 22 (2021) 277 230 197 181.5 179.4 133.4
God of War (2022) 182.7 163 138.8 100.8 85.5 60.1
Rainbow Six Extraction (2022) 379 275 273 239 168 96
Dying Light 2 (2022) 157.8 132.9 116 86.5 50
Elden Ring (2022) 60 60 60 60 60 60
Ghostwire Tokyo (2022) 206 196.3 195.4 192.5 165.8 86.7
Tiny Tina's Wonderlands (2022) 276 237 183.7 152.7 112.6 63.9
Vampire Bloodhunt (2022) 408 300 294 277 214 115.8

Compute Performance

In our render tests, the KFA2 GeForce RTX 3080 SG 12 GB performed very well against its own in-house competitors. It came within striking distance of the much more expensive Nvidia GeForce RTX 3090, which was only 7 % faster in our performance ranking. Having said that Nvidia GPUs cannot compete against AMD’s RDNA2-generation of GPUs, which outperformed its competitors handily every time. Keep in mind that your individual workload will heavily influence overall compute performance, and you should thus take a look at each individual test when choosing a GPU for general purpose GPU computing.

Performance Rating - Percent
AMD Radeon RX 6900 XT, R9 5950X
90.9 pt
AMD Radeon RX 6800 XT, R9 5950X
83.9 pt
AMD Radeon RX 6800, R9 5900X
79.4 pt
MSI GeForce RTX 3090 Suprim X, R9 5900X
77.8 pt
KFA2 GeForce RTX 3080 SG, R9 5900X
72.9 pt
AMD Radeon RX 6700 XT, R9 5900X
69.6 pt
MSI GeForce RTX 3080 Gaming X Trio, R9 5900X
68.2 pt
AMD Radeon RX 6600 XT, R9 5900X
58.6 pt
MSI GeForce RTX 3070 Ventus 3X, R9 5900X
56.9 pt
Inno3D GeForce RTX 3060 Twin X2, R9 5900X
41.2 pt
ComputeMark v2.1
1024x600 Normal, QJuliaRayTrace
MSI GeForce RTX 3090 Suprim X, R9 5900X
17058 Points +9%
KFA2 GeForce RTX 3080 SG, R9 5900X
15594 Points
MSI GeForce RTX 3080 Gaming X Trio, R9 5900X
15508 Points -1%
AMD Radeon RX 6900 XT, R9 5950X
12255 Points -21%
MSI GeForce RTX 3070 Ventus 3X, R9 5900X
11510 Points -26%
AMD Radeon RX 6800 XT, R9 5950X
11304 Points -28%
AMD Radeon RX 6800, R9 5900X
9343 Points -40%
Inno3D GeForce RTX 3060 Twin X2, R9 5900X
7719 Points -51%
AMD Radeon RX 6700 XT, R9 5900X
7537 Points -52%
AMD Radeon RX 6600 XT, R9 5900X
6423 Points -59%
1024x600 Normal, Mandel Scalar
MSI GeForce RTX 3090 Suprim X, R9 5900X
11197 Points +15%
AMD Radeon RX 6900 XT, R9 5950X
10834 Points +12%
AMD Radeon RX 6800 XT, R9 5950X
10018 Points +3%
MSI GeForce RTX 3080 Gaming X Trio, R9 5900X
9938 Points +2%
KFA2 GeForce RTX 3080 SG, R9 5900X
9698 Points
AMD Radeon RX 6800, R9 5900X
8520 Points -12%
MSI GeForce RTX 3070 Ventus 3X, R9 5900X
7042 Points -27%
AMD Radeon RX 6700 XT, R9 5900X
6430 Points -34%
AMD Radeon RX 6600 XT, R9 5900X
5413 Points -44%
Inno3D GeForce RTX 3060 Twin X2, R9 5900X
4218 Points -57%
1024x600 Normal, Mandel Vector
AMD Radeon RX 6900 XT, R9 5950X
8690 Points +4%
AMD Radeon RX 6800 XT, R9 5950X
8399 Points +1%
MSI GeForce RTX 3090 Suprim X, R9 5900X
8341 Points 0%
KFA2 GeForce RTX 3080 SG, R9 5900X
8326 Points
MSI GeForce RTX 3080 Gaming X Trio, R9 5900X
7540 Points -9%
AMD Radeon RX 6800, R9 5900X
7283 Points -13%
AMD Radeon RX 6700 XT, R9 5900X
5478 Points -34%
MSI GeForce RTX 3070 Ventus 3X, R9 5900X
5364 Points -36%
AMD Radeon RX 6600 XT, R9 5900X
4805 Points -42%
Inno3D GeForce RTX 3060 Twin X2, R9 5900X
4265 Points -49%
1024x600 Normal, Fluid 2DTexArr
MSI GeForce RTX 3090 Suprim X, R9 5900X
4560 Points +9%
KFA2 GeForce RTX 3080 SG, R9 5900X
4175 Points
MSI GeForce RTX 3080 Gaming X Trio, R9 5900X
4159 Points 0%
AMD Radeon RX 6800 XT, R9 5950X
3947 Points -5%
AMD Radeon RX 6900 XT, R9 5950X
3924 Points -6%
AMD Radeon RX 6800, R9 5900X
3144 Points -25%
MSI GeForce RTX 3070 Ventus 3X, R9 5900X
2666 Points -36%
AMD Radeon RX 6700 XT, R9 5900X
2430 Points -42%
Inno3D GeForce RTX 3060 Twin X2, R9 5900X
2007 Points -52%
AMD Radeon RX 6600 XT, R9 5900X
1627 Points -61%
1024x600 Normal, Fluid 3DTex
MSI GeForce RTX 3090 Suprim X, R9 5900X
5391 Points +10%
AMD Radeon RX 6800 XT, R9 5950X
5154 Points +5%
AMD Radeon RX 6900 XT, R9 5950X
5154 Points +5%
KFA2 GeForce RTX 3080 SG, R9 5900X
4900 Points
AMD Radeon RX 6800, R9 5900X
4674 Points -5%
MSI GeForce RTX 3080 Gaming X Trio, R9 5900X
4450 Points -9%
AMD Radeon RX 6700 XT, R9 5900X
3317 Points -32%
MSI GeForce RTX 3070 Ventus 3X, R9 5900X
2749 Points -44%
Inno3D GeForce RTX 3060 Twin X2, R9 5900X
2067 Points -58%
AMD Radeon RX 6600 XT, R9 5900X
1705 Points -65%
1024x600 Normal, Score
MSI GeForce RTX 3090 Suprim X, R9 5900X
46547 Points +9%
KFA2 GeForce RTX 3080 SG, R9 5900X
42692 Points
MSI GeForce RTX 3080 Gaming X Trio, R9 5900X
41594 Points -3%
AMD Radeon RX 6900 XT, R9 5950X
40857 Points -4%
AMD Radeon RX 6800 XT, R9 5950X
38823 Points -9%
AMD Radeon RX 6800, R9 5900X
32965 Points -23%
MSI GeForce RTX 3070 Ventus 3X, R9 5900X
29330 Points -31%
AMD Radeon RX 6700 XT, R9 5900X
25193 Points -41%
Inno3D GeForce RTX 3060 Twin X2, R9 5900X
20577 Points -52%
AMD Radeon RX 6600 XT, R9 5900X
19973 Points -53%
LuxMark v2.0 64Bit
Room GPUs-only
KFA2 GeForce RTX 3080 SG, R9 5900X
5768 Samples/s
MSI GeForce RTX 3090 Suprim X, R9 5900X
5727 Samples/s -1%
MSI GeForce RTX 3080 Gaming X Trio, R9 5900X
5198 Samples/s -10%
AMD Radeon RX 6900 XT, R9 5950X
5084 Samples/s -12%
AMD Radeon RX 6800 XT, R9 5950X
5057 Samples/s -12%
MSI GeForce RTX 3070 Ventus 3X, R9 5900X
4284 Samples/s -26%
AMD Radeon RX 6800, R9 5900X
3689 Samples/s -36%
AMD Radeon RX 6700 XT, R9 5900X
3291 Samples/s -43%
AMD Radeon RX 6600 XT, R9 5900X
2493 Samples/s -57%
Inno3D GeForce RTX 3060 Twin X2, R9 5900X
1679 Samples/s -71%
Sala GPUs-only
AMD Radeon RX 6900 XT, R9 5950X
31400 Samples/s +121%
AMD Radeon RX 6800 XT, R9 5950X
28023 Samples/s +97%
AMD Radeon RX 6800, R9 5900X
20840 Samples/s +47%
MSI GeForce RTX 3090 Suprim X, R9 5900X
14590 Samples/s +3%
AMD Radeon RX 6700 XT, R9 5900X
14554 Samples/s +2%
KFA2 GeForce RTX 3080 SG, R9 5900X
14204 Samples/s
MSI GeForce RTX 3080 Gaming X Trio, R9 5900X
12980 Samples/s -9%
MSI GeForce RTX 3070 Ventus 3X, R9 5900X
10096 Samples/s -29%
AMD Radeon RX 6600 XT, R9 5900X
7239 Samples/s -49%
Inno3D GeForce RTX 3060 Twin X2, R9 5900X
6807 Samples/s -52%
SPECviewperf 13
Solidworks (sw-04)
AMD Radeon RX 6900 XT, R9 5950X
214 fps +98%
AMD Radeon RX 6700 XT, R9 5900X
201 fps +86%
AMD Radeon RX 6800, R9 5900X
200 fps +85%
AMD Radeon RX 6800 XT, R9 5950X
193 fps +79%
AMD Radeon RX 6600 XT, R9 5900X
184 fps +70%
KFA2 GeForce RTX 3080 SG, R9 5900X
108 fps
MSI GeForce RTX 3070 Ventus 3X, R9 5900X
97.4 fps -10%
MSI GeForce RTX 3080 Gaming X Trio, R9 5900X
96.5 fps -11%
MSI GeForce RTX 3090 Suprim X, R9 5900X
95.3 fps -12%
Inno3D GeForce RTX 3060 Twin X2, R9 5900X
84.9 fps -21%
Siemens NX (snx-03)
AMD Radeon RX 6600 XT, R9 5900X
88.1 fps +235%
AMD Radeon RX 6700 XT, R9 5900X
87.8 fps +234%
AMD Radeon RX 6900 XT, R9 5950X
85.8 fps +226%
AMD Radeon RX 6800, R9 5900X
84.7 fps +222%
AMD Radeon RX 6800 XT, R9 5950X
81.4 fps +210%
MSI GeForce RTX 3090 Suprim X, R9 5900X
27.03 fps +3%
KFA2 GeForce RTX 3080 SG, R9 5900X
26.3 fps
MSI GeForce RTX 3080 Gaming X Trio, R9 5900X
24.26 fps -8%
MSI GeForce RTX 3070 Ventus 3X, R9 5900X
23.25 fps -12%
Inno3D GeForce RTX 3060 Twin X2, R9 5900X
16.2 fps -38%
Showcase (showcase-02)
MSI GeForce RTX 3090 Suprim X, R9 5900X
241 fps +6%
AMD Radeon RX 6900 XT, R9 5950X
241 fps +6%
AMD Radeon RX 6800 XT, R9 5950X
232 fps +2%
KFA2 GeForce RTX 3080 SG, R9 5900X
228 fps
MSI GeForce RTX 3080 Gaming X Trio, R9 5900X
204 fps -11%
AMD Radeon RX 6800, R9 5900X
194 fps -15%
MSI GeForce RTX 3070 Ventus 3X, R9 5900X
158 fps -31%
AMD Radeon RX 6700 XT, R9 5900X
150 fps -34%
Inno3D GeForce RTX 3060 Twin X2, R9 5900X
115 fps -50%
AMD Radeon RX 6600 XT, R9 5900X
111 fps -51%
Medical (medical-02)
AMD Radeon RX 6900 XT, R9 5950X
148 fps +45%
AMD Radeon RX 6800 XT, R9 5950X
130 fps +27%
AMD Radeon RX 6800, R9 5900X
113 fps +11%
MSI GeForce RTX 3090 Suprim X, R9 5900X
105 fps +3%
AMD Radeon RX 6700 XT, R9 5900X
104 fps +2%
KFA2 GeForce RTX 3080 SG, R9 5900X
102 fps
MSI GeForce RTX 3080 Gaming X Trio, R9 5900X
99 fps -3%
AMD Radeon RX 6600 XT, R9 5900X
89.6 fps -12%
MSI GeForce RTX 3070 Ventus 3X, R9 5900X
81.4 fps -20%
Inno3D GeForce RTX 3060 Twin X2, R9 5900X
55 fps -46%
Maya (maya-05)
MSI GeForce RTX 3090 Suprim X, R9 5900X
469 fps +2%
KFA2 GeForce RTX 3080 SG, R9 5900X
460 fps
MSI GeForce RTX 3080 Gaming X Trio, R9 5900X
440 fps -4%
AMD Radeon RX 6900 XT, R9 5950X
395 fps -14%
MSI GeForce RTX 3070 Ventus 3X, R9 5900X
363 fps -21%
AMD Radeon RX 6800, R9 5900X
356 fps -23%
AMD Radeon RX 6800 XT, R9 5950X
348 fps -24%
AMD Radeon RX 6700 XT, R9 5900X
325 fps -29%
AMD Radeon RX 6600 XT, R9 5900X
283 fps -38%
Inno3D GeForce RTX 3060 Twin X2, R9 5900X
261 fps -43%
Energy (energy-02)
AMD Radeon RX 6900 XT, R9 5950X
60.6 fps +61%
AMD Radeon RX 6800 XT, R9 5950X
58.4 fps +55%
AMD Radeon RX 6800, R9 5900X
49.7 fps +32%
MSI GeForce RTX 3090 Suprim X, R9 5900X
45.21 fps +20%
AMD Radeon RX 6700 XT, R9 5900X
40 fps +6%
MSI GeForce RTX 3080 Gaming X Trio, R9 5900X
37.87 fps +1%
KFA2 GeForce RTX 3080 SG, R9 5900X
37.6 fps
AMD Radeon RX 6600 XT, R9 5900X
29.8 fps -21%
MSI GeForce RTX 3070 Ventus 3X, R9 5900X
28.83 fps -23%
Inno3D GeForce RTX 3060 Twin X2, R9 5900X
13.6 fps -64%
Creo (creo-02)
KFA2 GeForce RTX 3080 SG, R9 5900X
324 fps
MSI GeForce RTX 3090 Suprim X, R9 5900X
316 fps -2%
MSI GeForce RTX 3080 Gaming X Trio, R9 5900X
295 fps -9%
AMD Radeon RX 6900 XT, R9 5950X
292 fps -10%
AMD Radeon RX 6800 XT, R9 5950X
276 fps -15%
AMD Radeon RX 6800, R9 5900X
269 fps -17%
AMD Radeon RX 6700 XT, R9 5900X
248 fps -23%
AMD Radeon RX 6600 XT, R9 5900X
242 fps -25%
MSI GeForce RTX 3070 Ventus 3X, R9 5900X
240 fps -26%
Inno3D GeForce RTX 3060 Twin X2, R9 5900X
181 fps -44%
Catia (catia-05)
AMD Radeon RX 6900 XT, R9 5950X
468 fps +127%
AMD Radeon RX 6800, R9 5900X
420 fps +104%
AMD Radeon RX 6800 XT, R9 5950X
412 fps +100%
AMD Radeon RX 6700 XT, R9 5900X
398 fps +93%
AMD Radeon RX 6600 XT, R9 5900X
353 fps +71%
MSI GeForce RTX 3090 Suprim X, R9 5900X
206 fps 0%
KFA2 GeForce RTX 3080 SG, R9 5900X
206 fps
MSI GeForce RTX 3080 Gaming X Trio, R9 5900X
190 fps -8%
MSI GeForce RTX 3070 Ventus 3X, R9 5900X
176 fps -15%
Inno3D GeForce RTX 3060 Twin X2, R9 5900X
109 fps -47%
3ds Max (3dsmax-06)
KFA2 GeForce RTX 3080 SG, R9 5900X
334 fps
AMD Radeon RX 6900 XT, R9 5950X
317 fps -5%
AMD Radeon RX 6800, R9 5900X
309 fps -7%
MSI GeForce RTX 3090 Suprim X, R9 5900X
298 fps -11%
MSI GeForce RTX 3080 Gaming X Trio, R9 5900X
294 fps -12%
AMD Radeon RX 6800 XT, R9 5950X
284 fps -15%
MSI GeForce RTX 3070 Ventus 3X, R9 5900X
269 fps -19%
AMD Radeon RX 6700 XT, R9 5900X
265 fps -21%
AMD Radeon RX 6600 XT, R9 5900X
237 fps -29%
Inno3D GeForce RTX 3060 Twin X2, R9 5900X
215 fps -36%
SPECviewperf 12
1900x1060 Solidworks (sw-03)
AMD Radeon RX 6900 XT, R9 5950X
167 fps +126%
AMD Radeon RX 6700 XT, R9 5900X
163 fps +121%
AMD Radeon RX 6800 XT, R9 5950X
150 fps +103%
AMD Radeon RX 6800, R9 5900X
149 fps +102%
AMD Radeon RX 6600 XT, R9 5900X
145 fps +96%
KFA2 GeForce RTX 3080 SG, R9 5900X
73.8 fps
MSI GeForce RTX 3090 Suprim X, R9 5900X
72.3 fps -2%
MSI GeForce RTX 3070 Ventus 3X, R9 5900X
69.9 fps -5%
MSI GeForce RTX 3080 Gaming X Trio, R9 5900X
66 fps -11%
Inno3D GeForce RTX 3060 Twin X2, R9 5900X
56.1 fps -24%
1900x1060 Siemens NX (snx-02)
AMD Radeon RX 6700 XT, R9 5900X
49.6 fps +313%
AMD Radeon RX 6600 XT, R9 5900X
48.8 fps +307%
AMD Radeon RX 6900 XT, R9 5950X
47.7 fps +298%
AMD Radeon RX 6800, R9 5900X
46.2 fps +285%
AMD Radeon RX 6800 XT, R9 5950X
45.07 fps +276%
MSI GeForce RTX 3090 Suprim X, R9 5900X
14.91 fps +24%
MSI GeForce RTX 3080 Gaming X Trio, R9 5900X
12.85 fps +7%
MSI GeForce RTX 3070 Ventus 3X, R9 5900X
12.82 fps +7%
KFA2 GeForce RTX 3080 SG, R9 5900X
12 fps
Inno3D GeForce RTX 3060 Twin X2, R9 5900X
8.98 fps -25%
1900x1060 Showcase (showcase-01)
AMD Radeon RX 6900 XT, R9 5950X
241 fps +7%
MSI GeForce RTX 3090 Suprim X, R9 5900X
236 fps +4%
KFA2 GeForce RTX 3080 SG, R9 5900X
226 fps
AMD Radeon RX 6800 XT, R9 5950X
223 fps -1%
AMD Radeon RX 6800, R9 5900X
194 fps -14%
MSI GeForce RTX 3080 Gaming X Trio, R9 5900X
180 fps -20%
MSI GeForce RTX 3070 Ventus 3X, R9 5900X
155 fps -31%
AMD Radeon RX 6700 XT, R9 5900X
150 fps -34%
Inno3D GeForce RTX 3060 Twin X2, R9 5900X
114 fps -50%
AMD Radeon RX 6600 XT, R9 5900X
111 fps -51%
1900x1060 Medical (medical-01)
AMD Radeon RX 6900 XT, R9 5950X
88.4 fps +119%
AMD Radeon RX 6800 XT, R9 5950X
77.3 fps +92%
AMD Radeon RX 6700 XT, R9 5900X
66.3 fps +65%
AMD Radeon RX 6800, R9 5900X
58.1 fps +44%
AMD Radeon RX 6600 XT, R9 5900X
54.9 fps +36%
MSI GeForce RTX 3090 Suprim X, R9 5900X
42.91 fps +6%
KFA2 GeForce RTX 3080 SG, R9 5900X
40.3 fps
MSI GeForce RTX 3070 Ventus 3X, R9 5900X
38.26 fps -5%
MSI GeForce RTX 3080 Gaming X Trio, R9 5900X
36.93 fps -8%
Inno3D GeForce RTX 3060 Twin X2, R9 5900X
36.5 fps -9%
1900x1060 Maya (maya-04)
MSI GeForce RTX 3090 Suprim X, R9 5900X
184 fps +32%
Inno3D GeForce RTX 3060 Twin X2, R9 5900X
173 fps +24%
MSI GeForce RTX 3070 Ventus 3X, R9 5900X
166 fps +19%
AMD Radeon RX 6900 XT, R9 5950X
151 fps +9%
MSI GeForce RTX 3080 Gaming X Trio, R9 5900X
146 fps +5%
AMD Radeon RX 6700 XT, R9 5900X
145 fps +4%
KFA2 GeForce RTX 3080 SG, R9 5900X
139 fps
AMD Radeon RX 6600 XT, R9 5900X
124 fps -11%
AMD Radeon RX 6800, R9 5900X
124 fps -11%
AMD Radeon RX 6800 XT, R9 5950X
118 fps -15%
1900x1060 Energy (energy-01)
AMD Radeon RX 6900 XT, R9 5950X
30.8 fps +79%
AMD Radeon RX 6800 XT, R9 5950X
28.39 fps +65%
AMD Radeon RX 6800, R9 5900X
23.9 fps +39%
MSI GeForce RTX 3090 Suprim X, R9 5900X
20.41 fps +19%
AMD Radeon RX 6700 XT, R9 5900X
18.8 fps +9%
KFA2 GeForce RTX 3080 SG, R9 5900X
17.2 fps
MSI GeForce RTX 3080 Gaming X Trio, R9 5900X
16.35 fps -5%
AMD Radeon RX 6600 XT, R9 5900X
14.7 fps -15%
MSI GeForce RTX 3070 Ventus 3X, R9 5900X
12.42 fps -28%
Inno3D GeForce RTX 3060 Twin X2, R9 5900X
9.89 fps -42%
1900x1060 Creo (creo-01)
AMD Radeon RX 6900 XT, R9 5950X
127 fps +71%
AMD Radeon RX 6700 XT, R9 5900X
120 fps +61%
AMD Radeon RX 6800, R9 5900X
120 fps +61%
AMD Radeon RX 6800 XT, R9 5950X
119 fps +60%
AMD Radeon RX 6600 XT, R9 5900X
111 fps +49%
MSI GeForce RTX 3090 Suprim X, R9 5900X
75.4 fps +1%
KFA2 GeForce RTX 3080 SG, R9 5900X
74.4 fps
MSI GeForce RTX 3080 Gaming X Trio, R9 5900X
65.6 fps -12%
MSI GeForce RTX 3070 Ventus 3X, R9 5900X
59.8 fps -20%
Inno3D GeForce RTX 3060 Twin X2, R9 5900X
52.4 fps -30%
1900x1060 Catia (catia-04)
AMD Radeon RX 6900 XT, R9 5950X
292 fps +269%
AMD Radeon RX 6700 XT, R9 5900X
259 fps +227%
AMD Radeon RX 6800, R9 5900X
242 fps +206%
AMD Radeon RX 6800 XT, R9 5950X
238 fps +201%
AMD Radeon RX 6600 XT, R9 5900X
218 fps +176%
MSI GeForce RTX 3090 Suprim X, R9 5900X
134 fps +69%
MSI GeForce RTX 3080 Gaming X Trio, R9 5900X
116 fps +47%
MSI GeForce RTX 3070 Ventus 3X, R9 5900X
112 fps +42%
KFA2 GeForce RTX 3080 SG, R9 5900X
79.1 fps
Inno3D GeForce RTX 3060 Twin X2, R9 5900X
73.9 fps -7%
1900x1060 3ds Max (3dsmax-05)
KFA2 GeForce RTX 3080 SG, R9 5900X
334 fps
MSI GeForce RTX 3090 Suprim X, R9 5900X
322 fps -4%
AMD Radeon RX 6900 XT, R9 5950X
318 fps -5%
AMD Radeon RX 6800, R9 5900X
283 fps -15%
MSI GeForce RTX 3080 Gaming X Trio, R9 5900X
276 fps -17%
MSI GeForce RTX 3070 Ventus 3X, R9 5900X
265 fps -21%
AMD Radeon RX 6700 XT, R9 5900X
253 fps -24%
AMD Radeon RX 6600 XT, R9 5900X
236 fps -29%
Inno3D GeForce RTX 3060 Twin X2, R9 5900X
217 fps -35%
AMD Radeon RX 6800 XT, R9 5950X
167 fps -50%
SPECviewperf 2020
3840x2160 Solidworks (solidworks-05)
MSI GeForce RTX 3090 Suprim X, R9 5900X
180 fps +3%
KFA2 GeForce RTX 3080 SG, R9 5900X
175 fps
MSI GeForce RTX 3080 Gaming X Trio, R9 5900X
158 fps -10%
MSI GeForce RTX 3070 Ventus 3X, R9 5900X
124 fps -29%
AMD Radeon RX 6900 XT, R9 5950X
112 fps -36%
AMD Radeon RX 6800 XT, R9 5950X
108 fps -38%
AMD Radeon RX 6800, R9 5900X
97.5 fps -44%
Inno3D GeForce RTX 3060 Twin X2, R9 5900X
81.6 fps -53%
AMD Radeon RX 6700 XT, R9 5900X
80.2 fps -54%
AMD Radeon RX 6600 XT, R9 5900X
58.7 fps -66%
3840x2160 Siemens NX (snx-04)
AMD Radeon RX 6900 XT, R9 5950X
85 fps +290%
AMD Radeon RX 6700 XT, R9 5900X
85 fps +290%
AMD Radeon RX 6800 XT, R9 5950X
81.7 fps +275%
AMD Radeon RX 6600 XT, R9 5900X
81 fps +272%
AMD Radeon RX 6800, R9 5900X
81 fps +272%
MSI GeForce RTX 3090 Suprim X, R9 5900X
22.6 fps +4%
KFA2 GeForce RTX 3080 SG, R9 5900X
21.8 fps
MSI GeForce RTX 3080 Gaming X Trio, R9 5900X
19.8 fps -9%
MSI GeForce RTX 3070 Ventus 3X, R9 5900X
19.15 fps -12%
Inno3D GeForce RTX 3060 Twin X2, R9 5900X
12.5 fps -43%
3840x2160 Medical (medical-03)
AMD Radeon RX 6900 XT, R9 5950X
30.4 fps +62%
AMD Radeon RX 6800 XT, R9 5950X
27.84 fps +48%
AMD Radeon RX 6800, R9 5900X
24.1 fps +28%
MSI GeForce RTX 3090 Suprim X, R9 5900X
21.19 fps +13%
AMD Radeon RX 6700 XT, R9 5900X
18.8 fps 0%
KFA2 GeForce RTX 3080 SG, R9 5900X
18.8 fps
MSI GeForce RTX 3080 Gaming X Trio, R9 5900X
18.47 fps -2%
AMD Radeon RX 6600 XT, R9 5900X
15.9 fps -15%
MSI GeForce RTX 3070 Ventus 3X, R9 5900X
13.74 fps -27%
Inno3D GeForce RTX 3060 Twin X2, R9 5900X
8.57 fps -54%
3840x2160 Maya (maya-06)
MSI GeForce RTX 3090 Suprim X, R9 5900X
330 fps +5%
KFA2 GeForce RTX 3080 SG, R9 5900X
314 fps
MSI GeForce RTX 3080 Gaming X Trio, R9 5900X
293 fps -7%
AMD Radeon RX 6900 XT, R9 5950X
266 fps -15%
MSI GeForce RTX 3070 Ventus 3X, R9 5900X
249 fps -21%
AMD Radeon RX 6800, R9 5900X
233 fps -26%
AMD Radeon RX 6800 XT, R9 5950X
224 fps -29%
AMD Radeon RX 6700 XT, R9 5900X
193 fps -39%
Inno3D GeForce RTX 3060 Twin X2, R9 5900X
162 fps -48%
AMD Radeon RX 6600 XT, R9 5900X
138 fps -56%
3840x2160 Energy (energy-03)
AMD Radeon RX 6800, R9 5900X
84.1 fps +126%
MSI GeForce RTX 3090 Suprim X, R9 5900X
61.1 fps +64%
AMD Radeon RX 6800 XT, R9 5950X
60.8 fps +63%
MSI GeForce RTX 3080 Gaming X Trio, R9 5900X
51.7 fps +39%
MSI GeForce RTX 3070 Ventus 3X, R9 5900X
37.99 fps +2%
KFA2 GeForce RTX 3080 SG, R9 5900X
37.2 fps
AMD Radeon RX 6900 XT, R9 5950X
32.6 fps -12%
AMD Radeon RX 6700 XT, R9 5900X
25.7 fps -31%
AMD Radeon RX 6600 XT, R9 5900X
21.2 fps -43%
Inno3D GeForce RTX 3060 Twin X2, R9 5900X
15.2 fps -59%
3840x2160 Creo (creo-03)
KFA2 GeForce RTX 3080 SG, R9 5900X
90 fps
MSI GeForce RTX 3090 Suprim X, R9 5900X
85.1 fps -5%
MSI GeForce RTX 3070 Ventus 3X, R9 5900X
78.1 fps -13%
MSI GeForce RTX 3080 Gaming X Trio, R9 5900X
77.6 fps -14%
Inno3D GeForce RTX 3060 Twin X2, R9 5900X
67.7 fps -25%
AMD Radeon RX 6800, R9 5900X
66.5 fps -26%
AMD Radeon RX 6900 XT, R9 5950X
65.4 fps -27%
AMD Radeon RX 6800 XT, R9 5950X
65 fps -28%
AMD Radeon RX 6700 XT, R9 5900X
61.1 fps -32%
AMD Radeon RX 6600 XT, R9 5900X
59.6 fps -34%
3840x2160 CATIA (catia-06)
MSI GeForce RTX 3090 Suprim X, R9 5900X
56.6 fps +5%
KFA2 GeForce RTX 3080 SG, R9 5900X
53.7 fps
MSI GeForce RTX 3080 Gaming X Trio, R9 5900X
50 fps -7%
AMD Radeon RX 6800, R9 5900X
45.3 fps -16%
AMD Radeon RX 6900 XT, R9 5950X
44.6 fps -17%
MSI GeForce RTX 3070 Ventus 3X, R9 5900X
43.15 fps -20%
AMD Radeon RX 6800 XT, R9 5950X
42.4 fps -21%
AMD Radeon RX 6700 XT, R9 5900X
39 fps -27%
AMD Radeon RX 6600 XT, R9 5900X
32.1 fps -40%
Inno3D GeForce RTX 3060 Twin X2, R9 5900X
28.6 fps -47%
3840x2160 3ds Max (3dsmax-07)
MSI GeForce RTX 3090 Suprim X, R9 5900X
135 fps +5%
KFA2 GeForce RTX 3080 SG, R9 5900X
128 fps
AMD Radeon RX 6900 XT, R9 5950X
121 fps -5%
AMD Radeon RX 6800 XT, R9 5950X
114 fps -11%
MSI GeForce RTX 3080 Gaming X Trio, R9 5900X
100 fps -22%
AMD Radeon RX 6800, R9 5900X
95.5 fps -25%
MSI GeForce RTX 3070 Ventus 3X, R9 5900X
84 fps -34%
AMD Radeon RX 6700 XT, R9 5900X
82.2 fps -36%
Inno3D GeForce RTX 3060 Twin X2, R9 5900X
65.7 fps -49%
AMD Radeon RX 6600 XT, R9 5900X
53.6 fps -58%

KFA2 GeForce RTX 3080 SG 12 GB Emissions

KFA2 GeForce RTX 3080 SG 12GB stress test

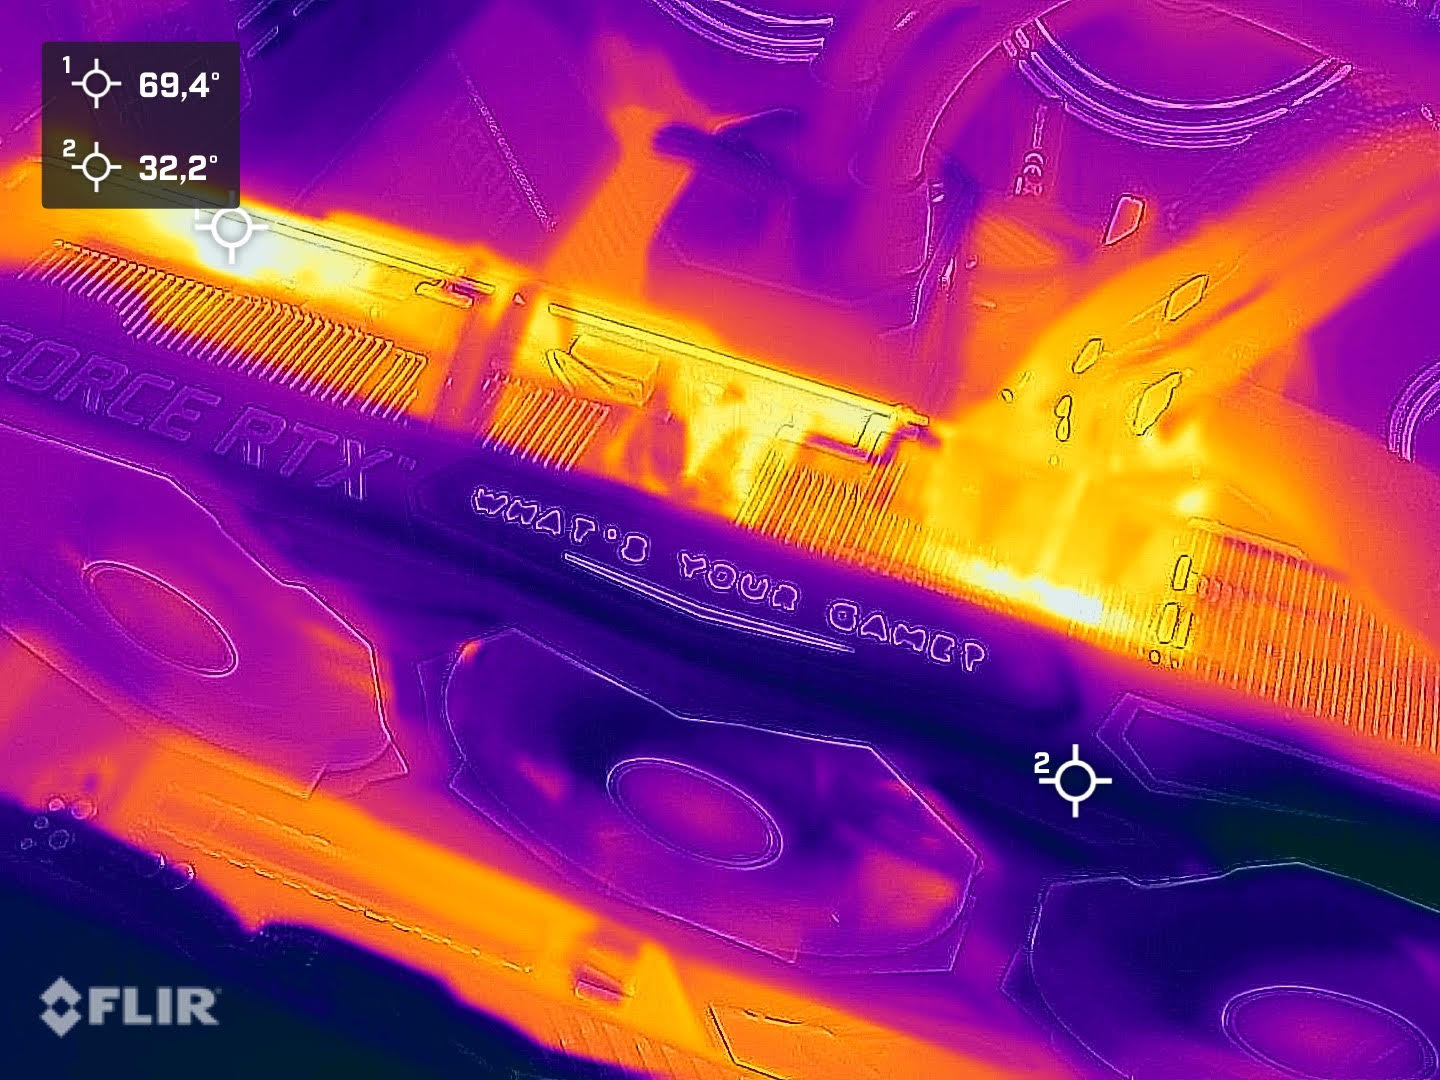
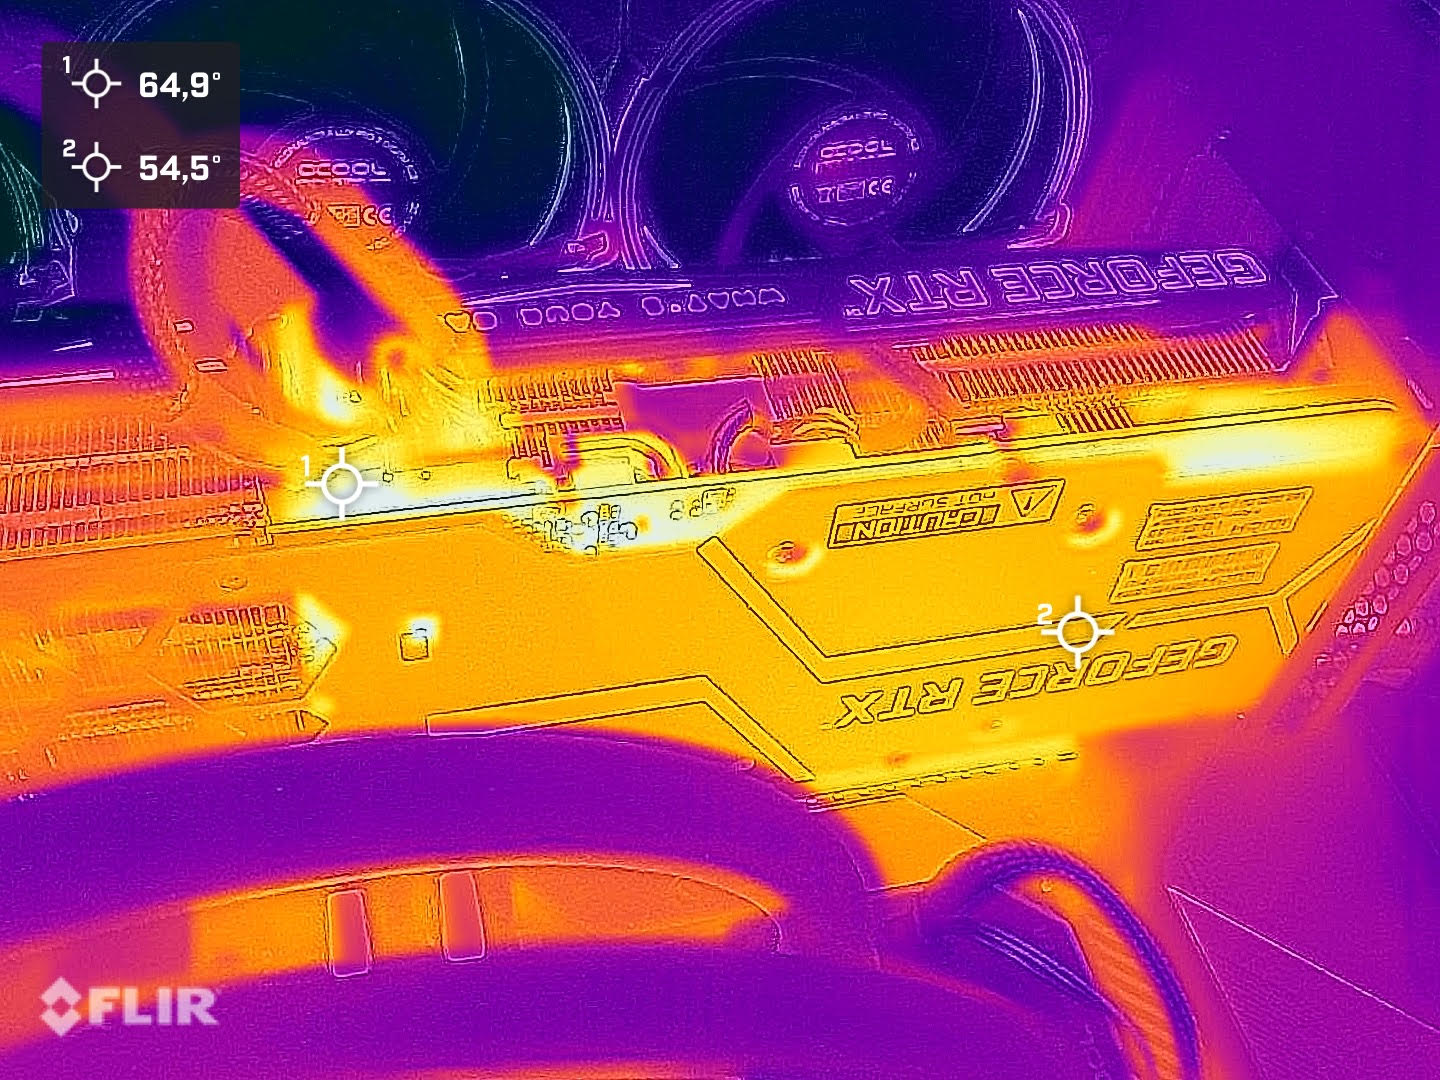
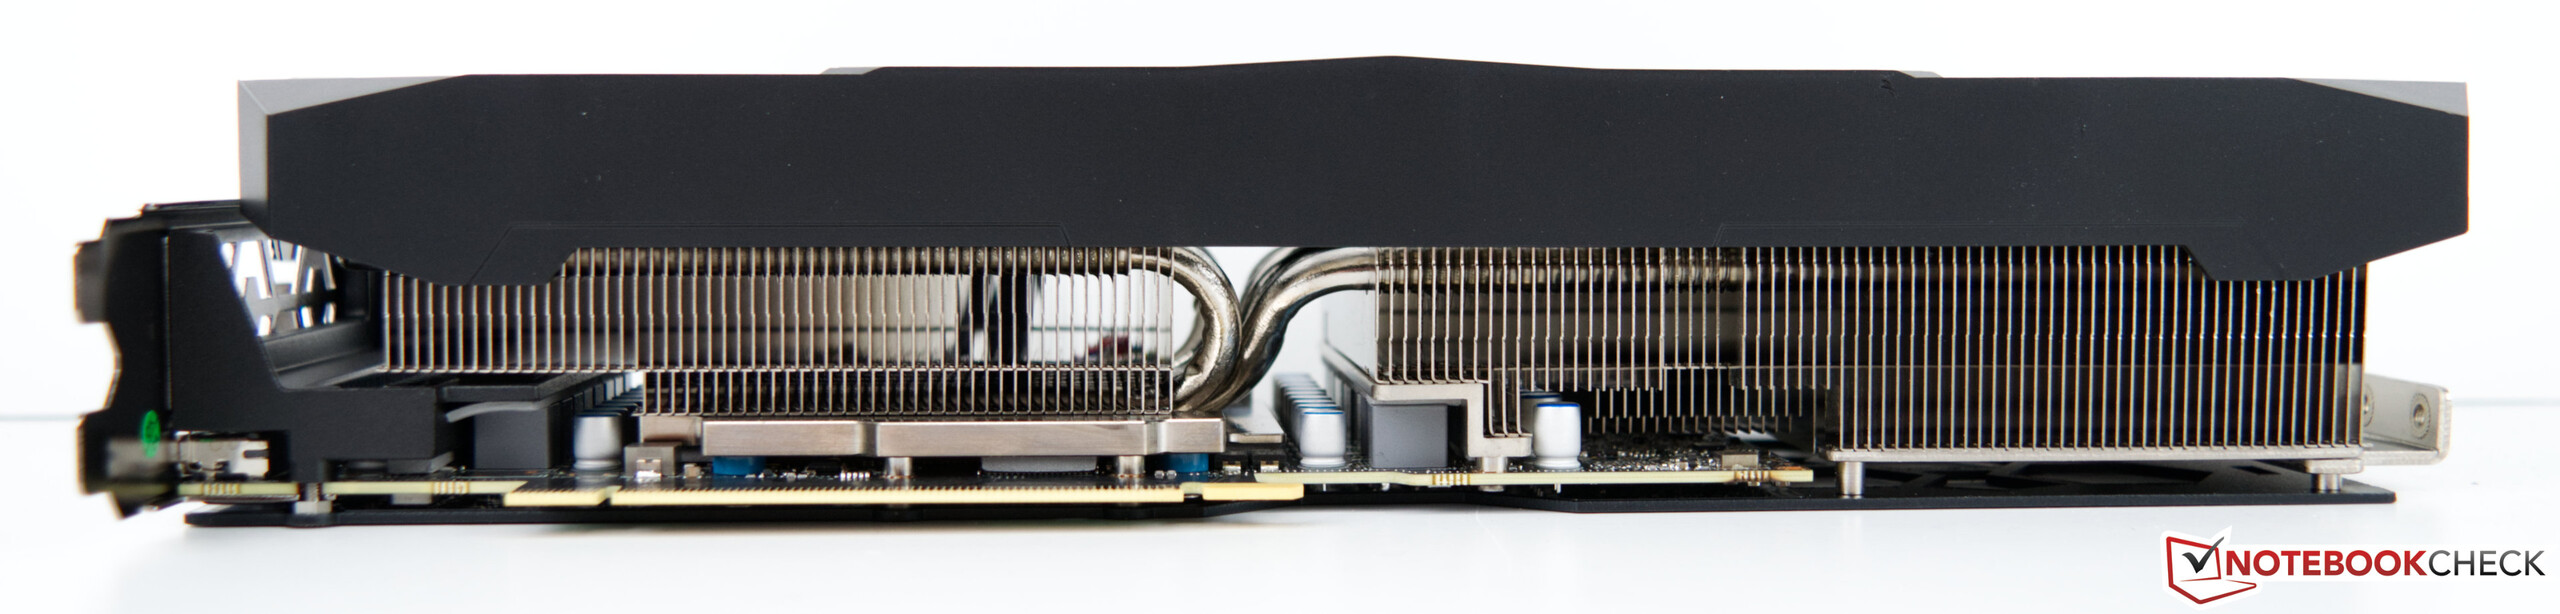
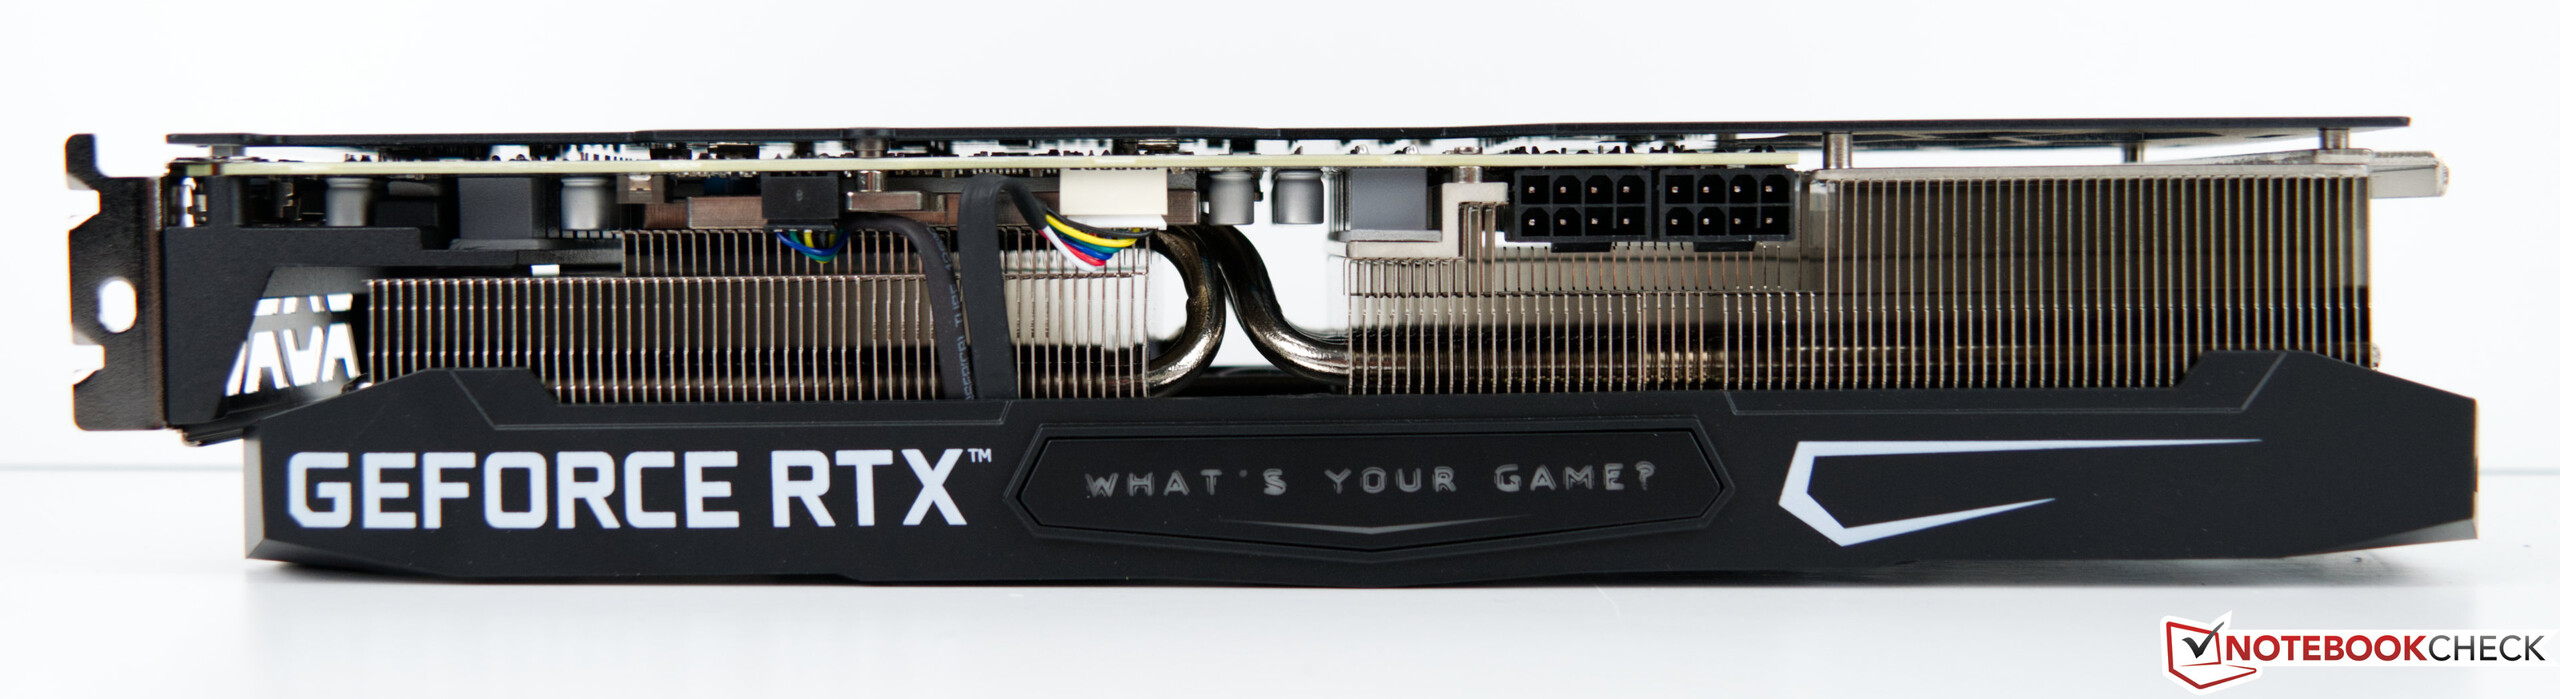
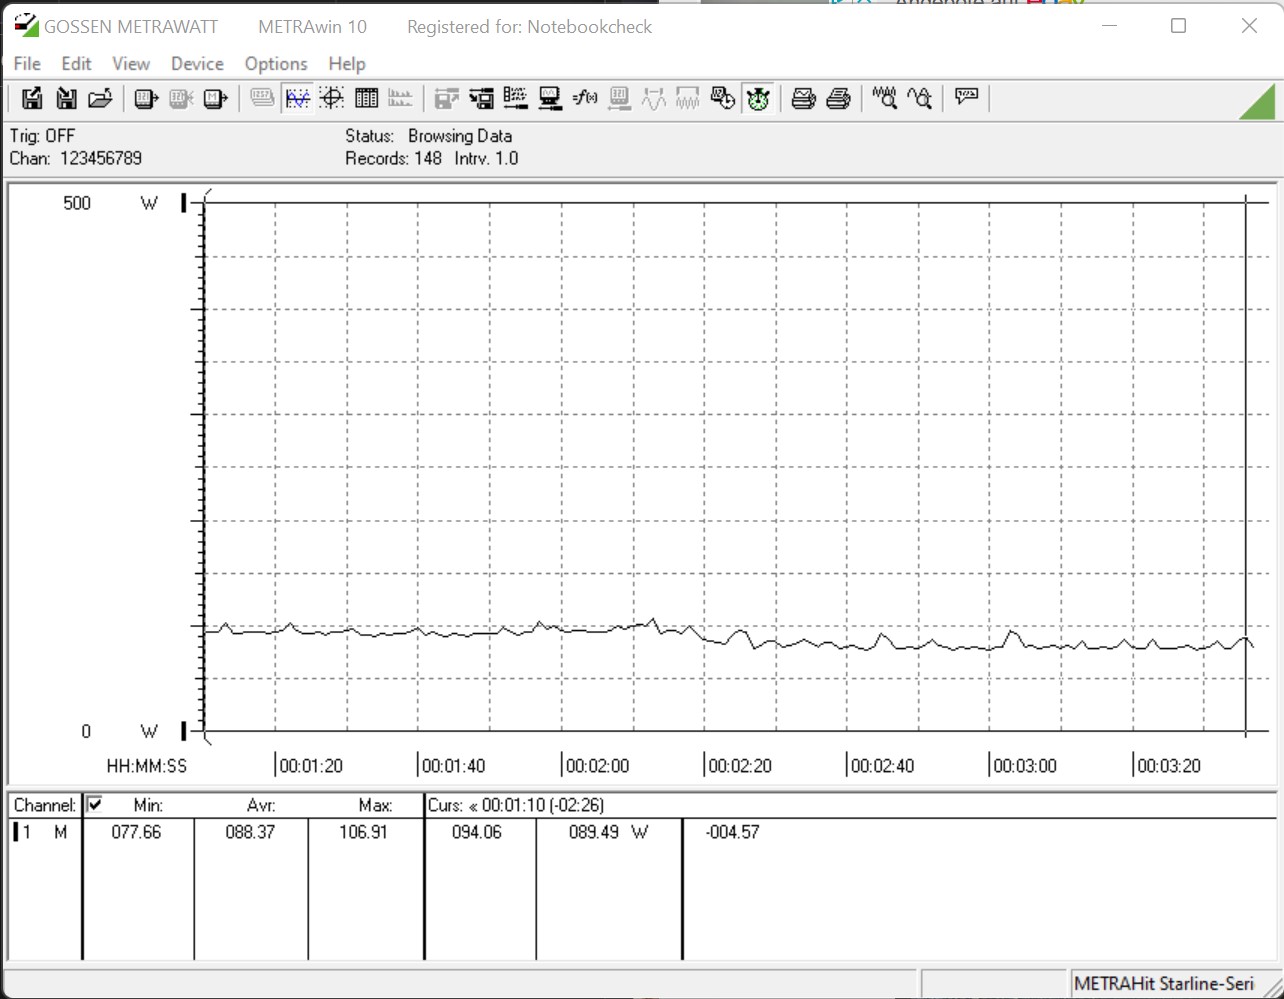
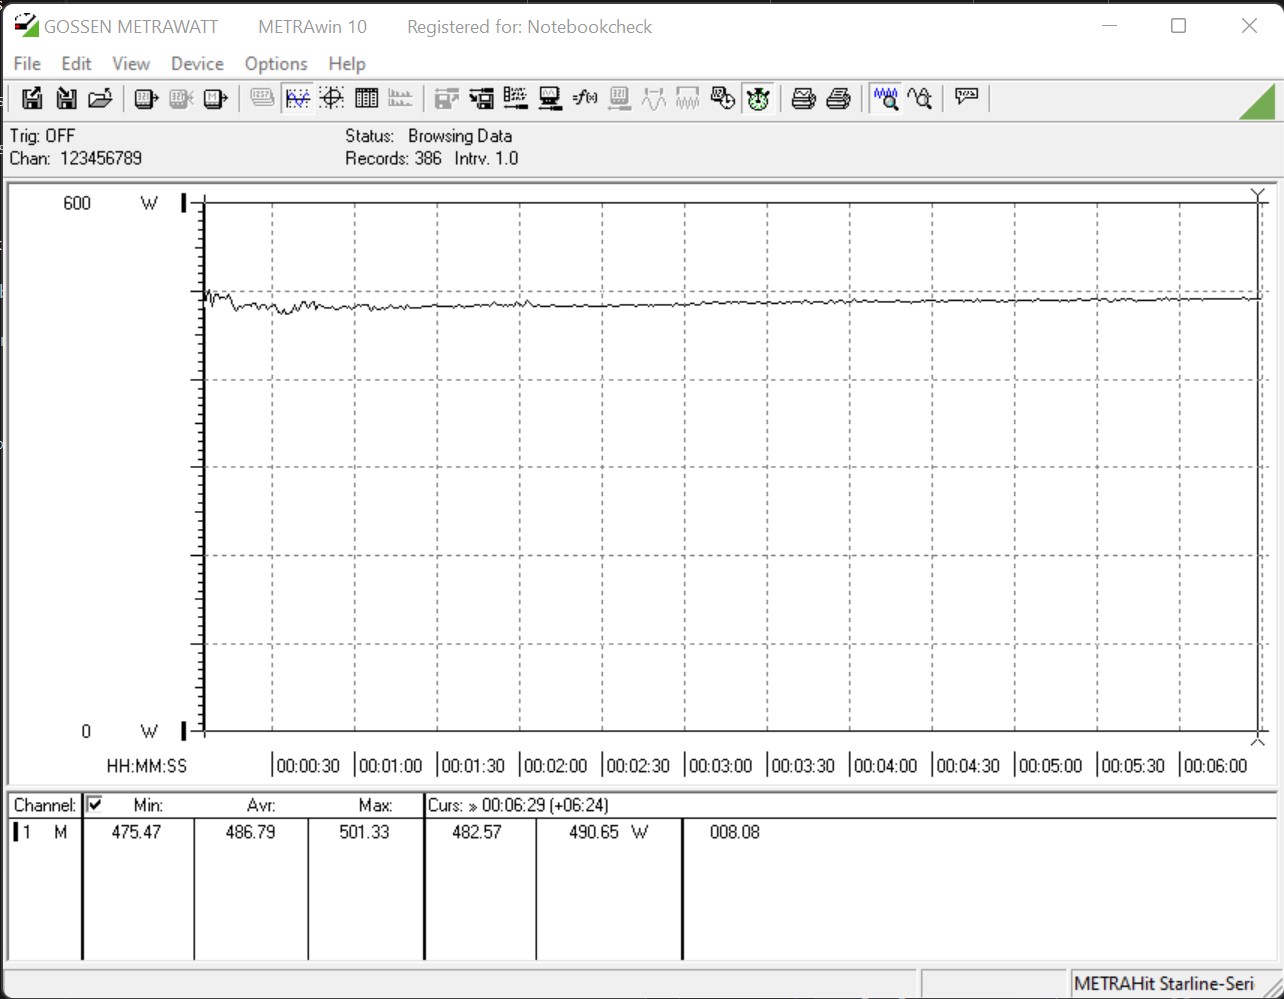
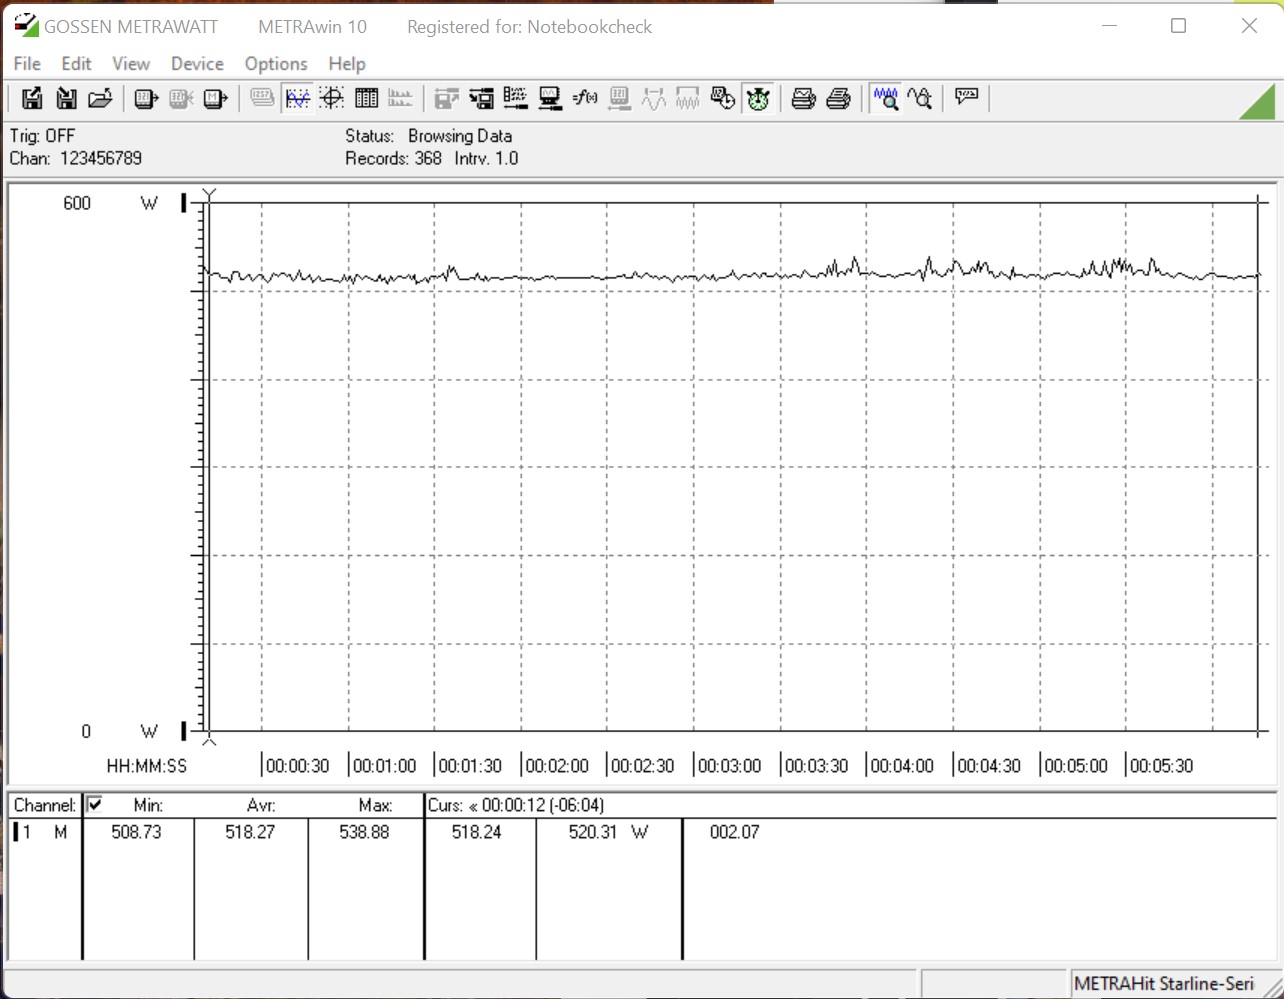
Emissions are a mixed bag overall. On the one hand, the KFA2’s cooler is well made and managed to keep the GeForce RTX 3080 GPU cool reliably and quietly. In fact, we could barely hear the fans from within a closed case. At 1,920 rpm its three 92 mm fans manage to move enough air through the cooling fins to keep the GA102 chip at 75 °C and the VRAM at a slightly higher 86 °C under load. On the other hand, the graphics card’s power consumption under load was immense. It peaked at a whopping 350 W, which is comparable to that of a Nvidia GeForce RTX 3090 FE. The MSI GeForce RTX 3090 Suprim X managed to beat that and required an even higher 420 W. When gaming, we recorded an average power consumption of 518 W.

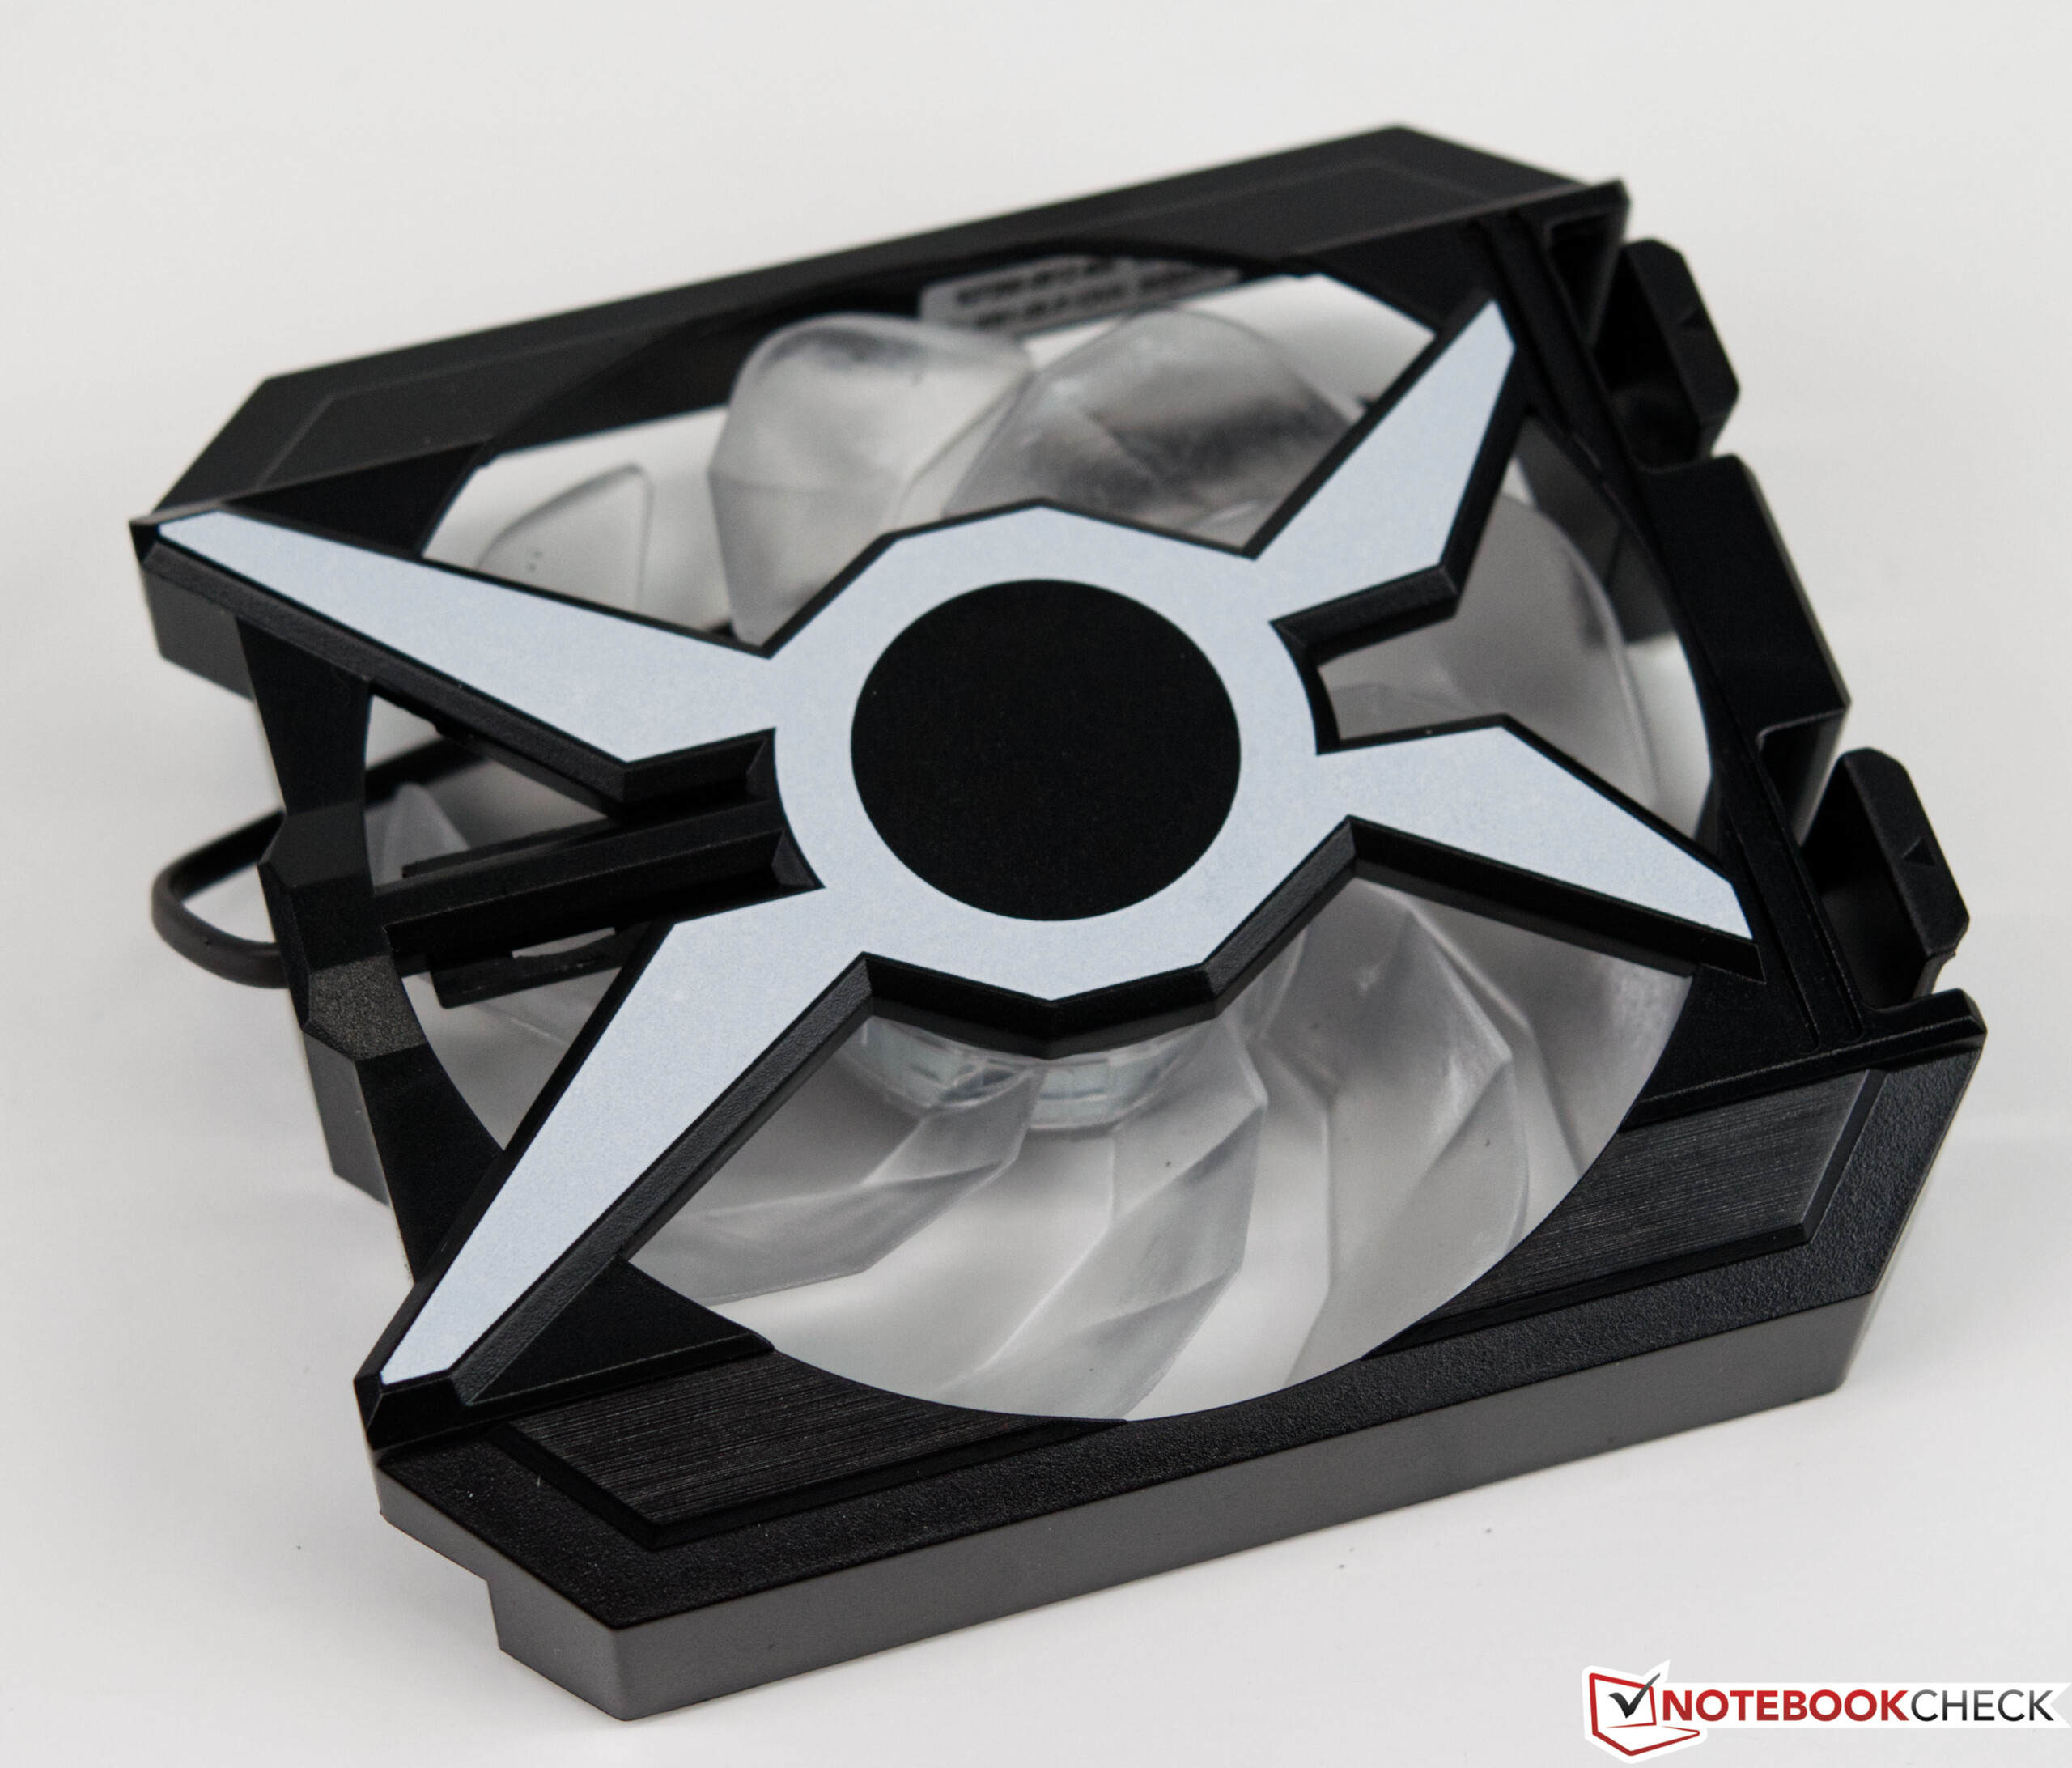
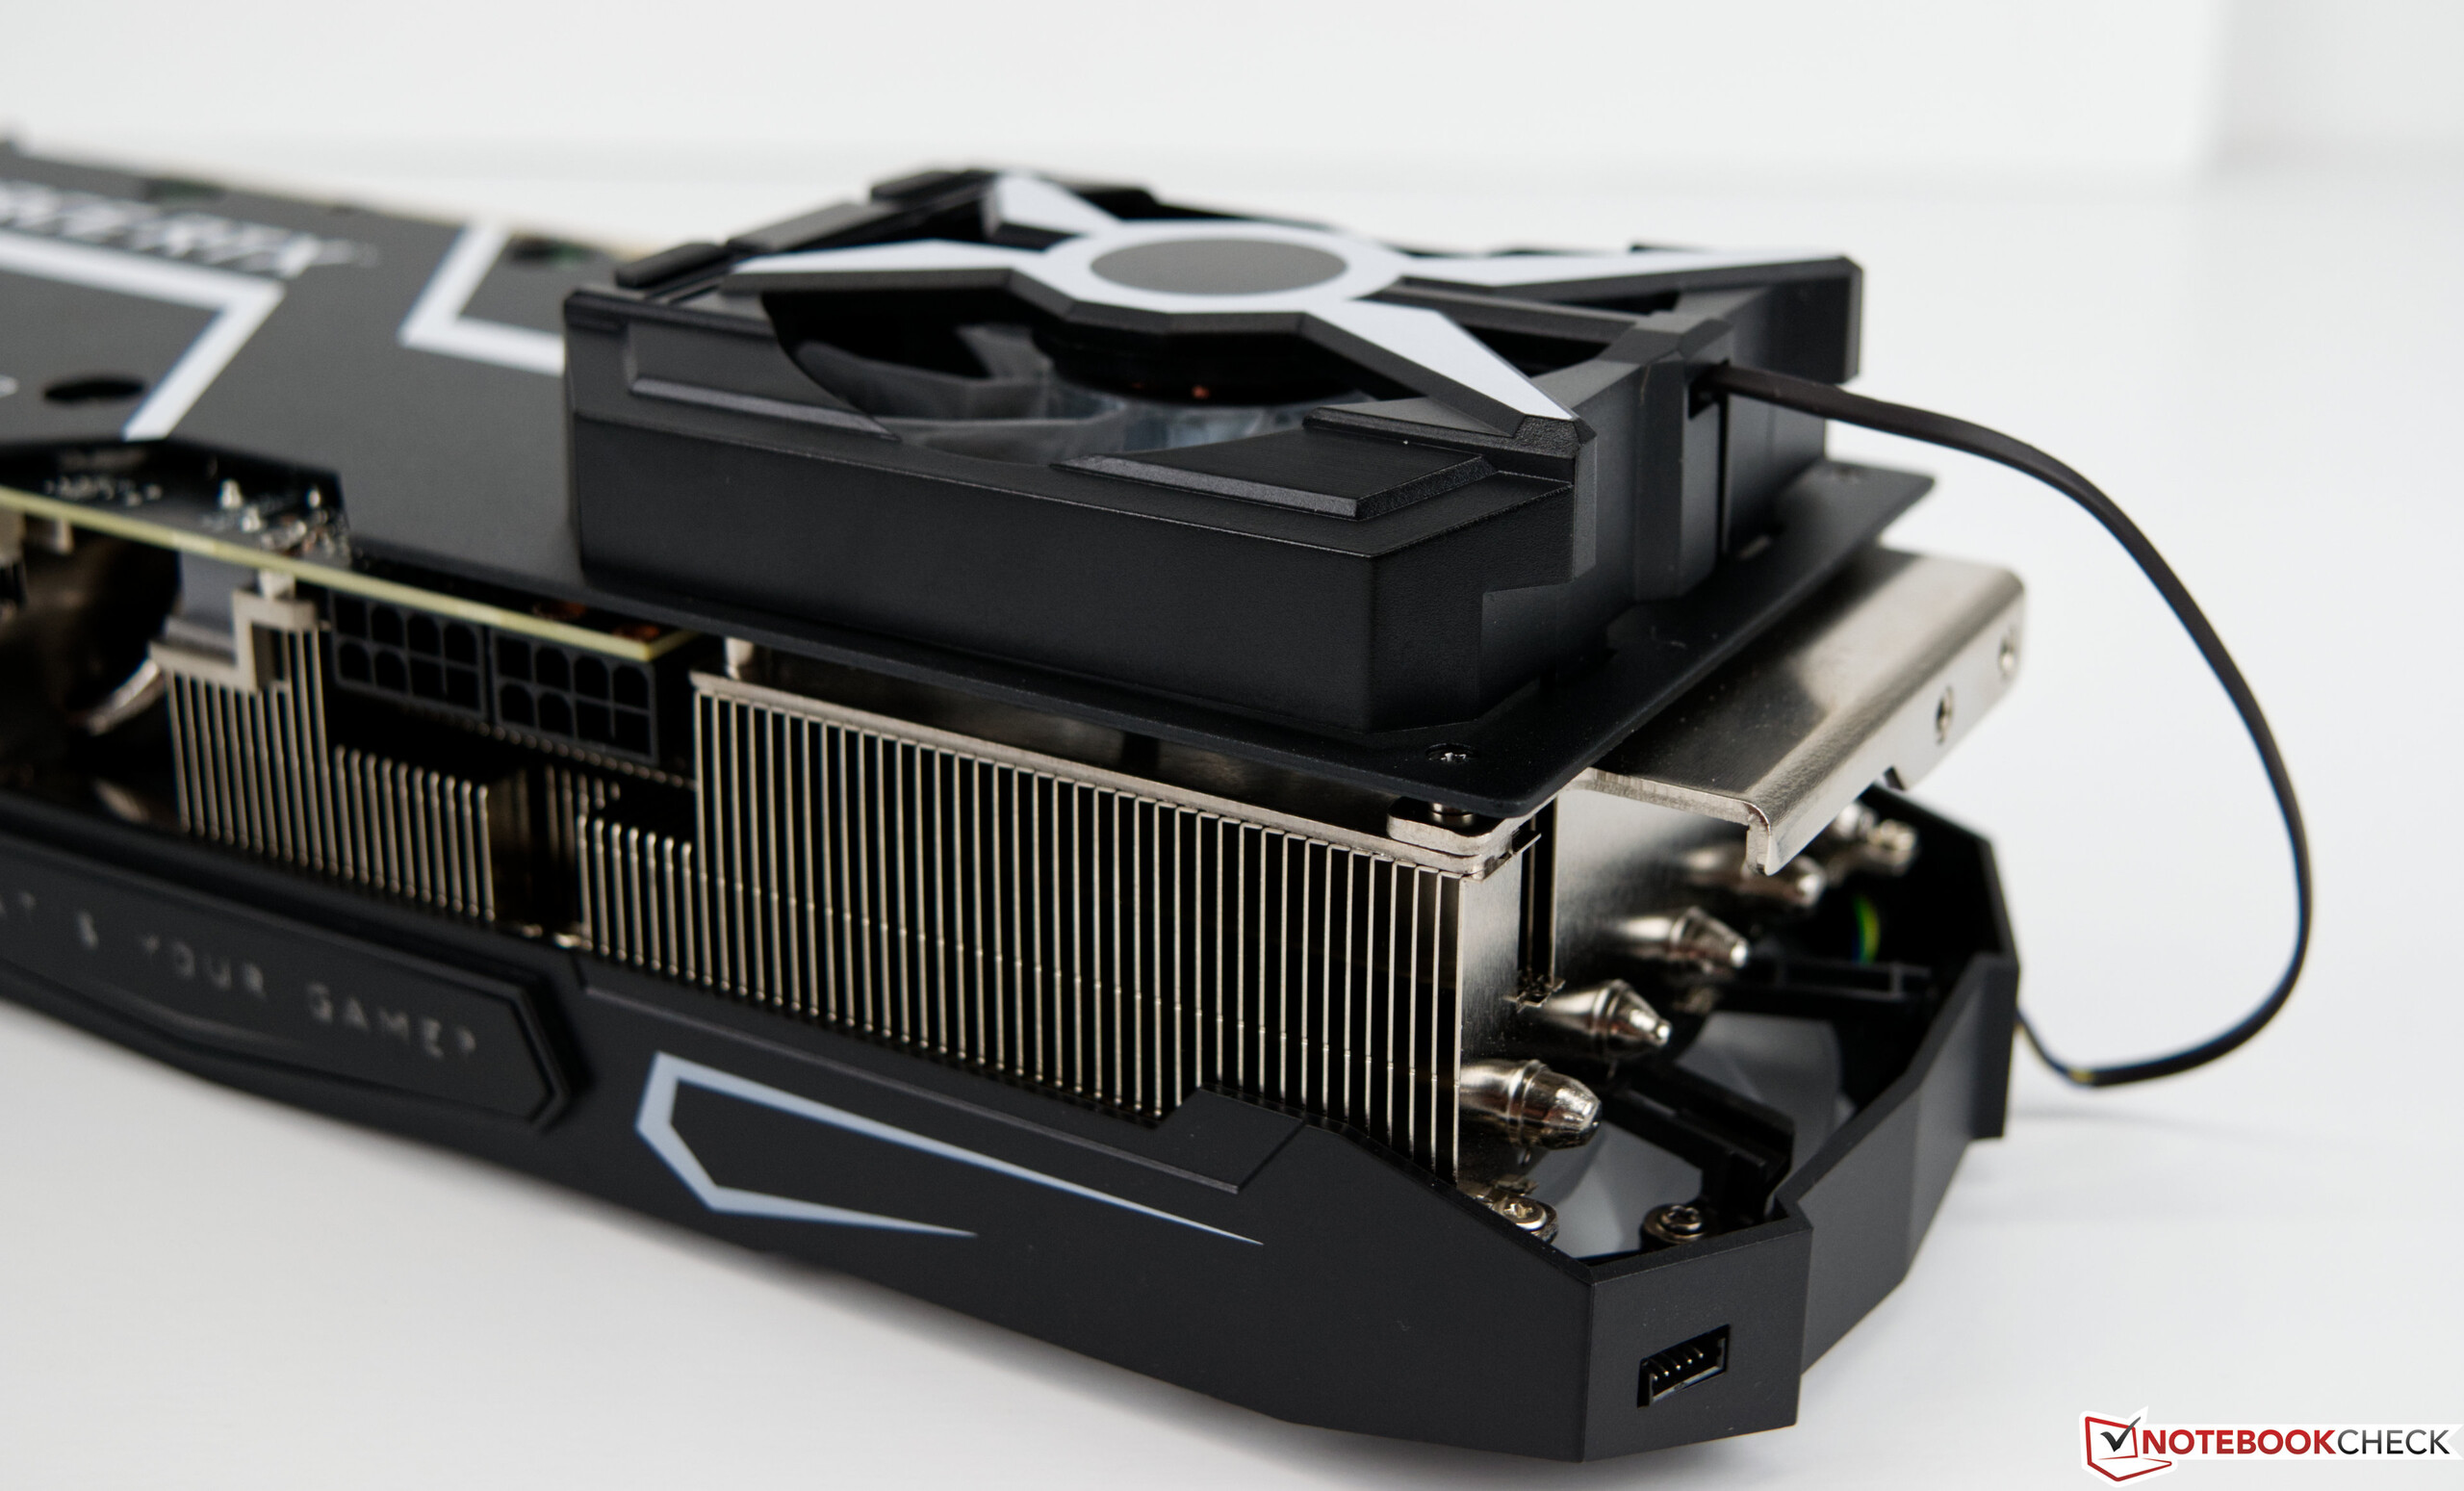
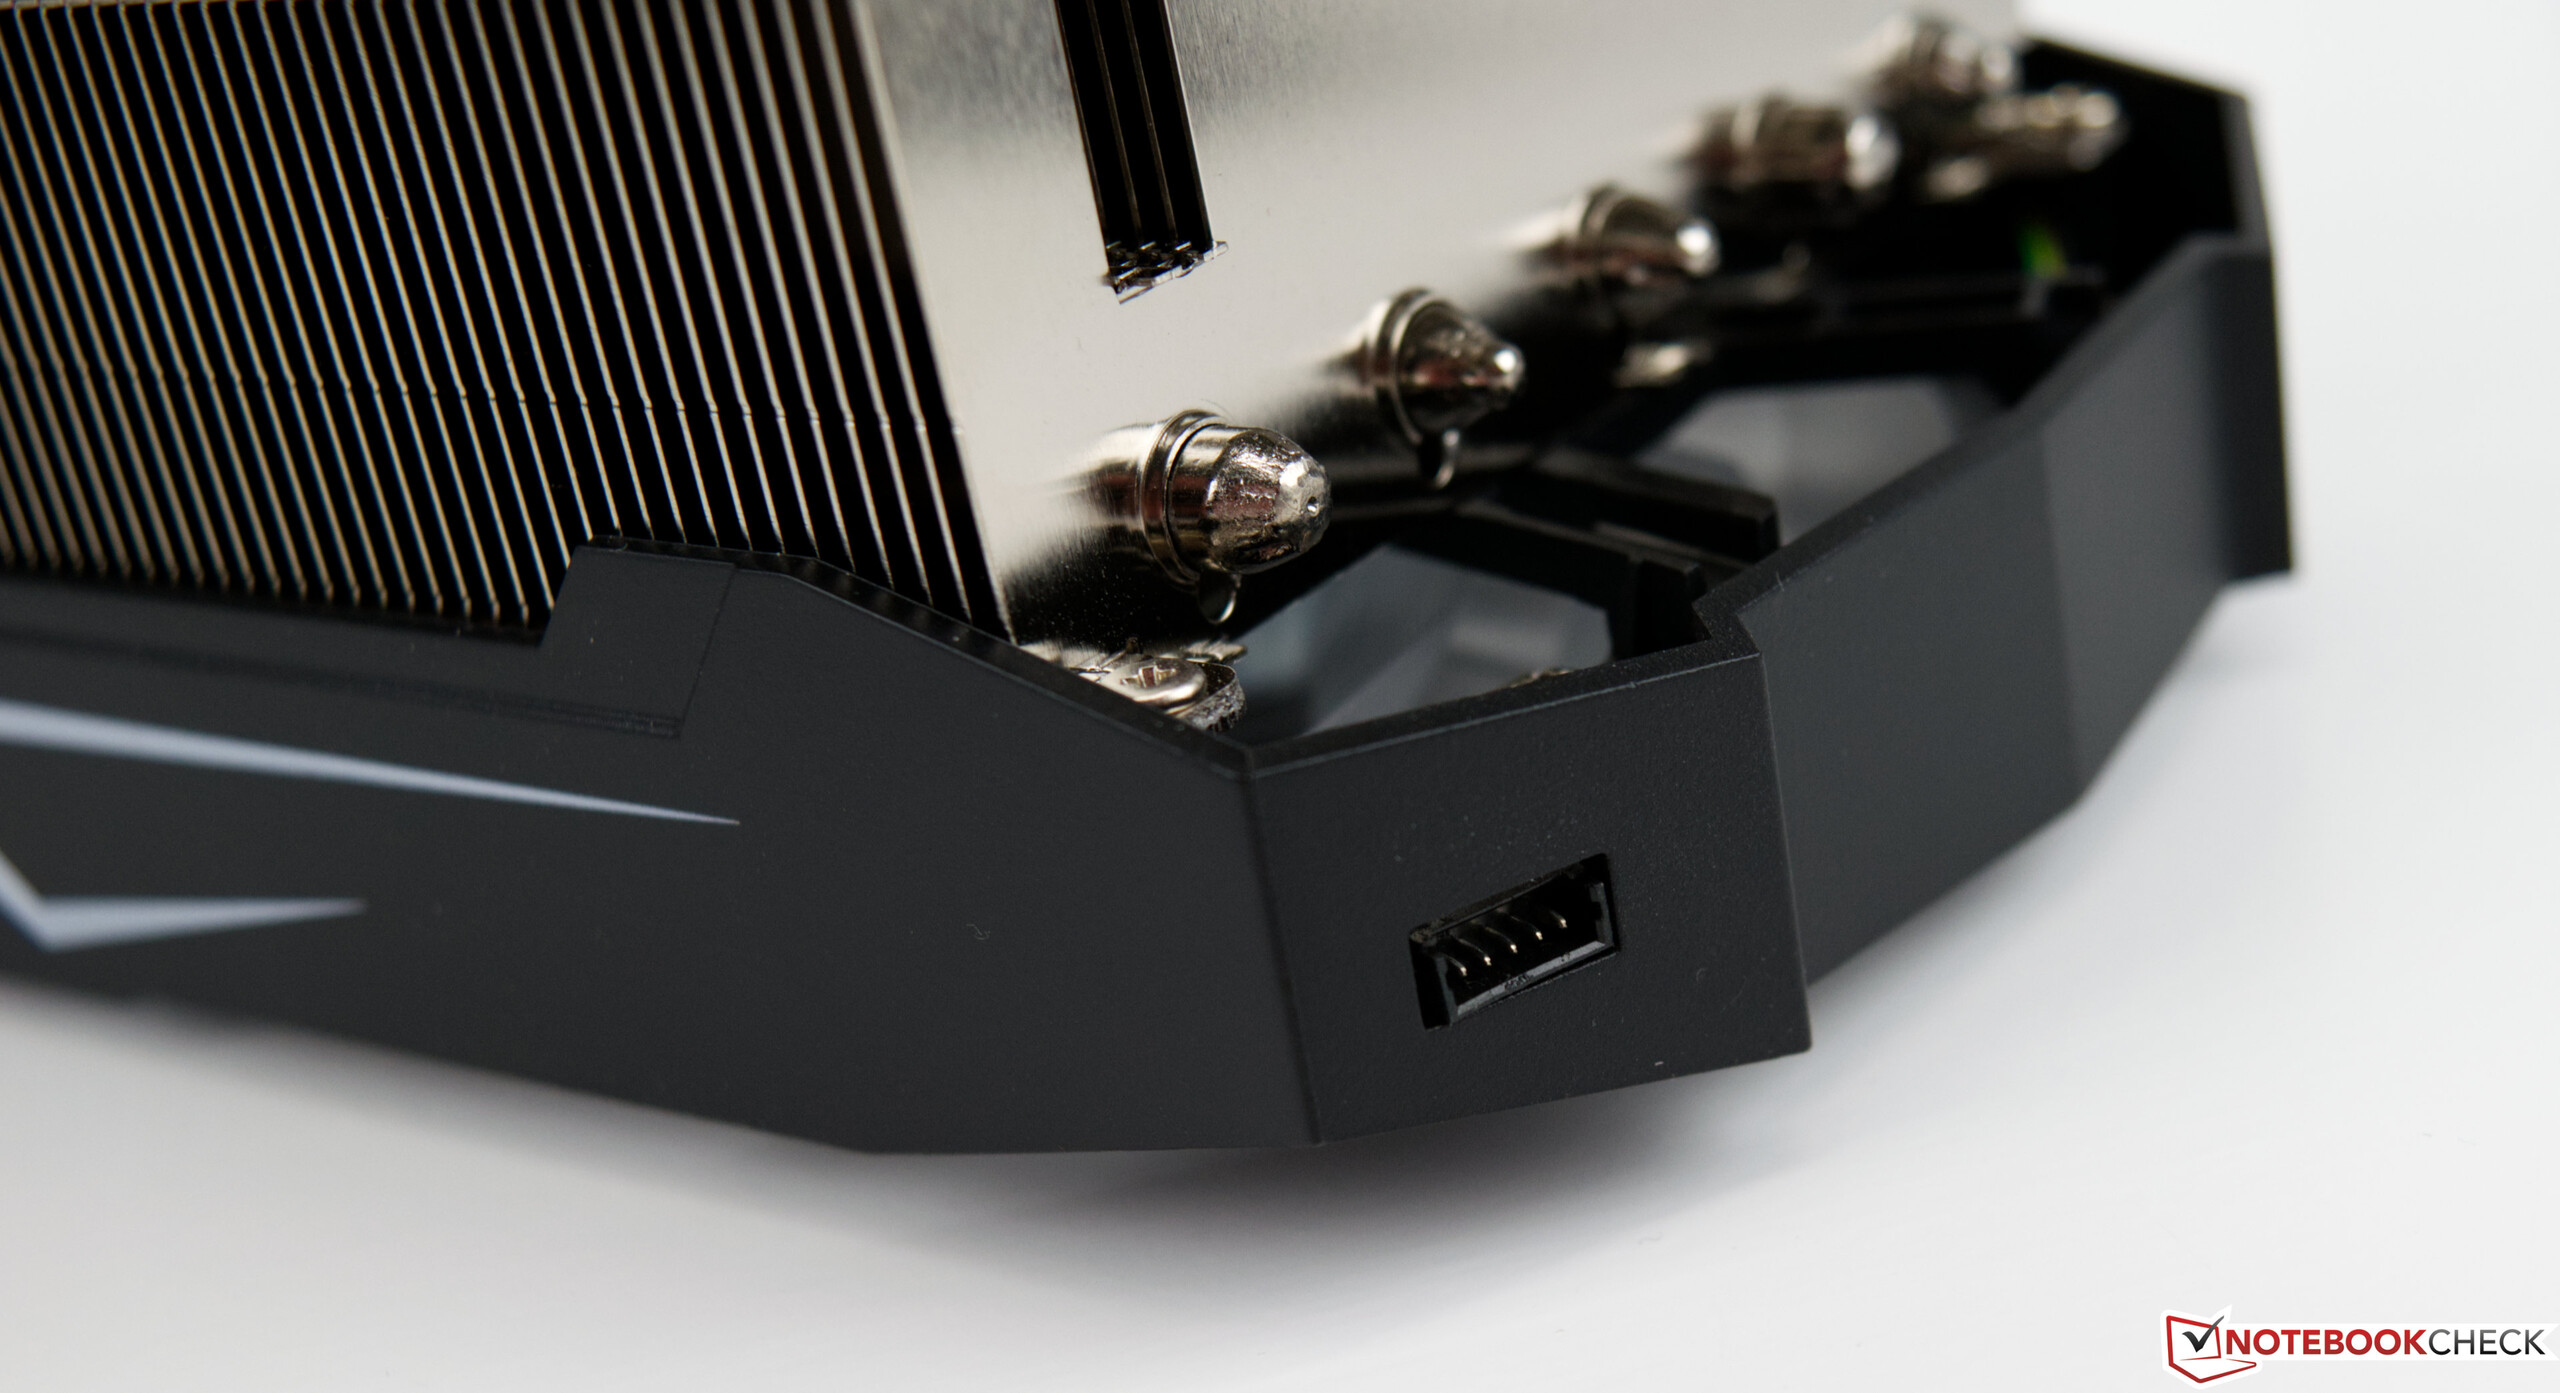
Please note that KFA2 includes an additional optional 80 mm fan, which can be mounted at the top of the card to provide extra cooling for the heat pipes along the rear of the card. Should you opt to install this fan you need to ensure proper spacing between the GPU and the RAM slots. Our particular test system was incompatible to this setup, and we were thus unable to mount the optional fan.

Power consumption entire system (idle)
Power consumption entire system (FurMark PT 100 %)
Power consumption entire system (The Witcher 3 Ultra)
Stress test FurMark (PT 100 %)
Power Consumption / The Witcher 3 ultra (external Monitor)
MSI GeForce RTX 3090 Suprim X
NVIDIA GeForce RTX 3090, R9 5900X, Intel Optane 905P 480GB 2.5 (Idle: 105.9 W)
597 (577min - 618max) Watt * -15%
KFA2 GeForce RTX 3080 SG
NVIDIA GeForce RTX 3080 12 GB, R9 5900X, Corsair MP600
518 (509min, 510P1 - 539max) Watt *
AMD Radeon RX 6800 XT
Radeon RX 6800 XT, R9 5950X, Intel Optane 905P 480GB 2.5 (Idle: 99.5 W)
505 (389min - 543max) Watt * +3%
MSI GeForce RTX 3080 Gaming X Trio
NVIDIA GeForce RTX 3080, R9 5900X, Intel Optane 905P 480GB 2.5 (Idle: 103 W)
498.3 (487min - 523max) Watt * +4%
AMD Radeon RX 6900 XT
Radeon RX 6900 XT, R9 5950X (Idle: 99.15 W)
488.3 (459.99min - 512.79max) Watt * +6%
AMD Radeon RX 6800
Radeon RX 6800, R9 5900X, Corsair MP600 (Idle: 81.4 W)
383 (372min, 376P1 - 389max) Watt * +26%
AMD Radeon RX 6700 XT
Radeon RX 6700 XT, R9 5900X, Corsair MP600 (Idle: 77.1 W)
369 (355min - 377max) Watt * +29%
MSI GeForce RTX 3070 Ventus 3X
NVIDIA GeForce RTX 3070, R9 5900X, Intel Optane 905P 480GB 2.5 (Idle: 91.46 W)
316.5 (309min - 329max) Watt * +39%
Inno3D GeForce RTX 3060 Twin X2
NVIDIA GeForce RTX 3060, R9 5900X, Corsair MP600 (Idle: 72 W)
307.5 (300min - 328max) Watt * +41%
AMD Radeon RX 6600 XT
Radeon RX 6600 XT, R9 5900X, Corsair MP600 (Idle: 52 W)
299 (291min, 295P1 - 331max) Watt * +42%
Power Consumption / FurMark 1.19 GPU Stress Test (external Monitor)
MSI GeForce RTX 3090 Suprim X
NVIDIA GeForce RTX 3090, R9 5900X, Intel Optane 905P 480GB 2.5 (Idle: 105.9 W)
551 (521min - 582max) Watt * -13%
MSI GeForce RTX 3080 Gaming X Trio
NVIDIA GeForce RTX 3080, R9 5900X, Intel Optane 905P 480GB 2.5 (Idle: 103 W)
492 (485min - 514max) Watt * -1%
KFA2 GeForce RTX 3080 SG
NVIDIA GeForce RTX 3080 12 GB, R9 5900X, Corsair MP600
487 (475min, 477P1 - 501max) Watt *
AMD Radeon RX 6900 XT
Radeon RX 6900 XT, R9 5950X (Idle: 99.15 W)
456.8 (378.13min - 484.67max) Watt * +6%
AMD Radeon RX 6800 XT
Radeon RX 6800 XT, R9 5950X, Intel Optane 905P 480GB 2.5 (Idle: 99.5 W)
447.9 (413min - 484max) Watt * +8%
AMD Radeon RX 6800
Radeon RX 6800, R9 5900X, Corsair MP600 (Idle: 81.4 W)
363 (337min, 347P1 - 379max) Watt * +25%
MSI GeForce RTX 3070 Ventus 3X
NVIDIA GeForce RTX 3070, R9 5900X, Intel Optane 905P 480GB 2.5 (Idle: 91.46 W)
336.6 (330min - 365max) Watt * +31%
AMD Radeon RX 6700 XT
Radeon RX 6700 XT, R9 5900X, Corsair MP600 (Idle: 77.1 W)
335.2 (317min - 376max) Watt * +31%
Inno3D GeForce RTX 3060 Twin X2
NVIDIA GeForce RTX 3060, R9 5900X, Corsair MP600 (Idle: 72 W)
302.1 (297min - 322max) Watt * +38%
AMD Radeon RX 6600 XT
Radeon RX 6600 XT, R9 5900X, Corsair MP600 (Idle: 52 W)
281 (257min, 274P1 - 319max) Watt * +42%

* ... smaller is better

Power Consumption
Idledarkmidlight 77 / 88 / 106 Watt
Load midlight 486 / 501 Watt
 color bar
Key: min: dark, med: mid, max: light        Metrahit Energy
Currently we use the Metrahit Energy, a professional single phase power quality and energy measurement digital multimeter, for our measurements. Find out more about it here. All of our test methods can be found here.

Power Consumption (computer without display)

0306090120150180210240270300330360390420450480510Tooltip
KFA2 GeForce RTX 3080 SG; 1280x720 FurMark 1.19 GPU Stress Test (external Monitor): Ø487 (475-501)
KFA2 GeForce RTX 3080 SG; 1920x1080 The Witcher 3 ultra (external Monitor): Ø518 (509-539)
KFA2 GeForce RTX 3080 SG; Idle 1min (external Monitor): Ø88.3 (77.7-106.9)

Pros

+ very good performance
+ 4K gaming-compatible
+ powerful cooler
+ relatively quiet under load
+ Raytracing + DLSS
+ fan stop mode
+ great RGB lights
+ optional fan and support brackets included

Cons

- very high power consumption
- mainboard may not be compatible with additional fan installed

Verdict – A Better Nvidia GeForce RTX 3080

In review: KFA2 GeForce RTX 3080 SG 12GB. Review unit provided by KFA2

The Nvidia GeForce RTX 3080 12 GB is the RTX 3080 chip that many have asked for since the chip was first introduced, and it took Nvidia 1.5 years to listen and realize that there was in fact a market for a 12 GB variant of its RTX 3080. Only time will tell whether or not it came too late considering that the next generation of GPUs, the RTX 4000-series, is supposedly ready to launch anytime soon. Accordingly, current high-end GPUs are a hard sale, especially that most gamers that wanted an RTX 3000-series GPU already bought one and upgrades within the 3000-series are not necessarily advisable and worth it.

The KFA2 GeForce RTX 3080 SG 12 GB performed very well overall in our benchmarks. However, this was only true for its raw performance. It consistently outperformed a regular GeForce RTX 3080 and performed slightly worse than a GeForce RTX 3090.

Its power consumption, on the other hand, was enormous. We should note though that this is not KFA2’s fault as other board partners will produce similar designs with identical power consumption. We liked the graphics card’s cooler, although you have to keep in mind that this triple-slot design takes up a significant amount of space and may not be compatible with your mainboard.

The KFA2 GeForce RTX 3080 SG 12 GB is a better GeForce RTX 3080 and features reliable cooling and great RGB lights.

If you are in the market for a new GPU the KFA2 GeForce RTX 3080 SG 12 GB might be worth a closer look as it is the better choice over the regular RTX 3080 thanks to its 12 GB of VRAM. Prices start at around $1,200 right now, and comparable cards made by GigabyteZotacAsus, or MSI are not any cheaper.

More benchmarks and test results for the RTX 3080 12 GB can be found on our GeForce RTX 3080 12 GB page.

static version load dynamic
Loading comments
Comment on this article
Please share our article, every link counts!
> Expert Reviews and News on Laptops, Smartphones and Tech Innovations > Reviews > KFA2 GeForce RTX 3080 SG 12GB Desktop Graphics Card Review: A Better RTX 3080 thanks to more VRAM and more Shaders?
Sebastian Bade, 2022-06-15 (Update: 2022-06-15)