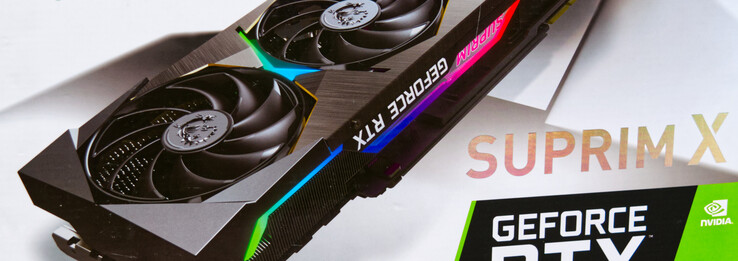
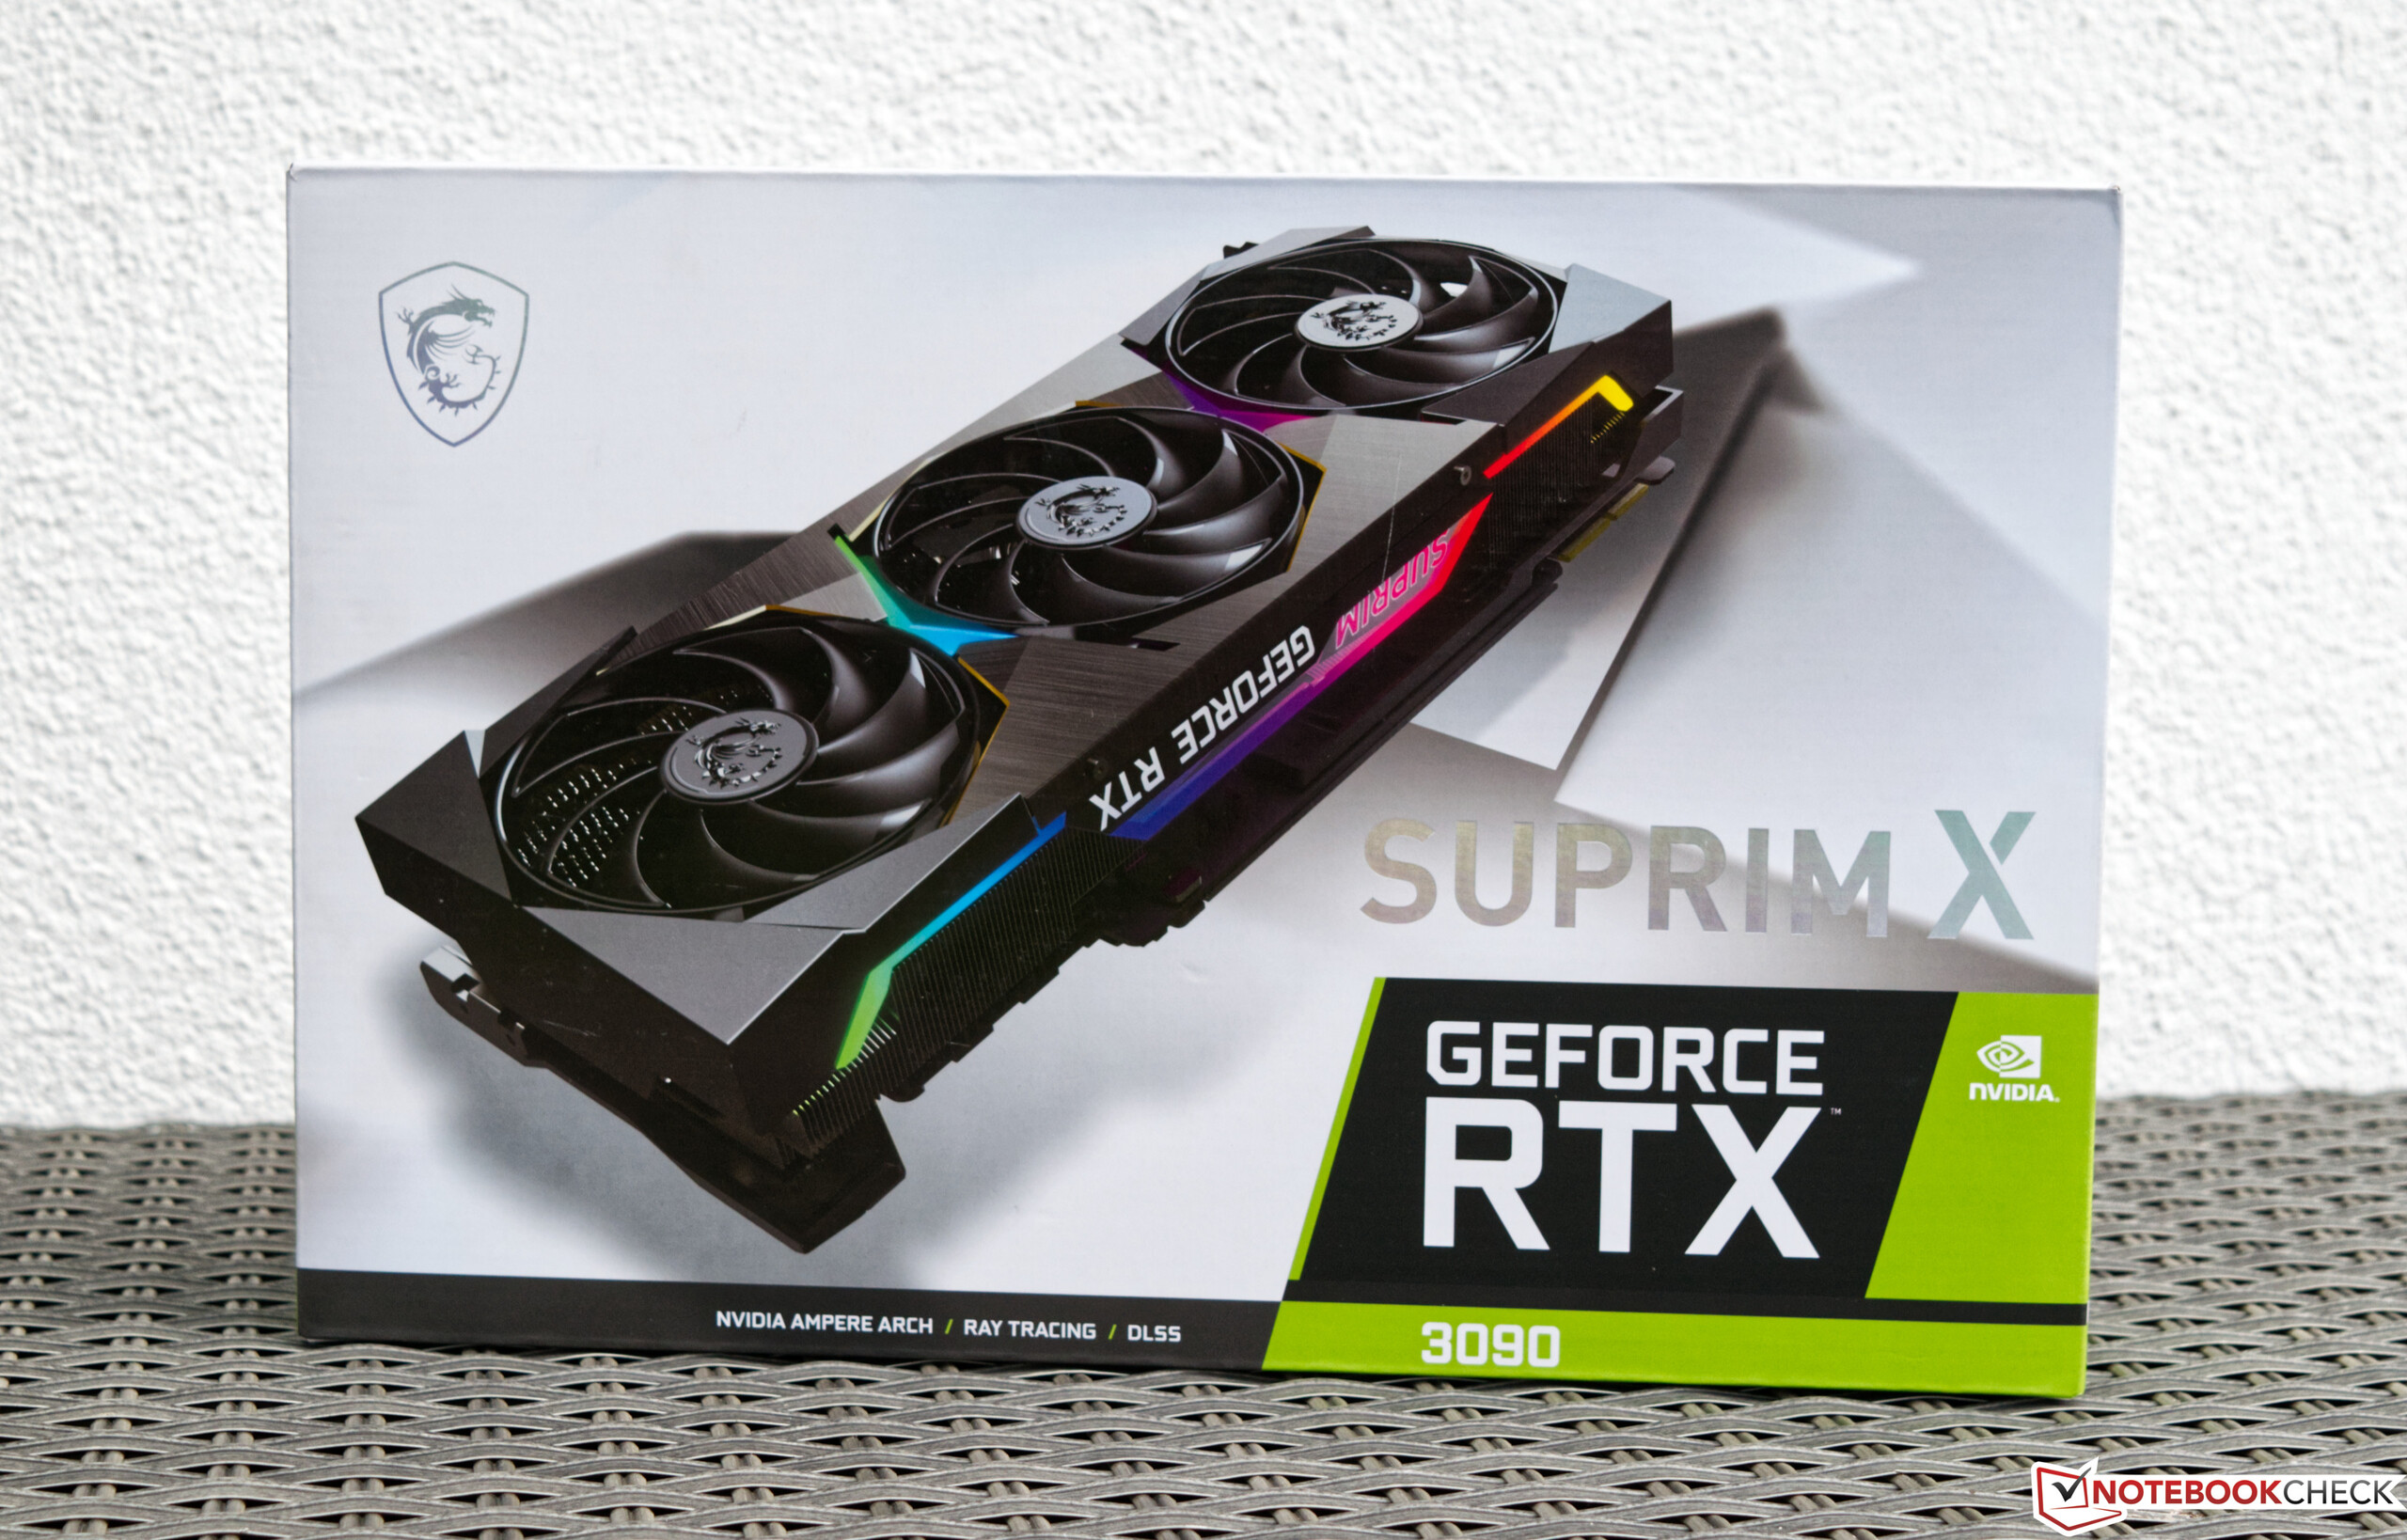
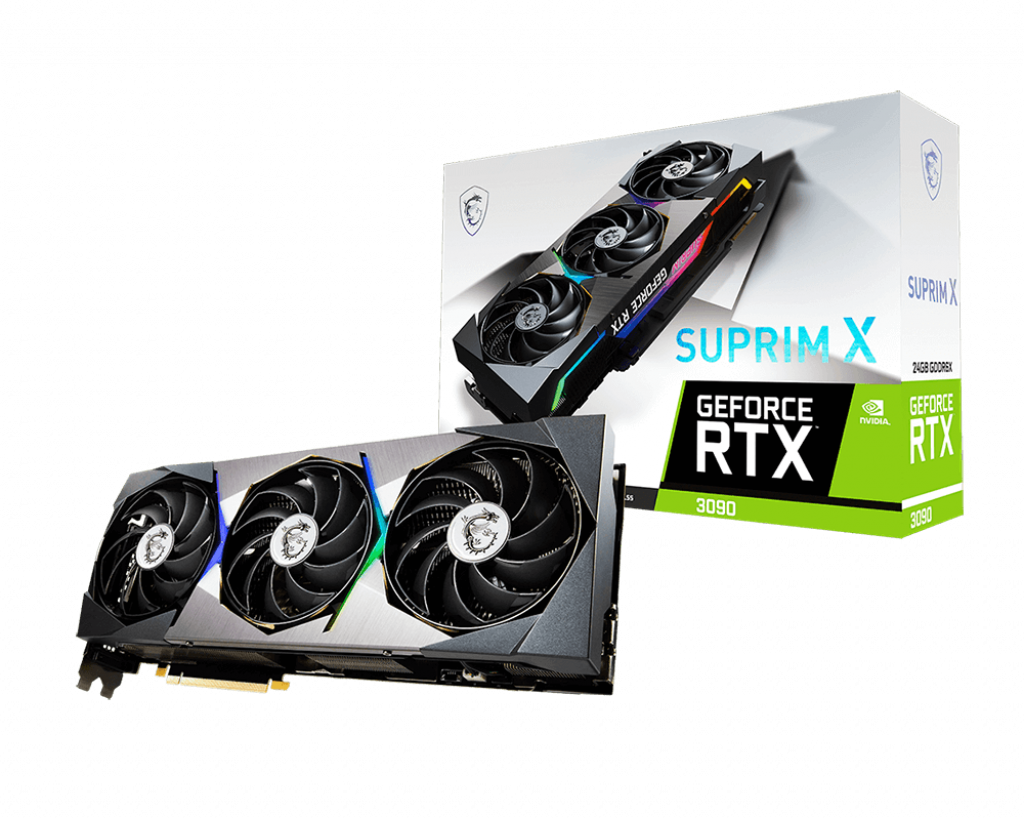
GeForce RTX 3090 Suprim X in review - MSI's new high-end graphics card series

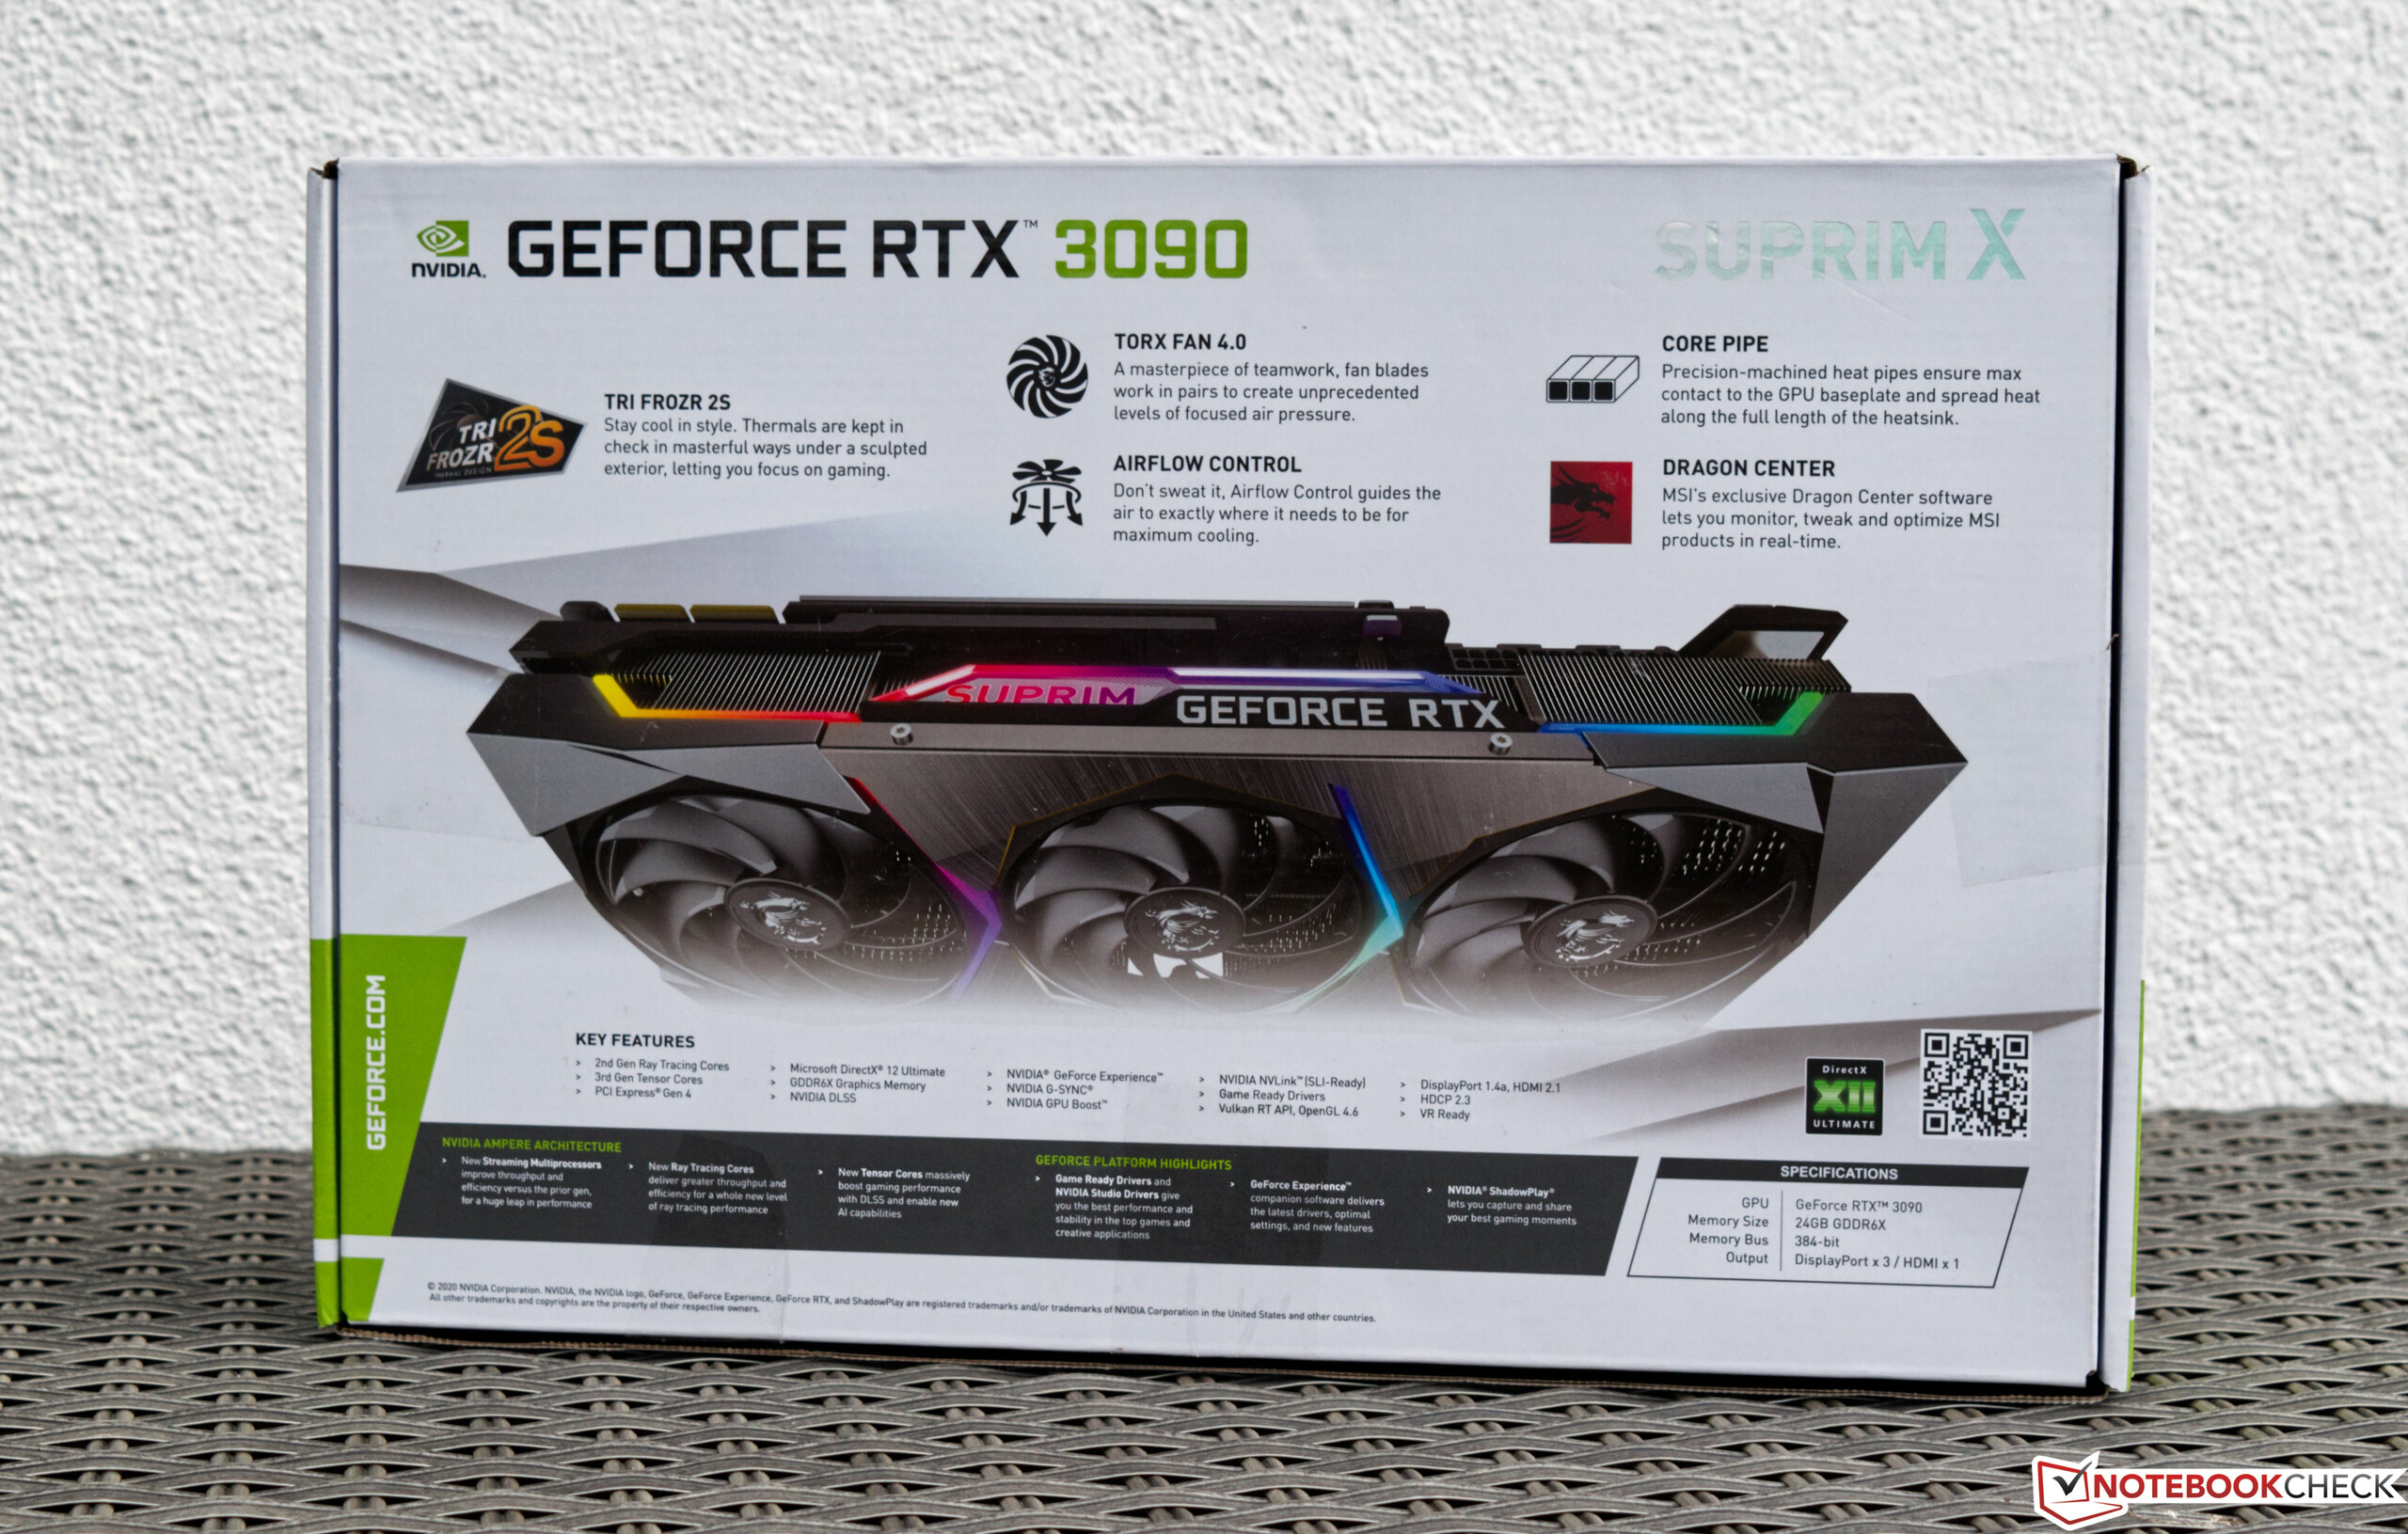
Until now, the Gaming X Trio was the part of MSI's portfolio that was intended for special high-end models. In recent years, there were also Lightning Z models every now and then, which offered even more performance due to selected components and special adjustments. Now, MSI introduces a new division in the high-end sector with the Suprim X models. MSI offers RTX 3070, 3080, and 3090 models of the new Ampere graphics cards under this name. At the same time, there's still the Gaming X Trio models, which have to make do with slightly less performance, because the Suprim X models offer a BIOS with a higher TDP.
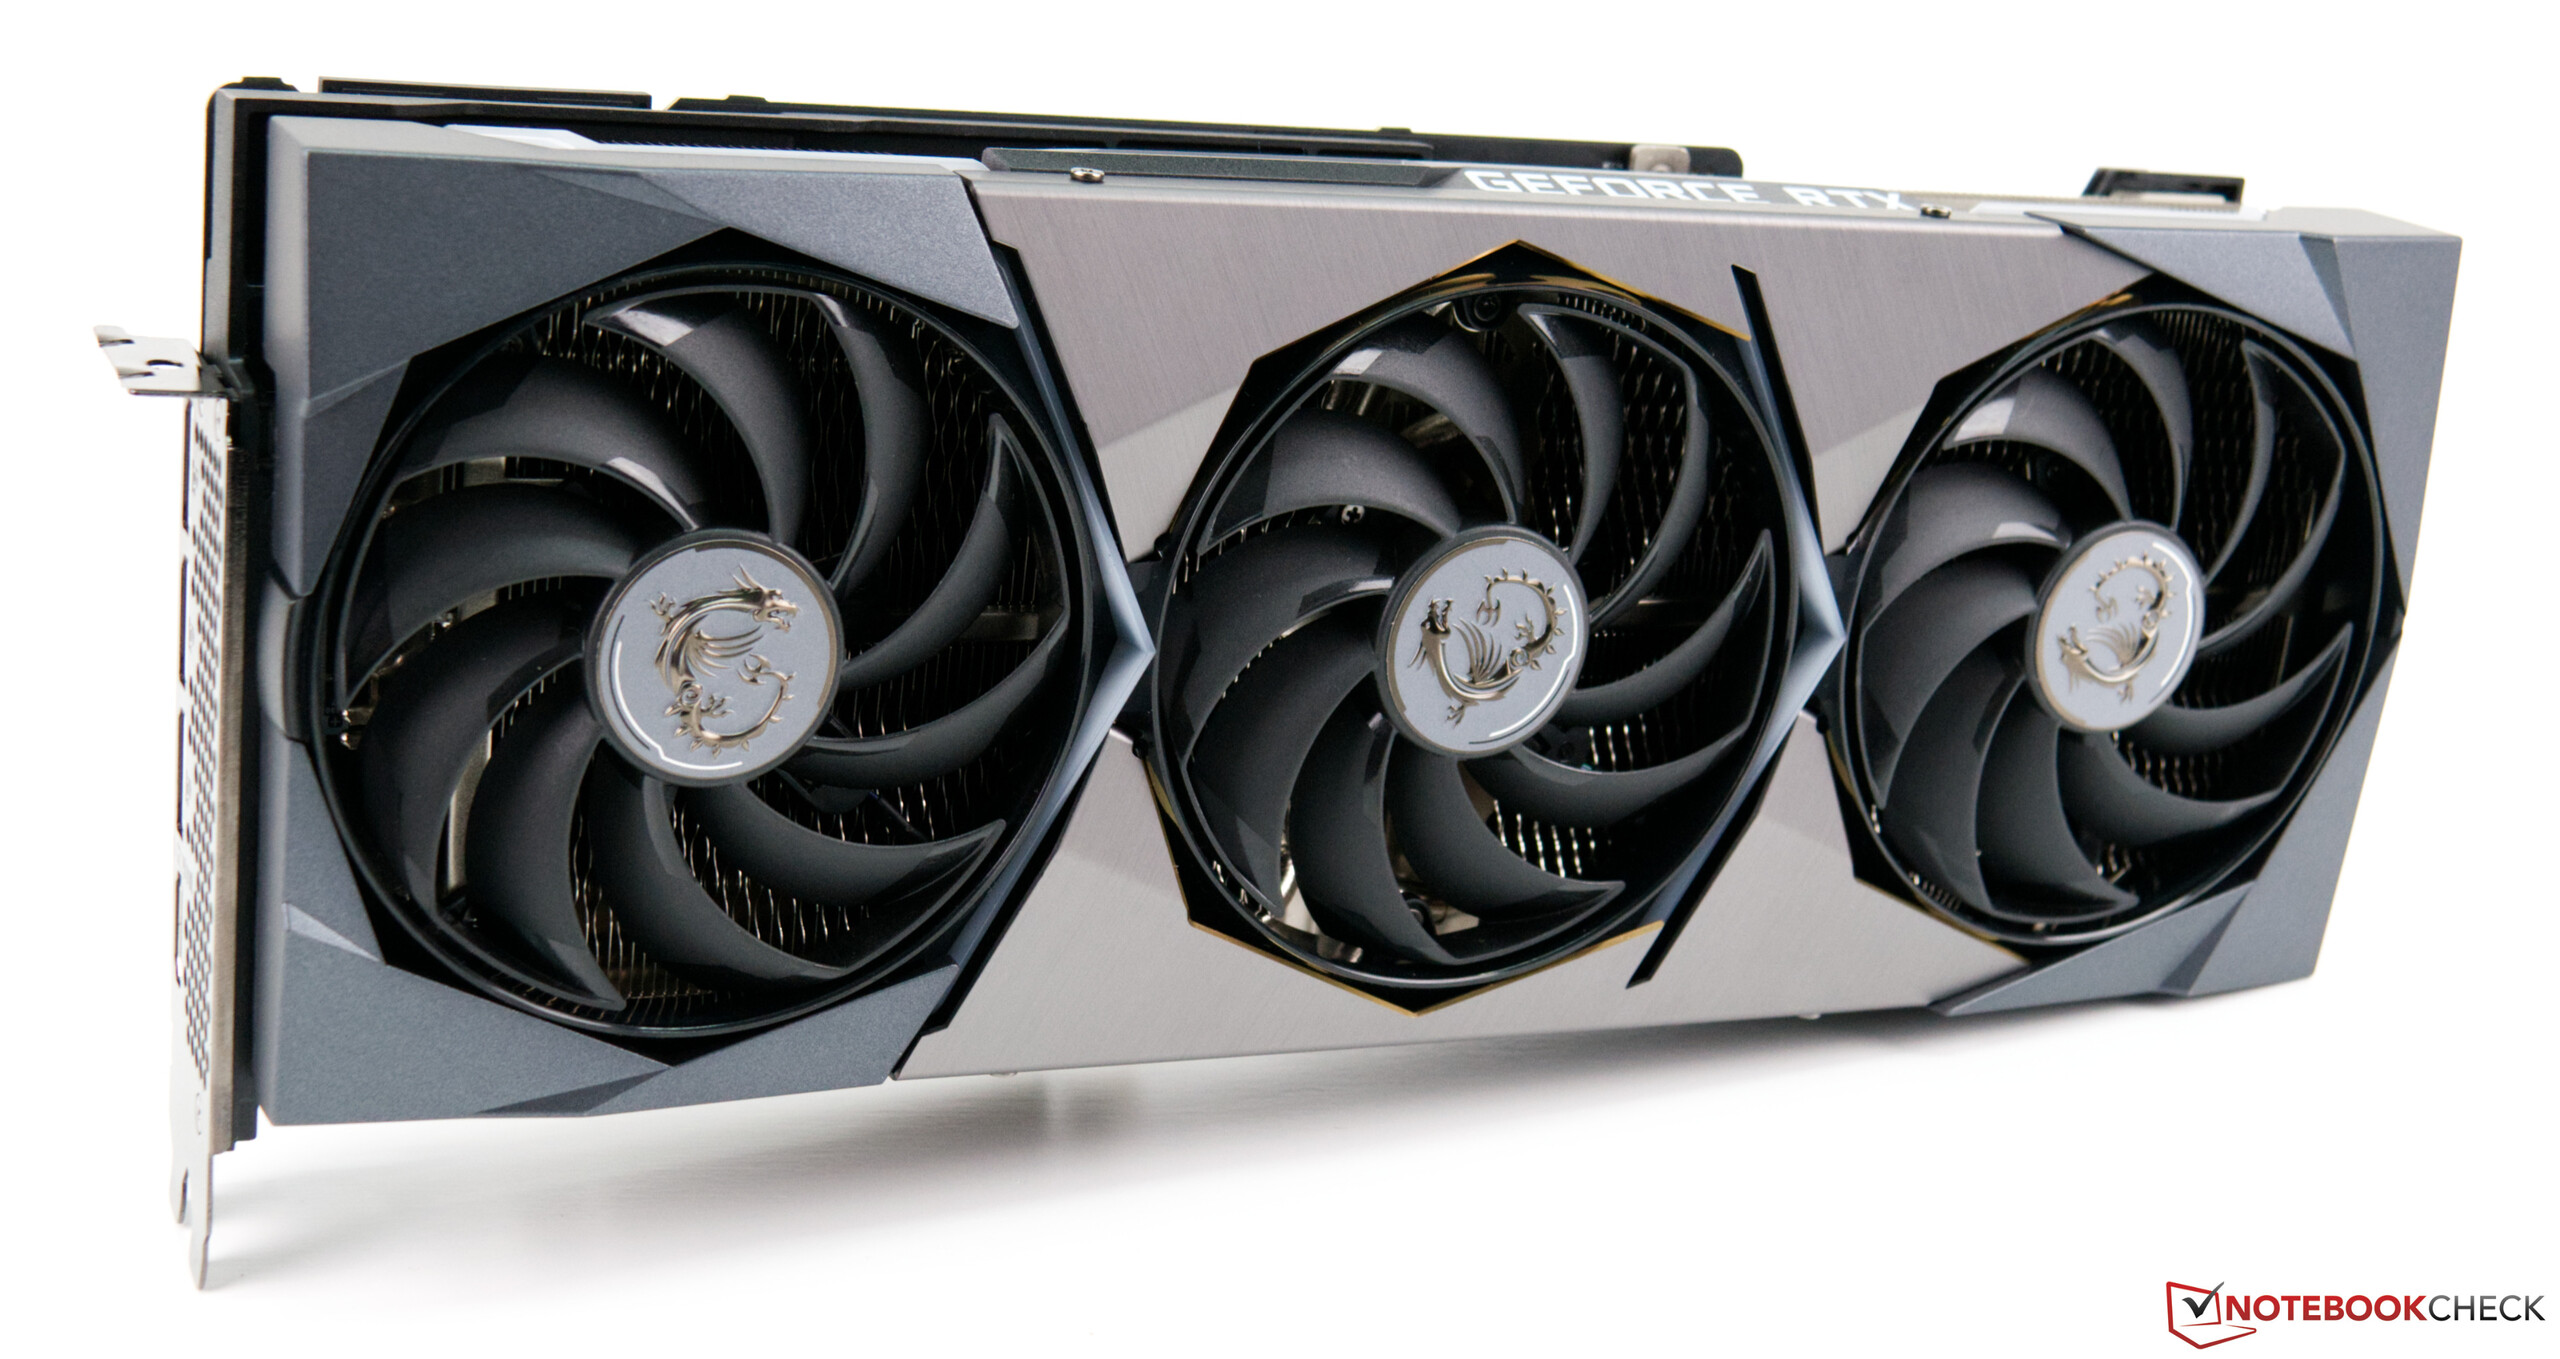
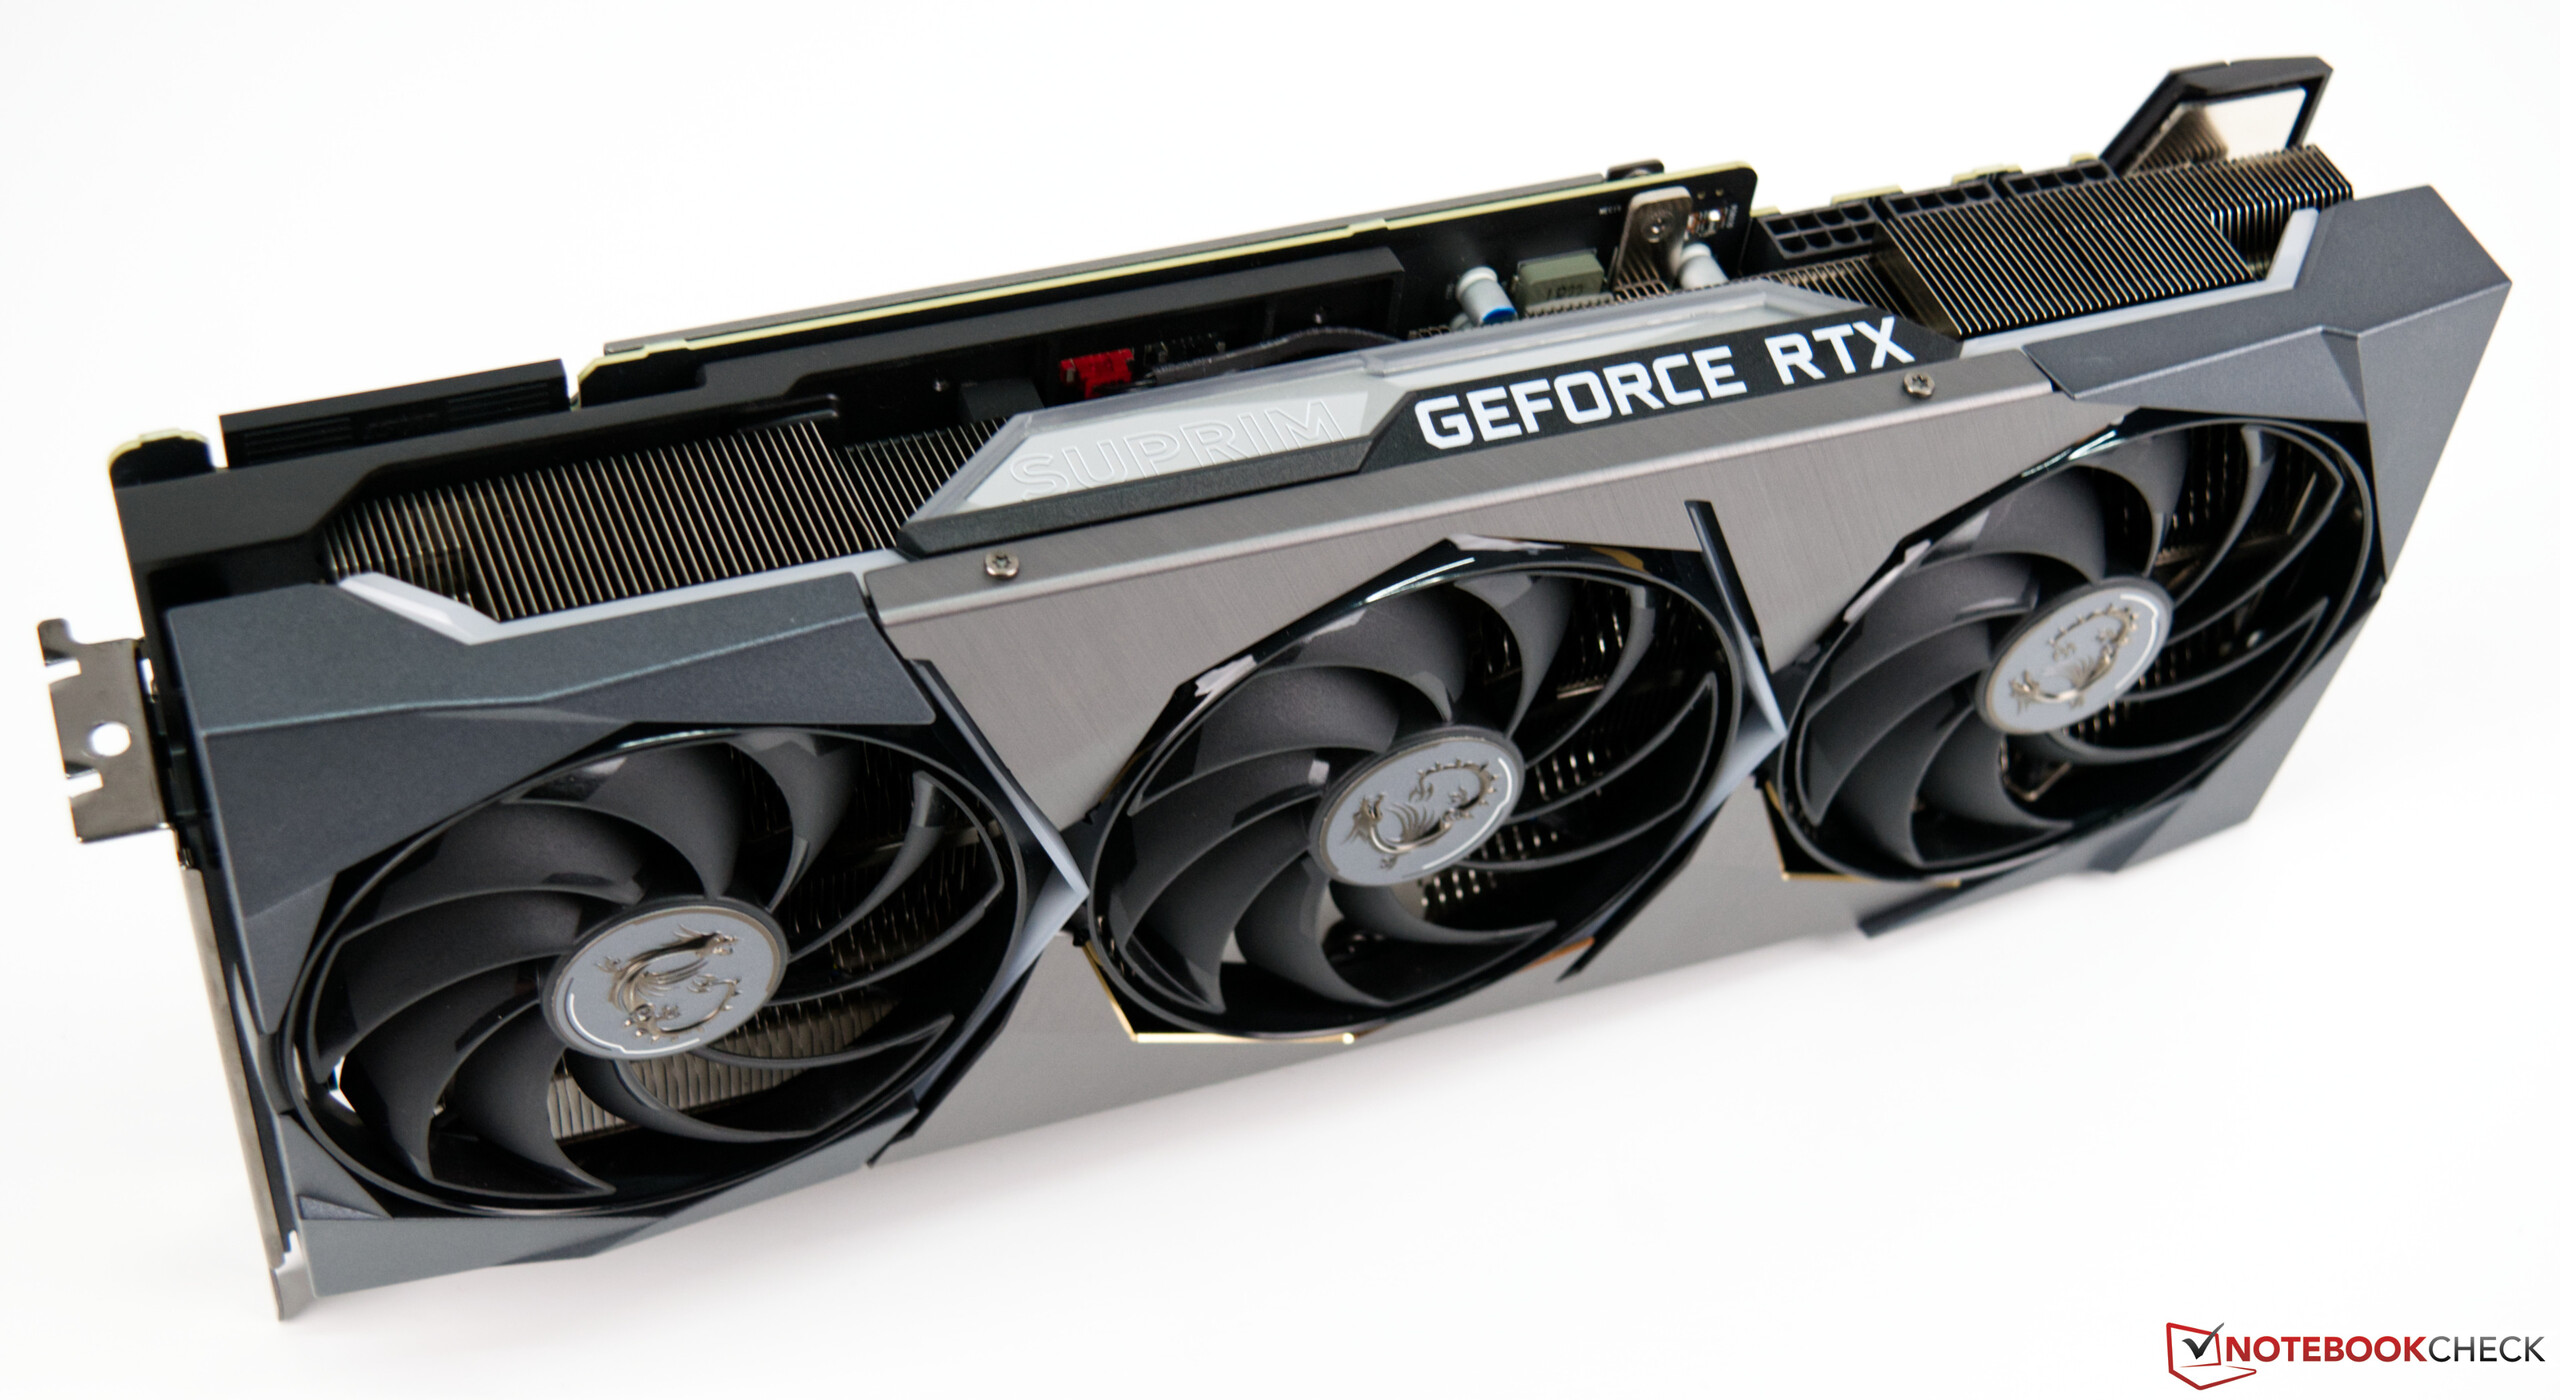
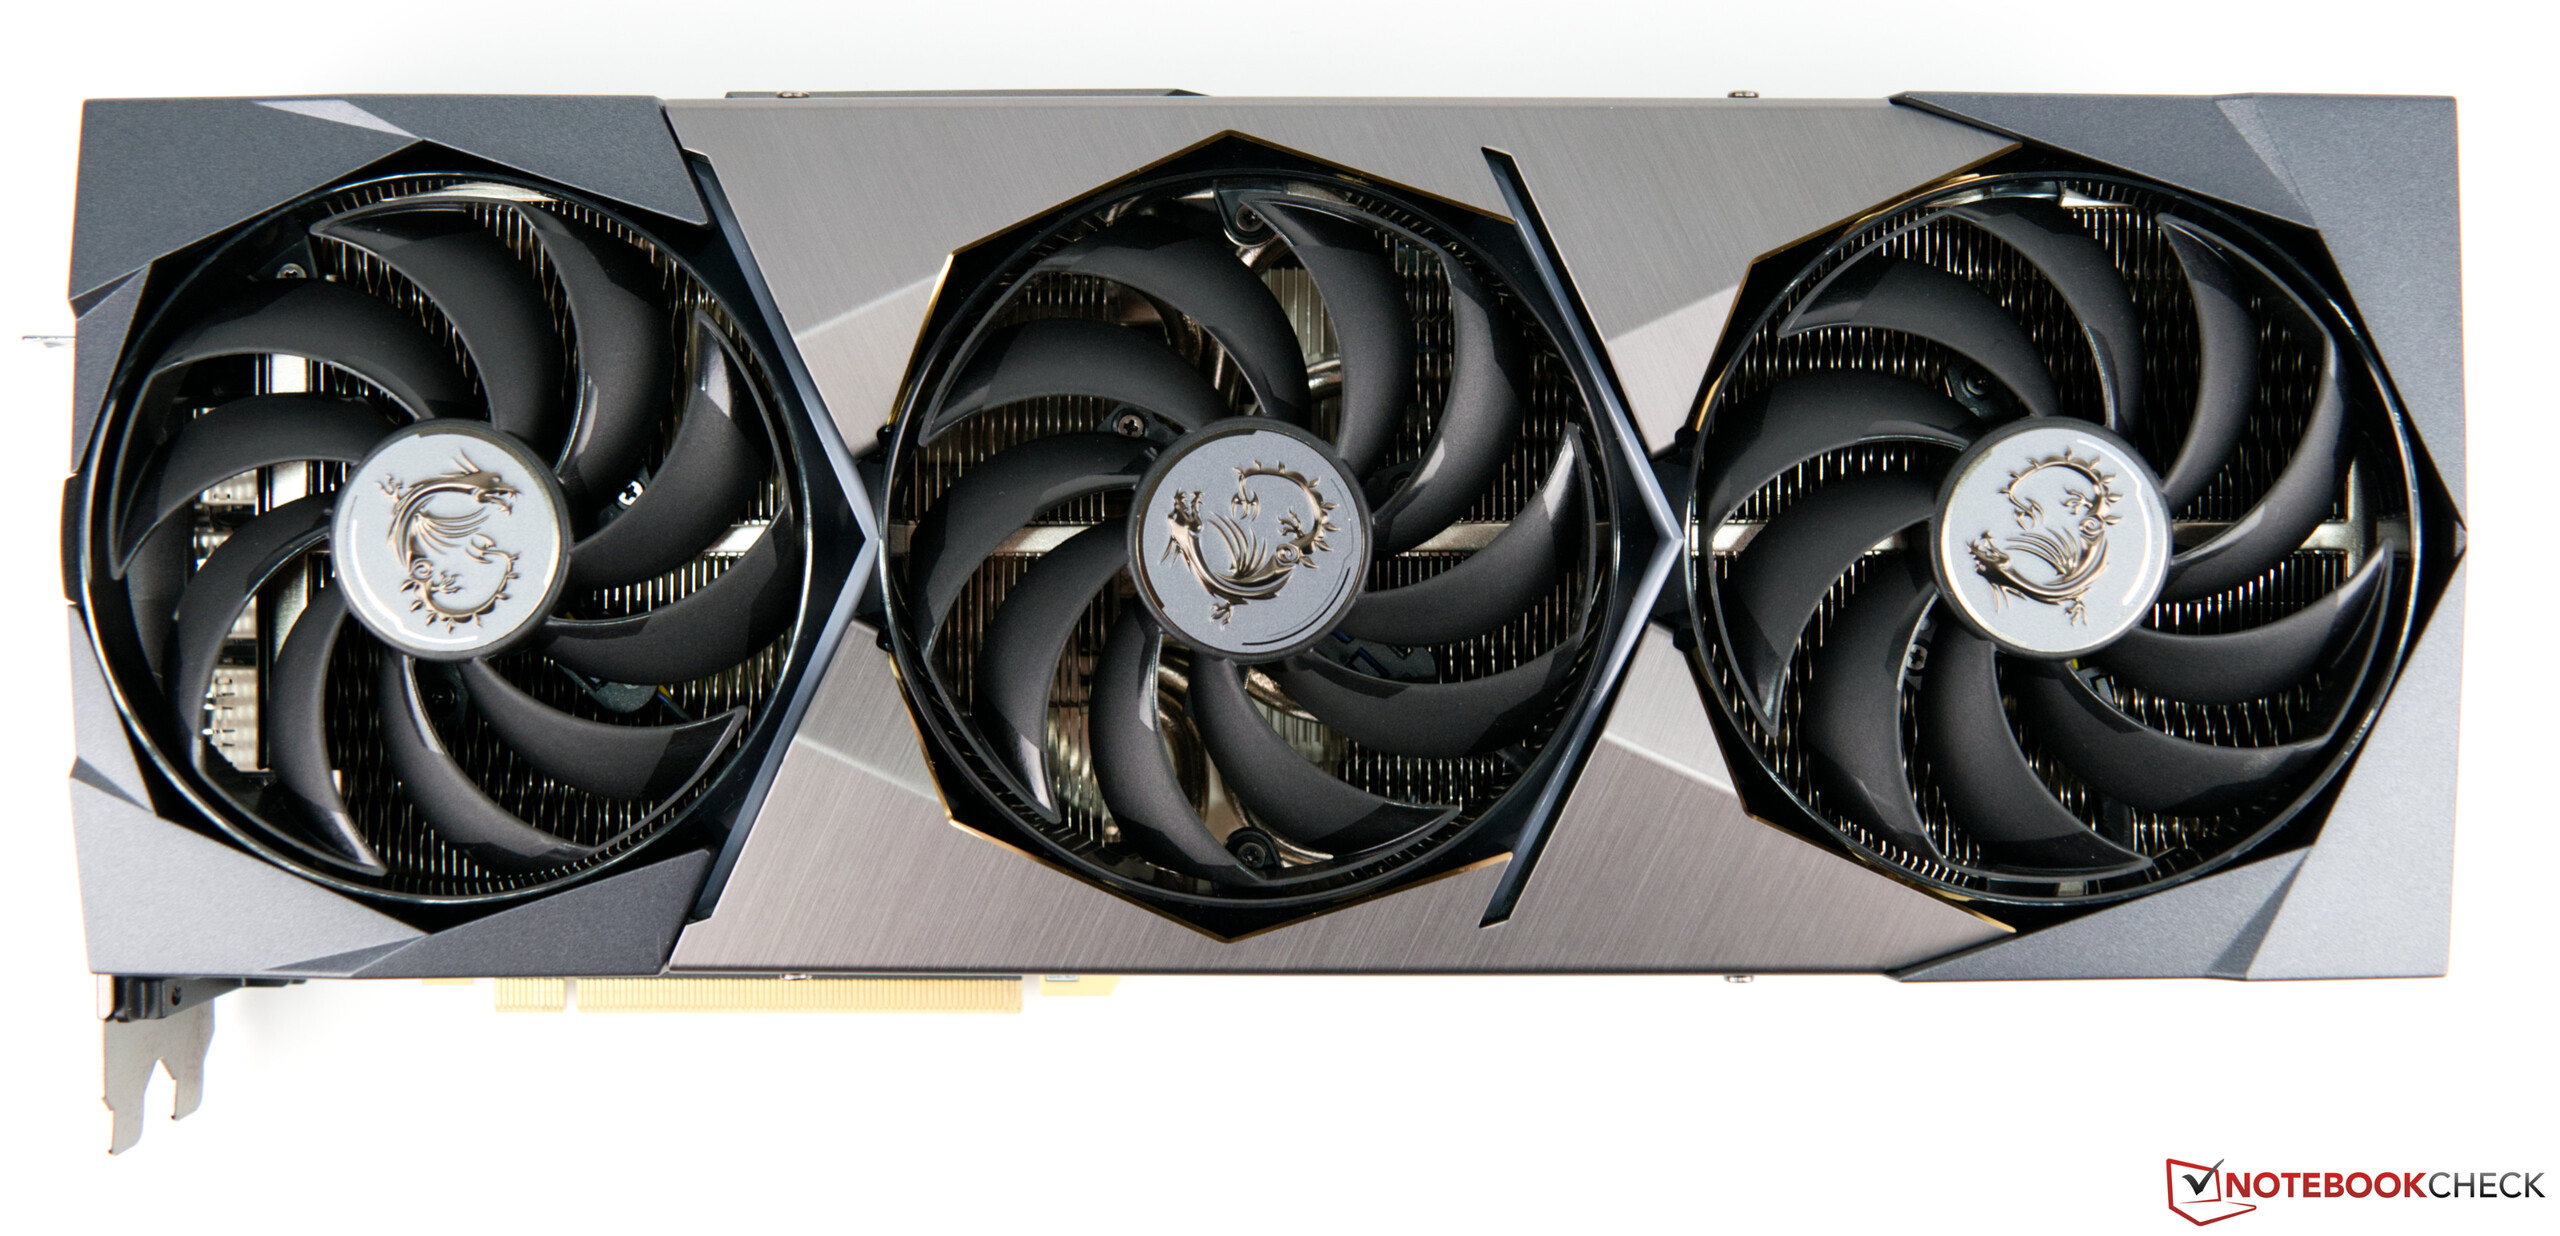
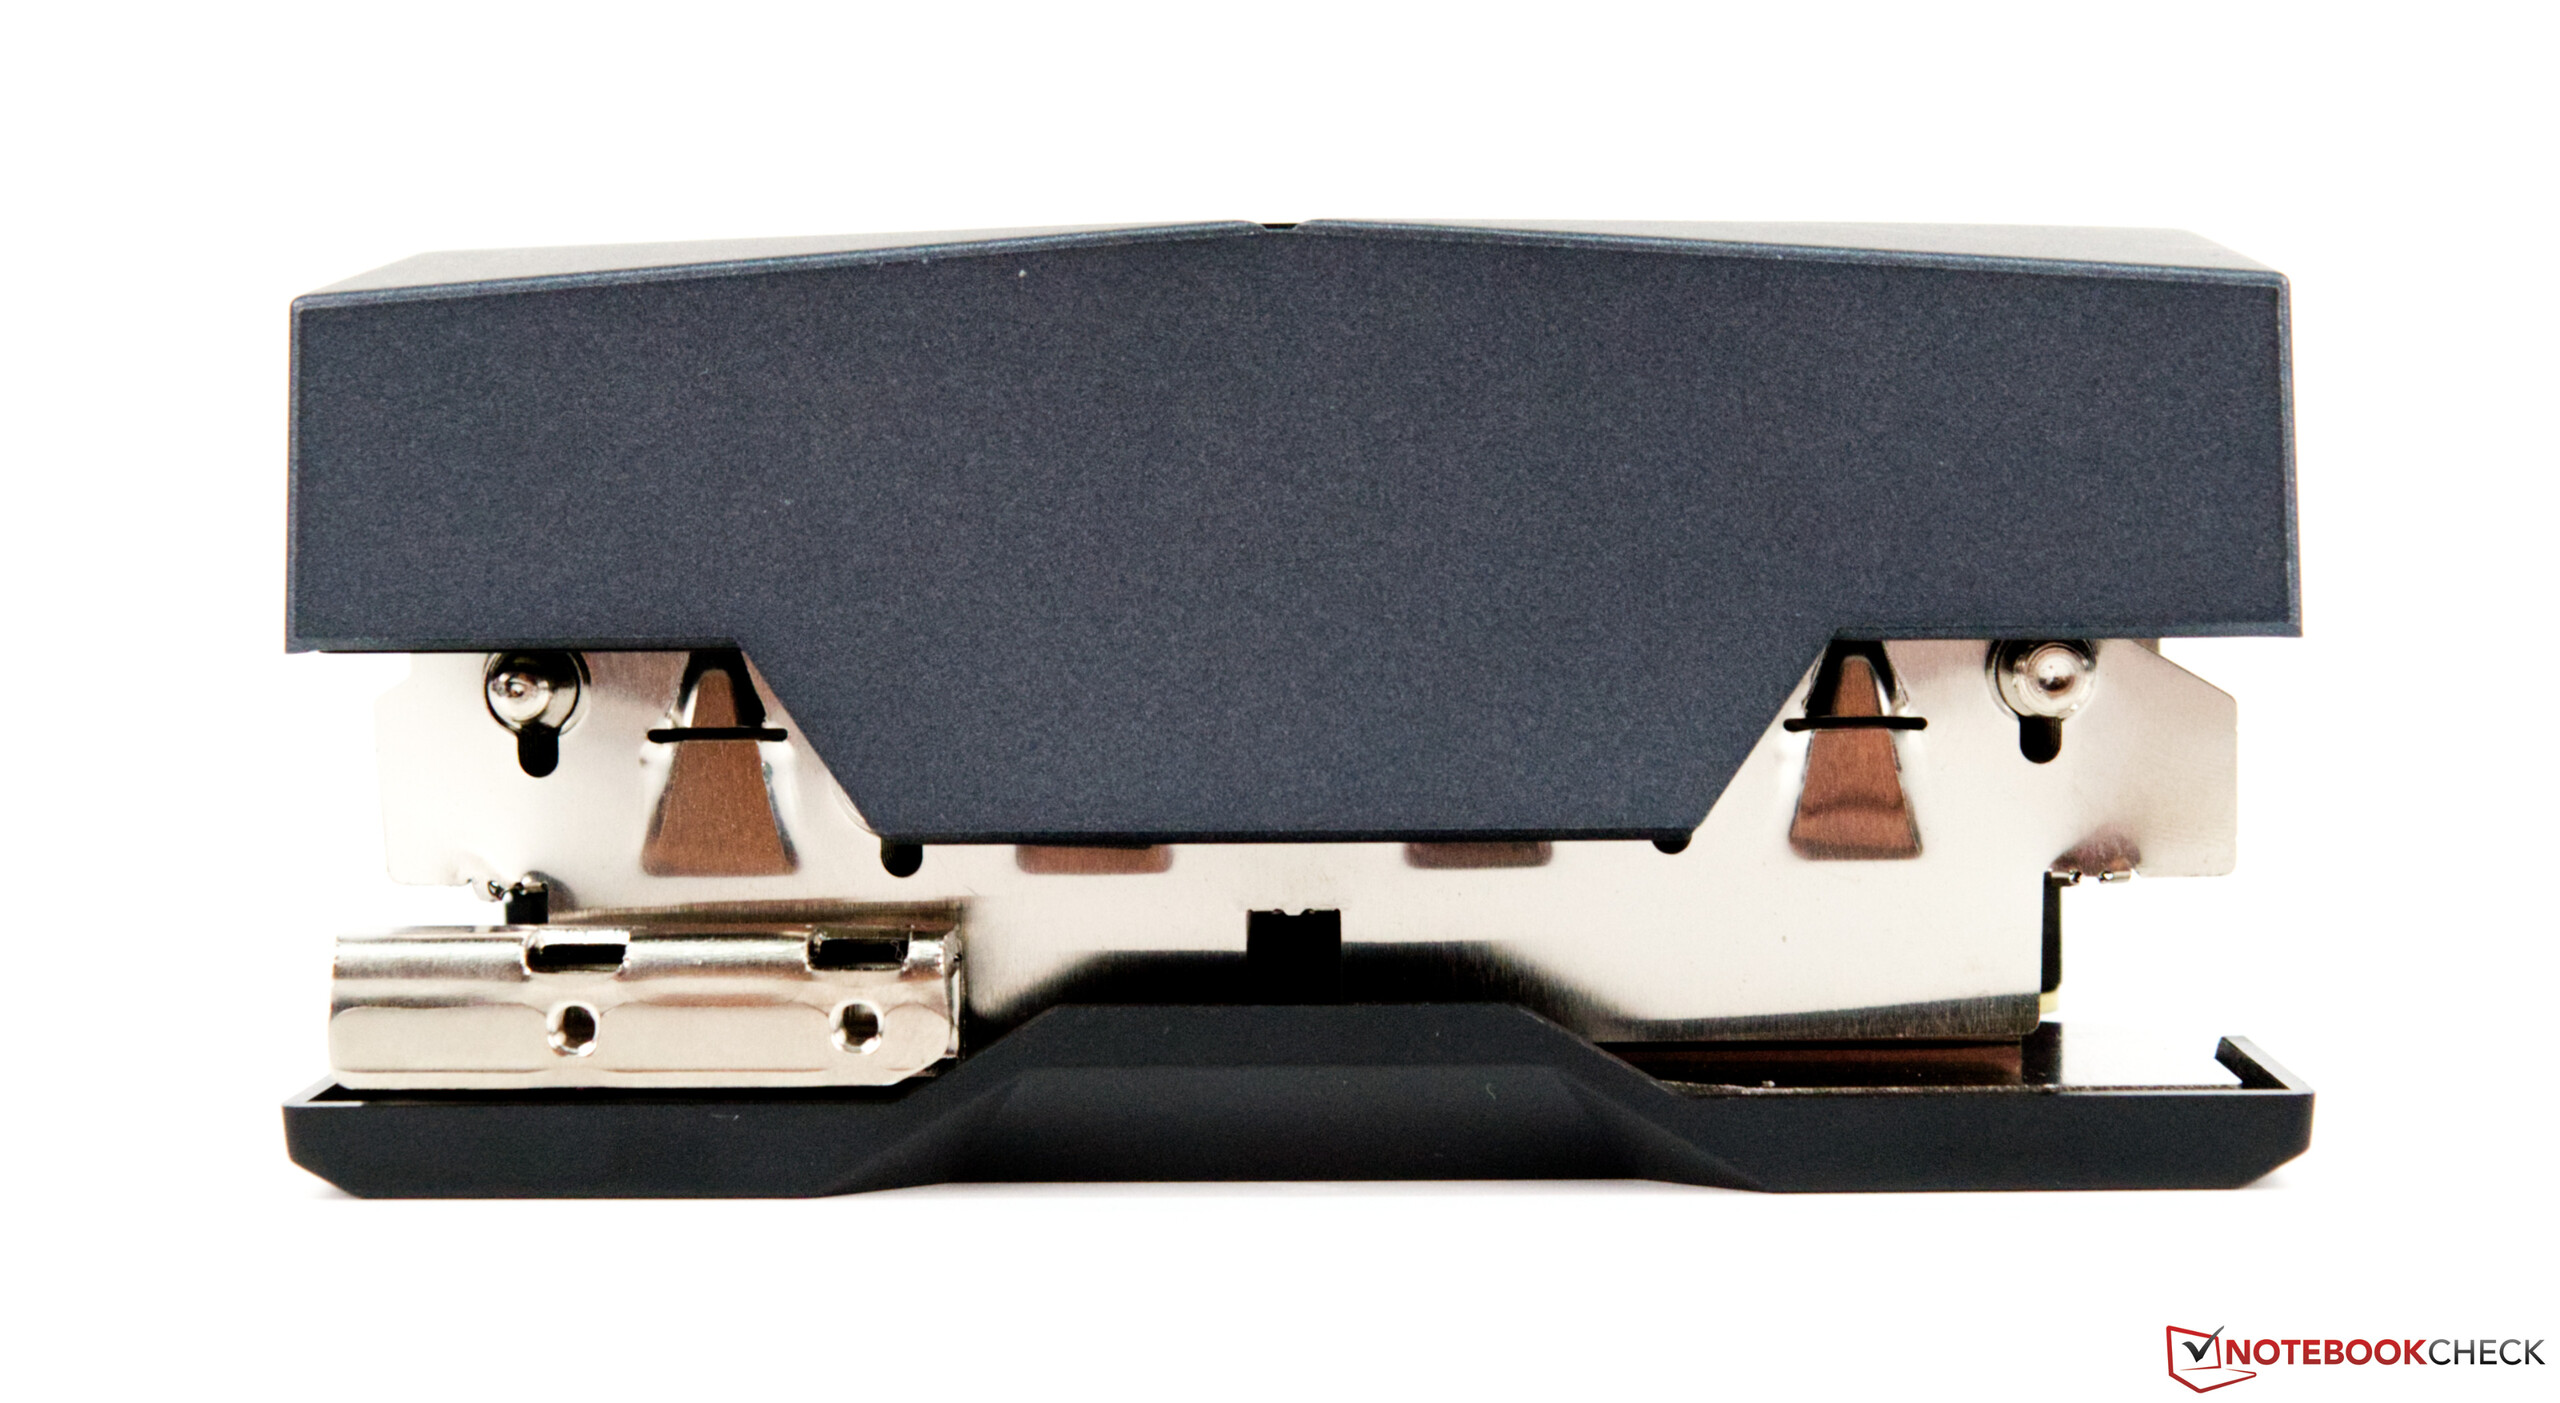
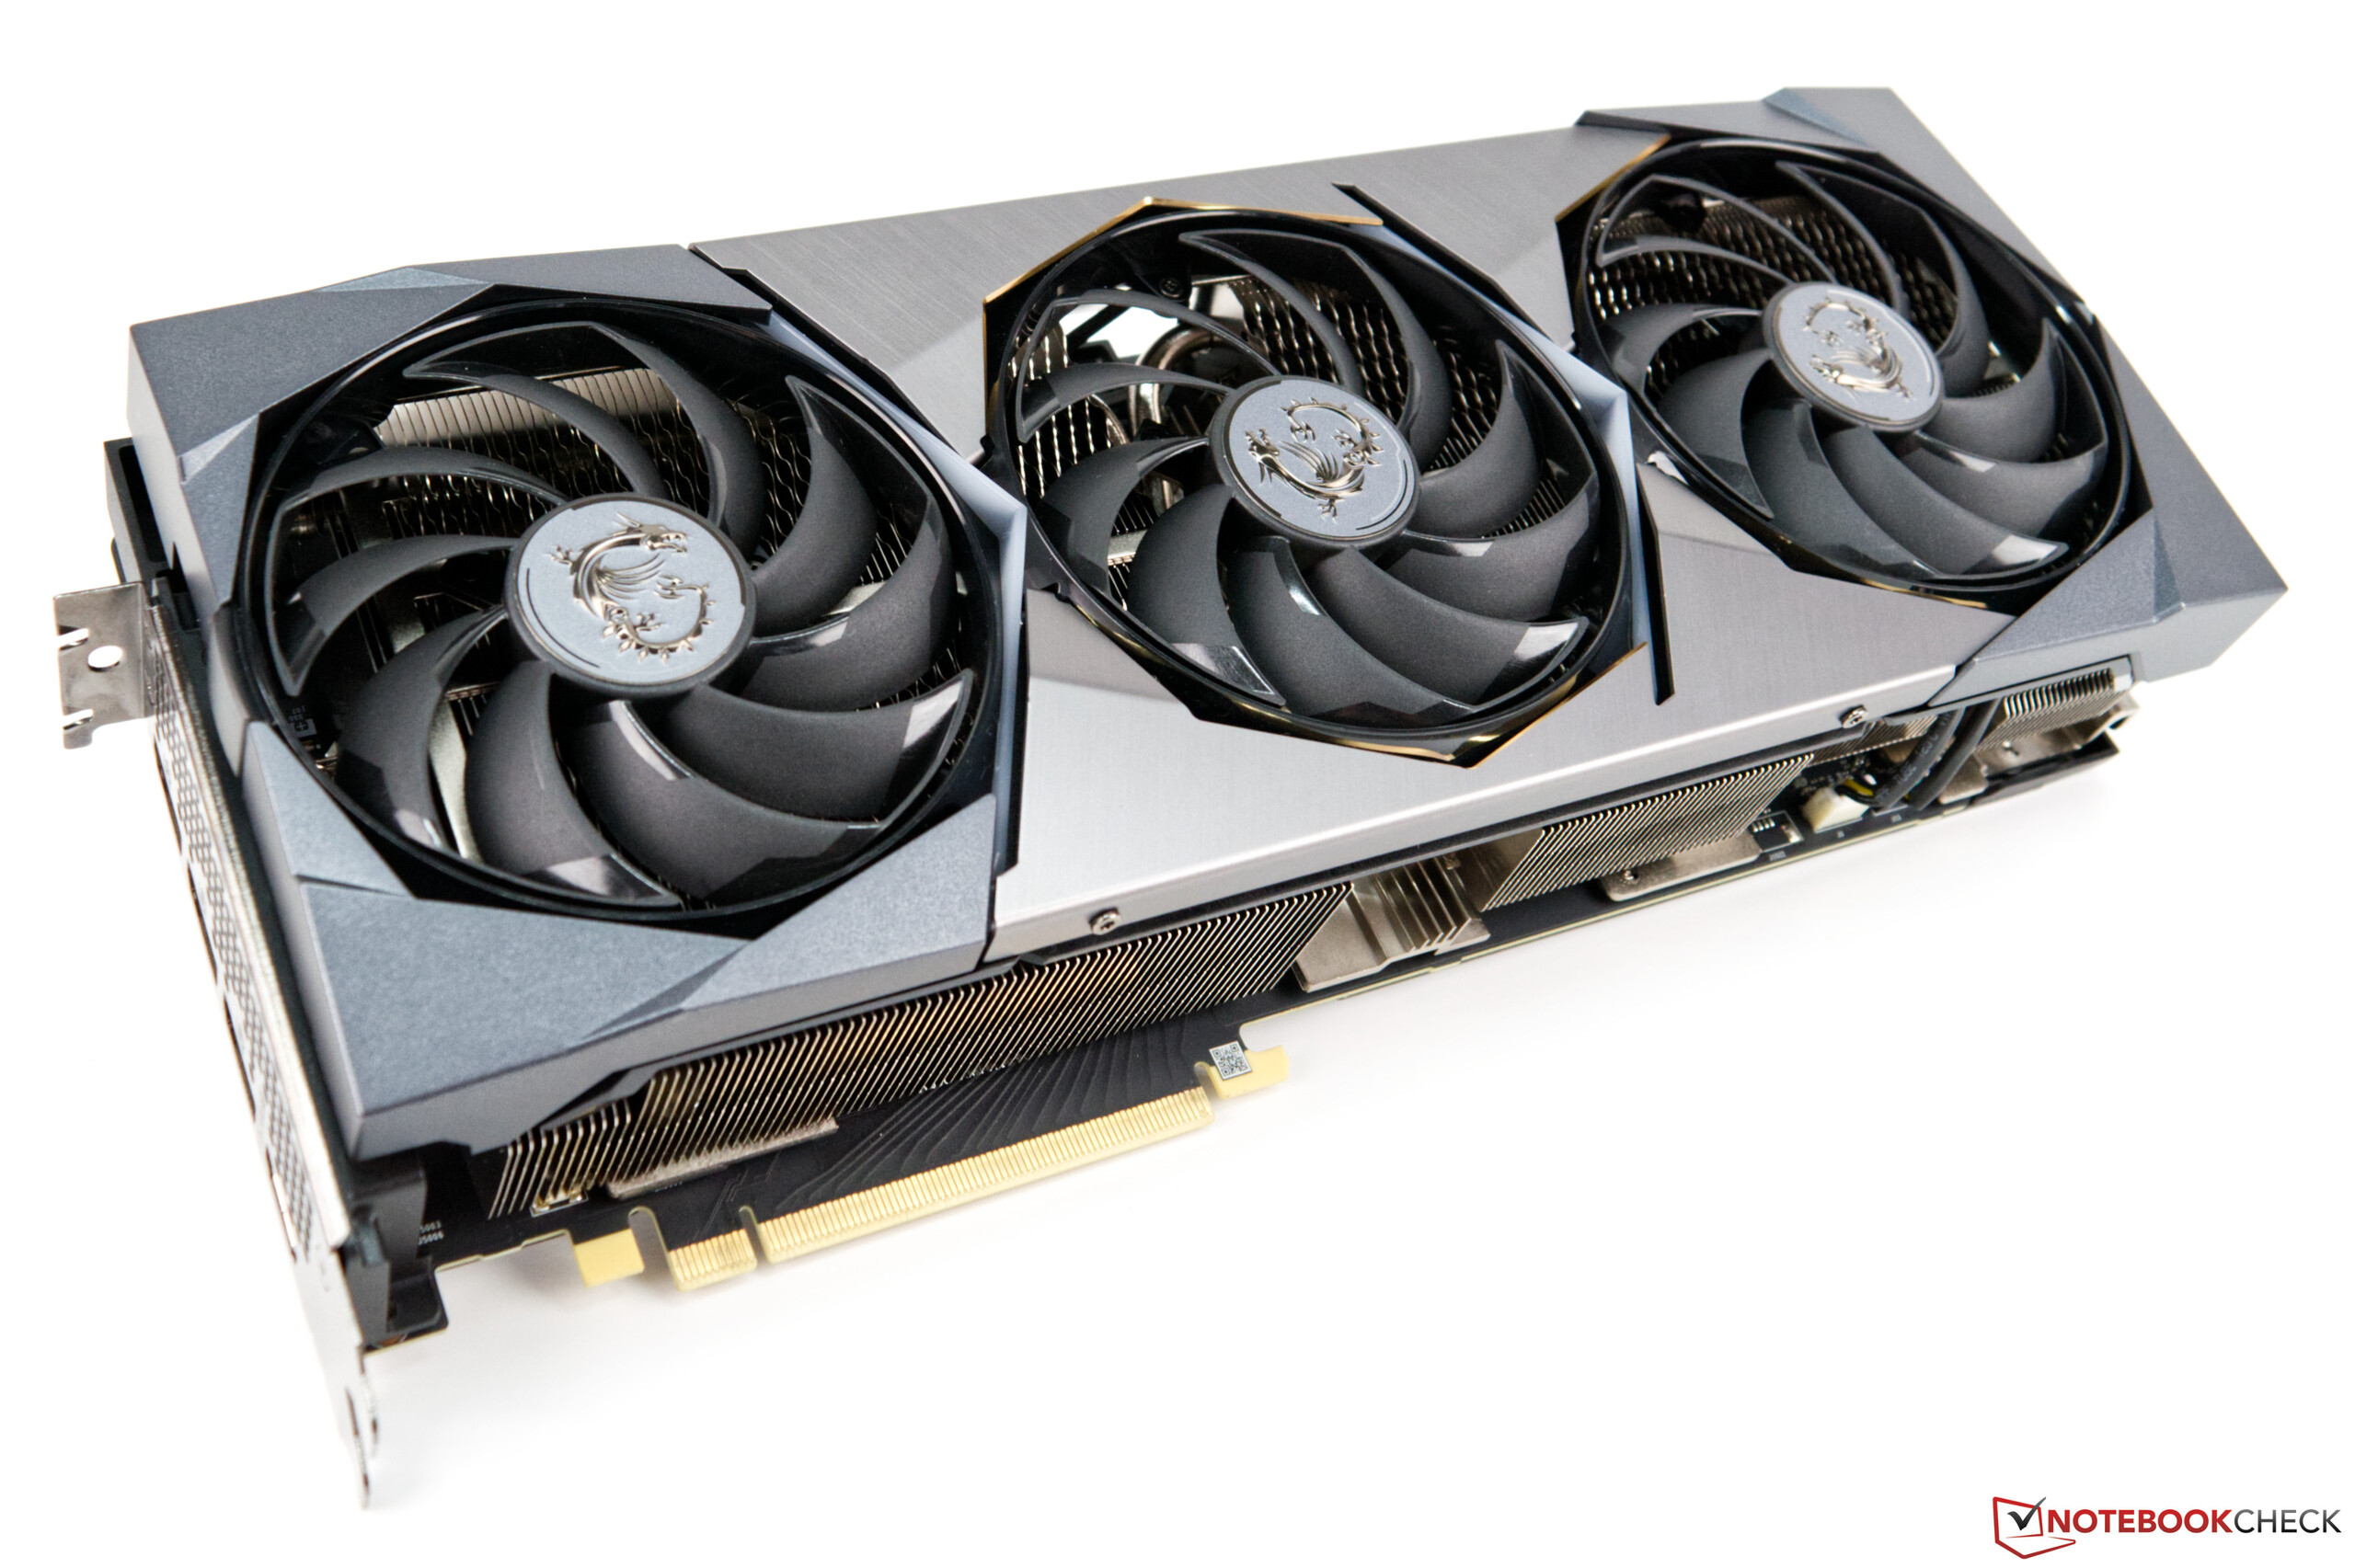
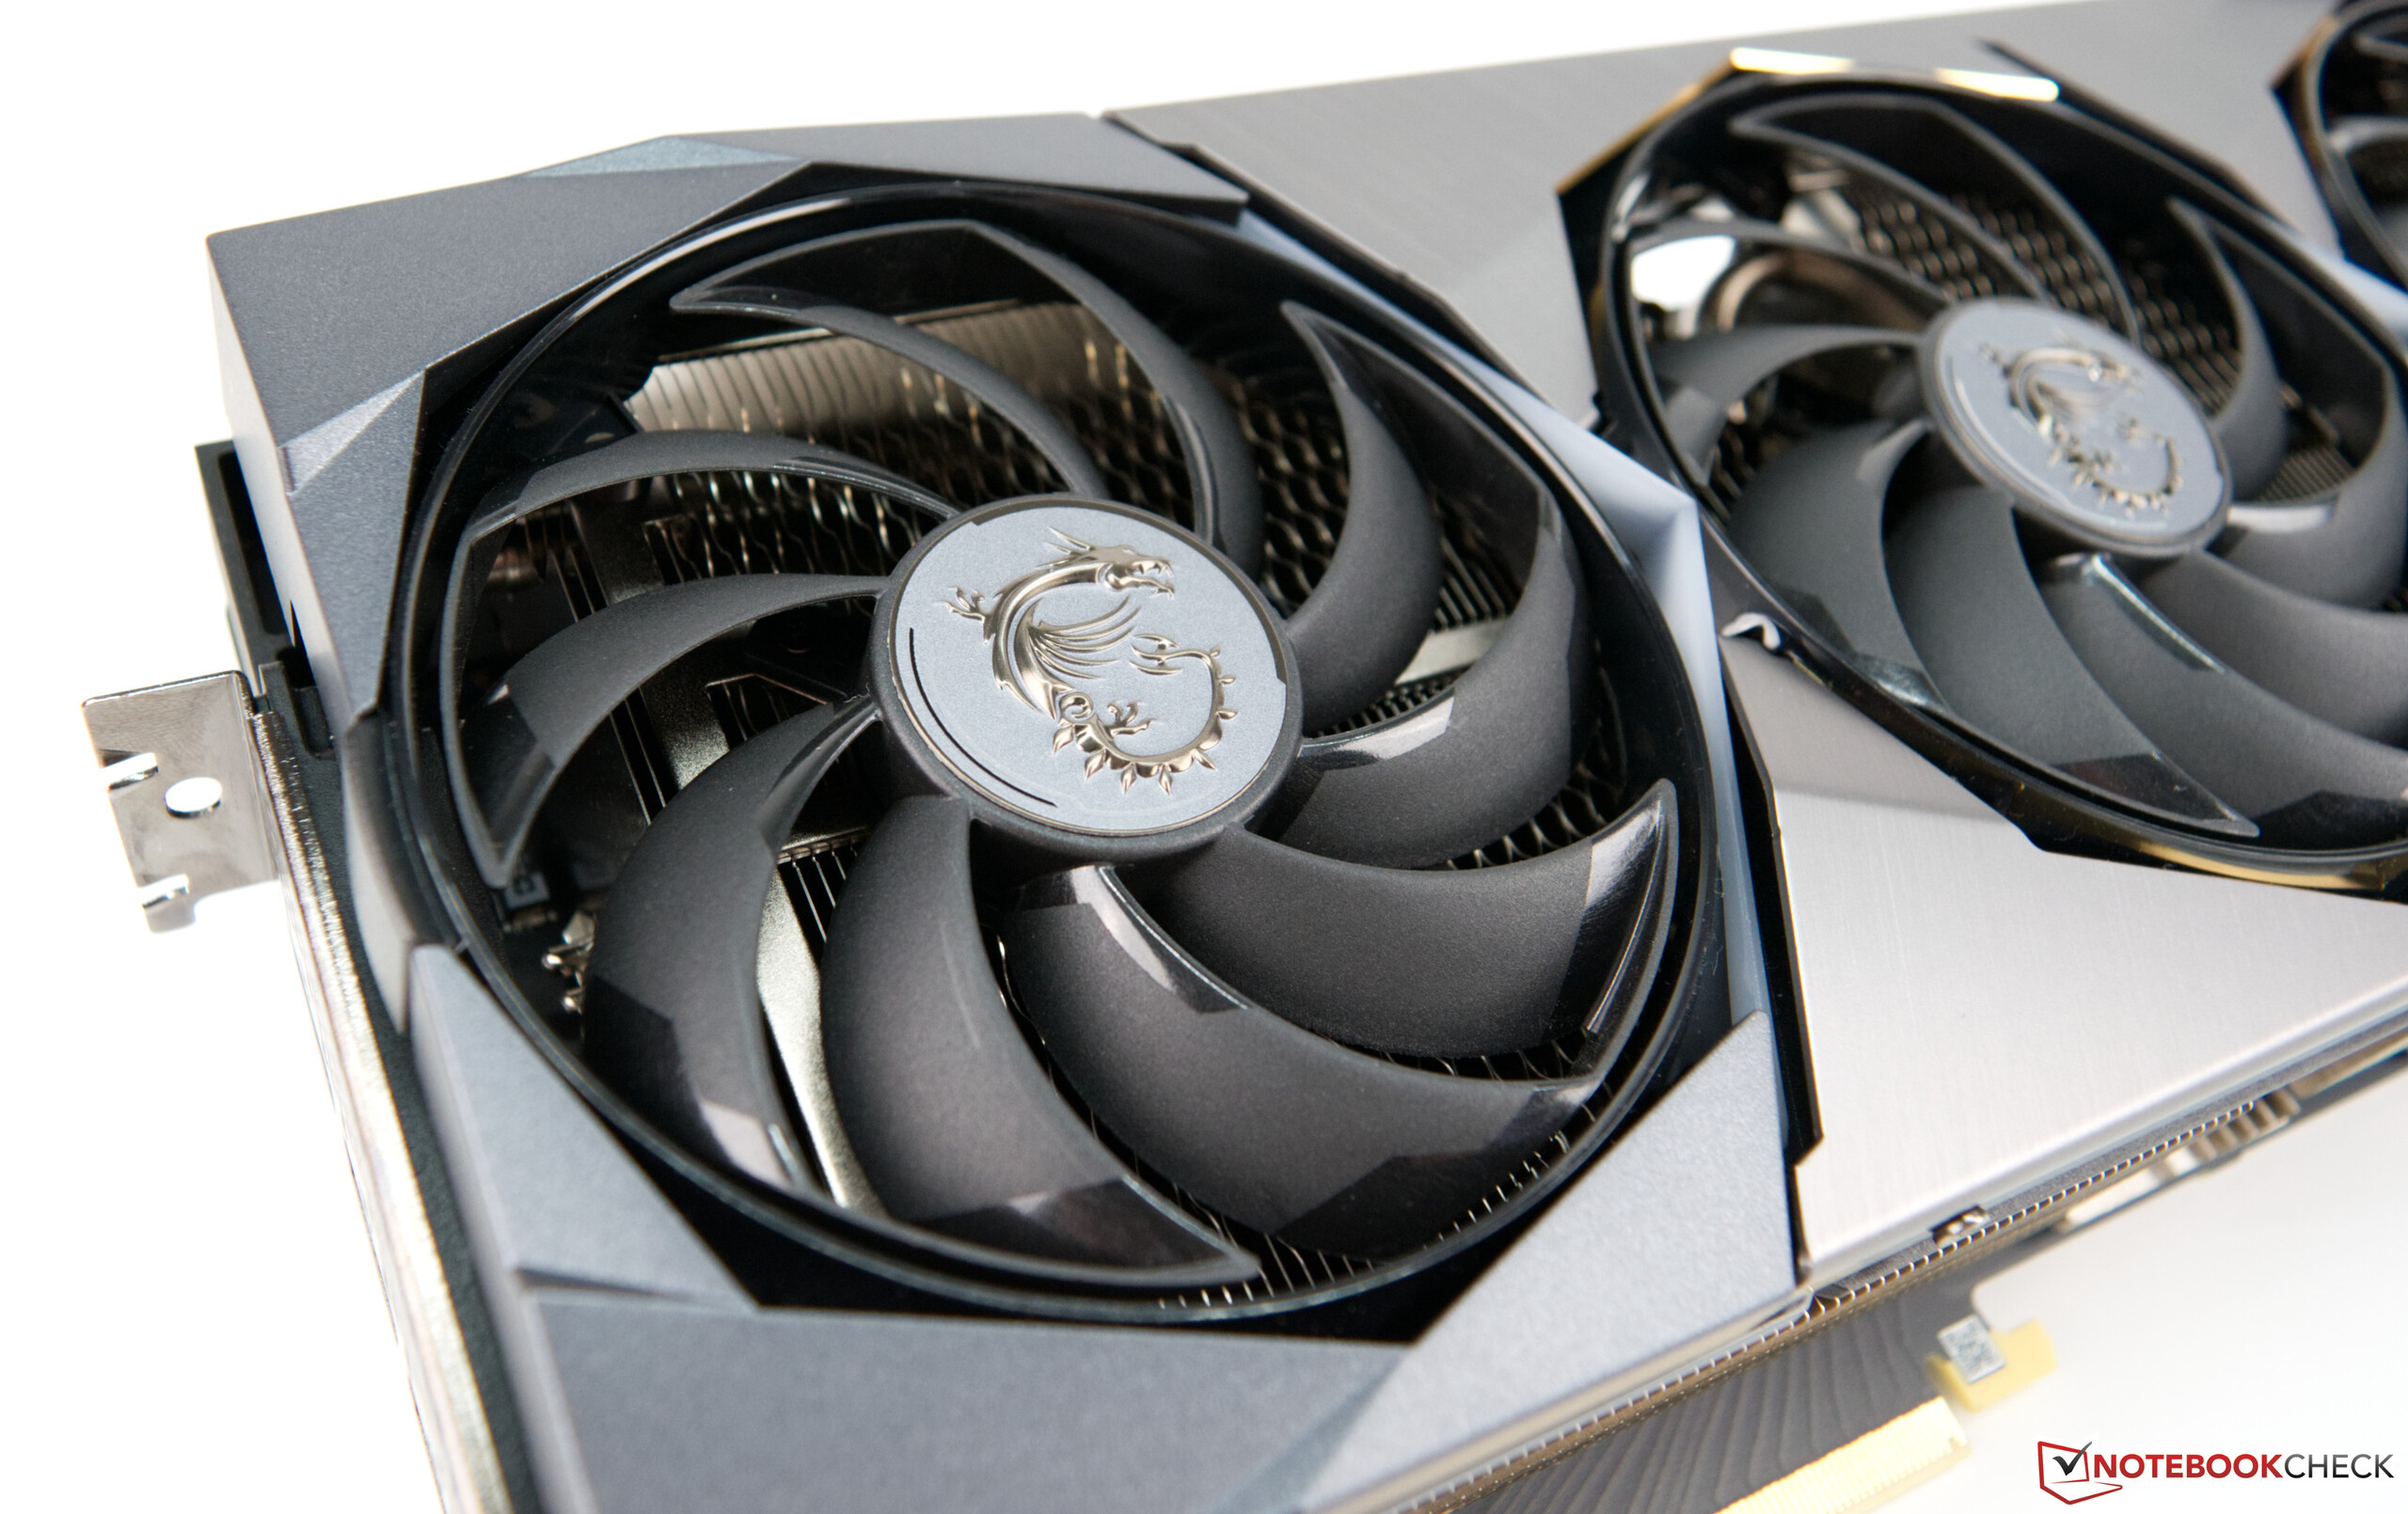
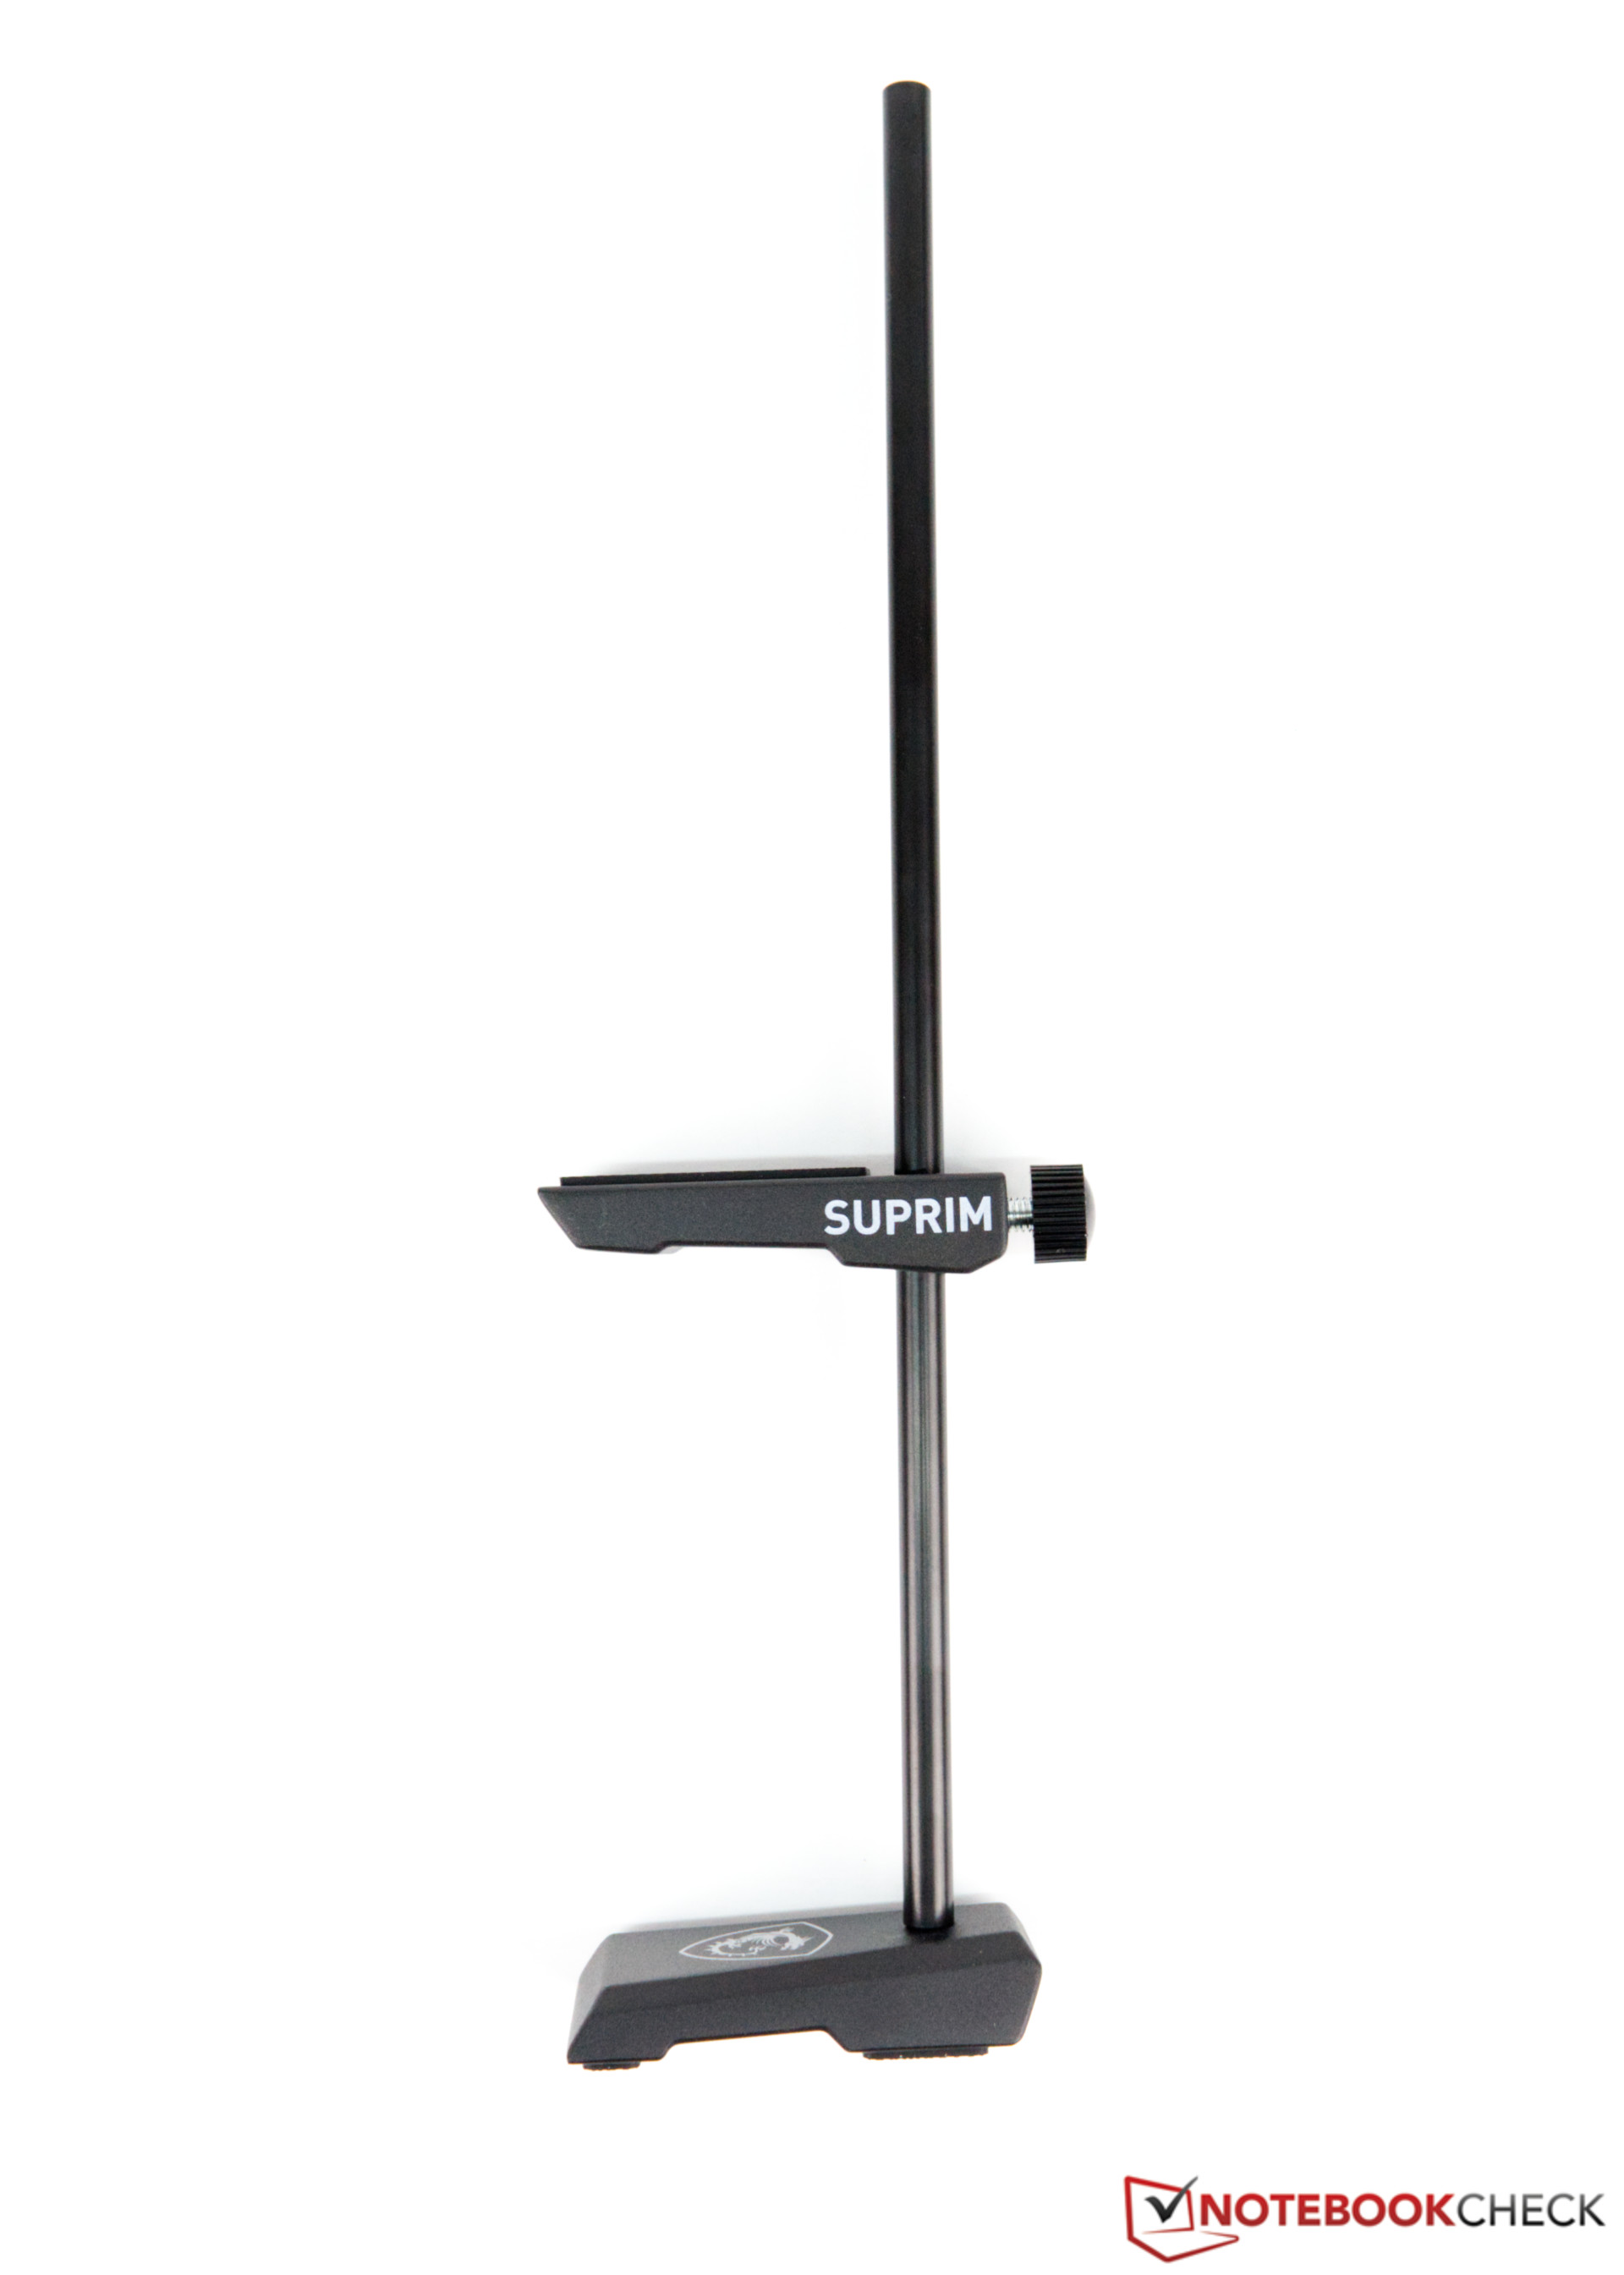
We took a look at the top model based on the RTX 3090 and were very excited about the results after unboxing the graphics card. Admittedly, there should be a lot of space in the case, because the graphics card measures a whopping 34 centimeters in overall length. The weight adds up to a good 1.7 kilograms, which is why MSI also includes a separate stand to stabilize the graphics card at the end due to the excess length. Without the stand, the graphics card sags a lot in the case, making you fear that the PCIe slot will be damaged in the long run. There should be no problems if you mount it vertically. Furthermore, the cooler is very thick, so that a total of three slots is needed.
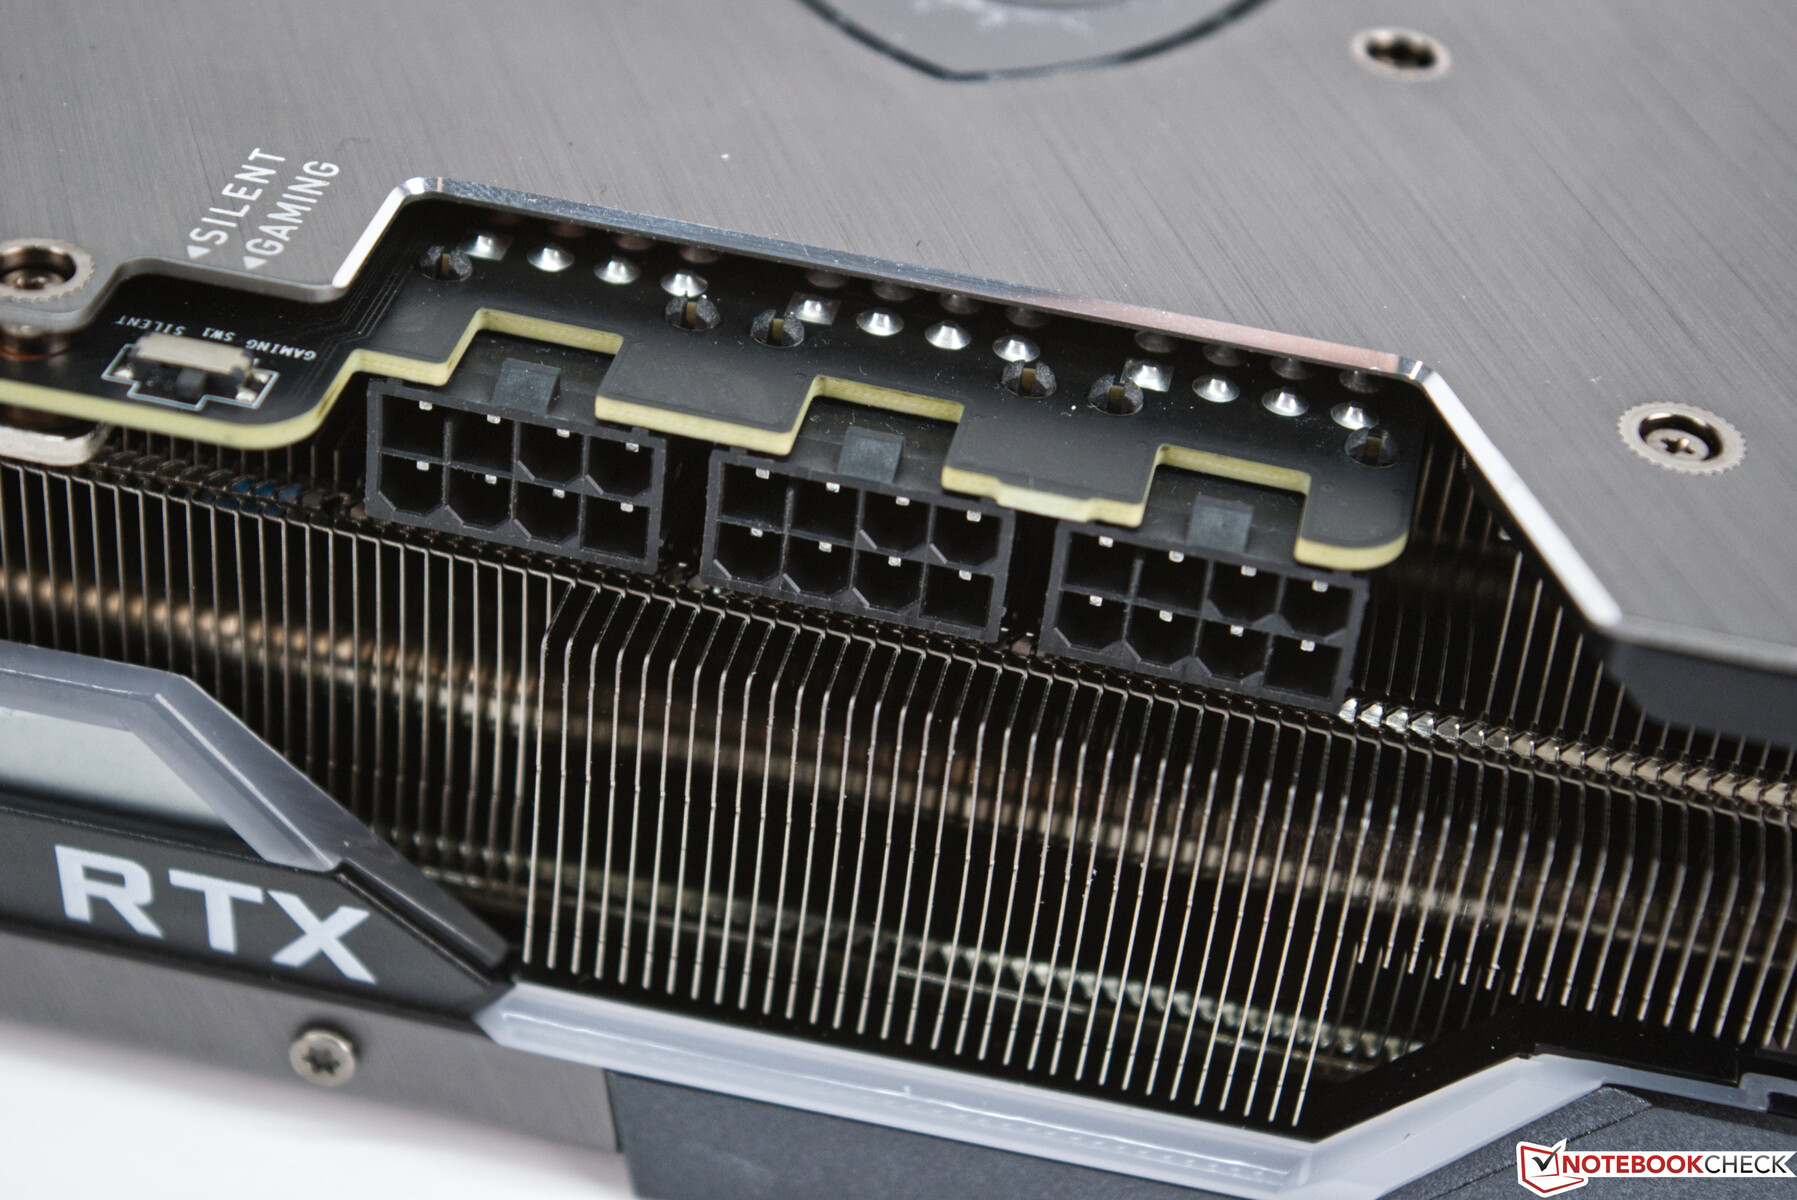
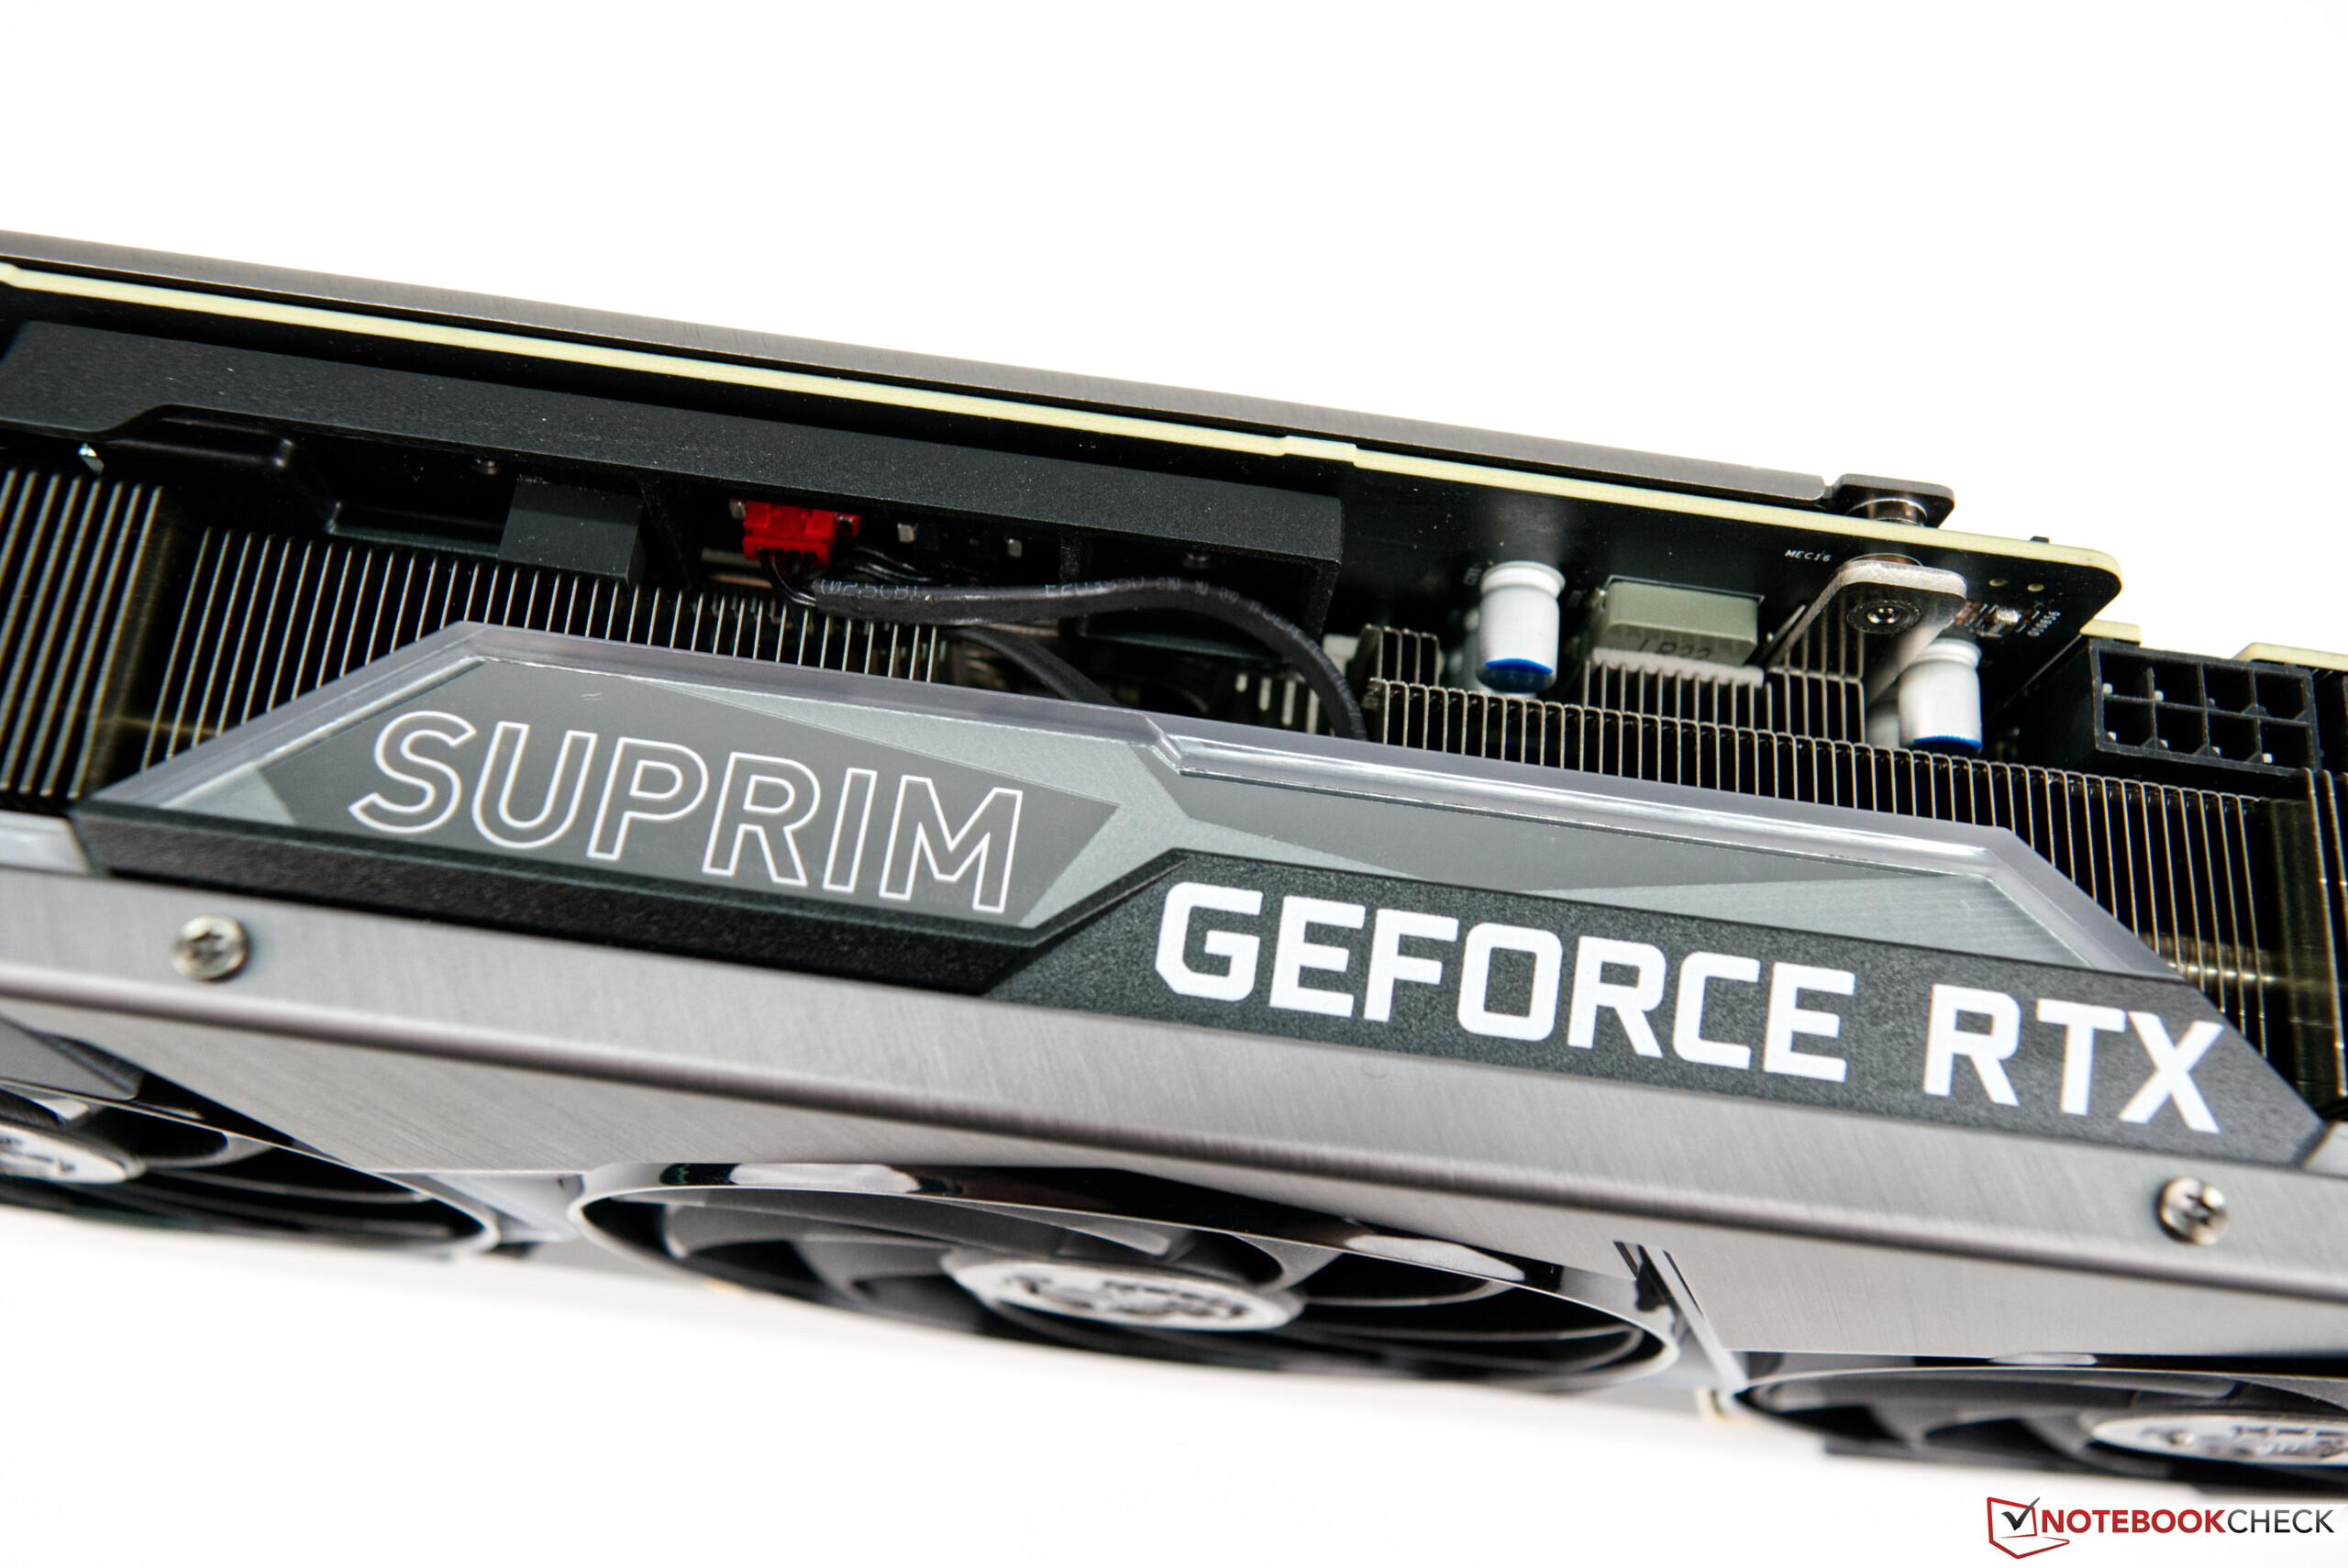
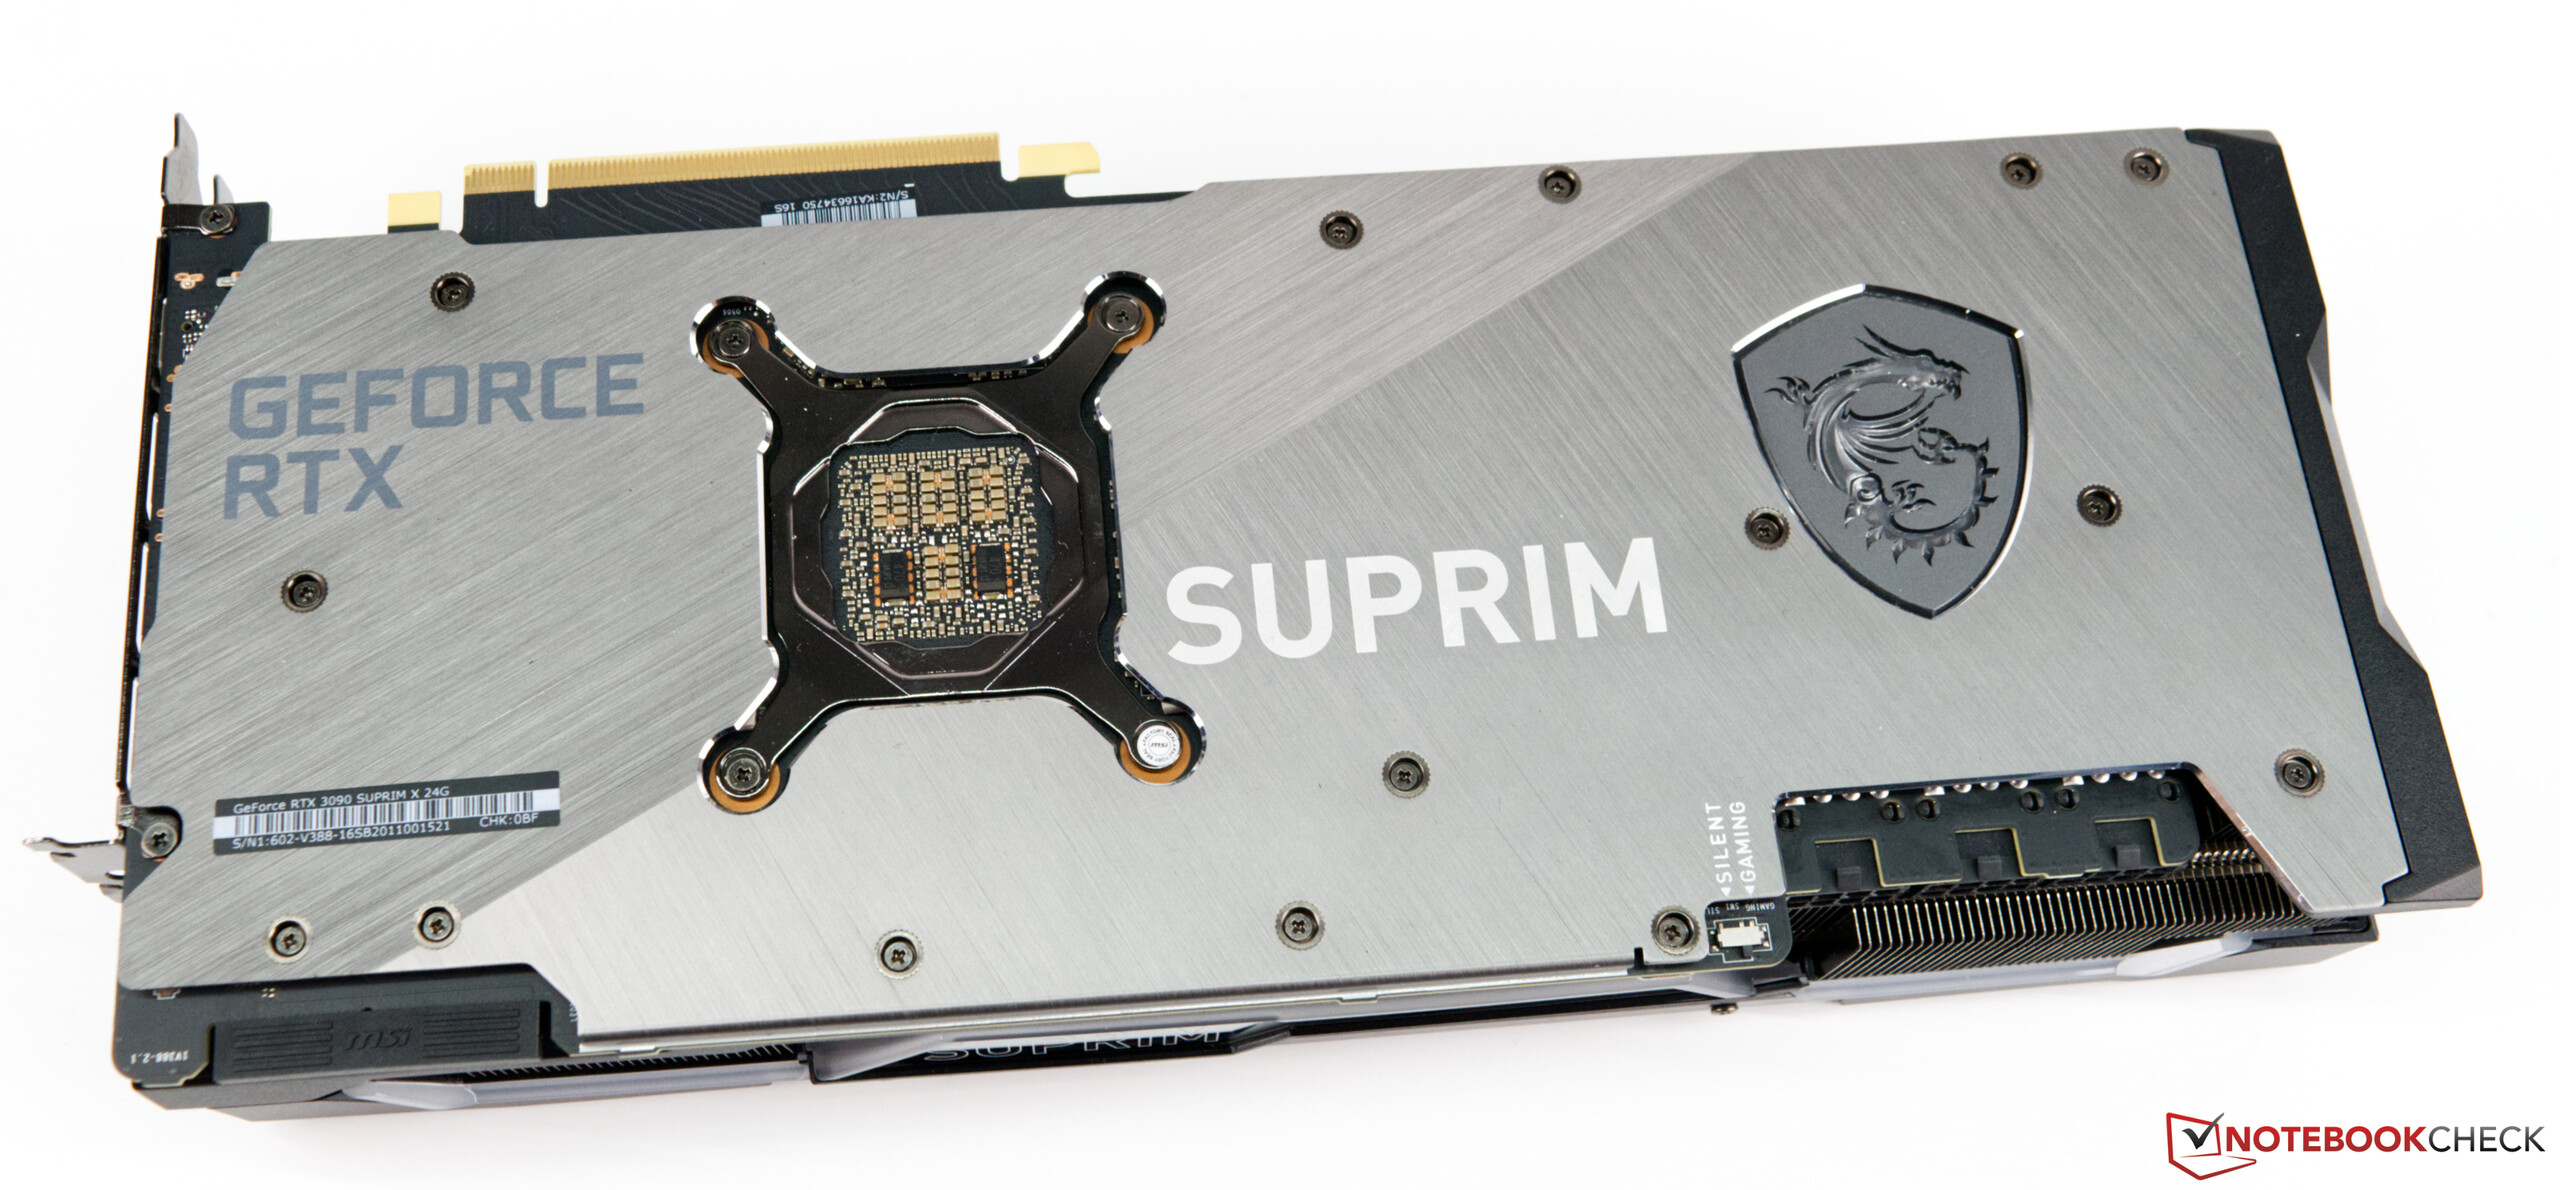
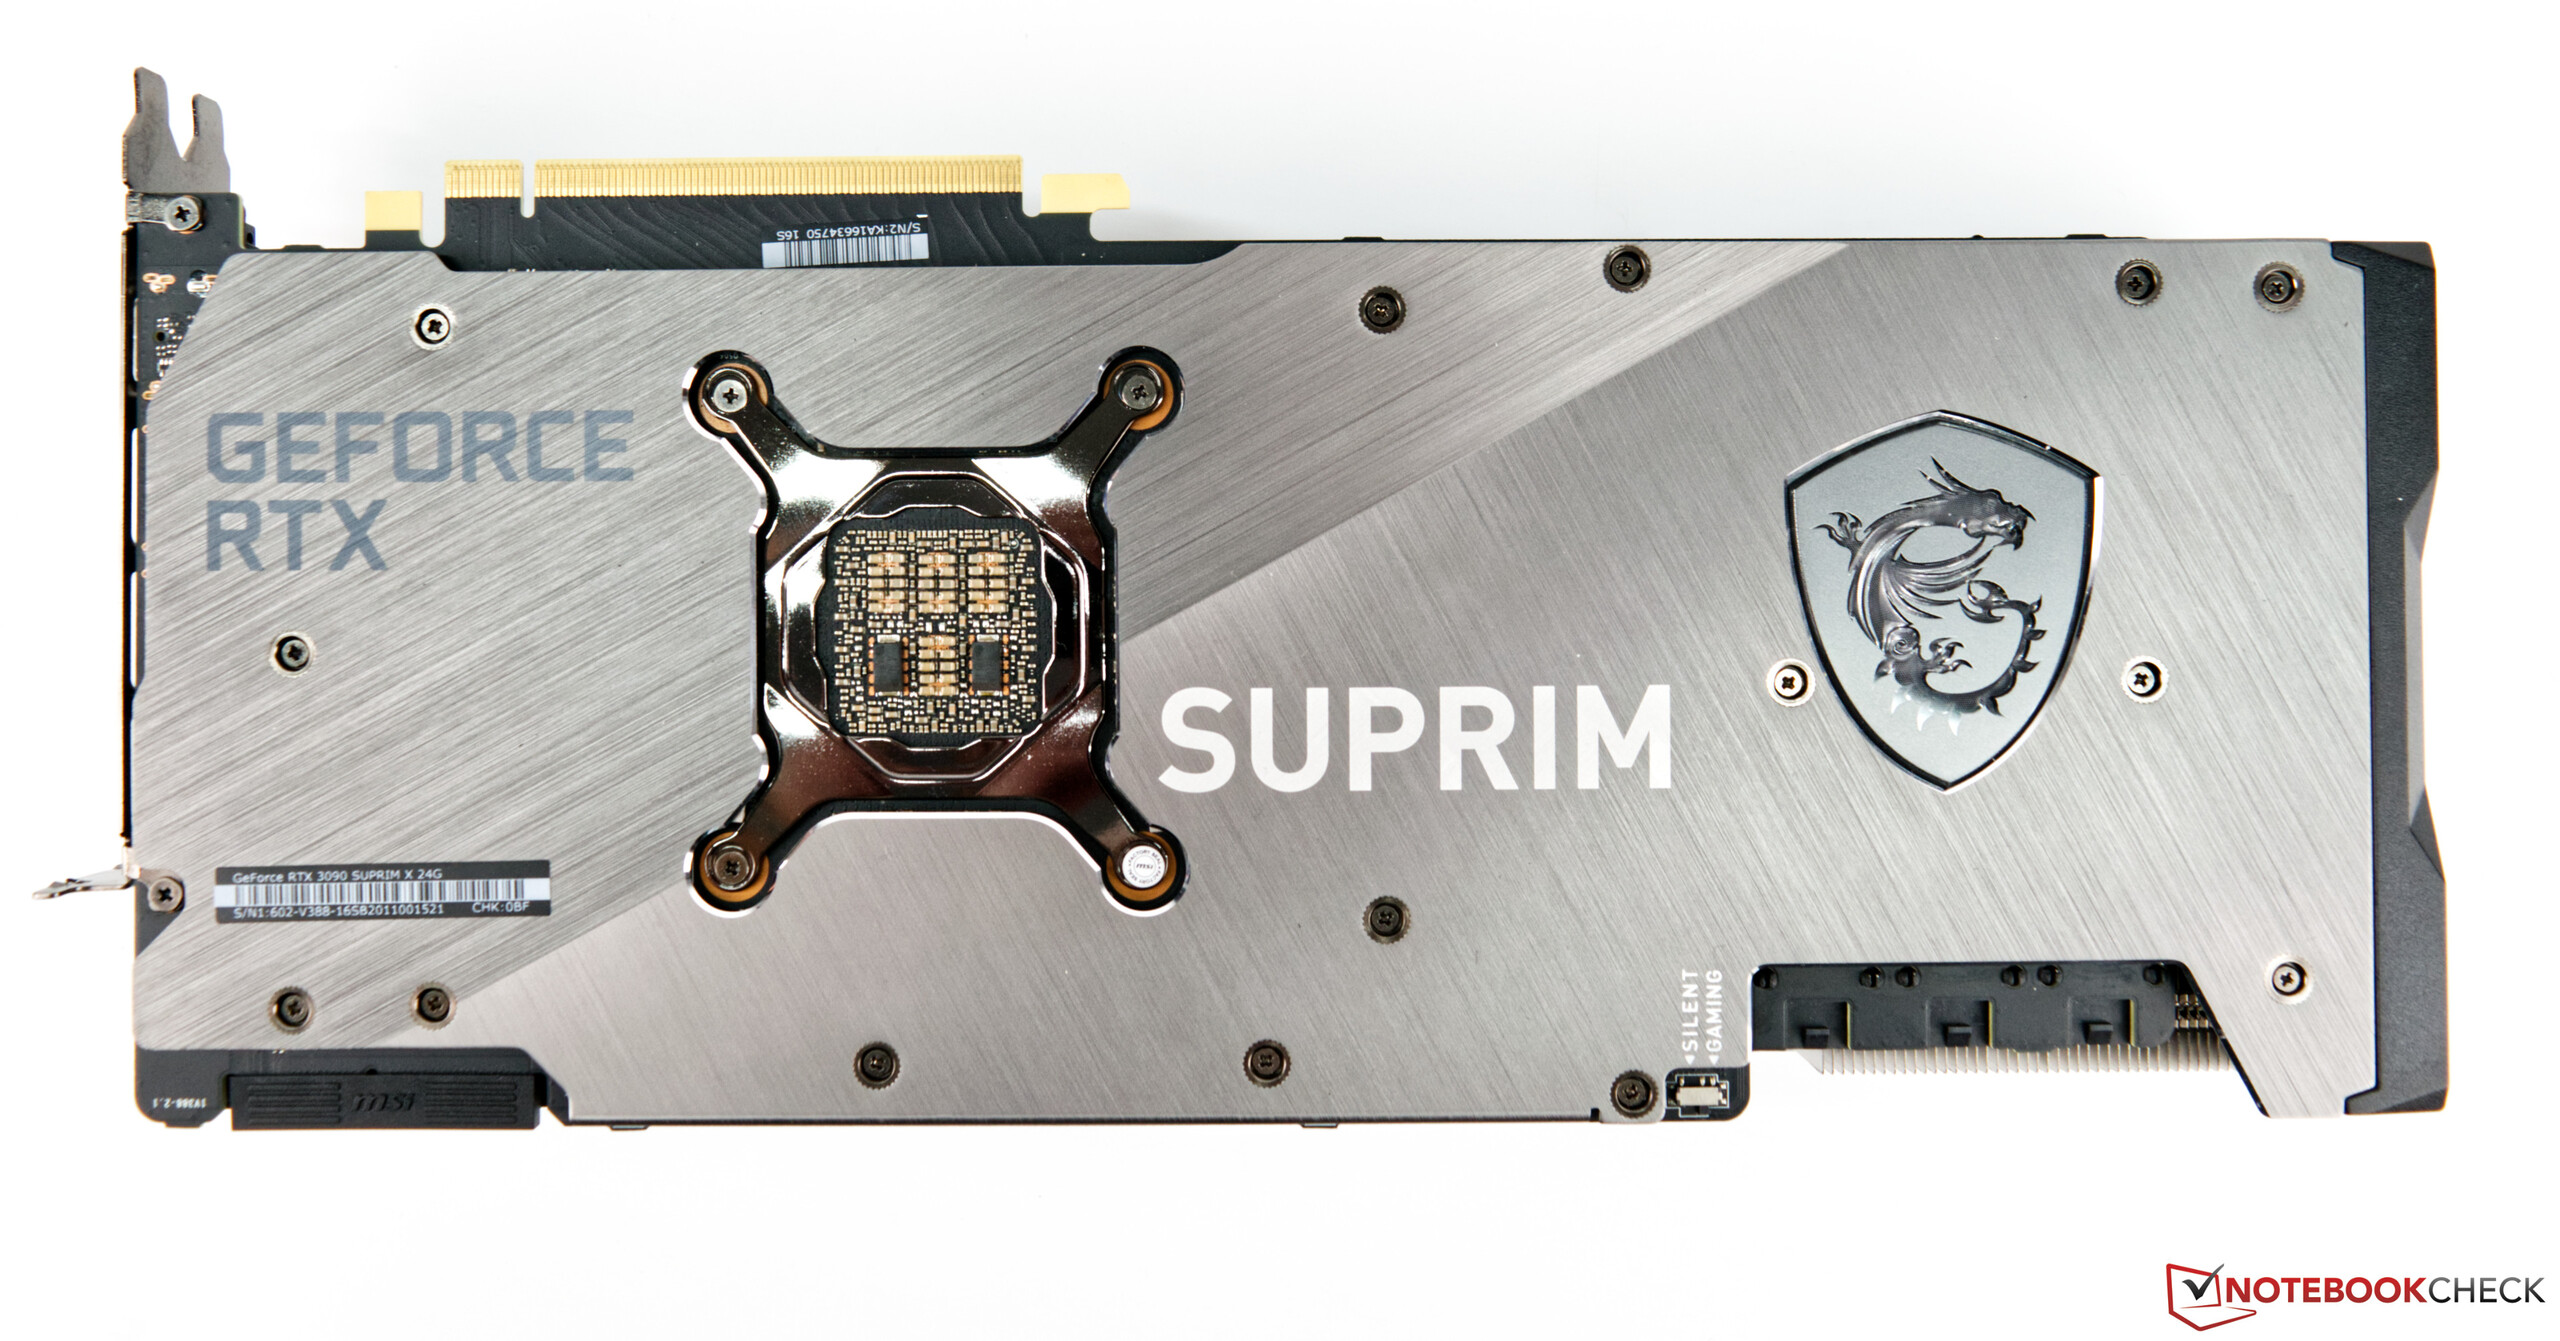
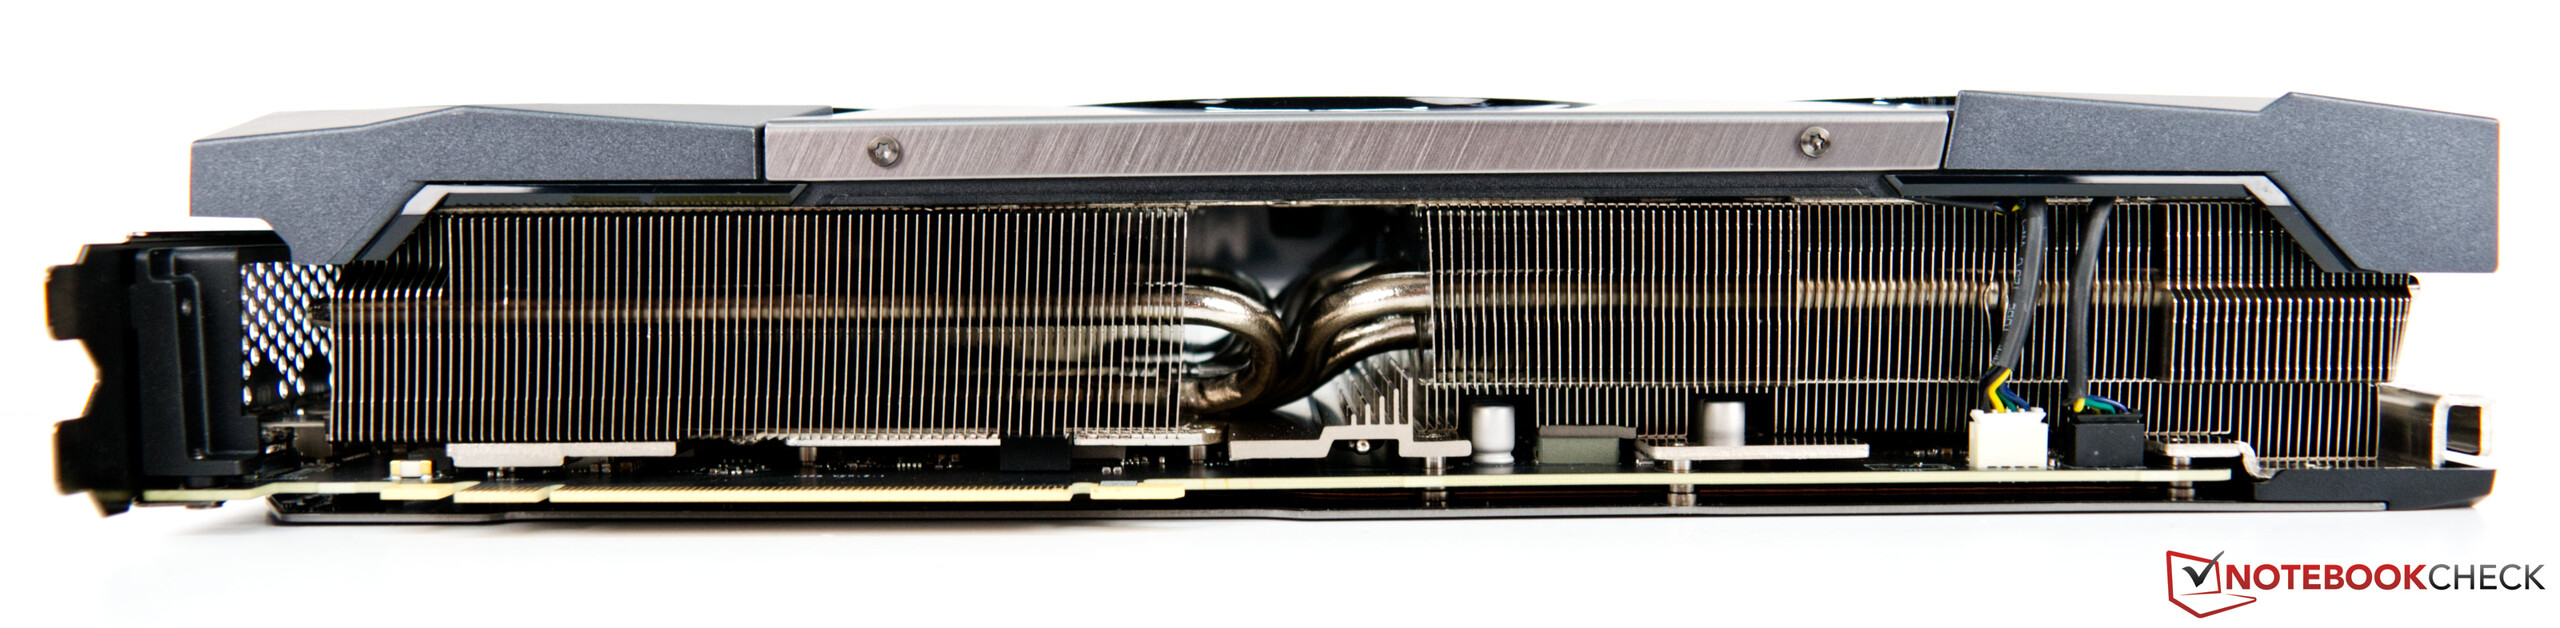
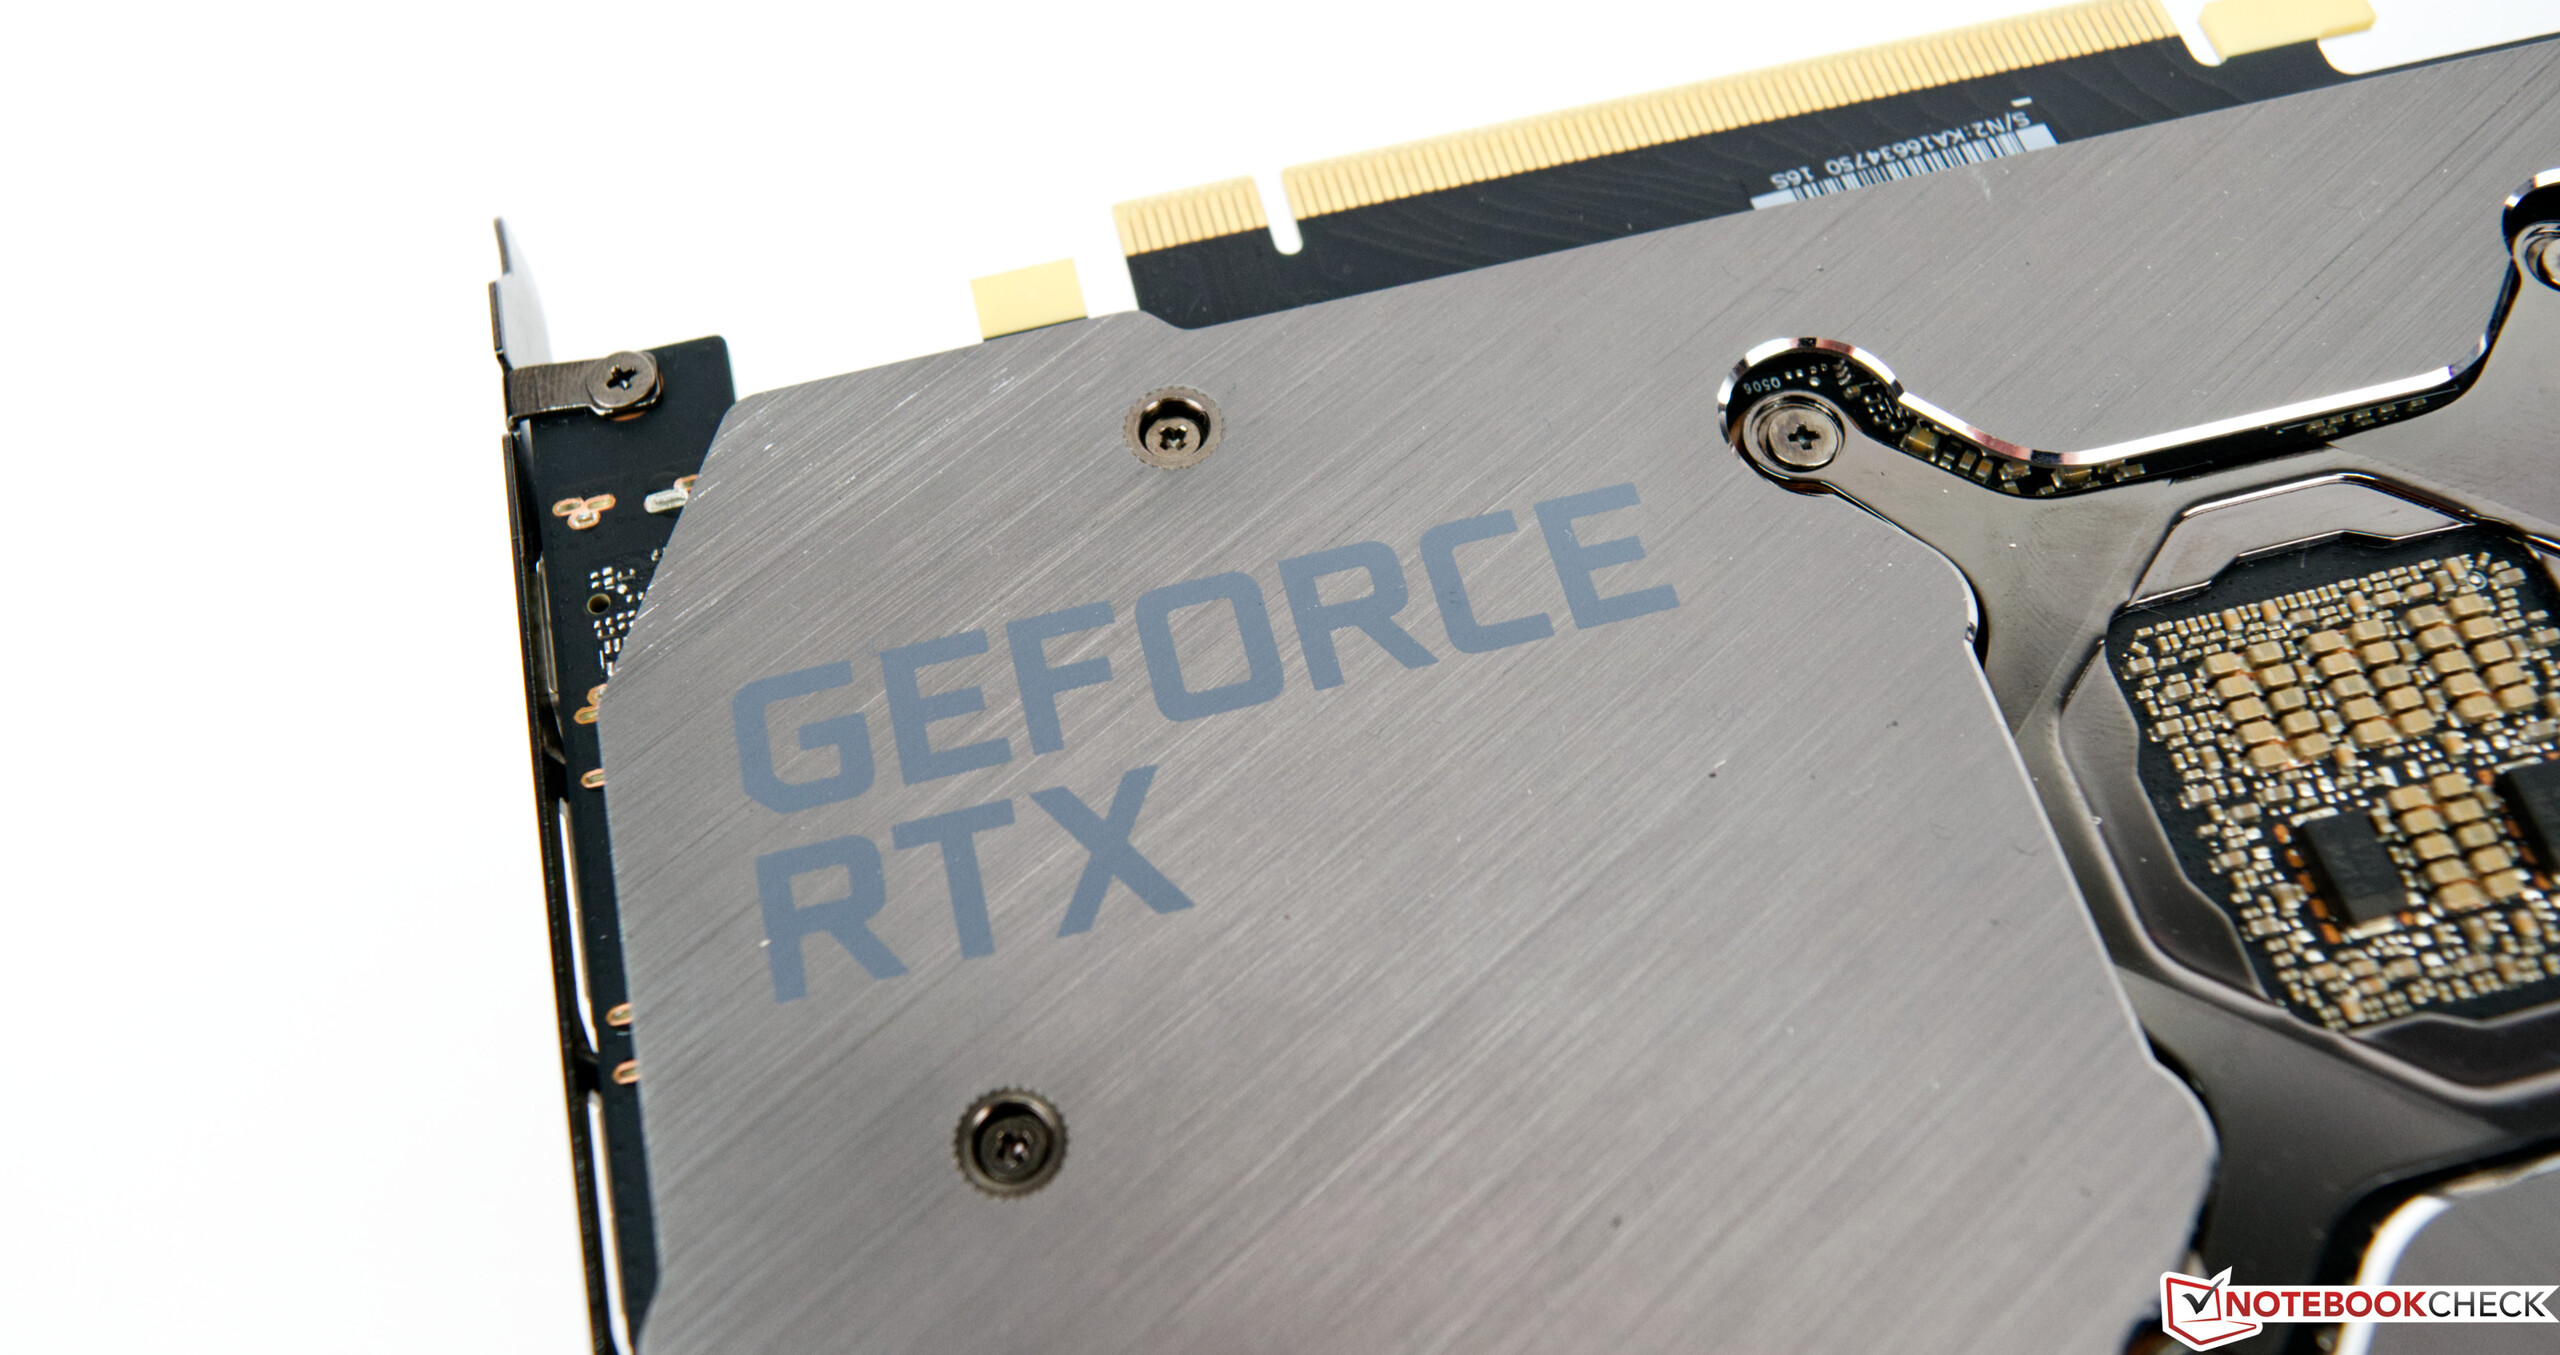
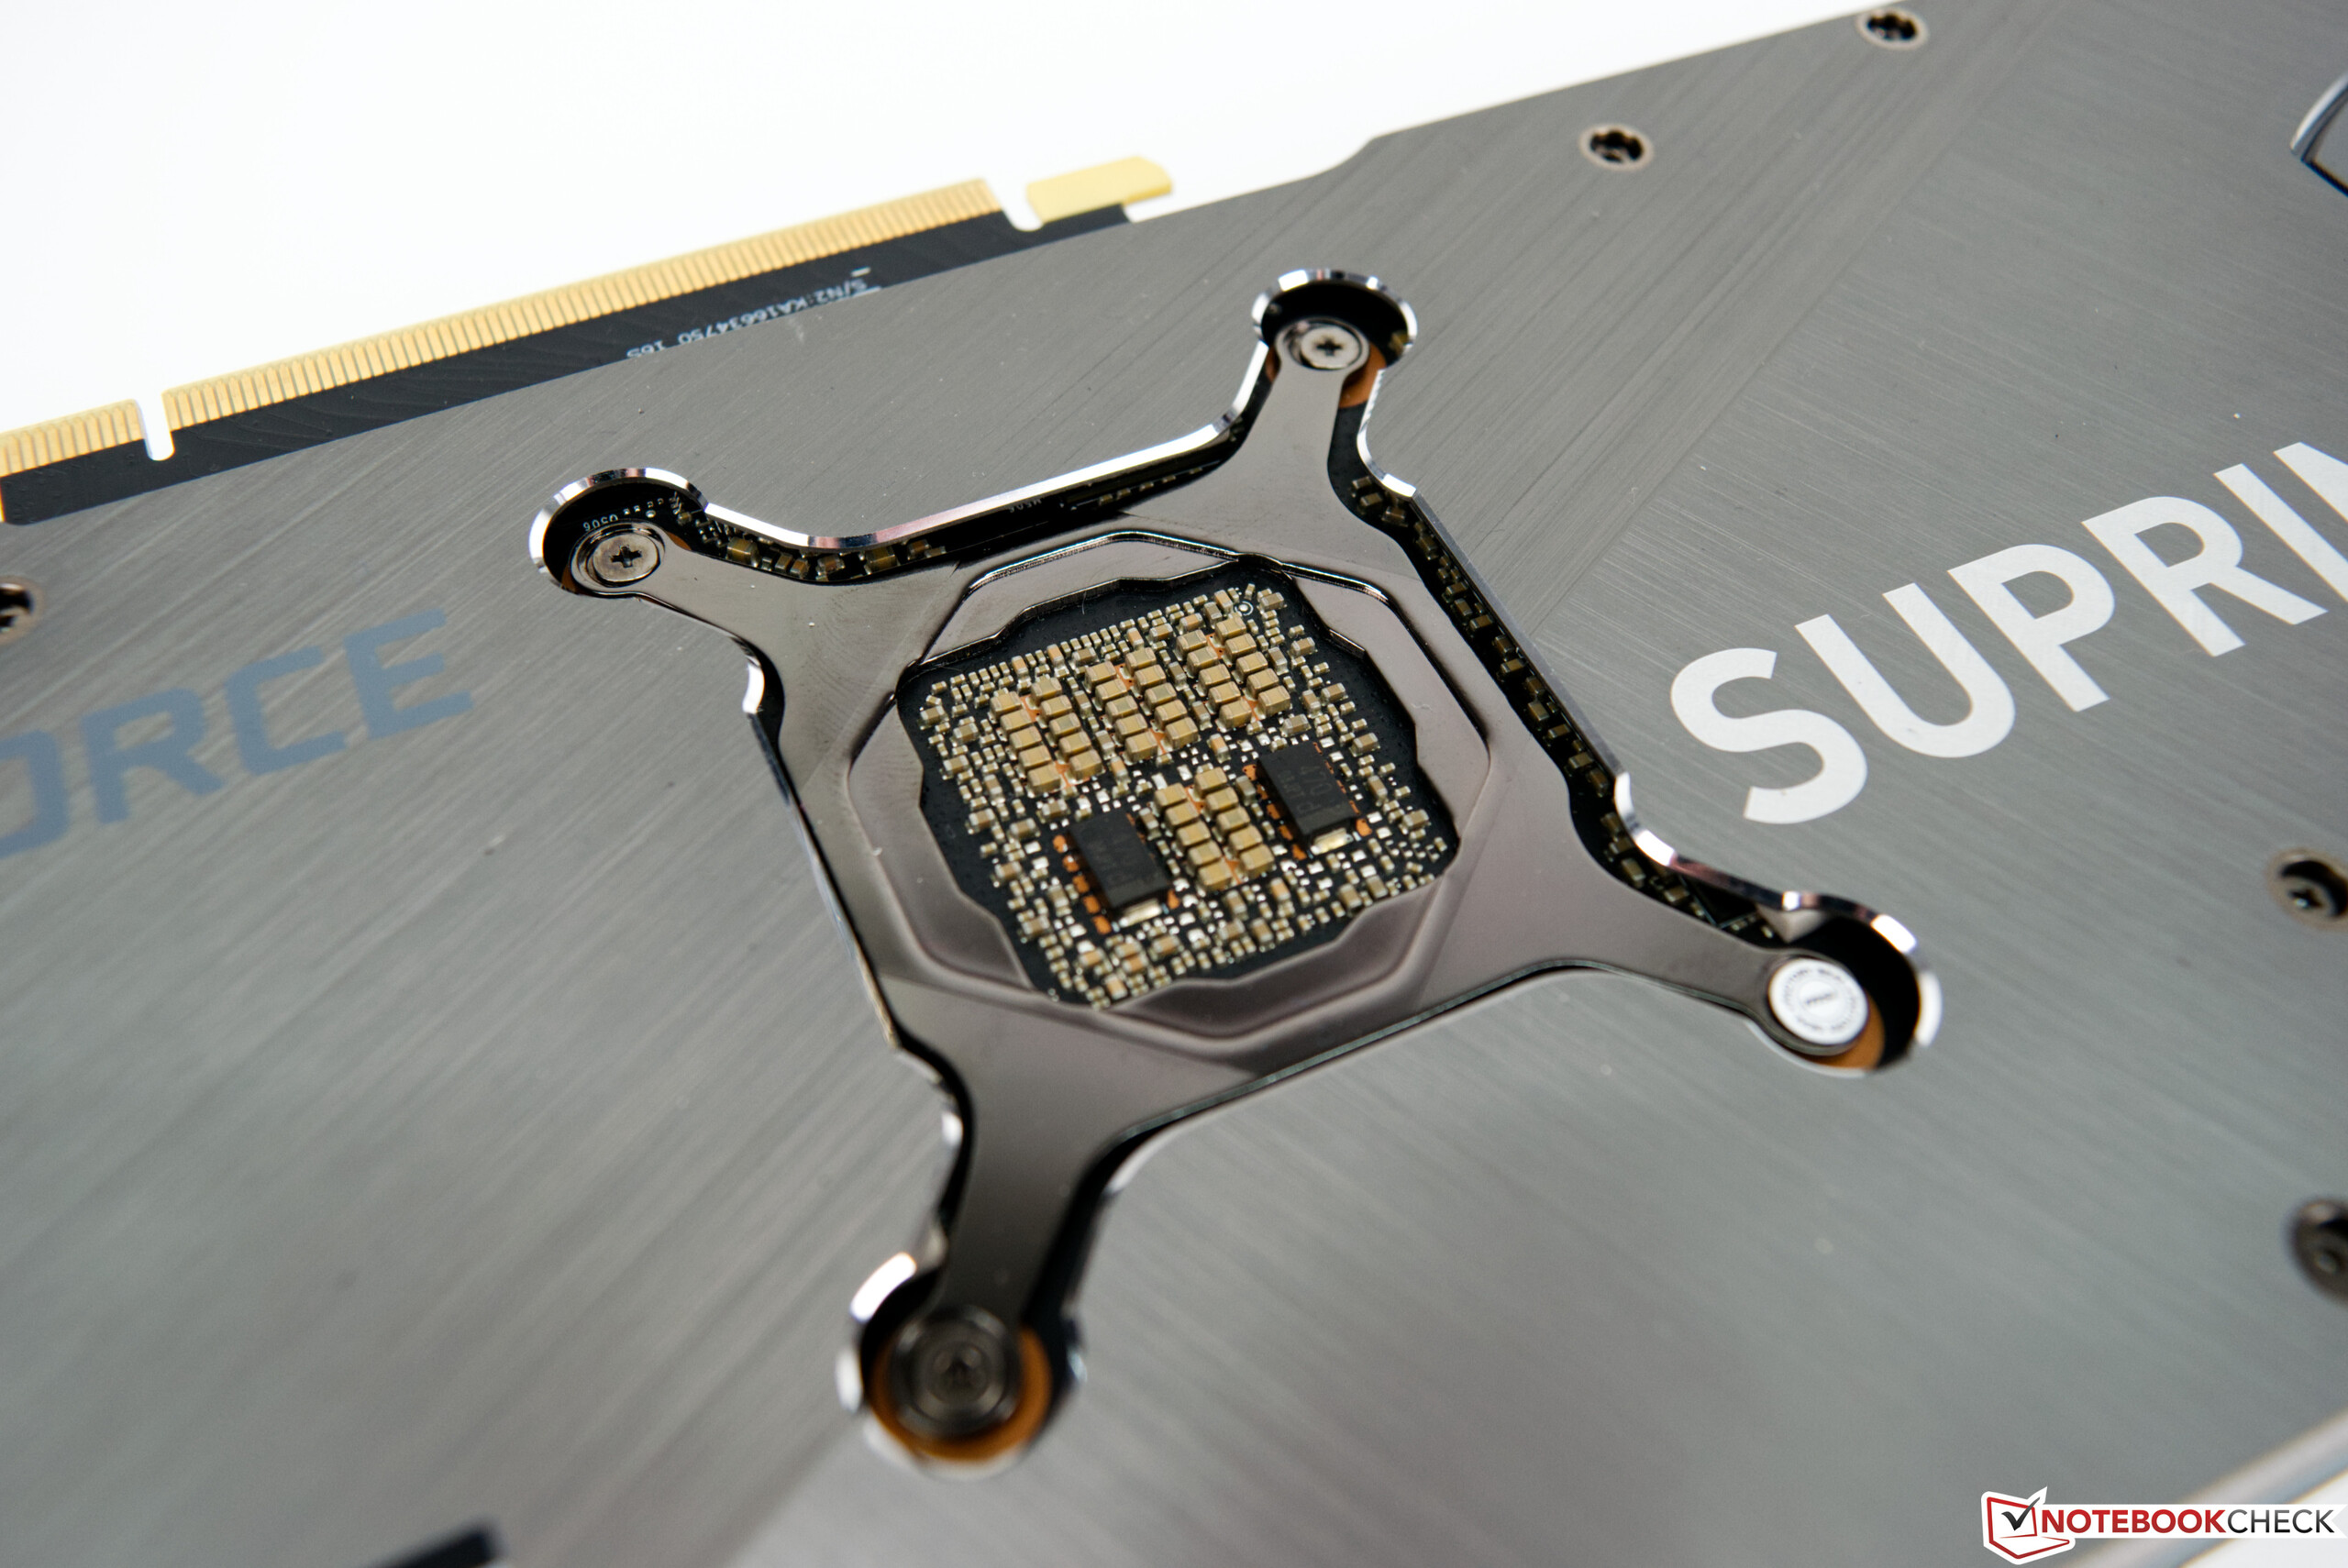
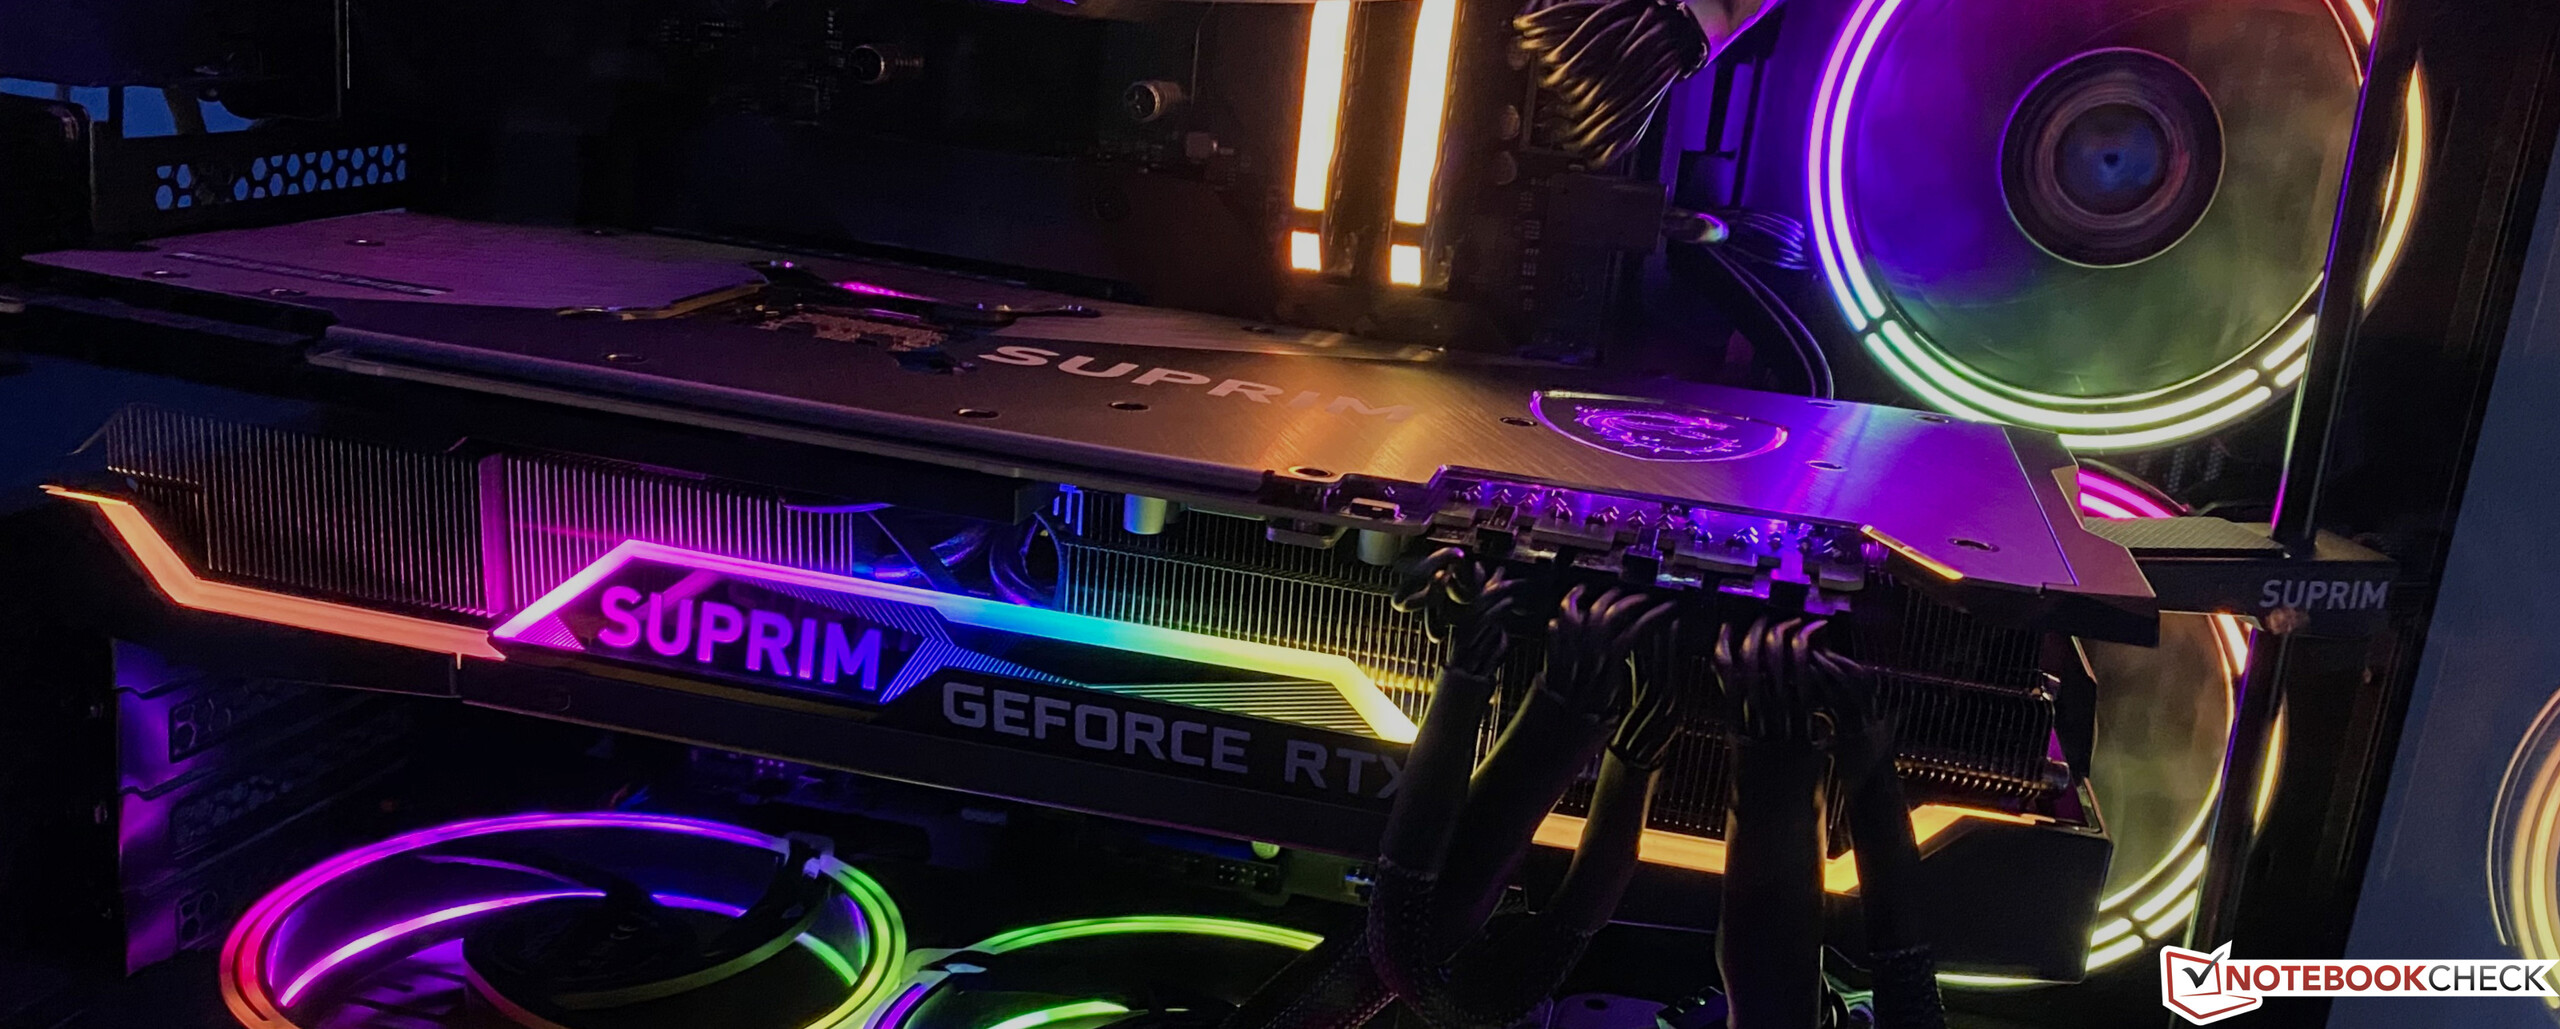
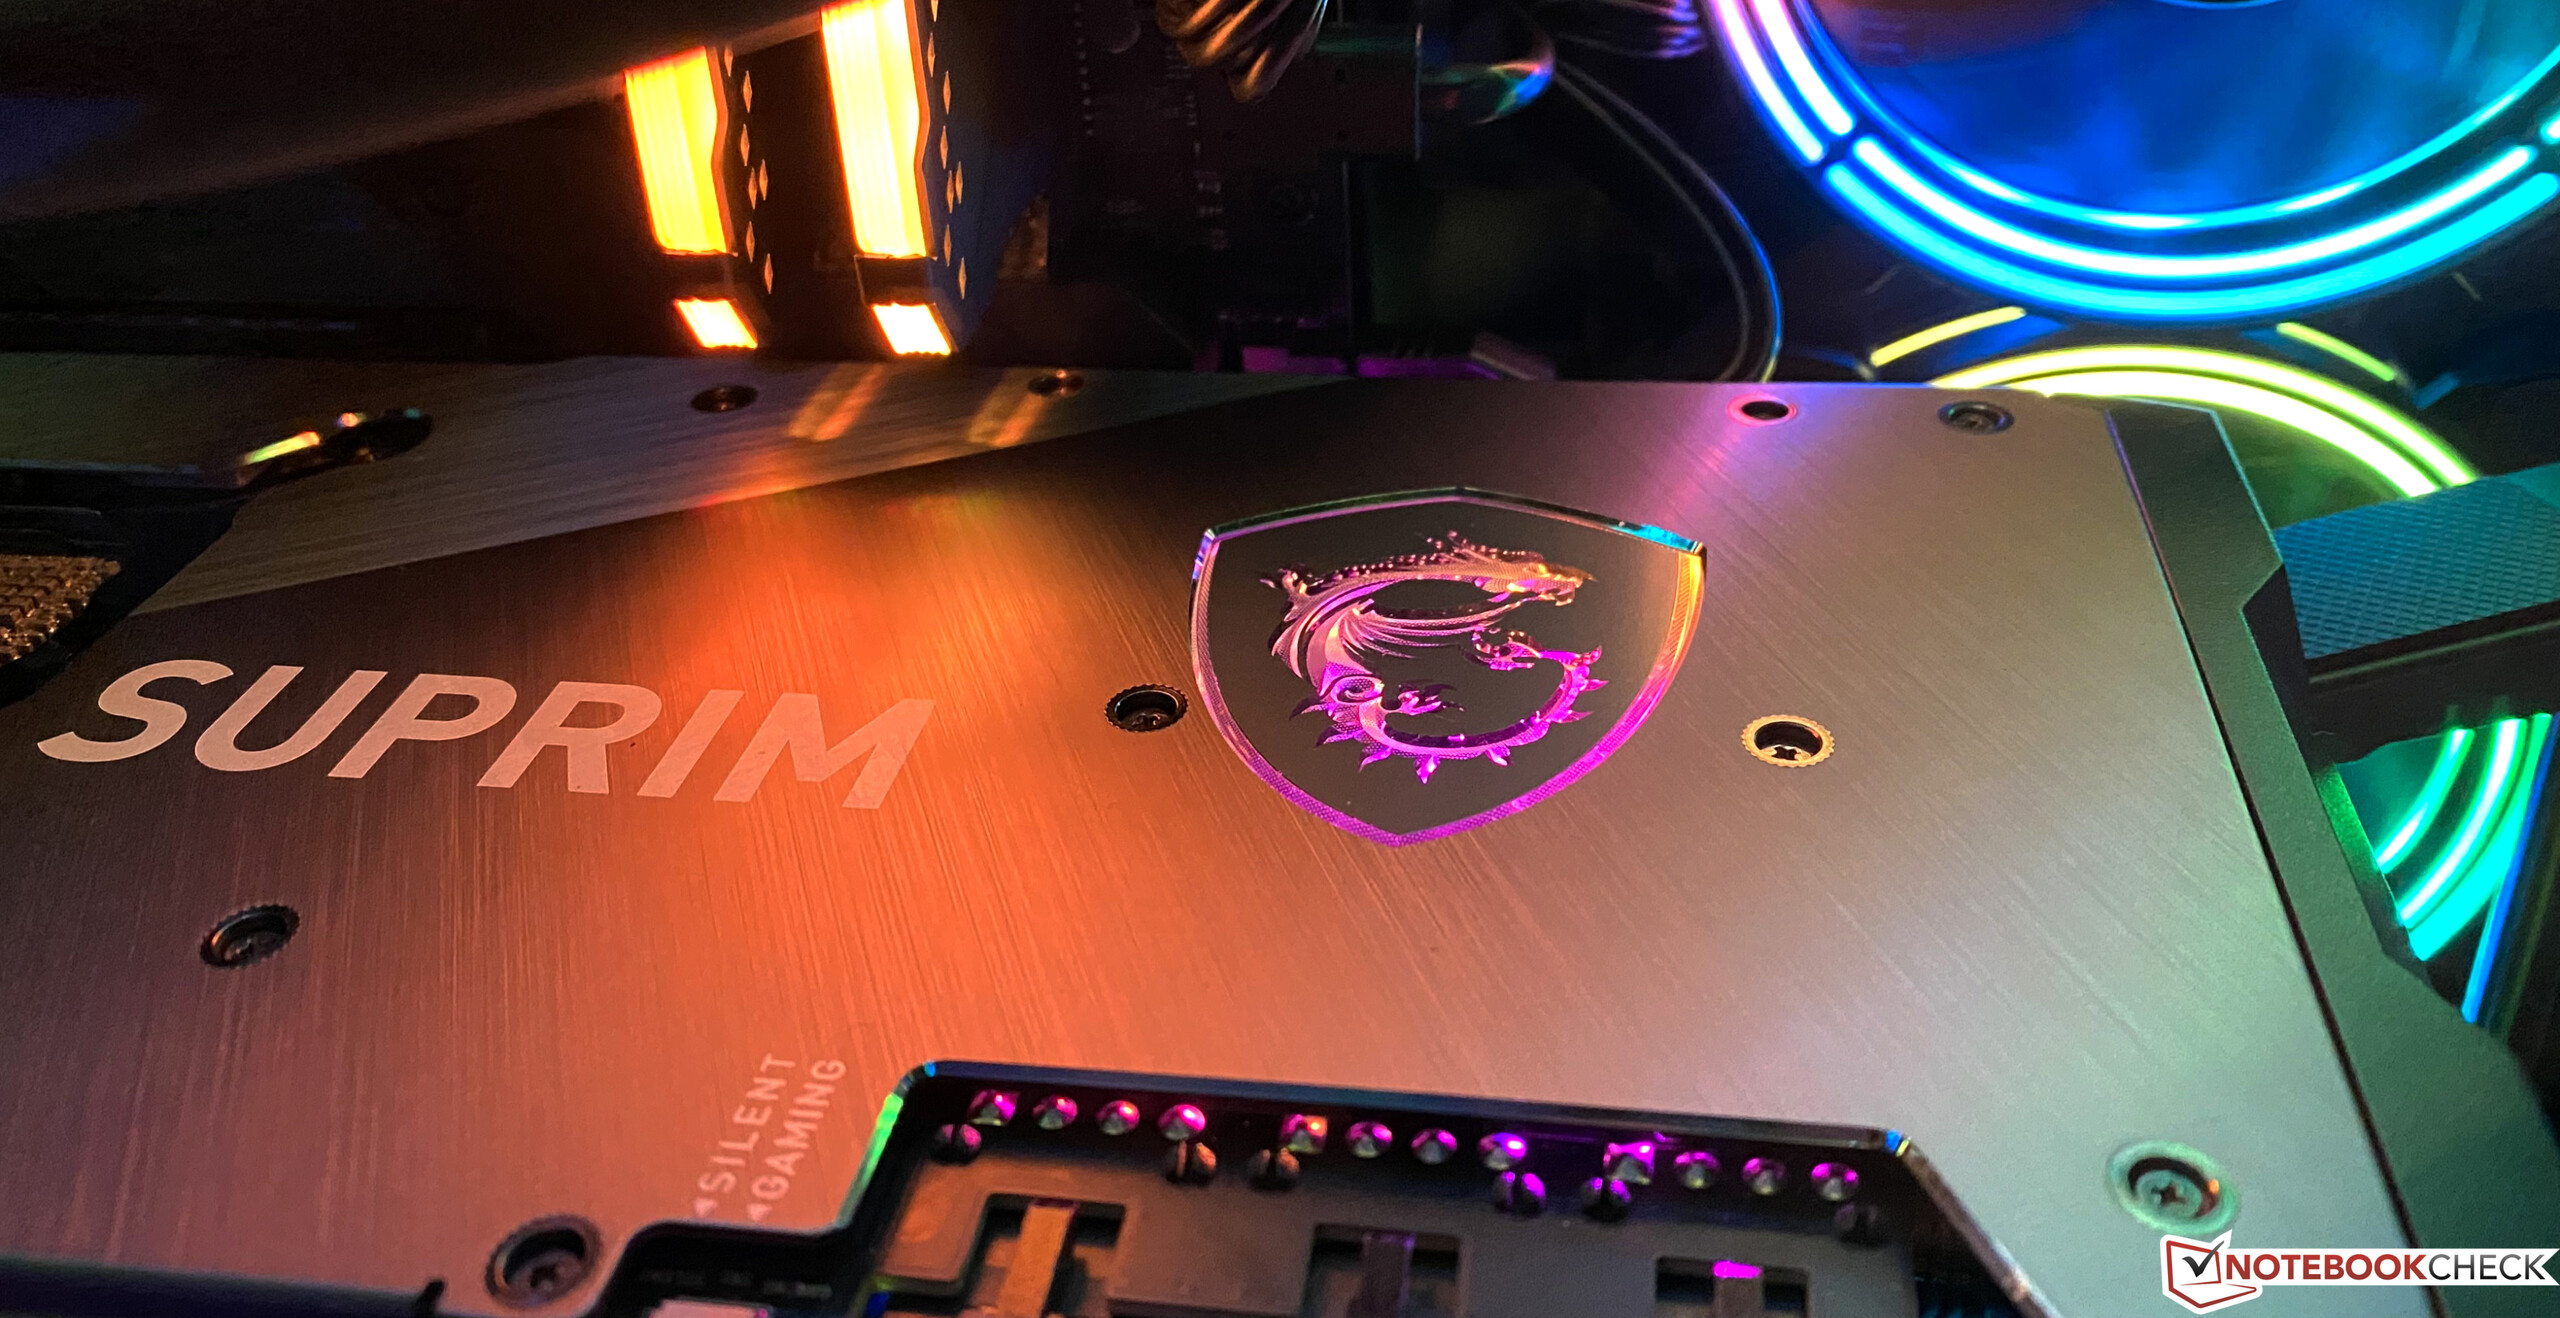
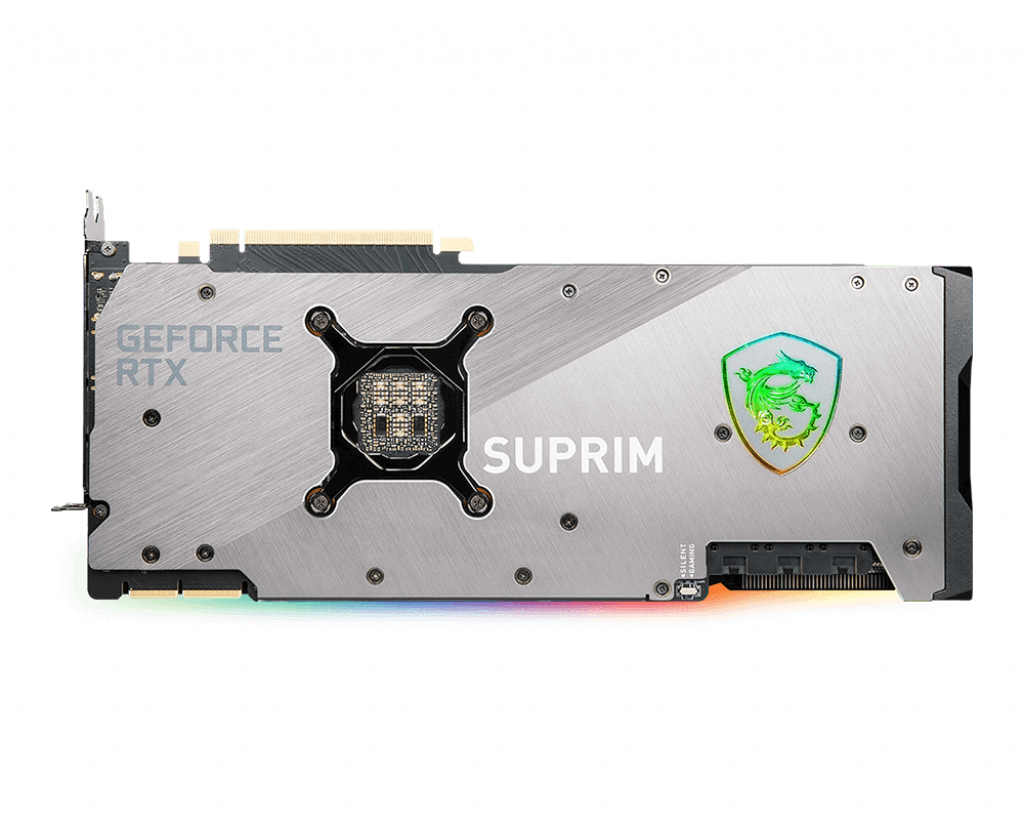
The build quality of the MSI GeForce RTX 3090 Suprim X is very high. This graphics card looks and feels very high-end. The front and back are made of aluminum, although there are also some plastic elements on the front. However, these don't ruin the high-quality impression at all. A total of seven powerful heat pipes distribute the heat to the huge heat sink, because the 420 watts also need to be kept in check. Moreover, you can still always count on RGB lighting as well. The MSI GeForce RTX 3090 Suprim X has many illuminated elements that literally beg for a case with a window side panel.
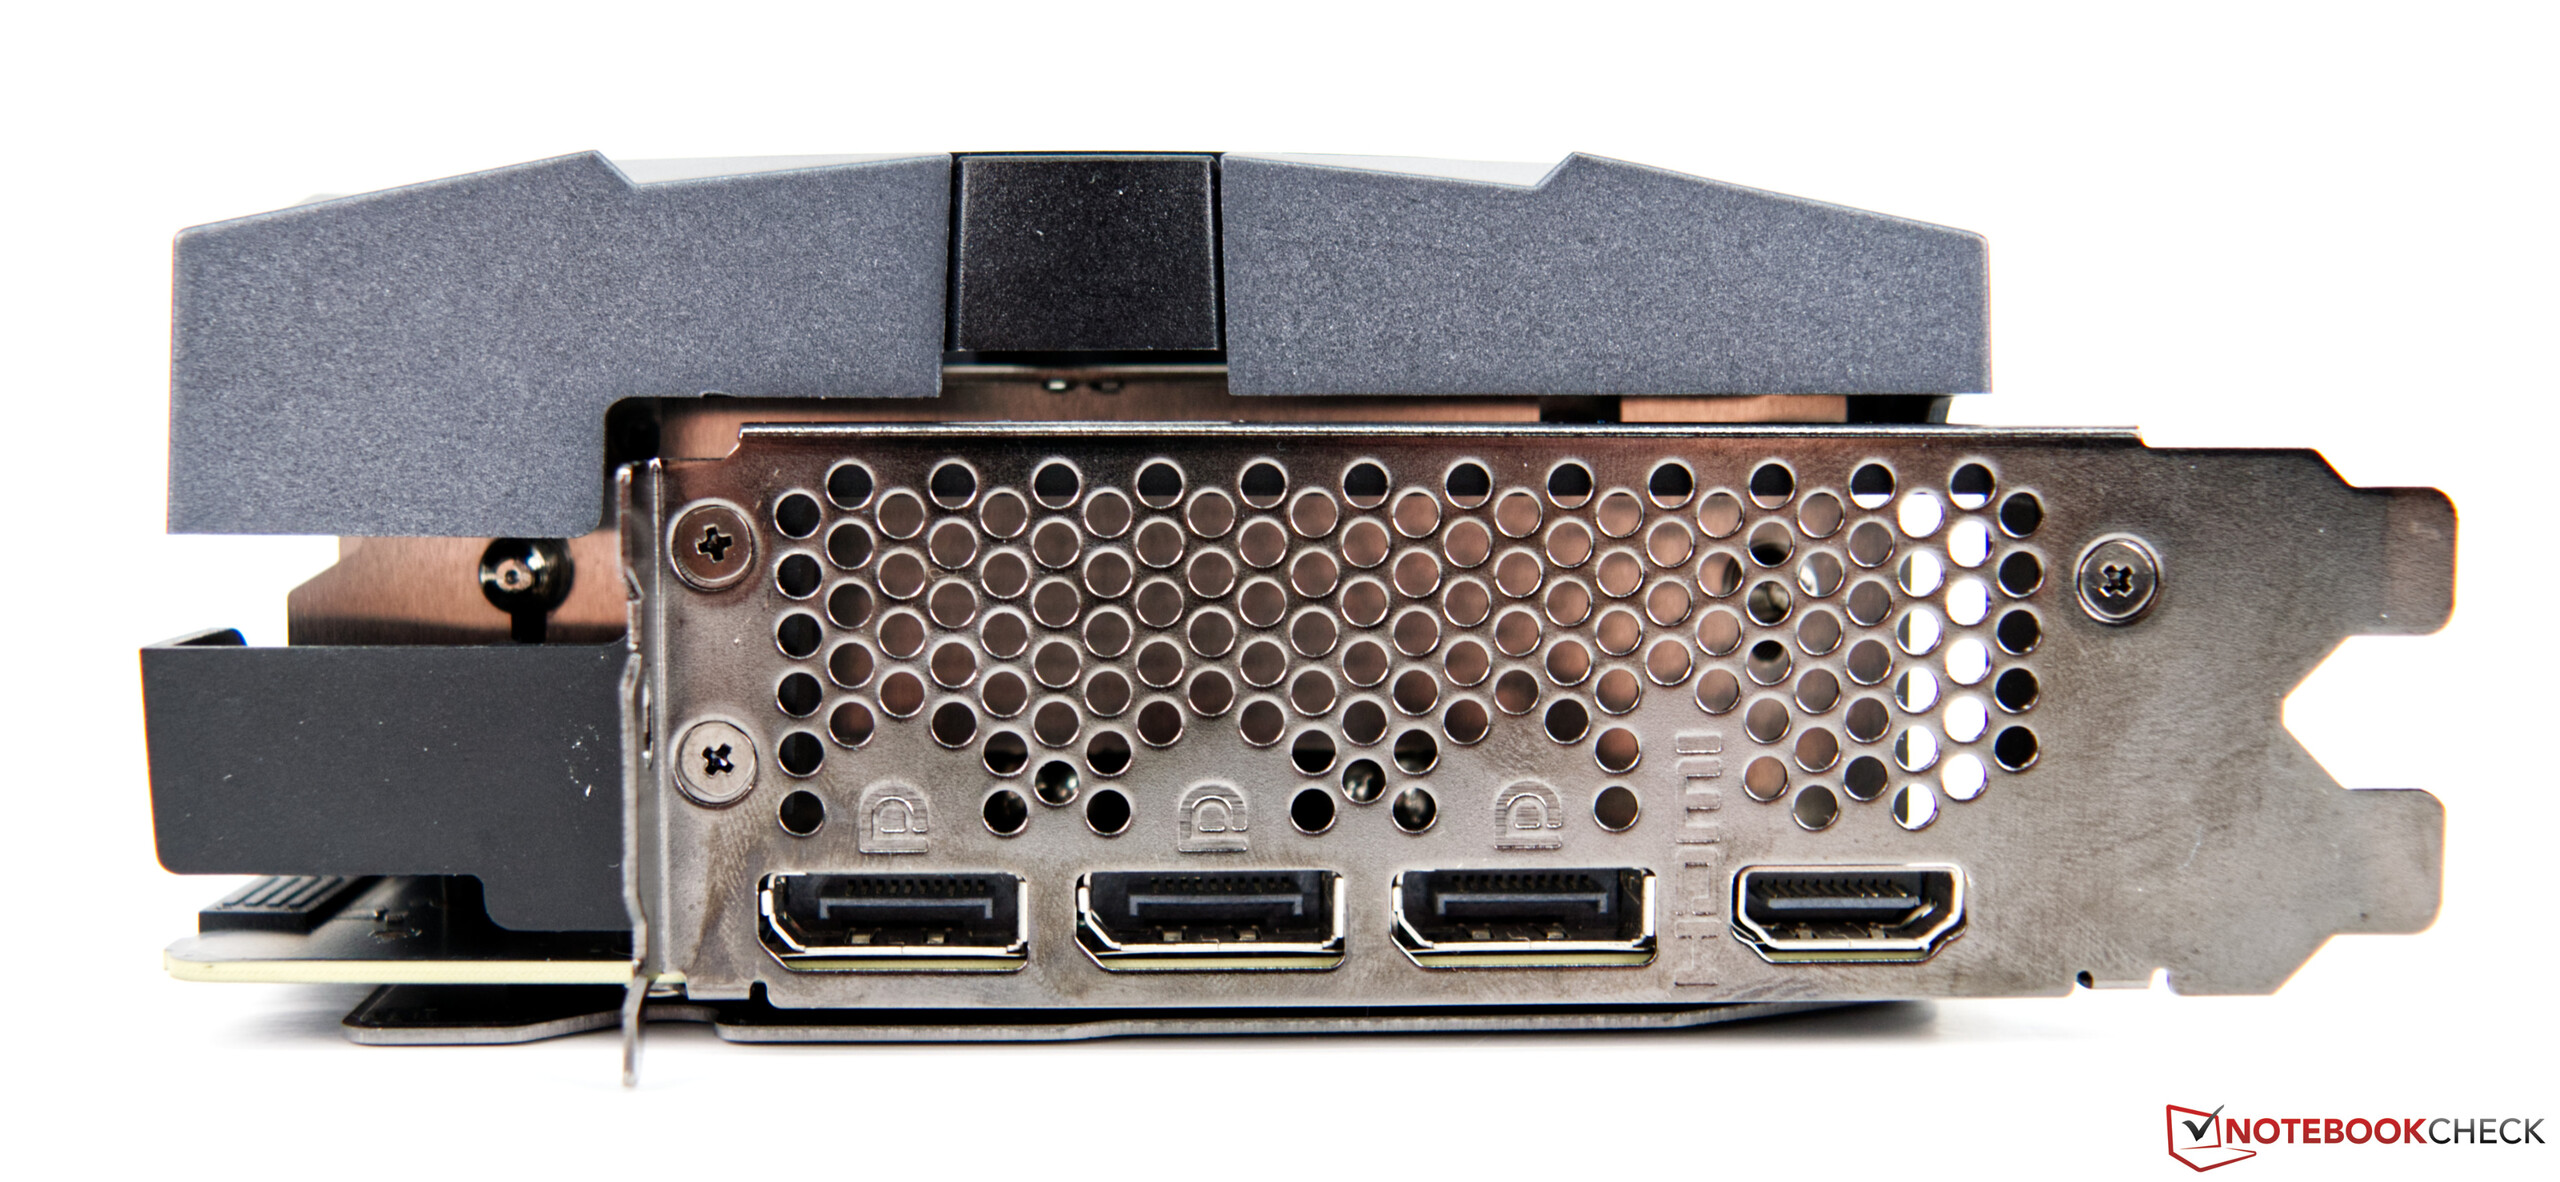
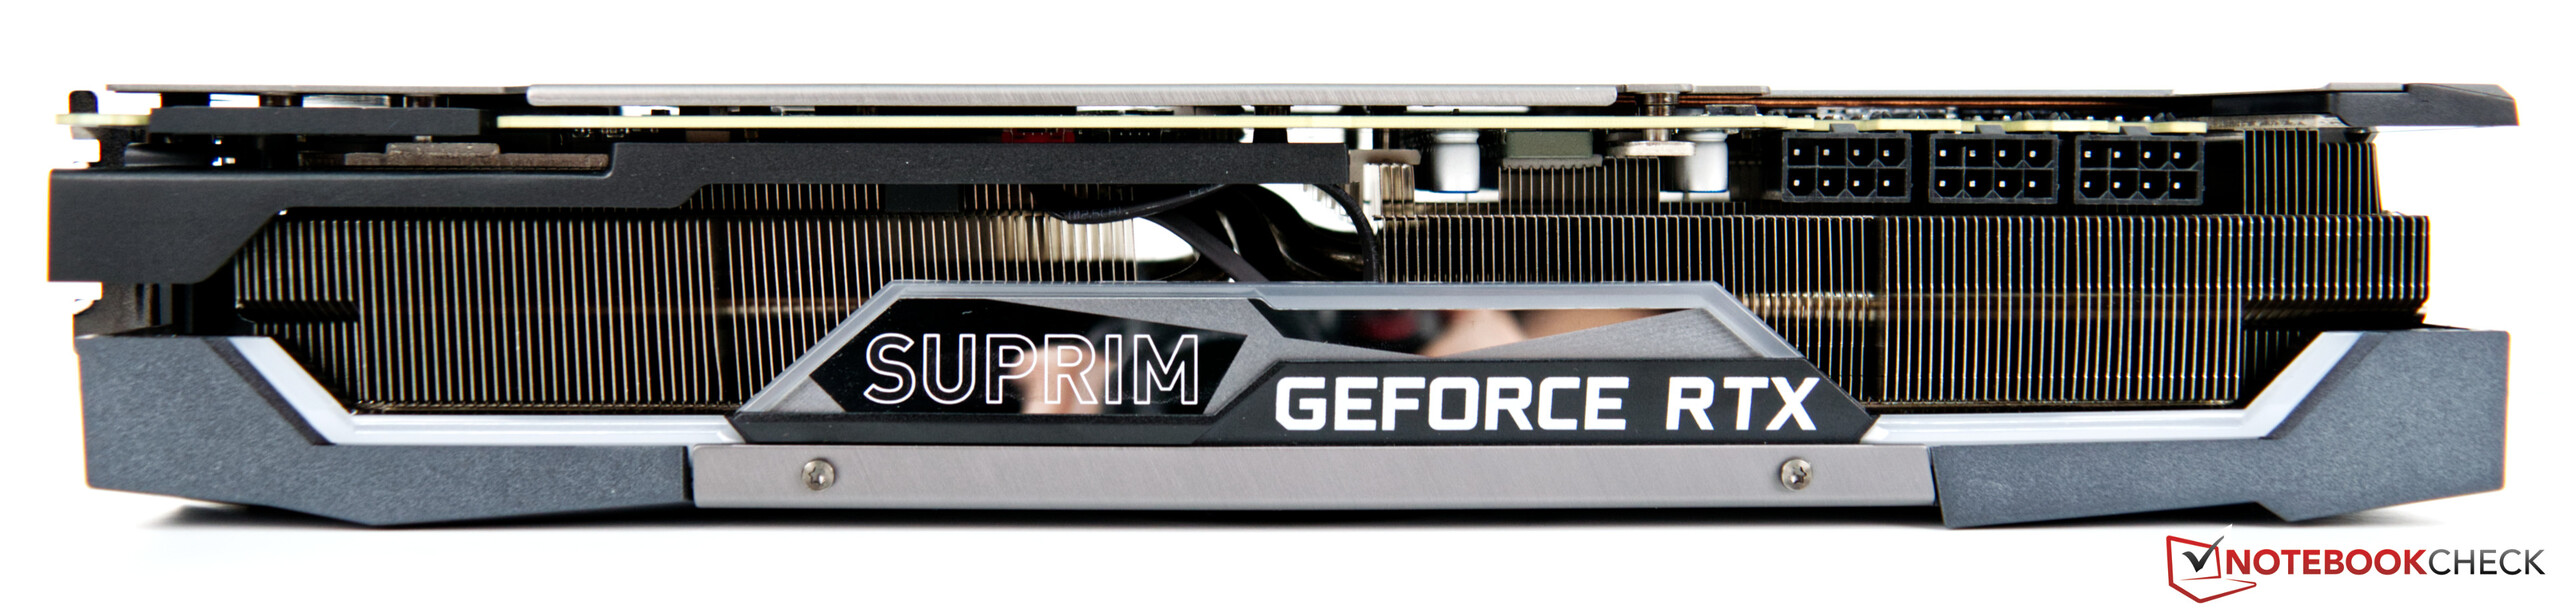
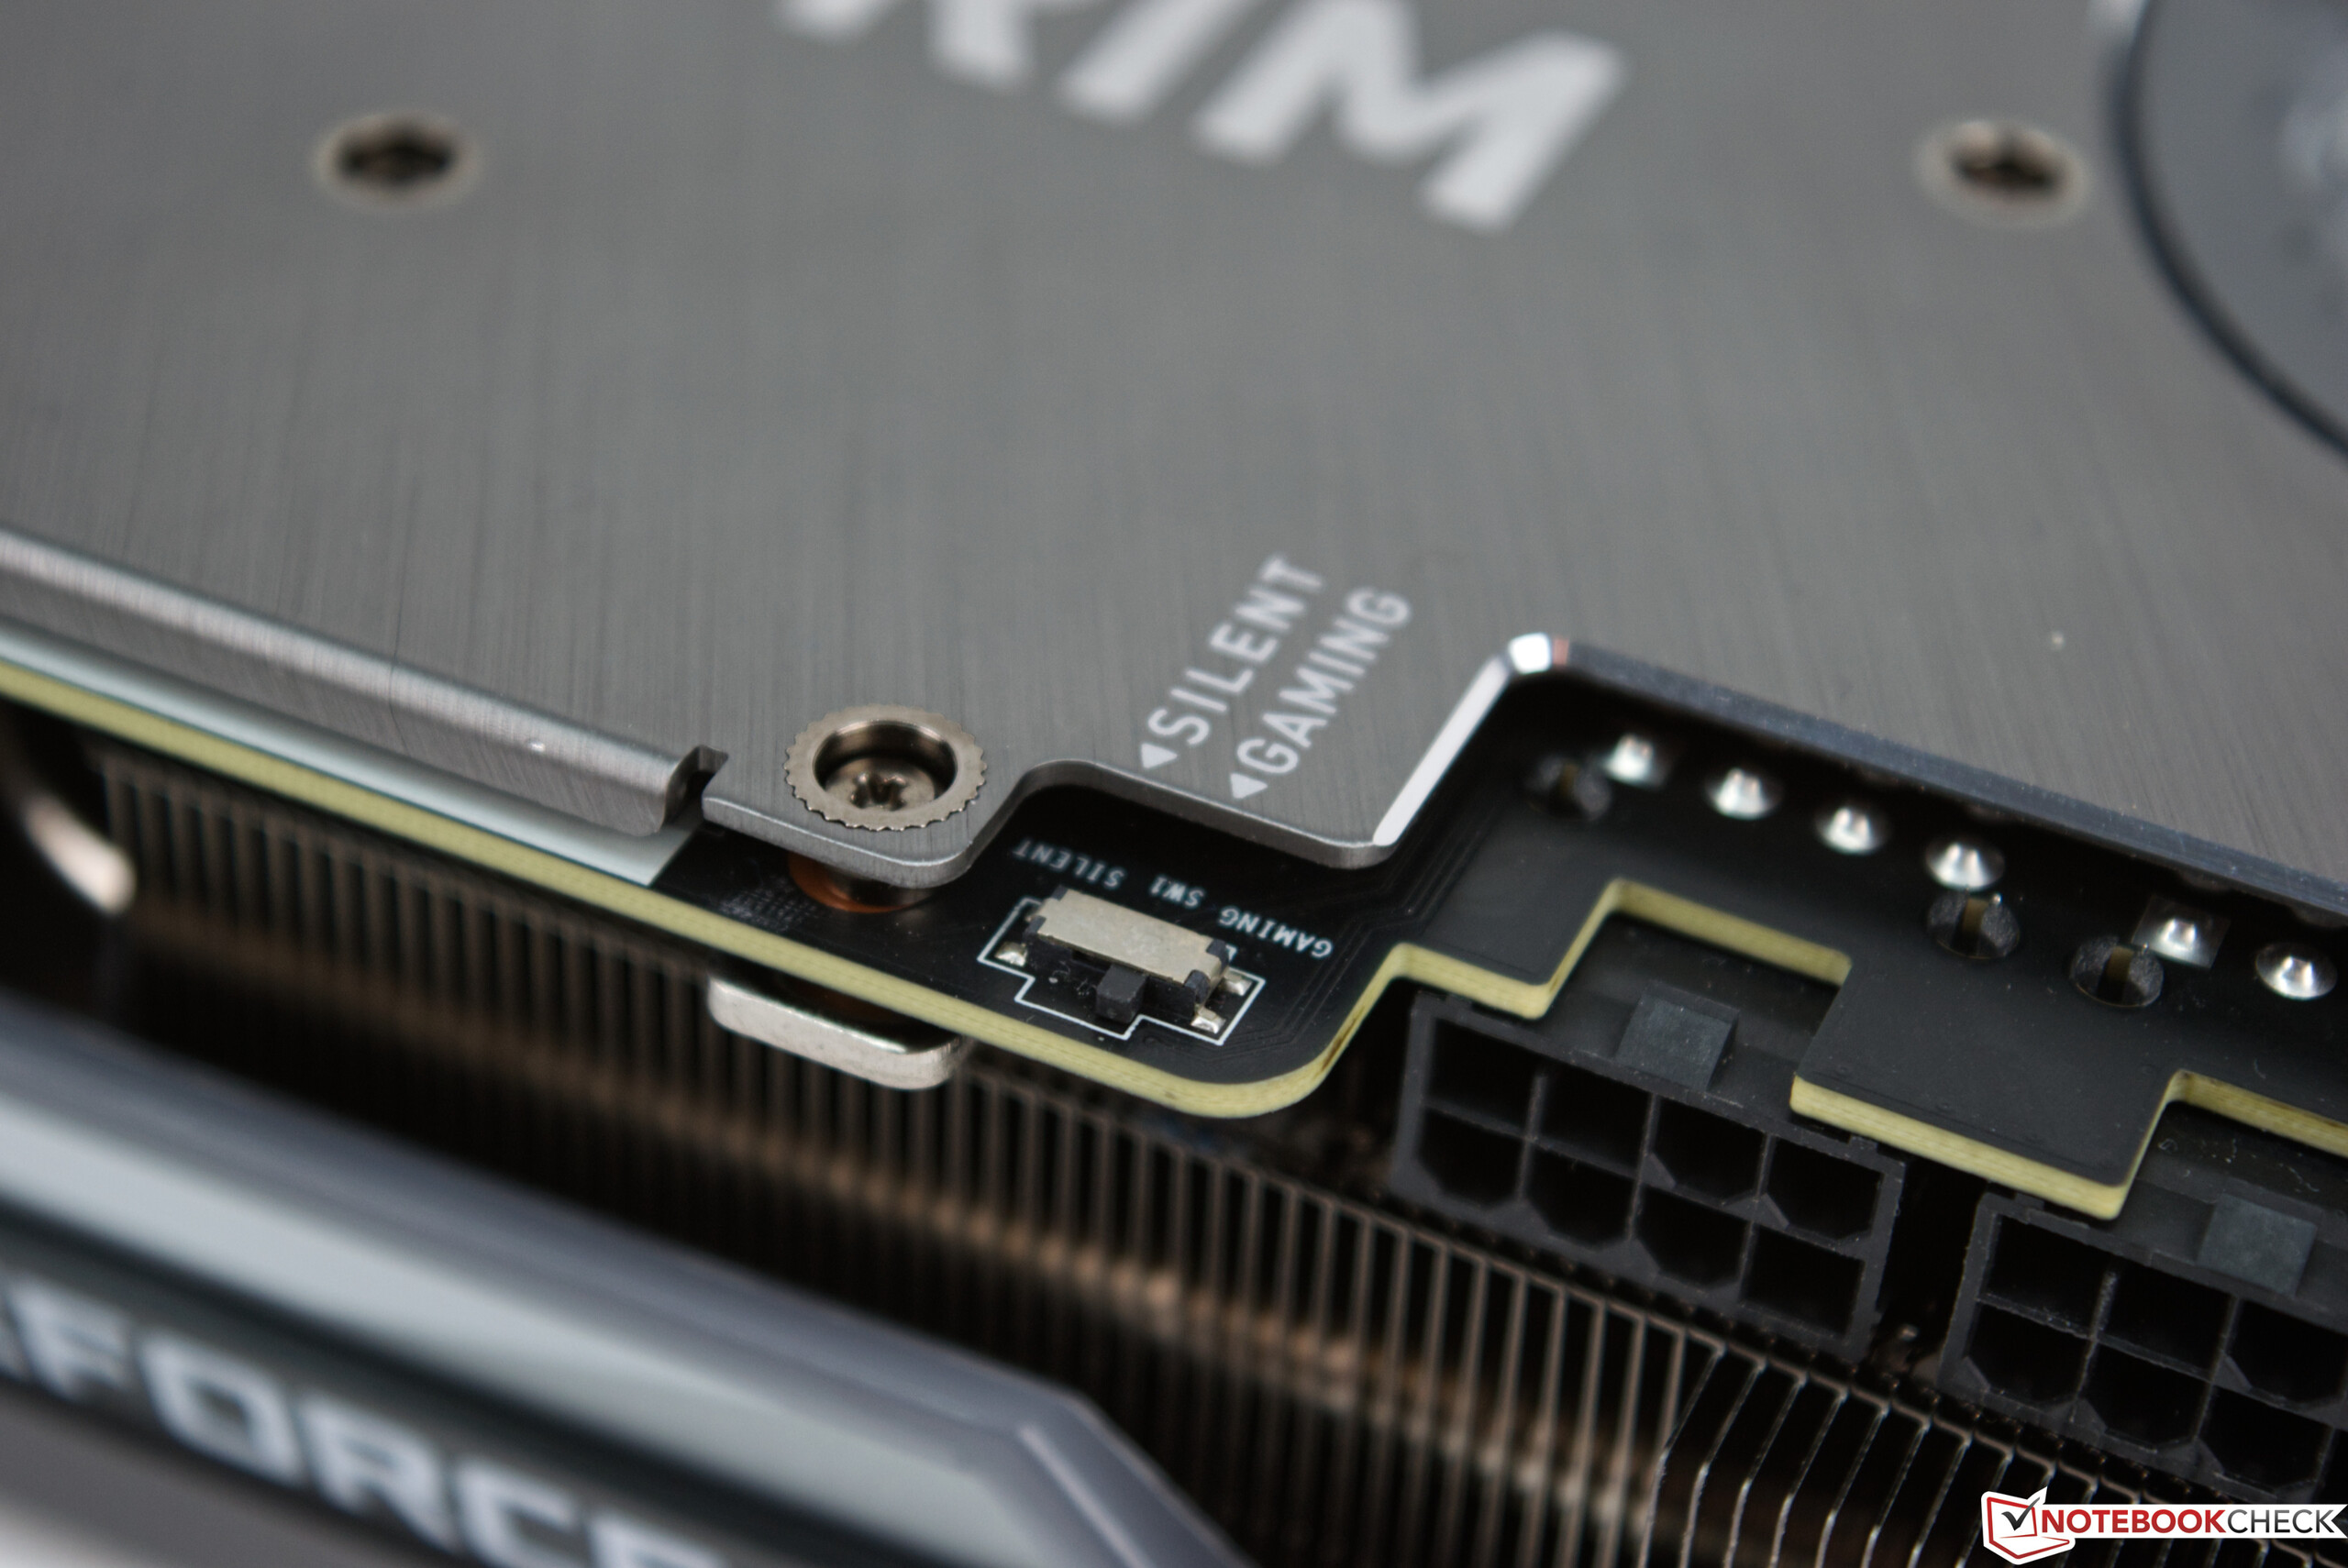
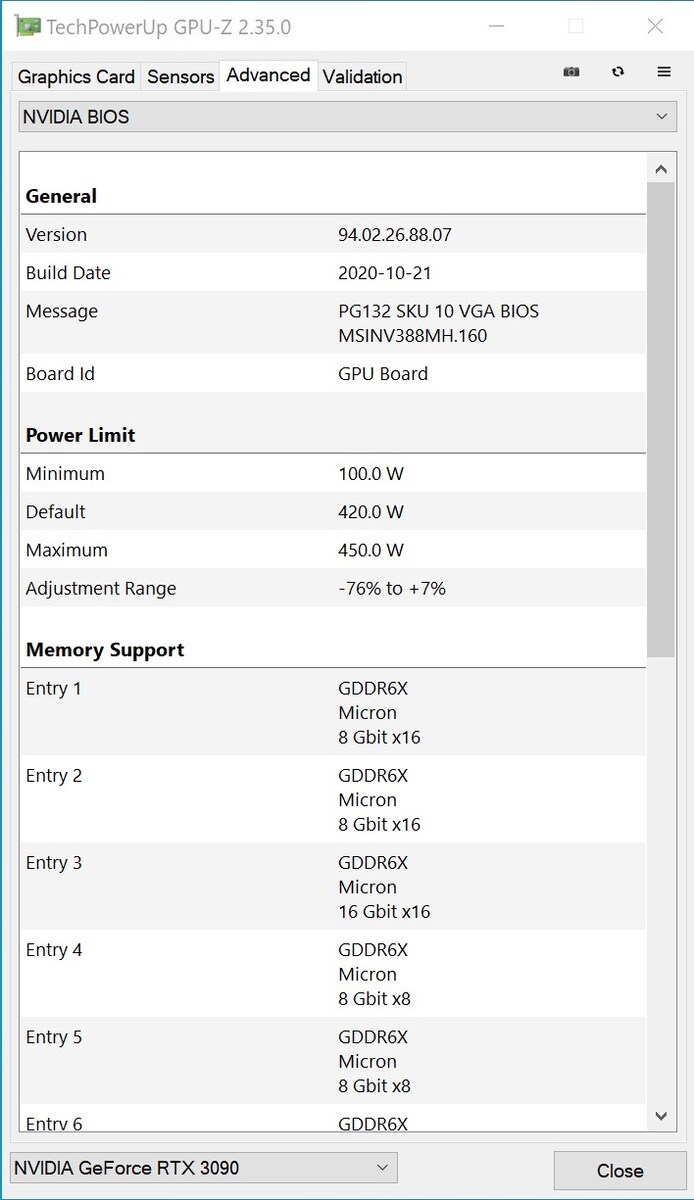
As already mentioned, the MSI GeForce RTX 3090 Suprim X is equipped with a 420-watt BIOS, which means that using three 8-pin power connectors is unavoidable. Externally, 8K displays at up to 60 Hz can be connected via HDMI thanks to the 2.1 standard. Likewise, 4K at 120 Hz is also possible via this connection, and this was able to be confirmed in the test too. Furthermore, there are three DisplayPort 1.4a connections.


The MSI GeForce RTX 3090 Suprim X compared with other NVIDIA GPUs
| Specification | RTX 3090 (Suprim X) | RTX 3090 (FE) | RTX 3080 FE | RTX 3070 FE | Titan RTX | TITAN X Pascal | RTX 2080 Ti | RTX 2080 |
| Chip | GA102 | GA102 | GA102 | GA104 | TU102 | GP102 | TU102 | TU104 |
| FinFET process | 8 nm | 8 nm | 8 nm | 8 nm | 12 nm | 16 nm | 12 nm | 12 nm |
| CUDA cores | 10,496 | 10,496 | 8,704 | 5,888 | 4,608 | 3,584 | 4,352 | 2,944 |
| Texture units | 328 | 328 | 272 | 184 | 288 | 224 | 272 | 184 |
| Tensor cores | 328 3rd Gen. | 328 3rd Gen. | 272 3rd Gen. | 184 3rd Gen. | 576 2nd Gen. | - | 544 2nd Gen. | 368 2nd Gen. |
| RT cores | 82 | 82 | 68 | 46 | 72 | - | 68 | 46 |
| GPU base clock | 1,395 MHz | 1,395 MHz | 1,440 MHz | 1,500 MHz | 1,350 MHz | 1,417 MHz | 1,350 MHz | 1,515 MHz |
| GPU boost clock | 1,860 MHz | 1,695 MHz | 1,710 MHz | 1,750 MHz | 1,770 MHz | 1,531 MHz | 1,545 MHz | 1,710 MHz |
| Memory bus | 384-bit | 384-bit | 320-bit | 256-bit | 384-bit | 384-bit | 352-bit | 256-bit |
| Memory bandwidth | 936 GB/s | 936 GB/s | 760 GB/s | 448 GB/s | 672 GB/s | 480.4 GB/s | 616 GB/s | 448 GB/s |
| Video memory | 24 GB GDDR6X | 24 GB GDDR6X | 10 GB GDDR6X | 8 GB GDDR6 | 24 GB GDDR6 | 12 GB GDDR5X | 11 GB GDDR6 | 8 GB GDDR6 |
| Power consumption | 420 W | 350 W | 320 W | 220 W | 280 W | 250 W | 250 W | 215 W |
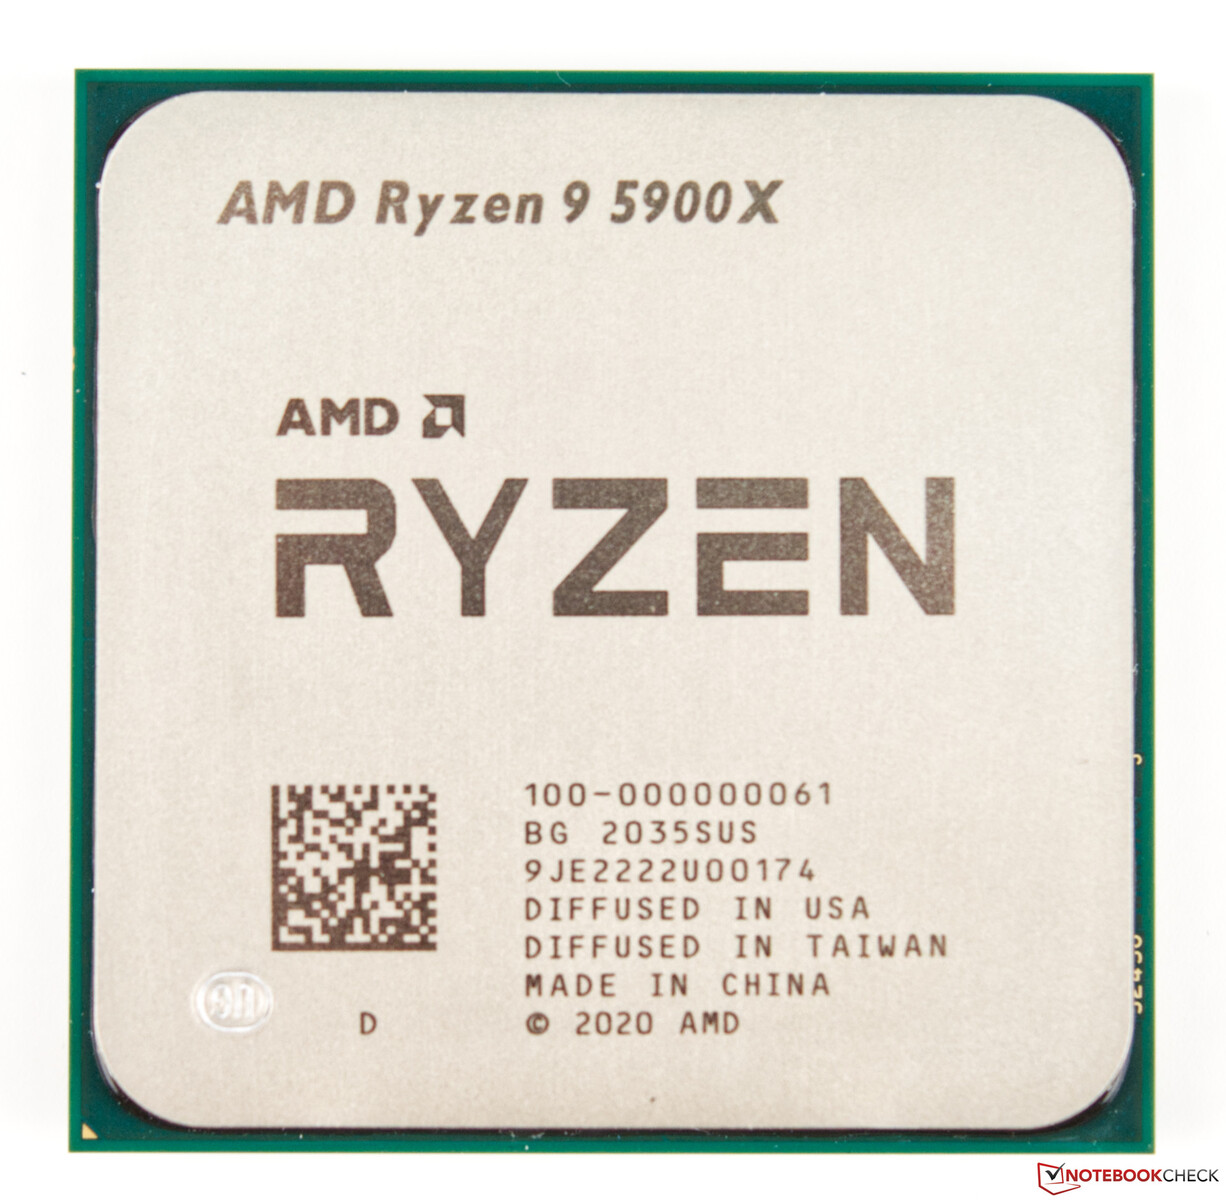
Our test system with the AMD Ryzen 9 5900X as base
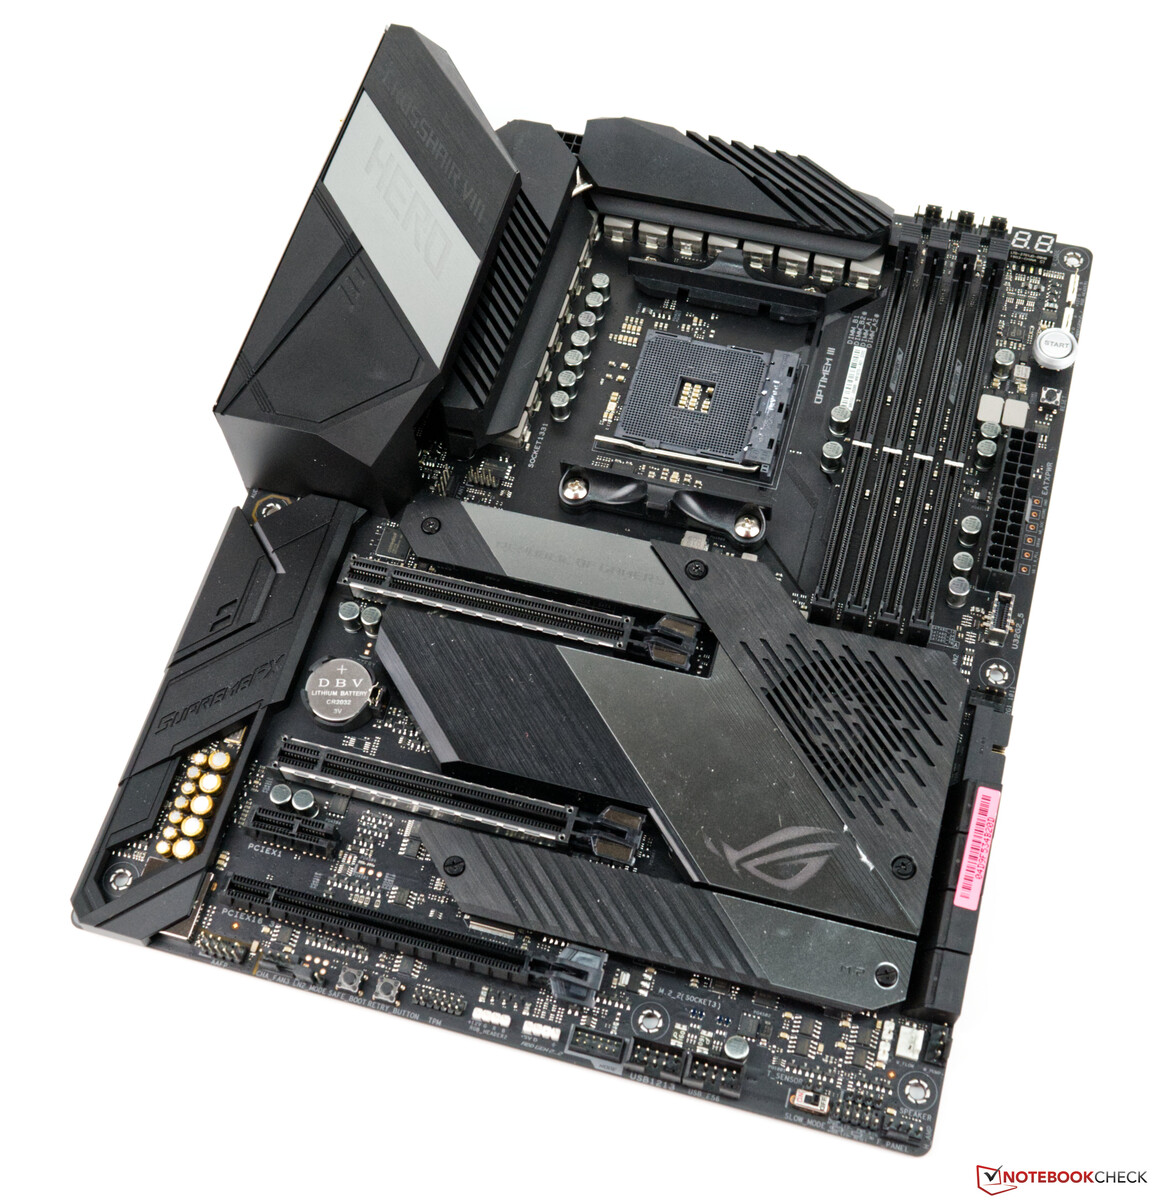
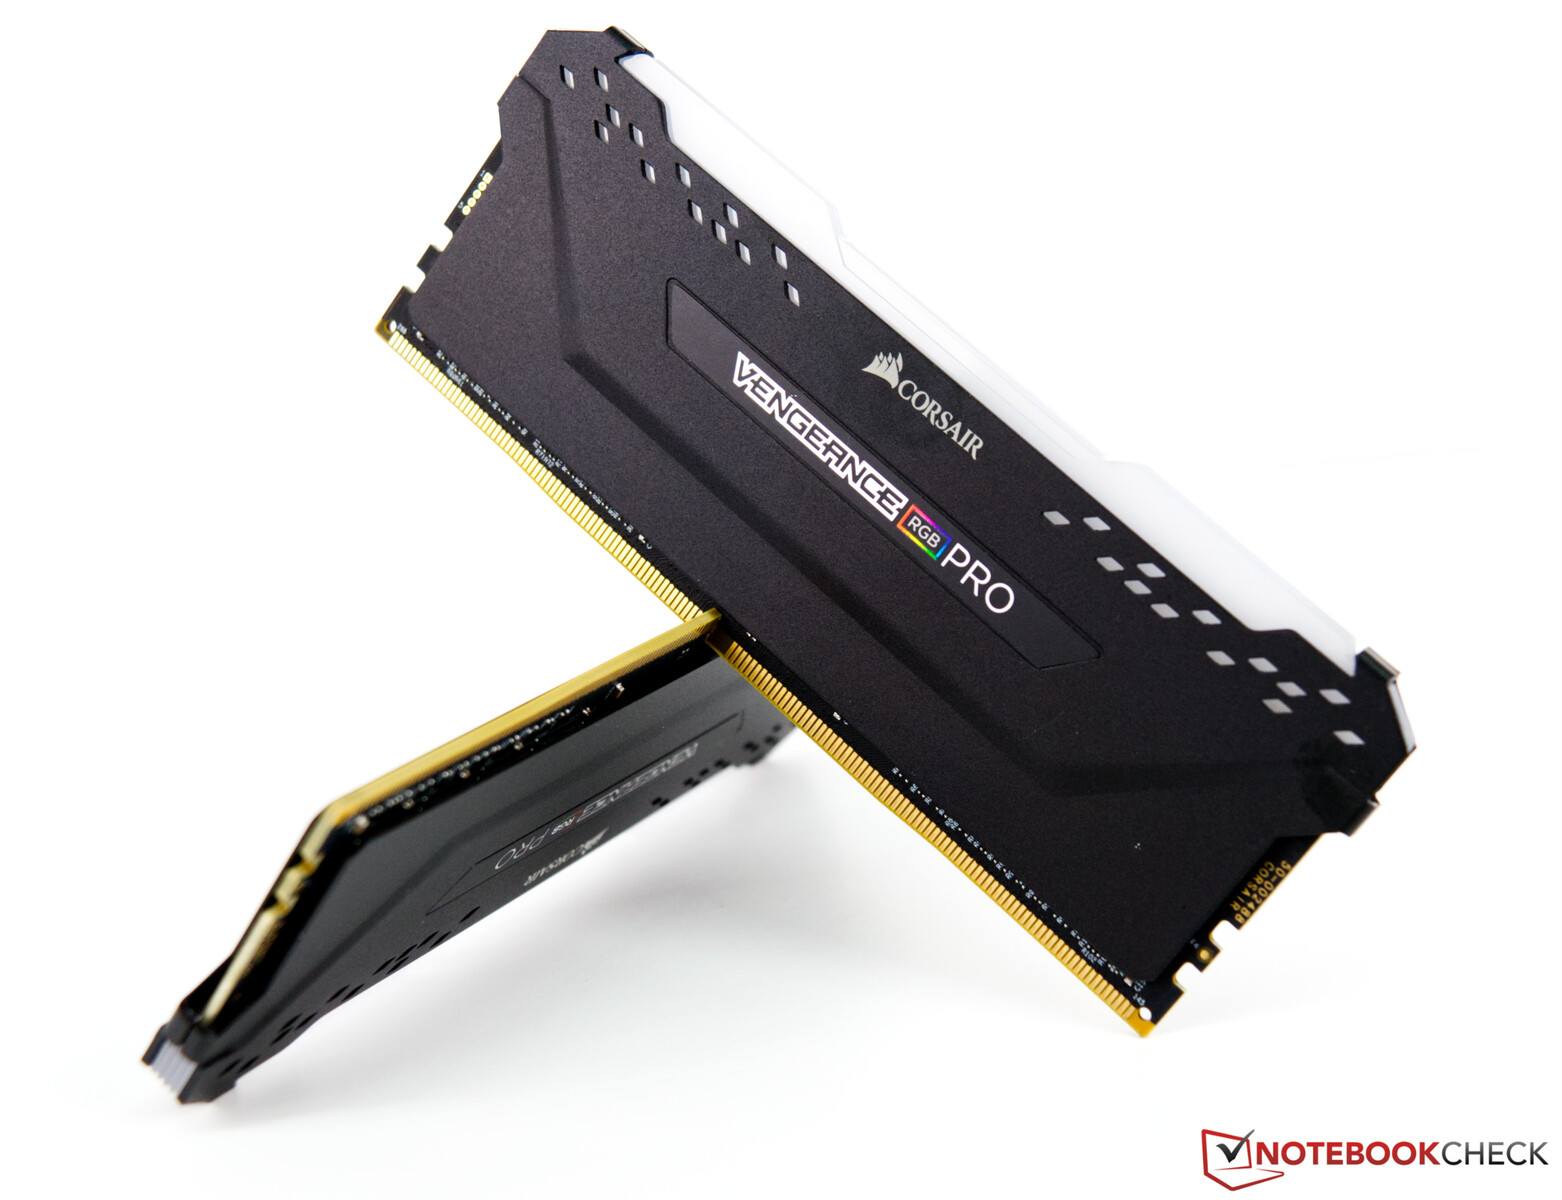
A current AMD platform based on the Asus X570 ROG Crosshair VIII serves as the test system. The CPU (AMD Ryzen 9 5900X) offers good CPU performance, and we use an AIO water cooler (Alphacool Eisbaer 280 mm) for cooling. The 32 GB of RAM comes from Corsair and clocks at 4,000 MHz. We use the Acer Predator XB321HK as monitor. It doesn't limit us due to its UHD capability. At this point, we would like to thank AMD for providing the test platform as well as Corsair for the RAM kit.
For the upcoming benchmarks and tests, we use the following system:
- Lian Li O11 Dynamic
- AMD Ryzen 9 5900X
- MSI GeForce RTX 3090 Suprim X (Nvidia driver 457.30)
- Asus X570 ROG Crosshair VIII Hero Wi-Fi (BIOS 2402, default settings, XMP 1 for DDR4-4000)
- Corsair RM1000X 1,000-watt power supply unit
- Corsair Vengeance RGB Pro DDR4-4000 2 x 16 GB RAM kit
- Corsair MP600 2 TB M.2 PCIe 4.0 SSD
- Crucial MX500 2 TB (for games)
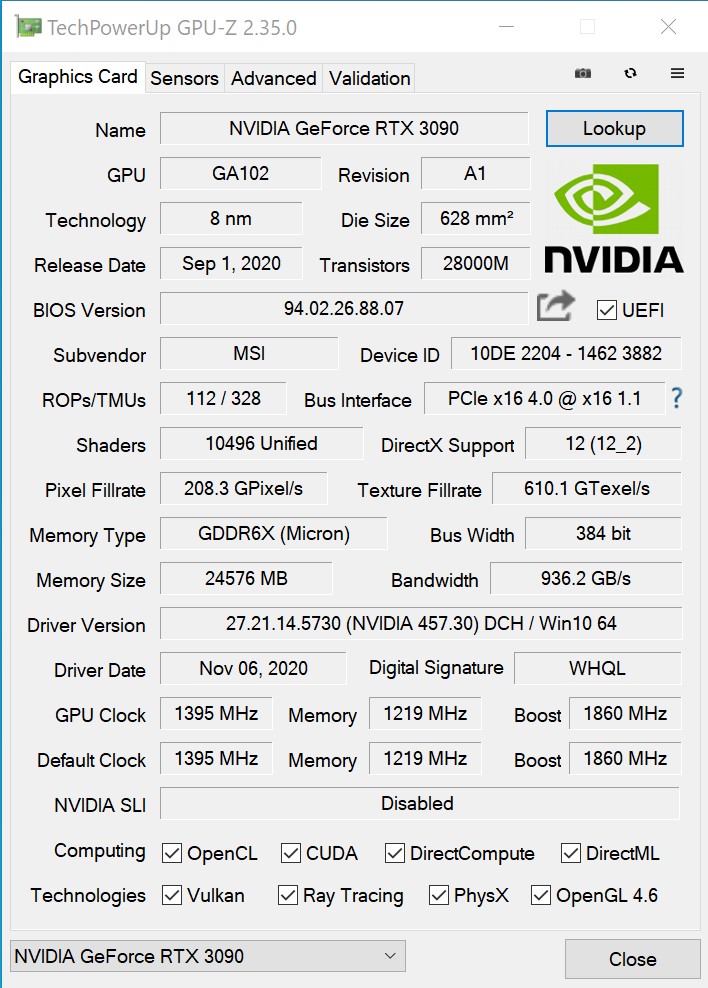
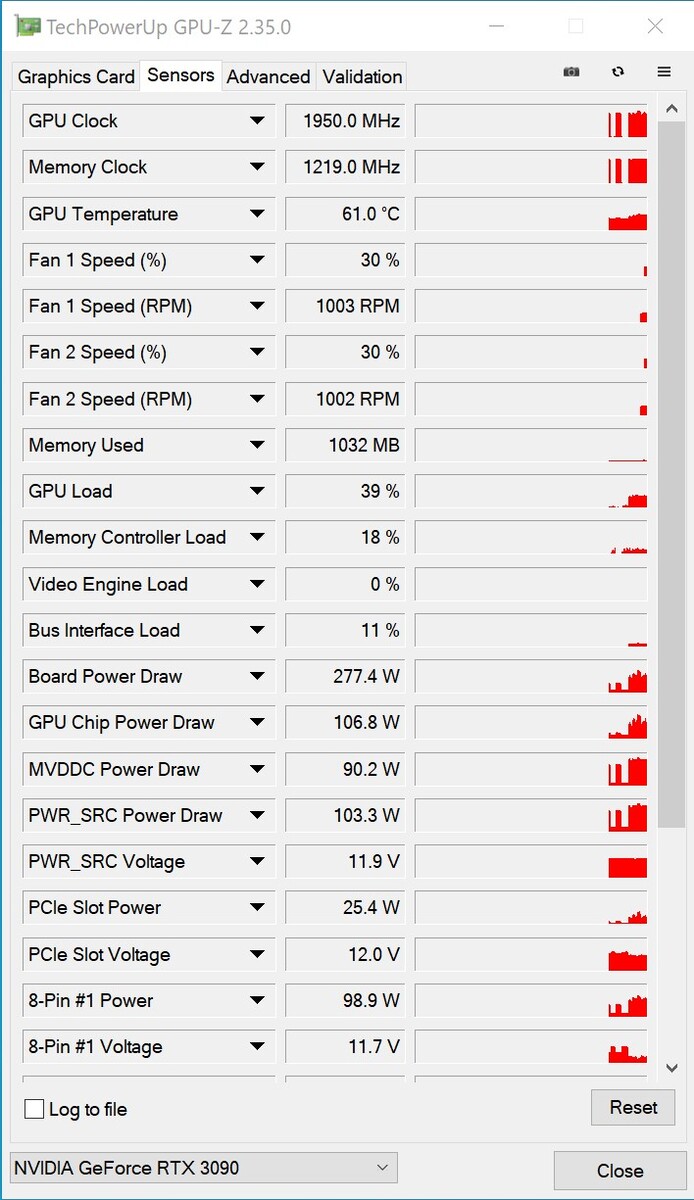
The clock speeds of the MSI GeForce RTX 3090 Suprim X
MSI keeps the base clock speed in line with the reference model. Nevertheless, at 1,860 MHz, MSI increases the boost clock rate of the RTX 3090 Suprim X significantly. In addition, the OC mode can be activated within MSI's Dragon Center, which increases the boost clock speed to an even higher 1,875 MHz. All the tests in this review were performed under the default settings and without OC mode. The VRAM remains unchanged as well, which is why the memory bandwidth is identical to the reference model.
Synthetic benchmarks
In the synthetic benchmarks, the MSI GeForce RTX 3090 Suprim X and the AMD Radeon RX 6800 XT are almost on par. The gap to the GeForce RTX 3080 is clearly visible and increases at higher resolutions. Compared to the GeForce RTX 2080 Ti, the lead of the new flagship grows to 40 to 50%. The Nvidia Titan RTX is based on the same chip as the RTX 2080 Ti and lags behind by a similar margin.
Due to the good cooling and the higher TDP in the MSI GeForce RTX 3090 Suprim X, performance should be better than with Nvidia's Founders Edition. However, we can't make valid statements regarding the reference model's performance at the moment, since we haven't been able to test this model yet.
| Unigine Superposition | |
| 1280x720 720p Low | |
| Titan RTX | |
| Radeon RX 6800 XT | |
| MSI GeForce RTX 3090 Suprim X | |
| GeForce RTX 3070 | |
| GeForce RTX 3080 | |
| 1920x1080 1080p High | |
| MSI GeForce RTX 3090 Suprim X | |
| Radeon RX 6800 XT | |
| GeForce RTX 3080 | |
| Titan RTX | |
| GeForce RTX 3070 | |
| 1920x1080 1080p Extreme | |
| MSI GeForce RTX 3090 Suprim X | |
| GeForce RTX 3080 | |
| Radeon RX 6800 XT | |
| Titan RTX | |
| GeForce RTX 3070 | |
| 3840x2160 4k Optimized | |
| MSI GeForce RTX 3090 Suprim X | |
| GeForce RTX 3080 | |
| Radeon RX 6800 XT | |
| Titan RTX | |
| GeForce RTX 3070 | |
| 7680x4320 8k Optimized | |
| MSI GeForce RTX 3090 Suprim X | |
| GeForce RTX 3080 | |
| Titan RTX | |
| Radeon RX 6800 XT | |
| GeForce RTX 3070 | |
Game benchmarks
To start with, we can say that the MSI GeForce RTX 3090 Suprim X can handle all modern titles without any problems. Occasionally, there are games where the average frame rate slips below the 60-FPS mark in 2160p. Nevertheless, smooth gaming is possible, and you don't get the impression that you're watching a slideshow.
Compared with the GeForce RTX 3080, the GeForce RTX 3090 can repeatedly set itself apart a bit. Nonetheless, the graphics card always requires very high resolutions in order to also be able to take advantage of the performance difference. However, in comparison with AMD's Radeon RX 6800 XT, the GeForce RTX 3090's performance plus is much bigger than we saw in the synthetic benchmarks. Performance varies depending on the game, although the AMD Radeon RX 6800 XT always sets the tone.
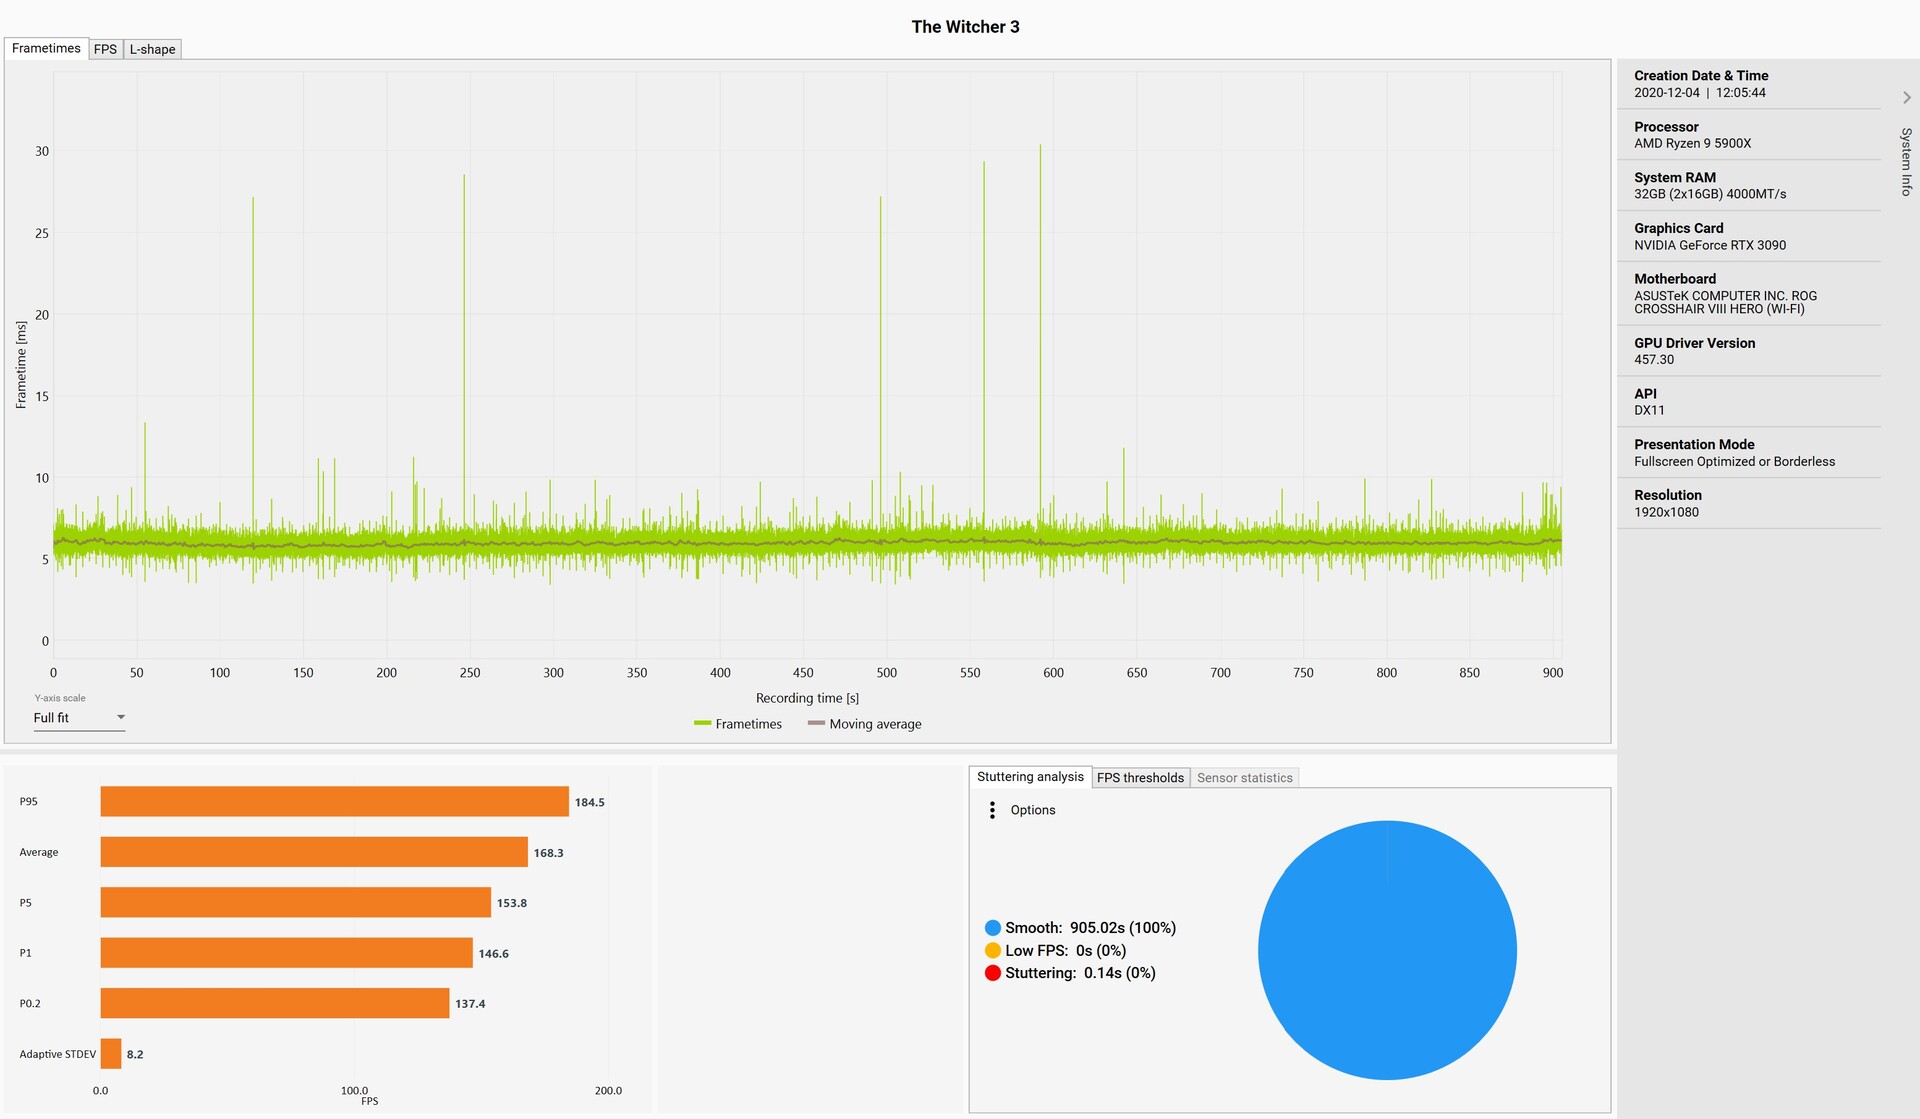
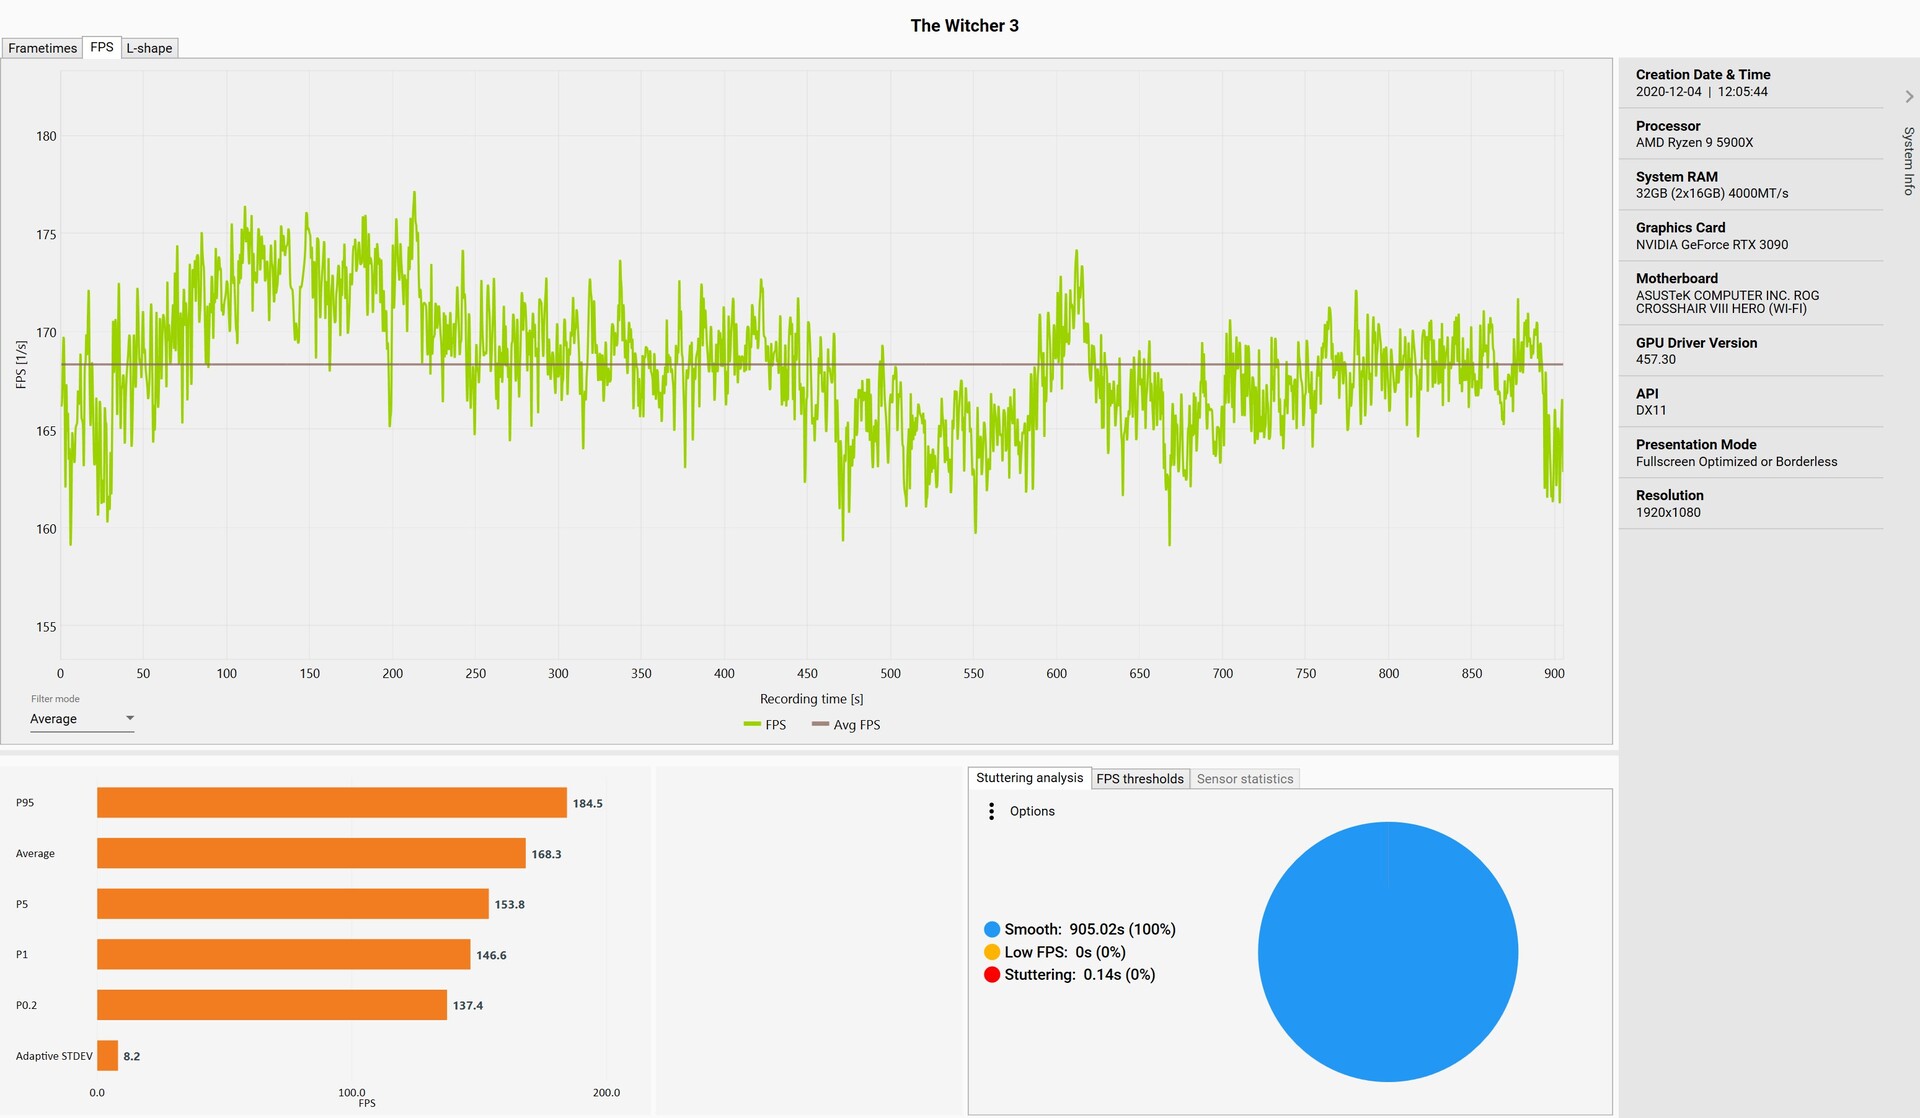
We use the game The Witcher 3 (Ultra preset) to log the frame times and the frame progression, since it also scales very well with the latest graphics cards. There are no anomalies in the frame times. Nevertheless, there are only a few isolated outliers that do not affect the smooth gameplay. When it comes to the frame progression, the frame rates are a bit better in the first third; they stabilize in the further course, though, and show a very good result of 168 FPS over the entire period. For comparison purposes: The Asus GeForce RTX 3080 ROG Strix Gaming OC achieved 139 FPS.
| F1 2020 - 3840x2160 Ultra High Preset AA:T AF:16x | |
| MSI GeForce RTX 3090 Suprim X | |
| Radeon RX 6800 XT | |
| GeForce RTX 3080 | |
| Titan RTX | |
| GeForce RTX 3070 | |
| Borderlands 3 - 3840x2160 Badass Overall Quality (DX11) | |
| MSI GeForce RTX 3090 Suprim X | |
| GeForce RTX 3080 | |
| Radeon RX 6800 XT | |
| Titan RTX | |
| Titan RTX | |
| GeForce RTX 3070 | |
| GeForce RTX 2080 Ti (Desktop) | |
| Red Dead Redemption 2 - 3840x2160 Maximum Settings | |
| MSI GeForce RTX 3090 Suprim X | |
| GeForce RTX 3080 | |
| Radeon RX 6800 XT | |
| GeForce RTX 3070 | |
| Titan RTX | |
| Rise of the Tomb Raider - 3840x2160 High Preset AA:FX AF:4x | |
| MSI GeForce RTX 3090 Suprim X | |
| GeForce RTX 3080 | |
| Radeon RX 6800 XT | |
| GeForce RTX 2080 Ti (Desktop) | |
| GeForce RTX 3070 | |
| GeForce RTX 2080 Super (Desktop) | |
| GeForce RTX 2080 (Desktop) | |
| GeForce RTX 2070 Super (Desktop) | |
| GeForce RTX 2070 (Desktop) | |
| Radeon VII | |
| GeForce RTX 2060 Super (Desktop) | |
| RX Vega 64 | |
| GeForce RTX 2060 (Desktop) | |
| Shadow of the Tomb Raider - 3840x2160 Highest Preset AA:T | |
| MSI GeForce RTX 3090 Suprim X | |
| GeForce RTX 3080 | |
| Radeon RX 6800 XT | |
| Titan RTX | |
| Titan RTX | |
| GeForce RTX 3070 | |
| GeForce RTX 2080 Ti (Desktop) | |
| GeForce RTX 2080 Super (Desktop) | |
| GeForce RTX 2080 (Desktop) | |
| Radeon VII | |
| GeForce RTX 2070 Super (Desktop) | |
| GeForce RTX 2070 (Desktop) | |
| Radeon RX 5700 XT (Desktop) | |
| GeForce RTX 2060 Super (Desktop) | |
| Radeon RX 5700 (Desktop) | |
| GeForce RTX 2060 (Desktop) | |
| RX Vega 64 | |
| Mafia Definitive Edition - 3840x2160 High Preset | |
| MSI GeForce RTX 3090 Suprim X | |
| GeForce RTX 3080 | |
| Titan RTX | |
| Radeon RX 6800 XT | |
| GeForce RTX 3070 | |
| Watch Dogs Legion - 3840x2160 Ultra Preset (DX12) | |
| MSI GeForce RTX 3090 Suprim X | |
| GeForce RTX 3080 | |
| Radeon RX 6800 XT | |
| Titan RTX | |
| GeForce RTX 3070 | |
| The Witcher 3 - 3840x2160 High Graphics & Postprocessing (Nvidia HairWorks Off) | |
| MSI GeForce RTX 3090 Suprim X | |
| GeForce RTX 3080 | |
| Radeon RX 6800 XT | |
| Titan RTX | |
| Titan RTX | |
| GeForce RTX 2080 Ti (Desktop) | |
| GeForce RTX 3070 | |
| GeForce RTX 2080 Super (Desktop) | |
| GeForce RTX 2080 (Desktop) | |
| GeForce RTX 2070 Super (Desktop) | |
| GeForce RTX 2070 (Desktop) | |
| GeForce RTX 2060 Super (Desktop) | |
| Radeon VII | |
| Radeon RX 5700 XT (Desktop) | |
| GeForce RTX 2060 (Desktop) | |
| RX Vega 64 | |
| Radeon RX 5700 (Desktop) | |
| low | med. | high | ultra | QHD | 4K | |
|---|---|---|---|---|---|---|
| GTA V (2015) | 184 | 176 | 175 | 114 | 109 | 164 |
| The Witcher 3 (2015) | 355 | 335 | 292 | 160 | 128 | |
| Dota 2 Reborn (2015) | 169.9 | 143.2 | 144.3 | 140.3 | 142.8 | |
| Rise of the Tomb Raider (2016) | 300 | 263 | 257 | 240 | 128 | |
| Final Fantasy XV Benchmark (2018) | 219 | 189 | 156 | 133 | 87.6 | |
| X-Plane 11.11 (2018) | 151 | 126 | 96.8 | 83 | ||
| Far Cry 5 (2018) | 179 | 162 | 153 | 141 | 137 | 106 |
| Strange Brigade (2018) | 525 | 415 | 372 | 330 | 255 | 158 |
| Shadow of the Tomb Raider (2018) | 201 | 193 | 177 | 188 | 162 | 95.6 |
| Battlefield V (2018) | 184 | 164 | 151 | 141 | 124 | 94 |
| Apex Legends (2019) | 144 | 144 | 144 | 144 | 144 | 139 |
| Far Cry New Dawn (2019) | 134 | 117 | 117 | 106 | 105 | 96 |
| Metro Exodus (2019) | 190 | 166 | 155 | 132 | 112 | 76.3 |
| The Division 2 (2019) | 239 | 221 | 188 | 160 | 128 | 77.5 |
| Anno 1800 (2019) | 145 | 145 | 105 | 54.8 | 53.9 | 52.5 |
| Rage 2 (2019) | 264 | 192 | 168 | 163 | 110 | 56.7 |
| Control (2019) | 238 | 215 | 177 | 123 | 66 | |
| Borderlands 3 (2019) | 178 | 157 | 145 | 135 | 117 | 73.4 |
| Star Wars Jedi Fallen Order (2019) | 133 | 132 | 131 | 130 | 111 | |
| Red Dead Redemption 2 (2019) | 175 | 174 | 155 | 115 | 96 | 67 |
| Hunt Showdown (2020) | 270 | 278 | 252 | 217 | 121 | |
| Doom Eternal (2020) | 314 | 310 | 298 | 296 | 295 | 188 |
| F1 2020 (2020) | 386 | 336 | 322 | 266 | 219 | 144 |
| Death Stranding (2020) | 209 | 207 | 203 | 210 | 176 | 110 |
| Horizon Zero Dawn (2020) | 203 | 196 | 181 | 166 | 148 | 95 |
| Crysis Remastered (2020) | 266 | 209 | 130 | 102 | 86.7 | 64.9 |
| Serious Sam 4 (2020) | 138.7 | 129.8 | 125.3 | 121.3 | 118.4 | 115.1 |
| Mafia Definitive Edition (2020) | 180 | 161 | 157 | 149 | 89.1 | |
| Star Wars Squadrons (2020) | 454 | 419 | 403 | 389 | 305 | 197 |
| FIFA 21 (2020) | 202 | 194 | 195 | 202 | 207 | 213 |
| Watch Dogs Legion (2020) | 128 | 127 | 111 | 103 | 89.7 | 60.3 |
| Dirt 5 (2020) | 191 | 149 | 127 | 112 | 100 | 73.8 |
| Assassin´s Creed Valhalla (2020) | 137 | 112 | 97 | 88 | 76 | 55 |
| Call of Duty Black Ops Cold War (2020) | 251 | 223 | 172 | 161 | 122 | 76.1 |
| Yakuza Like a Dragon (2020) | 116 | 114 | 115 | 116 | 116 | 80.2 |
Compute performance
In LuxMark and ComputeMark, the MSI GeForce RTX 3090 Suprim X scores slightly better than the GeForce RTX 3080 due to the better raw performance. However, the GeForce RTX 3090 has to admit a clear defeat to AMD's RX 6800 XT in the LuxMark Sala test. Each architecture has its advantages and disadvantages, which are supported differently by the programs and drivers. The SPECviewperf tests are mainly aimed at workstations. These offer more performance with the Quadro and FirePro models than with the consumer models due to driver optimizations.
| SPECviewperf 2020 | |
| 3840x2160 Solidworks (solidworks-05) | |
| MSI GeForce RTX 3090 Suprim X | |
| MSI GeForce RTX 3070 Gaming X Trio | |
| AMD Radeon RX 6800 XT | |
| 3840x2160 Siemens NX (snx-04) | |
| AMD Radeon RX 6800 XT | |
| MSI GeForce RTX 3090 Suprim X | |
| MSI GeForce RTX 3070 Gaming X Trio | |
| 3840x2160 Medical (medical-03) | |
| AMD Radeon RX 6800 XT | |
| MSI GeForce RTX 3090 Suprim X | |
| MSI GeForce RTX 3070 Gaming X Trio | |
| 3840x2160 Maya (maya-06) | |
| MSI GeForce RTX 3090 Suprim X | |
| MSI GeForce RTX 3070 Gaming X Trio | |
| AMD Radeon RX 6800 XT | |
| 3840x2160 Energy (energy-03) | |
| MSI GeForce RTX 3090 Suprim X | |
| AMD Radeon RX 6800 XT | |
| MSI GeForce RTX 3070 Gaming X Trio | |
| 3840x2160 Creo (creo-03) | |
| MSI GeForce RTX 3090 Suprim X | |
| MSI GeForce RTX 3070 Gaming X Trio | |
| AMD Radeon RX 6800 XT | |
| 3840x2160 CATIA (catia-06) | |
| MSI GeForce RTX 3090 Suprim X | |
| MSI GeForce RTX 3070 Gaming X Trio | |
| AMD Radeon RX 6800 XT | |
| 3840x2160 3ds Max (3dsmax-07) | |
| MSI GeForce RTX 3090 Suprim X | |
| AMD Radeon RX 6800 XT | |
| MSI GeForce RTX 3070 Gaming X Trio | |
Emissions of the MSI GeForce RTX 3090 Suprim X
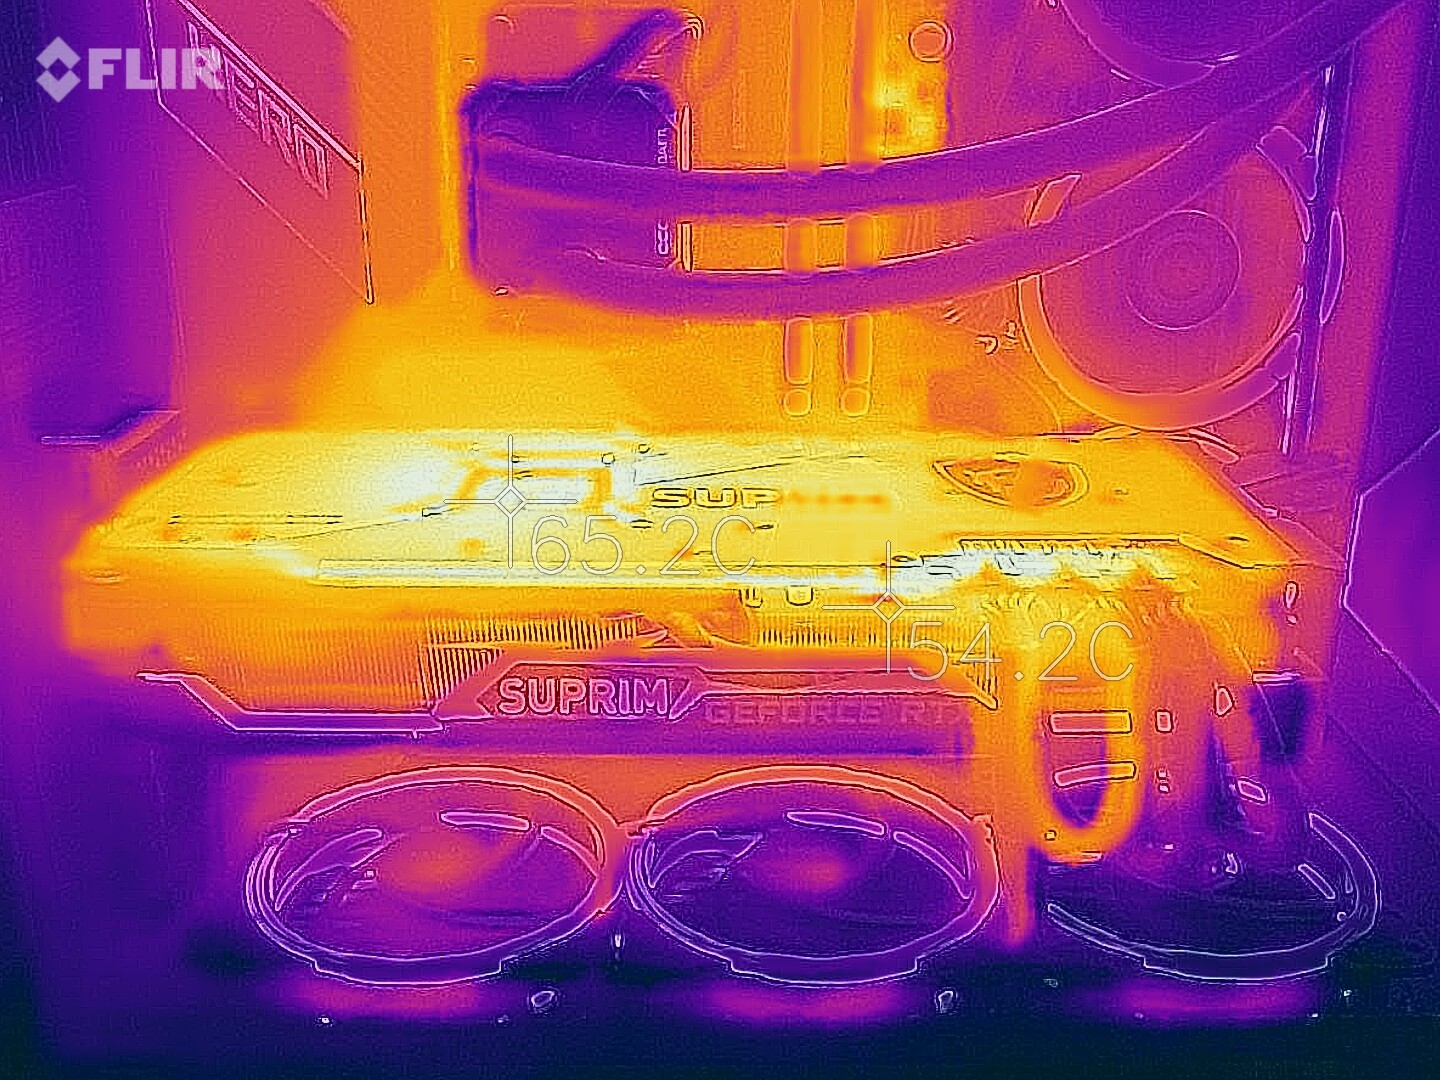
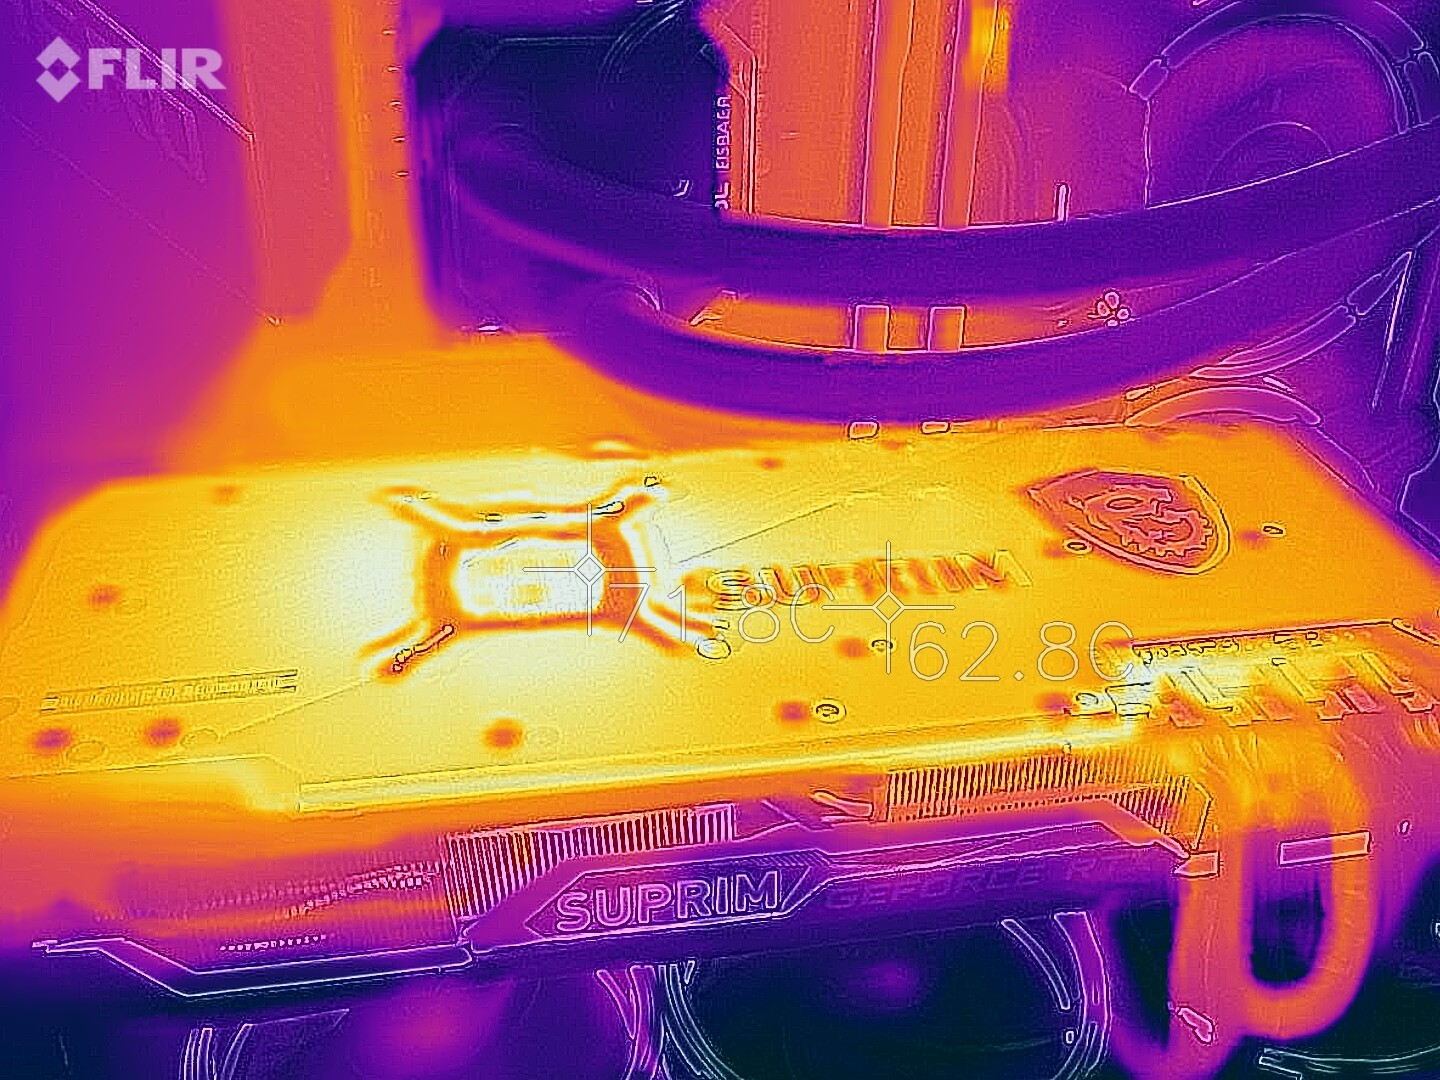
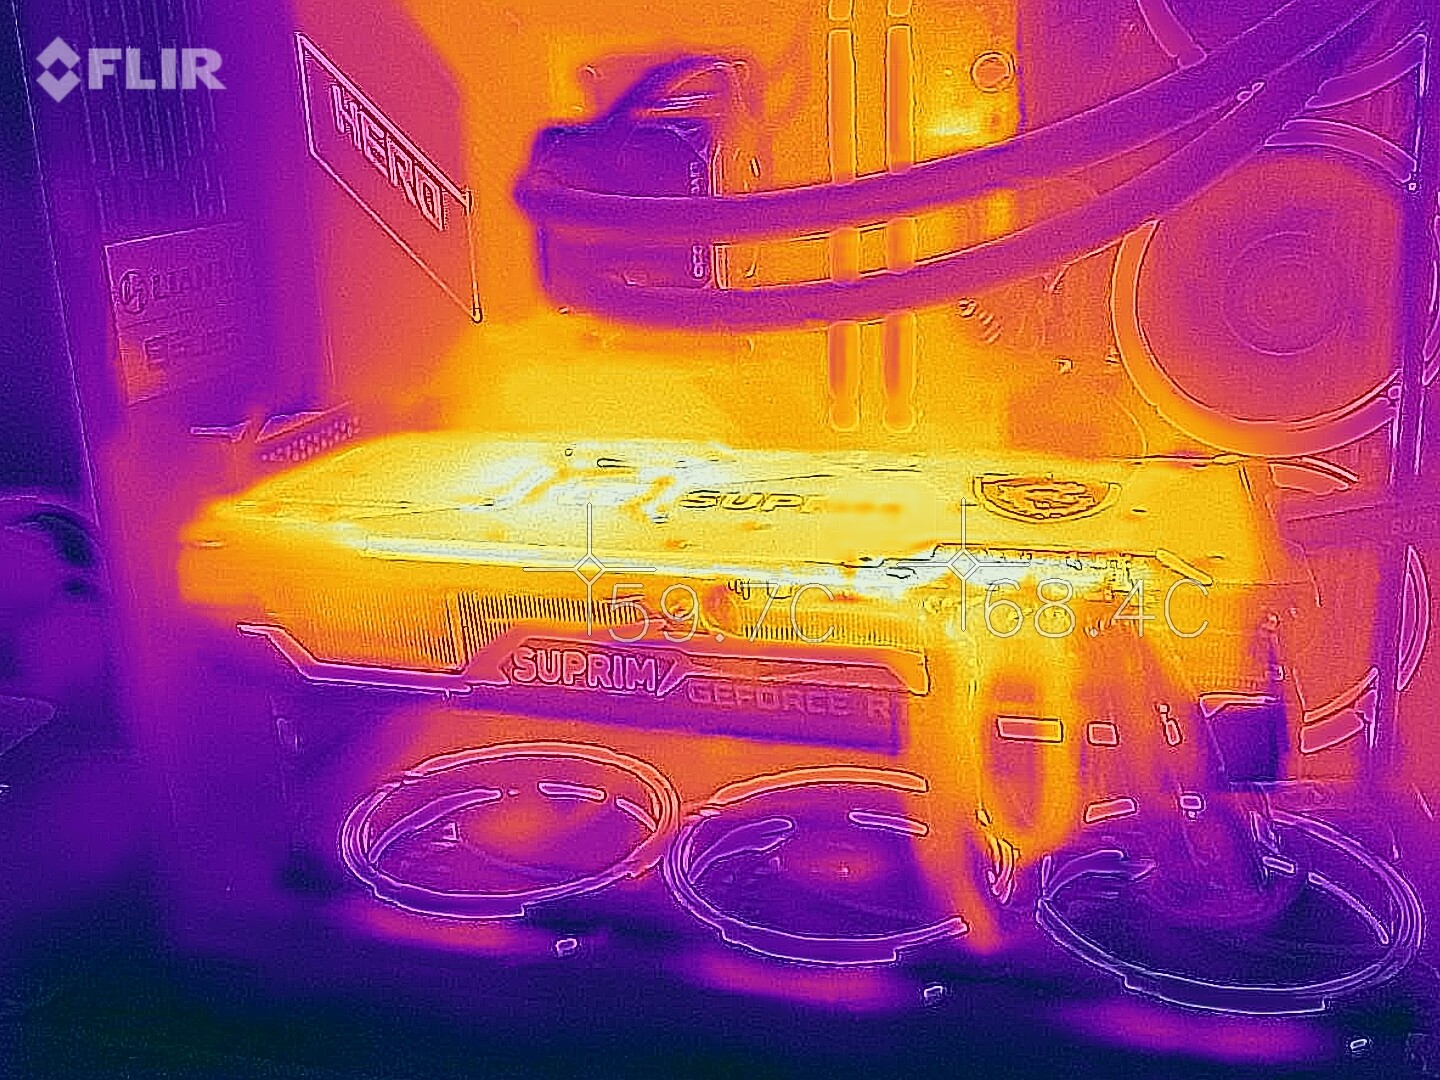
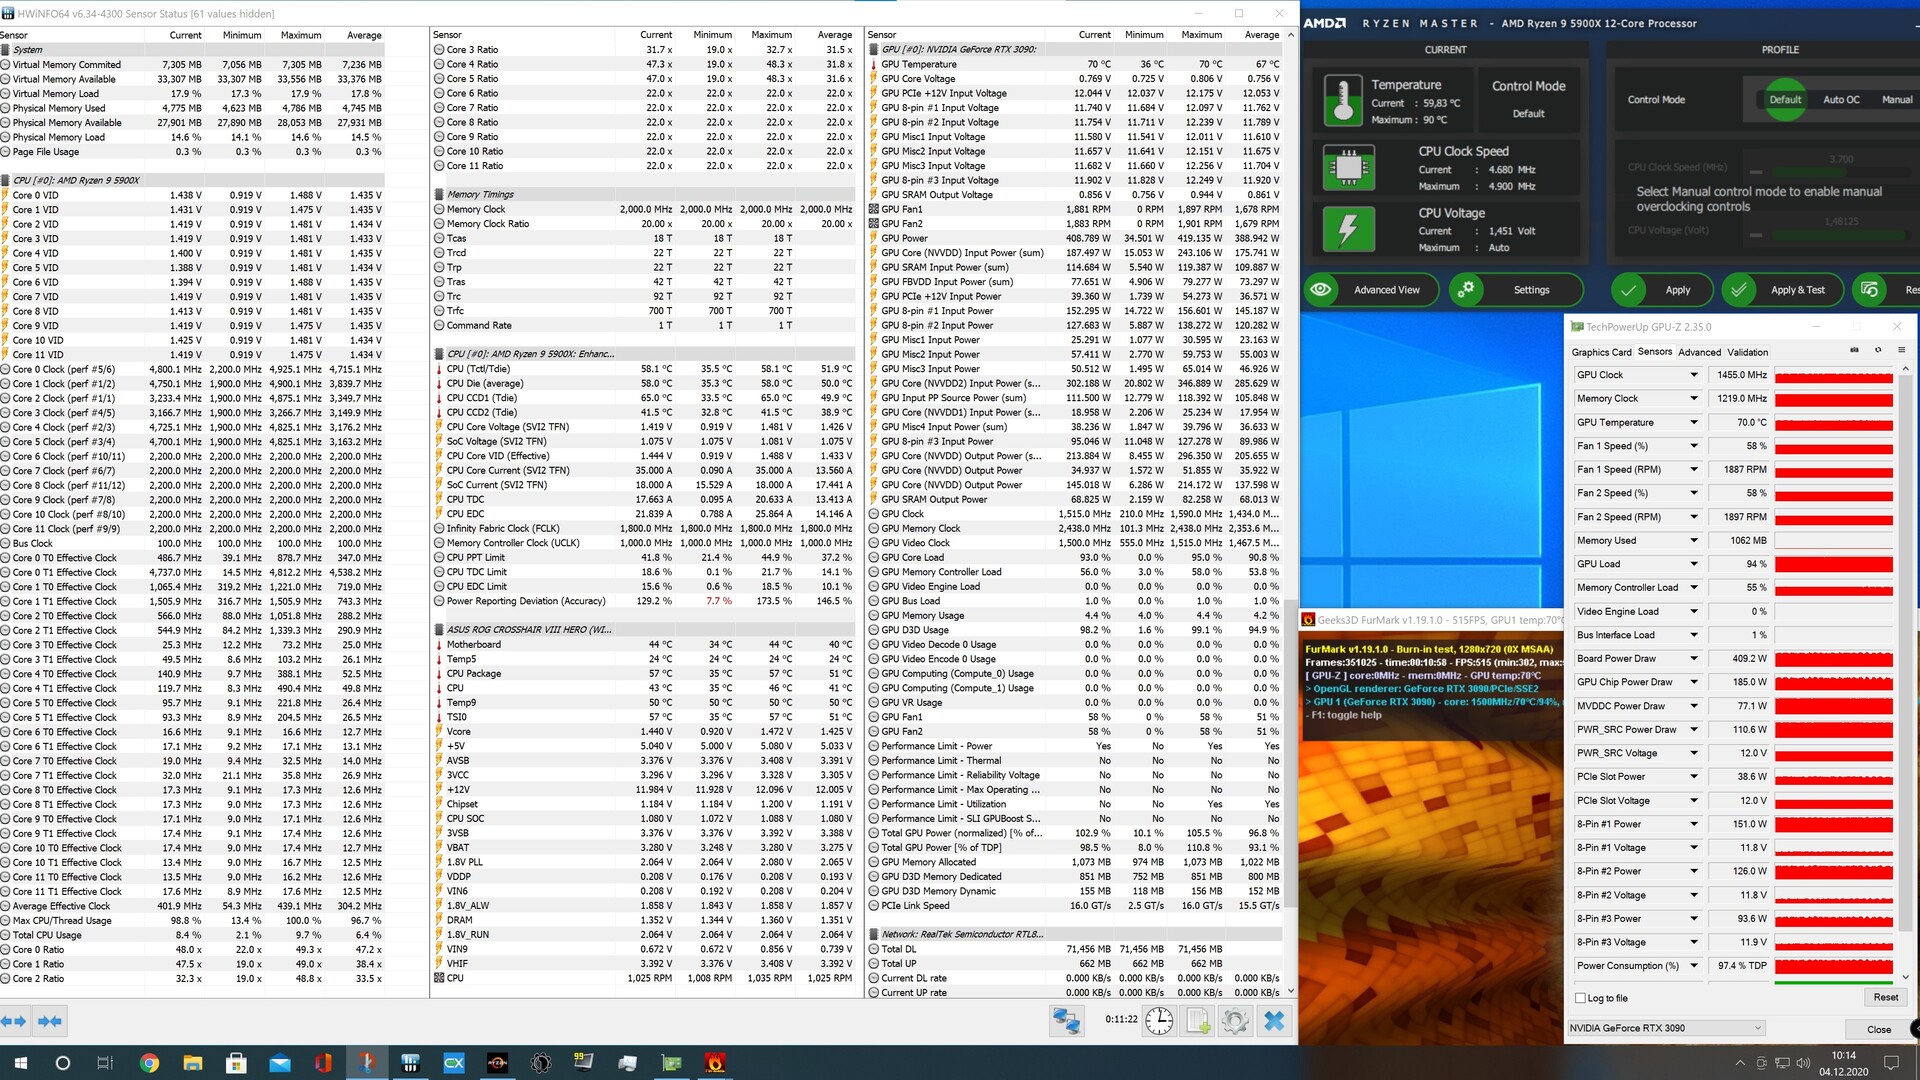
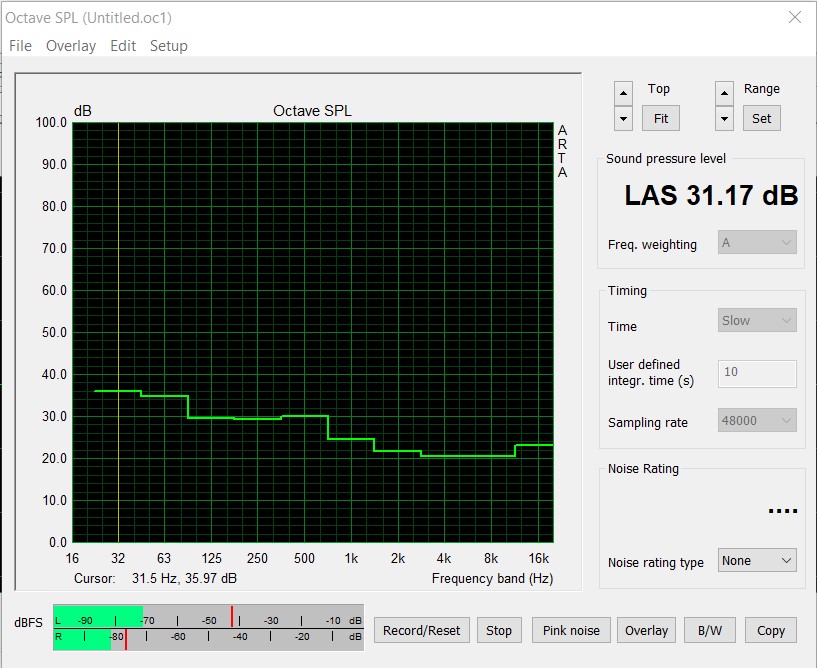
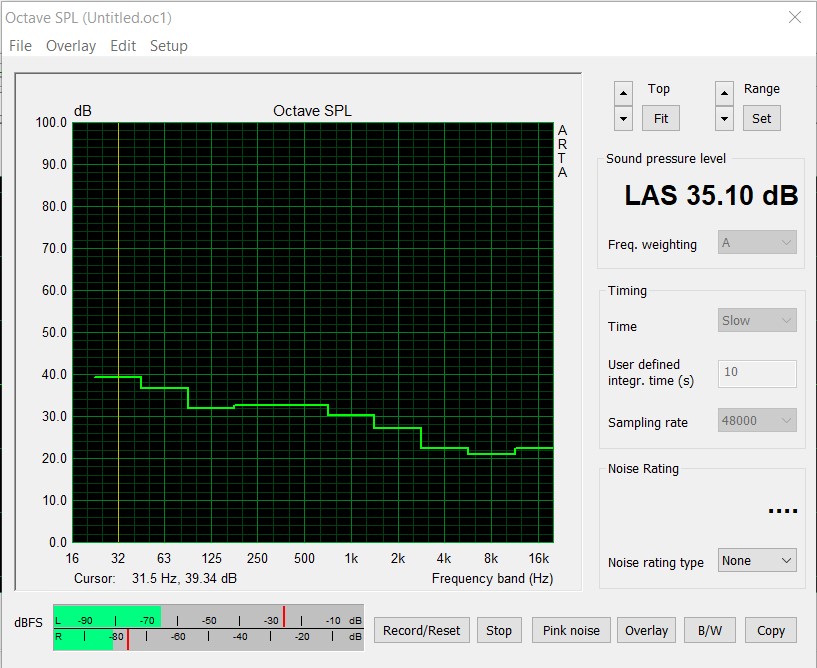
It should be clear to everyone that you can't expect any power-saving miracles with the GeForce RTX 3090. MSI increases the power consumption of the GeForce RTX 3090 Suprim X even further with a higher TDP of up to 420 watts. For comparison purposes: The reference model has a specified TDP of up to 350 watts. Although MSI adds another 70 watts, our review sample performs quite well in the load test. 70 °C (~158 °F) is the highest temperature in the stress test when the case is closed. This is a good value and shows that the cooling concept works optimally. The three 100-millimeter fans often even stand still and only start to rotate at just under 50 °C (~122 °F). This means that the graphics card isn't audible in idle usage; the fans don't need to work when there's a good airflow in the case. Under load, we measure a noise level of 36.1 dB(A) for the entire system at a distance of 20 centimeters next to the case and at the height of the graphics card. If the graphics card is left to work in silent mode, the noise level slightly drops to 35.1 dB(A).
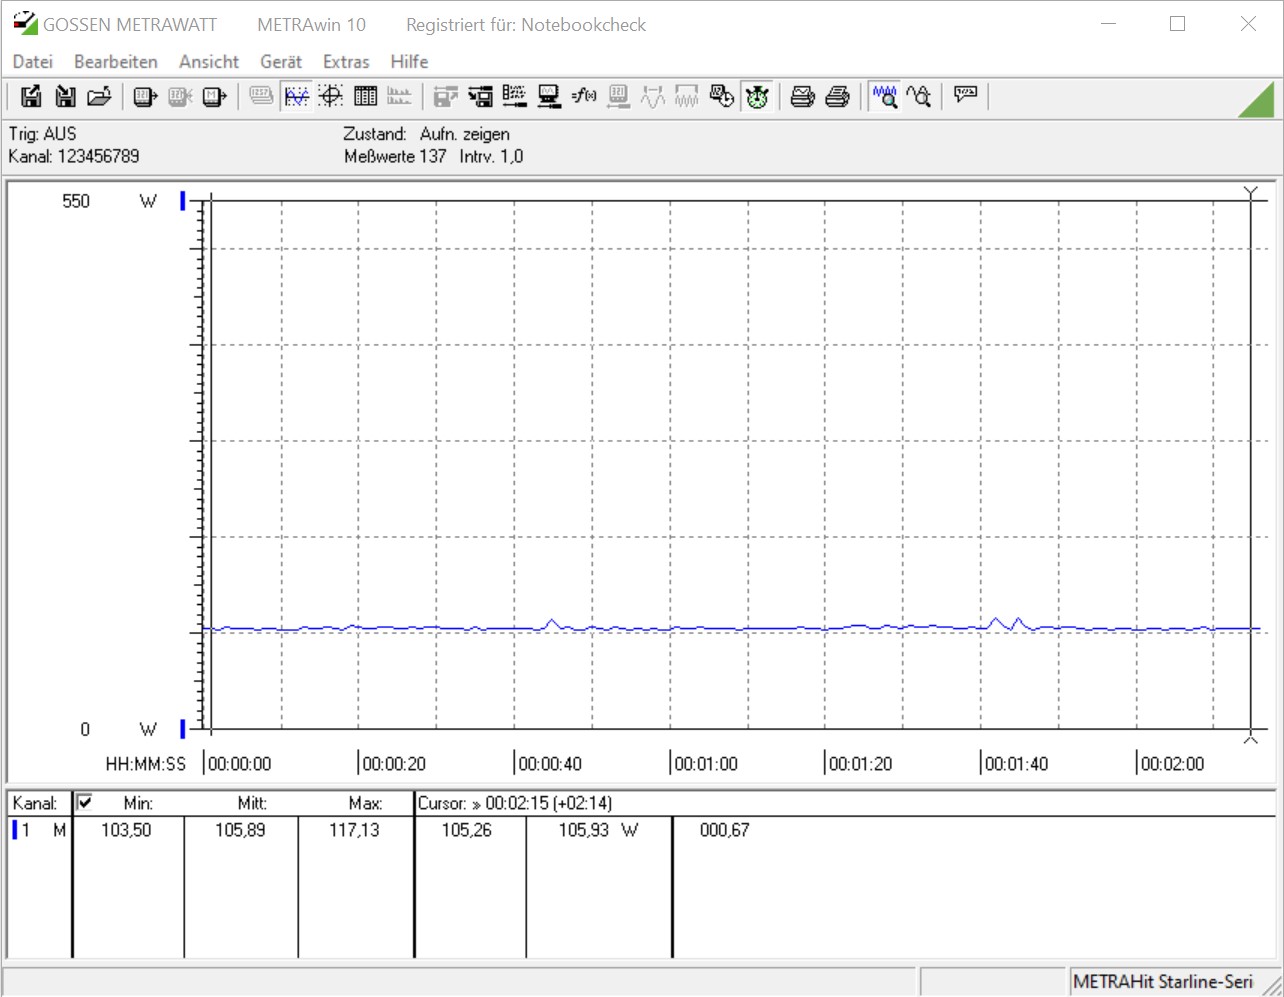
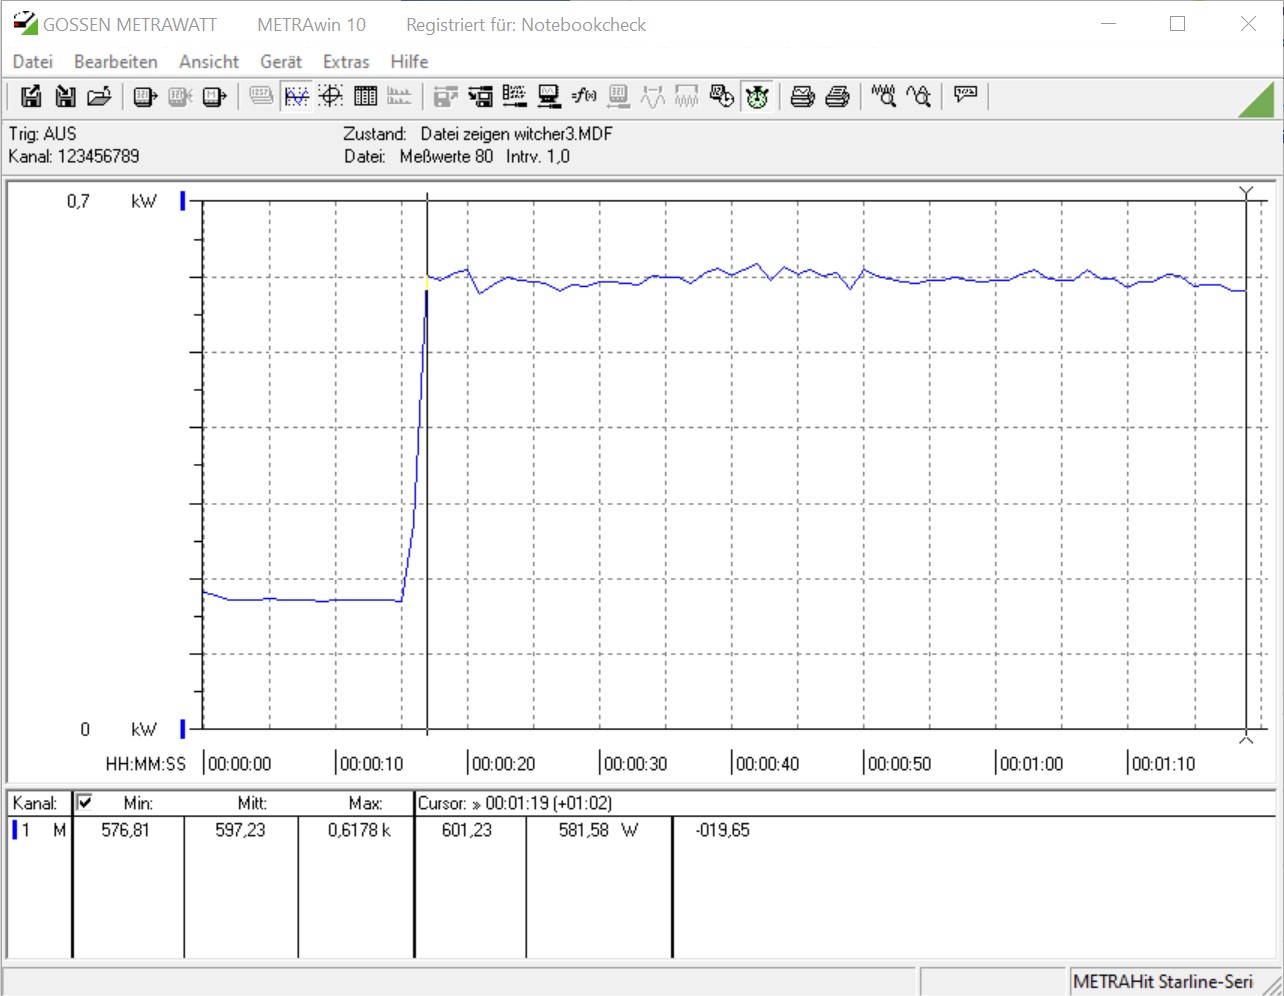
As expected, power consumption is high. It should also be mentioned that our measurements refer to the entire system (including nine 120-millimeter fans). In idle usage, just under 106 watts are drawn from the socket; at the same time, 597 watts are displayed on our measuring device under load when gaming. If you now increase the power target to 450 watts, you'll easily exceed 600 watts during gaming. Compared to the other graphics cards that we have tested so far, the MSI GeForce RTX 3090 Suprim X leads this field by a wide margin.
Those who buy the MSI GeForce RTX 3090 Suprim X should definitely be able to have a strong power supply unit. Our recommendation is an 850-watt power supply unit at the minimum.


| Power Consumption | |
| 1920x1080 The Witcher 3 ultra (external Monitor) | |
| MSI GeForce RTX 3090 Suprim X (Idle: 105.9 W) | |
| ASUS GeForce RTX 3080 ROG STRIX OC GAMING (Idle: 88.3 W) | |
| AMD Radeon RX 6800 XT (Idle: 99.5 W) | |
| KFA2 GeForce RTX 2080 Ti EX (Idle: 100.5 W) | |
| AMD Radeon RX Vega 64 (Idle: 74.3 W) | |
| MSI RTX 2080 Gaming X Trio (Idle: 87.78 W) | |
| MSI GeForce RTX 3070 Gaming X Trio (Idle: 95.1 W) | |
| Nvidia GeForce RTX 2080 Super (Idle: 78.87 W) | |
| AMD Radeon RX 5700 XT (Idle: 69.8 W) | |
| Nvidia GeForce RTX 2070 Super (96.8 fps, Idle: 80.5 W) | |
| MSI RTX 2070 Gaming Z 8G (Idle: 73.3 W) | |
| AMD Radeon VII (Idle: 81.39 W) | |
| Nvidia GeForce RTX 2060 Super (82.7 fps, Idle: 77.12 W) | |
| AMD Radeon RX 5700 (84.2 fps, Idle: 64.5 W) | |
| MSI RTX 2060 Gaming Z 6G (Idle: 74.66 W) | |
| 1280x720 FurMark 1.19 GPU Stress Test (external Monitor) | |
| MSI GeForce RTX 3090 Suprim X (Idle: 105.9 W) | |
| ASUS GeForce RTX 3080 ROG STRIX OC GAMING (Idle: 88.3 W) | |
| AMD Radeon RX 6800 XT (Idle: 99.5 W) | |
| AMD Radeon VII (Idle: 81.39 W) | |
| MSI RTX 2080 Gaming X Trio | |
| KFA2 GeForce RTX 2080 Ti EX (Idle: 100.5 W) | |
| MSI GeForce RTX 3070 Gaming X Trio (Idle: 95.1 W) | |
| Nvidia GeForce RTX 2080 Super (Idle: 78.87 W) | |
| MSI RTX 2070 Gaming Z 8G (Idle: 73.3 W) | |
| AMD Radeon RX 5700 XT (239 fps, Idle: 69.8 W) | |
| Nvidia GeForce RTX 2070 Super (283 fps, Idle: 80.5 W) | |
| MSI RTX 2060 Gaming Z 6G (Idle: 74.66 W) | |
| Nvidia GeForce RTX 2060 Super (237 fps, Idle: 77.12 W) | |
| AMD Radeon RX 5700 (207 fps, Idle: 64.5 W) | |
* ... smaller is better
Pros
Cons
Verdict - Very power-hungry and extremely fast
The GeForce RTX 3090 is without a doubt the fastest gaming graphics card on the market at the moment. With the MSI GeForce RTX 3090 Suprim X, we had a special model from MSI in the test; not only was it able to convince with very good gaming performance, but the new Suprim X model also has a fair bit to offer when it comes to its appearance. This is complemented by the very high-quality workmanship that is reflected both in terms of look and feel. Nevertheless, you should be aware that the very high performance is accompanied by a very high energy demand. Almost 600 watts for the test system without a monitor can't simply be left unmentioned. The biggest advantage of the GeForce RTX 3090 is the 24 GB VRAM, since it's more than twice as big as that of the GeForce RTX 3080. In the long run, this could spell the end for the RTX 3080. AMD takes a different approach with its RX 6000 graphics cards and offers all three models with 16 GB of VRAM.
Looking at the pure gaming performance, the MSI GeForce RTX 3090 Suprim X can clearly hold its own against a GeForce RTX 3080. With the Radeon RX 6800 XT, AMD ranks behind the RTX 3080. Consequently, AMD can only pose a threat to Nvidia with a Radeon RX 6900 XT. We currently don't have valid data for comparison with a Radeon RX 6900 XT. Nvidia's biggest plus points are currently ray tracing and DLSS. The former is also offered by AMD's new Big Navi graphics cards, but AMD still lags behind considerably in terms of performance here.
MSI has introduced a new high-end series with the GeForce RTX 3090 Suprim X. The new top model offers uncompromised gaming fun, but it requires very high resolutions to not always work in the CPU limit.
Unfortunately, the current market situation has been tense for months, and those who want to buy a new graphics card have to take what's available. Getting the card that you want is almost a miracle at the moment. In addition, the prices have skyrocketed, which also applies to the MSI GeForce RTX 3090 Suprim X. According to MSI, the MSRP for our review sample is 1,649 Euros (~$1,998). However, the graphics card is listed on Geizhals for almost 2,000 Euros (~$2,423) and sometimes for even much more.
All benchmarks and test results for the RTX 3090 can be found on the graphics card site for the GeForce RTX 3090 (regularly updated).

