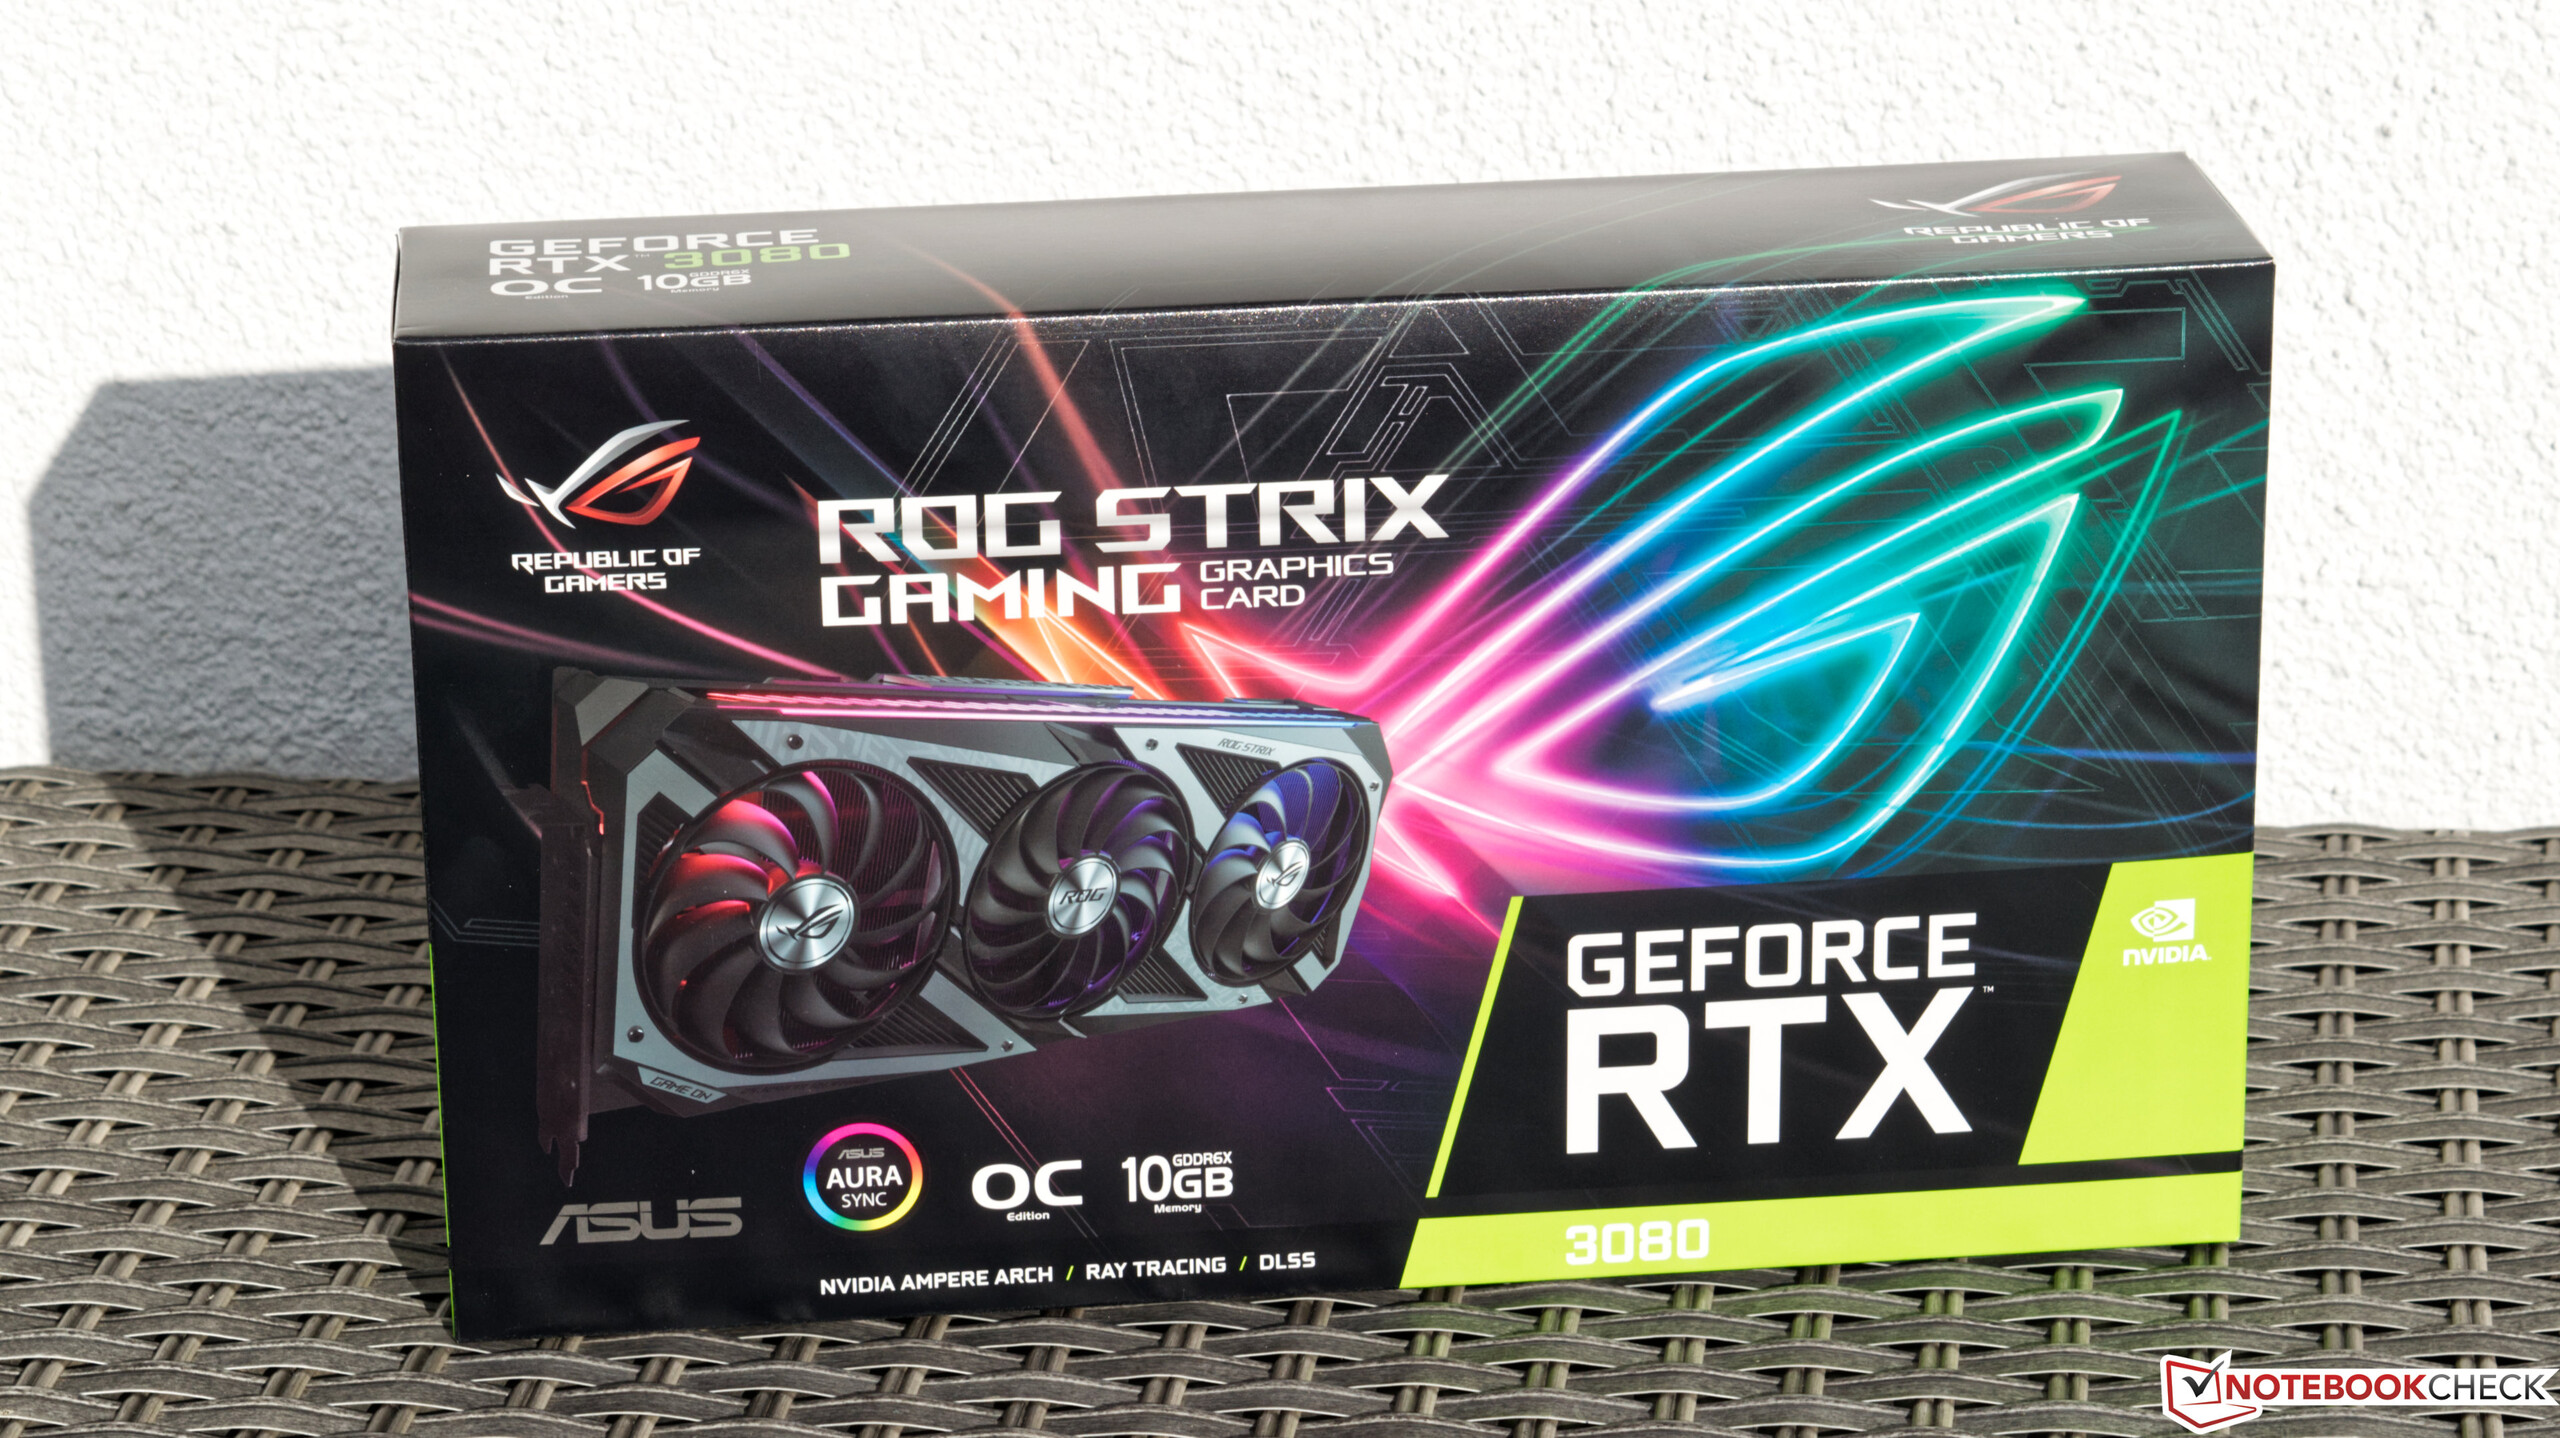
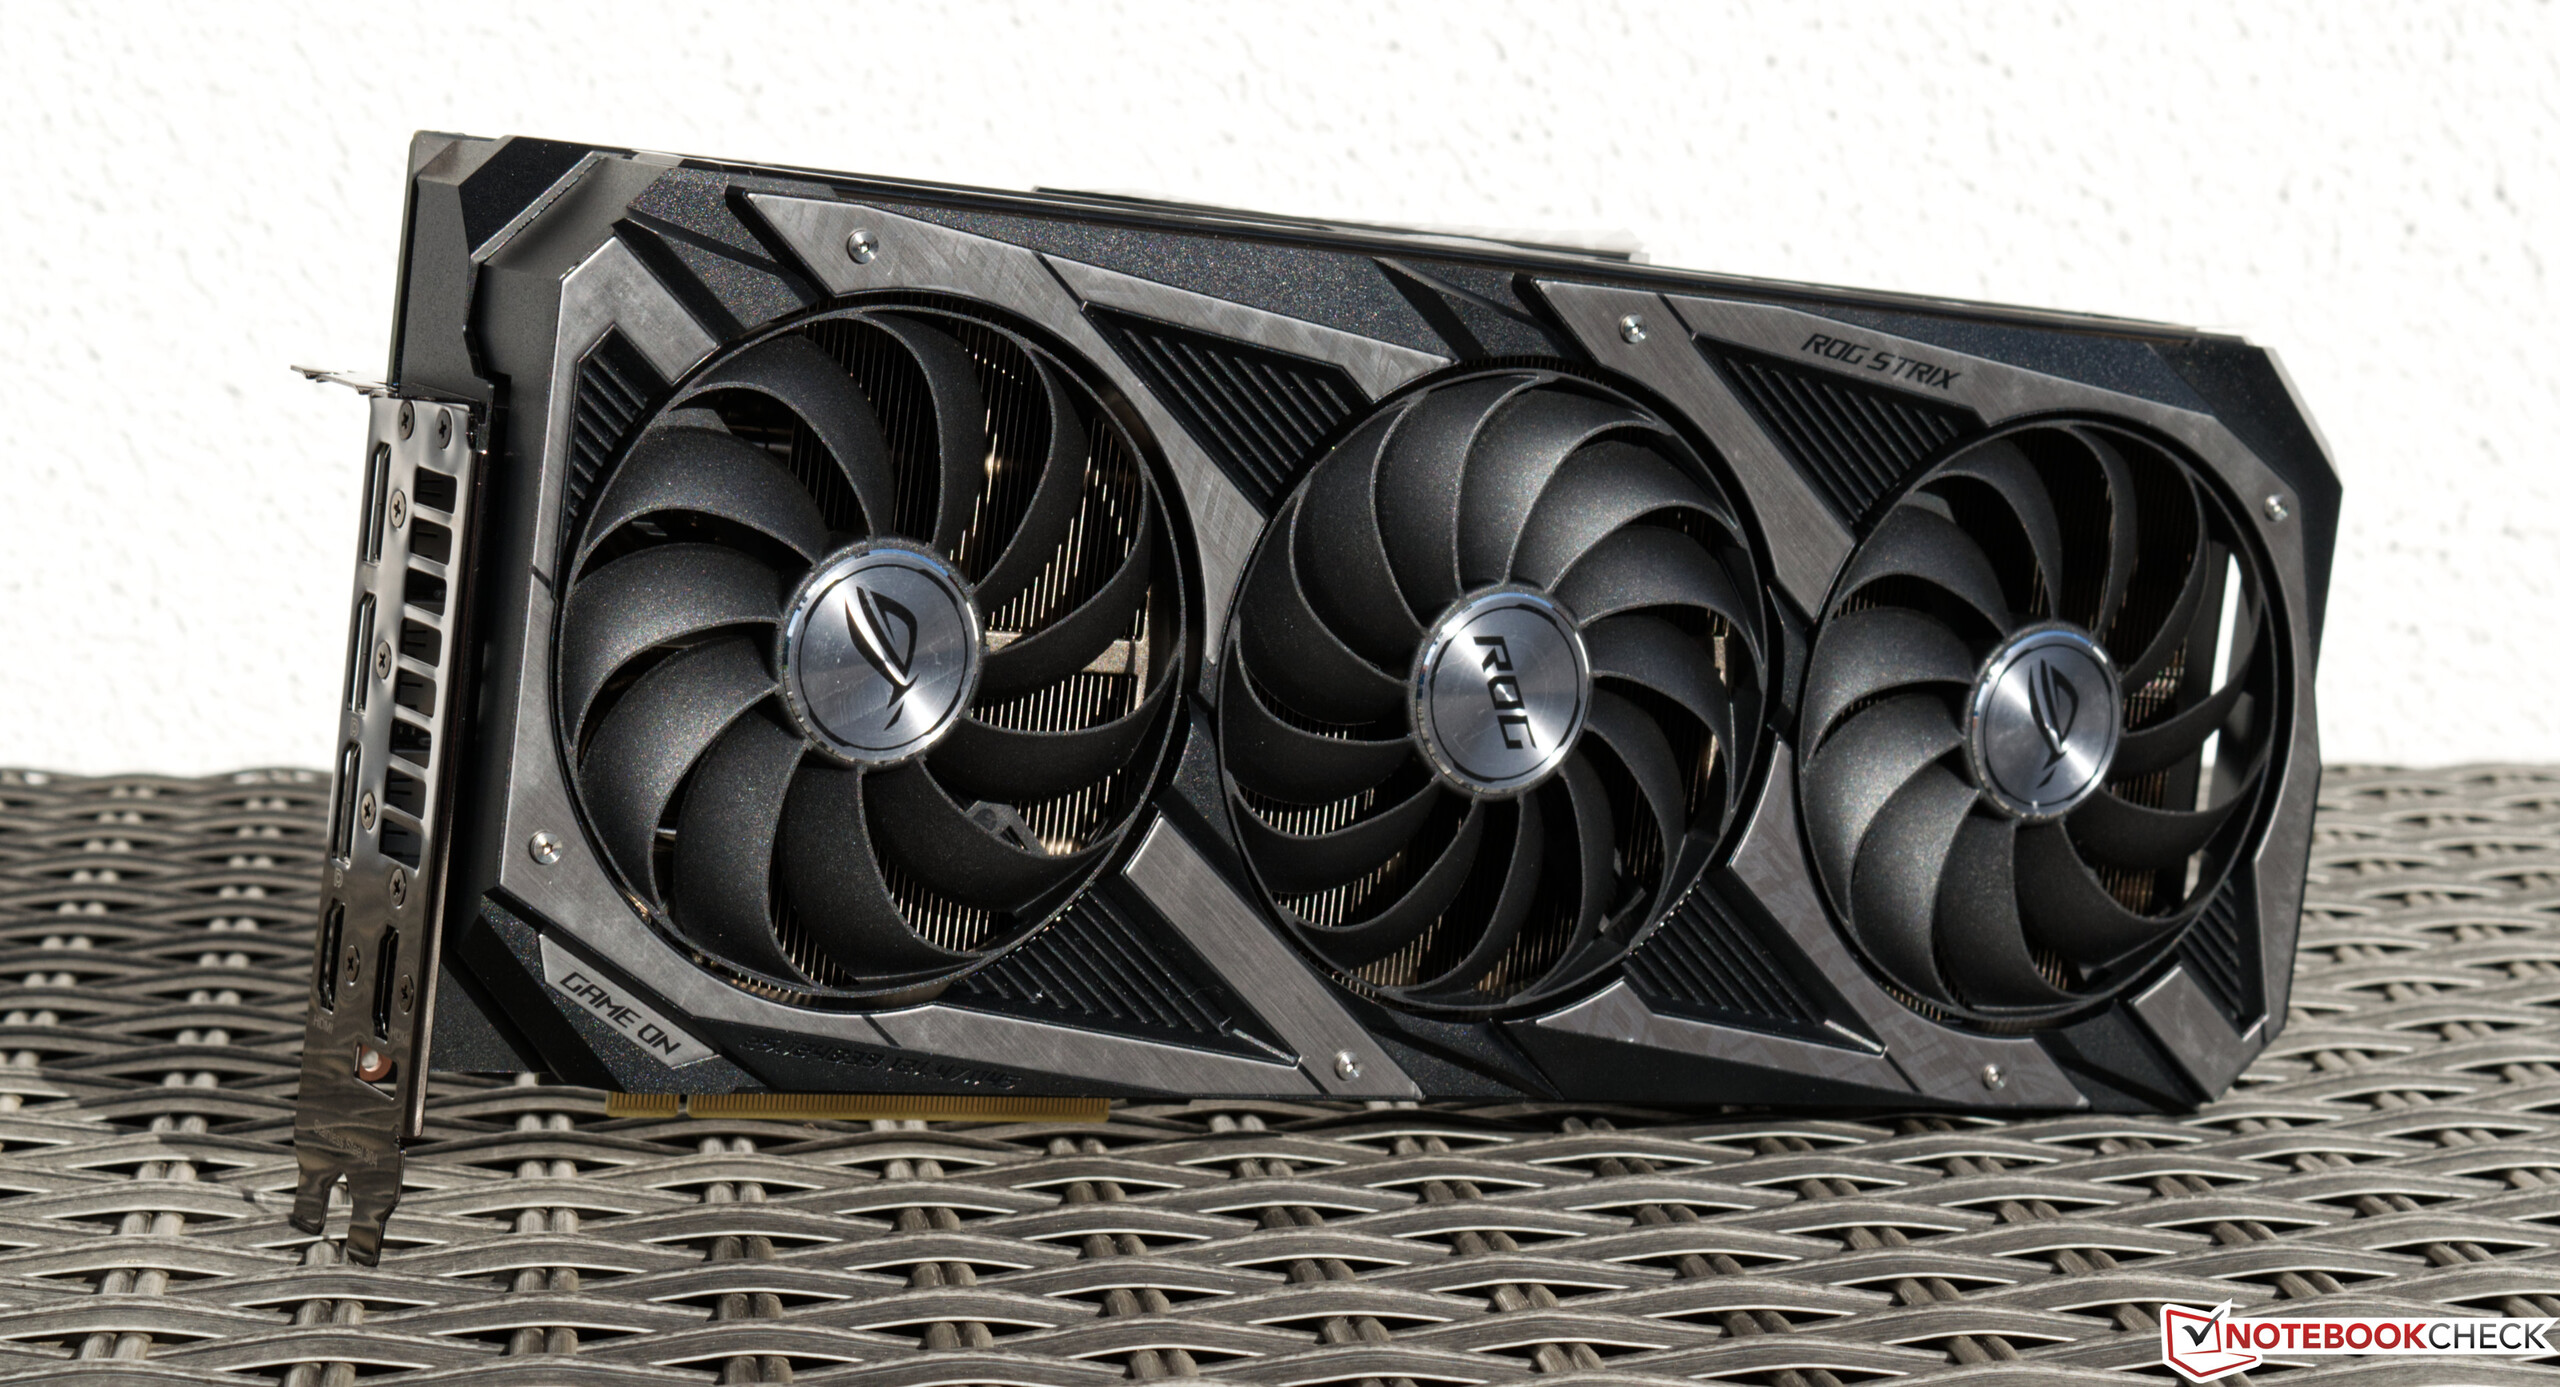
Asus GeForce RTX 3080 ROG Strix Gaming OC desktop GPU in review
The server segment started benefiting from the new Ampere architecture of Nvidia graphics cards earlier in 2020. About half a year later, the consumer models followed, which should bring a breath of fresh air to the desktop graphics card market. However, after the introduction of the new RTX 3000 series, the disenchantment was very big, because the large number of orders wasn't and still isn't able to be completely covered.
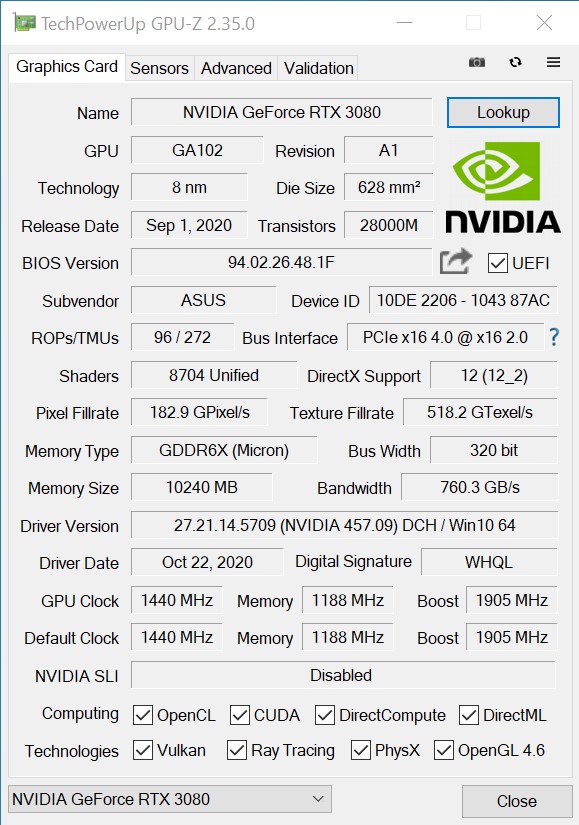
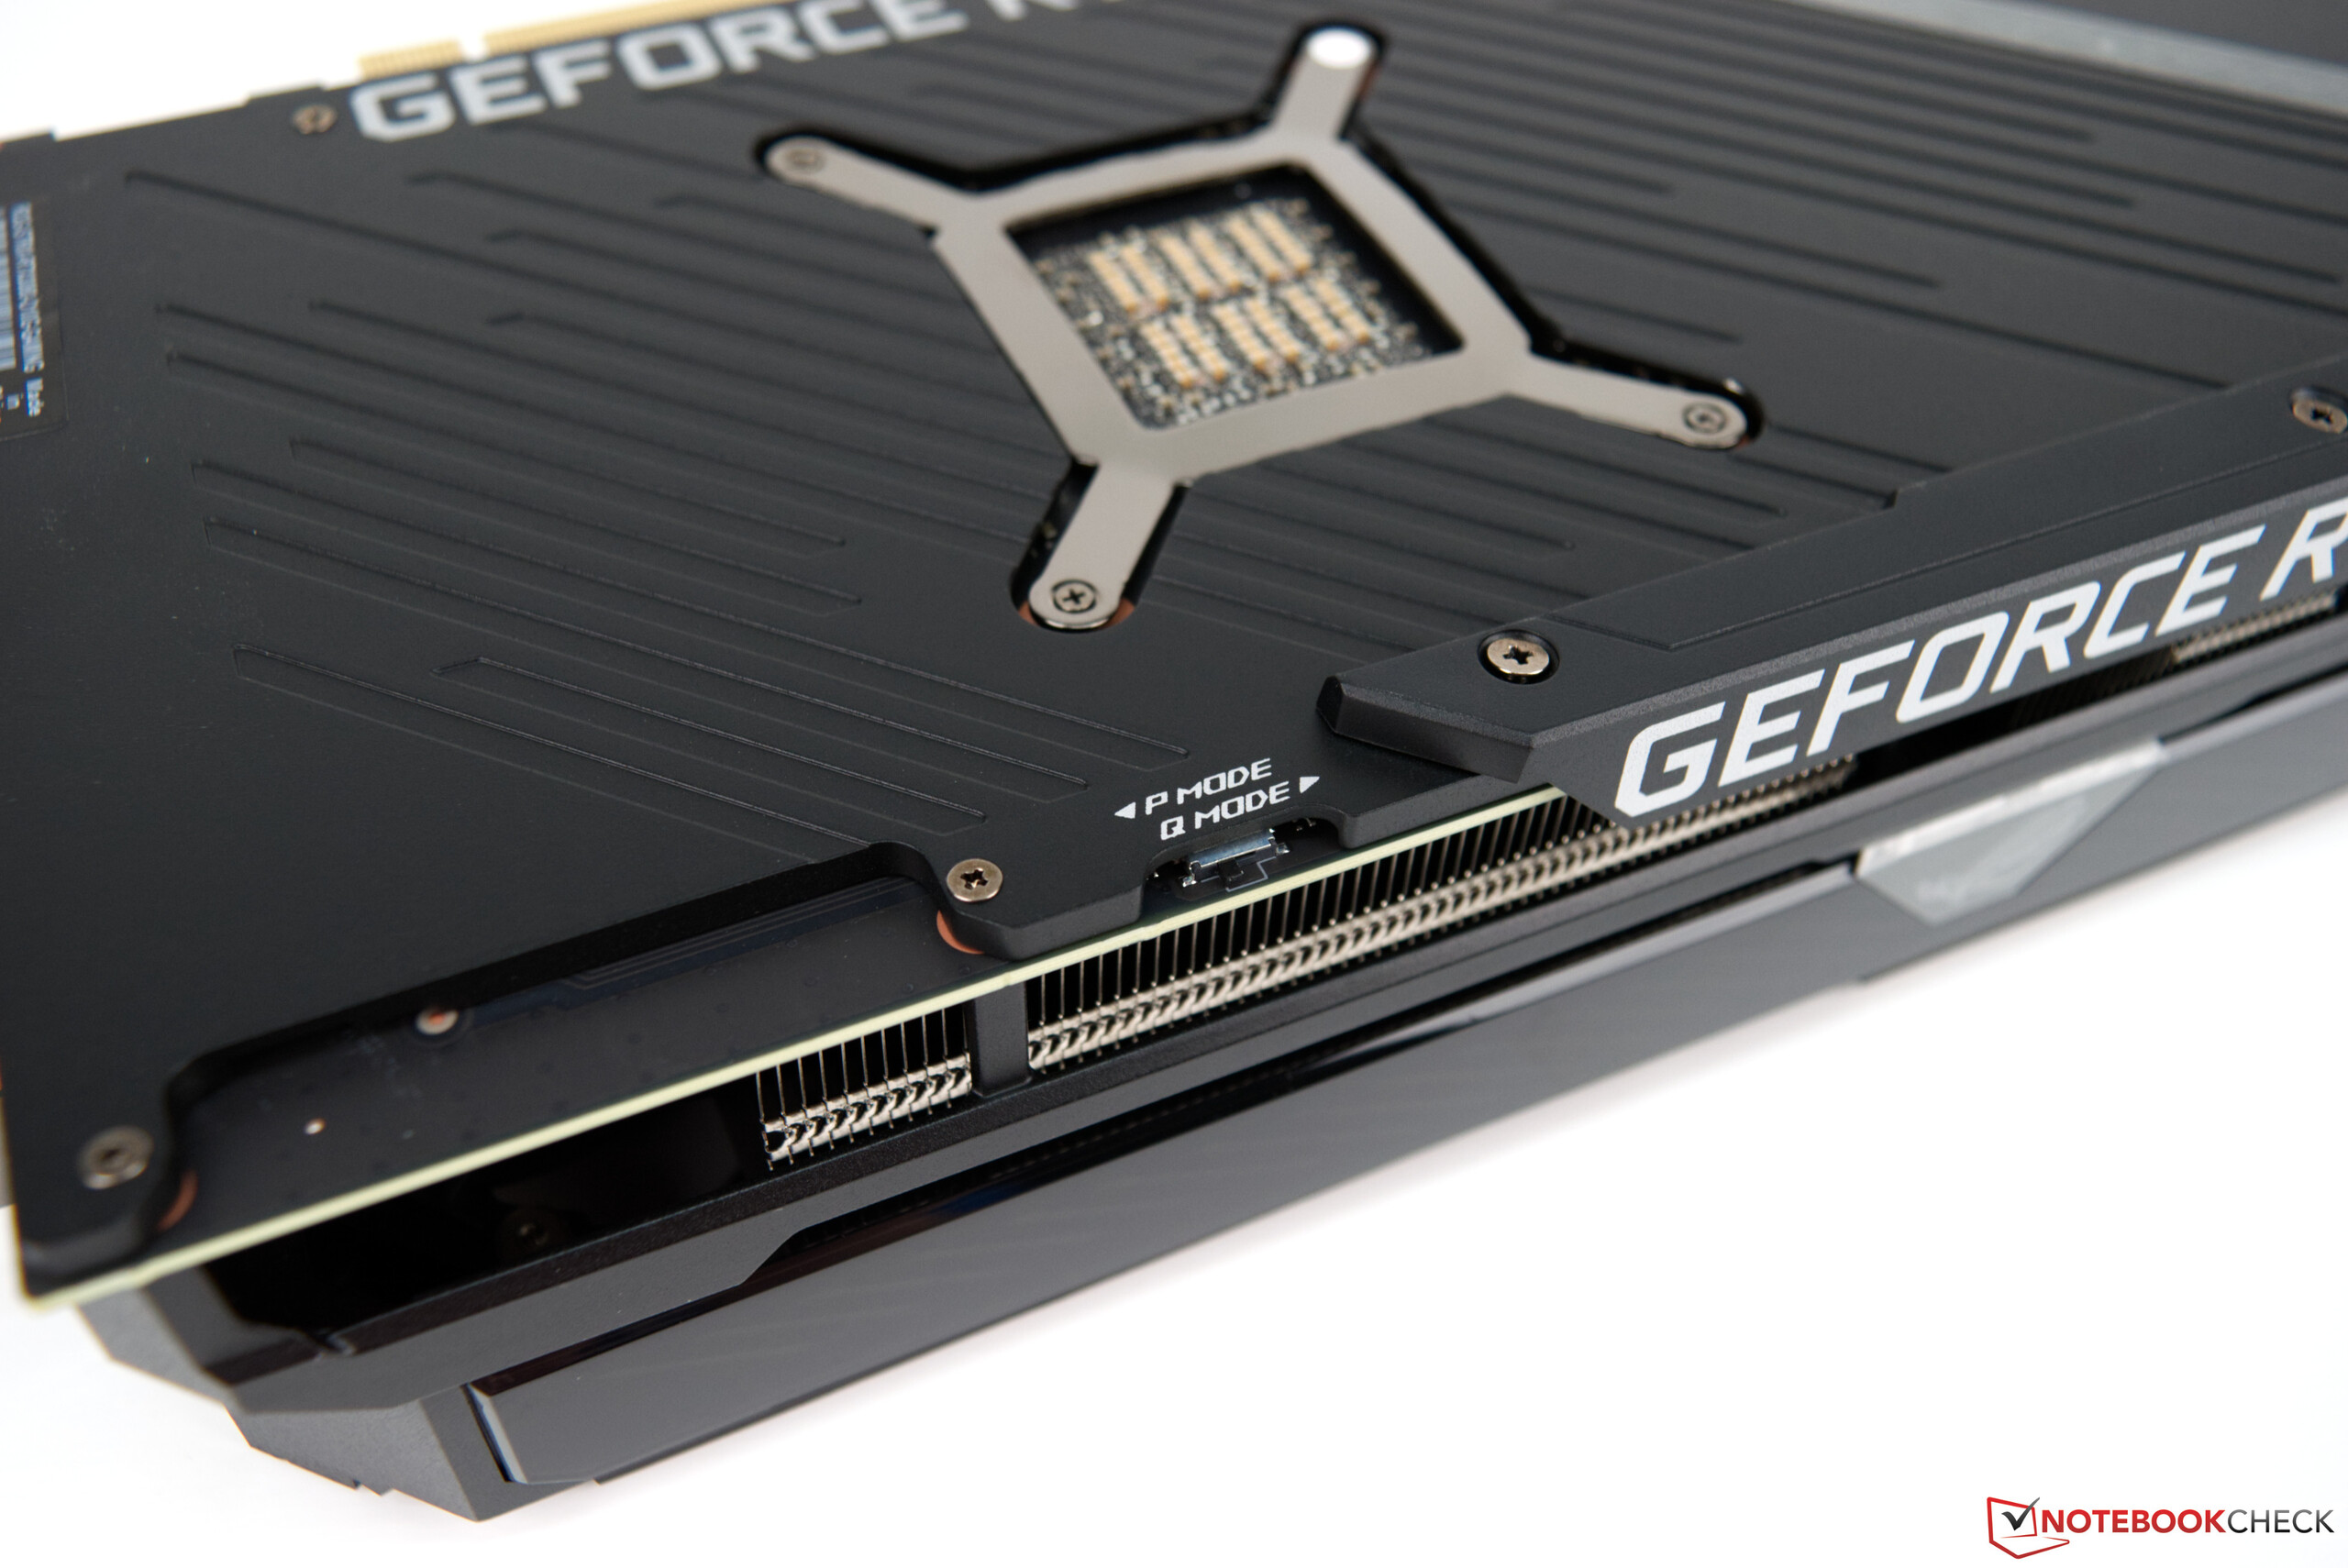
Those who were still able to secure a model of the new Nvidia graphics cards will be rewarded with very good performance throughout; we can reveal that much in advance. For this review, however, we received a test sample from Asus, which differs significantly from the Founders Edition. But nothing has changed in terms of the base of the GA102 Ampere chip. The same applies to the VRAM, which is identical at 10 GB GDDR6X on all RTX 3080 models. Asus grants the GeForce RTX 3080 ROG Strix Gaming OC a bit more leeway when it comes to boosting, though - it's almost 200 MHz compared to Nvidia's Founders Edition.
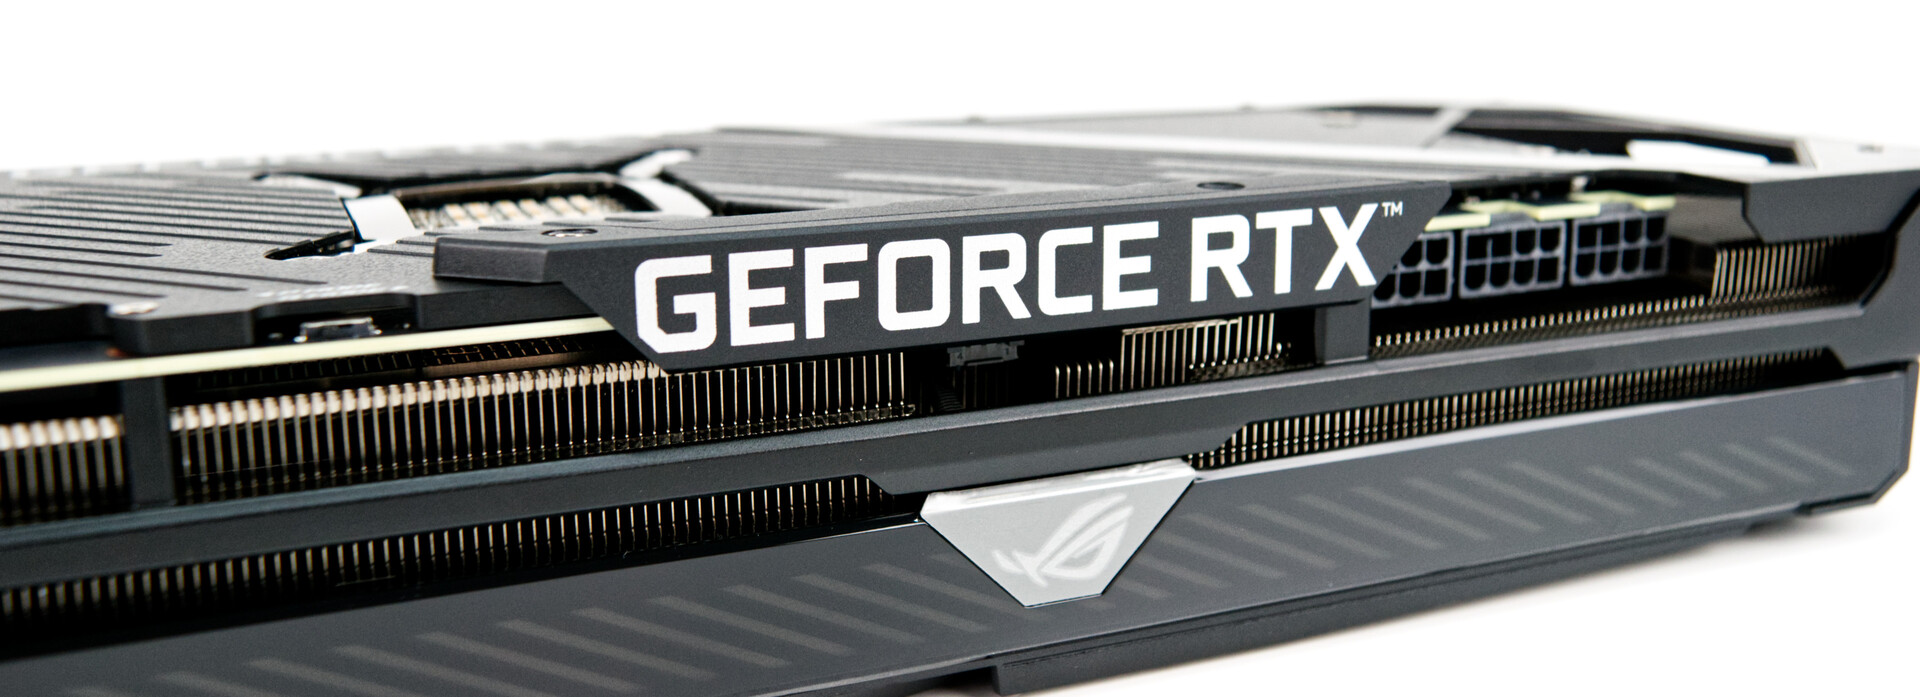
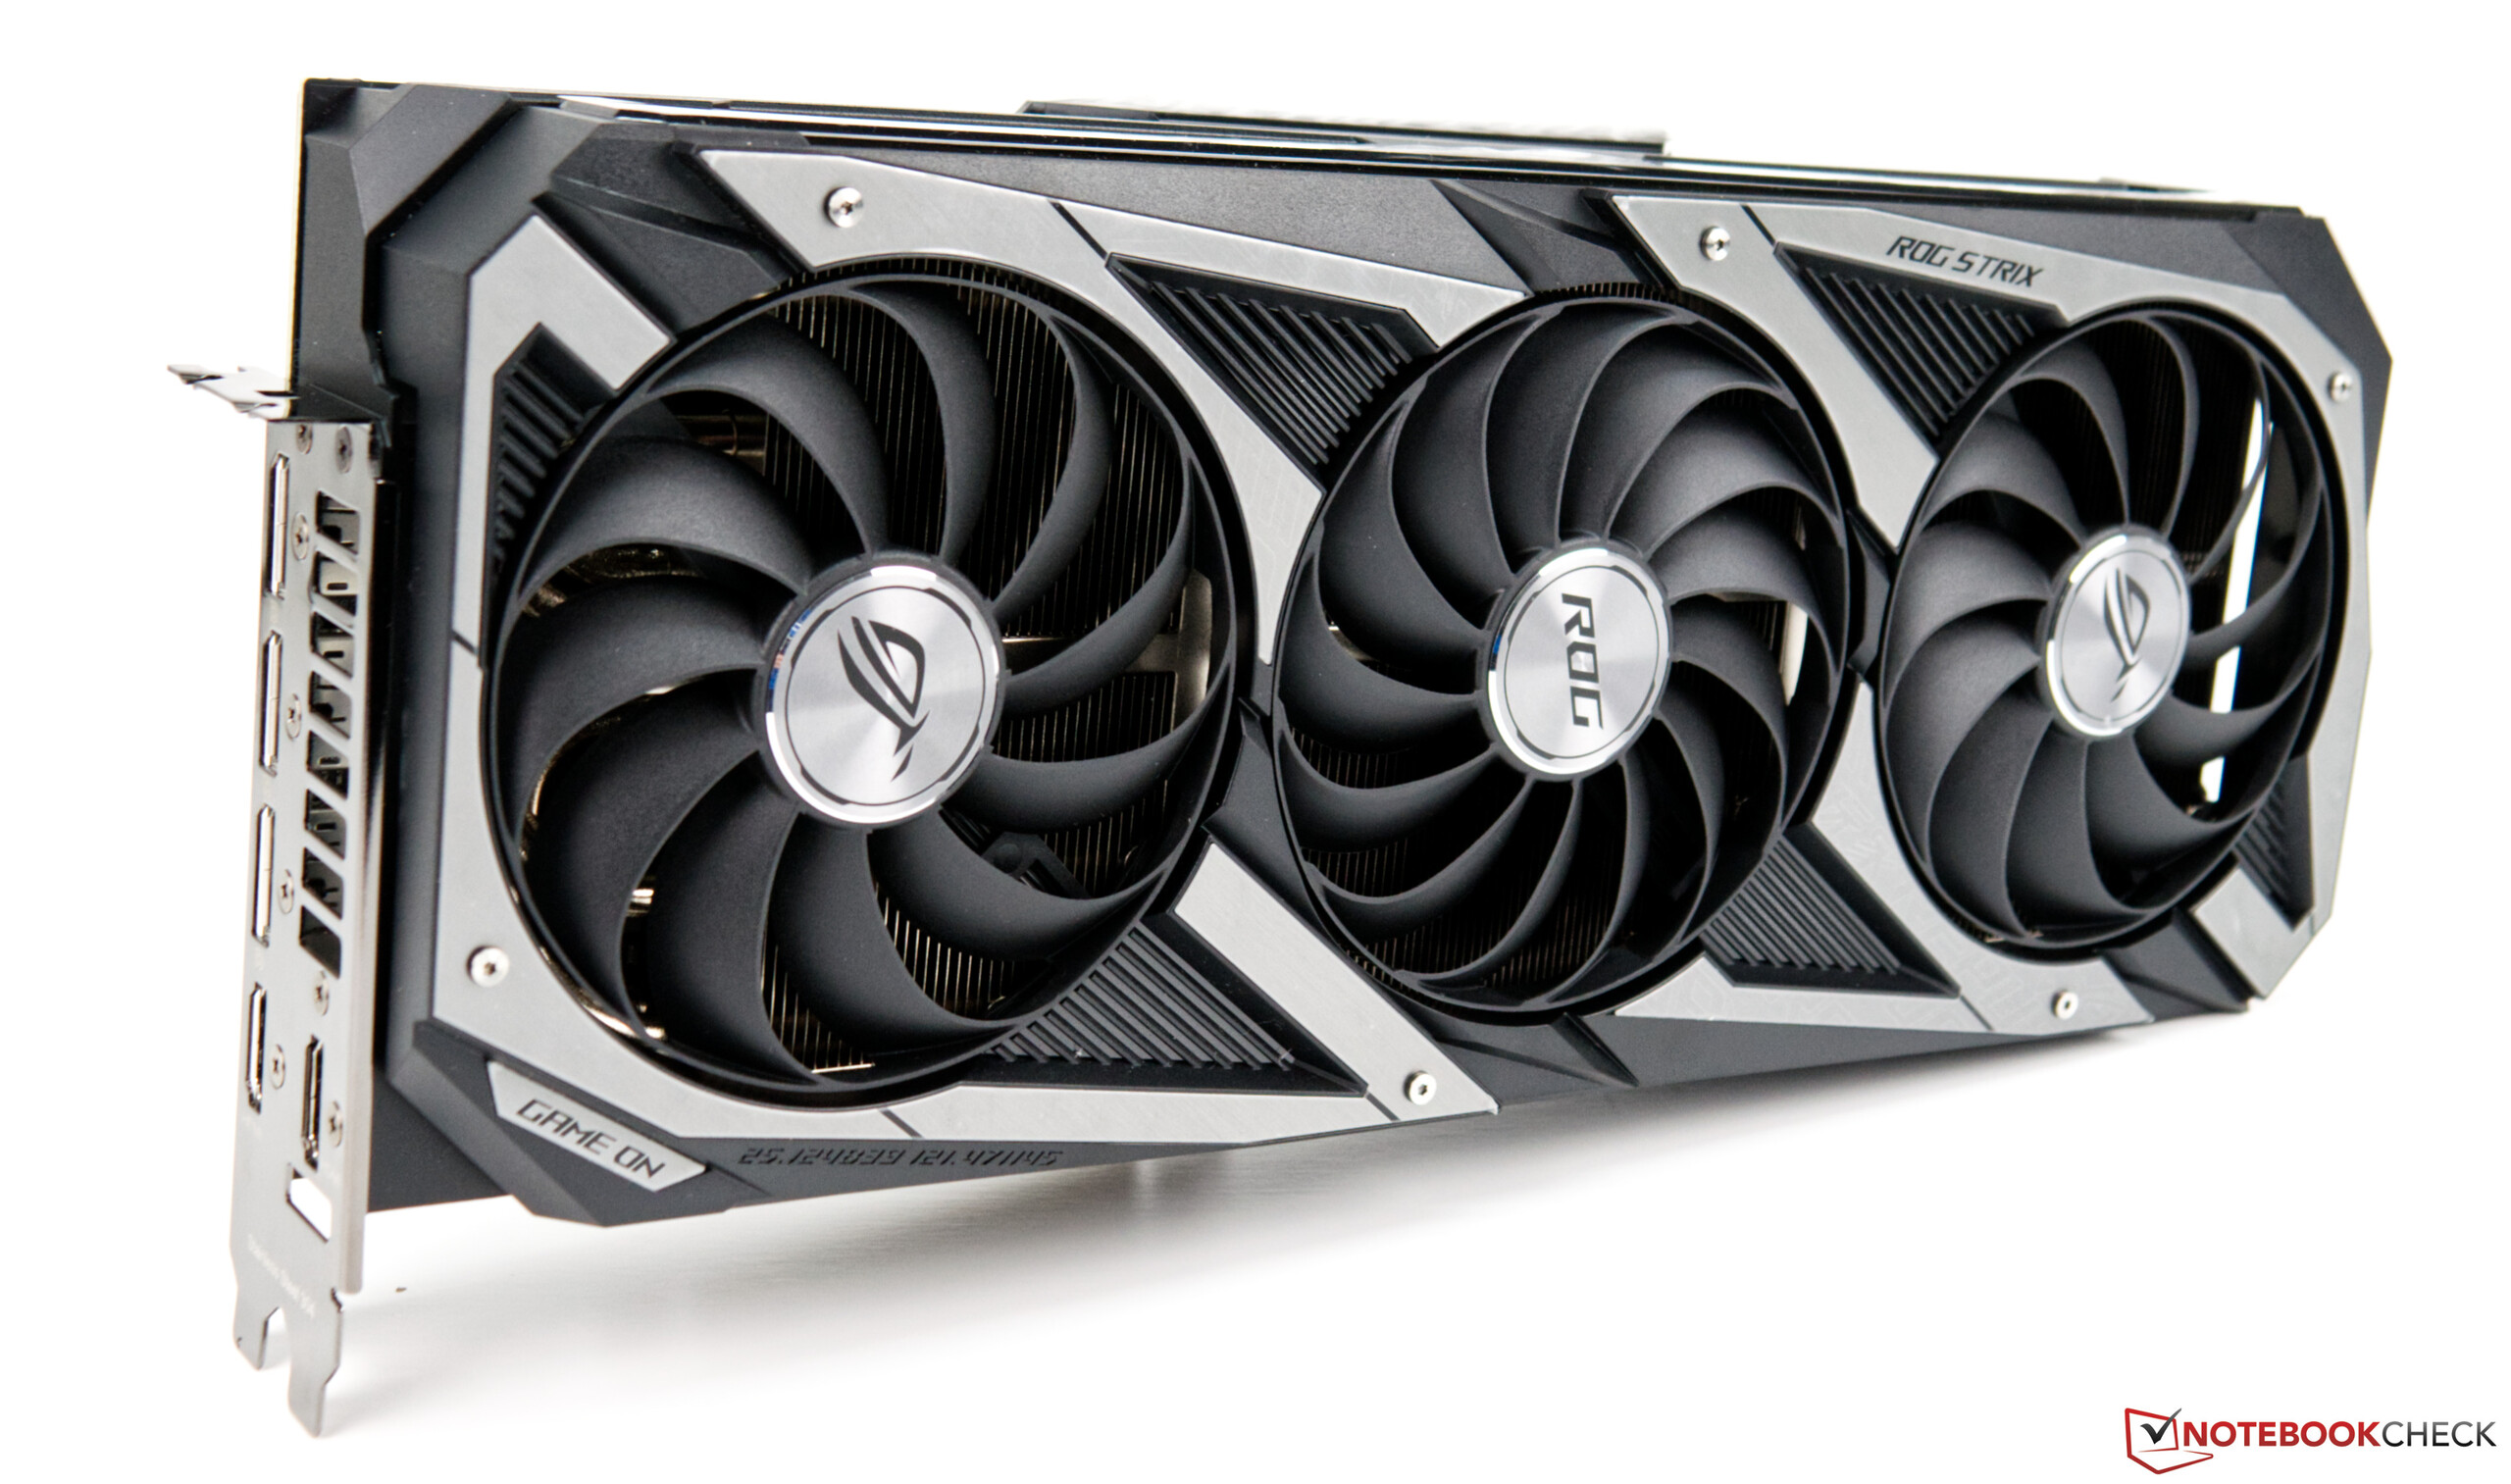
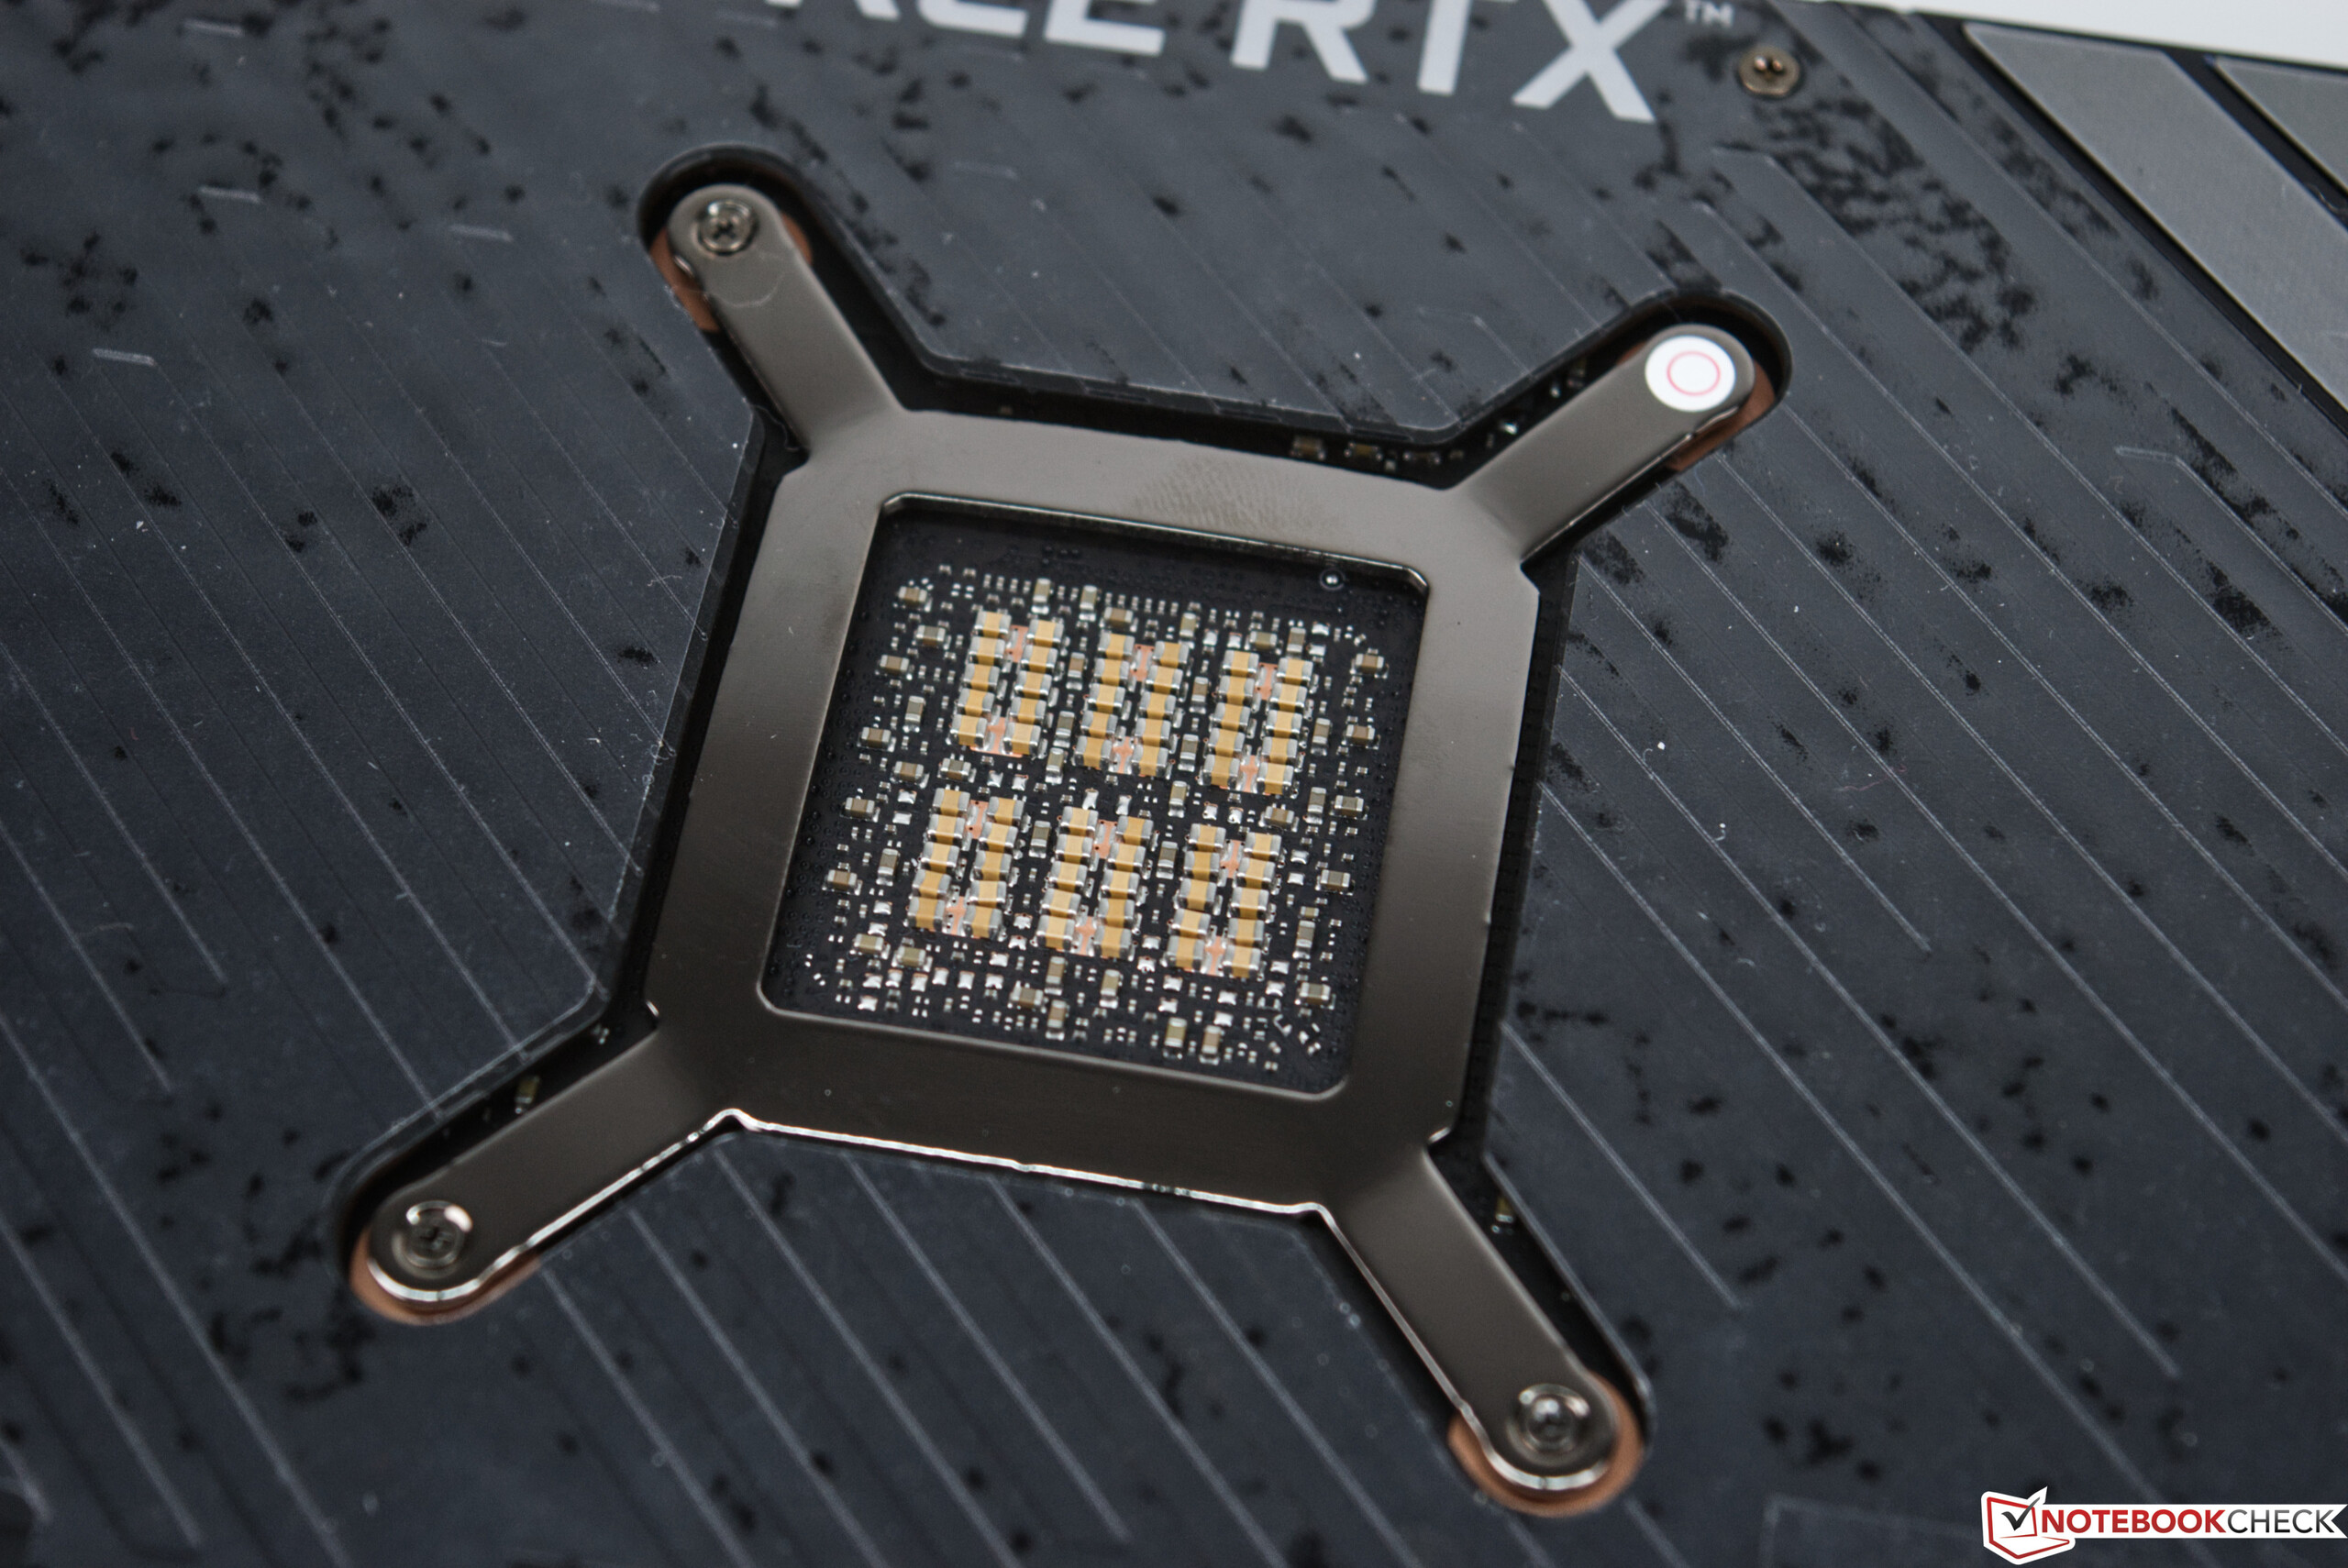
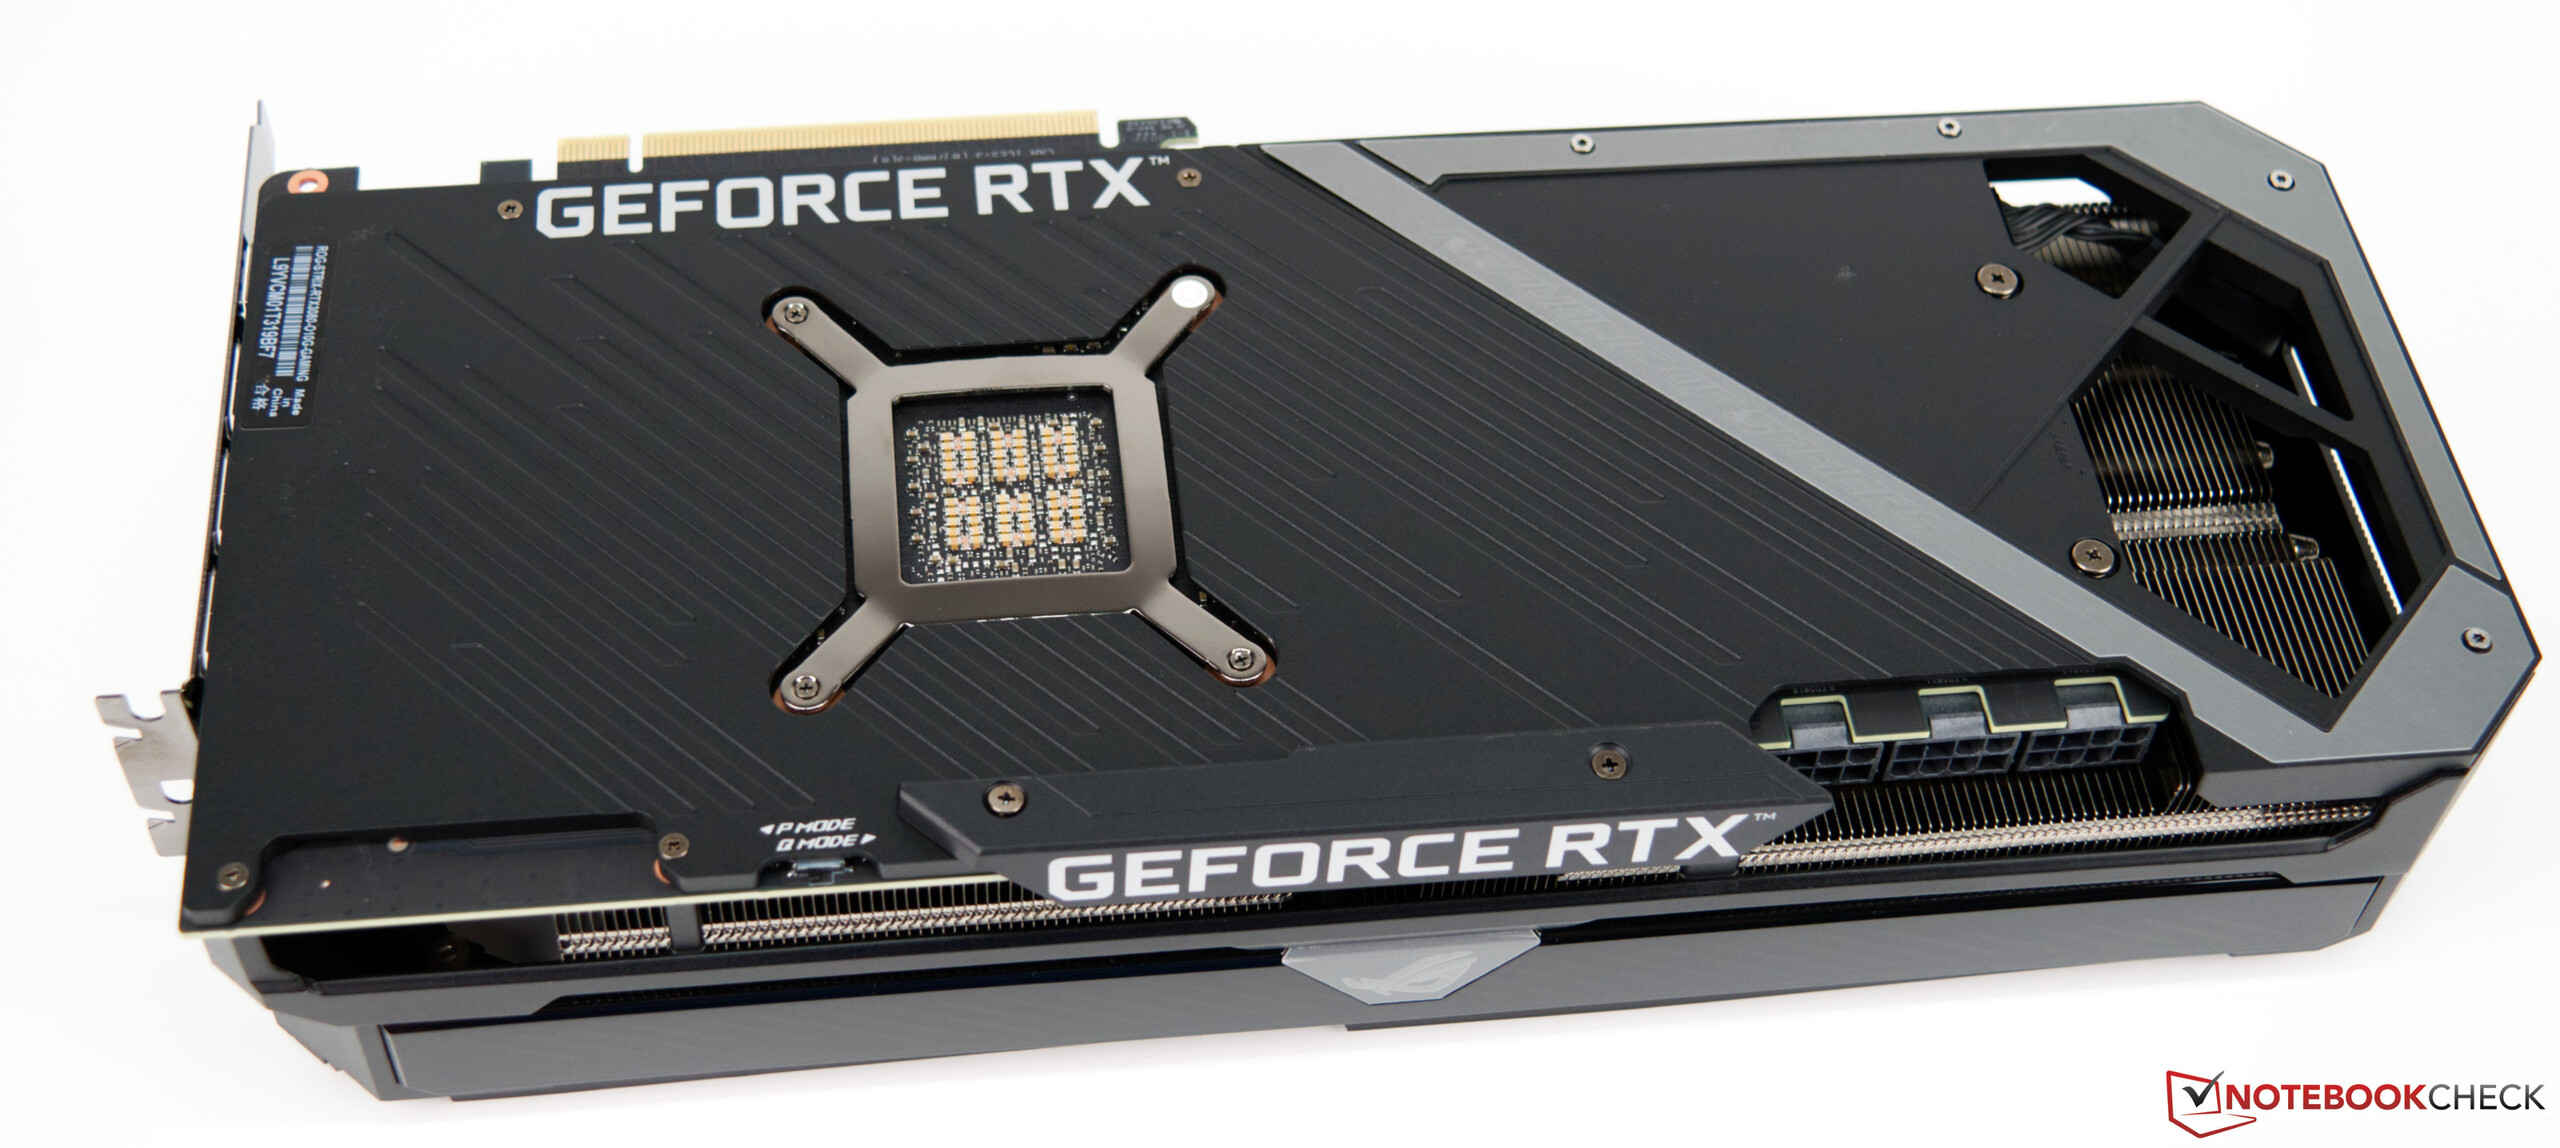
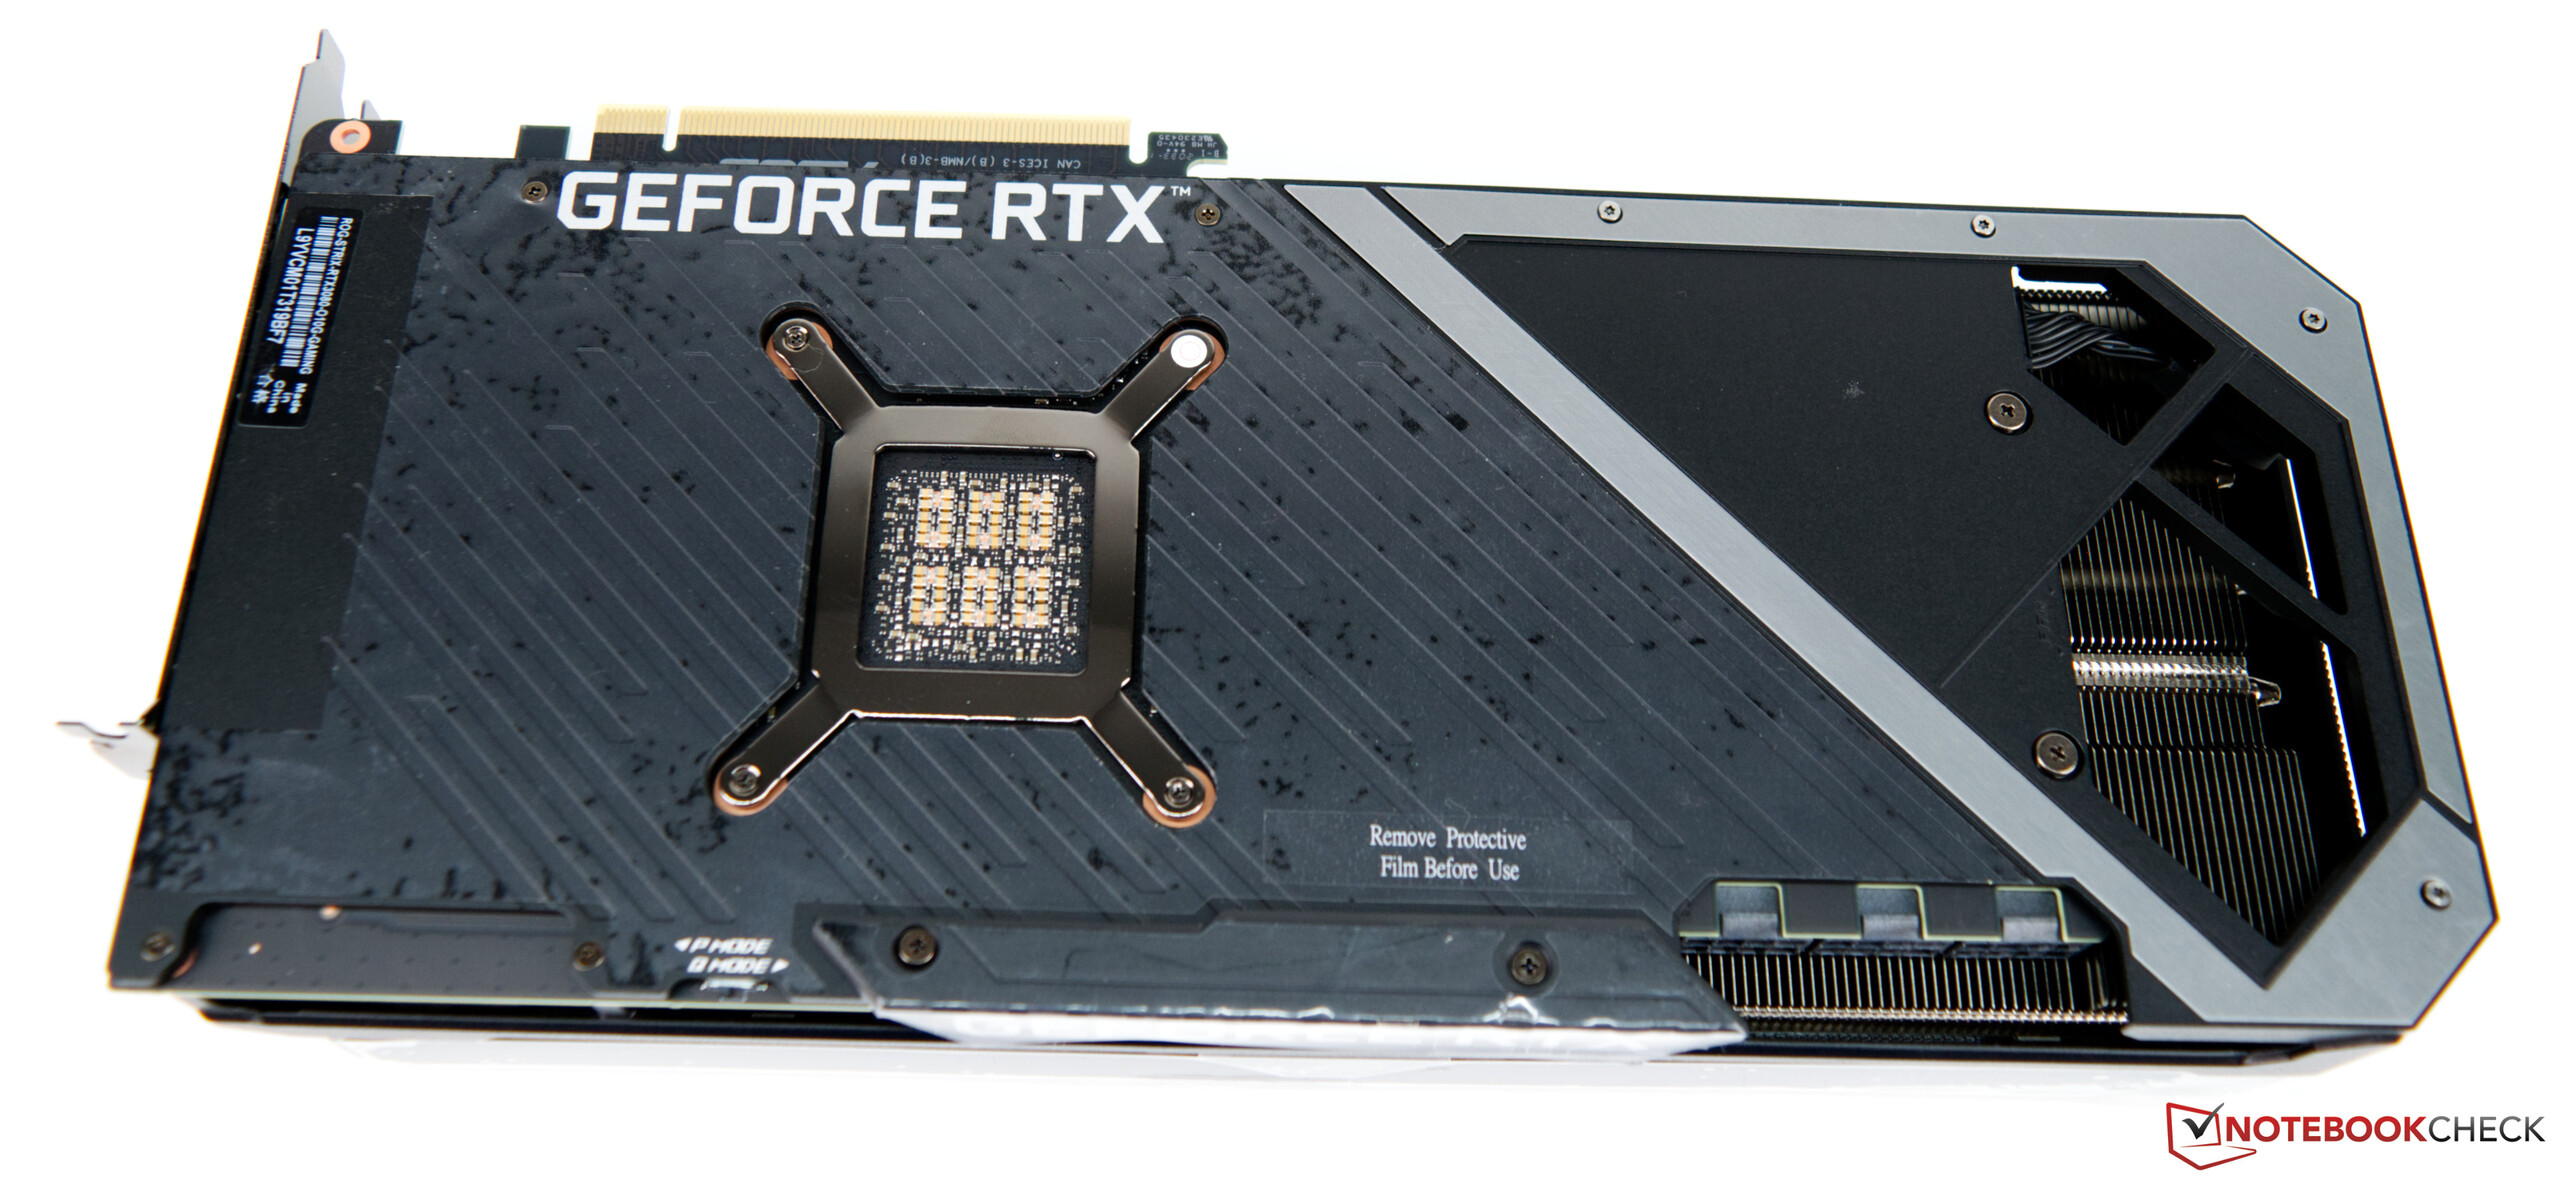
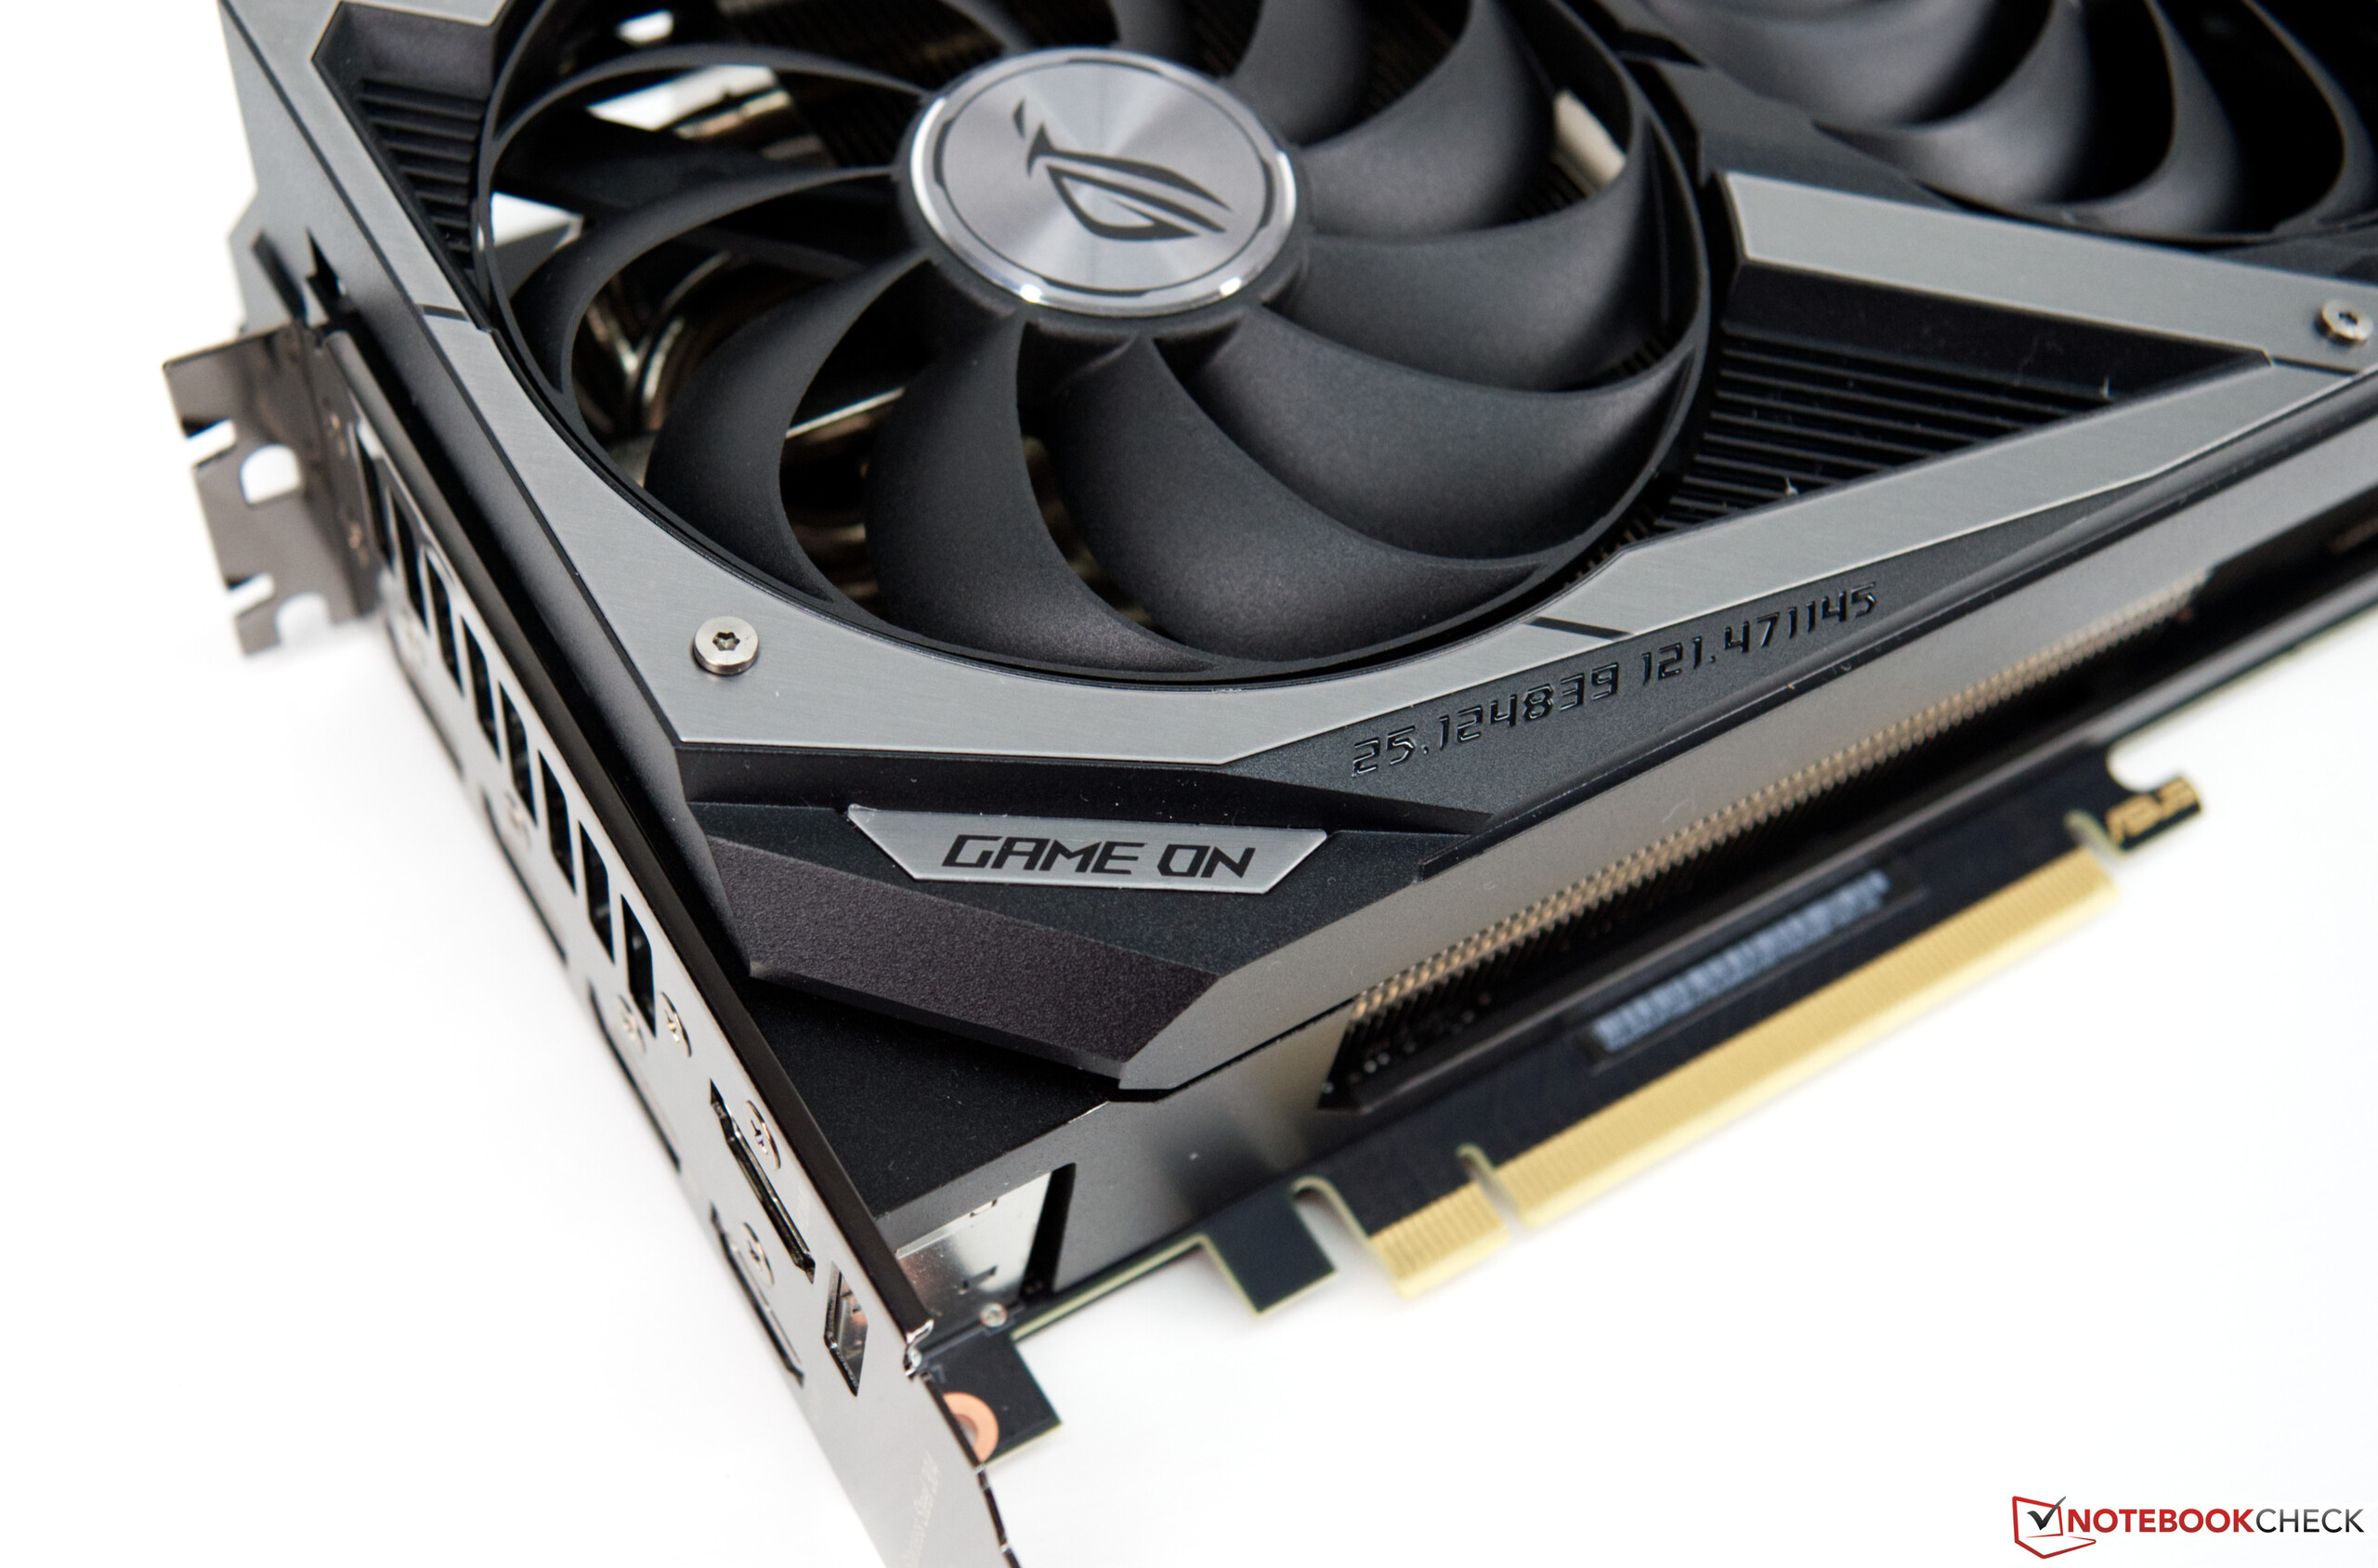
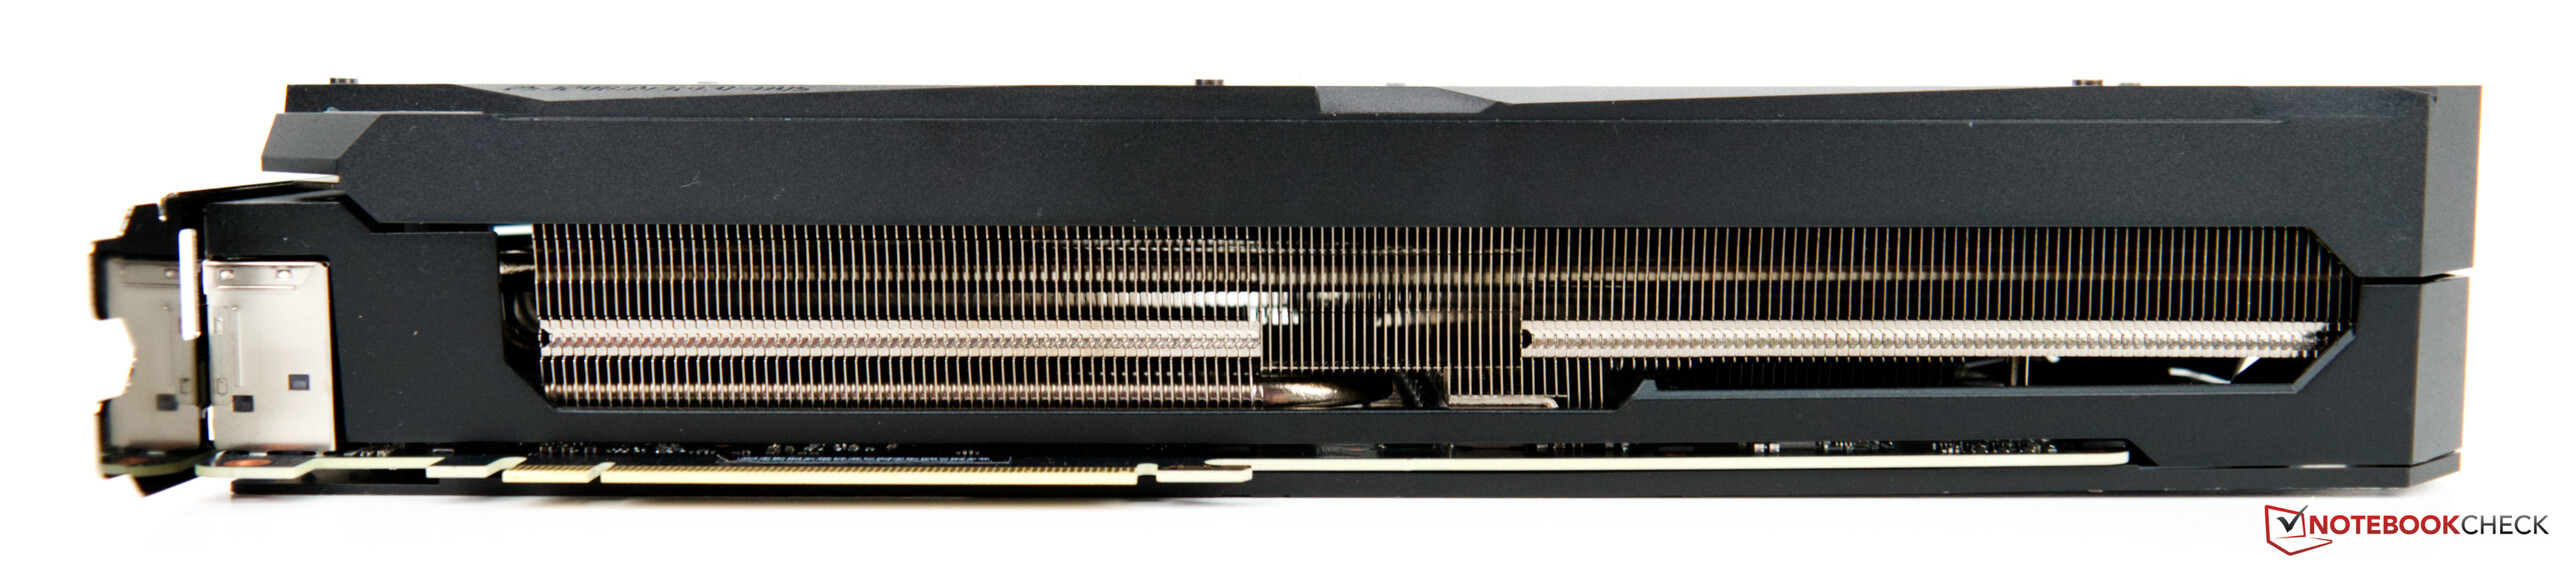
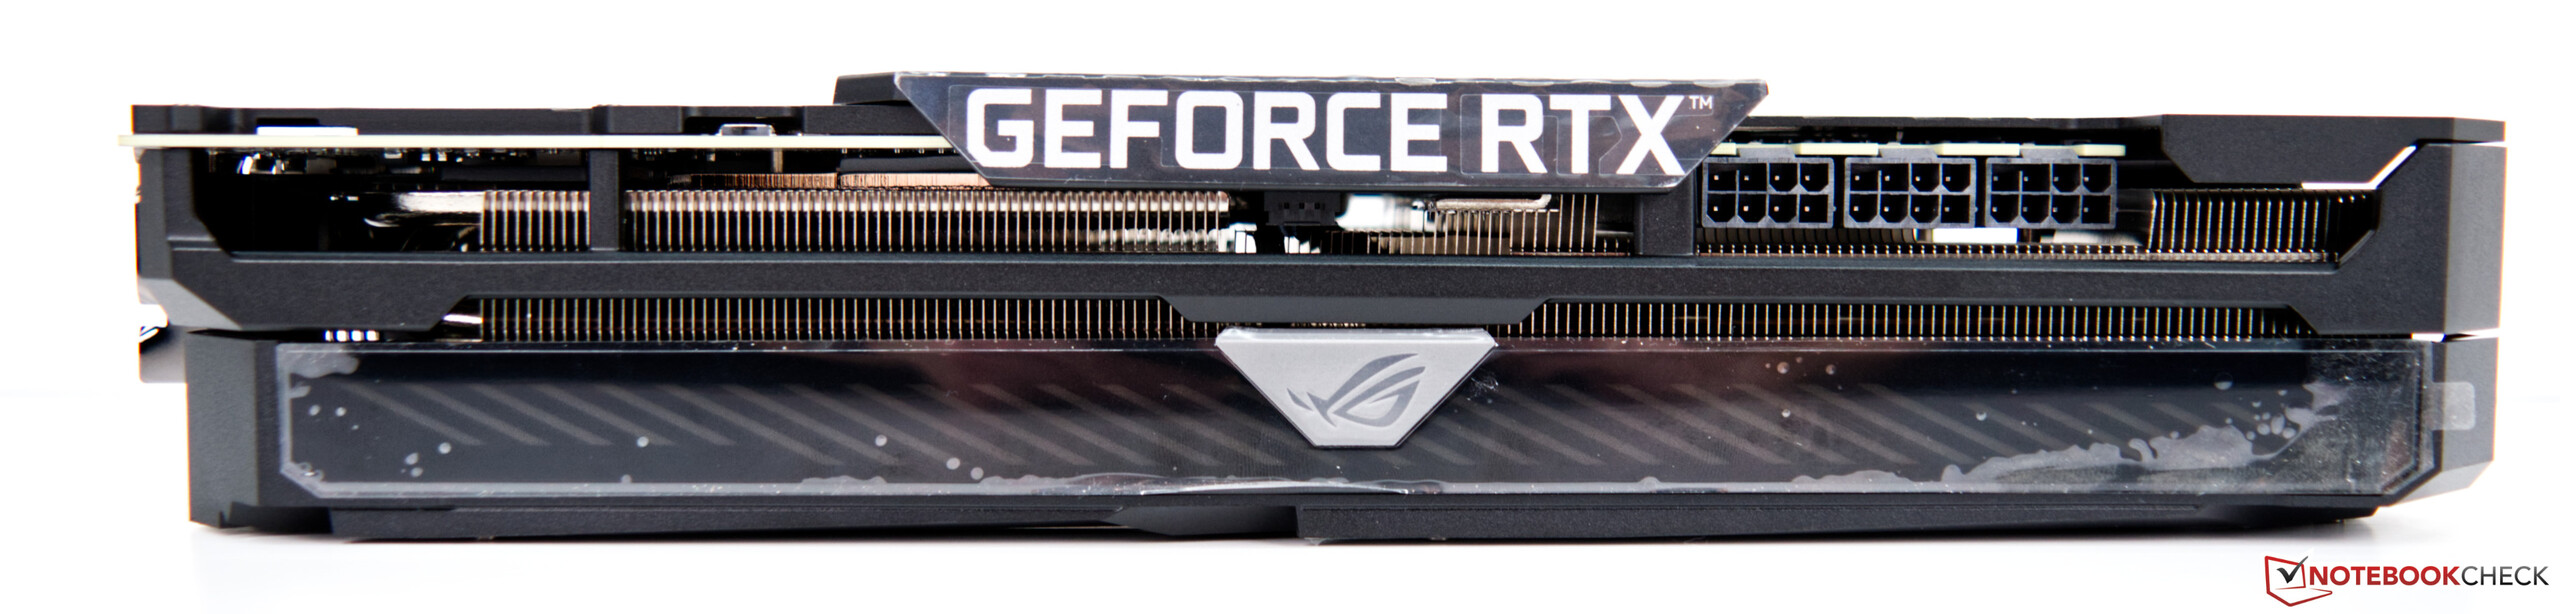
Moreover, Asus has given its top RTX 3080 model a very powerful triple-slot cooler. Overall, the graphics card measures just under 32 centimeters, which absolutely needs to be considered when buying this GPU. Not every case offers so much space for such a monster of a graphics card.
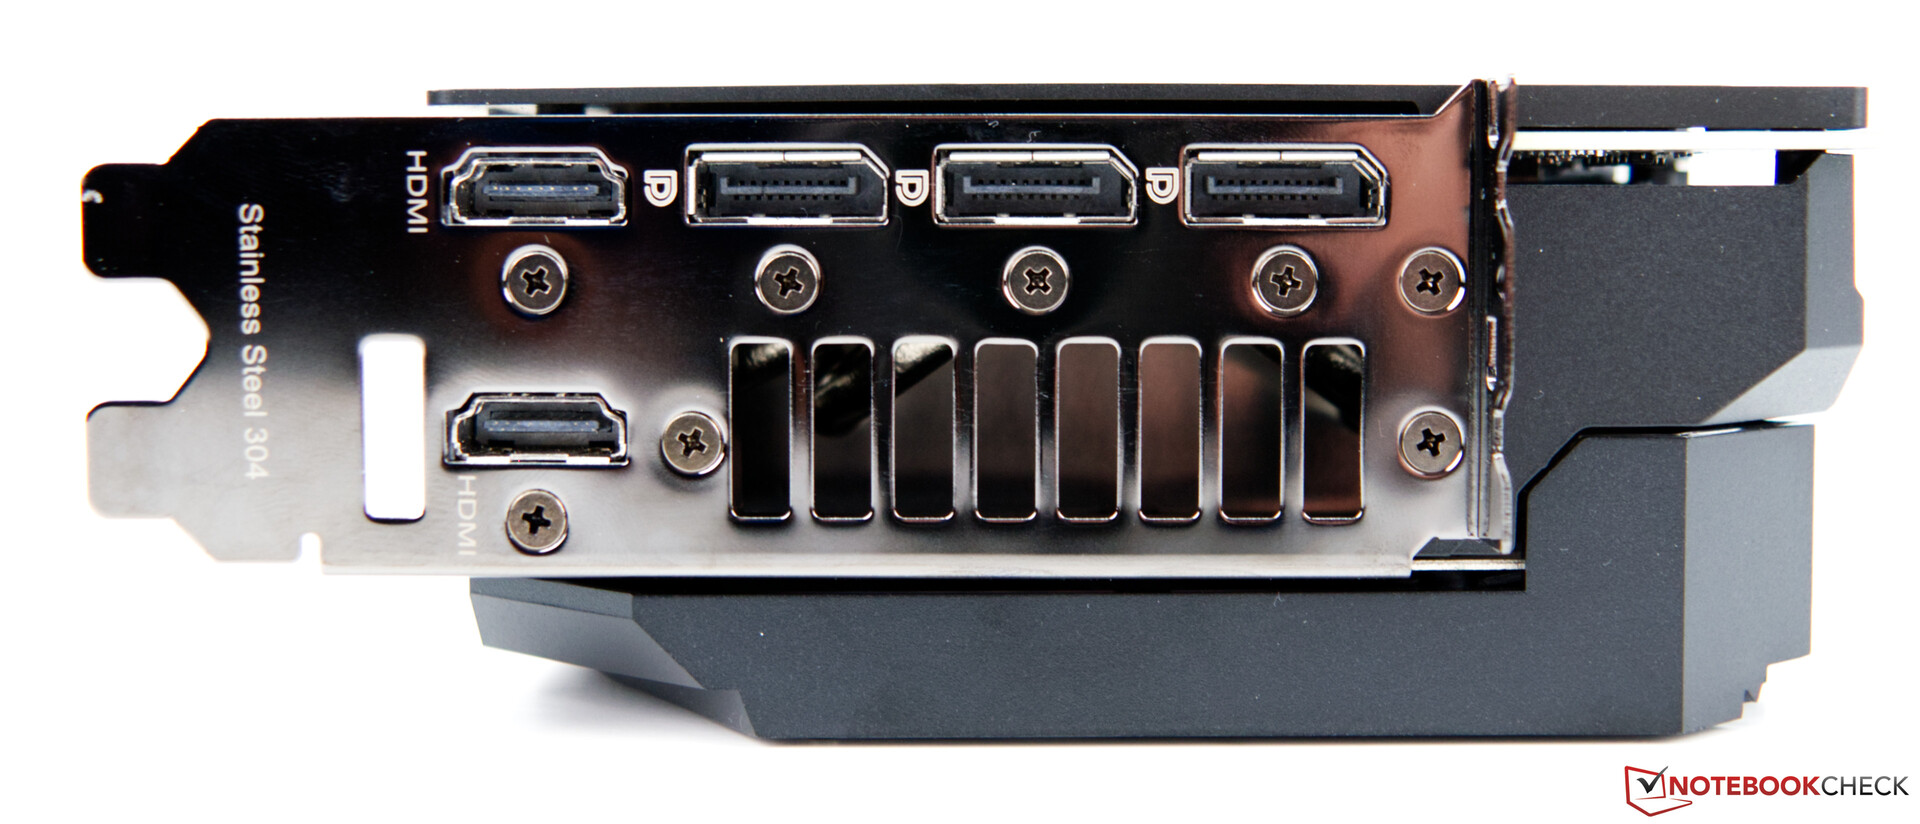
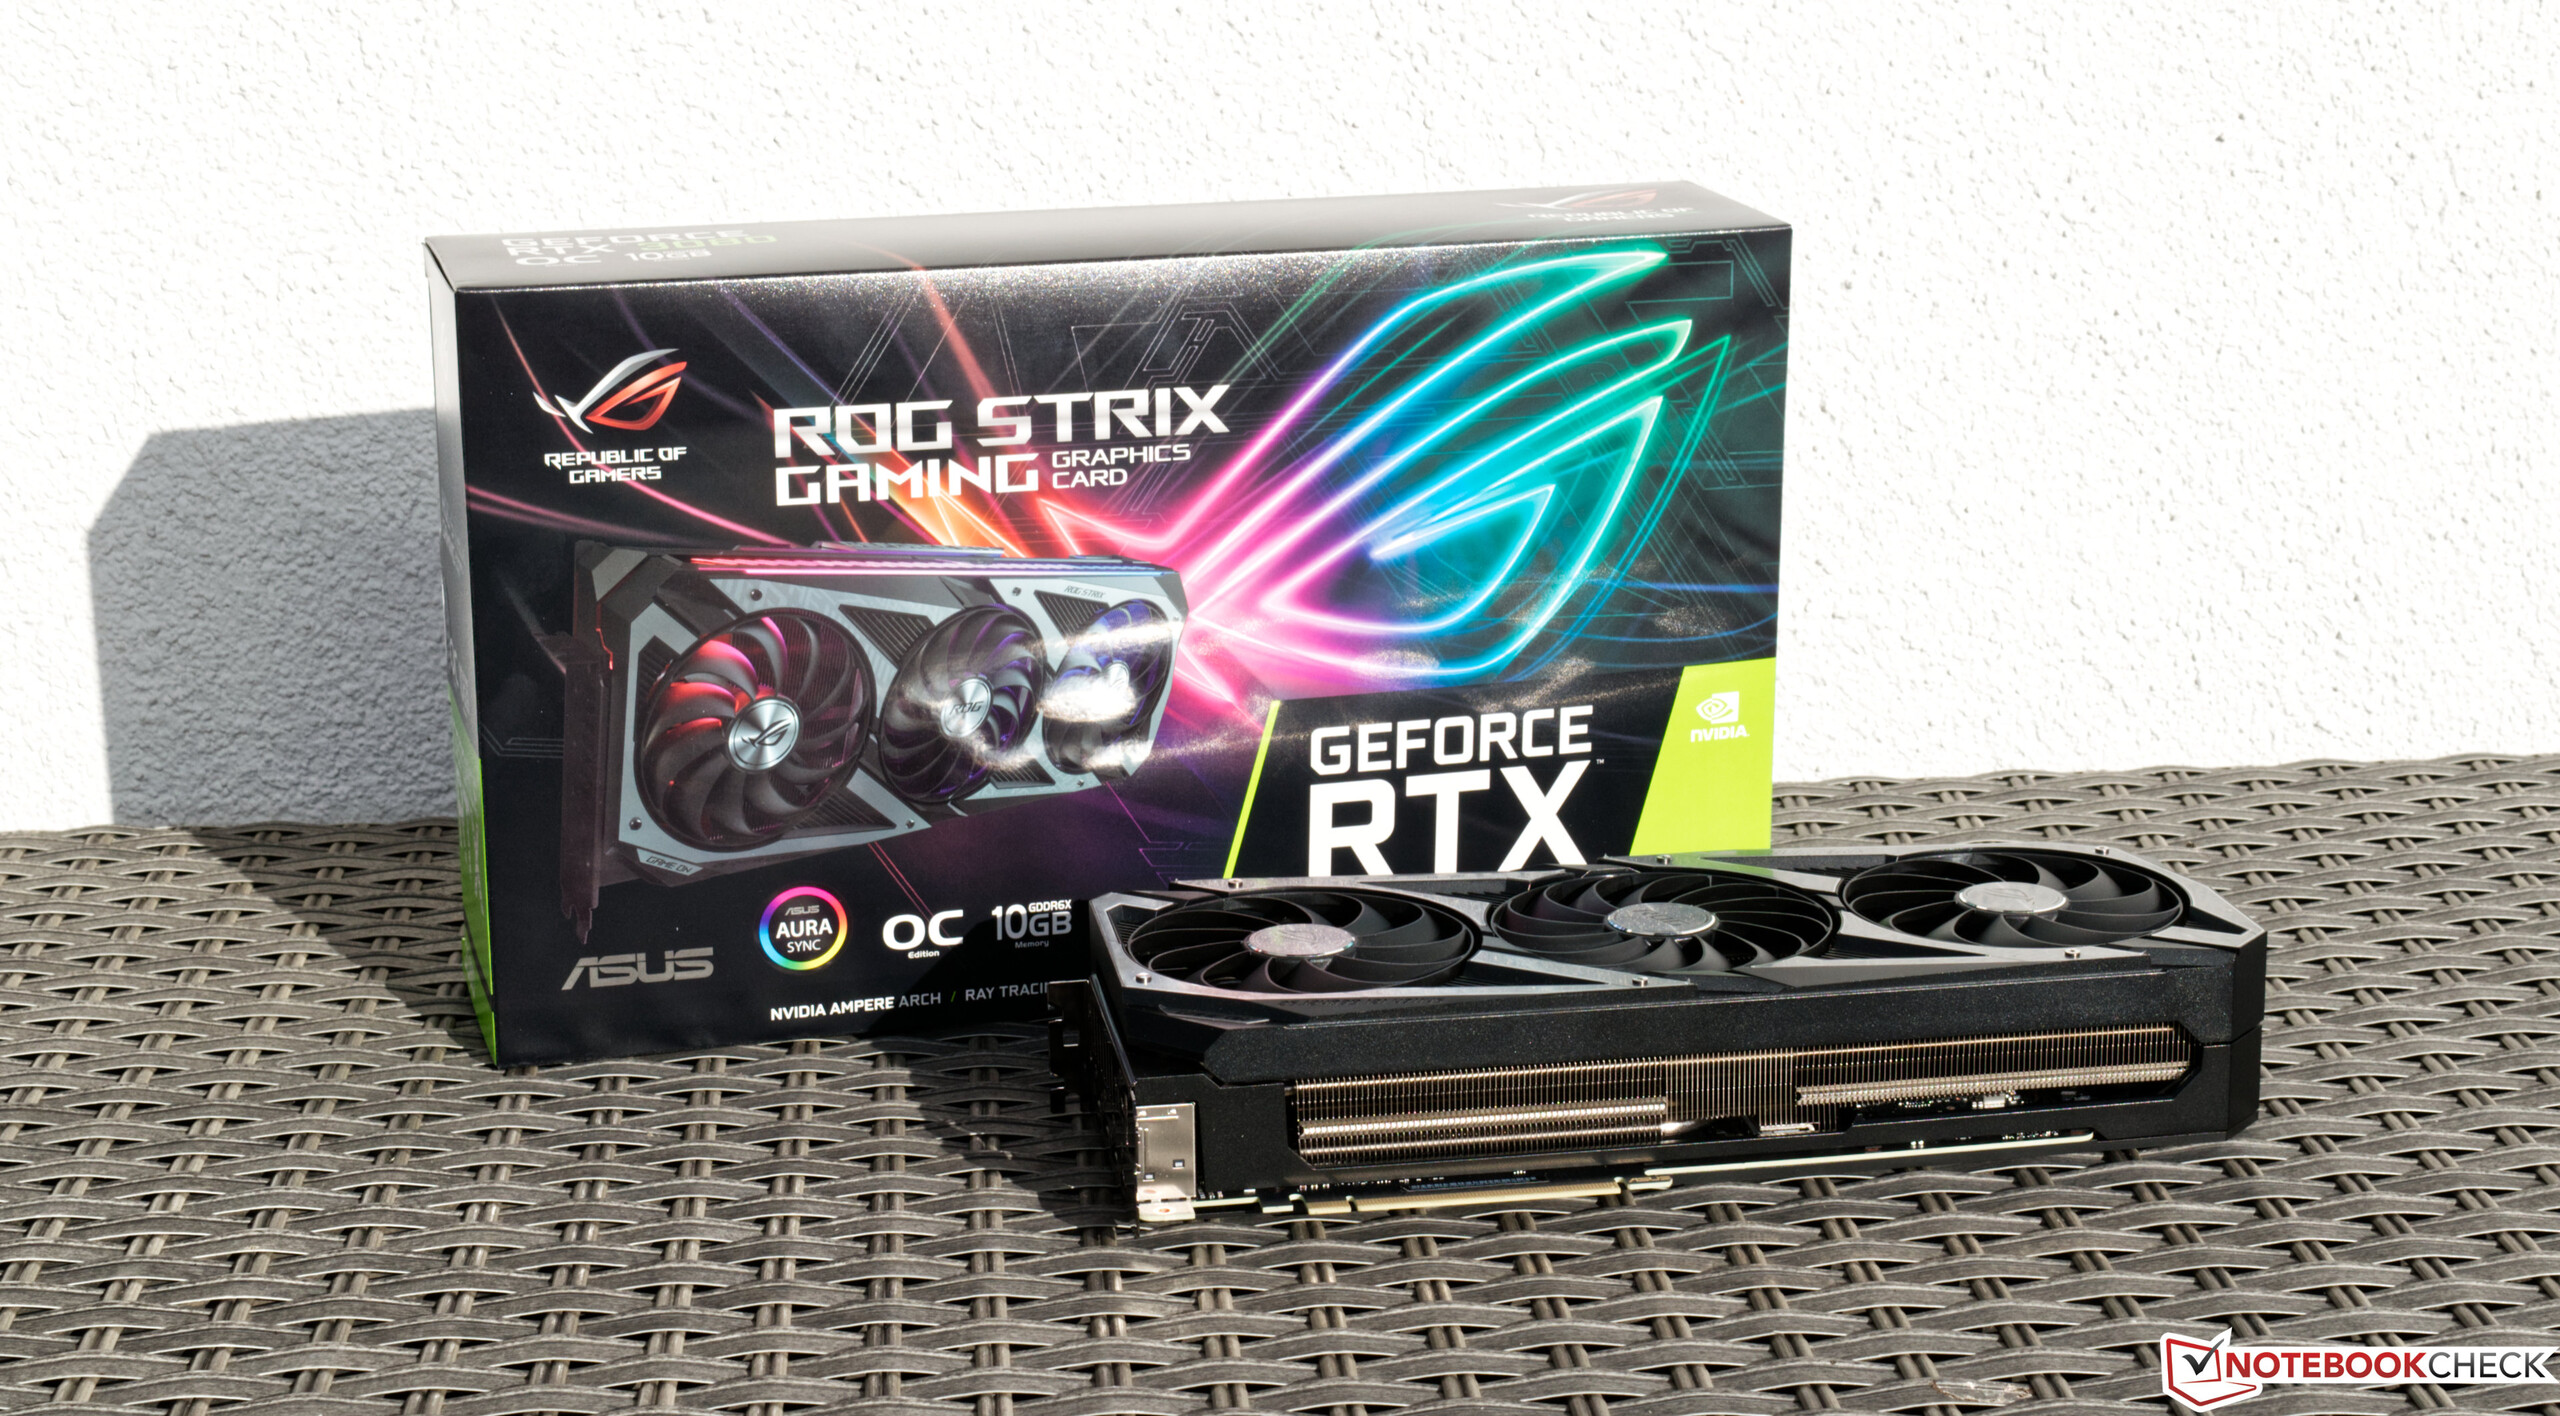
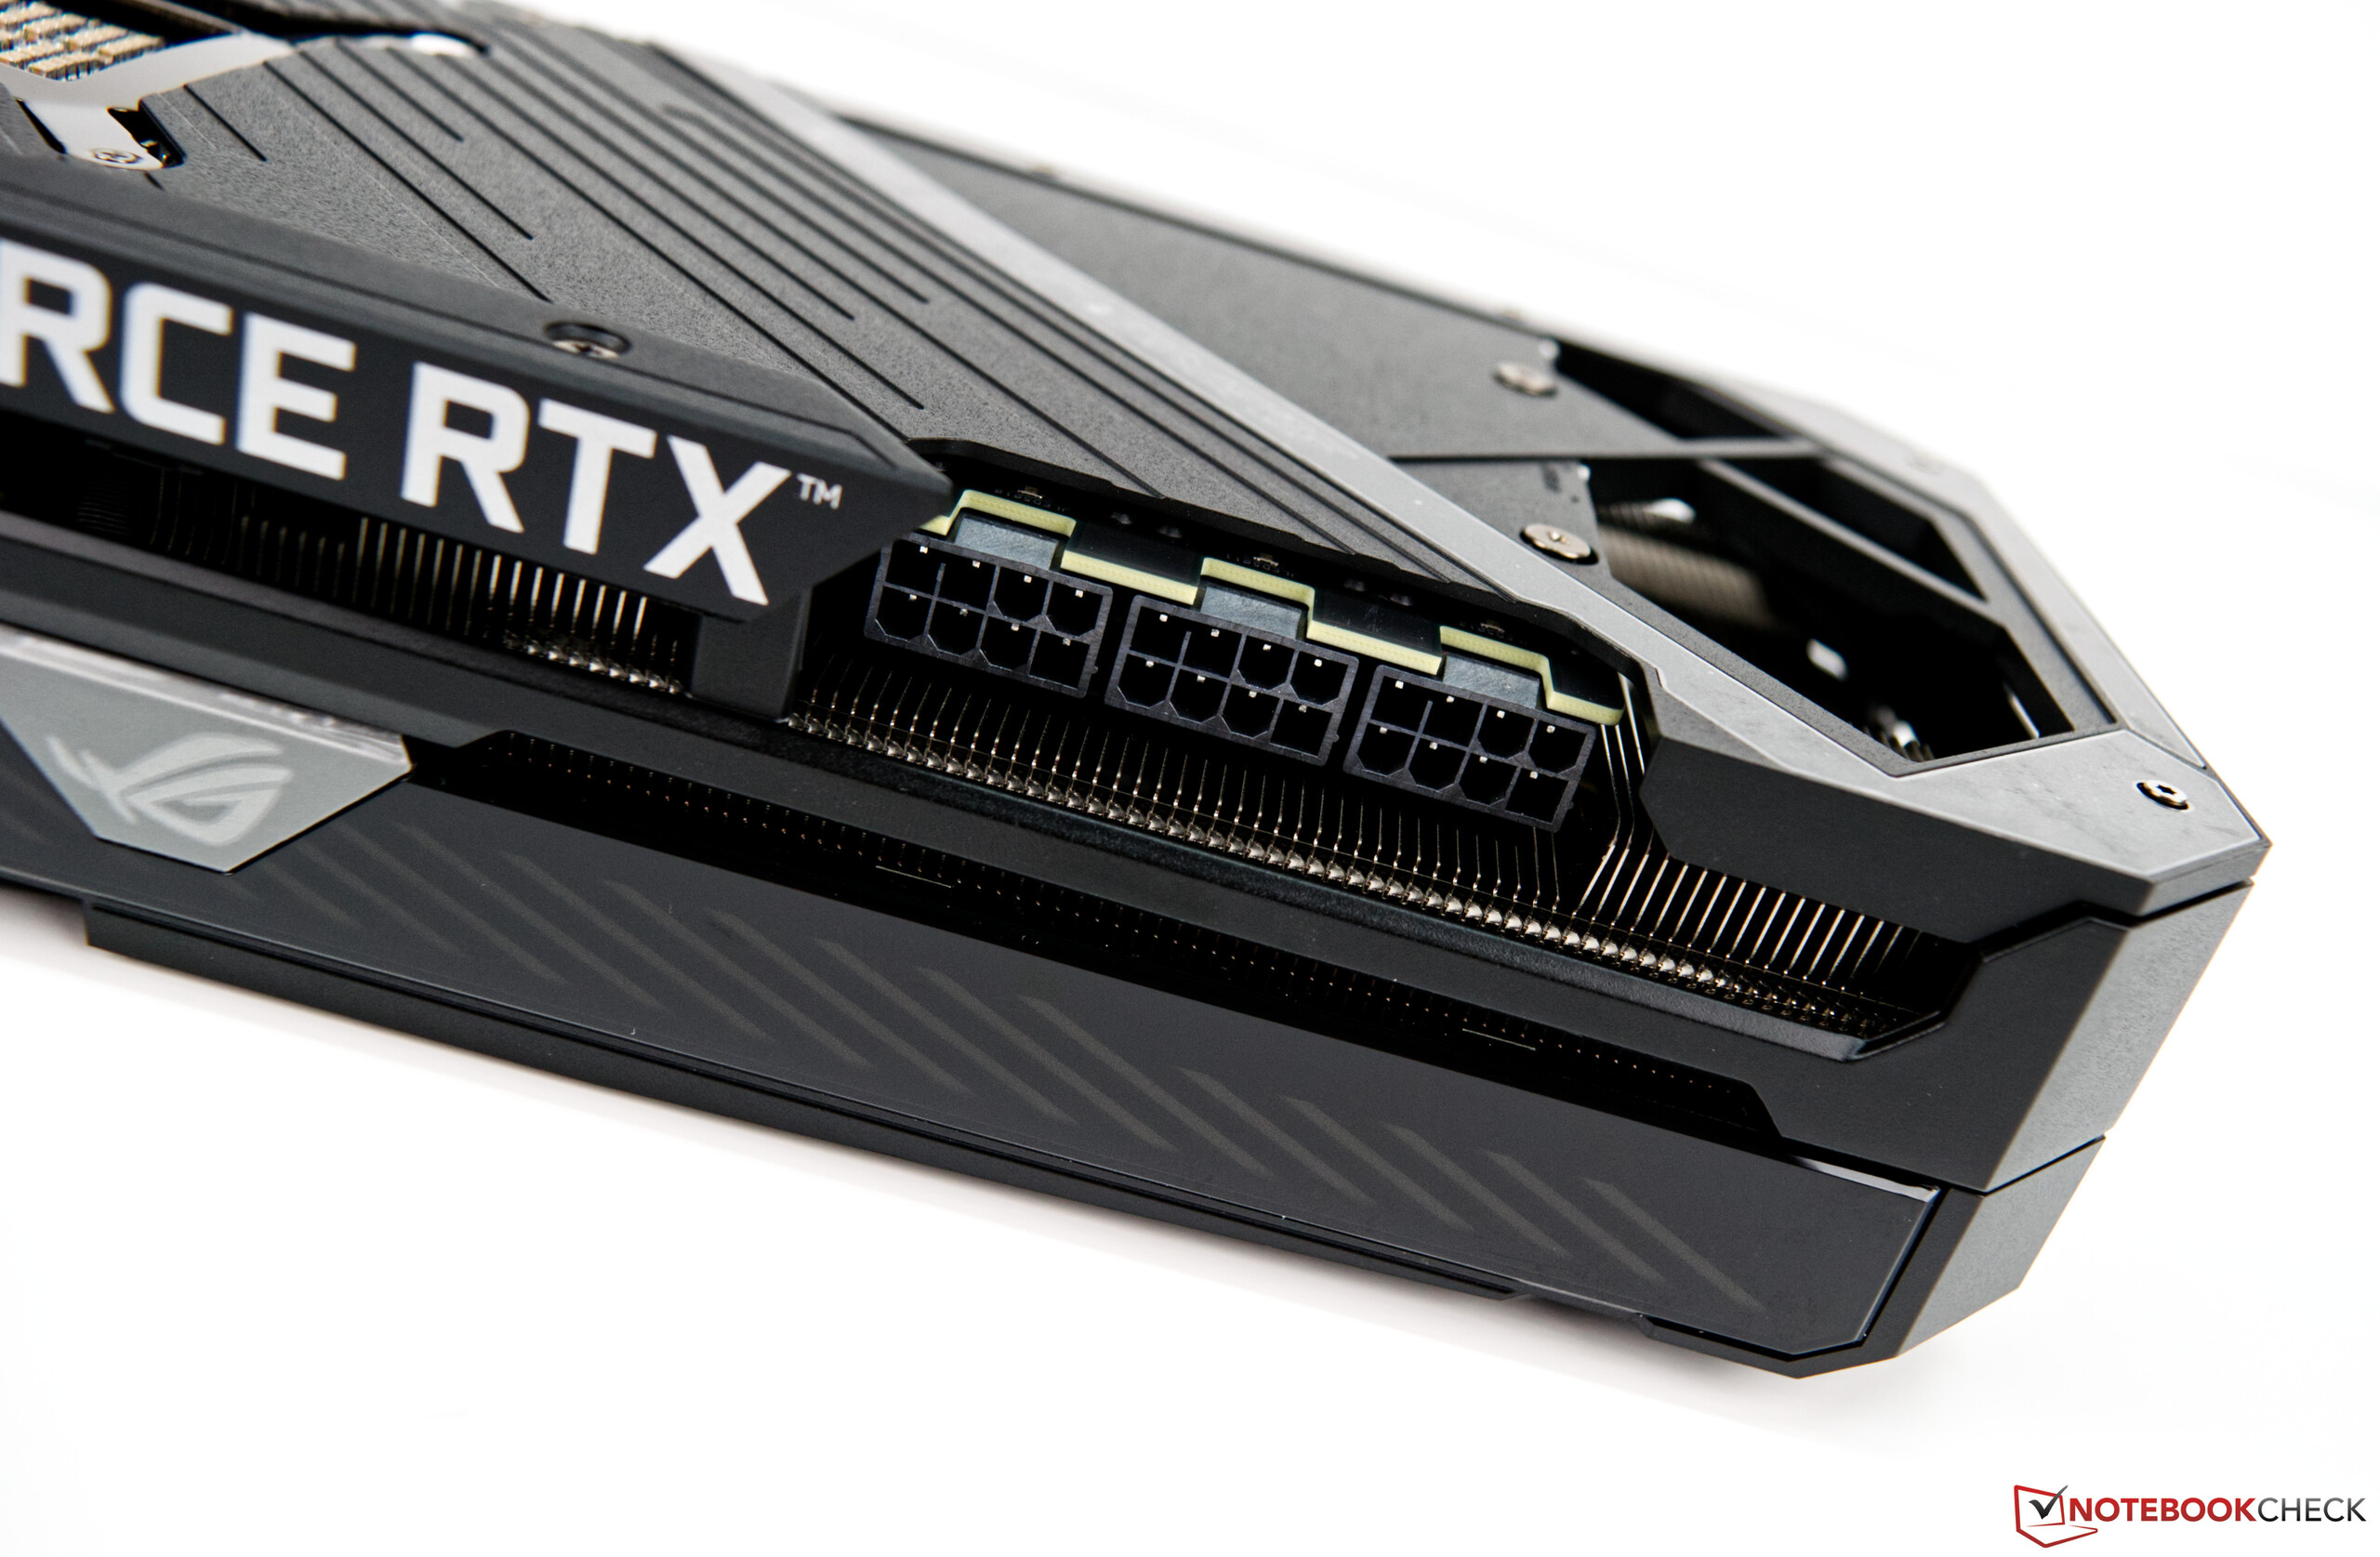
Asus follows the old familiar path when it comes to power supply and doesn't go for the 12-pin connector that Nvidia uses with its RTX 3000 cards. The GeForce RTX 3080 ROG Strix Gaming OC requires three 8-pin connectors for its operation. As a result, a strong power adapter is inevitable, and Asus itself speaks of at least 850 watts. Up to four external monitors can be connected simultaneously. For this purpose, the GPU features HDMI supporting the latest standard (2.1) as well as DisplayPort connections (1.4a).
The RTX 3080 compared with other NVIDIA GPUs
| Specification | RTX 3090 | RTX 3080 (Asus ROG) | RTX 3080 FE | RTX 3070 FE | Titan RTX | TITAN X Pascal | RTX 2080 Ti | RTX 2080 |
| Chip | GA102 | GA102 | GA102 | GA104 | TU102 | GP102 | TU102 | TU104 |
| FinFET process | 8 nm | 8 nm | 8 nm | 8 nm | 12 nm | 16 nm | 12 nm | 12 nm |
| CUDA cores | 10,496 | 8,704 | 8,704 | 5,888 | 4,608 | 3,584 | 4,352 | 2,944 |
| Texture units | 328 | 272 | 272 | 184 | 288 | 224 | 272 | 184 |
| Tensor cores | 328 3rd Gen. | 272 3rd Gen. | 272 3rd Gen. | 184 3rd Gen. | 576 2nd Gen. | - | 544 2nd Gen. | 368 2nd Gen. |
| RT Cores | 82 | 68 | 68 | 46 | 72 | - | 68 | 46 |
| GPU base clock | 1,395 MHz | 1,440 MHz | 1,440 MHz | 1,500 MHz | 1,350 MHz | 1,417 MHz | 1,350 MHz | 1,515 MHz |
| GPU boost clock | 1,695 MHz | 1,905 MHz | 1,710 MHz | 1,725 MHz | 1,770 MHz | 1,531 MHz | 1,545 MHz | 1,710 MHz |
| Memory bus | 384-bit | 320-bit | 320-bit | 256-bit | 384-bit | 384-bit | 352-bit | 256-bit |
| Memory bandwidth | 936 GB/s | 760 GB/s | 760 GB/s | 448 GB/s | 672 GB/s | 480.4 GB/s | 616 GB/s | 448 GB/s |
| Video memory | 24 GB GDDR6X | 10 GB GDDR6X | 10 GB GDDR6X | 8 GB GDDR6 | 24 GB GDDR6 | 12 GB GDDR5X | 11 GB GDDR6 | 8 GB GDDR6 |
| Power consumption | 350 W | 320 W | 320 W | 220 W | 280 W | 250 W | 250 W | 215 W |
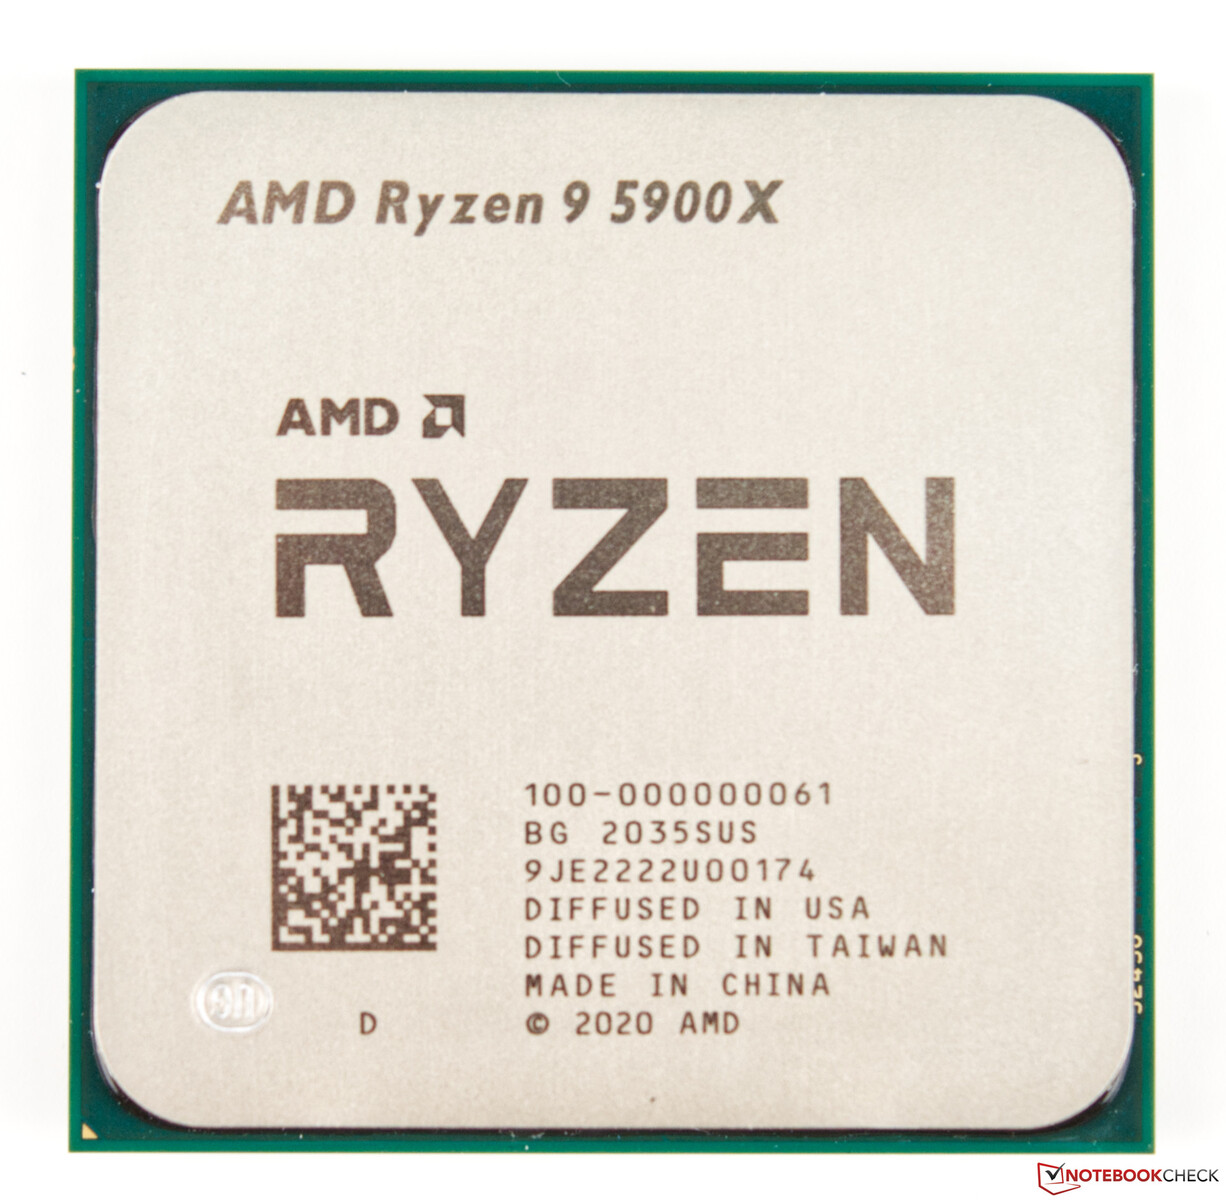
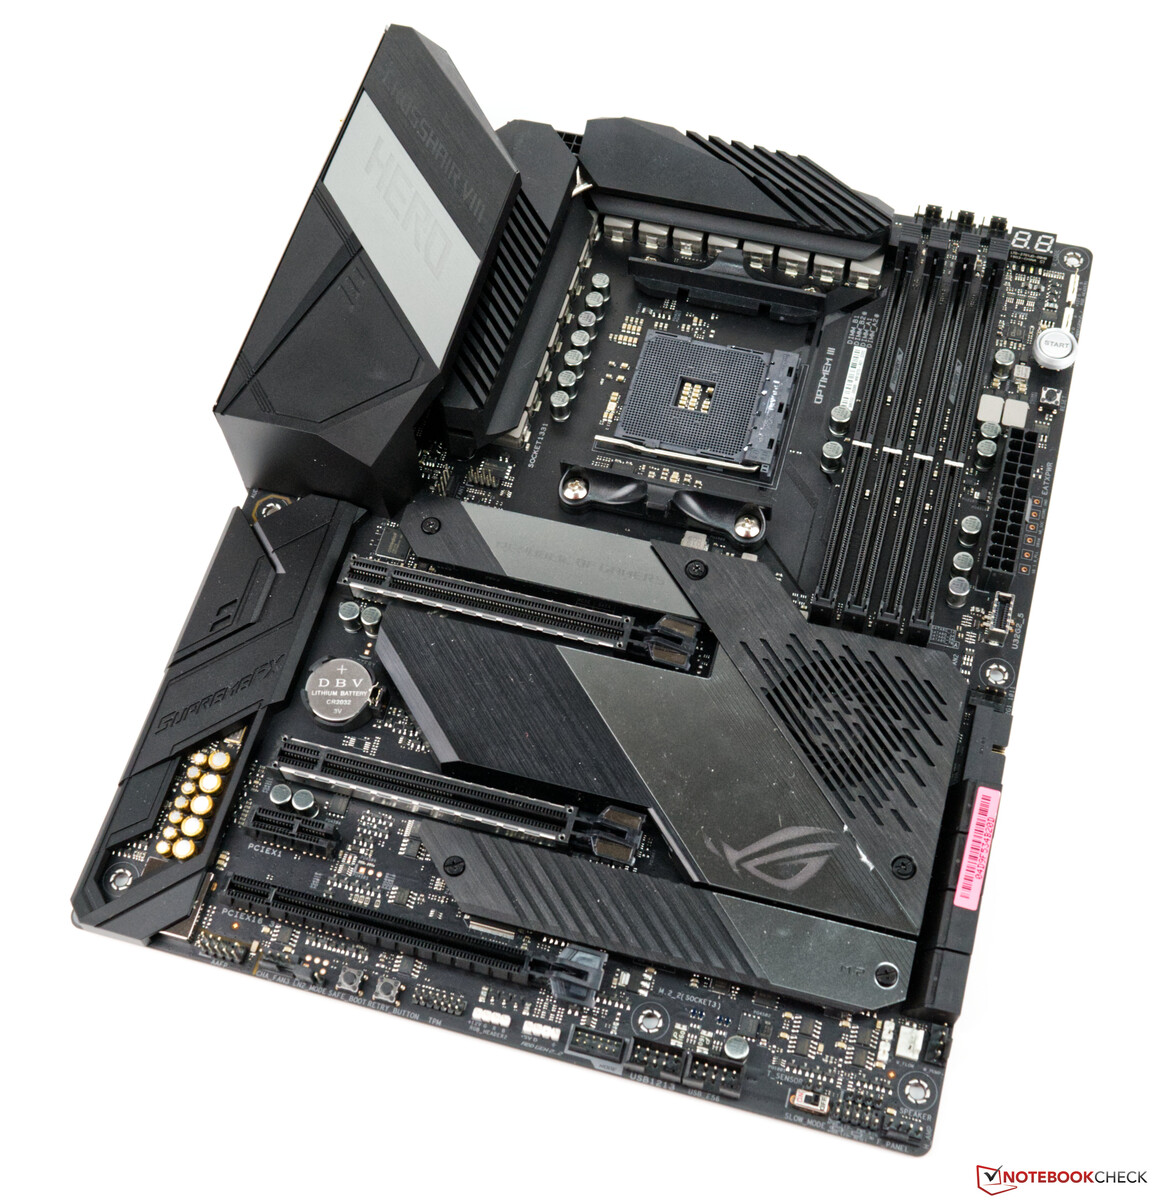
Our test system with the AMD Ryzen 9 3900X as base
A current AMD platform based on the Asus X570 ROG Crosshair VIII serves as our test system. The CPU (AMD Ryzen 9 5900X) offers good CPU performance, and we used an AIO (Alphacool Eisbaer 280cmm) for the cooling. The 32 GB of RAM comes from Corsair and clocks at 4,000 MHz. As monitor, we use the Acer Predator XB321HK. It doesn't limit us due to its UHD capability. At this point we would like to thank AMD for providing the test platform as well as Corsair for the RAM kit.
For the upcoming benchmarks and tests, we use the following system:
- Corsair Carbide Air 540 ATX Cube
- AMD Ryzen 9 5900X
- Asus GeForce RTX 3080 ROG Strix Gaming OC (Nvidia driver 457.09)
- Asus X570 ROG Crosshair VIII (BIOS 2402, default settings, XMP 1 for DDR4 4000)
- Corsair RM1000X 1000-watt power supply unit
- Corsair Vengeance RGB Pro DDR4 4000 2x 16 GB RAM kit
- Corsair MP600 2 TB M.2 PCIe 4.0 SSD
- Crucial MX500 2 TB (for games)
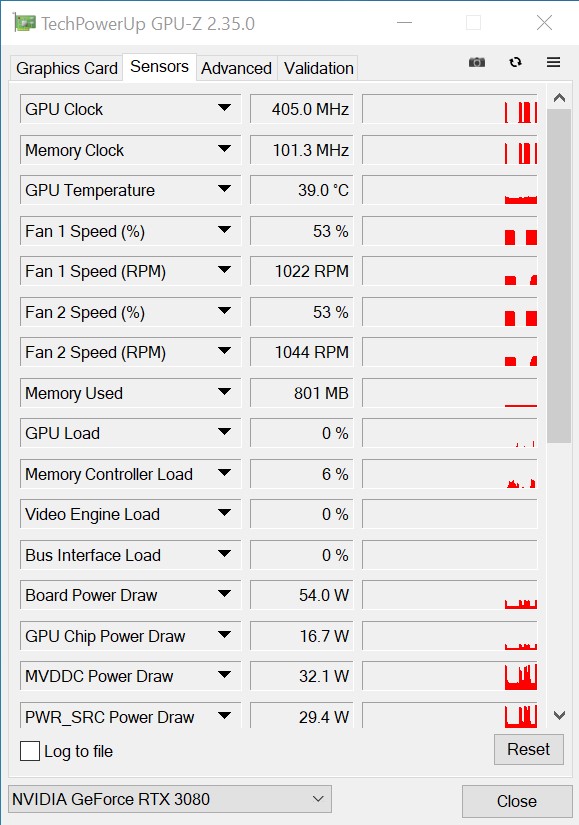
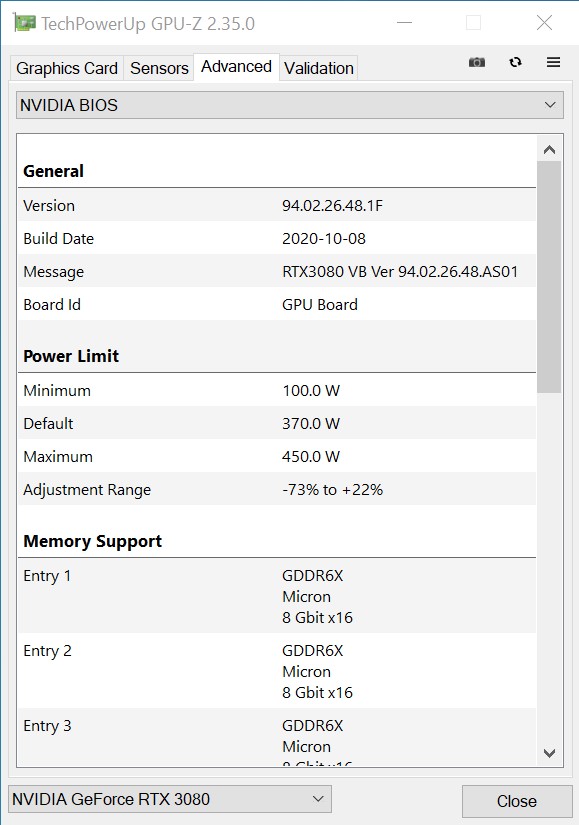
The clock speeds of the Asus GeForce RTX 3080 ROG Strix Gaming OC
At 1,440 MHz, the base clock speed of the Asus GeForce RTX 3080 ROG Strix Gaming OC has remained unchanged compared to the reference model. However, Asus takes a different path when it comes to the boost clock rate and allows its model to reach a considerably higher speed at up to 1,905 MHz. This clock rate can also be maintained without problems under load and is usually even exceeded. Moreover, Asus also allows a higher power target of up to 21%. As a result, the GeForce RTX 3080 ROG Strix Gaming OC can even be run stably at over 2 GHz. In terms of VRAM, there's GDDR6X now instead of GDDR6, which was previously used, although 10 GB should be enough now compared to the RTX 2080 Ti. At the moment, only the GeForce RTX 3090 of the current Ampere series offers more graphics memory.

Synthetic benchmarks
In the synthetic benchmarks, the Asus GeForce RTX 3080 ROG Strix Gaming OC already begins to show its potential quite clearly. Only the GeForce RTX 3090 offers more performance; we already reviewed it in our partner Zotac's configuration. Compared to the GeForce RTX 2080 Ti, our test sample can set itself apart with a lead of about 30%. The significantly more expensive Nvidia Titan RTX only manages to take third place in our comparison and can't keep up with the GeForce RTX 3080.
In contrast to the Founders Edition, Asus has a better cooling structure in the GeForce RTX 3080 ROG Strix Gaming OC, which results in a slight performance advantage over the reference model.
| Unigine Superposition | |
| 1280x720 720p Low | |
| Titan RTX | |
| Asus GeForce RTX 3080 ROG Strix Gaming OC | |
| 1920x1080 1080p High | |
| GeForce RTX 3090 | |
| Asus GeForce RTX 3080 ROG Strix Gaming OC | |
| Titan RTX | |
| 1920x1080 1080p Extreme | |
| GeForce RTX 3090 | |
| Asus GeForce RTX 3080 ROG Strix Gaming OC | |
| Titan RTX | |
| 3840x2160 4k Optimized | |
| GeForce RTX 3090 | |
| Asus GeForce RTX 3080 ROG Strix Gaming OC | |
| Titan RTX | |
| 7680x4320 8k Optimized | |
| GeForce RTX 3090 | |
| Asus GeForce RTX 3080 ROG Strix Gaming OC | |
| Titan RTX | |
| 3DMark 05 Standard | 46192 points | |
| 3DMark 06 Standard Score | 44255 points | |
| 3DMark Vantage P Result | 93066 points | |
| 3DMark 11 Performance | 32211 points | |
| 3DMark Ice Storm Standard Score | 238949 points | |
| 3DMark Cloud Gate Standard Score | 75364 points | |
| 3DMark Fire Strike Score | 33440 points | |
| 3DMark Fire Strike Extreme Score | 20455 points | |
| 3DMark Time Spy Score | 15712 points | |
Help | ||
Game benchmarks
The conducted gaming tests reveal that the GeForce RTX 3080 is more suitable for high resolutions. Nearly all the games that we tested could be played at 2160p without any problems. Nevertheless, there are specific games, such as Flight Simulator 2020, where even the GeForce RTX 3080 reaches its limits. The new graphics card shows the biggest advantage when it goes beyond 1080p. If you don't play at high resolutions, the purchase of an RTX 3080 is currently not worthwhile.
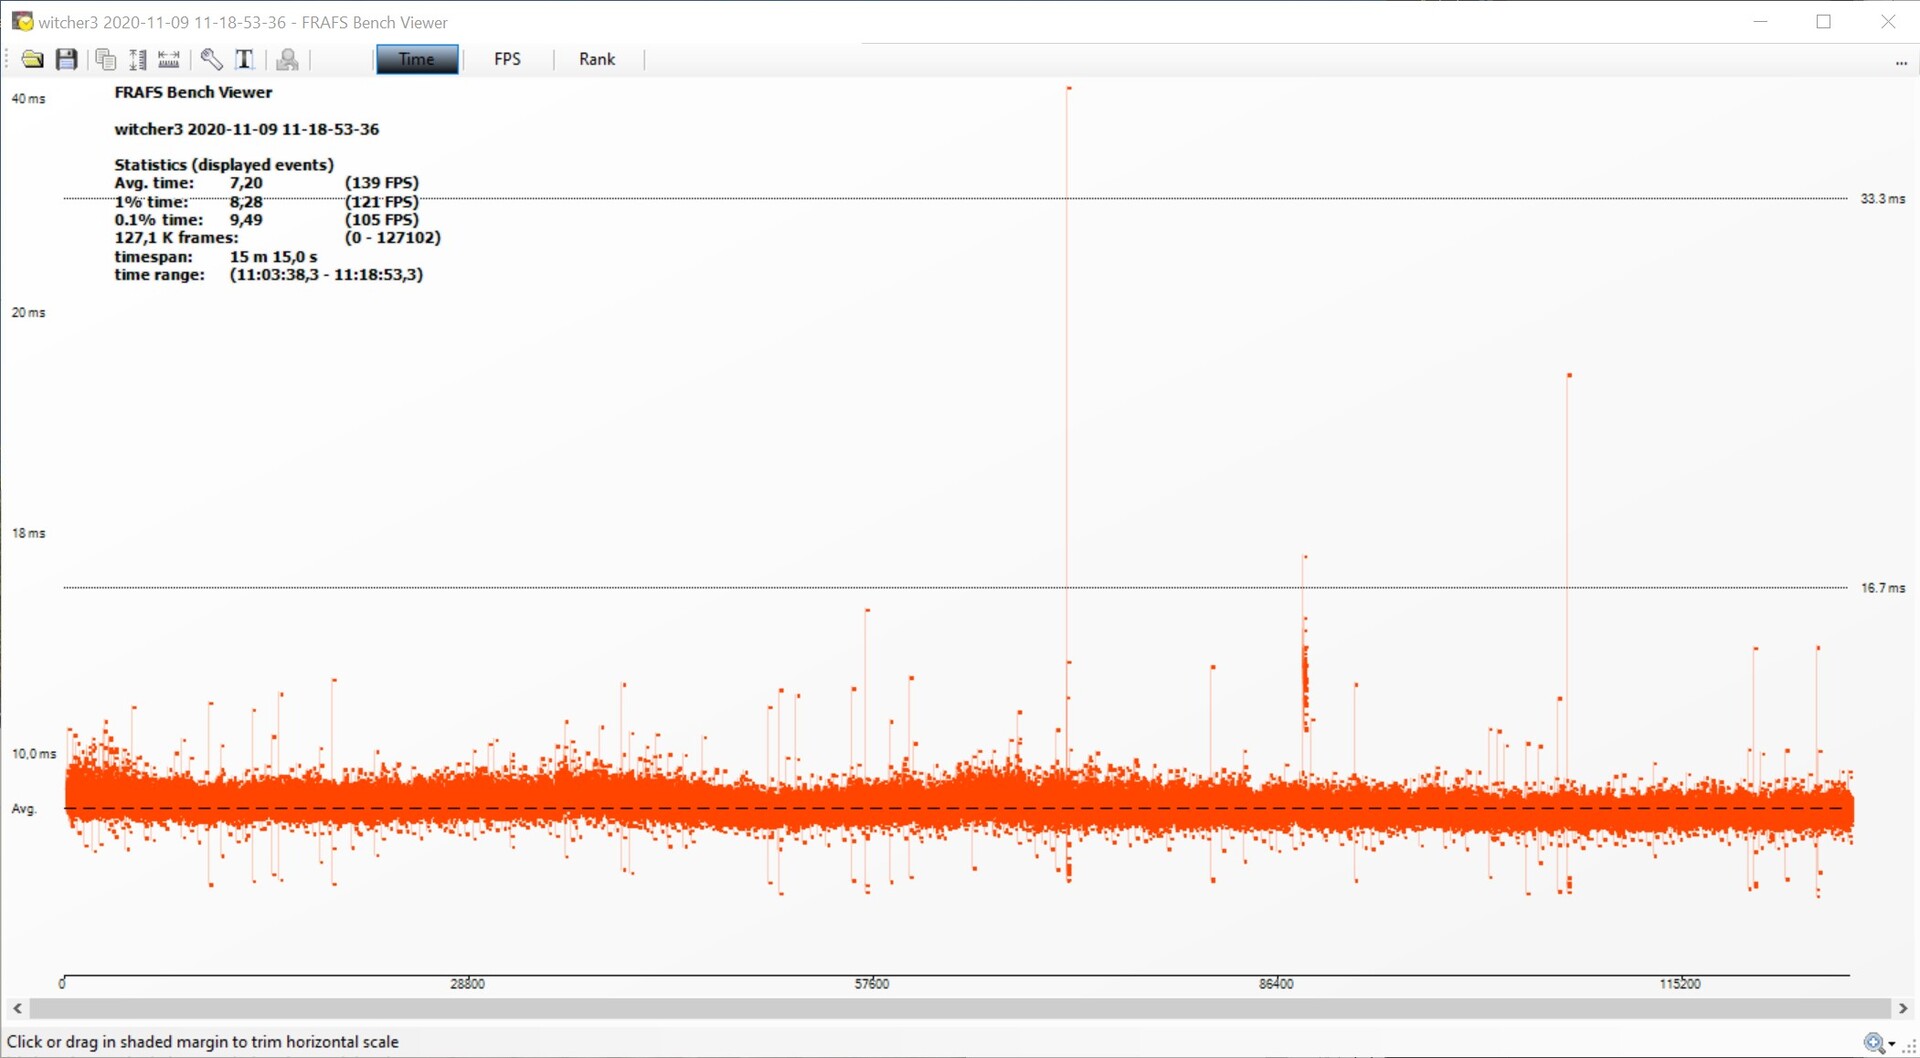
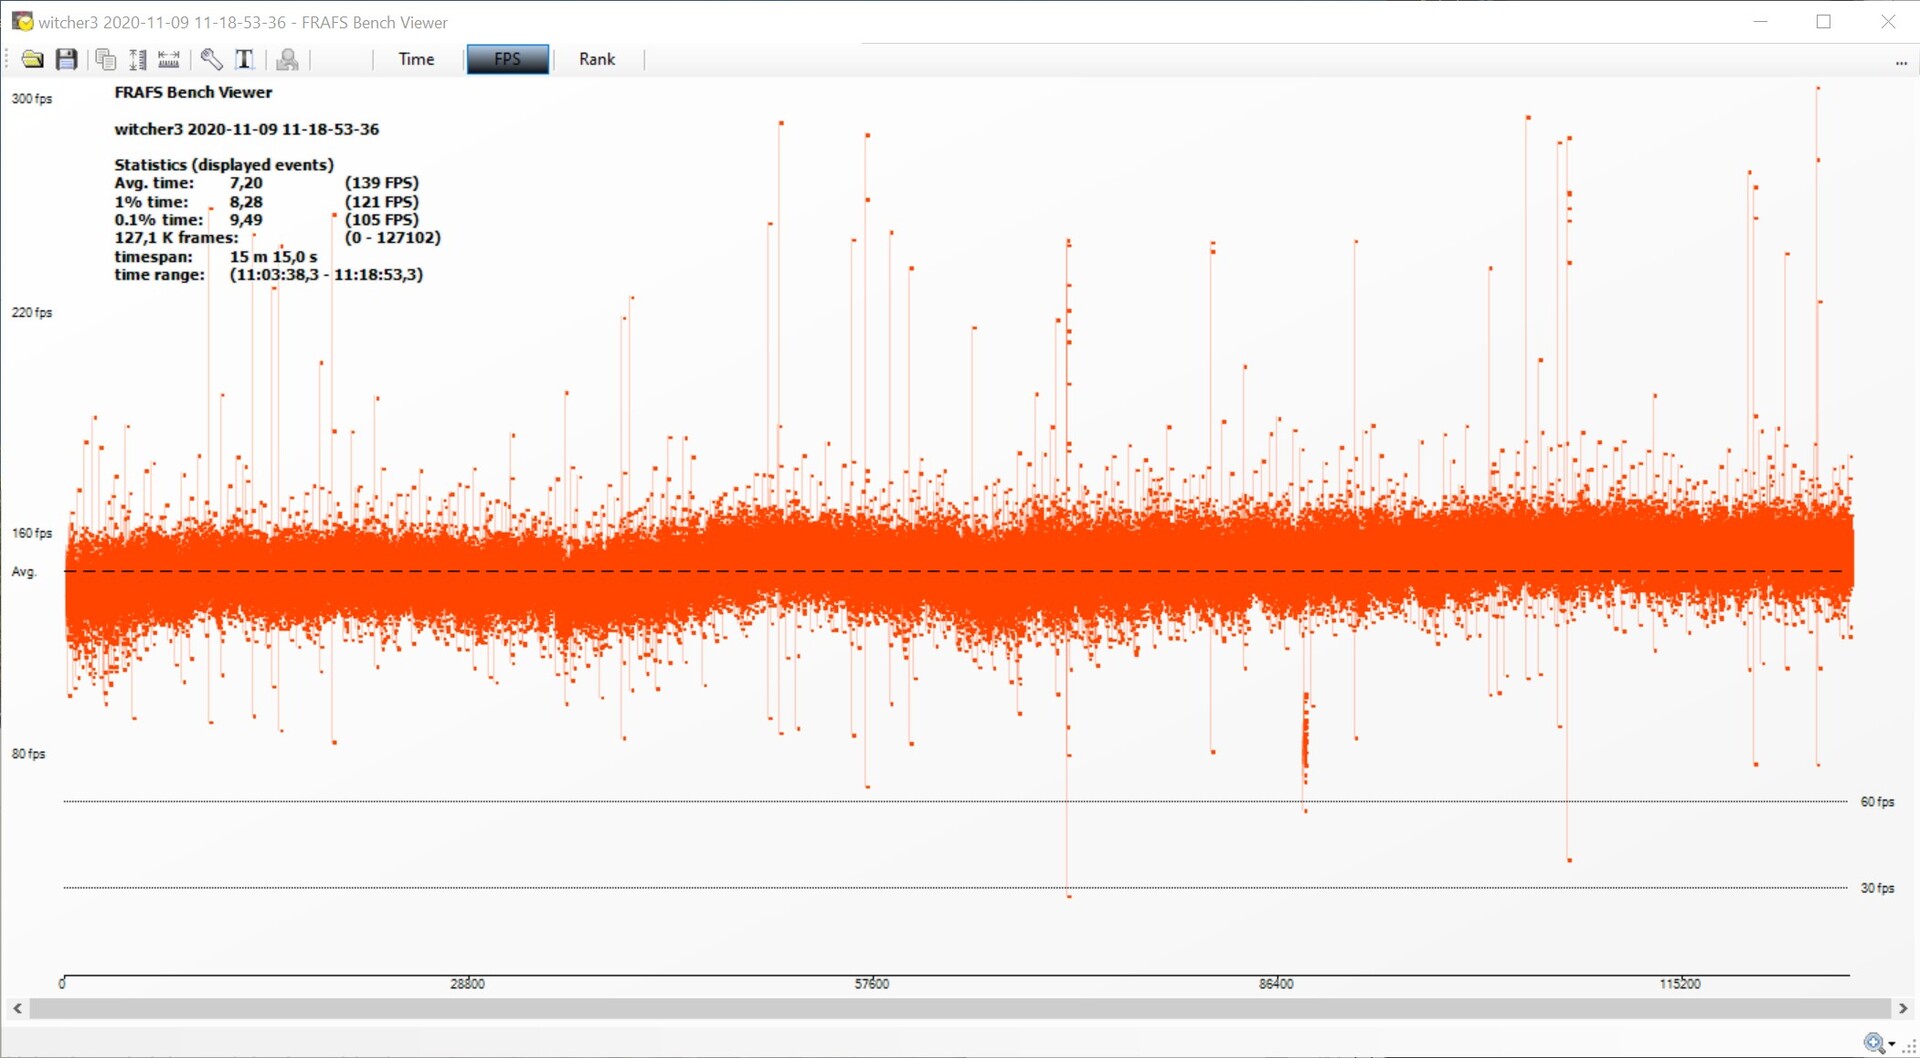
But smooth gaming is guaranteed with the Asus GeForce RTX 3080 ROG Strix Gaming OC. We examined the frame progression and also the frame times in the game The Witcher 3 (Ultra preset) and didn't find any noteworthy irregularities. We documented individual outliers. However, at 139 FPS, smooth playing is definitely guaranteed.
The Witcher 3 frame progression - Ultra preset
| F1 2020 - 3840x2160 Ultra High Preset AA:T AF:16x | |
| GeForce RTX 3090 | |
| Asus GeForce RTX 3080 ROG Strix Gaming OC | |
| Titan RTX | |
| Borderlands 3 - 3840x2160 Badass Overall Quality (DX11) | |
| GeForce RTX 3090 | |
| Asus GeForce RTX 3080 ROG Strix Gaming OC | |
| Titan RTX | |
| Titan RTX | |
| GeForce RTX 2080 Ti (Desktop) | |
| Red Dead Redemption 2 - 3840x2160 Maximum Settings | |
| GeForce RTX 3090 | |
| Asus GeForce RTX 3080 ROG Strix Gaming OC | |
| Titan RTX | |
| Rise of the Tomb Raider - 3840x2160 High Preset AA:FX AF:4x | |
| Asus GeForce RTX 3080 ROG Strix Gaming OC | |
| GeForce RTX 2080 Ti (Desktop) | |
| GeForce RTX 2080 Super (Desktop) | |
| GeForce RTX 2080 (Desktop) | |
| GeForce RTX 2070 Super (Desktop) | |
| GeForce RTX 2070 (Desktop) | |
| Radeon VII | |
| GeForce RTX 2060 Super (Desktop) | |
| RX Vega 64 | |
| GeForce RTX 2060 (Desktop) | |
| low | med. | high | ultra | QHD | 4K | |
|---|---|---|---|---|---|---|
| GTA V (2015) | 187 | 187 | 184 | 130 | 122 | 136 |
| The Witcher 3 (2015) | 427 | 375 | 286 | 152 | 115 | |
| Dota 2 Reborn (2015) | 216.6 | 197.1 | 184.4 | 168.7 | 159.1 | |
| Rise of the Tomb Raider (2016) | 327 | 231 | 217 | 217 | 107 | |
| Final Fantasy XV Benchmark (2018) | 228 | 205 | 156 | 124 | 76.1 | |
| X-Plane 11.11 (2018) | 165 | 153 | 123 | 105 | ||
| Far Cry 5 (2018) | 184 | 162 | 155 | 145 | 137 | 95 |
| Strange Brigade (2018) | 567 | 416 | 336 | 289 | 220 | 135 |
| Shadow of the Tomb Raider (2018) | 227 | 206 | 198 | 185 | 147 | 83.9 |
| Battlefield V (2018) | 192 | 178 | 163 | 152 | 132 | 94.2 |
| Apex Legends (2019) | 144 | 144 | 144 | 144 | 144 | 143 |
| Far Cry New Dawn (2019) | 150 | 132 | 127 | 115 | 110 | 89 |
| Metro Exodus (2019) | 212 | 155 | 143 | 111 | 92.2 | 64.1 |
| The Division 2 (2019) | 240 | 197 | 168 | 140 | 107 | 65 |
| Anno 1800 (2019) | 142 | 139 | 99.3 | 54.1 | 52.5 | 46.3 |
| Rage 2 (2019) | 294 | 209 | 182 | 180 | 134 | 72.1 |
| Control (2019) | 240 | 196 | 155 | 106 | 56.2 | |
| Borderlands 3 (2019) | 165 | 143 | 129 | 128 | 103 | 61.5 |
| Star Wars Jedi Fallen Order (2019) | 134 | 132 | 133 | 132 | 92.9 | |
| Red Dead Redemption 2 (2019) | 167 | 154 | 135 | 96 | 81 | 56 |
| Hunt Showdown (2020) | 236 | 173 | 172 | 155 | 95.8 | |
| Doom Eternal (2020) | 283 | 277 | 270 | 268 | 248 | 153 |
| F1 2020 (2020) | 367 | 255 | 239 | 185 | 155 | 118 |
| Horizon Zero Dawn (2020) | 164 | 151 | 147 | 141 | 133 | 95 |
| Flight Simulator 2020 (2020) | 115 | 97.4 | 79.9 | 62.8 | 55.6 | 37.3 |
| Serious Sam 4 (2020) | 182.5 | 148.6 | 138.1 | 135.2 | 124.8 | 117 |
| Mafia Definitive Edition (2020) | 199 | 184 | 169 | 137 | 78.2 | |
| Star Wars Squadrons (2020) | 586 | 433 | 379 | 358 | 266 | 169 |
| FIFA 21 (2020) | 306 | 312 | 293 | 295 | 295 | 284 |
| Watch Dogs Legion (2020) | 147 | 146 | 125 | 103 | 81.6 | 54.1 |
| Dirt 5 (2020) | 176 | 121 | 111 | 111 | 69.1 | 55.3 |
Compute performance
In LuxMark and ComputeMark, the Asus GeForce RTX 3080 ROG Strix Gaming OC scores significantly better than the older comparison models. The SPECviewperf tests are primarily aimed at workstations. Here, Quadro and FirePro models often deliver more performance due to driver optimizations. The Nvidia Titan RTX has a special position here, since it's identical in construction to the RTX 6000 of the Quadro series. Overall, it offers the best performance here, although the new Ampere graphics cards deliver better values in individual disciplines.
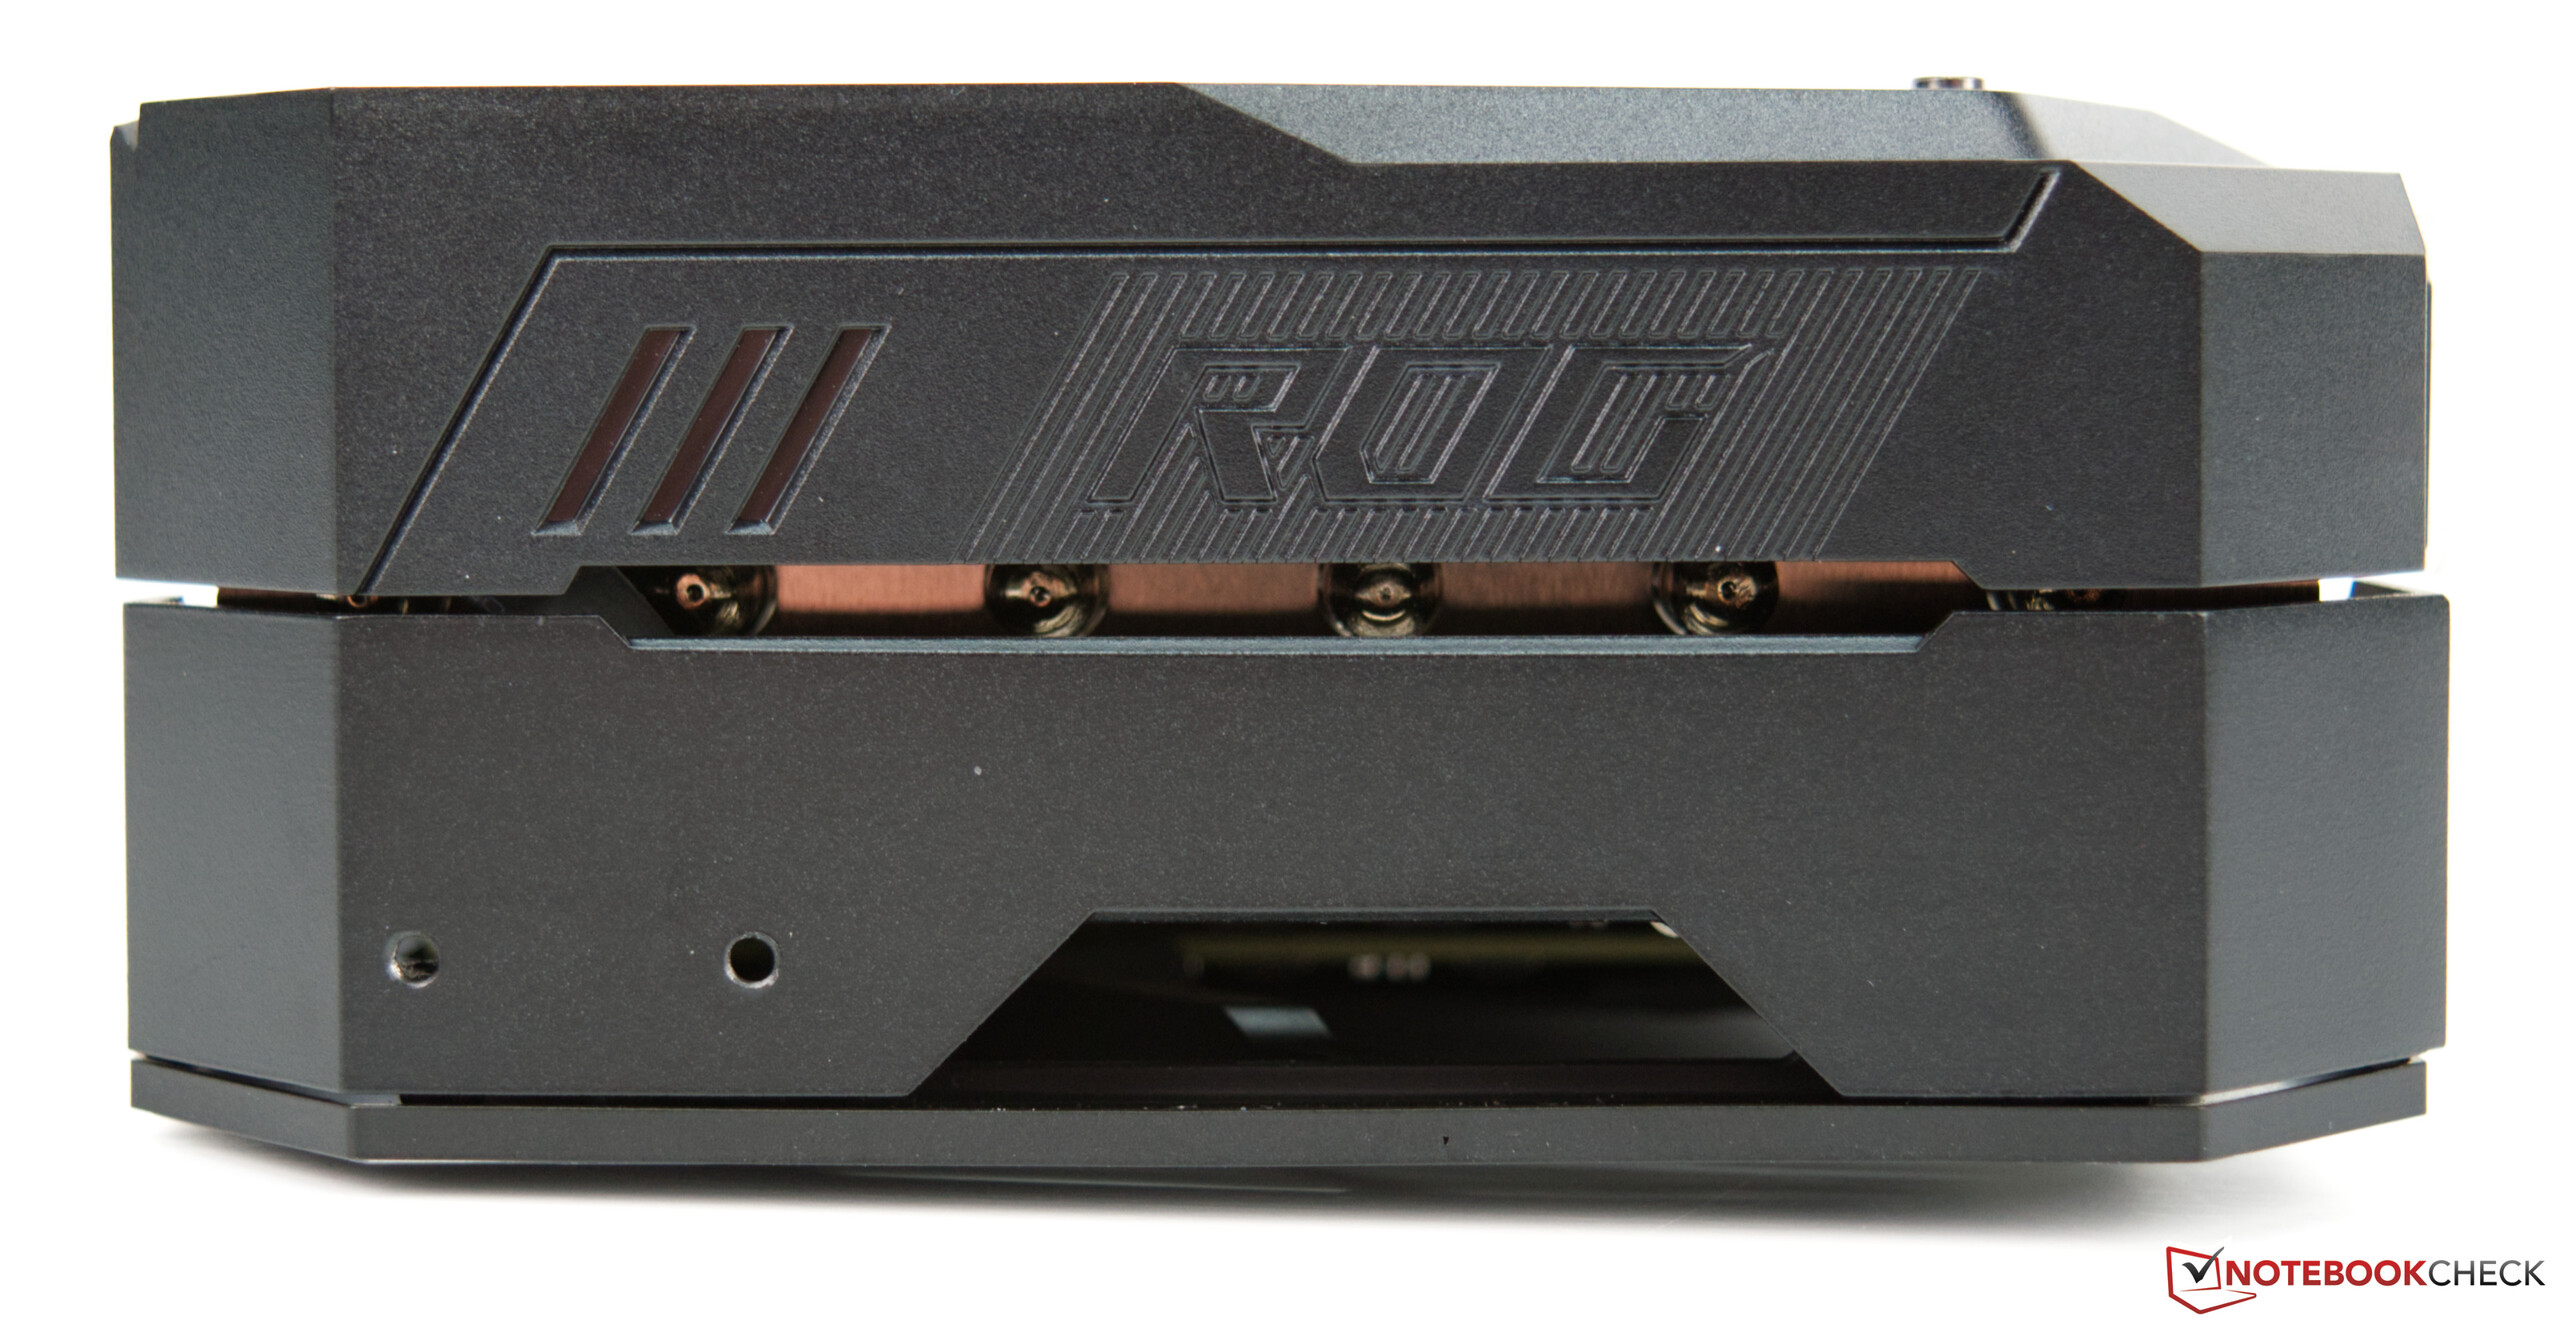
Emissions of the Asus GeForce RTX 3080 ROG Strix Gaming OC
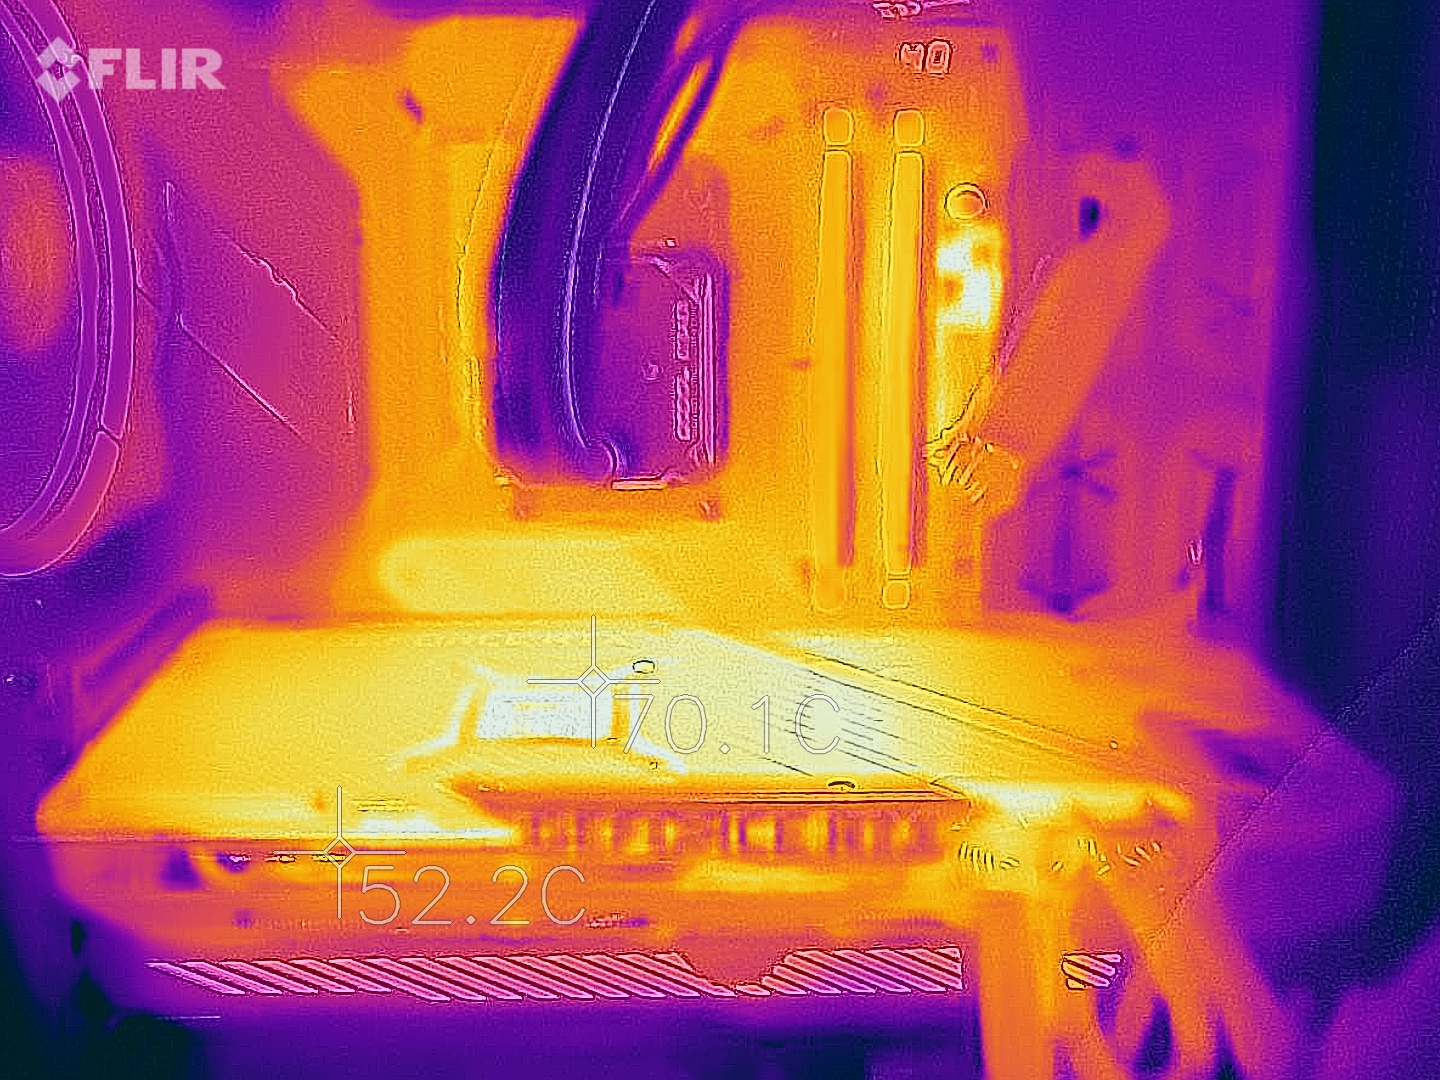

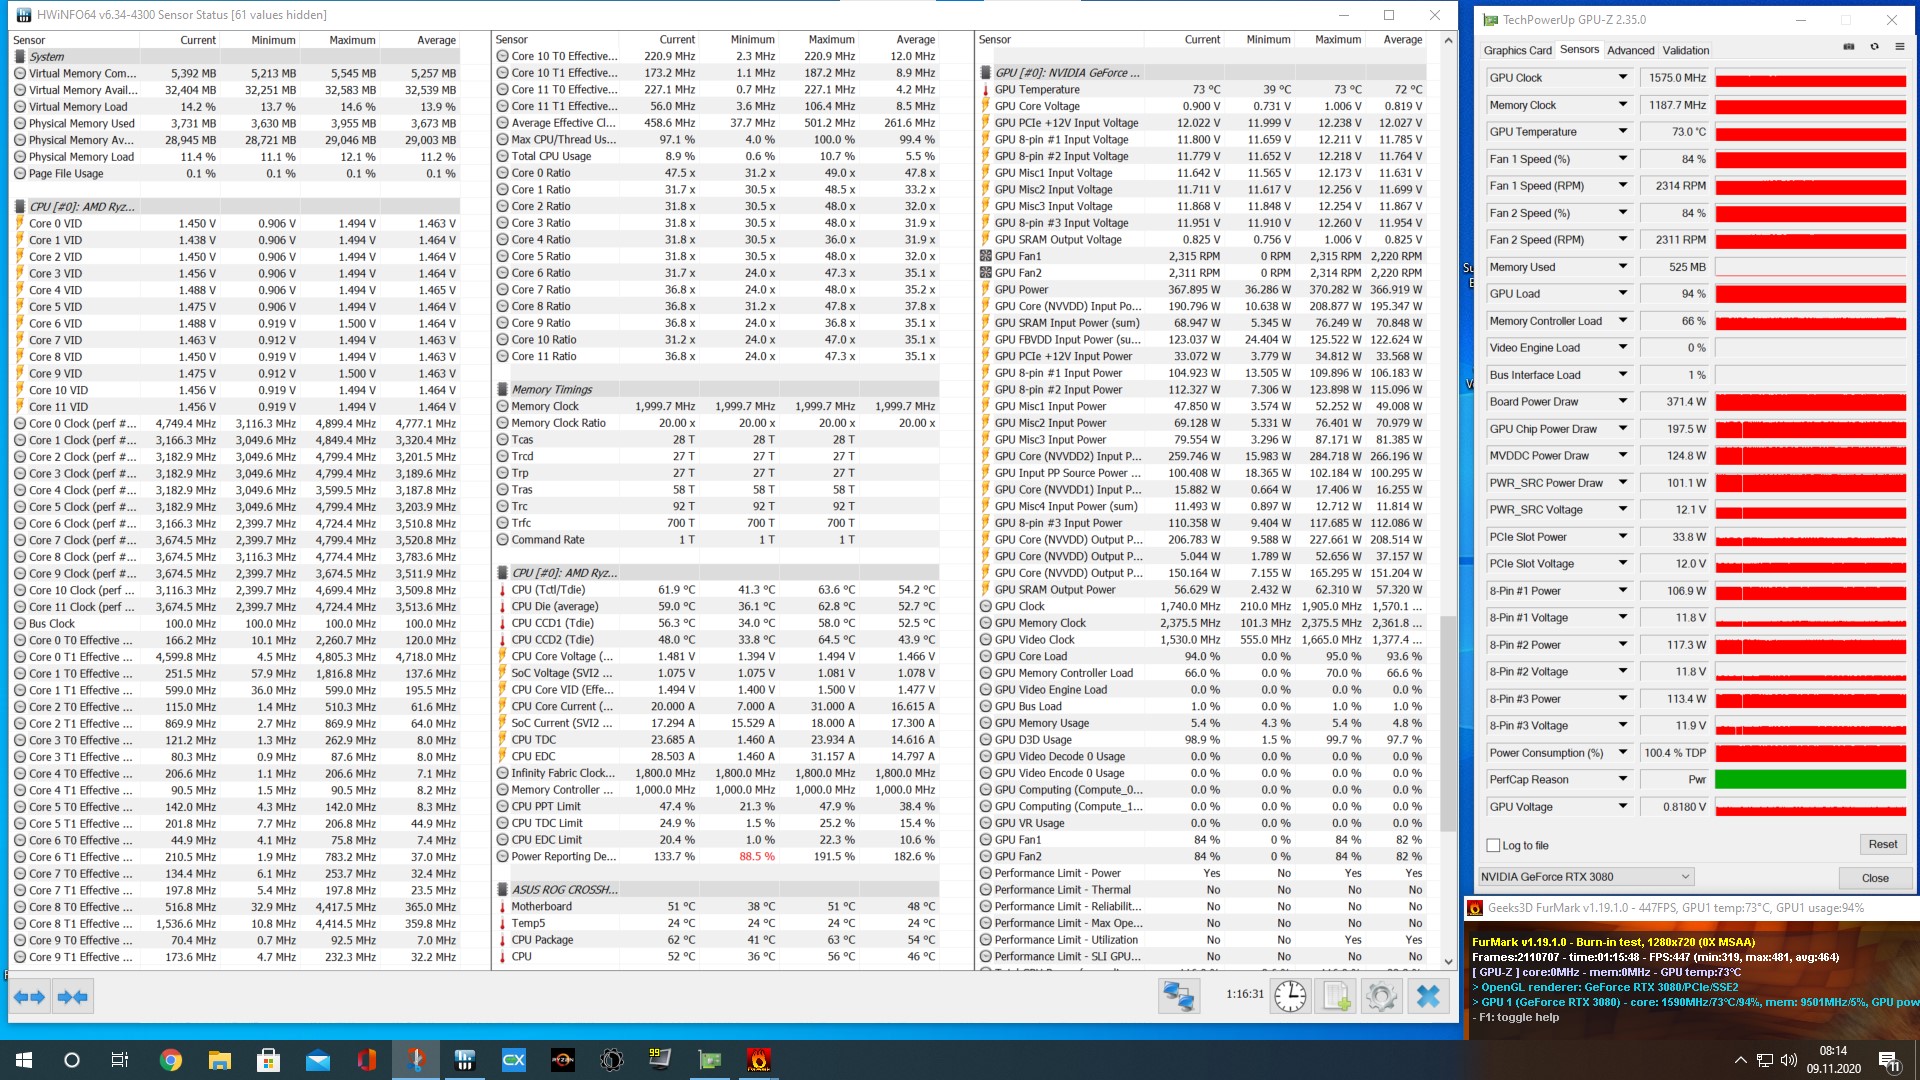
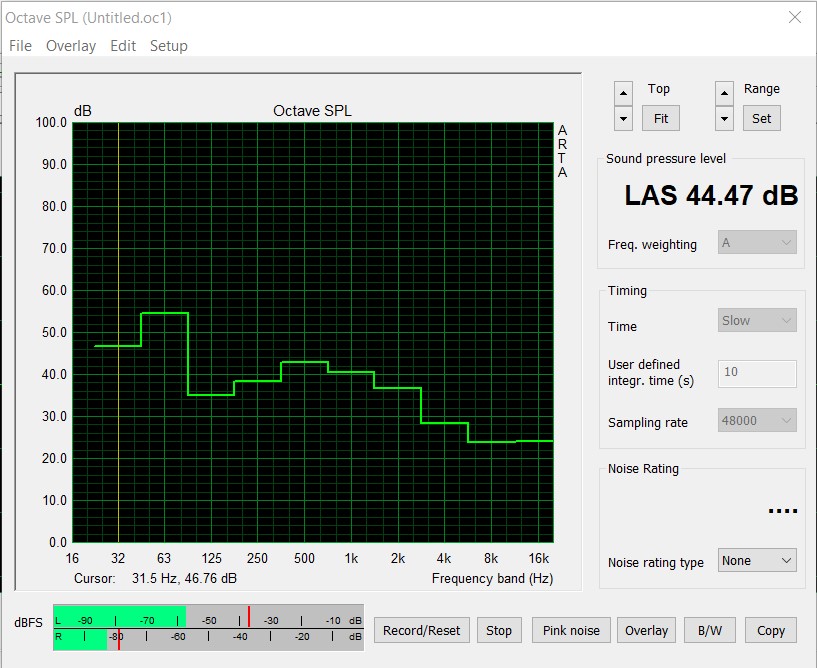
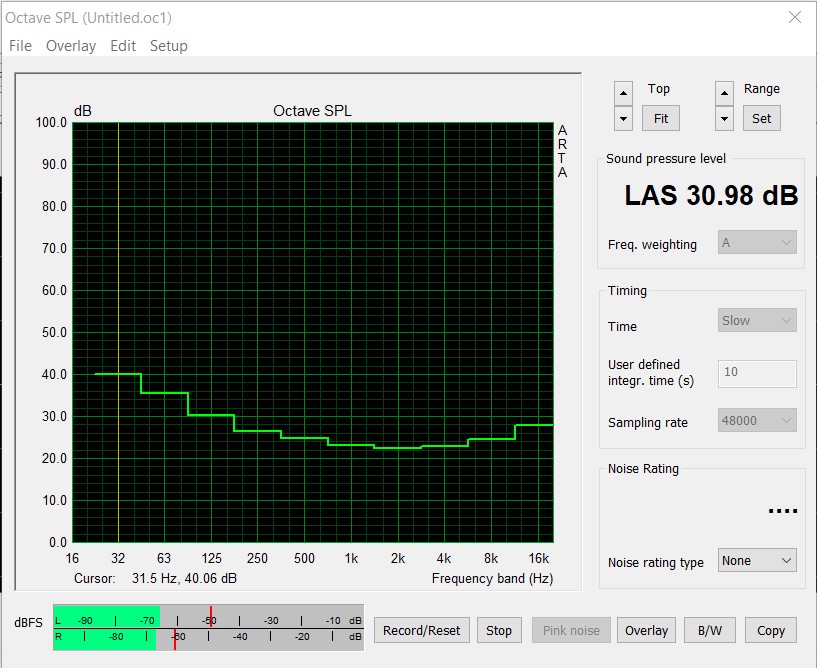
The Asus GeForce RTX 3080 ROG Strix Gaming OC is by no means a power-saving graphics card. But with a TDP of 320 watts, it's on par with the Founders Edition. The extremely protruding cooler is ventilated by three axial fans, and this was compensated for with good temperatures in the test. It's worth mentioning that the middle fan rotates in the opposite direction to the two side ones. In the stress test with the case closed, the graphics card heated up to 73 °C (~163 °F), which can definitely be considered to be a very good result. Furthermore, the noise level isn't too loud, even when the fans rotate at a good 2,300 revolutions per minute. With our measuring system, we were able to detect about 44 dB(A). In idle usage, the graphics card is completely silent due to the fan-stop mode. Low coil whine occurs from time to time as soon as the frame rates in menus exceed 1,000. In general, the issue isn't as present on the Asus GeForce RTX 3080 ROG Strix Gaming OC as it is on other graphics cards that we've already tested.
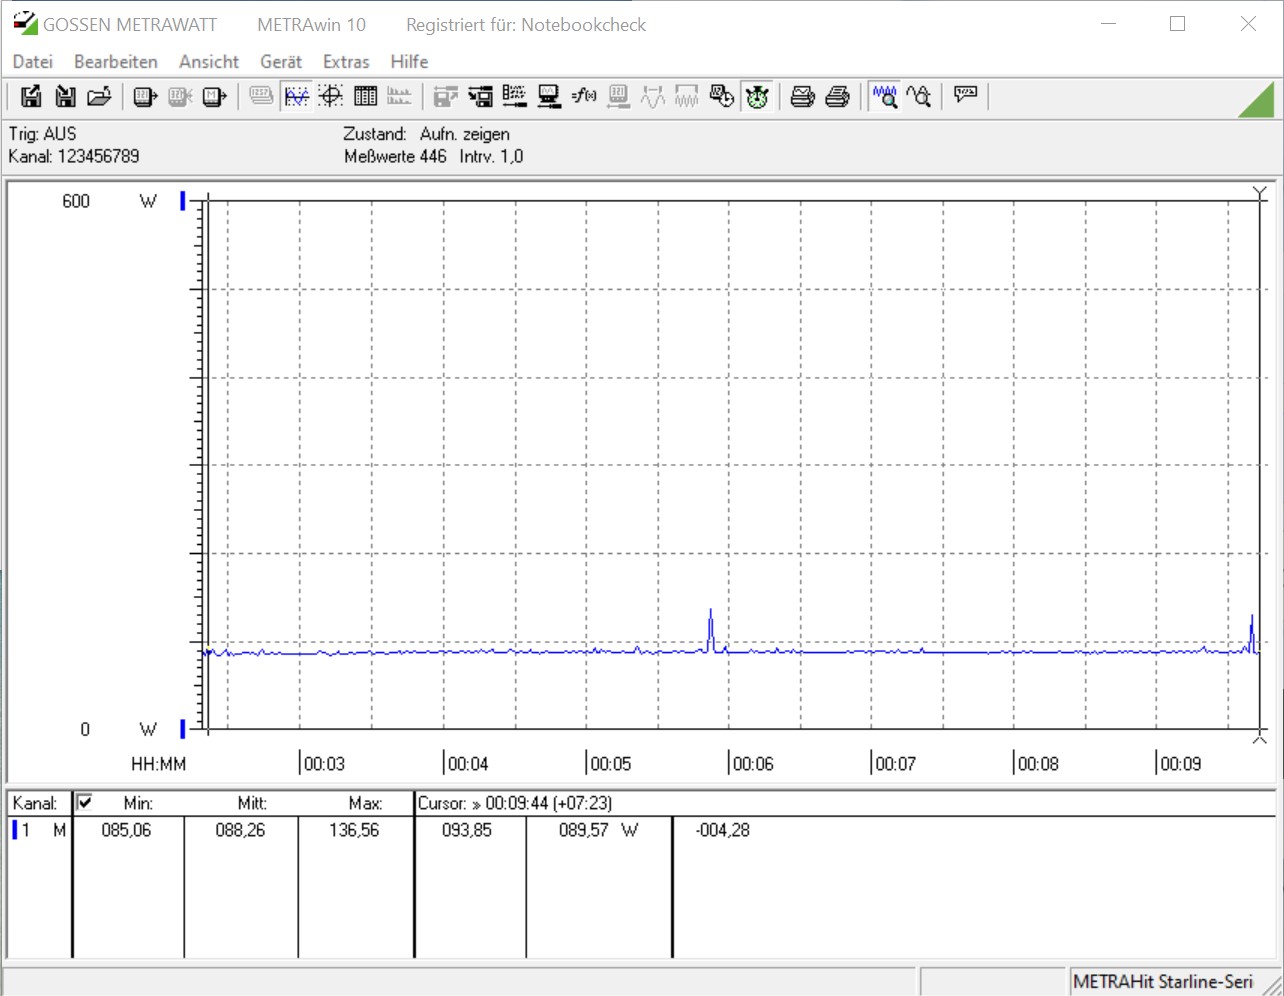
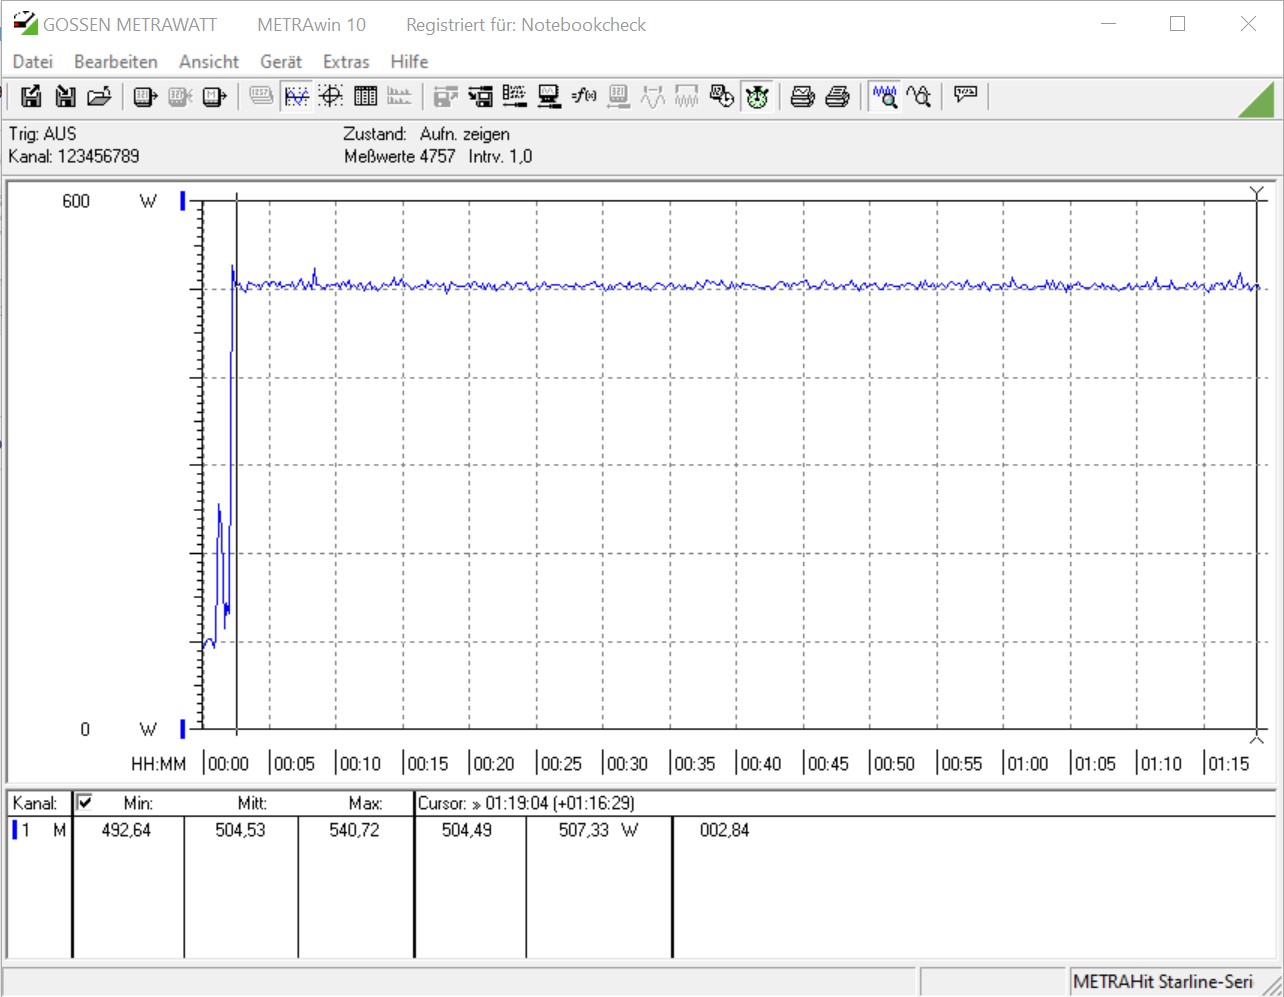
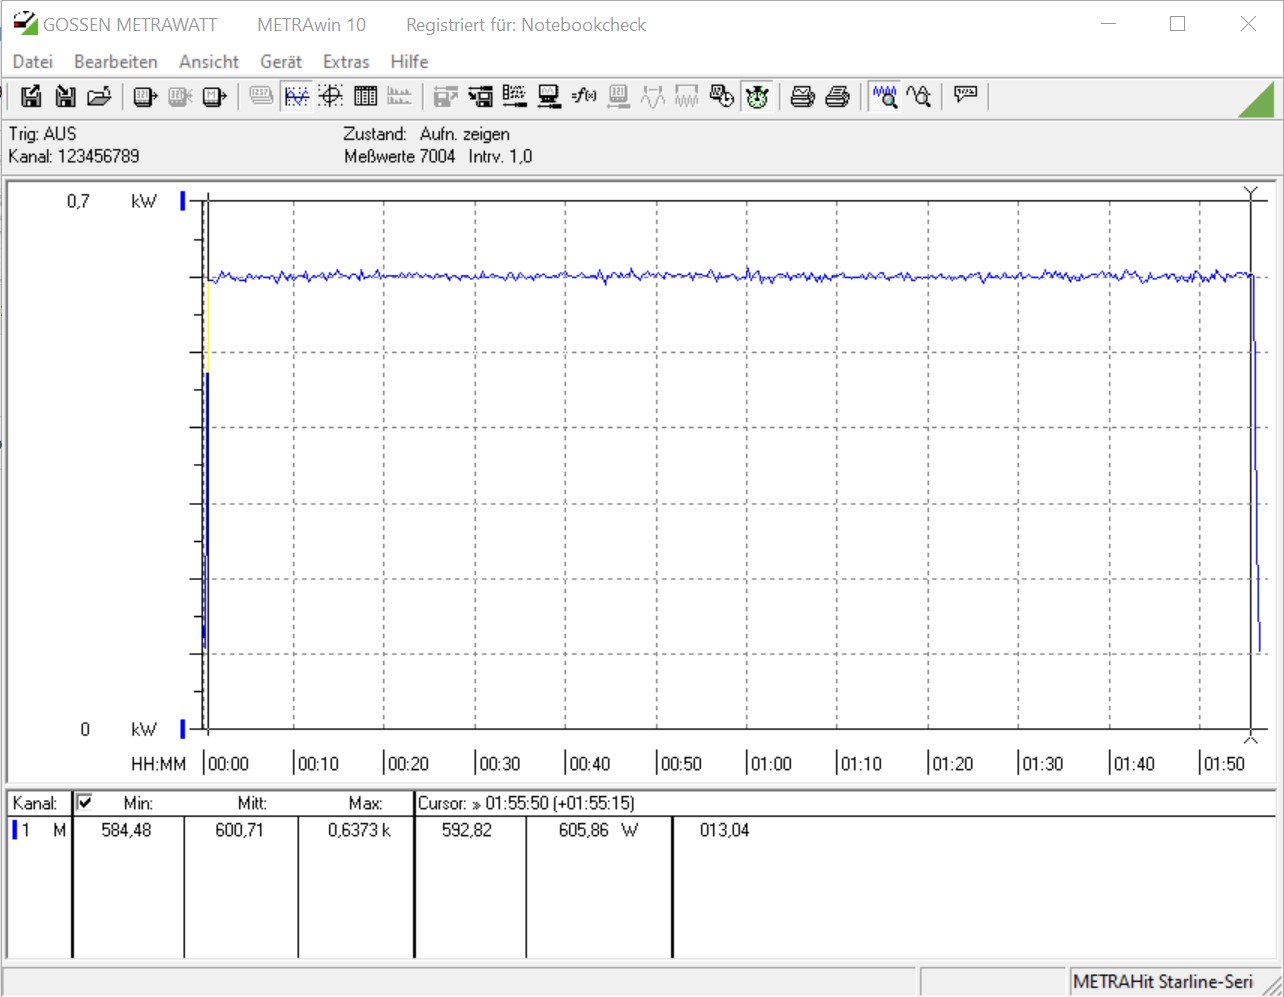
The GeForce RTX 3080 is quite power-hungry in terms of energy consumption. Just looking at the graphics card quickly reveals that a strong power supply unit is needed here, as the Asus GeForce RTX 3080 ROG Strix Gaming OC requires three 8-pin power connections. At around 505 watts, we measured almost identical values for the entire system under load, both in the stress test as well as the gaming test. If we now increase the power target to 121%, our measuring device shows just over 600 watts in the stress test. Consequently, it's not surprising that Asus specifies a power supply recommendation of at least 850 watts.

| Power Consumption | |
| 1920x1080 The Witcher 3 ultra (external Monitor) | |
| ASUS GeForce RTX 3080 ROG STRIX OC GAMING (Idle: 88.3 W) | |
| KFA2 GeForce RTX 2080 Ti EX (Idle: 100.5 W) | |
| AMD Radeon RX Vega 64 (Idle: 74.3 W) | |
| MSI RTX 2080 Gaming X Trio (Idle: 87.78 W) | |
| Nvidia GeForce RTX 2080 Super (Idle: 78.87 W) | |
| AMD Radeon RX 5700 XT (Idle: 69.8 W) | |
| Nvidia GeForce RTX 2070 Super (96.8 fps, Idle: 80.5 W) | |
| MSI RTX 2070 Gaming Z 8G (Idle: 73.3 W) | |
| AMD Radeon VII (Idle: 81.39 W) | |
| Nvidia GeForce RTX 2060 Super (82.7 fps, Idle: 77.12 W) | |
| AMD Radeon RX 5700 (84.2 fps, Idle: 64.5 W) | |
| MSI RTX 2060 Gaming Z 6G (Idle: 74.66 W) | |
| 1280x720 FurMark 1.19 GPU Stress Test (external Monitor) | |
| ASUS GeForce RTX 3080 ROG STRIX OC GAMING (Idle: 88.3 W) | |
| AMD Radeon VII (Idle: 81.39 W) | |
| MSI RTX 2080 Gaming X Trio | |
| KFA2 GeForce RTX 2080 Ti EX (Idle: 100.5 W) | |
| Nvidia GeForce RTX 2080 Super (Idle: 78.87 W) | |
| MSI RTX 2070 Gaming Z 8G (Idle: 73.3 W) | |
| AMD Radeon RX 5700 XT (239 fps, Idle: 69.8 W) | |
| Nvidia GeForce RTX 2070 Super (283 fps, Idle: 80.5 W) | |
| MSI RTX 2060 Gaming Z 6G (Idle: 74.66 W) | |
| Nvidia GeForce RTX 2060 Super (237 fps, Idle: 77.12 W) | |
| AMD Radeon RX 5700 (207 fps, Idle: 64.5 W) | |
* ... smaller is better
Pros
Cons
Verdict - Fast and quiet under load


With the GeForce RTX 3080 ROG Strix Gaming OC, Asus undoubtedly has a very fast graphics card on the market. All the latest games can be played smoothly with it. But this graphics card only starts to feel properly good when it goes beyond a native resolution of 1080p. The current Ampere generation can clearly distinguish itself from Turing here. If you add DLSS or Ray Tracing on top, the advantage of the newer architecture becomes even bigger. However, users must live with drawbacks compared to an RTX 2080 Ti in terms of VRAM, because at 10 GB on the RTX 3080, this is smaller than on the 2080 Ti (11 GB). On a long-term basis, though, that could become the downfall of the RTX 3080, because AMD has already announced its three top models of the 6000 series and consistently uses 16 GB of VRAM here. Nvidia's rumor mill is buzzing, and an RTX 3080 Ti with more shaders and 20 GB of VRAM is already supposed to be in the works.
But what good is a fast graphics card if it's not available to buy? Nvidia, and thus its board partners as well, already wasted a lot of potential here, because the demand still can't be met. According to internal reports, this situation is expected to continue into 2021.
The Asus GeForce RTX 3080 ROG Strix Gaming OC is one of the fastest RTX 3080 graphics cards that also comes with good cooling. The well thought-out cooling unit is convincing, and with the discreet RGB lighting, there's also something to feast your eyes on.
Those who have already managed to get their hands on an RTX 3080 model will be rewarded with a good amount of graphics power. But this also results in high energy consumption, which should be considered when buying. The correct power supply unit choice is important here so as to not suffer from ugly system crashes under load. Asus recommends at least an 850-watt power supply for our test sample.
The Asus GeForce RTX 3080 ROG Strix Gaming OC is currently priced at 999 Euros (~$1,185). That's 300 Euros (~$356) more than the MSRP of the Founders Edition; but the small quantities drive the prices extremely high, so that even the Founders Edition is partly offered at over 1,000 Euros (~$1,186). Our advice is, therefore, to wait and see what the competition does, so that you don't regret your purchase decision later.
All benchmarks and test values for the RTX 3080 can be found on the graphics card site for the GeForce RTX 3080 (regularly updated).

