Zotac Gaming GeForce RTX 3090 Trinity Review — Heralding the dawn of 8K gaming

Introduction
NVIDIA's Ampere launch this year will be remembered for several reasons. The Turing generation had to take in a fair share of criticism not only for the performance hit that resulted from ray tracing but also for the exorbitant prices of the cards at launch. NVIDIA hoped to remedy many of the teething problems of Turing with Ampere, and initial reviews of the RTX 3080 have been largely positive be it the significant gains over the RTX 2080 or the more reasonable prices of the flagship RTX 3080 Founders Edition.
While the RTX 3080 is being marketed by NVIDIA as Ampere's flagship graphics card, it is still not a Titan-class card when it comes to being the absolute best for both creators and gamers. This is where the RTX 3090 comes in. The RTX 3090 is being pegged as a successor to the Titan RTX. Previously, if you've ever wanted a Titan, the only available card was the Founders Edition directly from NVIDIA. This year, the RTX 3090 design is being outsourced to add-in board (AiB) partners as well, which means more variety and better availability. While we are not sure if NVIDIA would eventually launch a card under the Titan moniker some time later, the RTX 3090 on its part outclasses the Titan RTX in terms of specs and performance.
The RTX 3090 boasts 35.6 shader peak FP32 TFLOPs (vs. 16.3 in Titan RTX), 69.5 ray tracing TFLOPs (vs. 49.2 in Titan RTX), and 284.7 Tensor TFLOPs when using the Sparsity feature for AI inference. The complete specs are summarized in the table below.
Comparison of the RTX 3090 with other NVIDIA GPUs
| Specifications | RTX 3090 | RTX 3080 | Titan RTX | TITAN X Pascal | RTX 2080 Ti | RTX 2080 | RTX 2070 | GTX 1080 Ti |
| Chip | GA102 | GA102 | TU102 | GP102 | TU102 | TU104 | TU106 | GP102 |
| FinFET Process | 8 nm | 8 nm | 12 nm | 16 nm | 12 nm | 12 nm | 12 nm | 16 nm |
| CUDA cores | 10,496 | 8,704 | 4,608 | 3,584 | 4,352 | 2,944 | 2,304 | 3,584 |
| Texture Units | 328 | 272 | 288 | 224 | 272 | 184 | 144 | 224 |
| Tensor Cores | 328 3rd gen | 272 | 576 2nd gen | - | 544 | 368 | 288 | - |
| RT Cores | 82 | 68 | 72 | - | 68 | 46 | 36 | - |
| GPU Base Clock | 1,395 MHz | 1,440 MHz | 1,350 MHz | 1,417 MHz | 1,350 MHz | 1,515 MHz | 1,410 MHz | 1,481 MHz |
| GPU Boost Clock | 1,695 MHz | 1,710 MHz | 1,770 MHz | 1,531 MHz | 1,545 MHz | 1,710 MHz | 1,620 MHz | 1,582 MHz |
| Memory Bus | 384-bit | 320-bit | 384-bit | 384-bit | 352-bit | 256-bit | 256-bit | 352-bit |
| Memory Bandwidth | 936 GB/s | 760 GB/s | 672 GB/s | 480.4 GB/s | 616 GB/s | 448 GB/s | 448 GB/s | 484.4 GB/s |
| Video Memory | 24 GB GDDR6X | 10 GB GDDR6X | 24 GB GDDR6 | 12 GB GDDR5X | 11 GB GDDR6 | 8 GB GDDR6 | 8 GB GDDR6 | 11 GB GDDR5X |
| Power Consumption | 350 W | 320 W | 280 W | 250 W | 250 W | 215 W | 175 W | 215 W |
At an MSRP of US$1,499 the RTX 3090 Founders Edition is not a card for the masses. It is intended for creators who, in NVIDIA's terms, "understand the value of a larger frame buffer". Sure, you can game on this thing pretty well, but the real mettle of this card lies in gaming at 4K 144 Hz, and now, at 8K 30 Hz and above refresh rates.
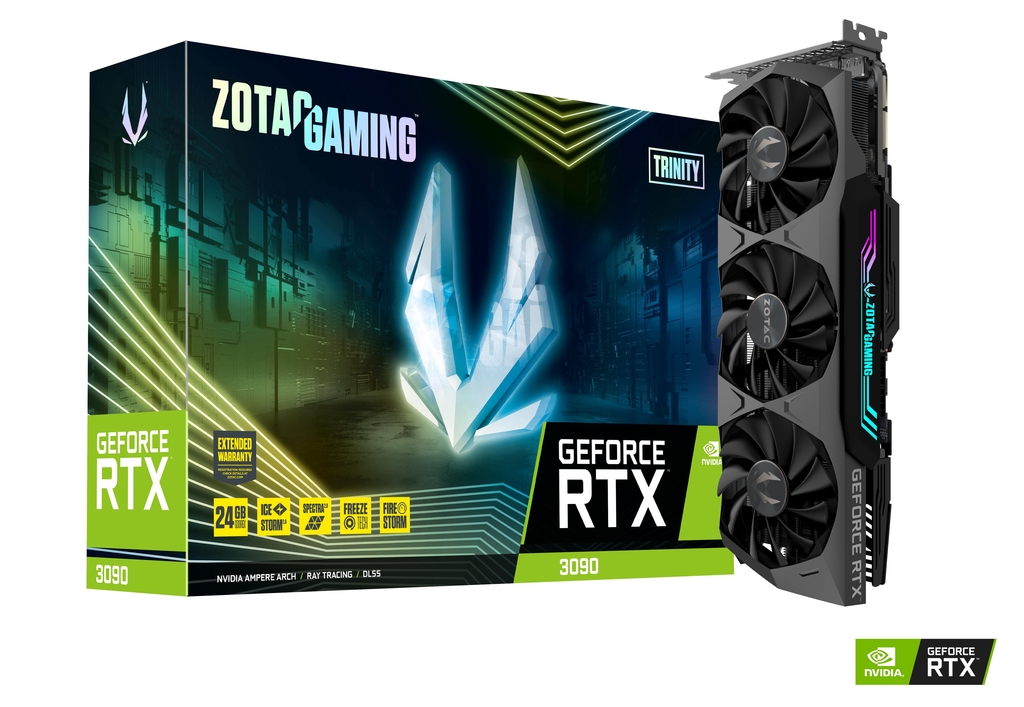
A tour of the Zotac Gaming GeForce RTX 3090 Trinity
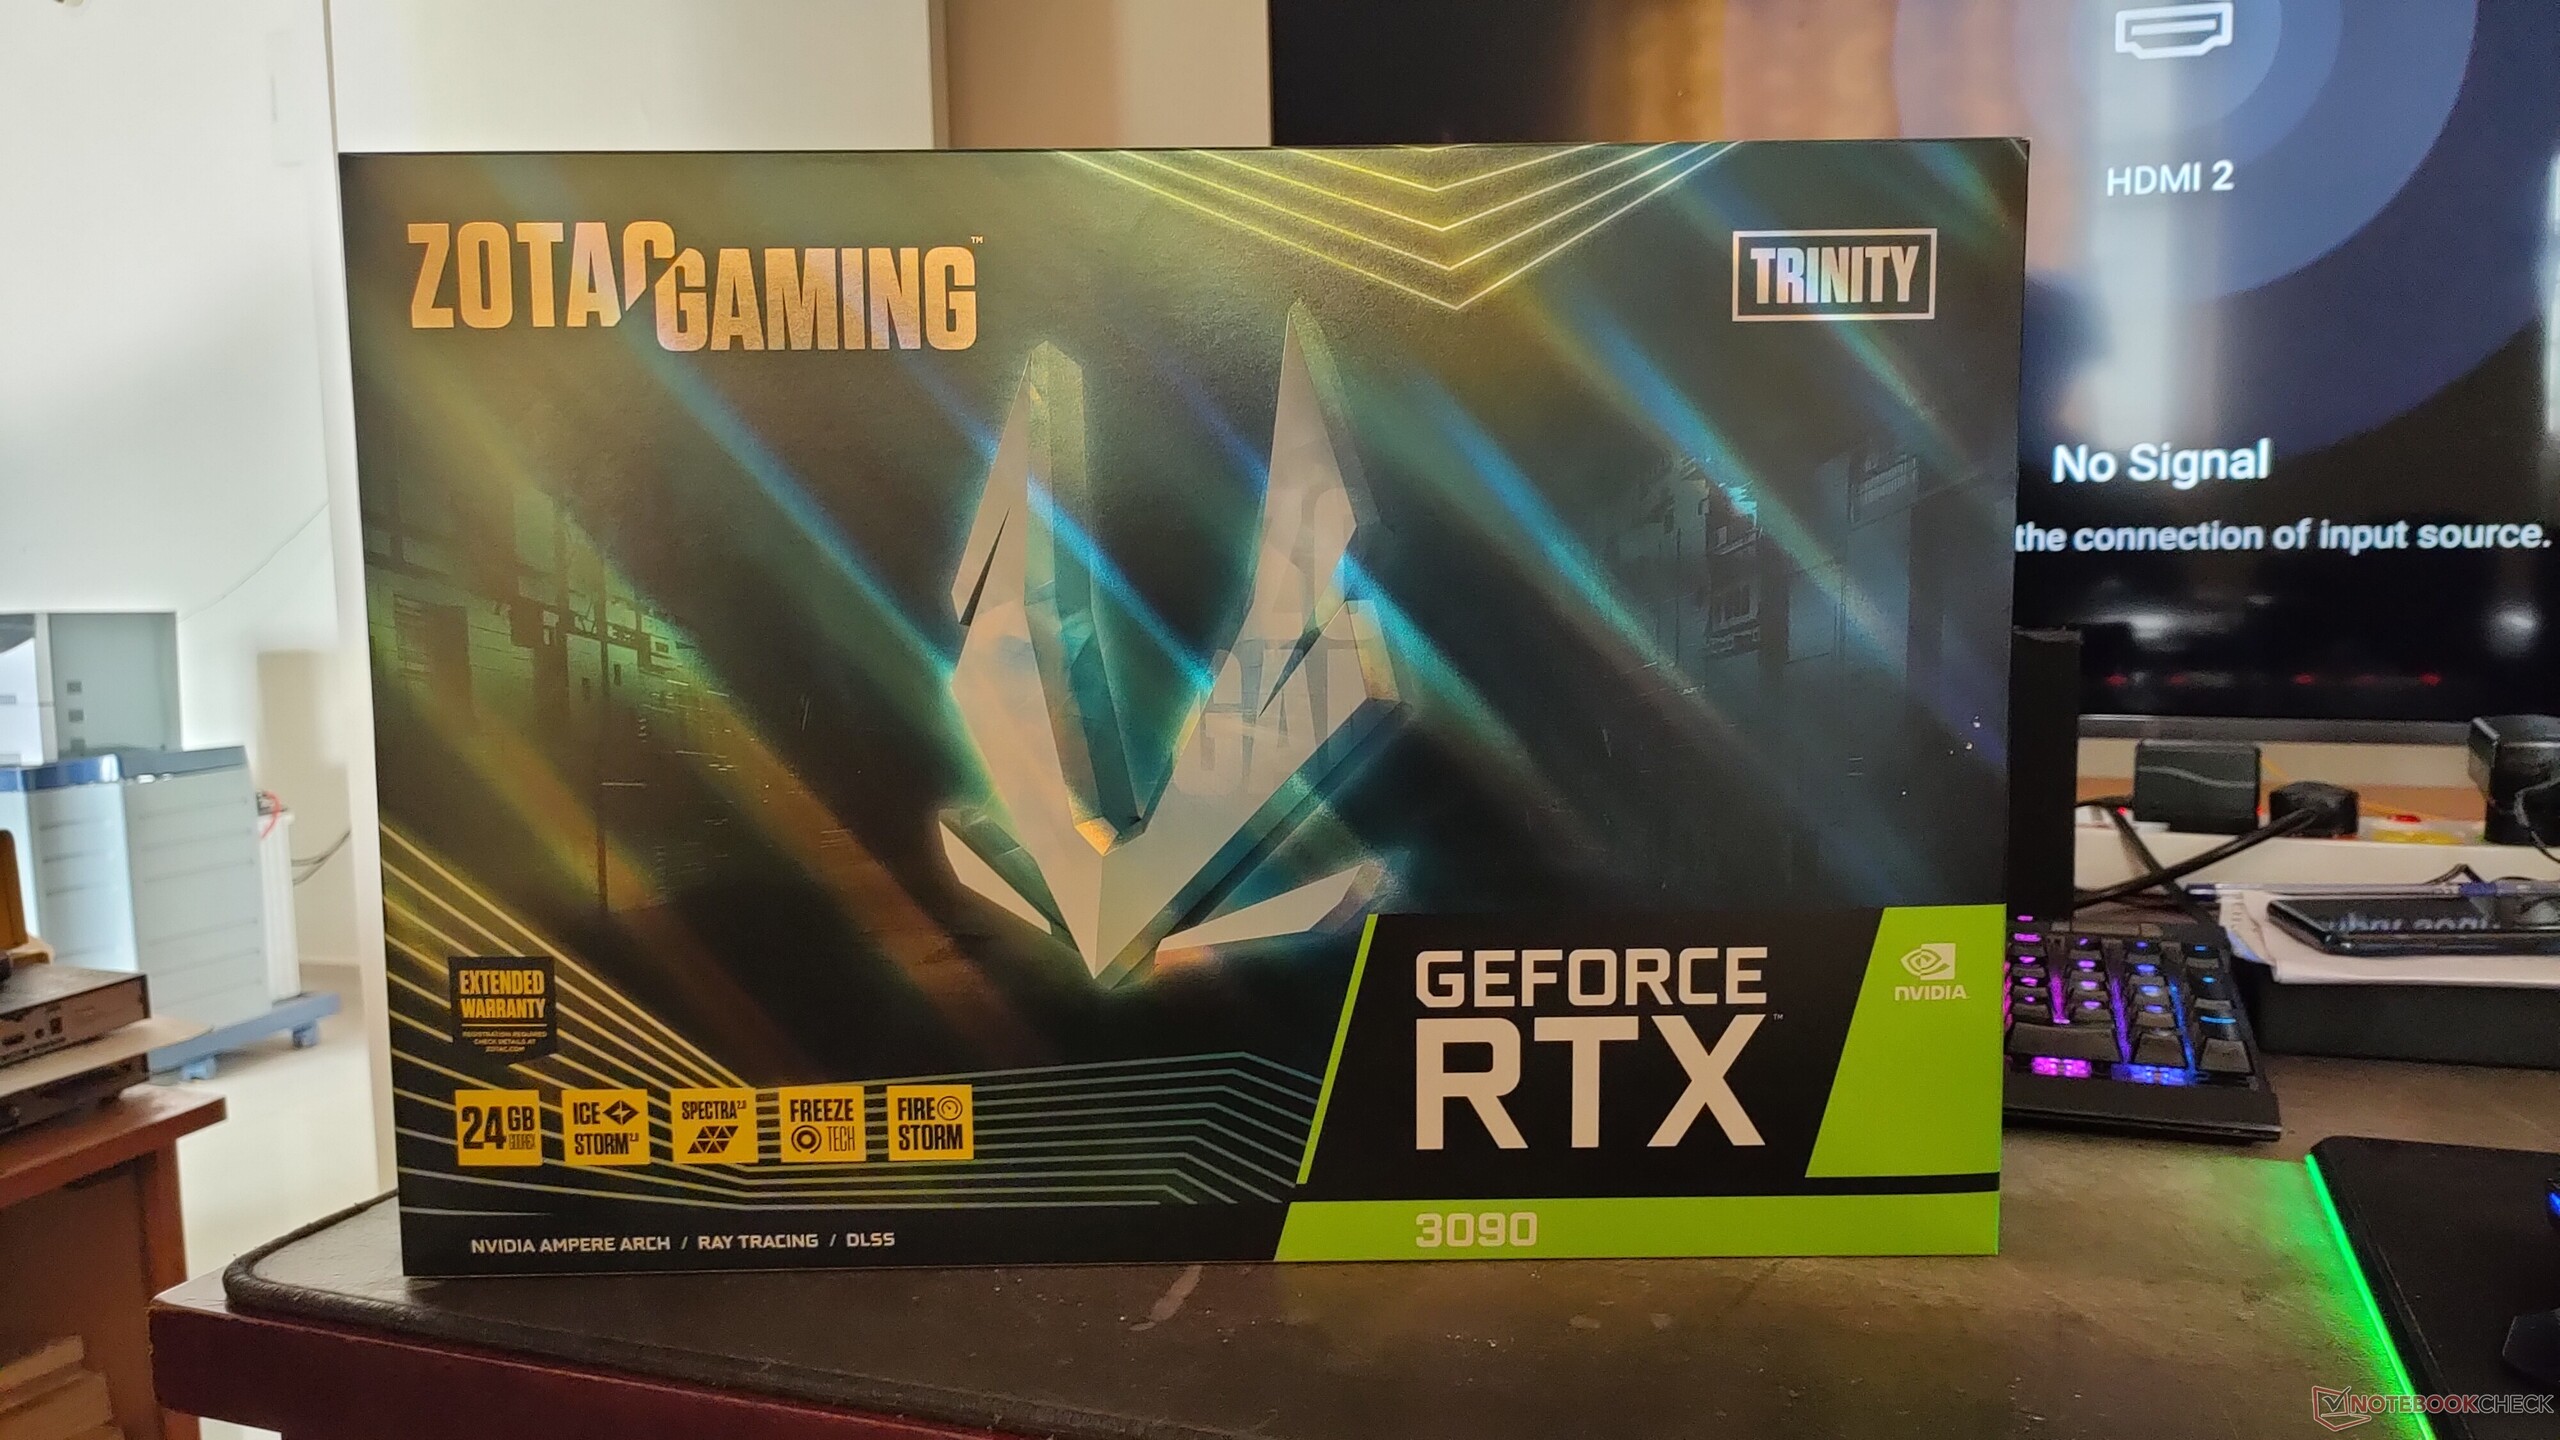
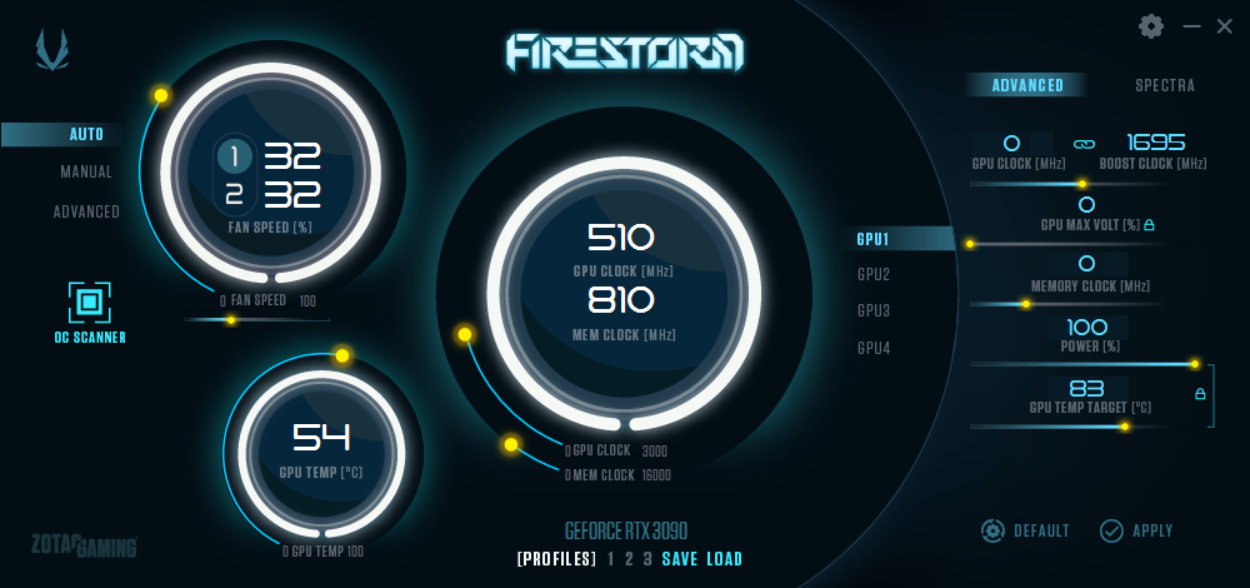
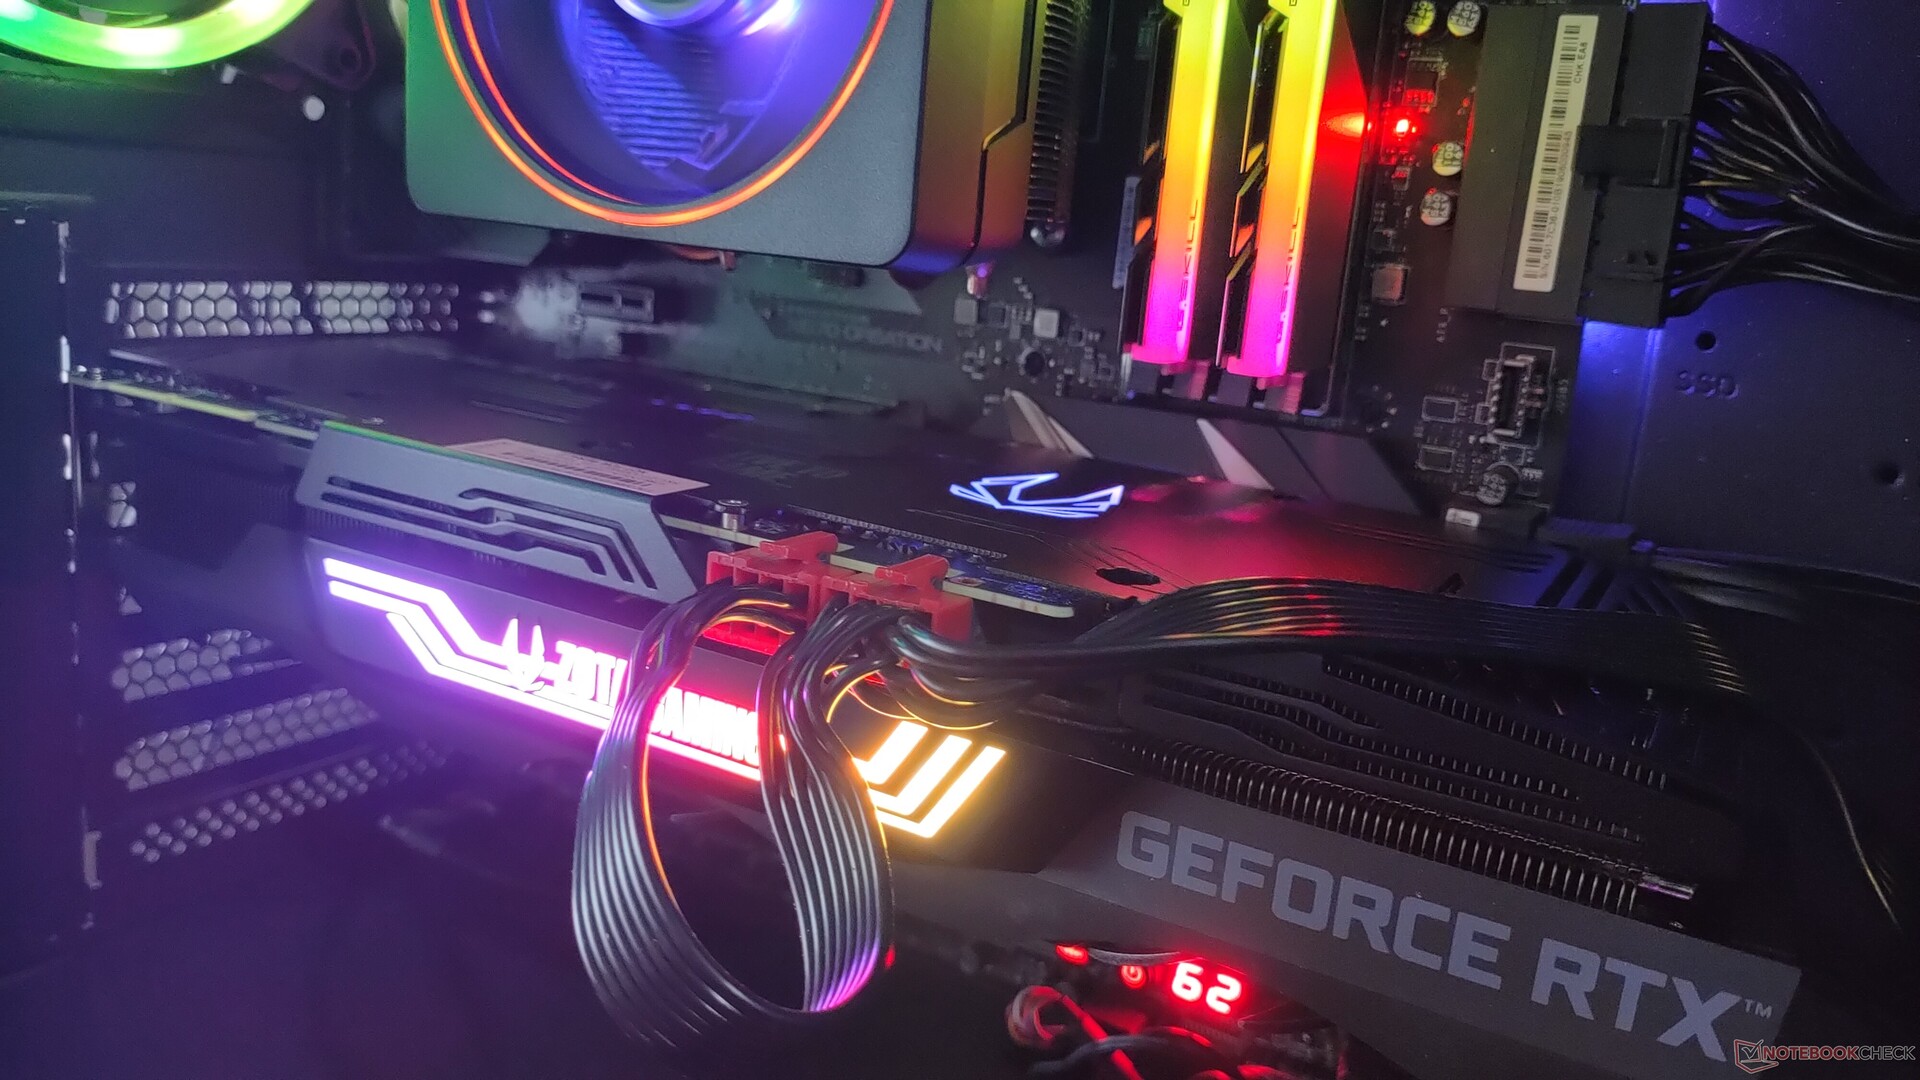
For this review, we will be using the Zotac Gaming GeForce RTX 3090 Trinity AiB card. The Zotac RTX 3090 uses a custom PCB, and its design differs a lot from the RTX 3090 Founders Edition. The card uses a triple-fan cooling system, which Zotac calls IceStorm 2.0. The RTX 3090 Trinity also features an 11-blade fan design and three groups of aluminum fin-stack array heatsinks with seven copper heat pipes. The company says the new fans help increase airflow by 10% when compared to the previous generation. Fan rotations can be adjusted independently in the now updated FireStorm utility that also allows for a fair bit of overclocking; the fans completely stop while idling.
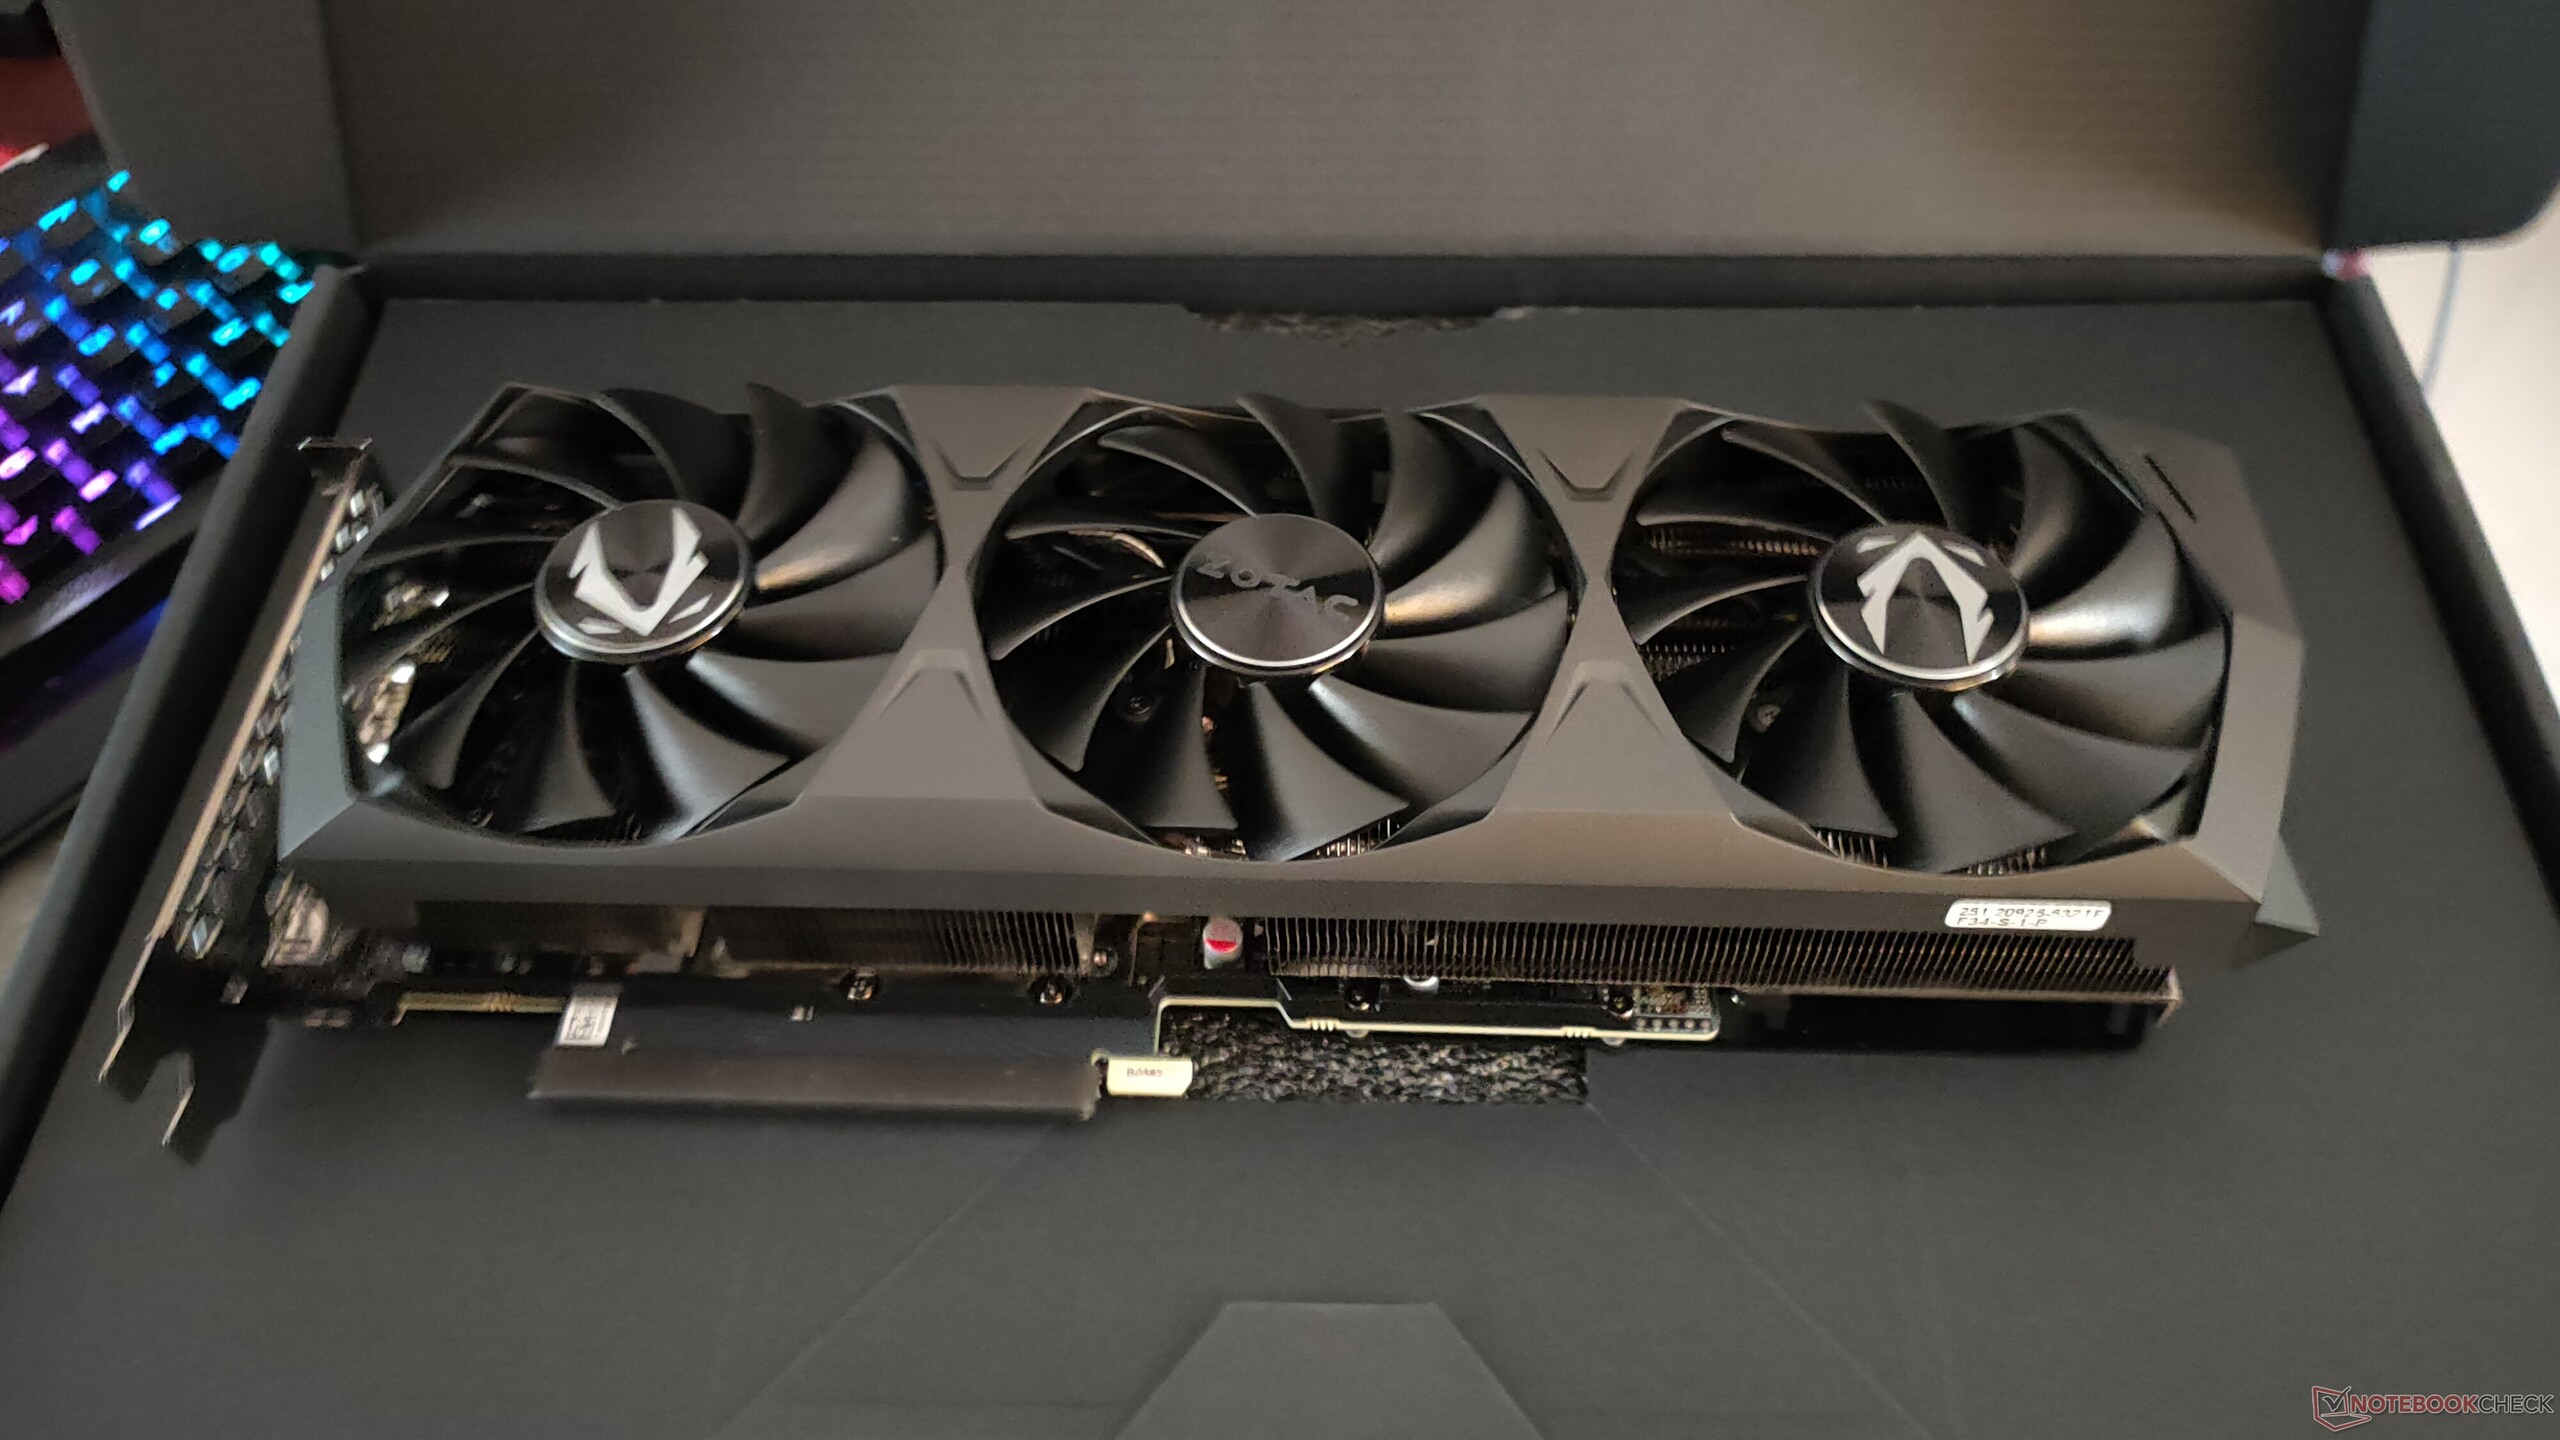
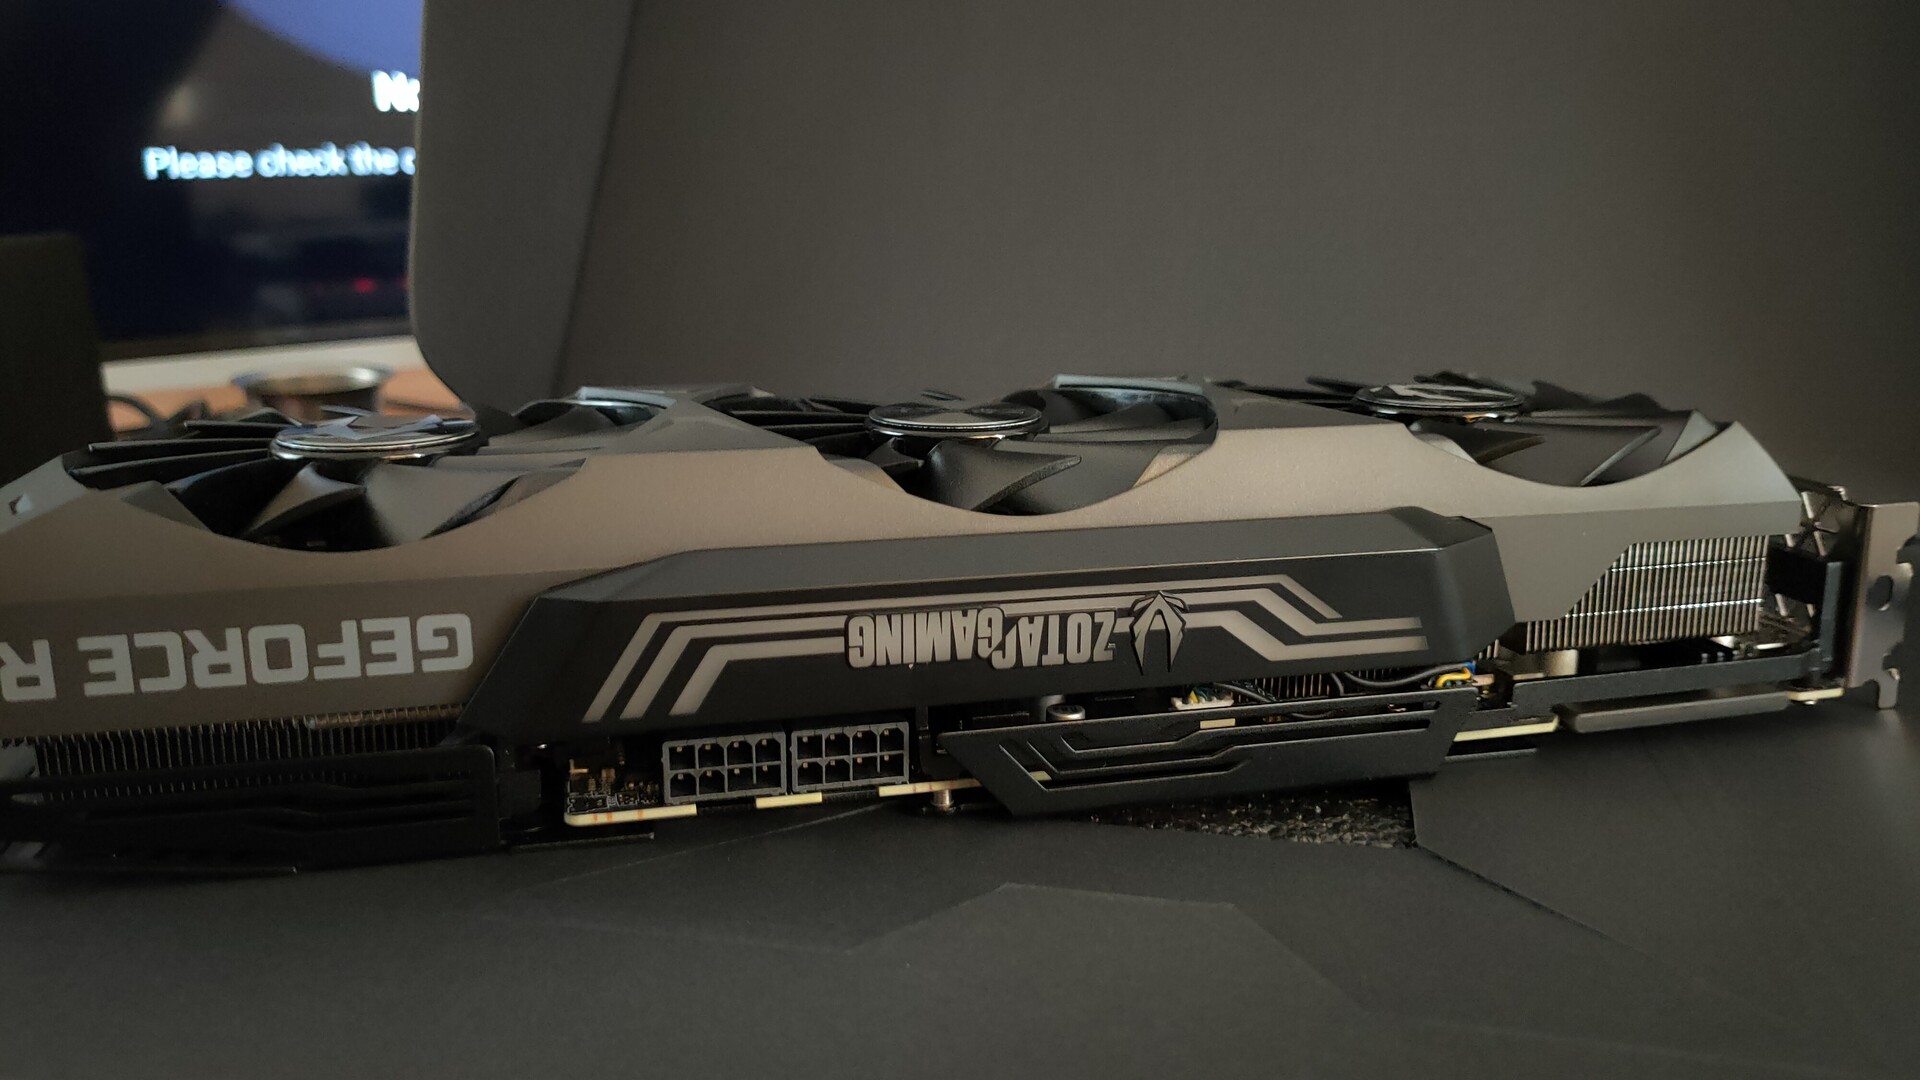
The RTX 3090 Founders Edition is a mammoth GPU that occupies three PCIe slots. In comparison, the Zotac RTX 3090 Trinity is your regular 2.5 -slot card, which means that you won't need to sacrifice PCIe expansion in most ATX boards. That being said, the card is longer than normal at 12.5 inches and even slightly exceeds the length of our test bench's E-ATX board.
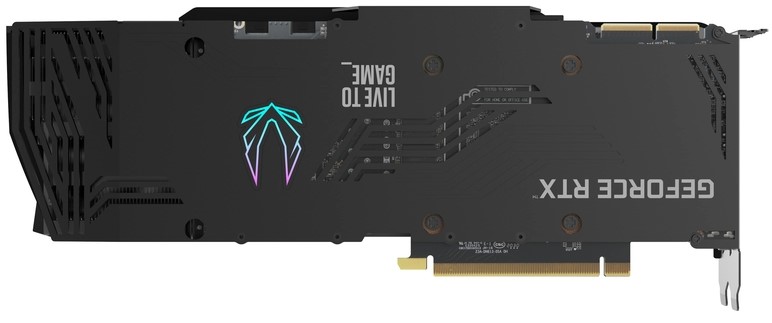
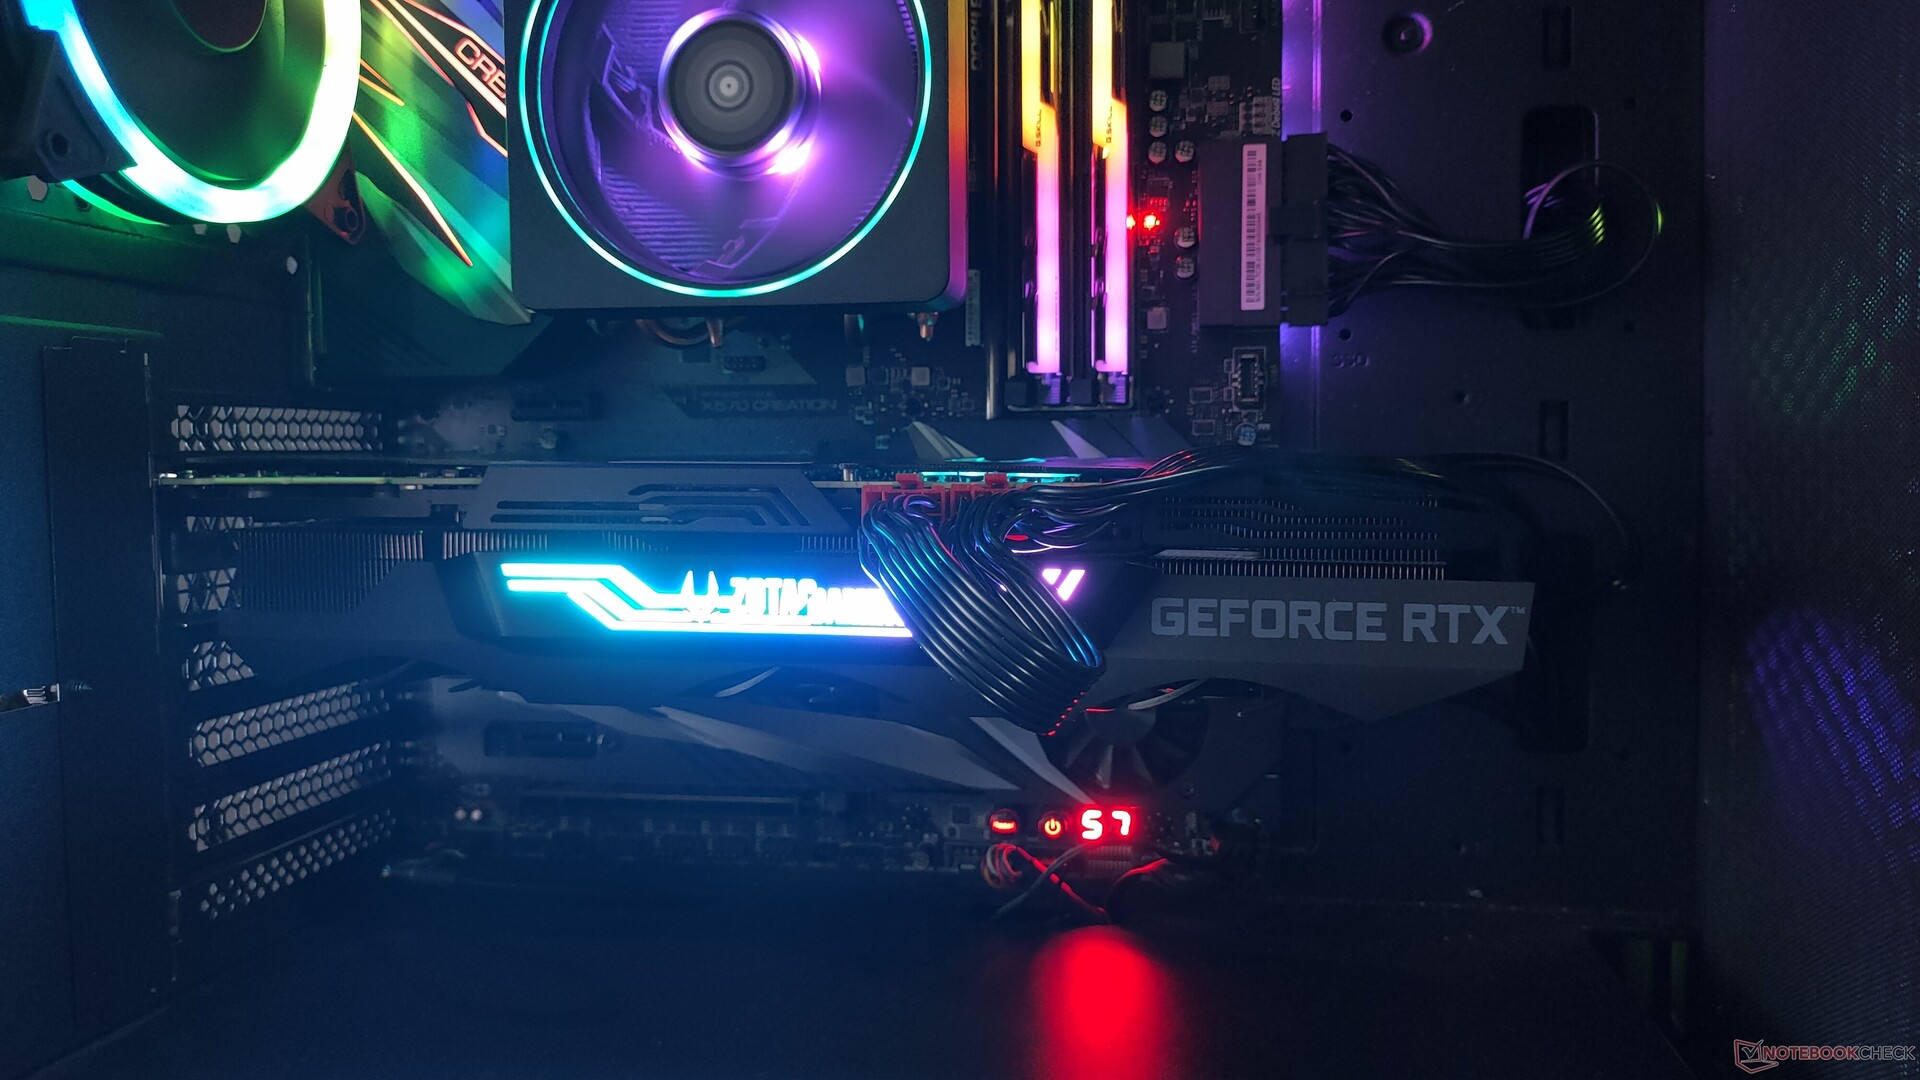
With NVIDIA deciding to ditch the USB Type-C VirtuaLink connector in this generation, we get the standard array of three DisplayPort 1.4a ports and an HDMI 2.1 port that support up to 8K 60 Hz output. Towards the top of the card, we find the Zotac Gaming RGB logo area, whose effects can be customized in the FireStorm utility. It is a standard fare with AiB cards, but it would have been great if the GeForce RTX label was also illuminated as many would want to show off their prized RTX cards in their builds. The RTX 3090 Trinity offers metal die-cast front and backplates. While the backplate is built well for the most part, it seemed a little flimsy as one goes towards the end of the card. The backplate sports the Zotac logo that is fitted with ARGB LED lighting.
NVIDIA has been steadily veering away from continuing SLI/NVLink for gamers. In the Ampere generation, the RTX 3090 is for now the only consumer card with an NVLink connector.
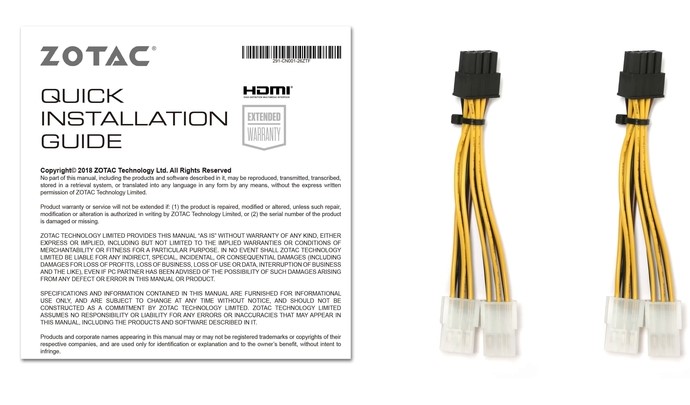
Like all other Ampere AiB cards we've seen so far, the RTX 3090 Trinity uses standard dual 8-pin connectors instead of the new 12-pin variant in the Founders Edition. One minor quirk with the RTX 3090 Trinity is the placement of the dual 8-pin power connectors — they are located more towards the middle of the card than the usual right edge. This makes reaching out to them with regular length PCIe power cables a tad bit cumbersome and may necessitate the purchase of a longer cable.
The Zotac Gaming GeForce RTX 3090 Trinity retails for US$1,694.73 (₹149,990).
Note: Due to paucity of available units from both NVIDIA and AiBs, our RTX 3080 review will follow shortly. For now, wherever necessary, we considered scores from Hardwareluxx.de's excellent RTX 3080 Founders Edition review for comparisons.
We could not get the RTX 3090 Founders Edition but NVIDIA India provided us with the Zotac Gaming GeForce RTX 3090 Trinity for testing. We tried our best to accommodate as many tests as possible within the short review window to give our readers a basic sense of the kind of performance that can be expected from this GPU. More tests and articles can be expected in the days to come.
The test bench
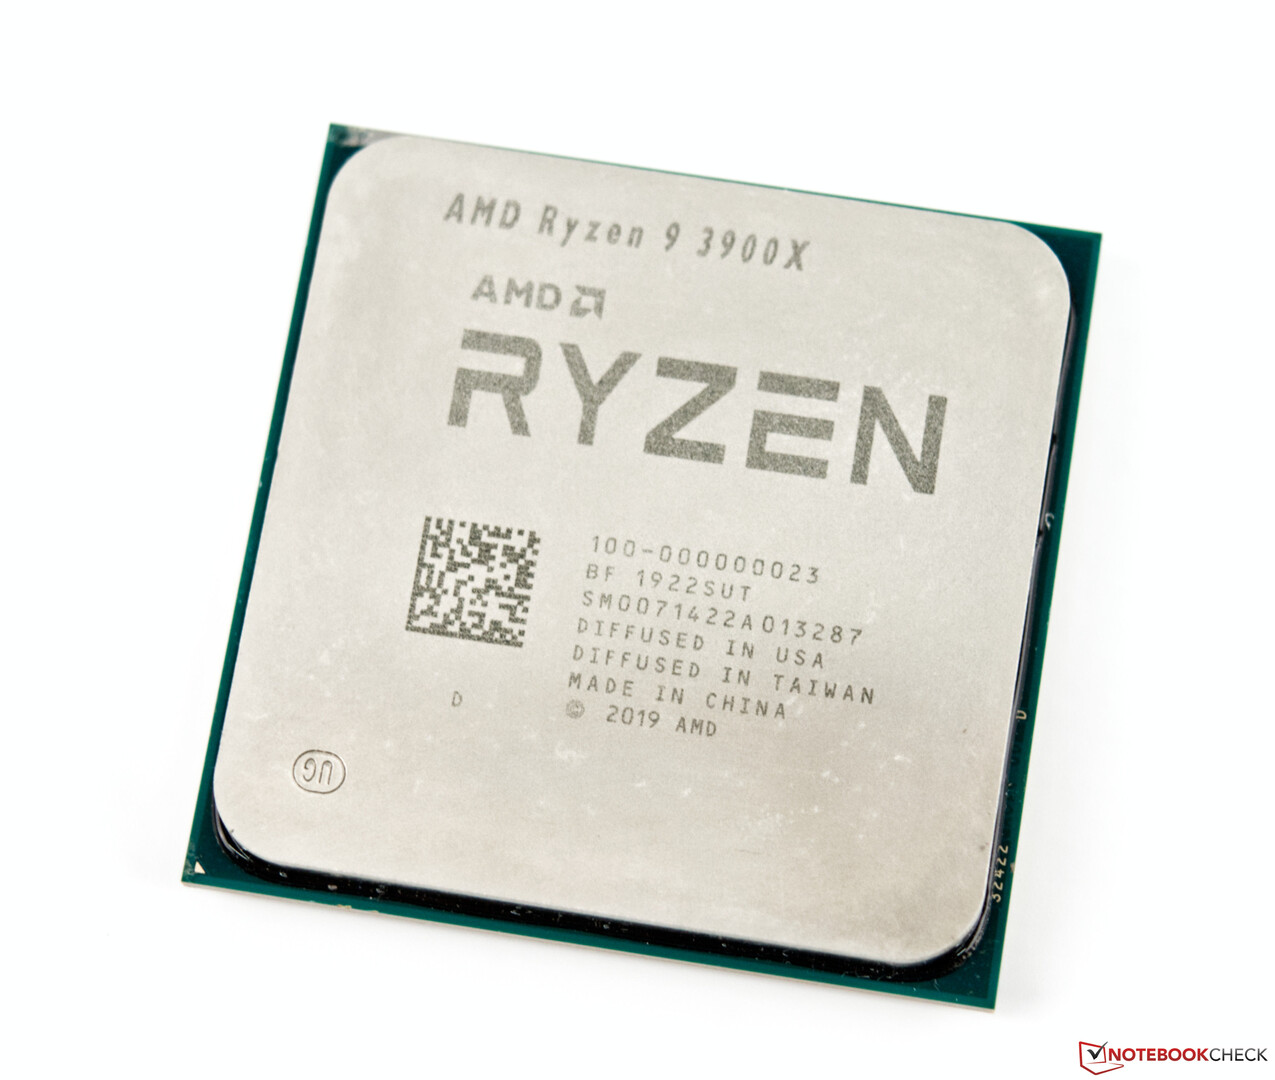
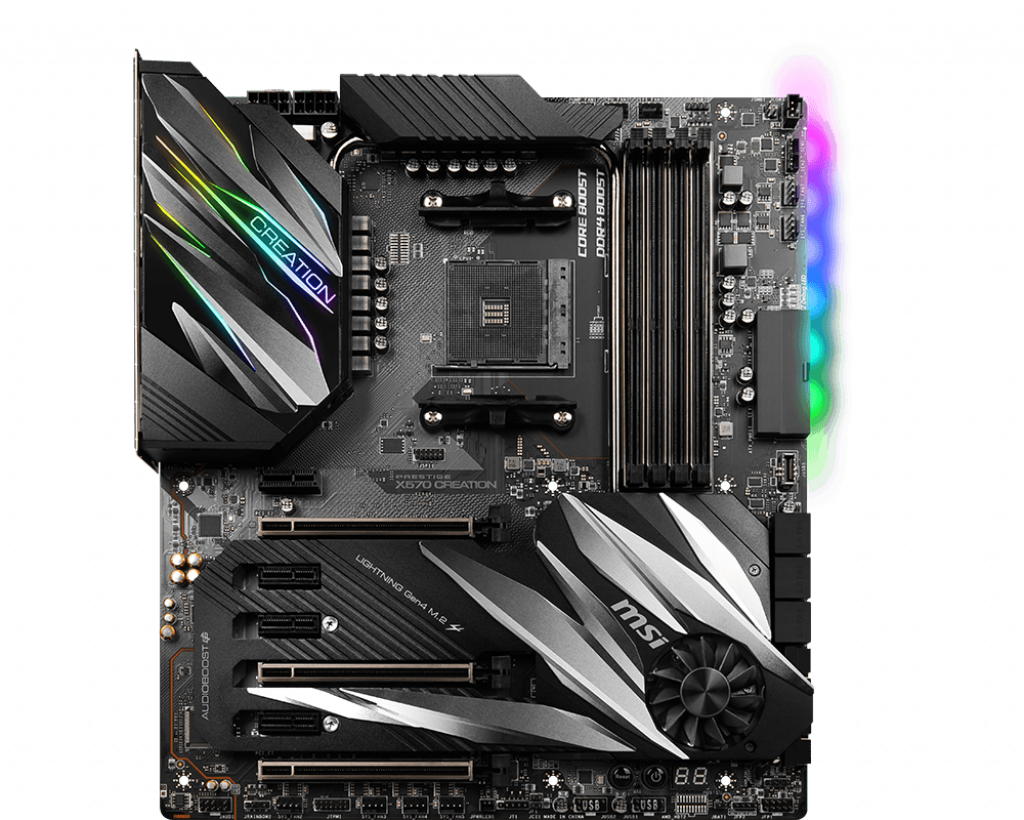
Our test bench is based on the AMD Ryzen 3000 X570 platform. We used an AMD Ryzen 9 3900X CPU on an MSI Prestige X570 Creation motherboard. The CPU was paired with 32 GB (16 GB x2) of G.SKILL Trident Z Neo DDR4-3600 RAM with timings 16-19-19-39. Windows 10 2004 with the latest cumulative updates (Build 19041.508) was installed on a Gigabyte Aorus NVMe Gen4 1 TB SSD while 2x 1 TB each of Crucial MX500 SATA SSDs were used to run benchmarks and games. The system was air cooled using AMD's stock Wraith Prism cooler. To allow for better airflow, the tests were run with the case's (Antec NX800) tempered side panel removed.
All drivers including the BIOS (AGESA Combo 1.0.8.1) and VGA (456.38) were updated to the latest available versions prior to benchmarking.
We paired the RTX 3090 Trinity to a OnePlus U Series 55U1 smart TV (hands-on review coming soon) running at native 4K 60 Hz. Color output was set to Full 32-bit RGB in the NVIDIA Control Panel and Windows scaling was set to 100%.
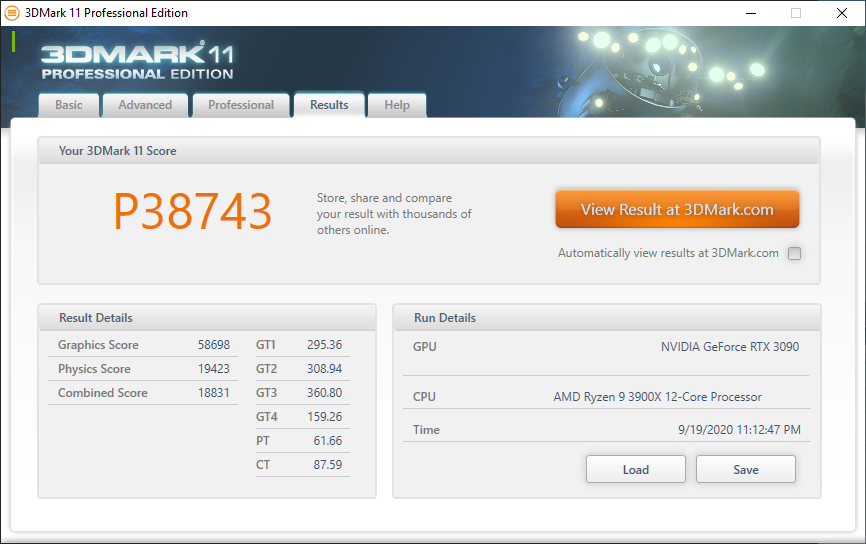
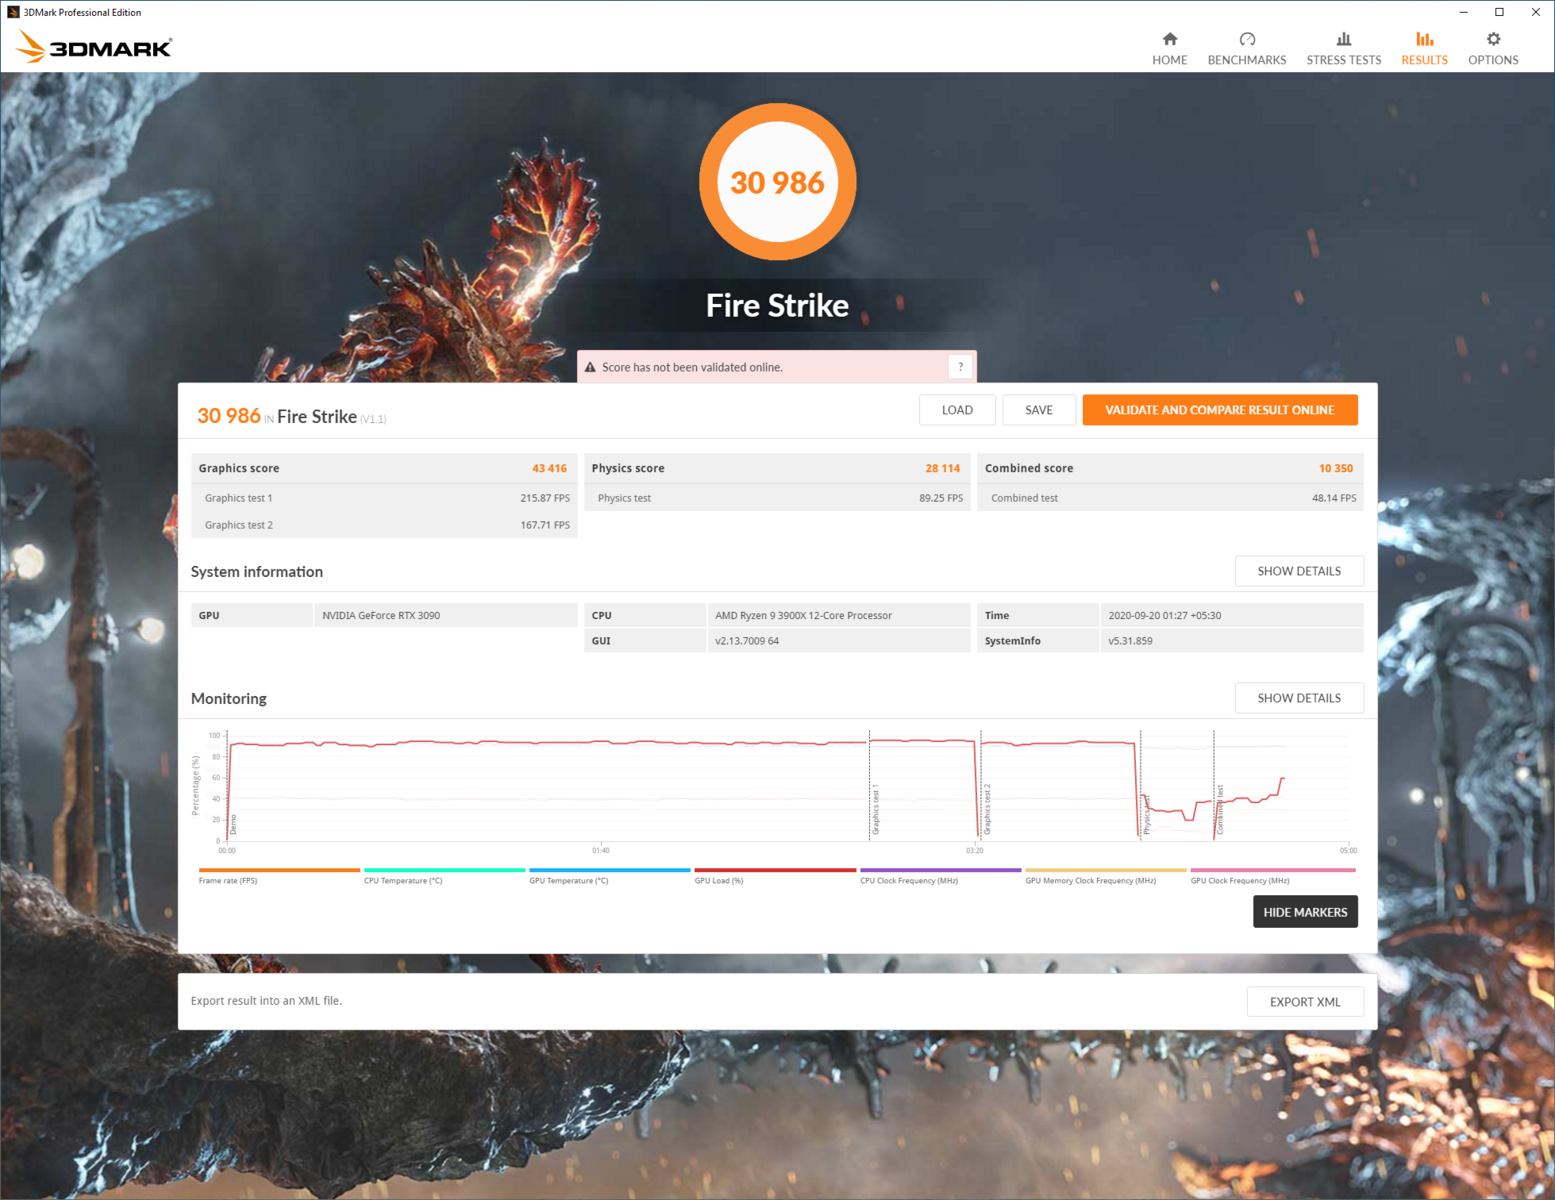
Synthetic benchmarks
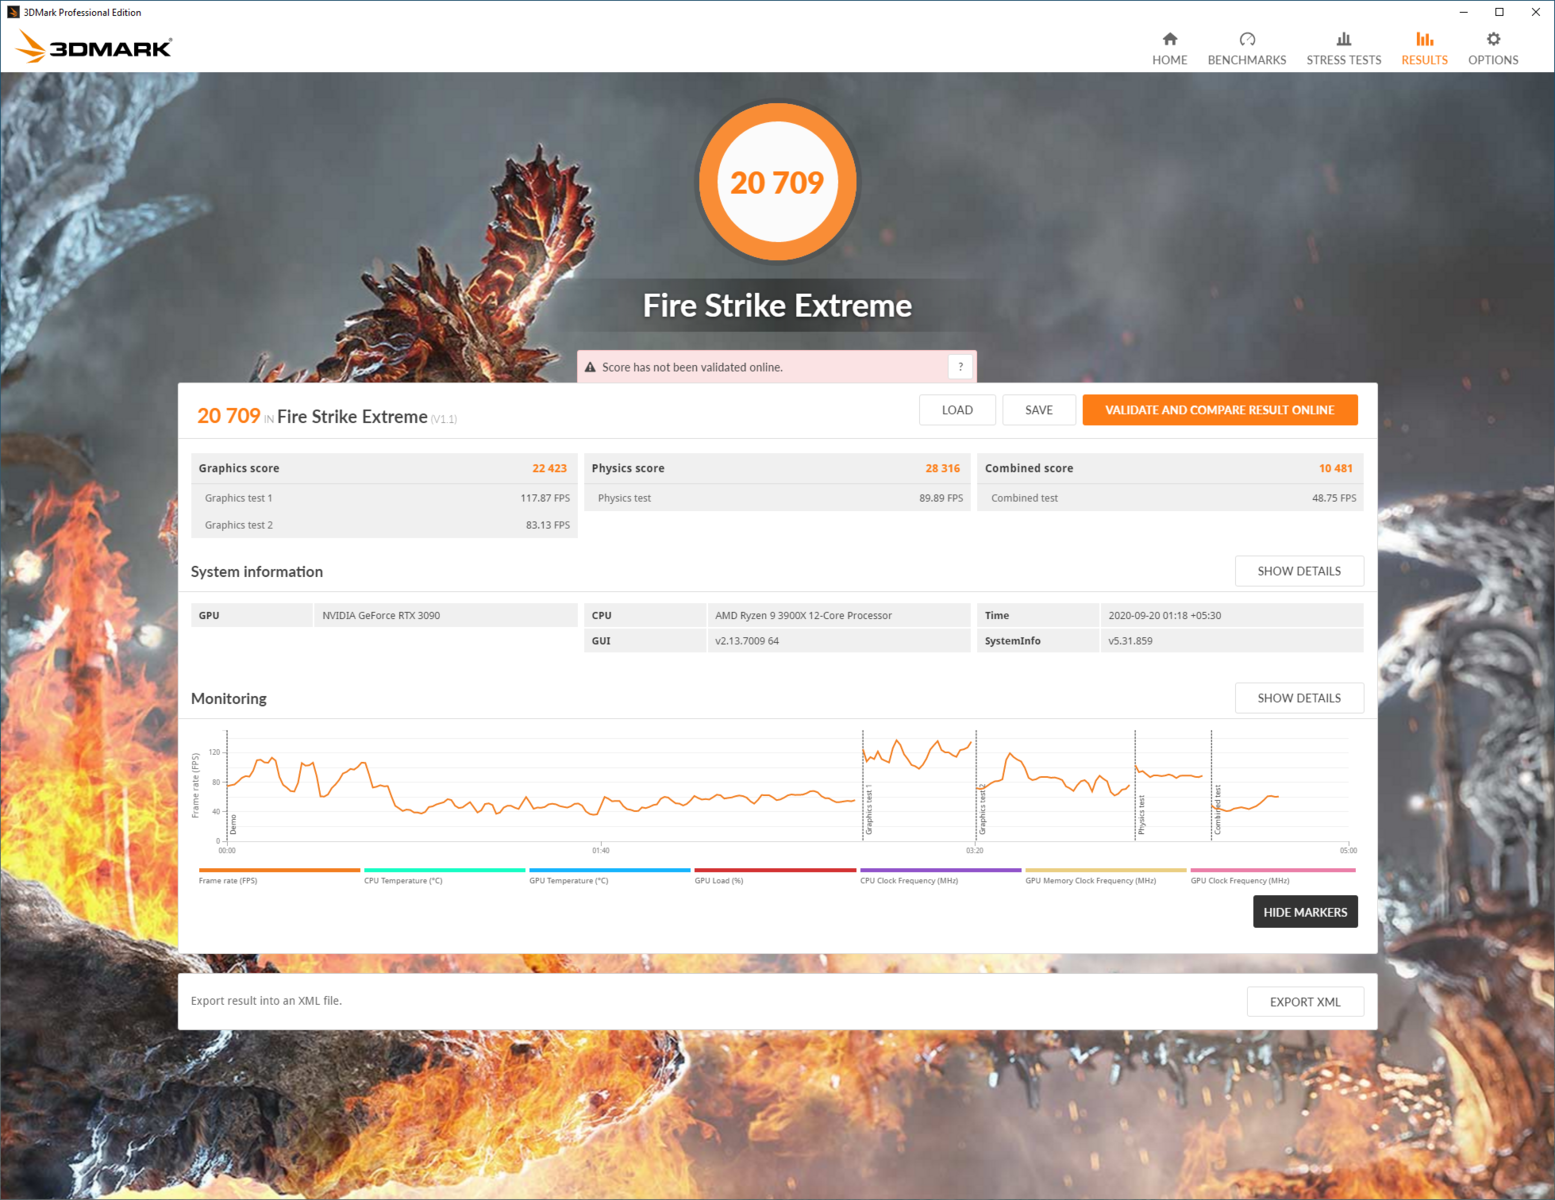
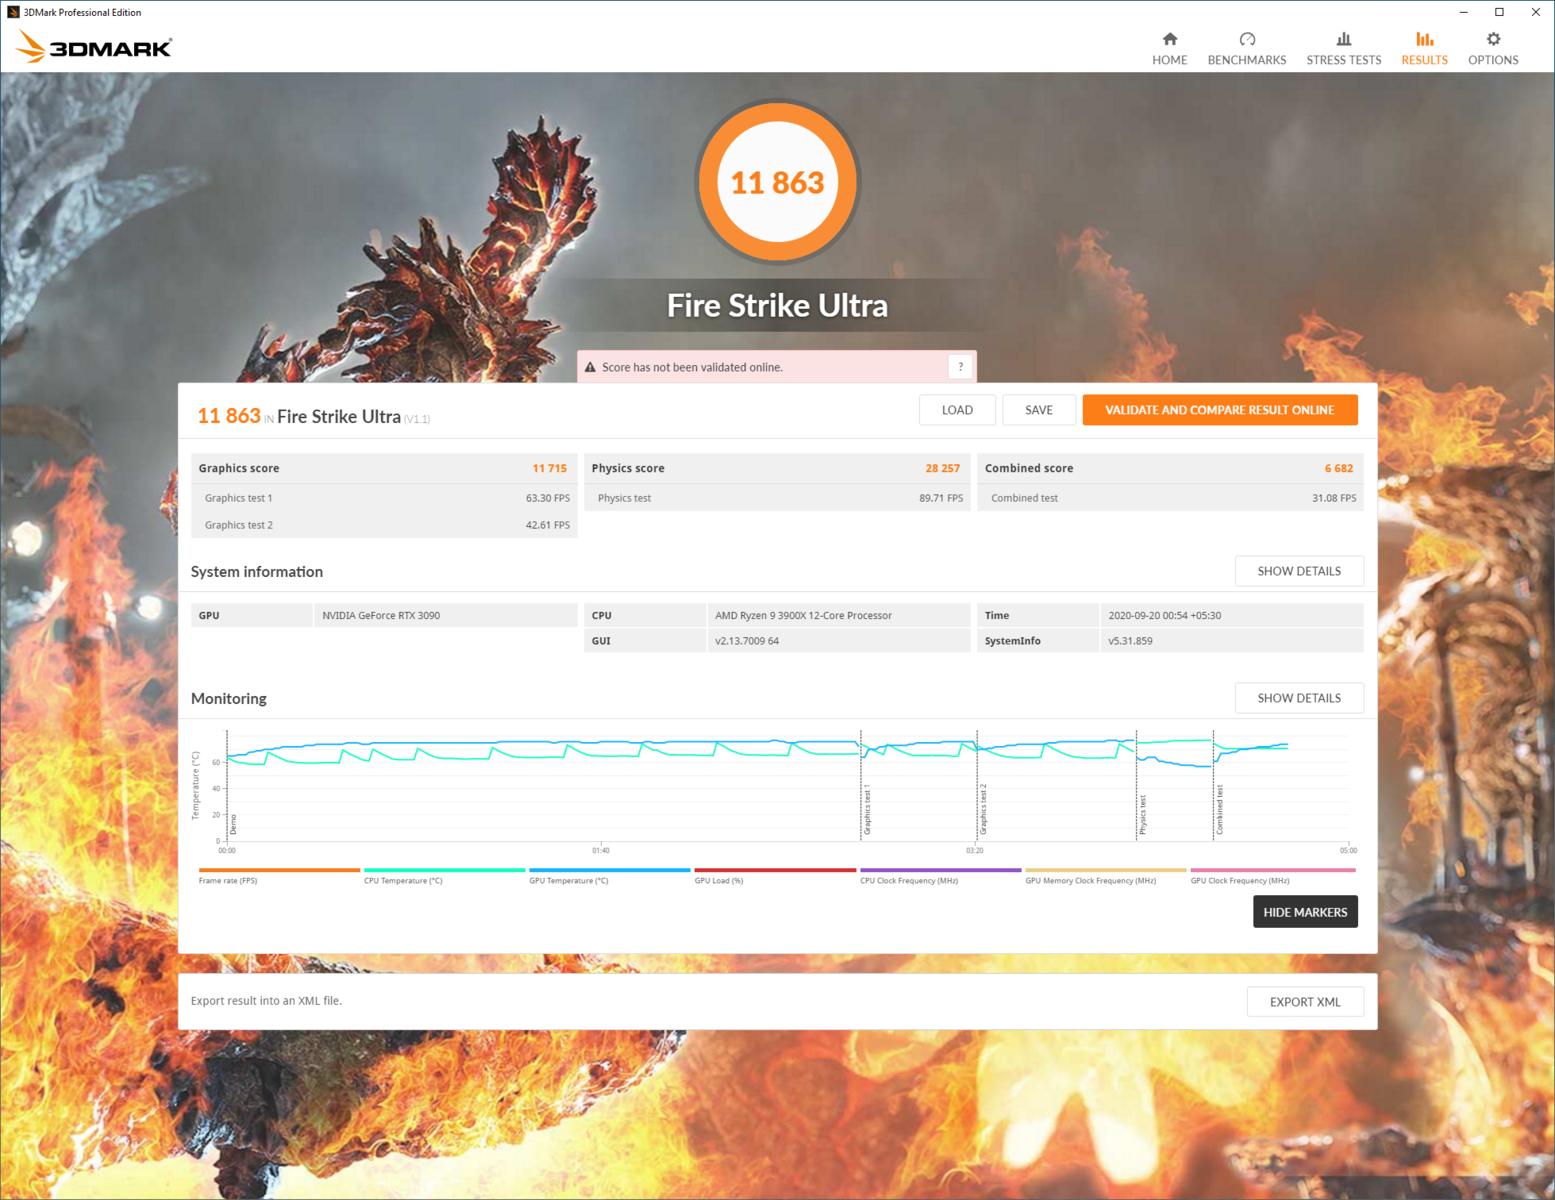
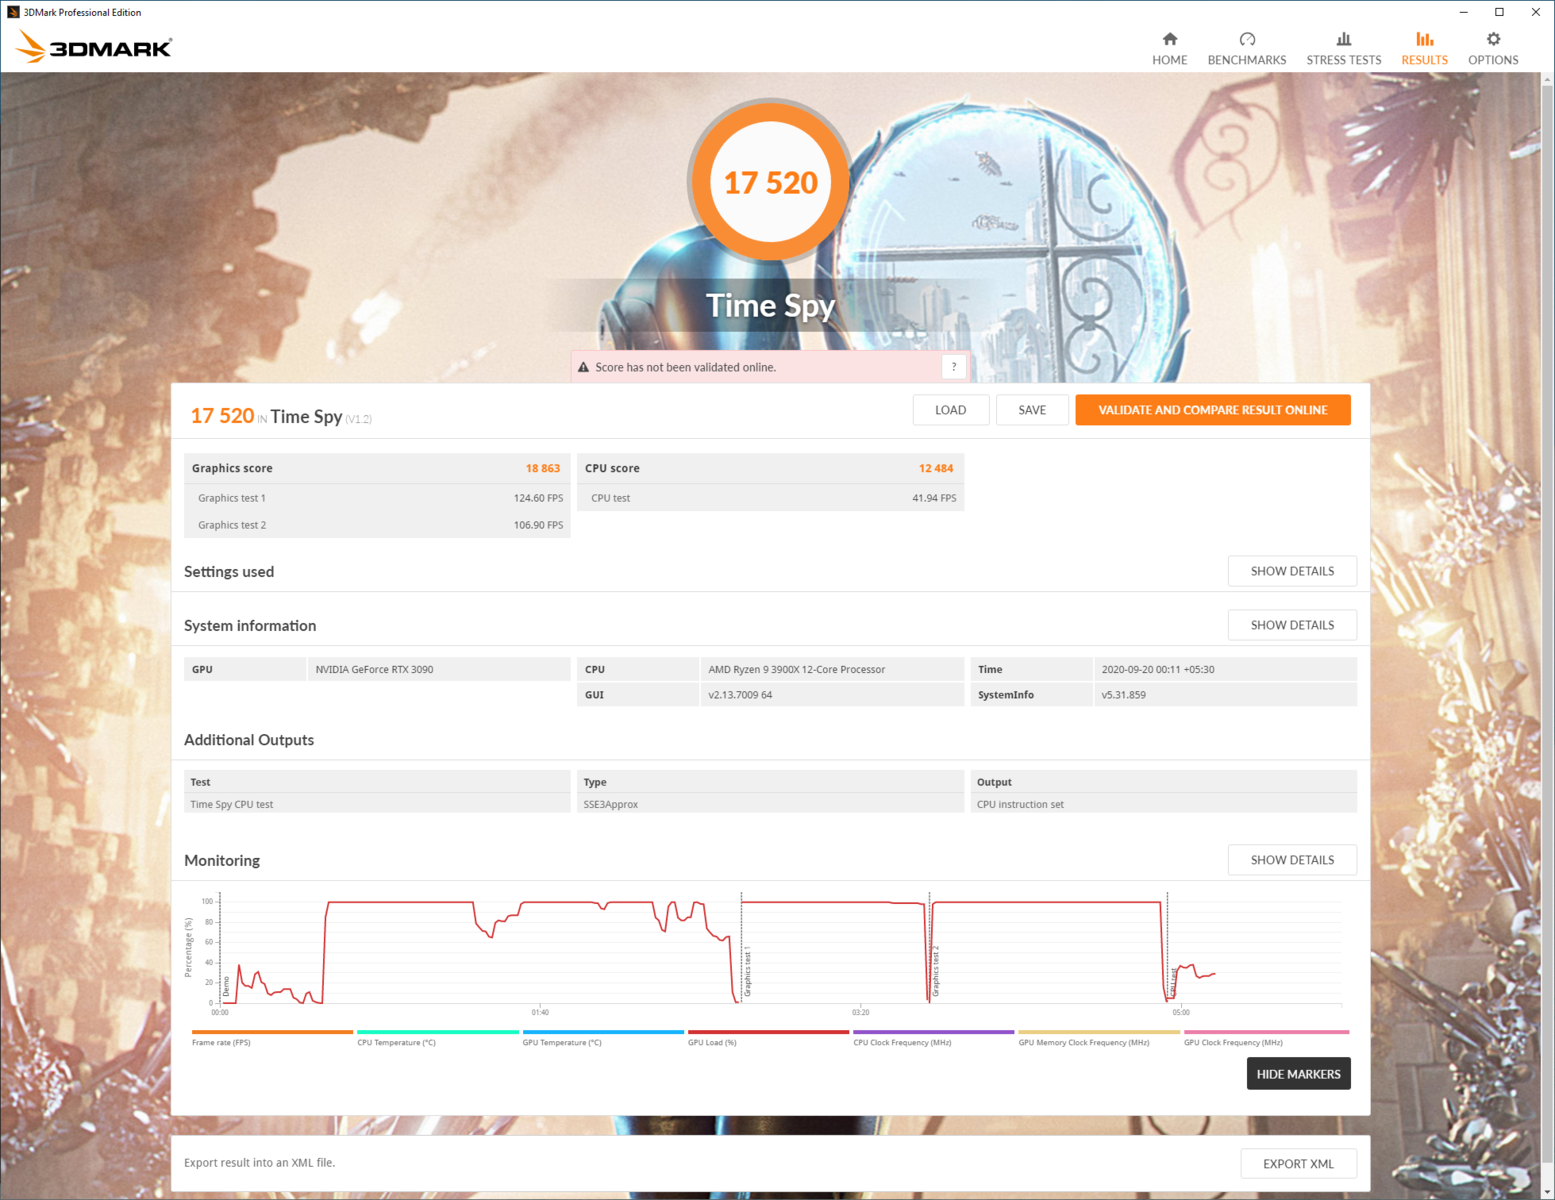
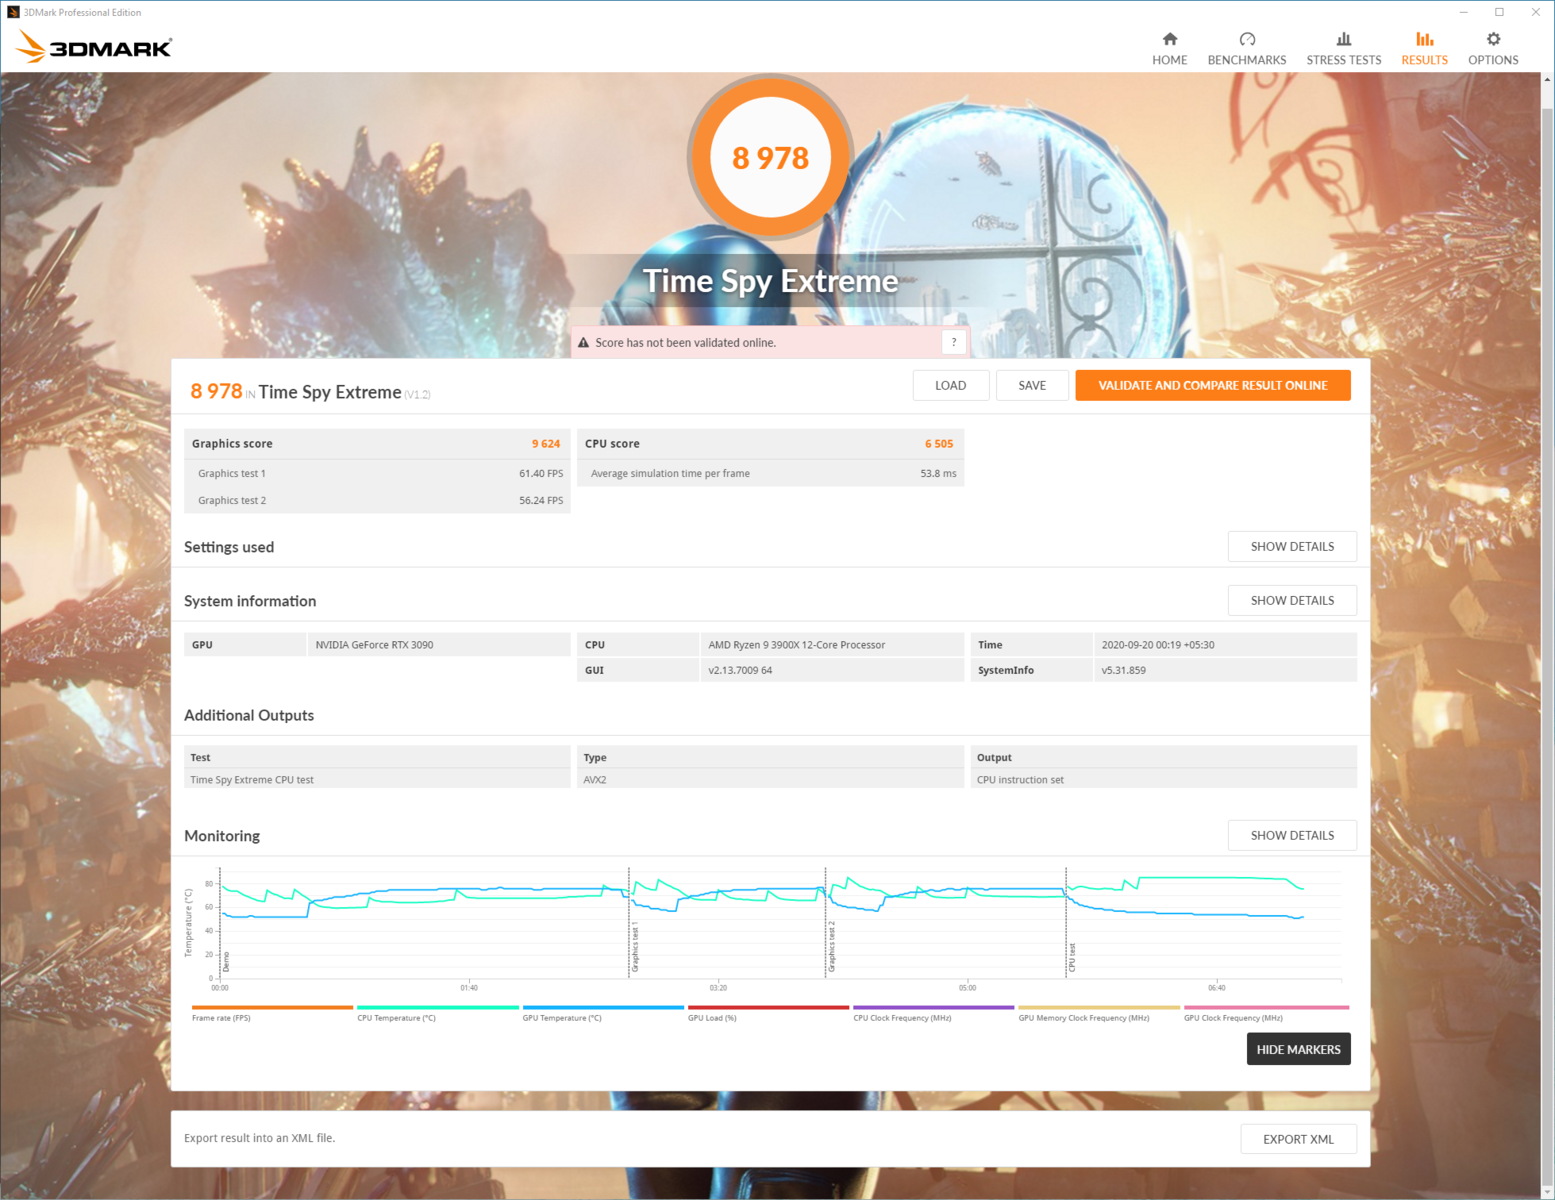
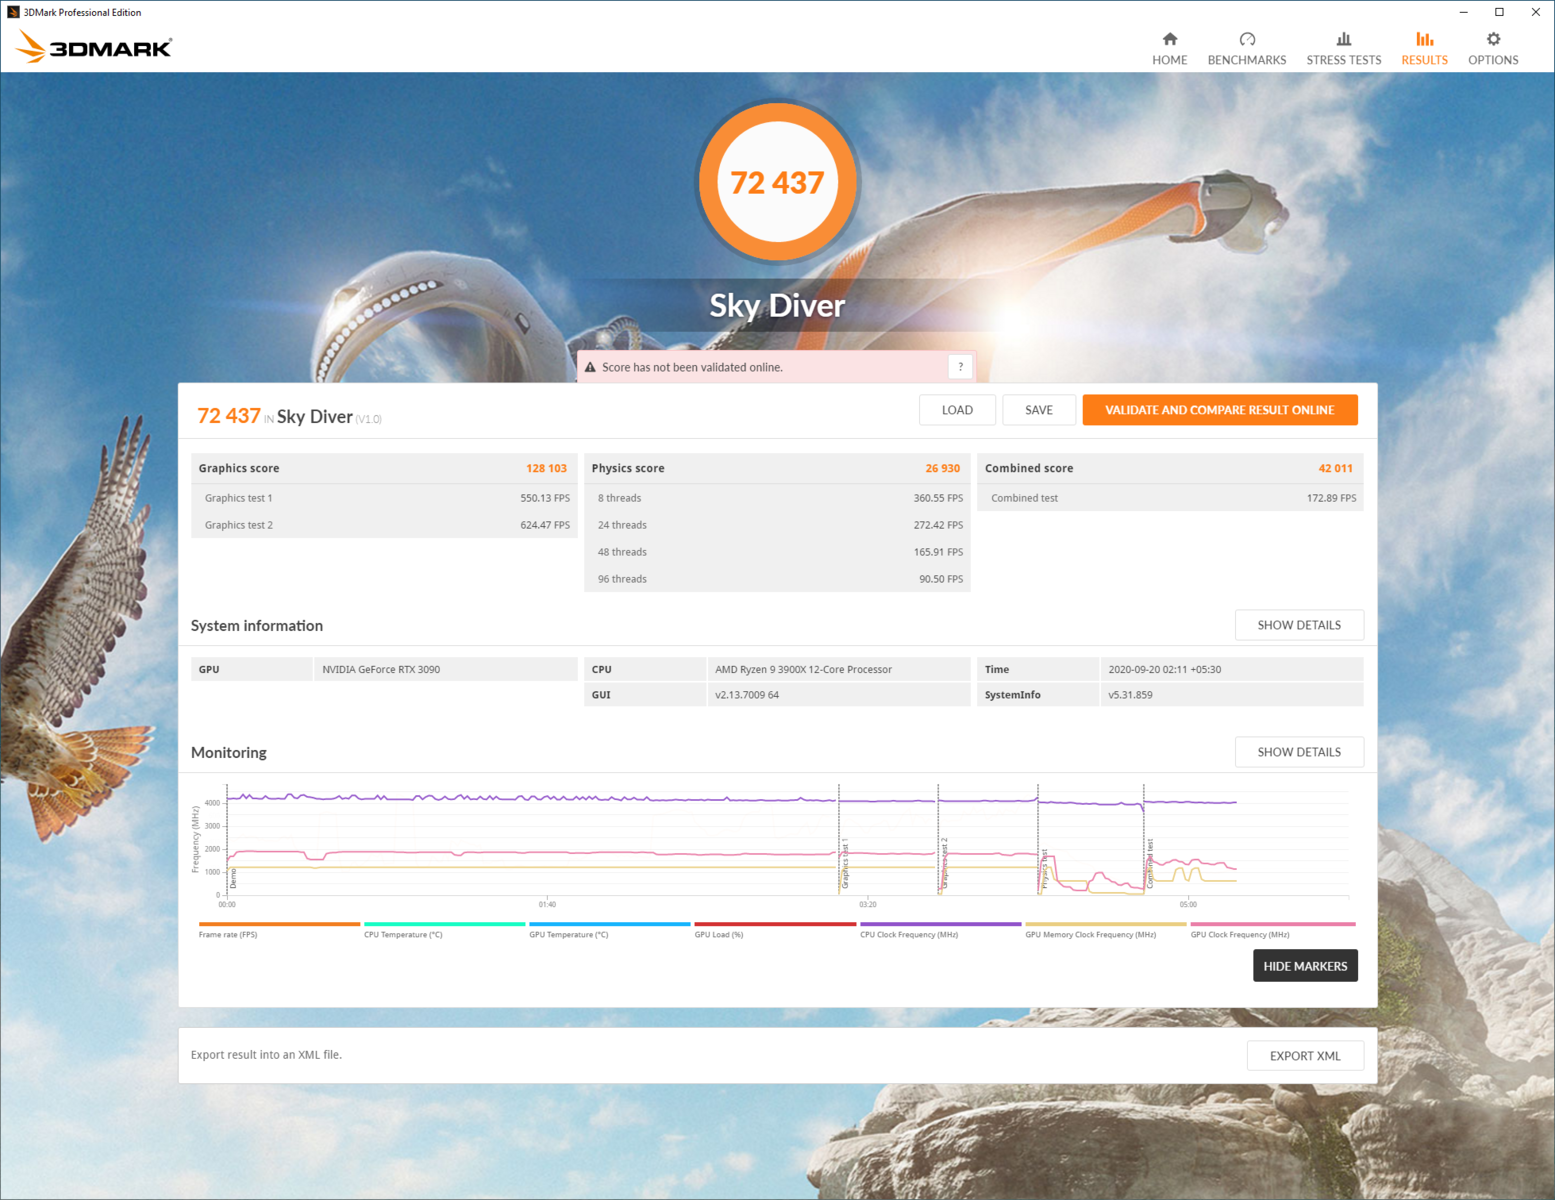
We used 3DMark and Unigine benchmarks to test the RTX 3090's performance in synthetic loads. We see that the RTX 3090 offers the best gains in benchmarks running at 1440p and above resolutions. In Fire Strike Ultra, for instance, we see a healthy 36% lead over the Titan RTX. The RTX 3090 also leads the Titan RTX by 31% in Fire Strike Extreme. However, compared to the RTX 3080 (20,834 points from Hardwareluxx), the difference only comes to about 7%.
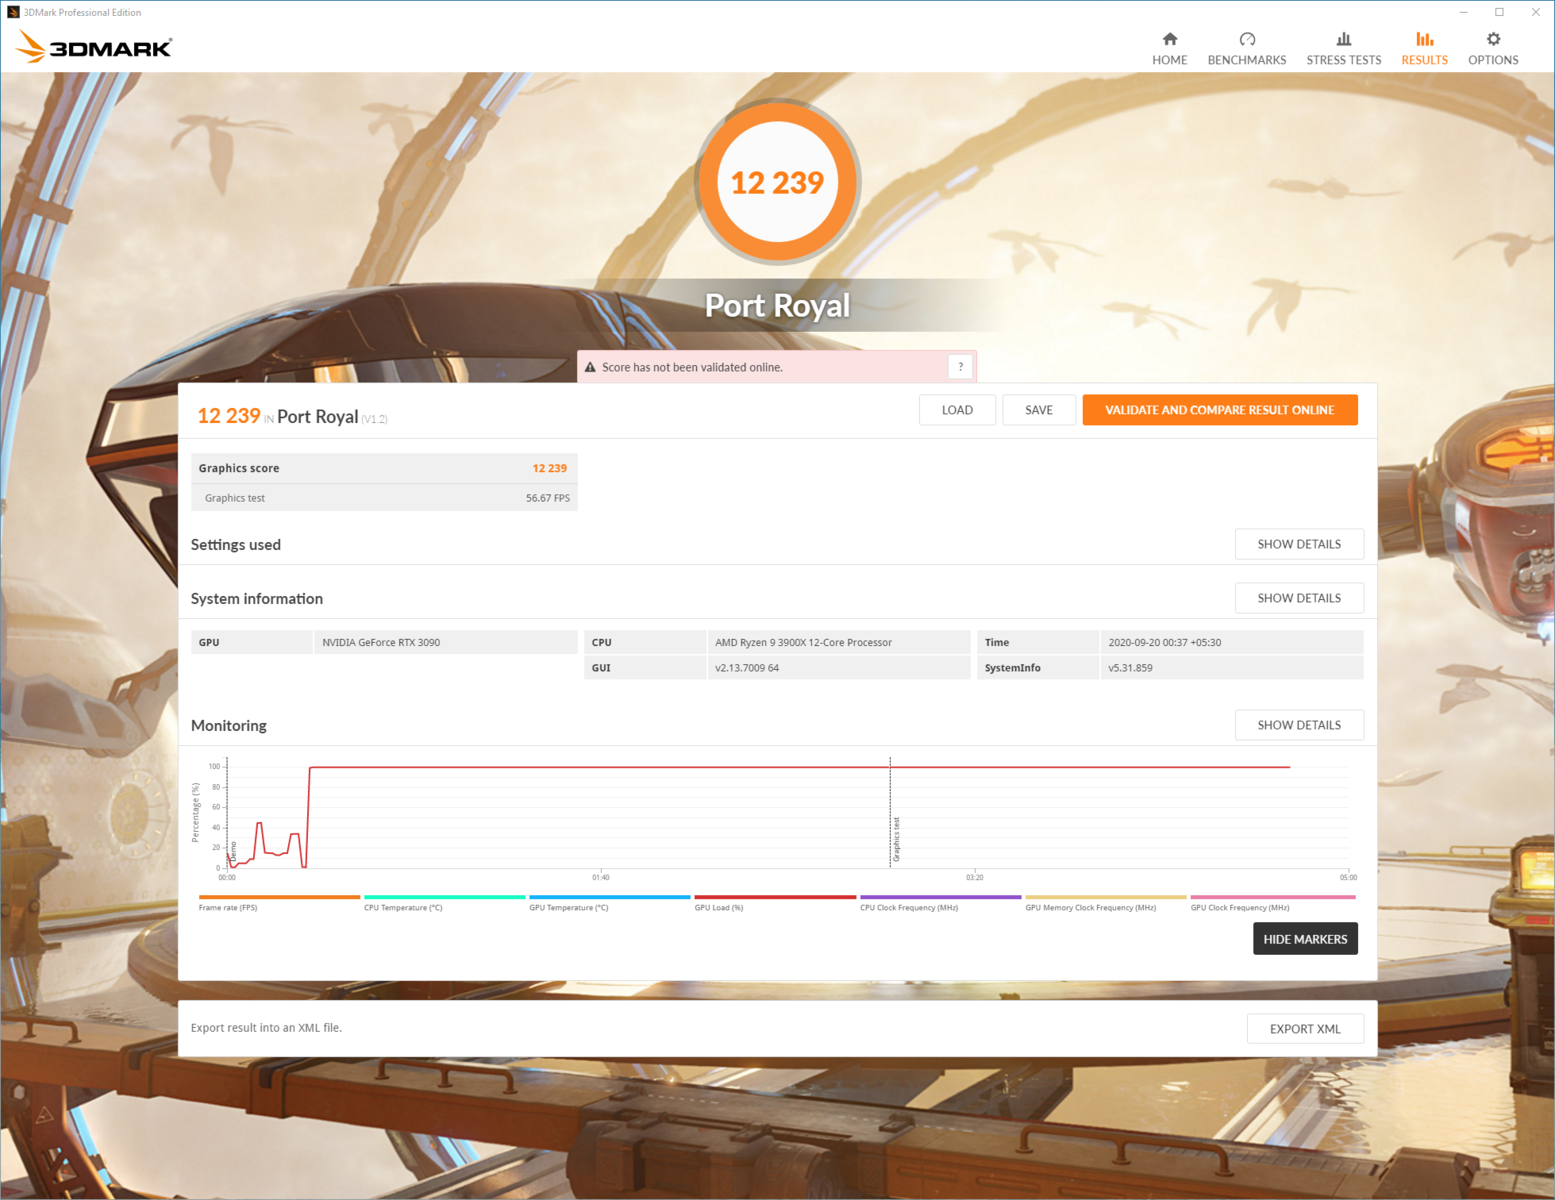
In the Port Royal benchmark that tests ray-tracing performance, we see the RTX 3090 posting nearly 1.5x higher scores compared to the RTX 2080 Ti. Once again, however, the RTX 3090 only offers an effective increase of about 7.25% compared to the RTX 3080 (11,426 points from Hardwareluxx).
In Unigine, we see gains of up to 36% in the Valley 1.0 benchmark and up to 31% in Heaven 4.0. Do note that the RTX 2080 Ti is able to offer better performance here compared to the Titan RTX. Unigine Superposition is a more demanding benchmark and we see that the RTX 3090 Trinity is able to achieve a strong 33% lead in both 4K and 8K Optimized presets.
One thing that is pretty evident from these synthetic tests is that there is not much of an incentive for choosing an RTX 3090 over an RTX 3080 as the difference in performance will be about 7-8% at best. That being said, if you are upgrading from a previous Titan card, the RTX 3090 does offer tangible benefits, especially at higher resolutions.

| 3DMark | |
| 2560x1440 Port Royal Graphics | |
| NVIDIA GeForce RTX 3090 | |
| NVIDIA Titan RTX | |
| NVIDIA GeForce RTX 2080 Ti (Desktop) | |
| NVIDIA GeForce RTX 2080 Super (Desktop) | |
| NVIDIA Titan X Pascal | |
| 2560x1440 Time Spy Graphics | |
| NVIDIA GeForce RTX 3090 | |
| NVIDIA Titan RTX | |
| NVIDIA GeForce RTX 2080 Ti (Desktop) | |
| NVIDIA GeForce RTX 2080 Super (Desktop) | |
| NVIDIA Titan X Pascal | |
| AMD Radeon RX 5700 XT (Desktop) | |
| 3840x2160 Fire Strike Ultra Graphics | |
| NVIDIA GeForce RTX 3090 | |
| NVIDIA Titan RTX | |
| NVIDIA GeForce RTX 2080 Ti (Desktop) | |
| NVIDIA Titan X Pascal | |
| NVIDIA GeForce RTX 2080 Super (Desktop) | |
| AMD Radeon RX 5700 XT (Desktop) | |
| Fire Strike Extreme Graphics | |
| NVIDIA GeForce RTX 3090 | |
| NVIDIA Titan RTX | |
| NVIDIA GeForce RTX 2080 Ti (Desktop) | |
| NVIDIA Titan X Pascal | |
| NVIDIA GeForce RTX 2080 Super (Desktop) | |
| AMD Radeon RX 5700 XT (Desktop) | |
| 1920x1080 Fire Strike Graphics | |
| NVIDIA GeForce RTX 3090 | |
| NVIDIA Titan RTX | |
| NVIDIA GeForce RTX 2080 Ti (Desktop) | |
| NVIDIA GeForce RTX 2080 Super (Desktop) | |
| AMD Radeon RX 5700 XT (Desktop) | |
| NVIDIA Titan X Pascal | |
| 3DMark 11 - 1280x720 Performance GPU | |
| NVIDIA GeForce RTX 3090 | |
| NVIDIA Titan RTX | |
| NVIDIA GeForce RTX 2080 Ti (Desktop) | |
| NVIDIA GeForce RTX 2080 Super (Desktop) | |
| NVIDIA Titan X Pascal | |
| AMD Radeon RX 5700 XT (Desktop) | |
| Unigine Valley 1.0 - 1920x1080 Extreme HD DirectX AA:x8 | |
| NVIDIA GeForce RTX 3090 | |
| NVIDIA Titan RTX | |
| NVIDIA GeForce RTX 2080 Ti (Desktop) | |
| NVIDIA Titan X Pascal | |
| NVIDIA GeForce RTX 2080 Super (Desktop) | |
| AMD Radeon RX 5700 XT (Desktop) | |
| Unigine Heaven 4.0 - Extreme Preset DX11 | |
| NVIDIA GeForce RTX 3090 | |
| NVIDIA Titan RTX | |
| NVIDIA GeForce RTX 2080 Ti (Desktop) | |
| NVIDIA GeForce RTX 2080 Super (Desktop) | |
| NVIDIA Titan X Pascal | |
| AMD Radeon RX 5700 XT (Desktop) | |
| Unigine Superposition | |
| 7680x4320 8k Optimized | |
| NVIDIA GeForce RTX 3090 | |
| NVIDIA Titan RTX | |
| NVIDIA Titan X Pascal | |
| AMD Radeon RX 5700 XT (Desktop) | |
| 3840x2160 4k Optimized | |
| NVIDIA GeForce RTX 3090 | |
| NVIDIA Titan RTX | |
| NVIDIA Titan X Pascal | |
| AMD Radeon RX 5700 XT (Desktop) | |
| 1920x1080 1080p Extreme | |
| NVIDIA GeForce RTX 3090 | |
| NVIDIA Titan RTX | |
| NVIDIA Titan X Pascal | |
| AMD Radeon RX 5700 XT (Desktop) | |
| 1920x1080 1080p High | |
| NVIDIA GeForce RTX 3090 | |
| NVIDIA Titan RTX | |
| NVIDIA Titan X Pascal | |
| AMD Radeon RX 5700 XT (Desktop) | |
Compute benchmarks
The RTX 3090 Trinity shines in compute benchmarks offering a high lead of 74% in ComputeMark's QJuliaRayTrace and a 61% overall high score in the benchmark over the Titan RTX. In the GPU-intensive LuxMark Room and Sala tests, the RTX 3090 scores an easy 25% and 36% margin over the Titan RTX. Workloads that make use of extensive GPU computations should, therefore, reap good benefits in upgrading to this card.
| ComputeMark v2.1 | |
| 1024x600 Normal, Score | |
| NVIDIA GeForce RTX 3090 | |
| NVIDIA Titan RTX | |
| NVIDIA GeForce RTX 2080 Ti (Desktop) | |
| NVIDIA GeForce RTX 2080 Super (Desktop) | |
| 1024x600 Normal, Fluid 3DTex | |
| NVIDIA GeForce RTX 3090 | |
| NVIDIA Titan RTX | |
| NVIDIA GeForce RTX 2080 Ti (Desktop) | |
| NVIDIA GeForce RTX 2080 Super (Desktop) | |
| 1024x600 Normal, Fluid 2DTexArr | |
| NVIDIA GeForce RTX 3090 | |
| NVIDIA Titan RTX | |
| NVIDIA GeForce RTX 2080 Ti (Desktop) | |
| NVIDIA GeForce RTX 2080 Super (Desktop) | |
| 1024x600 Normal, Mandel Vector | |
| NVIDIA GeForce RTX 3090 | |
| NVIDIA Titan RTX | |
| NVIDIA GeForce RTX 2080 Ti (Desktop) | |
| NVIDIA GeForce RTX 2080 Super (Desktop) | |
| 1024x600 Normal, Mandel Scalar | |
| NVIDIA GeForce RTX 3090 | |
| NVIDIA Titan RTX | |
| NVIDIA GeForce RTX 2080 Ti (Desktop) | |
| NVIDIA GeForce RTX 2080 Super (Desktop) | |
| 1024x600 Normal, QJuliaRayTrace | |
| NVIDIA GeForce RTX 3090 | |
| NVIDIA Titan RTX | |
| NVIDIA GeForce RTX 2080 Ti (Desktop) | |
| NVIDIA GeForce RTX 2080 Super (Desktop) | |
| LuxMark v2.0 64Bit | |
| Sala GPUs-only | |
| NVIDIA GeForce RTX 3090 | |
| NVIDIA Titan RTX | |
| NVIDIA GeForce RTX 2080 Ti (Desktop) | |
| NVIDIA GeForce RTX 2080 Super (Desktop) | |
| Room GPUs-only | |
| NVIDIA GeForce RTX 3090 | |
| NVIDIA Titan RTX | |
| NVIDIA GeForce RTX 2080 Ti (Desktop) | |
| NVIDIA GeForce RTX 2080 Super (Desktop) | |
| Geekbench 5.5 | |
| OpenCL Score | |
| NVIDIA GeForce RTX 3090 | |
| Vulkan Score 5.5 | |
| NVIDIA GeForce RTX 3090 | |
Professional applications
NVIDIA would want professionals in the medical, automobile, and 3D-rendering industries to ideally use its Quadro lineup. Ampere-based Quadro cards are yet to be announced and we expect them to easily outperform the RTX 3090. The RTX 3090 uses GeForce drivers, which are not certified for use in pro apps. Nevertheless, with the availability of 24 GB GDDR6X VRAM and a top-of-the-line Ampere core, the RTX 3090's applicability in these scenarios cannot be fully discounted. We see interesting results in our comparison with the Titan RTX and other NVIDIA cards.
In SPECviewperf 12, the best gains were seen with Maya and 3DS Max workloads with Showcase offering clear benefits as well compared to the Titan RTX. However, the RTX 3090 took a good beating in tests such as Solidworks, Catia, Siemens NX, etc.
Similarly, in SPECviewperf 13, Maya, 3DS Max, Creo, and Showcase show good improvements with the rest of the scores tanking badly compared to even the Titan X Pascal.
This could be largely due to the drivers and optimization, and we expect the scores to get better with time. That being said, the appreciable performance boost in 3DS Max and Maya will be of interest to those in 3D modeling as they stand to reap good benefits without having to necessarily invest in a more expensive Quadro card.
| NVIDIA GeForce RTX 3090 GeForce RTX 3090, R9 3900X | NVIDIA Titan RTX Titan RTX, R7 2700X, ADATA Premier Pro SP900NS38 512 GB | NVIDIA Titan X Pascal Titan X Pascal, TR 1950X, Samsung SM951 MZHPV512HDGL m.2 PCI-e | NVIDIA GeForce RTX 2080 Ti (Desktop) GeForce RTX 2080 Ti (Desktop), R9 3900X, Corsair MP600 | NVIDIA GeForce RTX 2080 Super (Desktop) GeForce RTX 2080 Super (Desktop), R7 2700X | NVIDIA Quadro M5000M Quadro M5000M, E3-1505M v5, Toshiba NVMe THNSN5256GPU7 | |
|---|---|---|---|---|---|---|
| SPECviewperf 12 | 222% | 145% | -16% | -27% | 39% | |
| 1900x1060 Solidworks (sw-03) (fps) | 77.1 | 139.6 81% | 77.1 0% | 78.4 2% | 70.8 -8% | 101 31% |
| 1900x1060 Siemens NX (snx-02) (fps) | 13.03 | 256.3 1867% | 206.8 1487% | 12.16 -7% | 12.26 -6% | 86.9 567% |
| 1900x1060 Showcase (showcase-01) (fps) | 237 | 191.6 -19% | 137 -42% | 175.6 -26% | 143.6 -39% | 44.14 -81% |
| 1900x1060 Medical (medical-01) (fps) | 80.9 | 87 8% | 79.6 -2% | 48.61 -40% | 45 -44% | 31.35 -61% |
| 1900x1060 Maya (maya-04) (fps) | 170 | 132.8 -22% | 79.7 -53% | 177.8 5% | 134.8 -21% | 69.6 -59% |
| 1900x1060 Energy (energy-01) (fps) | 24.81 | 28.12 13% | 19.78 -20% | 15.86 -36% | 13.09 -47% | 6.86 -72% |
| 1900x1060 Creo (creo-01) (fps) | 69.4 | 106.3 53% | 75.4 9% | 63.1 -9% | 52.7 -24% | 81.3 17% |
| 1900x1060 Catia (catia-04) (fps) | 132 | 178.1 35% | 100.3 -24% | 118.5 -10% | 104.2 -21% | 94.4 -28% |
| 1900x1060 3ds Max (3dsmax-05) (fps) | 329 | 268.2 -18% | 151.9 -54% | 258.1 -22% | 225.8 -31% | |
| SPECviewperf 13 | 206% | 132% | -15% | -27% | ||
| Solidworks (sw-04) (fps) | 108 | 132.9 23% | 82.1 -24% | 111.8 4% | 99.6 -8% | |
| Siemens NX (snx-03) (fps) | 23.62 | 462.4 1858% | 370.9 1470% | 21.99 -7% | 21.94 -7% | |
| Showcase (showcase-02) (fps) | 237 | 192 -19% | 136.8 -42% | 180.4 -24% | 144.5 -39% | |
| Medical (medical-02) (fps) | 102 | 89.3 -12% | 71.4 -30% | 82.1 -20% | 71.6 -30% | |
| Maya (maya-05) (fps) | 433 | 367.8 -15% | 236.5 -45% | 386.6 -11% | 328.7 -24% | |
| Energy (energy-02) (fps) | 44.36 | 51.9 17% | 32.46 -27% | 31.52 -29% | 23.78 -46% | |
| Creo (creo-02) (fps) | 328 | 307.6 -6% | 185.2 -44% | 286.5 -13% | 220.1 -33% | |
| Catia (catia-05) (fps) | 203 | 260.4 28% | 161.4 -20% | 178.8 -12% | 157.7 -22% | |
| 3ds Max (3dsmax-06) (fps) | 333 | 268.7 -19% | 153.4 -54% | 269.4 -19% | 227.8 -32% | |
| Total Average (Program / Settings) | 214% /
214% | 139% /
138% | -16% /
-15% | -27% /
-27% | 39% /
39% |
8K editing in DaVinci Resolve
Blackmagicdesign DaVinci Resolve has recently received an update (version 16.2.7) to support the latest Ampere GPUs, and NVIDIA provided us with an 8K REDCODE RAW project and a time-limited Resolve Studio license to evaluate the RTX 3090's performance in Resolve's Decode and Debayer functions and smooth 8K timeline scrolling while applying Motion Blur and Temporal Noise Reduction effects.
For this test, Resolve was set to use the RTX 3090's CUDA cores and GPU decode option for Decompression and Debayer. Temporal Noise Reduction was set by default to five frames and motion estimation was set to "Better". A Motion Blur value of 50 was applied. NVIDIA said that even an RTX 3080 will display an image processing error due to the limited amount of VRAM.
As you can see in our video below, this activity already uses up close to 16 GB of video memory and the card pulls about 280 W. Interestingly, GPU Boost seems to allow for a higher-than-rated boost up to 1,920 MHz with an overall temperature at about 71 °C.
Exporting the 17-second RAW clip took about 1:30 minutes and consumed nearly 18 GB of VRAM. In fact, playback of the exported 8K MP4 file also seemed to consume as much memory, albeit at a lower GPU usage of ~35%.
Game benchmarks
NVIDIA never really positioned the RTX 3090 as a gaming card. However, several gaming benchmarks of the RTX 3090 that have managed to leak over the past few days caused some consternation among gamers who were expecting a significant fps boost compared to the RTX 3080. In fact, NVIDIA has officially stated that the RTX 3090 can be expected to offer just about 10-15% more frames than the RTX 3080. While this is true, there is indeed benefit for gamers upgrading from a Titan RTX or even the RTX 2080 Ti, especially when gaming at 4k and above resolutions.
Those desirous of extracting every single frame from games should ideally pair the RTX 3090 with the Intel Comet Lake-S Core i9-10900K, especially at lower resolutions to minimize any bottlenecks. At resolutions above 1440p, the AMD system is pretty capable of helping you get the most out of the RTX 3090.
| Borderlands 3 | |
| 3840x2160 Badass Overall Quality (DX11) | |
| NVIDIA GeForce RTX 3090 | |
| NVIDIA Titan RTX | |
| NVIDIA GeForce RTX 2080 Ti (Desktop) | |
| NVIDIA Titan RTX | |
| NVIDIA GeForce RTX 2080 Super (Desktop) | |
| NVIDIA Titan X Pascal | |
| AMD Radeon RX 5700 XT (Desktop) | |
| 2560x1440 Badass Overall Quality (DX11) | |
| NVIDIA GeForce RTX 3090 | |
| NVIDIA Titan RTX | |
| NVIDIA Titan RTX | |
| NVIDIA GeForce RTX 2080 Ti (Desktop) | |
| NVIDIA GeForce RTX 2080 Super (Desktop) | |
| NVIDIA Titan X Pascal | |
| AMD Radeon RX 5700 XT (Desktop) | |
| 1920x1080 Badass Overall Quality (DX11) | |
| NVIDIA GeForce RTX 3090 | |
| NVIDIA Titan RTX | |
| NVIDIA Titan RTX | |
| NVIDIA GeForce RTX 2080 Ti (Desktop) | |
| NVIDIA GeForce RTX 2080 Super (Desktop) | |
| NVIDIA Titan X Pascal | |
| AMD Radeon RX 5700 XT (Desktop) | |
| 1920x1080 High Overall Quality (DX11) | |
| NVIDIA GeForce RTX 2080 Ti (Desktop) | |
| NVIDIA Titan RTX | |
| NVIDIA Titan RTX | |
| NVIDIA GeForce RTX 3090 | |
| NVIDIA GeForce RTX 2080 Super (Desktop) | |
| NVIDIA Titan X Pascal | |
| AMD Radeon RX 5700 XT (Desktop) | |
| Gears Tactics | |
| 3840x2160 Ultra Preset | |
| NVIDIA GeForce RTX 3090 | |
| NVIDIA Titan RTX | |
| NVIDIA GeForce RTX 2080 Super (Desktop) | |
| NVIDIA Titan X Pascal | |
| AMD Radeon RX 5700 XT (Desktop) | |
| 2560x1440 Ultra Preset | |
| NVIDIA GeForce RTX 3090 | |
| NVIDIA Titan RTX | |
| NVIDIA GeForce RTX 2080 Super (Desktop) | |
| NVIDIA Titan X Pascal | |
| AMD Radeon RX 5700 XT (Desktop) | |
| 1920x1080 Ultra Preset | |
| NVIDIA Titan RTX | |
| NVIDIA GeForce RTX 3090 | |
| NVIDIA GeForce RTX 2080 Super (Desktop) | |
| NVIDIA Titan X Pascal | |
| AMD Radeon RX 5700 XT (Desktop) | |
| 1920x1080 High Preset | |
| NVIDIA GeForce RTX 2080 Super (Desktop) | |
| NVIDIA Titan RTX | |
| NVIDIA GeForce RTX 3090 | |
| NVIDIA Titan X Pascal | |
| AMD Radeon RX 5700 XT (Desktop) | |
| Total War: Three Kingdoms | |
| 3840x2160 Ultra (incl textures) | |
| NVIDIA GeForce RTX 3090 | |
| NVIDIA Titan RTX | |
| NVIDIA GeForce RTX 2080 Super (Desktop) | |
| NVIDIA Titan X Pascal | |
| AMD Radeon RX 5700 XT (Desktop) | |
| 2560x1440 Ultra (incl textures) | |
| NVIDIA GeForce RTX 3090 | |
| NVIDIA Titan RTX | |
| NVIDIA GeForce RTX 2080 Super (Desktop) | |
| NVIDIA Titan X Pascal | |
| AMD Radeon RX 5700 XT (Desktop) | |
| 1920x1080 Ultra (incl textures) | |
| NVIDIA GeForce RTX 3090 | |
| NVIDIA Titan RTX | |
| NVIDIA GeForce RTX 2080 Super (Desktop) | |
| NVIDIA Titan X Pascal | |
| AMD Radeon RX 5700 XT (Desktop) | |
| 1920x1080 High (incl textures) | |
| NVIDIA GeForce RTX 3090 | |
| NVIDIA Titan RTX | |
| NVIDIA GeForce RTX 2080 Super (Desktop) | |
| NVIDIA Titan X Pascal | |
| AMD Radeon RX 5700 XT (Desktop) | |
| Death Stranding | |
| 3840x2160 Very High Preset | |
| NVIDIA GeForce RTX 3090 | |
| NVIDIA Titan RTX | |
| NVIDIA GeForce RTX 2080 Super (Desktop) | |
| NVIDIA Titan X Pascal | |
| AMD Radeon RX 5700 XT (Desktop) | |
| 2560x1440 Very High Preset | |
| NVIDIA Titan RTX | |
| NVIDIA GeForce RTX 3090 | |
| NVIDIA GeForce RTX 2080 Super (Desktop) | |
| NVIDIA Titan X Pascal | |
| AMD Radeon RX 5700 XT (Desktop) | |
| 1920x1080 Very High Preset | |
| NVIDIA GeForce RTX 3090 | |
| NVIDIA Titan RTX | |
| NVIDIA GeForce RTX 2080 Super (Desktop) | |
| AMD Radeon RX 5700 XT (Desktop) | |
| NVIDIA Titan X Pascal | |
| 1920x1080 Default Preset | |
| NVIDIA GeForce RTX 3090 | |
| NVIDIA Titan RTX | |
| NVIDIA GeForce RTX 2080 Super (Desktop) | |
| AMD Radeon RX 5700 XT (Desktop) | |
| NVIDIA Titan X Pascal | |
| Dirt Rally 2.0 | |
| 3840x2160 Ultra Preset AA:T AF:16x | |
| NVIDIA GeForce RTX 3090 | |
| 2560x1440 Ultra Preset AA:T AF:16x | |
| NVIDIA GeForce RTX 3090 | |
| 1920x1080 Ultra Preset AA:T AF:16x | |
| NVIDIA GeForce RTX 3090 | |
| 1920x1080 High Preset AA:T AF:8x | |
| NVIDIA GeForce RTX 3090 | |
| Shadow of the Tomb Raider | |
| 3840x2160 Highest Preset AA:T | |
| NVIDIA GeForce RTX 3090 | |
| NVIDIA Titan RTX | |
| NVIDIA Titan RTX | |
| NVIDIA Titan RTX | |
| NVIDIA Titan X Pascal | |
| 2560x1440 Highest Preset AA:T | |
| NVIDIA GeForce RTX 3090 | |
| NVIDIA Titan RTX | |
| NVIDIA Titan RTX | |
| 1920x1080 Highest Preset AA:T | |
| NVIDIA GeForce RTX 3090 | |
| NVIDIA GeForce RTX 3090 | |
| NVIDIA GeForce RTX 3090 | |
| NVIDIA Titan RTX | |
| NVIDIA Titan RTX | |
| NVIDIA Titan RTX | |
| AMD Radeon RX 5700 XT (Desktop) | |
| NVIDIA Titan X Pascal | |
| 1920x1080 High Preset AA:SM | |
| NVIDIA GeForce RTX 3090 | |
| NVIDIA GeForce RTX 3090 | |
| NVIDIA Titan RTX | |
| NVIDIA Titan RTX | |
| NVIDIA Titan RTX | |
| NVIDIA Titan X Pascal | |
| F1 2020 | |
| 3840x2160 Ultra High Preset AA:T AF:16x | |
| NVIDIA GeForce RTX 3090 | |
| NVIDIA Titan RTX | |
| NVIDIA GeForce RTX 2080 Super (Desktop) | |
| AMD Radeon RX 5700 XT (Desktop) | |
| NVIDIA Titan X Pascal | |
| 2560x1440 Ultra High Preset AA:T AF:16x | |
| NVIDIA GeForce RTX 3090 | |
| NVIDIA Titan RTX | |
| NVIDIA GeForce RTX 2080 Super (Desktop) | |
| AMD Radeon RX 5700 XT (Desktop) | |
| NVIDIA Titan X Pascal | |
| 1920x1080 Ultra High Preset AA:T AF:16x | |
| NVIDIA GeForce RTX 3090 | |
| NVIDIA Titan RTX | |
| NVIDIA GeForce RTX 2080 Super (Desktop) | |
| AMD Radeon RX 5700 XT (Desktop) | |
| NVIDIA Titan X Pascal | |
| 1920x1080 High Preset AA:T AF:16x | |
| NVIDIA Titan RTX | |
| NVIDIA GeForce RTX 3090 | |
| NVIDIA GeForce RTX 2080 Super (Desktop) | |
| AMD Radeon RX 5700 XT (Desktop) | |
| NVIDIA Titan X Pascal | |
| Doom Eternal | |
| 3840x2160 Ultra Preset | |
| NVIDIA GeForce RTX 3090 | |
| NVIDIA Titan RTX | |
| NVIDIA GeForce RTX 2080 Super (Desktop) | |
| AMD Radeon RX 5700 XT (Desktop) | |
| NVIDIA Titan X Pascal | |
| 2560x1440 Ultra Preset | |
| NVIDIA GeForce RTX 3090 | |
| NVIDIA Titan RTX | |
| NVIDIA GeForce RTX 2080 Super (Desktop) | |
| AMD Radeon RX 5700 XT (Desktop) | |
| NVIDIA Titan X Pascal | |
| 1920x1080 Ultra Preset | |
| NVIDIA GeForce RTX 3090 | |
| NVIDIA Titan RTX | |
| NVIDIA GeForce RTX 2080 Super (Desktop) | |
| NVIDIA Titan X Pascal | |
| AMD Radeon RX 5700 XT (Desktop) | |
| 1920x1080 High Preset | |
| NVIDIA GeForce RTX 3090 | |
| NVIDIA Titan RTX | |
| NVIDIA GeForce RTX 2080 Super (Desktop) | |
| NVIDIA Titan X Pascal | |
| AMD Radeon RX 5700 XT (Desktop) | |
| GRID 2019 | |
| 3840x2160 Ultra High Preset | |
| NVIDIA GeForce RTX 3090 | |
| NVIDIA Titan RTX | |
| NVIDIA GeForce RTX 2080 Super (Desktop) | |
| AMD Radeon RX 5700 XT (Desktop) | |
| NVIDIA Titan X Pascal | |
| 2560x1440 Ultra High Preset | |
| NVIDIA Titan RTX | |
| NVIDIA GeForce RTX 3090 | |
| NVIDIA GeForce RTX 2080 Super (Desktop) | |
| NVIDIA Titan X Pascal | |
| AMD Radeon RX 5700 XT (Desktop) | |
| 1920x1080 Ultra High Preset | |
| NVIDIA Titan RTX | |
| NVIDIA GeForce RTX 3090 | |
| NVIDIA GeForce RTX 2080 Super (Desktop) | |
| NVIDIA Titan X Pascal | |
| AMD Radeon RX 5700 XT (Desktop) | |
| 1920x1080 High Preset | |
| NVIDIA Titan RTX | |
| NVIDIA Titan X Pascal | |
| NVIDIA GeForce RTX 2080 Super (Desktop) | |
| AMD Radeon RX 5700 XT (Desktop) | |
| NVIDIA GeForce RTX 3090 | |
| Hitman 2 | |
| 3840x2160 Ultra AF:16x | |
| NVIDIA GeForce RTX 3090 | |
| NVIDIA Titan RTX | |
| NVIDIA Titan X Pascal | |
| 2560x1440 Ultra AF:16x | |
| NVIDIA GeForce RTX 3090 | |
| 1920x1080 Ultra AF:16x | |
| NVIDIA GeForce RTX 3090 | |
| NVIDIA Titan RTX | |
| NVIDIA Titan X Pascal | |
| 1920x1080 High AF:8x | |
| NVIDIA GeForce RTX 3090 | |
| NVIDIA Titan RTX | |
| NVIDIA Titan X Pascal | |
| Horizon Zero Dawn | |
| 3840x2160 Ultimate Quality | |
| NVIDIA GeForce RTX 3090 | |
| NVIDIA Titan RTX | |
| NVIDIA GeForce RTX 2080 Super (Desktop) | |
| AMD Radeon RX 5700 XT (Desktop) | |
| NVIDIA Titan X Pascal | |
| 2560x1440 Ultimate Quality | |
| NVIDIA GeForce RTX 3090 | |
| NVIDIA Titan RTX | |
| NVIDIA GeForce RTX 2080 Super (Desktop) | |
| AMD Radeon RX 5700 XT (Desktop) | |
| NVIDIA Titan X Pascal | |
| 1920x1080 Ultimate Quality | |
| NVIDIA GeForce RTX 3090 | |
| NVIDIA Titan RTX | |
| NVIDIA GeForce RTX 2080 Super (Desktop) | |
| AMD Radeon RX 5700 XT (Desktop) | |
| NVIDIA Titan X Pascal | |
| 1920x1080 Favor Quality | |
| NVIDIA GeForce RTX 3090 | |
| NVIDIA Titan RTX | |
| NVIDIA GeForce RTX 2080 Super (Desktop) | |
| AMD Radeon RX 5700 XT (Desktop) | |
| NVIDIA Titan X Pascal | |
| Anno 1800 | |
| 3840x2160 Ultra Graphics Quality (DX11) | |
| NVIDIA GeForce RTX 3090 | |
| NVIDIA GeForce RTX 2080 Ti (Desktop) | |
| 2560x1440 Ultra Graphics Quality (DX11) | |
| NVIDIA GeForce RTX 3090 | |
| NVIDIA GeForce RTX 2080 Ti (Desktop) | |
| 1920x1080 Ultra Graphics Quality (DX11) | |
| NVIDIA GeForce RTX 3090 | |
| AMD Radeon RX 5700 XT (Desktop) | |
| NVIDIA GeForce RTX 2080 Ti (Desktop) | |
| 1920x1080 High Graphics Quality (DX11) | |
| NVIDIA GeForce RTX 3090 | |
| NVIDIA GeForce RTX 2080 Ti (Desktop) | |
| Assassin´s Creed Odyssey | |
| 3840x2160 Ultra High Preset | |
| NVIDIA GeForce RTX 3090 | |
| NVIDIA Titan RTX | |
| NVIDIA Titan X Pascal | |
| 2560x1440 Ultra High Preset | |
| NVIDIA GeForce RTX 3090 | |
| 1920x1080 Ultra High Preset | |
| NVIDIA GeForce RTX 3090 | |
| NVIDIA Titan RTX | |
| NVIDIA Titan X Pascal | |
| 1920x1080 High Preset | |
| NVIDIA GeForce RTX 3090 | |
| NVIDIA Titan RTX | |
| NVIDIA Titan X Pascal | |
| Far Cry 5 | |
| 3840x2160 Ultra Preset AA:T | |
| NVIDIA GeForce RTX 3090 | |
| NVIDIA Titan RTX | |
| NVIDIA GeForce RTX 2080 Ti (Desktop) | |
| NVIDIA Titan RTX | |
| NVIDIA Titan RTX | |
| NVIDIA Titan X Pascal | |
| 2560x1440 Ultra Preset AA:T | |
| NVIDIA GeForce RTX 3090 | |
| NVIDIA GeForce RTX 2080 Ti (Desktop) | |
| NVIDIA Titan RTX | |
| NVIDIA Titan RTX | |
| 1920x1080 Ultra Preset AA:T | |
| NVIDIA GeForce RTX 2080 Ti (Desktop) | |
| NVIDIA GeForce RTX 3090 | |
| NVIDIA Titan RTX | |
| NVIDIA Titan RTX | |
| AMD Radeon RX 5700 XT (Desktop) | |
| NVIDIA Titan RTX | |
| NVIDIA Titan X Pascal | |
| 1920x1080 High Preset AA:T | |
| NVIDIA GeForce RTX 2080 Ti (Desktop) | |
| NVIDIA GeForce RTX 3090 | |
| NVIDIA Titan RTX | |
| NVIDIA Titan RTX | |
| NVIDIA Titan RTX | |
| NVIDIA Titan X Pascal | |
| Far Cry New Dawn | |
| 3840x2160 Ultra Preset | |
| NVIDIA GeForce RTX 3090 | |
| NVIDIA Titan RTX | |
| NVIDIA GeForce RTX 2080 Ti (Desktop) | |
| NVIDIA Titan RTX | |
| 2560x1440 Ultra Preset | |
| NVIDIA GeForce RTX 3090 | |
| NVIDIA GeForce RTX 2080 Ti (Desktop) | |
| NVIDIA Titan RTX | |
| NVIDIA Titan RTX | |
| 1920x1080 Ultra Preset | |
| NVIDIA GeForce RTX 3090 | |
| NVIDIA Titan RTX | |
| AMD Radeon RX 5700 XT (Desktop) | |
| NVIDIA GeForce RTX 2080 Ti (Desktop) | |
| NVIDIA Titan RTX | |
| 1920x1080 High Preset | |
| NVIDIA GeForce RTX 3090 | |
| NVIDIA Titan RTX | |
| NVIDIA GeForce RTX 2080 Ti (Desktop) | |
| NVIDIA Titan RTX | |
| Call of Duty Modern Warfare 2019 | |
| 3840x2160 Maximum Settings with Raytracing AA:T2X Filmic SM | |
| NVIDIA GeForce RTX 3090 | |
| NVIDIA Titan RTX | |
| NVIDIA GeForce RTX 2080 Super (Desktop) | |
| NVIDIA Titan X Pascal | |
| 1920x1080 Maximum Settings with Raytracing AA:T2X Filmic SM | |
| NVIDIA Titan RTX | |
| NVIDIA GeForce RTX 3090 | |
| NVIDIA GeForce RTX 2080 Super (Desktop) | |
| NVIDIA Titan X Pascal | |
| 3840x2160 Maximum Settings AA:T2X Filmic SM | |
| NVIDIA GeForce RTX 3090 | |
| NVIDIA Titan RTX | |
| NVIDIA GeForce RTX 2080 Super (Desktop) | |
| NVIDIA Titan X Pascal | |
| AMD Radeon RX 5700 XT (Desktop) | |
| 2560x1440 Maximum Settings AA:T2X Filmic SM | |
| NVIDIA GeForce RTX 3090 | |
| NVIDIA Titan RTX | |
| NVIDIA GeForce RTX 2080 Super (Desktop) | |
| NVIDIA Titan X Pascal | |
| AMD Radeon RX 5700 XT (Desktop) | |
| 1920x1080 Maximum Settings AA:T2X Filmic SM | |
| NVIDIA Titan RTX | |
| NVIDIA GeForce RTX 3090 | |
| NVIDIA GeForce RTX 2080 Super (Desktop) | |
| NVIDIA Titan X Pascal | |
| AMD Radeon RX 5700 XT (Desktop) | |
| 1920x1080 High Settings AA:1X SM | |
| NVIDIA Titan RTX | |
| NVIDIA GeForce RTX 3090 | |
| NVIDIA GeForce RTX 2080 Super (Desktop) | |
| NVIDIA Titan X Pascal | |
| AMD Radeon RX 5700 XT (Desktop) | |
| The Division 2 | |
| 3840x2160 Ultra Preset | |
| NVIDIA GeForce RTX 3090 | |
| NVIDIA GeForce RTX 2080 Ti (Desktop) | |
| 2560x1440 Ultra Preset | |
| NVIDIA GeForce RTX 3090 | |
| NVIDIA GeForce RTX 2080 Ti (Desktop) | |
| 1920x1080 Ultra Preset | |
| NVIDIA GeForce RTX 3090 | |
| NVIDIA GeForce RTX 2080 Ti (Desktop) | |
| 1920x1080 High Preset | |
| NVIDIA GeForce RTX 3090 | |
| NVIDIA GeForce RTX 2080 Ti (Desktop) | |
| Battlefield V | |
| 1920x1080 Ultra Preset DXR | |
| NVIDIA GeForce RTX 3090 | |
| 3840x2160 Ultra Preset | |
| NVIDIA GeForce RTX 3090 | |
| NVIDIA GeForce RTX 3090 | |
| NVIDIA Titan RTX | |
| NVIDIA Titan X Pascal | |
| 2560x1440 Ultra Preset | |
| NVIDIA GeForce RTX 3090 | |
| 1920x1080 Ultra Preset | |
| NVIDIA GeForce RTX 3090 | |
| NVIDIA Titan RTX | |
| NVIDIA Titan X Pascal | |
| 1920x1080 High Preset | |
| NVIDIA GeForce RTX 3090 | |
| NVIDIA Titan RTX | |
| NVIDIA Titan X Pascal | |
| Star Wars Jedi Fallen Order | |
| 3840x2160 Epic Preset | |
| NVIDIA GeForce RTX 3090 | |
| NVIDIA Titan RTX | |
| NVIDIA GeForce RTX 2080 Ti (Desktop) | |
| NVIDIA GeForce RTX 2080 Super (Desktop) | |
| NVIDIA Titan X Pascal | |
| AMD Radeon RX 5700 XT (Desktop) | |
| 2560x1440 Epic Preset | |
| NVIDIA Titan RTX | |
| NVIDIA GeForce RTX 2080 Super (Desktop) | |
| NVIDIA GeForce RTX 2080 Ti (Desktop) | |
| NVIDIA GeForce RTX 3090 | |
| NVIDIA Titan X Pascal | |
| AMD Radeon RX 5700 XT (Desktop) | |
| 1920x1080 Epic Preset | |
| NVIDIA Titan RTX | |
| NVIDIA GeForce RTX 2080 Super (Desktop) | |
| NVIDIA Titan X Pascal | |
| AMD Radeon RX 5700 XT (Desktop) | |
| NVIDIA GeForce RTX 2080 Ti (Desktop) | |
| NVIDIA GeForce RTX 3090 | |
| 1920x1080 High Preset | |
| NVIDIA Titan RTX | |
| NVIDIA GeForce RTX 2080 Super (Desktop) | |
| NVIDIA Titan X Pascal | |
| AMD Radeon RX 5700 XT (Desktop) | |
| NVIDIA GeForce RTX 2080 Ti (Desktop) | |
| NVIDIA GeForce RTX 3090 | |
| Red Dead Redemption 2 | |
| 3840x2160 Maximum Settings | |
| NVIDIA GeForce RTX 3090 | |
| NVIDIA GeForce RTX 2080 Ti (Desktop) | |
| NVIDIA Titan RTX | |
| NVIDIA GeForce RTX 2080 Super (Desktop) | |
| AMD Radeon RX 5700 XT (Desktop) | |
| NVIDIA Titan X Pascal | |
| 2560x1440 Maximum Settings | |
| NVIDIA GeForce RTX 3090 | |
| NVIDIA Titan RTX | |
| NVIDIA GeForce RTX 2080 Ti (Desktop) | |
| NVIDIA GeForce RTX 2080 Super (Desktop) | |
| AMD Radeon RX 5700 XT (Desktop) | |
| NVIDIA Titan X Pascal | |
| 1920x1080 Maximum Settings | |
| NVIDIA GeForce RTX 3090 | |
| NVIDIA Titan RTX | |
| NVIDIA GeForce RTX 2080 Ti (Desktop) | |
| NVIDIA GeForce RTX 2080 Super (Desktop) | |
| AMD Radeon RX 5700 XT (Desktop) | |
| NVIDIA Titan X Pascal | |
| 1920x1080 High Settings | |
| NVIDIA GeForce RTX 3090 | |
| NVIDIA Titan RTX | |
| NVIDIA GeForce RTX 2080 Ti (Desktop) | |
| NVIDIA GeForce RTX 2080 Super (Desktop) | |
| AMD Radeon RX 5700 XT (Desktop) | |
| NVIDIA Titan X Pascal | |
| GTA V | |
| 3840x2160 High/On (Advanced Graphics Off) AA:FX AF:8x | |
| NVIDIA GeForce RTX 3090 | |
| NVIDIA Titan RTX | |
| NVIDIA Titan X Pascal | |
| 3840x2160 Highest AA:4xMSAA + FX AF:16x | |
| NVIDIA GeForce RTX 3090 | |
| 2560x1440 Highest AA:4xMSAA + FX AF:16x | |
| NVIDIA GeForce RTX 3090 | |
| 1920x1080 Highest AA:4xMSAA + FX AF:16x | |
| NVIDIA Titan RTX | |
| NVIDIA Titan X Pascal | |
| NVIDIA GeForce RTX 3090 | |
| 1920x1080 High/On (Advanced Graphics Off) AA:2xMSAA + FX AF:8x | |
| NVIDIA GeForce RTX 3090 | |
| NVIDIA Titan RTX | |
| NVIDIA Titan X Pascal | |
| Metro Exodus | |
| 1920x1080 Ultra Quality DXR AF:16x | |
| NVIDIA Titan RTX | |
| NVIDIA GeForce RTX 3090 | |
| NVIDIA Titan RTX | |
| NVIDIA GeForce RTX 2080 Ti (Desktop) | |
| 3840x2160 Ultra Quality AF:16x | |
| NVIDIA GeForce RTX 3090 | |
| NVIDIA Titan RTX | |
| NVIDIA Titan RTX | |
| NVIDIA GeForce RTX 2080 Ti (Desktop) | |
| 2560x1440 Ultra Quality AF:16x | |
| NVIDIA GeForce RTX 3090 | |
| NVIDIA Titan RTX | |
| NVIDIA Titan RTX | |
| NVIDIA GeForce RTX 2080 Ti (Desktop) | |
| 1920x1080 Ultra Quality AF:16x | |
| NVIDIA GeForce RTX 3090 | |
| NVIDIA Titan RTX | |
| NVIDIA Titan RTX | |
| NVIDIA GeForce RTX 2080 Ti (Desktop) | |
| 1920x1080 High Quality AF:16x | |
| NVIDIA GeForce RTX 3090 | |
| NVIDIA Titan RTX | |
| NVIDIA Titan RTX | |
| NVIDIA GeForce RTX 2080 Ti (Desktop) | |
| Forza Horizon 4 | |
| 3840x2160 Ultra Preset AA:2xMS | |
| NVIDIA GeForce RTX 3090 | |
| NVIDIA Titan RTX | |
| NVIDIA Titan RTX | |
| NVIDIA GeForce RTX 2080 Ti (Desktop) | |
| NVIDIA Titan RTX | |
| NVIDIA Titan X Pascal | |
| 2560x1440 Ultra Preset AA:2xMS | |
| NVIDIA GeForce RTX 3090 | |
| NVIDIA Titan RTX | |
| NVIDIA Titan RTX | |
| NVIDIA GeForce RTX 2080 Ti (Desktop) | |
| 1920x1080 Ultra Preset AA:2xMS | |
| NVIDIA Titan RTX | |
| NVIDIA GeForce RTX 2080 Ti (Desktop) | |
| NVIDIA GeForce RTX 3090 | |
| NVIDIA Titan RTX | |
| AMD Radeon RX 5700 XT (Desktop) | |
| NVIDIA Titan RTX | |
| NVIDIA Titan X Pascal | |
| 1920x1080 High Preset AA:2xMS | |
| NVIDIA Titan RTX | |
| NVIDIA GeForce RTX 2080 Ti (Desktop) | |
| NVIDIA GeForce RTX 3090 | |
| NVIDIA Titan RTX | |
| NVIDIA Titan RTX | |
| NVIDIA Titan X Pascal | |
| Control | |
| 1920x1080 High Quality Preset & High Ray Tracing Preset (DX12) | |
| NVIDIA GeForce RTX 3090 | |
| NVIDIA GeForce RTX 2080 Ti (Desktop) | |
| NVIDIA GeForce RTX 2080 Super (Desktop) | |
| NVIDIA Titan X Pascal | |
| 3840x2160 High Quality Preset | |
| NVIDIA GeForce RTX 3090 | |
| NVIDIA GeForce RTX 2080 Ti (Desktop) | |
| NVIDIA GeForce RTX 2080 Super (Desktop) | |
| AMD Radeon RX 5700 XT (Desktop) | |
| NVIDIA Titan X Pascal | |
| 2560x1440 High Quality Preset | |
| NVIDIA GeForce RTX 3090 | |
| NVIDIA GeForce RTX 2080 Ti (Desktop) | |
| NVIDIA GeForce RTX 2080 Super (Desktop) | |
| NVIDIA Titan X Pascal | |
| AMD Radeon RX 5700 XT (Desktop) | |
| 1920x1080 High Quality Preset | |
| NVIDIA GeForce RTX 3090 | |
| NVIDIA GeForce RTX 2080 Ti (Desktop) | |
| NVIDIA GeForce RTX 2080 Super (Desktop) | |
| AMD Radeon RX 5700 XT (Desktop) | |
| NVIDIA Titan X Pascal | |
| low | med. | high | ultra | QHD | 4K | |
|---|---|---|---|---|---|---|
| GTA V (2015) | 165 | 104 | 99.3 | 152 | ||
| Far Cry 5 (2018) | 139 | 129 | 121 | 120 | 101 | |
| Shadow of the Tomb Raider (2018) | 148 | 148 | 145 | 137 | 89.3 | |
| Forza Horizon 4 (2018) | 175 | 175 | 166 | 164 | 147 | |
| Assassin´s Creed Odyssey (2018) | 138 | 121 | 92 | 82 | 65 | |
| Hitman 2 (2018) | 102 | 93.6 | 95.1 | 91.4 | 91.2 | |
| Battlefield V (2018) | 184 | 188 | 187 | 178 | 130 | |
| Far Cry New Dawn (2019) | 122 | 115 | 104 | 102 | 92 | |
| Metro Exodus (2019) | 139 | 123 | 108 | 102 | 71.7 | |
| Dirt Rally 2.0 (2019) | 171 | 166 | 150 | 137 | 93 | |
| The Division 2 (2019) | 183 | 157 | 140 | 120 | 71.9 | |
| Anno 1800 (2019) | 116 | 87.7 | 51.5 | 53 | 53.2 | |
| Total War: Three Kingdoms (2019) | 172.7 | 135.5 | 123.5 | 100 | 51.4 | |
| Control (2019) | 223 | 174 | 118 | 61.8 | ||
| Borderlands 3 (2019) | 134 | 124 | 117 | 109 | 71.5 | |
| GRID 2019 (2019) | 178 | 116 | 129 | 106 | 91.2 | |
| Call of Duty Modern Warfare 2019 (2019) | 177 | 169 | 169 | 149 | 96.4 | |
| Star Wars Jedi Fallen Order (2019) | 104 | 100 | 97.4 | 101 | 87.1 | |
| Red Dead Redemption 2 (2019) | 152 | 143 | 110 | 91.9 | 61.9 | |
| Doom Eternal (2020) | 393 | 330 | 282 | 271 | 182 | |
| Gears Tactics (2020) | 206.4 | 144.9 | 123 | 121.8 | 74.5 | |
| F1 2020 (2020) | 248 | 245 | 227 | 204 | 133 | |
| Death Stranding (2020) | 184 | 178 | 173 | 107 | 164 | |
| Horizon Zero Dawn (2020) | 158 | 147 | 138 | 126 | 82 |
8K gaming
Even as 4K gaming is yet to fully become mainstream, NVIDIA is already pitching the RTX 3090 as a card that can ably game at 8K. Not only gaming in 8K, but the RTX 3090 can also simultaneously capture 8K 30 fps video for playback or broadcasting. Ampere GPUs come with a hardware decoder for the new AV1 codec, which should help in more efficient encoding/decoding of 8K streams that use less bandwidth locally or on social media such as YouTube. Do note that there are only a handful of 8K TVs currently available, and you would also need an HDMI 2.1 cable that can handle all the bandwidth.
NVIDIA recommends an Intel Core i9-9900K, 64 GB DDR4-3200 RAM, an NVMe SSD, and an 850 W, 80 Plus Gold PSU as the minimum spec required for playing games in 8K using the RTX 3090. On the TV side, currently supported models include the LG Nano099, Nano098, Nano097, and Nano095 series, Samsung Q900T and Q800T series (firmware updates coming soon), and Sony Master Series Z9H.
Our setup uses a OnePlus 55U1 4K HDR TV. In order to test how the RTX 3090 would fare in 8K benchmarks, we used NVIDIA's Dynamic Super Resolution (DSR) feature to enable 8K processing on the GPU. The default 8K resolution is considered to be 7680x4320 in the 16:9 aspect ratio that yields 33.18 million pixels. However, the OnePlus 55U1 offered a resolution of 8192x4320 in a 256:135 aspect ratio, which yields about 35.39 million pixels.
Gameplay was recorded using the latest NVIDIA ShadowPlay software that comes with GeForce Experience Beta v3.20.5. The latest GeForce Experience Beta also adds new performance monitoring and GPU tuning tools almost negating the need for third-party software for overclocking.
Essentially, we are pushing 2.21 million pixels more than the spec. The Zotac RTX 3090 Trinity could sail through most tests without so much as a hiccup as you can see below.
Not all games will be able to render natively at 8K without stress, though. NVIDIA is pushing DLSS 2.0 as the means of achieving a stable 8K 30 or sometimes, even 8K 60 fps gaming. We will discuss more about DLSS 2.0 in a dedicated article soon. In short, DLSS renders the scene on the GPU at a lower resolution but uses AI to upscale it without noticeable quality loss to the native resolution of the display.
We were provided with private beta access for Control, Death Stranding, and Wolfenstein: Youngblood that allow for using the new DLSS 2.0 Ultra Performance mode. Doom Eternal and Forza Horizon 4 were run at native 8K (DSR) resolutions as they don't feature DLSS support yet. One thing we would like to note here is that although NVIDIA recommended HDR to be enabled, we had issues in enabling HDR mode in Windows on the OnePlus 55U1. Therefore, the gameplay was recorded with HDR off.
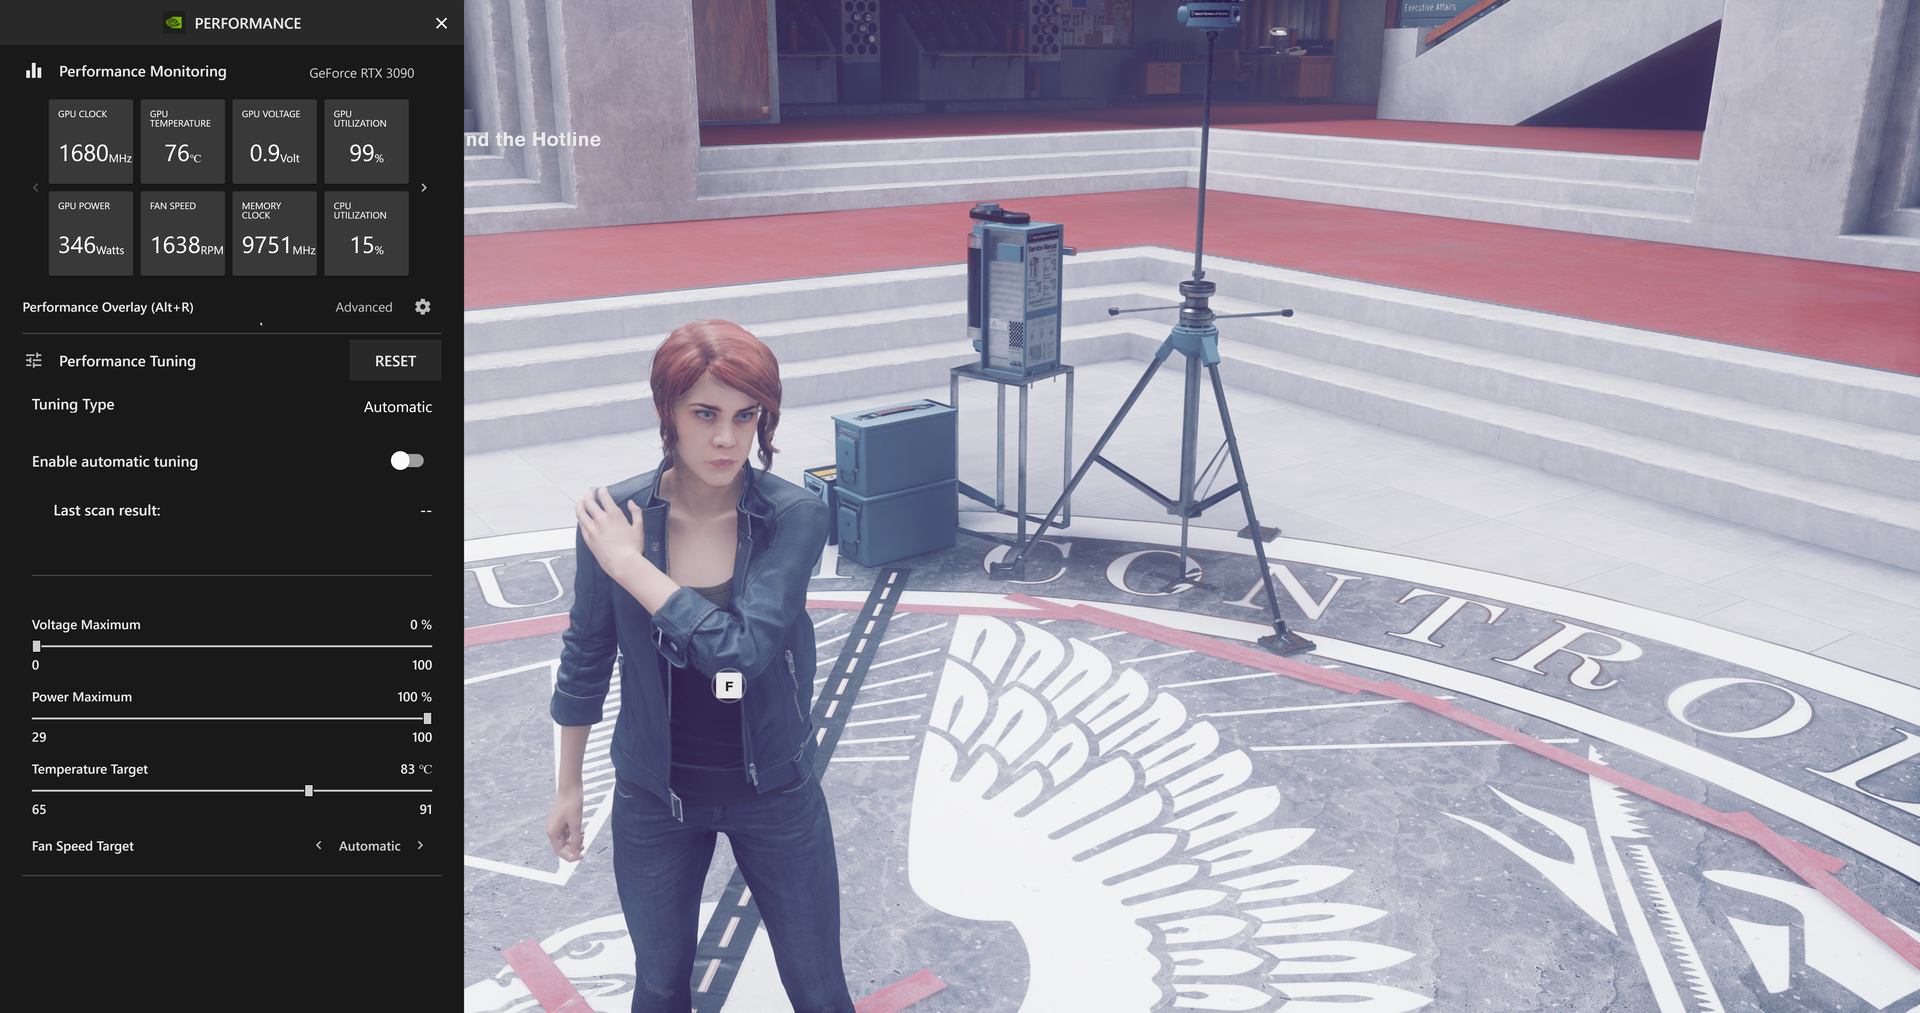
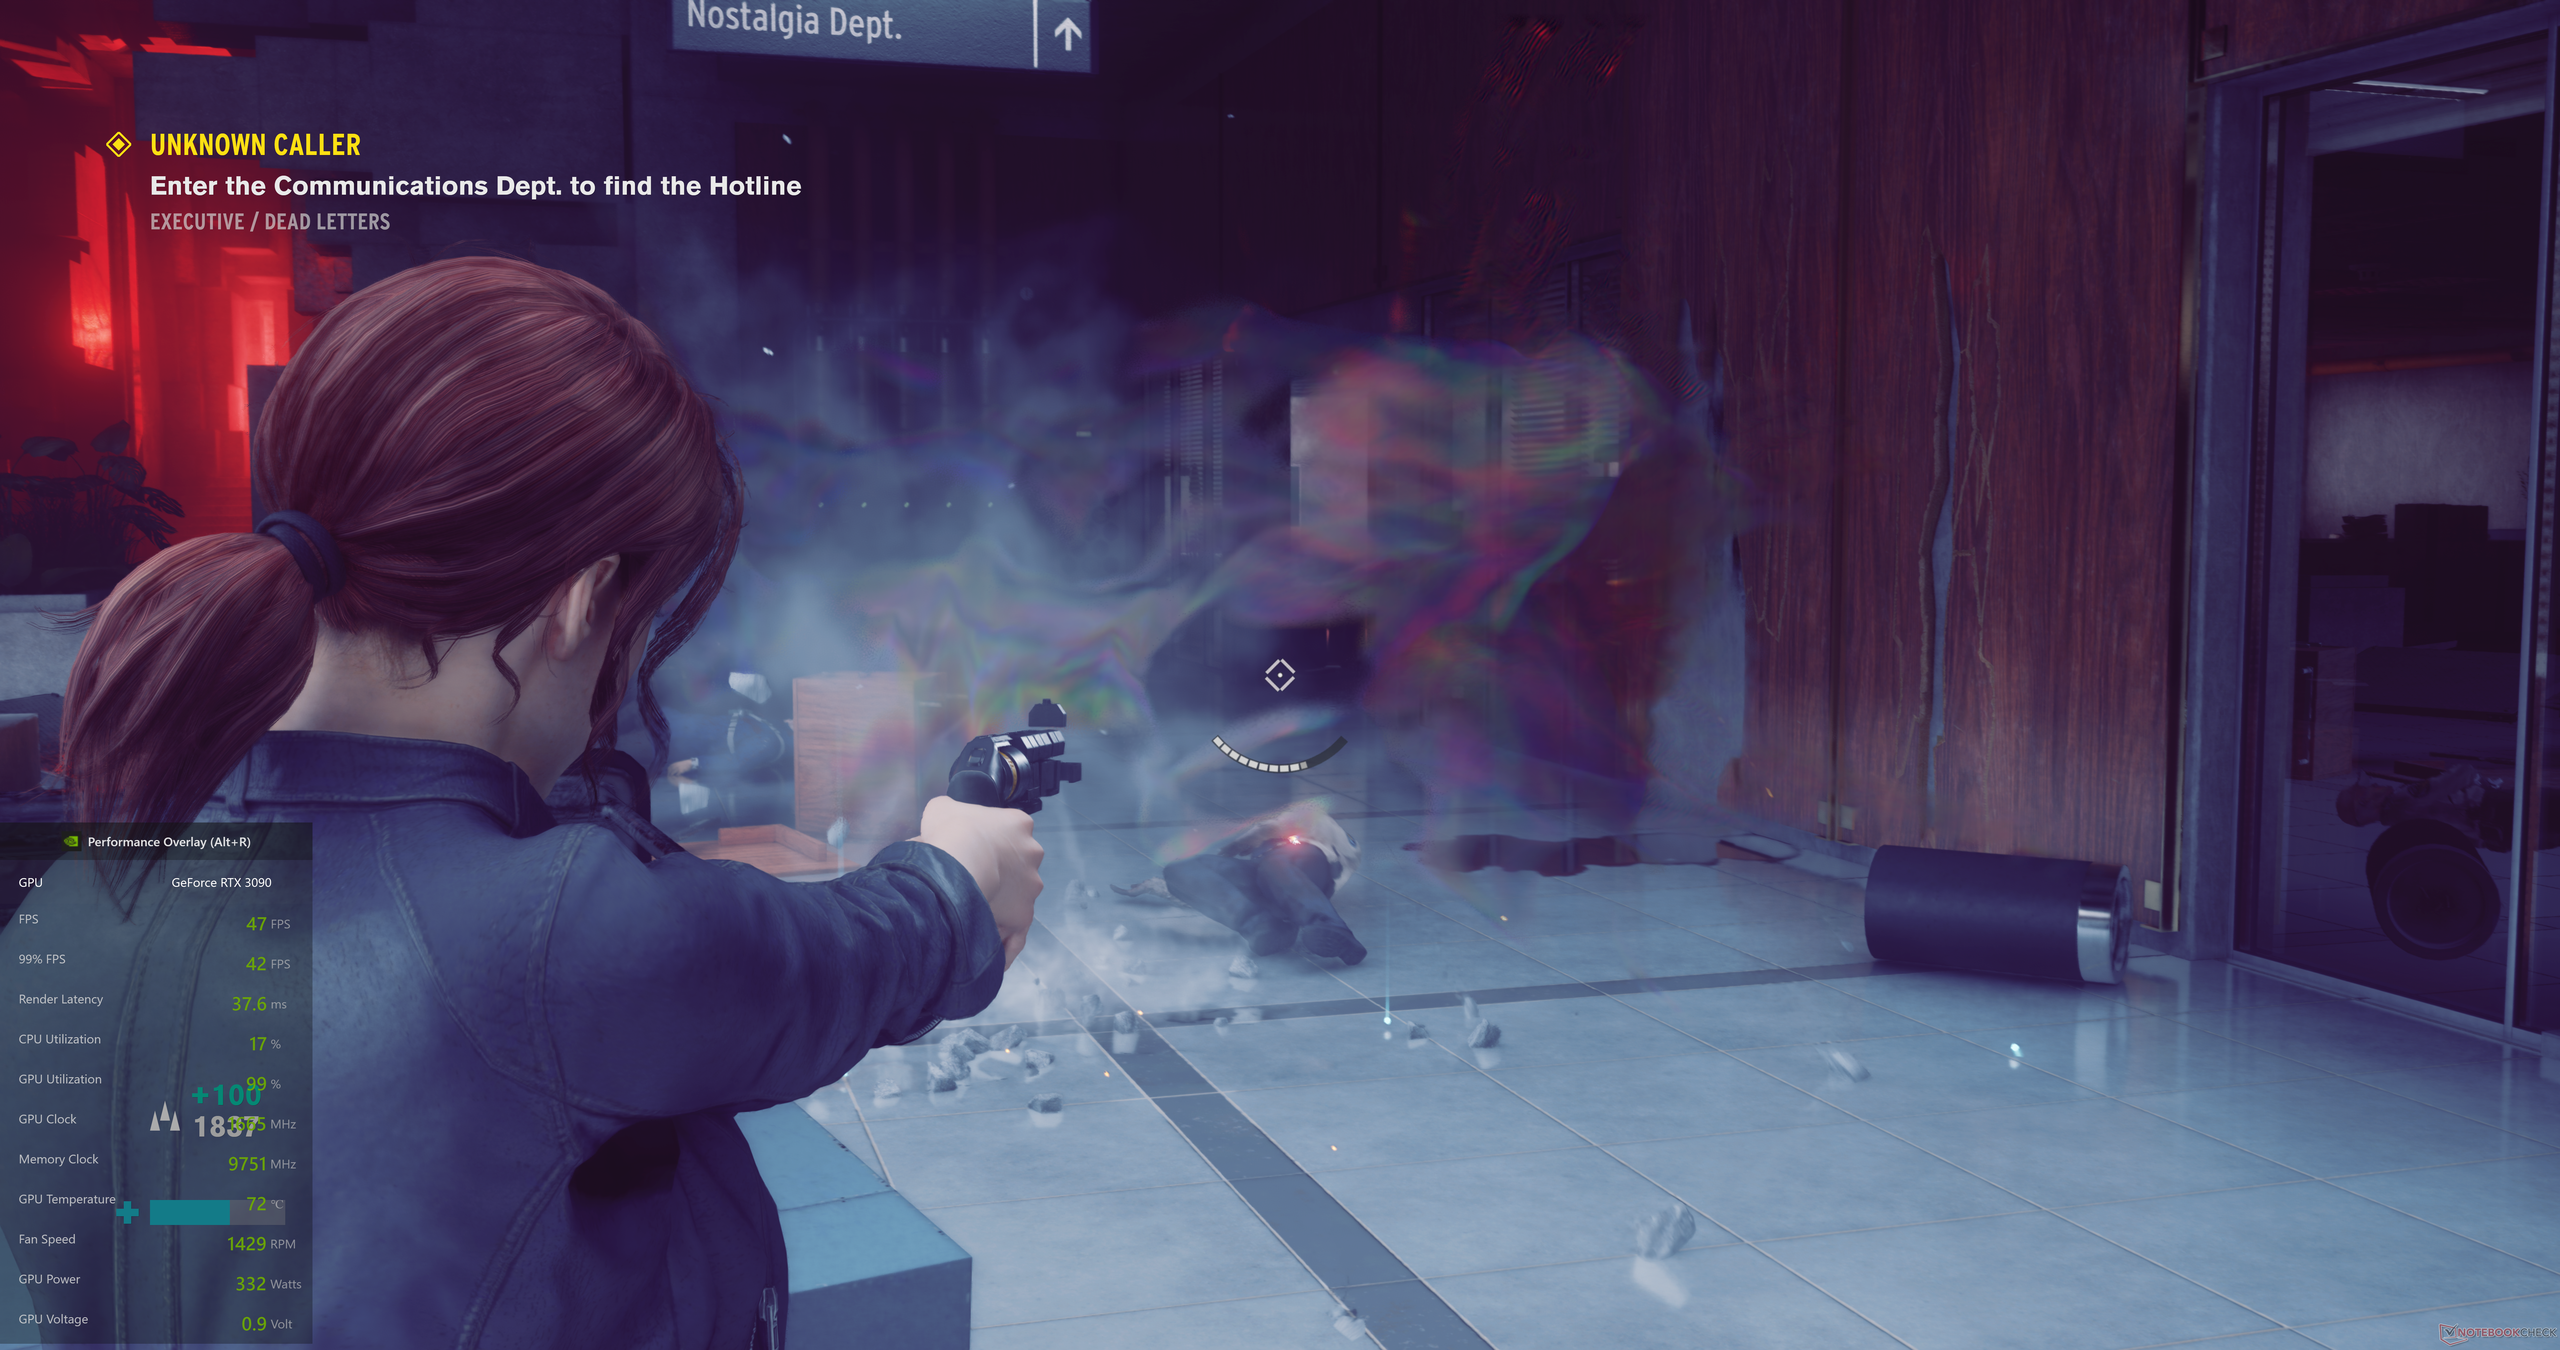
Control 8K with DLSS and RTX on
Control has been a strong proponent of RTX and DLSS features in the Turing generation and with Ampere those features have received a shot in the arm. We tested Control at 8K resolution using a 1440p render resolution with DLSS enabled and Ray Tracing preset set to High. Gameplay was recorded using the latest ShadowPlay beta version at 8K 30 fps with a 100 Mbps bitrate.
One issue we observed with the current ShadowPlay beta is that it does not record the new GeForce Experience performance overlay along with the video. Therefore, we had to use an alternative such as the FPS counter in the Xbox Game Bar to show system stats. However, we did take screencaps to give you an idea of GPU parameters during gameplay.
As you can see below, the character model is extremely detailed at 8K and we were able to achieve close to 50 fps with a lot of action in the scene. The processing is definitely power-intensive and the RTX 3090 almost hits its power limit of 350 W during the run. We also observed a VRAM usage of about 13 GB. Check out the gameplay video below.
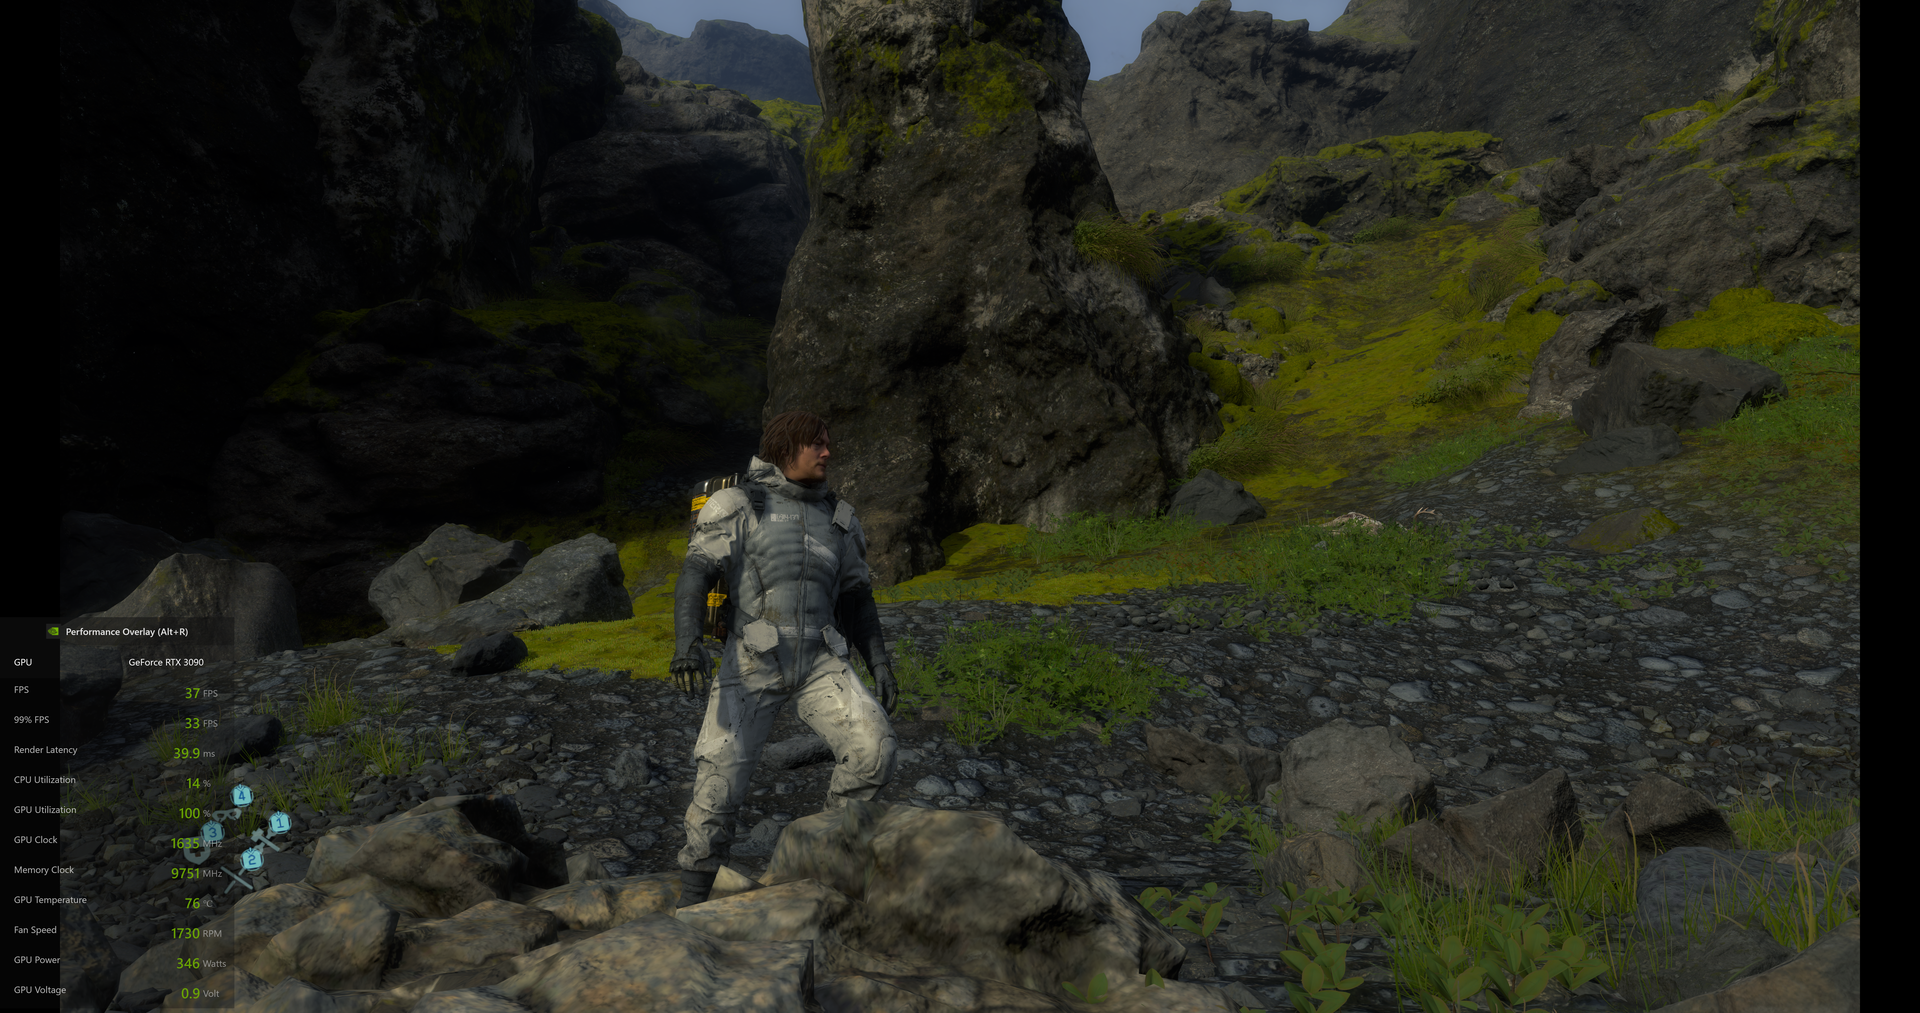
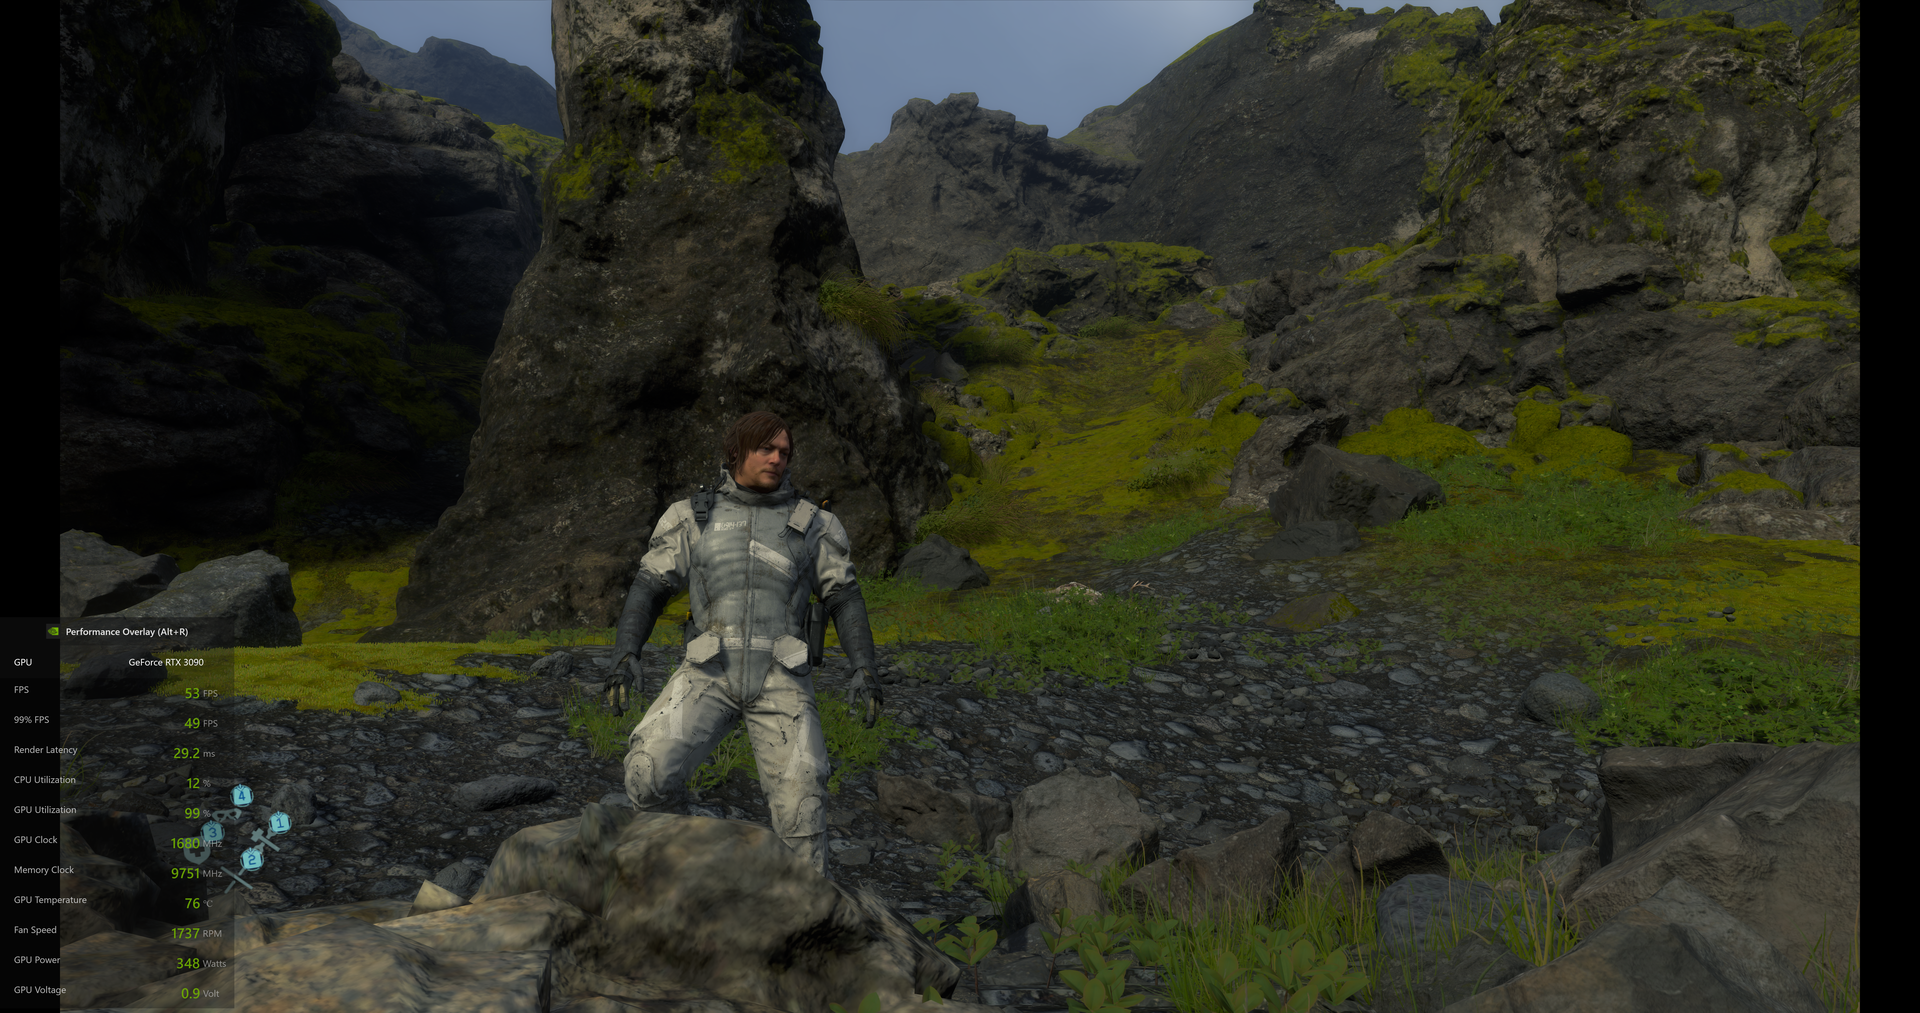
Death Stranding 8K with DLSS
Death Stranding benefits a lot from DLSS and looks gorgeous in 8K. Without DLSS on, we could hit about 37 fps in 8K DSR. That value goes up to a wonderful 70 fps when DLSS is enabled in Ultra Performance mode. We did notice that some of the rock textures had a bland surface. Initially we thought this was a DLSS issue, but the same was seen in native 4K without DLSS as well. Gameplay video is embedded below. Do note that the soundtrack has been muted to avoid potential copyright claims.
Wolfenstein: Youngblood 4K native with DLSS and RTX On
Wolfenstein: Youngblood introduced support for RTX features back during CES this year. We tried running the game at 8K DSR, but it didn't allow us to bump the resolution beyond 4K. Nevertheless, we could achieve up to 200 fps at native 4K with RTX and DLSS Ultra Performance mode enabled.
Doom Eternal native 8K DSR
One of the first games that NVIDIA showcased during the RTX 3080 launch was Doom Eternal. We've already seen in the gaming comparison above how the RTX 3090 offers excellent performance in this game at 4K Ultra Preset. We ran Doom Eternal at 8K DSR in the Ultra Preset with Resolution Scaling disabled and system stats set to Ultra Nightmare. Though the game does manage to hit 60 fps at times, the sweet spot lied between 47 and 55 fps depending on the action in the scene.
Forza Horizon 4 8K DSR
Forza Horizon 4 offered an immersive experience while playing at 8K High settings. We ran the integrated benchmark and found that the RTX 3090 Trinity could achieve a 64 fps average, which is really good. Even at High settings, the graphics were spectacular and minor details such the shape of water on the car, people on the sidewalks, foliage, and other elements had an extreme level of detail.
Emissions
We could only do some limited testing of temperatures and power draws of the card and most of them were in-game or compute workload observations. Despite not using the new Founders Edition cooler design, Zotac's triple-fan IceStorm 2.0 implementation has been really good so far. The fans stop completely when in idle and start ramping up only after about 57 °C in the default fan profile. The card is set to thermally throttle once it hits 83 °C. During most of our benchmarking, the RTX 3090 Trinity stayed well within the 80 °C mark even under full load. The GPU does draw the full 350 W power, but it is power well-spent given its capabilities. We look forward to further testing the thermals and overclocking abilities of the RTX 3090 in a future article.
Verdict
NVIDIA has managed to garner a lot of success with the Ampere launch given by how fast the first batch of cards were sold out within moments of availability. Though the company is pitching the RTX 3080 as the flagship gaming GPU, the real monster is the RTX 3090. With a drool-worthy specsheet and performance that shows good improvements across the board compared to the Titan RTX in synthetic and gaming tests, the RTX 3090 does seem compelling. But is it for everyone?
Even according to NVIDIA, the RTX 3090 is primarily aimed at demanding content creators who can make good use of all the available 24 GB VRAM. That being said, we did find some regression in performance in industry apps as measured by SPECviewperf. Whether that situation will improve with future drivers is something to watch out for. NVIDIA has not yet made the Quadro lineup official, but the RTX 3090 surely looks to offer a decent and cheaper alternative at the moment if previous pricing trends are to go by.
Creators who need to work on 8K assets will find the NVIDIA GeForce RTX 3090 an excellent companion. So will those who like their PCs to churn out the maximum possible frames at 4K High or Ultra settings. Mainstream regular gamers are best served elsewhere.
It looks like we have hit a performance ceiling with a majority of the current game engines. Our RTX 3080 review is on the way, but some of the already published numbers seem to suggest gamers are best served with the RTX 3080 when it comes to getting a better performance per dollar. That being said, with the RTX 3090, you are getting a card that can do proper 8K gaming without much fuss at the same cost as an RTX 2080 Ti at launch. Gamers who are also desirous of pushing high frame rates at 4K High or even Ultra settings may find an investment in the RTX 3090 worth the upfront cost. The recent rumors pointing to the likely availability of a 20 GB RTX 3080 version indicate that more VRAM is a definitive spec for GPUs going forward.
Our Zotac Gaming GeForce RTX 3090 Trinity unit performed admirably in all the tests without breaking a sweat. The cooling is excellent and the fans aren't too loud even under load. There are a few things that Zotac can rectify such as offering the power connector at a more accessible location and using a sturdier backplate. Otherwise, the card looks great and is actually a space saver compared to the Founders Edition's 3-slot design. We feel that the Zotac RTX 3090 Trinity can be considered as a good prospect if you decide to eventually bite the bullet and get the RTX 3090.
All in all, it seems that NVIDIA has set the bar high once again with the GeForce RTX 3090. AMD's plans with RDNA2 are still elusive save for a sneak peek at one of the cards last week, and the company will need to pull a rabbit out of the magic hat if it has any plans of taking the RTX 3090 head on.
Price comparison
