Notebookcheck Logo

NVIDIA GeForce RTX 3080 Ti Founders Edition Review: RTX 3090 performance for less but still a low value proposition

Ti(e)-ing with the 3090. The NVIDIA GeForce RTX 3080 Ti arrives as a mid-cycle refresh to supplant the RTX 3080 as the company's fastest gaming GPU nine months after the company first introduced the Ampere architecture. The RTX 3080 Ti sports a slightly cut-down variant of the GA102 GPU that is found in the RTX 3090 with half the VRAM. We take the RTX 3080 Ti FE for a test drive and evaluate how this US$1,199 card stacks up against the RTX 3080 and the AMD Radeon RX 6900 XT.

NVIDIA launched the GeForce RTX 3080 Ti during Computex 2021 last month alongside the RTX 3070 Ti. The RTX 3080 Ti is a slightly cut-down version of the "BFGPU" RTX 3090 and is more of a mid-cycle refresh than anything revolutionary. Essentially, we are looking at a better binned Ampere GA102 chip than the RTX 3080.

The RTX 3080 Ti now supplants the RTX 3080 as NVIDIA's flagship gaming GPU. It arrives at a time when GPU availability is still a concern with most cards selling out quickly and at a significant markup above MSRP. The RTX 3080 Ti can also be viewed as NVIDIA's riposte to a resurgent AMD, which seems to have got its mojo back with the launch of RDNA 2-based GPUs. The Radeon RX 6900 XT comes within striking distance of the RTX 3090 in several titles, meaning gamers need not look up to NVIDIA alone for a flagship gaming experience as long as ray-tracing performance is not the main purchasing criterion. 

Though positioned between the RTX 3080 and the RTX 3090, the RTX 3080 Ti leans more towards RTX 3090-levels of performance and is priced at a US$1,199 MSRP to match. While this is US$300 less than that of the RTX 3090's MSRP (US$1,499), it is also US$500 dearer than the RTX 3080 (US$699). In India, the RTX 3080 Ti Founders Edition (FE) retails for ₹1,22,000.

In this review, we put the RTX 3080 Ti Founders Edition through its paces and see how well this mid-cycle refresh augurs for gamers looking to purchase a new GPU.

Comparison of the RTX 3080 Ti with other NVIDIA GPUs

Specification RTX 3090 FE RTX 3080 Ti FE RTX 3080 FE RTX 3070 FE RTX 3060 Ti FE Titan RTX RTX 2080 Ti TITAN X Pascal
Chip GA102 GA102 GA102 GA104 GA104 TU102 TU102 GP102
FinFET process 8 nm 8 nm 8 nm 8 nm 8 nm 12 nm 12 nm 16 nm
CUDA cores 10,496 10,240 8,704 5,888 4,864 4,608 4,352 3,584
Texture units 328 320 272 184 152 288 272 224
Tensor cores 328 3rd Gen. 320 3rd Gen. 272 3rd Gen. 184 3rd Gen. 152 3rd Gen. 576 2nd Gen. 544 2nd Gen.
RT cores 82 80 68 46 38 72 68
GPU base clock 1,395 MHz 1,365 MHz 1,440 MHz 1,500 MHz 1,410 MHz 1,350 MHz 1,350 MHz 1,417 MHz
GPU boost clock 1,695 MHz 1,665 MHz 1,710 MHz 1,750 MHz 1,665 MHz 1,770 MHz 1,545 MHz 1,531 MHz
Memory bus 384-bit 384-bit 320-bit 256-bit 256-bit 384-bit 352-bit 384-bit
Memory bandwidth 936 GB/s 912 GB/s 760 GB/s 448 GB/s 448 GB/s 672 GB/s 616 GB/s 480.4 GB/s
Video memory 24 GB GDDR6X 12 GB GDDR6X 10 GB GDDR6X 8 GB GDDR6 8 GB GDDR6 24 GB GDDR6 11 GB GDDR6 12 GB GDDR5X
Power consumption 350 W 350 W 320 W 220 W 200 W 280 W 250 W 250 W

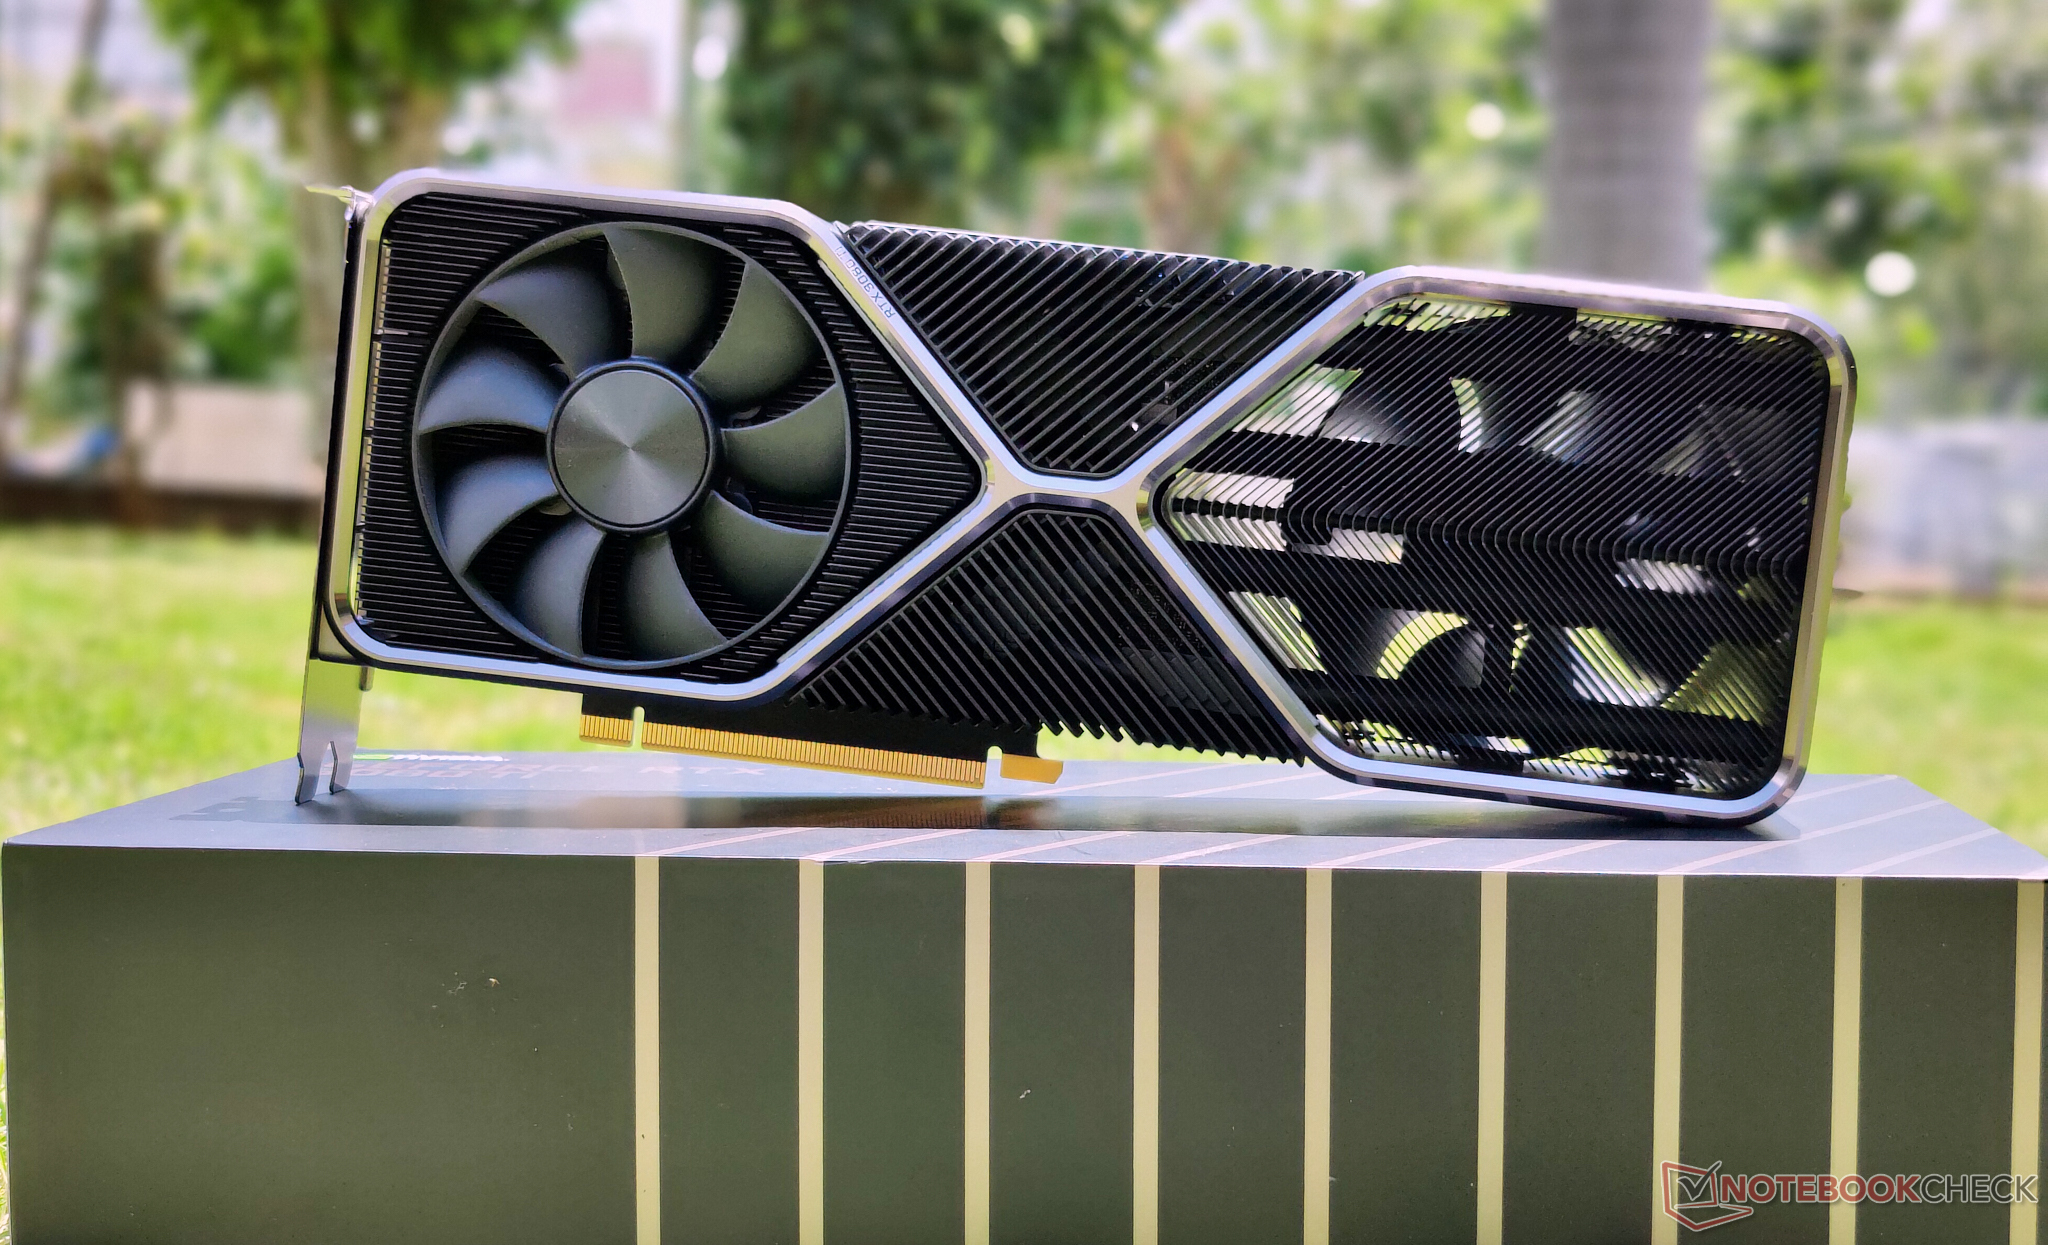
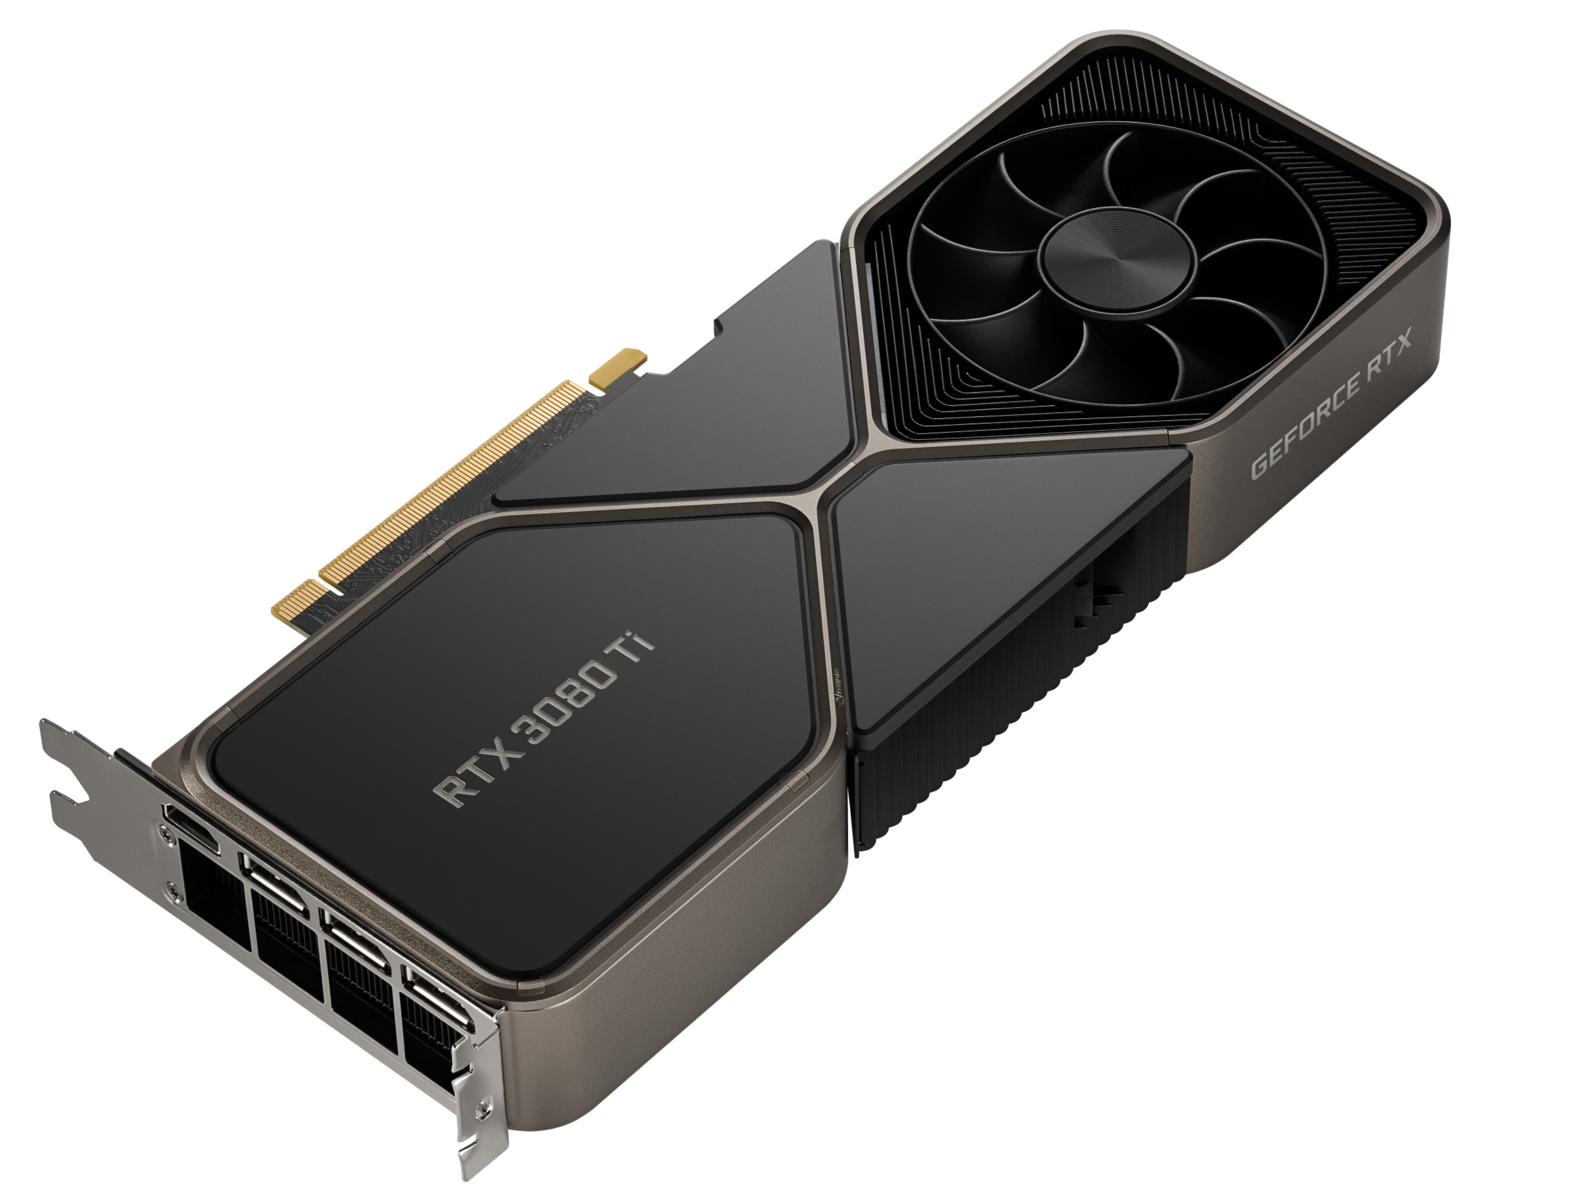
A tour of the NVIDIA GeForce RTX 3080 Ti FE

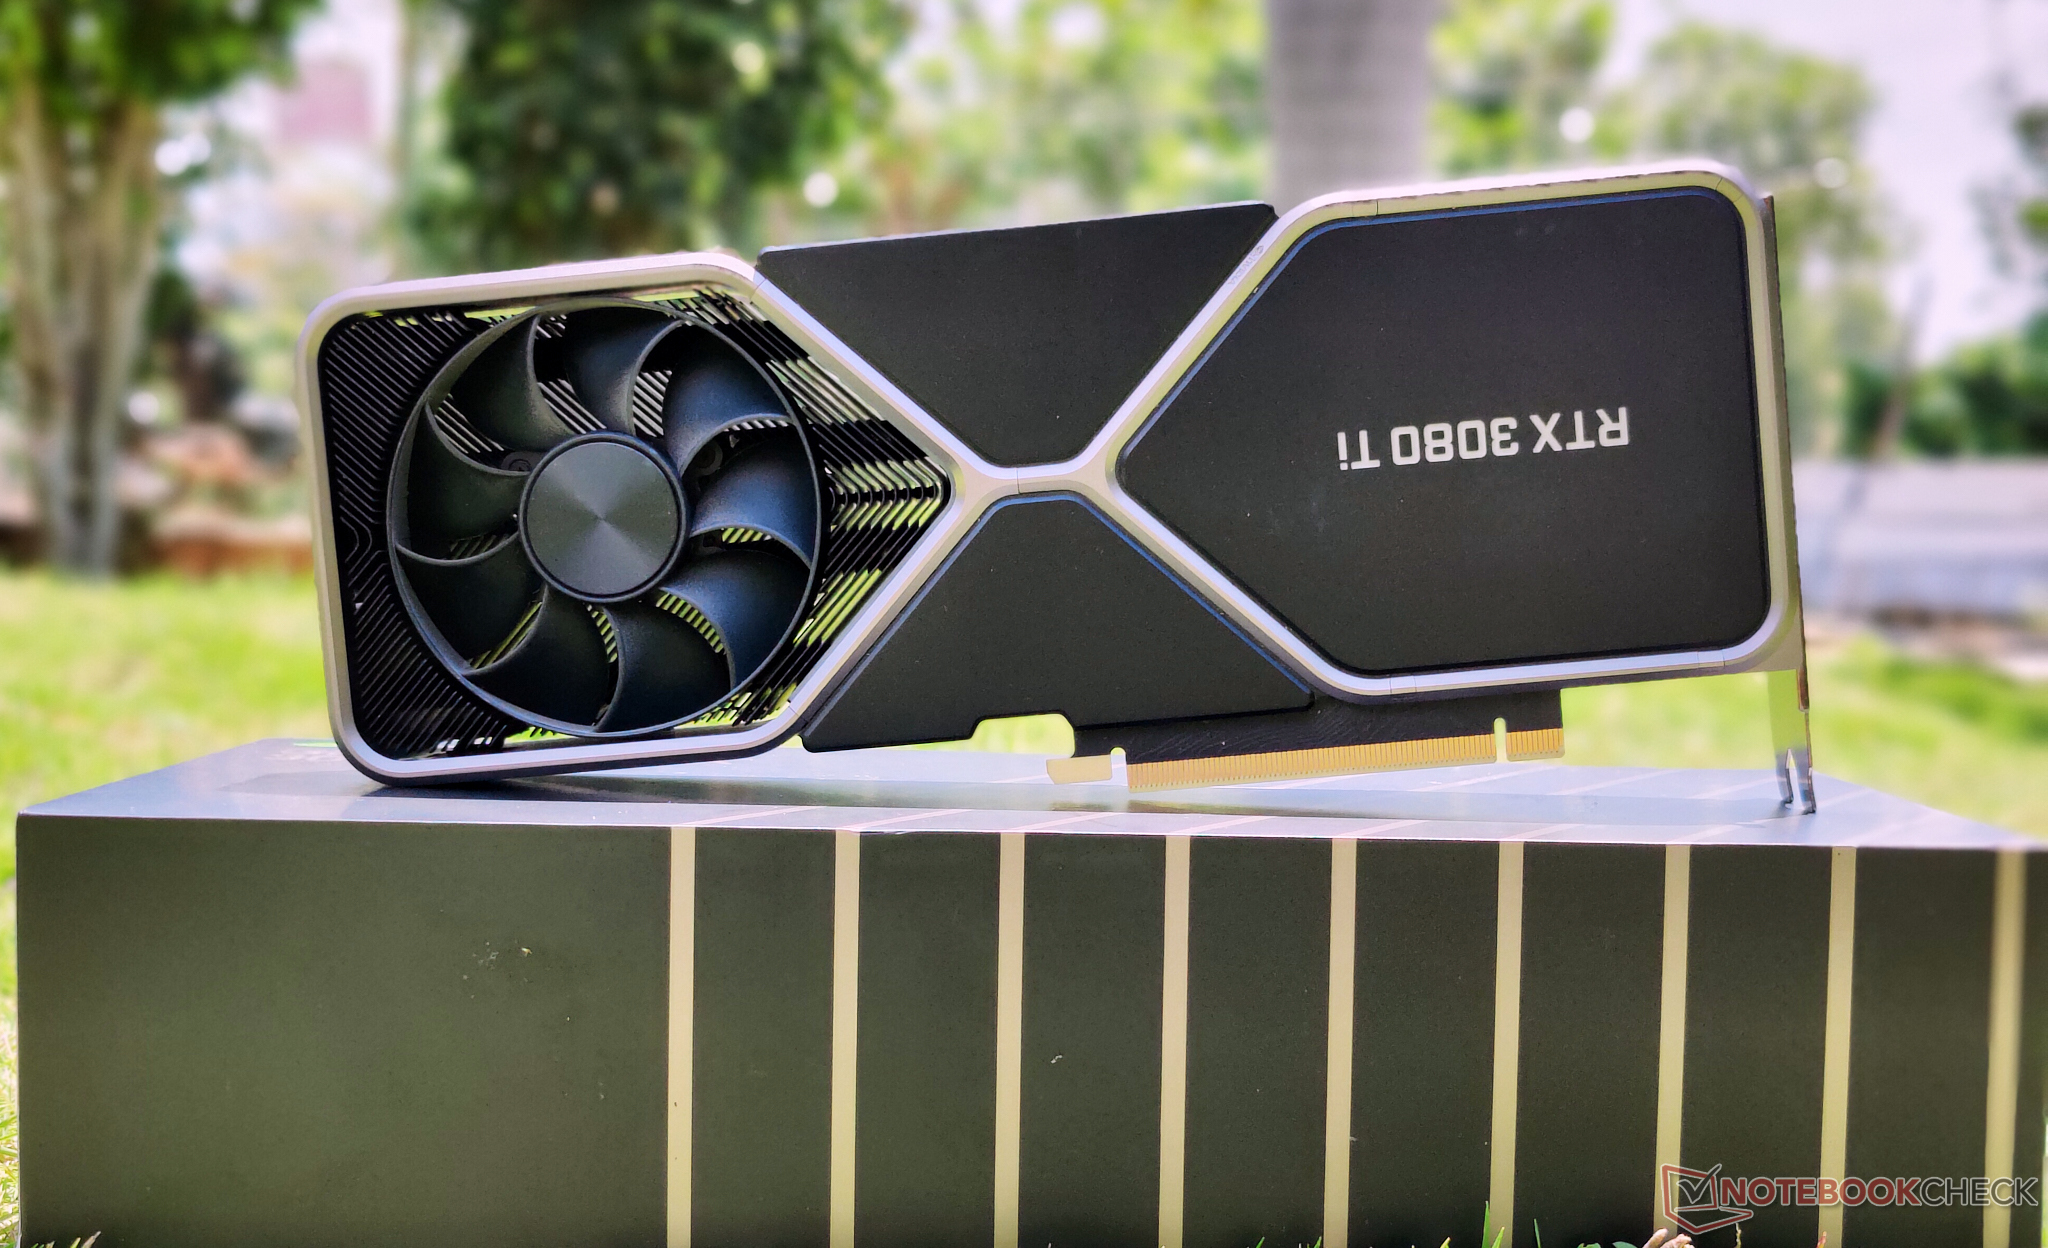
Design-wise, there is no difference between the Founders Editions of the RTX 3080 and the RTX 3080 Ti in terms of looks save for the new SKU name. Despite sporting near-RTX 3090 specs, NVIDIA has chosen to retain the 2-slot design of the RTX 3080.

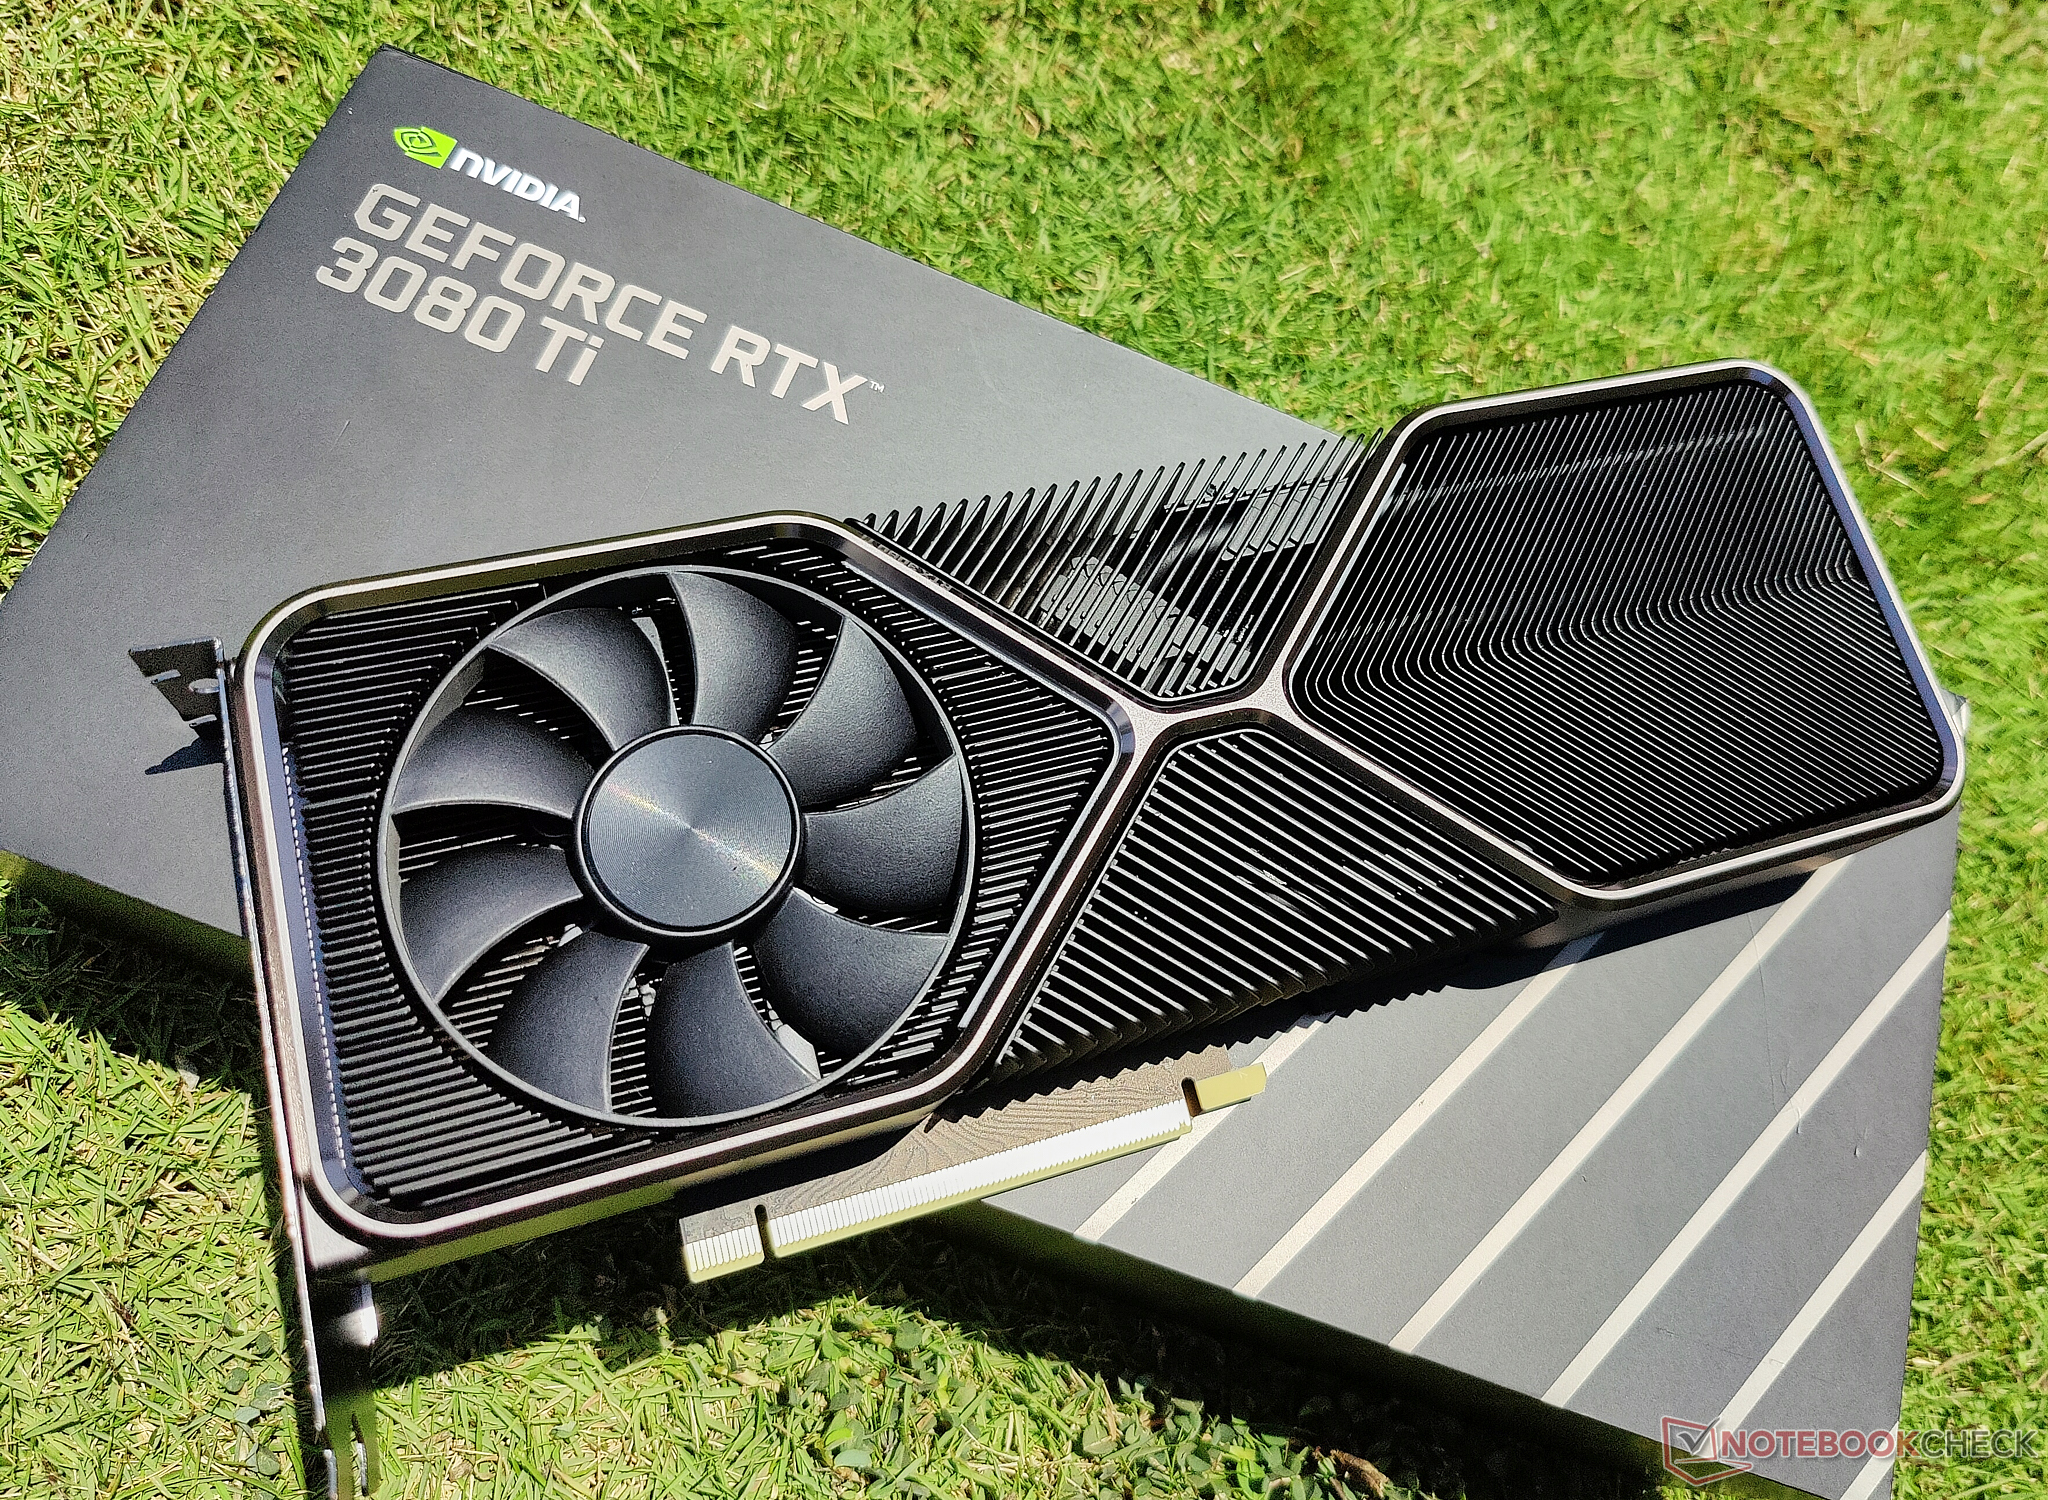
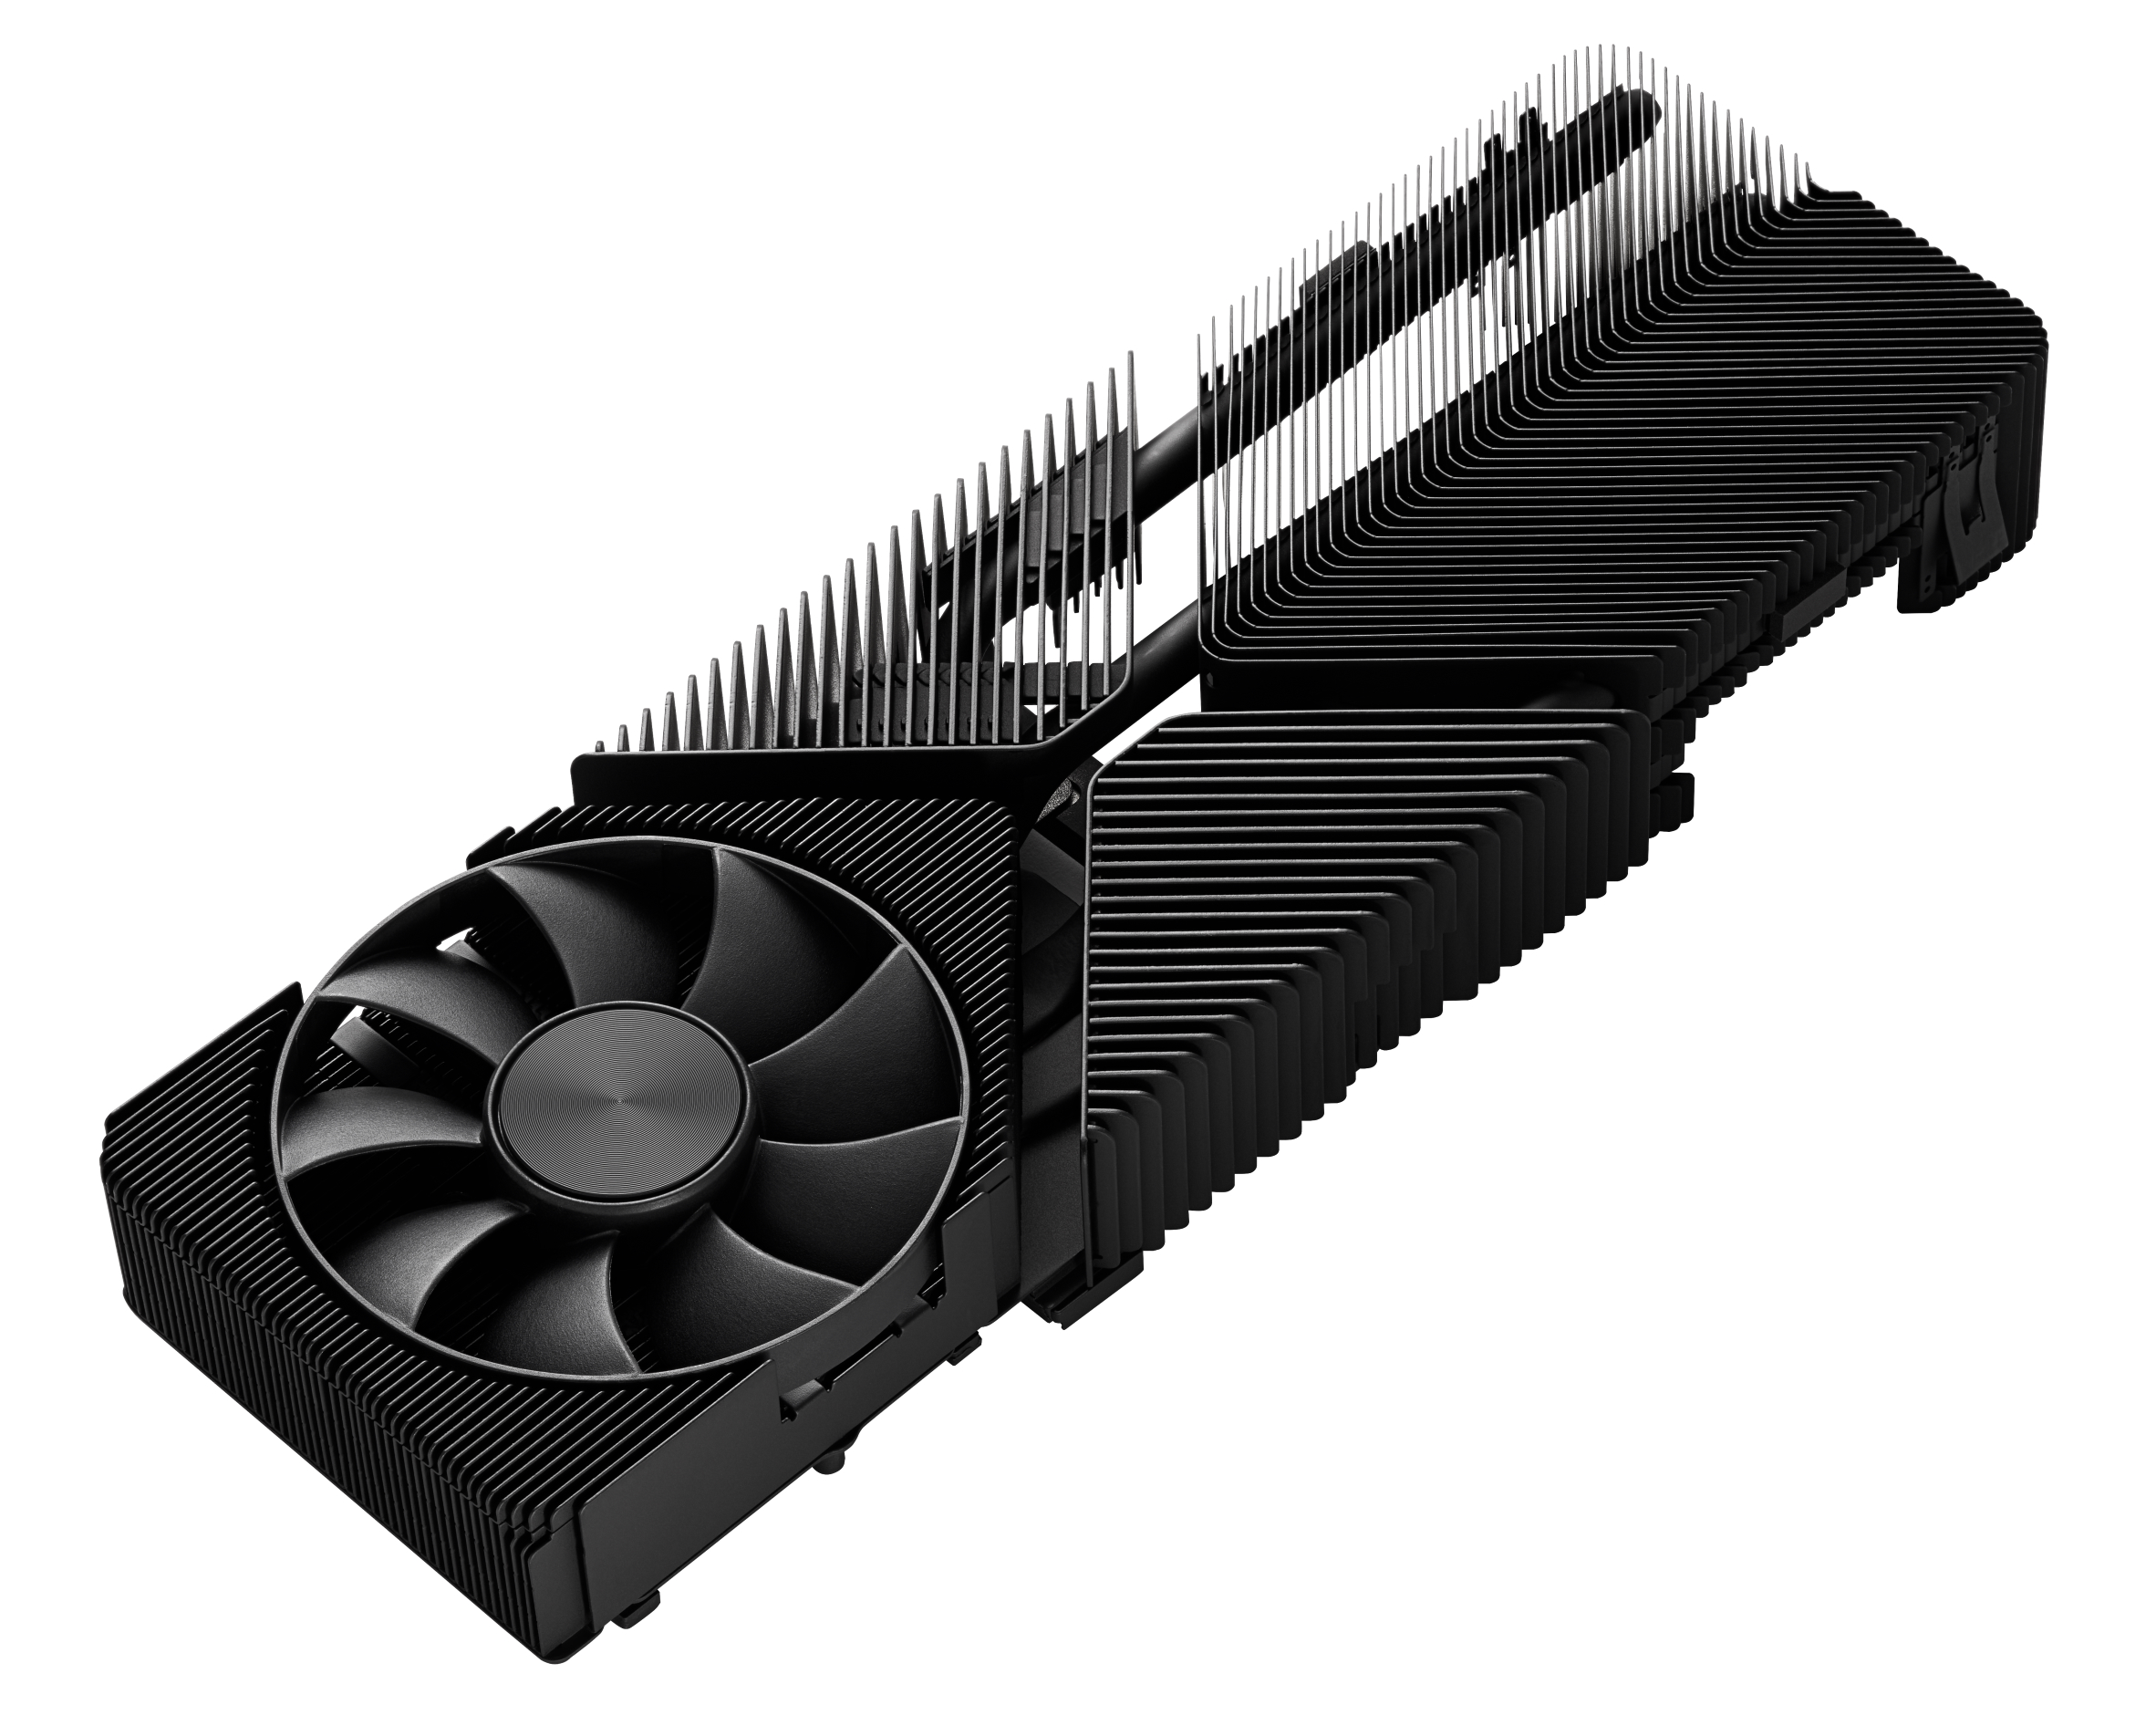
While this is good for case aesthetics, it does not exactly bode well for cooling and fan noise levels as we shall see below. The dual 9-blade 85 mm fans do a decent job at keeping the card somewhat cool, and the metal backplate helps in better heat dissipation to the surroundings. The thermal solution is capable-enough, but it does not quite seem to be in the same league as that of the RTX 3090.

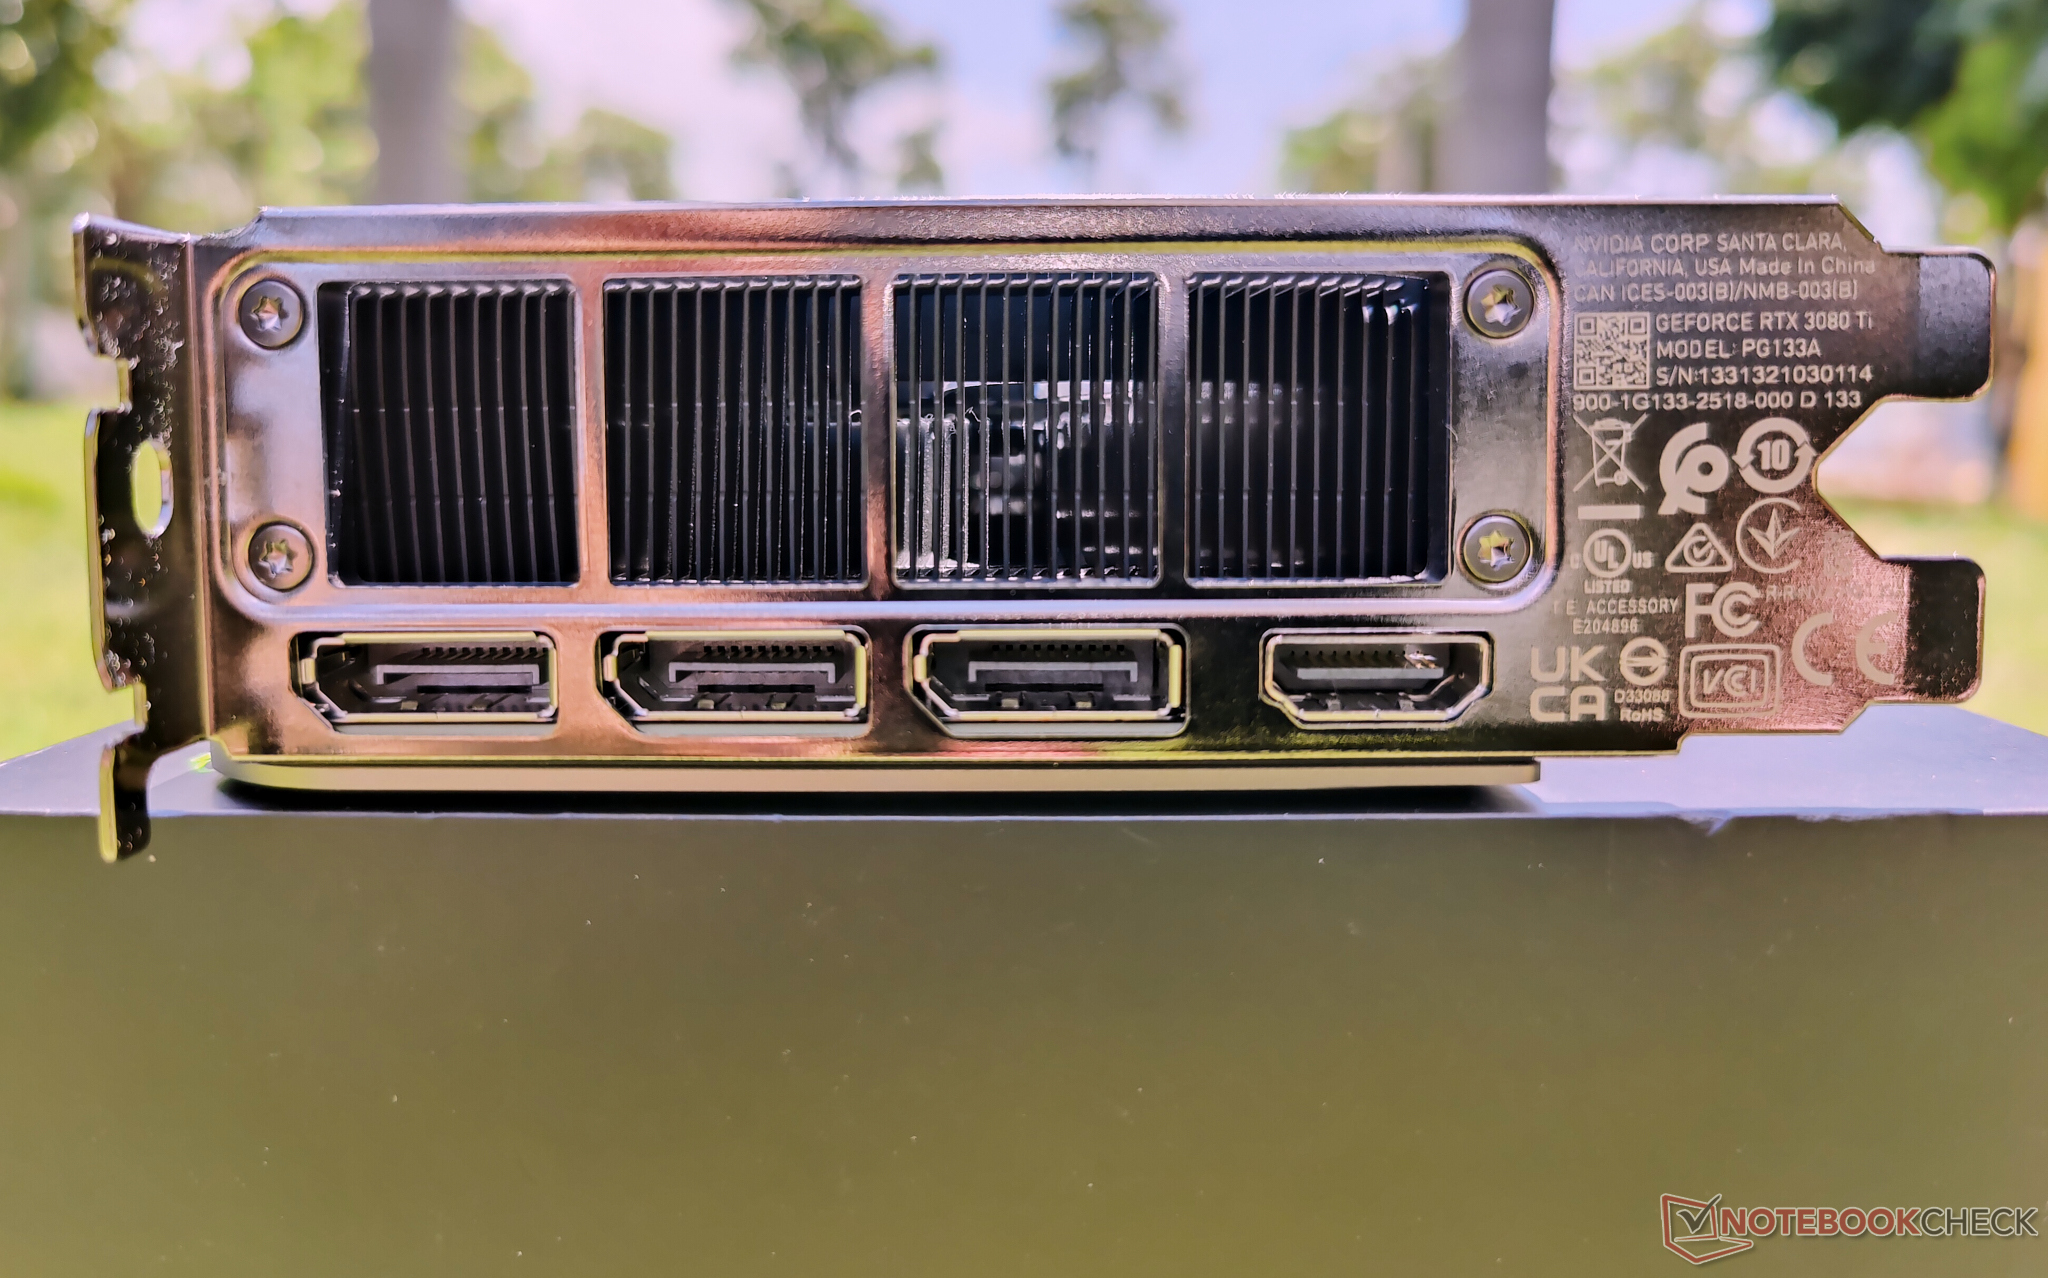
As is the hallmark for Ampere FE cards, we get to see the 12-pin Molex MicroFit 3.0 power connector in the top middle; there's a dual-8-pin to 12-pin connector provided in the box. Connectivity options are the standard fare and include one HDMI 2.1-out and three DisplayPort 1.4a outs. DisplayPort 1.4a enables the RTX 3080 Ti to drive two 8K 60 Hz displays with a single cable each without breaking much sweat while HDMI 2.1 allows for 4K 144 Hz and 8K 30 Hz output.

As is the case with most FE cards, the GeForce RTX logo glows in white and cannot be controlled by RGB software. However, it is possible to control some of the lighting on the inner frame via Corsair iCUE or other third-party RGB apps.

NVIDIA offers a standard three-year warranty on all GeForce Founders Editions cards.

RTX 3080 Ti FE PCB - Front. (Image Source: NVIDIA)
RTX 3080 Ti FE PCB - Back. (Image Source: NVIDIA)
RTX 3080 Ti FE cooling system. (Image Source: NVIDIA)

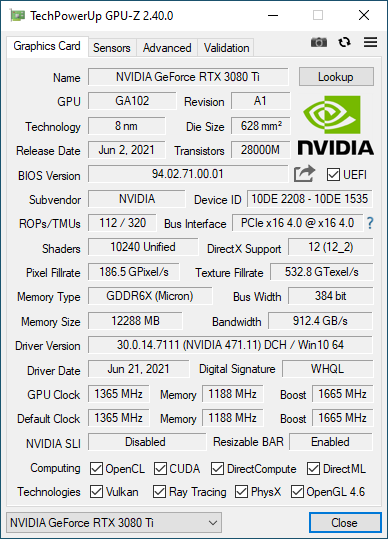
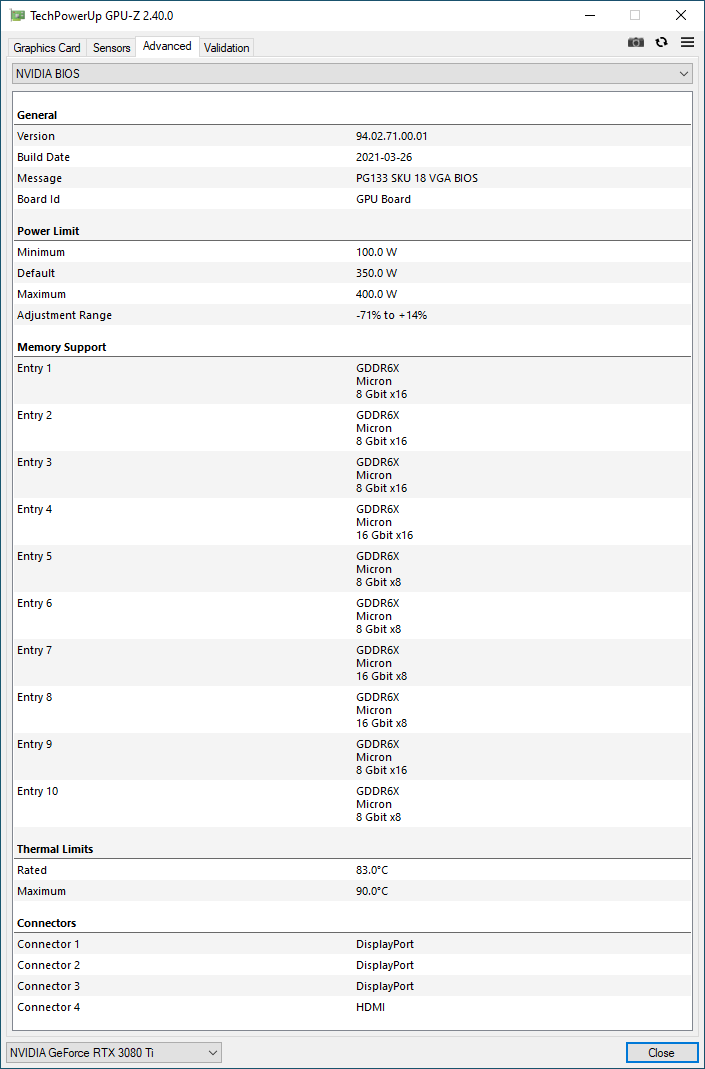
The RTX 3080 Ti FE offers a base clock of 1,365 MHz and 1,665 MHz boost. There is scope for attaining boost beyond this value although we did not find it being able to cross the 2,000 MHz mark like the RTX 3090. The RTX 3080 Ti is rated at a 350 W TGP. It is possible to increase the power target by another 14% to about 400 W, but we ran into stability issues during stress testing.

The RTX 3080 Ti FE maxes out the GDDR6X memory's 384-bit bus, which enables only two VRAM capacities — 12 GB and 24 GB. NVIDIA has reserved the 24 GB offering for the RTX 3090 with an aim to entice creative pros who also game, with the RTX 3080 Ti having to contend with 12 GB. While the card seems to have only 2 GB extra VRAM compared to the RTX 3080, we are looking at a 20% increase in memory bandwidth at 912 GB/s that should augur pretty well for dealing with heavy in-game textures at least in the current crop of AAA titles.

The test bench — Based on the AMD Ryzen 7 5800X and X570 platform

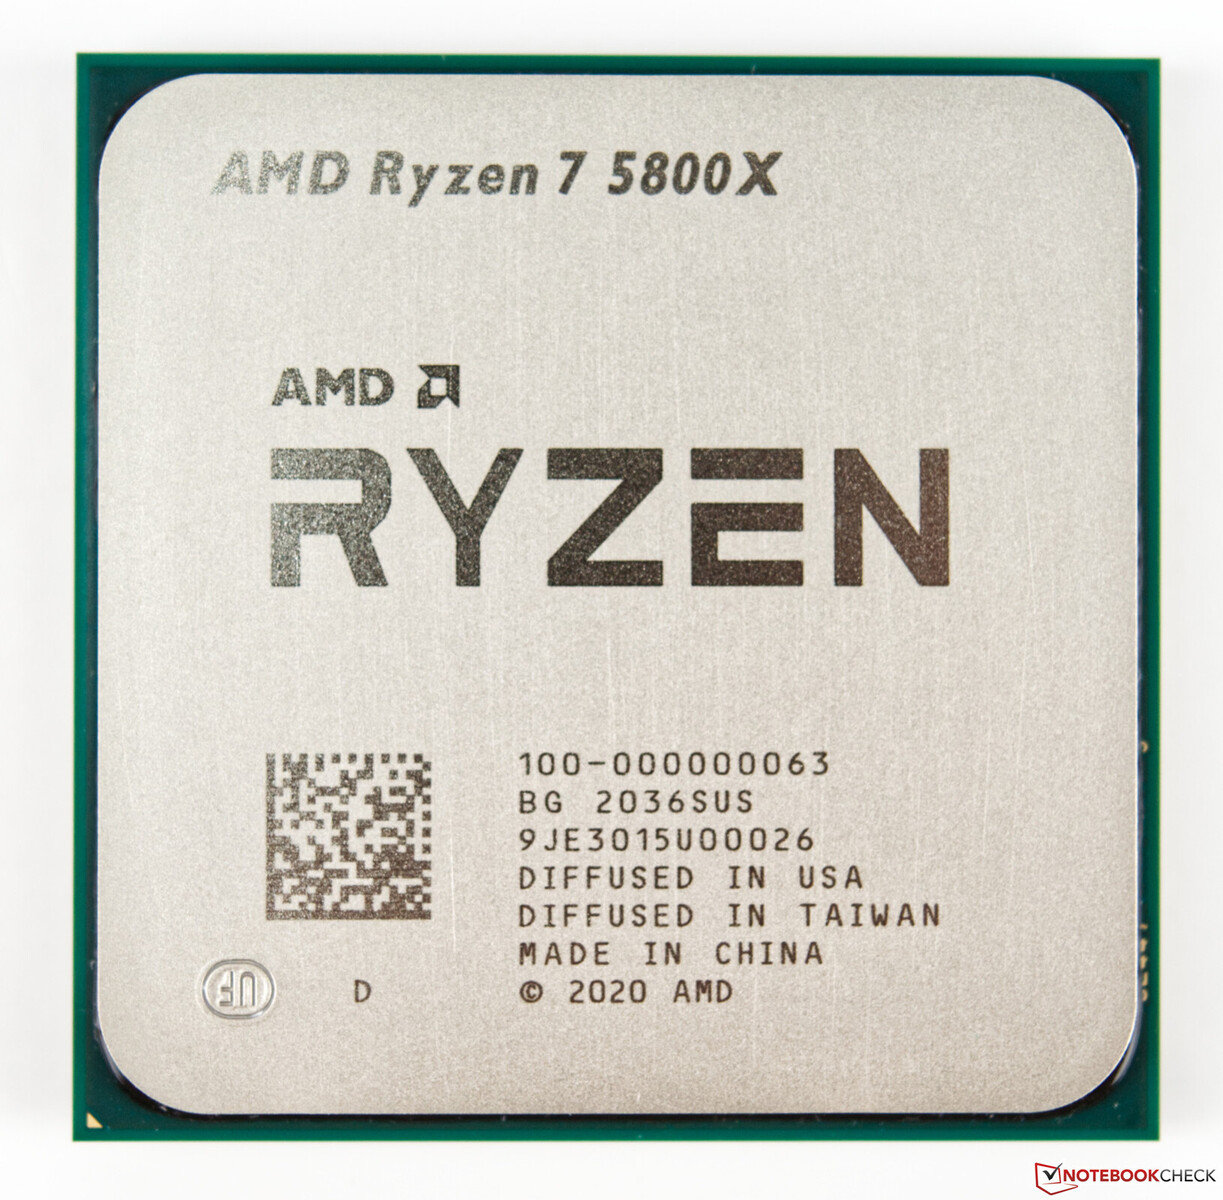
We used an AMD Ryzen 7 5800X as the processor of choice. The Ryzen 7 5800X was paired with an MSI Prestige X570 Creation motherboard, 32 GB (16 GB x2) of G.SKILL Trident Z Neo DDR4-3200 RAM (timings 16-19-19-39), and a Gigabyte Aorus NVMe Gen4 1 TB SSD.

Windows 10 21H1 with the latest cumulative updates (Build 19043.1081) was installed on the Aorus NVMe Gen4 PCIe SSD while two 1 TB Crucial MX500 SATA SSDs were used for running benchmarks and games. Resizable BAR was enabled in the UEFI, which may lend a slight performance improvement in select titles.

Cooling the Ryzen 7 5800X was a Corsair iCUE H115i Elite Capellix AIO cooler. The build was housed in a Corsair iCUE 4000X RGB case with a Thermaltake Toughpower 850 W 80 Plus Gold as the power supply of choice. All testing was performed with the case closed to represent typical usage.

A OnePlus U Series 55U1 smart TV running at 4K 60 Hz in Game Mode was connected to the RTX 3080 Ti via HDMI. Color output was set to full 32-bit RGB in the NVIDIA control panel and Windows desktop scaling was set to 100%.

We would like to thank AMD for facilitating the Ryzen 7 5800X CPU, Corsair for the iCUE Elite Capellix AIO cooler and iCUE 4000X case, and OnePlus for the U series 55U1 4K TV.

AMD Ryzen 7 5800X CPU
MSI Prestige X570 Creation motherboard. (Image Source: MSI)
Gigabyte Aorus NVMe Gen4 SSD. (Image Source: Gigabyte)
G.SKILL Trident Z Neo DDR4-3600 RAM. (Image Source: G.SKILL)

Synthetic benchmarks — On par with the RTX 3090

The NVIDIA RTX 3080 Ti presents an interesting picture when it comes to benchmark results — both synthetic and real world. For all intents and purposes, we are indeed looking at an RTX 3090 here. The RTX 3080 Ti is just two streaming multiprocessors (SMs) short of the RTX 3090 and, for the most part, this seems to have little to no impact in most benchmarks. We do see the RTX 3080 Ti performing better than the RTX 3090 in a handful of tests, probably because software and drivers could have improved over time.

In 3DMark, AMD's RDNA 2-based RX 6800 XT and RX 6900 XT do have a perceivable edge in all the Fire Strike Graphics tests, though the RTX 3080 Ti more or less ties with the RTX 3090 in Time Spy Graphics. Compared to the RTX 3080, the RTX 3080 Ti can be anywhere between 13% and 17% faster in Fire Strike Graphics depending on the resolution while being only 9% better in Time Spy Graphics.

As expected, NVIDIA cards easily ace their RDNA 2 rivals in the Port Royal ray-tracing benchmark with the RTX 3080 Ti on par with the RTX 3090 and about 13% and 34% faster than the RTX 3080 and Radeon RX 6900 XT, respectively.

The performance gap between the RTX 3080 Ti and RTX 3090 seems to widen somewhat in Unigine, particularly in the OpenGL versions of Heaven and Valley benchmarks. Superposition shows the RTX 3090 and RTX 3080 Ti to be on par with each other. The only exception here is seen in the 720p Low component of the test where the RTX 3080 Ti is nearly 25% ahead of the RTX 3090 probably because this resolution is more CPU-bound. In general, we see that the RTX 3080 Ti is about 14% faster than the average RTX 3080 at resolutions 1080p and above.

Do note that we have used a different CPU this time, the Ryzen 7 5800X, which may impact some of the synthetic benchmark results.

3DMark
2560x1440 Time Spy Graphics
Average NVIDIA GeForce RTX 3090
  (18685 - 20433, n=17)
19266 Points +1%
NVIDIA GeForce RTX 3080 Ti Founders Edition
NVIDIA GeForce RTX 3080 Ti, R7 5800X
19081 Points
Nvidia GeForce RTX 3090 Founders Edition
NVIDIA GeForce RTX 3090, R9 5900X
18685 Points -2%
AMD Radeon RX 6900 XT
AMD Radeon RX 6900 XT, R9 5950X
18210 Points -5%
AMD Radeon RX 6800 XT
AMD Radeon RX 6800 XT, R9 5950X
17603 Points -8%
Average NVIDIA GeForce RTX 3080
  (17467 - 17604, n=2)
17536 Points -8%
ASUS GeForce RTX 3080 ROG STRIX OC GAMING
NVIDIA GeForce RTX 3080, R9 5900X
17467 Points -8%
AMD Ryzen 9 5900X
NVIDIA Titan RTX, R9 5900X
15283 Points -20%
Average NVIDIA Titan RTX
  (14216 - 15283, n=29)
14884 Points -22%
Average NVIDIA GeForce RTX 2080 Ti (Desktop)
  (13744 - 14645, n=4)
14283 Points -25%
KFA2 GeForce RTX 2080 Ti EX
NVIDIA GeForce RTX 2080 Ti (Desktop), R9 3900X
13744 Points -28%
MSI GeForce RTX 3070 Gaming X Trio
NVIDIA GeForce RTX 3070, R9 5900X
13579 Points -29%
Average NVIDIA GeForce RTX 3070
  (11043 - 13579, n=7)
12616 Points -34%
Nvidia GeForce RTX 2080 Super
NVIDIA GeForce RTX 2080 Super (Desktop), R7 2700X
11477 Points -40%
Average NVIDIA GeForce RTX 2080 Super (Desktop)
  (11313 - 11542, n=4)
11439 Points -40%
1920x1080 Fire Strike Graphics
AMD Radeon RX 6900 XT
AMD Radeon RX 6900 XT, R9 5950X
50587 Points +10%
AMD Radeon RX 6800 XT
AMD Radeon RX 6800 XT, R9 5950X
49735 Points +9%
Average NVIDIA GeForce RTX 3090
  (41298 - 49282, n=17)
46856 Points +2%
NVIDIA GeForce RTX 3080 Ti Founders Edition
NVIDIA GeForce RTX 3080 Ti, R7 5800X
45785 Points
Nvidia GeForce RTX 3090 Founders Edition
NVIDIA GeForce RTX 3090, R9 5900X
41298 Points -10%
ASUS GeForce RTX 3080 ROG STRIX OC GAMING
NVIDIA GeForce RTX 3080, R9 5900X
40910 Points -11%
Average NVIDIA GeForce RTX 3080
  (37604 - 40910, n=2)
39257 Points -14%
Average NVIDIA Titan RTX
  (33377 - 40910, n=30)
36062 Points -21%
AMD Ryzen 9 5900X
NVIDIA Titan RTX, R9 5900X
34722 Points -24%
Average NVIDIA GeForce RTX 2080 Ti (Desktop)
  (32081 - 35851, n=4)
34141 Points -25%
KFA2 GeForce RTX 2080 Ti EX
NVIDIA GeForce RTX 2080 Ti (Desktop), R9 3900X
32081 Points -30%
MSI GeForce RTX 3070 Gaming X Trio
NVIDIA GeForce RTX 3070, R9 5900X
31096 Points -32%
Average NVIDIA GeForce RTX 3070
  (20357 - 33270, n=7)
28949 Points -37%
Average NVIDIA GeForce RTX 2080 Super (Desktop)
  (26824 - 28968, n=4)
27647 Points -40%
Nvidia GeForce RTX 2080 Super
NVIDIA GeForce RTX 2080 Super (Desktop), R7 2700X
27075 Points -41%
3840x2160 Fire Strike Ultra Graphics
AMD Radeon RX 6900 XT
AMD Radeon RX 6900 XT, R9 5950X
13370 Points +11%
AMD Radeon RX 6800 XT
AMD Radeon RX 6800 XT, R9 5950X
12626 Points +5%
Average NVIDIA GeForce RTX 3090
  (11613 - 12587, n=14)
12289 Points +2%
NVIDIA GeForce RTX 3080 Ti Founders Edition
NVIDIA GeForce RTX 3080 Ti, R7 5800X
12074 Points
Nvidia GeForce RTX 3090 Founders Edition
NVIDIA GeForce RTX 3090, R9 5900X
11613 Points -4%
ASUS GeForce RTX 3080 ROG STRIX OC GAMING
NVIDIA GeForce RTX 3080, R9 5900X
10793 Points -11%
Average NVIDIA GeForce RTX 3080
  (10645 - 10793, n=2)
10719 Points -11%
Average NVIDIA Titan RTX
  (8461 - 10793, n=29)
8868 Points -27%
AMD Ryzen 9 5900X
NVIDIA Titan RTX, R9 5900X
8649 Points -28%
MSI GeForce RTX 3070 Gaming X Trio
NVIDIA GeForce RTX 3070, R9 5900X
8483 Points -30%
Average NVIDIA GeForce RTX 3070
  (8043 - 8483, n=5)
8250 Points -32%
Average NVIDIA GeForce RTX 2080 Ti (Desktop)
  (7925 - 8504, n=4)
8226 Points -32%
KFA2 GeForce RTX 2080 Ti EX
NVIDIA GeForce RTX 2080 Ti (Desktop), R9 3900X
7925 Points -34%
Average NVIDIA GeForce RTX 2080 Super (Desktop)
  (6500 - 6700, n=3)
6585 Points -45%
Nvidia GeForce RTX 2080 Super
NVIDIA GeForce RTX 2080 Super (Desktop), R7 2700X
6500 Points -46%
Fire Strike Extreme Graphics
AMD Radeon RX 6900 XT
AMD Radeon RX 6900 XT, R9 5950X
26650 Points +15%
AMD Radeon RX 6800 XT
AMD Radeon RX 6800 XT, R9 5950X
25015 Points +8%
Average NVIDIA GeForce RTX 3090
  (22075 - 24730, n=14)
23806 Points +3%
NVIDIA GeForce RTX 3080 Ti Founders Edition
NVIDIA GeForce RTX 3080 Ti, R7 5800X
23127 Points
Nvidia GeForce RTX 3090 Founders Edition
NVIDIA GeForce RTX 3090, R9 5900X
22075 Points -5%
ASUS GeForce RTX 3080 ROG STRIX OC GAMING
NVIDIA GeForce RTX 3080, R9 5900X
20861 Points -10%
Average NVIDIA GeForce RTX 3080
  (20007 - 20861, n=2)
20434 Points -12%
Average NVIDIA Titan RTX
  (16484 - 20861, n=29)
17649 Points -24%
AMD Ryzen 9 5900X
NVIDIA Titan RTX, R9 5900X
17176 Points -26%
Average NVIDIA GeForce RTX 2080 Ti (Desktop)
  (15603 - 16856, n=3)
16416 Points -29%
MSI GeForce RTX 3070 Gaming X Trio
NVIDIA GeForce RTX 3070, R9 5900X
16196 Points -30%
Average NVIDIA GeForce RTX 3070
  (15503 - 16276, n=5)
15859 Points -31%
KFA2 GeForce RTX 2080 Ti EX
NVIDIA GeForce RTX 2080 Ti (Desktop), R9 3900X
15603 Points -33%
Average NVIDIA GeForce RTX 2080 Super (Desktop)
  (12968 - 13551, n=3)
13172 Points -43%
Nvidia GeForce RTX 2080 Super
NVIDIA GeForce RTX 2080 Super (Desktop), R7 2700X
12968 Points -44%
2560x1440 Port Royal Graphics
NVIDIA GeForce RTX 3080 Ti Founders Edition
NVIDIA GeForce RTX 3080 Ti, R7 5800X
12798 Points
Average NVIDIA GeForce RTX 3090
  (12255 - 13075, n=6)
12767 Points 0%
Nvidia GeForce RTX 3090 Founders Edition
NVIDIA GeForce RTX 3090, R9 5900X
12384 Points -3%
Average NVIDIA GeForce RTX 3080
  (11238 - 11433, n=2)
11336 Points -11%
ASUS GeForce RTX 3080 ROG STRIX OC GAMING
NVIDIA GeForce RTX 3080, R9 5900X
11238 Points -12%
AMD Radeon RX 6900 XT
AMD Radeon RX 6900 XT, R9 5950X
9585 Points -25%
AMD Ryzen 9 5900X
NVIDIA Titan RTX, R9 5900X
9335 Points -27%
AMD Ryzen 9 5900X
NVIDIA Titan RTX, R9 5900X
9239 Points -28%
Average NVIDIA Titan RTX
  (8945 - 9528, n=24)
9303 Points -27%
Average NVIDIA GeForce RTX 2080 Ti (Desktop)
  (8537 - 9021, n=2)
8779 Points -31%
KFA2 GeForce RTX 2080 Ti EX
NVIDIA GeForce RTX 2080 Ti (Desktop), R9 3900X
8537 Points -33%
MSI GeForce RTX 3070 Gaming X Trio
NVIDIA GeForce RTX 3070, R9 5900X
8191 Points -36%
Average NVIDIA GeForce RTX 3070
  (7796 - 8191, n=5)
7941 Points -38%
Average NVIDIA GeForce RTX 2080 Super (Desktop)
  (6745 - 6947, n=3)
6873 Points -46%
Nvidia GeForce RTX 2080 Super
NVIDIA GeForce RTX 2080 Super (Desktop), R7 2700X
6745 Points -47%
Unigine Heaven 4.0
Extreme Preset DX11
Average NVIDIA GeForce RTX 3090
  (272 - 315, n=11)
300 fps +3%
NVIDIA GeForce RTX 3080 Ti Founders Edition
NVIDIA GeForce RTX 3080 Ti, R7 5800X
290.2 (50.9min - 582.7max) fps
Nvidia GeForce RTX 3090 Founders Edition
NVIDIA GeForce RTX 3090, R9 5900X
274 fps -6%
AMD Radeon RX 6900 XT
AMD Radeon RX 6900 XT, R9 5950X
259.5 (49.3min - 537.2max) fps -11%
AMD Radeon RX 6800 XT
AMD Radeon RX 6800 XT, R9 5950X
247.9 fps -15%
Average NVIDIA GeForce RTX 3080
  (233 - 253, n=2)
243 fps -16%
AMD Ryzen 9 5900X
NVIDIA Titan RTX, R9 5900X
237.1 fps -18%
Average NVIDIA Titan RTX
  (207 - 248, n=12)
236 fps -19%
ASUS GeForce RTX 3080 ROG STRIX OC GAMING
NVIDIA GeForce RTX 3080, R9 5900X
232.6 fps -20%
Average NVIDIA GeForce RTX 2080 Ti (Desktop)
  (215 - 226, n=3)
222 fps -24%
KFA2 GeForce RTX 2080 Ti EX
NVIDIA GeForce RTX 2080 Ti (Desktop), R9 3900X
215.2 fps -26%
Average NVIDIA GeForce RTX 3070
  (196.4 - 214, n=5)
206 fps -29%
MSI GeForce RTX 3070 Gaming X Trio
NVIDIA GeForce RTX 3070, R9 5900X
202.5 fps -30%
Nvidia GeForce RTX 2080 Super
NVIDIA GeForce RTX 2080 Super (Desktop), R7 2700X
175.2 fps -40%
Average NVIDIA GeForce RTX 2080 Super (Desktop)
  ()
175.2 fps -40%
Extreme Preset OpenGL
Average NVIDIA GeForce RTX 3090
  (188.2 - 284, n=10)
270 fps +2%
NVIDIA GeForce RTX 3080 Ti Founders Edition
NVIDIA GeForce RTX 3080 Ti, R7 5800X
263.6 (12.2min - 543.3max) fps
Average NVIDIA GeForce RTX 3080
  (232 - 243, n=2)
238 fps -10%
ASUS GeForce RTX 3080 ROG STRIX OC GAMING
NVIDIA GeForce RTX 3080, R9 5900X
232.4 fps -12%
Average NVIDIA Titan RTX
  (203 - 299, n=12)
223 fps -15%
AMD Ryzen 9 5900X
NVIDIA Titan RTX, R9 5900X
215.1 fps -18%
AMD Radeon RX 6900 XT
AMD Radeon RX 6900 XT, R9 5950X
206.5 (8.2min - 453.7max) fps -22%
Average NVIDIA GeForce RTX 2080 Ti (Desktop)
  (202 - 213, n=3)
206 fps -22%
KFA2 GeForce RTX 2080 Ti EX
NVIDIA GeForce RTX 2080 Ti (Desktop), R9 3900X
204.4 fps -22%
AMD Radeon RX 6800 XT
AMD Radeon RX 6800 XT, R9 5950X
204 fps -23%
MSI GeForce RTX 3070 Gaming X Trio
NVIDIA GeForce RTX 3070, R9 5900X
196.1 fps -26%
Average NVIDIA GeForce RTX 3070
  (187.5 - 196.1, n=4)
192.5 fps -27%
Nvidia GeForce RTX 3090 Founders Edition
NVIDIA GeForce RTX 3090, R9 5900X
188.2 fps -29%
Nvidia GeForce RTX 2080 Super
NVIDIA GeForce RTX 2080 Super (Desktop), R7 2700X
167.5 fps -36%
Average NVIDIA GeForce RTX 2080 Super (Desktop)
  ()
167.5 fps -36%
Unigine Valley 1.0
1920x1080 Extreme HD DirectX AA:x8
Average NVIDIA GeForce RTX 3090
  (184.2 - 247, n=11)
225 fps +9%
NVIDIA GeForce RTX 3080 Ti Founders Edition
NVIDIA GeForce RTX 3080 Ti, R7 5800X
206 (51.6min - 350.7max) fps
AMD Radeon RX 6900 XT
AMD Radeon RX 6900 XT, R9 5950X
200.8 (53.4min - 359.1max) fps -3%
Nvidia GeForce RTX 3090 Founders Edition
NVIDIA GeForce RTX 3090, R9 5900X
192.4 fps -7%
AMD Radeon RX 6800 XT
AMD Radeon RX 6800 XT, R9 5950X
190.6 fps -7%
AMD Ryzen 9 5900X
NVIDIA Titan RTX, R9 5900X
180.1 fps -13%
Average NVIDIA GeForce RTX 3080
  (176.2 - 181.8, n=2)
179 fps -13%
ASUS GeForce RTX 3080 ROG STRIX OC GAMING
NVIDIA GeForce RTX 3080, R9 5900X
176.2 fps -14%
Average NVIDIA Titan RTX
  (135 - 191.4, n=12)
173.3 fps -16%
Average NVIDIA GeForce RTX 2080 Ti (Desktop)
  (159.4 - 164.1, n=3)
162.2 fps -21%
Average NVIDIA GeForce RTX 3070
  (155.1 - 168.5, n=5)
161.2 fps -22%
KFA2 GeForce RTX 2080 Ti EX
NVIDIA GeForce RTX 2080 Ti (Desktop), R9 3900X
159.4 fps -23%
MSI GeForce RTX 3070 Gaming X Trio
NVIDIA GeForce RTX 3070, R9 5900X
155.1 fps -25%
Nvidia GeForce RTX 2080 Super
NVIDIA GeForce RTX 2080 Super (Desktop), R7 2700X
120.2 fps -42%
Average NVIDIA GeForce RTX 2080 Super (Desktop)
  ()
120.2 fps -42%
1920x1080 Extreme HD Preset OpenGL AA:x8
Average NVIDIA GeForce RTX 3090
  (158.8 - 226, n=10)
203 fps +4%
NVIDIA GeForce RTX 3080 Ti Founders Edition
NVIDIA GeForce RTX 3080 Ti, R7 5800X
195.1 (46.1min - 342.7max) fps
Average NVIDIA GeForce RTX 3080
  (163.8 - 172, n=2)
167.9 fps -14%
AMD Radeon RX 6900 XT
AMD Radeon RX 6900 XT, R9 5950X
167.4 (56.7min - 375.7max) fps -14%
ASUS GeForce RTX 3080 ROG STRIX OC GAMING
NVIDIA GeForce RTX 3080, R9 5900X
163.8 fps -16%
Nvidia GeForce RTX 3090 Founders Edition
NVIDIA GeForce RTX 3090, R9 5900X
158.8 fps -19%
AMD Ryzen 9 5900X
NVIDIA Titan RTX, R9 5900X
158.5 fps -19%
AMD Radeon RX 6800 XT
AMD Radeon RX 6800 XT, R9 5950X
158.2 fps -19%
Average NVIDIA Titan RTX
  (139.2 - 181.2, n=12)
158.1 fps -19%
Average NVIDIA GeForce RTX 2080 Ti (Desktop)
  (144.5 - 147.8, n=3)
145.8 fps -25%
KFA2 GeForce RTX 2080 Ti EX
NVIDIA GeForce RTX 2080 Ti (Desktop), R9 3900X
145.1 fps -26%
MSI GeForce RTX 3070 Gaming X Trio
NVIDIA GeForce RTX 3070, R9 5900X
142.9 fps -27%
Average NVIDIA GeForce RTX 3070
  (140.2 - 144.9, n=4)
142.7 fps -27%
Nvidia GeForce RTX 2080 Super
NVIDIA GeForce RTX 2080 Super (Desktop), R7 2700X
114.5 fps -41%
Average NVIDIA GeForce RTX 2080 Super (Desktop)
  ()
114.5 fps -41%
Unigine Superposition
1280x720 720p Low
Average NVIDIA GeForce RTX 3090
  (33329 - 54879, n=10)
46049 Points +7%
NVIDIA GeForce RTX 3080 Ti Founders Edition
NVIDIA GeForce RTX 3080 Ti, R7 5800X
43163 Points
AMD Ryzen 9 5900X
NVIDIA Titan RTX, R9 5900X
40994 Points -5%
Average NVIDIA Titan RTX
  (25622 - 50876, n=9)
40891 Points -5%
AMD Radeon RX 6900 XT
AMD Radeon RX 6900 XT, R9 5950X
37023 Points -14%
AMD Radeon RX 6800 XT
AMD Radeon RX 6800 XT, R9 5950X
36452 Points -16%
Nvidia GeForce RTX 3090 Founders Edition
NVIDIA GeForce RTX 3090, R9 5900X
34649 Points -20%
Average NVIDIA GeForce RTX 3070
  (27330 - 40007, n=5)
34576 Points -20%
MSI GeForce RTX 3070 Gaming X Trio
NVIDIA GeForce RTX 3070, R9 5900X
31666 Points -27%
Average NVIDIA GeForce RTX 3080
  (30851 - 32183, n=2)
31517 Points -27%
ASUS GeForce RTX 3080 ROG STRIX OC GAMING
NVIDIA GeForce RTX 3080, R9 5900X
30851 Points -29%
Average NVIDIA GeForce RTX 2080 Super (Desktop)
  ()
26907 Points -38%
1920x1080 1080p High
Average NVIDIA GeForce RTX 3090
  (23626 - 27207, n=11)
26018 Points +4%
AMD Radeon RX 6900 XT
AMD Radeon RX 6900 XT, R9 5950X
25029 Points 0%
NVIDIA GeForce RTX 3080 Ti Founders Edition
NVIDIA GeForce RTX 3080 Ti, R7 5800X
24997 Points
Nvidia GeForce RTX 3090 Founders Edition
NVIDIA GeForce RTX 3090, R9 5900X
23853 Points -5%
AMD Radeon RX 6800 XT
AMD Radeon RX 6800 XT, R9 5950X
22265 Points -11%
Average NVIDIA GeForce RTX 3080
  (21333 - 21912, n=2)
21623 Points -13%
ASUS GeForce RTX 3080 ROG STRIX OC GAMING
NVIDIA GeForce RTX 3080, R9 5900X
21333 Points -15%
AMD Ryzen 9 5900X
NVIDIA Titan RTX, R9 5900X
20315 Points -19%
Average NVIDIA Titan RTX
  (19460 - 20658, n=9)
20301 Points -19%
MSI GeForce RTX 3070 Gaming X Trio
NVIDIA GeForce RTX 3070, R9 5900X
17346 Points -31%
Average NVIDIA GeForce RTX 3070
  (17054 - 17491, n=5)
17312 Points -31%
Average NVIDIA GeForce RTX 2080 Super (Desktop)
  ()
15558 Points -38%
1920x1080 1080p Extreme
Average NVIDIA GeForce RTX 3090
  (11806 - 12694, n=11)
12209 Points +1%
NVIDIA GeForce RTX 3080 Ti Founders Edition
NVIDIA GeForce RTX 3080 Ti, R7 5800X
12038 Points
Nvidia GeForce RTX 3090 Founders Edition
NVIDIA GeForce RTX 3090, R9 5900X
11806 Points -2%
Average NVIDIA GeForce RTX 3080
  (10572 - 10822, n=2)
10697 Points -11%
AMD Radeon RX 6900 XT
AMD Radeon RX 6900 XT, R9 5950X
10683 Points -11%
ASUS GeForce RTX 3080 ROG STRIX OC GAMING
NVIDIA GeForce RTX 3080, R9 5900X
10572 Points -12%
AMD Radeon RX 6800 XT
AMD Radeon RX 6800 XT, R9 5950X
10046 Points -17%
AMD Ryzen 9 5900X
NVIDIA Titan RTX, R9 5900X
9056 Points -25%
Average NVIDIA Titan RTX
  (8916 - 9285, n=9)
9051 Points -25%
MSI GeForce RTX 3070 Gaming X Trio
NVIDIA GeForce RTX 3070, R9 5900X
8507 Points -29%
Average NVIDIA GeForce RTX 3070
  (8276 - 8507, n=5)
8354 Points -31%
Average NVIDIA GeForce RTX 2080 Super (Desktop)
  ()
7080 Points -41%
3840x2160 4k Optimized
Average NVIDIA GeForce RTX 3090
  (15794 - 16868, n=11)
16326 Points +1%
NVIDIA GeForce RTX 3080 Ti Founders Edition
NVIDIA GeForce RTX 3080 Ti, R7 5800X
16153 Points
Nvidia GeForce RTX 3090 Founders Edition
NVIDIA GeForce RTX 3090, R9 5900X
15794 Points -2%
AMD Radeon RX 6900 XT
AMD Radeon RX 6900 XT, R9 5950X
14955 Points -7%
Average NVIDIA GeForce RTX 3080
  (13984 - 14243, n=2)
14114 Points -13%
ASUS GeForce RTX 3080 ROG STRIX OC GAMING
NVIDIA GeForce RTX 3080, R9 5900X
13984 Points -13%
AMD Radeon RX 6800 XT
AMD Radeon RX 6800 XT, R9 5950X
13471 Points -17%
Average NVIDIA Titan RTX
  (11937 - 12644, n=9)
12203 Points -24%
AMD Ryzen 9 5900X
NVIDIA Titan RTX, R9 5900X
12186 Points -25%
MSI GeForce RTX 3070 Gaming X Trio
NVIDIA GeForce RTX 3070, R9 5900X
10755 Points -33%
Average NVIDIA GeForce RTX 3070
  (10544 - 10755, n=5)
10667 Points -34%
Average NVIDIA GeForce RTX 2080 Super (Desktop)
  ()
9338 Points -42%
7680x4320 8k Optimized
Average NVIDIA GeForce RTX 3090
  (6969 - 7521, n=11)
7144 Points +1%
NVIDIA GeForce RTX 3080 Ti Founders Edition
NVIDIA GeForce RTX 3080 Ti, R7 5800X
7095 Points
Nvidia GeForce RTX 3090 Founders Edition
NVIDIA GeForce RTX 3090, R9 5900X
7002 Points -1%
Average NVIDIA GeForce RTX 3080
  (6243 - 6346, n=2)
6295 Points -11%
ASUS GeForce RTX 3080 ROG STRIX OC GAMING
NVIDIA GeForce RTX 3080, R9 5900X
6243 Points -12%
AMD Radeon RX 6900 XT
AMD Radeon RX 6900 XT, R9 5950X
5764 Points -19%
AMD Ryzen 9 5900X
NVIDIA Titan RTX, R9 5900X
5402 Points -24%
Average NVIDIA Titan RTX
  (5255 - 5571, n=9)
5393 Points -24%
AMD Radeon RX 6800 XT
AMD Radeon RX 6800 XT, R9 5950X
5256 Points -26%
MSI GeForce RTX 3070 Gaming X Trio
NVIDIA GeForce RTX 3070, R9 5900X
4695 Points -34%
Average NVIDIA GeForce RTX 3070
  (4587 - 4695, n=5)
4624 Points -35%
Average NVIDIA GeForce RTX 2080 Super (Desktop)
  ()
3989 Points -44%
3DMark 11 Performance
41396 points
3DMark Fire Strike Score
32491 points
3DMark Fire Strike Extreme Score
21605 points
3DMark Time Spy Score
17433 points
Help

Compute benchmarks — Good gains over the RTX 3080 and RX 6900 XT

The RTX 3080 Ti only has a very slight edge over the average RTX 3090 in ComputeMark overall while being 16% faster than the average RTX 3080 and the RX 6900 XT. A similar trend is seen in the LuxMark Room GPU test as well. However, AMD has a very significant lead over all NVIDIA offerings in the LuxMark Sala GPU test. While the RTX 3080 Ti is about 15% faster in Sala GPU compared to the average RTX 3080, it is 53% behind the Radeon RX 6900 XT. 

Geekbench compute tests show the RTX 3080 Ti having good leads overall. It ties with the RTX 3090 in OpenCL but is interestingly 27% faster in the Vulkan version of the test.

ComputeMark v2.1
1024x600 Normal, QJuliaRayTrace
Average NVIDIA GeForce RTX 3090
  (16403 - 18223, n=10)
17454 Points +2%
NVIDIA GeForce RTX 3080 Ti Founders Edition
NVIDIA GeForce RTX 3080 Ti, R7 5800X
17050 Points
Nvidia GeForce RTX 3090 Founders Edition
NVIDIA GeForce RTX 3090, R9 5900X
16543 Points -3%
Average NVIDIA GeForce RTX 3080
  (14718 - 15508, n=2)
15113 Points -11%
ASUS GeForce RTX 3080 ROG STRIX OC GAMING
NVIDIA GeForce RTX 3080, R9 5900X
14718 Points -14%
AMD Radeon RX 6900 XT
AMD Radeon RX 6900 XT, R9 5950X
12255 Points -28%
MSI GeForce RTX 3070 Gaming X Trio
NVIDIA GeForce RTX 3070, R9 5900X
11816 Points -31%
Average NVIDIA GeForce RTX 3070
  (11510 - 11816, n=3)
11665 Points -32%
AMD Radeon RX 6800 XT
AMD Radeon RX 6800 XT, R9 5950X
11304 Points -34%
Average NVIDIA Titan RTX
  (9418 - 10129, n=3)
9748 Points -43%
Average NVIDIA GeForce RTX 2080 Ti (Desktop)
  (9104 - 9690, n=3)
9492 Points -44%
KFA2 GeForce RTX 2080 Ti EX
NVIDIA GeForce RTX 2080 Ti (Desktop), R9 3900X
9104 Points -47%
Nvidia GeForce RTX 2080 Super
NVIDIA GeForce RTX 2080 Super (Desktop), R7 2700X
7258 Points -57%
1024x600 Normal, Mandel Scalar
Average NVIDIA GeForce RTX 3090
  (10650 - 11564, n=10)
11162 Points +1%
NVIDIA GeForce RTX 3080 Ti Founders Edition
NVIDIA GeForce RTX 3080 Ti, R7 5800X
11049 Points
AMD Radeon RX 6900 XT
AMD Radeon RX 6900 XT, R9 5950X
10834 Points -2%
Nvidia GeForce RTX 3090 Founders Edition
NVIDIA GeForce RTX 3090, R9 5900X
10650 Points -4%
AMD Radeon RX 6800 XT
AMD Radeon RX 6800 XT, R9 5950X
10018 Points -9%
Average NVIDIA GeForce RTX 3080
  (9554 - 9938, n=2)
9746 Points -12%
ASUS GeForce RTX 3080 ROG STRIX OC GAMING
NVIDIA GeForce RTX 3080, R9 5900X
9554 Points -14%
MSI GeForce RTX 3070 Gaming X Trio
NVIDIA GeForce RTX 3070, R9 5900X
7314 Points -34%
Average NVIDIA GeForce RTX 3070
  (7042 - 7314, n=3)
7169 Points -35%
Average NVIDIA Titan RTX
  (5977 - 6406, n=3)
6184 Points -44%
Average NVIDIA GeForce RTX 2080 Ti (Desktop)
  (5679 - 6226, n=3)
6010 Points -46%
KFA2 GeForce RTX 2080 Ti EX
NVIDIA GeForce RTX 2080 Ti (Desktop), R9 3900X
5679 Points -49%
Nvidia GeForce RTX 2080 Super
NVIDIA GeForce RTX 2080 Super (Desktop), R7 2700X
4525 Points -59%
1024x600 Normal, Mandel Vector
NVIDIA GeForce RTX 3080 Ti Founders Edition
NVIDIA GeForce RTX 3080 Ti, R7 5800X
9513 Points
Average NVIDIA GeForce RTX 3090
  (8038 - 10097, n=10)
9467 Points 0%
Nvidia GeForce RTX 3090 Founders Edition
NVIDIA GeForce RTX 3090, R9 5900X
9236 Points -3%
AMD Radeon RX 6900 XT
AMD Radeon RX 6900 XT, R9 5950X
8690 Points -9%
AMD Radeon RX 6800 XT
AMD Radeon RX 6800 XT, R9 5950X
8399 Points -12%
Average NVIDIA GeForce RTX 3080
  (7148 - 7540, n=2)
7344 Points -23%
ASUS GeForce RTX 3080 ROG STRIX OC GAMING
NVIDIA GeForce RTX 3080, R9 5900X
7148 Points -25%
Average NVIDIA GeForce RTX 3070
  (5364 - 6266, n=3)
5707 Points -40%
MSI GeForce RTX 3070 Gaming X Trio
NVIDIA GeForce RTX 3070, R9 5900X
5490 Points -42%
Average NVIDIA Titan RTX
  (4944 - 5440, n=3)
5158 Points -46%
Average NVIDIA GeForce RTX 2080 Ti (Desktop)
  (4695 - 5092, n=3)
4941 Points -48%
KFA2 GeForce RTX 2080 Ti EX
NVIDIA GeForce RTX 2080 Ti (Desktop), R9 3900X
4695 Points -51%
Nvidia GeForce RTX 2080 Super
NVIDIA GeForce RTX 2080 Super (Desktop), R7 2700X
3835 Points -60%
1024x600 Normal, Fluid 2DTexArr
Average NVIDIA GeForce RTX 3090
  (4344 - 4608, n=10)
4492 Points +1%
NVIDIA GeForce RTX 3080 Ti Founders Edition
NVIDIA GeForce RTX 3080 Ti, R7 5800X
4453 Points
Nvidia GeForce RTX 3090 Founders Edition
NVIDIA GeForce RTX 3090, R9 5900X
4344 Points -2%
Average NVIDIA GeForce RTX 3080
  (4087 - 4159, n=2)
4123 Points -7%
ASUS GeForce RTX 3080 ROG STRIX OC GAMING
NVIDIA GeForce RTX 3080, R9 5900X
4087 Points -8%
AMD Radeon RX 6800 XT
AMD Radeon RX 6800 XT, R9 5950X
3947 Points -11%
AMD Radeon RX 6900 XT
AMD Radeon RX 6900 XT, R9 5950X
3924 Points -12%
Average NVIDIA Titan RTX
  (3691 - 3828, n=3)
3757 Points -16%
Average NVIDIA GeForce RTX 2080 Ti (Desktop)
  (3444 - 3539, n=3)
3499 Points -21%
KFA2 GeForce RTX 2080 Ti EX
NVIDIA GeForce RTX 2080 Ti (Desktop), R9 3900X
3444 Points -23%
MSI GeForce RTX 3070 Gaming X Trio
NVIDIA GeForce RTX 3070, R9 5900X
2704 Points -39%
Average NVIDIA GeForce RTX 3070
  (2666 - 2706, n=3)
2692 Points -40%
Nvidia GeForce RTX 2080 Super
NVIDIA GeForce RTX 2080 Super (Desktop), R7 2700X
2655 Points -40%
1024x600 Normal, Fluid 3DTex
Average NVIDIA GeForce RTX 3090
  (5246 - 5520, n=10)
5448 Points +3%
NVIDIA GeForce RTX 3080 Ti Founders Edition
NVIDIA GeForce RTX 3080 Ti, R7 5800X
5312 Points
Nvidia GeForce RTX 3090 Founders Edition
NVIDIA GeForce RTX 3090, R9 5900X
5246 Points -1%
AMD Radeon RX 6800 XT
AMD Radeon RX 6800 XT, R9 5950X
5154 Points -3%
AMD Radeon RX 6900 XT
AMD Radeon RX 6900 XT, R9 5950X
5154 Points -3%
Average NVIDIA GeForce RTX 3080
  (4417 - 4450, n=2)
4434 Points -17%
ASUS GeForce RTX 3080 ROG STRIX OC GAMING
NVIDIA GeForce RTX 3080, R9 5900X
4417 Points -17%
Average NVIDIA Titan RTX
  (3877 - 4027, n=3)
3955 Points -26%
Average NVIDIA GeForce RTX 2080 Ti (Desktop)
  (3589 - 3653, n=3)
3625 Points -32%
KFA2 GeForce RTX 2080 Ti EX
NVIDIA GeForce RTX 2080 Ti (Desktop), R9 3900X
3589 Points -32%
MSI GeForce RTX 3070 Gaming X Trio
NVIDIA GeForce RTX 3070, R9 5900X
2776 Points -48%
Average NVIDIA GeForce RTX 3070
  (2749 - 2791, n=3)
2772 Points -48%
Nvidia GeForce RTX 2080 Super
NVIDIA GeForce RTX 2080 Super (Desktop), R7 2700X
2736 Points -48%
1024x600 Normal, Score
Average NVIDIA GeForce RTX 3090
  (44948 - 49118, n=9)
47804 Points +1%
NVIDIA GeForce RTX 3080 Ti Founders Edition
NVIDIA GeForce RTX 3080 Ti, R7 5800X
47377 Points
Nvidia GeForce RTX 3090 Founders Edition
NVIDIA GeForce RTX 3090, R9 5900X
46018 Points -3%
AMD Radeon RX 6900 XT
AMD Radeon RX 6900 XT, R9 5950X
40857 Points -14%
Average NVIDIA GeForce RTX 3080
  (39924 - 41594, n=2)
40759 Points -14%
ASUS GeForce RTX 3080 ROG STRIX OC GAMING
NVIDIA GeForce RTX 3080, R9 5900X
39924 Points -16%
AMD Radeon RX 6800 XT
AMD Radeon RX 6800 XT, R9 5950X
38823 Points -18%
MSI GeForce RTX 3070 Gaming X Trio
NVIDIA GeForce RTX 3070, R9 5900X
30100 Points -36%
Average NVIDIA GeForce RTX 3070
  (29330 - 30581, n=3)
30004 Points -37%
Average NVIDIA Titan RTX
  (27907 - 29830, n=3)
28802 Points -39%
Average NVIDIA GeForce RTX 2080 Ti (Desktop)
  (26510 - 28145, n=3)
27567 Points -42%
KFA2 GeForce RTX 2080 Ti EX
NVIDIA GeForce RTX 2080 Ti (Desktop), R9 3900X
26510 Points -44%
Nvidia GeForce RTX 2080 Super
NVIDIA GeForce RTX 2080 Super (Desktop), R7 2700X
21009 Points -56%
LuxMark v2.0 64Bit
Room GPUs-only
Average NVIDIA GeForce RTX 3090
  (5727 - 5985, n=9)
5893 Samples/s +2%
Nvidia GeForce RTX 3090 Founders Edition
NVIDIA GeForce RTX 3090, R9 5900X
5808 Samples/s +1%
NVIDIA GeForce RTX 3080 Ti Founders Edition
NVIDIA GeForce RTX 3080 Ti, R7 5800X
5772 Samples/s
Average NVIDIA GeForce RTX 3080
  (5112 - 5198, n=2)
5155 Samples/s -11%
ASUS GeForce RTX 3080 ROG STRIX OC GAMING
NVIDIA GeForce RTX 3080, R9 5900X
5112 Samples/s -11%
AMD Radeon RX 6900 XT
AMD Radeon RX 6900 XT, R9 5950X
5084 Samples/s -12%
AMD Radeon RX 6800 XT
AMD Radeon RX 6800 XT, R9 5950X
5057 Samples/s -12%
Average NVIDIA Titan RTX
  (4643 - 4703, n=2)
4673 Samples/s -19%
Average NVIDIA GeForce RTX 2080 Ti (Desktop)
  (4425 - 4494, n=3)
4449 Samples/s -23%
KFA2 GeForce RTX 2080 Ti EX
NVIDIA GeForce RTX 2080 Ti (Desktop), R9 3900X
4429 Samples/s -23%
MSI GeForce RTX 3070 Gaming X Trio
NVIDIA GeForce RTX 3070, R9 5900X
4293 Samples/s -26%
Average NVIDIA GeForce RTX 3070
  (2187 - 4293, n=3)
3588 Samples/s -38%
Nvidia GeForce RTX 2080 Super
NVIDIA GeForce RTX 2080 Super (Desktop), R7 2700X
3430 Samples/s -41%
Sala GPUs-only
AMD Radeon RX 6900 XT
AMD Radeon RX 6900 XT, R9 5950X
31400 Samples/s +111%
AMD Radeon RX 6800 XT
AMD Radeon RX 6800 XT, R9 5950X
28023 Samples/s +88%
Average NVIDIA GeForce RTX 3090
  (14590 - 15242, n=9)
14945 Samples/s 0%
NVIDIA GeForce RTX 3080 Ti Founders Edition
NVIDIA GeForce RTX 3080 Ti, R7 5800X
14871 Samples/s
Nvidia GeForce RTX 3090 Founders Edition
NVIDIA GeForce RTX 3090, R9 5900X
14670 Samples/s -1%
Average NVIDIA GeForce RTX 3080
  (12797 - 12980, n=2)
12889 Samples/s -13%
ASUS GeForce RTX 3080 ROG STRIX OC GAMING
NVIDIA GeForce RTX 3080, R9 5900X
12797 Samples/s -14%
Average NVIDIA Titan RTX
  (10799 - 10996, n=2)
10898 Samples/s -27%
Average NVIDIA GeForce RTX 2080 Ti (Desktop)
  (9999 - 10291, n=3)
10156 Samples/s -32%
MSI GeForce RTX 3070 Gaming X Trio
NVIDIA GeForce RTX 3070, R9 5900X
10115 Samples/s -32%
Average NVIDIA GeForce RTX 3070
  (10096 - 10115, n=3)
10107 Samples/s -32%
KFA2 GeForce RTX 2080 Ti EX
NVIDIA GeForce RTX 2080 Ti (Desktop), R9 3900X
9999 Samples/s -33%
Nvidia GeForce RTX 2080 Super
NVIDIA GeForce RTX 2080 Super (Desktop), R7 2700X
7878 Samples/s -47%
Geekbench 5.5
OpenCL Score
Average NVIDIA GeForce RTX 3090
  (199930 - 224611, n=19)
214008 Points 0%
NVIDIA GeForce RTX 3080 Ti Founders Edition
NVIDIA GeForce RTX 3080 Ti, R7 5800X
213283 Points
Nvidia GeForce RTX 3090 Founders Edition
NVIDIA GeForce RTX 3090, R9 5900X
199930 Points -6%
ASUS GeForce RTX 3080 ROG STRIX OC GAMING
NVIDIA GeForce RTX 3080, R9 5900X
192091 Points -10%
Average NVIDIA GeForce RTX 3080
  (164477 - 192091, n=2)
178284 Points -16%
AMD Radeon RX 6900 XT
AMD Radeon RX 6900 XT, R9 5950X
172661 Points -19%
AMD Radeon RX 6800 XT
AMD Radeon RX 6800 XT, R9 5950X
159072 Points -25%
AMD Ryzen 9 5900X
NVIDIA Titan RTX, R9 5900X
149070 Points -30%
Average NVIDIA Titan RTX
  (132850 - 153940, n=20)
140450 Points -34%
Average NVIDIA GeForce RTX 3070
  (134961 - 138625, n=4)
136574 Points -36%
MSI GeForce RTX 3070 Gaming X Trio
NVIDIA GeForce RTX 3070, R9 5900X
136521 Points -36%
Vulkan Score
NVIDIA GeForce RTX 3080 Ti Founders Edition
NVIDIA GeForce RTX 3080 Ti, R7 5800X
187800 Points
Nvidia GeForce RTX 3090 Founders Edition
NVIDIA GeForce RTX 3090, R9 5900X
147831 Points -21%
Average NVIDIA GeForce RTX 3090
  (62516 - 168974, n=19)
128422 Points -32%
Average NVIDIA Titan RTX
  (70085 - 138172, n=20)
92754 Points -51%
AMD Radeon RX 6900 XT
AMD Radeon RX 6900 XT, R9 5950X
88587 Points -53%
AMD Radeon RX 6800 XT
AMD Radeon RX 6800 XT, R9 5950X
81098 Points -57%
Average NVIDIA GeForce RTX 3080
  (76596 - 83486, n=2)
80041 Points -57%
AMD Ryzen 9 5900X
NVIDIA Titan RTX, R9 5900X
76596 Points -59%
ASUS GeForce RTX 3080 ROG STRIX OC GAMING
NVIDIA GeForce RTX 3080, R9 5900X
76596 Points -59%
Average NVIDIA GeForce RTX 3070
  (27460 - 107958, n=4)
71908 Points -62%
MSI GeForce RTX 3070 Gaming X Trio
NVIDIA GeForce RTX 3070, R9 5900X
62516 Points -67%

Game benchmarks — RTX 3080 Ti scores a home run at 4K Ultra

NVIDIA pitches the RTX 3080 Ti as the flagship gaming GPU, and it does not disappoint. A good number of titles are playable at fully maxed out settings at 4K close to the 100 fps mark. Only a handful of games such as Cyberpunk 2077 (DLSS off), Total War: Three Kingdoms, and Watch Dogs: Legion (DLSS off) struggle to attain the 60 fps sweet spot at 4K Ultra. Those desirous of making the most of their high-refresh rate displays stand to benefit by lowering the resolution to 1440p.

For the most part, the RTX 3080 Ti FE is well-within the margin of error of the RTX 3090's gaming performance. The slight reduction in CUDA cores and halving the memory from the RTX 3090 seems to have negligible effect in current titles. This is a good thing as it translates to a straight US$300 savings (at MSRP!) from the RTX 3090 if your primary use case is 4K Ultra 60 fps+ gaming.

We found the RTX 3080 Ti to be anywhere between 11% and 22% faster than the Radeon RX 6900 XT in our game test suite. That being said, the Radeon RDNA 2 cards did have an edge in Assassin's Creed Valhalla (+11%, 6900 XT) and Hitman 3 (+7%, 6900 XT).

We tested ray-tracing performance in titles such as Call of Duty: Black Ops Cold War, Metro Exodus, Resident Evil Village, and Control with DLSS off and, quite interestingly, the RTX 3080 Ti seemed to offer perceivable benefits over even the RTX 3090 with RT On. Compared to the RTX 3080, we are looking at anywhere between a 12% and 21% uplift in RT performance depending on the resolution. 

NVIDIA seems to have done a good job with the thermals as is evident by the fairly consistent performance near to the 174 fps mark observed in The Witcher 3 stress test at 1080p Ultra. However, we do find that the card can afford attaining a higher fps albeit for a brief period of about five minutes before falling back to the original value. This could probably be due to an opportunistic clock increase at this point during the stress test.

163173183Tooltip
NVIDIA GeForce RTX 3080 Ti Founders Edition NVIDIA GeForce RTX 3080 Ti, R7 5800X: Ø169.6 (163-187)
The Witcher 3
3840x2160 High Graphics & Postprocessing (Nvidia HairWorks Off)
Average NVIDIA GeForce RTX 3090
  (128 - 160.2, n=12)
151.5 fps +2%
NVIDIA GeForce RTX 3080 Ti Founders Edition
NVIDIA GeForce RTX 3080 Ti, R7 5800X
149 (132min, 132.59P1 - 161max) fps
Nvidia GeForce RTX 3090 Founders Edition
NVIDIA GeForce RTX 3090, R9 5900X
148 fps -1%
AMD Radeon RX 6900 XT
AMD Radeon RX 6900 XT, R9 5950X
122 (105min, 105P1 - 134max) fps -18%
ASUS GeForce RTX 3080 ROG STRIX OC GAMING
NVIDIA GeForce RTX 3080, R9 5900X
115 (107min - 124max) fps -23%
Average NVIDIA GeForce RTX 3080
  (114 - 115, n=2)
114.5 fps -23%
AMD Radeon RX 6800 XT
AMD Radeon RX 6800 XT, R9 5950X
110 (97min - 117max) fps -26%
AMD Ryzen 9 5900X
NVIDIA Titan RTX, R9 5900X
104 (97min - 112max) fps -30%
Average NVIDIA Titan RTX
  (94 - 107.1, n=28)
102.4 fps -31%
Average NVIDIA GeForce RTX 2080 Ti (Desktop)
  (96 - 101, n=3)
98.3 fps -34%
KFA2 GeForce RTX 2080 Ti EX
NVIDIA GeForce RTX 2080 Ti (Desktop), R9 3900X
96 (87min - 109max) fps -36%
Average NVIDIA GeForce RTX 3070
  (84 - 93.9, n=5)
89.3 fps -40%
MSI GeForce RTX 3070 Gaming X Trio
NVIDIA GeForce RTX 3070, R9 5900X
88.2 (82min - 97max) fps -41%
Nvidia GeForce RTX 2080 Super
NVIDIA GeForce RTX 2080 Super (Desktop), R7 2700X
79 (71min - 87max) fps -47%
Average NVIDIA GeForce RTX 2080 Super (Desktop)
  ()
79 fps -47%
Nvidia GeForce RTX 2070 Super
NVIDIA GeForce RTX 2070 Super (Desktop), R7 2700X
68 (61min - 74max) fps -54%
3840x2160 Ultra Graphics & Postprocessing (HBAO+)
Average NVIDIA GeForce RTX 3090
  (85.4 - 98.5, n=8)
93.4 fps 0%
NVIDIA GeForce RTX 3080 Ti Founders Edition
NVIDIA GeForce RTX 3080 Ti, R7 5800X
93.2 (86min, 86P1 - 103max) fps
Nvidia GeForce RTX 3090 Founders Edition
NVIDIA GeForce RTX 3090, R9 5900X
91.8 fps -2%
Average NVIDIA GeForce RTX 3080
  (78 - 85.7, n=2)
81.9 fps -12%
ASUS GeForce RTX 3080 ROG STRIX OC GAMING
NVIDIA GeForce RTX 3080, R9 5900X
78 (72min - 83max) fps -16%
AMD Radeon RX 6900 XT
AMD Radeon RX 6900 XT, R9 5950X
76.6 (70min, 70P1 - 84max) fps -18%
Average NVIDIA Titan RTX
  ()
71.8 fps -23%
Average NVIDIA GeForce RTX 2080 Ti (Desktop)
  (65 - 67, n=3)
65.7 fps -30%
KFA2 GeForce RTX 2080 Ti EX
NVIDIA GeForce RTX 2080 Ti (Desktop), R9 3900X
65 (59min - 71max) fps -30%
Average NVIDIA GeForce RTX 3070
  (59 - 60.3, n=2)
59.7 fps -36%
Nvidia GeForce RTX 2080 Super
NVIDIA GeForce RTX 2080 Super (Desktop), R7 2700X
55.2 (49min - 61max) fps -41%
Average NVIDIA GeForce RTX 2080 Super (Desktop)
  (55.2 - 55.2, n=2)
55.2 fps -41%
Nvidia GeForce RTX 2070 Super
NVIDIA GeForce RTX 2070 Super (Desktop), R7 2700X
46.3 (41min - 50max) fps -50%
1920x1080 Ultra Graphics & Postprocessing (HBAO+)
Average NVIDIA GeForce RTX 3090
  (160 - 192.6, n=16)
179.9 fps +3%
NVIDIA GeForce RTX 3080 Ti Founders Edition
NVIDIA GeForce RTX 3080 Ti, R7 5800X
174 (163min, 165P1 - 187max) fps
Nvidia GeForce RTX 3090 Founders Edition
NVIDIA GeForce RTX 3090, R9 5900X
171.5 fps -1%
AMD Radeon RX 6900 XT
AMD Radeon RX 6900 XT, R9 5950X
163.6 (139min - 179max) fps -6%
AMD Radeon RX 6800 XT
AMD Radeon RX 6800 XT, R9 5950X
160 (138min - 179max) fps -8%
ASUS GeForce RTX 3080 ROG STRIX OC GAMING
NVIDIA GeForce RTX 3080, R9 5900X
152 (138min - 171max) fps -13%
Average NVIDIA GeForce RTX 3080
  (145 - 152, n=2)
148.5 fps -15%
AMD Ryzen 9 5900X
NVIDIA Titan RTX, R9 5900X
141 (127min - 154max) fps -19%
Average NVIDIA Titan RTX
  (124 - 150, n=28)
137.7 fps -21%
KFA2 GeForce RTX 2080 Ti EX
NVIDIA GeForce RTX 2080 Ti (Desktop), R9 3900X
135 (118min - 158max) fps -22%
Average NVIDIA GeForce RTX 2080 Ti (Desktop)
  (131 - 136, n=3)
134 fps -23%
MSI GeForce RTX 3070 Gaming X Trio
NVIDIA GeForce RTX 3070, R9 5900X
122 (110min - 138max) fps -30%
Nvidia GeForce RTX 2080 Super
NVIDIA GeForce RTX 2080 Super (Desktop), R7 2700X
109 (81min - 123max) fps -37%
Average NVIDIA GeForce RTX 2080 Super (Desktop)
  ()
109 fps -37%
Average NVIDIA GeForce RTX 3070
  (52.8 - 132.2, n=7)
106.1 fps -39%
Nvidia GeForce RTX 2070 Super
NVIDIA GeForce RTX 2070 Super (Desktop), R7 2700X
97 (83min - 109max) fps -44%
Assassin´s Creed Valhalla
3840x2160 Ultra High Preset
AMD Radeon RX 6900 XT
AMD Radeon RX 6900 XT, R9 5950X (SAM ENABLED)
68 (33min - 230max) fps +11%
AMD Radeon RX 6900 XT
AMD Radeon RX 6900 XT, R9 5950X
63 (32min - 219max) fps +3%
AMD Radeon RX 6800 XT
AMD Radeon RX 6800 XT, R9 5950X
65 (33min - 179max) fps +7%
Average NVIDIA GeForce RTX 3090
  (55 - 74, n=3)
62 fps +2%
NVIDIA GeForce RTX 3080 Ti Founders Edition
NVIDIA GeForce RTX 3080 Ti, R7 5800X
61 (26min - 135max) fps
Nvidia GeForce RTX 3090 Founders Edition
NVIDIA GeForce RTX 3090, R9 5900X
57 (36min - 113max) fps -7%
Average NVIDIA GeForce RTX 3080
  ()
52 fps -15%
MSI GeForce RTX 3070 Gaming X Trio
NVIDIA GeForce RTX 3070, R9 5900X
47 (31min - 92max) fps -23%
Average NVIDIA GeForce RTX 2080 Ti (Desktop)
  ()
46 fps -25%
Average NVIDIA GeForce RTX 3070
  (42 - 47, n=3)
44 fps -28%
AMD Ryzen 9 5900X
NVIDIA Titan RTX, R9 5900X
43 fps -30%
Average NVIDIA Titan RTX
  ()
43 fps -30%
Average NVIDIA GeForce RTX 2080 Super (Desktop)
  ()
36 fps -41%
2560x1440 Ultra High Preset
AMD Radeon RX 6900 XT
AMD Radeon RX 6900 XT, R9 5950X (SAM ENABLED)
115 (41min - 242max) fps +34%
AMD Radeon RX 6900 XT
AMD Radeon RX 6900 XT, R9 5950X
102 (40min - 239max) fps +19%
AMD Radeon RX 6800 XT
AMD Radeon RX 6800 XT, R9 5950X
98 (25min - 211max) fps +14%
Average NVIDIA GeForce RTX 3090
  (76 - 120, n=3)
91.7 fps +7%
NVIDIA GeForce RTX 3080 Ti Founders Edition
NVIDIA GeForce RTX 3080 Ti, R7 5800X
86 (43min - 145max) fps
Nvidia GeForce RTX 3090 Founders Edition
NVIDIA GeForce RTX 3090, R9 5900X
79 (44min - 135max) fps -8%
Average NVIDIA GeForce RTX 3080
  ()
76 fps -12%
MSI GeForce RTX 3070 Gaming X Trio
NVIDIA GeForce RTX 3070, R9 5900X
67 (39min - 124max) fps -22%
Average NVIDIA GeForce RTX 2080 Ti (Desktop)
  ()
67 fps -22%
AMD Ryzen 9 5900X
NVIDIA Titan RTX, R9 5900X
66 fps -23%
Average NVIDIA Titan RTX
  ()
66 fps -23%
Average NVIDIA GeForce RTX 3070
  (65 - 67, n=3)
65.7 fps -24%
Average NVIDIA GeForce RTX 2080 Super (Desktop)
  ()
57 fps -34%
1920x1080 Ultra High Preset
AMD Radeon RX 6900 XT
AMD Radeon RX 6900 XT, R9 5950X (SAM ENABLED)
148 (44min - 248max) fps +48%
AMD Radeon RX 6900 XT
AMD Radeon RX 6900 XT, R9 5950X
125 (43min - 252max) fps +25%
AMD Radeon RX 6800 XT
AMD Radeon RX 6800 XT, R9 5950X
118 (29min - 255max) fps +18%
Average NVIDIA GeForce RTX 3090
  (88 - 152, n=3)
110.3 fps +10%
NVIDIA GeForce RTX 3080 Ti Founders Edition
NVIDIA GeForce RTX 3080 Ti, R7 5800X
100 (50min - 150max) fps
Nvidia GeForce RTX 3090 Founders Edition
NVIDIA GeForce RTX 3090, R9 5900X
91 (48min - 158max) fps -9%
Average NVIDIA GeForce RTX 3080
  ()
88 fps -12%
AMD Ryzen 9 5900X
NVIDIA Titan RTX, R9 5900X
80 fps -20%
Average NVIDIA Titan RTX
  ()
80 fps -20%
Average NVIDIA GeForce RTX 2080 Ti (Desktop)
  ()
80 fps -20%
Average NVIDIA GeForce RTX 3070
  (77 - 80, n=3)
78.3 fps -22%
MSI GeForce RTX 3070 Gaming X Trio
NVIDIA GeForce RTX 3070, R9 5900X
78 (15min - 139max) fps -22%
Average NVIDIA GeForce RTX 2080 Super (Desktop)
  ()
70 fps -30%
The Division 2
3840x2160 Ultra Preset
NVIDIA GeForce RTX 3080 Ti Founders Edition
NVIDIA GeForce RTX 3080 Ti, R7 5800X
76.6 (36.8min, 55.9P1) fps
Average NVIDIA GeForce RTX 3090
  (71.9 - 78, n=4)
74.9 fps -2%
Nvidia GeForce RTX 3090 Founders Edition
NVIDIA GeForce RTX 3090, R9 5900X
72 fps -6%
AMD Radeon RX 6900 XT
AMD Radeon RX 6900 XT, R9 5950X
66.6 (40.2min, 54.6P1) fps -13%
ASUS GeForce RTX 3080 ROG STRIX OC GAMING
NVIDIA GeForce RTX 3080, R9 5900X
65 fps -15%
Average NVIDIA GeForce RTX 3080
  ()
65 fps -15%
AMD Radeon RX 6800 XT
AMD Radeon RX 6800 XT, R9 5950X
63.2 (34.5min, 54.1P1) fps -17%
Average NVIDIA Titan RTX
  ()
62 fps -19%
Average NVIDIA GeForce RTX 2080 Ti (Desktop)
  (53 - 57, n=3)
55.3 fps -28%
KFA2 GeForce RTX 2080 Ti EX
NVIDIA GeForce RTX 2080 Ti (Desktop), R9 3900X
53 fps -31%
MSI GeForce RTX 3070 Gaming X Trio
NVIDIA GeForce RTX 3070, R9 5900X
49 fps -36%
Average NVIDIA GeForce RTX 3070
  ()
49 fps -36%
Nvidia GeForce RTX 2080 Super
NVIDIA GeForce RTX 2080 Super (Desktop), R7 2700X
45 fps -41%
Average NVIDIA GeForce RTX 2080 Super (Desktop)
  (43 - 45, n=2)
44 fps -43%
Nvidia GeForce RTX 2070 Super
NVIDIA GeForce RTX 2070 Super (Desktop), R7 2700X
39 fps -49%
2560x1440 Ultra Preset
Average NVIDIA GeForce RTX 3090
  (120 - 136, n=4)
126.3 fps +4%
Nvidia GeForce RTX 3090 Founders Edition
NVIDIA GeForce RTX 3090, R9 5900X
121 fps 0%
NVIDIA GeForce RTX 3080 Ti Founders Edition
NVIDIA GeForce RTX 3080 Ti, R7 5800X
121 (43.3min, 63.3P1) fps
AMD Radeon RX 6900 XT
AMD Radeon RX 6900 XT, R9 5950X
118 (51.3min, 70.9P1) fps -2%
AMD Radeon RX 6800 XT
AMD Radeon RX 6800 XT, R9 5950X
114 (52.4min, 73P1) fps -6%
ASUS GeForce RTX 3080 ROG STRIX OC GAMING
NVIDIA GeForce RTX 3080, R9 5900X
107 fps -12%
Average NVIDIA GeForce RTX 3080
  ()
107 fps -12%
Average NVIDIA Titan RTX
  ()
102 fps -16%
Average NVIDIA GeForce RTX 2080 Ti (Desktop)
  (92 - 100, n=3)
96.3 fps -20%
KFA2 GeForce RTX 2080 Ti EX
NVIDIA GeForce RTX 2080 Ti (Desktop), R9 3900X
92 fps -24%
MSI GeForce RTX 3070 Gaming X Trio
NVIDIA GeForce RTX 3070, R9 5900X
82 fps -32%
Average NVIDIA GeForce RTX 3070
  ()
82 fps -32%
Nvidia GeForce RTX 2080 Super
NVIDIA GeForce RTX 2080 Super (Desktop), R7 2700X
79 fps -35%
Average NVIDIA GeForce RTX 2080 Super (Desktop)
  ()
79 fps -35%
Nvidia GeForce RTX 2070 Super
NVIDIA GeForce RTX 2070 Super (Desktop), R7 2700X
69 fps -43%
1920x1080 Ultra Preset
Average NVIDIA GeForce RTX 3090
  (140 - 180, n=4)
158 fps +10%
Nvidia GeForce RTX 3090 Founders Edition
NVIDIA GeForce RTX 3090, R9 5900X
152 fps +6%
NVIDIA GeForce RTX 3080 Ti Founders Edition
NVIDIA GeForce RTX 3080 Ti, R7 5800X
143 (43.5min, 71.9P1) fps
ASUS GeForce RTX 3080 ROG STRIX OC GAMING
NVIDIA GeForce RTX 3080, R9 5900X
140 fps -2%
Average NVIDIA GeForce RTX 3080
  ()
140 fps -2%
AMD Radeon RX 6800 XT
AMD Radeon RX 6800 XT, R9 5950X
138 (45.5min, 74.1P1) fps -3%
AMD Radeon RX 6900 XT
AMD Radeon RX 6900 XT, R9 5950X
138 (54.9min, 75.2P1) fps -3%
Average NVIDIA GeForce RTX 2080 Ti (Desktop)
  (123 - 133, n=3)
127 fps -11%
KFA2 GeForce RTX 2080 Ti EX
NVIDIA GeForce RTX 2080 Ti (Desktop), R9 3900X
123 fps -14%
Average NVIDIA Titan RTX
  ()
113 fps -21%
MSI GeForce RTX 3070 Gaming X Trio
NVIDIA GeForce RTX 3070, R9 5900X
112 fps -22%
Average NVIDIA GeForce RTX 3070
  ()
112 fps -22%
Nvidia GeForce RTX 2080 Super
NVIDIA GeForce RTX 2080 Super (Desktop), R7 2700X
106 fps -26%
Average NVIDIA GeForce RTX 2080 Super (Desktop)
  ()
106 fps -26%
Nvidia GeForce RTX 2070 Super
NVIDIA GeForce RTX 2070 Super (Desktop), R7 2700X
90 fps -37%
Red Dead Redemption 2
3840x2160 Maximum Settings
Average NVIDIA GeForce RTX 3090
  (61.9 - 67, n=3)
64.1 fps +2%
Nvidia GeForce RTX 3090 Founders Edition
NVIDIA GeForce RTX 3090, R9 5900X
63.5 (29min - 85max) fps +1%
NVIDIA GeForce RTX 3080 Ti Founders Edition
NVIDIA GeForce RTX 3080 Ti, R7 5800X
62.7 (35.4min, 55.6P1 - 90.3max) fps
Average NVIDIA GeForce RTX 3080
  (56 - 56.4, n=2)
56.2 fps -10%
ASUS GeForce RTX 3080 ROG STRIX OC GAMING
NVIDIA GeForce RTX 3080, R9 5900X
56 fps -11%
AMD Radeon RX 6900 XT
AMD Radeon RX 6900 XT, R9 5950X
54.6 (36.2min, 47.6P1 - 67max) fps -13%
AMD Radeon RX 6800 XT
AMD Radeon RX 6800 XT, R9 5950X
52.9 (41min, 45.5P1 - 65.3max) fps -16%
MSI GeForce RTX 3070 Gaming X Trio
NVIDIA GeForce RTX 3070, R9 5900X
44 (32min - 55max) fps -30%
Average NVIDIA GeForce RTX 3070
  (42.1 - 44, n=3)
42.9 fps -32%
Average NVIDIA GeForce RTX 2080 Ti (Desktop)
  ()
42.3 fps -33%
Average NVIDIA Titan RTX
  ()
41 fps -35%
Average NVIDIA GeForce RTX 2080 Super (Desktop)
  ()
33 fps -47%
2560x1440 Maximum Settings
Average NVIDIA GeForce RTX 3090
  (91.9 - 96, n=3)
93.4 fps +1%
NVIDIA GeForce RTX 3080 Ti Founders Edition
NVIDIA GeForce RTX 3080 Ti, R7 5800X
92.5 (33.8min, 76.9P1 - 155max) fps
Nvidia GeForce RTX 3090 Founders Edition
NVIDIA GeForce RTX 3090, R9 5900X
92.3 (33min - 132max) fps 0%
Average NVIDIA GeForce RTX 3080
  (81 - 86.4, n=2)
83.7 fps -10%
AMD Radeon RX 6800 XT
AMD Radeon RX 6800 XT, R9 5950X
82.7 (59min, 66.7P1 - 103max) fps -11%
AMD Radeon RX 6900 XT
AMD Radeon RX 6900 XT, R9 5950X
82.1 (34min, 66.7P1 - 104max) fps -11%
ASUS GeForce RTX 3080 ROG STRIX OC GAMING
NVIDIA GeForce RTX 3080, R9 5900X
81 fps -12%
MSI GeForce RTX 3070 Gaming X Trio
NVIDIA GeForce RTX 3070, R9 5900X
65 (33min - 100max) fps -30%
Average NVIDIA GeForce RTX 3070
  (63.2 - 65, n=3)
63.9 fps -31%
Average NVIDIA Titan RTX
  ()
63 fps -32%
Average NVIDIA GeForce RTX 2080 Ti (Desktop)
  ()
63 fps -32%
Average NVIDIA GeForce RTX 2080 Super (Desktop)
  ()
50.6 fps -45%
1920x1080 Maximum Settings
NVIDIA GeForce RTX 3080 Ti Founders Edition
NVIDIA GeForce RTX 3080 Ti, R7 5800X
112 (39.2min, 90.9P1 - 148max) fps
Average NVIDIA GeForce RTX 3090
  (109.9 - 115, n=3)
111.6 fps 0%
Nvidia GeForce RTX 3090 Founders Edition
NVIDIA GeForce RTX 3090, R9 5900X
109.9 (37min - 148max) fps -2%
AMD Radeon RX 6800 XT
AMD Radeon RX 6800 XT, R9 5950X
102 (68.7min, 76.9P1 - 129max) fps -9%
Average NVIDIA GeForce RTX 3080
  (96 - 103, n=2)
99.5 fps -11%
AMD Radeon RX 6900 XT
AMD Radeon RX 6900 XT, R9 5950X
98 (34.2min, 76.9P1 - 125max) fps -12%
ASUS GeForce RTX 3080 ROG STRIX OC GAMING
NVIDIA GeForce RTX 3080, R9 5900X
96 fps -14%
MSI GeForce RTX 3070 Gaming X Trio
NVIDIA GeForce RTX 3070, R9 5900X
78 (38min - 126max) fps -30%
Average NVIDIA GeForce RTX 3070
  (76.2 - 78, n=3)
77.4 fps -31%
Average NVIDIA Titan RTX
  ()
76 fps -32%
Average NVIDIA GeForce RTX 2080 Ti (Desktop)
  ()
76 fps -32%
Average NVIDIA GeForce RTX 2080 Super (Desktop)
  ()
61 fps -46%
Mafia Definitive Edition
3840x2160 High Preset
Average NVIDIA GeForce RTX 3090
  (84.5 - 89.1, n=2)
86.8 fps 0%
NVIDIA GeForce RTX 3080 Ti Founders Edition
NVIDIA GeForce RTX 3080 Ti, R7 5800X
86.6 (39.4min, 52.6P0.1, 64P1 - 179max) fps
Nvidia GeForce RTX 3090 Founders Edition
NVIDIA GeForce RTX 3090, R9 5900X
84.5 fps -2%
ASUS GeForce RTX 3080 ROG STRIX OC GAMING
NVIDIA GeForce RTX 3080, R9 5900X
78.2 (17.9min, 31P0.1, 59.3P1 - 292max) fps -10%
Average NVIDIA GeForce RTX 3080
  (78.1 - 78.2, n=2)
78.2 fps -10%
AMD Radeon RX 6900 XT
AMD Radeon RX 6900 XT, R9 5950X
67 (32.3min, 41.7P0.1, 44.7P1 - 211max) fps -23%
Average NVIDIA Titan RTX
  ()
63.4 fps -27%
AMD Radeon RX 6800 XT
AMD Radeon RX 6800 XT, R9 5950X
62.6 (28min, 37.6P0.1, 49.2P1 - 87.3max) fps -28%
Average NVIDIA GeForce RTX 2080 Ti (Desktop)
  ()
62.4 fps -28%
MSI GeForce RTX 3070 Gaming X Trio
NVIDIA GeForce RTX 3070, R9 5900X
56.6 (34.7min, 37.9P0.1, 44.2P1 - 177max) fps -35%
Average NVIDIA GeForce RTX 3070
  (55.2 - 56.6, n=2)
55.9 fps -35%
Average NVIDIA GeForce RTX 2080 Super (Desktop)
  ()
48.5 fps -44%
2560x1440 High Preset
Average NVIDIA GeForce RTX 3090
  (142.3 - 149, n=2)
145.7 fps +3%
Nvidia GeForce RTX 3090 Founders Edition
NVIDIA GeForce RTX 3090, R9 5900X
142.3 fps 0%
NVIDIA GeForce RTX 3080 Ti Founders Edition
NVIDIA GeForce RTX 3080 Ti, R7 5800X
142 (48.1min, 63.2P0.1, 83P1 - 222max) fps
ASUS GeForce RTX 3080 ROG STRIX OC GAMING
NVIDIA GeForce RTX 3080, R9 5900X
137 (26.5min, 66.2P0.1, 95.7P1 - 265max) fps -4%
Average NVIDIA GeForce RTX 3080
  (127 - 137, n=2)
132 fps -7%
AMD Radeon RX 6900 XT
AMD Radeon RX 6900 XT, R9 5950X
120 (17.6min, 61.2P0.1, 83.1P1 - 238max) fps -15%
AMD Radeon RX 6800 XT
AMD Radeon RX 6800 XT, R9 5950X
112 (23.5min, 64P0.1, 80.8P1 - 169max) fps -21%
Average NVIDIA Titan RTX
  ()
109 fps -23%
Average NVIDIA GeForce RTX 2080 Ti (Desktop)
  ()
105 fps -26%
MSI GeForce RTX 3070 Gaming X Trio
NVIDIA GeForce RTX 3070, R9 5900X
98.7 (45.2min, 55.9P0.1, 69.4P1 - 191max) fps -30%
Average NVIDIA GeForce RTX 3070
  (98.1 - 98.7, n=2)
98.4 fps -31%
Average NVIDIA GeForce RTX 2080 Super (Desktop)
  ()
88.8 fps -37%
1920x1080 High Preset
ASUS GeForce RTX 3080 ROG STRIX OC GAMING
NVIDIA GeForce RTX 3080, R9 5900X
169 (32.7min, 75.7P0.1, 112P1 - 361max) fps +4%
NVIDIA GeForce RTX 3080 Ti Founders Edition
NVIDIA GeForce RTX 3080 Ti, R7 5800X
163 (45.1min, 70.3P0.1, 91.6P1 - 335max) fps
Nvidia GeForce RTX 3090 Founders Edition
NVIDIA GeForce RTX 3090, R9 5900X
158.8 fps -3%
Average NVIDIA GeForce RTX 3090
  (157 - 158.8, n=2)
157.9 fps -3%
Average NVIDIA GeForce RTX 3080
  (144 - 169, n=2)
156.5 fps -4%
AMD Radeon RX 6900 XT
AMD Radeon RX 6900 XT, R9 5950X
138 (32.8min, 68.1P0.1, 90.2P1 - 334max) fps -15%
Average NVIDIA GeForce RTX 3070
  (124 - 132, n=2)
128 fps -21%
MSI GeForce RTX 3070 Gaming X Trio
NVIDIA GeForce RTX 3070, R9 5900X
124 (57.4min, 62.8P0.1, 82P1 - 251max) fps -24%
Average NVIDIA Titan RTX
  ()
123.7 fps -24%
AMD Radeon RX 6800 XT
AMD Radeon RX 6800 XT, R9 5950X
121 (23.7min, 68P0.1, 83.3P1 - 223max) fps -26%
Average NVIDIA GeForce RTX 2080 Super (Desktop)
  ()
118.1 fps -28%
Average NVIDIA GeForce RTX 2080 Ti (Desktop)
  ()
117 fps -28%
Cyberpunk 2077 1.0
3840x2160 Ultra Preset
Average NVIDIA GeForce RTX 3090
  (41.5 - 45.3, n=2)
43.4 fps +3%
NVIDIA GeForce RTX 3080 Ti Founders Edition
NVIDIA GeForce RTX 3080 Ti, R7 5800X
42.3 (27.8min, 35.1P0.1, 37.6P1 - 61.2max) fps
Nvidia GeForce RTX 3090 Founders Edition
NVIDIA GeForce RTX 3090, R9 5900X
41.5 fps -2%
Average NVIDIA GeForce RTX 3080
  ()
38.9 fps -8%
AMD Radeon RX 6900 XT
AMD Radeon RX 6900 XT, R9 5950X
34.8 (19.4min, 22.8P0.1, 29.7P1 - 177max) fps -18%
Average NVIDIA GeForce RTX 2080 Ti (Desktop)
  ()
32.2 fps -24%
AMD Ryzen 9 5900X
NVIDIA Titan RTX, R9 5900X
30.9 fps -27%
Average NVIDIA Titan RTX
  ()
30.9 fps -27%
Average NVIDIA GeForce RTX 3070
  (26.6 - 27.9, n=2)
27.3 fps -35%
Average NVIDIA GeForce RTX 2080 Super (Desktop)
  ()
24.1 fps -43%
2560x1440 Ultra Preset
NVIDIA GeForce RTX 3080 Ti Founders Edition
NVIDIA GeForce RTX 3080 Ti, R7 5800X
84.3 (62.5min, 63.4P0.1, 71.2P1 - 108max) fps
Average NVIDIA GeForce RTX 3090
  (78.1 - 85.3, n=2)
81.7 fps -3%
Nvidia GeForce RTX 3090 Founders Edition
NVIDIA GeForce RTX 3090, R9 5900X
78.1 fps -7%
Average NVIDIA GeForce RTX 3080
  ()
72.5 fps -14%
AMD Radeon RX 6900 XT
AMD Radeon RX 6900 XT, R9 5950X
72.3 (21min, 36.7P0.1, 58.6P1 - 231max) fps -14%
Average NVIDIA GeForce RTX 2080 Ti (Desktop)
  ()
64 fps -24%
AMD Ryzen 9 5900X
NVIDIA Titan RTX, R9 5900X
58.4 fps -31%
Average NVIDIA Titan RTX
  ()
58.4 fps -31%
Average NVIDIA GeForce RTX 3070
  (53.7 - 54.8, n=2)
54.3 fps -36%
Average NVIDIA GeForce RTX 2080 Super (Desktop)
  ()
49.1 fps -42%
1920x1080 Ultra Preset
NVIDIA GeForce RTX 3080 Ti Founders Edition
NVIDIA GeForce RTX 3080 Ti, R7 5800X
125 (74.1min, 81.2P0.1, 91P1 - 179max) fps
Nvidia GeForce RTX 3090 Founders Edition
NVIDIA GeForce RTX 3090, R9 5900X
109.7 fps -12%
Average NVIDIA GeForce RTX 3090
  (108 - 109.7, n=2)
108.9 fps -13%
AMD Radeon RX 6900 XT
AMD Radeon RX 6900 XT, R9 5950X
106 (23.2min, 48.3P0.1, 76.1P1 - 189max) fps -15%
Average NVIDIA GeForce RTX 3080
  ()
103 fps -18%
Average NVIDIA GeForce RTX 2080 Ti (Desktop)
  ()
95.4 fps -24%
AMD Ryzen 9 5900X
NVIDIA Titan RTX, R9 5900X
82.3 fps -34%
Average NVIDIA Titan RTX
  ()
82.3 fps -34%
Average NVIDIA GeForce RTX 3070
  (80.6 - 81, n=2)
80.8 fps -35%
Average NVIDIA GeForce RTX 2080 Super (Desktop)
  ()
72.1 fps -42%
1920x1080 Ray Tracing Ultra Preset (DLSS off)
NVIDIA GeForce RTX 3080 Ti Founders Edition
NVIDIA GeForce RTX 3080 Ti, R7 5800X
67.7 (46.3min, 51P0.1, 55P1 - 87.5max) fps
Average NVIDIA GeForce RTX 3090
  (59.6 - 65.4, n=2)
62.5 fps -8%
Nvidia GeForce RTX 3090 Founders Edition
NVIDIA GeForce RTX 3090, R9 5900X
59.6 fps -12%
Average NVIDIA GeForce RTX 3080
  ()
56.6 fps -16%
Average NVIDIA GeForce RTX 2080 Ti (Desktop)
  ()
43.1 fps -36%
Average NVIDIA GeForce RTX 3070
  (41.9 - 42.3, n=2)
42.1 fps -38%
AMD Ryzen 9 5900X
NVIDIA Titan RTX, R9 5900X
40.4 fps -40%
Average NVIDIA Titan RTX
  ()
40.4 fps -40%
Average NVIDIA GeForce RTX 2080 Super (Desktop)
  ()
33 fps -51%
3840x2160 Ray Tracing Ultra Preset (DLSS off)
NVIDIA GeForce RTX 3080 Ti Founders Edition
NVIDIA GeForce RTX 3080 Ti, R7 5800X
21.2 (17.3min, 17.3P0.1, 17.9P1 - 24.5max) fps
Average NVIDIA GeForce RTX 3090
  (19.7 - 22.2, n=2)
21 fps -1%
Nvidia GeForce RTX 3090 Founders Edition
NVIDIA GeForce RTX 3090, R9 5900X
19.7 fps -7%
Average NVIDIA GeForce RTX 3080
  ()
19 fps -10%
Average NVIDIA GeForce RTX 2080 Ti (Desktop)
  ()
13.6 fps -36%
AMD Ryzen 9 5900X
NVIDIA Titan RTX, R9 5900X
13.1 fps -38%
Average NVIDIA Titan RTX
  ()
13.1 fps -38%
Average NVIDIA GeForce RTX 3070
  (10.9 - 12.2, n=2)
11.6 fps -45%
Average NVIDIA GeForce RTX 2080 Super (Desktop)
  ()
7.09 fps -67%
Call of Duty Black Ops Cold War
1920x1080 Highest Settings + Ultra Ray Tracing
AMD Ryzen 9 5900X
NVIDIA Titan RTX, R9 5900X
119 fps +25%
Average NVIDIA Titan RTX
  ()
119 fps +25%
NVIDIA GeForce RTX 3080 Ti Founders Edition
NVIDIA GeForce RTX 3080 Ti, R7 5800X
95.2 (44.1min, 47.7P0.1, 52.9P1 - 250max) fps
Nvidia GeForce RTX 3090 Founders Edition
NVIDIA GeForce RTX 3090, R9 5900X
89 fps -7%
Average NVIDIA GeForce RTX 3090
  (88.3 - 89, n=2)
88.7 fps -7%
Average NVIDIA GeForce RTX 3080
  ()
81.9 fps -14%
Average NVIDIA GeForce RTX 2080 Ti (Desktop)
  ()
77.2 fps -19%
AMD Radeon RX 6900 XT
AMD Radeon RX 6900 XT, R9 5950X
69.5 (40.4min, 48.2P0.1, 54.5P1 - 302max) fps -27%
MSI GeForce RTX 3070 Gaming X Trio
NVIDIA GeForce RTX 3070, R9 5900X
68.5 (19.1min, 22.3P0.1, 30.4P1 - 229max) fps -28%
Average NVIDIA GeForce RTX 3070
  (49.8 - 70.1, n=3)
62.8 fps -34%
Average NVIDIA GeForce RTX 2080 Super (Desktop)
  ()
59 fps -38%
AMD Radeon RX 6800 XT
AMD Radeon RX 6800 XT, R9 5950X
21.8 (8.8min, 9.61P0.1, 16.2P1 - 49.5max) fps -77%
3840x2160 Highest Settings
NVIDIA GeForce RTX 3080 Ti Founders Edition
NVIDIA GeForce RTX 3080 Ti, R7 5800X
76.5 (46.5min, 58.5P0.1, 63.1P1 - 212max) fps
Average NVIDIA GeForce RTX 3090
  (74.6 - 76.1, n=2)
75.4 fps -1%
Nvidia GeForce RTX 3090 Founders Edition
NVIDIA GeForce RTX 3090, R9 5900X
74.6 fps -2%
MSI GeForce RTX 3070 Gaming X Trio
NVIDIA GeForce RTX 3070, R9 5900X
74 (32.6min, 43.5P0.1, 50.6P1 - 270max) fps -3%
AMD Radeon RX 6900 XT
AMD Radeon RX 6900 XT, R9 5950X
68.1 (42.2min, 50.7P0.1, 56.8P1 - 172max) fps -11%
Average NVIDIA GeForce RTX 3080
  ()
65.6 fps -14%
AMD Radeon RX 6800 XT
AMD Radeon RX 6800 XT, R9 5950X
64 (10.8min, 11.6P0.1, 50.8P1 - 159max) fps -16%
Average NVIDIA GeForce RTX 3070
  (43.8 - 74, n=3)
56 fps -27%
Average NVIDIA GeForce RTX 2080 Ti (Desktop)
  ()
54.4 fps -29%
AMD Ryzen 9 5900X
NVIDIA Titan RTX, R9 5900X
52.9 fps -31%
Average NVIDIA Titan RTX
  ()
52.9 fps -31%
Average NVIDIA GeForce RTX 2080 Super (Desktop)
  (38 - 44.5, n=2)
41.3 fps -46%
2560x1440 Highest Settings
NVIDIA GeForce RTX 3080 Ti Founders Edition
NVIDIA GeForce RTX 3080 Ti, R7 5800X
131 (59.4min, 79.8P0.1, 92P1 - 272max) fps
Nvidia GeForce RTX 3090 Founders Edition
NVIDIA GeForce RTX 3090, R9 5900X
124.7 fps -5%
Average NVIDIA GeForce RTX 3090
  (122 - 124.7, n=2)
123.4 fps -6%
AMD Radeon RX 6900 XT
AMD Radeon RX 6900 XT, R9 5950X
115 (54.9min, 82.8P0.1, 92.3P1 - 314max) fps -12%
MSI GeForce RTX 3070 Gaming X Trio
NVIDIA GeForce RTX 3070, R9 5900X
107 (43.6min, 54P0.1, 62.7P1 - 272max) fps -18%
Average NVIDIA GeForce RTX 3080
  ()
104 fps -21%
Average NVIDIA GeForce RTX 3070
  (83 - 107, n=3)
93.2 fps -29%
Average NVIDIA GeForce RTX 2080 Ti (Desktop)
  ()
89.2 fps -32%
AMD Ryzen 9 5900X
NVIDIA Titan RTX, R9 5900X
87.6 fps -33%
Average NVIDIA Titan RTX
  ()
87.6 fps -33%
AMD Radeon RX 6800 XT
AMD Radeon RX 6800 XT, R9 5950X
80.4 (16.5min, 31.8P0.1, 64.3P1 - 285max) fps -39%
Average NVIDIA GeForce RTX 2080 Super (Desktop)
  (51 - 77.6, n=2)
64.3 fps -51%
1920x1080 Highest Settings
NVIDIA GeForce RTX 3080 Ti Founders Edition
NVIDIA GeForce RTX 3080 Ti, R7 5800X
162 (66.2min, 97.6P0.1, 111P1 - 288max) fps
Nvidia GeForce RTX 3090 Founders Edition
NVIDIA GeForce RTX 3090, R9 5900X
161.1 fps -1%
Average NVIDIA GeForce RTX 3090
  (161 - 161.1, n=2)
161.1 fps -1%
AMD Radeon RX 6900 XT
AMD Radeon RX 6900 XT, R9 5950X
153 (60.9min, 98.1P0.1, 117P1 - 437max) fps -6%
AMD Ryzen 9 5900X
NVIDIA Titan RTX, R9 5900X
144 fps -11%
AMD Radeon RX 6800 XT
AMD Radeon RX 6800 XT, R9 5950X
144 (58.7min, 90.7P0.1, 105P1 - 365max) fps -11%
Average NVIDIA Titan RTX
  ()
144 fps -11%
Average NVIDIA GeForce RTX 3080
  ()
127 fps -22%
MSI GeForce RTX 3070 Gaming X Trio
NVIDIA GeForce RTX 3070, R9 5900X
122 (45min, 57.3P0.1, 67.9P1 - 301max) fps -25%
Average NVIDIA GeForce RTX 2080 Ti (Desktop)
  ()
118 fps -27%
Average NVIDIA GeForce RTX 3070
  (95.7 - 122, n=3)
112.6 fps -30%
Average NVIDIA GeForce RTX 2080 Super (Desktop)
  (59 - 106, n=2)
82.5 fps -49%
Metro Exodus
1920x1080 Ultra Quality DXR AF:16x
NVIDIA GeForce RTX 3080 Ti Founders Edition
NVIDIA GeForce RTX 3080 Ti, R7 5800X
112 (53.98min - 169.75max) fps
Average NVIDIA GeForce RTX 3090
  (68.6 - 122.2, n=12)
111.4 fps -1%
Average NVIDIA GeForce RTX 3080
  (91.5 - 102, n=2)
96.8 fps -14%
ASUS GeForce RTX 3080 ROG STRIX OC GAMING
NVIDIA GeForce RTX 3080, R9 5900X
91.5 (51.03min - 134.52max) fps -18%
AMD Radeon RX 6900 XT
AMD Radeon RX 6900 XT, R9 5950X
90.5 (55.53min - 126.79max) fps -19%
AMD Ryzen 9 5900X
NVIDIA Titan RTX, R9 5900X
87.9 (49.32min - 136.76max) fps -22%
Average NVIDIA Titan RTX
  (69 - 95.5, n=23)
86.1 fps -23%
AMD Radeon RX 6800 XT
AMD Radeon RX 6800 XT, R9 5950X
85.5 (52.71min - 120.38max) fps -24%
Average NVIDIA GeForce RTX 2080 Ti (Desktop)
  (78.6 - 84.9, n=3)
81.8 fps -27%
Average NVIDIA GeForce RTX 3070
  (80.4 - 83, n=5)
81.6 fps -27%
MSI GeForce RTX 3070 Gaming X Trio
NVIDIA GeForce RTX 3070, R9 5900X
80.4 (43.5min - 124.3max) fps -28%
KFA2 GeForce RTX 2080 Ti EX
NVIDIA GeForce RTX 2080 Ti (Desktop), R9 3900X
78.6 (43min - 115max) fps -30%
Nvidia GeForce RTX 3090 Founders Edition
NVIDIA GeForce RTX 3090, R9 5900X
68.6 (37.68min - 117.88max) fps -39%
Nvidia GeForce RTX 2080 Super
NVIDIA GeForce RTX 2080 Super (Desktop), R7 2700X
65 (37.62min - 97.62max) fps -42%
Average NVIDIA GeForce RTX 2080 Super (Desktop)
  ()
65 fps -42%
Nvidia GeForce RTX 2070 Super
NVIDIA GeForce RTX 2070 Super (Desktop), R7 2700X
57.5 (34min - 85max) fps -49%
3840x2160 Ultra Quality AF:16x
Average NVIDIA GeForce RTX 3090
  (70.6 - 77.3, n=12)
75 fps +1%
NVIDIA GeForce RTX 3080 Ti Founders Edition
NVIDIA GeForce RTX 3080 Ti, R7 5800X
74.2 (43.62min - 125.9max) fps
Nvidia GeForce RTX 3090 Founders Edition
NVIDIA GeForce RTX 3090, R9 5900X
70.6 (41.43min - 118.98max) fps -5%
AMD Radeon RX 6900 XT
AMD Radeon RX 6900 XT, R9 5950X
66.7 (42.71min - 92.25max) fps -10%
Average NVIDIA GeForce RTX 3080
  (64.1 - 65.9, n=2)
65 fps -12%
ASUS GeForce RTX 3080 ROG STRIX OC GAMING
NVIDIA GeForce RTX 3080, R9 5900X
64.1 (36.54min - 108.57max) fps -14%
AMD Radeon RX 6800 XT
AMD Radeon RX 6800 XT, R9 5950X
56.3 (40.14min - 64.28max) fps -24%
AMD Ryzen 9 5900X
NVIDIA Titan RTX, R9 5900X
54.9 (34.88min - 89.73max) fps -26%
Average NVIDIA Titan RTX
  (51.3 - 57.9, n=27)
54.9 fps -26%
Average NVIDIA GeForce RTX 2080 Ti (Desktop)
  (47.5 - 51, n=3)
49.7 fps -33%
MSI GeForce RTX 3070 Gaming X Trio
NVIDIA GeForce RTX 3070, R9 5900X
49.1 (30.24min - 89.89max) fps -34%
Average NVIDIA GeForce RTX 3070
  (48.3 - 49.7, n=5)
48.9 fps -34%
KFA2 GeForce RTX 2080 Ti EX
NVIDIA GeForce RTX 2080 Ti (Desktop), R9 3900X
47.5 (31min - 69max) fps -36%
Average NVIDIA GeForce RTX 2080 Super (Desktop)
  (40 - 40.4, n=2)
40.2 fps -46%
Nvidia GeForce RTX 2080 Super
NVIDIA GeForce RTX 2080 Super (Desktop), R7 2700X
40 (25.84min - 59.35max) fps -46%
Nvidia GeForce RTX 2070 Super
NVIDIA GeForce RTX 2070 Super (Desktop), R7 2700X
35 (23min - 51max) fps -53%
2560x1440 Ultra Quality AF:16x
Average NVIDIA GeForce RTX 3090
  (102 - 118.2, n=12)
113.2 fps +3%
NVIDIA GeForce RTX 3080 Ti Founders Edition
NVIDIA GeForce RTX 3080 Ti, R7 5800X
110 (55.44min - 188.15max) fps
Nvidia GeForce RTX 3090 Founders Edition
NVIDIA GeForce RTX 3090, R9 5900X
106 (54.88min - 173.25max) fps -4%
AMD Radeon RX 6900 XT
AMD Radeon RX 6900 XT, R9 5950X
102 (59.52min - 156.84max) fps -7%
Average NVIDIA GeForce RTX 3080
  (92.2 - 97.4, n=2)
94.8 fps -14%
AMD Radeon RX 6800 XT
AMD Radeon RX 6800 XT, R9 5950X
94.6 (55.44min - 143.68max) fps -14%
ASUS GeForce RTX 3080 ROG STRIX OC GAMING
NVIDIA GeForce RTX 3080, R9 5900X
92.2 (46.62min - 155.93max) fps -16%
AMD Ryzen 9 5900X
NVIDIA Titan RTX, R9 5900X
84.9 (46.03min - 152.65max) fps -23%
Average NVIDIA Titan RTX
  (69 - 92.9, n=26)
84 fps -24%
Average NVIDIA GeForce RTX 3070
  (74.4 - 78.3, n=5)
75.8 fps -31%
Average NVIDIA GeForce RTX 2080 Ti (Desktop)
  (71.9 - 77.9, n=3)
75.3 fps -32%
MSI GeForce RTX 3070 Gaming X Trio
NVIDIA GeForce RTX 3070, R9 5900X
74.4 (38.95min - 129.85max) fps -32%
KFA2 GeForce RTX 2080 Ti EX
NVIDIA GeForce RTX 2080 Ti (Desktop), R9 3900X
71.9 (40min - 108max) fps -35%
Average NVIDIA GeForce RTX 2080 Super (Desktop)
  (61 - 65, n=2)
63 fps -43%
Nvidia GeForce RTX 2080 Super
NVIDIA GeForce RTX 2080 Super (Desktop), R7 2700X
61 (35.51min - 95.82max) fps -45%
Nvidia GeForce RTX 2070 Super
NVIDIA GeForce RTX 2070 Super (Desktop), R7 2700X
54.3 (32min - 83max) fps -51%
1920x1080 Ultra Quality AF:16x
Average NVIDIA GeForce RTX 3090
  (108 - 145, n=12)
135.3 fps +3%
NVIDIA GeForce RTX 3080 Ti Founders Edition
NVIDIA GeForce RTX 3080 Ti, R7 5800X
131 (62.29min - 206.31max) fps
NVIDIA GeForce RTX 3080 Ti Founders Edition
NVIDIA GeForce RTX 3080 Ti, R7 5800X
131 (62.29min - 206.31max) fps 0%
Nvidia GeForce RTX 3090 Founders Edition
NVIDIA GeForce RTX 3090, R9 5900X
124 (65.58min - 188.71max) fps -5%
AMD Radeon RX 6900 XT
AMD Radeon RX 6900 XT, R9 5950X
123 (67.67min - 199.52max) fps -6%
AMD Radeon RX 6800 XT
AMD Radeon RX 6800 XT, R9 5950X
115 (64.52min - 181.92max) fps -12%
Average NVIDIA GeForce RTX 3080
  (111 - 116, n=2)
113.5 fps -13%
ASUS GeForce RTX 3080 ROG STRIX OC GAMING
NVIDIA GeForce RTX 3080, R9 5900X
111 (57.16min - 183.25max) fps -15%
AMD Ryzen 9 5900X
NVIDIA Titan RTX, R9 5900X
106 (52.66min - 176.55max) fps -19%
Average NVIDIA Titan RTX
  (73 - 116, n=27)
102.2 fps -22%
Average NVIDIA GeForce RTX 3070
  (91.3 - 97.7, n=5)
93.9 fps -28%
Average NVIDIA GeForce RTX 2080 Ti (Desktop)
  (89.7 - 98.6, n=3)
93.8 fps -28%
MSI GeForce RTX 3070 Gaming X Trio
NVIDIA GeForce RTX 3070, R9 5900X
91.3 (46.36min - 152.74max) fps -30%
KFA2 GeForce RTX 2080 Ti EX
NVIDIA GeForce RTX 2080 Ti (Desktop), R9 3900X
89.7 (46min - 140max) fps -32%
Average NVIDIA GeForce RTX 2080 Super (Desktop)
  (76 - 82, n=2)
79 fps -40%
Nvidia GeForce RTX 2080 Super
NVIDIA GeForce RTX 2080 Super (Desktop), R7 2700X
76 (38.54min - 122.4max) fps -42%
Nvidia GeForce RTX 2070 Super
NVIDIA GeForce RTX 2070 Super (Desktop), R7 2700X
67.8 (36min - 110max) fps -48%
Hitman 3
3840x2160 Maximum Settings AF:16x
AMD Radeon RX 6900 XT
AMD Radeon RX 6900 XT, R9 5950X
128.4 fps +7%
AMD Radeon RX 6900 XT
AMD Radeon RX 6900 XT, R9 5950X (SAM ENABLED)
127.8 fps +7%
NVIDIA GeForce RTX 3080 Ti Founders Edition
NVIDIA GeForce RTX 3080 Ti, R7 5800X
119.6 fps
Average NVIDIA GeForce RTX 3090
  (115 - 122, n=2)
118.5 fps -1%
Nvidia GeForce RTX 3090 Founders Edition
NVIDIA GeForce RTX 3090, R9 5900X
115 fps -4%
Average NVIDIA GeForce RTX 3080
  ()
109 fps -9%
Average NVIDIA GeForce RTX 2080 Ti (Desktop)
  ()
85.2 fps -29%
AMD Ryzen 9 5900X
NVIDIA Titan RTX, R9 5900X
82 fps -31%
Average NVIDIA Titan RTX
  ()
82 fps -31%
Average NVIDIA GeForce RTX 3070
  ()
77.5 fps -35%
Average NVIDIA GeForce RTX 2080 Super (Desktop)
  ()
64 fps -46%
2560x1440 Maximum Settings AF:16x
AMD Radeon RX 6900 XT
AMD Radeon RX 6900 XT, R9 5950X
213.1 fps +1%
AMD Radeon RX 6900 XT
AMD Radeon RX 6900 XT, R9 5950X (SAM ENABLED)
213.1 fps +1%
NVIDIA GeForce RTX 3080 Ti Founders Edition
NVIDIA GeForce RTX 3080 Ti, R7 5800X
210.4 fps
Nvidia GeForce RTX 3090 Founders Edition
NVIDIA GeForce RTX 3090, R9 5900X
190 fps -10%
Average NVIDIA GeForce RTX 3090
  (166 - 190, n=2)
178 fps -15%
Average NVIDIA GeForce RTX 3080
  ()
164 fps -22%
Average NVIDIA GeForce RTX 2080 Ti (Desktop)
  ()
147 fps -30%
AMD Ryzen 9 5900X
NVIDIA Titan RTX, R9 5900X
145 fps -31%
Average NVIDIA Titan RTX
  ()
145 fps -31%
Average NVIDIA GeForce RTX 3070
  ()
140 fps -33%
Average NVIDIA GeForce RTX 2080 Super (Desktop)
  ()
115 fps -45%
1920x1080 Maximum Settings AF:16x
AMD Radeon RX 6900 XT
AMD Radeon RX 6900 XT, R9 5950X
276.2 fps +3%
AMD Radeon RX 6900 XT
AMD Radeon RX 6900 XT, R9 5950X (SAM ENABLED)
269.4 fps +1%
NVIDIA GeForce RTX 3080 Ti Founders Edition
NVIDIA GeForce RTX 3080 Ti, R7 5800X
267 fps
Nvidia GeForce RTX 3090 Founders Edition
NVIDIA GeForce RTX 3090, R9 5900X
223 fps -16%
AMD Ryzen 9 5900X
NVIDIA Titan RTX, R9 5900X
202 fps -24%
Average NVIDIA Titan RTX
  ()
202 fps -24%
Average NVIDIA GeForce RTX 3090
  (167 - 223, n=2)
195 fps -27%
Average NVIDIA GeForce RTX 3080
  ()
166 fps -38%
Average NVIDIA GeForce RTX 2080 Super (Desktop)
  ()
166 fps -38%
Average NVIDIA GeForce RTX 3070
  ()
165 fps -38%
Average NVIDIA GeForce RTX 2080 Ti (Desktop)
  ()
162 fps -39%
Outriders
3840x2160 Ultra Preset
Average NVIDIA GeForce RTX 3090
  (85.7 - 89.3, n=2)
87.5 fps +5%
Nvidia GeForce RTX 3090 Founders Edition
NVIDIA GeForce RTX 3090, R9 5900X
85.7 (14.7min, 22.5P0.1, 46.9P1 - 251max) fps +2%
NVIDIA GeForce RTX 3080 Ti Founders Edition
NVIDIA GeForce RTX 3080 Ti, R7 5800X
83.7 (43.7min, 47.1P0.1, 63.2P1 - 197max) fps
Average NVIDIA GeForce RTX 3080
  ()
79.1 fps -5%
AMD Ryzen 9 5900X
NVIDIA Titan RTX, R9 5900X
64 (19.5min, 27.6P0.1, 34.8P1 - 242max) fps -24%
Average NVIDIA Titan RTX
  ()
64 fps -24%
Average NVIDIA GeForce RTX 2080 Ti (Desktop)
  ()
61.8 fps -26%
2560x1440 Ultra Preset
NVIDIA GeForce RTX 3080 Ti Founders Edition
NVIDIA GeForce RTX 3080 Ti, R7 5800X
151 (48.6min, 55.6P0.1, 72.9P1 - 232max) fps
Nvidia GeForce RTX 3090 Founders Edition
NVIDIA GeForce RTX 3090, R9 5900X
150 (18.9min, 38.2P0.1, 79.9P1 - 274max) fps -1%
Average NVIDIA GeForce RTX 3090
  (125 - 150, n=2)
137.5 fps -9%
Average NVIDIA GeForce RTX 3080
  ()
125 fps -17%
AMD Ryzen 9 5900X
NVIDIA Titan RTX, R9 5900X
119 (18.3min, 24.7P0.1, 65.9P1 - 236max) fps -21%
Average NVIDIA Titan RTX
  ()
119 fps -21%
Average NVIDIA GeForce RTX 2080 Ti (Desktop)
  ()
114 fps -25%
1920x1080 Ultra Preset
Nvidia GeForce RTX 3090 Founders Edition
NVIDIA GeForce RTX 3090, R9 5900X
168 (20.9min, 40.1P0.1, 86.5P1 - 275max) fps +14%
AMD Ryzen 9 5900X
NVIDIA Titan RTX, R9 5900X
156 (15.2min, 19.3P0.1, 82.3P1 - 265max) fps +5%
Average NVIDIA Titan RTX
  ()
156 fps +5%
NVIDIA GeForce RTX 3080 Ti Founders Edition
NVIDIA GeForce RTX 3080 Ti, R7 5800X
148 (46.9min, 49.5P0.1, 68.8P1 - 250max) fps
Average NVIDIA GeForce RTX 3090
  (125 - 168, n=2)
146.5 fps -1%
Average NVIDIA GeForce RTX 2080 Ti (Desktop)
  ()
132 fps -11%
Average NVIDIA GeForce RTX 3080
  ()
126 fps -15%
Resident Evil Village
1920x1080 Ray Tracing Preset
Nvidia GeForce RTX 3090 Founders Edition
NVIDIA GeForce RTX 3090, R9 5900X
197 (122min, 151P0.1, 167P1 - 247max) fps +6%
NVIDIA GeForce RTX 3080 Ti Founders Edition
NVIDIA GeForce RTX 3080 Ti, R7 5800X
185 (59.9min, 132P0.1, 146P1 - 260max) fps
Average NVIDIA GeForce RTX 3090
  (144 - 197, n=2)
170.5 fps -8%
Average NVIDIA GeForce RTX 3080
  ()
150 fps -19%
AMD Ryzen 9 5900X
NVIDIA Titan RTX, R9 5900X
138 (84.7min, 95.4P0.1, 105P1 - 185max) fps -25%
Average NVIDIA Titan RTX
  ()
138 fps -25%
Average NVIDIA GeForce RTX 2080 Ti (Desktop)
  ()
138 fps -25%
Average NVIDIA GeForce RTX 3070
  ()
129 fps -30%
3840x2160 Max Preset
Average NVIDIA GeForce RTX 3090
  (116 - 117, n=2)
116.5 fps +2%
Nvidia GeForce RTX 3090 Founders Edition
NVIDIA GeForce RTX 3090, R9 5900X
116 (74.7min, 97.9P0.1, 100P1 - 155max) fps +2%
NVIDIA GeForce RTX 3080 Ti Founders Edition
NVIDIA GeForce RTX 3080 Ti, R7 5800X
114 (60.9min, 95.6P0.1, 99.4P1 - 151max) fps
Average NVIDIA GeForce RTX 3080
  ()
103 fps -10%
Average NVIDIA GeForce RTX 2080 Ti (Desktop)
  ()
74.3 fps -35%
AMD Ryzen 9 5900X
NVIDIA Titan RTX, R9 5900X
74.2 (52.5min, 56.1P0.1, 59.9P1 - 108max) fps -35%
Average NVIDIA Titan RTX
  ()
74.2 fps -35%
Average NVIDIA GeForce RTX 3070
  ()
70.8 fps -38%
2560x1440 Max Preset
Nvidia GeForce RTX 3090 Founders Edition
NVIDIA GeForce RTX 3090, R9 5900X
213 (144min, 170P0.1, 177P1 - 288max) fps +7%
NVIDIA GeForce RTX 3080 Ti Founders Edition
NVIDIA GeForce RTX 3080 Ti, R7 5800X
199 (93min, 150P0.1, 167P1 - 262max) fps
Average NVIDIA GeForce RTX 3090
  (179 - 213, n=2)
196 fps -2%
Average NVIDIA GeForce RTX 3080
  ()
182 fps -9%
Average NVIDIA GeForce RTX 2080 Ti (Desktop)
  ()
147 fps -26%
AMD Ryzen 9 5900X
NVIDIA Titan RTX, R9 5900X
142 (43.4min, 102P0.1, 109P1 - 201max) fps -29%
Average NVIDIA GeForce RTX 3070
  ()
142 fps -29%
Average NVIDIA Titan RTX
  ()
142 fps -29%
1920x1080 Max Preset
Nvidia GeForce RTX 3090 Founders Edition
NVIDIA GeForce RTX 3090, R9 5900X
285 (152min, 198P0.1, 217P1 - 395max) fps +22%
NVIDIA GeForce RTX 3080 Ti Founders Edition
NVIDIA GeForce RTX 3080 Ti, R7 5800X
234 (92.3min, 159P0.1, 175P1 - 298max) fps
Average NVIDIA GeForce RTX 3090
  (180 - 285, n=2)
233 fps 0%
AMD Ryzen 9 5900X
NVIDIA Titan RTX, R9 5900X
212 (117min, 132P0.1, 155P1 - 307max) fps -9%
Average NVIDIA Titan RTX
  ()
212 fps -9%
Average NVIDIA GeForce RTX 3080
  ()
186 fps -21%
Average NVIDIA GeForce RTX 3070
  ()
183 fps -22%
Average NVIDIA GeForce RTX 2080 Ti (Desktop)
  ()
181 fps -23%
Days Gone
3840x2160 Very High Preset
Average NVIDIA GeForce RTX 3090
  (81.2 - 88.7, n=2)
85 fps +2%
NVIDIA GeForce RTX 3080 Ti Founders Edition
NVIDIA GeForce RTX 3080 Ti, R7 5800X
83.3 (24.2min, 39.7P0.1, 58.5P1 - 229max) fps
Nvidia GeForce RTX 3090 Founders Edition
NVIDIA GeForce RTX 3090, R9 5900X
81.2 (30.6min, 39.4P0.1, 55.6P1 - 168max) fps -3%
Average NVIDIA GeForce RTX 3080
  ()
78.6 fps -6%
AMD Ryzen 9 5900X
NVIDIA Titan RTX, R9 5900X
64.9 (32min, 34.4P0.1, 48.3P1 - 168max) fps -22%
Average NVIDIA Titan RTX
  ()
64.9 fps -22%
Average NVIDIA GeForce RTX 2080 Ti (Desktop)
  ()
63.9 fps -23%
Average NVIDIA GeForce RTX 3070
  ()
57.8 fps -31%
2560x1440 Very High Preset
NVIDIA GeForce RTX 3080 Ti Founders Edition
NVIDIA GeForce RTX 3080 Ti, R7 5800X
137 (32.9min, 55.8P0.1, 81.9P1 - 376max) fps
Average NVIDIA GeForce RTX 3090
  (133 - 139, n=2)
136 fps -1%
Nvidia GeForce RTX 3090 Founders Edition
NVIDIA GeForce RTX 3090, R9 5900X
133 (34.2min, 47.6P0.1, 71.1P1 - 307max) fps -3%
Average NVIDIA GeForce RTX 3080
  ()
131 fps -4%
AMD Ryzen 9 5900X
NVIDIA Titan RTX, R9 5900X
108 (35.4min, 45.8P0.1, 62.8P1 - 276max) fps -21%
Average NVIDIA Titan RTX
  ()
108 fps -21%
Average NVIDIA GeForce RTX 2080 Ti (Desktop)
  ()
105 fps -23%
Average NVIDIA GeForce RTX 3070
  ()
99.3 fps -28%
1920x1080 Very High Preset
NVIDIA GeForce RTX 3080 Ti Founders Edition
NVIDIA GeForce RTX 3080 Ti, R7 5800X
178 (22min, 64.2P0.1, 106P1 - 378max) fps
Nvidia GeForce RTX 3090 Founders Edition
NVIDIA GeForce RTX 3090, R9 5900X
164 (30.3min, 46.6P0.1, 78.1P1 - 336max) fps -8%
Average NVIDIA GeForce RTX 3090
  (159 - 164, n=2)
161.5 fps -9%
Average NVIDIA GeForce RTX 3080
  ()
158 fps -11%
AMD Ryzen 9 5900X
NVIDIA Titan RTX, R9 5900X
141 (26.3min, 48.7P0.1, 74.9P1 - 300max) fps -21%
Average NVIDIA Titan RTX
  ()
141 fps -21%
Average NVIDIA GeForce RTX 2080 Ti (Desktop)
  ()
135 fps -24%
Average NVIDIA GeForce RTX 3070
  ()
131 fps -26%
Control
1920x1080 High Quality Preset & High Ray Tracing Preset (DX12)
NVIDIA GeForce RTX 3080 Ti Founders Edition
NVIDIA GeForce RTX 3080 Ti, R7 5800X
114 (5.37min, 73.8P0.1, 94.6P1 - 164max) fps
Average NVIDIA GeForce RTX 3090
  (91.4 - 122.6, n=5)
111.1 fps -3%
Nvidia GeForce RTX 3090 Founders Edition
NVIDIA GeForce RTX 3090, R9 5900X
106.9 fps -6%
ASUS GeForce RTX 3080 ROG STRIX OC GAMING
NVIDIA GeForce RTX 3080, R9 5900X
103 (94min - 116max) fps -10%
Average NVIDIA GeForce RTX 3080
  (98.1 - 103, n=2)
100.6 fps -12%
Average NVIDIA Titan RTX
  (63 - 120, n=3)
88.1 fps -23%
AMD Radeon RX 6900 XT
AMD Radeon RX 6900 XT, R9 5950X (SAM ENABLED)
76.2 (38.7min, 43.3P0.1, 62.8P1 - 142max) fps -33%
AMD Radeon RX 6900 XT
AMD Radeon RX 6900 XT, R9 5950X
73.1 (31.6min, 40.9P0.1, 62.6P1 - 149max) fps -36%
Average NVIDIA GeForce RTX 2080 Ti (Desktop)
  (72 - 76, n=2)
74 fps -35%
KFA2 GeForce RTX 2080 Ti EX
NVIDIA GeForce RTX 2080 Ti (Desktop), R9 3900X
72 (67min - 80max) fps -37%
Average NVIDIA GeForce RTX 3070
  (57.9 - 75.1, n=3)
68.5 fps -40%
AMD Radeon RX 6800 XT
AMD Radeon RX 6800 XT, R9 5950X
66.9 (60min - 75max) fps -41%
MSI GeForce RTX 3070 Gaming X Trio
NVIDIA GeForce RTX 3070, R9 5900X
57.9 (29min - 79max) fps -49%
Average NVIDIA GeForce RTX 2080 Super (Desktop)
  ()
53.2 fps -53%
3840x2160 High Quality Preset (DX11)
NVIDIA GeForce RTX 3080 Ti Founders Edition
NVIDIA GeForce RTX 3080 Ti, R7 5800X
64.9 (41.3min, 50.5P0.1, 55.3P1 - 127max) fps
Average NVIDIA GeForce RTX 3090
  (61.3 - 66, n=5)
62.9 fps -3%
Nvidia GeForce RTX 3090 Founders Edition
NVIDIA GeForce RTX 3090, R9 5900X
61.3 fps -6%
Average NVIDIA GeForce RTX 3080
  (56.2 - 56.7, n=2)
56.5 fps -13%
ASUS GeForce RTX 3080 ROG STRIX OC GAMING
NVIDIA GeForce RTX 3080, R9 5900X
56.2 (49min - 64max) fps -13%
AMD Radeon RX 6900 XT
AMD Radeon RX 6900 XT, R9 5950X
54.7 (39.8min, 41.7P0.1, 44.9P1 - 65.8max) fps -16%
AMD Radeon RX 6900 XT
AMD Radeon RX 6900 XT, R9 5950X (SAM ENABLED)
53.9 (36.6min, 41.7P0.1, 43.5P1 - 64.9max) fps -17%
AMD Radeon RX 6800 XT
AMD Radeon RX 6800 XT, R9 5950X
51.6 (46min - 58max) fps -20%
Average NVIDIA Titan RTX
  (45.2 - 47.3, n=3)
46.5 fps -28%
Average NVIDIA GeForce RTX 2080 Ti (Desktop)
  (42.6 - 45.8, n=2)
44.2 fps -32%
KFA2 GeForce RTX 2080 Ti EX
NVIDIA GeForce RTX 2080 Ti (Desktop), R9 3900X
42.6 (37min - 49max) fps -34%
MSI GeForce RTX 3070 Gaming X Trio
NVIDIA GeForce RTX 3070, R9 5900X
42.3 (37min - 49max) fps -35%
Average NVIDIA GeForce RTX 3070
  (40.6 - 42.3, n=3)
41.3 fps -36%
Average NVIDIA GeForce RTX 2080 Super (Desktop)
  ()
30.4 fps -53%
2560x1440 High Quality Preset (DX11)
NVIDIA GeForce RTX 3080 Ti Founders Edition
NVIDIA GeForce RTX 3080 Ti, R7 5800X
122 (52.6min, 86.2P0.1, 99.3P1 - 392max) fps
Average NVIDIA GeForce RTX 3090
  (115.8 - 123.7, n=5)
120.4 fps -1%
Nvidia GeForce RTX 3090 Founders Edition
NVIDIA GeForce RTX 3090, R9 5900X
115.8 fps -5%
AMD Radeon RX 6900 XT
AMD Radeon RX 6900 XT, R9 5950X
113 (71.5min, 73.2P0.1, 79.6P1 - 164max) fps -7%
AMD Radeon RX 6900 XT
AMD Radeon RX 6900 XT, R9 5950X (SAM ENABLED)
113 (68min, 71.3P0.1, 81.1P1 - 193max) fps -7%
AMD Radeon RX 6800 XT
AMD Radeon RX 6800 XT, R9 5950X
108 (93min - 123max) fps -11%
ASUS GeForce RTX 3080 ROG STRIX OC GAMING
NVIDIA GeForce RTX 3080, R9 5900X
106 (92min - 123max) fps -13%
Average NVIDIA GeForce RTX 3080
  (105 - 106, n=2)
105.5 fps -14%
Average NVIDIA Titan RTX
  (89 - 93.6, n=3)
91.5 fps -25%
Average NVIDIA GeForce RTX 2080 Ti (Desktop)
  (84 - 89, n=2)
86.5 fps -29%
KFA2 GeForce RTX 2080 Ti EX
NVIDIA GeForce RTX 2080 Ti (Desktop), R9 3900X
84 (75min - 95max) fps -31%
MSI GeForce RTX 3070 Gaming X Trio
NVIDIA GeForce RTX 3070, R9 5900X
82.5 (72min - 96max) fps -32%
Average NVIDIA GeForce RTX 3070
  (79.8 - 82.5, n=3)
81.2 fps -33%
Average NVIDIA GeForce RTX 2080 Super (Desktop)
  ()
62 fps -49%
1920x1080 High Quality Preset (DX11)
NVIDIA GeForce RTX 3080 Ti Founders Edition
NVIDIA GeForce RTX 3080 Ti, R7 5800X
181 (49.7min, 115P0.1, 140P1 - 509max) fps
Average NVIDIA GeForce RTX 3090
  (172.2 - 189.2, n=5)
179.9 fps -1%
AMD Radeon RX 6900 XT
AMD Radeon RX 6900 XT, R9 5950X
175 (56.8min, 96P0.1, 112P1 - 314max) fps -3%
AMD Radeon RX 6900 XT
AMD Radeon RX 6900 XT, R9 5950X (SAM ENABLED)
174 (54min, 99P0.1, 112P1 - 335max) fps -4%
Nvidia GeForce RTX 3090 Founders Edition
NVIDIA GeForce RTX 3090, R9 5900X
172.2 fps -5%
AMD Radeon RX 6800 XT
AMD Radeon RX 6800 XT, R9 5950X
168 (145min - 194max) fps -7%
ASUS GeForce RTX 3080 ROG STRIX OC GAMING
NVIDIA GeForce RTX 3080, R9 5900X
155 (133min - 178max) fps -14%
Average NVIDIA GeForce RTX 3080
  (151 - 155, n=2)
153 fps -15%
Average NVIDIA Titan RTX
  (135 - 141.9, n=3)
137.3 fps -24%
Average NVIDIA GeForce RTX 2080 Ti (Desktop)
  (126 - 132, n=2)
129 fps -29%
KFA2 GeForce RTX 2080 Ti EX
NVIDIA GeForce RTX 2080 Ti (Desktop), R9 3900X
126 (111min - 143max) fps -30%
MSI GeForce RTX 3070 Gaming X Trio
NVIDIA GeForce RTX 3070, R9 5900X
122 (103min - 138max) fps -33%
Average NVIDIA GeForce RTX 3070
  (117 - 124.9, n=3)
121.3 fps -33%
Average NVIDIA GeForce RTX 2080 Super (Desktop)
  ()
95 fps -48%
low med. high ultraQHD4K
The Witcher 3 (2015) 174 149
Shadow of the Tomb Raider (2018) 178 157 93
Battlefield V (2018) 196 192 136
Far Cry New Dawn (2019) 122 118 100
Metro Exodus (2019) 131 110 74.2
The Division 2 (2019) 143 121 76.6
Total War: Three Kingdoms (2019) 151.2 103.4 51.4
Control (2019) 181 122 64.9
Borderlands 3 (2019) 129 114 71.2
Red Dead Redemption 2 (2019) 112 92.5 62.7
Doom Eternal (2020) 388 316 191
Gears Tactics (2020) 141.1 147.5 88.3
Mafia Definitive Edition (2020) 163 142 86.6
Watch Dogs Legion (2020) 97 88.5 58.7
Dirt 5 (2020) 163 136 92.4
Assassin´s Creed Valhalla (2020) 100 86 61
Call of Duty Black Ops Cold War (2020) 162 131 76.5
Cyberpunk 2077 1.0 (2020) 125 84.3 42.3
Hitman 3 (2021) 267 210.4 119.6
Outriders (2021) 148 151 83.7
Resident Evil Village (2021) 234 199 114
Days Gone (2021) 178 137 83.3

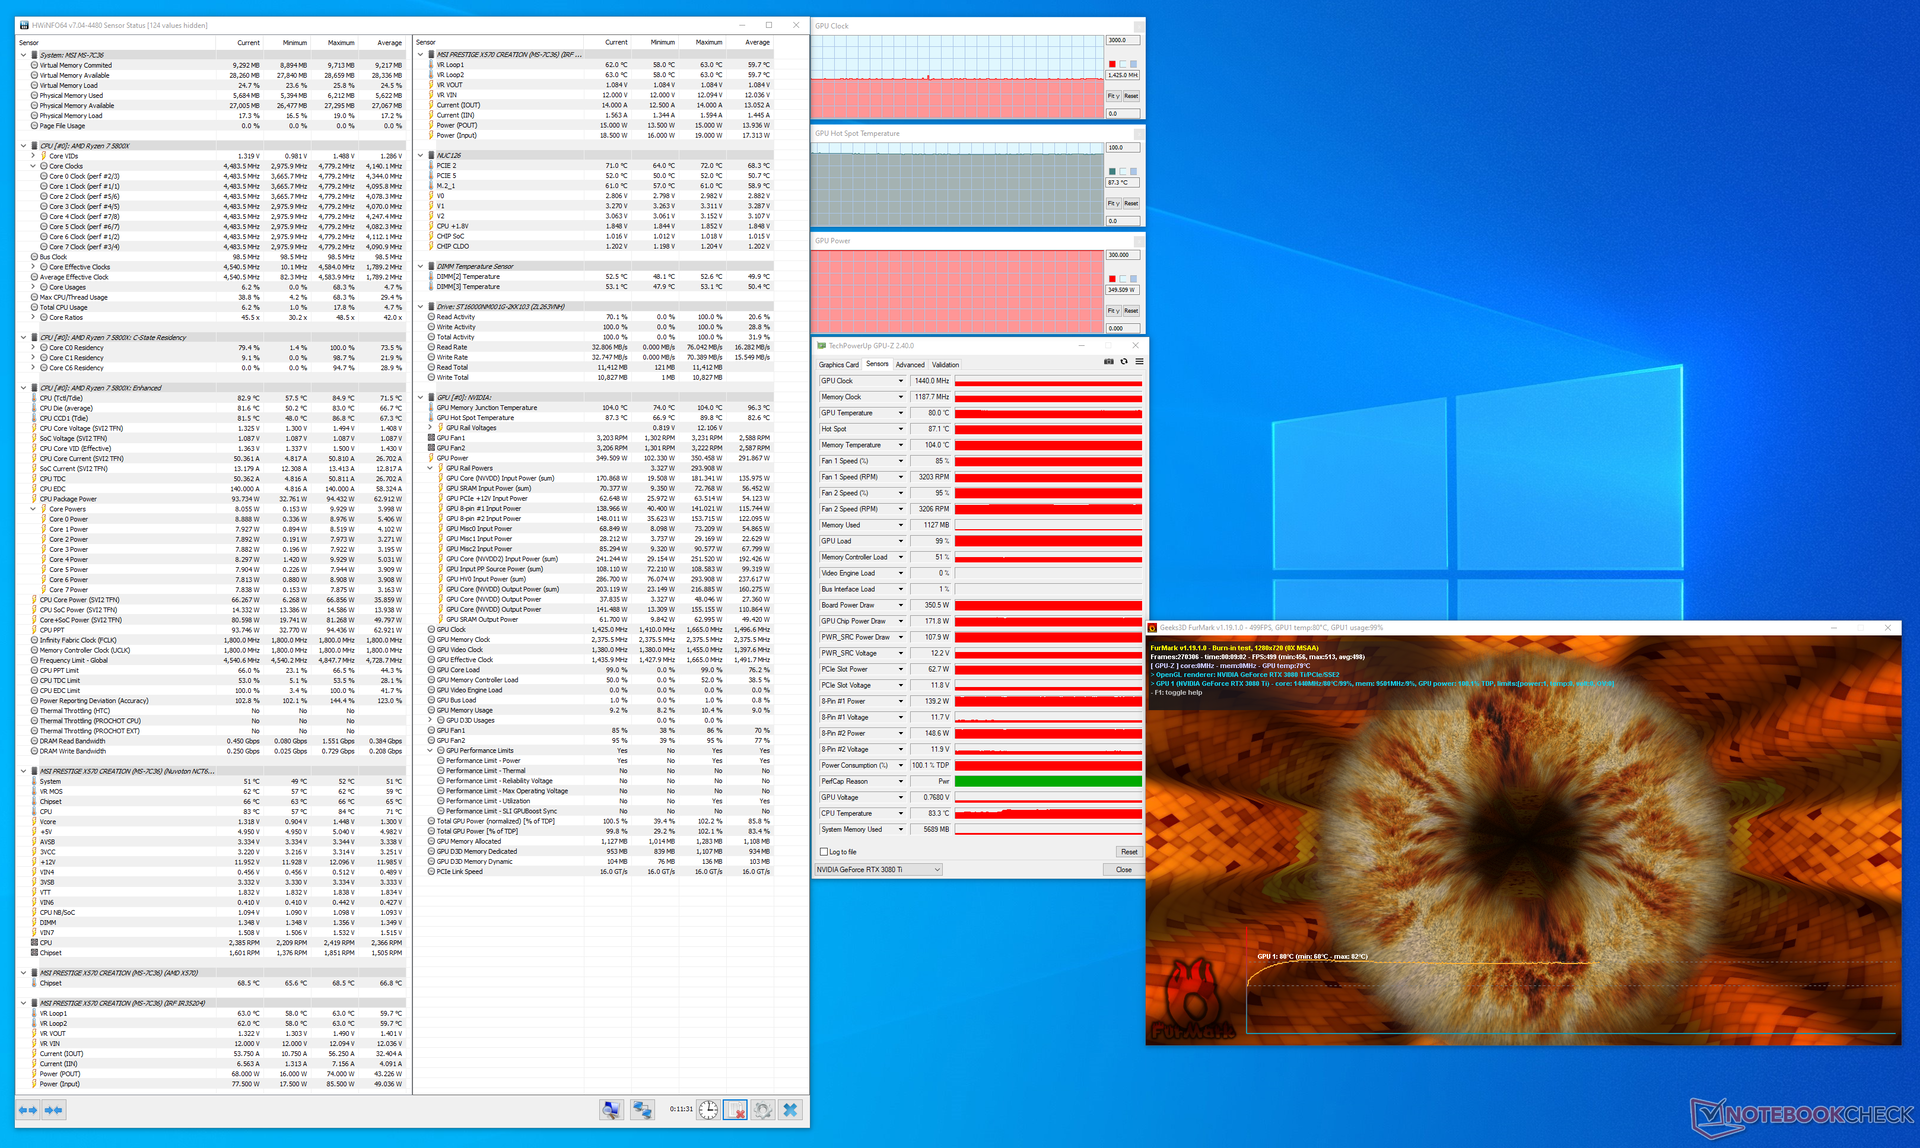
Emissions — Inconsistent at 350 W TGP

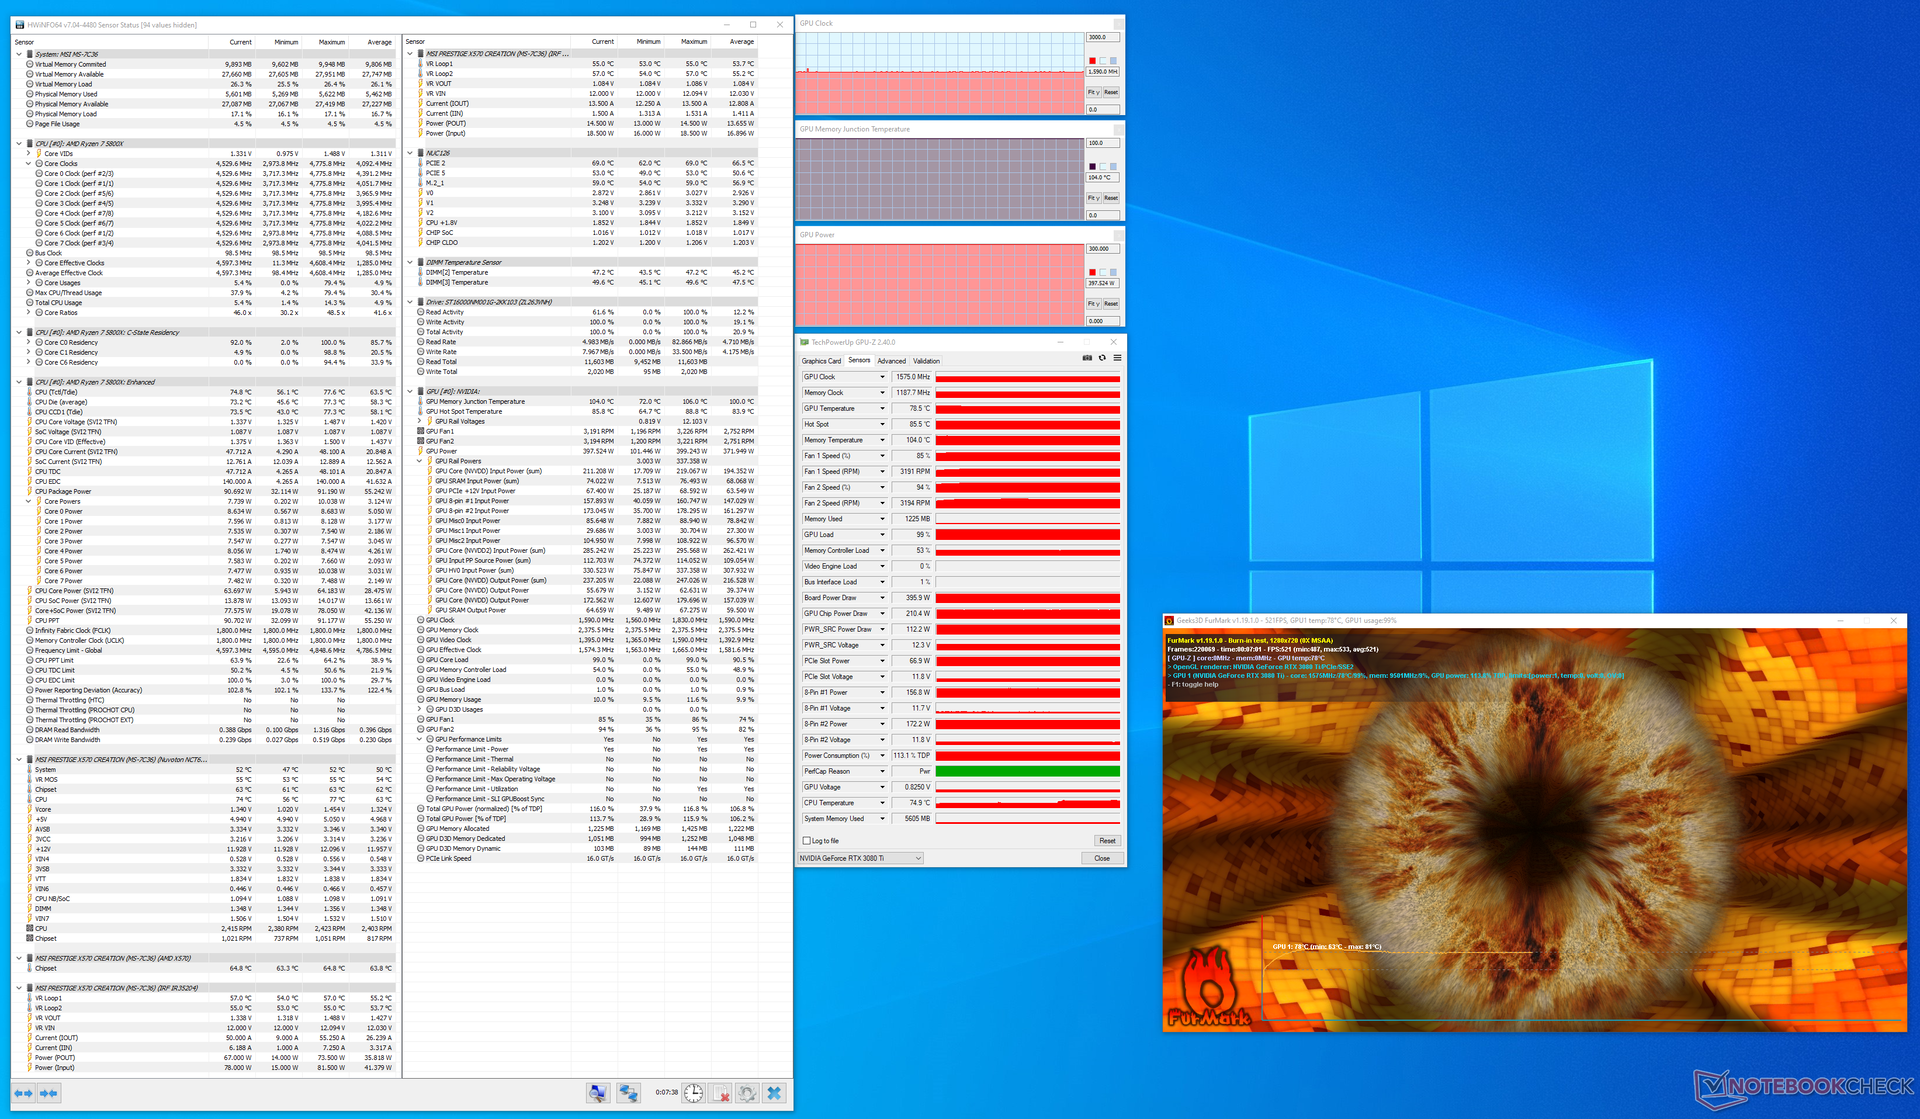
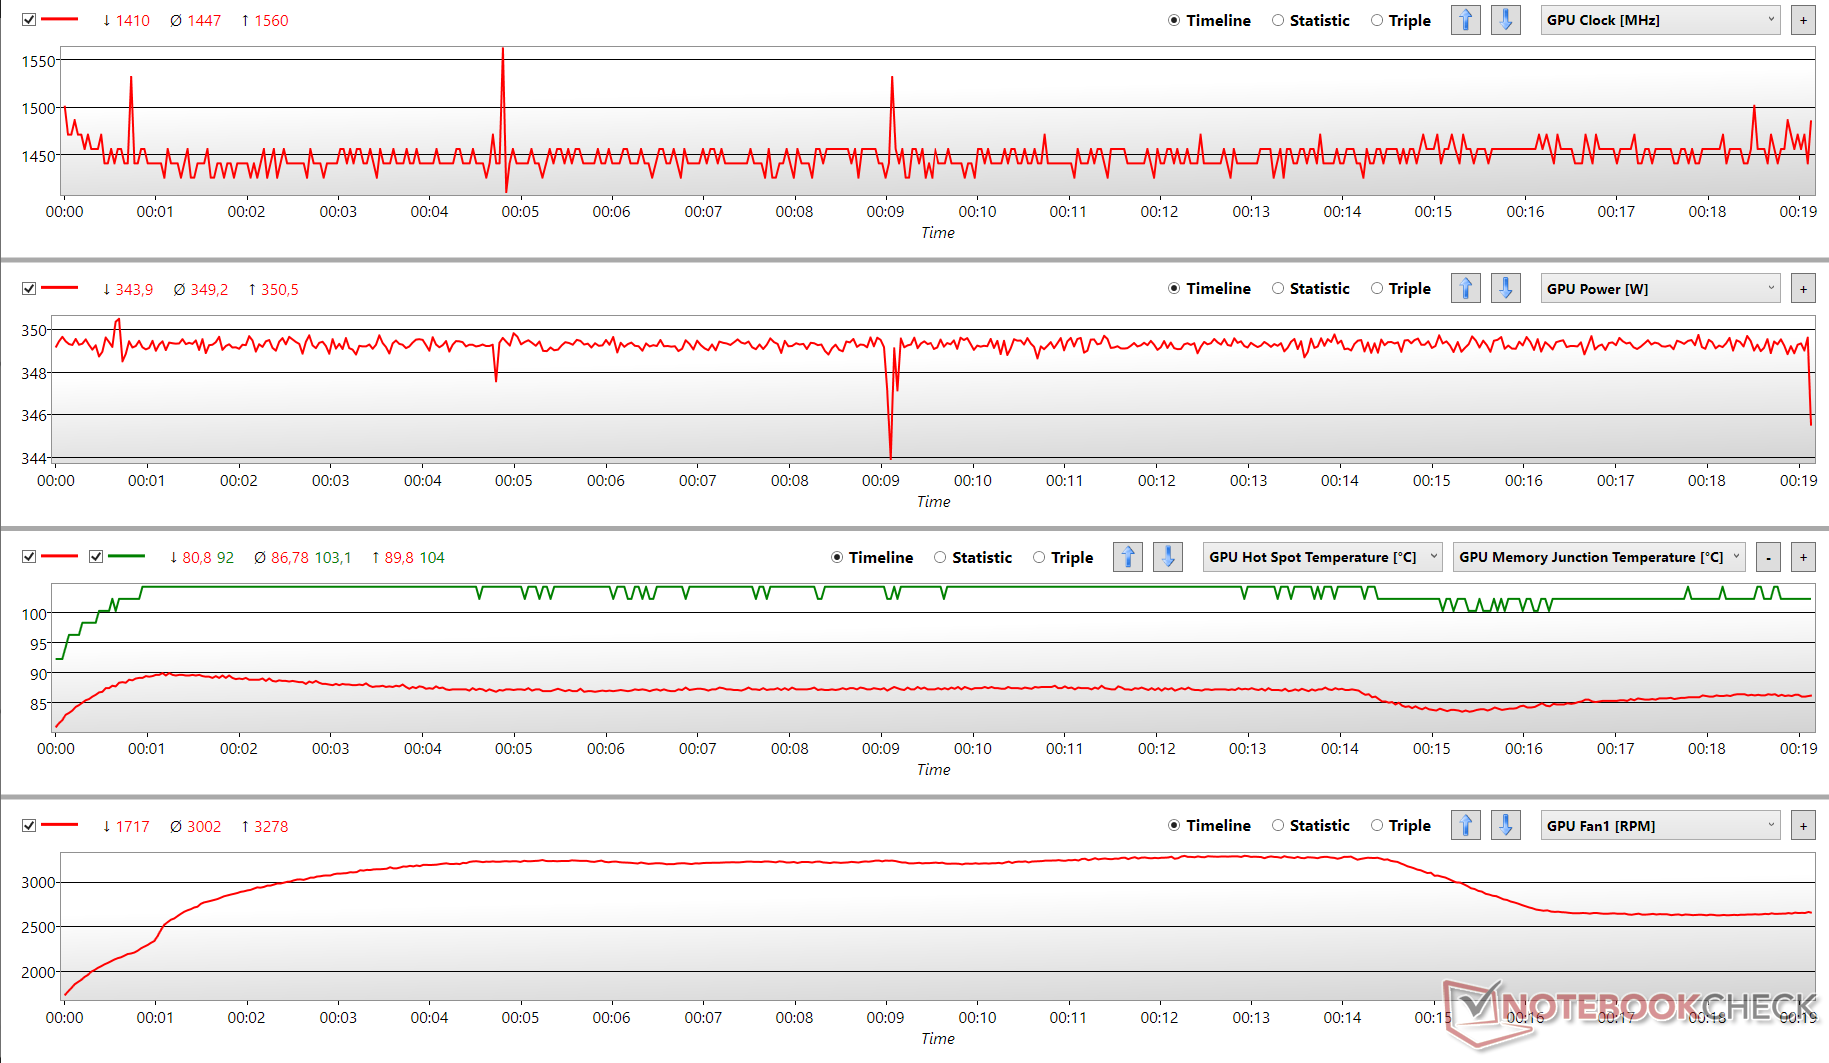
The RTX 3080 Ti is rated at a TGP of 350 W, which can be increased by another 14% to 400 W as specified in the VBIOS. Stressing the card with FurMark at 350 W (100% power target) results in the GPU core hitting 80 °C and the clocks hovering around 1,440 MHz. We did notice the card lowering its power target, sometimes down to 345 W, owing to the set temperature target at 83 °C during which the clocks momentarily increase up to a maximum of 1,550 MHz. NVIDIA could have done a better job with the cooling system, though as the fans seemed to throttle by nearly 1000 RPM towards the end of the run, sensing a momentary drop in hot spot temperature.

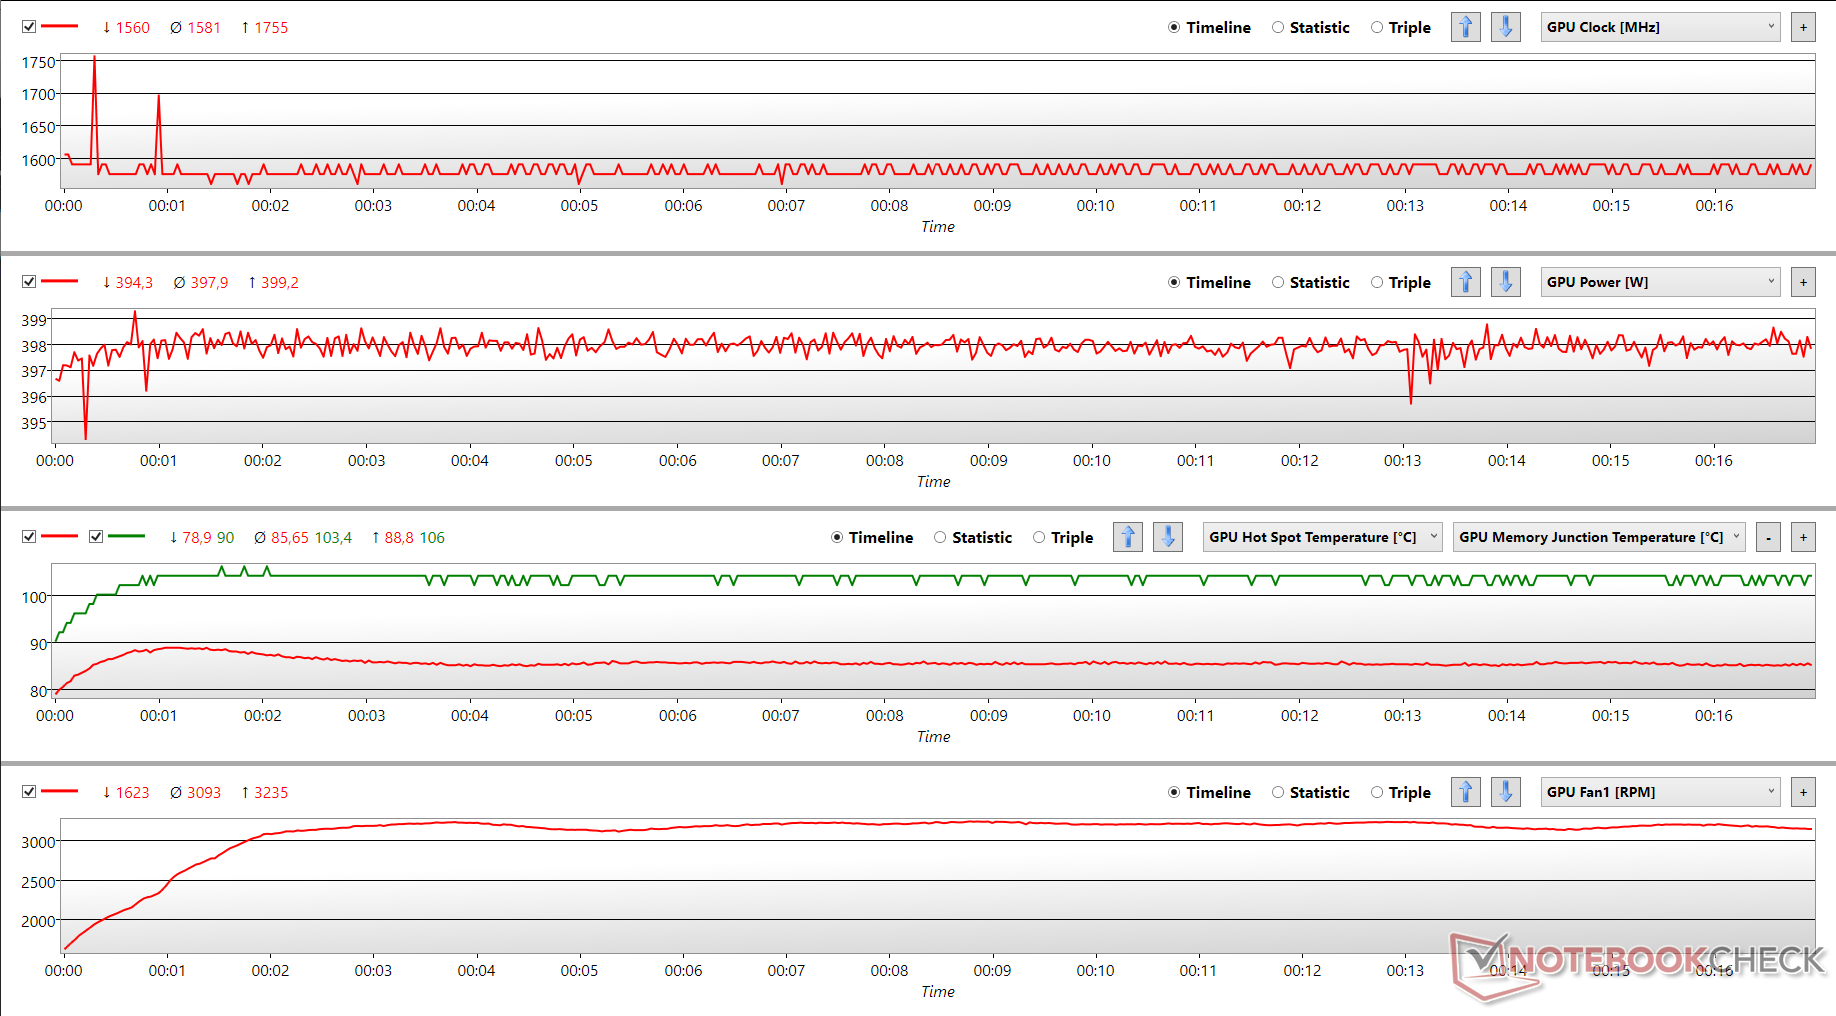
Increasing the power target to 114% (400 W) via the built-in performance tool in GeForce Experience offers a much different picture. We not only see higher clocks (1,590 MHz) but also a better sustained boost without major spikes despite the core attaining similar temperature levels. The auto-lowering of the TGP is also much less-pronounced at 114% power target than before and the fans also seem to be able to keep up quite nicely. However, we found that pushing the card to 400 W can be quite unstable at times, resulting in crashes.

A 350 W TGP is the default power configuration, but the card does not show a consistent clock profile during stress. Enthusiasts may see the benefit in upping the power target a bit in the interest of higher and more stable boosts.

Overall, it seems as if NVIDIA has shoehorned a near-full RTX 3090 GA102 GPU into an RTX 3080 chassis resulting in thermal and stability issues when pushed to the hilt. That being said, we didn't run into any throttling issues during gaming so these inconsistencies may not be immediately noticeable in real-world usage.

FurMark stress at 100% PT
FurMark stress at 114% PT
GPU parameters during FurMark stress at 100% PT (GPU hot spot temp. - red, GPU memory junction temp. - green)
GPU parameters during FurMark stress at 114% PT (GPU hot spot temp. - red, GPU memory junction temp. - green)

Power Consumption

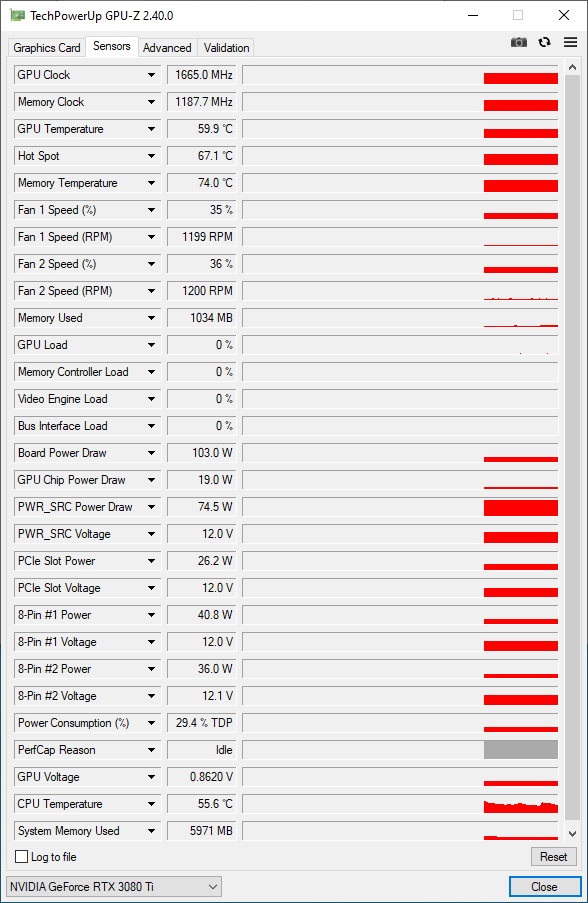
At idle, the RTX 3080 Ti has a total board power draw of about 103 W with the GA102 chip drawing 21 W. Under load, the GA102 GPU can draw 172 W for itself when the card is set at a TGP of 350 W. These figures resemble what we had earlier seen with the MSI GeForce RTX 3080 Gaming X Trio GPU, which sports a 340 W TGP. The RTX 3090 FE actually comes across as a more economical option when considering power consumption under stress. Increasing the power target to 400 W consequently results in the GPU core drawing 210 W under load. Comparatively, the RX 6900 XT's core draws about 255 W during FurMark stress at a 100% power target.

Temperature

High GPU core temp. even under 0% load

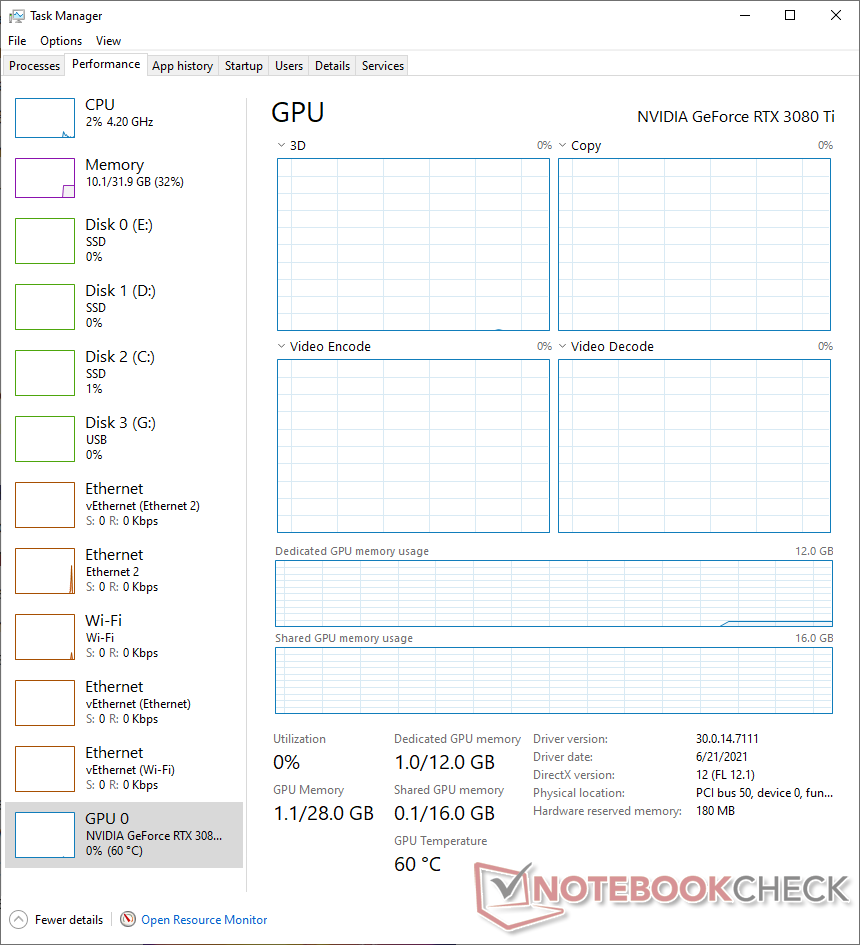
For some reason, our RTX 3080 Ti FE unit always posted a core temperature of 60 °C even under idle. Though NVIDIA has implemented a complete fan-stop mode in all Ampere FE cards, due to such idle temperatures, we found the fans to be always spinning at 36% (~1,230 RPM). This is despite Windows Task Manager reporting 0% activity on all GPU parameters. We also tried setting the Power Management mode to "Normal" in the NVIDIA Control Panel, but that didn't seem to have any effect. It is possible that this could be an isolated problem with our unit, so we have reached out to NVIDIA for further clarification.

NVIDIA GeForce RTX 3080 Ti FE heatmap during FurMark stress

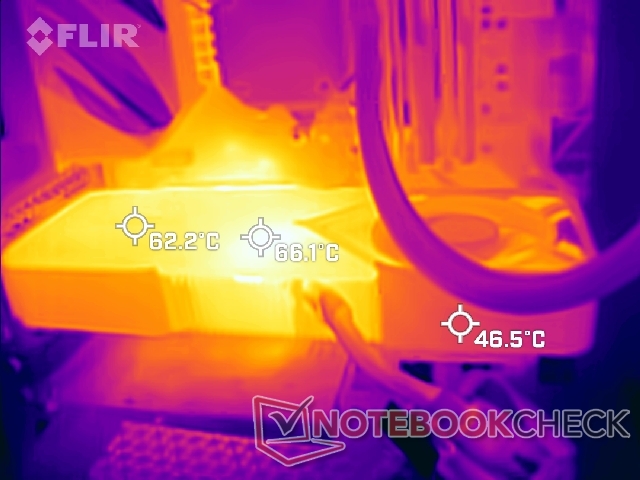
While the core itself reached about 80 °C under load, the surface temperatures are about as expected. We recorded 66 °C near the GPU core area and about 62 °C near the VRMs and memory in an ambient temperature of about 23 °C. The presence of a metal backplate seems to be an advantage here in efficient surface heat dissipation. Nevertheless, given NVIDIA's new fan design, we cannot emphasize enough the requirement of good case cooling to drive the hot air outside.

Since the rear fan exhausts towards the AIO cooler and system RAM, good case cooling can help prevent heat build-up on components above the card as seen in the adjoining heatmap. Undervolting the card using third-party utilities may help in further lowering temperatures. Adequate ambient cooling helps too.

Noise Levels

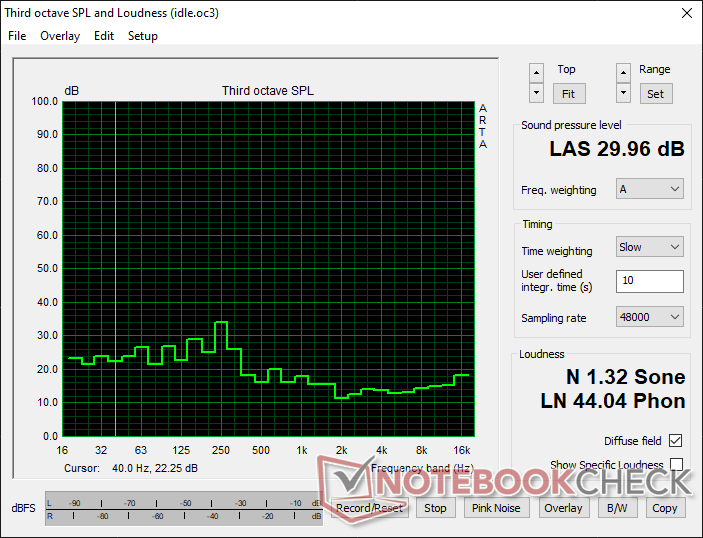
We evaluated fan noise levels at a distance of 20 cm from the closed case with all other system fans turned off except for the Corsair H115i Capellix AIO pump, which was set to operate under the Quiet profile. As indicated earlier, we never quite experienced a complete fan-stop with our unit. Therefore, the noise levels under idle seemed to be somewhat on the higher side and were close to 30 dB(A).

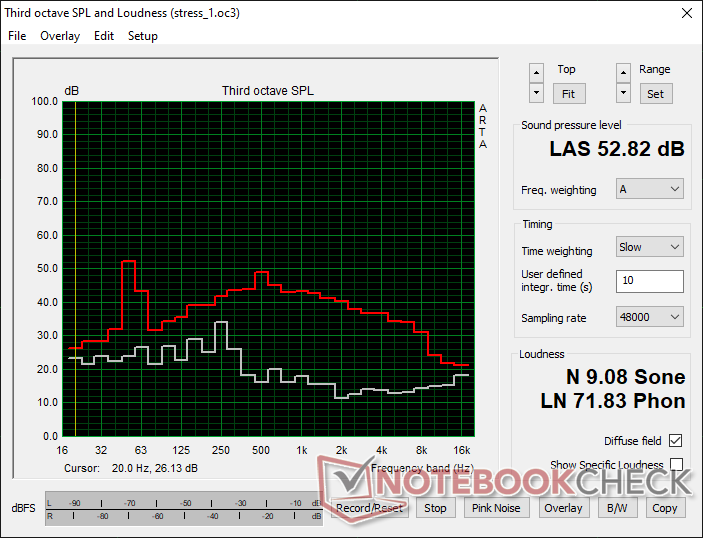
Upon starting FurMark stress at a 100% power target, we noticed that the noise levels can increase up to 50 dB(A). We recorded a maximum sound pressure level of 53 dB(A) during the duration of the test.

Real-world usage isn't likely to be as stressful, but the high noise levels can get quite disconcerting while gaming. We also noticed some coil whine when the fans ran at full speed. Once again, it is possible that this could be just a bad sample. However, it is clearly evident that the dual 85 mm fans have to do more work in order to properly cool the near-full GA102 GPU, resulting in perceivably higher fan noise than a typical RTX 3080 FE card.

Noise levels - Idle with case fans off
Noise levels - FurMark stress at 100% PT with case fans off

Pros

+ Good, sturdy design and build quality
+ Excellent 4K Ultra 60 fps+ gaming performance
+ Performance almost indistinguishable from an RTX 3090
+ DLSS 2.0 and ray-tracing support in compatible games
+ Manageable surface temperatures under load

Cons

- Clocked lower than the RTX 3090 FE and RTX 3080 FE
- High emissions under load
- Not very stable at higher power targets
- High fan noise levels under load
- Costs nearly double the RTX 3080 MSRP for just about 15% increase in performance

Verdict — Performance gains and pricing don't scale well

NVIDIA GeForce RTX 3080 Ti Founders Edition. Review unit courtesy of NVIDIA India.

For perhaps the first time, gamers have to face a triple whammy of supply chain constraints, inflated prices, and the ephemeral cryptocurrency mining craze. On the bright side, AMD's new found resurgence has brought back some much needed competition in the flagship GPU space. The NVIDIA GeForce RTX 3080 Ti Founders Edition arrives at such a crucial juncture in GPU history.

The RTX 3080 Ti FE brings all the goodness of Ampere's Founders Edition design, which seems to be giving add-in board (AiB) cards a run for their money. The chassis is premium and, unlike the mammoth RTX 3090 FE, it sports a sleek 2-slot design. NVIDIA continues to use the 12-pin power connector, which can make cable management a cumbersome affair if you don't have a modern PSU with a 12-pin PCIe connector. 

However, we did observe that the RTX 3080 Ti FE does not seem to benefit entirely from NVIDIA's new Founders Edition design. We observed frequent clock ramping, high temperatures, and high noise levels during testing. Keeping aside the possibility that this could be an isolated issue with our review sample, for all intents and purposes, the RTX 3080 Ti is almost an RTX 3090 at heart. Thus, using this chip in a chassis meant for the RTX 3080 is bound to result in a few incongruencies when it comes to thermals. 

The NVIDIA GeForce RTX 3080 Ti offers RTX 3090-levels of gaming performance at an MSRP that is US$300 lower. While this is no doubt the halo GPU that hardcore gamers would crave for, it is also nearly twice as dear as the RTX 3080 for nominal performance gains in most titles. 

The RTX 3080 Ti aims to supplant the RTX 3080 as the flagship Ampere GPU for gaming, and it is able to do so quite easily. However, we are only looking at about less than 15% advantage in 4K Ultra in most titles. The other way to look at it is that the RTX 3090 has a less than 5% lead over the RTX 3080 Ti in most games, so you can save a bit with the RTX 3080 Ti if gaming is the primary use case  — provided you are able to actually buy the card, that is. Given that the RTX 3080 Ti is almost on par with the RTX 3090 in both synthetics and games, it makes sense to go for the latter only if you really need all the 24 GB VRAM goodness for creative tasks.

If you're not bothered about ray-tracing performance or DLSS, AMD's Radeon RX 6800 XT and RX 6900 XT are still highly relevant competitors to the RTX 3080 Ti FE and are available at much lesser MSRPs. That being said, AMD's ray-tracing performance is already RTX 2080 Ti-level and the company is also bringing out its own DLSS alternative named FidelityFX Super Resolution (FSR), which should further enhance RDNA 2's prospects.

Those looking at playing at QHD resolutions or below are better served by the RTX 3070 and RTX 3060 Ti unless really high frame rates are required to keep pace with high-refresh rate displays.

Price and availability

Availability of GPUs at MSRPs is still an ongoing concern well into 2021. The RTX 3080 Ti Founders Edition is out of stock at most online retailers. AiB cards from the likes of MSI, Asus, EVGA, Zotac, and Gigabyte seem to have a much better availability but at a significantly high markup. For instance, the MSI Gaming GeForce RTX 3080 Ti Gaming X Trio currently retails close to the US$2,400 mark on Newegg and Amazon. Best Buy, however, lists both the RTX 3080 Ti FE and other AiB variants as sold out. The situation at Walmart is no better either with cards such as the Zotac AMP Holo GeForce RTX 3080 Ti being sold at a whopping US$3,399. We recommend waiting a bit longer for prices to normalize before deciding on a purchase.

Pricecompare

static version load dynamic
Loading Comments
Comment on this article
Please share our article, every link counts!
> Expert Reviews and News on Laptops, Smartphones and Tech Innovations > Reviews > NVIDIA GeForce RTX 3080 Ti Founders Edition Review: RTX 3090 performance for less but still a low value proposition
Vaidyanathan Subramaniam, 2021-07- 7 (Update: 2021-08- 5)