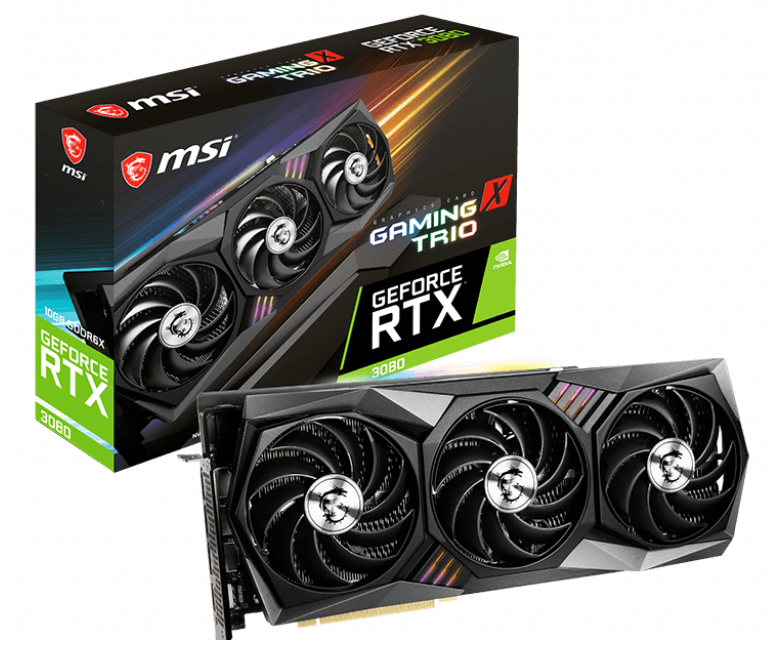
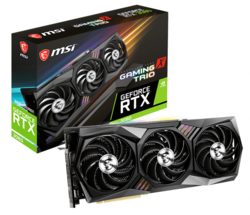
MSI GeForce RTX 3080 Gaming X Trio 10G desktop graphics card in review
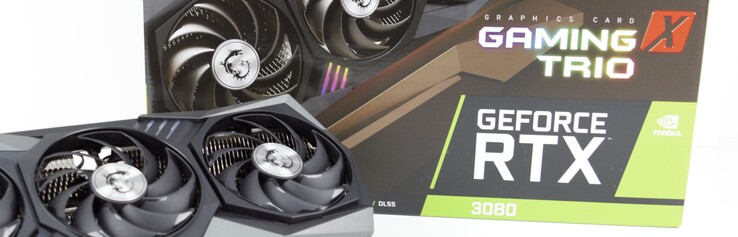
With the MSI GeForce RTX 3080 Gaming X Trio, we have the second fastest model of MSI's RTX 3080 series in review. Only the new Suprim X series should be able to surpass it in terms of performance. In any case, this is what the technical specifications indicate.
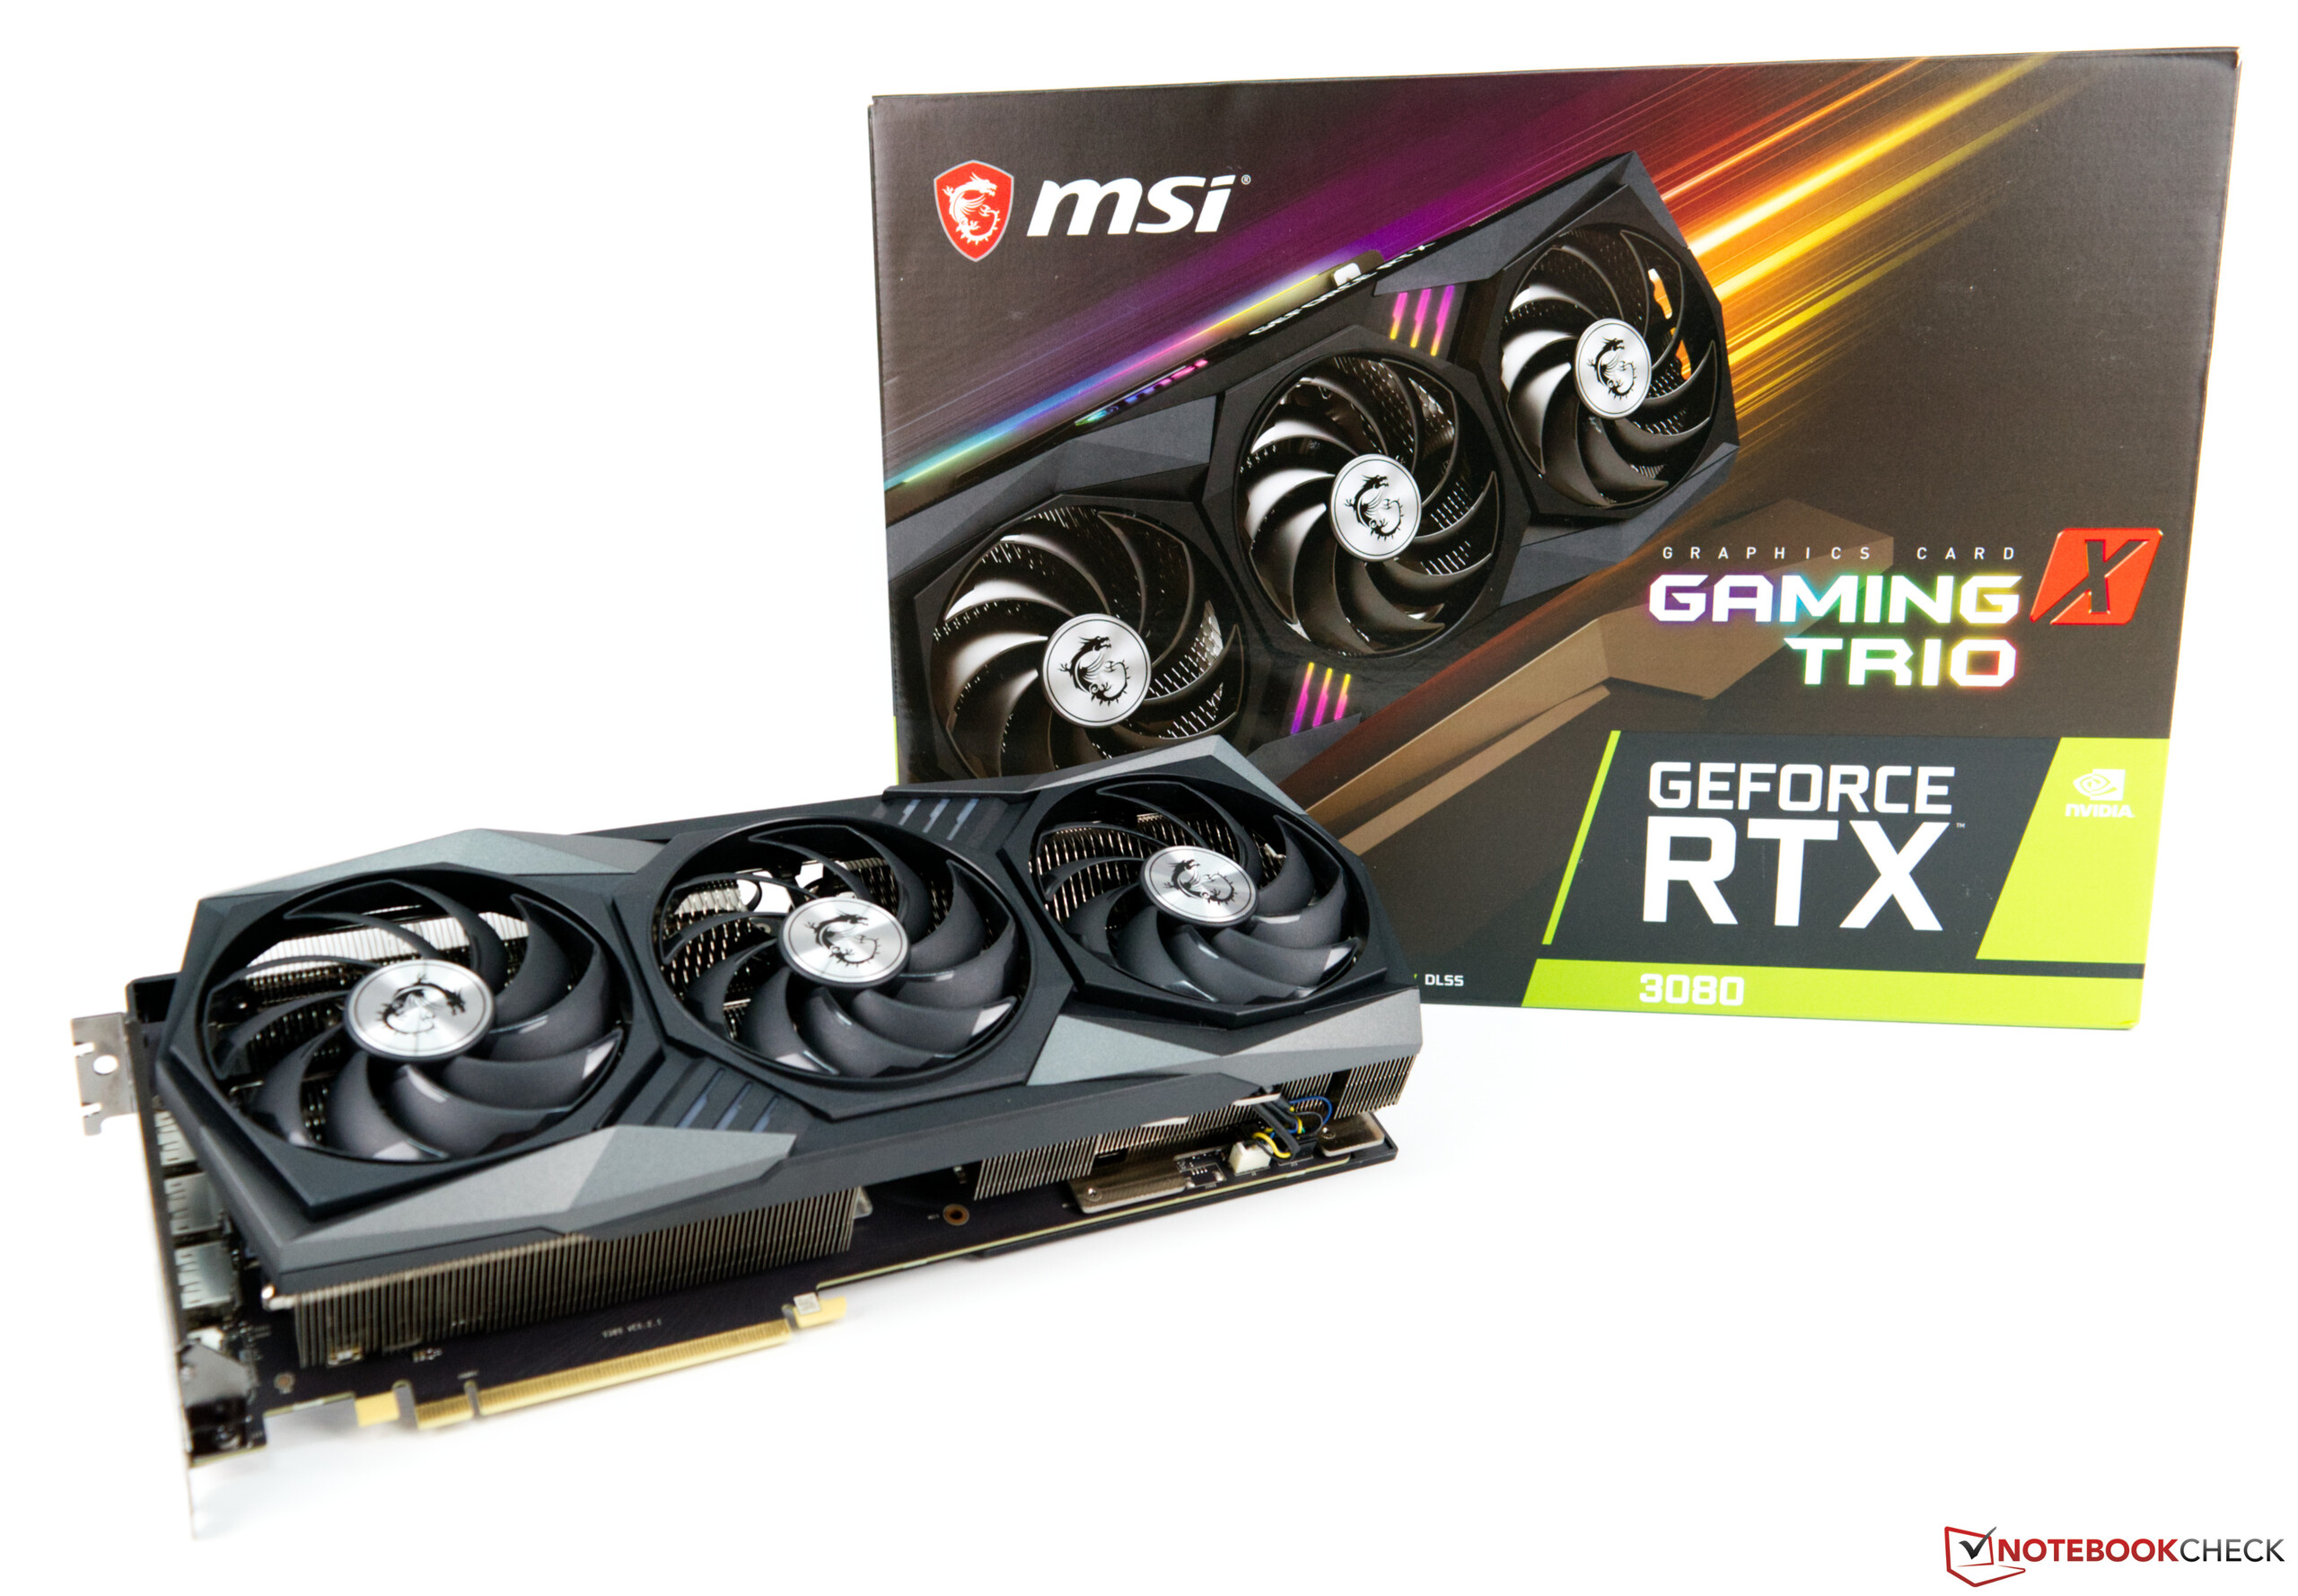
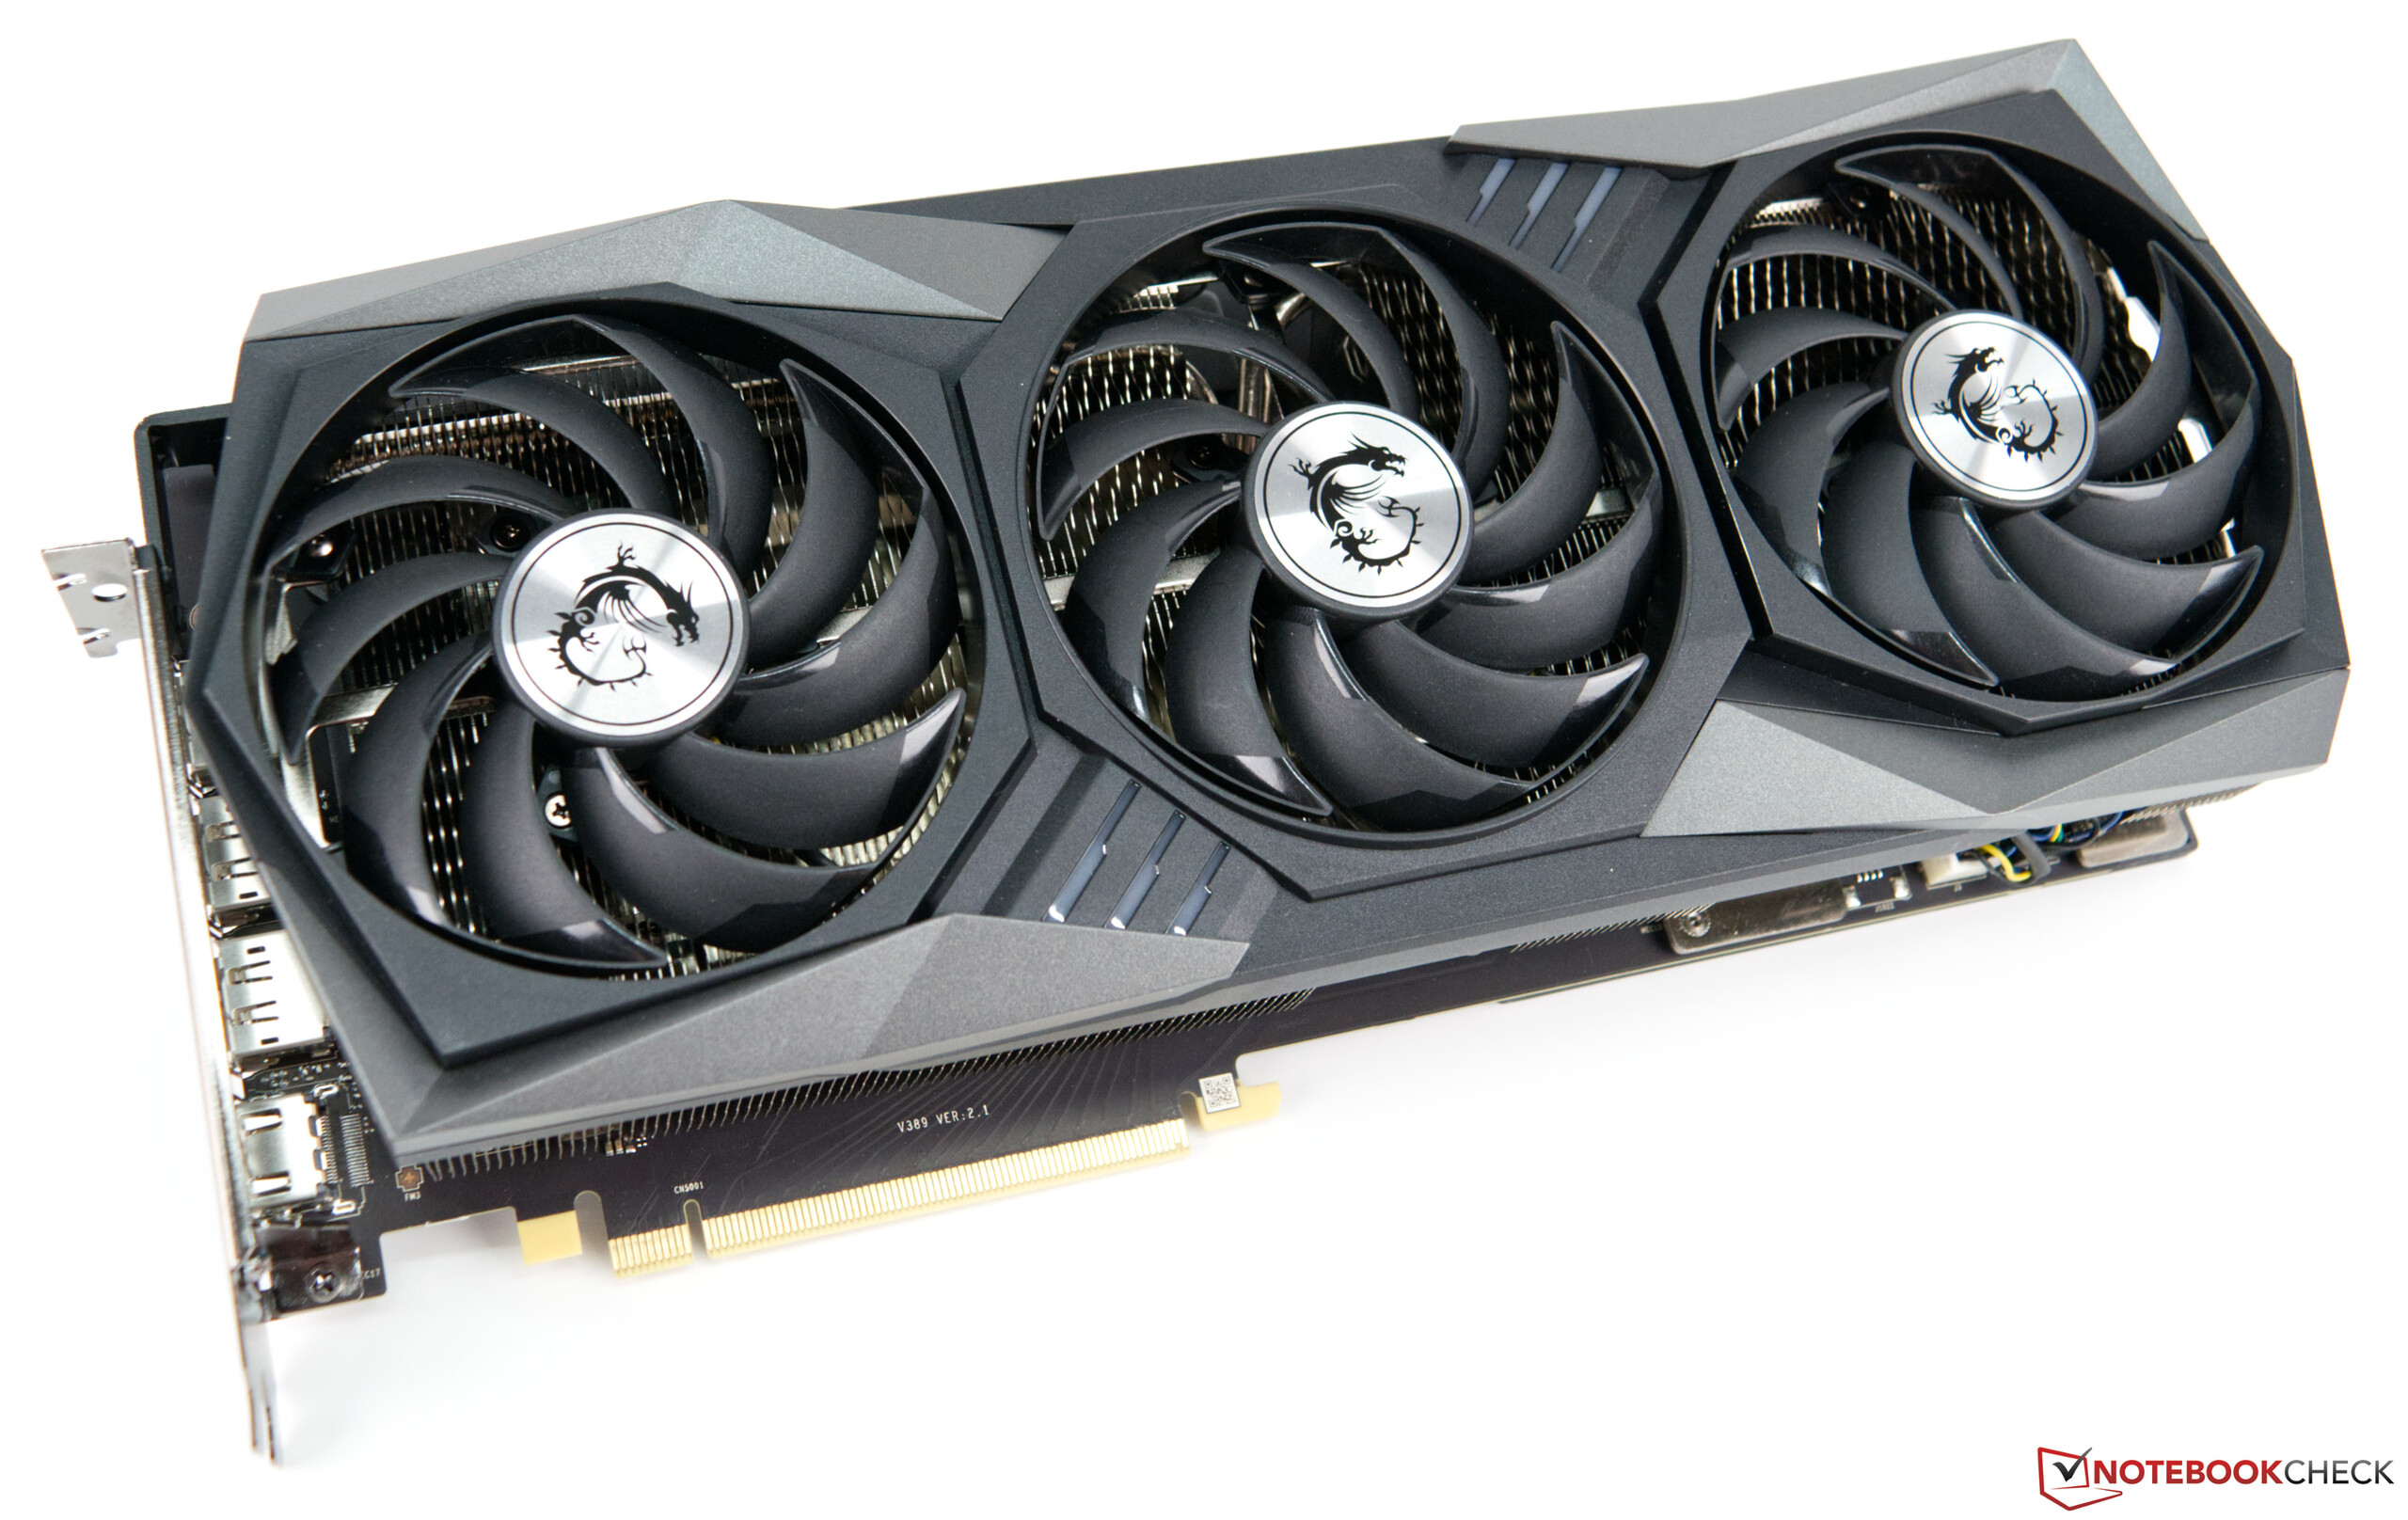
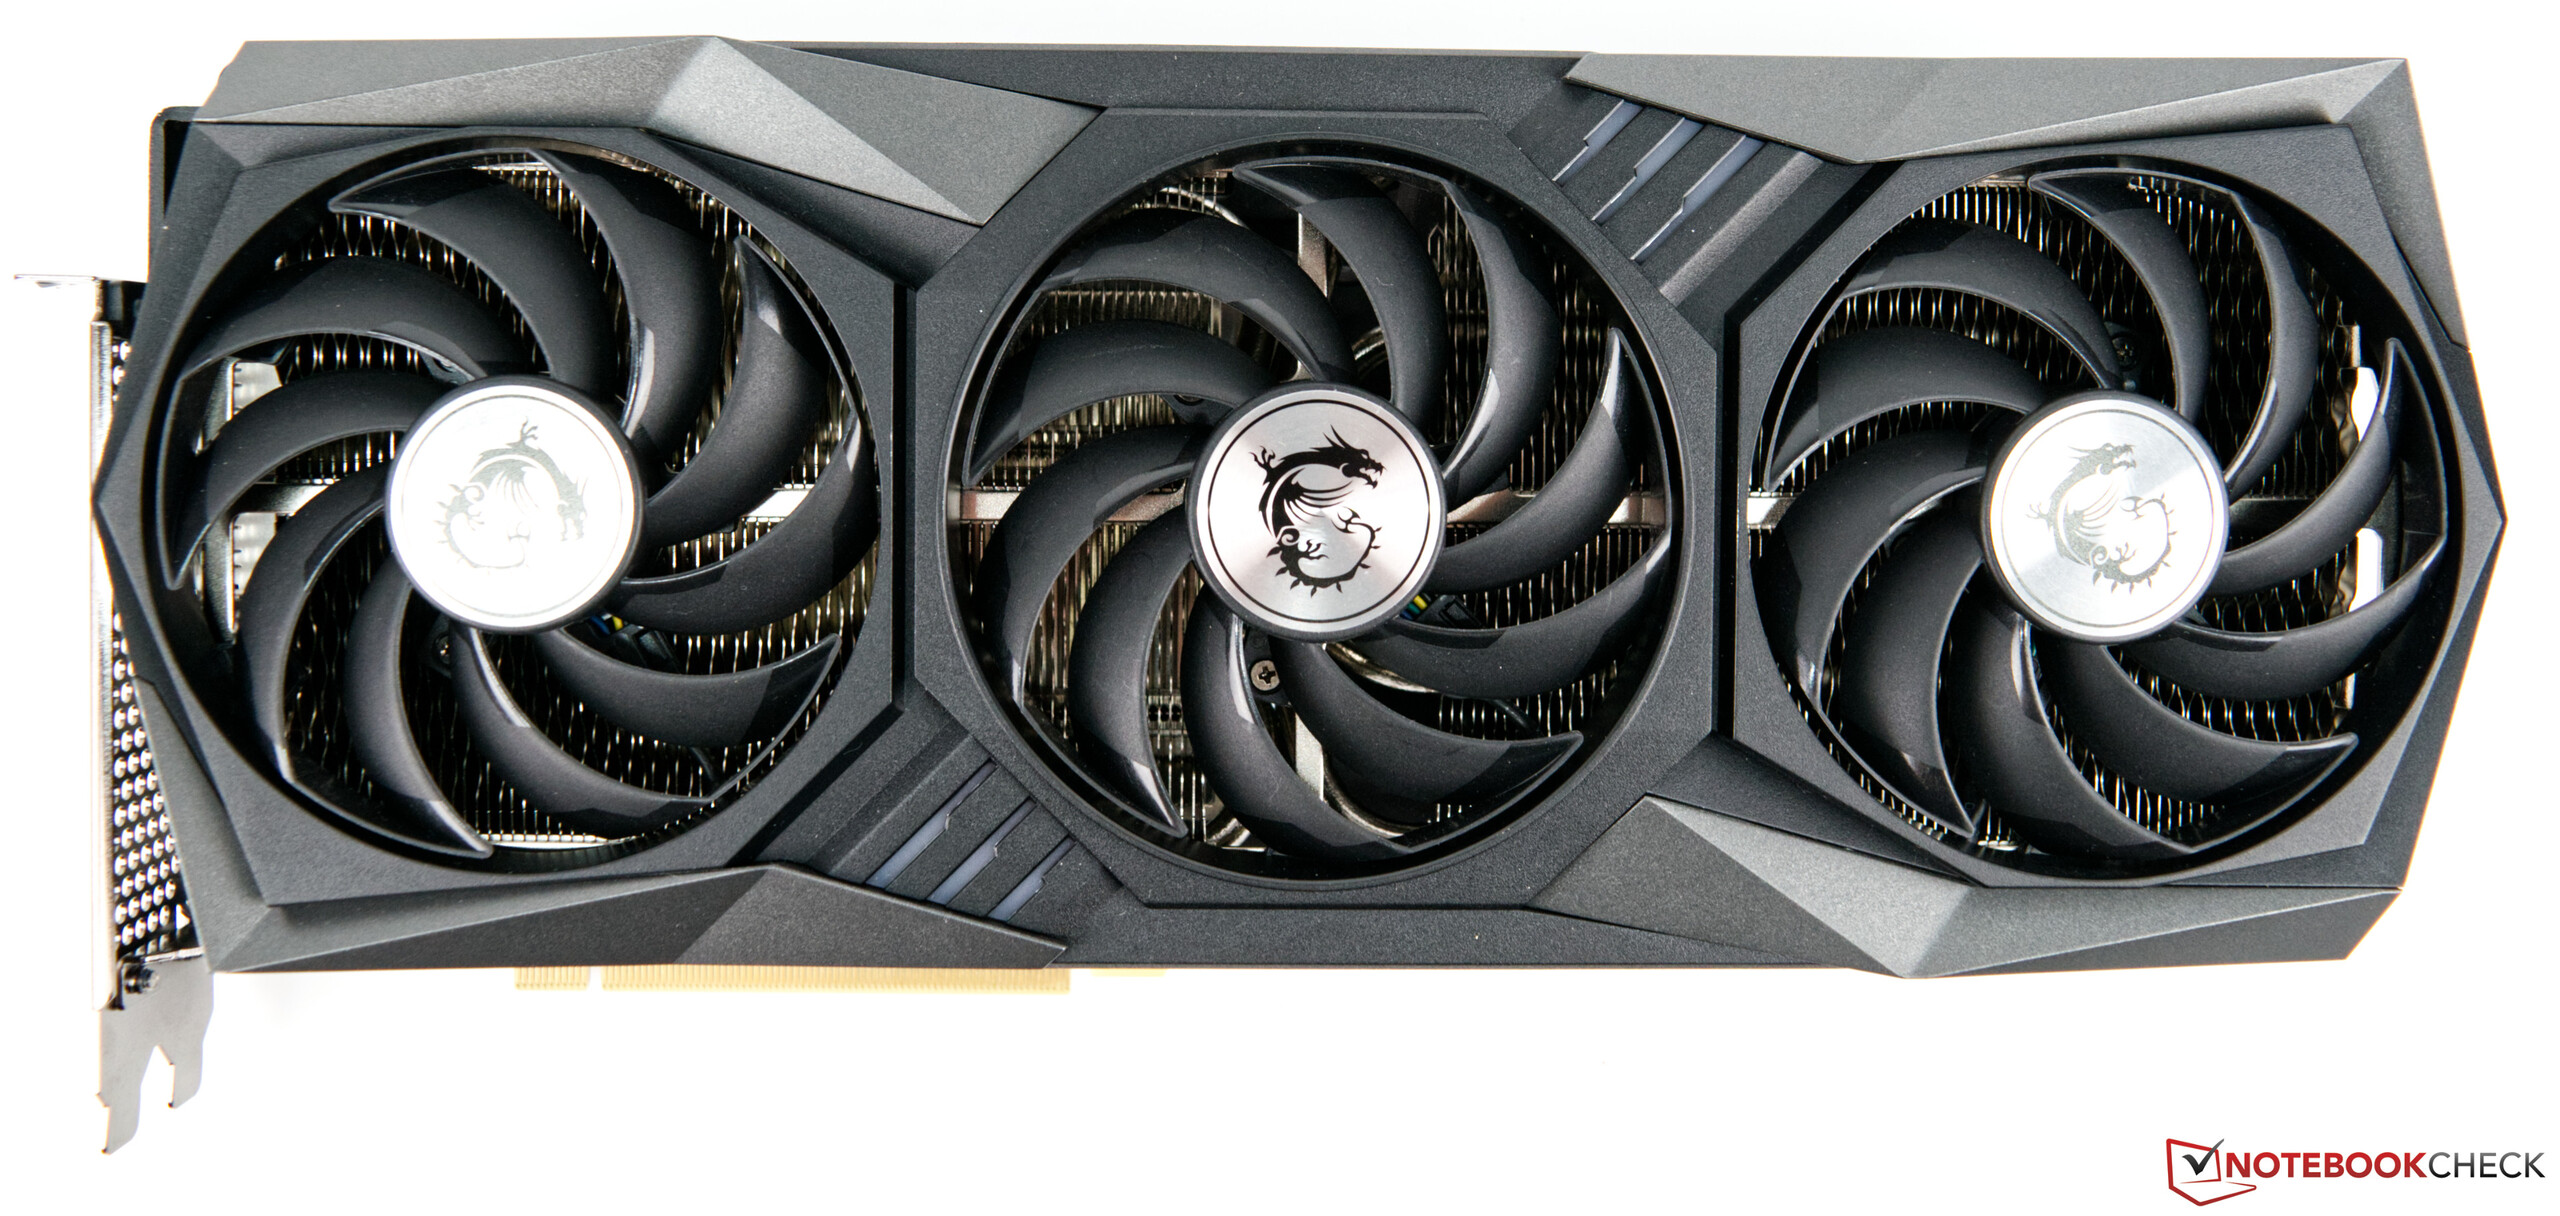
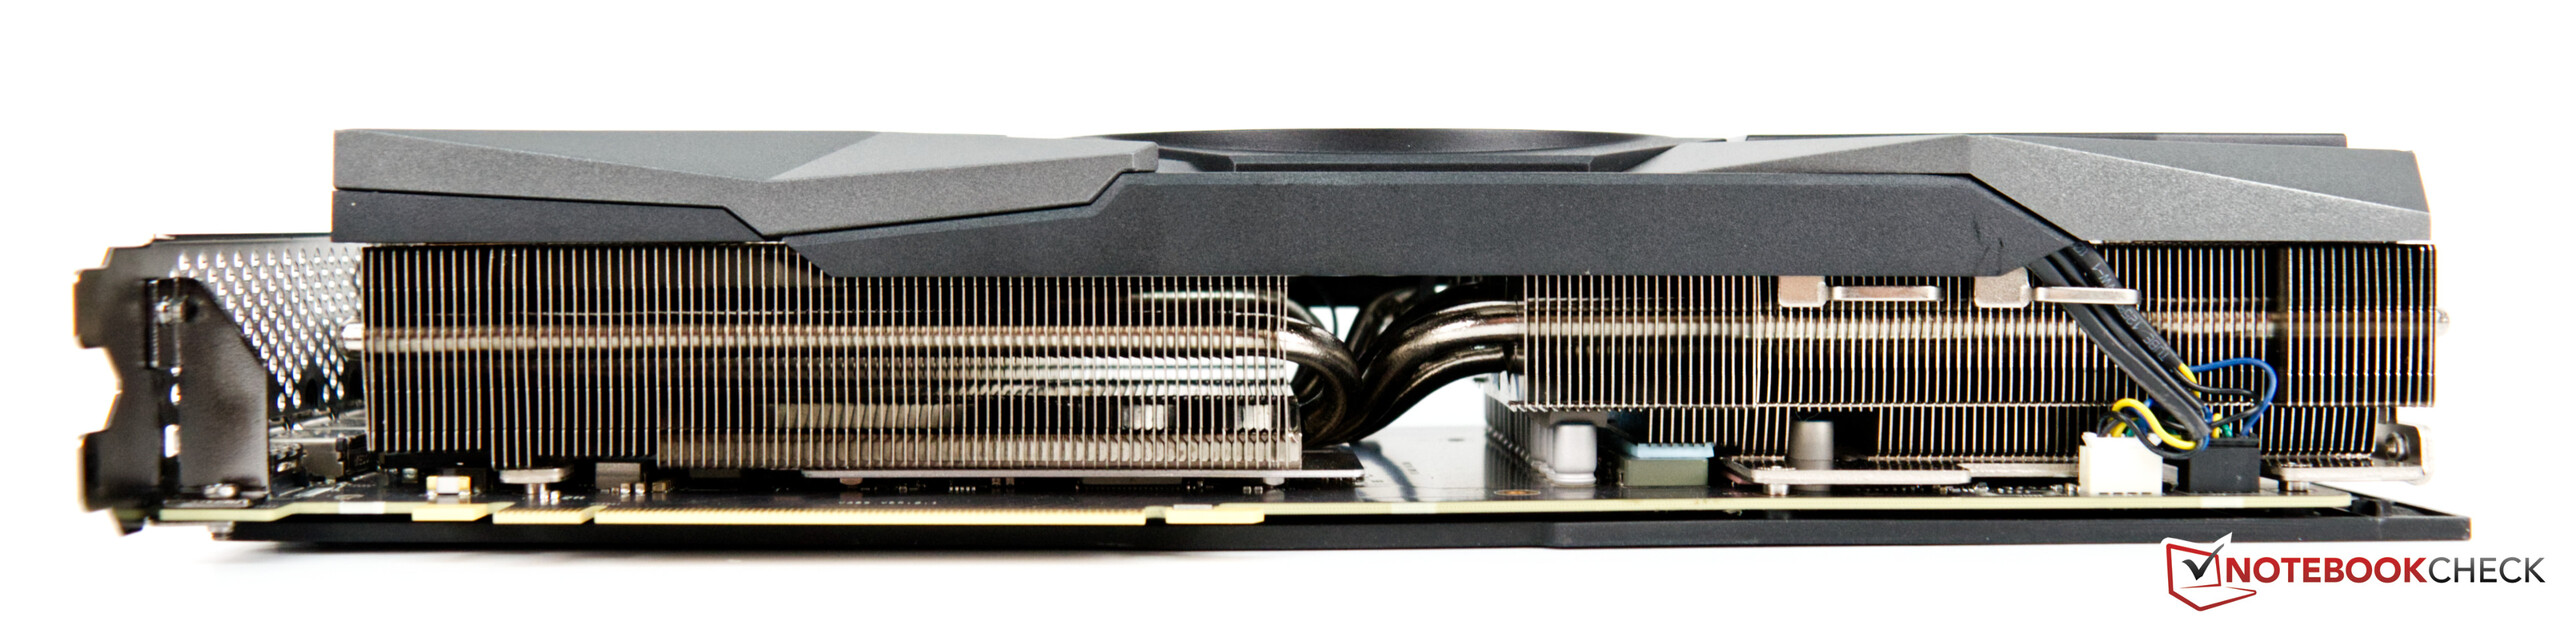
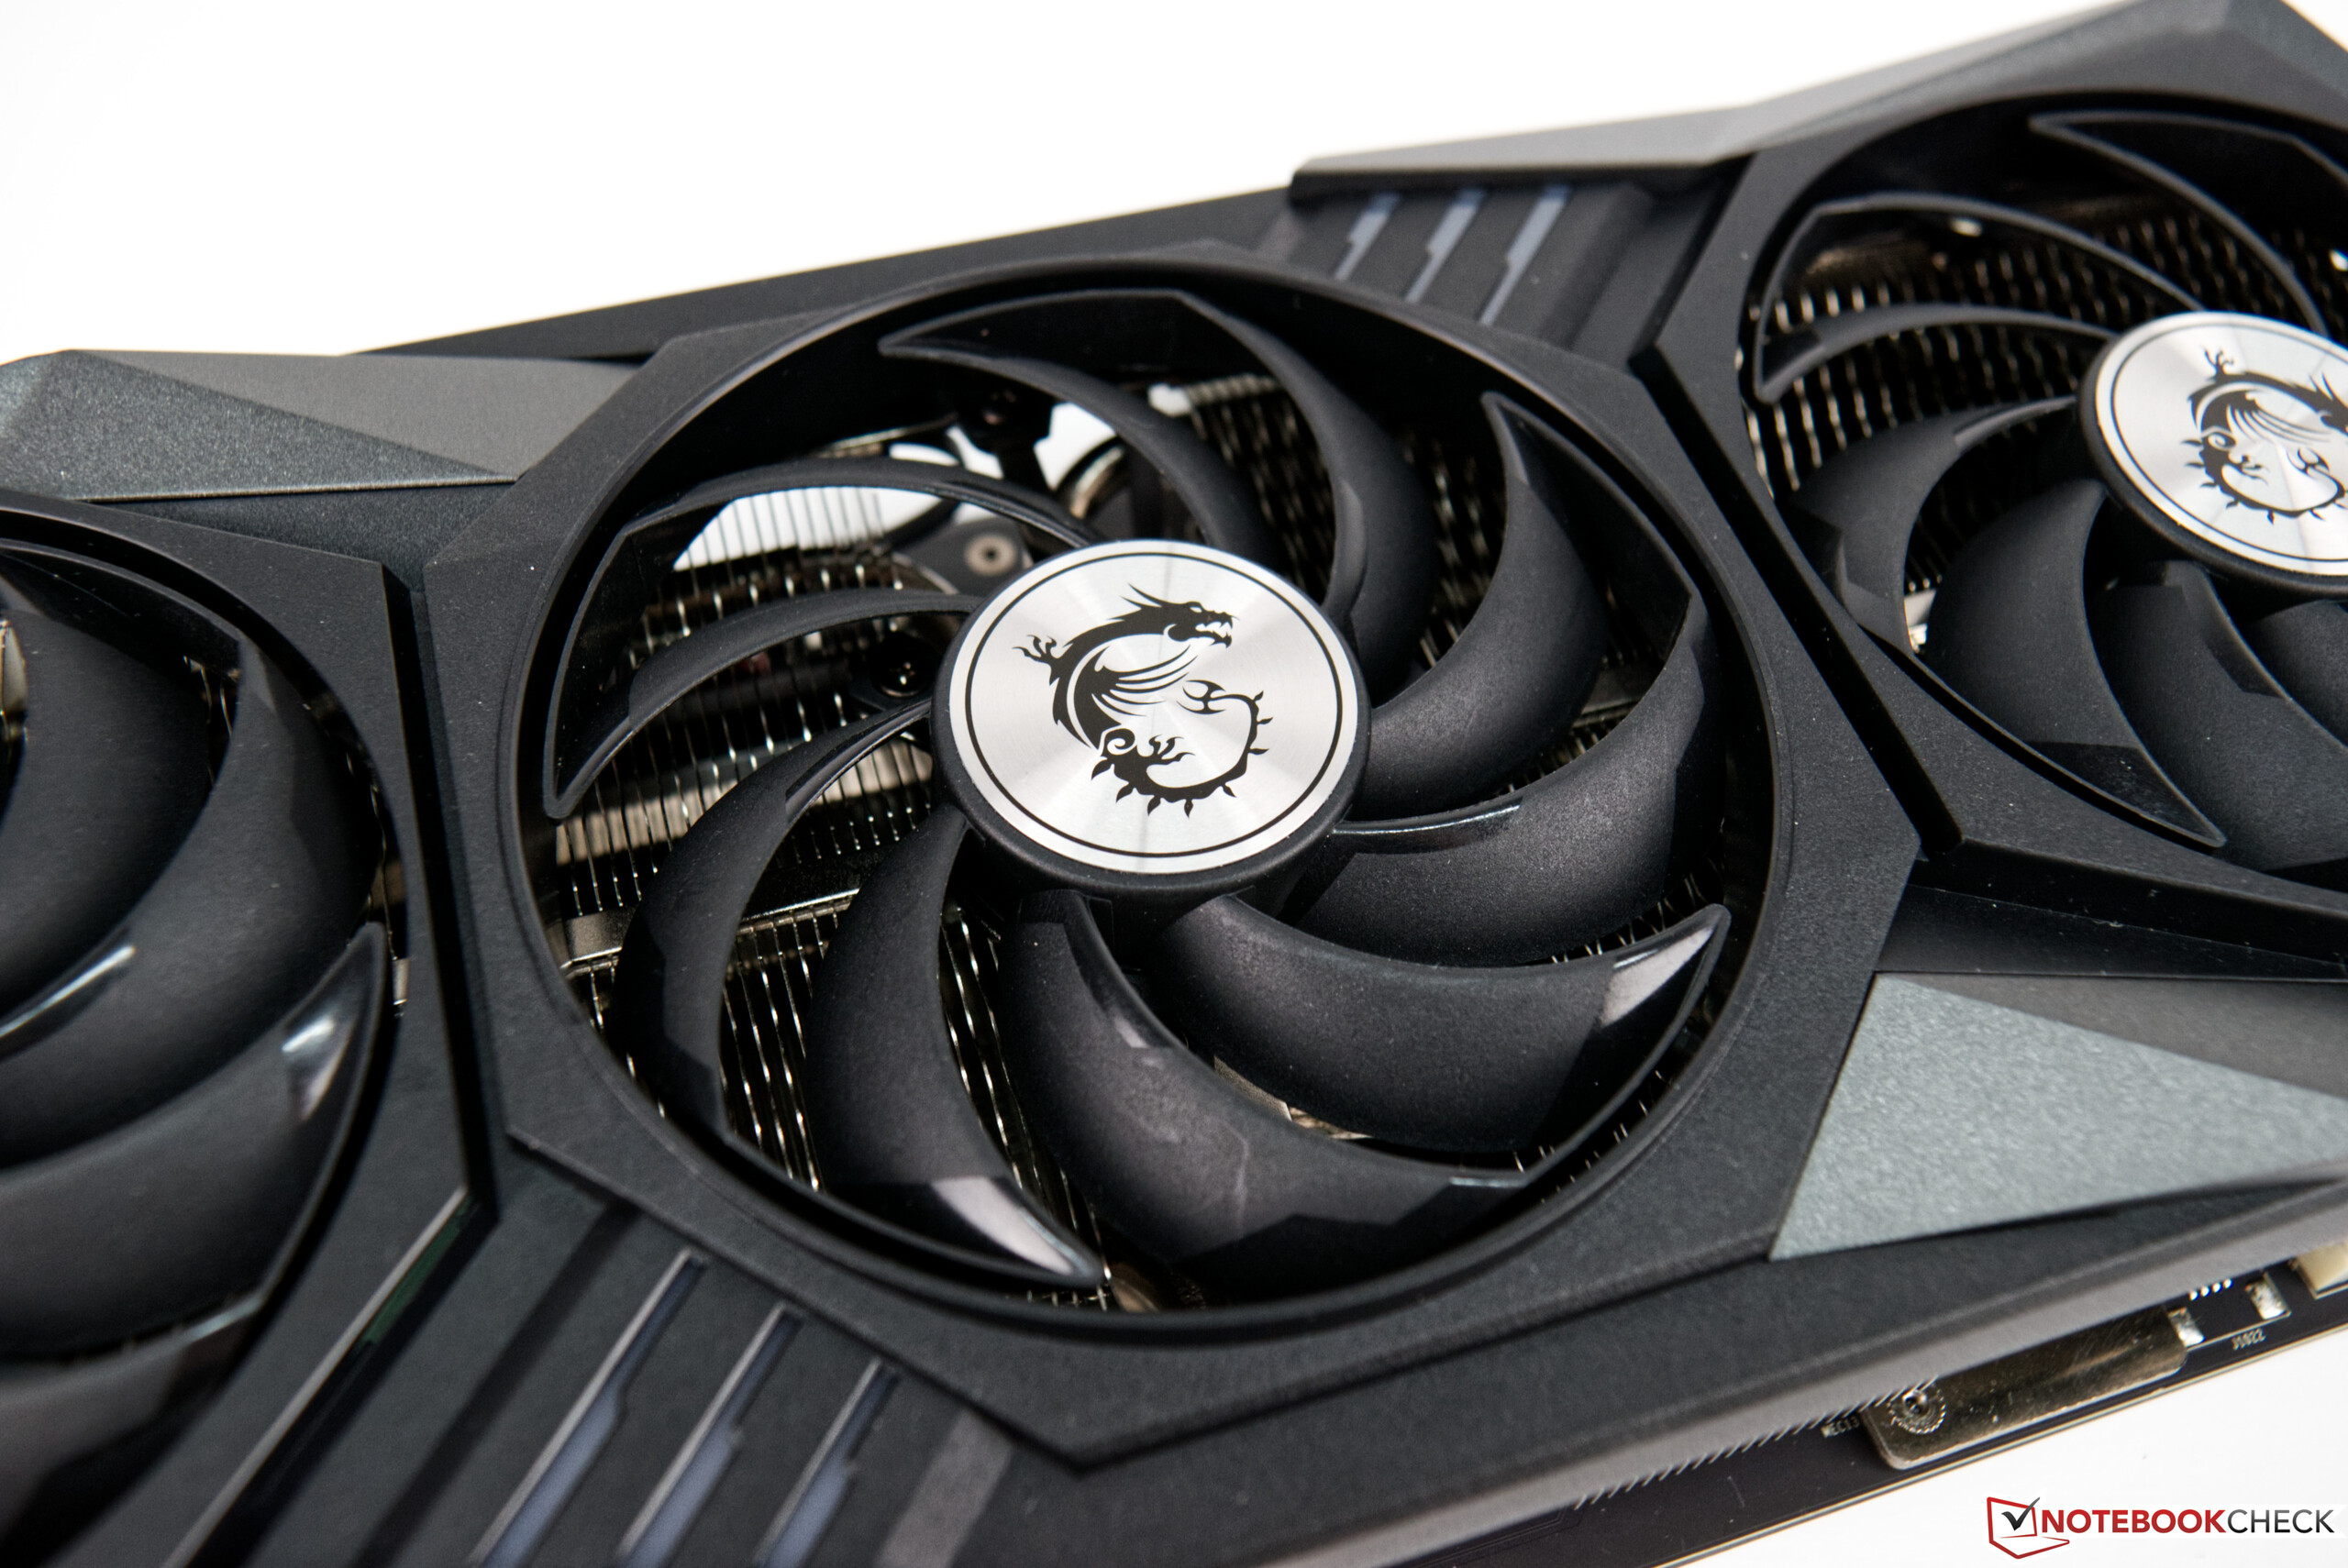
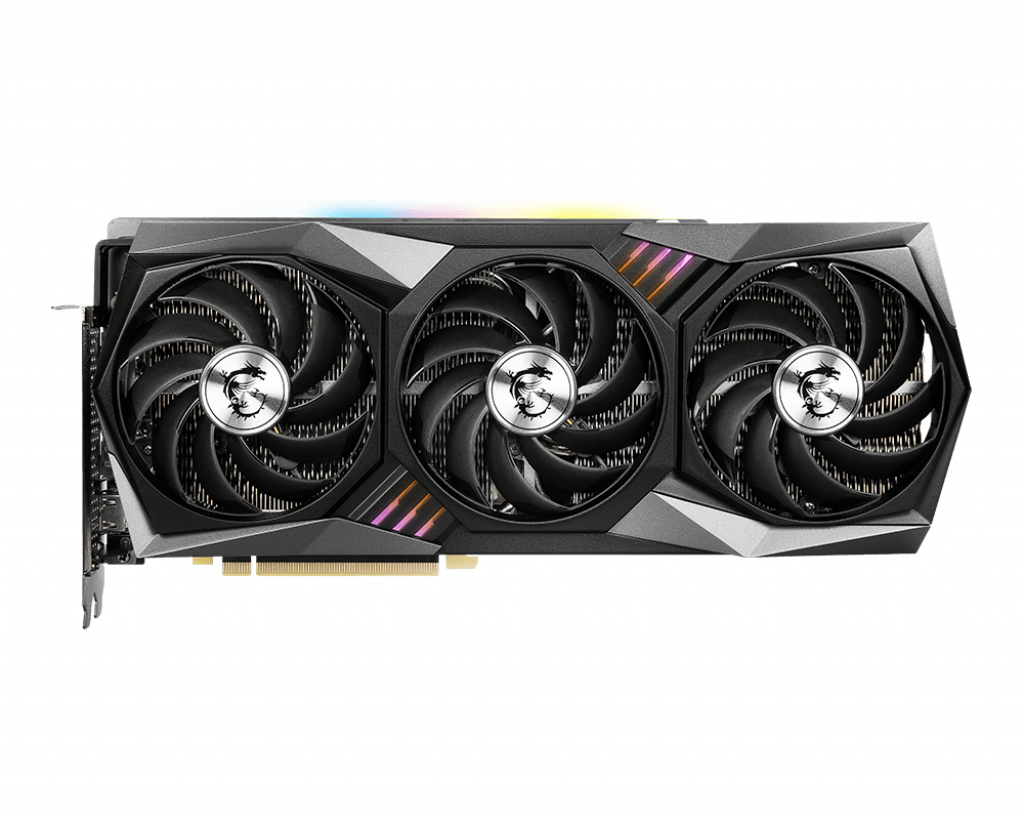
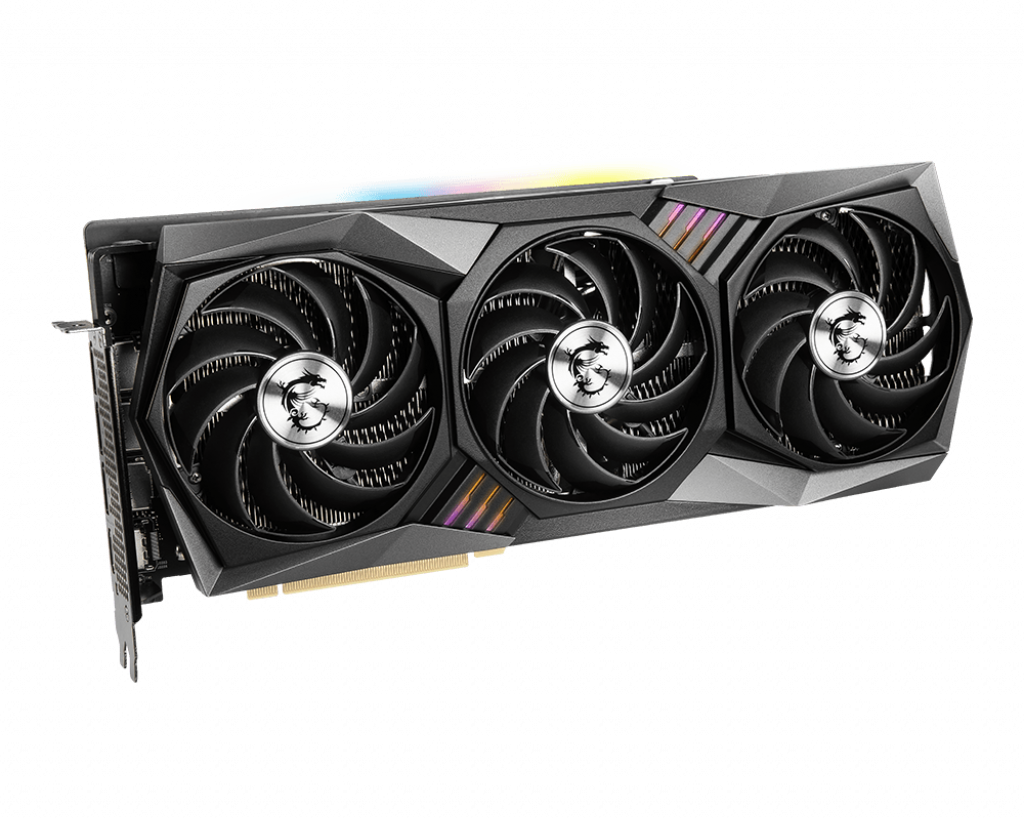
Our test sample from MSI looks a bit outdated when compared to the new Suprim X model. Nevertheless, the Gaming X Trio series has established itself well in the last few years and has always squeezed a lot of performance out from the graphics chips thanks to the very good cooling. Another important factor for this is that MSI also increases the TDP and doesn't use the reference model as a guideline. With a good 32 centimeters, the MSI GeForce RTX 3080 Gaming X Trio is very long and doesn't fit into every case, which should definitely be taken into account when buying.
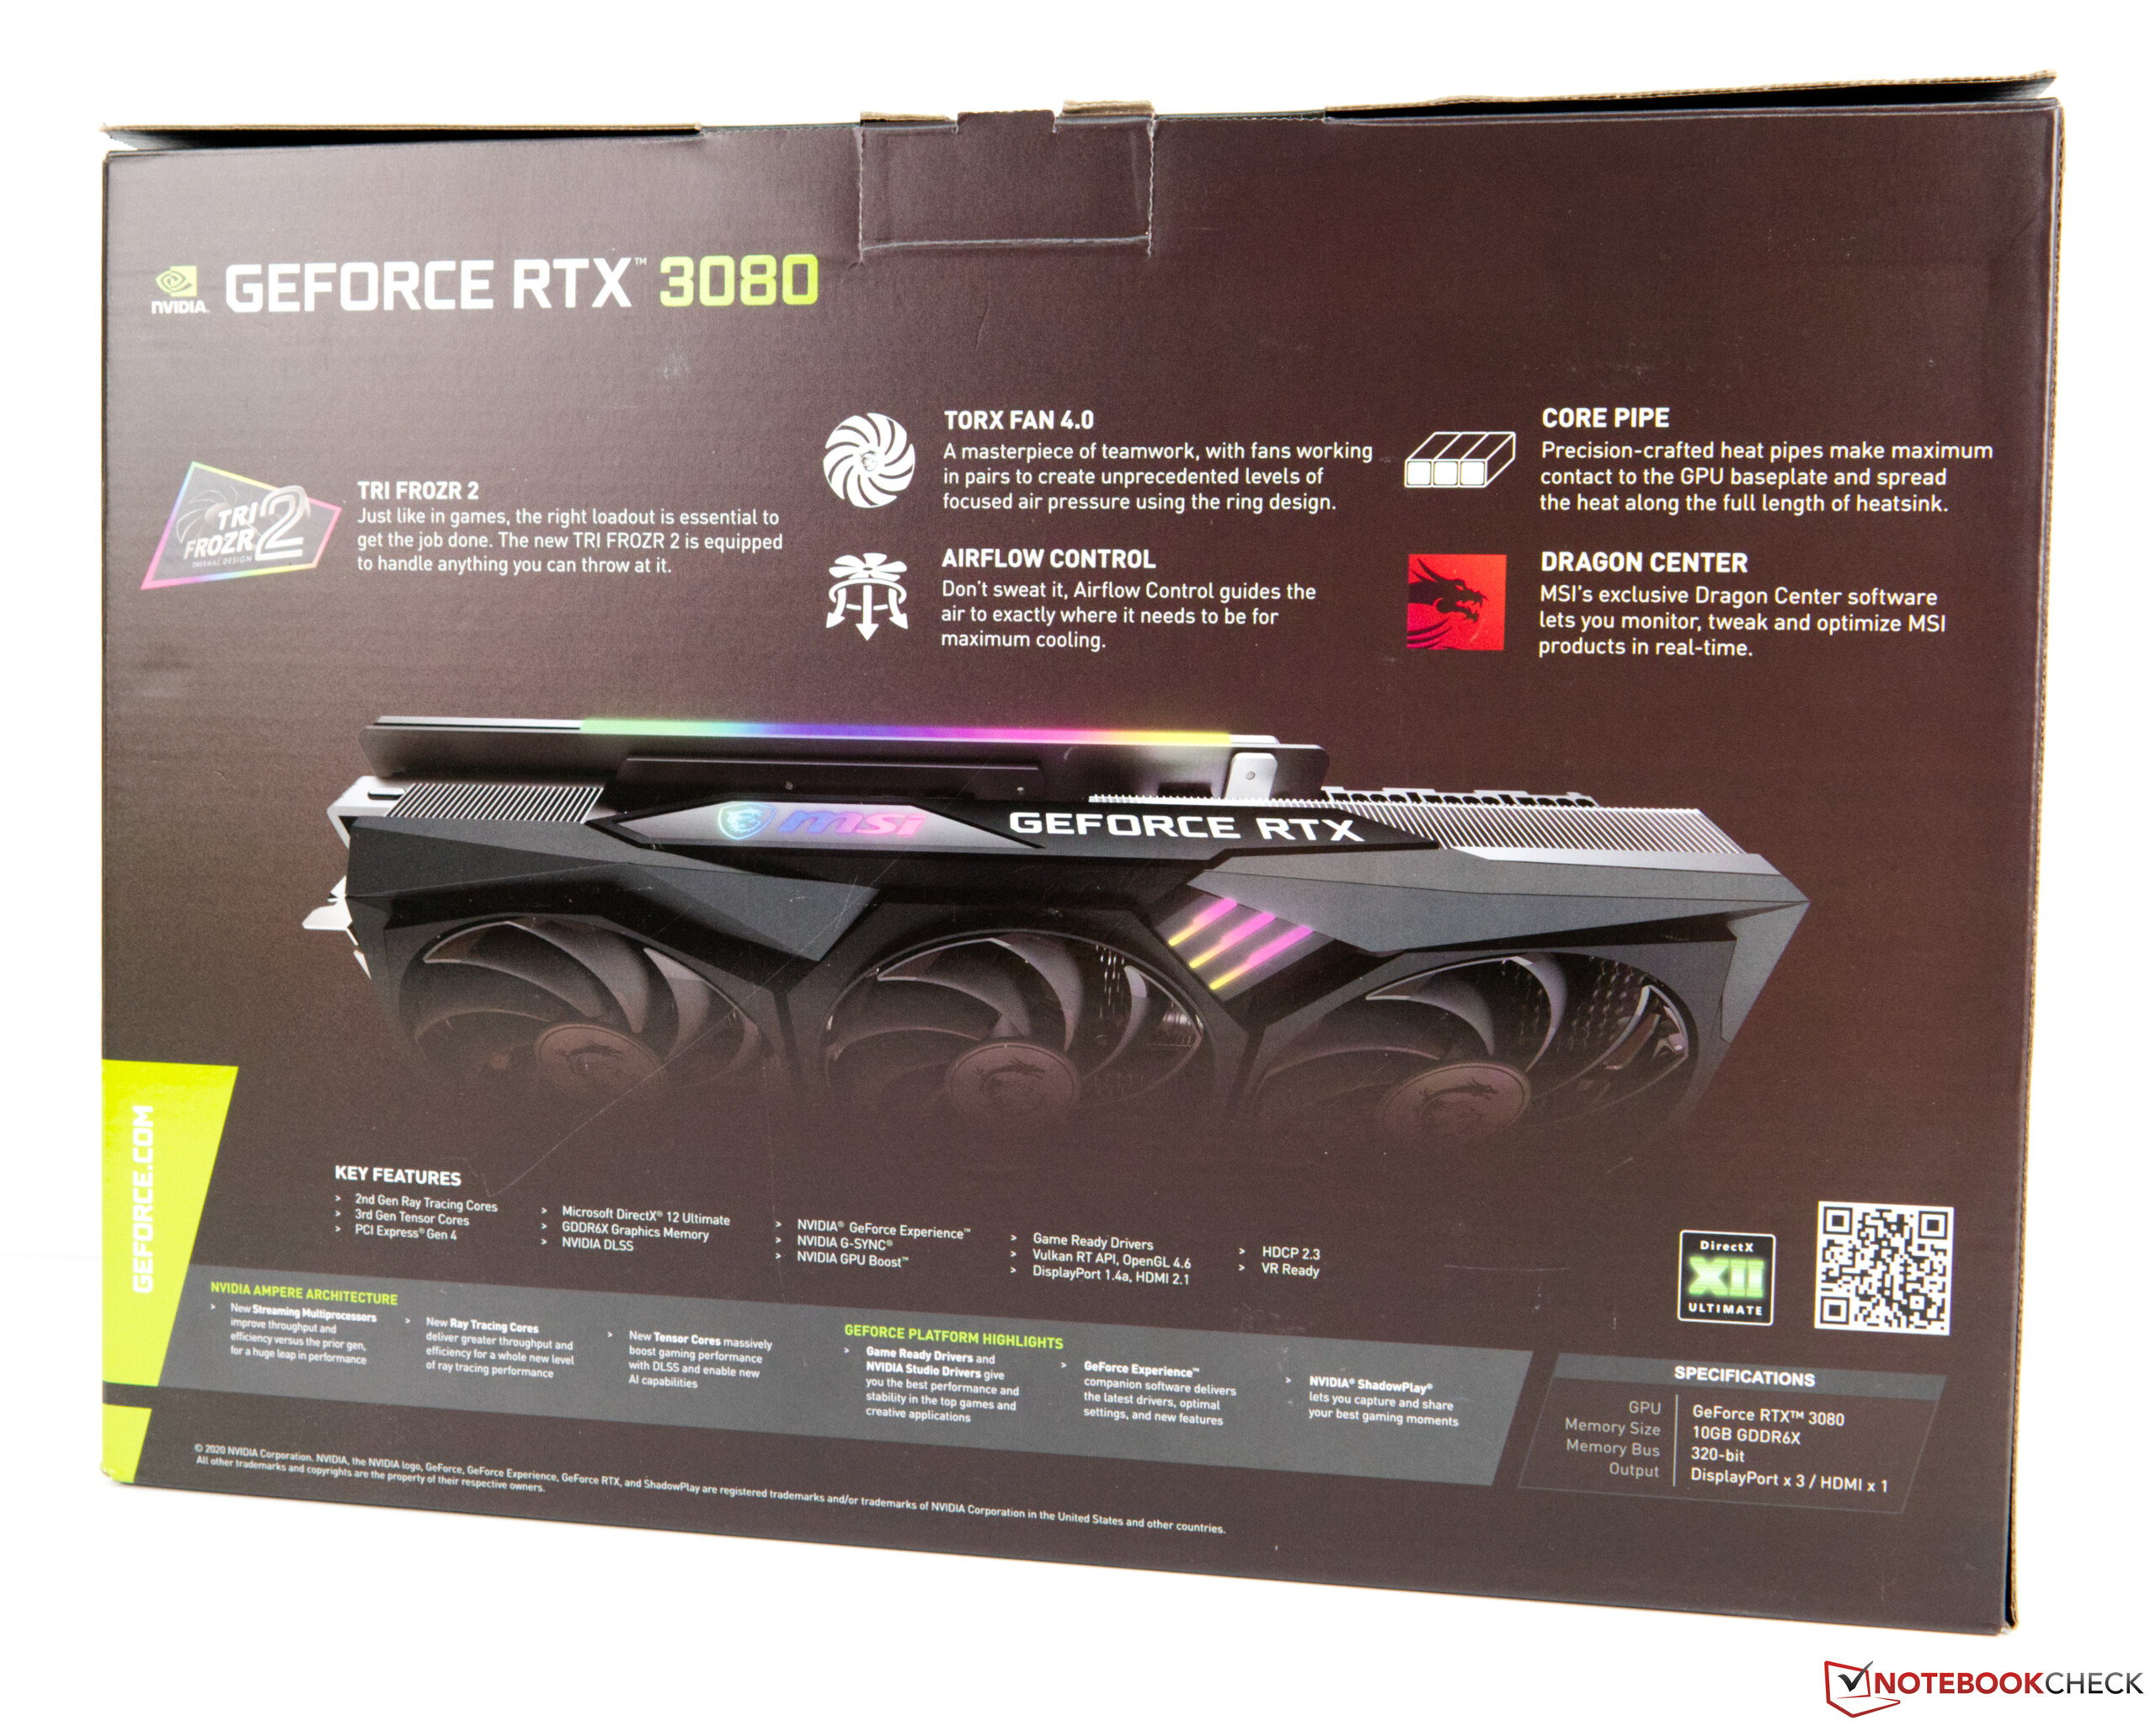
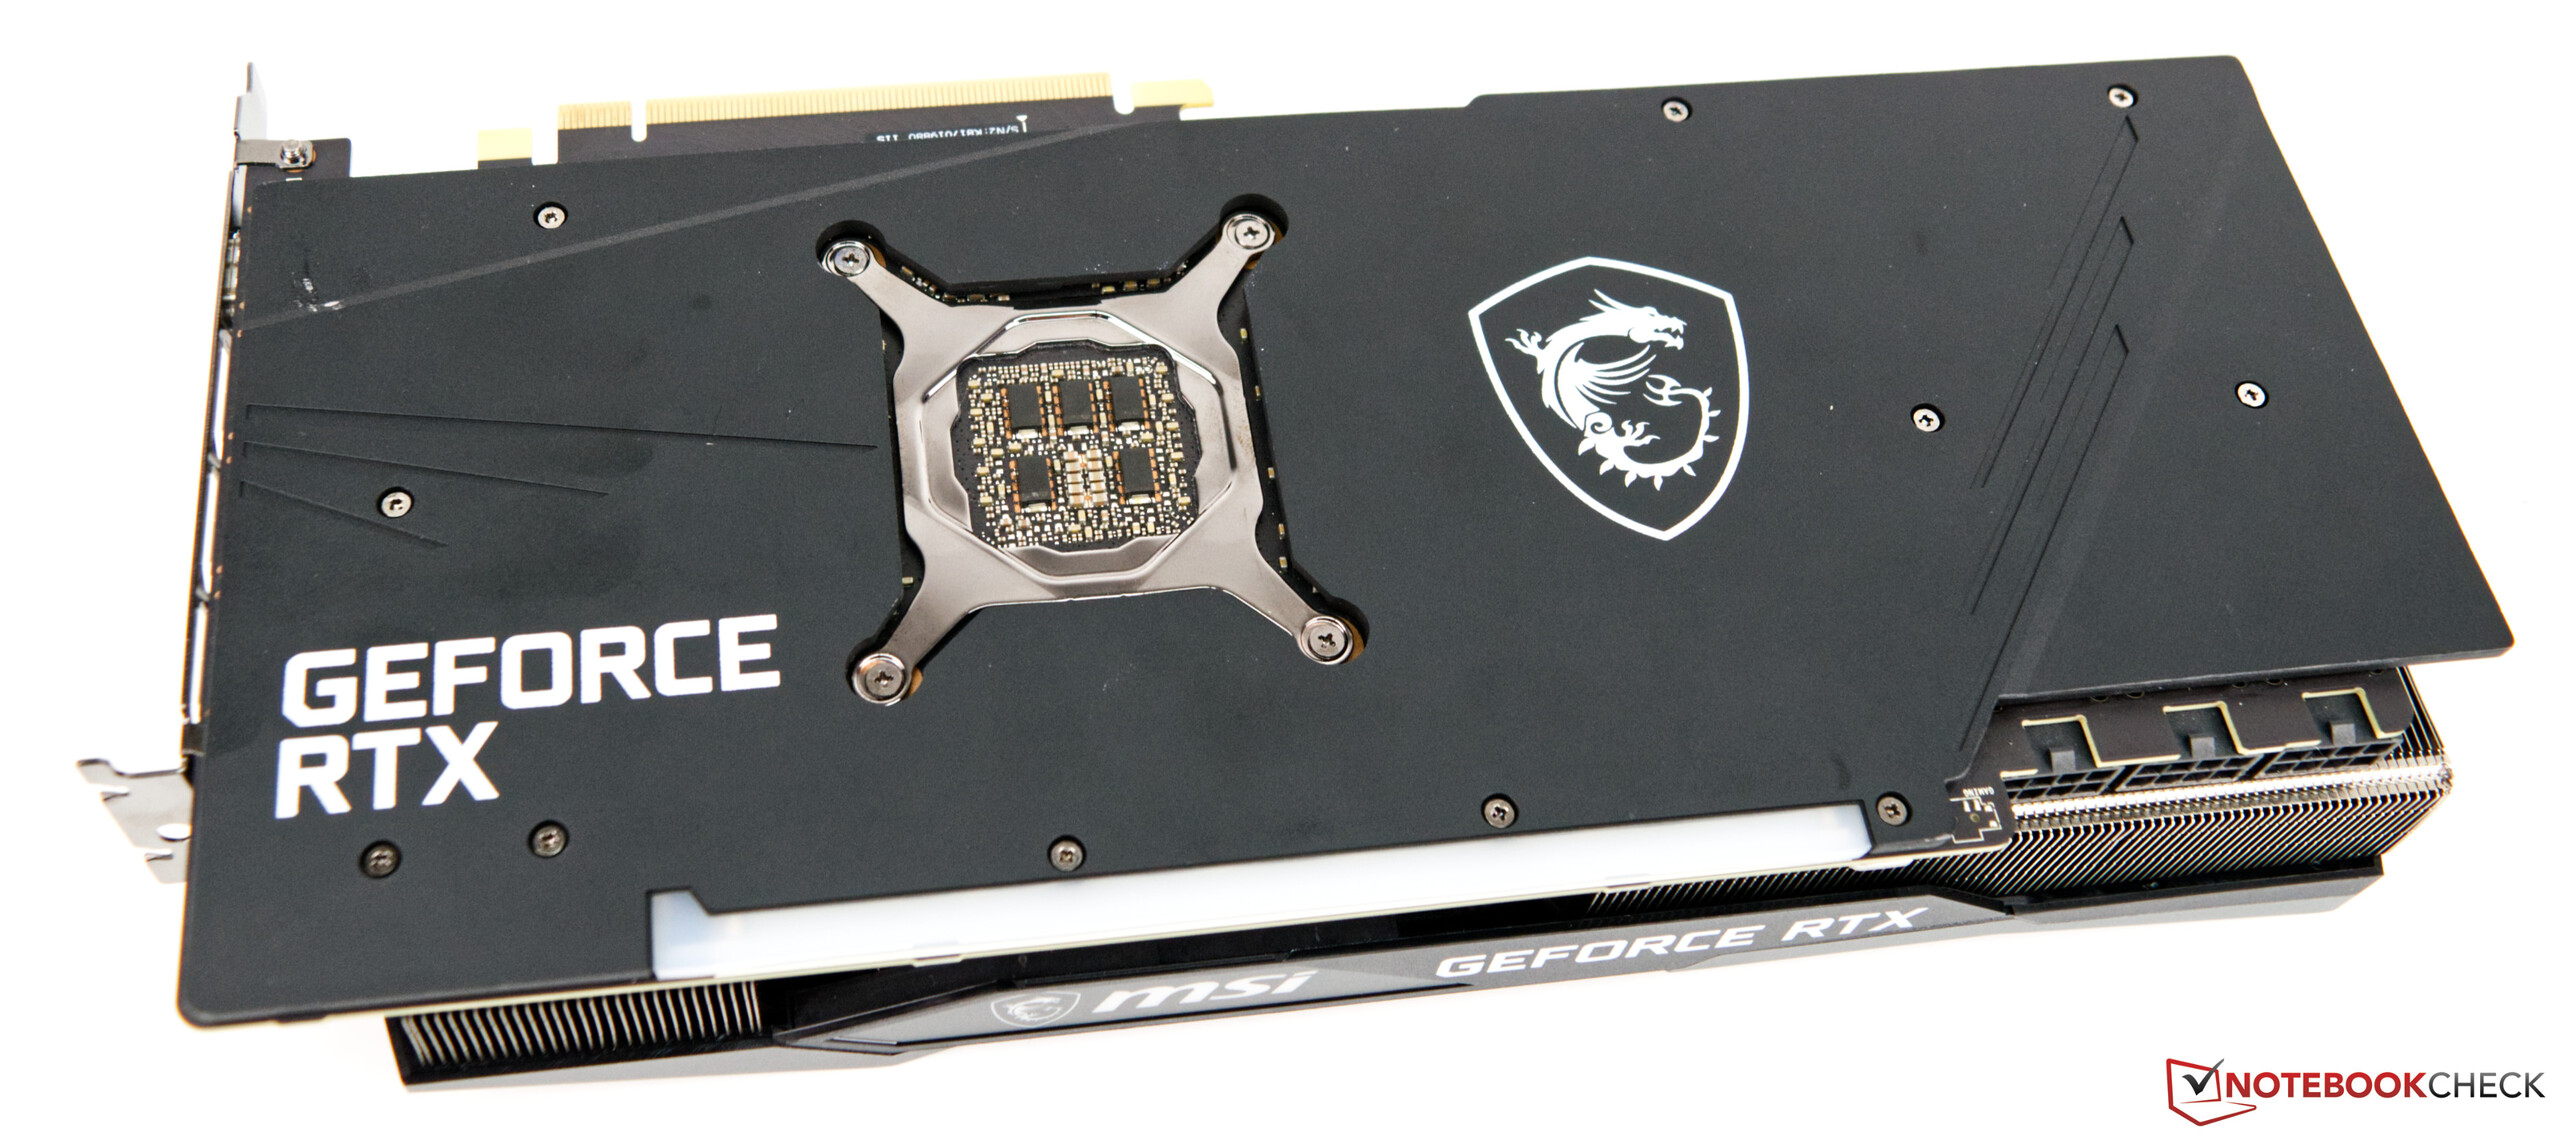
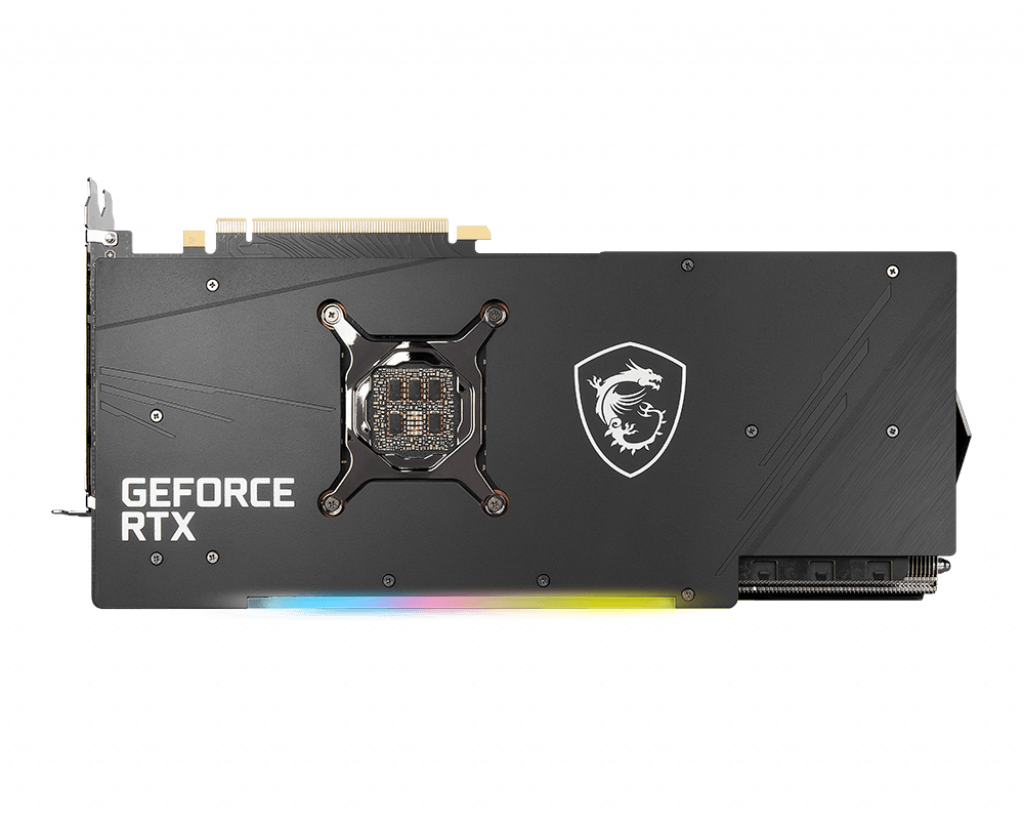
The workmanship is at a very high level. Unfortunately, the backplate is only made of plastic and not aluminum as usual. The surface could have been used as an additional heat dissipater here. But heat is not an issue with the MSI GeForce RTX 3080 Gaming X Trio as we found out in the test. RGB lighting is obviously a must, and it attracts attention when the case has a side window.
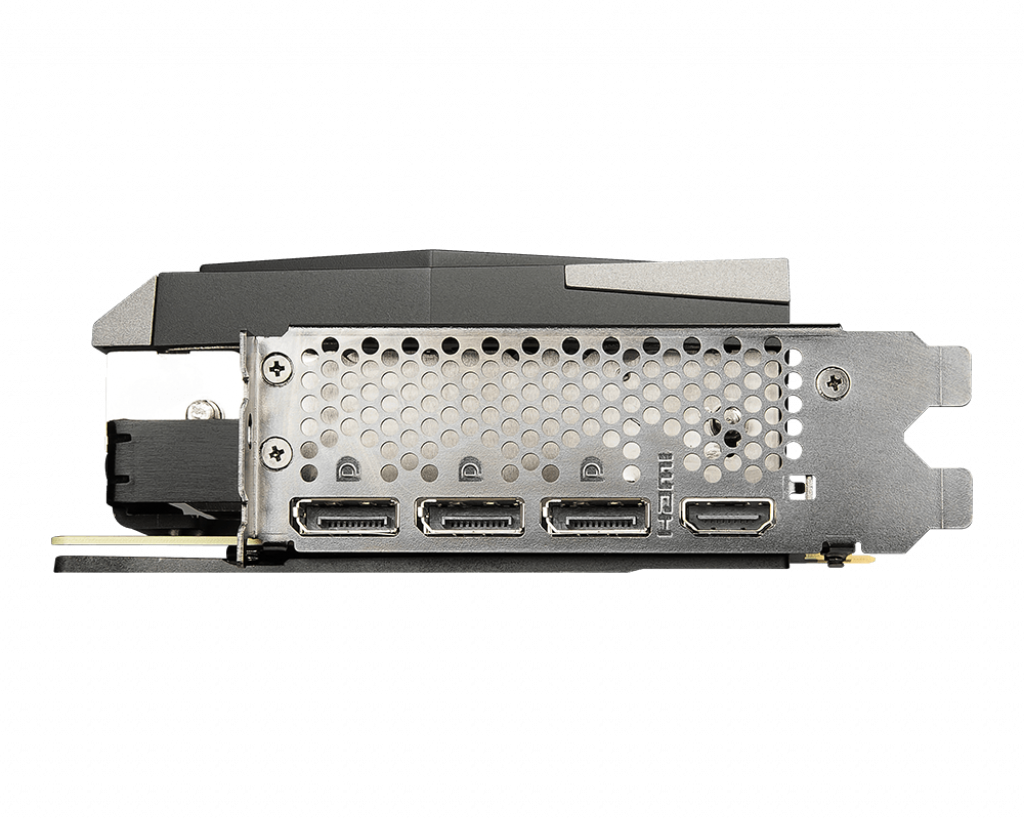
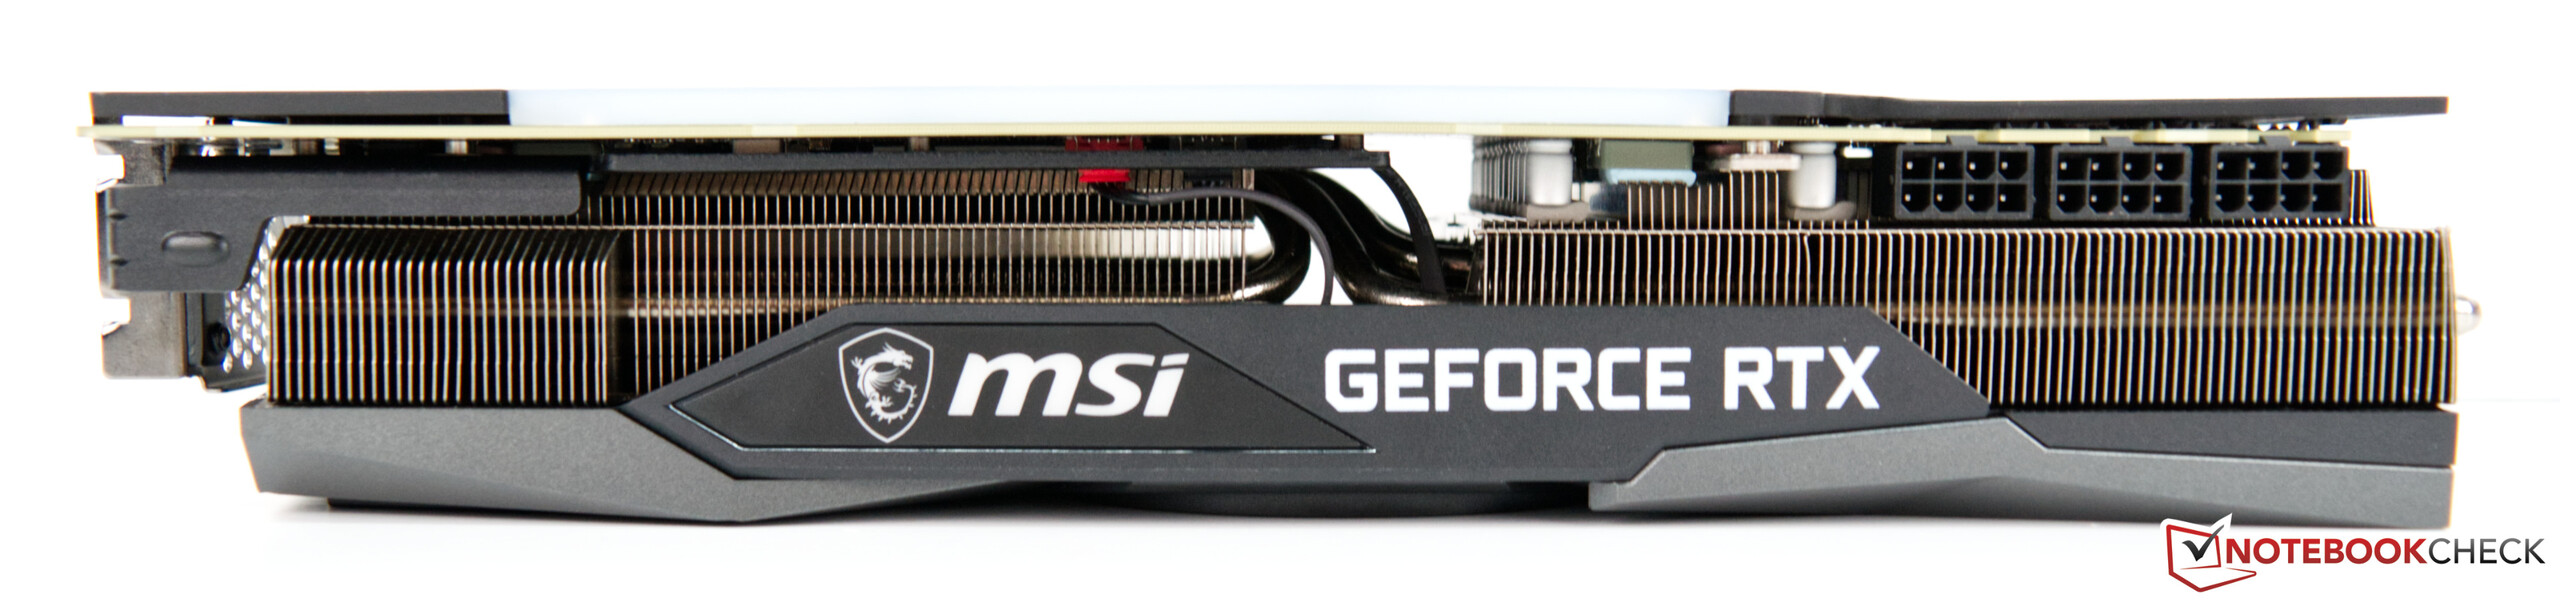
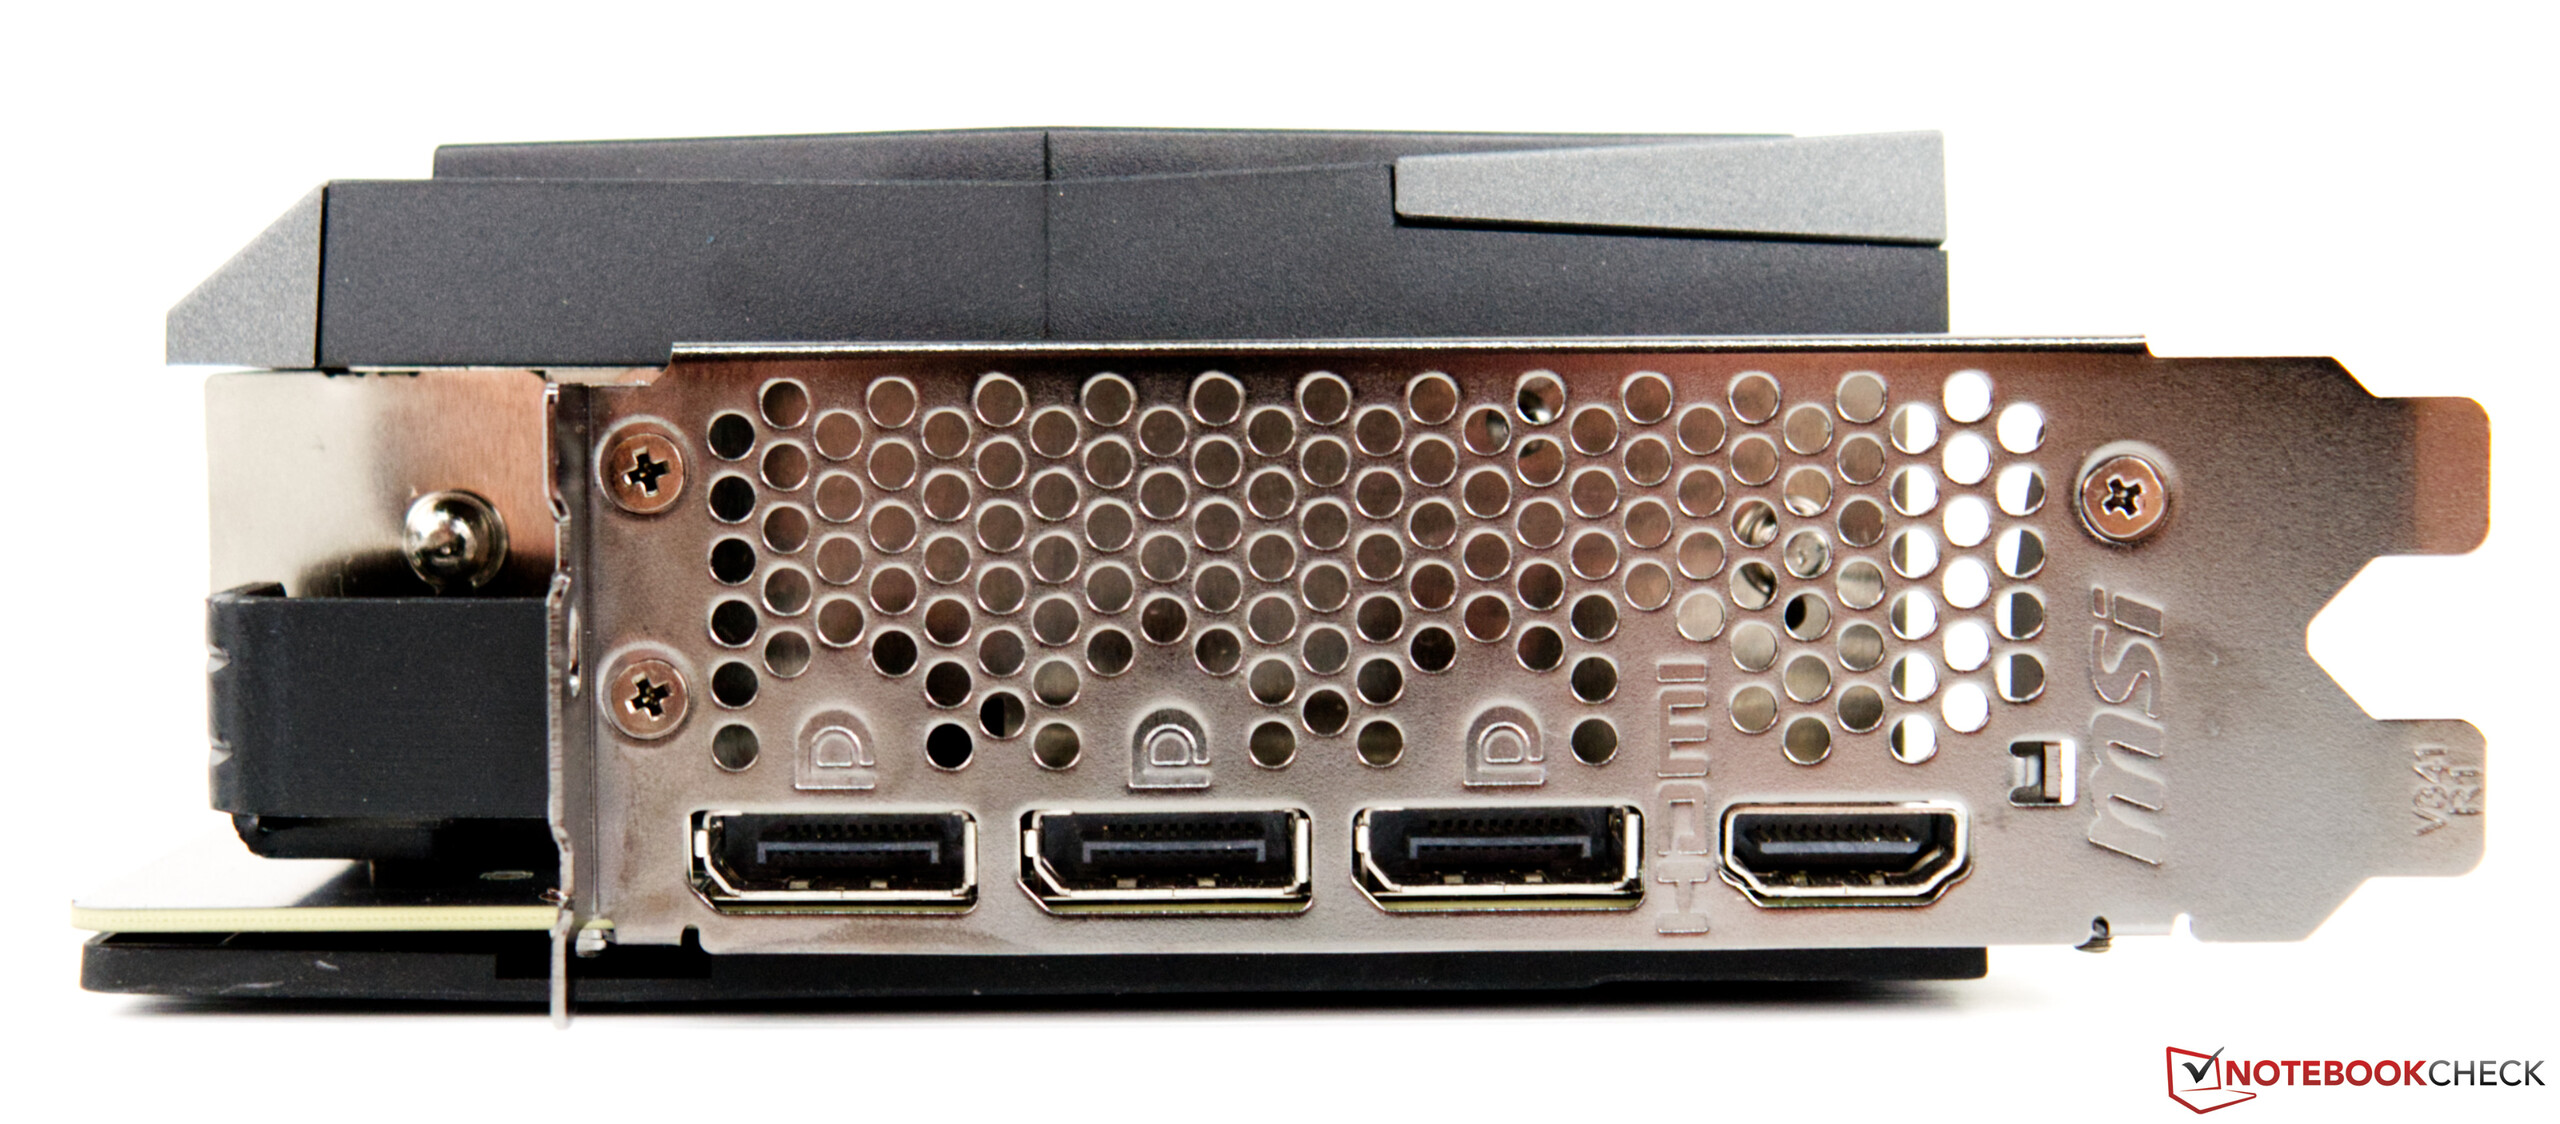
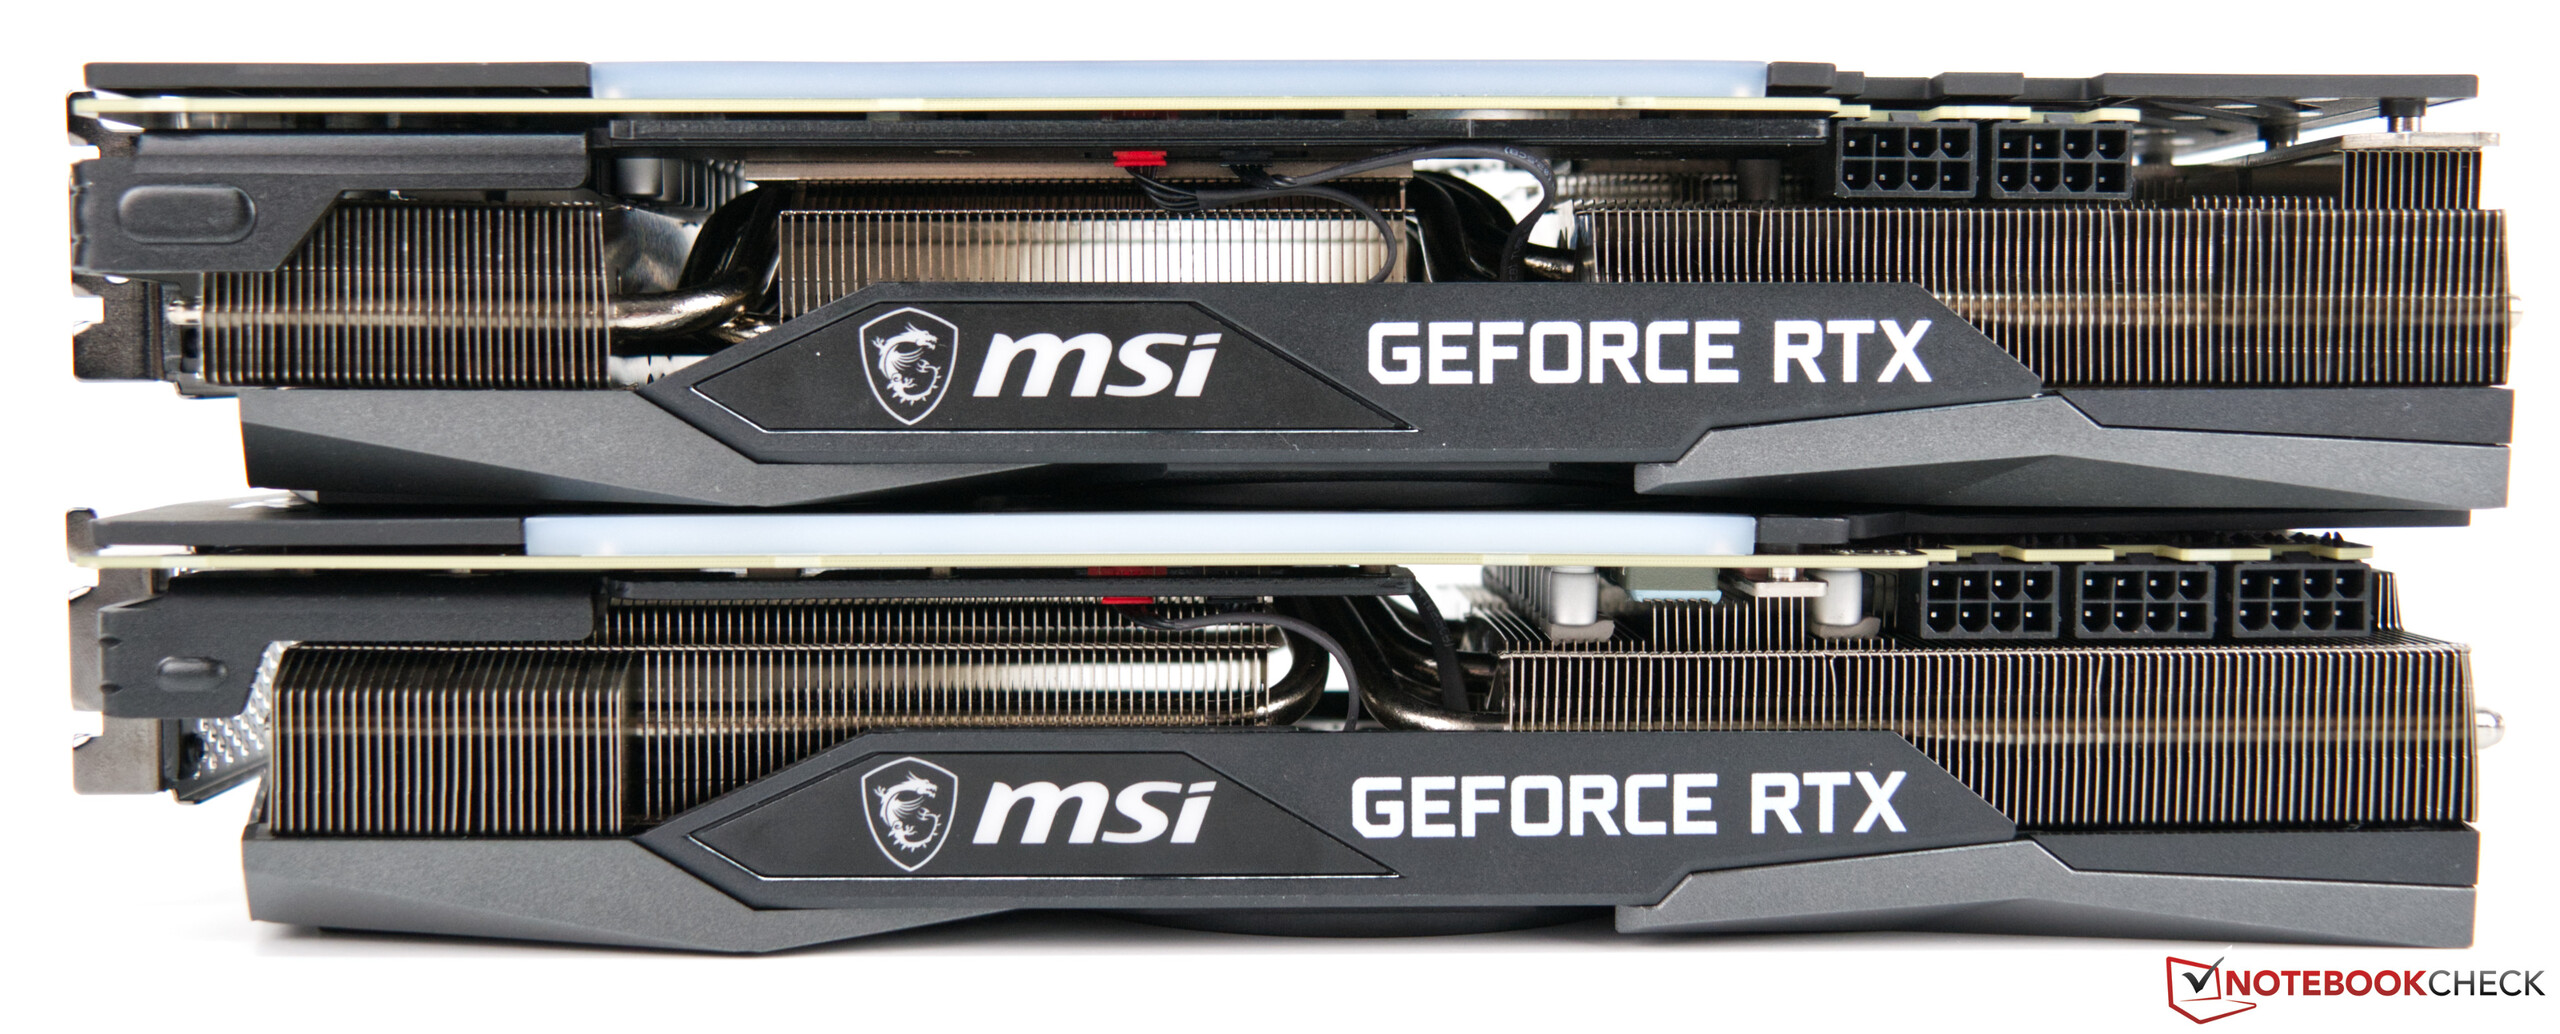
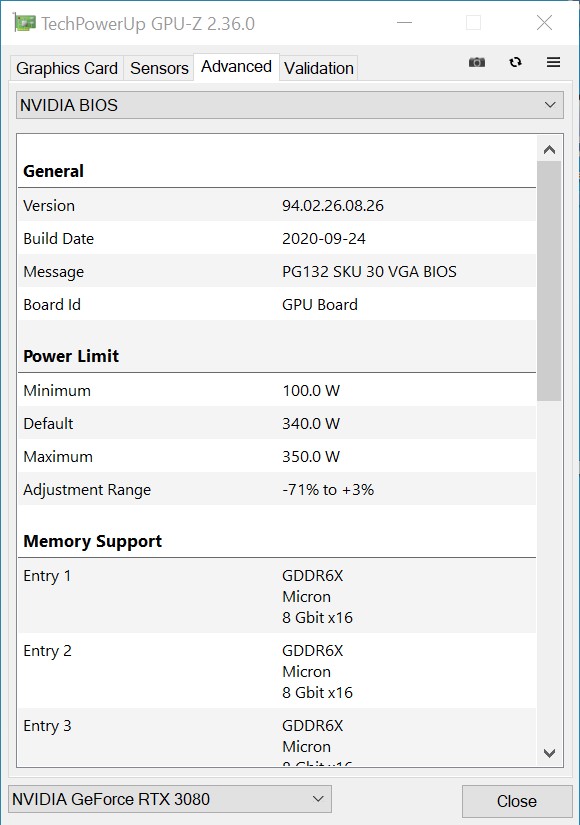
We've already mentioned the higher power consumption, and to be more precise, the graphics card has up to 340 watts at its disposal. The reference model only had 320 watts. At the same time, this means a more stable and higher boost clock speed under load. To supply the graphics card with enough power, it requires three 8-pin power connectors internally, which means that MSI doesn't use the 12-pin connector of the reference design. Externally, the graphics card offers one HDMI 2.1 port and three DisplayPort 1.4a connections. This allows the MSI GeForce RTX 3080 Gaming X Trio to output 8K at 60 Hz or 4K at 120 Hz. We were able to confirm this in the test.


The RTX 3080 compared with other NVIDIA GPUs
| Specification | RTX 3090 | RTX 3080 (Gaming X Trio) | RTX 3080 FE | RTX 3070 FE | Titan RTX | TITAN X Pascal | RTX 2080 Ti | RTX 2080 |
| Chip | GA102 | GA102 | GA102 | GA104 | TU102 | GP102 | TU102 | TU104 |
| FinFET process | 8 nm | 8 nm | 8 nm | 8 nm | 12 nm | 16 nm | 12 nm | 12 nm |
| CUDA cores | 10,496 | 8,704 | 8,704 | 5,888 | 4,608 | 3,584 | 4,352 | 2,944 |
| Texture units | 328 | 272 | 272 | 184 | 288 | 224 | 272 | 184 |
| Tensor cores | 328 3rd Gen. | 272 3rd Gen. | 272 3rd Gen. | 184 3rd Gen. | 576 2nd Gen. | - | 544 2nd Gen. | 368 2nd Gen. |
| RT cores | 82 | 68 | 68 | 46 | 72 | - | 68 | 46 |
| GPU base clock | 1,395 MHz | 1,440 MHz | 1,440 MHz | 1,500 MHz | 1,350 MHz | 1,417 MHz | 1,350 MHz | 1,515 MHz |
| GPU boost clock | 1,695 MHz | 1,815 MHz | 1,710 MHz | 1,750 MHz | 1,770 MHz | 1,531 MHz | 1,545 MHz | 1,710 MHz |
| Memory bus | 384-bit | 320-bit | 320-bit | 256-bit | 384-bit | 384-bit | 352-bit | 256-bit |
| Memory bandwidth | 936 GB/s | 760 GB/s | 760 GB/s | 448 GB/s | 672 GB/s | 480.4 GB/s | 616 GB/s | 448 GB/s |
| Video memory | 24 GB GDDR6X | 10 GB GDDR6X | 10 GB GDDR6X | 8 GB GDDR6 | 24 GB GDDR6 | 12 GB GDDR5X | 11 GB GDDR6 | 8 GB GDDR6 |
| Power consumption | 350 W | 340 W | 320 W | 220 W | 280 W | 250 W | 250 W | 215 W |
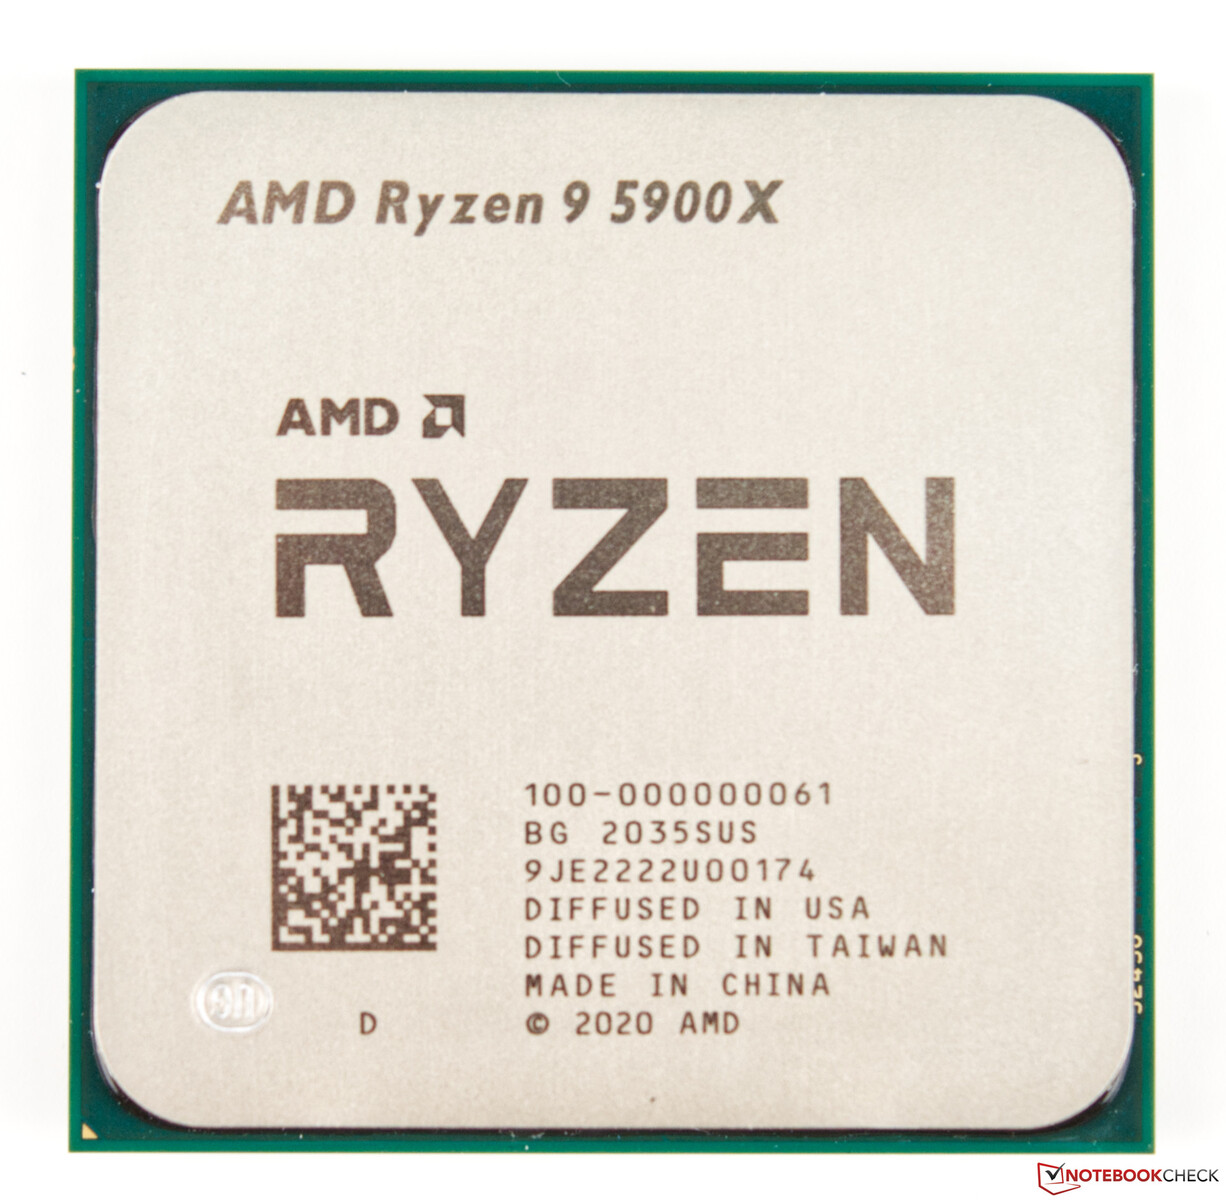
Our test system with the AMD Ryzen 9 5900X as base
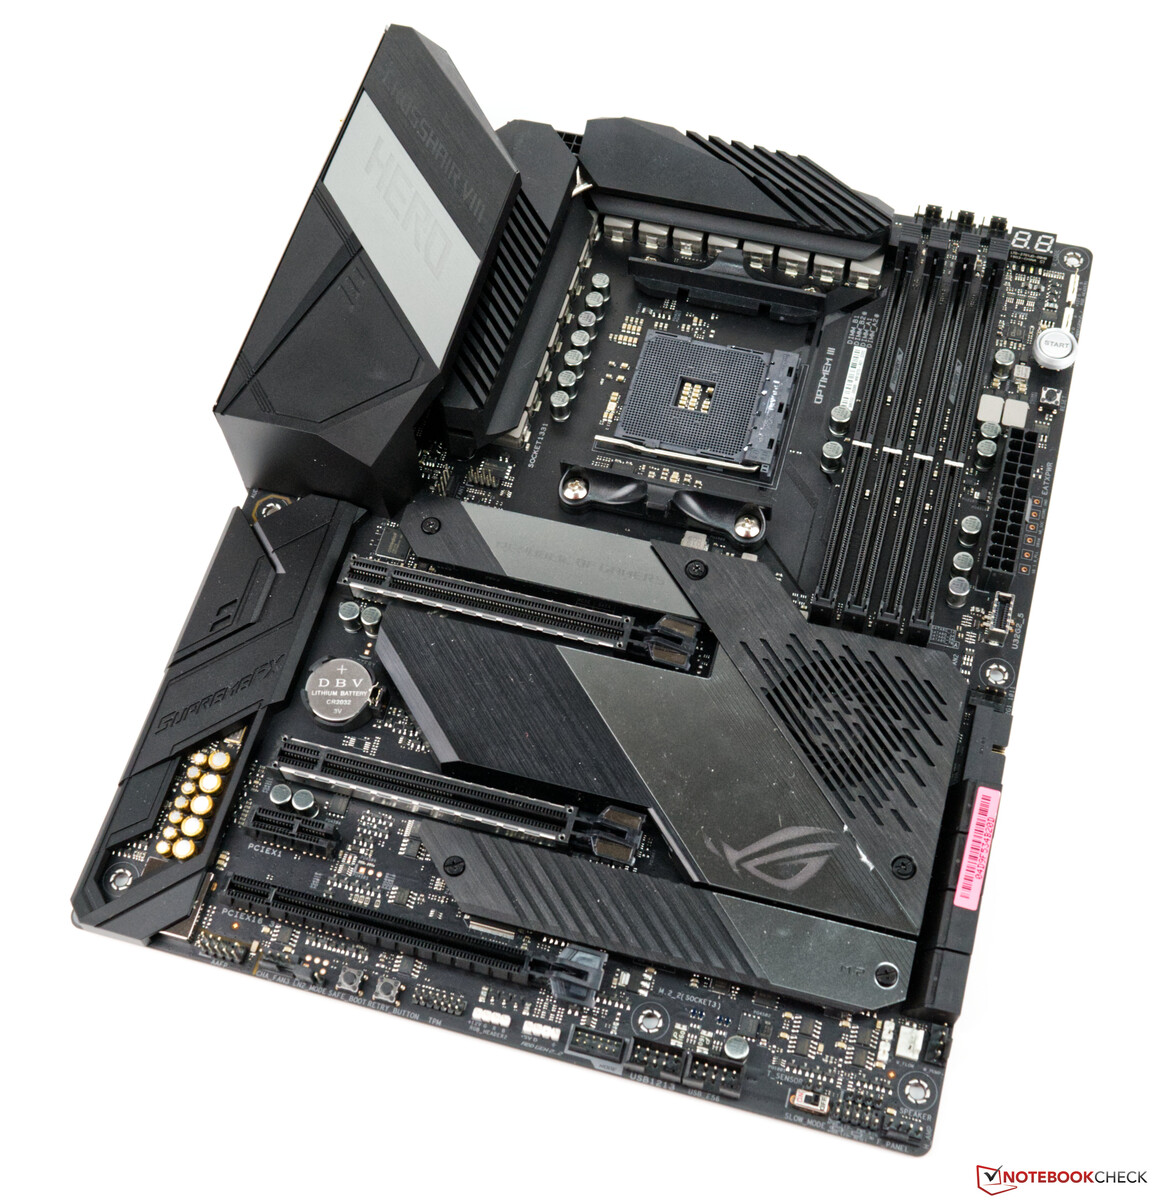
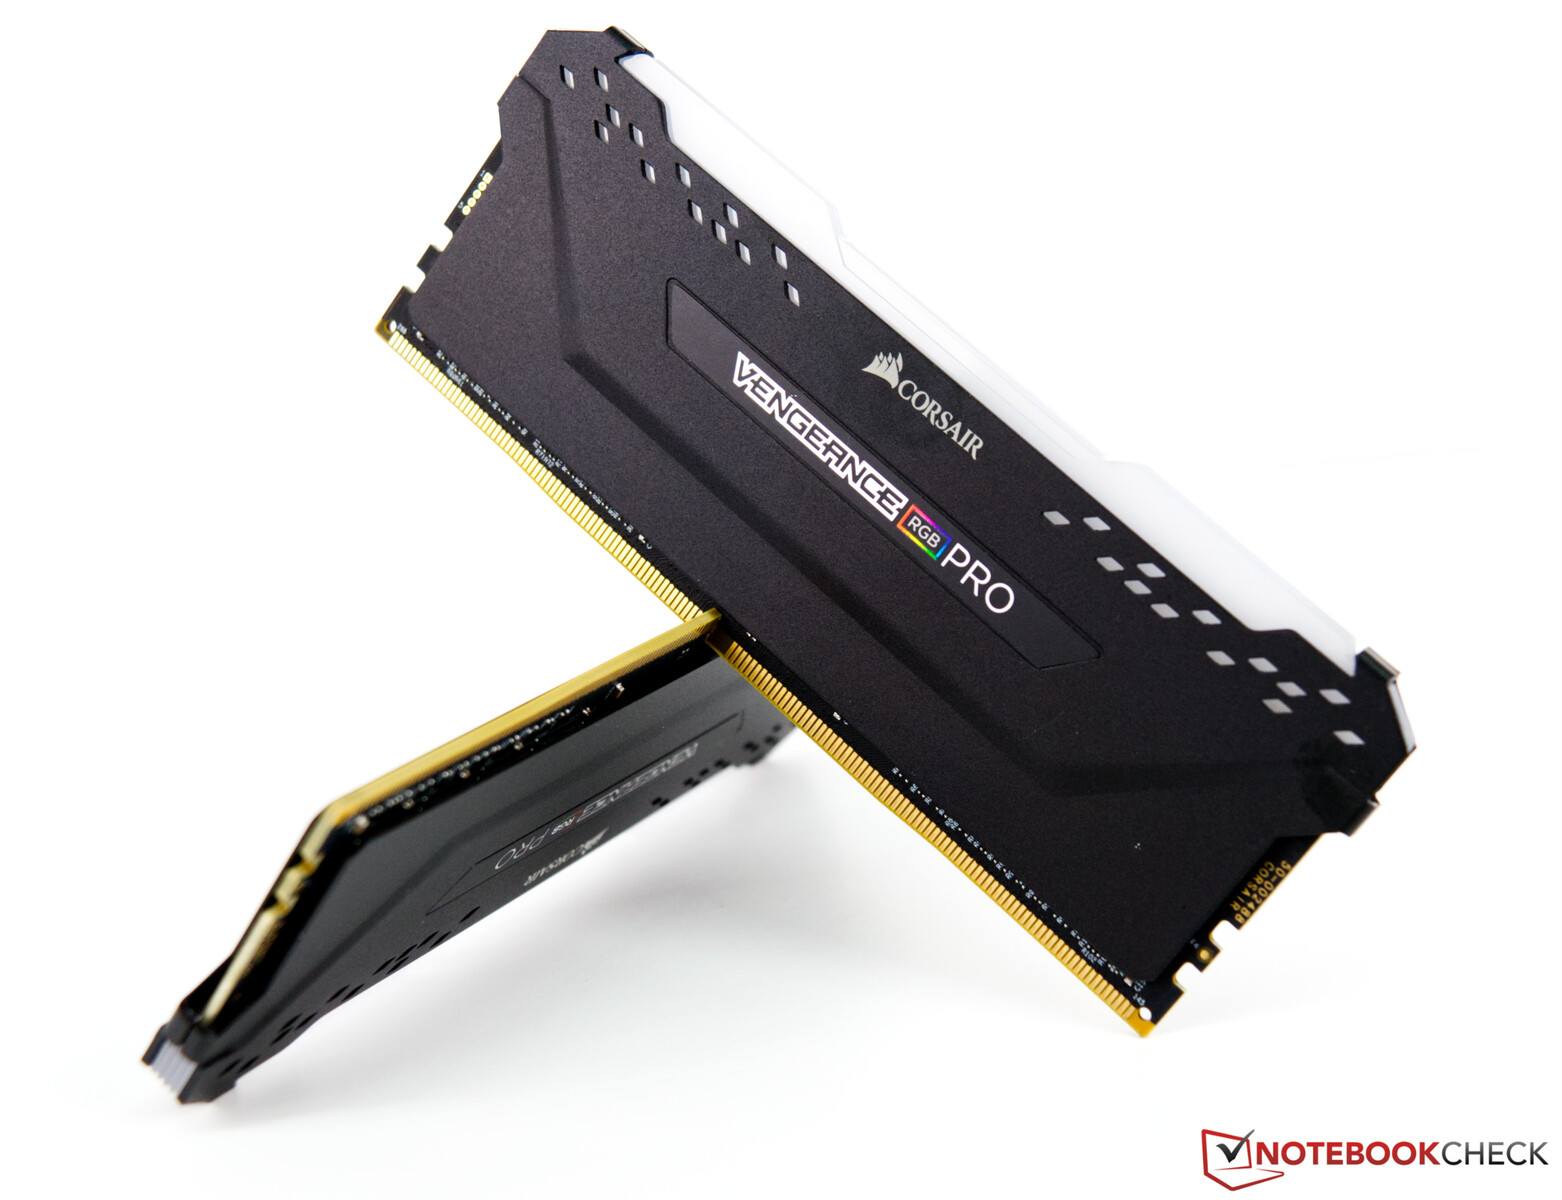
A current AMD platform based on the Asus X570 ROG Crosshair VIII serves as the test system. The CPU (AMD Ryzen 9 5900X) offers good CPU performance, and we use an AIO (Alphacool Eisbaer Aurora 360mm) for cooling. The 32 GB of RAM comes from Corsair and clocks at 4,000 MHz. We use the Acer Predator XB321HK as a monitor. It doesn't limit us due to its UHD capability. At this point, we would like to thank AMD for providing the test platform as well as Corsair for the RAM kit.
For the upcoming benchmarks and tests, we use the following system:
- Lian Li O11 Dynamic
- AMD Ryzen 9 5900X
- MSI GeForce RTX 3080 Gaming X Trio (Nvidia driver 460.79)
- Asus X570 ROG Crosshair VIII Hero Wi-Fi (BIOS 2402, default settings, XMP 1 for DDR4-4000)
- Corsair RM1000X 1,000-watt power supply unit
- Corsair Vengeance RGB Pro DDR4-4000 2x 16 GB RAM kit
- Corsair MP600 2 TB M.2 PCIe 4.0 SSD
- Crucial MX500 2 TB (for games)
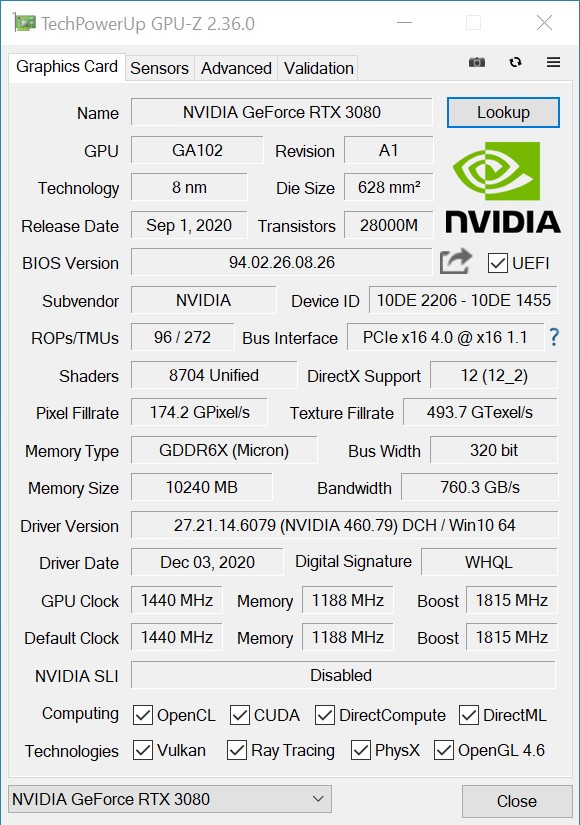
The clock speeds of the MSI GeForce RTX 3080 Gaming X Trio
Nothing has changed in terms of the base clock speed, because the MSI GeForce RTX 3080 Gaming X Trio also clocks at 1,440 MHz. However, there are deviations in the boost clock rate compared to the reference model. MSI's model offers a good 100 MHz. Nevertheless, Asus offered an even higher boost clock speed with the RTX 3080 ROG Strix Gaming OC. You'll find out exactly what this means further down in the review. MSI remains true to the reference model in terms of VRAM too, which means, conversely, that the memory bandwidth of 760 GB/s remains unchanged as well.
Synthetic benchmarks
In the synthetic benchmarks, the GeForce RTX 3080 Gaming X Trio has a battle with the GeForce RTX 3080 ROG Strix Gaming OC. Sometimes MSI is ahead, and sometimes the model from Asus is in the lead. Nevertheless, both models are behind the GeForce RTX 3090 that we recently reviewed in the form of MSI's Suprim X. Compared to a GeForce RTX 2080 Ti, the GeForce RTX 3080 Gaming X Trio can set itself apart with a lead of about 30%. A GeForce RTX 3070 is about as fast at the moment. The very expensive Nvidia Titan RTX can slightly outperform a GeForce RTX 2080 Ti, but it doesn't manage to reach the performance of the GeForce RTX 3080.
| Unigine Superposition | |
| 1280x720 720p Low | |
| Titan RTX | |
| Radeon RX 6800 XT | |
| GeForce RTX 3090 | |
| MSI GeForce RTX 3080 Gaming X Trio | |
| GeForce RTX 3070 | |
| GeForce RTX 3080 | |
| 1920x1080 1080p High | |
| GeForce RTX 3090 | |
| Radeon RX 6800 XT | |
| MSI GeForce RTX 3080 Gaming X Trio | |
| GeForce RTX 3080 | |
| Titan RTX | |
| GeForce RTX 3070 | |
| 1920x1080 1080p Extreme | |
| GeForce RTX 3090 | |
| MSI GeForce RTX 3080 Gaming X Trio | |
| GeForce RTX 3080 | |
| Radeon RX 6800 XT | |
| Titan RTX | |
| GeForce RTX 3070 | |
| 3840x2160 4k Optimized | |
| GeForce RTX 3090 | |
| MSI GeForce RTX 3080 Gaming X Trio | |
| GeForce RTX 3080 | |
| Radeon RX 6800 XT | |
| Titan RTX | |
| GeForce RTX 3070 | |
| 7680x4320 8k Optimized | |
| GeForce RTX 3090 | |
| MSI GeForce RTX 3080 Gaming X Trio | |
| GeForce RTX 3080 | |
| Titan RTX | |
| Radeon RX 6800 XT | |
| GeForce RTX 3070 | |
| 3DMark 03 Standard | 136483 points | |
| 3DMark 05 Standard | 34535 points | |
| 3DMark 06 Standard Score | 35659 points | |
| 3DMark Vantage P Result | 62128 points | |
| 3DMark 11 Performance | 26565 points | |
| 3DMark Ice Storm Standard Score | 197964 points | |
| 3DMark Cloud Gate Standard Score | 48366 points | |
| 3DMark Fire Strike Score | 20451 points | |
| 3DMark Fire Strike Extreme Score | 12092 points | |
| 3DMark Time Spy Score | 8797 points | |
Help | ||
Game benchmarks
The gaming tests that we conducted show very good performance in modern games. Nevertheless, the GeForce RTX 3080 requires high resolutions so as not to be slowed down by the CPU limit. Compared to Asus, our test sample from MSI often has to take a back seat, although the gap is very small and can even be considered a measuring tolerance. Overall, both models are equally fast. Only the GeForce RTX 3090 delivers more FPS at high resolutions. Compared to AMD, Nvidia can assert itself with the RTX 3080 in some games. But AMD can also keep up well with the Radeon RX 6800 XT, and depending on the game, AMD can place itself directly behind the GeForce RTX 3090 with its new graphics card.
Considering only the pure gaming performance, we can recommend the MSI GeForce RTX 3080 Gaming X Trio without any restrictions. However, the somewhat low VRAM still leaves a bad taste, and unfortunately, this doesn't contribute to the GPU being well-equipped for the long run. Nevertheless, the 10 GB of VRAM is currently still sufficient to bring playable frame rates in 2160p onto the screen. The GeForce RTX 3080 might have a harder time in the future, though.
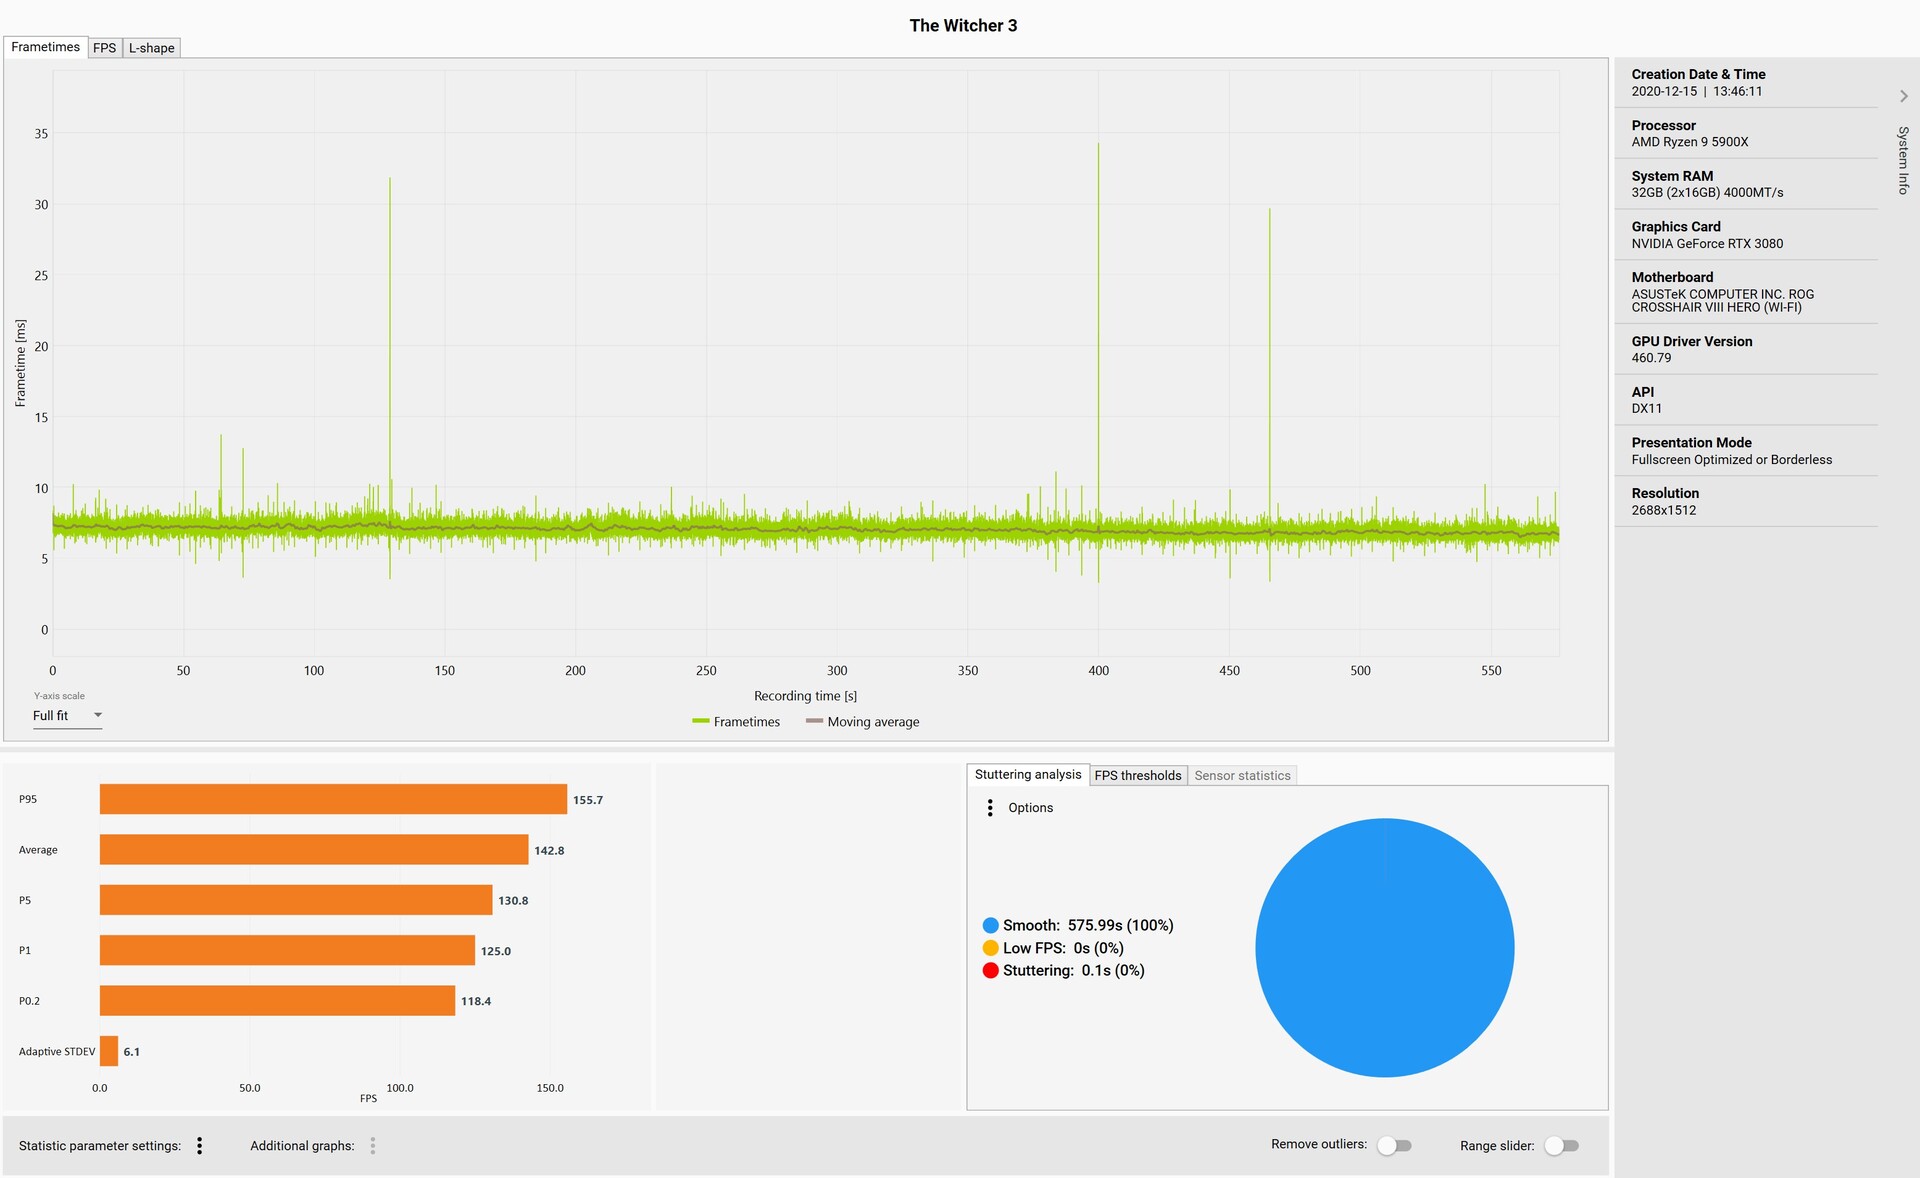
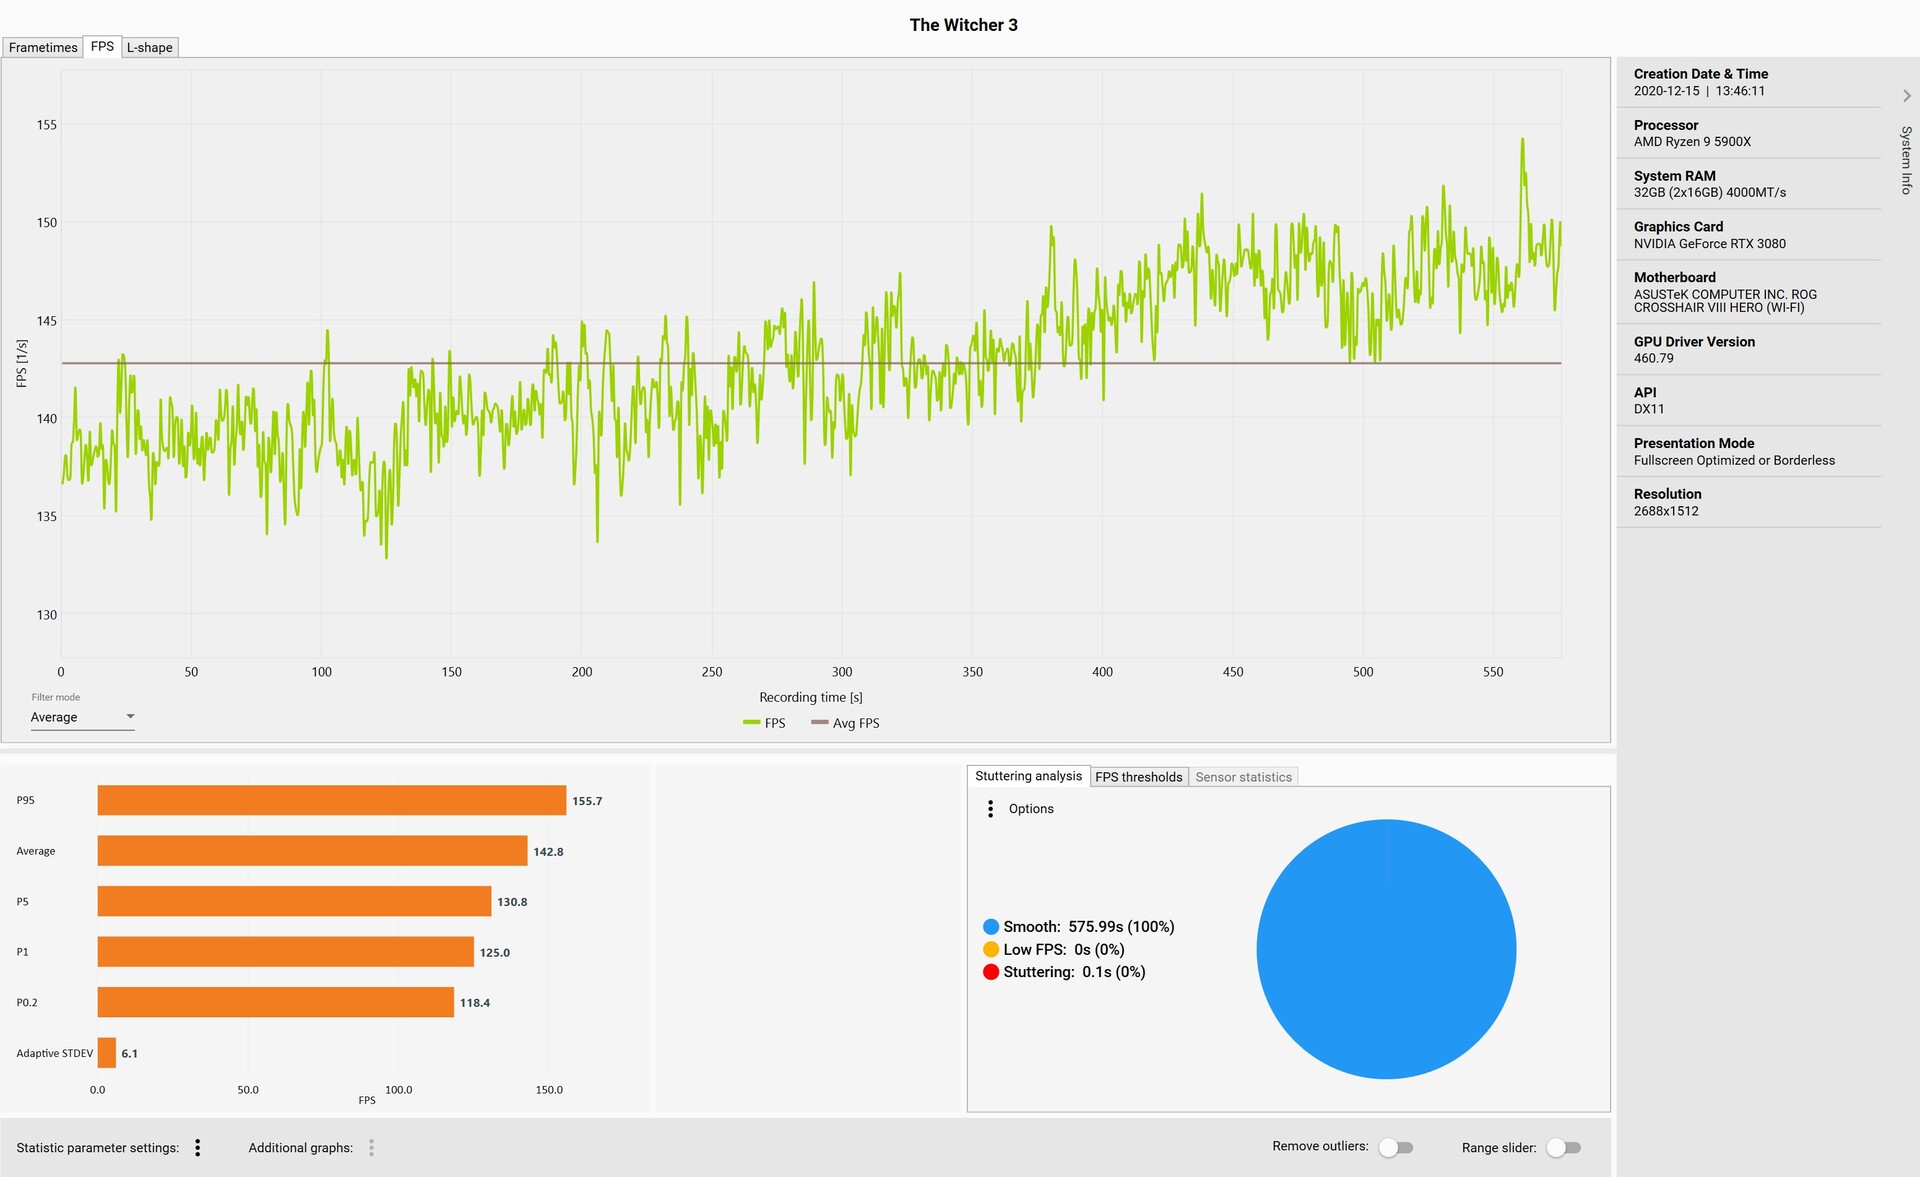
We use The Witcher 3 (Ultra preset) as an example for the frame progression and frame times. The logged data did not show any negative anomalies. Single outliers are visible, but they didn't affect the smooth gameplay in this case.
| F1 2020 - 3840x2160 Ultra High Preset AA:T AF:16x | |
| GeForce RTX 3090 | |
| Radeon RX 6800 XT | |
| GeForce RTX 3080 | |
| MSI GeForce RTX 3080 Gaming X Trio | |
| Titan RTX | |
| GeForce RTX 3070 | |
| Borderlands 3 - 3840x2160 Badass Overall Quality (DX11) | |
| GeForce RTX 3090 | |
| MSI GeForce RTX 3080 Gaming X Trio | |
| GeForce RTX 3080 | |
| Radeon RX 6800 XT | |
| Titan RTX | |
| Titan RTX | |
| GeForce RTX 3070 | |
| GeForce RTX 2080 Ti (Desktop) | |
| Red Dead Redemption 2 - 3840x2160 Maximum Settings | |
| GeForce RTX 3090 | |
| MSI GeForce RTX 3080 Gaming X Trio | |
| GeForce RTX 3080 | |
| Radeon RX 6800 XT | |
| GeForce RTX 3070 | |
| Titan RTX | |
| Rise of the Tomb Raider - 3840x2160 High Preset AA:FX AF:4x | |
| GeForce RTX 3090 | |
| MSI GeForce RTX 3080 Gaming X Trio | |
| GeForce RTX 3080 | |
| Radeon RX 6800 XT | |
| GeForce RTX 2080 Ti (Desktop) | |
| GeForce RTX 3070 | |
| GeForce RTX 2080 Super (Desktop) | |
| GeForce RTX 2080 (Desktop) | |
| GeForce RTX 2070 Super (Desktop) | |
| GeForce RTX 2070 (Desktop) | |
| Radeon VII | |
| GeForce RTX 2060 Super (Desktop) | |
| RX Vega 64 | |
| GeForce RTX 2060 (Desktop) | |
| Shadow of the Tomb Raider - 3840x2160 Highest Preset AA:T | |
| GeForce RTX 3090 | |
| MSI GeForce RTX 3080 Gaming X Trio | |
| GeForce RTX 3080 | |
| Radeon RX 6800 XT | |
| Titan RTX | |
| Titan RTX | |
| GeForce RTX 3070 | |
| GeForce RTX 2080 Ti (Desktop) | |
| GeForce RTX 2080 Super (Desktop) | |
| GeForce RTX 2080 (Desktop) | |
| Radeon VII | |
| GeForce RTX 2070 Super (Desktop) | |
| GeForce RTX 2070 (Desktop) | |
| Radeon RX 5700 XT (Desktop) | |
| GeForce RTX 2060 Super (Desktop) | |
| Radeon RX 5700 (Desktop) | |
| GeForce RTX 2060 (Desktop) | |
| RX Vega 64 | |
| Mafia Definitive Edition - 3840x2160 High Preset | |
| GeForce RTX 3090 | |
| GeForce RTX 3080 | |
| MSI GeForce RTX 3080 Gaming X Trio | |
| Titan RTX | |
| Radeon RX 6800 XT | |
| GeForce RTX 3070 | |
| Watch Dogs Legion - 3840x2160 Ultra Preset (DX12) | |
| GeForce RTX 3090 | |
| GeForce RTX 3080 | |
| MSI GeForce RTX 3080 Gaming X Trio | |
| Radeon RX 6800 XT | |
| Titan RTX | |
| GeForce RTX 3070 | |
| The Witcher 3 - 3840x2160 High Graphics & Postprocessing (Nvidia HairWorks Off) | |
| GeForce RTX 3090 | |
| GeForce RTX 3080 | |
| MSI GeForce RTX 3080 Gaming X Trio | |
| Radeon RX 6800 XT | |
| Titan RTX | |
| Titan RTX | |
| GeForce RTX 2080 Ti (Desktop) | |
| GeForce RTX 3070 | |
| GeForce RTX 2080 Super (Desktop) | |
| GeForce RTX 2080 (Desktop) | |
| GeForce RTX 2070 Super (Desktop) | |
| GeForce RTX 2070 (Desktop) | |
| GeForce RTX 2060 Super (Desktop) | |
| Radeon VII | |
| Radeon RX 5700 XT (Desktop) | |
| GeForce RTX 2060 (Desktop) | |
| RX Vega 64 | |
| Radeon RX 5700 (Desktop) | |
| low | med. | high | ultra | QHD | 4K | |
|---|---|---|---|---|---|---|
| GTA V (2015) | 182 | 175 | 169 | 104 | 101 | 150 |
| The Witcher 3 (2015) | 446 | 413 | 320 | 145 | 114 | |
| Dota 2 Reborn (2015) | 124.1 | 113.2 | 109.3 | 101.1 | 98 | |
| Rise of the Tomb Raider (2016) | 388 | 300 | 273 | 233 | 114 | |
| Final Fantasy XV Benchmark (2018) | 148 | 132 | 113 | 91 | 66 | |
| X-Plane 11.11 (2018) | 163 | 153 | 122.5 | 104.8 | ||
| Far Cry 5 (2018) | 175 | 152 | 144 | 135 | 132 | 93 |
| Strange Brigade (2018) | 426 | 350 | 315 | 285 | 218 | 134 |
| Shadow of the Tomb Raider (2018) | 191 | 181 | 186 | 177 | 152 | 87.9 |
| Battlefield V (2018) | 187.3 | 165.8 | 148.6 | 137.9 | 116.1 | 87.2 |
| Apex Legends (2019) | 144 | 144 | 144 | 144 | 144 | 140 |
| Far Cry New Dawn (2019) | 143 | 125 | 120 | 108 | 103 | 88 |
| Metro Exodus (2019) | 220 | 181 | 60.2 | 116 | 97.4 | 65.9 |
| Anno 1800 (2019) | 137 | 135 | 93.9 | 54 | 52.4 | 43.2 |
| Control (2019) | 235 | 185 | 151 | 105 | 56.7 | |
| Borderlands 3 (2019) | 147 | 127 | 120 | 117 | 95.7 | 61.9 |
| Star Wars Jedi Fallen Order (2019) | 128 | 127 | 129 | 128 | 97.2 | |
| Red Dead Redemption 2 (2019) | 152.1 | 149.5 | 141.9 | 103 | 86.4 | 56.4 |
| Hunt Showdown (2020) | 260 | 232 | 228 | 188 | 107 | |
| Doom Eternal (2020) | 305 | 302 | 291 | 290 | 277 | 167 |
| F1 2020 (2020) | 321 | 288 | 249 | 179 | 146 | 114 |
| Death Stranding (2020) | 232 | 219 | 208 | 202 | 163 | 98.7 |
| Horizon Zero Dawn (2020) | 198 | 180 | 164 | 144 | 128 | 82 |
| Crysis Remastered (2020) | 227 | 157 | 98.9 | 62.1 | 59.9 | 49.2 |
| Serious Sam 4 (2020) | 161 | 125.2 | 121.7 | 114.3 | 112.8 | 112.7 |
| Mafia Definitive Edition (2020) | 182 | 159 | 144 | 127 | 78.1 | |
| Star Wars Squadrons (2020) | 360 | 392 | 362 | 362 | 274 | 175 |
| FIFA 21 (2020) | 170 | 184 | 182 | 181 | 199 | 195 |
| Watch Dogs Legion (2020) | 122 | 121 | 113 | 99.3 | 81.1 | 53.5 |
| Dirt 5 (2020) | 186 | 134 | 112 | 97 | 85.5 | 65.7 |
| Assassin´s Creed Valhalla (2020) | 136 | 111 | 96 | 88 | 76 | 52 |
| Call of Duty Black Ops Cold War (2020) | 235 | 201 | 173 | 127 | 104 | 65.6 |
| Yakuza Like a Dragon (2020) | 121 | 116 | 118 | 110 | 112 | 72.4 |
| Immortals Fenyx Rising (2020) | 143 | 121 | 109 | 80 | 74 | 57 |
| Cyberpunk 2077 1.0 (2020) | 132 | 128 | 116 | 103 | 72.5 | 38.9 |
Compute performance
In LuxMark and ComputeMark, the MSI GeForce RTX 3080 Gaming X Trio is often a tad ahead of the Asus GeForce RTX 3080 ROG Strix Gaming OC. However, you only get a noticeable performance boost when you use the faster GeForce RTX 3090. Only professional graphics cards like the Quadro or FirePro models are able to offer even more performance.
Emissions of the MSI GeForce RTX 3080 Gaming X Trio
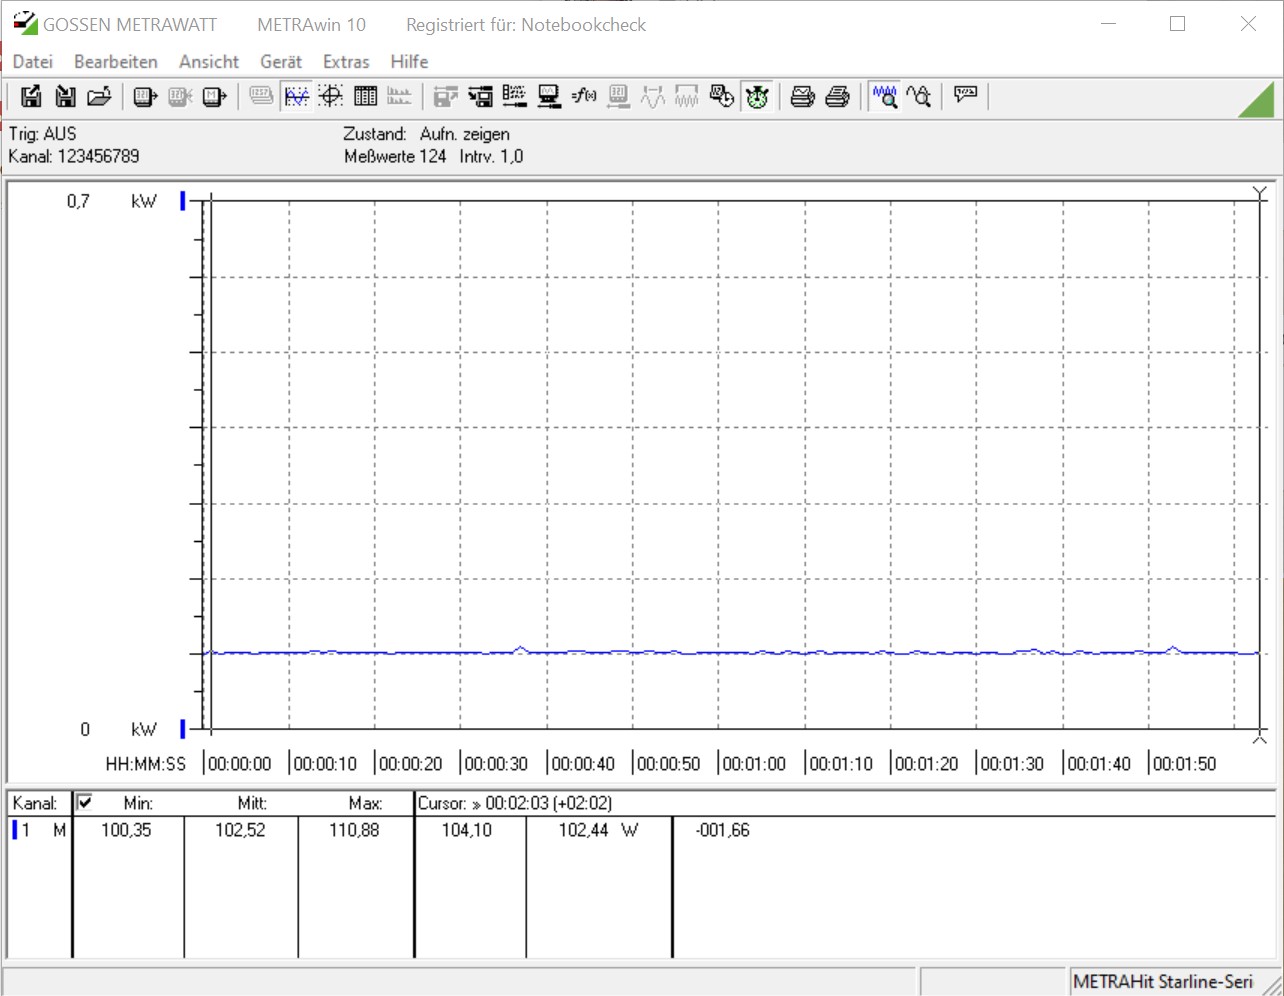
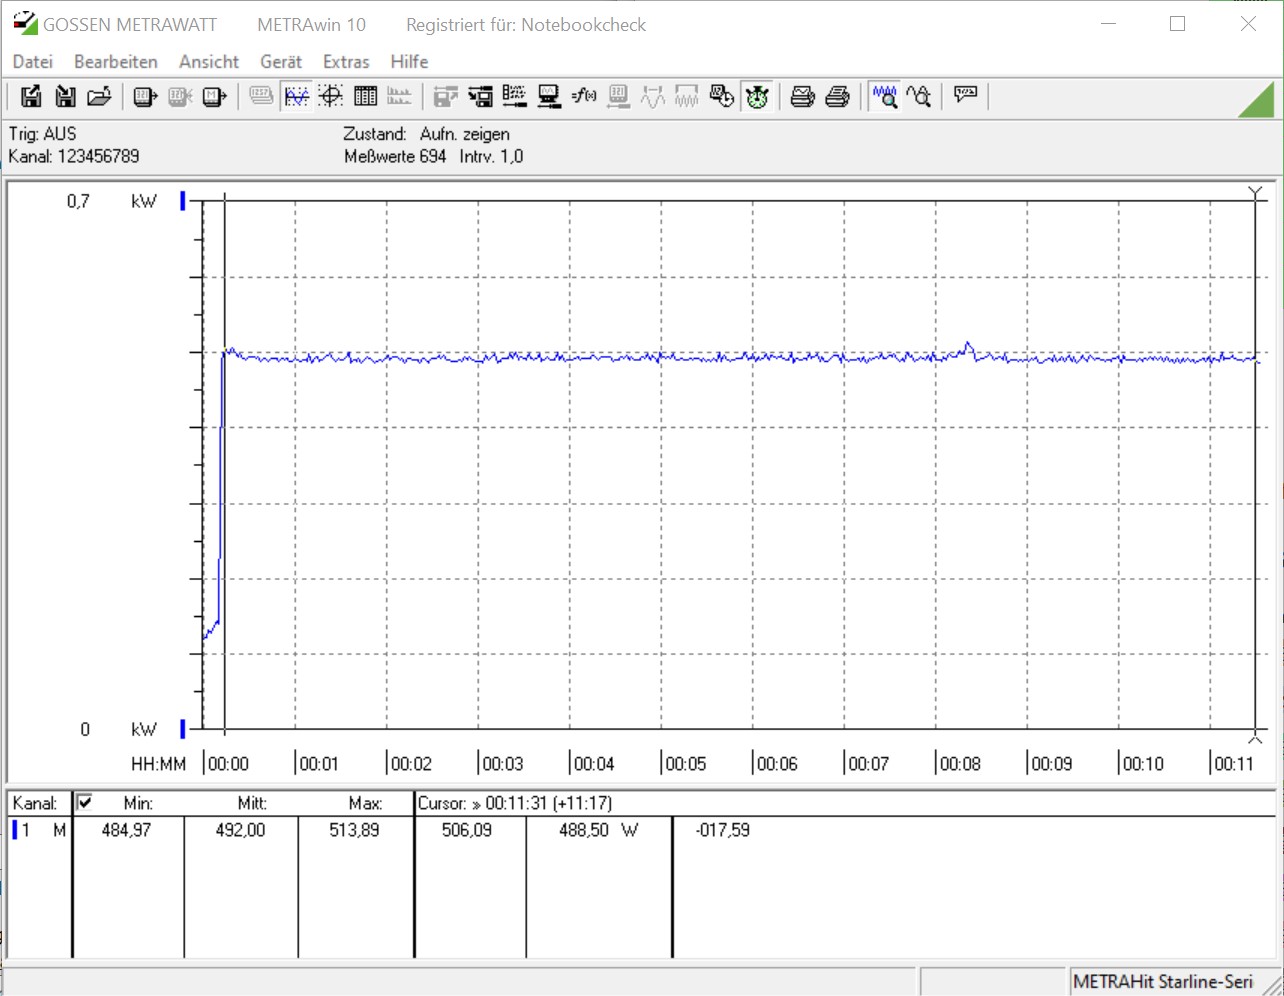
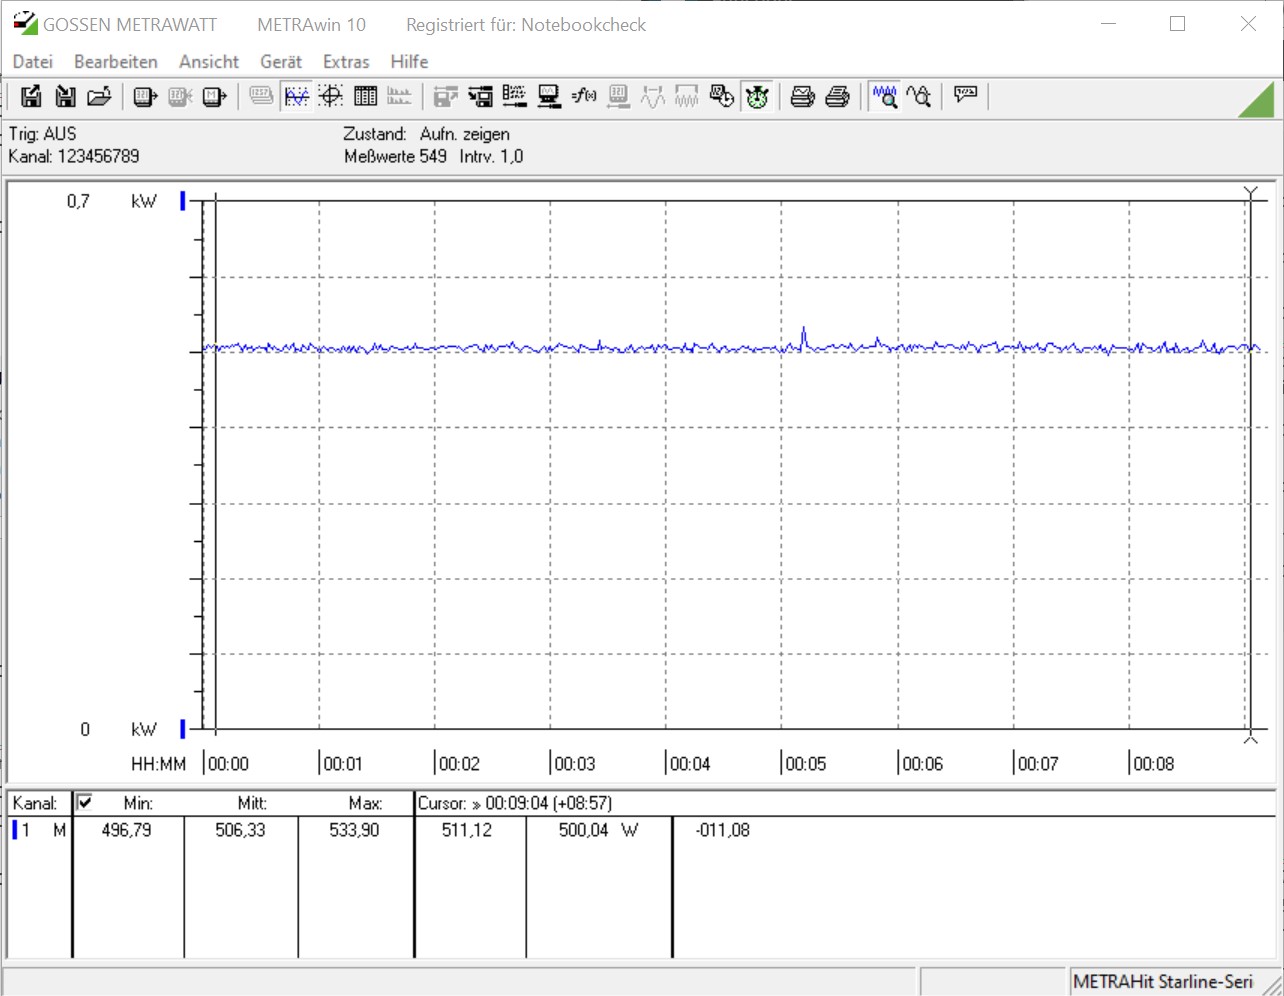
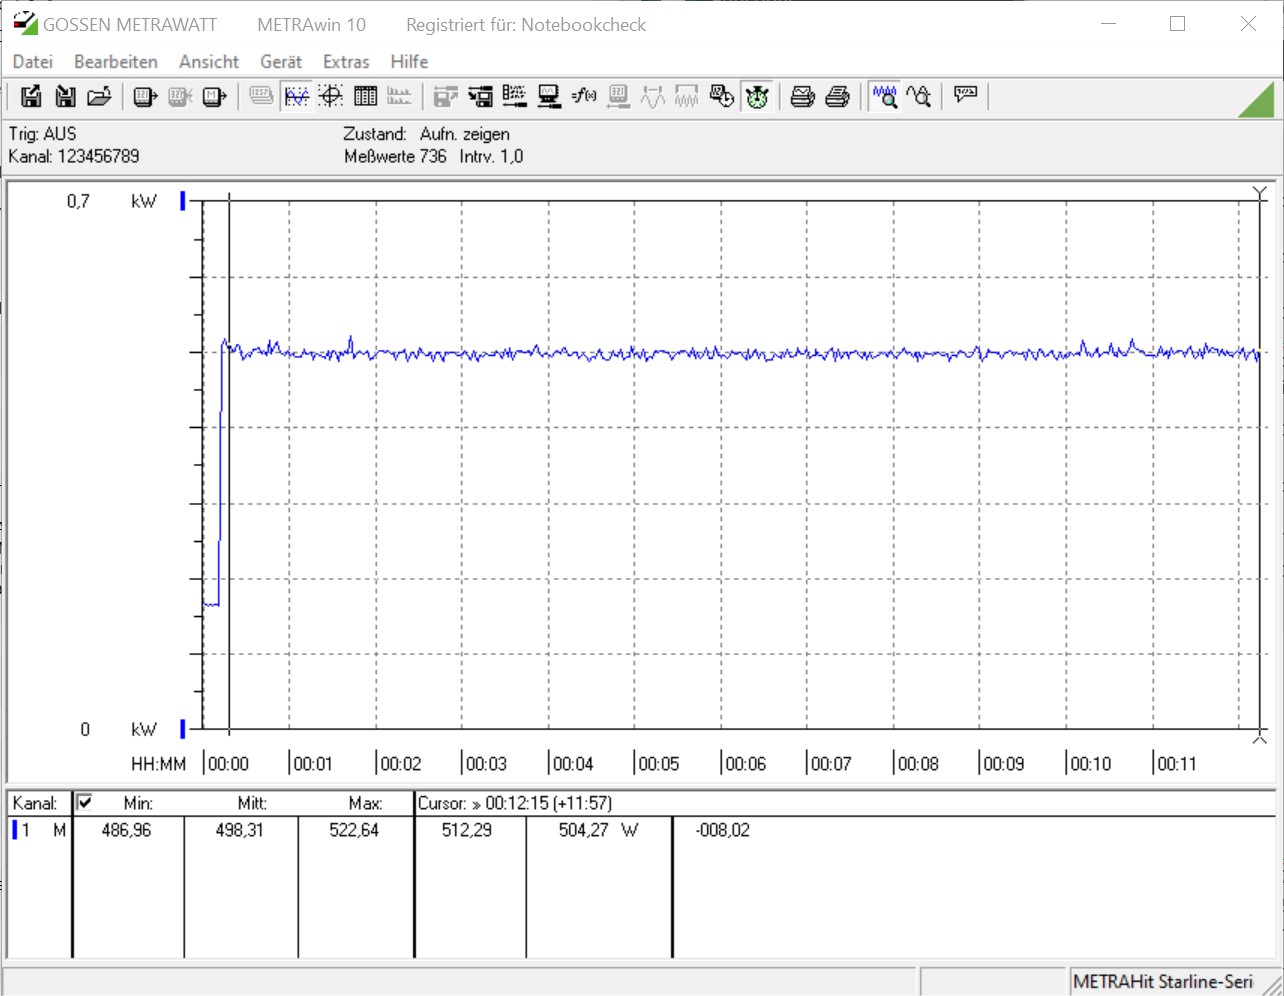
In terms of emissions, it should be clear to every user that a high-end graphics card won't set any records in terms of energy consumption. We recently saw where this all can lead when we reviewed the MSI GeForce RTX 3090 Suprim X. The system with the MSI GeForce RTX Gaming X Trio doesn't draw power from the socket quite as dramatically. Nevertheless, it's still just under 500 watts that our test device displayed on average during gaming. The counterpart from Asus even reached just over 500 watts. Therefore, a powerful power supply unit is mandatory when buying this graphics card. MSI's recommendation for a smooth operation is a 750-watt power supply. Our 1,000-watt power supply from Corsair had no problems, and there were no crashes under load.
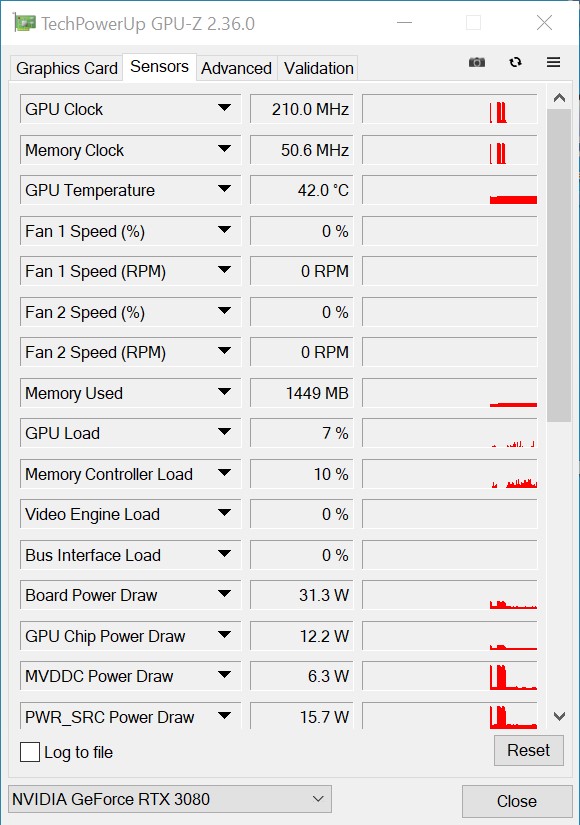
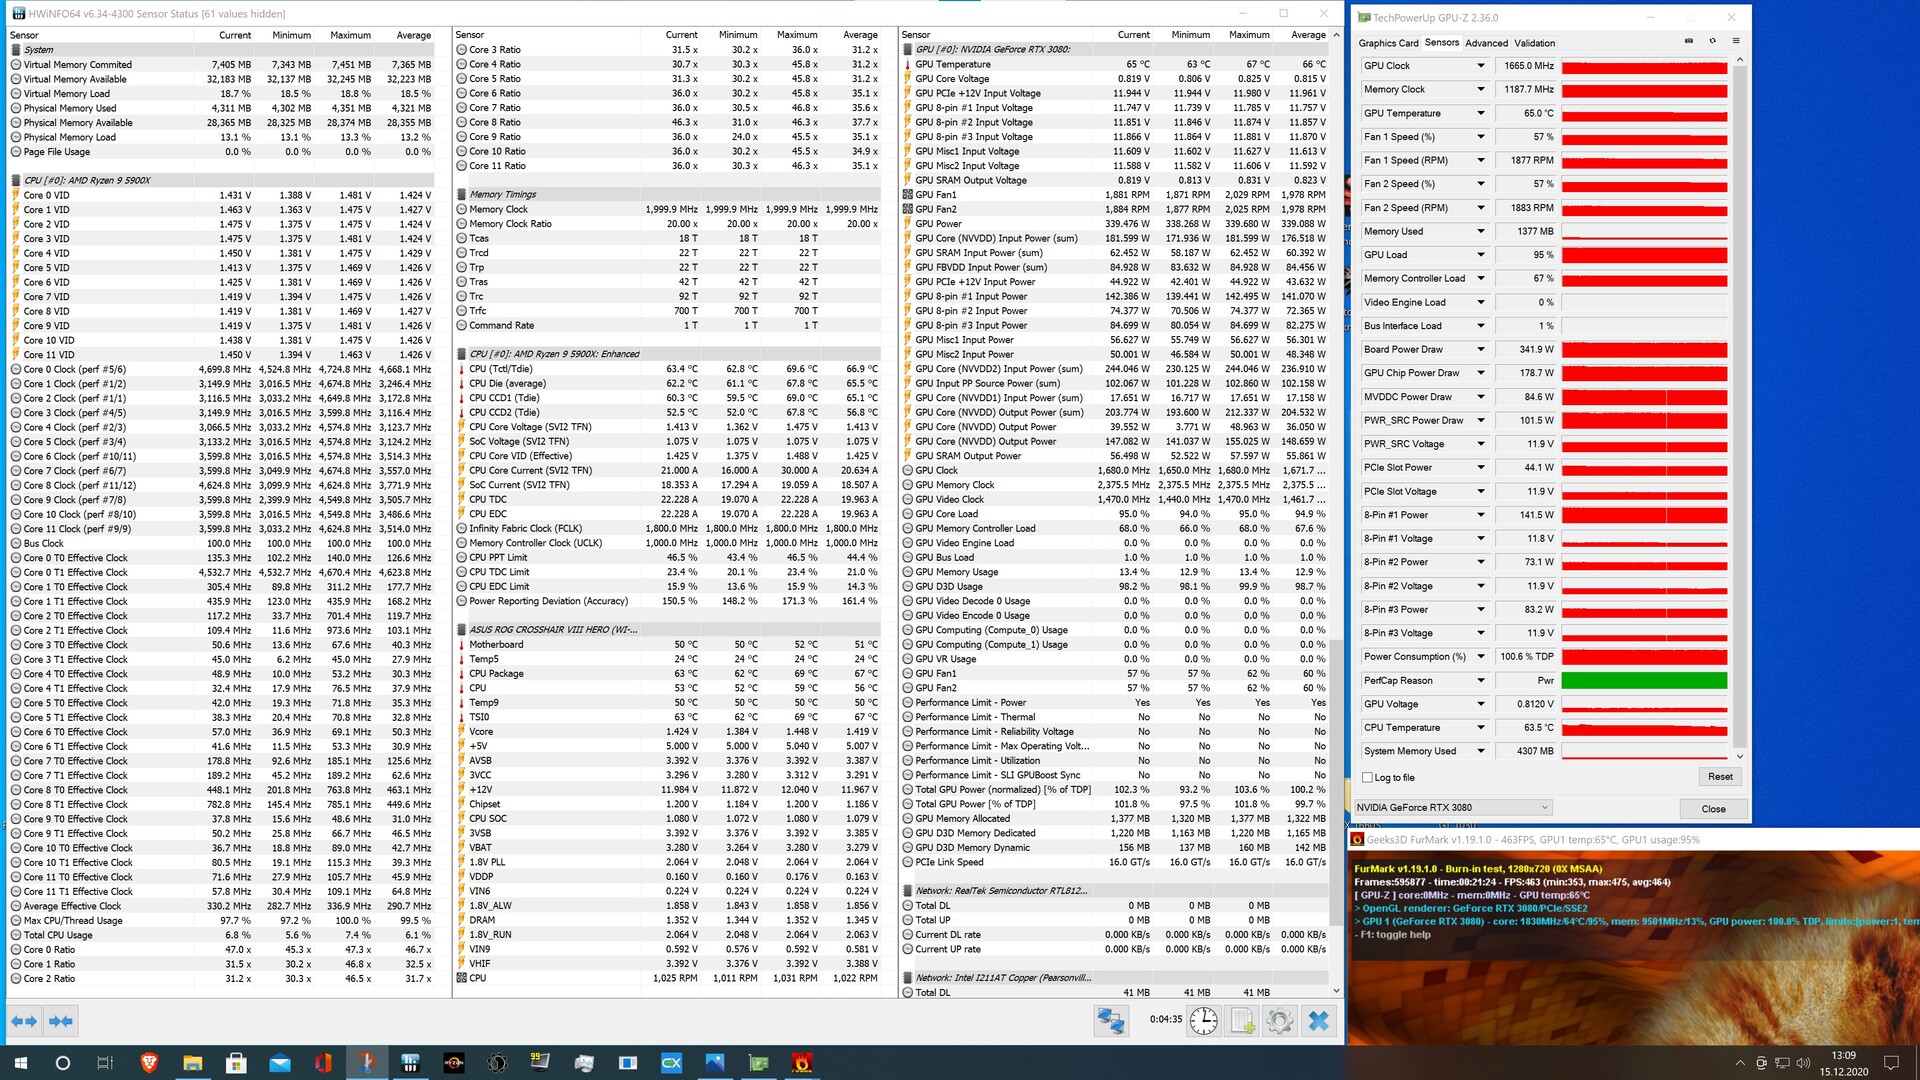
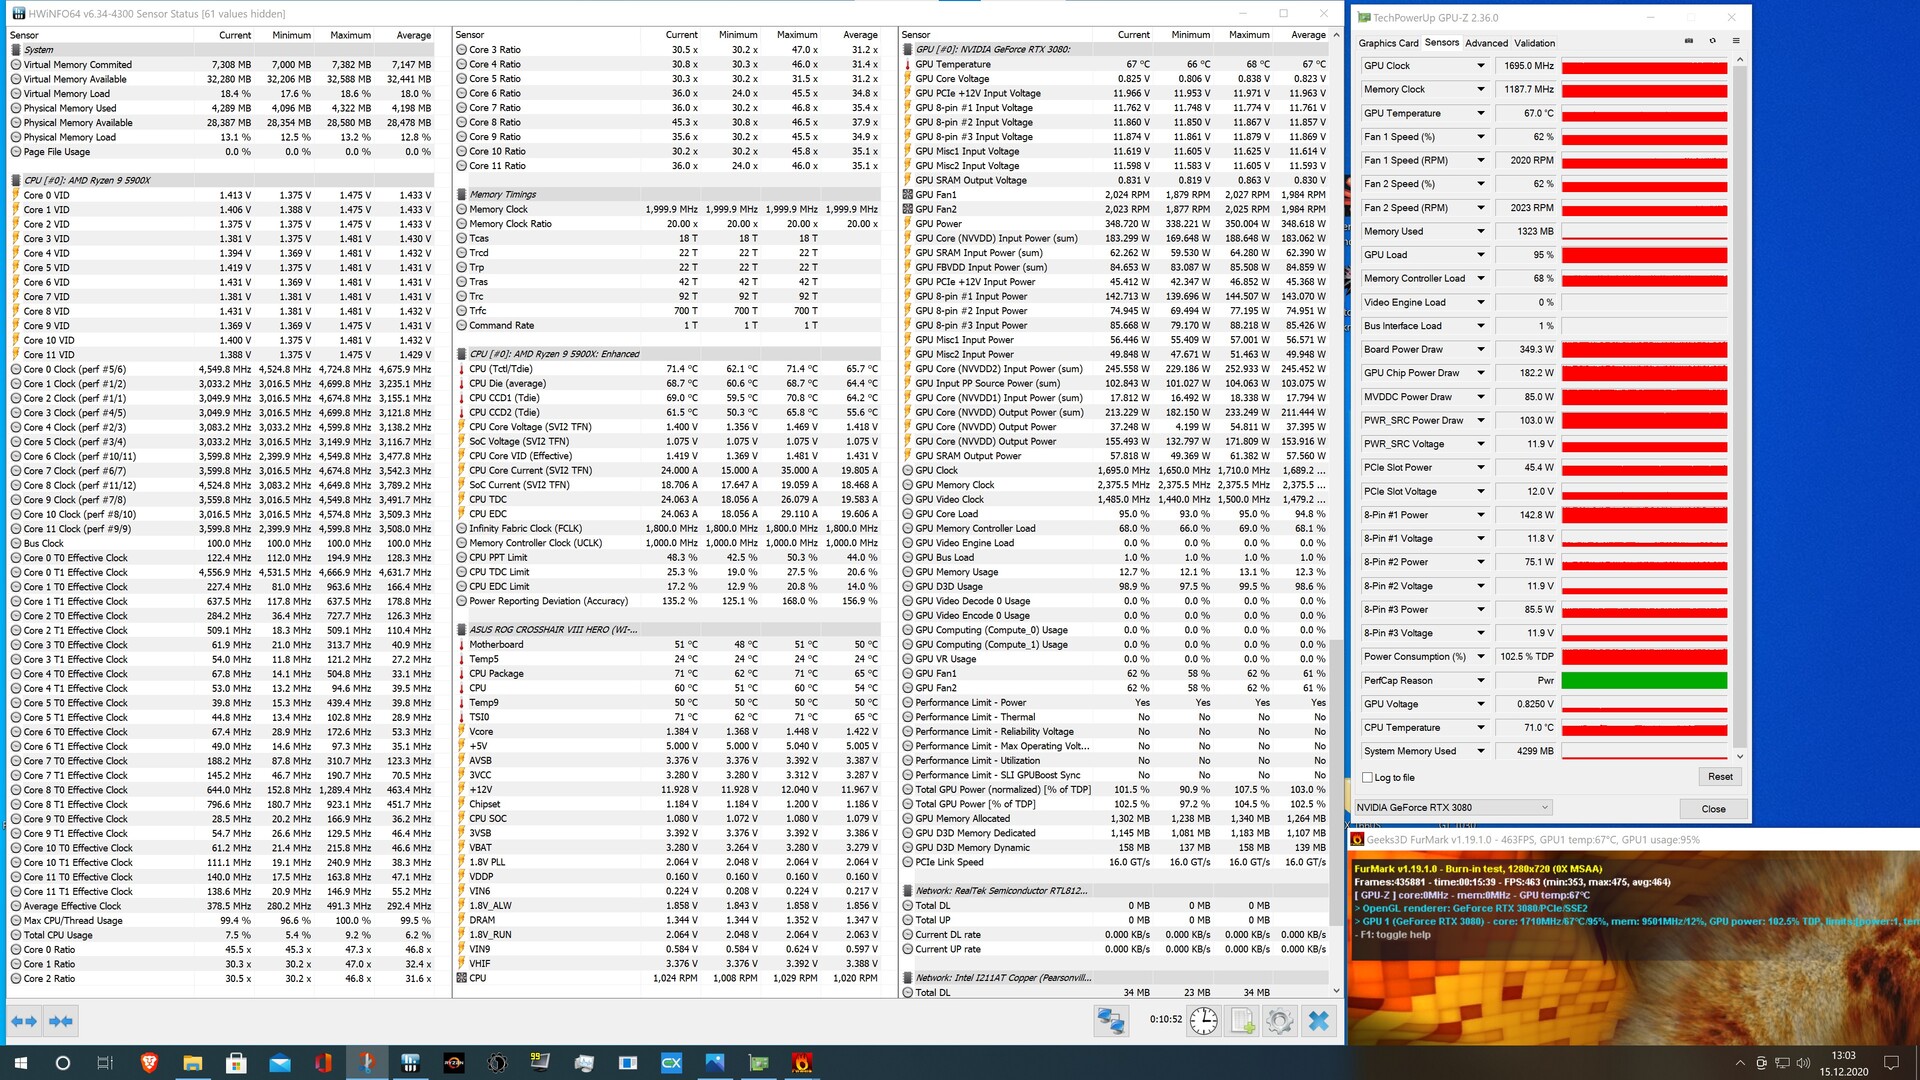
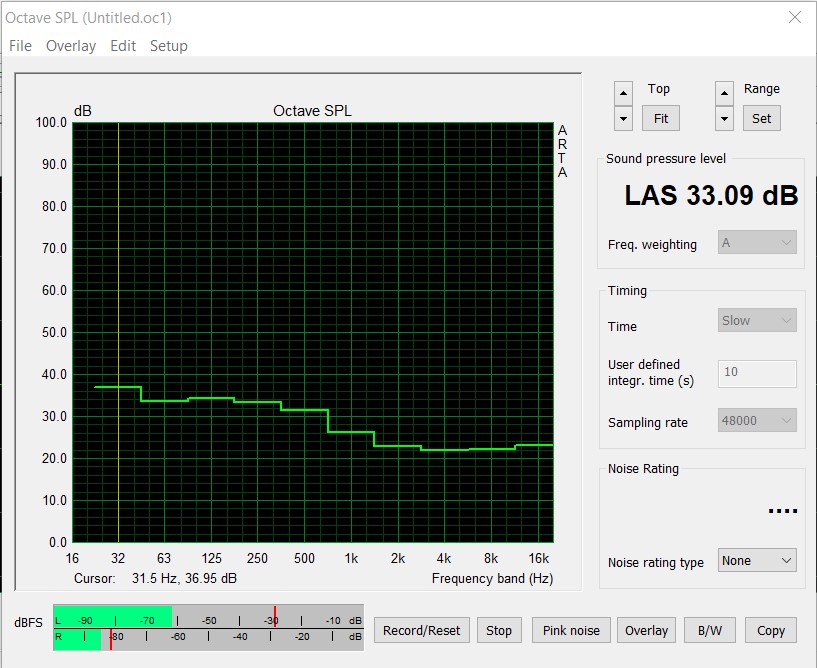
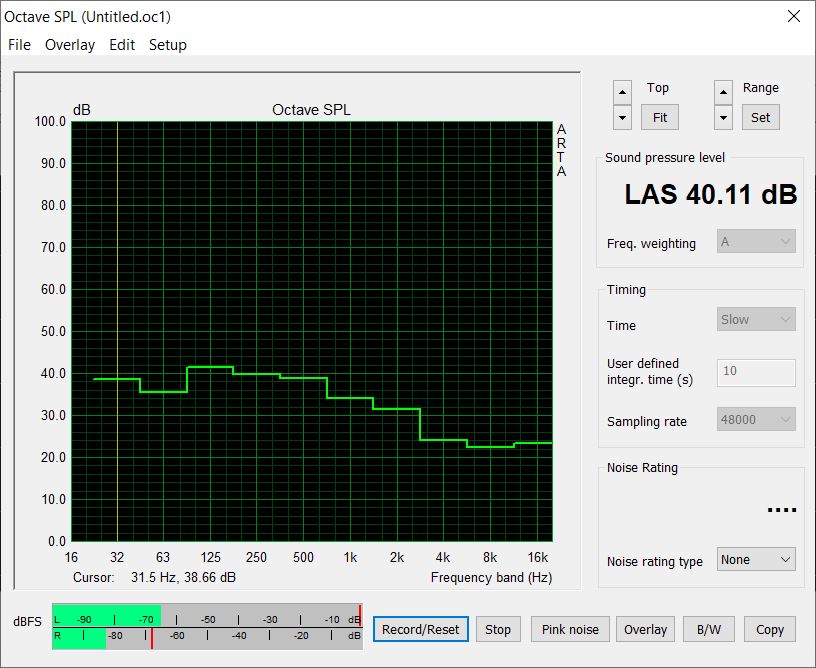
MSI hit the bullseye in terms of noise with the installed cooling concept. In 2D mode or under low load, the fans stand still, and therefore, we could only measure the case fans in idle usage. At a distance of about 20 centimeters next to the case, the noise level was 33 dB(A). During the stress test, the graphics card was quietly audible at a measured 40 dB(A). If you also increase the power target, the noise level increases slightly, which is reflected in the fan revolutions too. The three axial fans have to plow through almost 200 revolutions per minute more to supply the graphics card with fresh air. In normal use, the fan speed is between 1,800 and 1,900 rpm.
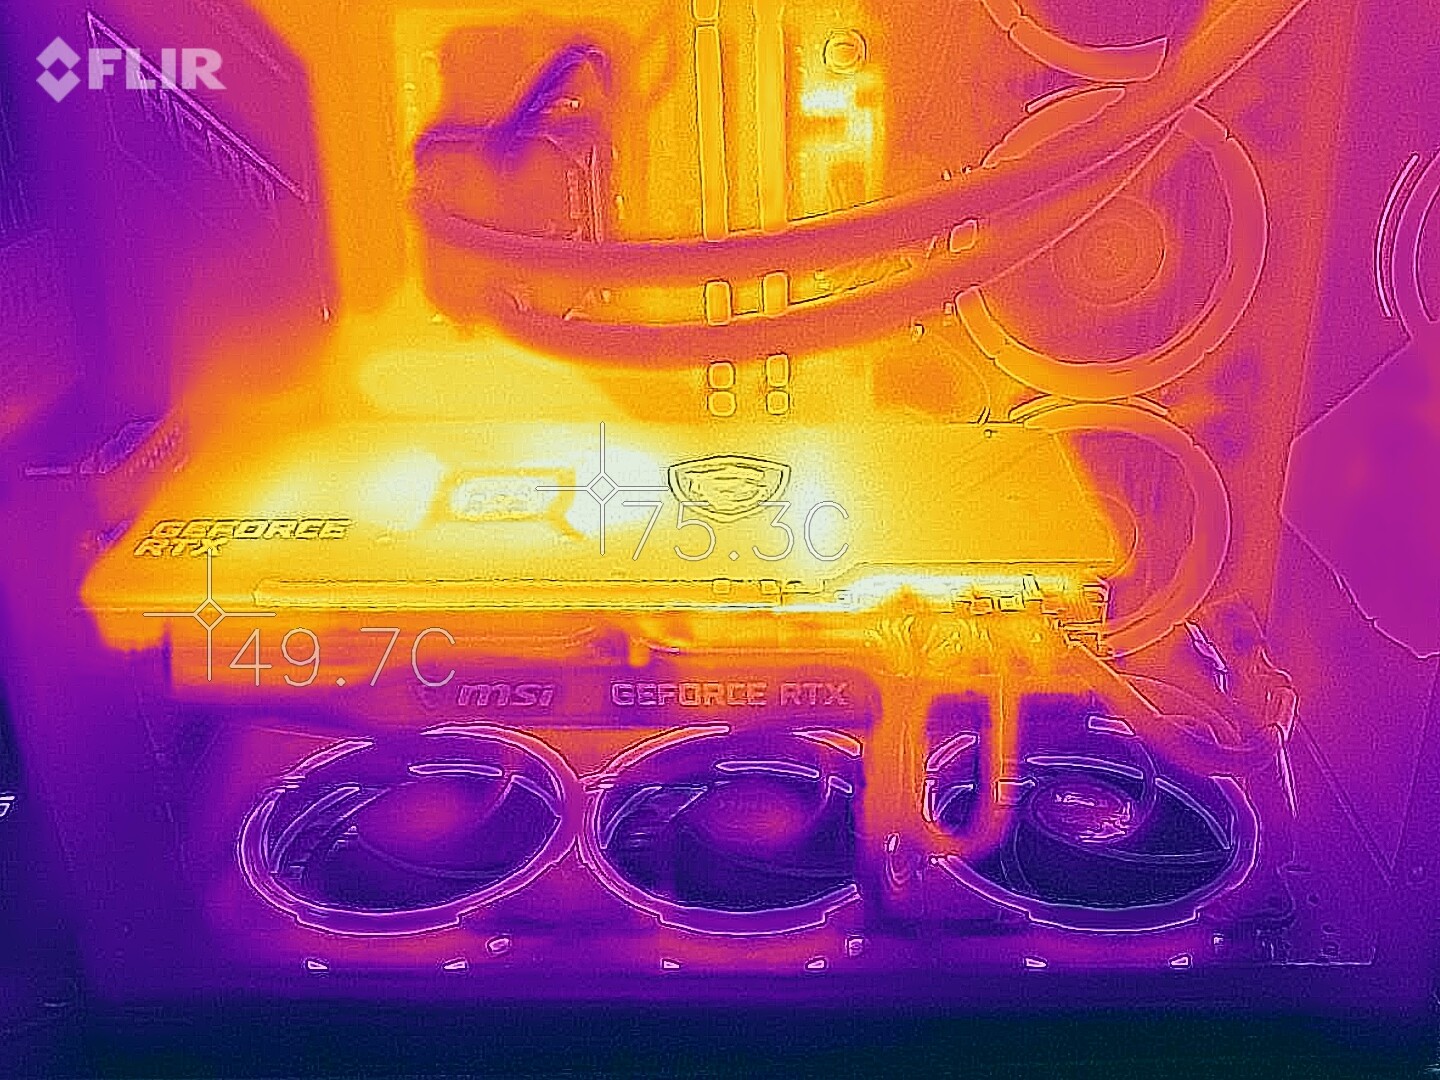
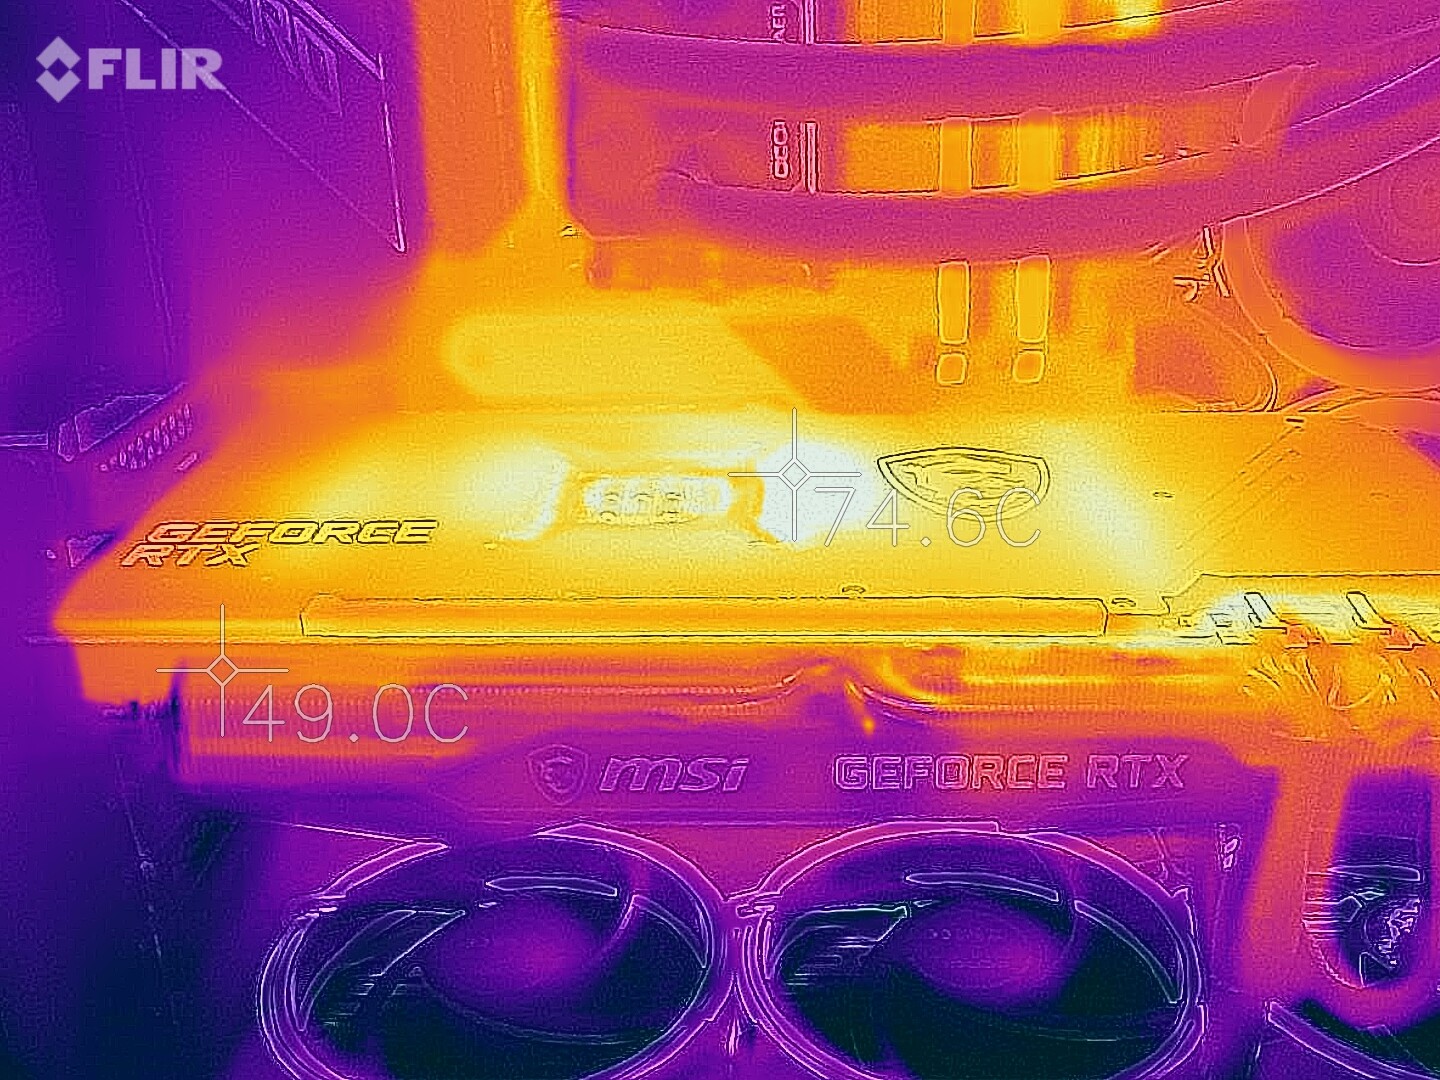
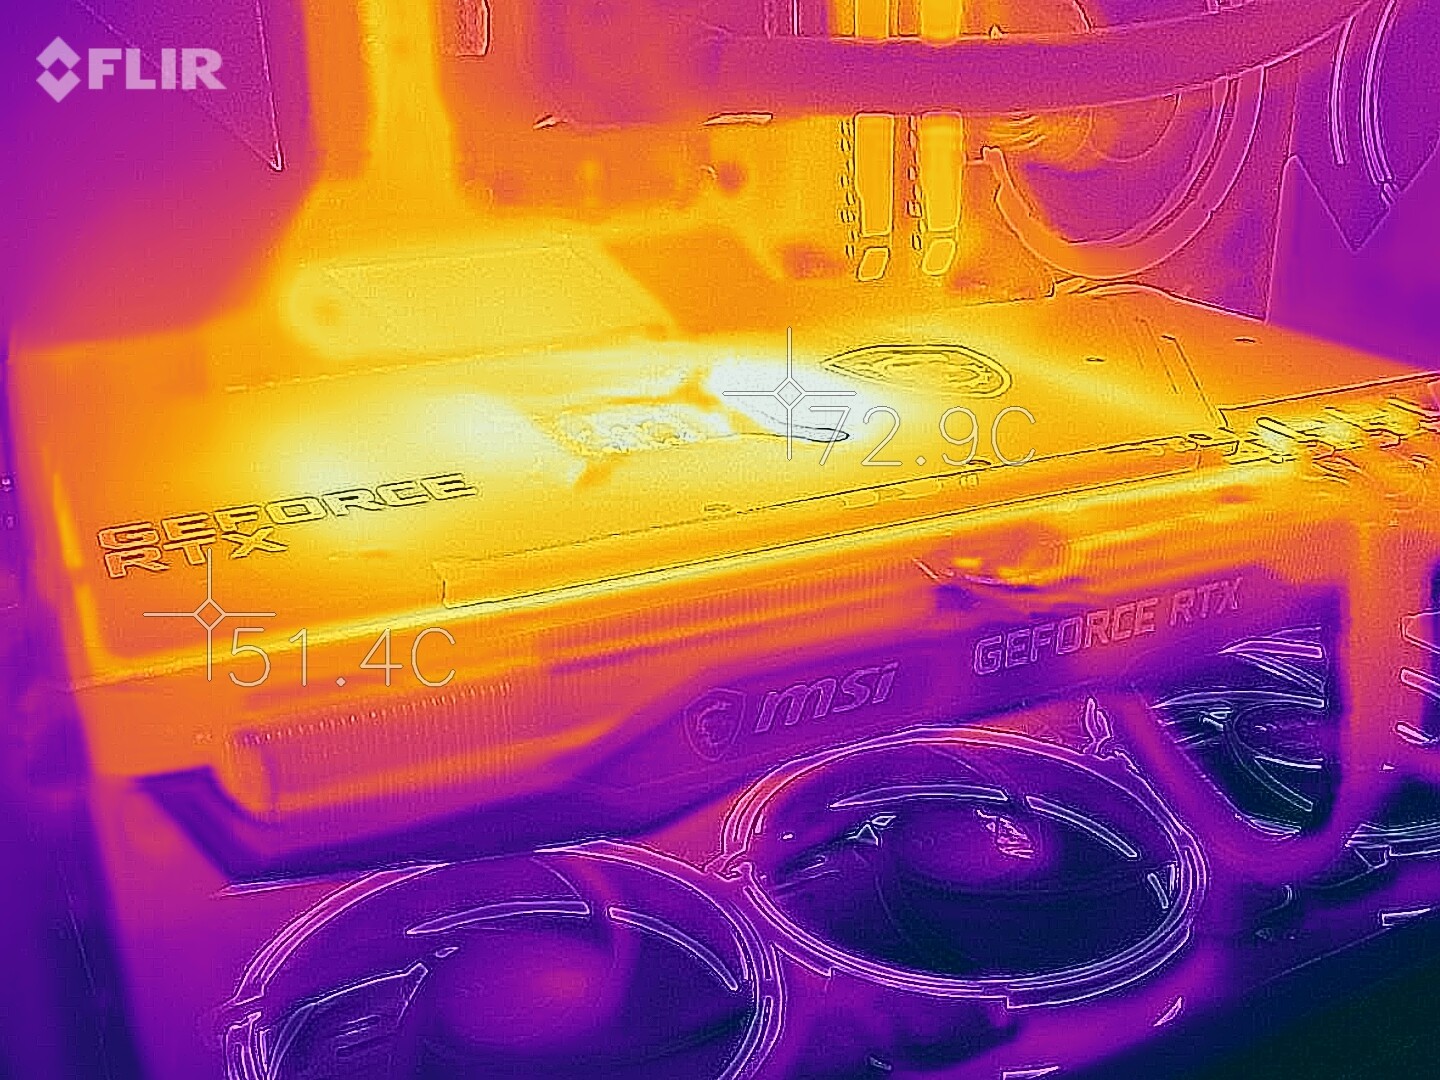
There are no heat problems with the MSI Geforce RTX Gaming X Trio. The maximum GPU temperature was 68 °C (~154 °F) in the higher power target. The temperature drops by one degree when the graphics card is used with its factory settings.

* ... smaller is better
Pros
Cons
Verdict - Powerful RTX 3080 with good cooling
MSI extends its well-known series of gaming graphics cards with the GeForce RTX 3080 Gaming X Trio. In pure performance terms, this graphics card doesn't have to hide behind the competition and is on par with an Asus GeForce RTX 3080 ROG Strix Gaming OC, which has an even higher boost speed according to the spec sheet. However, MSI also adjusts the clock rate compared to the reference model and increases it by 105 MHz to 1,815 MHz. Nevertheless, this is almost always surpassed under load, which is also due to the very good cooling. Thanks to the zero-fan mode, the MSI GeForce RTX 3080 Gaming X Trio is even silent in 2D mode or under low load; even under load, the three large fans only produce a quiet noise, which doesn't feel annoying.
With the AMD Radeon RX 6800 XT, Nvidia has a serious opponent in the high-end sector now. The GeForce RTX 3080 is about as fast when comparing performance. Only when special features like ray tracing are used, preferably in conjunction with DLSS, can the GeForce models gain ground. The only point of criticism that remains is the high power consumption under load. However, AMD's competition isn't much more efficient with a TGP of 300 watts.
The MSI GeForce RTX 3080 Gaming X Trio is a very fast RTX 3080 graphics card that also stays quite cool under load.
So who needs such a graphics card? Well, if we look at recent games like Cyberpunk 2077, you almost can't get around a powerful RTX 3080 if you don't necessarily want to sacrifice details. Somewhat older games, on the other hand, require high resolutions so as to not to be constantly stuck in the CPU limit. Therefore, those who primarily play in 2160p or even 1440p (UWQHD) can consider buying a GeForce RTX 3080. But that brings us to the next point: Availability. It's still almost impossible to buy a GeForce RTX 3080 at the moment, because availability has been very poor since its release. Furthermore, available models are extremely overpriced. MSI quotes an MSRP of 769 Euros (~$943) for the GeForce RTX 3080 Gaming X Trio. However, the actual retail price, if a model is available, is 1,000 Euros (~$1,223) or even higher. This is a scenario that will probably keep going on for a while, because no one can say when the situation will ease.

