Notebookcheck Logo

AMD Radeon RX 7900 XTX with 24 GB VRAM review: Already available for less than 1000 Euros

AMD in a price war with Nvidia! The AMD Radeon RX 7900 XTX has been available on the store shelves for more than a year. Recently, its price was lowered to put some pressure on Nvidia with the start of its Super graphics cards. We use this occasion to take another look at the AMD Radeon RX 7900 XTX and evaluate its performance again. Is the AMD graphics card with 24 GB still worth it, or does Nvidia offer the better overall package? We find out in our test with numerous measurements and benchmarks.
XFX Speedster MERC 310 Radeon RX 7900 XTX Black Edition
The external connections of the XFX Speedster MERC 310 Radeon RX 7900 XTX Black Edition

At this point, the AMD Radeon RX 7900 XTX has been available on the market for more than a year. A refresh, such as the one that Nvidia recently offered for its Super graphics cards, isn't available from AMD. The only way that remains for AMD to still remain competitive is lowering its prices. And just that is what the manufacturer has done with the price of AMD's flagship now slipping below the 1,000 Euro mark (~$1,085). As we already saw at the release of the AMD Radeon RX 7900 XTX, the performance of Nvidia's top model (GeForce RTX 4090) is not within reach. Until now, the Nvidia GeForce RTX 4080 was therefore considered its closest competitor. However, that has recently been replaced with the Nvidia GeForce RTX 4080 Super, which offers a slightly higher performance at a significantly lower MSRP. Although you currently still have to pay more than 1,000 Euros, if you want to use Nvidia's second fastest graphics card.

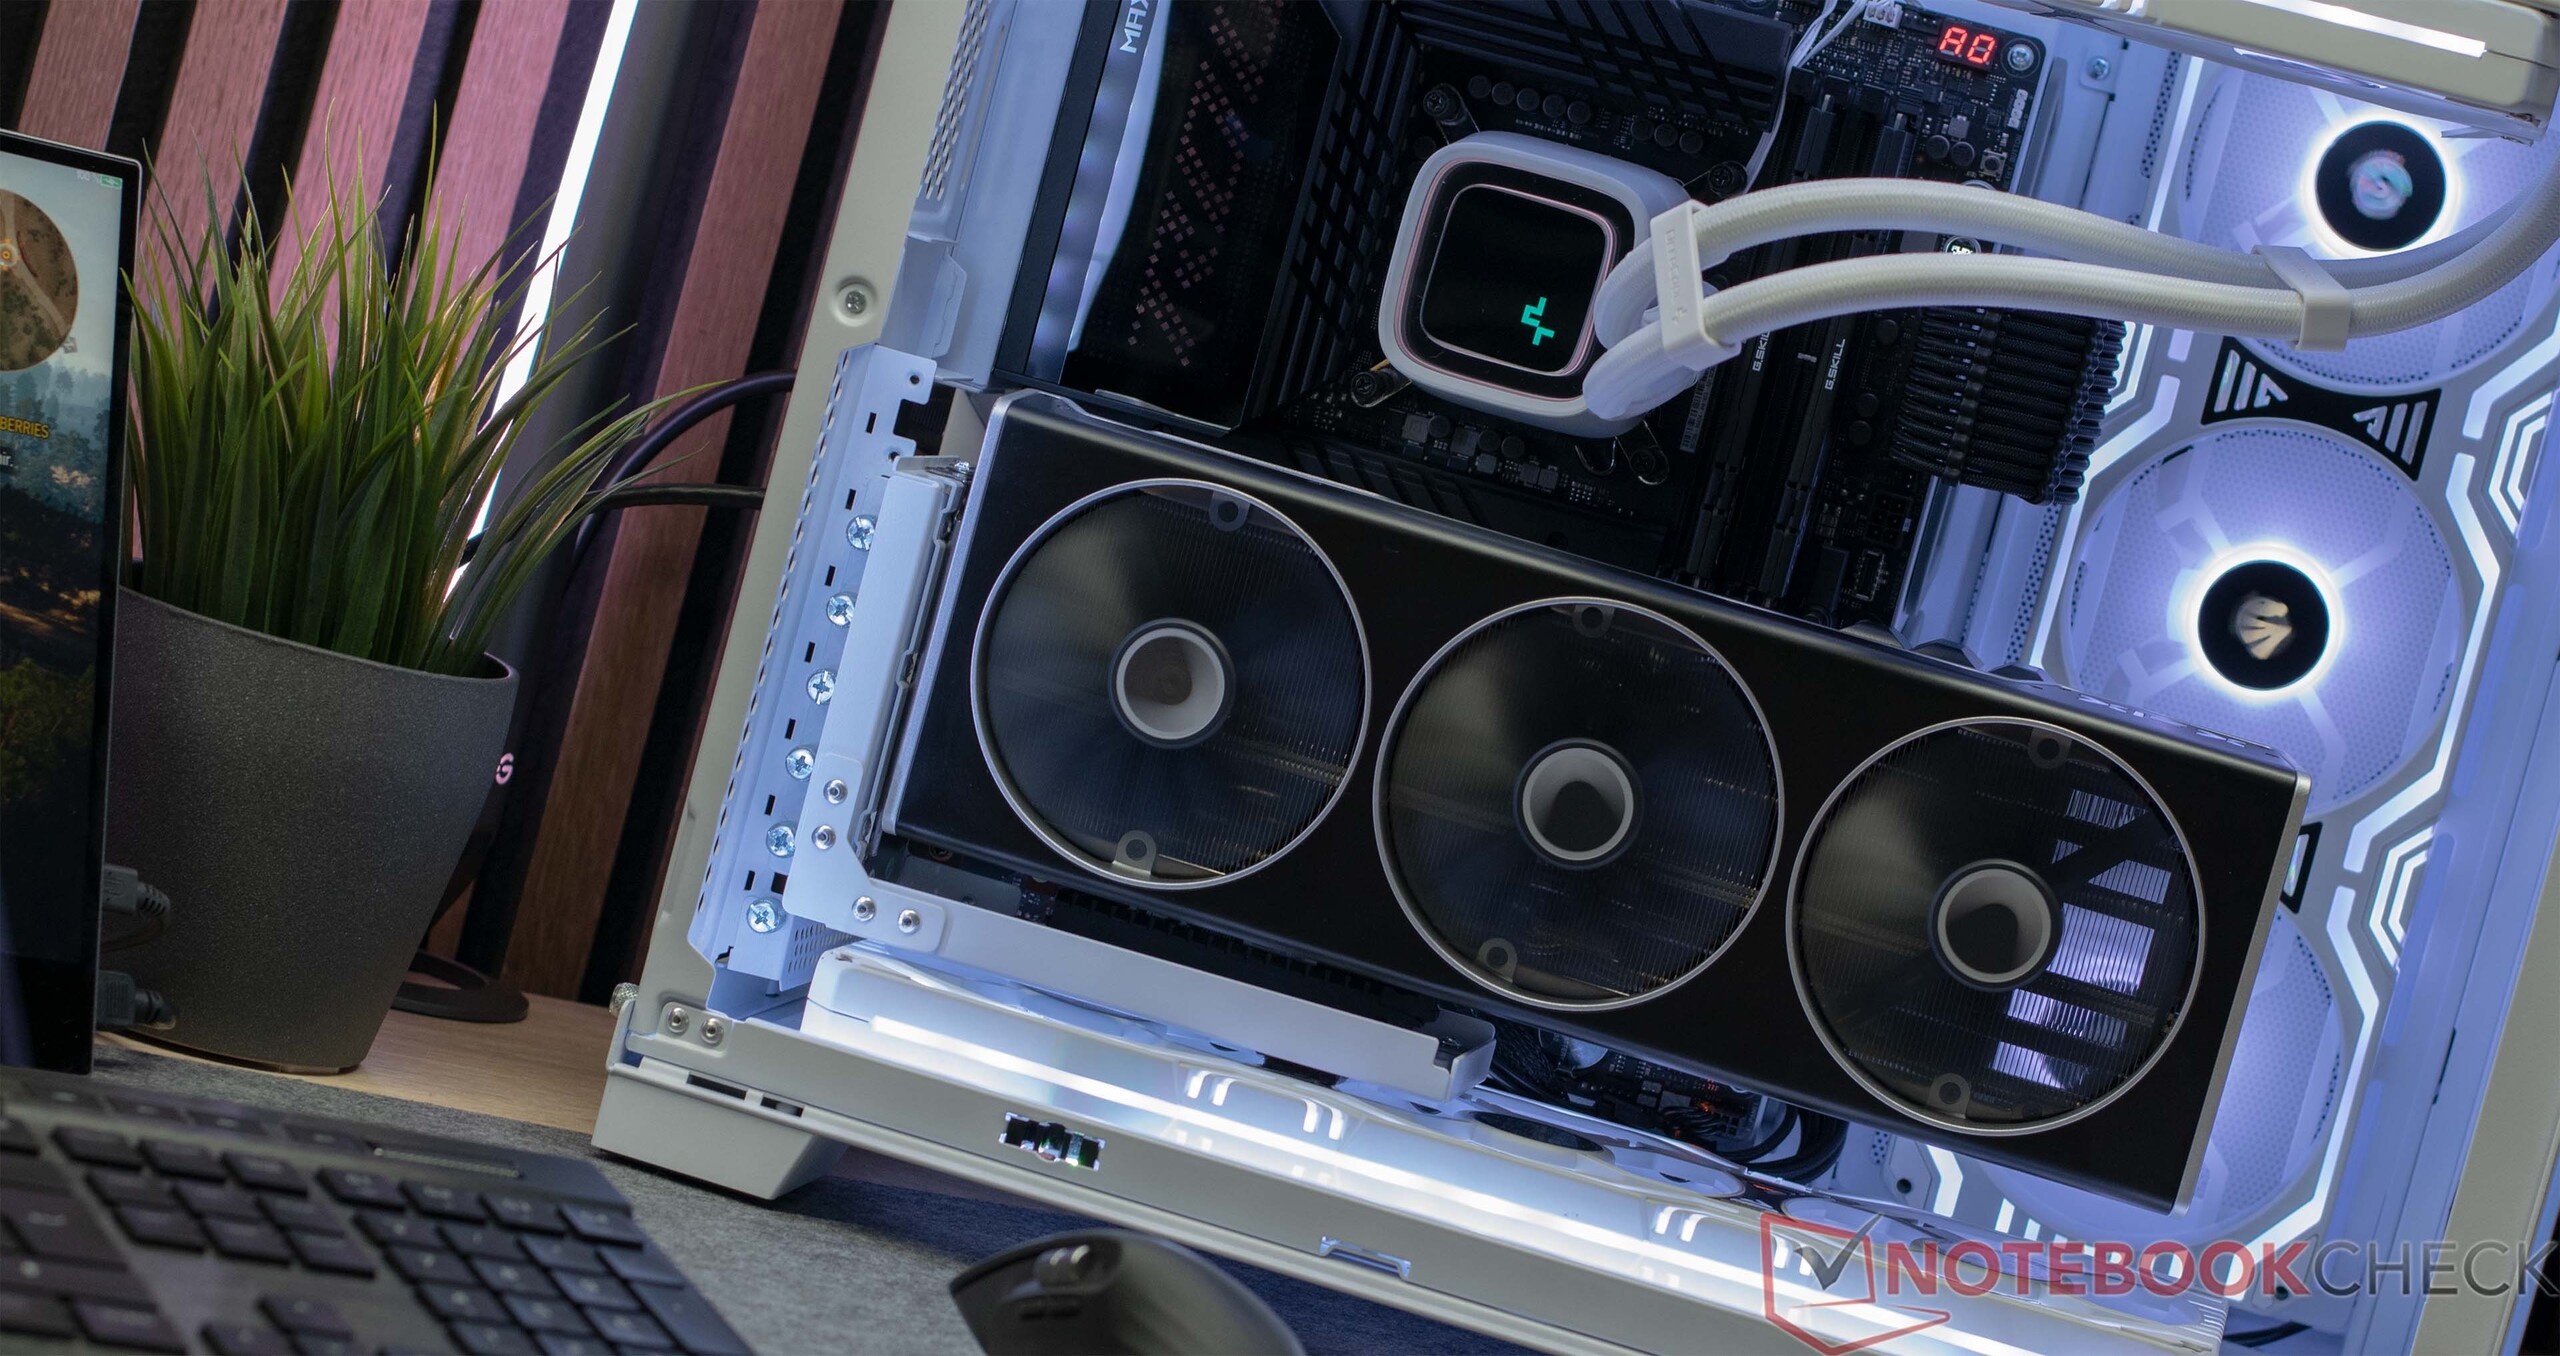
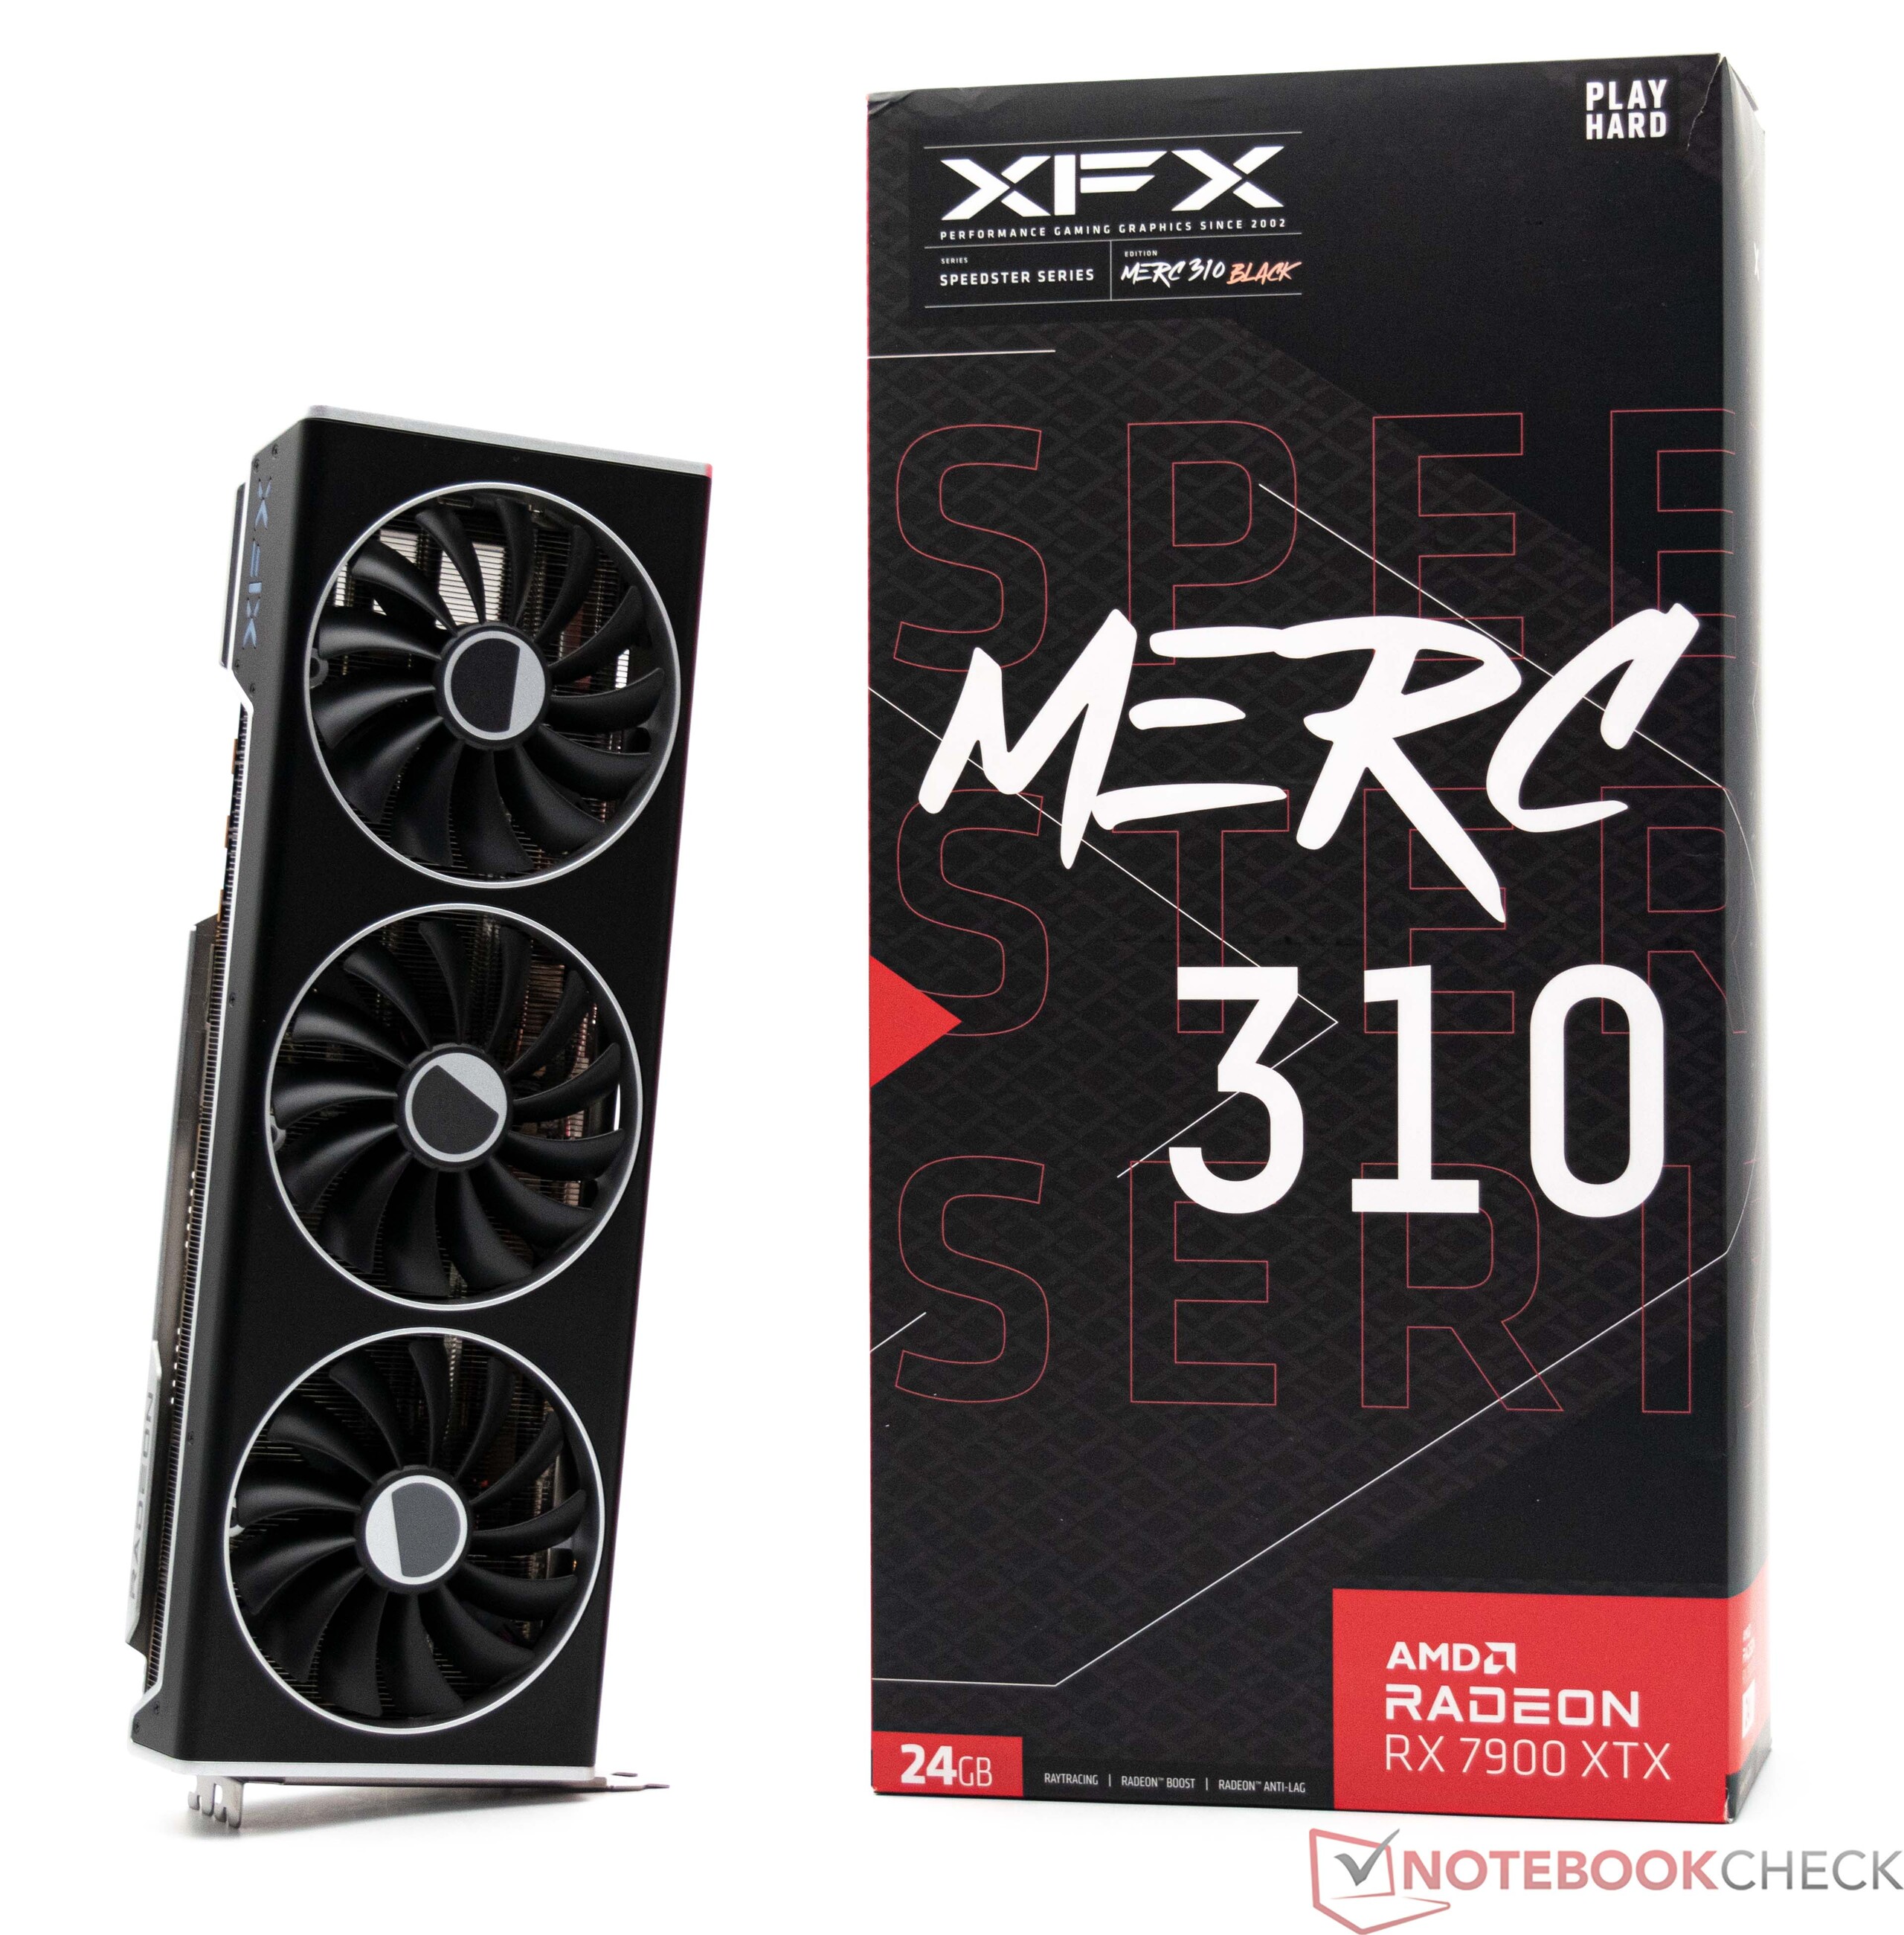
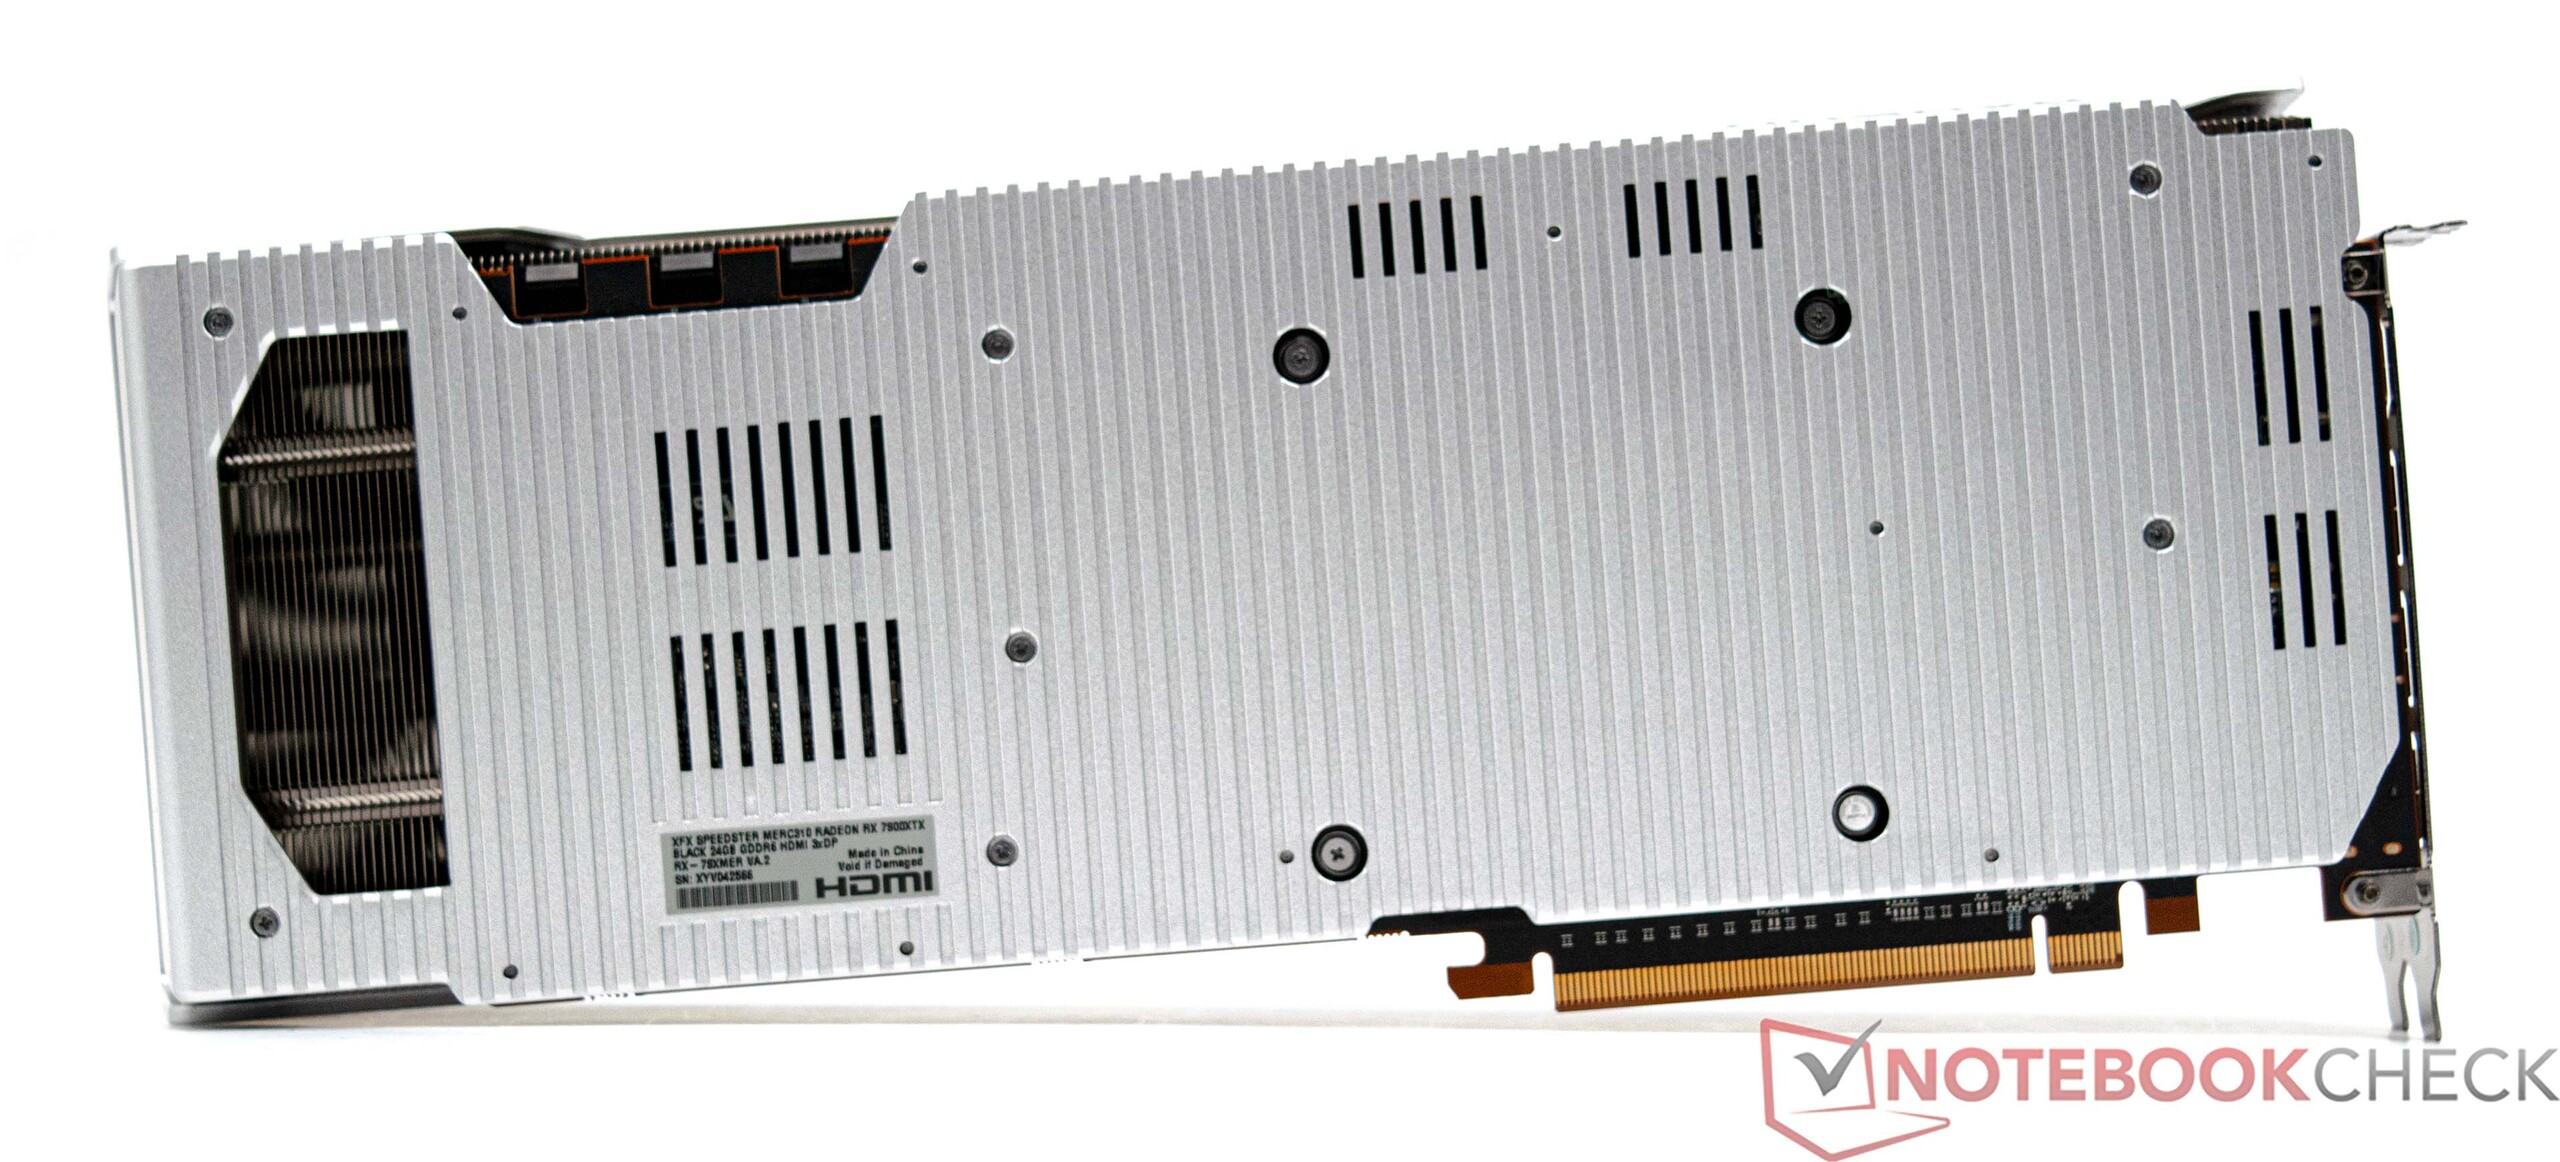
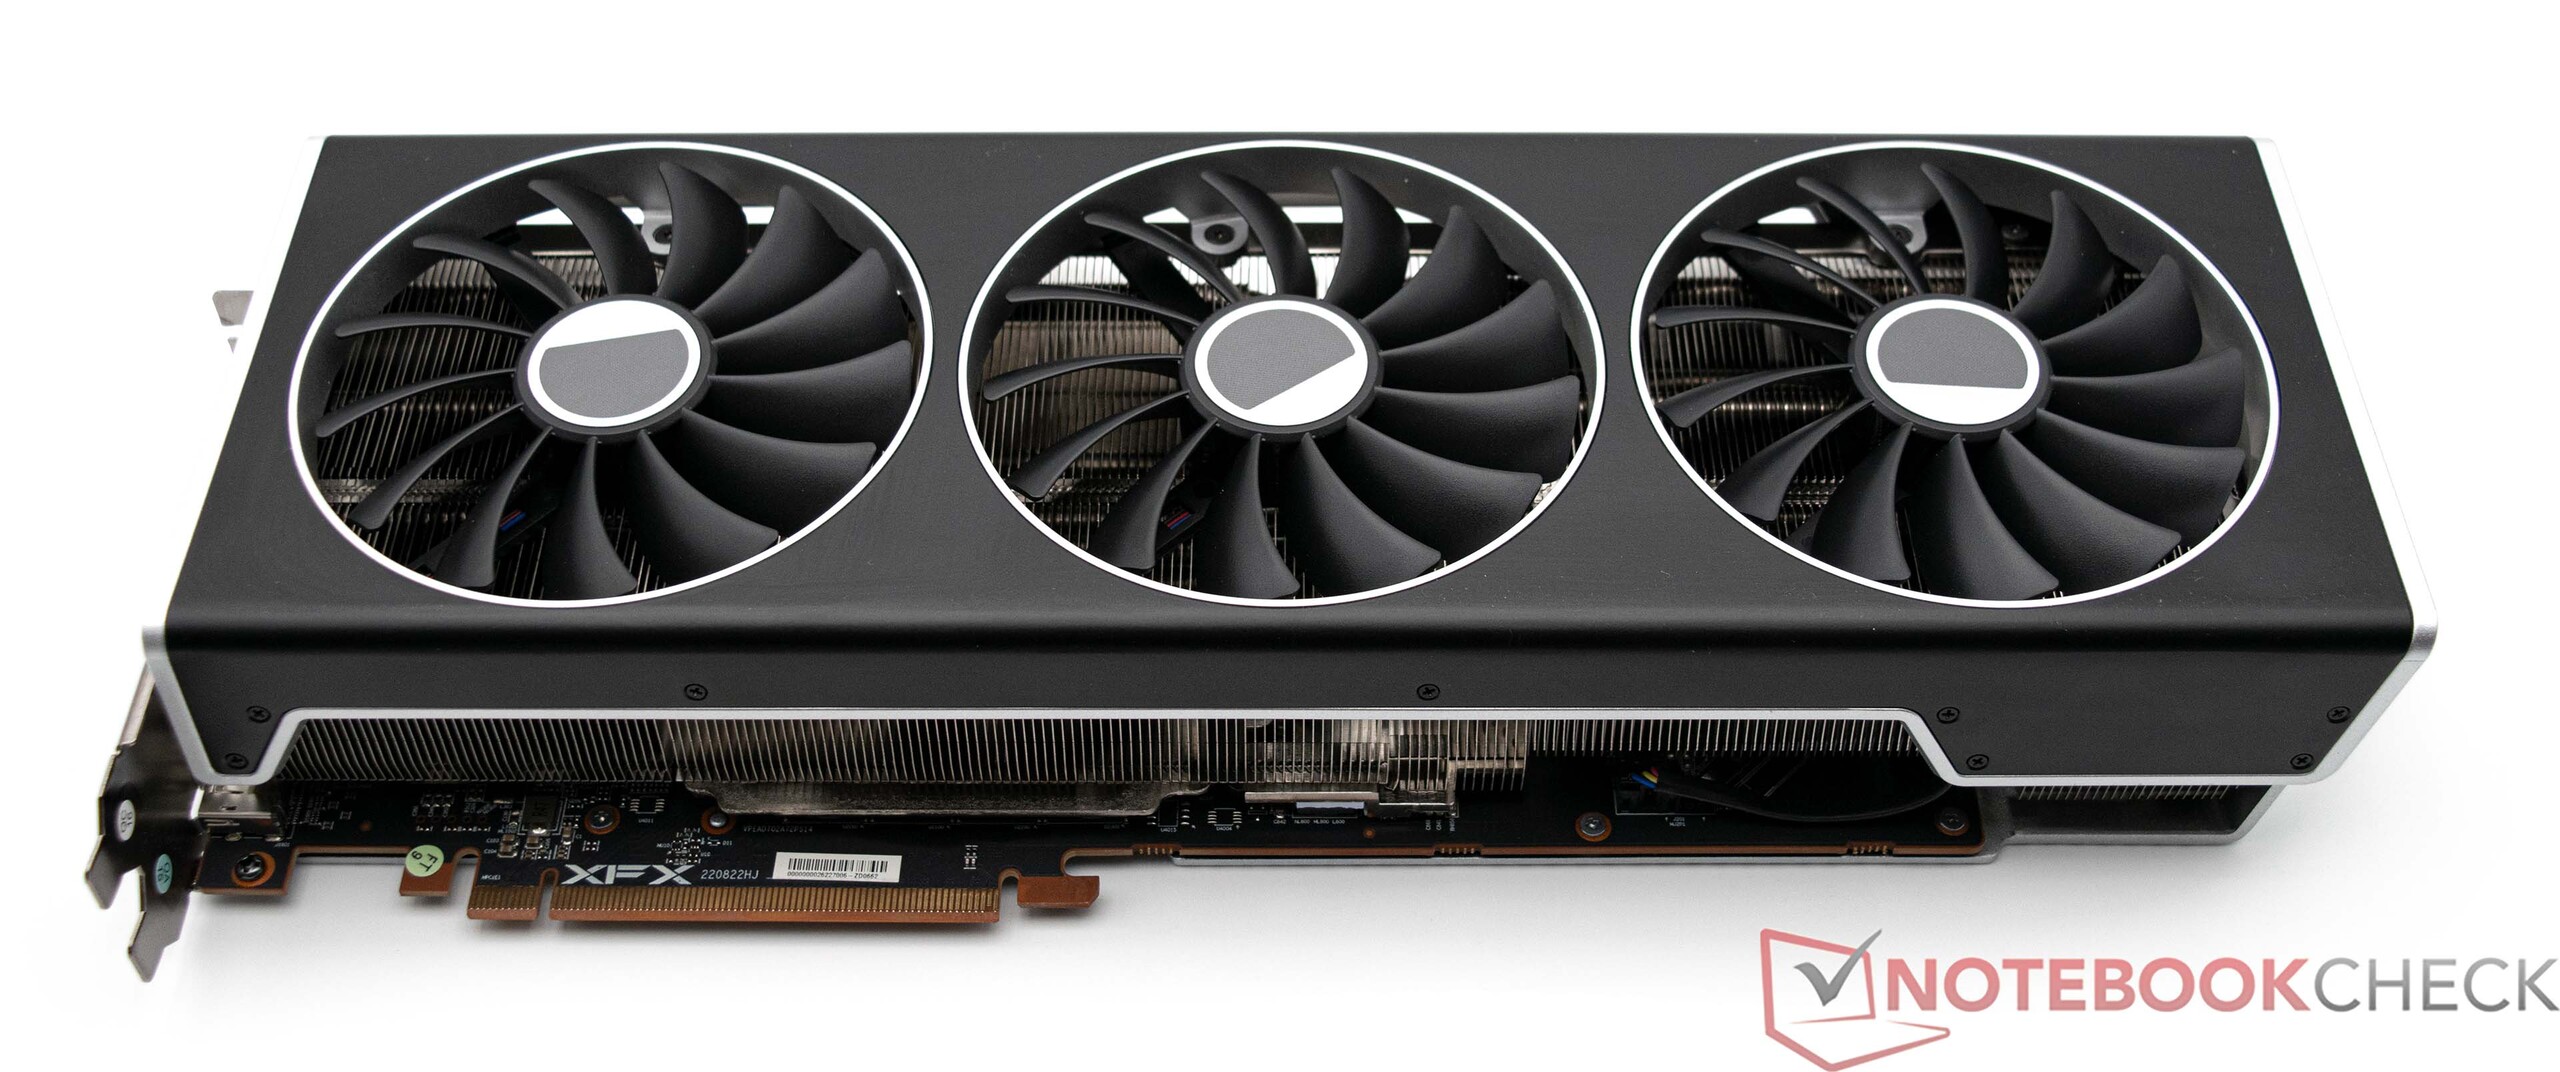
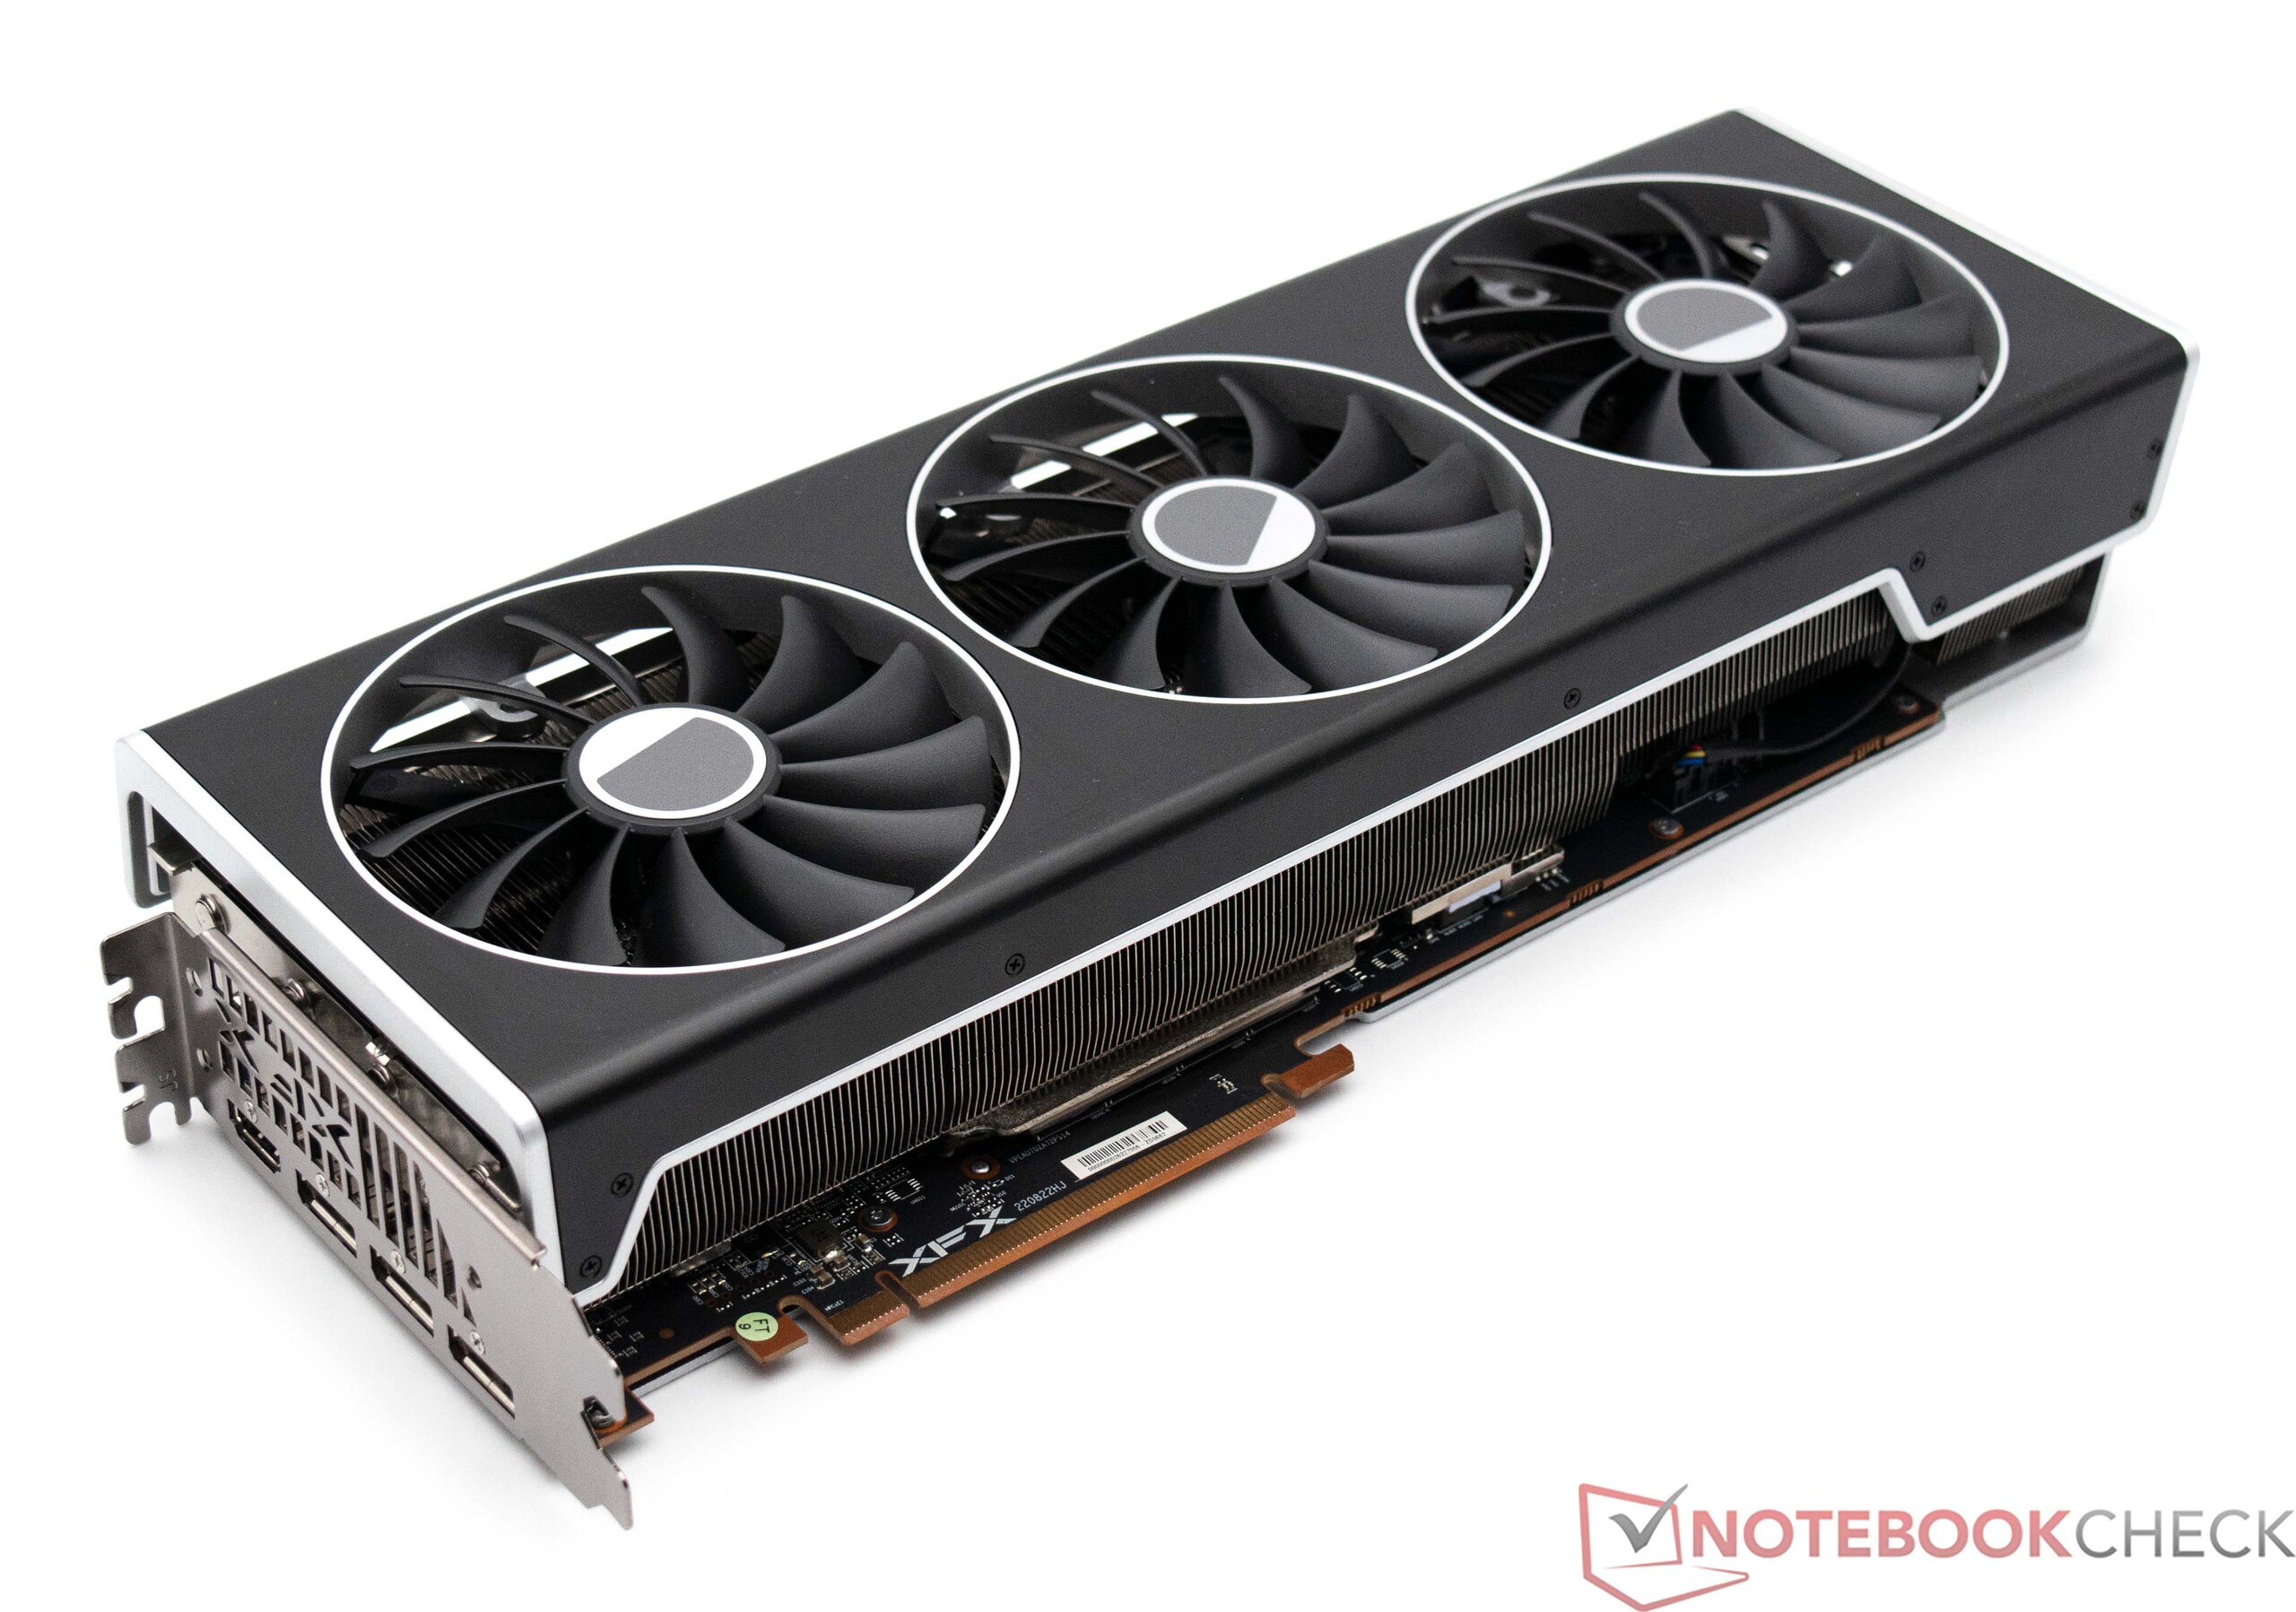
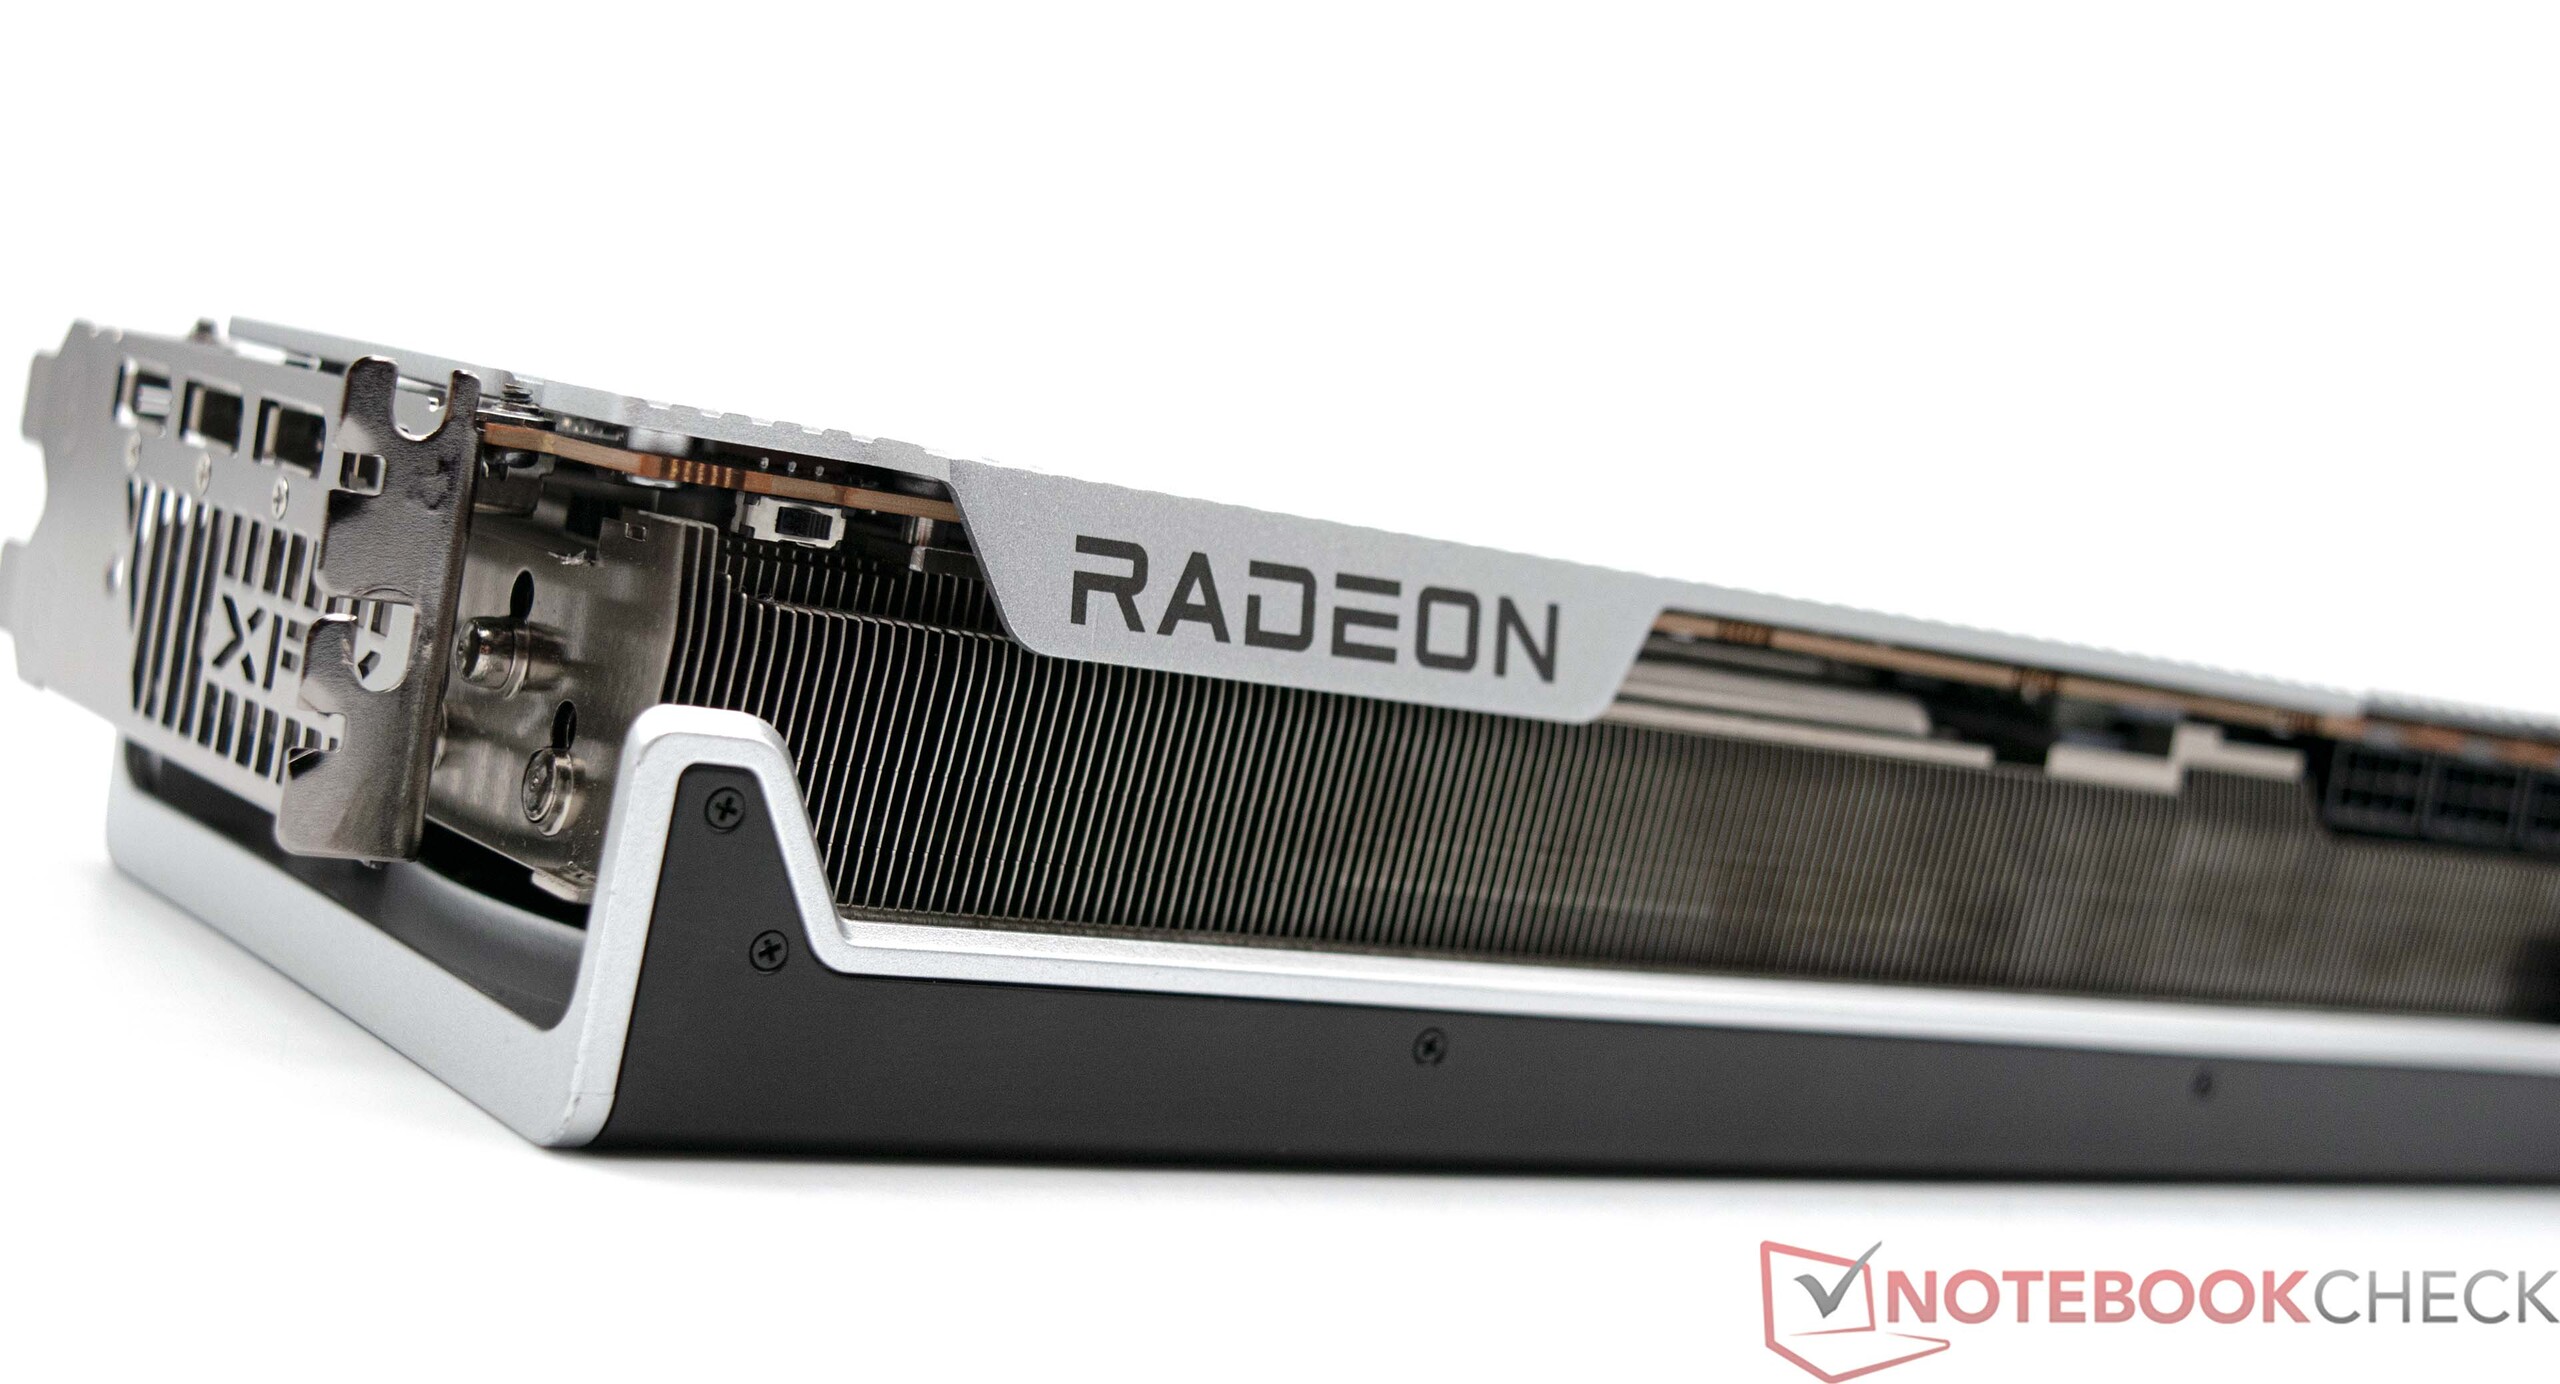
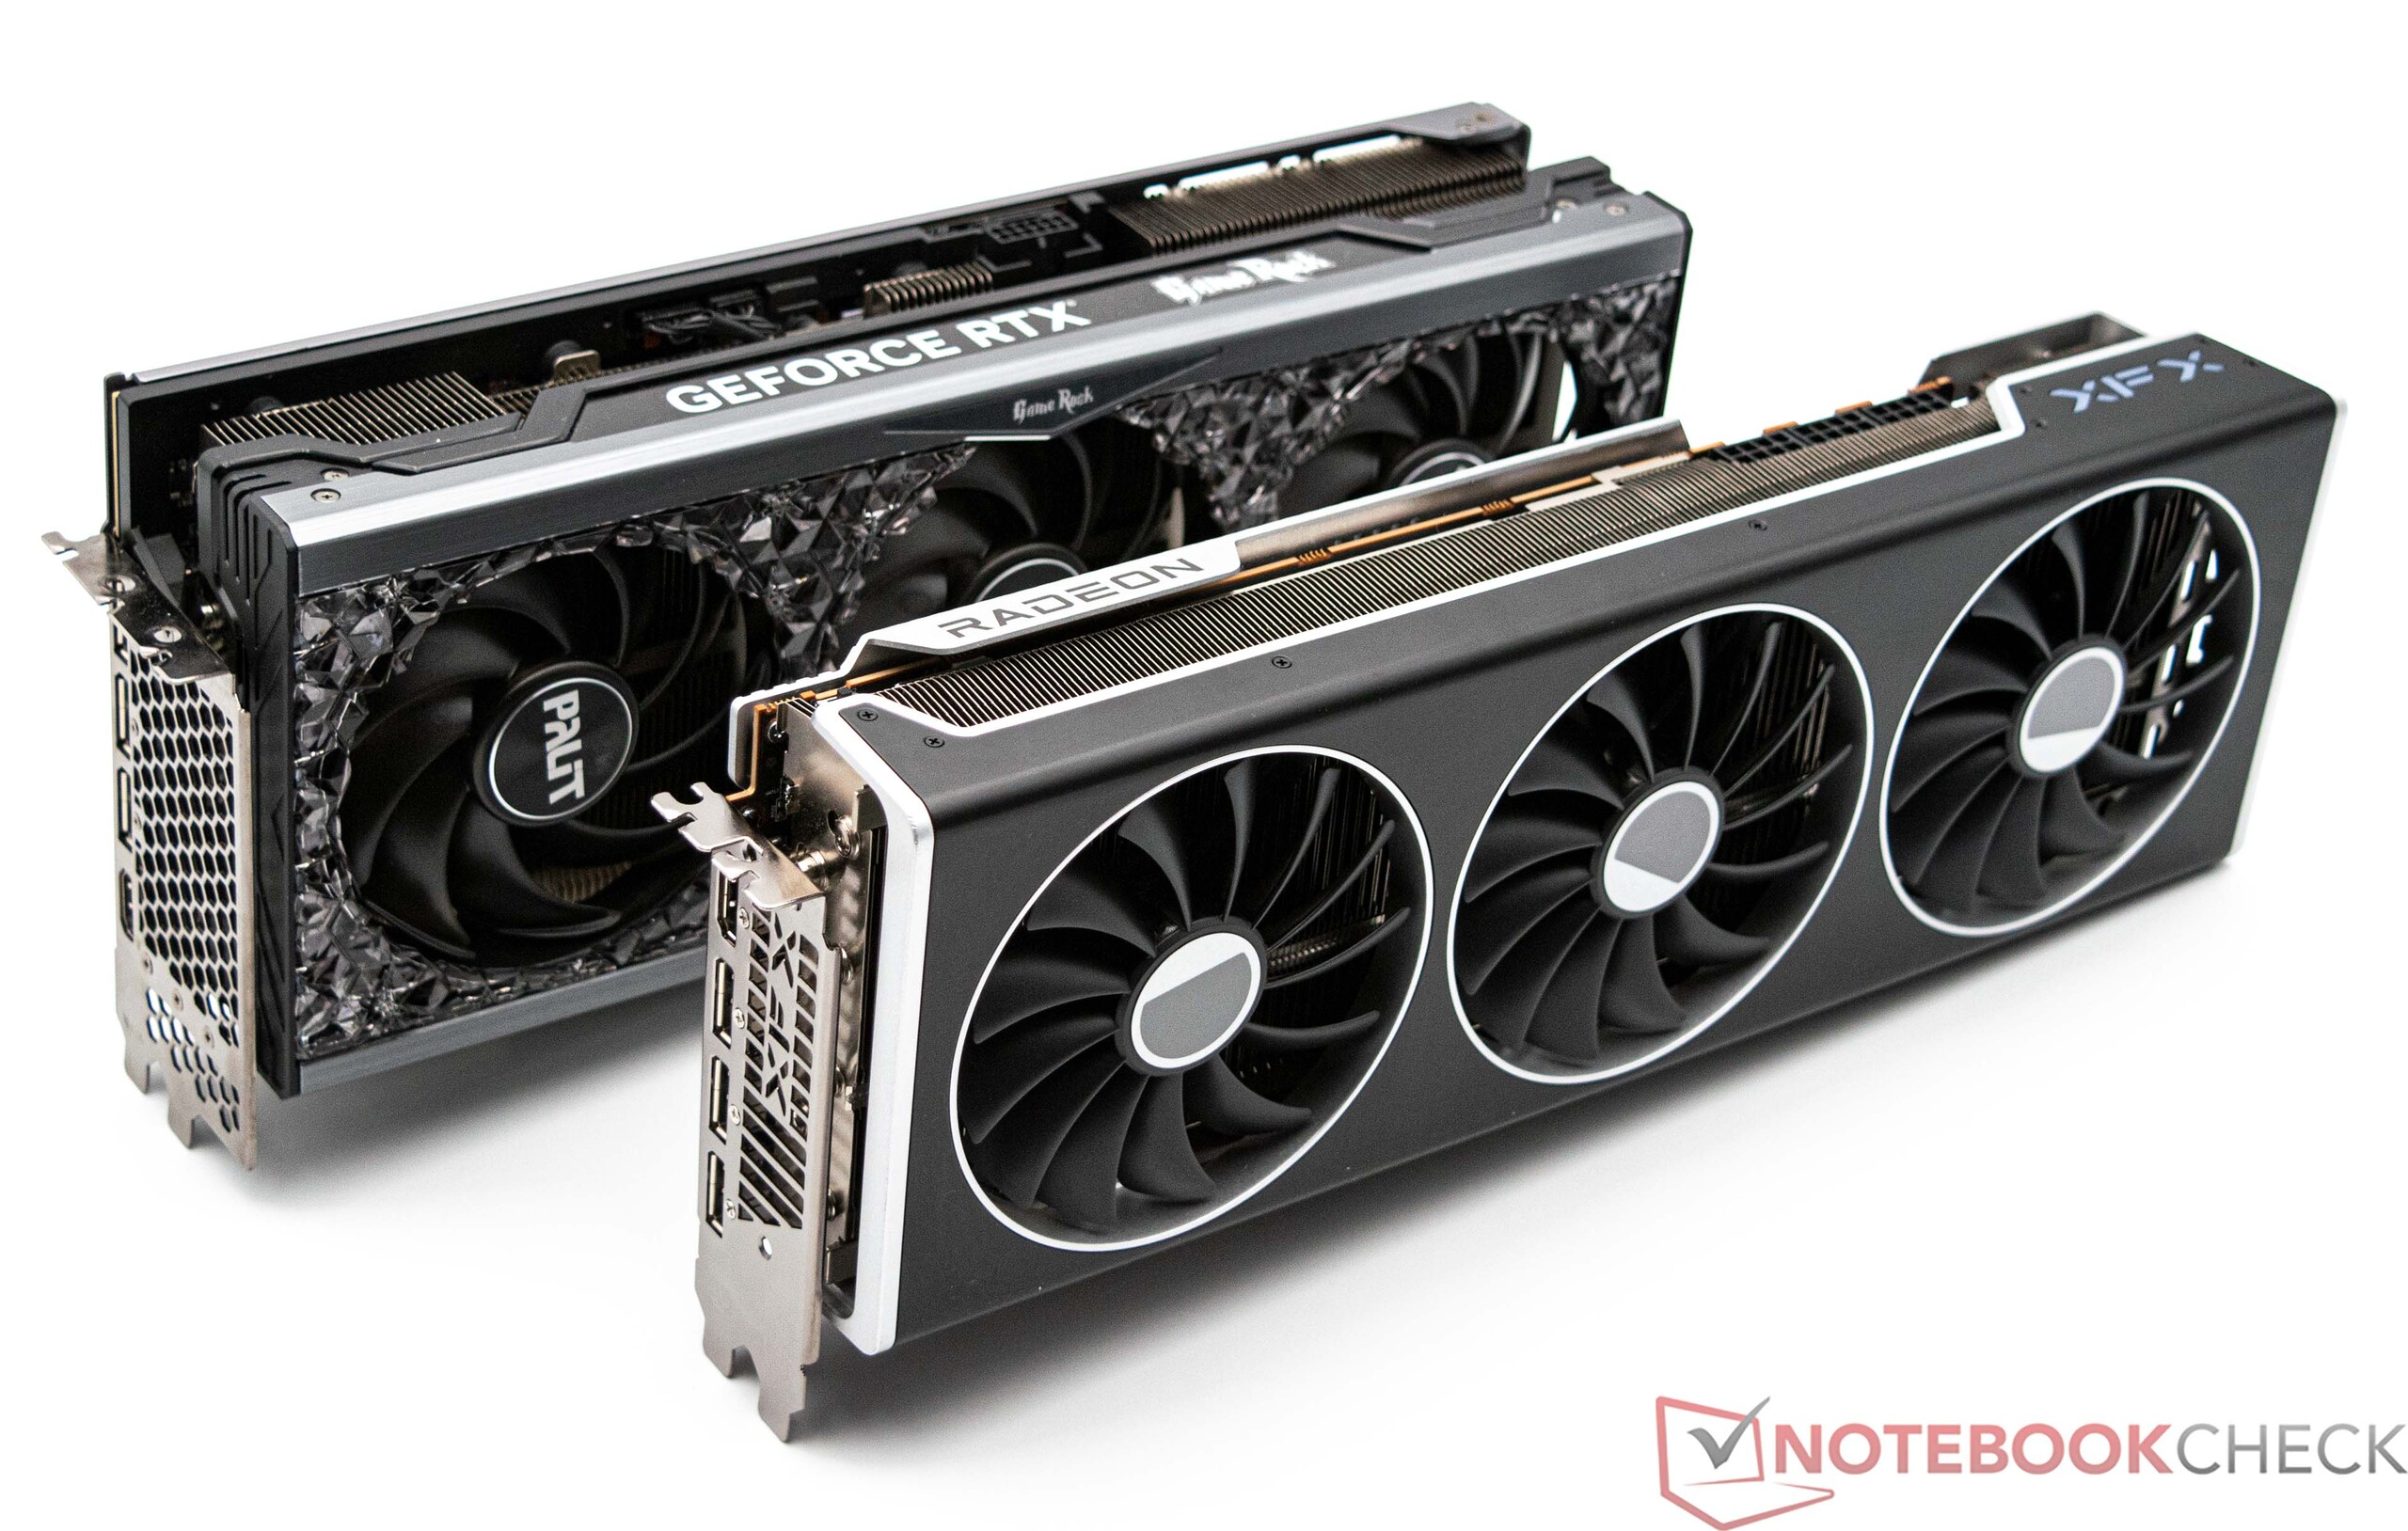
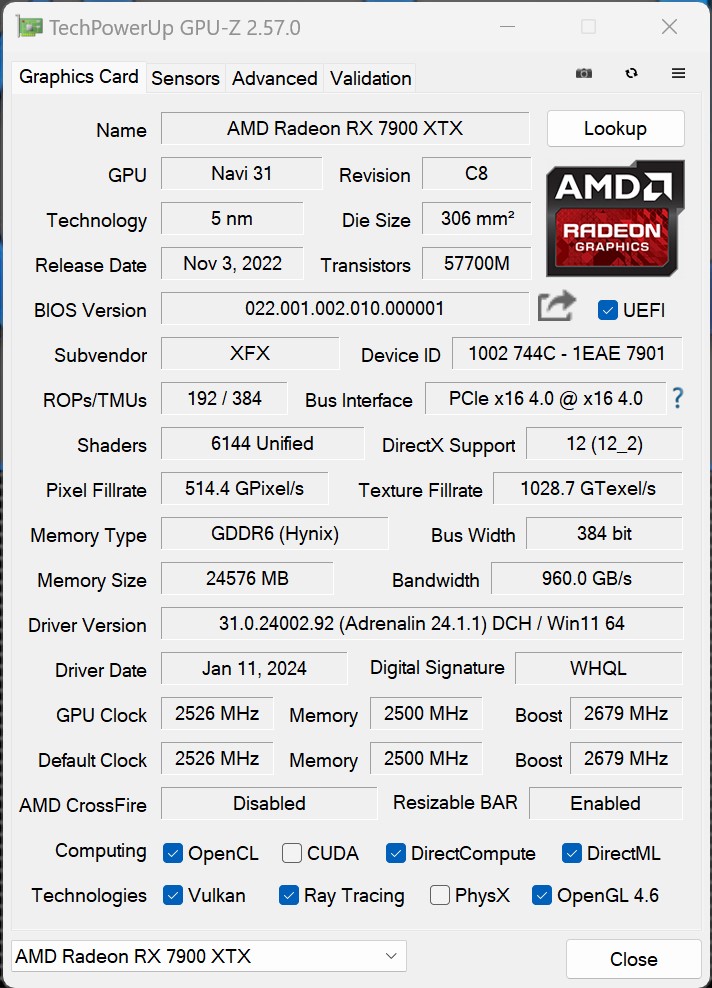
In this review, we take a look at the XFX Speedster MERC 310 Radeon RX 7900 XTX Black Edition. The XFX model is significantly larger than the reference model from AMD. In addition, its more powerful cooling unit allows for a higher power target. However, in terms of efficiency, AMD is still unable to keep up with the competitors from the green corner. This is not a secret, since nothing has changed in the RDNA3 architecture at this point. With the GPU chip called Navi 31, AMD already uses the full build that combines a total of 6,144 Stream Processors. The MCM package (Multi-Chip Module) is based on the GDC (Graphics Compute Die), which combines the Stream Processors. In addition, there are also 6 MCDs (Memory Cache Die) that are responsible for the VRAM connection. The AMD Radeon RX 7900 XTX has 24 GB of VRAM in total, which represents a significant advantage over Nvidia. Both the Nvidia GeForce RTX 4080 Super and the slightly more affordable Nvidia GeForce RTX 4070 Ti Super are equipped with only 16 GB of VRAM.

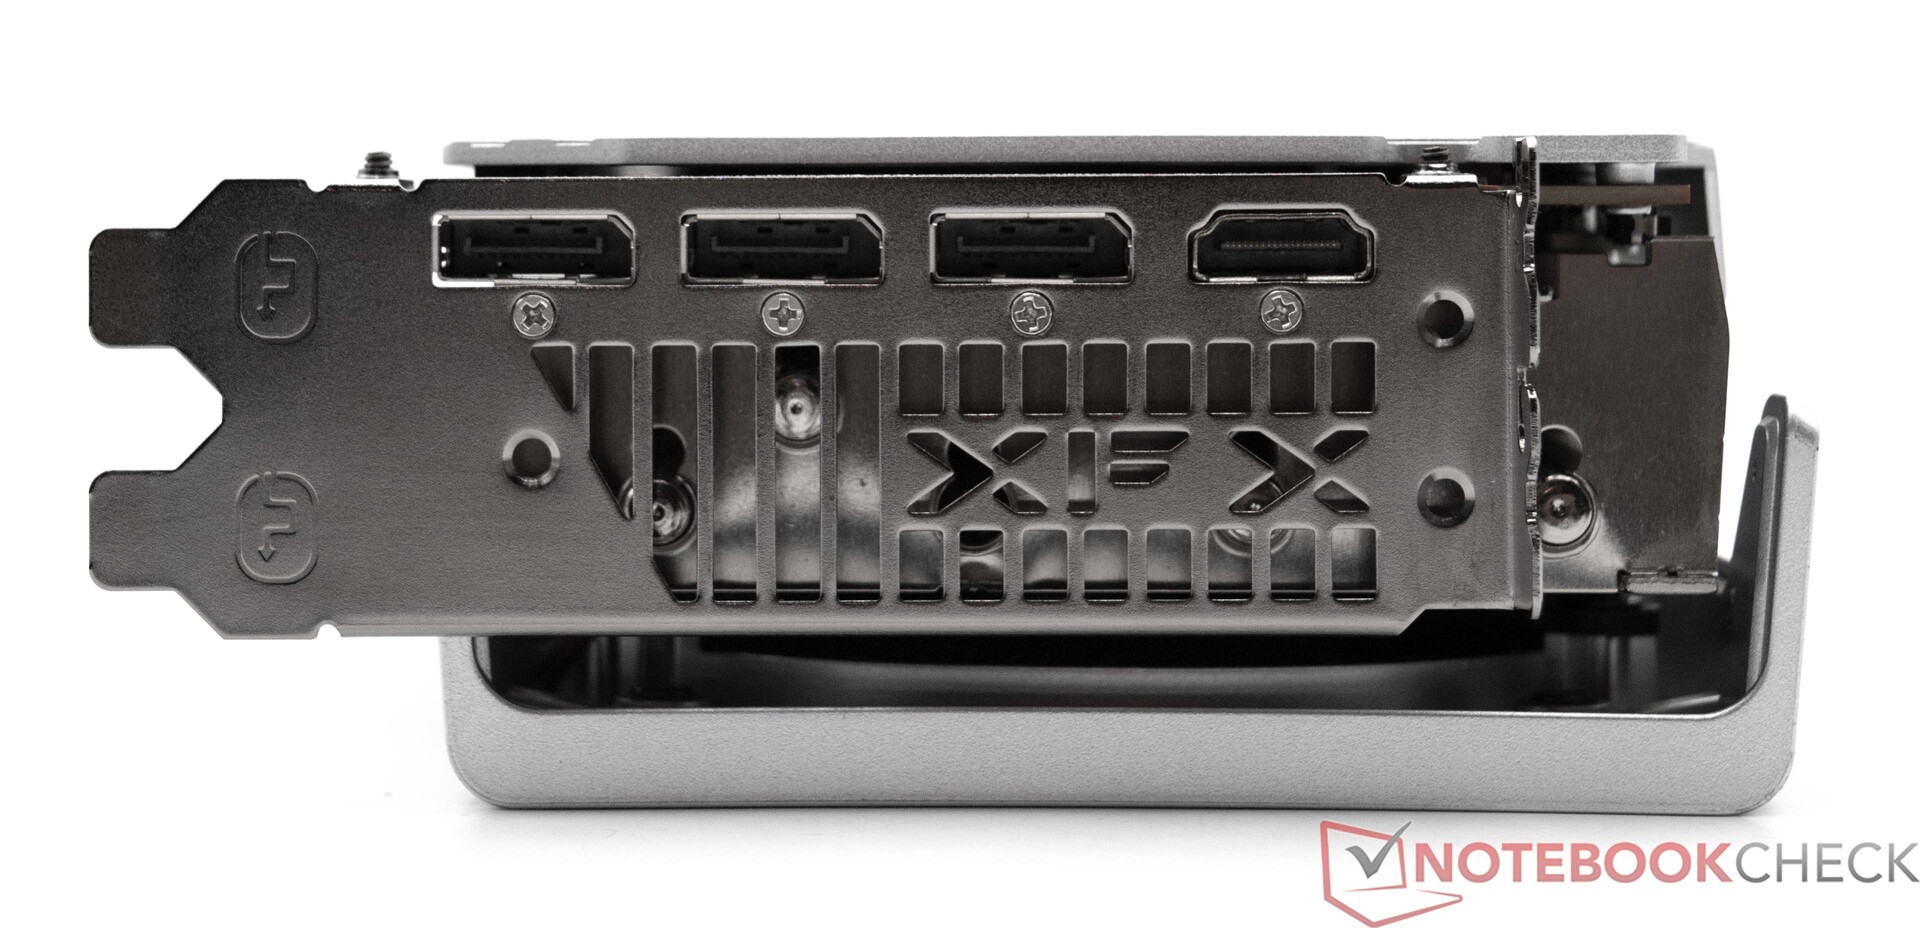
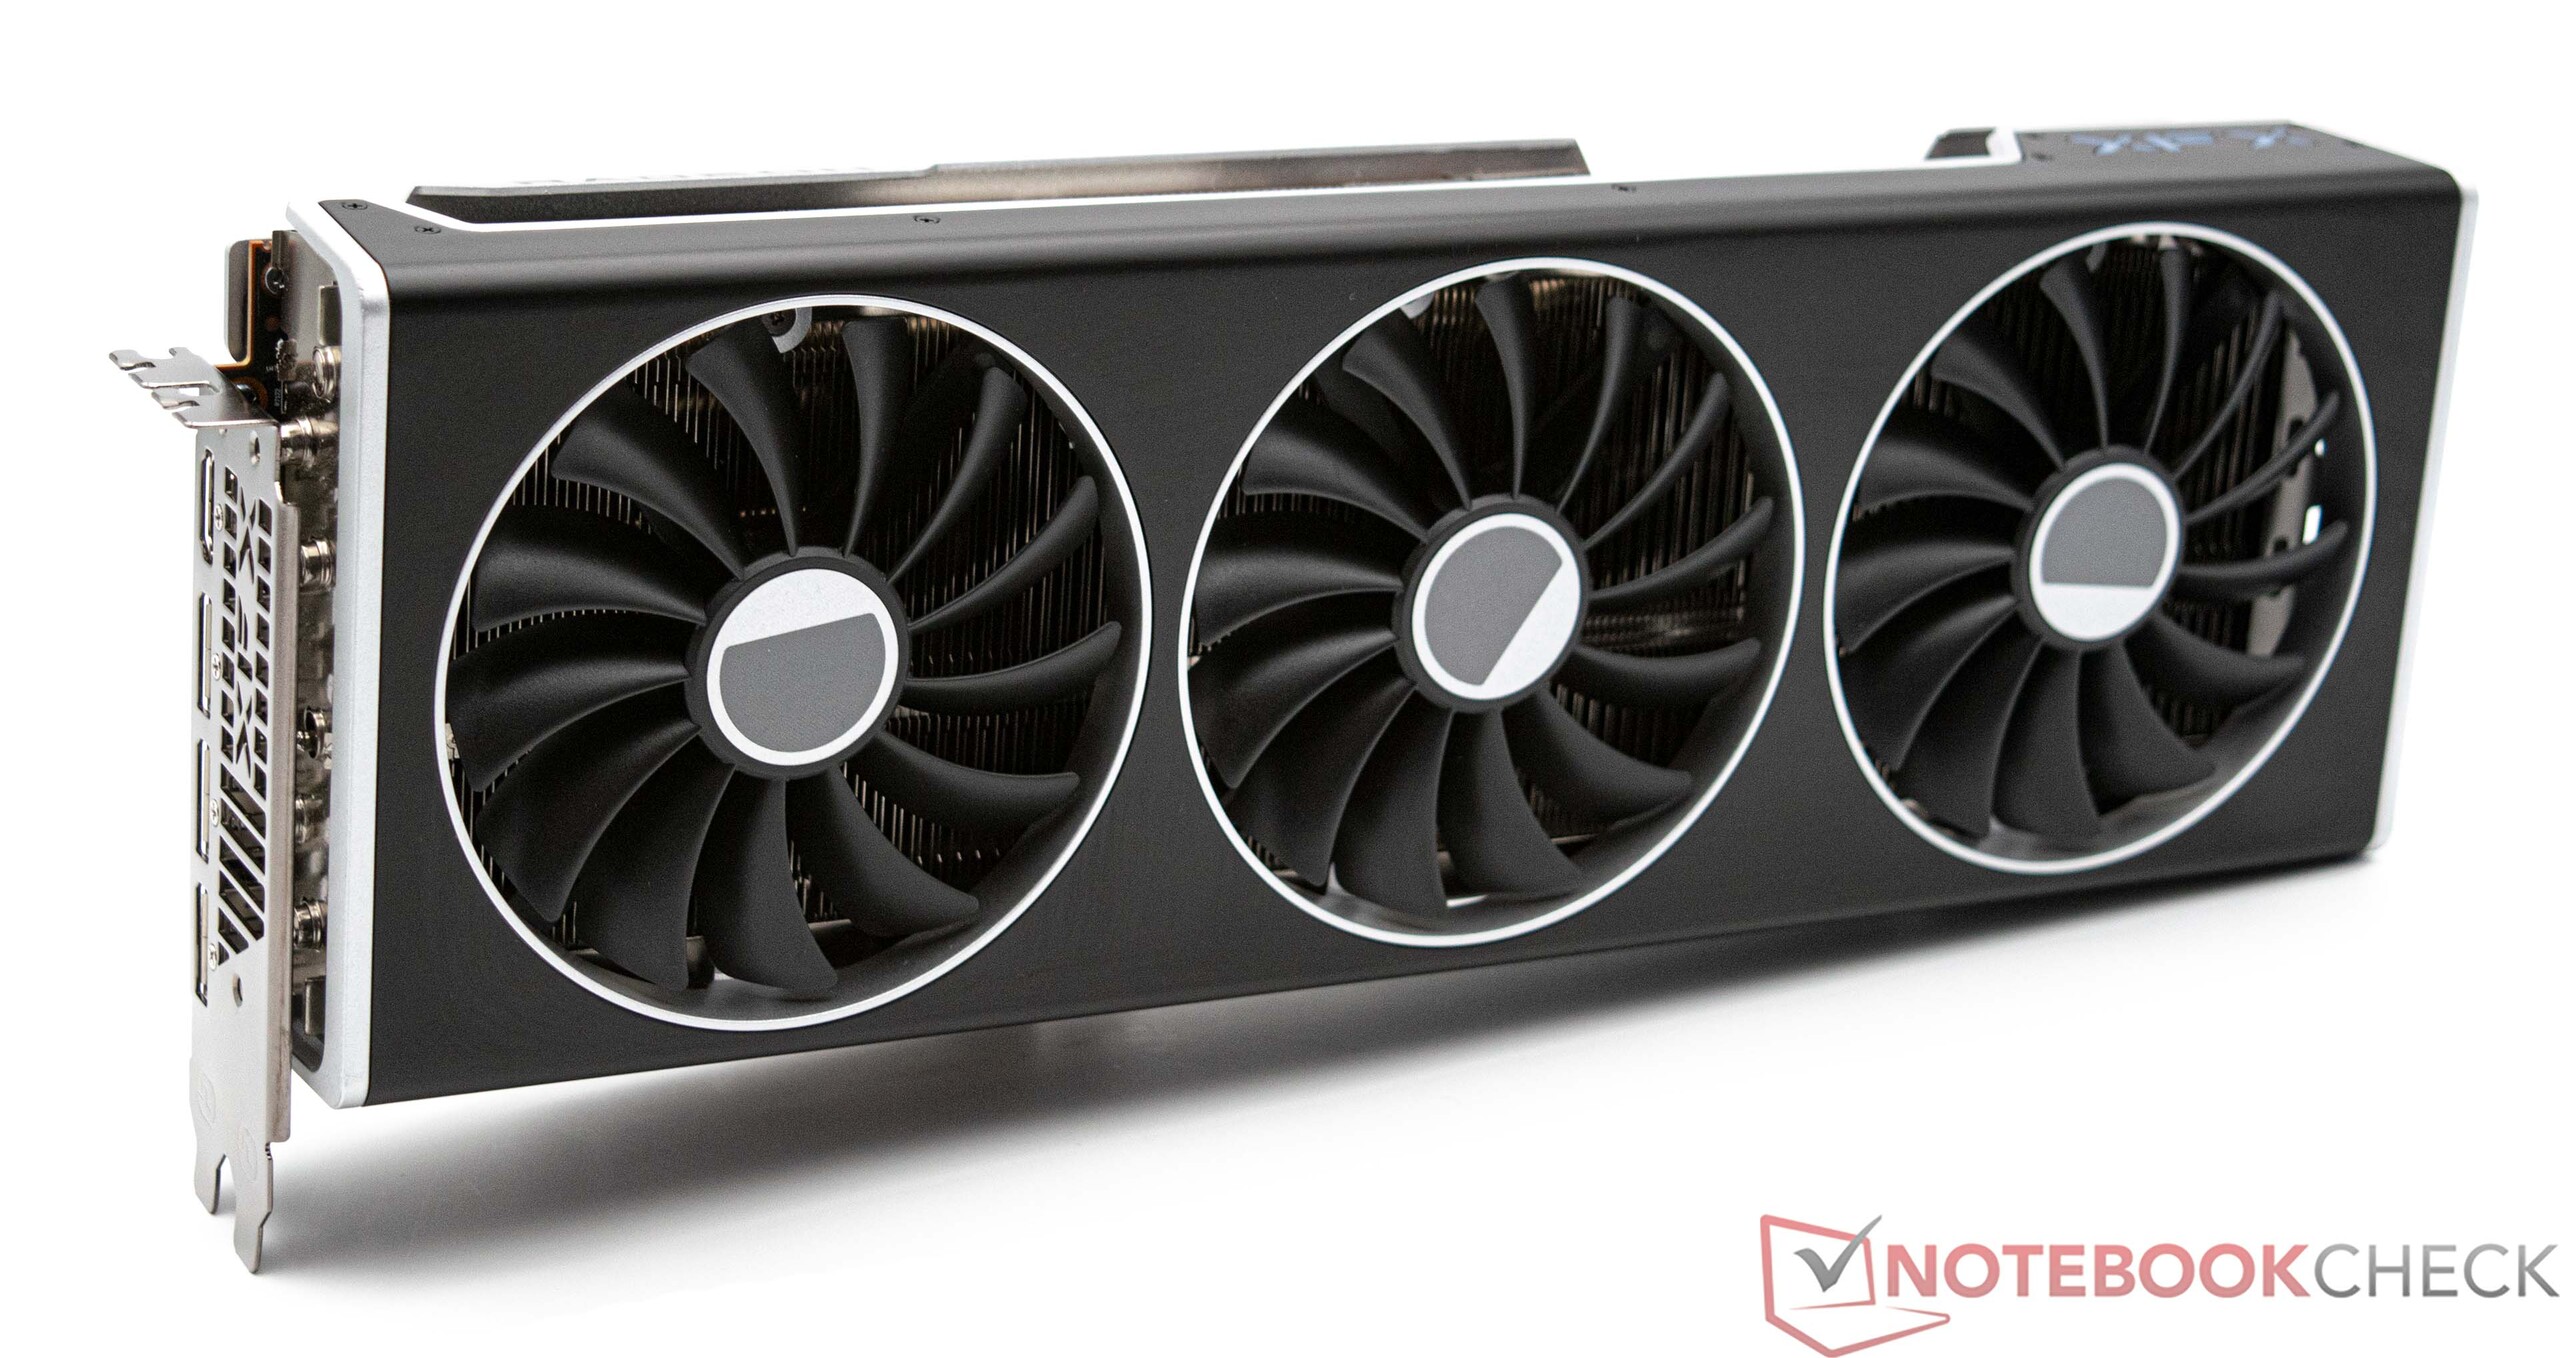
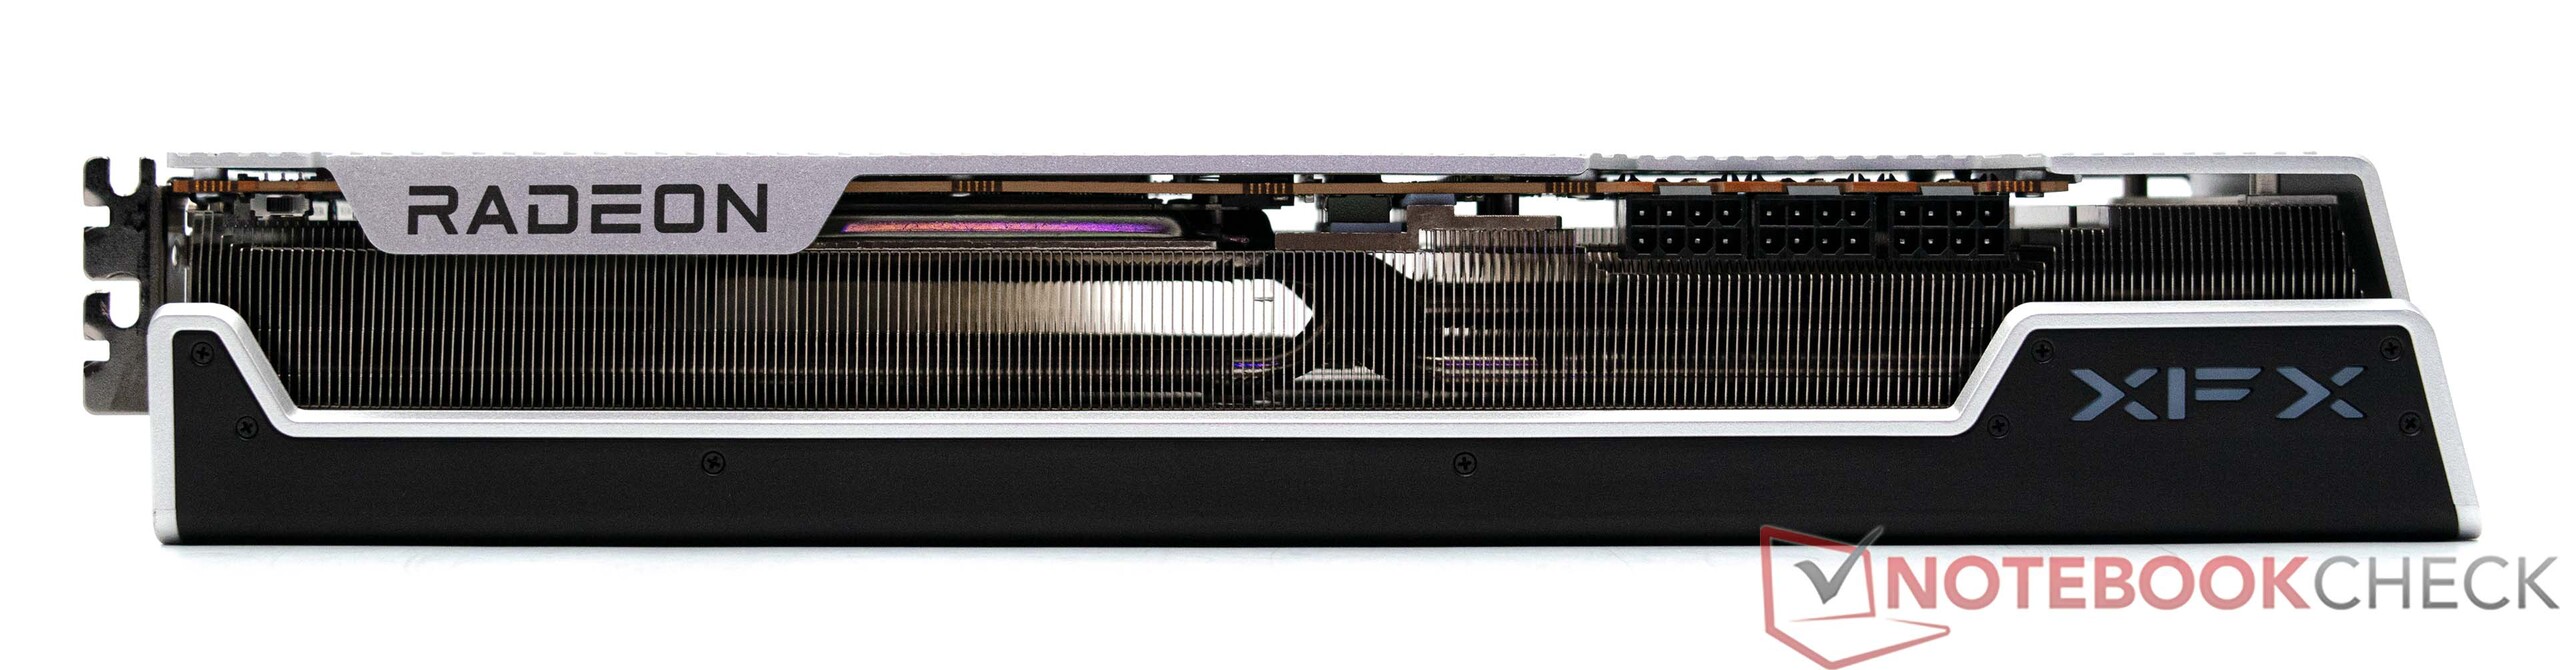
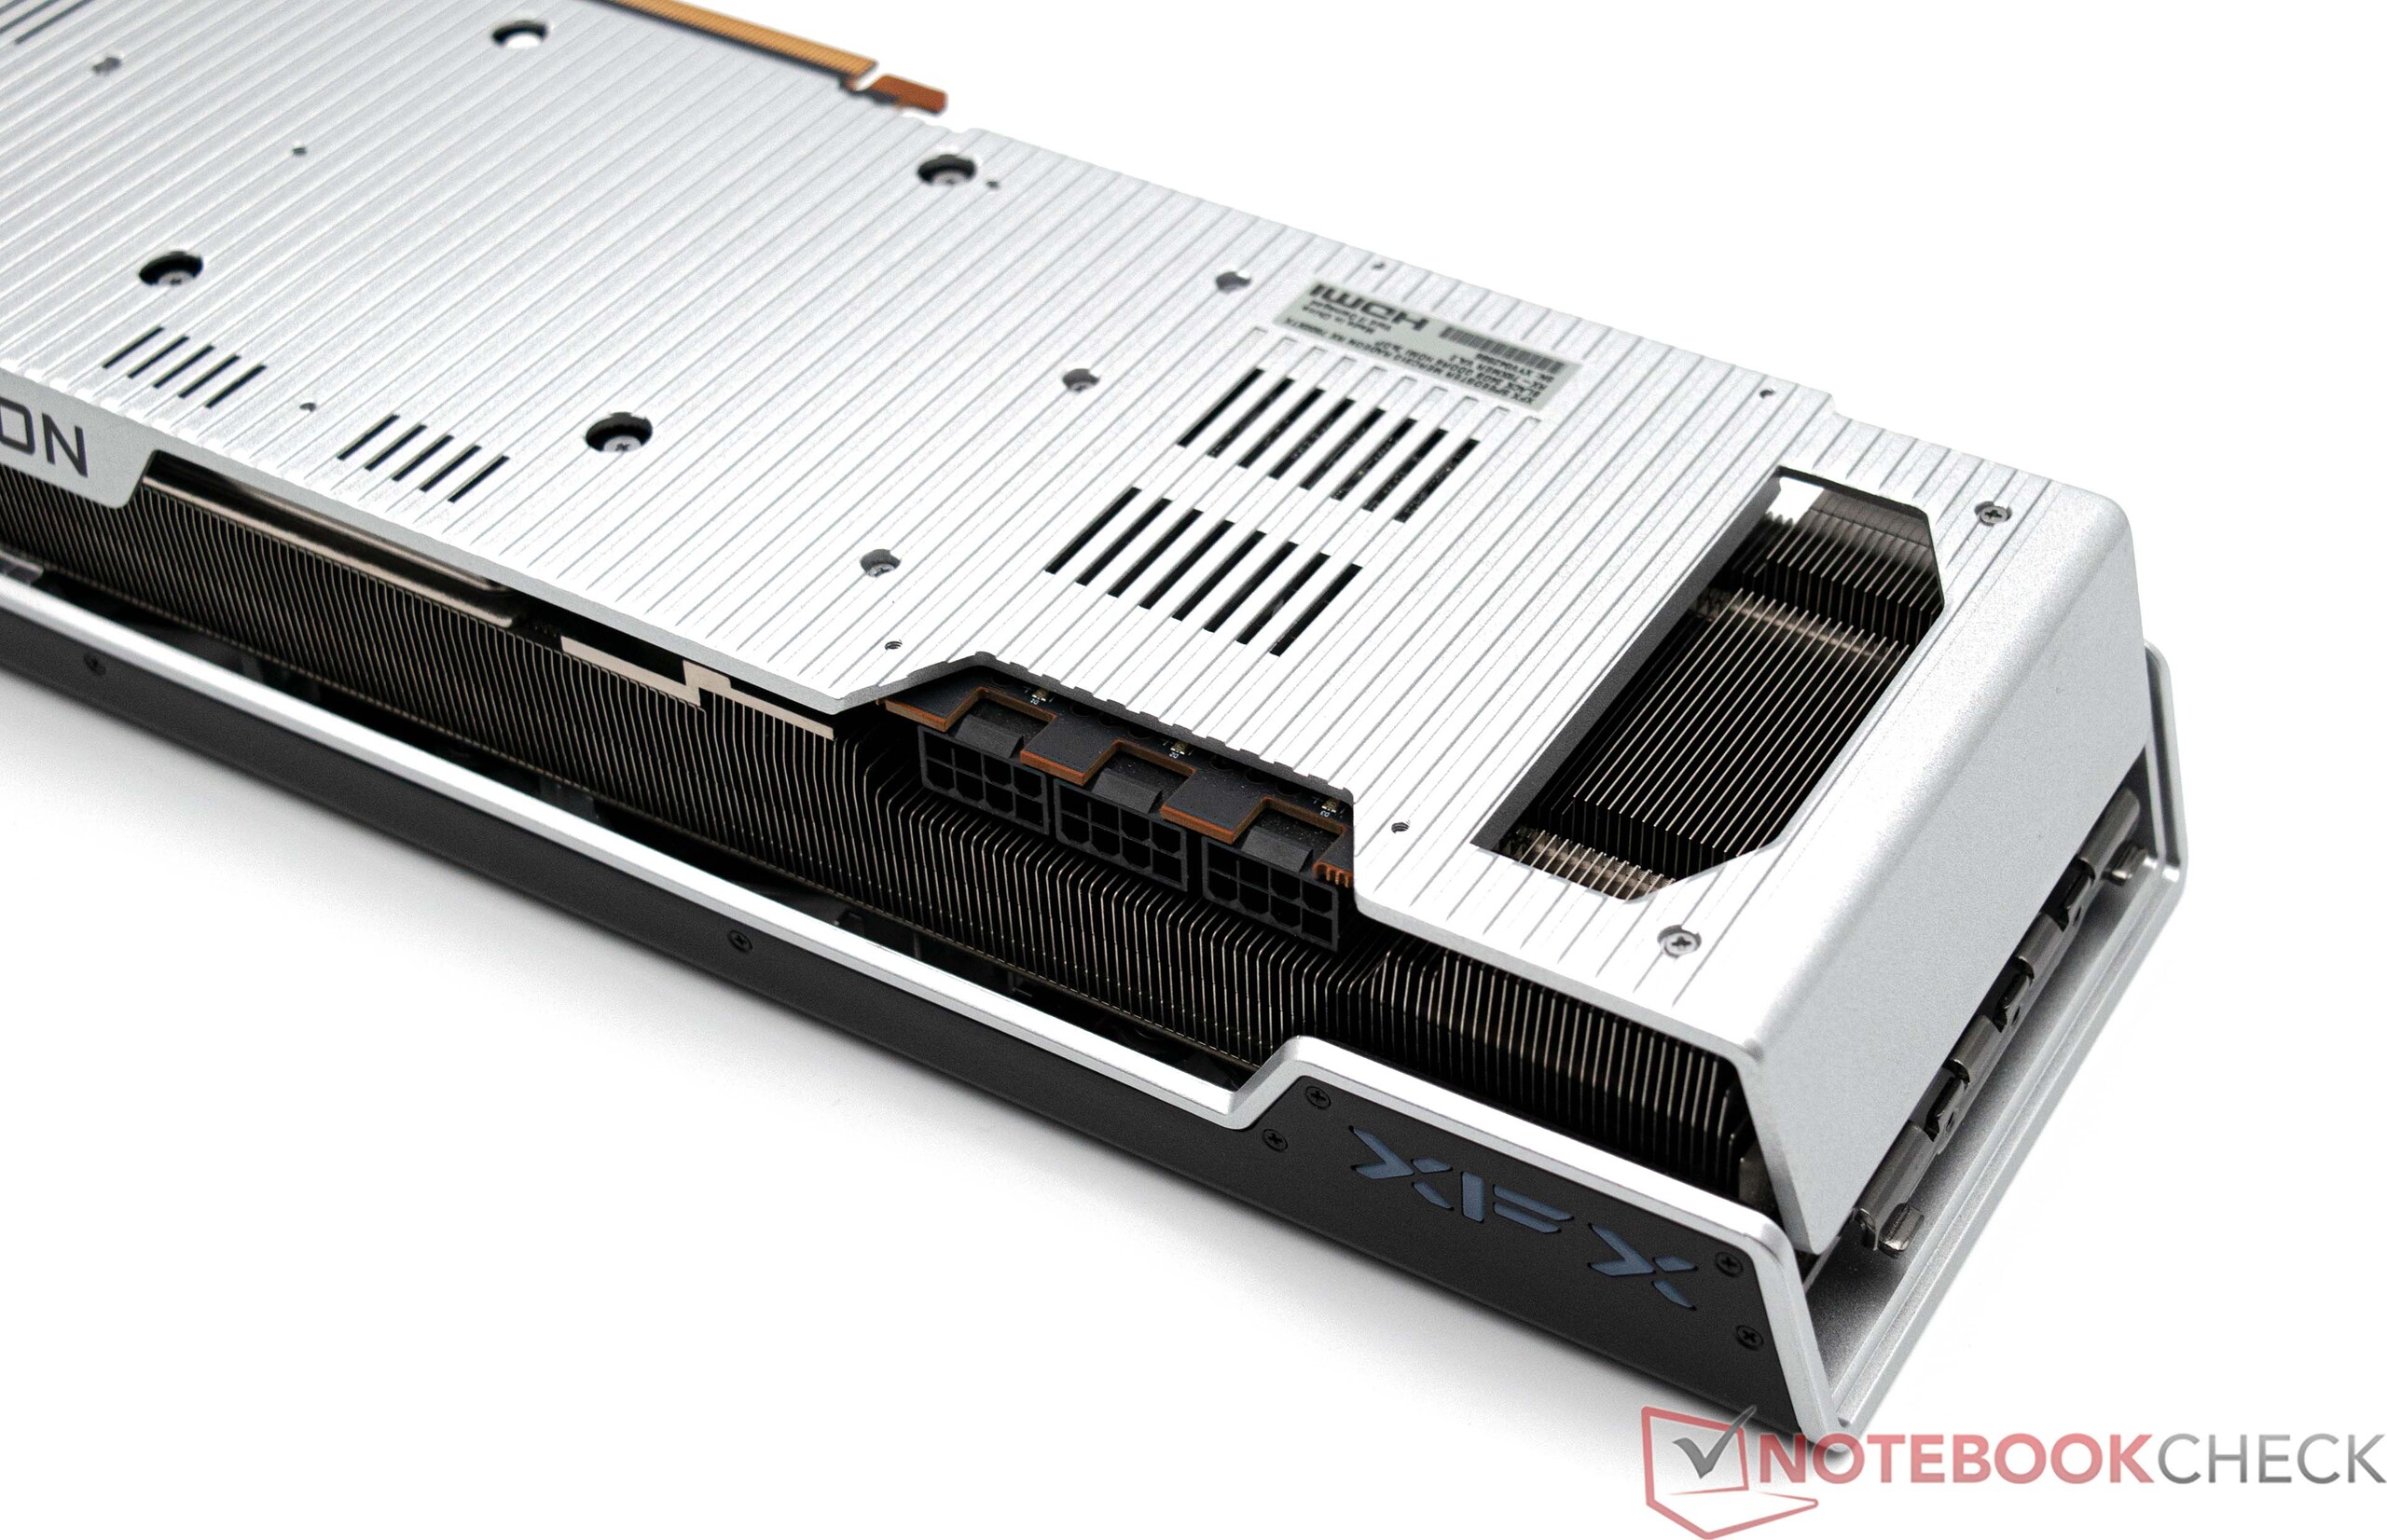
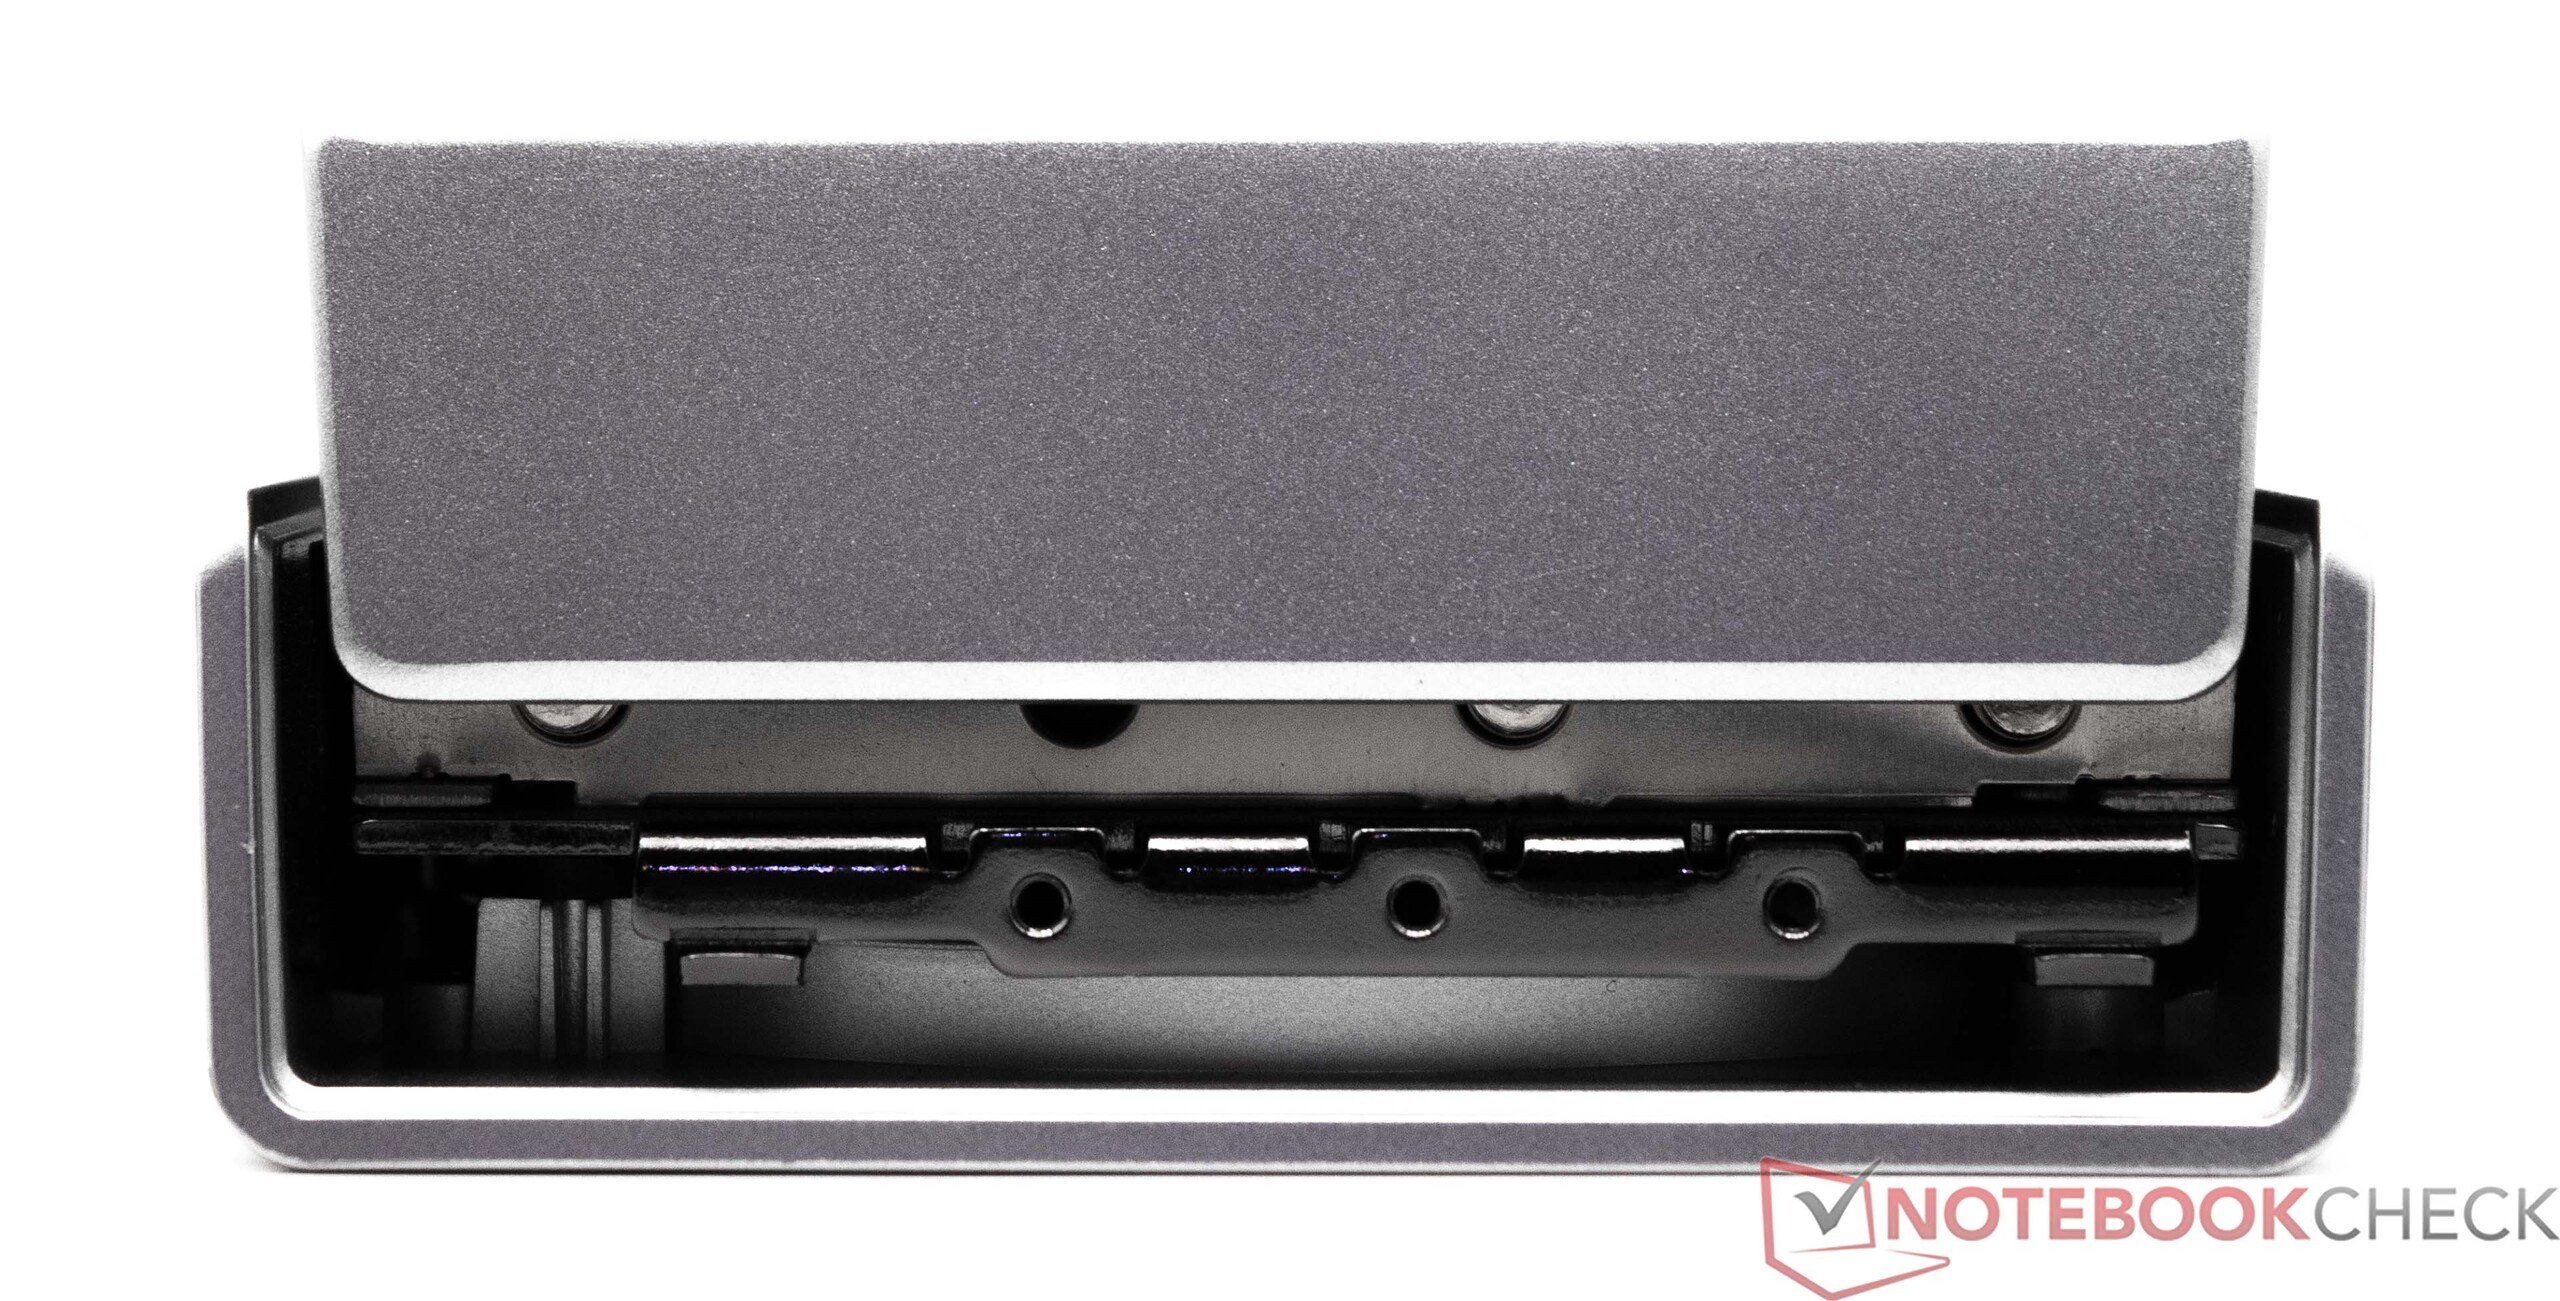
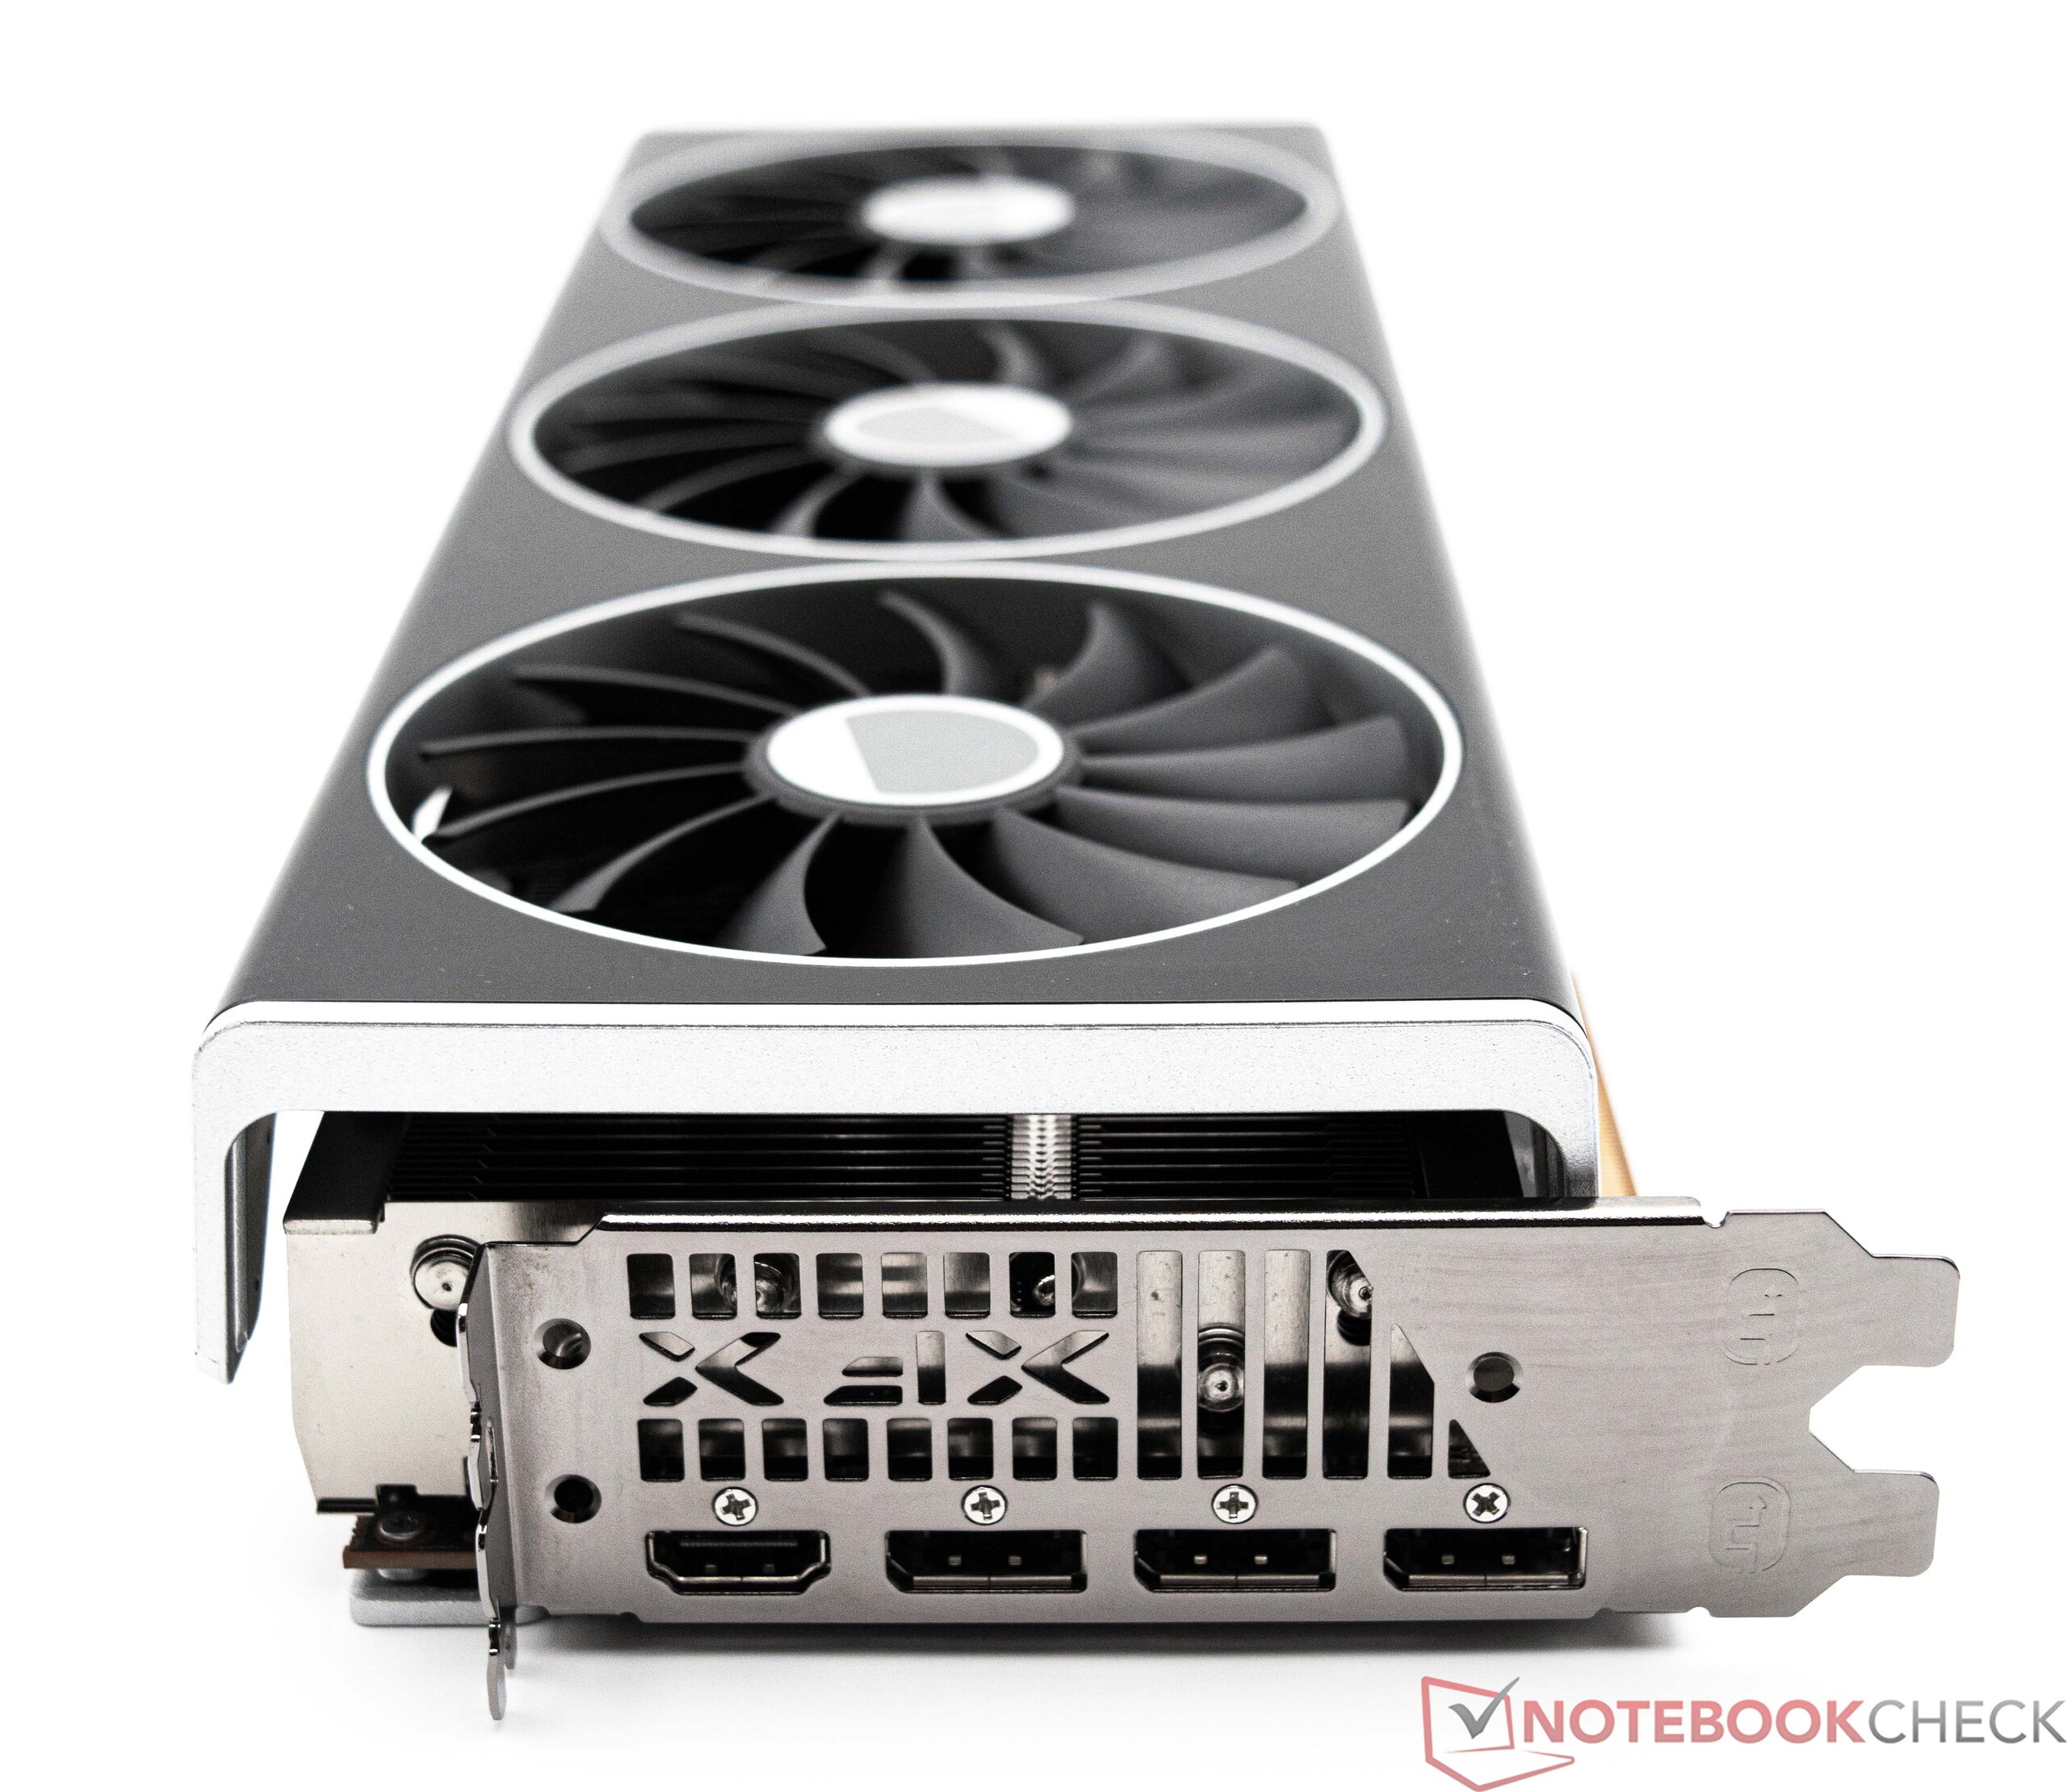
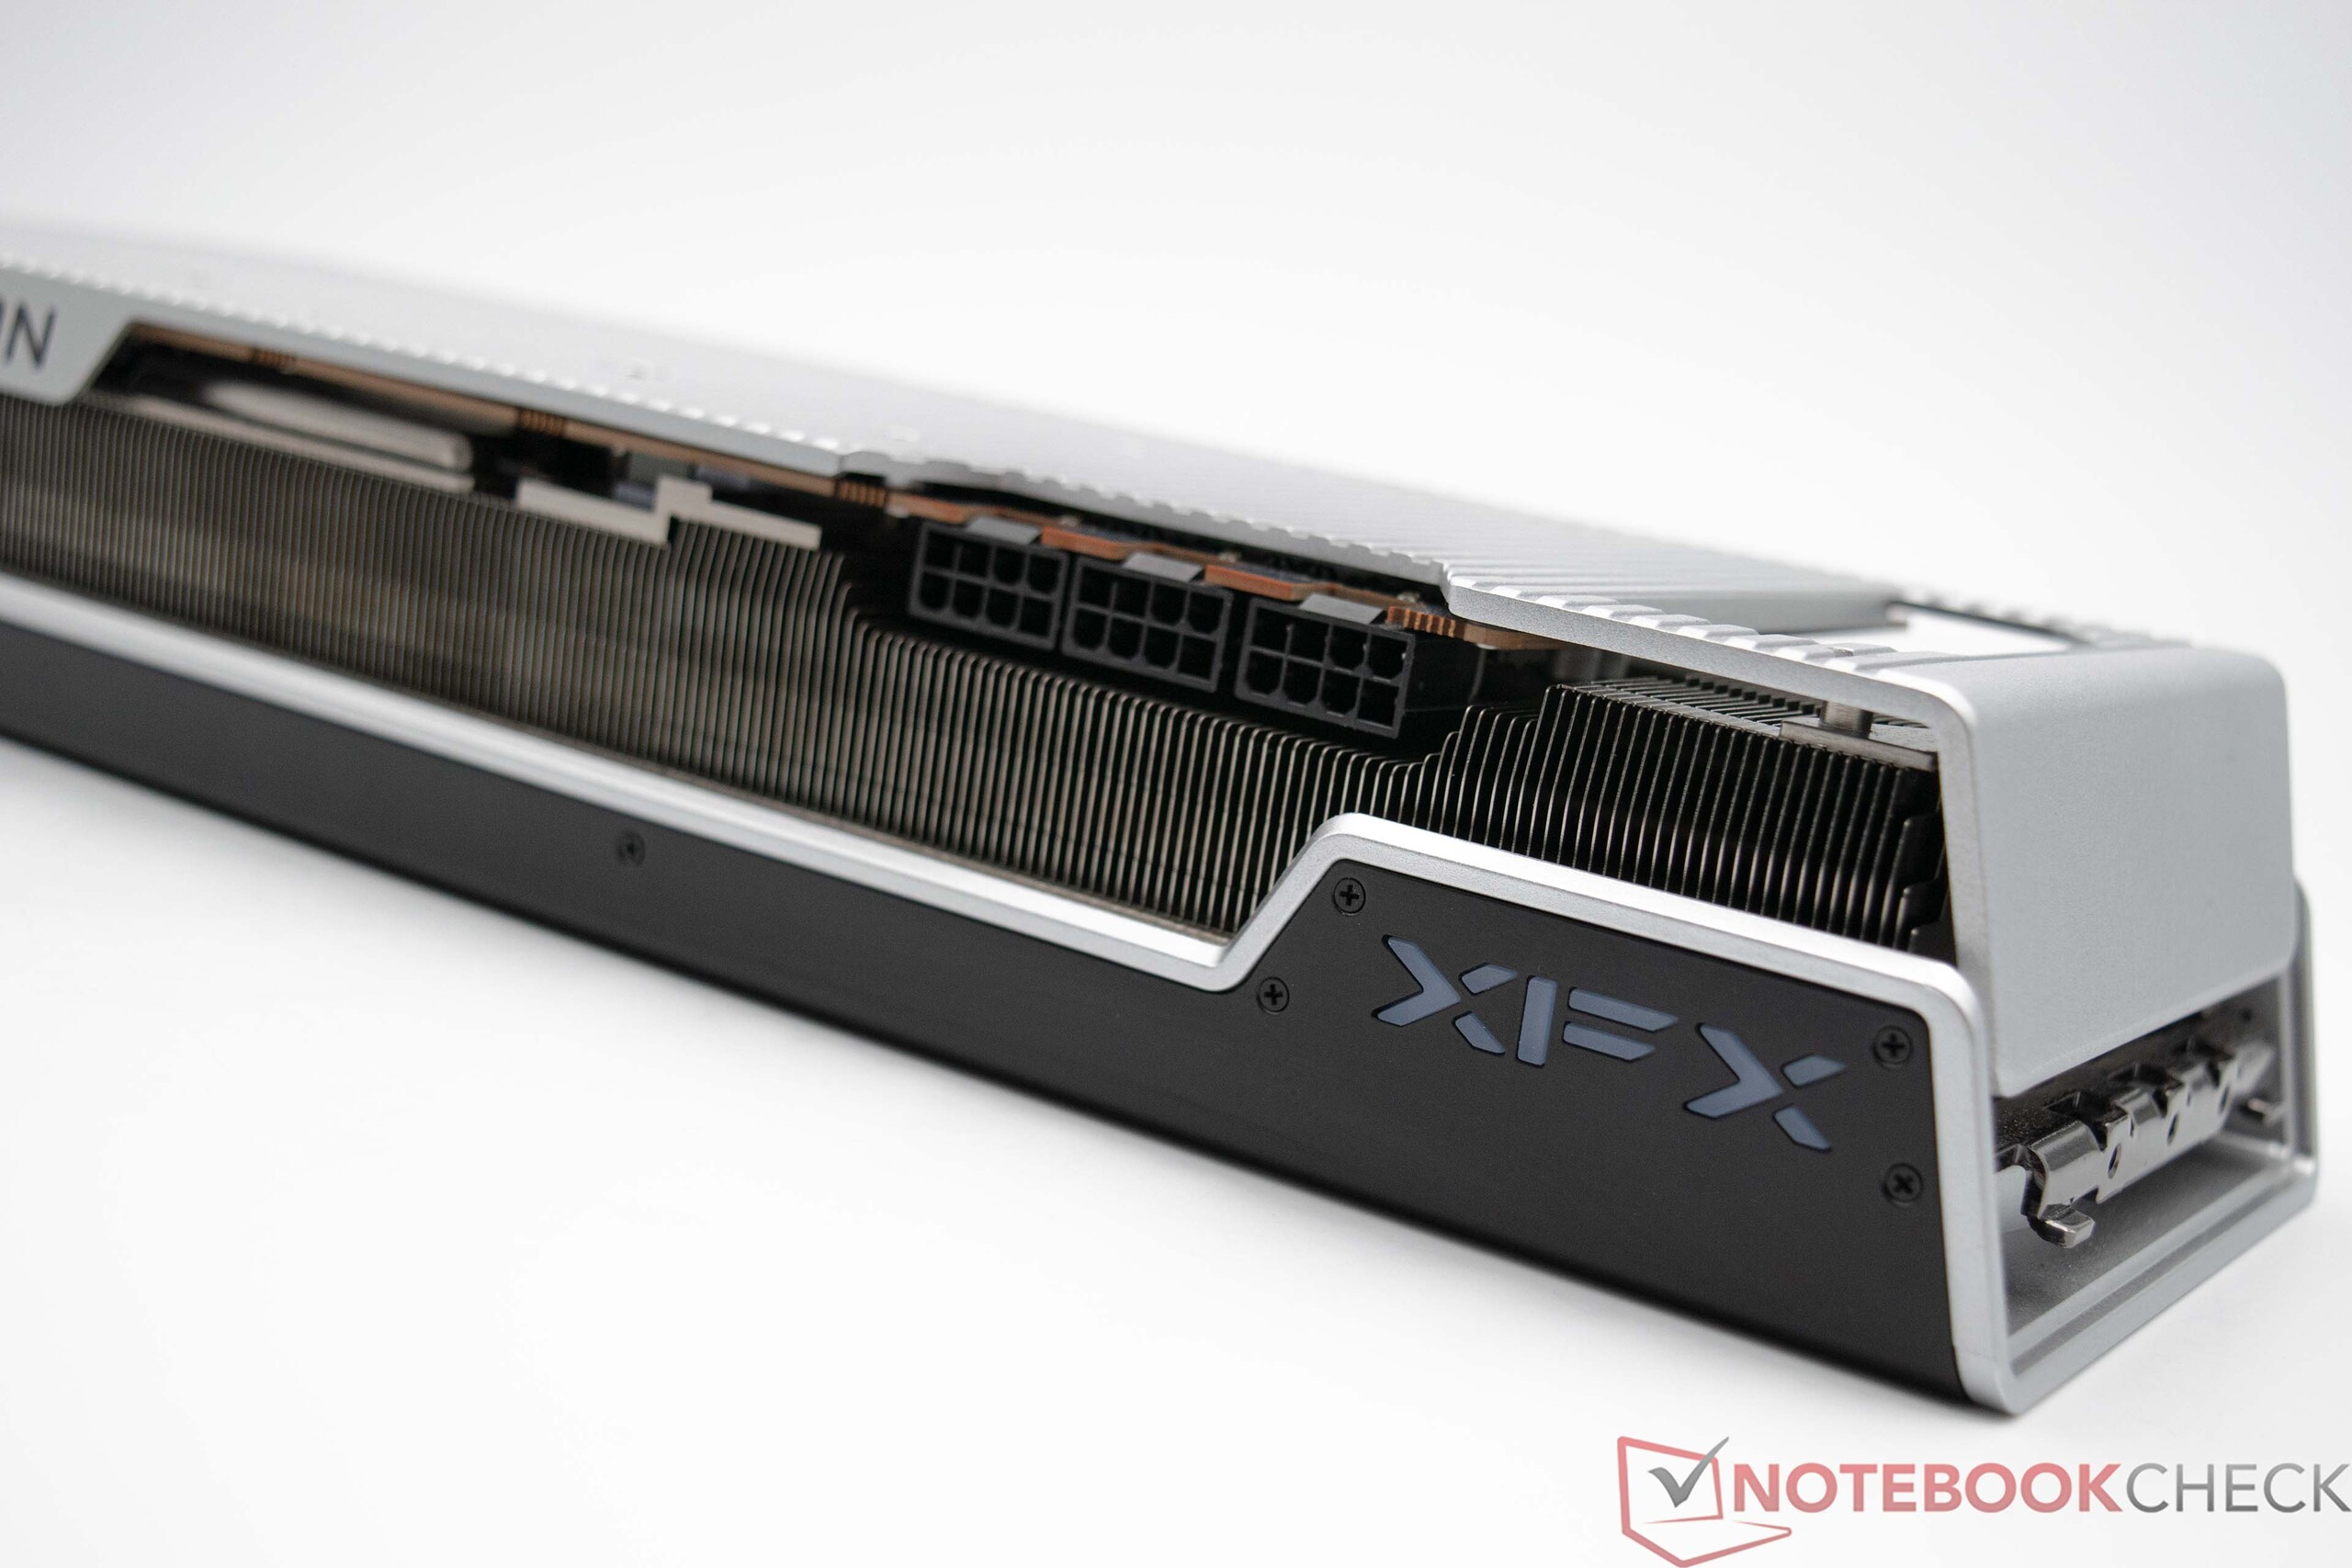
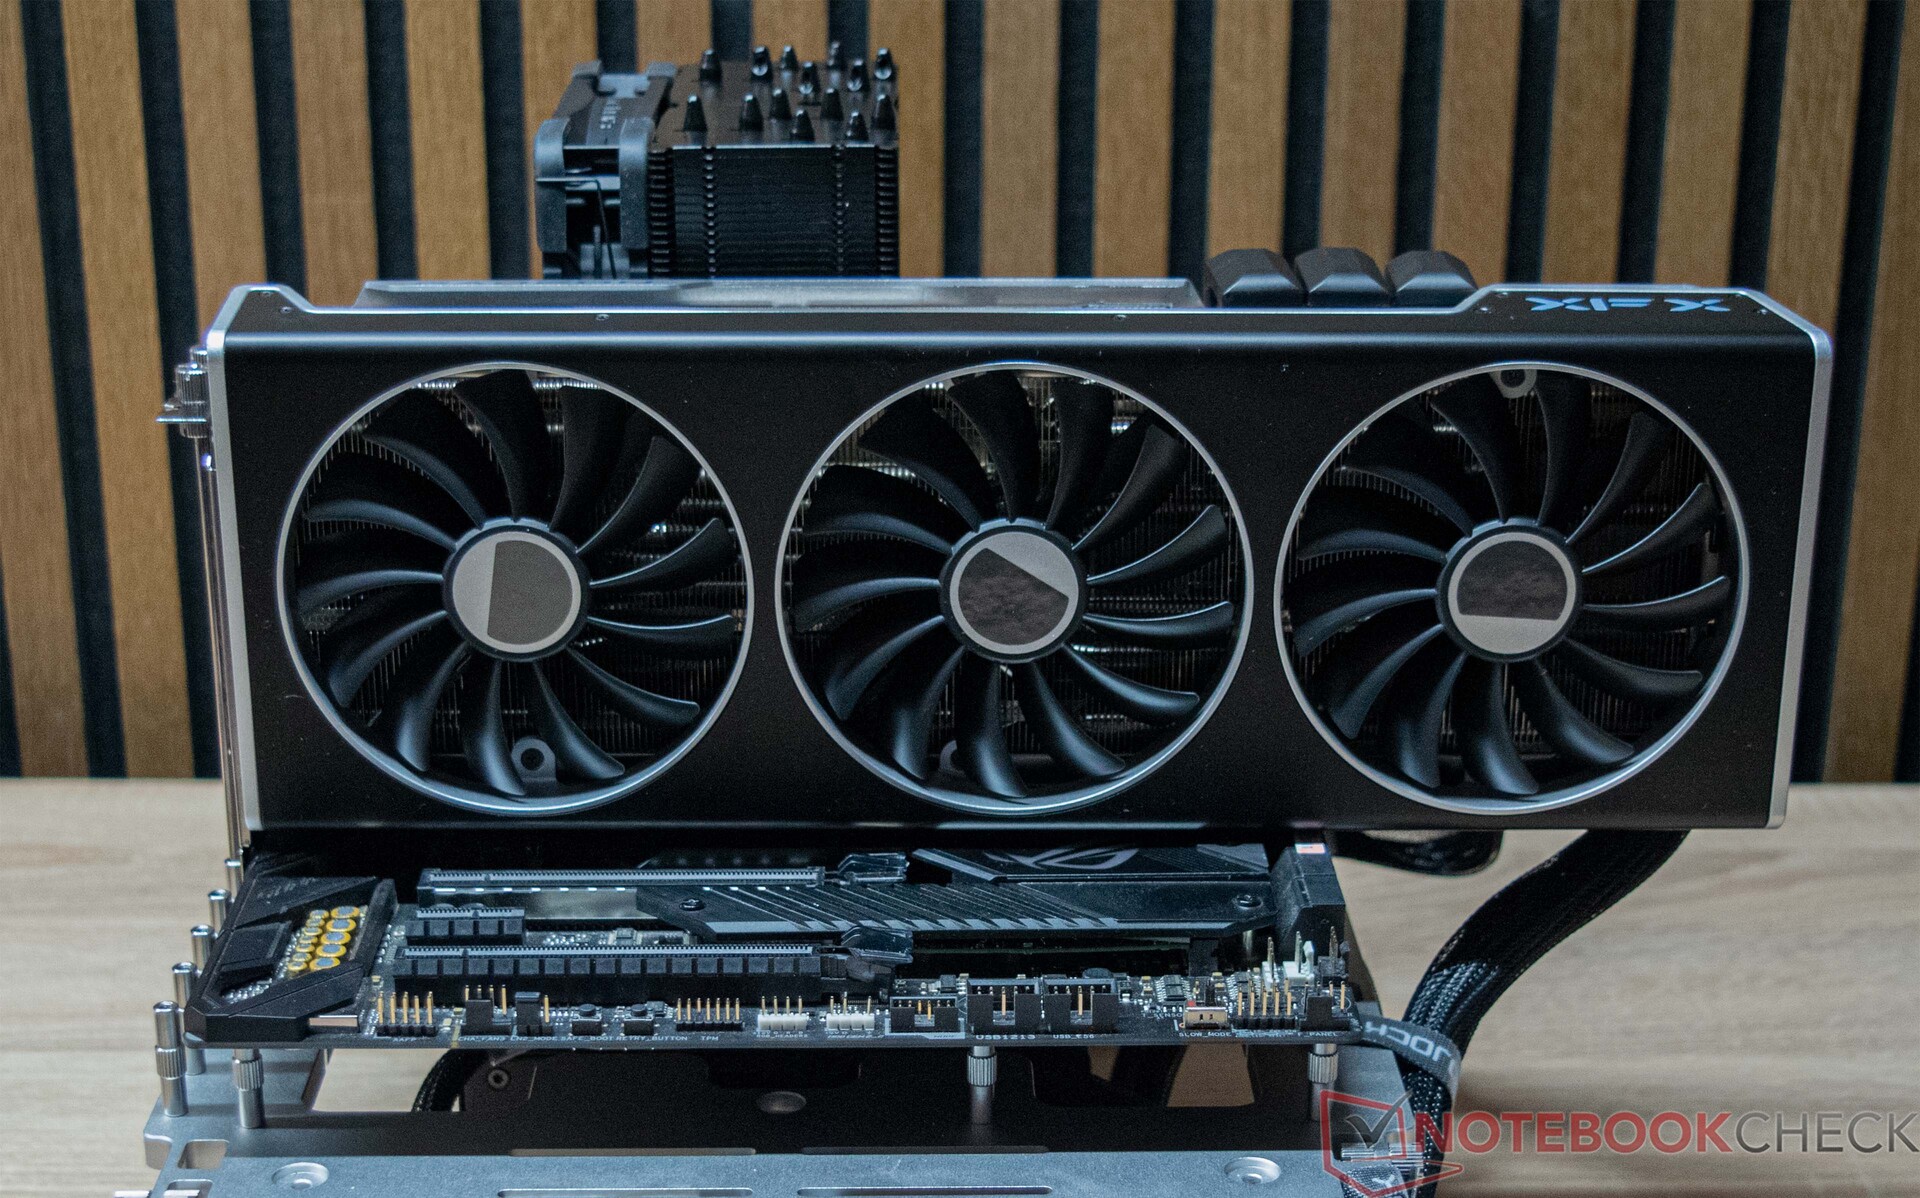
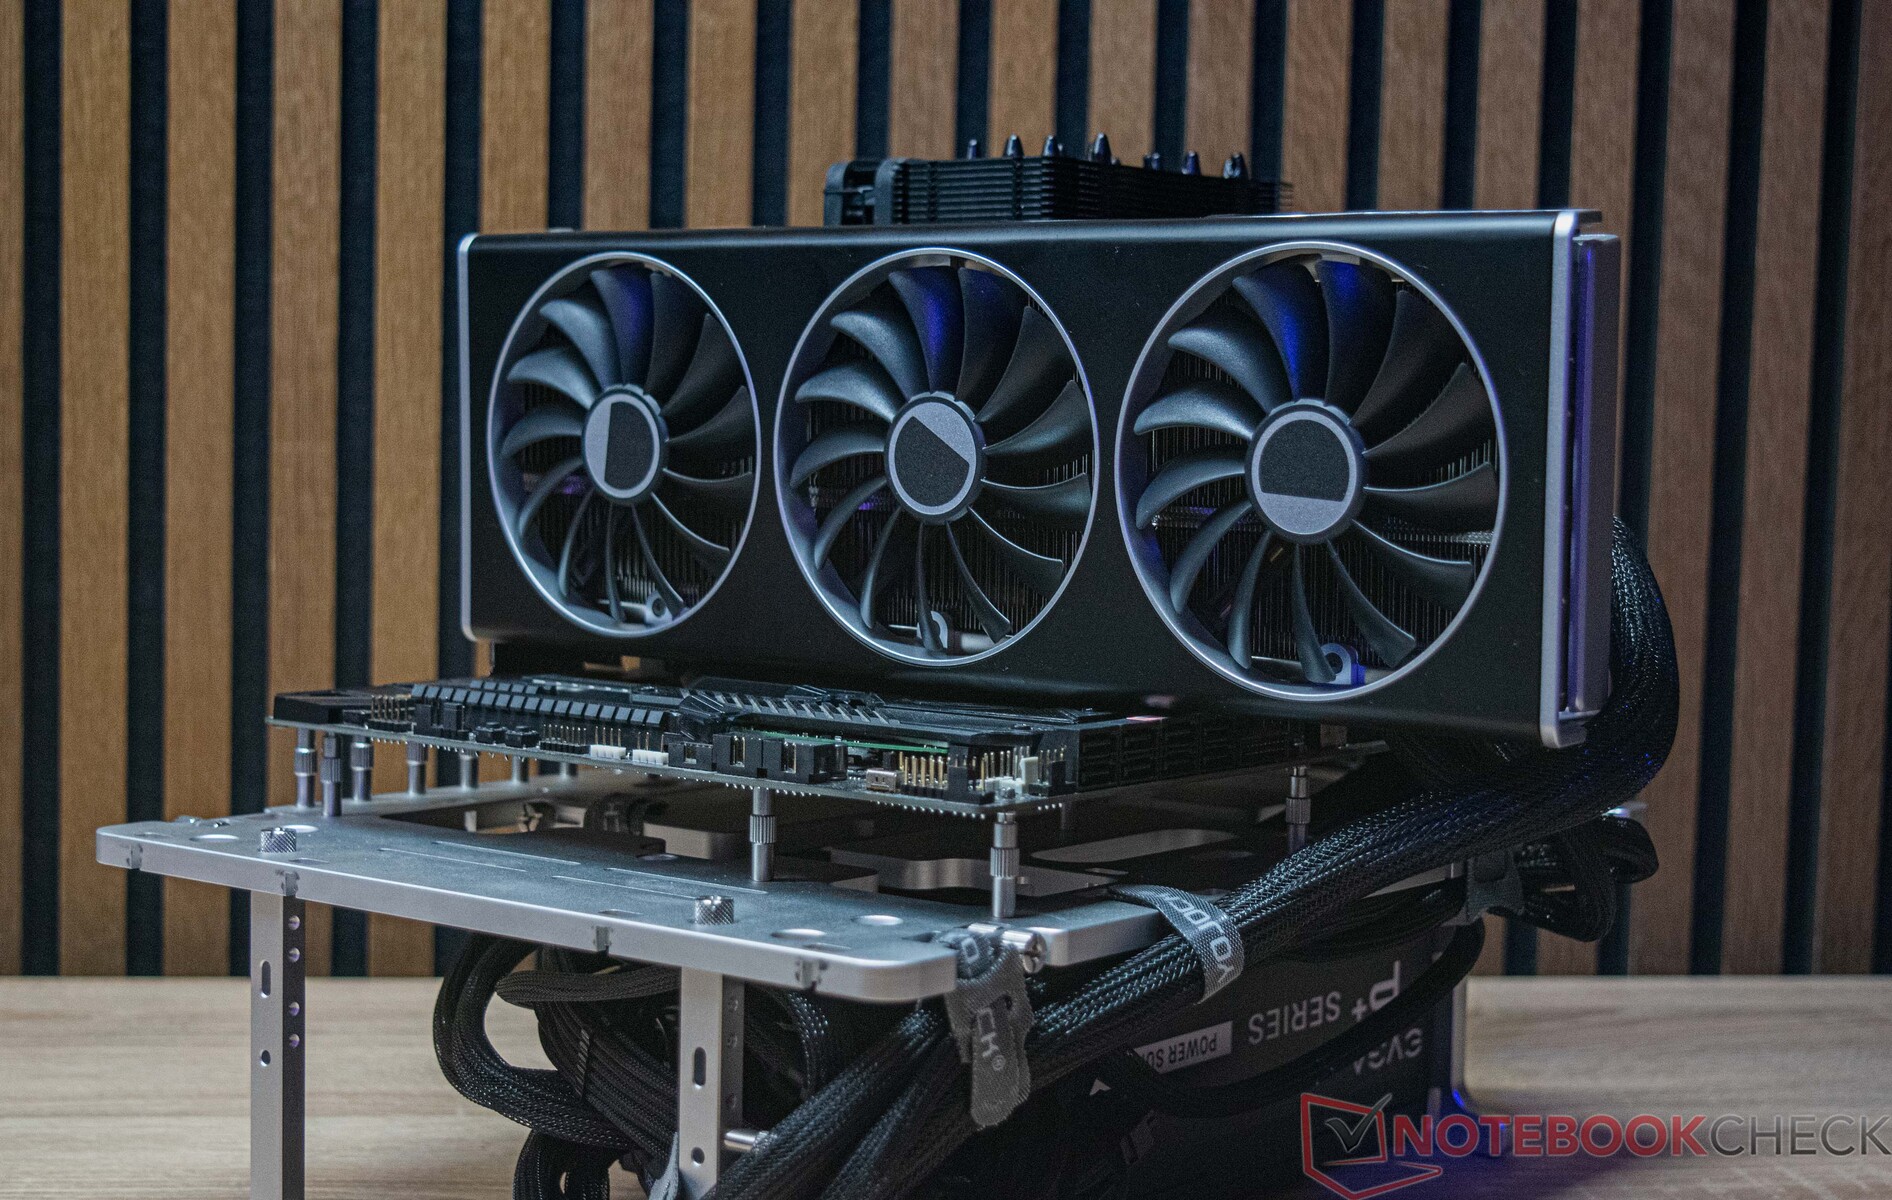
As already mentioned, the XFX Speedster MERC 310 Radeon RX 7900 XTX Black Edition is a model that isn't based on AMD's reference design. The model from the board partner is significantly larger and at 34.4 cm (~13.5 in), also fairly long. This is a point that users definitely need to pay attention to. With a thickness of 2.9 slots, there also has to be sufficient space below the graphics card. But the XFX model still is not extremely thick, since current high-end graphics cards almost always occupy three or more slots in the case. In terms of supplying power, XFX continues to use the known 6+2 PCIe connectors. In order to deliver the almost 400 watts under load without any problems, the XFX Speedster MERC 310 Radeon RX 7900 XTX Black Edition has a total of three 6+2 PCIe connectors. In terms of external connections, our test unit offers 3x DisplayPort, two of which support the newest 2.1 standard. An HDMI 2.1 connection is also available, allowing you to use a total of four displays.

Infos on our Test System

XFX Radeon RX 7900 XTX Merc 310 Black Edition
Processor
Intel Core i9-14900K 24 x 3.2 - 6 GHz, 253 W PL2 / Short Burst, 253 W PL1 / Sustained, Raptor Lake
Graphics adapter
AMD Radeon RX 7900 XTX - 24 GB VRAM, Core: 2679 MHz, Memory: 2500 MHz, 406 W TDP, Adrenalin 24.1.1
Memory
32 GB 
, DDR5-6000, CL30
Mainboard
Intel Z690 (Alder Lake-S PCH)
Storage
Kingston KC3000 2048G SKC3000D2048G, 2048 GB 
, M.2 NVMe
Size
height x width x depth (in mm): 57 x 128 x 344 ( = 2.24 x 5.04 x 13.54 in)
Operating System
Microsoft Windows 11 Pro
Additional features
24 Months Warranty
Weight
1.857 kg ( = 65.5 oz / 4.09 pounds), Power Supply: 0 g ( = 0 oz / 0 pounds)
Price
949 Euro
Note: The manufacturer may use components from different suppliers including display panels, drives or memory sticks with similar specifications.


XFX Speedster MERC 310 Radeon RX 7900 XTX Black Edition in Detail

XFX Speedster MERC 310 Radeon RX 7900 XTX Black Edition in our test system
XFX Speedster MERC 310 Radeon RX 7900 XTX Black Edition
XFX Speedster MERC 310 Radeon RX 7900 XTX Black Edition vs. Palit GeForce RTX 4090 GameRock OC

Comparison of the Radeon AMD GPUs

Specifications Radeon RX 7900 XTX Radeon RX 7900 XT Radeon RX 7900 GRE Radeon RX 7800 XT Radeon RX 7700 XT Radeon RX 7600
GPU Navi 31 XTX Navi 31 XT Navi 31 XT Navi 32 XT Navi 32 XL Navi 33 XL
Manufacturing Process 5/6 nm 5/6 nm 5/6 nm 5/6 nm 5/6 nm 6 nm
Compute Units 96 84 80 60 54 32
Shading Units 6,144 5,376 5,120 3,840 3,456 2,048
Texture Mapping Units 384 336 320 240 216 128
Ray Accelerators 96 84 80 60 54 32
Base Clock 2,270 MHz 2,000 MHz 1,880 MHz 1,295 MHz 1,700 MHz 1,720 MHz
Game Clock 2,300 MHz 2,000 MHz 1,880 MHz 2,124 MHz 2,171 MHz 2,250 MHz
Boost Clock 2,500 MHz 2,400 MHz 2,245 MHz 2,430 MHz 2,544 MHz 2,655 MHz
Infinity Cache 96 MB 80 MB 64 MB 64 MB 48 MB 32 MB
Memory Bus Width 384 bit 320 bit 256 bit 256 bit 256 bit 128 bit
Memory Bandwidth 960 GB/s 800 GB/s 576 GB/s 620.8 GB/s 432 GB/s 288 GB/s
Memory Size 24 GB GDDR6 20 GB GDDR6 16 GB GDDR6 16 GB GDDR6 12 GB GDDR6 8 GB GDDR6
TBP 355 W 315 W 260 W 263 W 245 W 165 W

The Clock Speeds of the XFX Speedster MERC 310 Radeon RX 7900 XTX Black Edition

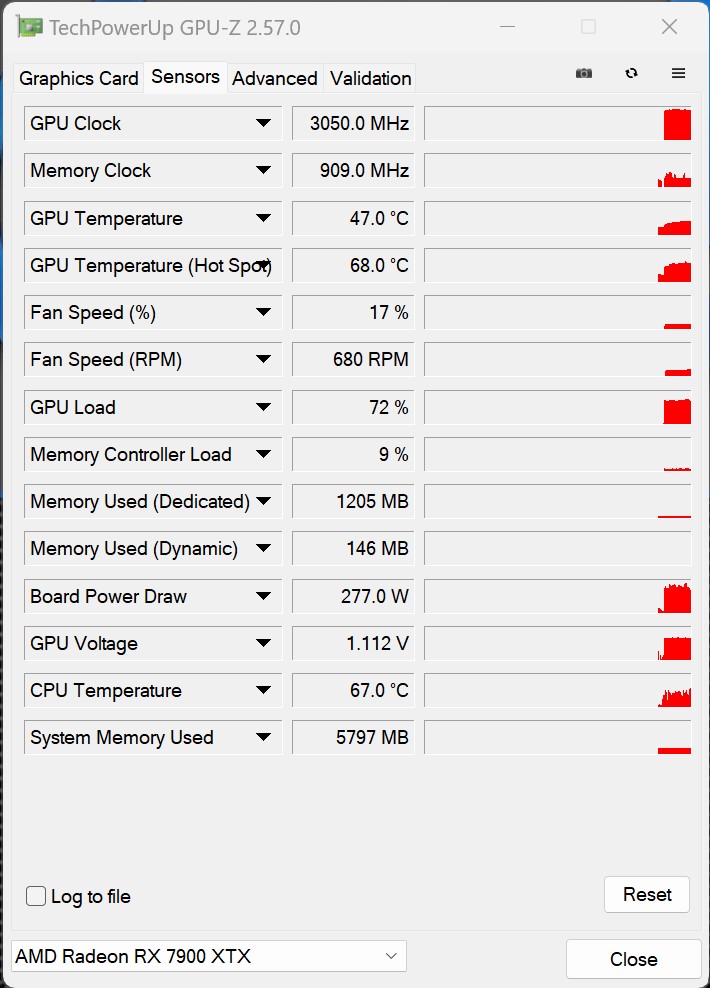
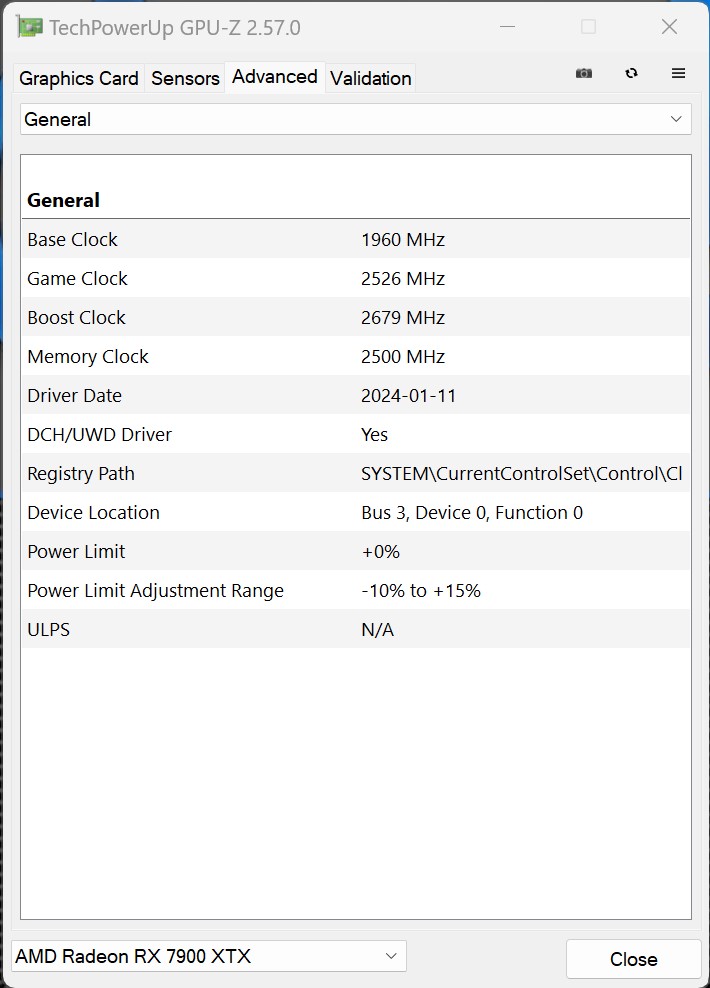
In terms of the GPU clock speeds, the demands on the XFX Speedster MERC 310 Radeon RX 7900 XTX Black Edition are significantly higher than those on the reference model. In addition, there are two BIOS versions that increase the GPU boost further and also adjust the power target to slightly more than 400 watts. All the following benchmarks are run with the Performance mode to reflect the maximum performance of the graphics card. At 2,679 MHz, the boost speed of our XFX model is increased by almost 180 MHz compared to that of the reference card. In our praxis tests, we also see that the 2,679 MHz are always surpassed during full load of the graphics card. In most games, the NAVI 31 chip runs at 2,750 to 2,950 MHz. The VRAM remains untouched by any possible overclocking measures, and XFX keeps to the guidelines from AMD here.

GPU-Z
GPU-Z
GPU-Z
GPU-Z
GPU-Z
GPU-Z

Synthetic Benchmarks

In the synthetic benchmarks, we can already see the performance the XFX Speedster MERC 310 Radeon RX 7900 XTX Black Edition is able to achieve. In several tests, our test unit is able to place second behind the Palit GeForce RTX 4090 GameRock OC. Depending on the test and specific demands, our test card sometimes does better and at other times worse. For the latter, we should mention the Luxmark and Computemark tests, where the AMD graphics card lose some ground compared to the graphics accelerators from Nvidia.

Basically, the XFX Speedster MERC 310 Radeon RX 7900 XTX Black Edition delivers a very high 3D performance that is still competitive after more than one year on the market.

Performance Rating - Percent
Palit GeForce RTX 4090 GameRock OC
99.9 pt
XFX Radeon RX 7900 XTX Merc 310 Black Edition
83.3 pt
Zotac RTX 4080 Super Trinity Black Edition
80.8 pt
KFA2 GeForce RTX 4080 Super SG
79.6 pt
AMD Radeon RX 7900 XTX
79.4 pt
KFA2 GeForce RTX 4080 SG
78.1 pt
AMD Radeon RX 7900 XT
70.6 pt
Asus TUF Gaming GeForce RTX 4070 Ti Super
67.2 pt
KFA2 GeForce RTX 4070 Ti EX Gamer
64.6 pt
MSI Radeon RX 6950 XT Gaming X Trio
64.1 pt
AMD Radeon RX 7900 GRE
60.7 pt
AMD Radeon RX 7800 XT
55.7 pt
KFA2 GeForce RTX 4070 EX Gamer
53.7 pt
Sapphire Pulse Radeon RX 7700 XT
48.2 pt
KFA2 GeForce RTX 4060 Ti EX, 16GB GDDR6
39.4 pt
XFX Speedster QICK 308 Radeon RX 7600 Black Edition
36 pt
KFA2 GeForce RTX 4060 1-Click-OC 2X
35 pt
3DMark
2560x1440 Time Spy Graphics
Palit GeForce RTX 4090 GameRock OC
37762 Points +17%
XFX Radeon RX 7900 XTX Merc 310 Black Edition
32205 Points
AMD Radeon RX 7900 XTX
29699 Points -8%
Zotac RTX 4080 Super Trinity Black Edition
28605 Points -11%
KFA2 GeForce RTX 4080 Super SG
28378 Points -12%
KFA2 GeForce RTX 4080 SG
27791 Points -14%
AMD Radeon RX 7900 XT
25874 Points -20%
Asus TUF Gaming GeForce RTX 4070 Ti Super
23695 Points -26%
KFA2 GeForce RTX 4070 Ti EX Gamer
22304 Points -31%
MSI Radeon RX 6950 XT Gaming X Trio
22289 Points -31%
AMD Radeon RX 7900 GRE
20820 Points -35%
AMD Radeon RX 7800 XT
19369 Points -40%
KFA2 GeForce RTX 4070 EX Gamer
17827 Points -45%
Sapphire Pulse Radeon RX 7700 XT
16777 Points -48%
KFA2 GeForce RTX 4060 Ti EX, 16GB GDDR6
13359 Points -59%
XFX Speedster QICK 308 Radeon RX 7600 Black Edition
11062 Points -66%
KFA2 GeForce RTX 4060 1-Click-OC 2X
10494 Points -67%
Fire Strike Extreme Graphics
Palit GeForce RTX 4090 GameRock OC
46420 Points +15%
XFX Radeon RX 7900 XTX Merc 310 Black Edition
40464 Points
AMD Radeon RX 7900 XTX
39570 Points -2%
Zotac RTX 4080 Super Trinity Black Edition
34430 Points -15%
KFA2 GeForce RTX 4080 SG
33912 Points -16%
AMD Radeon RX 7900 XT
33747 Points -17%
KFA2 GeForce RTX 4080 Super SG
33634 Points -17%
MSI Radeon RX 6950 XT Gaming X Trio
30406 Points -25%
Asus TUF Gaming GeForce RTX 4070 Ti Super
27984 Points -31%
AMD Radeon RX 7900 GRE
27356 Points -32%
KFA2 GeForce RTX 4070 Ti EX Gamer
26694 Points -34%
AMD Radeon RX 7800 XT
25279 Points -38%
KFA2 GeForce RTX 4070 EX Gamer
21216 Points -48%
Sapphire Pulse Radeon RX 7700 XT
21006 Points -48%
KFA2 GeForce RTX 4060 Ti EX, 16GB GDDR6
15511 Points -62%
XFX Speedster QICK 308 Radeon RX 7600 Black Edition
14966 Points -63%
KFA2 GeForce RTX 4060 1-Click-OC 2X
13086 Points -68%
3840x2160 Fire Strike Ultra Graphics
Palit GeForce RTX 4090 GameRock OC
25209 Points +20%
XFX Radeon RX 7900 XTX Merc 310 Black Edition
20998 Points
AMD Radeon RX 7900 XTX
20214 Points -4%
Zotac RTX 4080 Super Trinity Black Edition
17579 Points -16%
KFA2 GeForce RTX 4080 Super SG
17236 Points -18%
KFA2 GeForce RTX 4080 SG
17120 Points -18%
AMD Radeon RX 7900 XT
17078 Points -19%
MSI Radeon RX 6950 XT Gaming X Trio
15188 Points -28%
AMD Radeon RX 7900 GRE
14000 Points -33%
Asus TUF Gaming GeForce RTX 4070 Ti Super
13998 Points -33%
KFA2 GeForce RTX 4070 Ti EX Gamer
13189 Points -37%
AMD Radeon RX 7800 XT
12529 Points -40%
Sapphire Pulse Radeon RX 7700 XT
10596 Points -50%
KFA2 GeForce RTX 4070 EX Gamer
9920 Points -53%
XFX Speedster QICK 308 Radeon RX 7600 Black Edition
7305 Points -65%
KFA2 GeForce RTX 4060 Ti EX, 16GB GDDR6
7058 Points -66%
KFA2 GeForce RTX 4060 1-Click-OC 2X
5668 Points -73%
1920x1080 Fire Strike Graphics
Palit GeForce RTX 4090 GameRock OC
70971 Points +14%
AMD Radeon RX 7900 XTX
66967 Points +7%
KFA2 GeForce RTX 4080 SG
65190 Points +4%
AMD Radeon RX 7900 XT
63712 Points +2%
XFX Radeon RX 7900 XTX Merc 310 Black Edition
62392 Points
Zotac RTX 4080 Super Trinity Black Edition
59674 Points -4%
MSI Radeon RX 6950 XT Gaming X Trio
59672 Points -4%
KFA2 GeForce RTX 4080 Super SG
59075 Points -5%
AMD Radeon RX 7900 GRE
54819 Points -12%
KFA2 GeForce RTX 4070 Ti EX Gamer
53736 Points -14%
Asus TUF Gaming GeForce RTX 4070 Ti Super
52738 Points -15%
AMD Radeon RX 7800 XT
50181 Points -20%
KFA2 GeForce RTX 4070 EX Gamer
44065 Points -29%
Sapphire Pulse Radeon RX 7700 XT
42801 Points -31%
XFX Speedster QICK 308 Radeon RX 7600 Black Edition
32404 Points -48%
KFA2 GeForce RTX 4060 Ti EX, 16GB GDDR6
32275 Points -48%
KFA2 GeForce RTX 4060 1-Click-OC 2X
28111 Points -55%
Unigine Superposition
7680x4320 8k Optimized
Palit GeForce RTX 4090 GameRock OC
12845 Points +44%
XFX Radeon RX 7900 XTX Merc 310 Black Edition
8931 Points
Zotac RTX 4080 Super Trinity Black Edition
8767 Points -2%
AMD Radeon RX 7900 XTX
8751 Points -2%
KFA2 GeForce RTX 4080 Super SG
8729 Points -2%
KFA2 GeForce RTX 4080 SG
8604 Points -4%
Asus TUF Gaming GeForce RTX 4070 Ti Super
7121 Points -20%
AMD Radeon RX 7900 XT
7034 Points -21%
MSI Radeon RX 6950 XT Gaming X Trio
6464 Points -28%
KFA2 GeForce RTX 4070 Ti EX Gamer
6380 Points -29%
AMD Radeon RX 7900 GRE
5663 Points -37%
AMD Radeon RX 7800 XT
5307 Points -41%
KFA2 GeForce RTX 4070 EX Gamer
5290 Points -41%
Sapphire Pulse Radeon RX 7700 XT
4085 Points -54%
KFA2 GeForce RTX 4060 Ti EX, 16GB GDDR6
3517 Points -61%
KFA2 GeForce RTX 4060 1-Click-OC 2X
3066 Points -66%
XFX Speedster QICK 308 Radeon RX 7600 Black Edition
2964 Points -67%
3840x2160 4k Optimized
Palit GeForce RTX 4090 GameRock OC
33885 Points +41%
XFX Radeon RX 7900 XTX Merc 310 Black Edition
23972 Points
AMD Radeon RX 7900 XTX
23174 Points -3%
Zotac RTX 4080 Super Trinity Black Edition
23135 Points -3%
KFA2 GeForce RTX 4080 Super SG
23130 Points -4%
KFA2 GeForce RTX 4080 SG
22482 Points -6%
Asus TUF Gaming GeForce RTX 4070 Ti Super
18817 Points -22%
AMD Radeon RX 7900 XT
18806 Points -22%
MSI Radeon RX 6950 XT Gaming X Trio
16993 Points -29%
KFA2 GeForce RTX 4070 Ti EX Gamer
16889 Points -30%
AMD Radeon RX 7900 GRE
15602 Points -35%
KFA2 GeForce RTX 4070 EX Gamer
13814 Points -42%
AMD Radeon RX 7800 XT
13776 Points -43%
Sapphire Pulse Radeon RX 7700 XT
11256 Points -53%
KFA2 GeForce RTX 4060 Ti EX, 16GB GDDR6
9516 Points -60%
KFA2 GeForce RTX 4060 1-Click-OC 2X
7959 Points -67%
XFX Speedster QICK 308 Radeon RX 7600 Black Edition
7817 Points -67%
1920x1080 1080p Extreme
Palit GeForce RTX 4090 GameRock OC
21920 Points +21%
XFX Radeon RX 7900 XTX Merc 310 Black Edition
18081 Points
AMD Radeon RX 7900 XTX
17264 Points -5%
Zotac RTX 4080 Super Trinity Black Edition
16971 Points -6%
KFA2 GeForce RTX 4080 SG
16635 Points -8%
KFA2 GeForce RTX 4080 Super SG
16221 Points -10%
AMD Radeon RX 7900 XT
14181 Points -22%
Asus TUF Gaming GeForce RTX 4070 Ti Super
13312 Points -26%
KFA2 GeForce RTX 4070 Ti EX Gamer
12837 Points -29%
MSI Radeon RX 6950 XT Gaming X Trio
12048 Points -33%
AMD Radeon RX 7900 GRE
11728 Points -35%
AMD Radeon RX 7800 XT
10145 Points -44%
KFA2 GeForce RTX 4070 EX Gamer
9842 Points -46%
Sapphire Pulse Radeon RX 7700 XT
8732 Points -52%
KFA2 GeForce RTX 4060 Ti EX, 16GB GDDR6
7712 Points -57%
XFX Speedster QICK 308 Radeon RX 7600 Black Edition
6419 Points -64%
KFA2 GeForce RTX 4060 1-Click-OC 2X
5974 Points -67%
1920x1080 1080p High
Palit GeForce RTX 4090 GameRock OC
50399 Points +35%
Zotac RTX 4080 Super Trinity Black Edition
39045 Points +5%
KFA2 GeForce RTX 4080 Super SG
38778 Points +4%
XFX Radeon RX 7900 XTX Merc 310 Black Edition
37278 Points
KFA2 GeForce RTX 4080 SG
36824 Points -1%
AMD Radeon RX 7900 XTX
36536 Points -2%
AMD Radeon RX 7900 XT
31426 Points -16%
Asus TUF Gaming GeForce RTX 4070 Ti Super
30884 Points -17%
KFA2 GeForce RTX 4070 Ti EX Gamer
29062 Points -22%
MSI Radeon RX 6950 XT Gaming X Trio
28797 Points -23%
AMD Radeon RX 7900 GRE
26374 Points -29%
KFA2 GeForce RTX 4070 EX Gamer
23184 Points -38%
AMD Radeon RX 7800 XT
23019 Points -38%
Sapphire Pulse Radeon RX 7700 XT
19766 Points -47%
KFA2 GeForce RTX 4060 Ti EX, 16GB GDDR6
16732 Points -55%
XFX Speedster QICK 308 Radeon RX 7600 Black Edition
14051 Points -62%
KFA2 GeForce RTX 4060 1-Click-OC 2X
13790 Points -63%
1280x720 720p Low
Zotac RTX 4080 Super Trinity Black Edition
58018 Points +26%
Palit GeForce RTX 4090 GameRock OC
57174 Points +24%
KFA2 GeForce RTX 4080 Super SG
56966 Points +24%
KFA2 GeForce RTX 4070 Ti EX Gamer
56396 Points +23%
Asus TUF Gaming GeForce RTX 4070 Ti Super
50322 Points +10%
KFA2 GeForce RTX 4080 SG
49734 Points +8%
KFA2 GeForce RTX 4070 EX Gamer
49545 Points +8%
AMD Radeon RX 7900 XTX
47274 Points +3%
AMD Radeon RX 7900 GRE
45946 Points 0%
XFX Radeon RX 7900 XTX Merc 310 Black Edition
45946 Points
AMD Radeon RX 7900 XT
45904 Points 0%
KFA2 GeForce RTX 4060 1-Click-OC 2X
45864 Points 0%
AMD Radeon RX 7800 XT
45745 Points 0%
Sapphire Pulse Radeon RX 7700 XT
45299 Points -1%
KFA2 GeForce RTX 4060 Ti EX, 16GB GDDR6
43851 Points -5%
MSI Radeon RX 6950 XT Gaming X Trio
42809 Points -7%
XFX Speedster QICK 308 Radeon RX 7600 Black Edition
42477 Points -8%
Unigine Heaven 4.0
Extreme Preset DX11
Palit GeForce RTX 4090 GameRock OC
483.7 fps +24%
KFA2 GeForce RTX 4080 SG
399.9 fps +2%
Zotac RTX 4080 Super Trinity Black Edition
394.4 fps +1%
XFX Radeon RX 7900 XTX Merc 310 Black Edition
390.2 fps
KFA2 GeForce RTX 4080 Super SG
386.2 fps -1%
AMD Radeon RX 7900 XTX
357.6 fps -8%
AMD Radeon RX 7900 XT
319.7 fps -18%
MSI Radeon RX 6950 XT Gaming X Trio
317.8 fps -19%
KFA2 GeForce RTX 4070 Ti EX Gamer
312.1 fps -20%
Asus TUF Gaming GeForce RTX 4070 Ti Super
311.9 (47.1min - 651.4max) fps -20%
AMD Radeon RX 7900 GRE
270.8 fps -31%
KFA2 GeForce RTX 4070 EX Gamer
257.6 fps -34%
AMD Radeon RX 7800 XT
242.7 fps -38%
Sapphire Pulse Radeon RX 7700 XT
211.7 fps -46%
KFA2 GeForce RTX 4060 Ti EX, 16GB GDDR6
174.8 fps -55%
KFA2 GeForce RTX 4060 1-Click-OC 2X
153.7 fps -61%
XFX Speedster QICK 308 Radeon RX 7600 Black Edition
148.1 fps -62%
Extreme Preset OpenGL
Palit GeForce RTX 4090 GameRock OC
465.1 fps +11%
XFX Radeon RX 7900 XTX Merc 310 Black Edition
419.2 fps
Zotac RTX 4080 Super Trinity Black Edition
386.3 fps -8%
KFA2 GeForce RTX 4080 Super SG
381.9 fps -9%
KFA2 GeForce RTX 4080 SG
371.1 fps -11%
AMD Radeon RX 7900 XTX
370.2 fps -12%
AMD Radeon RX 7900 XT
330.2 fps -21%
Asus TUF Gaming GeForce RTX 4070 Ti Super
310.3 (14.5min - 698.3max) fps -26%
KFA2 GeForce RTX 4070 Ti EX Gamer
290.5 fps -31%
AMD Radeon RX 7900 GRE
277.9 fps -34%
AMD Radeon RX 7800 XT
257.9 fps -38%
MSI Radeon RX 6950 XT Gaming X Trio
251.9 fps -40%
KFA2 GeForce RTX 4070 EX Gamer
237.1 fps -43%
Sapphire Pulse Radeon RX 7700 XT
213.2 fps -49%
KFA2 GeForce RTX 4060 Ti EX, 16GB GDDR6
170.3 fps -59%
XFX Speedster QICK 308 Radeon RX 7600 Black Edition
147.2 fps -65%
KFA2 GeForce RTX 4060 1-Click-OC 2X
147 fps -65%
Unigine Valley 1.0
1920x1080 Extreme HD DirectX AA:x8
Palit GeForce RTX 4090 GameRock OC
305.2 fps +4%
XFX Radeon RX 7900 XTX Merc 310 Black Edition
293.3 fps
Zotac RTX 4080 Super Trinity Black Edition
282.3 fps -4%
KFA2 GeForce RTX 4080 Super SG
277.1 fps -6%
AMD Radeon RX 7900 XTX
264.5 fps -10%
KFA2 GeForce RTX 4080 SG
257 fps -12%
AMD Radeon RX 7900 XT
243.3 fps -17%
Asus TUF Gaming GeForce RTX 4070 Ti Super
242.6 (75.4min - 480.6max) fps -17%
MSI Radeon RX 6950 XT Gaming X Trio
239.4 fps -18%
KFA2 GeForce RTX 4070 Ti EX Gamer
217.2 fps -26%
AMD Radeon RX 7900 GRE
217 fps -26%
AMD Radeon RX 7800 XT
191.3 fps -35%
KFA2 GeForce RTX 4070 EX Gamer
190 fps -35%
Sapphire Pulse Radeon RX 7700 XT
160.1 fps -45%
KFA2 GeForce RTX 4060 Ti EX, 16GB GDDR6
127.8 fps -56%
KFA2 GeForce RTX 4060 1-Click-OC 2X
115.3 fps -61%
XFX Speedster QICK 308 Radeon RX 7600 Black Edition
107.5 fps -63%
1920x1080 Extreme HD Preset OpenGL AA:x8
Palit GeForce RTX 4090 GameRock OC
322.2 fps +5%
XFX Radeon RX 7900 XTX Merc 310 Black Edition
306.8 fps
Zotac RTX 4080 Super Trinity Black Edition
273.7 fps -11%
KFA2 GeForce RTX 4080 Super SG
271.3 fps -12%
AMD Radeon RX 7900 XTX
254.2 fps -17%
Asus TUF Gaming GeForce RTX 4070 Ti Super
232.1 (62.3min - 435.4max) fps -24%
KFA2 GeForce RTX 4080 SG
231.8 fps -24%
AMD Radeon RX 7900 XT
225.9 fps -26%
KFA2 GeForce RTX 4070 Ti EX Gamer
197.6 fps -36%
AMD Radeon RX 7900 GRE
191.7 fps -38%
MSI Radeon RX 6950 XT Gaming X Trio
186.5 fps -39%
AMD Radeon RX 7800 XT
182 fps -41%
KFA2 GeForce RTX 4070 EX Gamer
169 fps -45%
Sapphire Pulse Radeon RX 7700 XT
143 fps -53%
KFA2 GeForce RTX 4060 Ti EX, 16GB GDDR6
114.9 fps -63%
KFA2 GeForce RTX 4060 1-Click-OC 2X
104.5 fps -66%
XFX Speedster QICK 308 Radeon RX 7600 Black Edition
94.8 fps -69%
3DMark 11
1280x720 Performance GPU
Palit GeForce RTX 4090 GameRock OC
104998 Points +22%
KFA2 GeForce RTX 4080 SG
88359 Points +2%
Zotac RTX 4080 Super Trinity Black Edition
87776 Points +2%
KFA2 GeForce RTX 4080 Super SG
87055 Points +1%
XFX Radeon RX 7900 XTX Merc 310 Black Edition
86262 Points
AMD Radeon RX 7900 XTX
83322 Points -3%
AMD Radeon RX 7900 XT
77784 Points -10%
Asus TUF Gaming GeForce RTX 4070 Ti Super
74834 Points -13%
KFA2 GeForce RTX 4070 Ti EX Gamer
74228 Points -14%
MSI Radeon RX 6950 XT Gaming X Trio
73975 Points -14%
AMD Radeon RX 7900 GRE
68260 Points -21%
AMD Radeon RX 7800 XT
63292 Points -27%
KFA2 GeForce RTX 4070 EX Gamer
60428 Points -30%
Sapphire Pulse Radeon RX 7700 XT
57340 Points -34%
XFX Speedster QICK 308 Radeon RX 7600 Black Edition
43430 Points -50%
KFA2 GeForce RTX 4060 Ti EX, 16GB GDDR6
43112 Points -50%
KFA2 GeForce RTX 4060 1-Click-OC 2X
38191 Points -56%
1280x720 Performance
Palit GeForce RTX 4090 GameRock OC
66197 Points +17%
KFA2 GeForce RTX 4080 SG
62760 Points +11%
Zotac RTX 4080 Super Trinity Black Edition
60267 Points +7%
KFA2 GeForce RTX 4080 Super SG
59568 Points +5%
AMD Radeon RX 7900 XTX
56526 Points 0%
XFX Radeon RX 7900 XTX Merc 310 Black Edition
56505 Points
AMD Radeon RX 7900 XT
54796 Points -3%
Asus TUF Gaming GeForce RTX 4070 Ti Super
54278 Points -4%
KFA2 GeForce RTX 4070 Ti EX Gamer
53915 Points -5%
MSI Radeon RX 6950 XT Gaming X Trio
52806 Points -7%
AMD Radeon RX 7900 GRE
51189 Points -9%
KFA2 GeForce RTX 4070 EX Gamer
50253 Points -11%
AMD Radeon RX 7800 XT
47729 Points -16%
Sapphire Pulse Radeon RX 7700 XT
45241 Points -20%
KFA2 GeForce RTX 4060 Ti EX, 16GB GDDR6
38780 Points -31%
XFX Speedster QICK 308 Radeon RX 7600 Black Edition
38744 Points -31%
KFA2 GeForce RTX 4060 1-Click-OC 2X
36813 Points -35%
Premiere Pro PugetBench - GPU 0.9
Palit GeForce RTX 4090 GameRock OC
100.2 Points +34%
KFA2 GeForce RTX 4080 Super SG
86.9 Points +16%
Zotac RTX 4080 Super Trinity Black Edition
86.3 Points +16%
KFA2 GeForce RTX 4070 Ti EX Gamer
75.6 Points +1%
XFX Radeon RX 7900 XTX Merc 310 Black Edition
74.6 Points
KFA2 GeForce RTX 4070 EX Gamer
72.9 Points -2%
AMD Radeon RX 7900 XTX
71.1 Points -5%
AMD Radeon RX 7900 GRE
67.5 Points -10%
AMD Radeon RX 7900 XT
67 Points -10%
MSI Radeon RX 6950 XT Gaming X Trio
66.1 Points -11%
AMD Radeon RX 7800 XT
63.4 Points -15%
Sapphire Pulse Radeon RX 7700 XT
60.2 Points -19%
KFA2 GeForce RTX 4060 1-Click-OC 2X
46.4 Points -38%
XFX Speedster QICK 308 Radeon RX 7600 Black Edition
45.6 Points -39%
Photoshop PugetBench - GPU Score
AMD Radeon RX 7900 XT
169.5 Points +9%
AMD Radeon RX 7900 XTX
169.3 Points +8%
MSI Radeon RX 6950 XT Gaming X Trio
169 Points +8%
AMD Radeon RX 7900 GRE
165.8 Points +6%
Sapphire Pulse Radeon RX 7700 XT
164.3 Points +5%
AMD Radeon RX 7800 XT
162.2 Points +4%
XFX Radeon RX 7900 XTX Merc 310 Black Edition
156.1 Points
XFX Speedster QICK 308 Radeon RX 7600 Black Edition
155.8 Points 0%
Palit GeForce RTX 4090 GameRock OC
155.7 Points 0%
Zotac RTX 4080 Super Trinity Black Edition
130.9 Points -16%
KFA2 GeForce RTX 4080 Super SG
123 Points -21%
KFA2 GeForce RTX 4070 EX Gamer
122.1 Points -22%
KFA2 GeForce RTX 4060 1-Click-OC 2X
121 Points -22%
KFA2 GeForce RTX 4070 Ti EX Gamer
114.9 Points -26%
KFA2 GeForce RTX 4060 Ti EX, 16GB GDDR6
113.5 Points -27%
ComputeMark v2.1
1024x600 Normal, QJuliaRayTrace
Palit GeForce RTX 4090 GameRock OC
34332 Points +79%
Zotac RTX 4080 Super Trinity Black Edition
26177 Points +37%
KFA2 GeForce RTX 4080 Super SG
25693 Points +34%
Asus TUF Gaming GeForce RTX 4070 Ti Super
21382 Points +12%
KFA2 GeForce RTX 4070 Ti EX Gamer
21107 Points +10%
XFX Radeon RX 7900 XTX Merc 310 Black Edition
19141 Points
AMD Radeon RX 7900 XTX
17915 Points -6%
KFA2 GeForce RTX 4070 EX Gamer
17521 Points -8%
AMD Radeon RX 7900 XT
16990 Points -11%
AMD Radeon RX 7900 GRE
15546 Points -19%
KFA2 GeForce RTX 4060 Ti EX, 16GB GDDR6
13856 Points -28%
MSI Radeon RX 6950 XT Gaming X Trio
13672 Points -29%
AMD Radeon RX 7800 XT
13454 Points -30%
Sapphire Pulse Radeon RX 7700 XT
12925 Points -32%
KFA2 GeForce RTX 4060 1-Click-OC 2X
9916 Points -48%
XFX Speedster QICK 308 Radeon RX 7600 Black Edition
8897 Points -54%
1024x600 Normal, Score
Palit GeForce RTX 4090 GameRock OC
92171 Points +43%
Zotac RTX 4080 Super Trinity Black Edition
67215 Points +5%
KFA2 GeForce RTX 4080 Super SG
65378 Points +2%
XFX Radeon RX 7900 XTX Merc 310 Black Edition
64304 Points
AMD Radeon RX 7900 XTX
62963 Points -2%
AMD Radeon RX 7900 XT
57570 Points -10%
Asus TUF Gaming GeForce RTX 4070 Ti Super
54675 Points -15%
KFA2 GeForce RTX 4070 Ti EX Gamer
51287 Points -20%
AMD Radeon RX 7900 GRE
47257 Points -27%
MSI Radeon RX 6950 XT Gaming X Trio
45552 Points -29%
AMD Radeon RX 7800 XT
43852 Points -32%
KFA2 GeForce RTX 4070 EX Gamer
43049 Points -33%
Sapphire Pulse Radeon RX 7700 XT
38363 Points -40%
KFA2 GeForce RTX 4060 Ti EX, 16GB GDDR6
32285 Points -50%
XFX Speedster QICK 308 Radeon RX 7600 Black Edition
25119 Points -61%
KFA2 GeForce RTX 4060 1-Click-OC 2X
23841 Points -63%
1024x600 Normal, Fluid 3DTex
Palit GeForce RTX 4090 GameRock OC
10724 Points +18%
XFX Radeon RX 7900 XTX Merc 310 Black Edition
9123 Points
AMD Radeon RX 7900 XTX
8537 Points -6%
AMD Radeon RX 7900 XT
7109 Points -22%
KFA2 GeForce RTX 4080 Super SG
6807 Points -25%
Zotac RTX 4080 Super Trinity Black Edition
6780 Points -26%
MSI Radeon RX 6950 XT Gaming X Trio
5577 Points -39%
Asus TUF Gaming GeForce RTX 4070 Ti Super
4935 Points -46%
AMD Radeon RX 7900 GRE
4804 Points -47%
AMD Radeon RX 7800 XT
4736 Points -48%
KFA2 GeForce RTX 4070 Ti EX Gamer
3789 Points -58%
KFA2 GeForce RTX 4070 EX Gamer
3541 Points -61%
Sapphire Pulse Radeon RX 7700 XT
2603 Points -71%
KFA2 GeForce RTX 4060 Ti EX, 16GB GDDR6
2085 Points -77%
KFA2 GeForce RTX 4060 1-Click-OC 2X
1943 Points -79%
XFX Speedster QICK 308 Radeon RX 7600 Black Edition
1835 Points -80%
1024x600 Normal, Fluid 2DTexArr
XFX Radeon RX 7900 XTX Merc 310 Black Edition
7993 Points
AMD Radeon RX 7900 XTX
7315 Points -8%
Palit GeForce RTX 4090 GameRock OC
6891 Points -14%
AMD Radeon RX 7900 XT
6460 Points -19%
Zotac RTX 4080 Super Trinity Black Edition
5674 Points -29%
KFA2 GeForce RTX 4080 Super SG
5651 Points -29%
Asus TUF Gaming GeForce RTX 4070 Ti Super
4876 Points -39%
AMD Radeon RX 7900 GRE
4779 Points -40%
AMD Radeon RX 7800 XT
4489 Points -44%
MSI Radeon RX 6950 XT Gaming X Trio
4349 Points -46%
KFA2 GeForce RTX 4070 Ti EX Gamer
3724 Points -53%
KFA2 GeForce RTX 4070 EX Gamer
3494 Points -56%
Sapphire Pulse Radeon RX 7700 XT
2666 Points -67%
KFA2 GeForce RTX 4060 Ti EX, 16GB GDDR6
2039 Points -74%
KFA2 GeForce RTX 4060 1-Click-OC 2X
1912 Points -76%
XFX Speedster QICK 308 Radeon RX 7600 Black Edition
1878 Points -77%
1024x600 Normal, Mandel Vector
Palit GeForce RTX 4090 GameRock OC
17336 Points +37%
AMD Radeon RX 7900 XTX
13737 Points +9%
AMD Radeon RX 7900 XT
13022 Points +3%
Zotac RTX 4080 Super Trinity Black Edition
12779 Points +1%
XFX Radeon RX 7900 XTX Merc 310 Black Edition
12625 Points
KFA2 GeForce RTX 4080 Super SG
11618 Points -8%
Asus TUF Gaming GeForce RTX 4070 Ti Super
10883 Points -14%
KFA2 GeForce RTX 4070 Ti EX Gamer
10541 Points -17%
AMD Radeon RX 7800 XT
9963 Points -21%
MSI Radeon RX 6950 XT Gaming X Trio
9933 Points -21%
AMD Radeon RX 7900 GRE
9581 Points -24%
Sapphire Pulse Radeon RX 7700 XT
9568 Points -24%
KFA2 GeForce RTX 4070 EX Gamer
8636 Points -32%
KFA2 GeForce RTX 4060 Ti EX, 16GB GDDR6
6852 Points -46%
XFX Speedster QICK 308 Radeon RX 7600 Black Edition
5764 Points -54%
KFA2 GeForce RTX 4060 1-Click-OC 2X
4916 Points -61%
1024x600 Normal, Mandel Scalar
Palit GeForce RTX 4090 GameRock OC
22889 Points +48%
Zotac RTX 4080 Super Trinity Black Edition
15806 Points +2%
KFA2 GeForce RTX 4080 Super SG
15609 Points +1%
AMD Radeon RX 7900 XTX
15458 Points 0%
XFX Radeon RX 7900 XTX Merc 310 Black Edition
15422 Points
AMD Radeon RX 7900 XT
13989 Points -9%
Asus TUF Gaming GeForce RTX 4070 Ti Super
12599 Points -18%
AMD Radeon RX 7900 GRE
12547 Points -19%
KFA2 GeForce RTX 4070 Ti EX Gamer
12126 Points -21%
MSI Radeon RX 6950 XT Gaming X Trio
12020 Points -22%
AMD Radeon RX 7800 XT
11209 Points -27%
Sapphire Pulse Radeon RX 7700 XT
10601 Points -31%
KFA2 GeForce RTX 4070 EX Gamer
9857 Points -36%
KFA2 GeForce RTX 4060 Ti EX, 16GB GDDR6
7454 Points -52%
XFX Speedster QICK 308 Radeon RX 7600 Black Edition
6746 Points -56%
KFA2 GeForce RTX 4060 1-Click-OC 2X
5153 Points -67%
LuxMark v2.0 64Bit
Room GPUs-only
Palit GeForce RTX 4090 GameRock OC
12316 Samples/s +172%
Zotac RTX 4080 Super Trinity Black Edition
10136 Samples/s +124%
KFA2 GeForce RTX 4080 Super SG
10075 Samples/s +122%
Asus TUF Gaming GeForce RTX 4070 Ti Super
9355 Samples/s +106%
KFA2 GeForce RTX 4070 Ti EX Gamer
7625 Samples/s +68%
KFA2 GeForce RTX 4070 EX Gamer
6950 Samples/s +53%
AMD Radeon RX 7900 XTX
5161 Samples/s +14%
KFA2 GeForce RTX 4060 Ti EX, 16GB GDDR6
4570 Samples/s +1%
XFX Radeon RX 7900 XTX Merc 310 Black Edition
4534 Samples/s
AMD Radeon RX 7900 XT
4451 Samples/s -2%
MSI Radeon RX 6950 XT Gaming X Trio
4173 Samples/s -8%
KFA2 GeForce RTX 4060 1-Click-OC 2X
4063 Samples/s -10%
AMD Radeon RX 7900 GRE
3784 Samples/s -17%
AMD Radeon RX 7800 XT
3446 Samples/s -24%
Sapphire Pulse Radeon RX 7700 XT
3258 Samples/s -28%
XFX Speedster QICK 308 Radeon RX 7600 Black Edition
2227 Samples/s -51%
Sala GPUs-only
Palit GeForce RTX 4090 GameRock OC
27201 Samples/s +95%
Zotac RTX 4080 Super Trinity Black Edition
23374 Samples/s +68%
KFA2 GeForce RTX 4080 Super SG
22634 Samples/s +62%
Asus TUF Gaming GeForce RTX 4070 Ti Super
19620 Samples/s +41%
KFA2 GeForce RTX 4070 Ti EX Gamer
17719 Samples/s +27%
AMD Radeon RX 7900 XTX
15019 Samples/s +8%
KFA2 GeForce RTX 4070 EX Gamer
14493 Samples/s +4%
XFX Radeon RX 7900 XTX Merc 310 Black Edition
13953 Samples/s
AMD Radeon RX 7900 XT
13489 Samples/s -3%
MSI Radeon RX 6950 XT Gaming X Trio
12057 Samples/s -14%
AMD Radeon RX 7900 GRE
11265 Samples/s -19%
KFA2 GeForce RTX 4060 Ti EX, 16GB GDDR6
11226 Samples/s -20%
AMD Radeon RX 7800 XT
10158 Samples/s -27%
KFA2 GeForce RTX 4060 1-Click-OC 2X
8991 Samples/s -36%
Sapphire Pulse Radeon RX 7700 XT
8614 Samples/s -38%
XFX Speedster QICK 308 Radeon RX 7600 Black Edition
5583 Samples/s -60%
Affinity Photo 2 - Combined (Single / Multi GPU)
KFA2 GeForce RTX 4070 EX Gamer
8704 Points +6%
KFA2 GeForce RTX 4080 Super SG
8557 Points +4%
KFA2 GeForce RTX 4070 Ti EX Gamer
8516 Points +3%
Palit GeForce RTX 4090 GameRock OC
8448 Points +3%
Zotac RTX 4080 Super Trinity Black Edition
8399 Points +2%
AMD Radeon RX 7800 XT
8274 Points +1%
XFX Radeon RX 7900 XTX Merc 310 Black Edition
8232 Points
AMD Radeon RX 7900 GRE
7671 Points -7%
Sapphire Pulse Radeon RX 7700 XT
7462 Points -9%
KFA2 GeForce RTX 4060 1-Click-OC 2X
6882 Points -16%
KFA2 GeForce RTX 4060 Ti EX, 16GB GDDR6
6314 Points -23%
XFX Speedster QICK 308 Radeon RX 7600 Black Edition
6273 Points -24%
MSI Radeon RX 6950 XT Gaming X Trio
2759 Points -66%
AMD Radeon RX 7900 XTX
2656 Points -68%
AMD Radeon RX 7900 XT
2627 Points -68%
3DMark 05 Standard
81077 points
3DMark 06 Standard Score
70898 points
3DMark Vantage P Result
150207 points
3DMark 11 Performance
56505 points
3DMark Ice Storm Standard Score
280306 points
3DMark Cloud Gate Standard Score
80201 points
3DMark Fire Strike Score
45912 points
3DMark Fire Strike Extreme Score
36218 points
3DMark Time Spy Score
30033 points
Help

Professional Applications

We already saw that the AMD graphics cards are also very well suited for professional applications when the new graphics card was introduced. AMD continues to be able to deliver a better performance here than the competitors from Nvidia. In our comparison, the XFX Speedster MERC 310 Radeon RX 7900 XTX Black Edition is even able to place ahead of the Palit GeForce RTX 4090 GameRock OC. But you also have to understand that both AMD and Nvidia offer some special graphics cards in their portfolio that have been optimized exactly for those applications. With their specific driver adjustments, they even allow for significantly better results. In addition, the consumer graphics cards from AMD don't use ECC VRAM, while it is used in the AMD Radeon Pro models.

AMD Radeon RX 7900 XTX
i9-14900K
NVIDIA GeForce RTX 4090
i9-14900K
NVIDIA GeForce RTX 4080
R9 7950X
NVIDIA GeForce RTX 4070 Ti
R9 7950X
NVIDIA GeForce RTX 4070
R9 7950X
NVIDIA GeForce RTX 4060 Ti 16G
R9 7950X
NVIDIA GeForce RTX 4060
R9 7950X
AMD Radeon RX 7900 XTX
R9 7950X
AMD Radeon RX 7900 XT
R9 7950X
AMD Radeon RX 7900 GRE
R9 7950X
AMD Radeon RX 6950 XT
R9 7950X
AMD Radeon RX 7800 XT
R9 7950X
AMD Radeon RX 7700 XT
R9 7950X
AMD Radeon RX 7600
R9 7950X
NVIDIA RTX 6000 Ada Generation
TR Pro 7995WX
Average of class
 
SPECviewperf 12
-18%
-34%
-43%
-51%
-61%
-67%
-3%
-13%
-26%
-39%
-29%
-39%
-52%
-11%
-75%
1900x1060 3ds Max (3dsmax-05)
491
565
15%
502
2%
436
-11%
382
-22%
290
-41%
251
-49%
553
13%
502
2%
444
-10%
418
-15%
427
-13%
373
-24%
279
-43%
473
-4%
192.2 ?(11 - 571, n=357)
-61%
1900x1060 Catia (catia-04)
605
291
-52%
221
-63%
192
-68%
161
-73%
128
-79%
113
-81%
536
-11%
481
-20%
448
-26%
368
-39%
386
-36%
351
-42%
273
-55%
349
-42%
102.3 ?(4.56 - 605, n=571)
-83%
1900x1060 Creo (creo-01)
201
127
-37%
110
-45%
99.4
-51%
89.1
-56%
73.4
-63%
60.6
-70%
187
-7%
176
-12%
155
-23%
163
-19%
148
-26%
123
-39%
115
-43%
250
24%
62.9 ?(0.91 - 250, n=574)
-69%
1900x1060 Energy (energy-01)
93.6
84.7
-10%
58.8
-37%
48
-49%
31.7
-66%
22.6
-76%
15.9
-83%
85.2
-9%
72.4
-23%
40.3
-57%
34.3
-63%
38.4
-59%
33.4
-64%
25.5
-73%
58.2
-38%
14.6 ?(0.04 - 112, n=556)
-84%
1900x1060 Maya (maya-04)
320
340
6%
309
-3%
287
-10%
284
-11%
257
-20%
233
-27%
367
15%
347
8%
323
1%
195
-39%
304
-5%
283
-12%
236
-26%
266
-17%
105.4 ?(2.09 - 367, n=573)
-67%
1900x1060 Medical (medical-01)
392
303
-23%
171
-56%
157
-60%
132
-66%
110
-72%
82.4
-79%
347
-11%
288
-27%
226
-42%
95.2
-76%
200
-49%
177
-55%
128
-67%
282
-28%
51.2 ?(0.58 - 392, n=560)
-87%
1900x1060 Showcase (showcase-01)
318
398
25%
333
5%
244
-23%
190
-40%
132
-58%
109
-66%
322
1%
278
-13%
222
-30%
264
-17%
235
-26%
179
-44%
127
-60%
429
35%
93.9 ?(2.63 - 459, n=562)
-70%
1900x1060 Solidworks (sw-03)
403
139
-66%
113
-72%
118
-71%
109
-73%
95.1
-76%
91.2
-77%
360
-11%
342
-15%
319
-21%
218
-46%
322
-20%
288
-29%
221
-45%
319
-21%
83.5 ?(0.97 - 403, n=574)
-79%
SPECviewperf 13
-21%
-35%
-45%
-54%
-64%
-70%
-11%
-21%
-26%
-38%
-29%
-39%
-55%
-12%
-73%
3ds Max (3dsmax-06)
482
567
18%
497
3%
433
-10%
381
-21%
289
-40%
252
-48%
564
17%
506
5%
439
-9%
416
-14%
434
-10%
371
-23%
280
-42%
496.95
3%
183.9 ?(10.8 - 575, n=455)
-62%
Catia (catia-05)
900
428
-52%
340
-62%
290
-68%
241
-73%
189
-79%
163
-82%
825
-8%
728
-19%
661
-27%
588
-35%
588
-35%
529
-41%
410
-54%
578.86
-36%
196.9 ?(15.6 - 900, n=454)
-78%
Creo (creo-02)
684
618
-10%
529
-23%
455
-33%
375
-45%
301
-56%
230
-66%
613
-10%
567
-17%
470
-31%
374
-45%
442
-35%
387
-43%
294
-57%
590.13
-14%
199.9 ?(1.68 - 684, n=454)
-71%
Energy (energy-02)
229
127
-45%
92.6
-60%
72.8
-68%
54.2
-76%
45.3
-80%
34.6
-85%
187
-18%
147
-36%
150
-34%
60.8
-73%
139
-39%
115
-50%
82.9
-64%
230.06
0%
Maya (maya-05)
864
881
2%
678
-22%
591
-32%
510
-41%
403
-53%
343
-60%
735
-15%
670
-22%
580
-33%
460
-47%
548
-37%
487
-44%
333
-61%
637.3
-26%
Medical (medical-02)
479
180
-62%
150
-69%
132
-72%
112
-77%
85.1
-82%
76.5
-84%
263
-45%
237
-51%
372
-22%
332
-31%
300
-37%
226
-53%
331.9
-31%
74.5 ?(1.96 - 479, n=448)
-84%
Showcase (showcase-02)
318
400
26%
334
5%
244
-23%
191
-40%
133
-58%
108
-66%
323
2%
279
-12%
221
-31%
264
-17%
234
-26%
179
-44%
127
-60%
430.2
35%
117.8 ?(4.99 - 459, n=446)
-63%
Solidworks (sw-04)
373
199
-47%
179
-52%
168
-55%
157
-58%
135
-64%
127
-66%
323
-13%
307
-18%
287
-23%
254
-32%
294
-21%
265
-29%
195
-48%
278
-25%
118.5 ?(3.69 - 373, n=457)
-68%
SPECviewperf 2020
-16%
-43%
-52%
-59%
-69%
-74%
-22%
-33%
-28%
-55%
-35%
-44%
-60%
21%
-69%
3840x2160 Medical (medical-03)
105
40.3
-62%
32.2
-69%
26.9
-74%
22.2
-79%
16.5
-84%
13.7
-87%
62.3
-41%
53.9
-49%
76.1
-28%
35
-67%
63.7
-39%
56.2
-46%
36.1
-66%
79
-25%
19.8 ?(0.78 - 105, n=249)
-81%
3840x2160 Energy (energy-03)
192
230
20%
90.4
-53%
75.7
-61%
57.6
-70%
44.9
-77%
33.2
-83%
129
-33%
99.6
-48%
133
-31%
69.3
-64%
111
-42%
95
-51%
67
-65%
457
138%
47.9 ?(0.41 - 457, n=249)
-75%
3840x2160 Creo (creo-03)
211
148
-30%
128
-39%
121
-43%
112
-47%
95.9
-55%
85.9
-59%
187
-11%
173
-18%
159
-25%
92.4
-56%
151
-28%
130
-38%
106
-50%
191
-9%
77.4 ?(8.75 - 211, n=248)
-63%
3840x2160 CATIA (catia-06)
153
97.1
-37%
75.5
-51%
61.2
-60%
51.6
-66%
38.5
-75%
34
-78%
127
-17%
113
-26%
107
-30%
59.7
-61%
101
-34%
88.8
-42%
68
-56%
139
-9%
46.6 ?(2.11 - 153, n=247)
-70%
3840x2160 3ds Max (3dsmax-07)
186
236
27%
179
-4%
147
-21%
122
-34%
88.8
-52%
67.4
-64%
167
-10%
143
-23%
134
-28%
140
-25%
125
-33%
106
-43%
72.9
-61%
207
11%
79.8 ?(3.24 - 240, n=249)
-57%
Total Average (Program / Settings)
-18% / -19%
-37% / -36%
-47% / -46%
-55% / -54%
-65% / -64%
-70% / -70%
-12% / -11%
-22% / -21%
-27% / -27%
-44% / -43%
-31% / -31%
-41% / -40%
-56% / -55%
-1% / -4%
-72% / -73%

Gaming Performance

In most of the gaming tests, we see a duel between our XFX Speedster MERC 310 Radeon RX 7900 XTX Black Edition and the two Nvidia GeForce RTX 4080 Super models. At this point, we are unable to declare a clear winner, and most of the times, the models are only separated by a few percentage points. 

In our overview of the tested games, we see that AMD's flagship is able to display most games smoothly in 2160p resolution at maximum details. Only few games are able to push the average framerates below 60. The same is the case with the KFA2 GeForce RTX 4080 Super SG. The largest advantage of the AMD graphics card is its large amount of VRAM. With 24 GB, the AMD Radeon RX 7900 XTX gets just as much VRAM as the top model from Nvidia. Compared to the Nvidia GeForce RTX 4080 Super, AMD has an advantage in this regard. In addition, there are a few games that reach a VRAM utilization of more than 12 GB. For that reason, we consider the XFX Speedster MERC 310 Radeon RX 7900 XTX Black Edition a graphics card for 4K gaming. Even after one year on the market, the AMD Radeon RX 7900 XTX basically still delivers sufficient performance to handle even current games.

The Witcher 3 - 3840x2160 High Graphics & Postprocessing (Nvidia HairWorks Off)
Palit GeForce RTX 4090 GameRock OC
293 (121.6min, 193.2P0.1, 243P1) fps +47%
Zotac RTX 4080 Super Trinity Black Edition
207 (105.5min, 148.2P0.1, 176.3P1) fps +4%
KFA2 GeForce RTX 4080 Super SG
204 (112.9min, 147.5P0.1, 173.3P1) fps +2%
KFA2 GeForce RTX 4080 SG
202 (77.2min, 112.7P0.1, 171.7P1) fps +1%
XFX Radeon RX 7900 XTX Merc 310 Black Edition
199.7 (122min, 127.2P0.1, 175.1P1) fps
AMD Radeon RX 7900 XTX
163.8 (49.6min, 112P0.1, 134.1P1) fps -18%
AMD Radeon RX 7900 XT
158.5 (83.2min, 111.2P0.1, 122.8P1) fps -21%
MSI Radeon RX 6950 XT Gaming X Trio
148.3 (41.6min, 103P0.1, 117.2P1) fps -26%
KFA2 GeForce RTX 4070 Ti EX Gamer
143 fps -28%
AMD Radeon RX 7900 GRE
124.7 fps -38%
AMD Radeon RX 7800 XT
112.9 fps -43%
KFA2 GeForce RTX 4070 EX Gamer
112.5 fps -44%
Sapphire Pulse Radeon RX 7700 XT
88.7 (73.3min, 74.7P0.1, 79.4P1) fps -56%
KFA2 GeForce RTX 4060 Ti EX, 16GB GDDR6
78.5 fps -61%
KFA2 GeForce RTX 4060 1-Click-OC 2X
67.5 fps -66%
XFX Speedster QICK 308 Radeon RX 7600 Black Edition
58.7 fps -71%
Metro Exodus
3840x2160 Ultra Quality AF:16x
Palit GeForce RTX 4090 GameRock OC
143.4 (84.04min) fps +28%
XFX Radeon RX 7900 XTX Merc 310 Black Edition
112.4 (73.11min) fps
KFA2 GeForce RTX 4080 Super SG
106 (66.97min) fps -6%
Zotac RTX 4080 Super Trinity Black Edition
105.9 (67.55min) fps -6%
KFA2 GeForce RTX 4080 SG
103.9 (62.73min) fps -8%
AMD Radeon RX 7900 XTX
103.5 (66.43min) fps -8%
AMD Radeon RX 7900 XT
86.9 (56.86min) fps -23%
Asus TUF Gaming GeForce RTX 4070 Ti Super
84.4 (52.73min) fps -25%
KFA2 GeForce RTX 4070 Ti EX Gamer
81.2 fps -28%
MSI Radeon RX 6950 XT Gaming X Trio
79.3 (52.59min) fps -29%
AMD Radeon RX 7900 GRE
71.6 (46.26min) fps -36%
AMD Radeon RX 7800 XT
66.7 (43.89min) fps -41%
KFA2 GeForce RTX 4070 EX Gamer
64.9 (41.66min) fps -42%
Sapphire Pulse Radeon RX 7700 XT
57 (38.42min) fps -49%
KFA2 GeForce RTX 4060 Ti EX, 16GB GDDR6
48.1 (32min) fps -57%
KFA2 GeForce RTX 4060 1-Click-OC 2X
38.3 (25.16min) fps -66%
XFX Speedster QICK 308 Radeon RX 7600 Black Edition
38.1 (25.45min) fps -66%
2560x1440 Ultra Quality AF:16x
Palit GeForce RTX 4090 GameRock OC
194.6 (92.87min) fps +16%
XFX Radeon RX 7900 XTX Merc 310 Black Edition
167.8 (99.03min) fps
Zotac RTX 4080 Super Trinity Black Edition
163.1 (84.63min) fps -3%
KFA2 GeForce RTX 4080 Super SG
161.8 (85.35min) fps -4%
AMD Radeon RX 7900 XTX
154.5 (90.83min) fps -8%
KFA2 GeForce RTX 4080 SG
153.7 (78.14min) fps -8%
AMD Radeon RX 7900 XT
135 (79.57min) fps -20%
Asus TUF Gaming GeForce RTX 4070 Ti Super
130.9 (70.75min) fps -22%
KFA2 GeForce RTX 4070 Ti EX Gamer
126.7 (70.16min) fps -24%
MSI Radeon RX 6950 XT Gaming X Trio
124.6 (75.06min) fps -26%
AMD Radeon RX 7900 GRE
112 (65.69min) fps -33%
KFA2 GeForce RTX 4070 EX Gamer
103.7 (58.34min) fps -38%
AMD Radeon RX 7800 XT
102.6 (62.24min) fps -39%
Sapphire Pulse Radeon RX 7700 XT
89.6 (55.65min) fps -47%
KFA2 GeForce RTX 4060 Ti EX, 16GB GDDR6
78.6 (46.09min) fps -53%
XFX Speedster QICK 308 Radeon RX 7600 Black Edition
64.9 (40.24min) fps -61%
KFA2 GeForce RTX 4060 1-Click-OC 2X
62.9 (36.84min) fps -63%
Far Cry 5
3840x2160 Ultra Preset AA:T
Palit GeForce RTX 4090 GameRock OC
187 (168min) fps +15%
XFX Radeon RX 7900 XTX Merc 310 Black Edition
163 (145min) fps
AMD Radeon RX 7900 XTX
155 (134min) fps -5%
KFA2 GeForce RTX 4080 Super SG
146 (128min) fps -10%
Zotac RTX 4080 Super Trinity Black Edition
145 (123min) fps -11%
KFA2 GeForce RTX 4080 SG
139 (125min) fps -15%
AMD Radeon RX 7900 XT
132 (116min) fps -19%
MSI Radeon RX 6950 XT Gaming X Trio
126 (109min) fps -23%
Asus TUF Gaming GeForce RTX 4070 Ti Super
119 (108min) fps -27%
KFA2 GeForce RTX 4070 Ti EX Gamer
111 (99min) fps -32%
AMD Radeon RX 7900 GRE
108 (95min) fps -34%
AMD Radeon RX 7800 XT
103 (91min) fps -37%
KFA2 GeForce RTX 4070 EX Gamer
93 (83min) fps -43%
Sapphire Pulse Radeon RX 7700 XT
82 (73min) fps -50%
KFA2 GeForce RTX 4060 Ti EX, 16GB GDDR6
65 (56min) fps -60%
XFX Speedster QICK 308 Radeon RX 7600 Black Edition
57 (49min) fps -65%
KFA2 GeForce RTX 4060 1-Click-OC 2X
55 (49min) fps -66%
2560x1440 Ultra Preset AA:T
Zotac RTX 4080 Super Trinity Black Edition
218 (163min) fps +9%
Palit GeForce RTX 4090 GameRock OC
216 (164min) fps +8%
KFA2 GeForce RTX 4080 Super SG
208 (154min) fps +4%
XFX Radeon RX 7900 XTX Merc 310 Black Edition
200 (150min) fps
Asus TUF Gaming GeForce RTX 4070 Ti Super
187 (146min) fps -6%
KFA2 GeForce RTX 4080 SG
185 (133min) fps -7%
KFA2 GeForce RTX 4070 Ti EX Gamer
182 (139min) fps -9%
AMD Radeon RX 7900 XTX
174 (133min) fps -13%
AMD Radeon RX 7900 XT
173 (134min) fps -13%
AMD Radeon RX 7900 GRE
173 (131min) fps -13%
MSI Radeon RX 6950 XT Gaming X Trio
172 (131min) fps -14%
KFA2 GeForce RTX 4070 EX Gamer
171 (138min) fps -14%
AMD Radeon RX 7800 XT
161 (122min) fps -19%
Sapphire Pulse Radeon RX 7700 XT
157 (129min) fps -21%
KFA2 GeForce RTX 4060 Ti EX, 16GB GDDR6
127 (112min) fps -36%
XFX Speedster QICK 308 Radeon RX 7600 Black Edition
115 (100min) fps -42%
KFA2 GeForce RTX 4060 1-Click-OC 2X
110 (98min) fps -45%
Far Cry 6
3840x2160 Ultra Graphics Quality + HD Textures AA:T
Palit GeForce RTX 4090 GameRock OC
141.9 (132min) fps +6%
XFX Radeon RX 7900 XTX Merc 310 Black Edition
134.1 (122min) fps
AMD Radeon RX 7900 XTX
124 (113min) fps -8%
KFA2 GeForce RTX 4080 Super SG
114.3 (103min) fps -15%
Zotac RTX 4080 Super Trinity Black Edition
114.1 (102min) fps -15%
KFA2 GeForce RTX 4080 SG
107 (98min) fps -20%
AMD Radeon RX 7900 XT
104.1 (95min) fps -22%
MSI Radeon RX 6950 XT Gaming X Trio
94.7 (87min) fps -29%
Asus TUF Gaming GeForce RTX 4070 Ti Super
91 (64min) fps -32%
AMD Radeon RX 7900 GRE
88.1 (81min) fps -34%
KFA2 GeForce RTX 4070 Ti EX Gamer
87.8 (79min) fps -35%
AMD Radeon RX 7800 XT
85.5 (78min) fps -36%
KFA2 GeForce RTX 4070 EX Gamer
73.9 (66min) fps -45%
Sapphire Pulse Radeon RX 7700 XT
63.1 (58min) fps -53%
KFA2 GeForce RTX 4060 Ti EX, 16GB GDDR6
53.5 (46min) fps -60%
KFA2 GeForce RTX 4060 1-Click-OC 2X
40.9 (36min) fps -70%
XFX Speedster QICK 308 Radeon RX 7600 Black Edition
25.1 (21min) fps -81%
2560x1440 Ultra Graphics Quality + HD Textures AA:T
XFX Radeon RX 7900 XTX Merc 310 Black Edition
197.6 (153min) fps
Palit GeForce RTX 4090 GameRock OC
195.6 (152min) fps -1%
Zotac RTX 4080 Super Trinity Black Edition
189 (155min) fps -4%
KFA2 GeForce RTX 4080 Super SG
181 (144min) fps -8%
AMD Radeon RX 7900 XTX
176.4 (126min) fps -11%
AMD Radeon RX 7900 XT
167.9 (125min) fps -15%
Asus TUF Gaming GeForce RTX 4070 Ti Super
154 (133min) fps -22%
KFA2 GeForce RTX 4070 Ti EX Gamer
153.4 (128min) fps -22%
AMD Radeon RX 7900 GRE
151.5 (132min) fps -23%
KFA2 GeForce RTX 4080 SG
150.6 (112min) fps -24%
MSI Radeon RX 6950 XT Gaming X Trio
148.8 (110min) fps -25%
AMD Radeon RX 7800 XT
147.3 (129min) fps -25%
KFA2 GeForce RTX 4070 EX Gamer
134.1 (123min) fps -32%
Sapphire Pulse Radeon RX 7700 XT
121.9 (109min) fps -38%
KFA2 GeForce RTX 4060 Ti EX, 16GB GDDR6
98.9 (89min) fps -50%
KFA2 GeForce RTX 4060 1-Click-OC 2X
85.4 (71min) fps -57%
XFX Speedster QICK 308 Radeon RX 7600 Black Edition
82.7 (67min) fps -58%
F1 2021
3840x2160 Ultra High Preset + Raytracing AA:T AF:16x
Palit GeForce RTX 4090 GameRock OC (874931)
203 (173min, 165P1) fps +41%
KFA2 GeForce RTX 4080 Super SG (874931)
147.1 (127min, 123P1) fps +2%
Zotac RTX 4080 Super Trinity Black Edition (874931)
146.7 (128min, 125P1) fps +2%
KFA2 GeForce RTX 4080 SG (874931)
144.3 (123min, 122P1) fps 0%
XFX Radeon RX 7900 XTX Merc 310 Black Edition (874931)
143.9 (123min, 121P1) fps
AMD Radeon RX 7900 XTX (874931)
133.6 (114min, 113P1) fps -7%
KFA2 GeForce RTX 4070 Ti EX Gamer (874931)
113.4 (98min, 97P1) fps -21%
AMD Radeon RX 7900 XT (874931)
112.3 (95min, 95P1) fps -22%
MSI Radeon RX 6950 XT Gaming X Trio (874931)
102.1 (86min, 86P1) fps -29%
AMD Radeon RX 7900 GRE (874931)
93.8 (81min, 80P1) fps -35%
KFA2 GeForce RTX 4070 EX Gamer (874931)
91 (78min, 78P1) fps -37%
AMD Radeon RX 7800 XT (874931)
90.2 (78min, 77P1) fps -37%
Sapphire Pulse Radeon RX 7700 XT (874931)
72.6 (62min, 62P1) fps -50%
KFA2 GeForce RTX 4060 Ti EX, 16GB GDDR6 (874931)
66.3 (56min, 56P1) fps -54%
XFX Speedster QICK 308 Radeon RX 7600 Black Edition (874931)
27.3 (19min, 19P1) fps -81%
2560x1440 Ultra High Preset + Raytracing AA:T AF:16x
Palit GeForce RTX 4090 GameRock OC (874931)
291 (246min, 214P1) fps +22%
Zotac RTX 4080 Super Trinity Black Edition (874931)
253 (214min, 205P1) fps +6%
KFA2 GeForce RTX 4080 Super SG (874931)
253 (212min, 205P1) fps +6%
KFA2 GeForce RTX 4080 SG (874931)
240 (202min, 180P1) fps +1%
XFX Radeon RX 7900 XTX Merc 310 Black Edition (874931)
238 (199min, 190P1) fps
AMD Radeon RX 7900 XTX (874931)
220 (183min, 170P1) fps -8%
KFA2 GeForce RTX 4070 Ti EX Gamer (874931)
199.8 (168min, 166P1) fps -16%
AMD Radeon RX 7900 XT (874931)
192.8 (158min, 160P1) fps -19%
MSI Radeon RX 6950 XT Gaming X Trio (874931)
179.7 (152min, 150P1) fps -24%
KFA2 GeForce RTX 4070 EX Gamer (874931)
163.6 (138min, 138P1) fps -31%
AMD Radeon RX 7900 GRE (874931)
161.2 (137min, 136P1) fps -32%
AMD Radeon RX 7800 XT (874931)
155.9 (135min, 133P1) fps -34%
Sapphire Pulse Radeon RX 7700 XT (874931)
129.5 (111min, 110P1) fps -46%
KFA2 GeForce RTX 4060 Ti EX, 16GB GDDR6 (874931)
126.7 (108min, 107P1) fps -47%
XFX Speedster QICK 308 Radeon RX 7600 Black Edition (874931)
88.7 (75min, 75P1) fps -63%
F1 22
3840x2160 Ultra High Preset AA:T AF:16x
Palit GeForce RTX 4090 GameRock OC (959964)
83.4 (72min, 71P1) fps +43%
KFA2 GeForce RTX 4080 Super SG (959964)
59.8 (51min, 50P1) fps +3%
Zotac RTX 4080 Super Trinity Black Edition (959964)
59.6 (51min, 49P1) fps +2%
XFX Radeon RX 7900 XTX Merc 310 Black Edition (959964)
58.2 (38min, 39P1) fps
KFA2 GeForce RTX 4080 SG (939134)
57.9 (50min, 49P1) fps -1%
AMD Radeon RX 7900 XTX (939134)
52.4 (37min, 38P1) fps -10%
Asus TUF Gaming GeForce RTX 4070 Ti Super (959964)
48.9 (42min, 40P1) fps -16%
KFA2 GeForce RTX 4070 Ti EX Gamer (959964)
46.9 (40min, 40P1) fps -19%
AMD Radeon RX 7900 XT (939134)
44.9 (32min, 32P1) fps -23%
AMD Radeon RX 7900 GRE (959964)
38.7 (26min, 27P1) fps -34%
KFA2 GeForce RTX 4070 EX Gamer (959964)
36.6 (31min, 30P1) fps -37%
MSI Radeon RX 6950 XT Gaming X Trio (939134)
36.5 (27min, 27P1) fps -37%
AMD Radeon RX 7800 XT (959964)
34.7 (22min, 23P1) fps -40%
Sapphire Pulse Radeon RX 7700 XT (959964)
29.8 (20min, 20P1) fps -49%
KFA2 GeForce RTX 4060 Ti EX, 16GB GDDR6 (959964)
27.7 (23min, 23P1) fps -52%
KFA2 GeForce RTX 4060 1-Click-OC 2X (959964)
20.7 (17min, 17P1) fps -64%
XFX Speedster QICK 308 Radeon RX 7600 Black Edition (959964)
12.6 (10min, 10P1) fps -78%
2560x1440 Ultra High Preset AA:T AF:16x
Palit GeForce RTX 4090 GameRock OC (959964)
161.1 (140min, 115P1) fps +45%
KFA2 GeForce RTX 4080 Super SG (959964)
120.6 (105min, 98P1) fps +8%
Zotac RTX 4080 Super Trinity Black Edition (959964)
118.1 (102min, 96P1) fps +6%
KFA2 GeForce RTX 4080 SG (939134)
113.8 (99min, 92P1) fps +2%
XFX Radeon RX 7900 XTX Merc 310 Black Edition (959964)
111.2 (78min, 80P1) fps
AMD Radeon RX 7900 XTX (939134)
102.1 (74min, 75P1) fps -8%
Asus TUF Gaming GeForce RTX 4070 Ti Super (959964)
95.1 (82min, 79P1) fps -14%
KFA2 GeForce RTX 4070 Ti EX Gamer (959964)
94.1 (81min, 78P1) fps -15%
AMD Radeon RX 7900 XT (939134)
88.1 (65min, 65P1) fps -21%
AMD Radeon RX 7900 GRE (959964)
76.1 (53min, 55P1) fps -32%
MSI Radeon RX 6950 XT Gaming X Trio (939134)
75.4 (56min, 56P1) fps -32%
KFA2 GeForce RTX 4070 EX Gamer (959964)
73.7 (63min, 62P1) fps -34%
AMD Radeon RX 7800 XT (959964)
69.8 (47min, 48P1) fps -37%
Sapphire Pulse Radeon RX 7700 XT (959964)
59.9 (41min, 42P1) fps -46%
KFA2 GeForce RTX 4060 Ti EX, 16GB GDDR6 (959964)
56.1 (48min, 47P1) fps -50%
KFA2 GeForce RTX 4060 1-Click-OC 2X (959964)
42.8 (36min, 36P1) fps -62%
XFX Speedster QICK 308 Radeon RX 7600 Black Edition (959964)
37.8 (25min, 26P1) fps -66%
A Plague Tale Requiem
3840x2160 Ultra Preset
XFX Radeon RX 7900 XTX Merc 310 Black Edition
65 (51.7min, 53.5P0.1, 57.5P1) fps
AMD Radeon RX 7900 XTX
58.9 (43.6min, 50.2P0.1, 51.8P1) fps -9%
Zotac RTX 4080 Super Trinity Black Edition
58.2 (43.2min, 45.9P0.1, 50.6P1) fps -10%
KFA2 GeForce RTX 4080 Super SG
58.1 (45.3min, 48.7P0.1, 51.8P1) fps -11%
KFA2 GeForce RTX 4080 SG
54.4 (45.1min, 46.4P0.1, 48.4P1) fps -16%
AMD Radeon RX 7900 XT
47.9 (39.5min, 40.9P0.1, 42P1) fps -26%
KFA2 GeForce RTX 4070 Ti EX Gamer
42.7 (35.9min, 36.6P0.1, 37.6P1) fps -34%
MSI Radeon RX 6950 XT Gaming X Trio
41.7 (31.3min, 36.5P0.1, 37.6P1) fps -36%
AMD Radeon RX 7900 GRE
39.9 (30.3min, 33.5P0.1, 35.3P1) fps -39%
AMD Radeon RX 7800 XT
37.5 (29.9min, 31.5P0.1, 32.7P1) fps -42%
KFA2 GeForce RTX 4070 EX Gamer
34.6 (28.5min, 29.4P0.1, 31.2P1) fps -47%
Sapphire Pulse Radeon RX 7700 XT
30.3 (23.9min, 26.2P0.1, 27.3P1) fps -53%
KFA2 GeForce RTX 4060 Ti EX, 16GB GDDR6
24.6 (20.1min, 21.2P0.1, 22.2P1) fps -62%
XFX Speedster QICK 308 Radeon RX 7600 Black Edition
20.9 (17.4min, 18.3P0.1, 18.9P1) fps -68%
KFA2 GeForce RTX 4060 1-Click-OC 2X
19.7 (16.6min, 16.9P0.1, 17.4P1) fps -70%
2560x1440 Ultra Preset
XFX Radeon RX 7900 XTX Merc 310 Black Edition
106.5 (79.9min, 86.8P0.1, 90.8P1) fps
KFA2 GeForce RTX 4080 Super SG
101.6 (71.5min, 79.3P0.1, 86.1P1) fps -5%
Zotac RTX 4080 Super Trinity Black Edition
101 (77.7min, 79.7P0.1, 86.2P1) fps -5%
AMD Radeon RX 7900 XTX
97.5 (74.2min, 78P0.1, 80.8P1) fps -8%
KFA2 GeForce RTX 4080 SG
95.4 (34.6min, 73P0.1, 80P1) fps -10%
AMD Radeon RX 7900 XT
84.1 (53min, 65.3P0.1, 71.6P1) fps -21%
KFA2 GeForce RTX 4070 Ti EX Gamer
77.2 (60.6min, 63.9P0.1, 66.2P1) fps -28%
MSI Radeon RX 6950 XT Gaming X Trio
72.8 (53.4min, 61.7P0.1, 63.4P1) fps -32%
AMD Radeon RX 7900 GRE
70.3 (50.2min, 55.1P0.1, 60.4P1) fps -34%
AMD Radeon RX 7800 XT
64.9 (52.3min, 55.6P0.1, 56.5P1) fps -39%
KFA2 GeForce RTX 4070 EX Gamer
61 (50.3min, 52P0.1, 53.7P1) fps -43%
Sapphire Pulse Radeon RX 7700 XT
52.6 (44.8min, 45.2P0.1, 46.2P1) fps -51%
KFA2 GeForce RTX 4060 Ti EX, 16GB GDDR6
46.1 (38min, 38.4P0.1, 40.2P1) fps -57%
XFX Speedster QICK 308 Radeon RX 7600 Black Edition
38.4 (30.5min, 31.8P0.1, 33.7P1) fps -64%
KFA2 GeForce RTX 4060 1-Click-OC 2X
36 (21.5min, 28.8P0.1, 31.6P1) fps -66%
Spider-Man Miles Morales
3840x2160 Very High Preset AA:T
Zotac RTX 4080 Super Trinity Black Edition
117.6 (81min, 89.4P0.1, 100.8P1) fps 0%
XFX Radeon RX 7900 XTX Merc 310 Black Edition
117.4 (78.4min, 91.8P0.1, 99.5P1) fps
KFA2 GeForce RTX 4080 Super SG
116.4 (86.3min, 90.7P0.1, 97.7P1) fps -1%
KFA2 GeForce RTX 4080 SG
103.9 (24.9min, 74.5P0.1, 85.9P1) fps -11%
AMD Radeon RX 7900 XTX
97.9 (73.8min, 75.2P0.1, 81.4P1) fps -17%
KFA2 GeForce RTX 4070 Ti EX Gamer
86.6 (72min, 74.3P0.1, 76P1) fps -26%
AMD Radeon RX 7900 XT
83.9 (66.5min, 67.5P0.1, 69.7P1) fps -29%
MSI Radeon RX 6950 XT Gaming X Trio
74 (60.8min, 61.2P0.1, 63.4P1) fps -37%
AMD Radeon RX 7900 GRE
73.1 (60.7min, 61P0.1, 62.7P1) fps -38%
AMD Radeon RX 7800 XT
72.8 (60.9min, 61.8P0.1, 64.1P1) fps -38%
KFA2 GeForce RTX 4070 EX Gamer
70.8 (61.1min, 61.5P0.1, 62.9P1) fps -40%
Sapphire Pulse Radeon RX 7700 XT
58.1 (49.9min, 50.4P0.1, 51.1P1) fps -51%
KFA2 GeForce RTX 4060 Ti EX, 16GB GDDR6
54.2 (44.3min, 45.3P0.1, 46.6P1) fps -54%
KFA2 GeForce RTX 4060 1-Click-OC 2X
43.9 (22.8min, 34P0.1, 37P1) fps -63%
XFX Speedster QICK 308 Radeon RX 7600 Black Edition
38.6 (14.6min, 24.3P0.1, 30.6P1) fps -67%
2560x1440 Very High Preset AA:T
KFA2 GeForce RTX 4080 SG
202 (80.4min, 94.3P0.1, 151.7P1) fps +10%
KFA2 GeForce RTX 4080 Super SG
186.7 (81.9min, 97.2P0.1, 146.5P1) fps +1%
XFX Radeon RX 7900 XTX Merc 310 Black Edition
184 (88.6min, 98.9P0.1, 142.2P1) fps
Zotac RTX 4080 Super Trinity Black Edition
183.2 (91.4min, 97.2P0.1, 142.1P1) fps 0%
AMD Radeon RX 7900 XTX
146.3 (77.4min, 85.4P0.1, 114.1P1) fps -20%
KFA2 GeForce RTX 4070 Ti EX Gamer
143.9 (74.9min, 88.7P0.1, 118.9P1) fps -22%
AMD Radeon RX 7900 XT
135 (82min, 84.7P0.1, 104.7P1) fps -27%
KFA2 GeForce RTX 4070 EX Gamer
124.2 (73.8min, 87.3P0.1, 101.6P1) fps -32%
AMD Radeon RX 7900 GRE
122.7 (80.8min, 85.2P0.1, 100.5P1) fps -33%
MSI Radeon RX 6950 XT Gaming X Trio
121.2 (76min, 80.1P0.1, 95.4P1) fps -34%
AMD Radeon RX 7800 XT
116.7 (74.3min, 84.1P0.1, 95.3P1) fps -37%
Sapphire Pulse Radeon RX 7700 XT
100.6 (69.8min, 75.1P0.1, 81P1) fps -45%
KFA2 GeForce RTX 4060 Ti EX, 16GB GDDR6
98.4 (70.7min, 76.6P0.1, 81.3P1) fps -47%
KFA2 GeForce RTX 4060 1-Click-OC 2X
80.1 (24.9min, 56.5P0.1, 69.7P1) fps -56%
XFX Speedster QICK 308 Radeon RX 7600 Black Edition
74.5 (34.3min, 38.6P0.1, 59.3P1) fps -60%
Borderlands 3
3840x2160 Badass Overall Quality (DX11)
Palit GeForce RTX 4090 GameRock OC
137.9 fps +50%
KFA2 GeForce RTX 4080 Super SG
98 fps +6%
Zotac RTX 4080 Super Trinity Black Edition
97.9 fps +6%
KFA2 GeForce RTX 4080 SG
95.2 fps +3%
XFX Radeon RX 7900 XTX Merc 310 Black Edition
92.2 fps
AMD Radeon RX 7900 XTX
88.4 fps -4%
Asus TUF Gaming GeForce RTX 4070 Ti Super
79.4 fps -14%
AMD Radeon RX 7900 XT
74.6 fps -19%
KFA2 GeForce RTX 4070 Ti EX Gamer
71.9 fps -22%
MSI Radeon RX 6950 XT Gaming X Trio
70.9 fps -23%
AMD Radeon RX 7900 GRE
64.1 fps -30%
KFA2 GeForce RTX 4070 EX Gamer
58.6 fps -36%
AMD Radeon RX 7800 XT
57.9 fps -37%
Sapphire Pulse Radeon RX 7700 XT
48 fps -48%
KFA2 GeForce RTX 4060 Ti EX, 16GB GDDR6
42.5 fps -54%
XFX Speedster QICK 308 Radeon RX 7600 Black Edition
34.5 fps -63%
KFA2 GeForce RTX 4060 1-Click-OC 2X
33.8 fps -63%
2560x1440 Badass Overall Quality (DX11)
Palit GeForce RTX 4090 GameRock OC
198.4 fps +28%
Zotac RTX 4080 Super Trinity Black Edition
172.3 fps +11%
KFA2 GeForce RTX 4080 Super SG
170.9 fps +10%
KFA2 GeForce RTX 4080 SG
163.2 fps +5%
XFX Radeon RX 7900 XTX Merc 310 Black Edition
155.3 fps
AMD Radeon RX 7900 XTX
152.2 fps -2%
Asus TUF Gaming GeForce RTX 4070 Ti Super
143.6 fps -8%
AMD Radeon RX 7900 XT
135.2 fps -13%
KFA2 GeForce RTX 4070 Ti EX Gamer
134.3 fps -14%
MSI Radeon RX 6950 XT Gaming X Trio
132.3 fps -15%
AMD Radeon RX 7900 GRE
115.5 fps -26%
KFA2 GeForce RTX 4070 EX Gamer
111.2 fps -28%
AMD Radeon RX 7800 XT
105.5 fps -32%
Sapphire Pulse Radeon RX 7700 XT
89.4 fps -42%
KFA2 GeForce RTX 4060 Ti EX, 16GB GDDR6
81.7 fps -47%
XFX Speedster QICK 308 Radeon RX 7600 Black Edition
65.7 fps -58%
KFA2 GeForce RTX 4060 1-Click-OC 2X
64.8 fps -58%
God of War
3840x2160 Ultra Preset
Palit GeForce RTX 4090 GameRock OC
134 (79.9min, 105.4P0.1, 116.1P1) fps +23%
XFX Radeon RX 7900 XTX Merc 310 Black Edition
109.3 (84.5min, 86.8P0.1, 91.9P1) fps
AMD Radeon RX 7900 XTX
102.1 (84.5min, 85.9P0.1, 90.1P1) fps -7%
Zotac RTX 4080 Super Trinity Black Edition
100.6 (84.5min, 85.7P0.1, 89.8P1) fps -8%
KFA2 GeForce RTX 4080 Super SG
100.6 (85.7min, 87.5P0.1, 90.1P1) fps -8%
KFA2 GeForce RTX 4080 SG
95.3 (53min, 65.4P0.1, 82.4P1) fps -13%
AMD Radeon RX 7900 XT
88.1 (74.7min, 76.3P0.1, 78.3P1) fps -19%
MSI Radeon RX 6950 XT Gaming X Trio
74.3 (66min, 66.2P0.1, 67.6P1) fps -32%
AMD Radeon RX 7900 GRE
68.2 (59.8min, 60.3P0.1, 61.5P1) fps -38%
AMD Radeon RX 7800 XT
67 (56.4min, 58.3P0.1, 59.2P1) fps -39%
KFA2 GeForce RTX 4070 EX Gamer
63.1 (43.6min, 45.6P0.1, 57P1) fps -42%
Sapphire Pulse Radeon RX 7700 XT
54.2 (48.7min, 48.9P0.1, 49.9P1) fps -50%
KFA2 GeForce RTX 4060 Ti EX, 16GB GDDR6
44.8 (34.8min, 39.5P0.1, 40.7P1) fps -59%
KFA2 GeForce RTX 4060 1-Click-OC 2X
37.3 (33.7min, 33.9P0.1, 34.3P1) fps -66%
XFX Speedster QICK 308 Radeon RX 7600 Black Edition
34.8 (23.9min, 26.7P0.1, 32.1P1) fps -68%
2560x1440 Ultra Preset
Palit GeForce RTX 4090 GameRock OC
183.3 (95.7min, 120.9P0.1, 155.6P1) fps +13%
XFX Radeon RX 7900 XTX Merc 310 Black Edition
162.5 (115.8min, 121.6P0.1, 129.8P1) fps
AMD Radeon RX 7900 XTX
153.8 (118min, 124.2P0.1, 129.7P1) fps -5%
Zotac RTX 4080 Super Trinity Black Edition
139.3 (112.7min, 114.4P0.1, 120.7P1) fps -14%
KFA2 GeForce RTX 4080 Super SG
138.9 (100.7min, 113.9P0.1, 121.2P1) fps -15%
AMD Radeon RX 7900 XT
136.7 (105.2min, 115.2P0.1, 118.2P1) fps -16%
KFA2 GeForce RTX 4080 SG
136.3 (52.3min, 80.9P0.1, 116.8P1) fps -16%
MSI Radeon RX 6950 XT Gaming X Trio
112.9 (86.8min, 94P0.1, 97.4P1) fps -31%
AMD Radeon RX 7900 GRE
104.2 (36min, 85.5P0.1, 89.6P1) fps -36%
AMD Radeon RX 7800 XT
101.7 (86.8min, 87.3P0.1, 89.5P1) fps -37%
KFA2 GeForce RTX 4070 EX Gamer
92.6 (50.7min, 60.4P0.1, 80.2P1) fps -43%
Sapphire Pulse Radeon RX 7700 XT
85.3 (69.3min, 71.3P0.1, 72.7P1) fps -48%
KFA2 GeForce RTX 4060 Ti EX, 16GB GDDR6
67.9 (48.1min, 57.4P0.1, 59.7P1) fps -58%
KFA2 GeForce RTX 4060 1-Click-OC 2X
57.2 (48.1min, 48.5P0.1, 49.6P1) fps -65%
XFX Speedster QICK 308 Radeon RX 7600 Black Edition
56.5 (33.9min, 48.1P0.1, 49.1P1) fps -65%
GTA V
3840x2160 Highest Settings possible AA:4xMSAA + FX AF:16x
Palit GeForce RTX 4090 GameRock OC
146.1 (4.68min, 100P1) fps +33%
XFX Radeon RX 7900 XTX Merc 310 Black Edition
110.2 (13.6min, 76.9P1) fps
Zotac RTX 4080 Super Trinity Black Edition
105.3 (5.08min, 71.4P1) fps -4%
KFA2 GeForce RTX 4080 Super SG
104.2 (6.26min, 71.4P1) fps -5%
AMD Radeon RX 7900 XTX
100.7 (7.16min, 71.4P1) fps -9%
KFA2 GeForce RTX 4080 SG
94.7 (5.87min, 62.5P1) fps -14%
MSI Radeon RX 6950 XT Gaming X Trio
88.6 (6.8min, 58.8P1) fps -20%
AMD Radeon RX 7900 XT
83.1 (6.83min, 58.8P1) fps -25%
Asus TUF Gaming GeForce RTX 4070 Ti Super
81.6 (14.9min, 55.6P1) fps -26%
KFA2 GeForce RTX 4070 Ti EX Gamer
71.9 (7.31min, 50P1) fps -35%
AMD Radeon RX 7900 GRE
65.2 (12.4min, 47.6P1) fps -41%
AMD Radeon RX 7800 XT
64.4 (13.5min, 47.6P1) fps -42%
KFA2 GeForce RTX 4070 EX Gamer
59.9 (4.14min, 40P1) fps -46%
Sapphire Pulse Radeon RX 7700 XT
48.4 (12.1min, 35.7P1) fps -56%
KFA2 GeForce RTX 4060 Ti EX, 16GB GDDR6
43.4 (5.67min, 29.4P1) fps -61%
KFA2 GeForce RTX 4060 1-Click-OC 2X
39.4 (5.08min, 27P1) fps -64%
XFX Speedster QICK 308 Radeon RX 7600 Black Edition
34.3 (23.1min, 25P1) fps -69%
2560x1440 Highest Settings possible AA:4xMSAA + FX AF:16x
Palit GeForce RTX 4090 GameRock OC
171.9 (4.45min, 142.9P1) fps +2%
Zotac RTX 4080 Super Trinity Black Edition
170.6 (13min, 125P1) fps +1%
XFX Radeon RX 7900 XTX Merc 310 Black Edition
169.2 (3.02min, 142.9P1) fps
KFA2 GeForce RTX 4080 Super SG
168.8 (6.31min, 125P1) fps 0%
MSI Radeon RX 6950 XT Gaming X Trio
164.9 (11.3min, 111.1P1) fps -3%
AMD Radeon RX 7900 XTX
160.4 (10.4min, 100P1) fps -5%
KFA2 GeForce RTX 4080 SG
159.2 (3.49min, 111.1P1) fps -6%
AMD Radeon RX 7900 XT
159.2 (9.41min, 100P1) fps -6%
Asus TUF Gaming GeForce RTX 4070 Ti Super
155.3 (30.3min, 111.1P1) fps -8%
KFA2 GeForce RTX 4070 Ti EX Gamer
146.7 (4.54min, 100P1) fps -13%
AMD Radeon RX 7900 GRE
142.7 (17.1min, 100P1) fps -16%
AMD Radeon RX 7800 XT
138.7 (8.98min, 90.9P1) fps -18%
KFA2 GeForce RTX 4070 EX Gamer
136.2 (8.88min, 90.9P1) fps -20%
Sapphire Pulse Radeon RX 7700 XT
105.4 (16.6min, 71.4P1) fps -38%
KFA2 GeForce RTX 4060 Ti EX, 16GB GDDR6
101.3 (6.75min, 66.7P1) fps -40%
KFA2 GeForce RTX 4060 1-Click-OC 2X
90.3 (6.72min, 58.8P1) fps -47%
XFX Speedster QICK 308 Radeon RX 7600 Black Edition
77.4 (14.6min, 52.6P1) fps -54%
The Quarry
3840x2160 Ultra Preset
KFA2 GeForce RTX 4080 Super SG
82.8 (36.5min, 37.4P0.1, 70.1P1) fps +5%
Zotac RTX 4080 Super Trinity Black Edition
82.5 (20.7min, 38.7P0.1, 68.7P1) fps +5%
Palit GeForce RTX 4090 GameRock OC
81.8 (18.4min, 47.4P0.1, 71.9P1) fps +4%
KFA2 GeForce RTX 4080 SG
79.2 (19.3min, 29.2P0.1, 62.6P1) fps +1%
XFX Radeon RX 7900 XTX Merc 310 Black Edition
78.8 (33.3min, 36.7P0.1, 69.3P1) fps
AMD Radeon RX 7900 XTX
73.9 (32.8min, 35.6P0.1, 65.4P1) fps -6%
AMD Radeon RX 7900 XT
62.4 (27.6min, 30.1P0.1, 54.9P1) fps -21%
KFA2 GeForce RTX 4070 Ti EX Gamer
60.1 fps -24%
MSI Radeon RX 6950 XT Gaming X Trio
55.3 (23.1min, 23.6P0.1, 47.9P1) fps -30%
AMD Radeon RX 7900 GRE
52.9 (24.5min, 25P0.1, 46.5P1) fps -33%
AMD Radeon RX 7800 XT
45.9 (20.4min, 21.1P0.1, 39.7P1) fps -42%
Sapphire Pulse Radeon RX 7700 XT
37.8 (5.36min, 5.64P0.1, 25.8P1) fps -52%
KFA2 GeForce RTX 4070 EX Gamer
32.5 (13.3min, 17.1P0.1, 22.1P1) fps -59%
XFX Speedster QICK 308 Radeon RX 7600 Black Edition
22.8 (0.736min, 2.35P0.1, 9.32P1) fps -71%
KFA2 GeForce RTX 4060 Ti EX, 16GB GDDR6
22.6 (6.62min, 12.5P0.1, 15.1P1) fps -71%
KFA2 GeForce RTX 4060 1-Click-OC 2X
17.5 (9.13min, 9.24P0.1, 10.1P1) fps -78%
2560x1440 Ultra Preset
Palit GeForce RTX 4090 GameRock OC
198.7 (47.1min, 93.1P0.1, 161P1) fps +37%
KFA2 GeForce RTX 4080 Super SG
149.4 (16.3min, 70.7P0.1, 125.3P1) fps +3%
KFA2 GeForce RTX 4080 SG
149 (34.3min, 46P0.1, 119.7P1) fps +2%
Zotac RTX 4080 Super Trinity Black Edition
148.3 (12.8min, 69.2P0.1, 122.5P1) fps +2%
XFX Radeon RX 7900 XTX Merc 310 Black Edition
145.5 (61.2min, 75.9P0.1, 122.4P1) fps
AMD Radeon RX 7900 XTX
136.9 (51.4min, 70.5P0.1, 114.2P1) fps -6%
AMD Radeon RX 7900 XT
118.7 (47.8min, 58.3P0.1, 100P1) fps -18%
KFA2 GeForce RTX 4070 Ti EX Gamer
114.1 (25.5min, 44.5P0.1, 96.6P1) fps -22%
MSI Radeon RX 6950 XT Gaming X Trio
102.7 (45.2min, 49.7P0.1, 87.1P1) fps -29%
AMD Radeon RX 7900 GRE
97.6 (48.1min, 51.8P0.1, 83.4P1) fps -33%
KFA2 GeForce RTX 4070 EX Gamer
90.9 (17.1min, 36.9P0.1, 75.4P1) fps -38%
AMD Radeon RX 7800 XT
84.6 (36.4min, 41.9P0.1, 71.5P1) fps -42%
Sapphire Pulse Radeon RX 7700 XT
73.6 (33.7min, 36.4P0.1, 62.4P1) fps -49%
KFA2 GeForce RTX 4060 Ti EX, 16GB GDDR6
68.1 (24.1min, 31.6P0.1, 57.8P1) fps -53%
KFA2 GeForce RTX 4060 1-Click-OC 2X
54.7 (16.6min, 25P0.1, 45.3P1) fps -62%
XFX Speedster QICK 308 Radeon RX 7600 Black Edition
49.4 (19.8min, 20.2P0.1, 43P1) fps -66%
Tiny Tina's Wonderlands
3840x2160 Badass Preset (DX12)
Palit GeForce RTX 4090 GameRock OC
131.7 fps +48%
KFA2 GeForce RTX 4080 Super SG
92.3 fps +3%
Zotac RTX 4080 Super Trinity Black Edition
91.9 fps +3%
XFX Radeon RX 7900 XTX Merc 310 Black Edition
89.2 fps
KFA2 GeForce RTX 4080 SG
89 fps 0%
AMD Radeon RX 7900 XTX
85.6 fps -4%
MSI Radeon RX 6950 XT Gaming X Trio
77.4 fps -13%
AMD Radeon RX 7900 XT
71.3 fps -20%
KFA2 GeForce RTX 4070 Ti EX Gamer
68.9 fps -23%
AMD Radeon RX 7900 GRE
60.7 fps -32%
AMD Radeon RX 7800 XT
57.2 fps -36%
KFA2 GeForce RTX 4070 EX Gamer
56.4 fps -37%
Sapphire Pulse Radeon RX 7700 XT
46 fps -48%
KFA2 GeForce RTX 4060 Ti EX, 16GB GDDR6
36.7 fps -59%
XFX Speedster QICK 308 Radeon RX 7600 Black Edition
29.7 fps -67%
KFA2 GeForce RTX 4060 1-Click-OC 2X
26.6 fps -70%
2560x1440 Badass Preset (DX12)
Palit GeForce RTX 4090 GameRock OC
234 fps +43%
KFA2 GeForce RTX 4080 Super SG
172.6 fps +5%
Zotac RTX 4080 Super Trinity Black Edition
171.7 fps +5%
KFA2 GeForce RTX 4080 SG
165.8 fps +1%
XFX Radeon RX 7900 XTX Merc 310 Black Edition
164 fps
AMD Radeon RX 7900 XTX
160.7 fps -2%
MSI Radeon RX 6950 XT Gaming X Trio
146.2 fps -11%
AMD Radeon RX 7900 XT
136 fps -17%
KFA2 GeForce RTX 4070 Ti EX Gamer
129.8 fps -21%
AMD Radeon RX 7900 GRE
114.8 fps -30%
AMD Radeon RX 7800 XT
108.6 fps -34%
KFA2 GeForce RTX 4070 EX Gamer
106.9 fps -35%
Sapphire Pulse Radeon RX 7700 XT
89.2 fps -46%
KFA2 GeForce RTX 4060 Ti EX, 16GB GDDR6
80.2 fps -51%
XFX Speedster QICK 308 Radeon RX 7600 Black Edition
65.8 fps -60%
KFA2 GeForce RTX 4060 1-Click-OC 2X
62.6 fps -62%
GRID Legends
3840x2160 Ultra Preset
Palit GeForce RTX 4090 GameRock OC (800660)
191.2 (90.7min) fps +3%
AMD Radeon RX 7900 XTX (643827)
187 (75.7min) fps +1%
XFX Radeon RX 7900 XTX Merc 310 Black Edition (800660)
185.7 (81.3min) fps
AMD Radeon RX 7900 XT (643827)
164.9 (73.6min) fps -11%
KFA2 GeForce RTX 4080 Super SG (800660)
164.9 (81.6min) fps -11%
Zotac RTX 4080 Super Trinity Black Edition (800660)
163.6 (29.7min) fps -12%
KFA2 GeForce RTX 4080 SG (643827)
163.3 (55.9min) fps -12%
MSI Radeon RX 6950 XT Gaming X Trio (643827)
157.8 (77.1min) fps -15%
AMD Radeon RX 7900 GRE (800660)
140.5 (81.4min) fps -24%
KFA2 GeForce RTX 4070 Ti EX Gamer (712825)
133.5 (19.2min) fps -28%
AMD Radeon RX 7800 XT (800660)
128.6 (63.4min) fps -31%
KFA2 GeForce RTX 4070 EX Gamer (712825)
110.2 (59.1min) fps -41%
Sapphire Pulse Radeon RX 7700 XT (800660)
104.2 (68.6min) fps -44%
KFA2 GeForce RTX 4060 Ti EX, 16GB GDDR6 (800660)
83.5 (56.5min) fps -55%
XFX Speedster QICK 308 Radeon RX 7600 Black Edition (800660)
77.2 (51.2min) fps -58%
KFA2 GeForce RTX 4060 1-Click-OC 2X (800660)
67.1 (55.2min) fps -64%
2560x1440 Ultra Preset
AMD Radeon RX 7900 XTX (643827)
259 (75.5min) fps +19%
AMD Radeon RX 7900 XT (643827)
241 (68.5min) fps +11%
MSI Radeon RX 6950 XT Gaming X Trio (643827)
236 (77.2min) fps +9%
KFA2 GeForce RTX 4080 SG (643827)
233 (70.3min) fps +7%
Palit GeForce RTX 4090 GameRock OC (800660)
225 (98.2min) fps +4%
XFX Radeon RX 7900 XTX Merc 310 Black Edition (800660)
217 (87.2min) fps
Zotac RTX 4080 Super Trinity Black Edition (800660)
210 (52min) fps -3%
KFA2 GeForce RTX 4080 Super SG (800660)
207 (56.9min) fps -5%
KFA2 GeForce RTX 4070 Ti EX Gamer (712825)
198 (81.4min) fps -9%
AMD Radeon RX 7900 GRE (800660)
185 (85.1min) fps -15%
AMD Radeon RX 7800 XT (800660)
173.5 (71.7min) fps -20%
KFA2 GeForce RTX 4070 EX Gamer (712825)
166.8 (68min) fps -23%
Sapphire Pulse Radeon RX 7700 XT (800660)
153.8 (51.7min) fps -29%
KFA2 GeForce RTX 4060 Ti EX, 16GB GDDR6 (800660)
135.2 (59.4min) fps -38%
XFX Speedster QICK 308 Radeon RX 7600 Black Edition (800660)
126.3 (78.3min) fps -42%
KFA2 GeForce RTX 4060 1-Click-OC 2X (800660)
112.7 (65.9min) fps -48%
Final Fantasy XV Benchmark
3840x2160 High Quality
Palit GeForce RTX 4090 GameRock OC (1.3)
161.9 fps +43%
Zotac RTX 4080 Super Trinity Black Edition (1.3)
122.4 fps +8%
KFA2 GeForce RTX 4080 Super SG (1.3)
120.6 fps +6%
KFA2 GeForce RTX 4080 SG (1.3)
116.9 fps +3%
XFX Radeon RX 7900 XTX Merc 310 Black Edition (1.3)
113.5 fps
AMD Radeon RX 7900 XTX (1.3)
101.6 fps -10%
Asus TUF Gaming GeForce RTX 4070 Ti Super (1.3)
98.9 fps -13%
KFA2 GeForce RTX 4070 Ti EX Gamer (1.3)
87.6 fps -23%
MSI Radeon RX 6950 XT Gaming X Trio (1.3)
85.6 fps -25%
AMD Radeon RX 7900 XT (1.3)
84.9 fps -25%
AMD Radeon RX 7900 GRE (1.3)
75.5 fps -33%
KFA2 GeForce RTX 4070 EX Gamer (1.3)
74.8 fps -34%
AMD Radeon RX 7800 XT (1.3)
70.5 fps -38%
Sapphire Pulse Radeon RX 7700 XT (1.3)
57.4 fps -49%
KFA2 GeForce RTX 4060 Ti EX, 16GB GDDR6 (1.3)
51.2 fps -55%
KFA2 GeForce RTX 4060 1-Click-OC 2X (1.3)
43 fps -62%
XFX Speedster QICK 308 Radeon RX 7600 Black Edition (1.3)
39.3 fps -65%
2560x1440 High Quality
Palit GeForce RTX 4090 GameRock OC (1.3)
229 fps +21%
Zotac RTX 4080 Super Trinity Black Edition (1.3)
203 fps +7%
KFA2 GeForce RTX 4080 Super SG (1.3)
203 fps +7%
KFA2 GeForce RTX 4080 SG (1.3)
195.7 fps +3%
XFX Radeon RX 7900 XTX Merc 310 Black Edition (1.3)
189.7 fps
AMD Radeon RX 7900 XTX (1.3)
172.8 fps -9%
Asus TUF Gaming GeForce RTX 4070 Ti Super (1.3)
168.8 fps -11%
KFA2 GeForce RTX 4070 Ti EX Gamer (1.3)
160.1 fps -16%
MSI Radeon RX 6950 XT Gaming X Trio (1.3)
152.4 fps -20%
AMD Radeon RX 7900 XT (1.3)
149.9 fps -21%
KFA2 GeForce RTX 4070 EX Gamer (1.3)
135.2 fps -29%
AMD Radeon RX 7900 GRE (1.3)
133 fps -30%
AMD Radeon RX 7800 XT (1.3)
124.6 fps -34%
Sapphire Pulse Radeon RX 7700 XT (1.3)
103.1 fps -46%
KFA2 GeForce RTX 4060 Ti EX, 16GB GDDR6 (1.3)
90.5 fps -52%
KFA2 GeForce RTX 4060 1-Click-OC 2X (1.3)
79.3 fps -58%
XFX Speedster QICK 308 Radeon RX 7600 Black Edition (1.3)
74.2 fps -61%
The Last of Us
3840x2160 Ultra Preset
XFX Radeon RX 7900 XTX Merc 310 Black Edition
70.3 (51.8min, 55.8P0.1, 57.9P1) fps
KFA2 GeForce RTX 4080 Super SG
61.8 (23min, 42.2P0.1, 49.4P1) fps -12%
Zotac RTX 4080 Super Trinity Black Edition
60.7 (33.3min, 46.9P0.1, 50.2P1) fps -14%
AMD Radeon RX 7900 GRE
44.8 (36min, 36.2P0.1, 37P1) fps -36%
KFA2 GeForce RTX 4070 Ti EX Gamer
44.2 (22.2min, 33.4P0.1, 35.4P1) fps -37%
AMD Radeon RX 7800 XT
42.7 (31.6min, 34.4P0.1, 35.2P1) fps -39%
MSI Radeon RX 6950 XT Gaming X Trio
39.6 (33.3min, 33.5P0.1, 34P1) fps -44%
KFA2 GeForce RTX 4070 EX Gamer
35.2 (7.22min, 9.91P0.1, 27.9P1) fps -50%
Sapphire Pulse Radeon RX 7700 XT
29.6 (2.01min, 7.29P0.1, 21.7P1) fps -58%
KFA2 GeForce RTX 4060 Ti EX, 16GB GDDR6
26.8 (20.8min, 20.9P0.1, 21.4P1) fps -62%
KFA2 GeForce RTX 4060 1-Click-OC 2X
18.6 (2.12min, 5.14P0.1, 11.9P1) fps -74%
XFX Speedster QICK 308 Radeon RX 7600 Black Edition
15.2 (3.04min, 3.17P0.1, 3.97P1) fps -78%
2560x1440 Ultra Preset
XFX Radeon RX 7900 XTX Merc 310 Black Edition
127.2 (46.8min, 80.8P0.1, 98.6P1) fps
Zotac RTX 4080 Super Trinity Black Edition
121 (87.2min, 95.7P0.1, 102.1P1) fps -5%
KFA2 GeForce RTX 4080 Super SG
120.9 (84.5min, 93.7P0.1, 101.5P1) fps -5%
AMD Radeon RX 7900 GRE
88.9 (47.9min, 70.5P0.1, 73P1) fps -30%
KFA2 GeForce RTX 4070 Ti EX Gamer
87.9 (51min, 58.7P0.1, 71.8P1) fps -31%
AMD Radeon RX 7800 XT
86.1 (46.8min, 68P0.1, 70.9P1) fps -32%
MSI Radeon RX 6950 XT Gaming X Trio
76.8 (61.2min, 62.6P0.1, 64.4P1) fps -40%
KFA2 GeForce RTX 4070 EX Gamer
72.5 (53.2min, 56.3P0.1, 59.7P1) fps -43%
Sapphire Pulse Radeon RX 7700 XT
68 (39.1min, 54.5P0.1, 56.3P1) fps -47%
KFA2 GeForce RTX 4060 Ti EX, 16GB GDDR6
56.3 (43.4min, 44.5P0.1, 45.7P1) fps -56%
KFA2 GeForce RTX 4060 1-Click-OC 2X
39.9 (1.82min, 11.8P0.1, 28.9P1) fps -69%
XFX Speedster QICK 308 Radeon RX 7600 Black Edition
36.5 (2.78min, 6.02P0.1, 23.1P1) fps -71%
F1 23
3840x2160 Ultra High Preset AA:T AF:16x
Palit GeForce RTX 4090 GameRock OC (1030131)
80.1 (61min, 61P1) fps +71%
Zotac RTX 4080 Super Trinity Black Edition (1057599)
55.5 (41min, 42P1) fps +19%
KFA2 GeForce RTX 4080 Super SG (1070925)
54.5 (41min, 41P1) fps +16%
XFX Radeon RX 7900 XTX Merc 310 Black Edition (1070925)
46.8 (28min, 28P1) fps
Asus TUF Gaming GeForce RTX 4070 Ti Super (1057599)
45.1 (34min, 34P1) fps -4%
AMD Radeon RX 7900 GRE (1016022)
32.1 (19min, 19P1) fps -31%
KFA2 GeForce RTX 4070 EX Gamer
32 (25min) fps -32%
MSI Radeon RX 6950 XT Gaming X Trio (1016022)
29.7 (18min, 18P1) fps -37%
AMD Radeon RX 7800 XT (1022189)
27.3 (16min, 16P1) fps -42%
KFA2 GeForce RTX 4060 Ti EX, 16GB GDDR6 (1022189)
24.6 (19min, 19P1) fps -47%
Sapphire Pulse Radeon RX 7700 XT (1026791)
23.5 (14min, 14P1) fps -50%
KFA2 GeForce RTX 4060 1-Click-OC 2X (1008687)
16.5 (8min, 2P1) fps -65%
XFX Speedster QICK 308 Radeon RX 7600 Black Edition (1016022)
10.7 (6min, 6P1) fps -77%
2560x1440 Ultra High Preset AA:T AF:16x
Palit GeForce RTX 4090 GameRock OC (1030131)
155.5 (121min, 121P1) fps +68%
KFA2 GeForce RTX 4080 Super SG (1070925)
111.4 (85min, 86P1) fps +21%
Zotac RTX 4080 Super Trinity Black Edition (1057599)
110.7 (85min, 85P1) fps +20%
XFX Radeon RX 7900 XTX Merc 310 Black Edition (1070925)
92.4 (60min, 60P1) fps
Asus TUF Gaming GeForce RTX 4070 Ti Super (1057599)
90 (70min, 69P1) fps -3%
KFA2 GeForce RTX 4070 EX Gamer
66 (52min) fps -29%
AMD Radeon RX 7900 GRE (1016022)
64.1 (41min, 40P1) fps -31%
MSI Radeon RX 6950 XT Gaming X Trio (1016022)
62 (40min, 40P1) fps -33%
AMD Radeon RX 7800 XT (1022189)
55.8 (34min, 34P1) fps -40%
KFA2 GeForce RTX 4060 Ti EX, 16GB GDDR6 (1022189)
51 (39min, 39P1) fps -45%
Sapphire Pulse Radeon RX 7700 XT (1026791)
48.7 (31min, 31P1) fps -47%
KFA2 GeForce RTX 4060 1-Click-OC 2X (1008687)
38 (27min, 29P1) fps -59%
XFX Speedster QICK 308 Radeon RX 7600 Black Edition (1016022)
31.8 (19min, 19P1) fps -66%
Hogwarts Legacy
3840x2160 Ultra Preset AA:High T
XFX Radeon RX 7900 XTX Merc 310 Black Edition
76.2 (28.2min, 45P0.1, 62.3P1) fps
Zotac RTX 4080 Super Trinity Black Edition
68.6 (23.3min, 33.8P0.1, 55.5P1) fps -10%
KFA2 GeForce RTX 4080 Super SG
67 (25.9min, 37.9P0.1, 52.5P1) fps -12%
MSI Radeon RX 6950 XT Gaming X Trio
54.8 (32.1min, 33.7P0.1, 46.9P1) fps -28%
AMD Radeon RX 7900 GRE
50.9 (24.1min, 31.2P0.1, 42.6P1) fps -33%
KFA2 GeForce RTX 4070 Ti EX Gamer
46.5 (15.7min, 17.8P0.1, 37.6P1) fps -39%
AMD Radeon RX 7800 XT
44.2 (21.7min, 28.7P0.1, 35.1P1) fps -42%
KFA2 GeForce RTX 4070 EX Gamer
41.9 (21.4min, 22.1P0.1, 34.1P1) fps -45%
Sapphire Pulse Radeon RX 7700 XT
35.5 (19.9min, 23P0.1, 29.6P1) fps -53%
KFA2 GeForce RTX 4060 Ti EX, 16GB GDDR6
30.6 (14.7min, 17.4P0.1, 25.4P1) fps -60%
KFA2 GeForce RTX 4060 1-Click-OC 2X
24.9 (16.5min, 17.7P0.1, 20.5P1) fps -67%
XFX Speedster QICK 308 Radeon RX 7600 Black Edition
22.4 (11.5min, 12.3P0.1, 16.1P1) fps -71%
2560x1440 Ultra Preset AA:High T
XFX Radeon RX 7900 XTX Merc 310 Black Edition
133.7 (33.9min, 51.9P0.1, 98.6P1) fps
Zotac RTX 4080 Super Trinity Black Edition
112.2 (32.7min, 44.9P0.1, 74.6P1) fps -16%
KFA2 GeForce RTX 4080 Super SG
110.3 (34.8min, 53.2P0.1, 77.1P1) fps -18%
MSI Radeon RX 6950 XT Gaming X Trio
100 (43.1min, 58.7P0.1, 79.7P1) fps -25%
AMD Radeon RX 7900 GRE
91.2 (30.3min, 49.4P0.1, 72P1) fps -32%
KFA2 GeForce RTX 4070 Ti EX Gamer
86.4 (26.8min, 40.2P0.1, 59.3P1) fps -35%
KFA2 GeForce RTX 4070 EX Gamer
84.2 (30.8min, 42.2P0.1, 60.8P1) fps -37%
AMD Radeon RX 7800 XT
76.4 (27.8min, 38.4P0.1, 61P1) fps -43%
Sapphire Pulse Radeon RX 7700 XT
66.9 (26.3min, 39.2P0.1, 54.8P1) fps -50%
KFA2 GeForce RTX 4060 Ti EX, 16GB GDDR6
57.6 (26.1min, 32.7P0.1, 43.9P1) fps -57%
XFX Speedster QICK 308 Radeon RX 7600 Black Edition
49.6 (22.5min, 23.6P0.1, 39.5P1) fps -63%
KFA2 GeForce RTX 4060 1-Click-OC 2X
46.3 (9.49min, 23.4P0.1, 35.2P1) fps -65%
Lords of the Fallen
3840x2160 Ultra Preset
KFA2 GeForce RTX 4080 Super SG
40.5 (25.3min, 25.6P0.1, 31.2P1) fps +4%
Zotac RTX 4080 Super Trinity Black Edition
40.1 (26.8min, 29.1P0.1, 33P1) fps +3%
XFX Radeon RX 7900 XTX Merc 310 Black Edition
39.1 (25min, 25.1P0.1, 27.5P1) fps
MSI Radeon RX 6950 XT Gaming X Trio
25.4 (19.9min, 21P0.1, 21.9P1) fps -35%
Sapphire Pulse Radeon RX 7700 XT
19.2 (15min, 16P0.1, 16.9P1) fps -51%
XFX Speedster QICK 308 Radeon RX 7600 Black Edition
12.3 (7.48min, 7.48P0.1, 8.28P1) fps -69%
2560x1440 Ultra Preset
KFA2 GeForce RTX 4080 Super SG
73.9 (53.3min, 58.2P0.1, 64P1) fps +2%
Zotac RTX 4080 Super Trinity Black Edition
73.7 (50.1min, 55.2P0.1, 63.7P1) fps +2%
XFX Radeon RX 7900 XTX Merc 310 Black Edition
72.5 (52.2min, 54.8P0.1, 61.7P1) fps
MSI Radeon RX 6950 XT Gaming X Trio
50 (41min, 42P0.1, 43.4P1) fps -31%
Sapphire Pulse Radeon RX 7700 XT
37.1 (30min, 31.1P0.1, 32.6P1) fps -49%
XFX Speedster QICK 308 Radeon RX 7600 Black Edition
25.1 (21.6min, 21.6P0.1, 21.9P1) fps -65%

Raytracing Performance - The problem of the AMD graphics cards...

With activated raytracing, the average frame rates drop significantly. Compared to Nvidia, AMD has significantly more difficulties to produce the 3D performance here. Unfortunately, the top model is unable to keep up with the Nvidia GeForce RTX 4080 Super. However, we cannot really give any general opinion on the raytracing performance. The performance varies from one game to the next, and we also have to consider the driver development. Alan Wake 2, which causes an extreme drop in the frame rate with activated raytracing, presents itself as extremely power hungry. Our XFX Speedster MERC 310 Radeon RX 7900 XTX Black Edition even falls behind an Asus TUF Gaming GeForce RTX 4070 Ti Super here. At the same time, we also see the huge performance increase compared to the MSI Radeon RX 6950 XT Gaming X Trio in this example.

Spider-Man Miles Morales - 1920x0180 Very High Preset + Ray-Tracing AA:T
Palit GeForce RTX 4090 GameRock OC
138.7 (76.9min, 83.4P0.1, 107.3P1) fps +16%
KFA2 GeForce RTX 4080 Super SG
128.4 (45.3min, 76.5P0.1, 104.4P1) fps +8%
Palit GeForce RTX 4090 GameRock OC
122.2 (60.2min, 67.7P0.1, 89P1) fps +3%
XFX Radeon RX 7900 XTX Merc 310 Black Edition
119.2 (78.3min, 82.3P0.1, 97.9P1) fps
KFA2 GeForce RTX 4070 Ti SG
102 (65.6min, 73.3P0.1, 87.1P1) fps -14%
AMD Radeon RX 7900 XTX
98.6 (68.4min, 71.9P0.1, 82.3P1) fps -17%
AMD Radeon RX 7900 XT
88.5 (67.1min, 70.7P0.1, 74.7P1) fps -26%
KFA2 GeForce RTX 4070 EX Gamer
88.2 (67.7min, 70.6P0.1, 73.5P1) fps -26%
AMD Radeon RX 7800 XT
84.8 (66.4min, 67.2P0.1, 69.6P1) fps -29%
MSI Radeon RX 6950 XT Gaming X Trio
80.9 (60.3min, 63.4P0.1, 67.7P1) fps -32%
AMD Radeon RX 7900 GRE
78.6 (59.1min, 62.8P0.1, 64.9P1) fps -34%
ASUS Dual GeForce RTX 4060 Ti OC
70.3 (33min, 46.9P0.1, 57.7P1) fps -41%
Sapphire Pulse Radeon RX 7700 XT
66.9 (52.6min, 53.1P0.1, 55.3P1) fps -44%
Nvidia Titan RTX
66.7 (52.9min, 54P0.1, 55.9P1) fps -44%
AMD Radeon RX 6800
65 (48.7min, 50.9P0.1, 52.4P1) fps -45%
Acer Predator BiFrost Arc A770 OC, 16GB GDDR6
64.6 (33.1min, 54.4P0.1, 55.7P1) fps -46%
Sapphire Pulse Radeon RX 6750 XT
56 (43.8min, 44.2P0.1, 45.6P1) fps -53%
Nvidia GeForce RTX 2070 Super
50.9 (23.9min, 24.2P0.1, 32.7P1) fps -57%
XFX Speedster QICK 308 Radeon RX 7600 Black Edition
43 (28.5min, 29.6P0.1, 30.3P1) fps -64%
Nvidia GeForce RTX 2060 Super
39.5 (22.7min, 23P0.1, 28.8P1) fps -67%
Metro Exodus - 1920x1080 Ultra Quality DXR AF:16x
Palit GeForce RTX 4090 GameRock OC
159.9 (95.45min) fps +5%
Palit GeForce RTX 4090 GameRock OC
157.3 (96.47min) fps +3%
KFA2 GeForce RTX 4080 Super SG
152.7 (79.12min) fps 0%
XFX Radeon RX 7900 XTX Merc 310 Black Edition
152 (95.06min) fps
AMD Radeon RX 7900 XTX
141.2 (89.03min) fps -7%
Asus TUF Gaming GeForce RTX 4070 Ti Super
133.4 (69.17min) fps -12%
KFA2 GeForce RTX 4070 Ti SG
133.3 (68.29min) fps -12%
AMD Radeon RX 7900 XT
124.3 (78.88min) fps -18%
MSI Radeon RX 6950 XT Gaming X Trio
110.2 (69.77min) fps -27%
KFA2 GeForce RTX 4070 EX Gamer
109.4 (61.5min) fps -28%
AMD Radeon RX 7900 GRE
103.8 (63.84min) fps -32%
AMD Radeon RX 7800 XT
98.4 (61.39min) fps -35%
Nvidia Titan RTX
91.8 (51.42min) fps -40%
Sapphire Pulse Radeon RX 7700 XT
88.1 (56.03min) fps -42%
ASUS Dual GeForce RTX 4060 Ti OC
84.8 (45.59min) fps -44%
Acer Predator BiFrost Arc A770 OC, 16GB GDDR6
70.9 (42.22min) fps -53%
Sapphire Pulse Radeon RX 6750 XT
70.5 (43.91min) fps -54%
XFX Speedster QICK 308 Radeon RX 7600 Black Edition
62.9 (40.28min) fps -59%
Nvidia GeForce RTX 2070 Super
62.1 (35.93min) fps -59%
Nvidia GeForce RTX 2060 Super
53.3 (31.47min) fps -65%
Far Cry 6 - 1920x1080 Ultra Graphics Quality + HD Textures + DXR AA:T
XFX Radeon RX 7900 XTX Merc 310 Black Edition
156.5 (83min) fps
Palit GeForce RTX 4090 GameRock OC
156.1 (130min) fps 0%
AMD Radeon RX 7900 XTX
152.1 (75min) fps -3%
KFA2 GeForce RTX 4080 Super SG
149.4 (125min) fps -5%
Asus TUF Gaming GeForce RTX 4070 Ti Super
144 (125min) fps -8%
AMD Radeon RX 7900 XT
143.6 (46min) fps -8%
AMD Radeon RX 7900 GRE
136.7 (44min) fps -13%
Palit GeForce RTX 4090 GameRock OC
133.4 (108min) fps -15%
KFA2 GeForce RTX 4070 Ti SG
133.4 (109min) fps -15%
MSI Radeon RX 6950 XT Gaming X Trio
132.8 (51min) fps -15%
KFA2 GeForce RTX 4070 EX Gamer
132 (110min) fps -16%
AMD Radeon RX 7800 XT
129.4 (36min) fps -17%
AMD Radeon RX 6800
112.6 (63min) fps -28%
Nvidia Titan RTX
109.3 (98min) fps -30%
Sapphire Pulse Radeon RX 7700 XT
104.1 (18min) fps -33%
Sapphire Pulse Radeon RX 6750 XT
101.4 (33min) fps -35%
Acer Predator BiFrost Arc A770 OC, 16GB GDDR6
79.5 (71min) fps -49%
XFX Speedster QICK 308 Radeon RX 7600 Black Edition
63.6 (31min) fps -59%
Nvidia GeForce RTX 2070 Super
49.6 (32min) fps -68%
Nvidia GeForce RTX 2060 Super
47.7 (30min) fps -70%
The Callisto Protocol - 1920x1080 Ultra Preset (without FSR Upscaling) + Full Ray-Tracing
XFX Radeon RX 7900 XTX Merc 310 Black Edition
114.4 fps
KFA2 GeForce RTX 4080 Super SG
111.7 fps -2%
AMD Radeon RX 7800 XT
99.3 fps -13%
AMD Radeon RX 7900 GRE
99 fps -13%
AMD Radeon RX 7900 XTX
98 fps -14%
Asus TUF Gaming GeForce RTX 4070 Ti Super
96.75 fps -15%
Sapphire Pulse Radeon RX 7700 XT
92.4 fps -19%
Palit GeForce RTX 4090 GameRock OC
92 fps -20%
ASUS Dual GeForce RTX 4060 Ti OC
90.7 fps -21%
AMD Radeon RX 7900 XT
89 fps -22%
MSI Radeon RX 6950 XT Gaming X Trio
84 fps -27%
KFA2 GeForce RTX 4070 Ti SG
82.1 fps -28%
KFA2 GeForce RTX 4070 EX Gamer
78.6 fps -31%
AMD Radeon RX 6800
66 fps -42%
XFX Speedster QICK 308 Radeon RX 7600 Black Edition
65.8 fps -42%
Nvidia Titan RTX
58.7 fps -49%
Acer Predator BiFrost Arc A770 OC, 16GB GDDR6
58.6 fps -49%
Nvidia GeForce RTX 2070 Super
45.6 fps -60%
Nvidia GeForce RTX 2060 Super
37.5 fps -67%
Sapphire Pulse Radeon RX 6750 XT
28.8 fps -75%
Guardians of the Galaxy - 1920x1080 Ultra Preset + Ultra Ray-Tracing
Palit GeForce RTX 4090 GameRock OC
215 (128min) fps +37%
KFA2 GeForce RTX 4080 Super SG
204 fps +30%
XFX Radeon RX 7900 XTX Merc 310 Black Edition
157 fps
AMD Radeon RX 7900 XTX
137 fps -13%
KFA2 GeForce RTX 4070 EX Gamer
131 fps -17%
AMD Radeon RX 7900 XT
122 fps -22%
AMD Radeon RX 7900 GRE
105 fps -33%
MSI Radeon RX 6950 XT Gaming X Trio
101 fps -36%
ASUS Dual GeForce RTX 4060 Ti OC
100 fps -36%
AMD Radeon RX 7800 XT
97 fps -38%
Nvidia Titan RTX
94 fps -40%
Sapphire Pulse Radeon RX 7700 XT
77 fps -51%
Nvidia GeForce RTX 2070 Super
68 fps -57%
Sapphire Pulse Radeon RX 6750 XT
62 fps -61%
Acer Predator BiFrost Arc A770 OC, 16GB GDDR6
59 fps -62%
Nvidia GeForce RTX 2060 Super
54 fps -66%
XFX Speedster QICK 308 Radeon RX 7600 Black Edition
51 fps -68%
Returnal
1920x1080 Epic Preset + Epic Ray-Tracing
Palit GeForce RTX 4090 GameRock OC
180 (77min) fps +32%
Palit GeForce RTX 4090 GameRock OC
167 fps +23%
KFA2 GeForce RTX 4080 Super SG
153 (81min) fps +13%
XFX Radeon RX 7900 XTX Merc 310 Black Edition
136 (76min) fps
KFA2 GeForce RTX 4070 EX Gamer
102 fps -25%
AMD Radeon RX 7900 GRE
99 fps -27%
AMD Radeon RX 7800 XT
93 fps -32%
Nvidia Titan RTX
86 fps -37%
ASUS Dual GeForce RTX 4060 Ti OC
84 fps -38%
Sapphire Pulse Radeon RX 7700 XT
78 (44min) fps -43%
AMD Radeon RX 6800
71 fps -48%
Nvidia GeForce RTX 2070 Super
61 fps -55%
Sapphire Pulse Radeon RX 6750 XT
60 fps -56%
Nvidia GeForce RTX 2060 Super
53 fps -61%
XFX Speedster QICK 308 Radeon RX 7600 Black Edition
50 fps -63%
Acer Predator BiFrost Arc A770 OC, 16GB GDDR6
50 (31min) fps -63%
3840x2160 Epic Preset + Epic Ray-Tracing
Palit GeForce RTX 4090 GameRock OC
88 (52min) fps +47%
Palit GeForce RTX 4090 GameRock OC
85 fps +42%
KFA2 GeForce RTX 4080 Super SG
65 (44min) fps +8%
XFX Radeon RX 7900 XTX Merc 310 Black Edition
60 (34min) fps
AMD Radeon RX 7900 GRE
41 fps -32%
KFA2 GeForce RTX 4070 EX Gamer
40 fps -33%
AMD Radeon RX 7800 XT
37 fps -38%
Nvidia Titan RTX
36 fps -40%
ASUS Dual GeForce RTX 4060 Ti OC
32 fps -47%
Sapphire Pulse Radeon RX 7700 XT
31 (10min) fps -48%
AMD Radeon RX 6800
29 fps -52%
Acer Predator BiFrost Arc A770 OC, 16GB GDDR6
24 (11min) fps -60%
Nvidia GeForce RTX 2070 Super
23 fps -62%
Sapphire Pulse Radeon RX 6750 XT
22 fps -63%
Nvidia GeForce RTX 2060 Super
19 fps -68%
XFX Speedster QICK 308 Radeon RX 7600 Black Edition
15 fps -75%
F1 23 - 1920x1080 Ultra High Preset AA:T AF:16x
Palit GeForce RTX 4090 GameRock OC (1038401)
216 (177min, 154P1) fps +56%
Palit GeForce RTX 4090 GameRock OC (1022189)
210 (168min, 150P1) fps +52%
KFA2 GeForce RTX 4080 Super SG (1070925)
170.3 (134min, 133P1) fps +23%
XFX Radeon RX 7900 XTX Merc 310 Black Edition (1070925)
138.6 (96min, 94P1) fps
Asus TUF Gaming GeForce RTX 4070 Ti Super (1057599)
138.2 (109min, 108P1) fps 0%
KFA2 GeForce RTX 4070 EX Gamer
105 (84min) fps -24%
AMD Radeon RX 7900 GRE (1016022)
97.6 (67min, 65P1) fps -30%
MSI Radeon RX 6950 XT Gaming X Trio (1016022)
97.1 (64min, 65P1) fps -30%
AMD Radeon RX 7800 XT (1022189)
87.4 (56min, 56P1) fps -37%
ASUS Dual GeForce RTX 4060 Ti OC (1012607)
82.1 (64min, 64P1) fps -41%
Nvidia Titan RTX (1021115)
81.6 (65min, 64P1) fps -41%
Sapphire Pulse Radeon RX 7700 XT (1026791)
76.5 (49min, 50P1) fps -45%
AMD Radeon RX 6800 (1016022)
69.5 (44min, 45P1) fps -50%
Acer Predator BiFrost Arc A770 OC, 16GB GDDR6 (1026791)
67.2 (52min, 52P1) fps -52%
Sapphire Pulse Radeon RX 6750 XT (1016022)
57.3 (37min, 37P1) fps -59%
Nvidia GeForce RTX 2070 Super (1021115)
54.4 (42min, 42P1) fps -61%
XFX Speedster QICK 308 Radeon RX 7600 Black Edition (1016022)
48.8 (31min, 31P1) fps -65%
Nvidia GeForce RTX 2060 Super (1021115)
46 (35min, 35P1) fps -67%
Star Wars Jedi Survivor - 1920x1080 Epic Preset + Ray Tracing
Palit GeForce RTX 4090 GameRock OC
146.8 (51.4min, 70.2P0.1, 108.8P1) fps +24%
Palit GeForce RTX 4090 GameRock OC
133.1 (28.3min, 54.3P0.1, 89.1P1) fps +13%
KFA2 GeForce RTX 4080 Super SG
128.7 (57.3min, 63.7P0.1, 89.2P1) fps +9%
XFX Radeon RX 7900 XTX Merc 310 Black Edition
118.3 (52min, 62.3P0.1, 91.6P1) fps
MSI Radeon RX 6950 XT Gaming X Trio
90.2 (25.5min, 33.6P0.1, 67.2P1) fps -24%
AMD Radeon RX 7900 GRE
84 (19.9min, 36.1P0.1, 63.4P1) fps -29%
KFA2 GeForce RTX 4070 EX Gamer
83.9 (16.9min, 23.7P0.1, 54.8P1) fps -29%
AMD Radeon RX 7800 XT
82.4 (36.2min, 44P0.1, 63.7P1) fps -30%
Sapphire Pulse Radeon RX 7700 XT
71 (36.4min, 44.4P0.1, 54.8P1) fps -40%
Nvidia Titan RTX
70.2 (20.7min, 34.7P0.1, 50.9P1) fps -41%
AMD Radeon RX 6800
66.5 (18.8min, 32.8P0.1, 49.4P1) fps -44%
ASUS Dual GeForce RTX 4060 Ti OC
59.8 (14.9min, 17.9P0.1, 40.8P1) fps -49%
Sapphire Pulse Radeon RX 6750 XT
58.3 (19.6min, 31.9P0.1, 46.6P1) fps -51%
Nvidia GeForce RTX 2070 Super
51.2 (17min, 27.3P0.1, 40.4P1) fps -57%
Acer Predator BiFrost Arc A770 OC, 16GB GDDR6
48.8 (33.4min, 37.1P0.1, 40.6P1) fps -59%
XFX Speedster QICK 308 Radeon RX 7600 Black Edition
47.1 (17min, 23.5P0.1, 35.8P1) fps -60%
Nvidia GeForce RTX 2060 Super
41.6 (17.2min, 23.5P0.1, 33P1) fps -65%
Hogwarts Legacy - 1920x1080 Ultra Preset + Full Ray Tracing AA:High T
KFA2 GeForce RTX 4080 Super SG
86.5 (33.3min, 39.8P0.1, 58.3P1) fps +2%
Palit GeForce RTX 4090 GameRock OC
86 (15.3min, 32.6P0.1, 59.3P1) fps +1%
XFX Radeon RX 7900 XTX Merc 310 Black Edition
84.9 (27.5min, 40.2P0.1, 61.8P1) fps
Palit GeForce RTX 4090 GameRock OC
84.4 (30.9min, 38.4P0.1, 61.8P1) fps -1%
KFA2 GeForce RTX 4070 EX Gamer
73.1 (24.1min, 27.4P0.1, 42P1) fps -14%
MSI Radeon RX 6950 XT Gaming X Trio
64.2 (23.9min, 31.1P0.1, 48.3P1) fps -24%
AMD Radeon RX 7900 GRE
60.4 (24.6min, 28.4P0.1, 43.1P1) fps -29%
Nvidia Titan RTX
60.1 (23.2min, 23.5P0.1, 43.5P1) fps -29%
ASUS Dual GeForce RTX 4060 Ti OC
54.4 (17.4min, 25.5P0.1, 37.1P1) fps -36%
Sapphire Pulse Radeon RX 7700 XT
48.6 (21.2min, 26.2P0.1, 37.1P1) fps -43%
AMD Radeon RX 6800
47.5 (23min, 26.8P0.1, 36.2P1) fps -44%
Nvidia GeForce RTX 2070 Super
42.3 (16.3min, 20.4P0.1, 30.2P1) fps -50%
Acer Predator BiFrost Arc A770 OC, 16GB GDDR6
41.3 (13.4min, 19.8P0.1, 31.8P1) fps -51%
Sapphire Pulse Radeon RX 6750 XT
39.8 (18.8min, 23.3P0.1, 31.2P1) fps -53%
Nvidia GeForce RTX 2060 Super
36.9 (20.6min, 21.7P0.1, 28.5P1) fps -57%
XFX Speedster QICK 308 Radeon RX 7600 Black Edition
30.5 (3.79min, 3.97P0.1, 8.09P1) fps -64%
Ghostwire Tokyo - 1920x1080 Highest Settings + Maximum Ray Tracing
Palit GeForce RTX 4090 GameRock OC
183.2 (43min, 94.2P0.1, 137.8P1) fps +23%
KFA2 GeForce RTX 4080 Super SG
173.8 (39.1min, 95.5P0.1, 124.3P1) fps +17%
XFX Radeon RX 7900 XTX Merc 310 Black Edition
148.8 (46.5min, 88P0.1, 101.5P1) fps
Asus TUF Gaming GeForce RTX 4070 Ti Super
142.2 (32.5min, 52.5P0.1, 88.4P1) fps -4%
AMD Radeon RX 7900 XTX
136.3 (39.1min, 76.4P0.1, 95.8P1) fps -8%
KFA2 GeForce RTX 4070 Ti SG
130.7 (40.2min, 67.1P0.1, 87.4P1) fps -12%
AMD Radeon RX 7900 XT
116.5 (30.3min, 71.6P0.1, 78.1P1) fps -22%
KFA2 GeForce RTX 4070 EX Gamer
113.3 (41.1min, 59P0.1, 70.4P1) fps -24%
AMD Radeon RX 7900 GRE
100.8 (20.2min, 48.3P0.1, 63.1P1) fps -32%
MSI Radeon RX 6950 XT Gaming X Trio
99 (35.8min, 58.6P0.1, 66P1) fps -33%
AMD Radeon RX 7800 XT
95.3 (30.1min, 39.9P0.1, 57.5P1) fps -36%
ASUS Dual GeForce RTX 4060 Ti OC
88.9 (36.1min, 48.4P0.1, 52.3P1) fps -40%
Sapphire Pulse Radeon RX 7700 XT
82.5 (20.2min, 38.6P0.1, 48.8P1) fps -45%
Nvidia Titan RTX
79 (25.6min, 41.8P0.1, 47.6P1) fps -47%
Acer Predator BiFrost Arc A770 OC, 16GB GDDR6
63.5 (24.4min, 34.3P0.1, 36.2P1) fps -57%
Sapphire Pulse Radeon RX 6750 XT
61.8 (30.9min, 32.8P0.1, 34.4P1) fps -58%
Nvidia GeForce RTX 2070 Super
53.8 (28.3min, 28.7P0.1, 31P1) fps -64%
XFX Speedster QICK 308 Radeon RX 7600 Black Edition
52.8 (26.9min, 27.7P0.1, 28.6P1) fps -65%
Nvidia GeForce RTX 2060 Super
43.7 (23.2min, 23.6P0.1, 24.3P1) fps -71%
Cyberpunk 2077 1.6
1920x1080 Ray Tracing Ultra Preset (DLSS off)
Palit GeForce RTX 4090 GameRock OC (1.6)
135.7 (93.9min) fps +87%
Palit GeForce RTX 4090 GameRock OC (1.6)
118.6 (69.3min) fps +63%
KFA2 GeForce RTX 4080 Super SG (1.6)
104 (78.8min) fps +43%
KFA2 GeForce RTX 4070 Ti SG (1.5)
81.5 (62.2min) fps +12%
Asus TUF Gaming GeForce RTX 4070 Ti Super (1.63)
79.9 (63.5min) fps +10%
XFX Radeon RX 7900 XTX Merc 310 Black Edition (1.6)
72.7 (55.4min) fps
AMD Radeon RX 7900 XTX (1.61)
64.6 (49.1min) fps -11%
KFA2 GeForce RTX 4070 EX Gamer
63.1 fps -13%
AMD Radeon RX 7900 XT (1.61)
57.1 (41.7min) fps -21%
AMD Radeon RX 7900 GRE (1.6)
50.6 (38.5min) fps -30%
ASUS Dual GeForce RTX 4060 Ti OC (1.6)
48 (36.7min) fps -34%
MSI Radeon RX 6950 XT Gaming X Trio (1.61)
47.7 (32.5min) fps -34%
AMD Radeon RX 7800 XT (1.6)
46 (33.3min) fps -37%
Sapphire Pulse Radeon RX 7700 XT (1.6)
39.8 (30min) fps -45%
Sapphire Pulse Radeon RX 7700 XT (1.6)
39.8 (30min) fps -45%
Sapphire Pulse Radeon RX 7700 XT (1.6)
39.8 (30min) fps -45%
AMD Radeon RX 6800 (1.61)
33.7 (23.1min) fps -54%
Nvidia GeForce RTX 2070 Super (1.6)
33.4 fps -54%
Acer Predator BiFrost Arc A770 OC, 16GB GDDR6 (1.6)
29.4 (22.1min) fps -60%
Sapphire Pulse Radeon RX 6750 XT
28.6 fps -61%
Nvidia GeForce RTX 2060 Super (1.6)
25.4 (19.1min) fps -65%
XFX Speedster QICK 308 Radeon RX 7600 Black Edition (1.6)
22.4 (13.9min) fps -69%
3840x2160 Ray Tracing Ultra Preset (DLSS off)
Palit GeForce RTX 4090 GameRock OC (1.6)
44.7 (32.5min) fps +92%
Palit GeForce RTX 4090 GameRock OC (1.6)
42.5 (31.9min) fps +82%
KFA2 GeForce RTX 4080 Super SG (1.6)
31.6 (23.5min) fps +36%
Asus TUF Gaming GeForce RTX 4070 Ti Super (1.63)
24.2 (19.3min) fps +4%
XFX Radeon RX 7900 XTX Merc 310 Black Edition (1.6)
23.3 (17.3min) fps
KFA2 GeForce RTX 4070 Ti SG (1.5)
21.6 (9.54min) fps -7%
AMD Radeon RX 7900 XTX (1.61)
20.7 (14.4min) fps -11%
KFA2 GeForce RTX 4070 EX Gamer
17.9 fps -23%
AMD Radeon RX 7900 XT (1.61)
17.6 (12min) fps -24%
AMD Radeon RX 7900 GRE (1.6)
15 (10.3min) fps -36%
MSI Radeon RX 6950 XT Gaming X Trio (1.61)
13.7 (9.28min) fps -41%
AMD Radeon RX 7800 XT (1.6)
13.7 (10.2min) fps -41%
Sapphire Pulse Radeon RX 7700 XT (1.6)
11.5 (7.84min) fps -51%
Sapphire Pulse Radeon RX 7700 XT (1.6)
11.5 (7.84min) fps -51%
Acer Predator BiFrost Arc A770 OC, 16GB GDDR6 (1.6)
10.1 (8.06min) fps -57%
AMD Radeon RX 6800 (1.61)
9.47 (6.59min) fps -59%
Sapphire Pulse Radeon RX 6750 XT
7.7 fps -67%
Nvidia GeForce RTX 2070 Super (1.6)
2.58 (1.427min) fps -89%
ASUS Dual GeForce RTX 4060 Ti OC (1.6)
2.2 (1.622min) fps -91%
XFX Speedster QICK 308 Radeon RX 7600 Black Edition (1.6)
2.05 (0.904min) fps -91%
Ratchet & Clank Rift Apart
1920x1080 Very High Preset + Very High Raytracing AA:T
Palit GeForce RTX 4090 GameRock OC
138.2 (56.2min, 72.1P0.1, 90.9P1) fps +56%
Palit GeForce RTX 4090 GameRock OC
124.3 (63.5min, 66.3P0.1, 76.3P1) fps +41%
KFA2 GeForce RTX 4080 Super SG
118.3 (62.7min, 66.3P0.1, 71.5P1) fps +34%
XFX Radeon RX 7900 XTX Merc 310 Black Edition
88.4 (59.3min, 60P0.1, 61.7P1) fps
AMD Radeon RX 7800 XT
63.1 (38.7min, 40.4P0.1, 41.4P1) fps -29%
ASUS Dual GeForce RTX 4060 Ti OC
61.7 (32.9min, 35.3P0.1, 38.6P1) fps -30%
Nvidia Titan RTX
61.2 (17min, 32.2P0.1, 35.7P1) fps -31%
AMD Radeon RX 6800
50.5 (30.3min, 31.3P0.1, 32P1) fps -43%
Sapphire Pulse Radeon RX 7700 XT
47.8 (18min, 27.7P0.1, 28.4P1) fps -46%
Acer Predator BiFrost Arc A770 OC, 16GB GDDR6
44.5 (24min, 24.8P0.1, 26.9P1) fps -50%
Sapphire Pulse Radeon RX 6750 XT
38 (18min, 21.8P0.1, 22.5P1) fps -57%
Nvidia GeForce RTX 2070 Super
35.4 (19.7min, 19.7P0.1, 21.1P1) fps -60%
Nvidia GeForce RTX 2060 Super
31.7 (14.1min, 16.3P0.1, 18.5P1) fps -64%
XFX Speedster QICK 308 Radeon RX 7600 Black Edition
12 (5.57min, 5.86P0.1, 6.47P1) fps -86%
3840x2160 Very High Preset + Very High Raytracing + DLSS Quality + FG
Palit GeForce RTX 4090 GameRock OC
145.2 (64.8min, 82.2P0.1, 98.9P1) fps
Palit GeForce RTX 4090 GameRock OC
136.3 (55.4min, 61.1P0.1, 72.9P1) fps
KFA2 GeForce RTX 4080 Super SG
114 (64.1min, 68.6P0.1, 80.8P1) fps
ASUS Dual GeForce RTX 4060 Ti OC
15.6 (5.66min, 6.01P0.1, 6.38P1) fps
Alan Wake 2 - 1920x1080 High Preset + High Ray Tracing
Palit GeForce RTX 4090 GameRock OC
94.3 (58.2min, 64.3P0.1, 75.4P1) fps +77%
KFA2 GeForce RTX 4080 Super SG
76.3 (42min, 55.1P0.1, 61.9P1) fps +43%
Asus TUF Gaming GeForce RTX 4070 Ti Super
69.8 (45.3min, 48.6P0.1, 57.5P1) fps +31%
XFX Radeon RX 7900 XTX Merc 310 Black Edition
53.2 (21.9min, 34.4P0.1, 40.3P1) fps
MSI Radeon RX 6950 XT Gaming X Trio
29.6 (18.3min, 18.6P0.1, 21.9P1) fps -44%
Nvidia Titan RTX
27.9 (19.9min, 20.2P0.1, 21.5P1) fps -48%
Sapphire Pulse Radeon RX 7700 XT
26.7 (18.3min, 18.4P0.1, 20.9P1) fps -50%
AMD Radeon RX 6800
21.1 (15min, 15P0.1, 15.4P1) fps -60%
Sapphire Pulse Radeon RX 6750 XT
17.4 (11.5min, 11.6P0.1, 13P1) fps -67%
Nvidia GeForce RTX 2070 Super
5.28 (2.55min, 2.57P0.1, 2.79P1) fps -90%
Nvidia GeForce RTX 2060 Super
4.9 (2.34min, 2.34P0.1, 2.38P1) fps -91%
XFX Speedster QICK 308 Radeon RX 7600 Black Edition
4.4 (2.21min, 2.21P0.1, 2.24P1) fps -92%
Horizon Zero Dawn - 3840x2160 Ultimate Quality FidelityFX Quality
Palit GeForce RTX 4090 GameRock OC
234 (124min) fps +22%
XFX Radeon RX 7900 XTX Merc 310 Black Edition
192 (98min) fps
KFA2 GeForce RTX 4080 Super SG
191 (87min) fps -1%
Cyberpunk 2077 2.0 Phantom Liberty - 1920x1080 Ray Tracing Ultra Preset (DLSS off)
Palit GeForce RTX 4090 GameRock OC (2.0)
126.3 (100.3min) fps +80%
KFA2 GeForce RTX 4080 Super SG (2.02)
100.1 (76.1min) fps +42%
Asus TUF Gaming GeForce RTX 4070 Ti Super (2.1)
81.8 (63.1min) fps +16%
XFX Radeon RX 7900 XTX Merc 310 Black Edition (2.11)
70.3 (61.5min) fps
MSI Radeon RX 6950 XT Gaming X Trio (2.02)
47.4 (35min) fps -33%
Sapphire Pulse Radeon RX 7700 XT (2.02)
37 (29.3min) fps -47%
AMD Radeon RX 6800 (2.02)
34 (23.8min) fps -52%
Acer Predator BiFrost Arc A770 OC, 16GB GDDR6 (2.0)
31.3 (25.7min) fps -55%
Sapphire Pulse Radeon RX 6750 XT (2.02)
28.1 (19.7min) fps -60%
XFX Speedster QICK 308 Radeon RX 7600 Black Edition (2.02)
23.9 (17.8min) fps -66%
Enshrouded - 3840x2160 Max. Quality + Quality FSR
Palit GeForce RTX 4090 GameRock OC
111.5 (76.6min, 81.9P0.1, 85.9P1) fps +5%
XFX Radeon RX 7900 XTX Merc 310 Black Edition
106.3 (76.7min, 80.4P0.1, 84.3P1) fps
KFA2 GeForce RTX 4080 Super SG
87.8 (63min, 64.6P0.1, 68.2P1) fps -17%

Overview of the Games Tested with the XFX Speedster MERC 310 Radeon RX 7900 XTX Black Edition

all | 2015 | 2017 | 2018 | 2019 | 2020 | 2021 | 2022 | 2023 | 2024
low med. high ultraQHD4K FSR4K
Prince of Persia The Lost Crown (2024) 358 358 358 358 358
Palworld (2024) 236 223 187.3 184.1 154.5 92.2
Enshrouded (2024) 195.5 181.3 159.5 134 105.2 106.3 66
Helldivers 2 (2024) 211 203 198 196.8 153.7 82.7
Skull & Bones (2024) 210 165 132 129 112 101 68
Last Epoch (2024) 297 296 294 293 238 104.4
Alone in the Dark (2024) 308 297 297 231 148 148.3 70.9
Horizon Forbidden West (2024) 222 221 166.2 162.1 132.8 109.6 84.9
Dragon's Dogma 2 (2024) 100.4 101.9 101 93.5 89.9
show all (69 hidden)

Emissions - Cooling more than 400 watts is audible

Noise Emissions

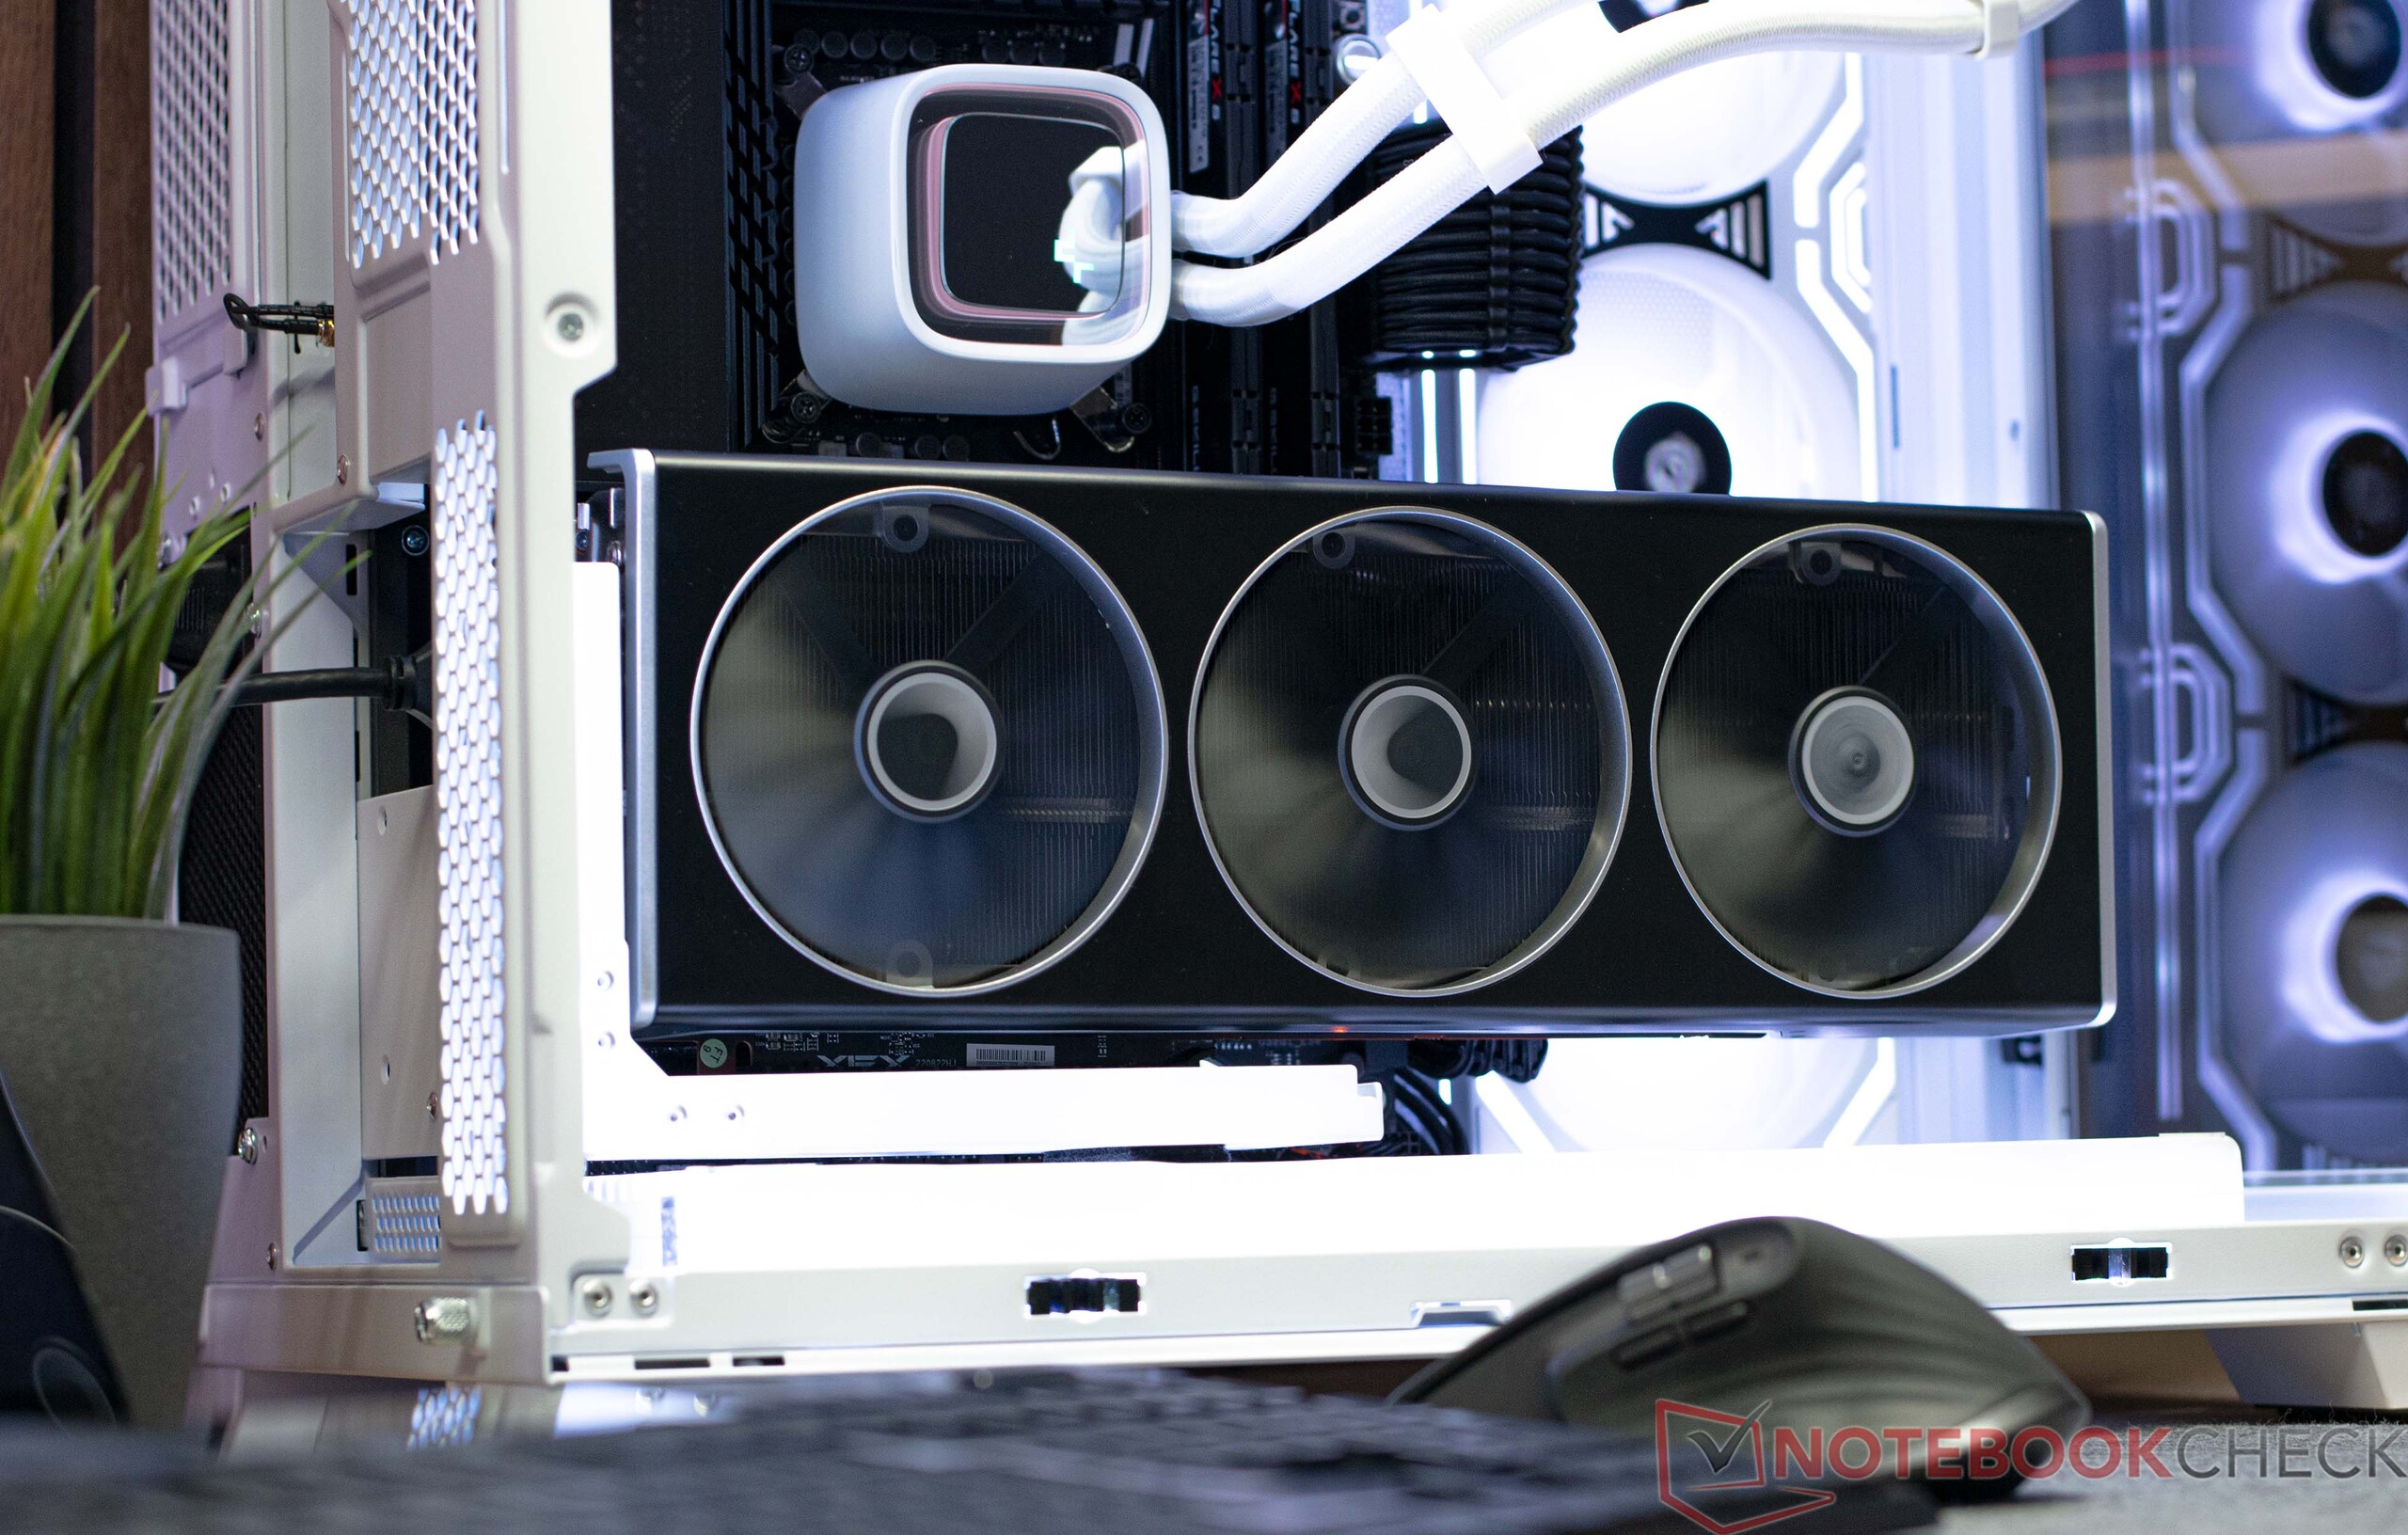
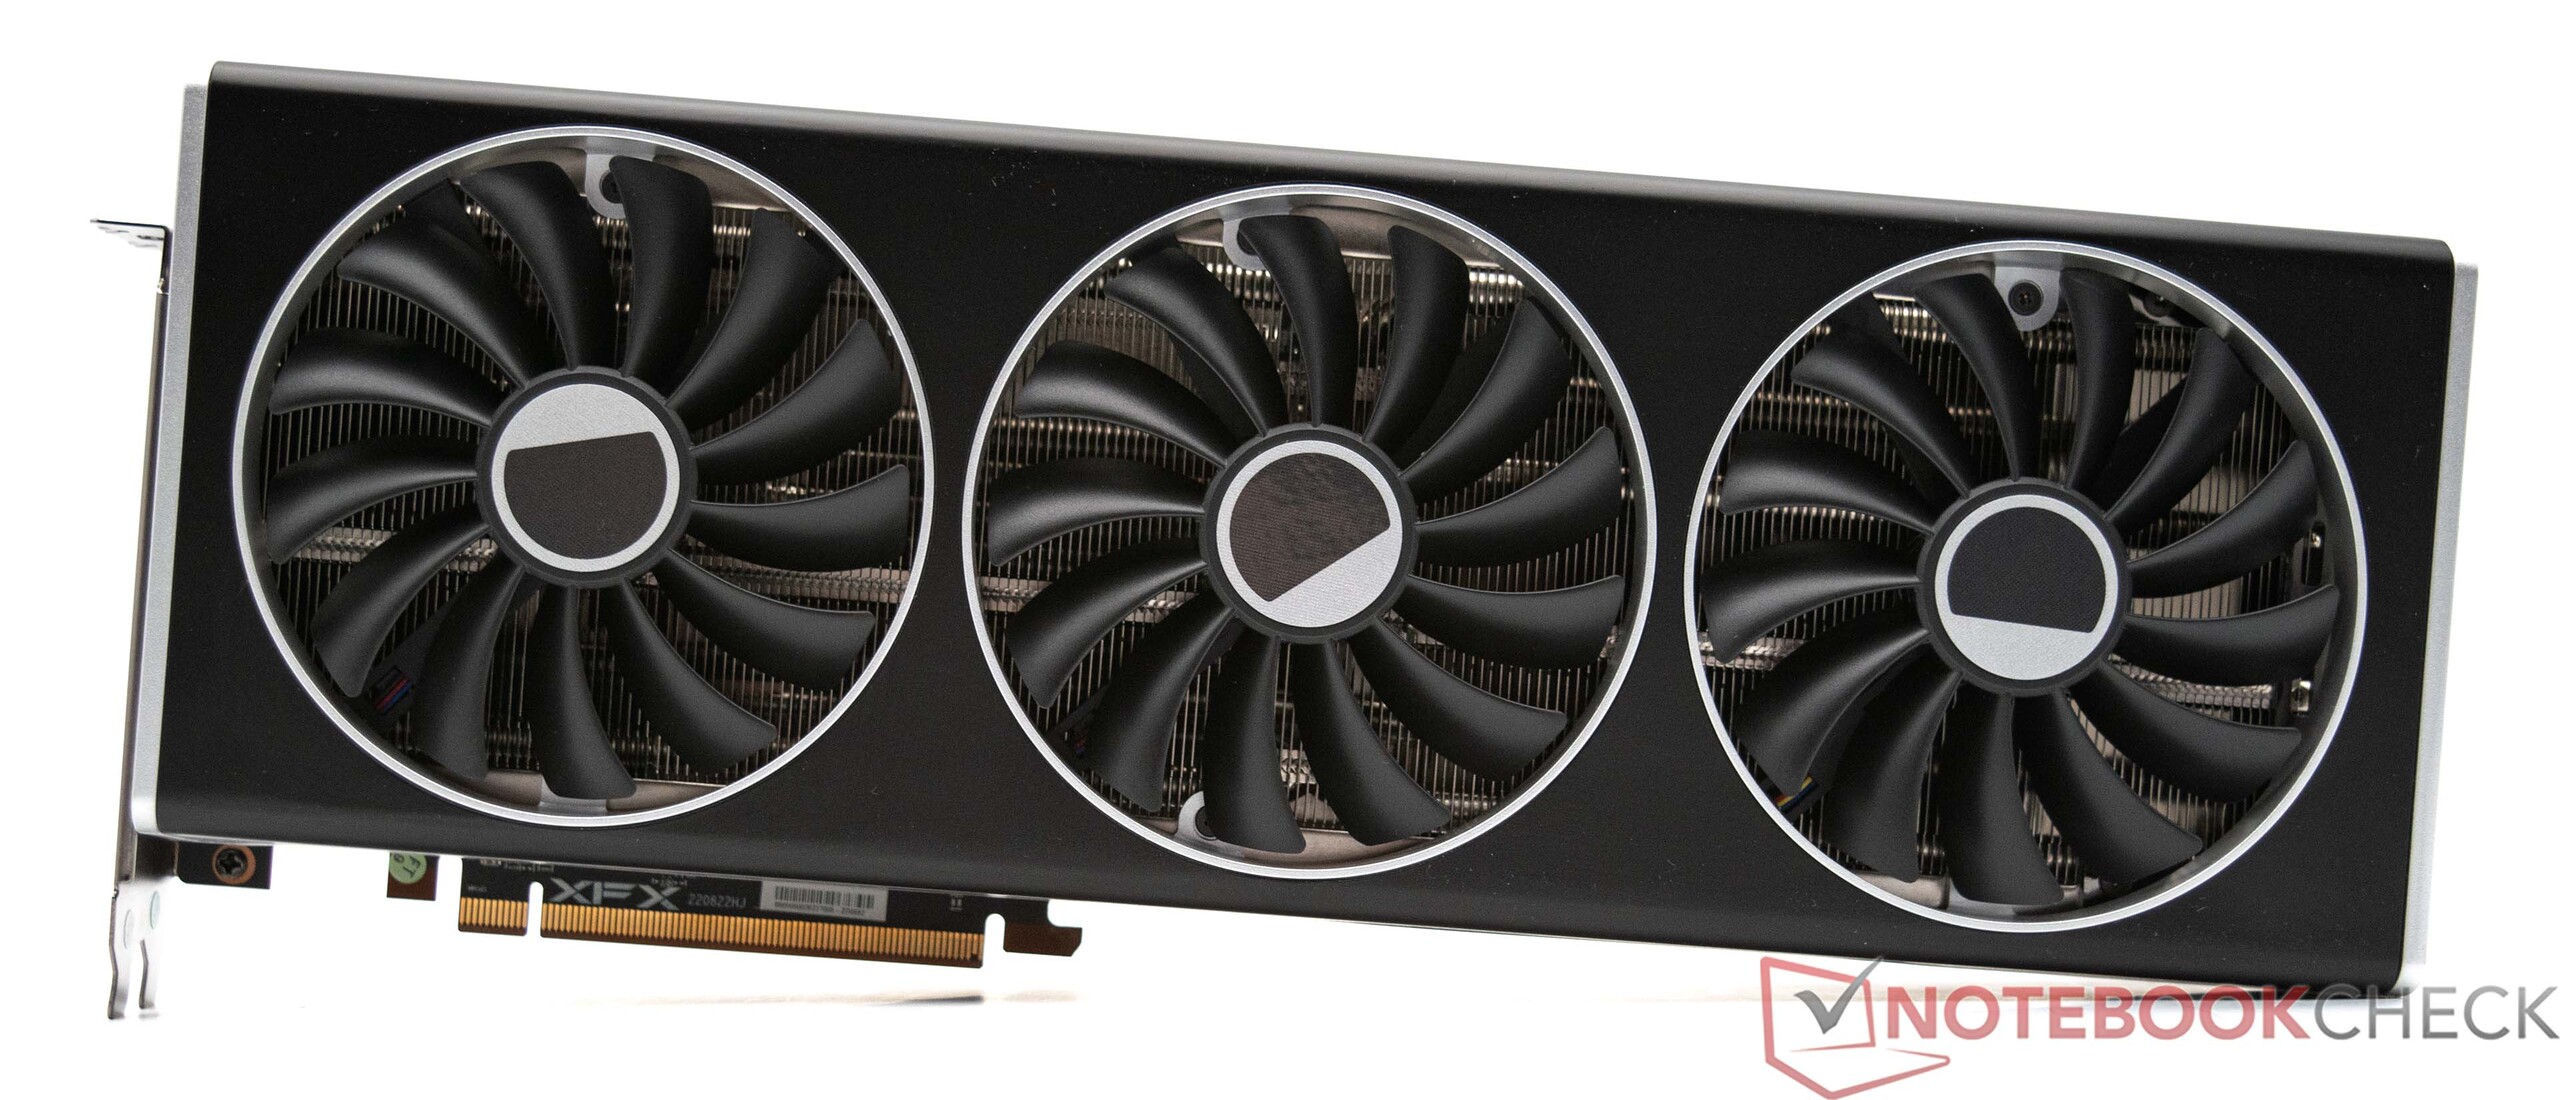
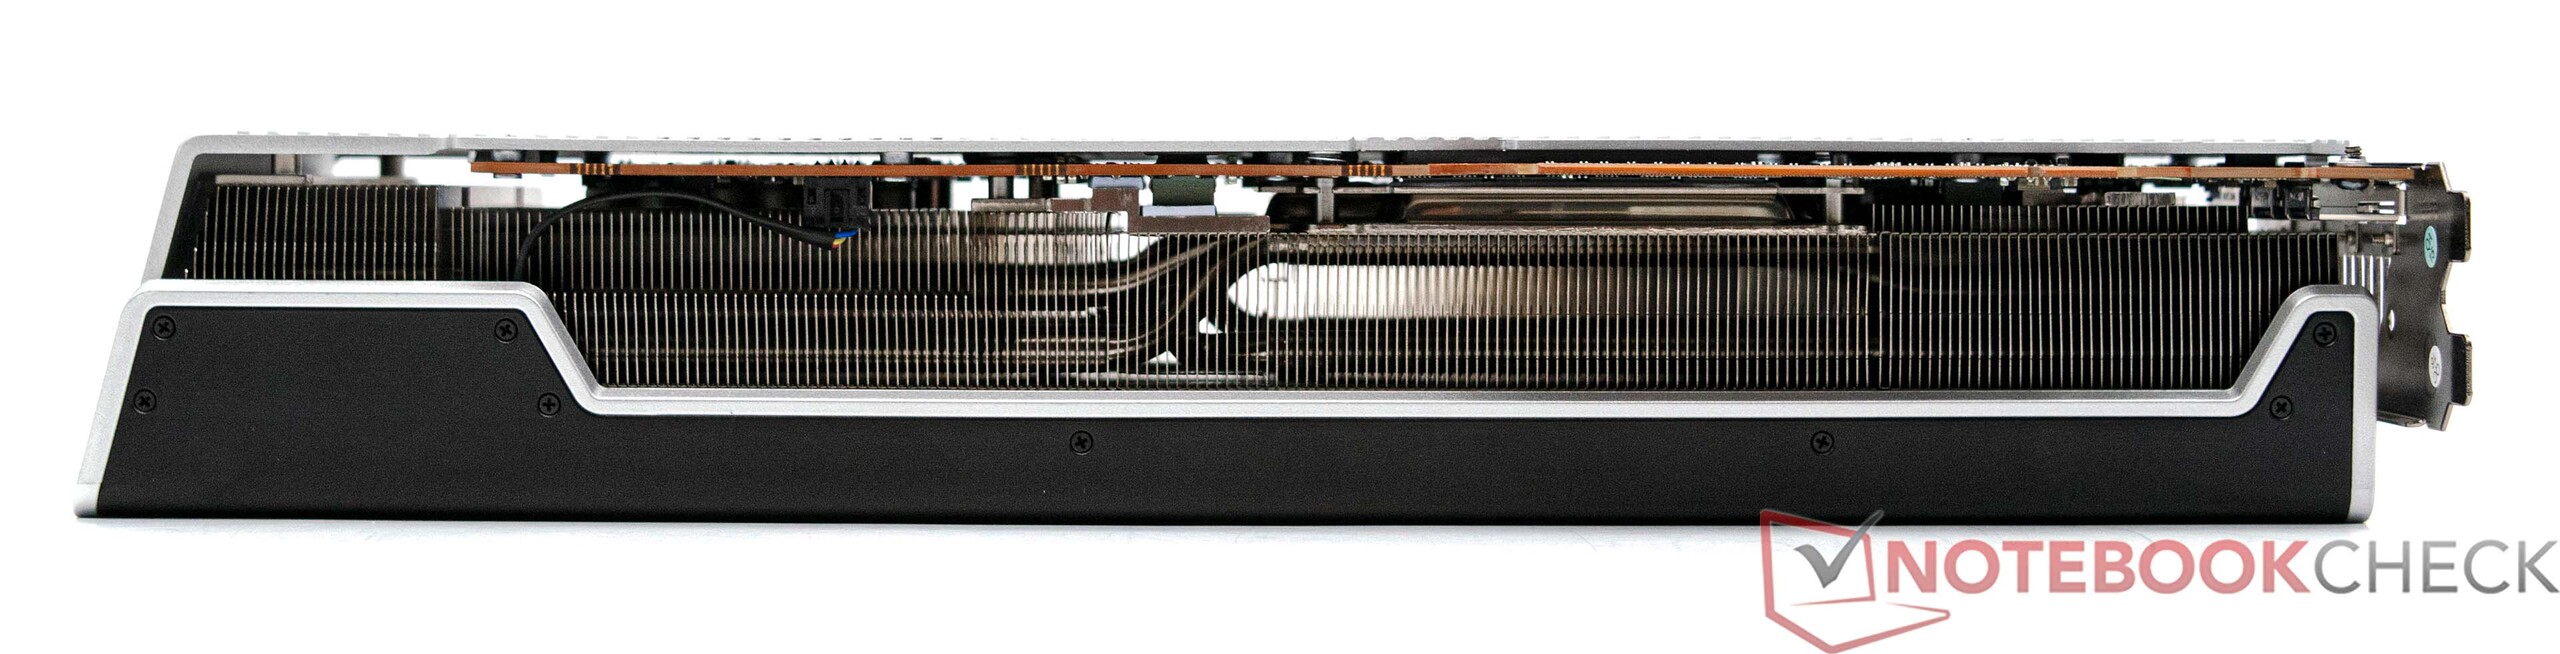
XFX uses a very long cooling element with three 100-millimeter (~3.9 in) fans in the Speedster MERC 310 Radeon RX 7900 XTX Black Edition. The back consists of a massive metal plate that is also used to dissipate the heat. The Performance BIOS allows a power consumption of just above 400 watts for the graphics card, which makes it clearly audible under load. You can still hear the graphics card even inside an enclosed case.

For our test, we move the XFX Speedster MERC 310 Radeon RX 7900 XTX Black Edition into our noise level test system with an open setup. If there is no load, the graphics card can be cooled silently. But we still notice some quiet electronic noises, although they aren't audible in regular operation. Under low load, the fans spin at a low speed, only producing a noise level of around 29.7 dB(A). As already mentioned, the fans spin up quite a bit under full load, where we measure top noise levels of 51.6 dB(A). Those who don't use the graphics card with the Performance BIOS will be rewarded with lower noise levels, and the maximum noise level then drops to about 45 dB(A) with our open setup. Features such as VSync or manual frame rate limitation also have an influence on the noise level of the graphics card. You can also manually adjust the fan curve in the AMD driver.

XFX Speedster MERC 310 Radeon RX 7900 XTX Black Edition during the noise level measurements

Noise Level

Idle
25.9 / 25.9 / 26 dB(A)
Load
29.7 / 51.6 dB(A)
  red to green bar
 
 
30 dB
silent
40 dB(A)
audible
50 dB(A)
loud
 
min: dark, med: mid, max: light   Earthworks M23R (15 cm distance)   environment noise: 24.9 dB(A)
dB(A) 0102030405060708090Deep BassMiddle BassHigh BassLower RangeMidsHigher MidsLower HighsMid HighsUpper HighsSuper Highs2039.739.736.437.335.734.136.939.72541.541.531.32829.827.833.441.53140.640.633.332.83229.331.740.64039.539.530.528.127.427.824.939.550404030.336.736.837.523.5406338.238.224.821.423.22225.738.28037.737.724.321.72222.22537.710040.140.124.521.621.121.52340.112537.937.925.416.916.517.915.937.916039.339.322.811.811.812.111.639.320040.240.225.612.710.911.311.740.225041.441.418.310.910.510.78.841.431543.843.817.313.311.612.410.143.840048.848.82014.814.214.28.748.8500424218.712.512.512.38.642630404017.312.111.711.89.14080038.438.4161110.710.81038.4100036.936.9131110.910.91136.9125039.739.713.811.311.411.210.739.7160042.842.814.712.112.211.810.742.8200043.143.117.814.614.714.611.843.1250037.437.417.513.113.113.212.437.4315032.732.717.313.713.713.913.232.7400030.630.618.214.514.514.414.130.6500032.732.719.3151514.914.232.7630032.132.117.915.515.415.514.732.18000393918.615.415.415.314.8391000032.532.518.315.415.515.41532.51250024.224.216.415.415.415.414.824.21600024.624.62118.21818.114.424.6SPL51.651.629.72625.925.924.951.6N8.48.41.30.70.70.70.68.4median 39median 39median 18.2median 13.7median 13.7median 13.9median 11.8median 39Delta4.44.41.61.52.21.924.4hearing rangehide median Fan NoiseXFX Radeon RX 7900 XTX Merc 310 Black Edition

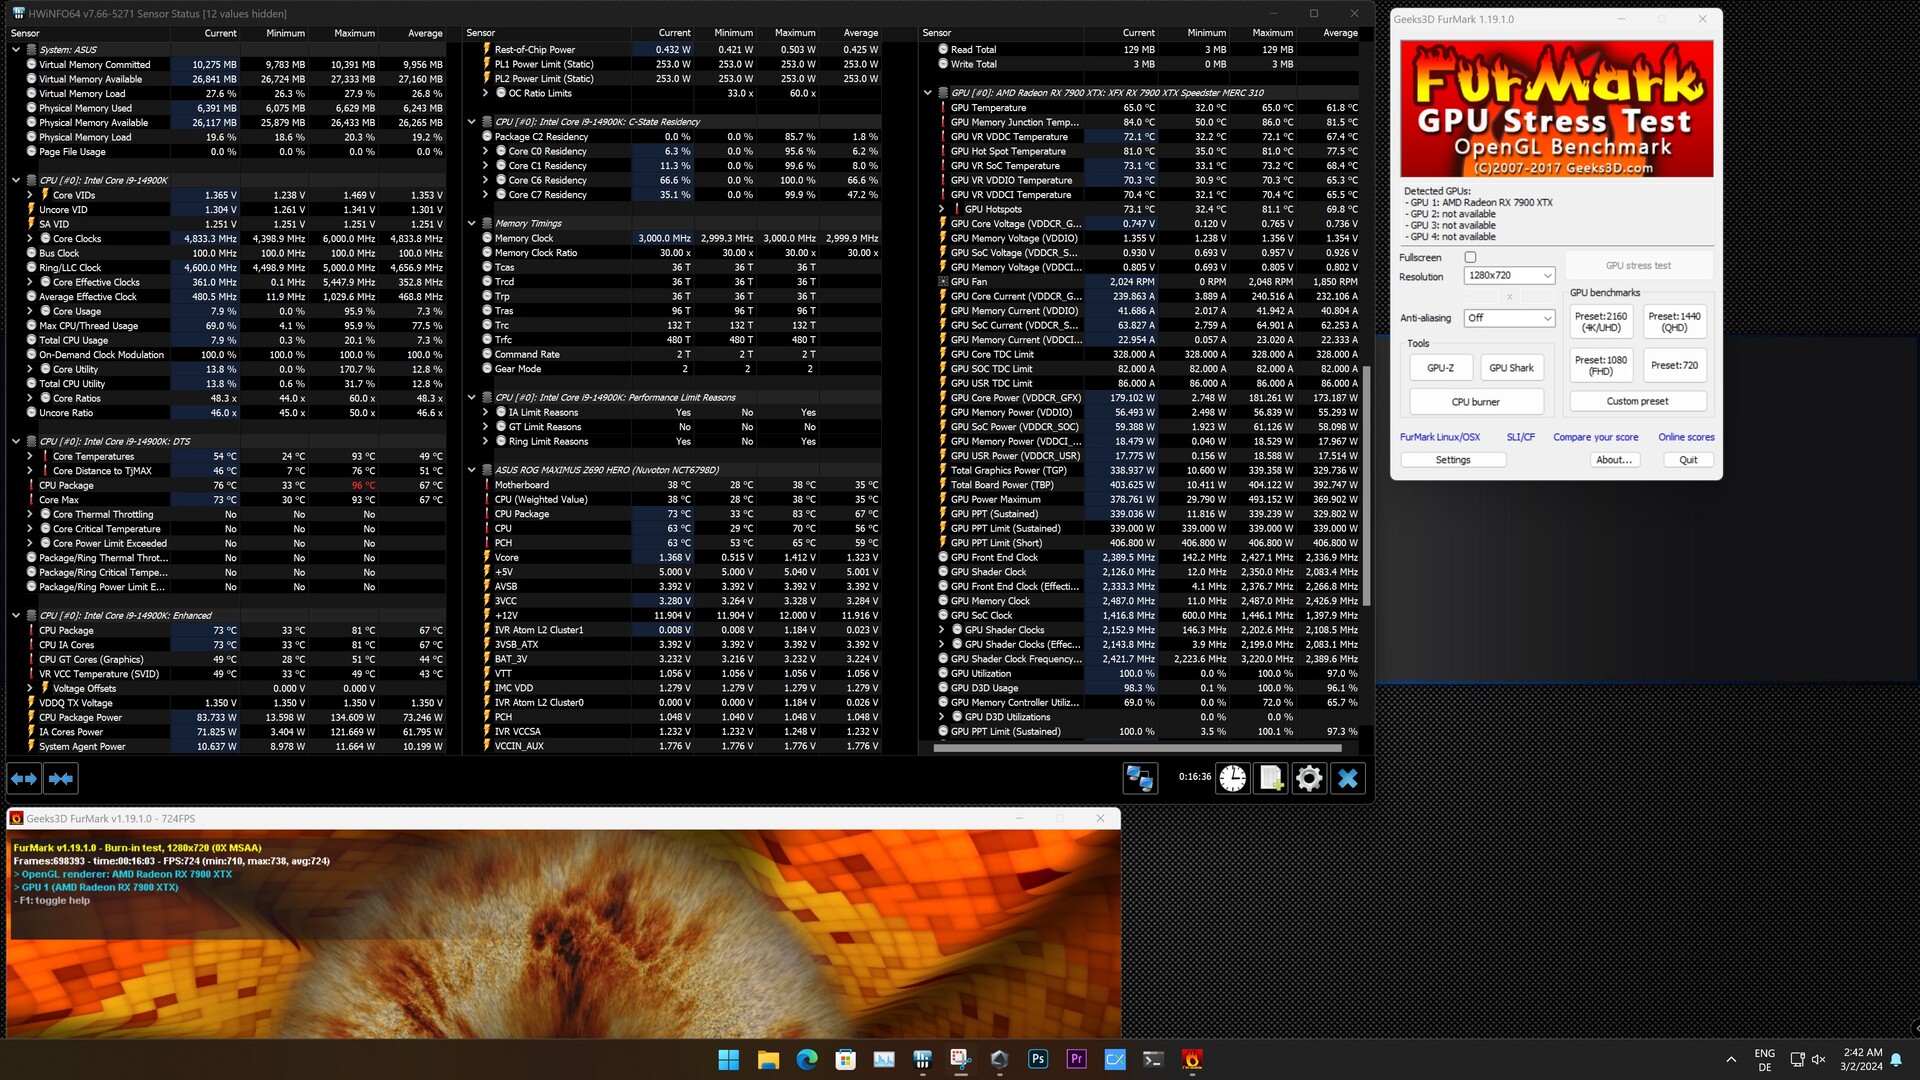
Temperatures and Power Consumption

During the stress test, we see that the XFX Speedster MERC 310 Radeon RX 7900 XTX Black Edition is able to maintain its high performance constantly. At the GPU hotspot, our test unit reaches 81 °C (178 °F), although the maximum temperature of the VRAM is 86 °C (187°F). As cooling system, XFX uses a vapor chamber unit that covers the GPU chip and the VRAM. Numerous heat pipes will then lead the heat to the large cooling body and fins that are provided with cool air by three 100-millimeter (~3.9 in) fans. The design works well, and the graphics card is able to constantly maintain almost 400 Watt (TGP - Total Graphics Power) on average.

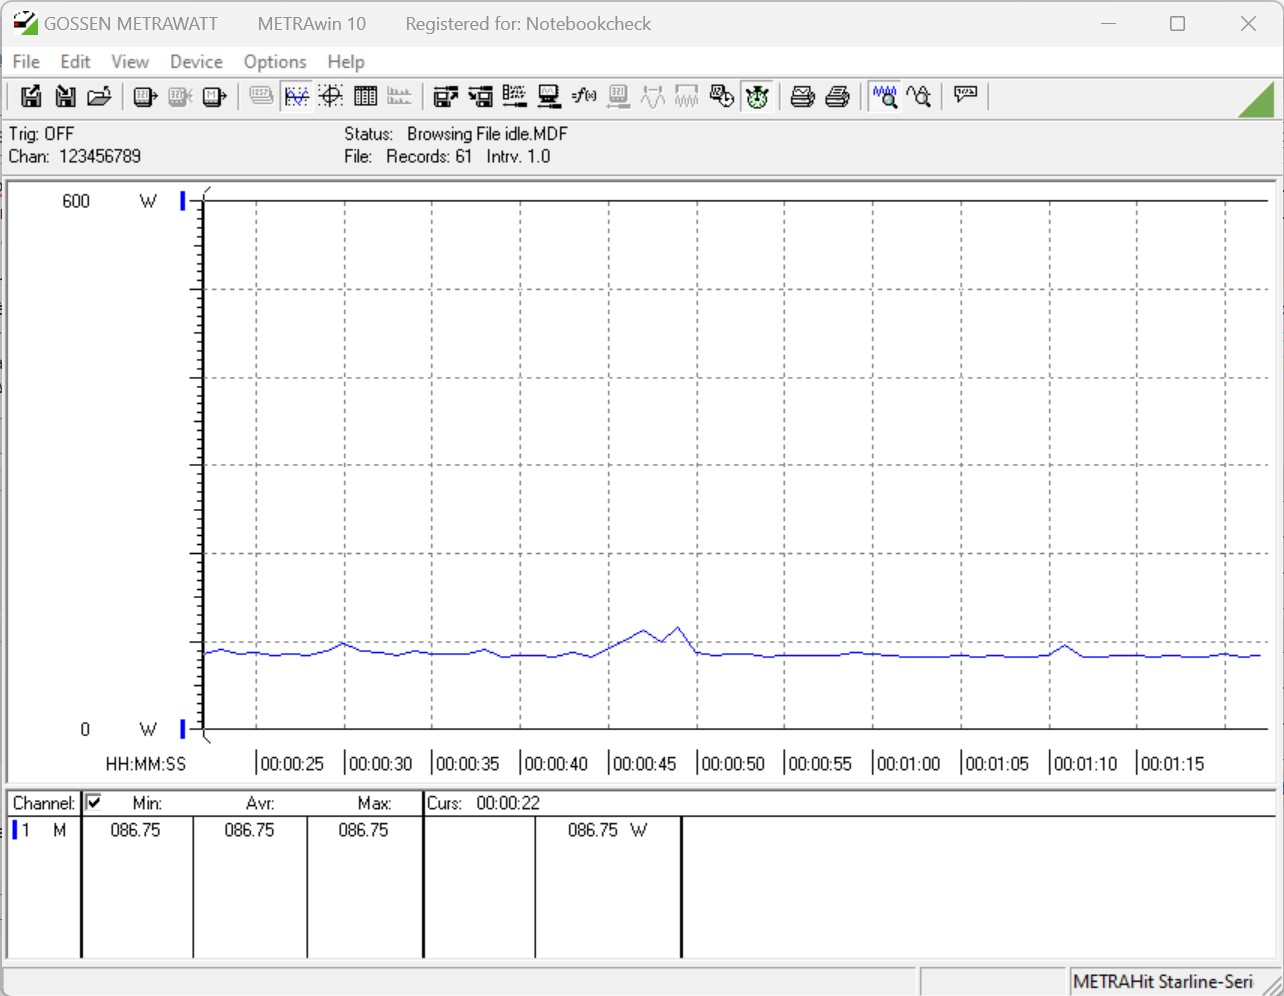
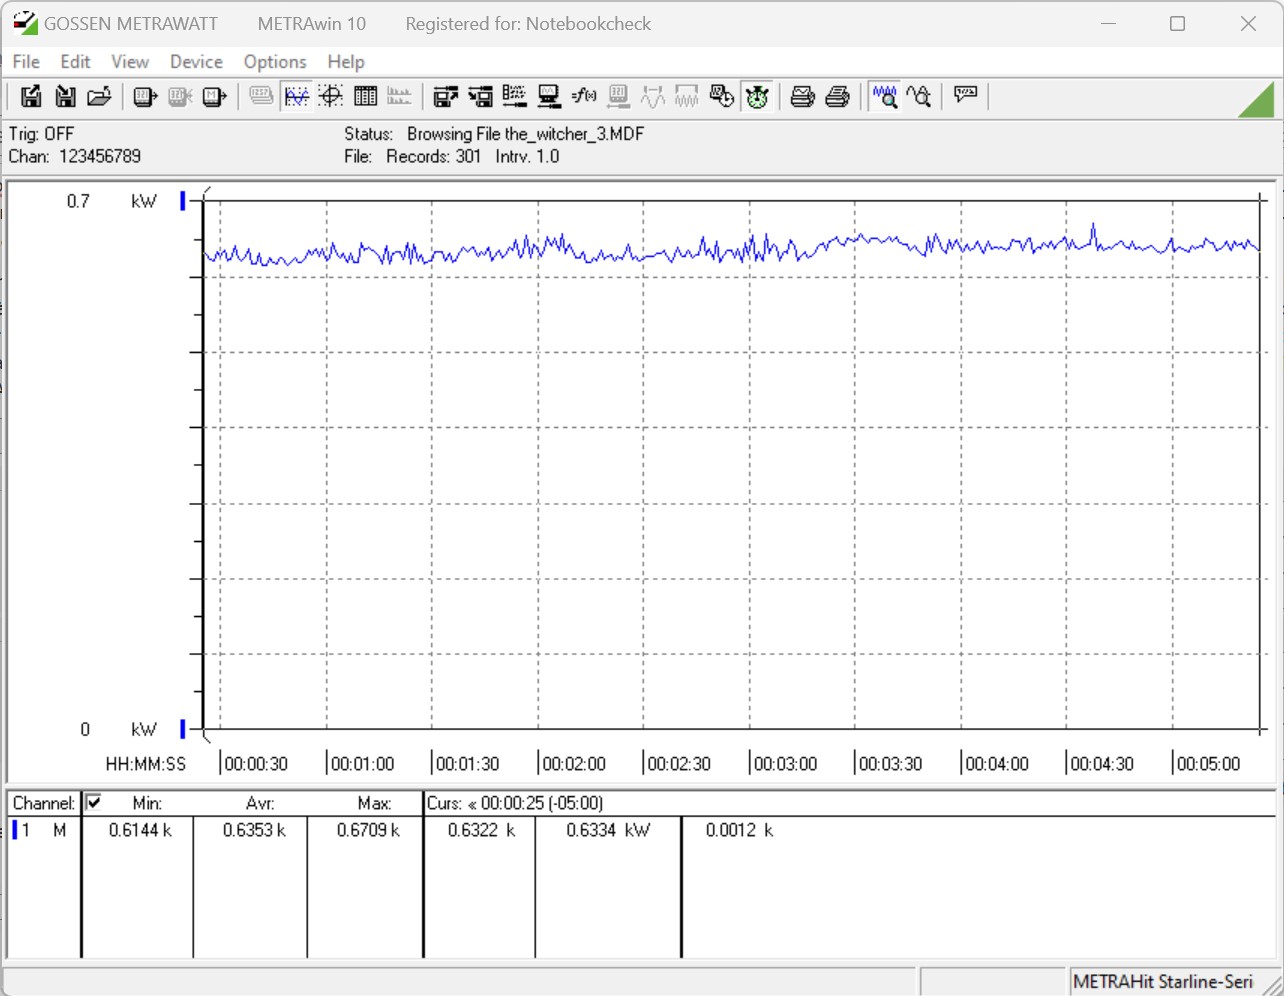
AMD's top models are known for not being the most efficient. This also goes for the XFX Speedster MERC 310 Radeon RX 7900 XTX Black Edition, which consumes a lot of power without manual tuning. With 590 watts on average during the stress test, our test unit places directly behind the Palit GeForce RTX 4090 GameRock OC. While gaming, that will even move clearly ahead with 635 watts on average. Due to the CPU limitation, Nvidia's top model is unable to deliver its full performance here. Looking at brief load peaks, we measure almost 600 watts, so the power supply has to hold up to heavy demands. This also explains the manufacturer's recommendation for an 850-Watt power supply, and in our opinion you'd be wise to stick to that.

FurMark stress test (PT, 100%, Performance BIOS)
Power consumption of our test system during idle operation
Power consumption of our test system during the stress test
Power consumption of our test system while gaming (The Witcher 3, 1080p; Preset: Ultra)
XFX Speedster MERC 310 Radeon RX 7900 XTX Black Edition during the stress test
XFX Speedster MERC 310 Radeon RX 7900 XTX Black Edition while gaming (The Witcher 3, 1080p; Preset: Ultra)
 
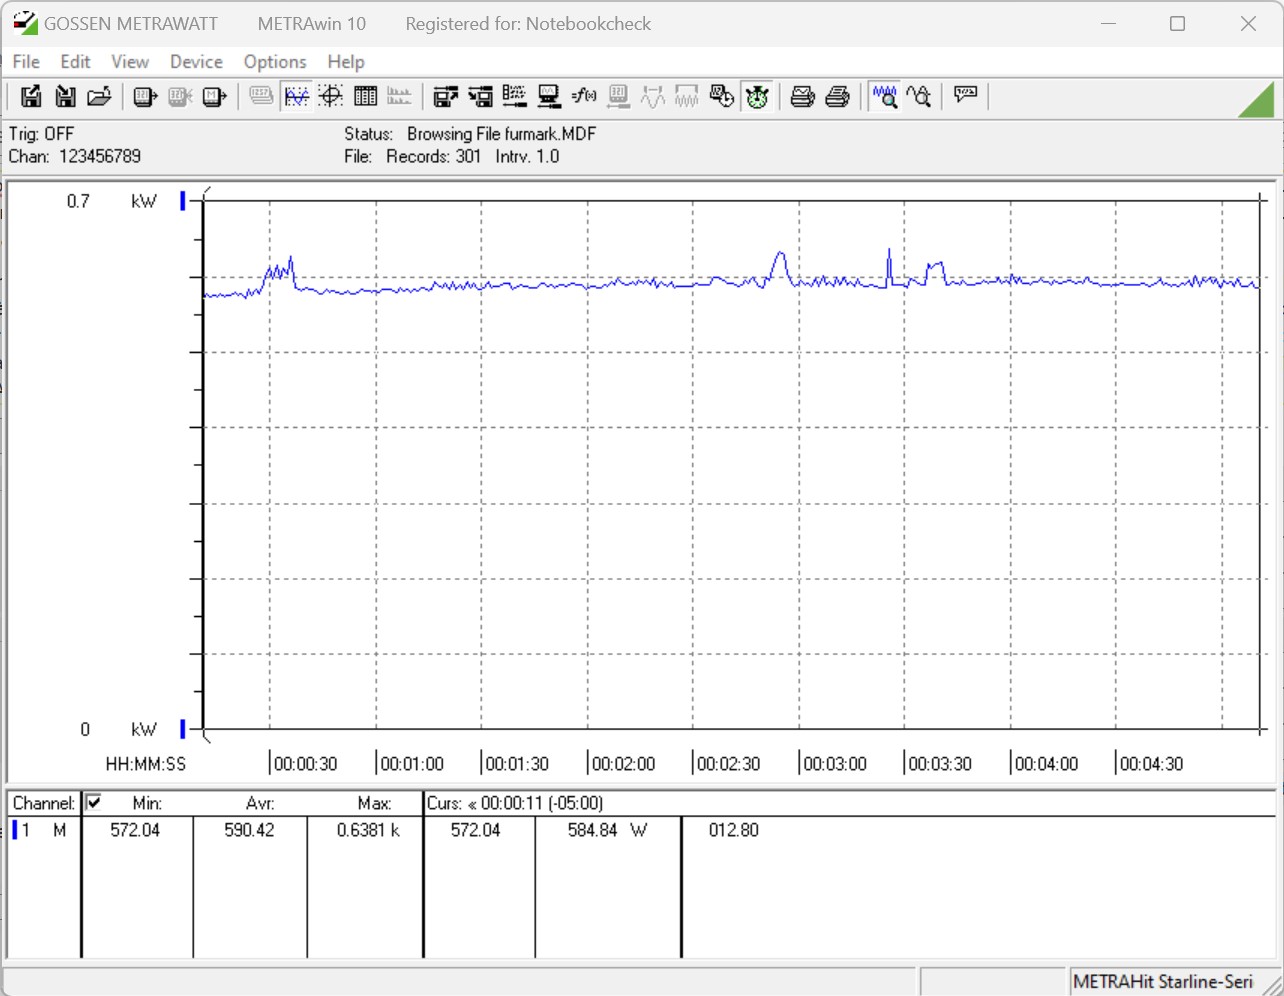
Power Consumption / FurMark 1.19 GPU Stress Test (external Monitor)
Palit GeForce RTX 4090 GameRock OC
Palit GeForce RTX 4090 GameRock OC, AMD Ryzen 9 7950X
611 (597.78min - 648.9max) Watt * -4%
XFX Radeon RX 7900 XTX Merc 310 Black Edition
XFX Radeon RX 7900 XTX Merc 310 Black Edition, Intel Core i9-14900K
590 (572min, 574P1 - 638max) Watt *
AMD Radeon RX 7900 XTX
AMD Radeon RX 7900 XTX, AMD Ryzen 9 7950X (Idle: 86.5 W)
518 (501min, 502P1 - 525max) Watt * +12%
NVIDIA GeForce RTX 3090 Founders Edition
NVIDIA GeForce RTX 3090 Founders Edition, AMD Ryzen 9 7950X
516 (512min, 514P1 - 541max) Watt * +13%
AMD Radeon RX 7900 XT
AMD Radeon RX 7900 XT, AMD Ryzen 9 7950X (Idle: 84.6 W)
513 (500min, 506P1 - 527max) Watt * +13%
KFA2 GeForce RTX 3070 Ti SG
KFA2 GeForce RTX 3070 Ti SG, AMD Ryzen 9 7950X (Idle: 88.9 W)
472 (464min, 465P1 - 531max) Watt * +20%
KFA2 GeForce RTX 4080 SG
KFA2 GeForce RTX 4080 SG, AMD Ryzen 9 7950X (Idle: 86.4 W)
468 (453min, 459P1 - 480max) Watt * +21%
KFA2 GeForce RTX 4070 Ti EX Gamer
KFA2 GeForce RTX 4070 Ti EX Gamer, AMD Ryzen 9 7950X
451 (345min, 415P1 - 474max) Watt * +24%
KFA2 GeForce RTX 4080 Super SG
KFA2 GeForce RTX 4080 Super SG, Intel Core i9-14900K
441 (426min, 433P1 - 452max) Watt * +25%
AMD Radeon RX 7900 GRE
AMD Radeon RX 7900 GRE, AMD Ryzen 9 7950X
418 (412min, 414P1 - 431max) Watt * +29%
Sapphire Pulse Radeon RX 6750 XT
Sapphire Pulse Radeon RX 6750 XT, AMD Ryzen 9 7950X
414 (410min, 411P1 - 423max) Watt * +30%
AMD Radeon RX 7800 XT
AMD Radeon RX 7800 XT, AMD Ryzen 9 7950X
408 (375min, 380P1 - 434max) Watt * +31%
Acer Predator BiFrost Arc A770 OC, 16GB GDDR6
Acer Predator BiFrost Arc A770 OC, 16GB GDDR6, AMD Ryzen 9 7950X
350 (336min, 338P1 - 372max) Watt * +41%
XFX Speedster QICK 308 Radeon RX 7600 Black Edition
XFX Speedster QICK 308 Radeon RX 7600 Black Edition, AMD Ryzen 9 7950X
333 (323min, 325P1 - 352max) Watt * +44%
Sapphire Nitro+ Radeon RX 6650 XT
Sapphire Nitro+ Radeon RX 6650 XT, AMD Ryzen 9 5900X
329 (305min, 319P1 - 354max) Watt * +44%
KFA2 GeForce RTX 4070 EX Gamer
KFA2 GeForce RTX 4070 EX Gamer, AMD Ryzen 9 7950X
329 (257min, 289P1 - 337max) Watt * +44%
KFA2 GeForce RTX 4060 Ti EX
KFA2 GeForce RTX 4060 Ti EX, AMD Ryzen 9 7950X
308 (303min, 305P1 - 318max) Watt * +48%
KFA2 GeForce RTX 4060 1-Click-OC 2X
KFA2 GeForce RTX 4060 1-Click-OC 2X, AMD Ryzen 9 7950X
251 (244min, 245P1 - 259max) Watt * +57%
Power Consumption / The Witcher 3 ultra (external Monitor)
XFX Radeon RX 7900 XTX Merc 310 Black Edition
XFX Radeon RX 7900 XTX Merc 310 Black Edition, Intel Core i9-14900K
635 (615min, 617P1 - 671max) Watt *
AMD Radeon RX 7900 XTX
AMD Radeon RX 7900 XTX, AMD Ryzen 9 7950X (Idle: 86.5 W)
540 (527min, 530P1 - 564max) Watt * +15%
NVIDIA GeForce RTX 3090 Founders Edition
NVIDIA GeForce RTX 3090 Founders Edition, AMD Ryzen 9 7950X
538 (532min, 532P1 - 570max) Watt * +15%
Palit GeForce RTX 4090 GameRock OC
Palit GeForce RTX 4090 GameRock OC, AMD Ryzen 9 7950X
531.8 (520min - 571max) Watt * +16%
KFA2 GeForce RTX 4080 Super SG
KFA2 GeForce RTX 4080 Super SG, Intel Core i9-14900K
489 (481min, 482P1 - 502max) Watt * +23%
KFA2 GeForce RTX 4080 SG
KFA2 GeForce RTX 4080 SG, AMD Ryzen 9 7950X (Idle: 86.4 W)
461 (450min, 453P1 - 476max) Watt * +27%
AMD Radeon RX 7900 XT
AMD Radeon RX 7900 XT, AMD Ryzen 9 7950X (Idle: 84.6 W)
459 (451min, 453P1 - 488max) Watt * +28%
KFA2 GeForce RTX 3070 Ti SG
KFA2 GeForce RTX 3070 Ti SG, AMD Ryzen 9 7950X (Idle: 88.9 W)
453 (447min, 448P1 - 469max) Watt * +29%
AMD Radeon RX 7900 GRE
AMD Radeon RX 7900 GRE, AMD Ryzen 9 7950X
440 (433min, 435P1 - 447max) Watt * +31%
KFA2 GeForce RTX 4070 Ti EX Gamer
KFA2 GeForce RTX 4070 Ti EX Gamer, AMD Ryzen 9 7950X
426 (418min, 421P1 - 437max) Watt * +33%
AMD Radeon RX 7800 XT
AMD Radeon RX 7800 XT, AMD Ryzen 9 7950X
425 (421min, 422P1 - 429max) Watt * +33%
Sapphire Pulse Radeon RX 6750 XT
Sapphire Pulse Radeon RX 6750 XT, AMD Ryzen 9 7950X
395 (384min, 385P1 - 420max) Watt * +38%
KFA2 GeForce RTX 4070 EX Gamer
KFA2 GeForce RTX 4070 EX Gamer, AMD Ryzen 9 7950X
359 (356min, 356P1 - 375max) Watt * +43%
XFX Speedster QICK 308 Radeon RX 7600 Black Edition
XFX Speedster QICK 308 Radeon RX 7600 Black Edition, AMD Ryzen 9 7950X
346 (340min, 341P1 - 351max) Watt * +46%
Sapphire Nitro+ Radeon RX 6650 XT
Sapphire Nitro+ Radeon RX 6650 XT, AMD Ryzen 9 5900X
339 (332min, 334P1 - 366max) Watt * +47%
KFA2 GeForce RTX 4060 Ti EX
KFA2 GeForce RTX 4060 Ti EX, AMD Ryzen 9 7950X
311 (300min, 302P1 - 329max) Watt * +51%
Acer Predator BiFrost Arc A770 OC, 16GB GDDR6
Acer Predator BiFrost Arc A770 OC, 16GB GDDR6, AMD Ryzen 9 7950X
287 (283min, 284P1 - 311max) Watt * +55%
KFA2 GeForce RTX 4060 1-Click-OC 2X
KFA2 GeForce RTX 4060 1-Click-OC 2X, AMD Ryzen 9 7950X
272 (264min, 266P1 - 297max) Watt * +57%
Power Consumption / Witcher 3 ultra Efficiency (external Monitor)
Palit GeForce RTX 4090 GameRock OC
Palit GeForce RTX 4090 GameRock OC, AMD Ryzen 9 7950X
0.602 fps per Watt +28%
KFA2 GeForce RTX 4080 SG
KFA2 GeForce RTX 4080 SG, AMD Ryzen 9 7950X
0.581 fps per Watt +24%
AMD Radeon RX 7900 XT
AMD Radeon RX 7900 XT, AMD Ryzen 9 7950X
0.577 fps per Watt +23%
AMD Radeon RX 7900 XTX
AMD Radeon RX 7900 XTX, AMD Ryzen 9 7950X
0.55 fps per Watt +17%
KFA2 GeForce RTX 4080 Super SG
KFA2 GeForce RTX 4080 Super SG, Intel Core i9-14900K
0.538 fps per Watt +15%
KFA2 GeForce RTX 4070 Ti EX Gamer
KFA2 GeForce RTX 4070 Ti EX Gamer, AMD Ryzen 9 7950X
0.509 fps per Watt +8%
AMD Radeon RX 7900 GRE
AMD Radeon RX 7900 GRE, AMD Ryzen 9 7950X
0.4777 fps per Watt +2%
KFA2 GeForce RTX 4070 EX Gamer
KFA2 GeForce RTX 4070 EX Gamer, AMD Ryzen 9 7950X
0.4769 fps per Watt +2%
XFX Radeon RX 7900 XTX Merc 310 Black Edition
XFX Radeon RX 7900 XTX Merc 310 Black Edition, Intel Core i9-14900K
0.4693 fps per Watt
KFA2 GeForce RTX 4060 Ti EX
KFA2 GeForce RTX 4060 Ti EX, AMD Ryzen 9 7950X
0.4521 fps per Watt -4%
AMD Radeon RX 7800 XT
AMD Radeon RX 7800 XT, AMD Ryzen 9 7950X
0.4461 fps per Watt -5%
KFA2 GeForce RTX 4060 1-Click-OC 2X
KFA2 GeForce RTX 4060 1-Click-OC 2X, AMD Ryzen 9 7950X
0.4103 fps per Watt -13%
Sapphire Pulse Radeon RX 6750 XT
Sapphire Pulse Radeon RX 6750 XT, AMD Ryzen 9 7950X
0.3597 fps per Watt -23%
NVIDIA GeForce RTX 3090 Founders Edition
NVIDIA GeForce RTX 3090 Founders Edition, AMD Ryzen 9 7950X
0.358 fps per Watt -24%
XFX Speedster QICK 308 Radeon RX 7600 Black Edition
XFX Speedster QICK 308 Radeon RX 7600 Black Edition, AMD Ryzen 9 7950X
0.354 fps per Watt -25%
KFA2 GeForce RTX 3070 Ti SG
KFA2 GeForce RTX 3070 Ti SG, AMD Ryzen 9 7950X
0.3241 fps per Watt -31%
Sapphire Nitro+ Radeon RX 6650 XT
Sapphire Nitro+ Radeon RX 6650 XT, AMD Ryzen 9 5900X
0.3168 fps per Watt -32%
Acer Predator BiFrost Arc A770 OC, 16GB GDDR6
Acer Predator BiFrost Arc A770 OC, 16GB GDDR6, AMD Ryzen 9 7950X
0.2491 fps per Watt -47%

* ... smaller is better

Power Consumption With External Monitor

03570105140175210245280315350385420455490525560595630665Tooltip
XFX Radeon RX 7900 XTX Merc 310 Black Edition; 1280x720 FurMark 1.19 GPU Stress Test (external Monitor): Ø590 (572-638)
XFX Radeon RX 7900 XTX Merc 310 Black Edition; 1920x1080 The Witcher 3 ultra (external Monitor): Ø635 (615-671)
XFX Radeon RX 7900 XTX Merc 310 Black Edition; Idle 1min (external Monitor): Ø87 (82-116.2)

Pros

+ high 3D performance throughout
+ suitable for 2160p
+ good performance with professional applications
+ fan stop mode
+ simple design
+ relatively low price

Cons

- loud under load
- raytracing performance worse than competitors
- high power consumption

Verdict - Good price-performance ratio with 24 GB VRAM

The XFX Speedster MERC 310 Radeon RX 7900 XTX Black Edition in our test

The XFX Speedster MERC 310 Radeon RX 7900 XTX Black Edition is a good alternative to AMD's reference design if you need to tease a higher performance from the hardware used. At this point, nothing has changed in the architecture, even though the higher performance of our test unit compared to the reference model is only achieved due to the higher GPU clock speeds. However, XFX also pays for the additional performance with a huge power consumption that almost comes close to that of an Nvidia GeForce RTX 4090. The direct competitor of the AMD Radeon RX 7900 XTX is the Nvidia GeForce RTX 4080 Super that has only been introduced in the beginning of this year, though. AMD has not announced any update of its top models yet, so it is currently entering the competition with a graphics card that is more than a year old. The performance of the XFX Speedster MERC 310 Radeon RX 7900 XTX Black Edition is excellent, as long as you don't use the raytracing features. Without this feature, the XFX Speedster MERC 310 Radeon RX 7900 XTX Black Edition often even reaches the same frame rates as Nvidia's currently fastest Super model.

The XFX Speedster MERC 310 Radeon RX 7900 XTX Black Edition is a good AMD graphics card and a good price-performance alternative to the current Nvidia GeForce RTX 4080 Super. The larger VRAM is reassuring, even though the efficiency of the AMD graphics card is unable to keep up with Nvidia.

Arguments for the purchase of the AMD graphics card are the large VRAM with 24 GB as well as the relatively low purchase price compared to the competitors. You still have to pay around 950 Euros (~$1,031) for AMD's top model, while an Nvidia GeForce RTX 4080 Super currently costs more than 1,100 Euros (~$1,193). You have to decide for yourself whether the higher raytracing performance is worth the additional cost.

With the XFX Speedster MERC 310 Radeon RX 7900 XTX Black Edition, you get a very powerful Radeon RX 7900 XT. With a little fine tuning, you can counter the high power consumption and improve its efficiency significantly. But those who want to use the graphics card with the settings out of the box should better use it with the Standard BIOS.

Price and Availability

The XFX Speedster MERC 310 Radeon RX 7900 XTX Black Edition is currently available for example from Amazon for ~$930 or from BestBuy for $999.

static version load dynamic
Loading comments
Comment on this article

Transparency

The present review sample was freely purchased by the author at his/her own expense. The manufacturer did not receive a copy of this review before publication, nor was there any obligation to publish it.

Please share our article, every link counts!
> Expert Reviews and News on Laptops, Smartphones and Tech Innovations > Reviews > AMD Radeon RX 7900 XTX with 24 GB VRAM review: Already available for less than 1000 Euros
Sebastian Bade, 2024-03- 7 (Update: 2024-03- 7)