Notebookcheck Logo

Palworld in review: Laptop and desktop benchmarks

An exciting mix of genres. Palworld has quickly become a surprising success on Steam within just a few days. This early access title combines elements from various games like Pokemon, Ark, and Zelda. We delved deeper into this visually demanding game.
Palworld

Test systems

Asus ROG Zephyrus M16 (RTX 4090)
Razer Blade 16 Mid 23 (RTX 4080)
XMG Pro 15 E23 (RTX 4070)
Razer Blade 14 Mid 23 (RTX 4060)
Medion Erazer Scout E20 (RTX 4050)
Asus TUF Gaming Advantage A16 (RX 7600S & 780M)
Silent Base 802 (RTX 4080 & RX 7900 XT)
Philips Evnia 8000 Series 41,5" UHD OLED gaming monitor

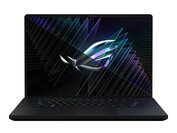
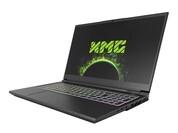
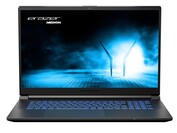
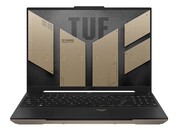
We ran our gaming benchmarks on these devices. Clicking on the various images will take you to the respective producer's website. Further details on the devices' specifications are listed at the end of the article.

Tech

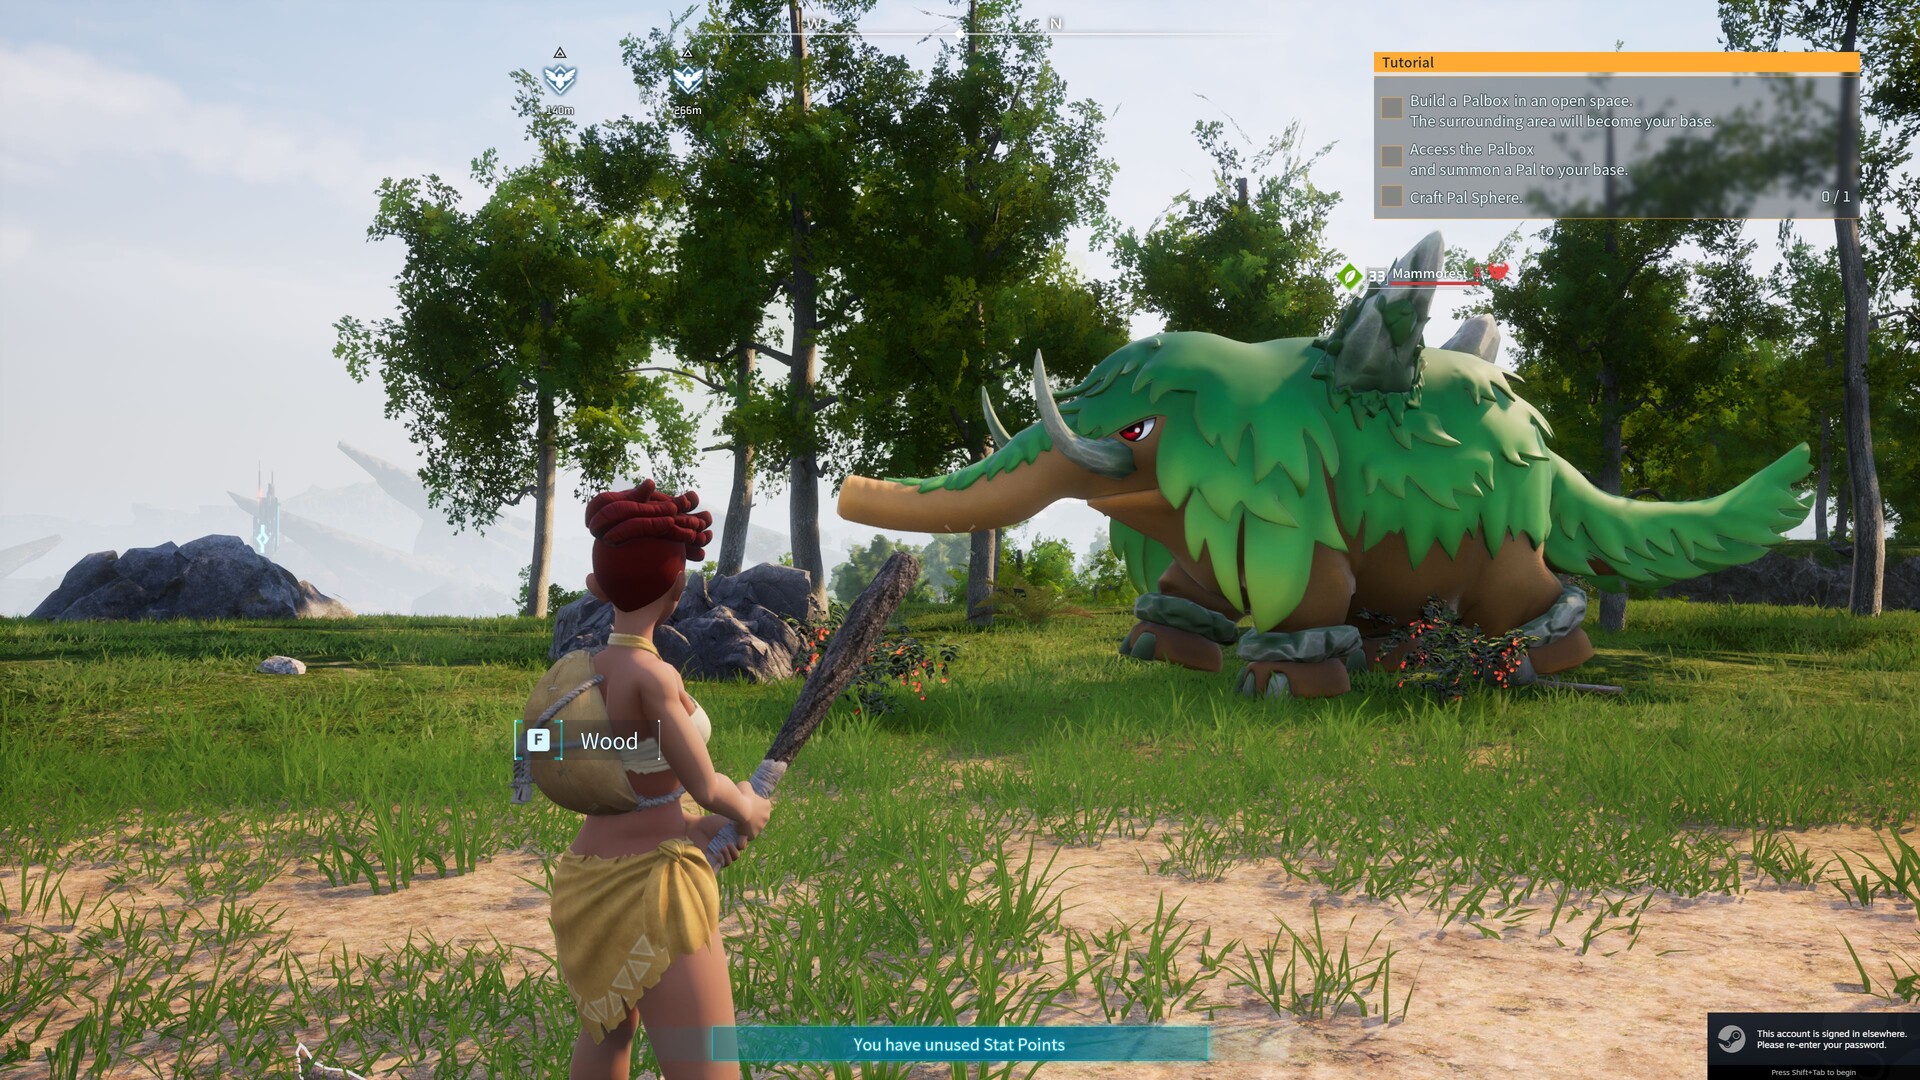
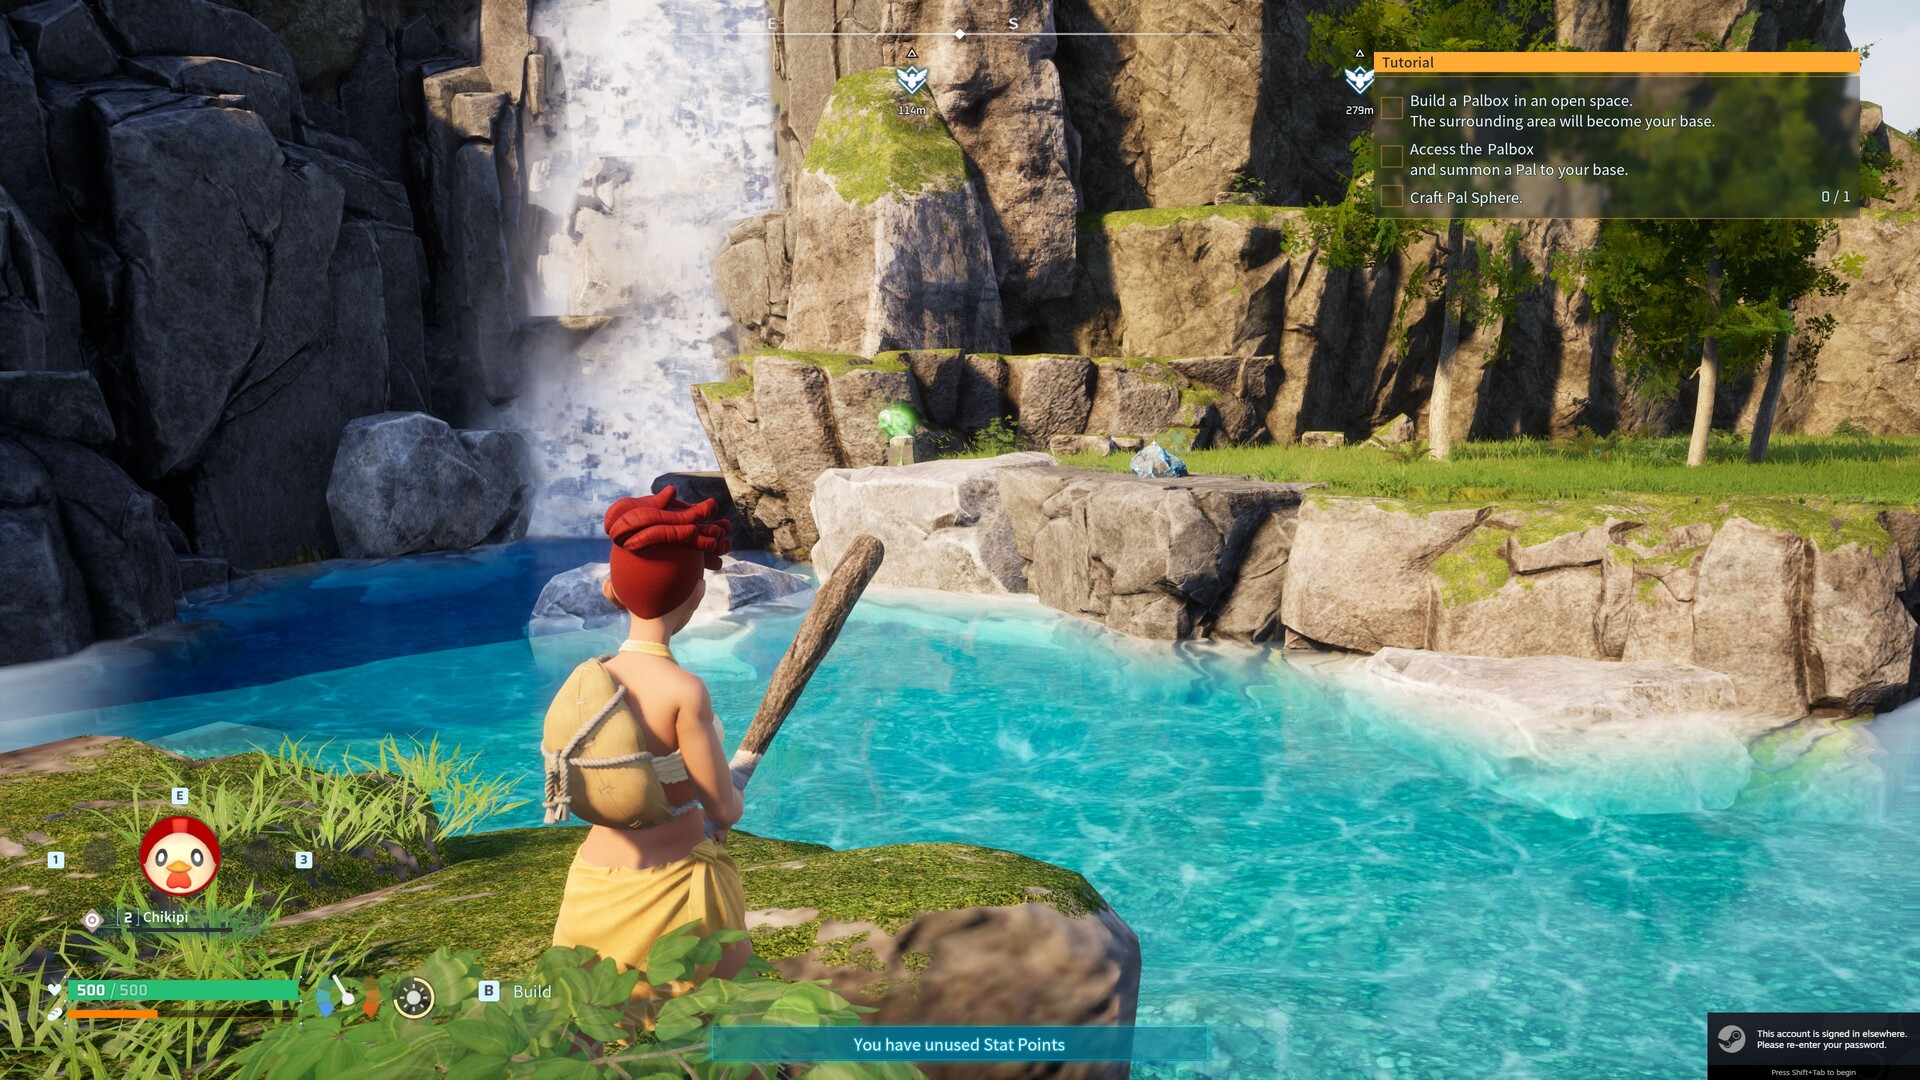
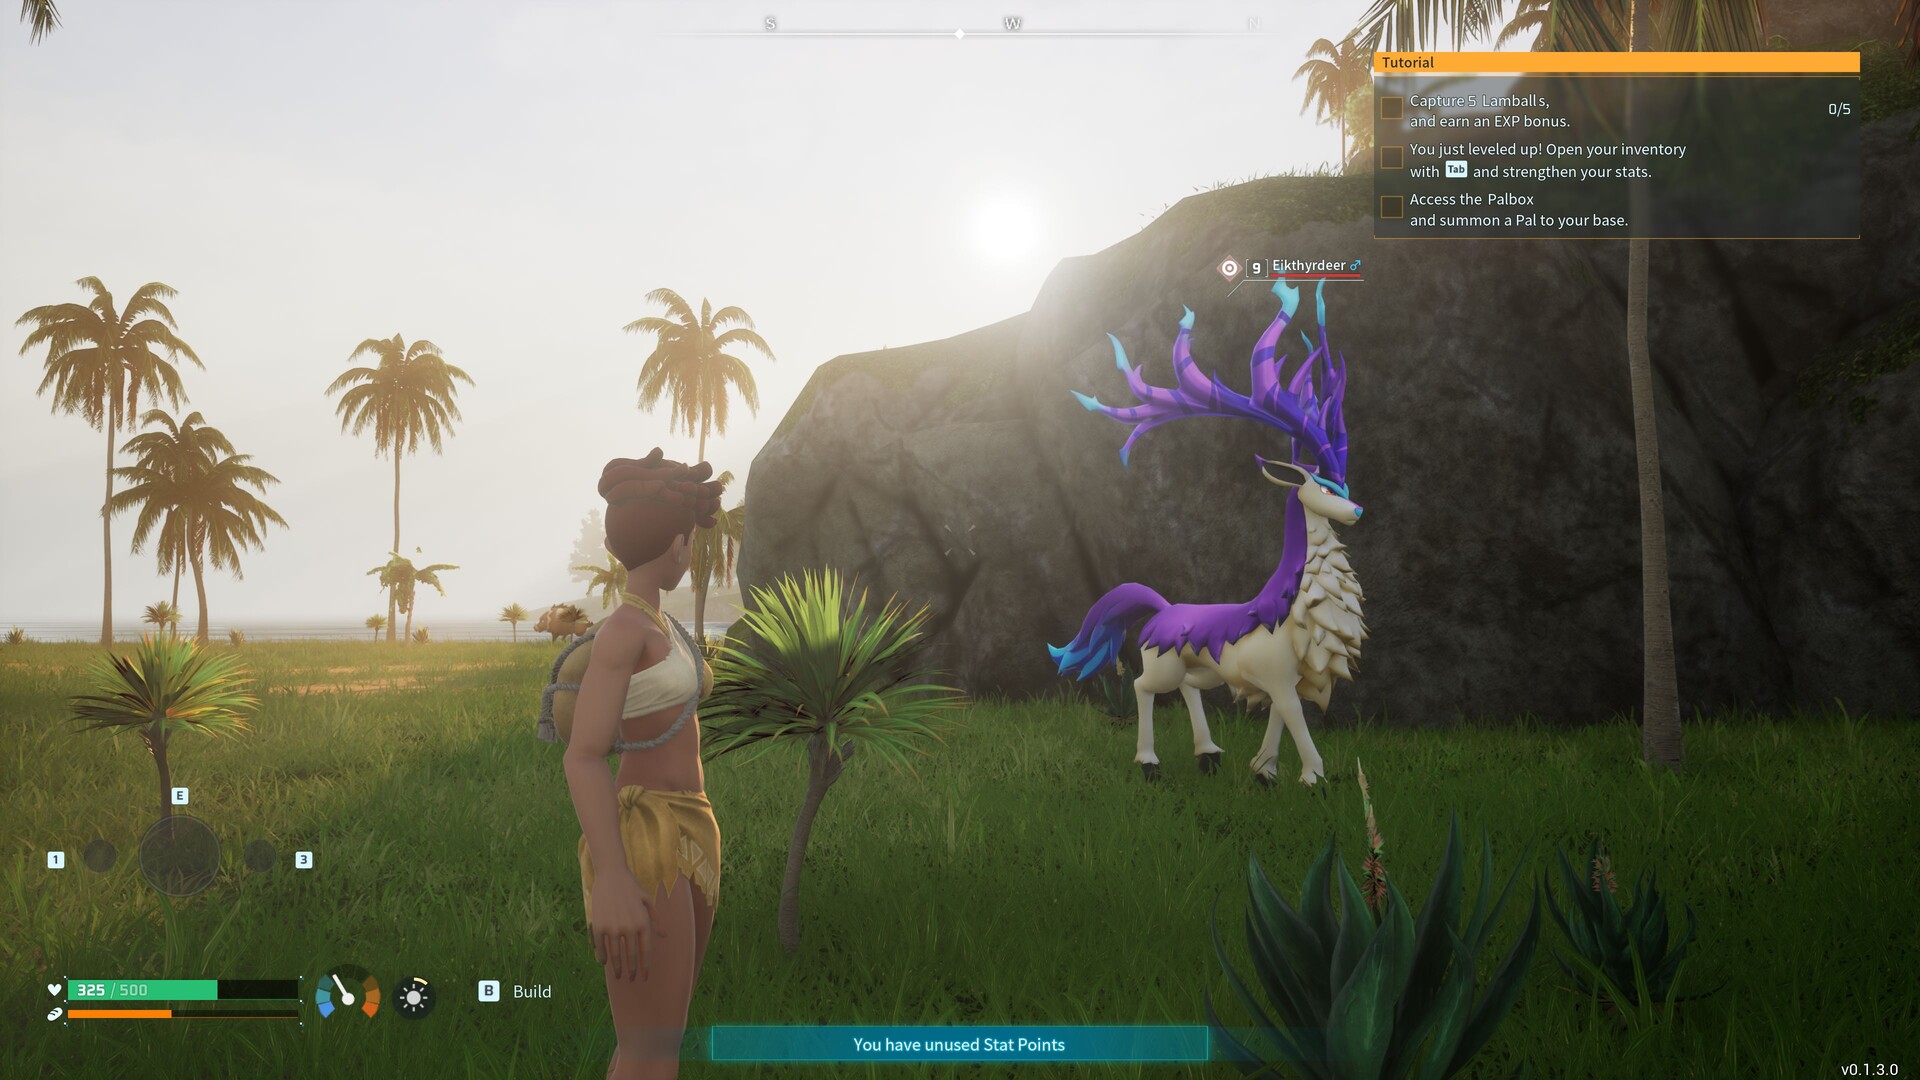
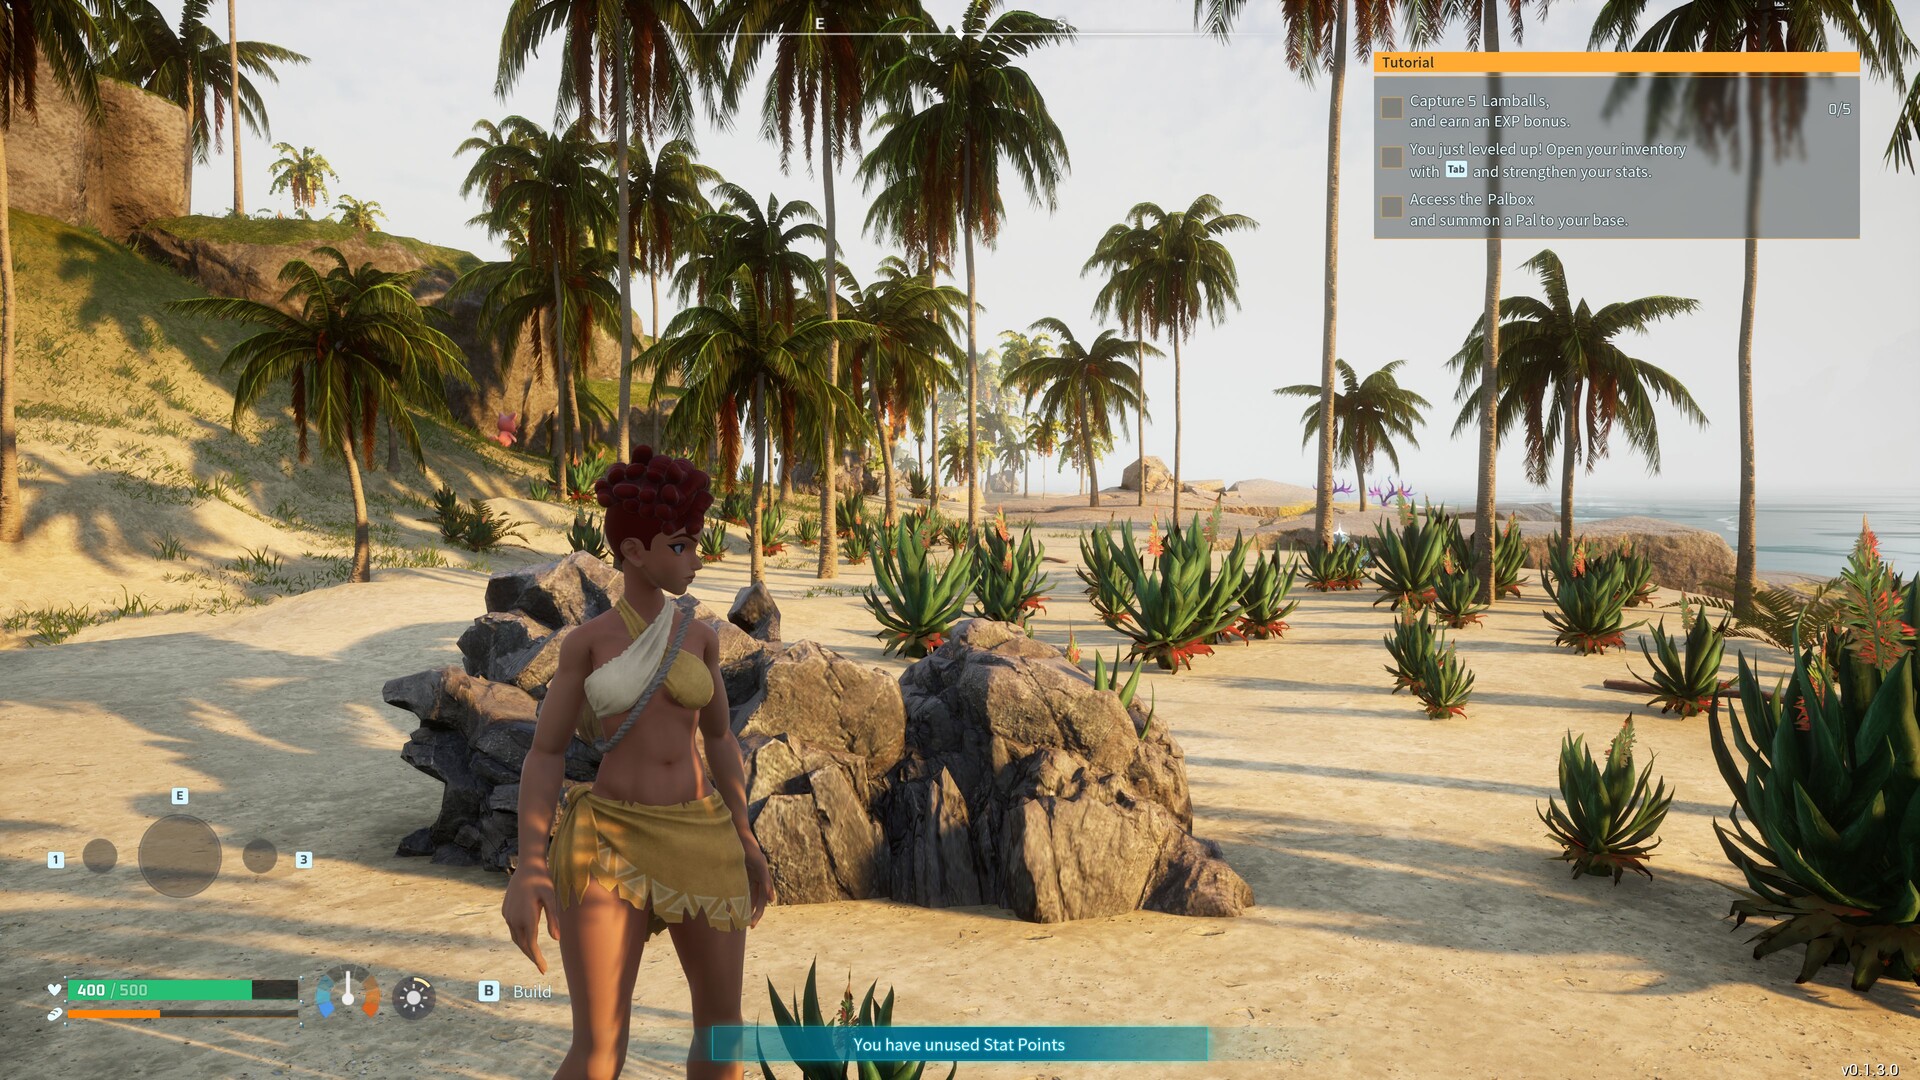
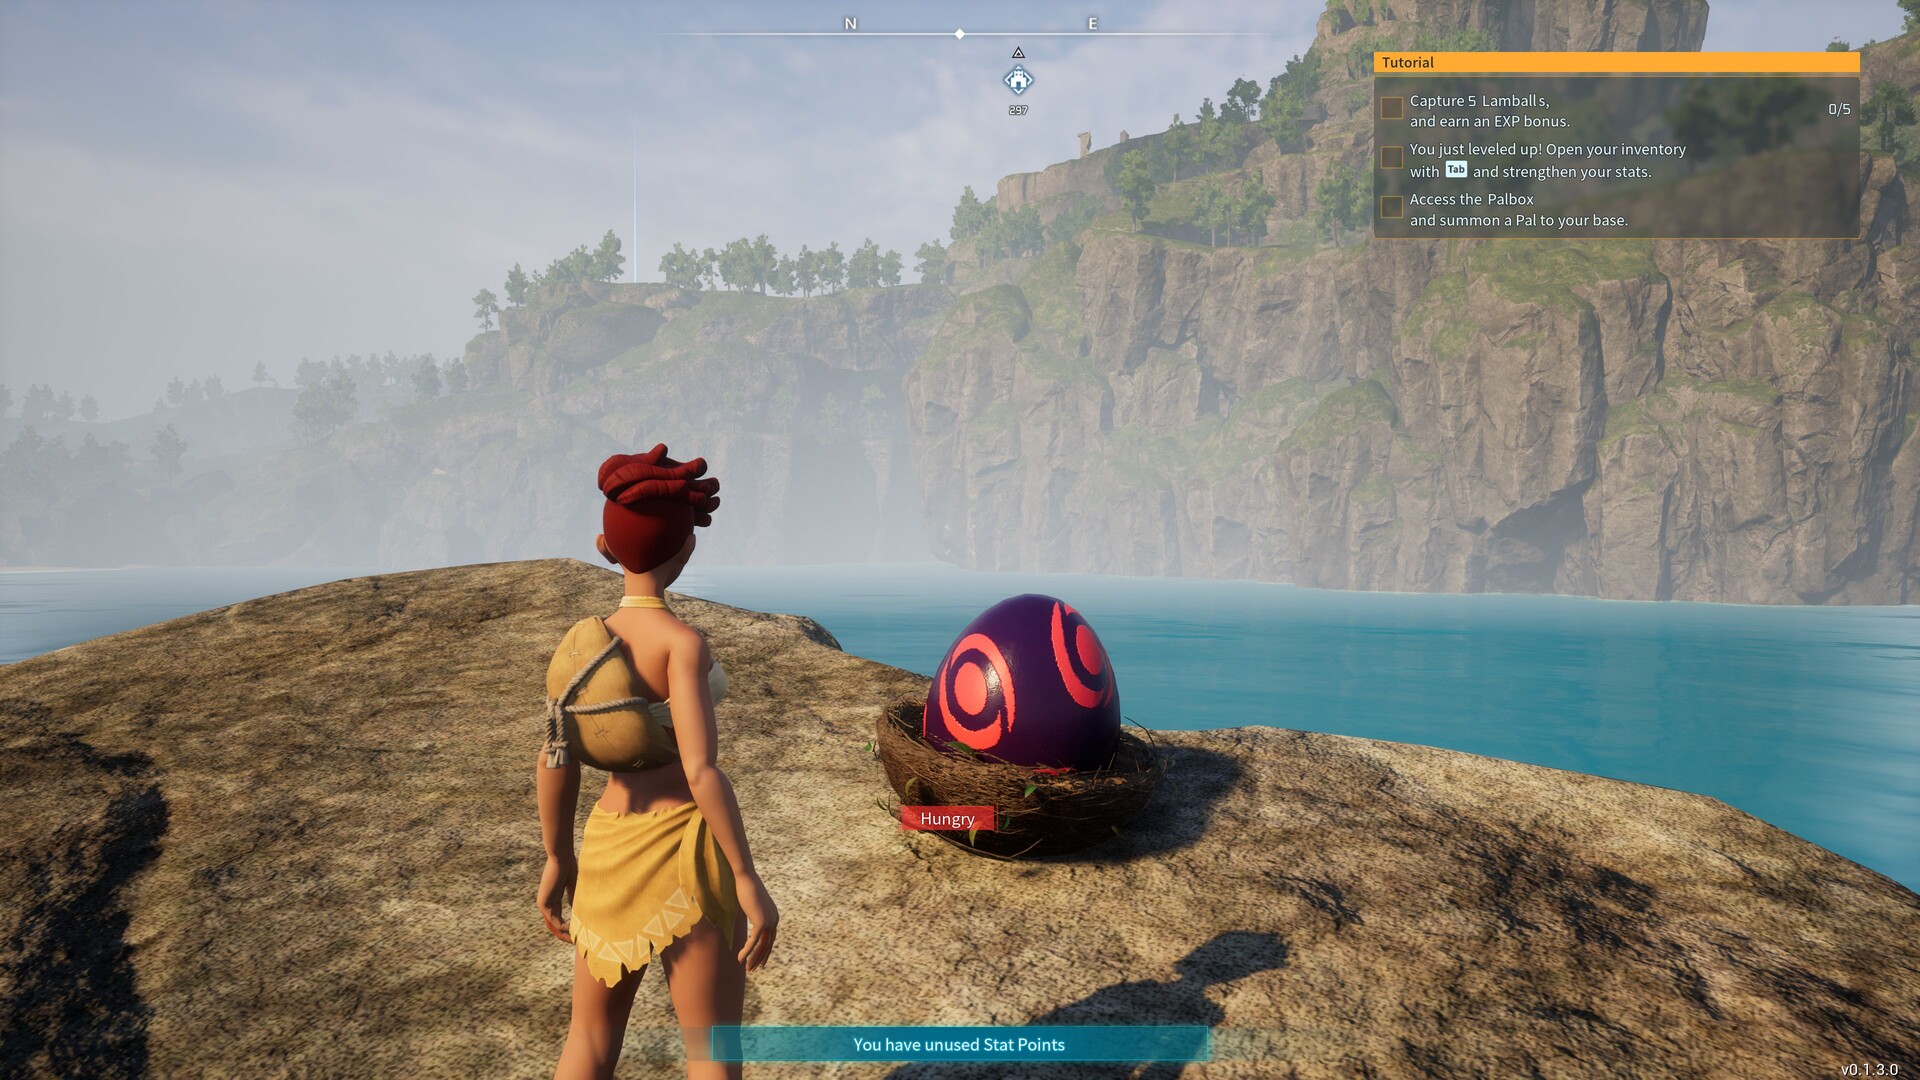
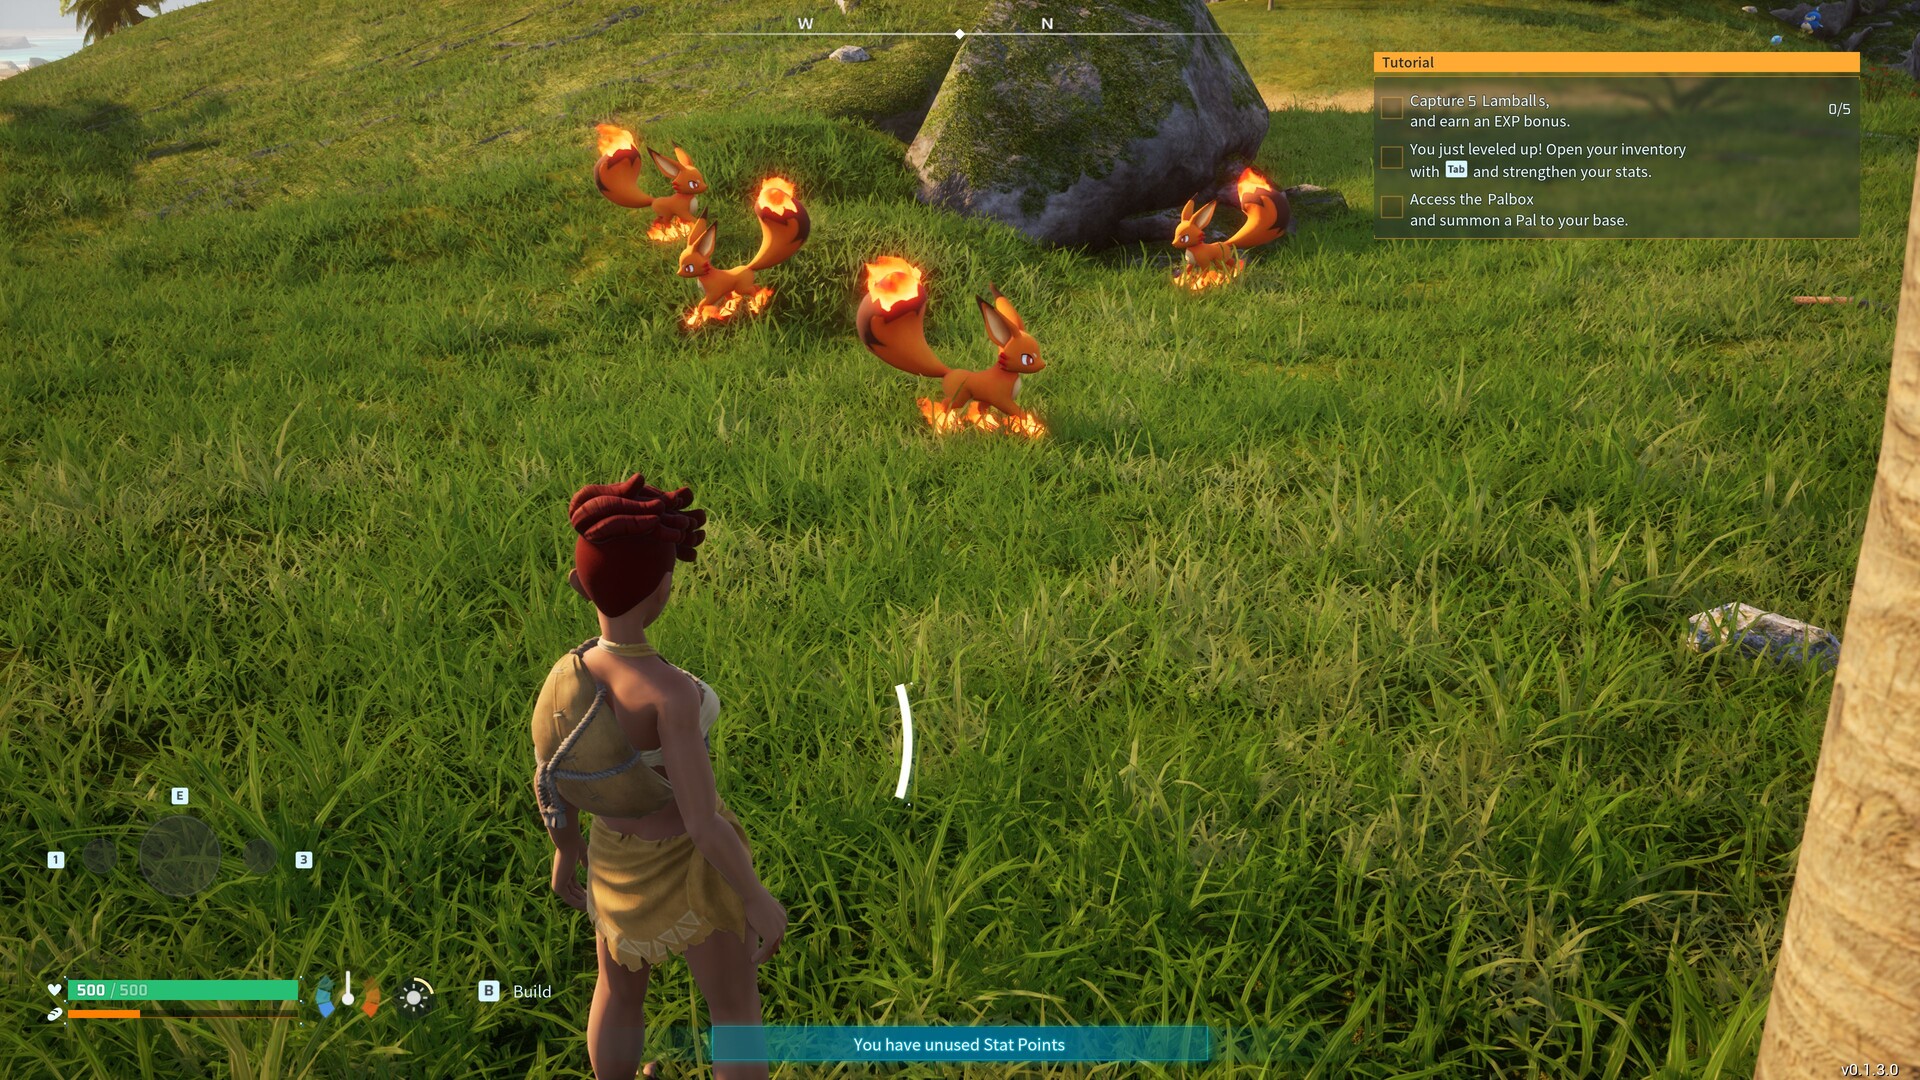
Palworld has quickly ascended to the top of the Steam charts almost out of nowhere. Developed by Japanese studio Pocket Pair, this open-world game is built on the robust Unreal Engine 5, ensuring impressive visuals. Despite its vibrant colors and overall cartoonish graphic style, the underlying technology is undeniably noteworthy. Beyond the solid textures, particularly at higher levels, the positive features encompass dense vegetation, excellent visibility, and beautiful lighting atmospheres.

Palworld
Palworld
Palworld
Palworld
Palworld
Palworld

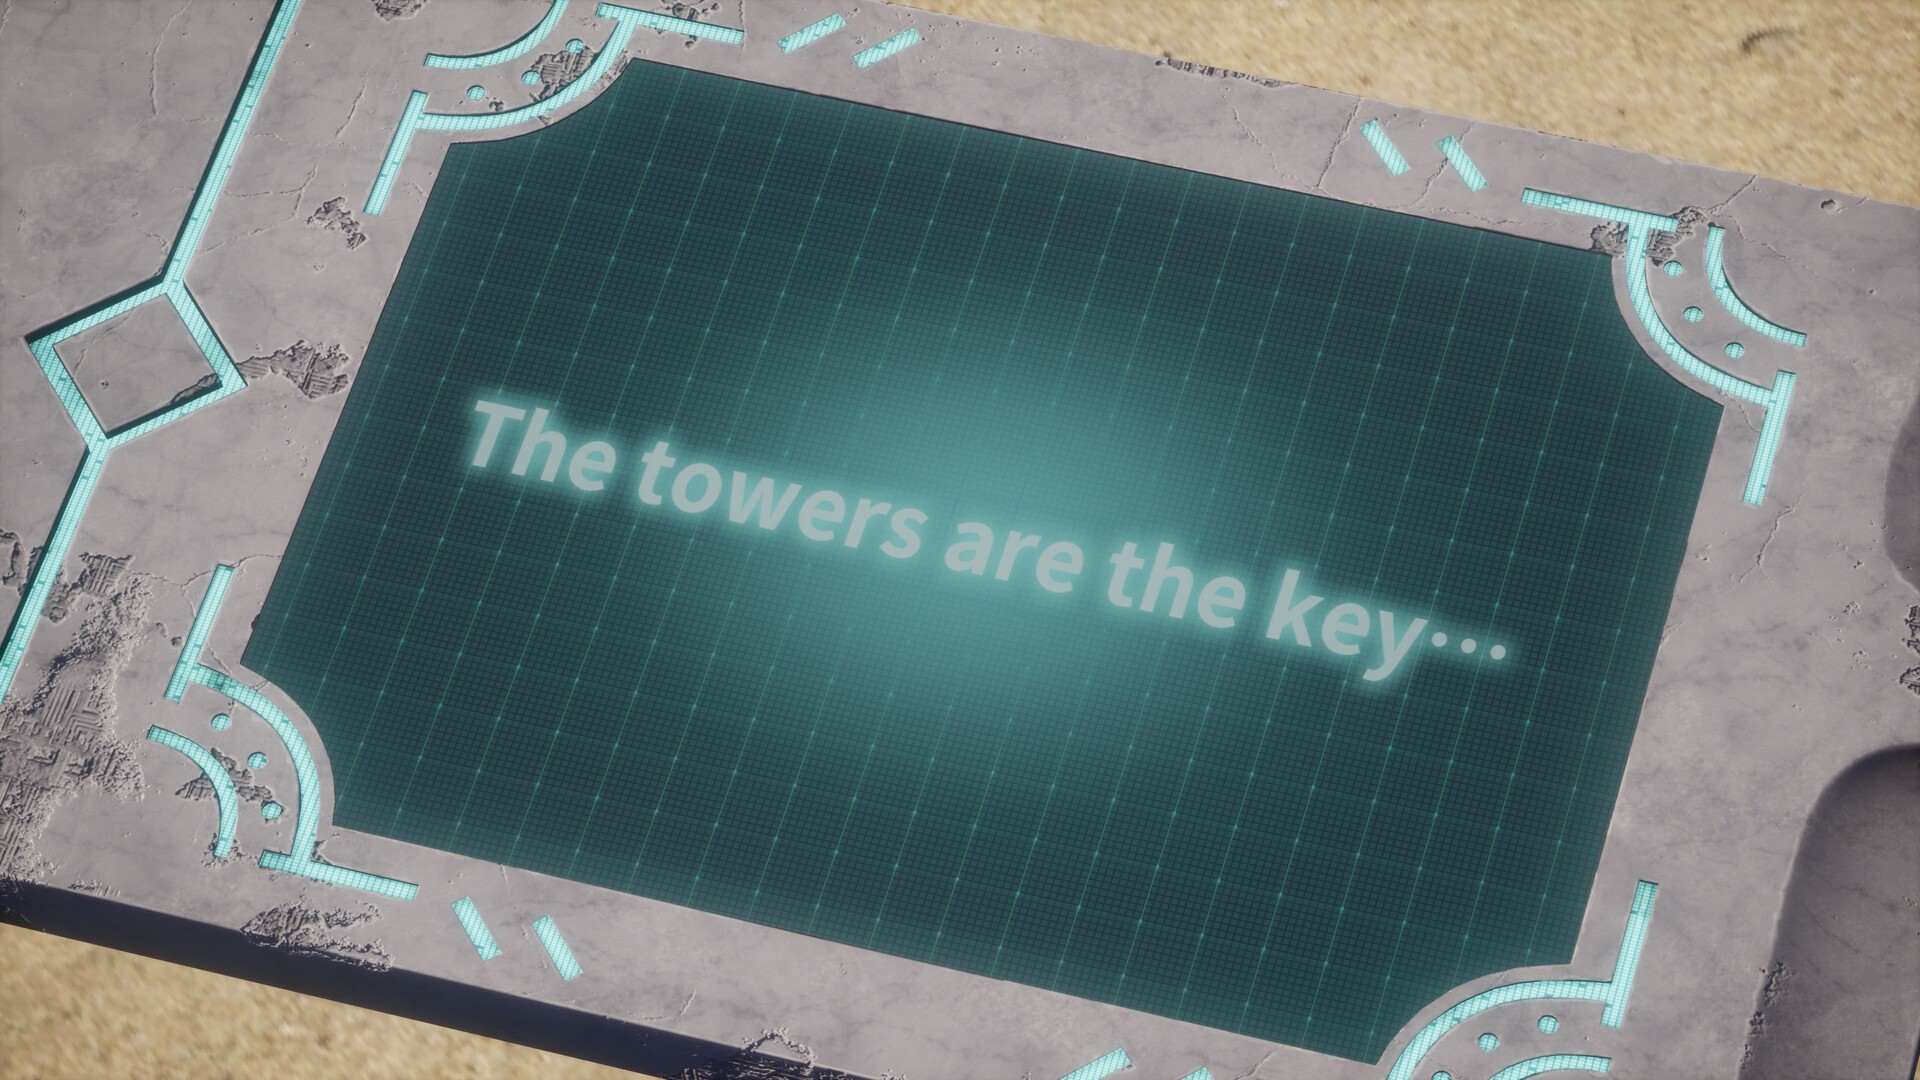
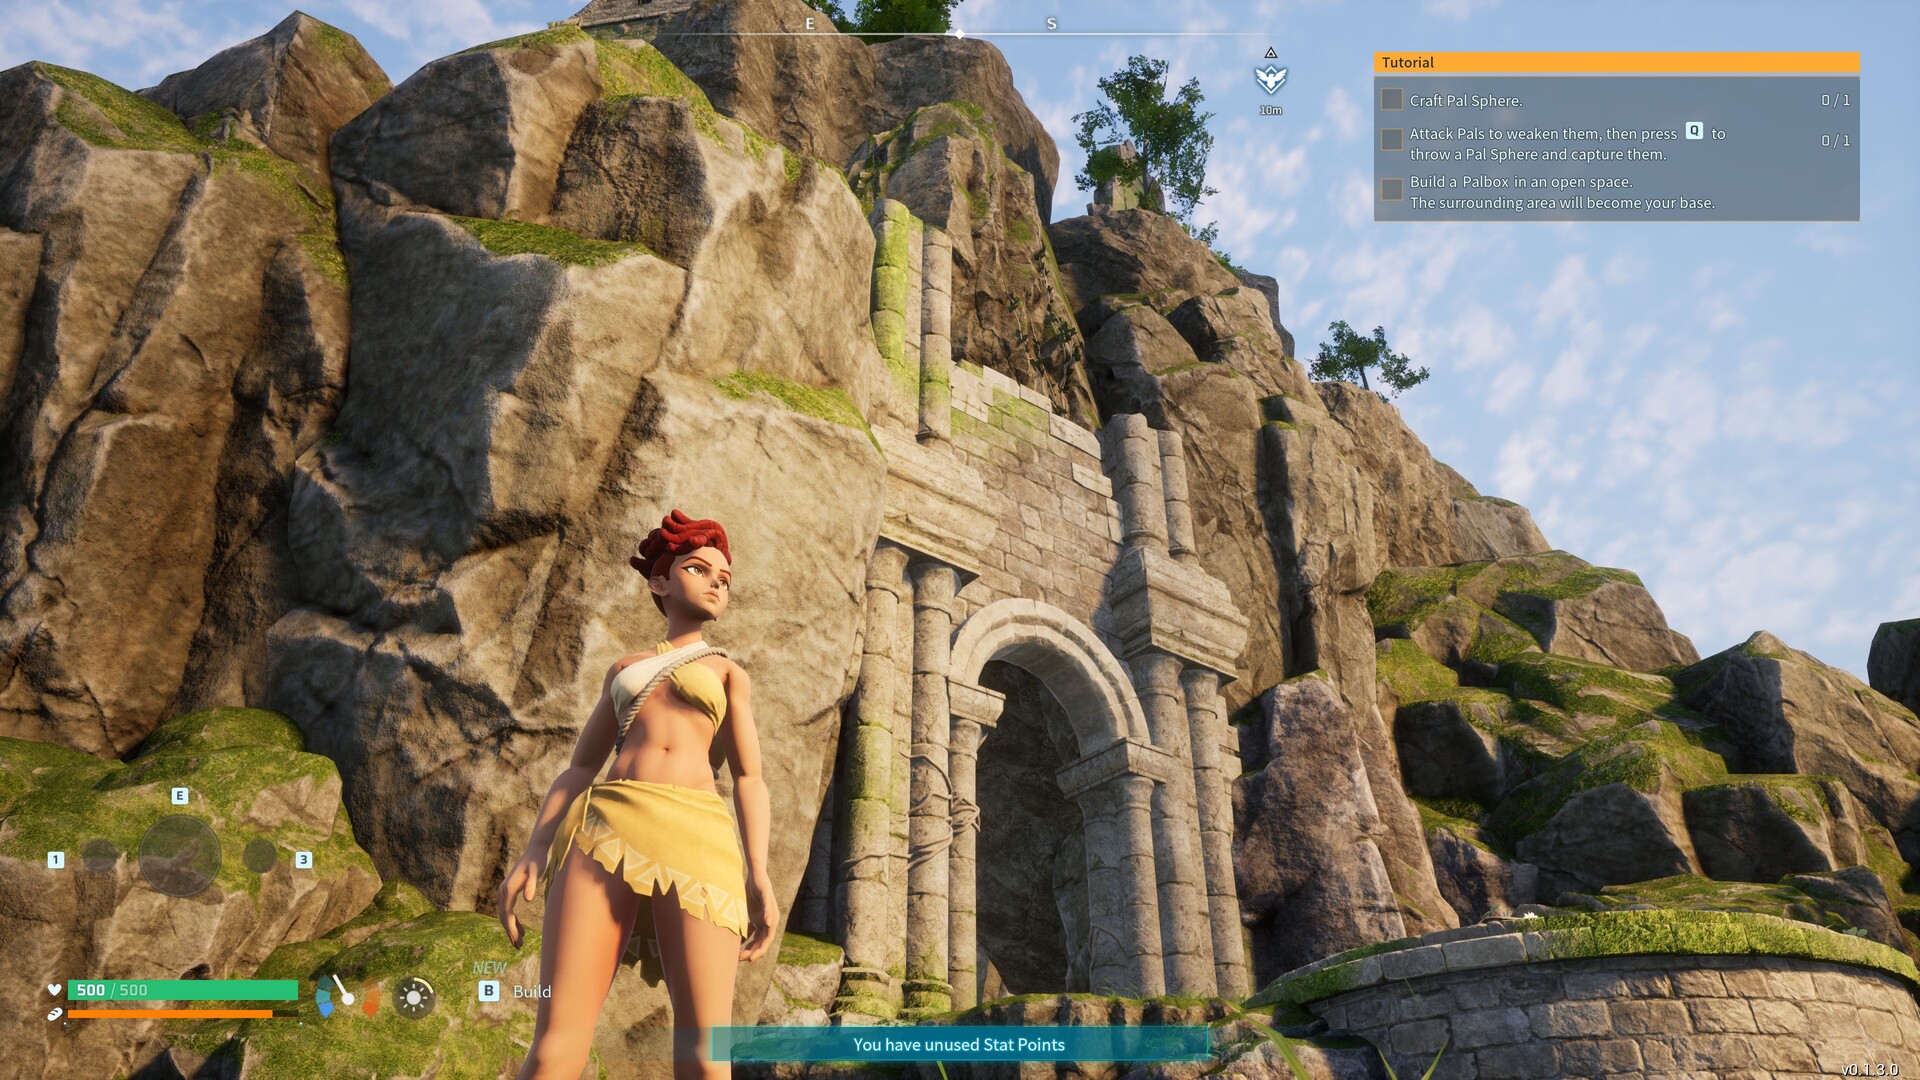
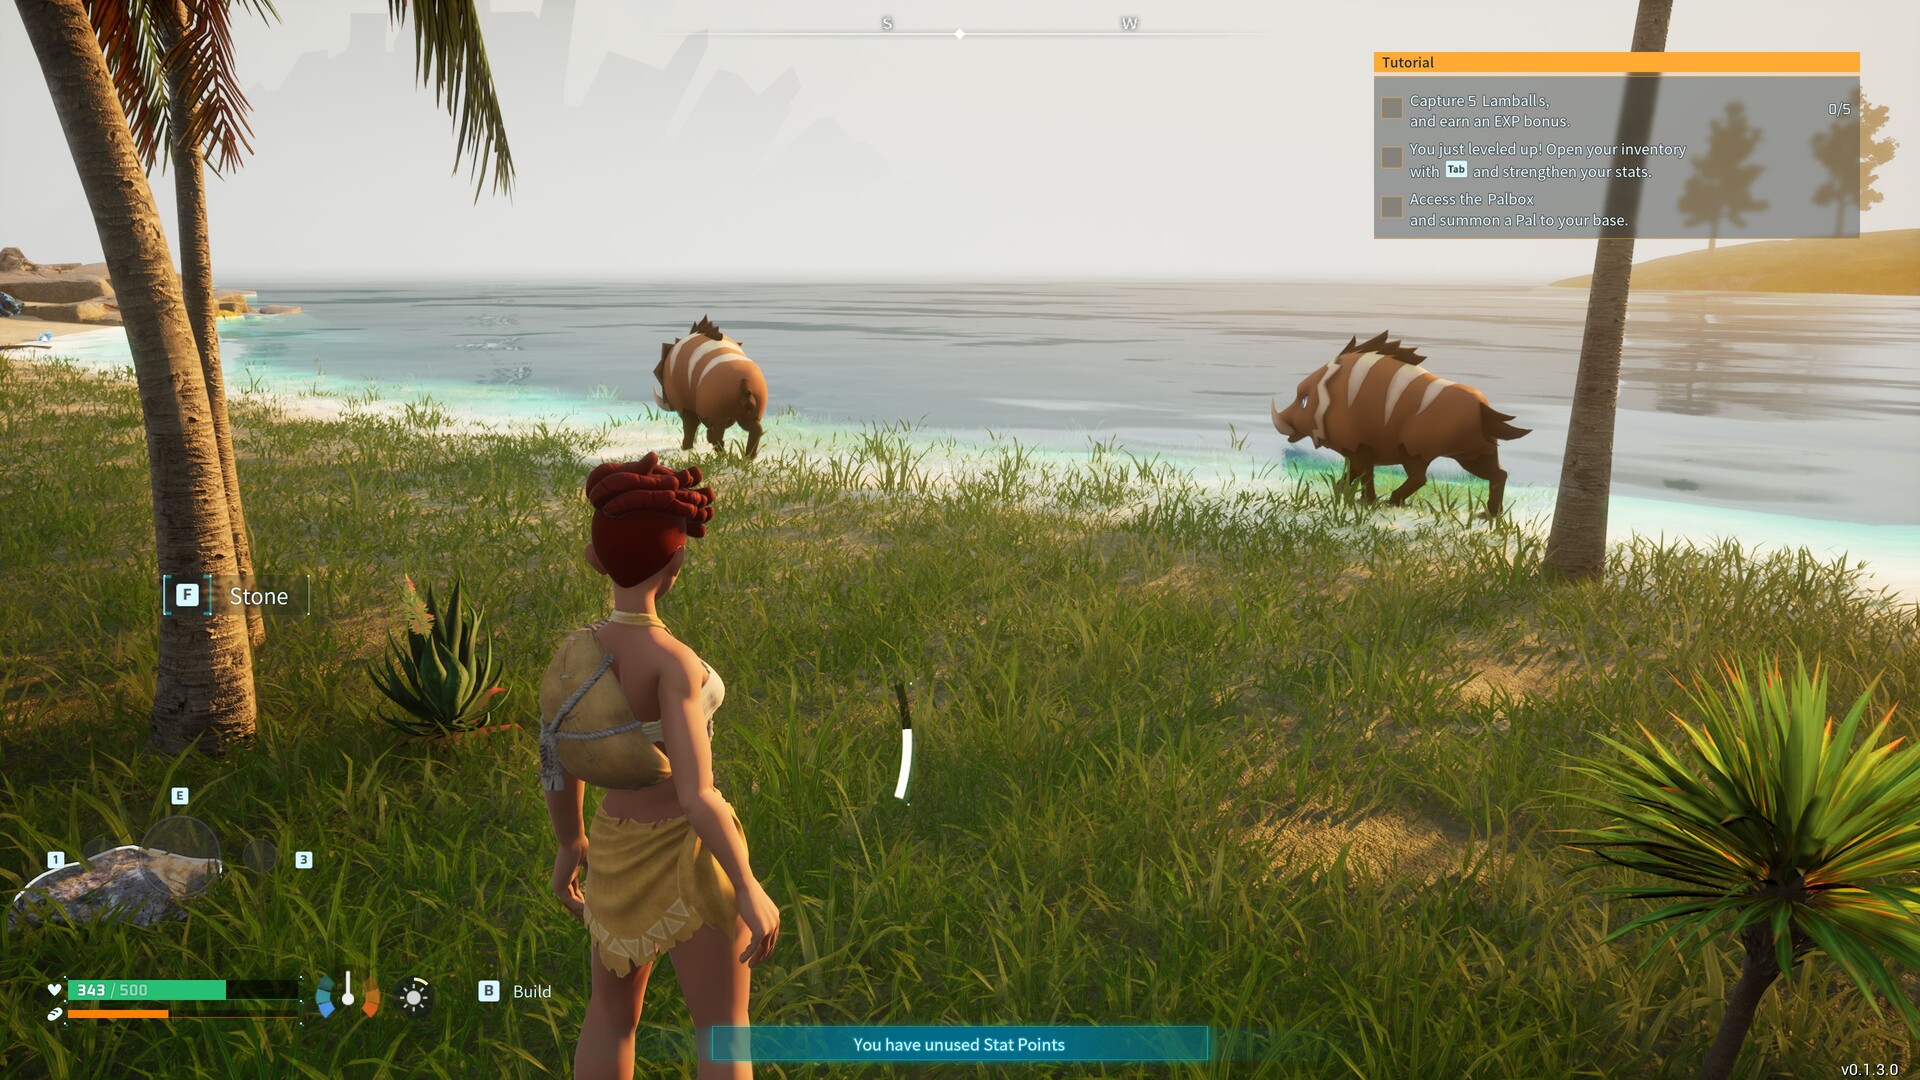
The game also offers diverse climate zones and an attractive day-night cycle. The numerous creatures are lovingly designed, although occasional strong similarities to Pokemon can be observed. For an early access game, Palworld seems impressively polished. However, issues are more prevalent in the finer details. Objects may awkwardly pop up at times, and there are occasional problems with clipping and collision detection.

Palworld
Palworld
Palworld
Palworld
Palworld
Palworld

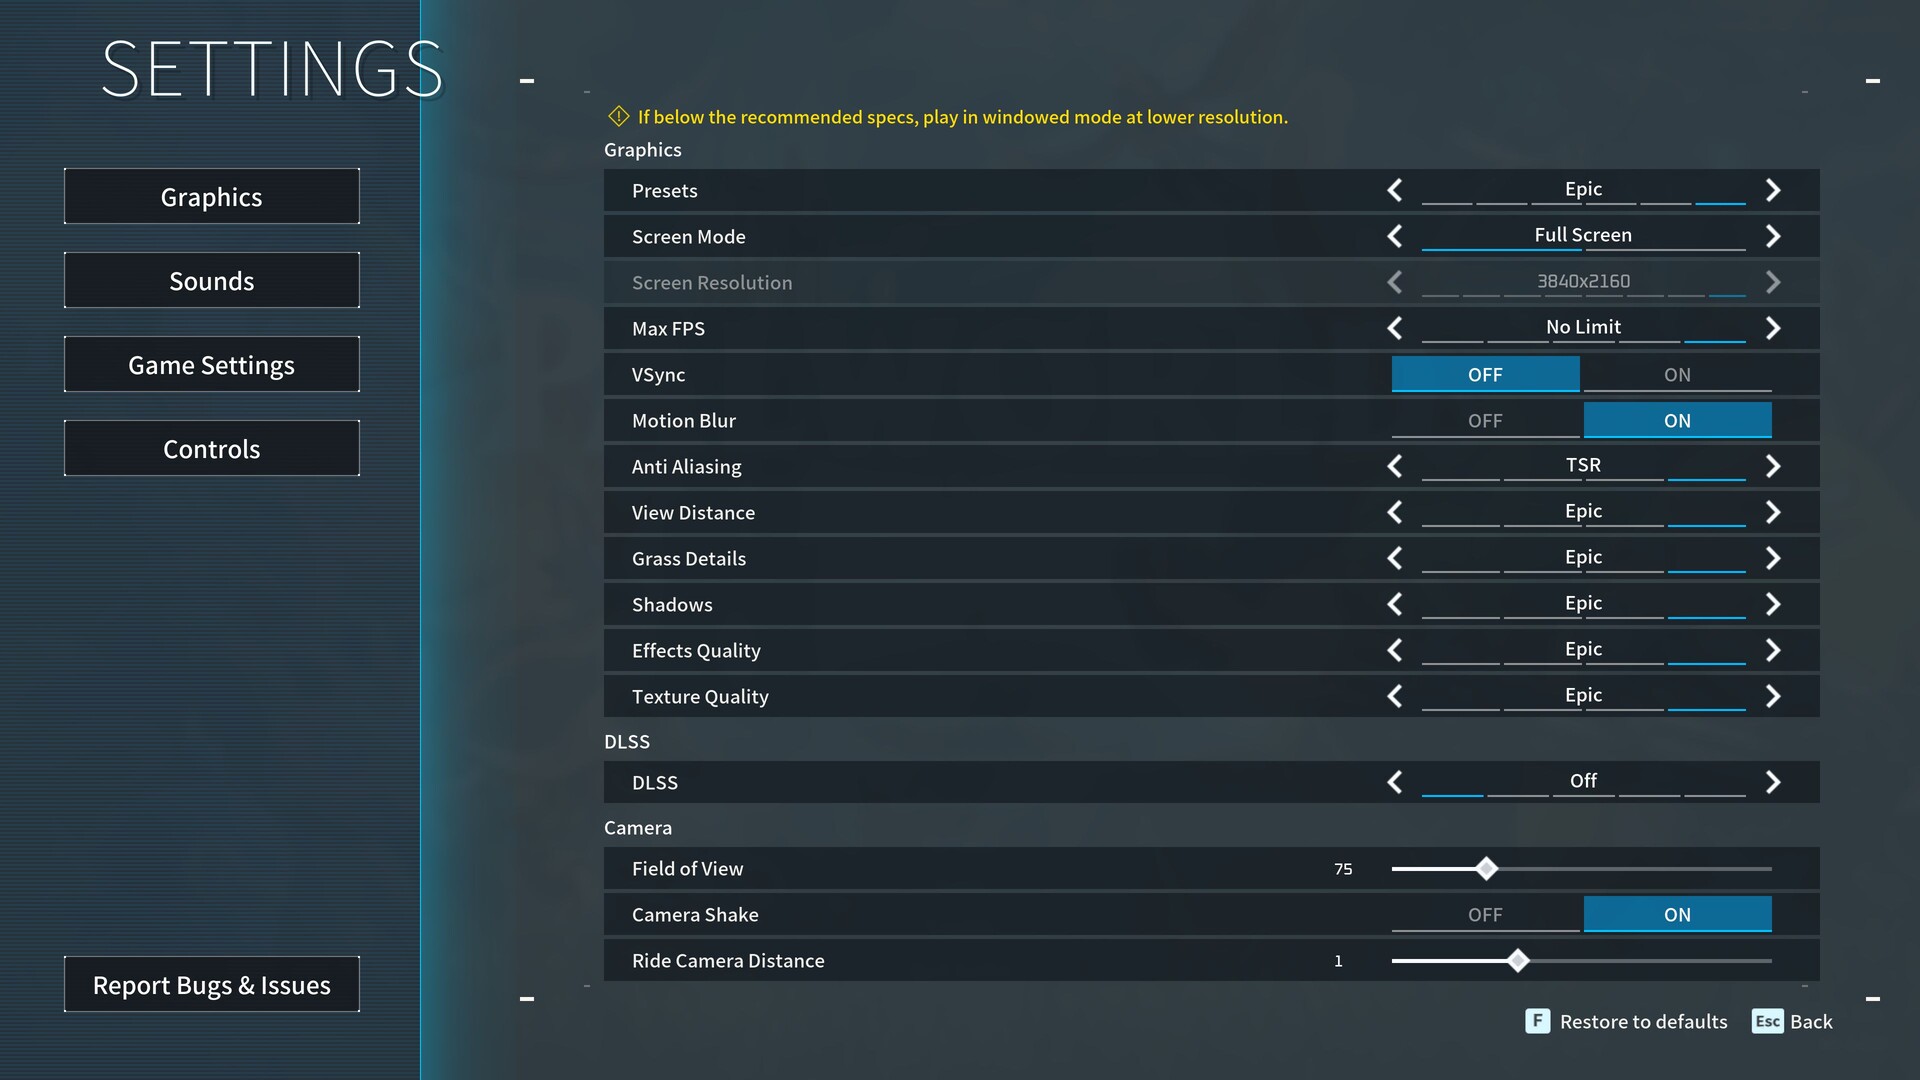
The graphics interface requires some consideration. For instance, we had to rerun certain benchmarks because the Max FPS switch didn't consistently function correctly, occasionally limiting the frame rate to 120 FPS despite the No Limit setting. It's also suboptimal that the message "Restart due" is displayed for simple changes, and the full-screen mode applies only to the native resolution. Nonetheless, the options menu is commendable. Alongside five quality and detail controls, there are also five useful presets (we would rate the game as decent).

Palworld
Palworld
Palworld
Palworld
Palworld
Palworld

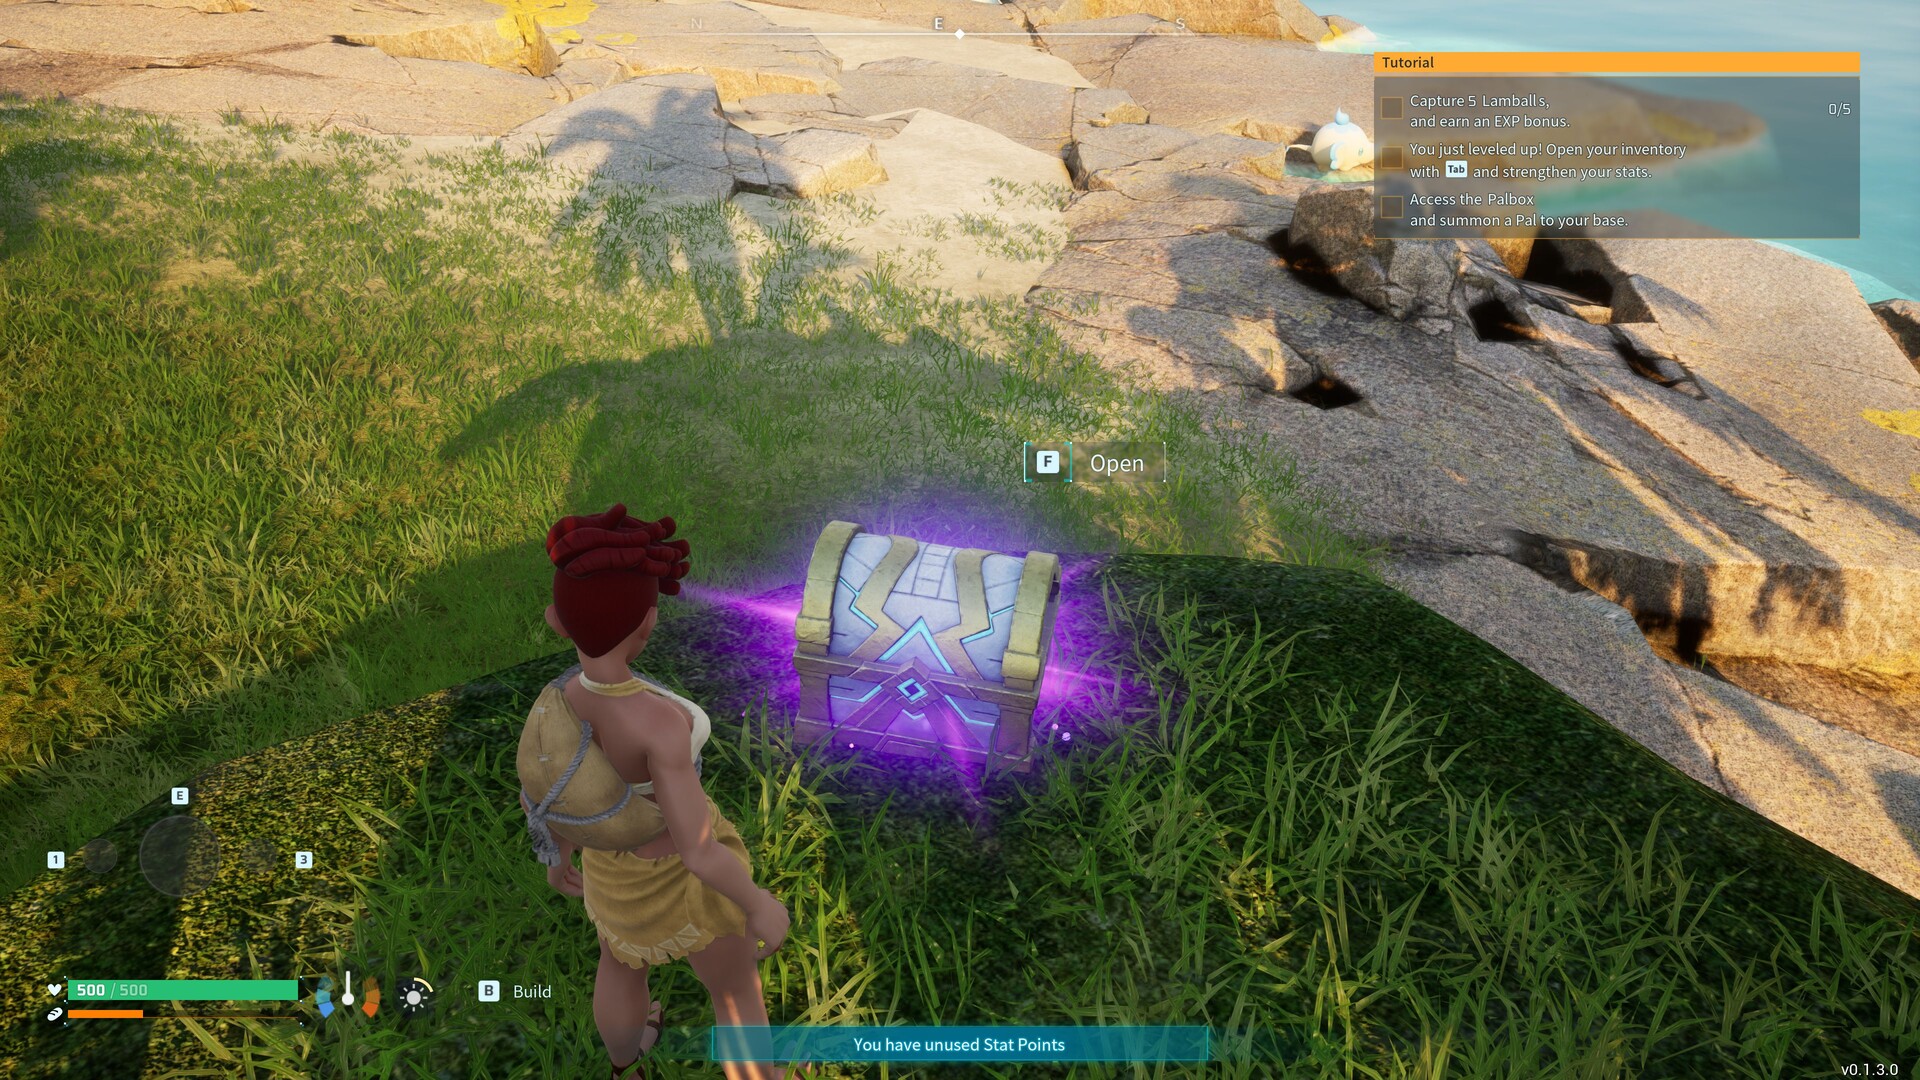
VSync, Motion Blur, and DLSS are also optional, but currently, players have to do without FSR. For edge smoothing, FXAA, TAA, and TSR are available—the latter is activated by default in most presets. Additional explanations of the individual settings from the developers would be appreciated. Meanwhile, the duration of the game start and loading times is satisfactory. In essence, Palworld runs quite smoothly, which is not a given for an Early Access title. The scope is similarly remarkable, and Palworld undeniably has its charm in terms of gameplay, motivating players to explore and experiment.

Palworld

Benchmark

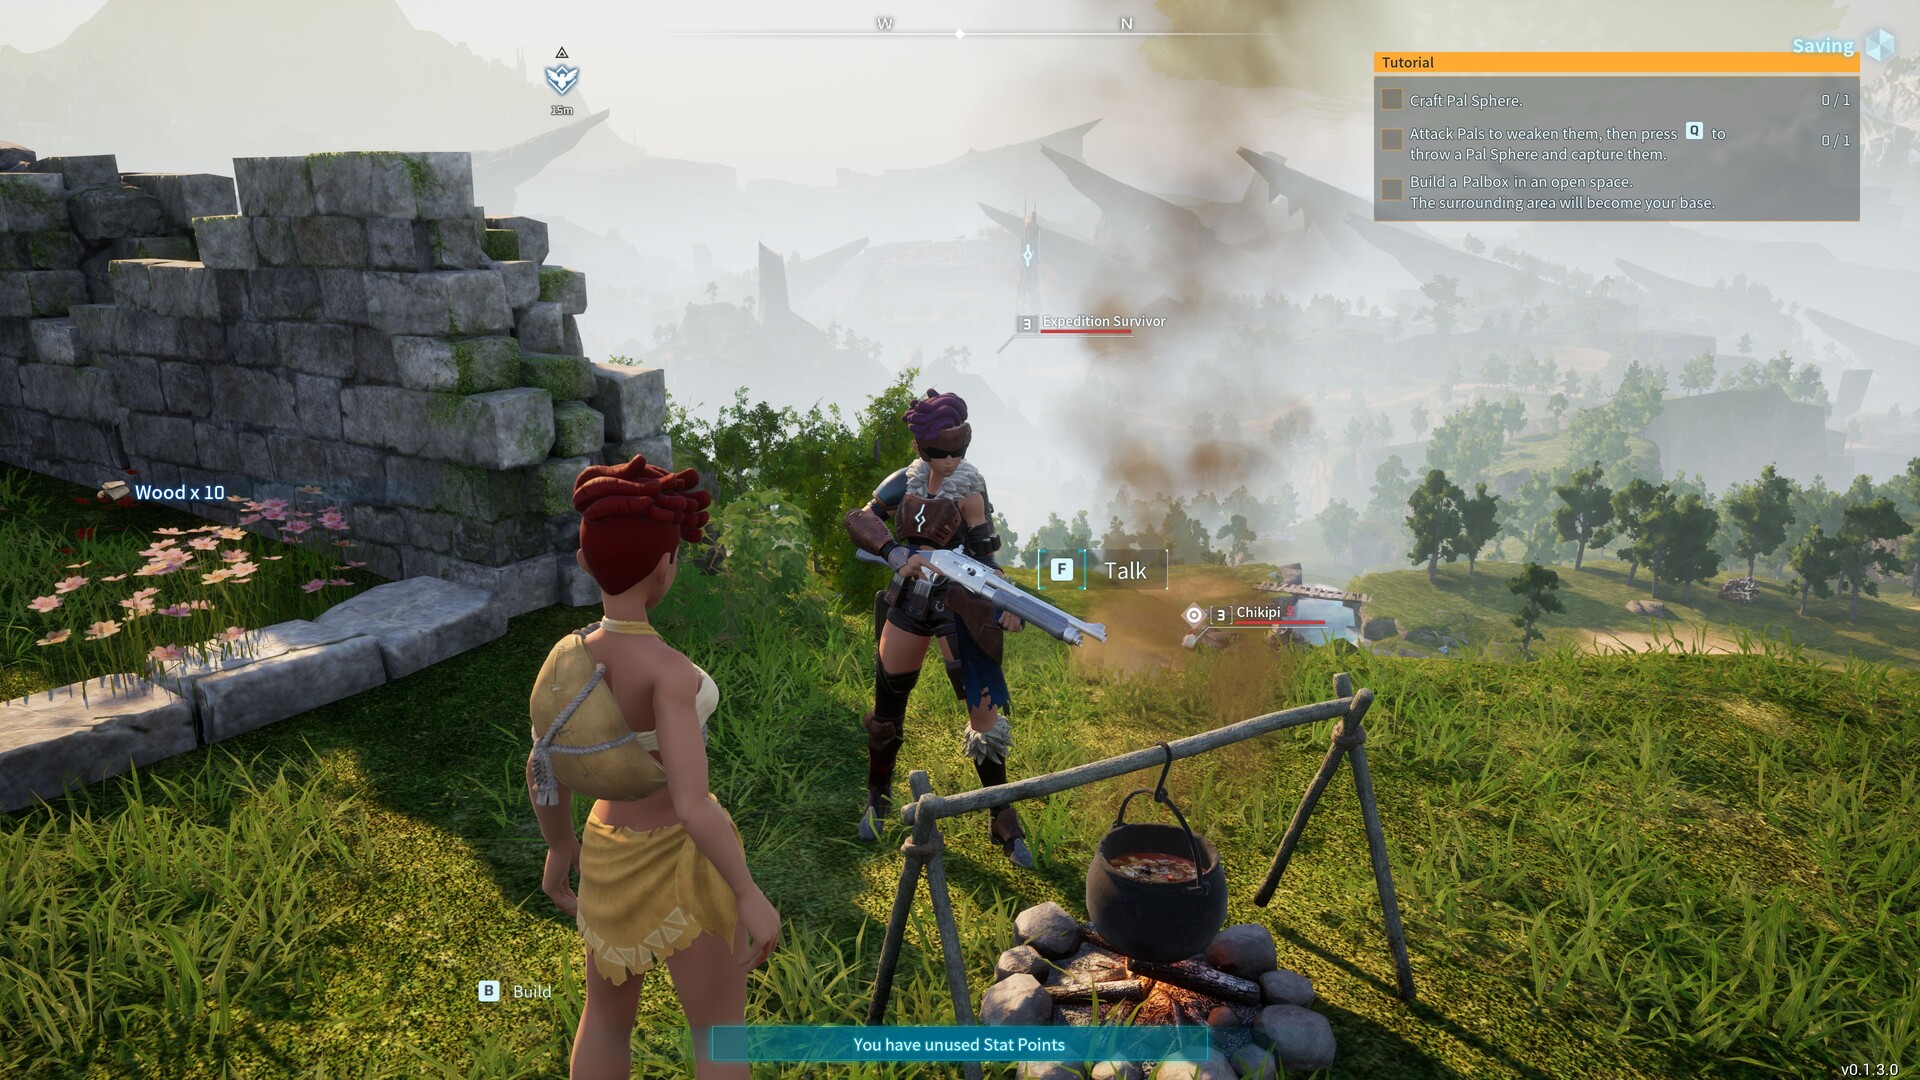
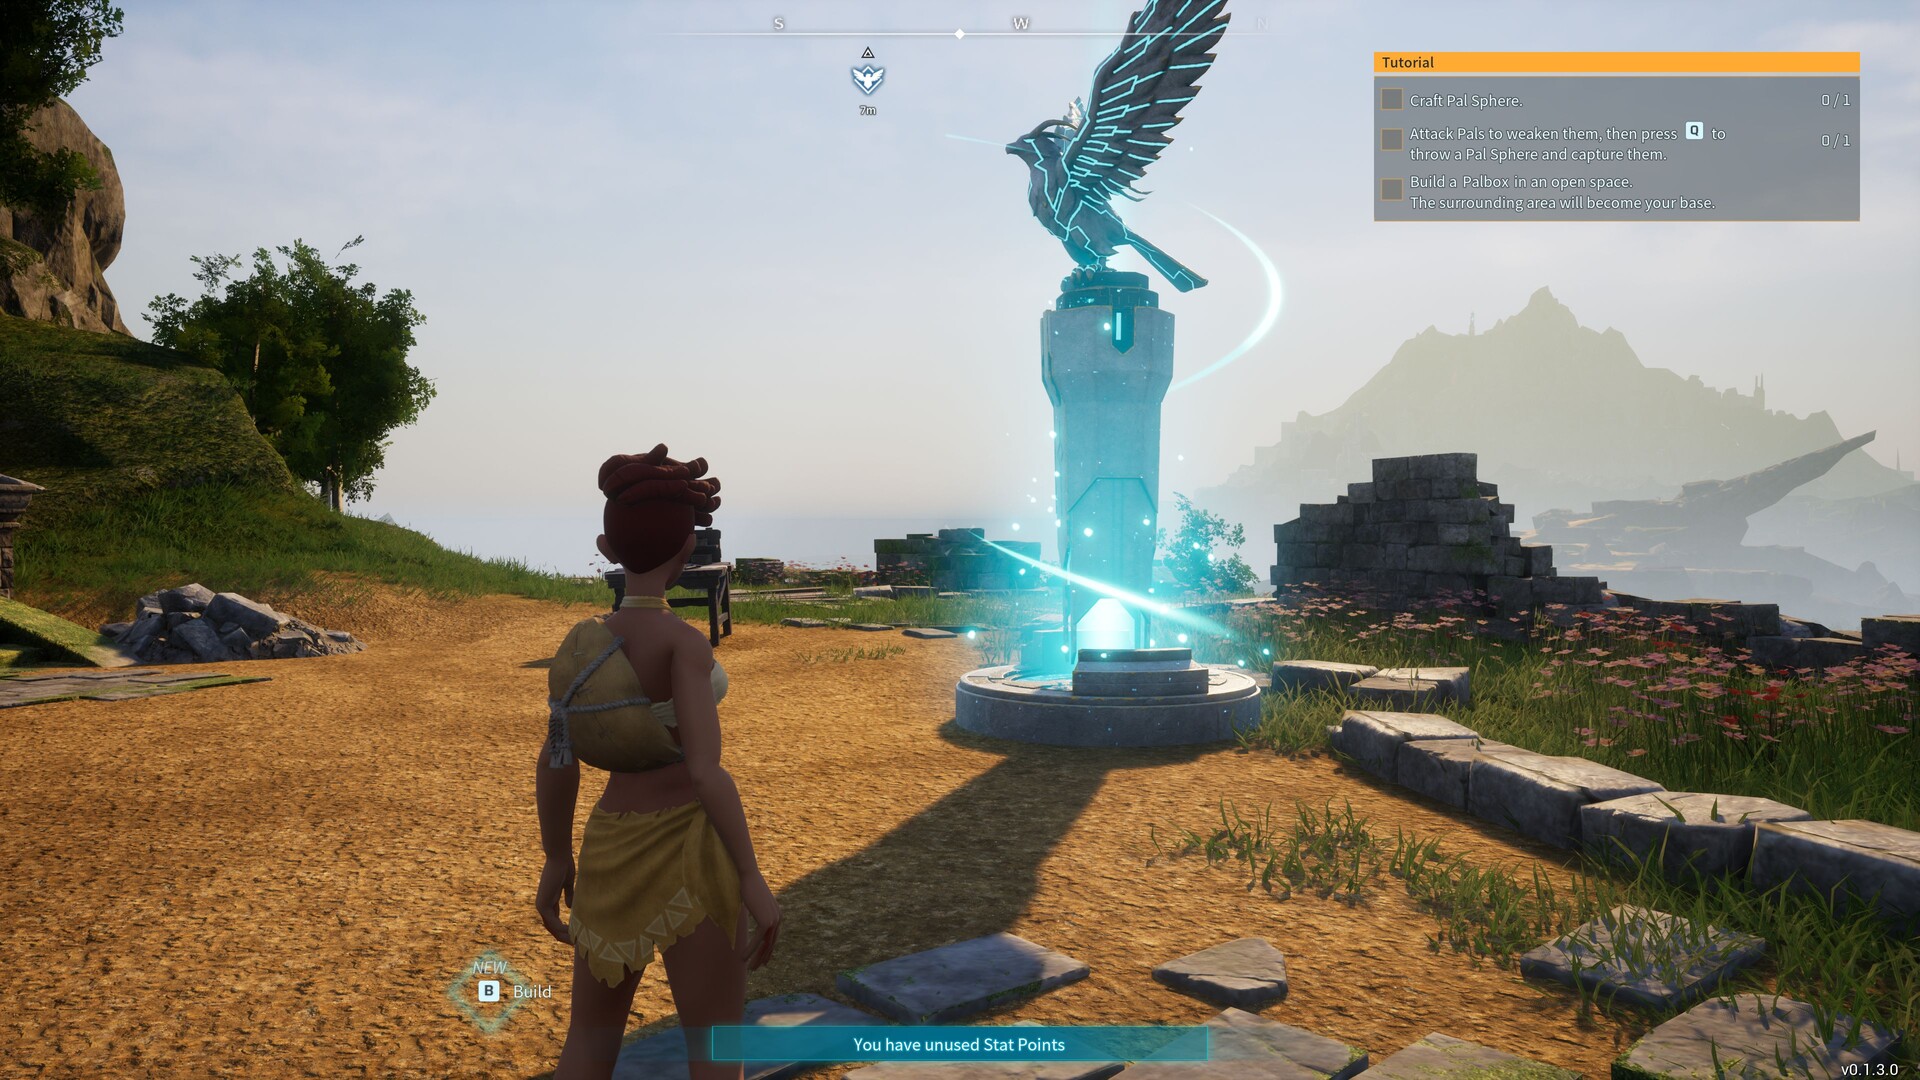
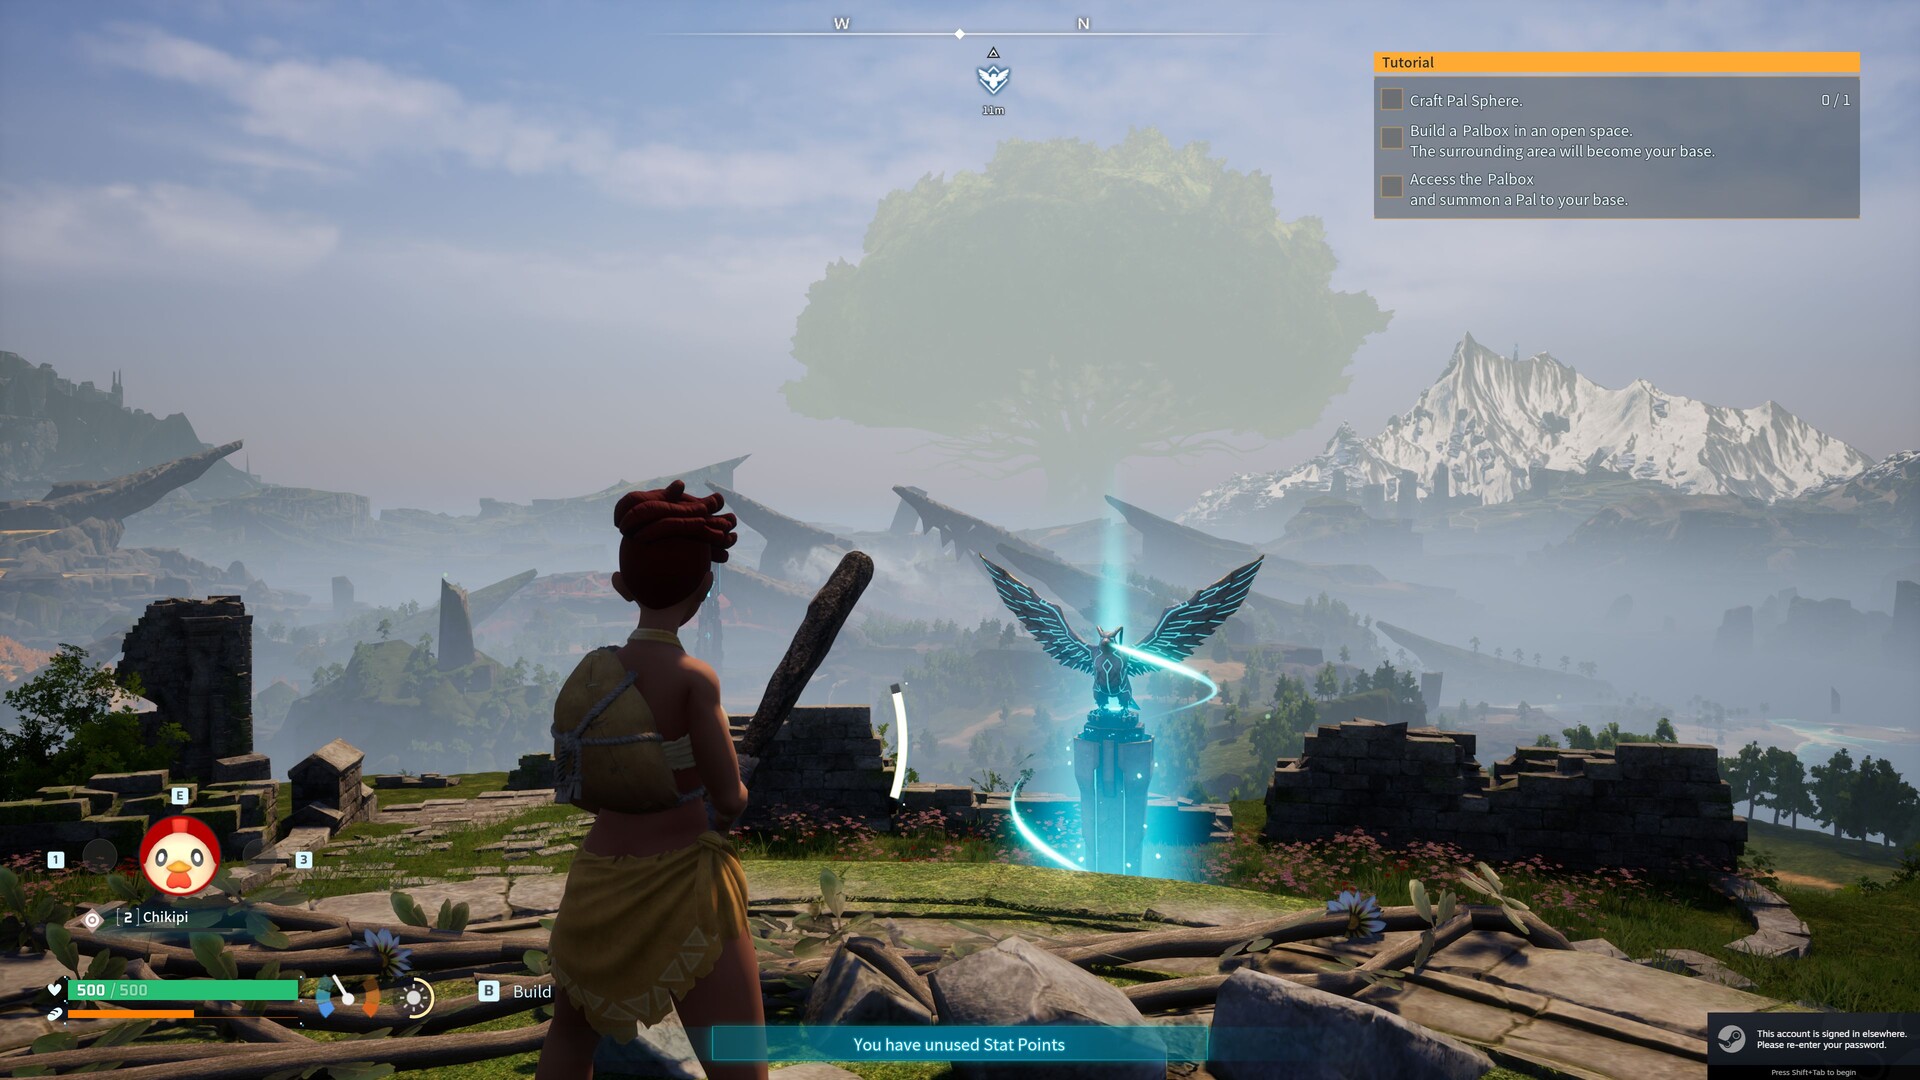
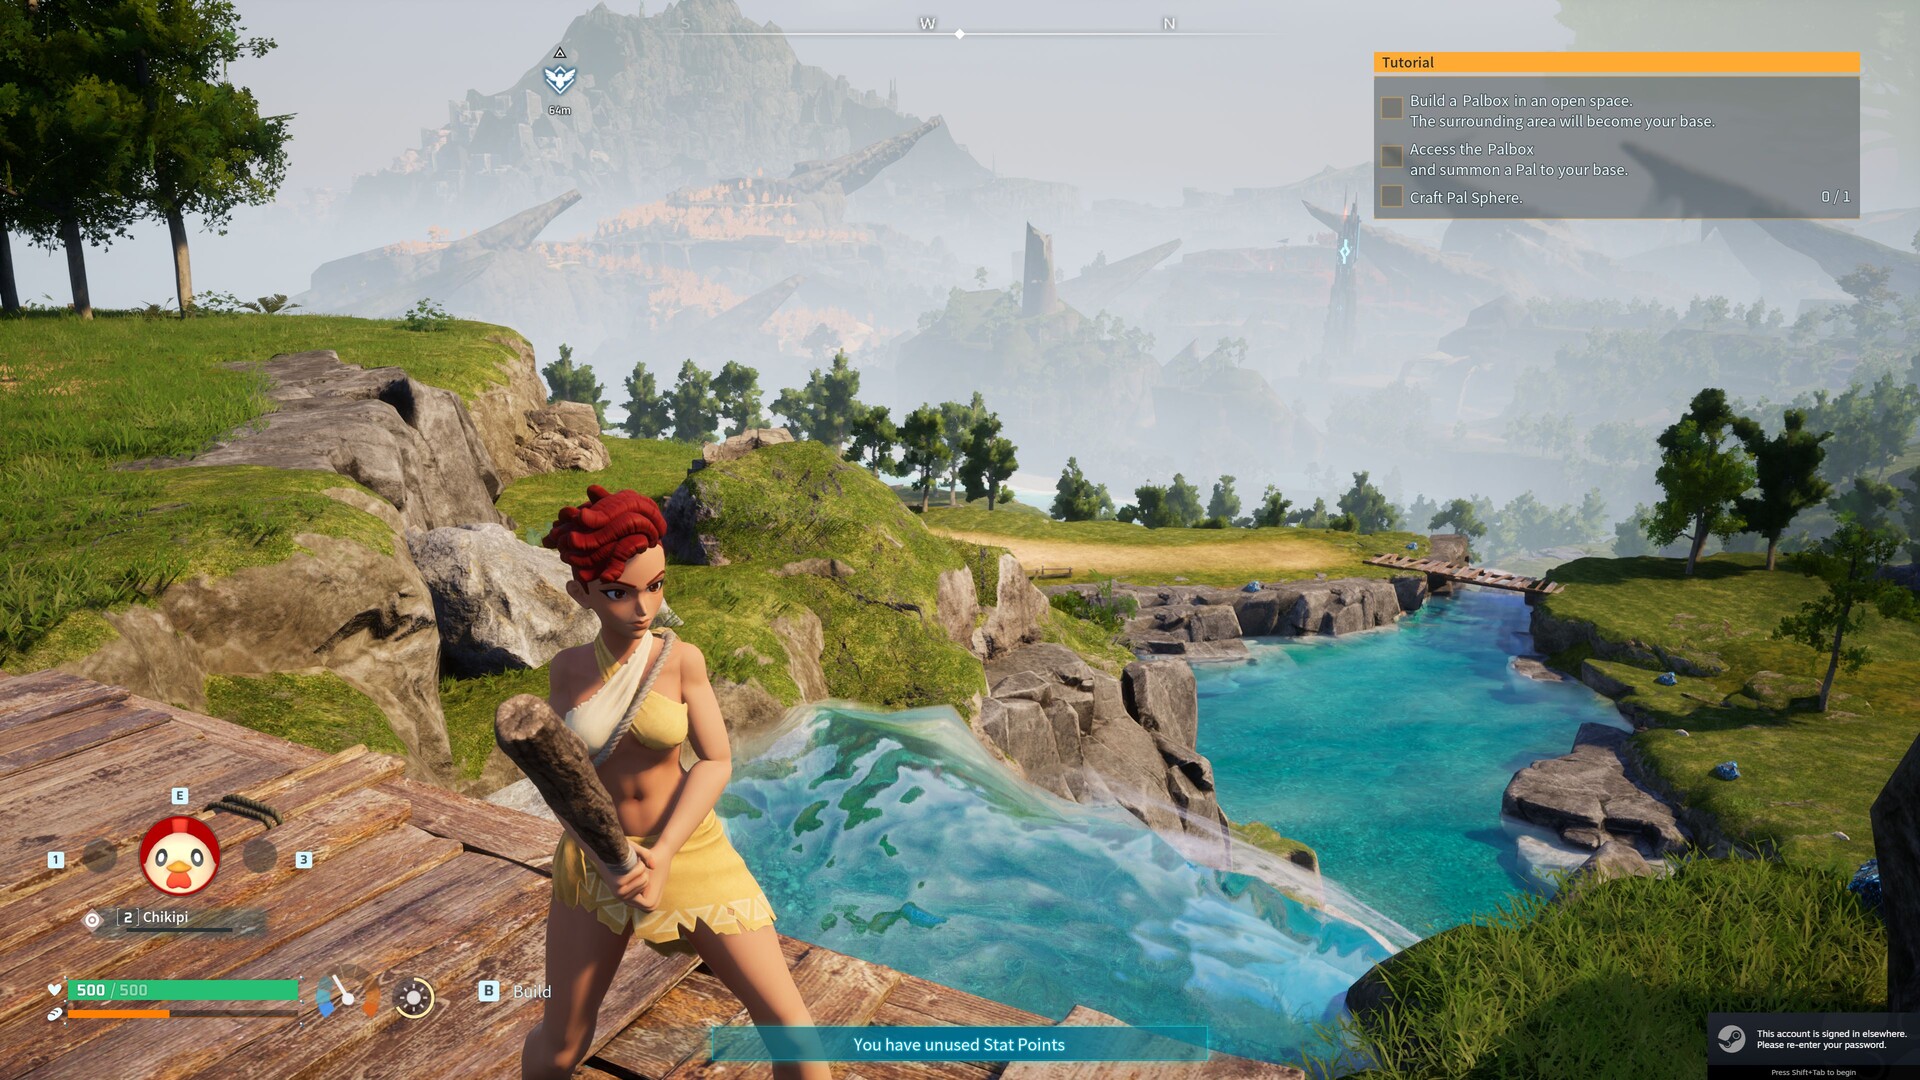
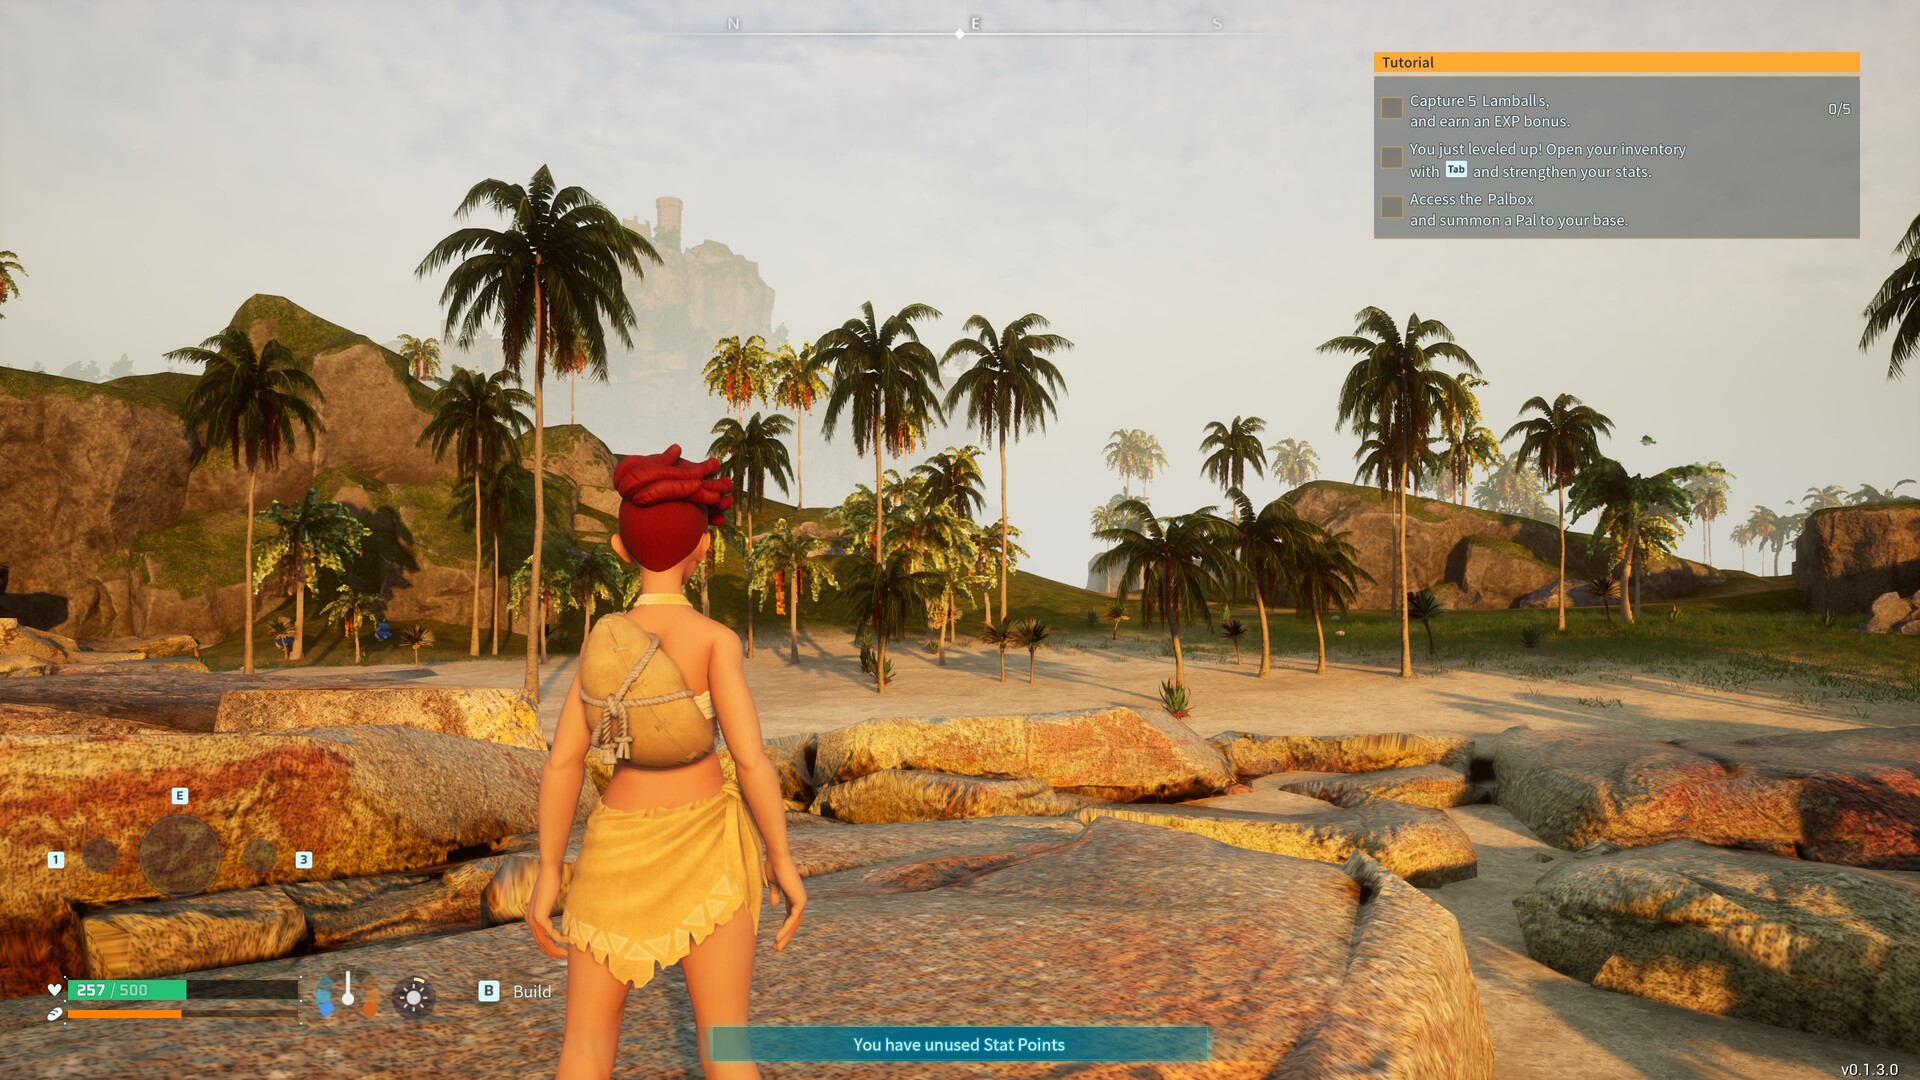
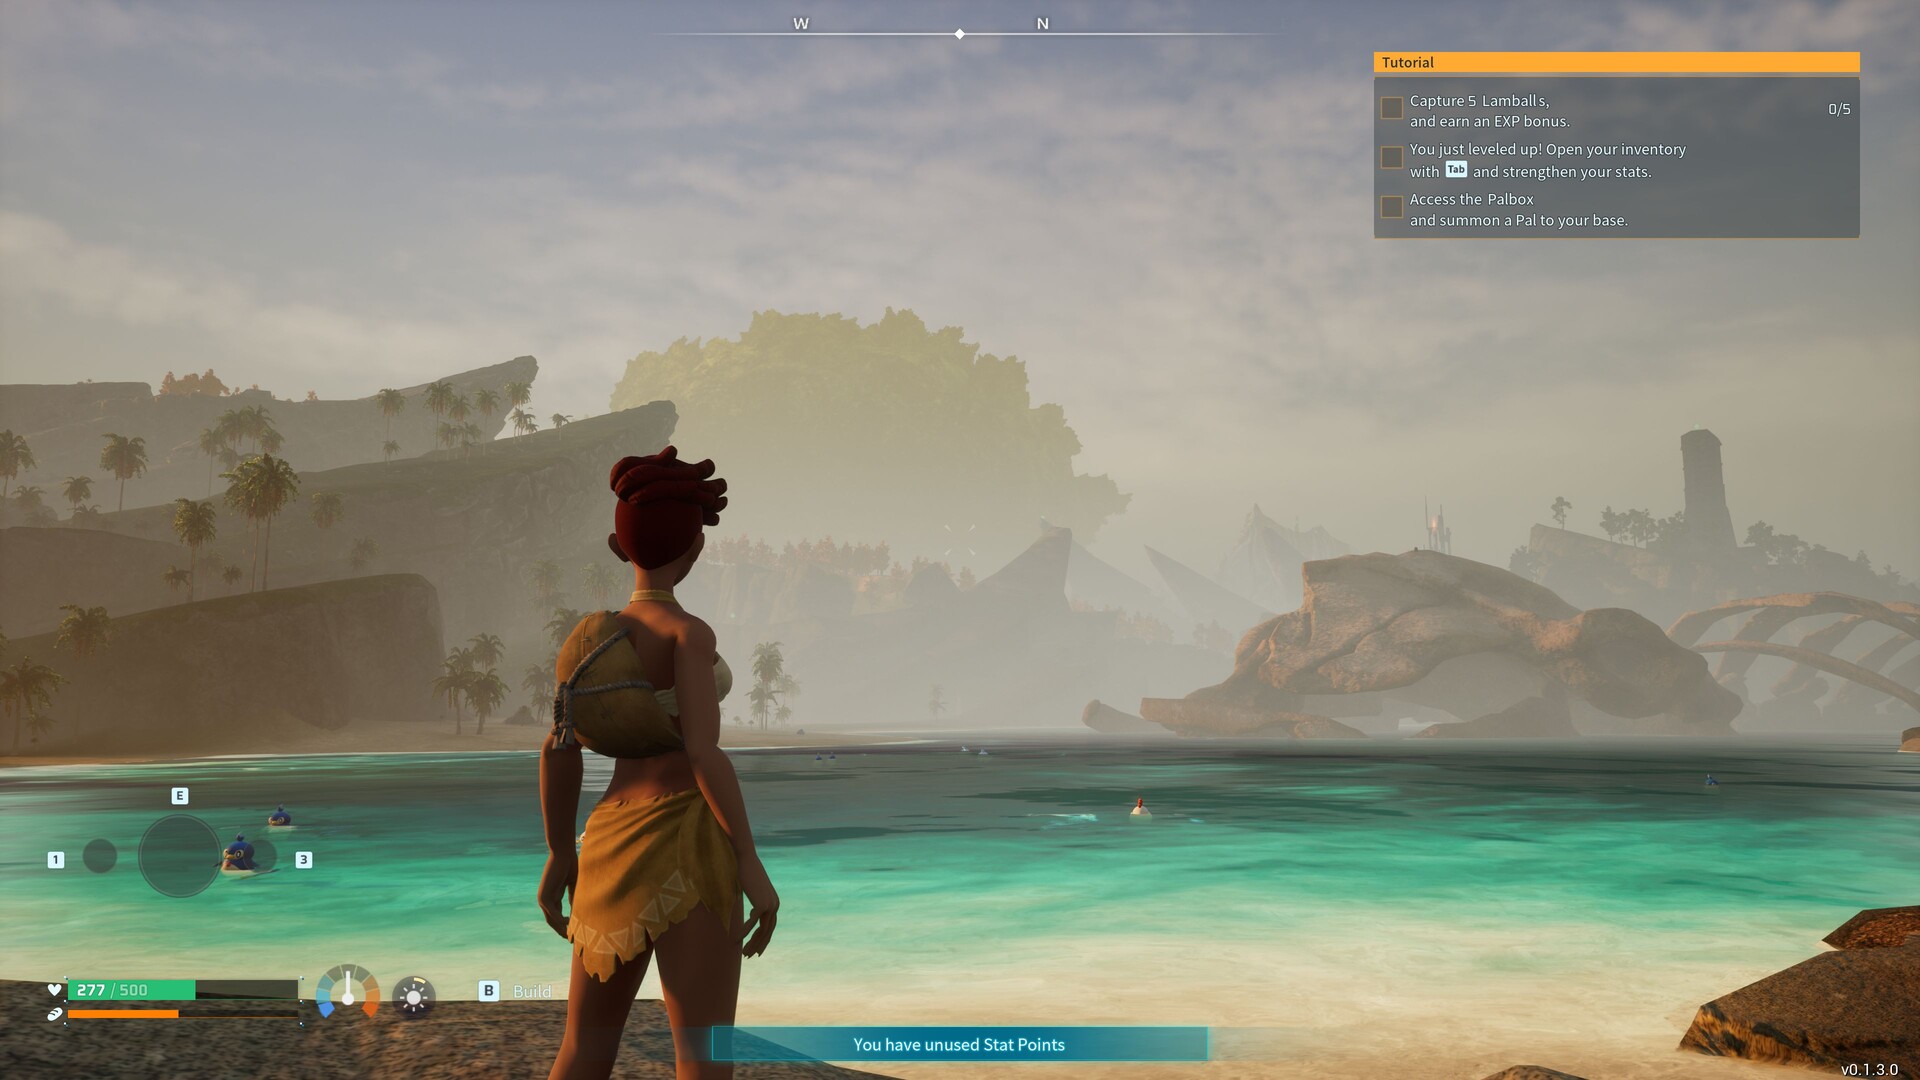
For our measurements, we used the initial phase of the game, specifically when the main character is set free into the open world. The CapFrameX tool is employed to record a predetermined route for just under 20 seconds.

Results


FHD (1,920 x 1,080)

Palworld's hardware requirements fall into a middle range, not particularly low nor high. The iGPU Radeon 780M can handle the low preset smoothly enough in Full HD. Meanwhile, current mid-range graphics cards face no issues with higher presets, as illustrated in our table.

Palworld
    1920x1080 Low Preset AA:TSR     1920x1080 Medium Preset AA:TSR     1920x1080 High Preset AA:TSR     1920x1080 Epic Preset AA:TSR
NVIDIA GeForce RTX 4080, i9-13900K
Desktop-PC Asus ROG Strix Z790-F
237 (51min, 91.8P0.1, 159.1P1) fps ∼100%
219 (55.4min, 110.5P0.1, 165.4P1) fps ∼100%
218 (75.5min, 95.5P0.1, 145.3P1) fps ∼100%
AMD Radeon RX 7900 XT, i9-13900K
Desktop-PC Asus ROG Strix Z790-F
173.9 (72.6min, 98.7P0.1, 135.2P1) fps ∼73%
153.9 (50.3min, 57.5P0.1, 108.6P1) fps ∼70%
149.9 (47min, 55.3P0.1, 98P1) fps ∼69%
NVIDIA GeForce RTX 4090 Laptop GPU, i9-13900H
Asus ROG Zephyrus M16
171.6 (48min, 69.4P0.1, 98.7P1) fps ∼72%
139.3 (26.8min, 48P0.1, 85.2P1) fps ∼64%
138.8 (26.3min, 42.5P0.1, 86.9P1) fps ∼64%
NVIDIA GeForce RTX 4080 Laptop GPU, i9-13950HX
Razer Blade 16 Mid 23
162.3 (33.9min, 57.9P0.1, 95.5P1) fps ∼68%
133.5 (32.2min, 39.3P0.1, 77.7P1) fps ∼61%
130.8 (23.6min, 34.4P0.1, 73.8P1) fps ∼60%
NVIDIA GeForce RTX 4070 Laptop GPU, i9-13900HX
XMG Pro 15 E23
118.4 (7.9min, 42.5P0.1, 73.7P1) fps ∼50%
111 (29.1min, 46.7P0.1, 73P1) fps ∼51%
108.5 (34.6min, 46.6P0.1, 70.2P1) fps ∼50%
NVIDIA GeForce RTX 4060 Laptop GPU, R9 7940HS
Razer Blade 14 Mid 23
110.7 (31.6min, 34.9P0.1, 54.4P1) fps ∼47%
91.9 (13.2min, 23.2P0.1, 53.7P1) fps ∼42%
87.8 (13.4min, 18.4P0.1, 44.8P1) fps ∼40%
NVIDIA GeForce RTX 4050 Laptop GPU, i7-13700H
Medion Erazer Scout E20
99.1 (25.7min, 37.4P0.1, 68.1P1) fps ∼42%
76.3 (31.8min, 36.1P0.1, 58.9P1) fps ∼35%
74.9 (28.8min, 39.1P0.1, 61P1) fps ∼34%
AMD Radeon RX 7600S, R9 7940HS
Asus TUF Gaming Advantage A16
117 (59.9min, 75.4P0.1, 90.1P1) fps ∼100%
97.7 (25.5min, 41P0.1, 67.6P1) fps ∼41%
71.9 (32.2min, 39.2P0.1, 51.8P1) fps ∼33%
69.5 (29.4min, 35.7P0.1, 50.6P1) fps ∼32%
AMD Radeon 780M, R9 7940HS
Asus TUF Gaming Advantage A16
37.9 (6.67min, 8.65P0.1, 25P1) fps ∼32%
30.3 (13.1min, 14P0.1, 19.8P1) fps ∼13%
20.5 (4.68min, 5.5P0.1, 11.8P1) fps ∼9%
20.2 (10.6min, 10.9P0.1, 12.5P1) fps ∼9%

QHD (2,560 x 1,440)

Even at QHD resolution, a high-end graphics card is not necessary. A GeForce RTX 4050 or Radeon RX 7600S is adequate for a combination of 2,560 x 1,440 pixels and the Epic preset.

Palworld
    2560x1440 Epic Preset AA:TSR
NVIDIA GeForce RTX 4080, i9-13900K
Desktop-PC Asus ROG Strix Z790-F
178.1 (64.7min, 112.8P0.1, 147.1P1) fps ∼100%
AMD Radeon RX 7900 XT, i9-13900K
Desktop-PC Asus ROG Strix Z790-F
135.2 (14.2min, 49.8P0.1, 85.1P1) fps ∼76%
NVIDIA GeForce RTX 4090 Laptop GPU, i9-13900H
Asus ROG Zephyrus M16
110.5 (31min, 40.3P0.1, 61.9P1) fps ∼62%
NVIDIA GeForce RTX 4080 Laptop GPU, i9-13950HX
Razer Blade 16 Mid 23
106.7 (25.6min, 31.6P0.1, 53.9P1) fps ∼60%
NVIDIA GeForce RTX 4070 Laptop GPU, i9-13900HX
XMG Pro 15 E23
81.3 (33.5min, 35.1P0.1, 56.1P1) fps ∼46%
NVIDIA GeForce RTX 4060 Laptop GPU, R9 7940HS
Razer Blade 14 Mid 23
65.6 (7.31min, 12.6P0.1, 39.2P1) fps ∼37%
NVIDIA GeForce RTX 4050 Laptop GPU, i7-13700H
Medion Erazer Scout E20
50.6 (21.2min, 27.7P0.1, 40.2P1) fps ∼28%
AMD Radeon RX 7600S, R9 7940HS
Asus TUF Gaming Advantage A16
48.9 (14.9min, 17P0.1, 35.8P1) fps ∼27%

UHD (3,840 x 2,160)

The actual test comes at 3,840 x 2,160 pixels, especially if upscaling is not utilized. The Epic preset runs smoothly only with a GeForce RTX 4070 or higher. With DLSS included, a GeForce RTX 4060 is sufficient.

Palworld
    3840x2160 Epic Preset AA:TSR     3840x2160 Epic Preset + Quality DLSS AA:TSR
NVIDIA GeForce RTX 4080, i9-13900K
Desktop-PC Asus ROG Strix Z790-F
101.6 (46.1min, 58.5P0.1, 82.9P1) fps ∼100%
139.8 (9.18min, 61.1P0.1, 105.5P1) fps ∼100%
AMD Radeon RX 7900 XT, i9-13900K
Desktop-PC Asus ROG Strix Z790-F
71.3 (10.3min, 12.3P0.1, 46.3P1) fps ∼70%
NVIDIA GeForce RTX 4090 Laptop GPU, i9-13900H
Asus ROG Zephyrus M16
66.5 (23.9min, 26.1P0.1, 38.8P1) fps ∼65%
86.2 (11.9min, 21.2P0.1, 40.8P1) fps ∼62%
NVIDIA GeForce RTX 4080 Laptop GPU, i9-13950HX
Razer Blade 16 Mid 23
61 (20.7min, 22.8P0.1, 35.8P1) fps ∼60%
83 (16.5min, 20.7P0.1, 39.4P1) fps ∼59%
NVIDIA GeForce RTX 4070 Laptop GPU, i9-13900HX
XMG Pro 15 E23
42.7 (16.8min, 19.5P0.1, 33.4P1) fps ∼42%
58.1 (24.4min, 29P0.1, 43.4P1) fps ∼42%
NVIDIA GeForce RTX 4060 Laptop GPU, R9 7940HS
Razer Blade 14 Mid 23
34.8 (14.7min, 14.9P0.1, 24.3P1) fps ∼34%
49.9 (17.6min, 20.9P0.1, 30.6P1) fps ∼36%
NVIDIA GeForce RTX 4050 Laptop GPU, i7-13700H
Medion Erazer Scout E20
26 (11.6min, 12.4P0.1, 15.1P1) fps ∼26%
36.3 (15.5min, 20.4P0.1, 31.7P1) fps ∼26%
AMD Radeon RX 7600S, R9 7940HS
Asus TUF Gaming Advantage A16
25.2 (9.17min, 9.74P0.1, 12.2P1) fps ∼25%

Overview

Show Restrictions
PosModel< PrevNext >Palworld
 Palworld (2024)
low
1920x1080
Low Preset
TSRAA
med.
1920x1080
Medium Preset
TSRAA
high
1920x1080
High Preset
TSRAA
ultra
1920x1080
Epic Preset
TSRAA
QHD
2560x1440
Epic Preset
TSRAA
4K
3840x2160
Epic Preset
TSRAA

3840x2160
Epic Preset + Quality DLSS
TSRAA
NVIDIA GeForce RTX 4090
240
239
234
232
211
138.7
198.3
AMD Radeon RX 7900 XTX
236
223
187.3
184.1
154.5
92.2
NVIDIA GeForce RTX 4080 Super
240n2
238n2
225.5n2
224n2
181.05n2
103.95n2
140.4n2
NVIDIA GeForce RTX 4080
237
219
218
178.1
101.6
139.8
AMD Radeon RX 7900 XT
173.9
153.9
149.9
135.2
71.3
AMD Radeon RX 6950 XT
236
219
172.8
165.3
121.1
67.3
NVIDIA GeForce RTX 4090 Laptop GPU
211
176.25n2
145.3n2
144.85n2
115.15n2
66.5
86.2
NVIDIA GeForce RTX 3090
239
233
208
157.3
120.4
71.5
96.4
NVIDIA GeForce RTX 4080 Laptop GPU
162.3
133.5
130.8
106.7
61
83
NVIDIA GeForce RTX 3080 12 GB
209
165.5
152.7
113.4
66.5
AMD Radeon RX 6800
209
167.8
124
117.4
86.4
46.5
NVIDIA Titan RTX
146.6
123.8
98.7
91.4
65.8
36.3
70.9
NVIDIA GeForce RTX 3080 Ti Laptop GPU
115.6
86.6
47.1
NVIDIA GeForce RTX 4070 Laptop GPU
118.4
106.6n2
102.55n2
75.2n2
42.7
58.1
NVIDIA GeForce RTX 3070
173.9
138.8
124.6
91.4
51.8
AMD Radeon RX 6750 XT
184.2
148.3
110.7
100.9
71.8
38.4
AMD Radeon RX 6700 XT
172.2
140.6
99.9
93.1
67.1
36.3
NVIDIA GeForce RTX 3080 Laptop GPU
119.9
116.4
102.5
96.8n2
70.95n2
40.15n2
54.6n2
NVIDIA GeForce RTX 3060 Ti
185.7
156.9
121.6
109.3
81.5
43.7
61.1
PosModel< PrevNext >Palworld
low med. high ultra QHD 4K
Intel Arc A770
127.4
105.8
82
78.8
60.2
33.5
AMD Radeon RX 7600
158.3
131.5
96.9
85.7
59.6
28.3
NVIDIA GeForce RTX 4060 Laptop GPU
110.7
91.9
87.8
65.6
34.8
49.9
AMD Radeon RX 6650 XT
145.7
115.7
80.9
74.8
52.2
27.4
NVIDIA GeForce RTX 3070 Laptop GPU
116.7
106.1
103
102.1
72.9
38.7
54.9
Intel Arc A750
125.2
112.2
89.5
81.7
59.3
32.3
NVIDIA Titan X Pascal
133.5
112.2
90.3
83.7
57.8
32.2
NVIDIA GeForce RTX 2070 Super (Desktop)
143.7
120.1
94.4
86.3
58.4
31.2
45
AMD Radeon RX 5700 XT (Desktop)
125.7
100.7
73
68.2
47.1
25.9
AMD Radeon RX 7600S
117
97.7
71.9
69.5
48.9
25.2
Intel Arc A580
111.9
94.8
73.5
67.9
48.5
26.7
NVIDIA GeForce RTX 2060 Super (Desktop)
124.7
105
82
75.1
51.5
25.9
40.2
AMD Radeon RX 6600
119.4
104
78.4
70.7
47.2
22.1
AMD Radeon RX 5700 (Desktop)
112.5
89
67.1
62.9
42.7
23.3
AMD Radeon RX 5600 XT (Desktop)
109.8
89.2
66.5
62.4
42.8
21.7
NVIDIA GeForce GTX 1660 Super (Desktop)
86n2
70.75n2
54.15n2
49.65n2
34n2
17.35n2
AMD Radeon RX 6500 XT
68.7
43.7
30.1
21.7
AMD Radeon RX 5500 XT (Desktop)
71.8
60.7
43.4
40.8
28
14.9
NVIDIA GeForce RTX 4050 Laptop GPU
96.2n2
74.4n2
73.4n2
50.6
26
36.3
Intel Arc A730M
80.1
67.4
53.8
50.7
36.5
18.9
PosModel< PrevNext >Palworld
low med. high ultra QHD 4K
NVIDIA GeForce GTX 1660 Ti Mobile
80.5
69.9
55.3
50.7
NVIDIA GeForce GTX 1650 Super (Desktop)
70.9
53.4
51.3
47.4
26
11.8
AMD Radeon RX 6500M
59.5
47.9
26.8
21.1
NVIDIA GeForce RTX 2050 Mobile
57.2
48
37.5
35
NVIDIA GeForce GTX 1650 Mobile
50.6
43.8
33.6
31
Intel Arc A380
46.3
37.4
27.4
24.4
Intel Arc A310
38.3
33.2
23.2
20.9
Intel Arc 8-Cores iGPU
40.6
37.1
29.5
27.3
Intel Arc 7-Cores iGPU
34.8
32.6
25.2
23.4
AMD Radeon 780M
42.4n2
35.1n2
24.95n2
23.1n2
17.7
8.9
Intel UHD Graphics Xe 32EUs (Tiger Lake-H)
11.1
Intel UHD Graphics 630
5.96
AMD Radeon RX Vega 3
6.28
(-) * Smaller values are better. / n123 Number of benchmarks for this median value / * Approximate position


Legend
5Stutters – This game is very likely to stutter and have poor frame rates. Based on all known benchmarks using the specified graphical settings, average frame rates are expected to fall below 25fps
May Stutter – This graphics card has not been explicitly tested on this game. Based on interpolated information from surrounding graphics cards of similar performance levels, stutters and poor frame rates are expected.
30Fluent – Based on all known benchmarks using the specified graphical settings, this game should run at or above 25fps
40Fluent – Based on all known benchmarks using the specified graphical settings, this game should run at or above 35fps
60Fluent – Based on all known benchmarks using the specified graphical settings, this game should run at or above 58fps
May Run Fluently – This graphics card has not been explicitly tested on this game. Based on interpolated information from surrounding graphics cards of similar performance levels, fluent frame rates are expected.
?Uncertain – This graphics card experienced unexpected performance issues during testing for this game. A slower card may be able to achieve better and more consistent frame rates than this particular GPU running the same benchmark scene.
Uncertain – This graphics card has not been explicitly tested on this game and no reliable interpolation can be made based on the performances of surrounding cards of the same class or family.
The value in the fields displays the average frame rate of all values in the database. Move your cursor over the value to see individual results.

Test system details

Notebook Graphics card Processor RAM
Asus ROG Zephyrus M16 Nvidia GeForce RTX 4090 @150 W TGP (16 GB GDDR6X) Intel Core i9-13900H 2 x 16 GB DDR5
Razer Blade 16 Mid 23 Nvidia GeForce RTX 4080 @175 W TGP (12 GB GDDR6X) Intel Core i9-13950HX 2 x 16 GB DDR5
XMG Pro 15 E23 Nvidia GeForce RTX 4070 @140 W TGP (8 GB GDDR6) Intel Core i9-13900HX 2 x 16 GB DDR5
Razer Blade 14 Mid 23 Nvidia GeForce RTX 4060 @140 W TGP (8 GB GDDR6) AMD Ryzen 9 7940HS 2 x 8 GB DDR5
Medion Erazer Scout E20 Nvidia GeForce RTX 4050 @100 W TGP (6 GB GDDR6) Intel Core i7-13700H 2 x 8 GB DDR5
Asus TUF Gaming Advantage A16 AMD Radeon RX 7600S (8 GB GDDR6) & AMD Radeon 780M AMD Ryzen 9 7940HS 2 x 8 GB DDR5
Tower PC Graphics card Processor RAM
Asus ROG Strix Z790-F Nvidia GeForce RTX 4080 (16 GB GDDR6X)
AMD Radeon RX 7900 XT (20 GB GDDR6)
Intel Core i9-13900K 2 x 24 GB DDR5 G.Skill
4K monitor Operating system Nvidia driver AMD driver
Philips Evnia 42M2N8900 Windows 11 ForceWare 546.65 Adrenalin 23.12.1
Read all 1 comments / answer
static version load dynamic
Loading Comments
Comment on this article
Please share our article, every link counts!
> Expert Reviews and News on Laptops, Smartphones and Tech Innovations > Reviews > Palworld in review: Laptop and desktop benchmarks
Florian Glaser, 2024-01-26 (Update: 2024-01-26)