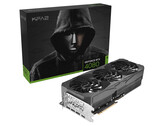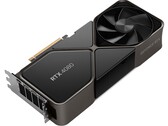
The Nvidia GeForce RTX 4080 is a high-end desktop graphics card based on the AD103 chip using the Ada Lovelace architecture. The 4080 offers 9,728 cores and 16 GB GDDR6X graphics memory with a 256-bit memory bus and clocked at 22.4 Gbits. The card offers a very good ray tracing performance thanks to the 76 dedicated ray tracing cores. For AI calculations (and DLSS 3 in games), the RTX 4080 has 304 Tensor cores.
The gaming performance is well-suited for 4k60 gaming in maximum detail settings and 2K gaming with higher frame rates. Even ray tracing effects can be used with DLSS in most games. Compared to the competition, the RTX 4080 is on par with the AMD Radeon RX 7900 XT , with a noticeable advantage when raytracing is used.
The AD103 chip is manufactured in the modern 5nm process at TSMC (4N with EUV) and specified with a TGP (Total Graphics Power) of 320 Watts (compared to the 450 Watts of the RTX 4090 ). Nvidia is recommending a 750-watt power supply for the RTX 4080.
GeForce RTX 4000 Series Codename AD103-300-A1 Architecture Ada Lovelace Pipelines 9728 - unified TMUs 304 ROPs 112 Raytracing Cores 76 Tensor / AI Cores 304 Core Speed 2205 - 2505 (Boost) MHz Theoretical Performance 48.7 TFLOPS FP16, 48.7 TFLOPS FP32, 0.76 TFLOPS FP64 AI GPU 780 TOPS INT8 Cache L2: 64 MB Memory Speed 22400 effective = 1400 MHz Memory Bus Width 256 Bit Memory Type GDDR6X Max. Amount of Memory 16 GB Shared Memory no Memory Bandwidth 716.8 GB/s API DirectX 12 Ultimate, Shader 6.7, OpenGL 4.6, OpenCL 3.0, Vulkan 1.3 Power Consumption 320 Watt Transistor Count 45.900 Million Die Size 379 mm² Man. Technology 5 nm PCIe 4.0 x16 Displays 4 Displays (max.), HDMI 2.1, DisplayPort 1.4a Date of Announcement 20.09.2022 Link to Manufacturer Page www.nvidia.com Predecessor GeForce RTX 3080 12 GB
Performance Rating - 3DMark 11 + Fire Strike + Time Spy
3DMark - 3DMark Speed Way Score
min: 6857 avg: 7004 median: 6994 (47%) max: 7169 Points
3DMark - 3DMark Steel Nomad
...
AMD Radeon RX 9070 GRE
3DMark - 3DMark Wild Life Unlimited
min: 168063 avg: 168356 median: 168356 (85%) max: 168648 Points
3DMark - 3DMark Wild Life Extreme Unlimited
min: 58693 avg: 59206 median: 59205.5 (69%) max: 59718 Points
3DMark - 3DMark Solar Bay
3DMark - 3DMark Fire Strike Standard Score
min: 42673 avg: 45551 median: 44563 (67%) max: 52792 Points
...
AMD Radeon RX 9070 GRE
...
3DMark - 3DMark Fire Strike Standard Graphics
min: 56220 avg: 59341 median: 58893 (54%) max: 65190 Points
...
AMD Radeon RX 9070 GRE
...
3DMark - 3DMark Ice Storm Graphics
min: 607574 avg: 672148 median: 653221 (72%) max: 755650 Points
3DMark - 3DMark Time Spy Score
min: 23129 avg: 25341 median: 25833 (67%) max: 26494 Points
...
AMD Radeon RX 9070 GRE
3DMark - 3DMark Time Spy Graphics
min: 26550 avg: 27394 median: 27679 (56%) max: 28133 Points
...
AMD Radeon RX 9070 GRE
3DMark - 3DMark Ice Storm Unlimited Graphics
min: 745945 avg: 776952 median: 769721 (78%) max: 815189 Points
3DMark - 3DMark Ice Storm Extreme Graphics
min: 547101 avg: 614279 median: 613293 (72%) max: 682443 Points
3DMark - 3DMark Cloud Gate Score
min: 84302 avg: 86849 median: 86459 (82%) max: 89785 Points
3DMark - 3DMark Cloud Gate Graphics
min: 177280 avg: 214985 median: 185431 (46%) max: 282243 Points
3DMark - 3DMark Night Raid
min: 87448 avg: 92699 median: 92571 (87%) max: 98077 Points
3DMark - 3DMark Night Raid Graphics Score
min: 209322 avg: 220093 median: 211103 (81%) max: 239853 Points
3DMark 11 - 3DM11 Performance Score
min: 49823 avg: 57148 median: 57741 (70%) max: 62760 Points
3DMark 11 - 3DM11 Performance GPU
min: 63679 avg: 81373 median: 86267 (66%) max: 88359 Points
3DMark Vantage 3DM Vant. Perf. total + 3DMark Vantage - 3DM Vant. Perf. total
3DM Vant. Perf. GPU no PhysX + 3DMark Vantage - 3DM Vant. Perf. GPU no PhysX
3DMark 05 - 3DMark 05 - Standard
3DMark 06 3DMark 06 - Standard 1280x1024 + Unigine Valley 1.0 - Unigine Valley 1.0 DX
min: 253.1 avg: 263.1 median: 260.9 (79%) max: 277.5 fps
Blender - Blender 3.3 Classroom CUDA *
min: 14 avg: 14.5 median: 14.5 (2%) max: 15 Seconds
Blender - Blender 3.3 Classroom OPTIX *
min: 9 avg: 9.3 median: 9 (3%) max: 10 Seconds
SPECviewperf 12 specvp12 sw-03 + SPECviewperf 12 - specvp12 sw-03
min: 113 avg: 120 median: 120 (30%) max: 127 fps
specvp12 snx-02 + SPECviewperf 12 - specvp12 snx-02
min: 21.6 avg: 22.5 median: 22.5 (3%) max: 23.4 fps
specvp12 showcase-01 + SPECviewperf 12 - specvp12 showcase-01
min: 304 avg: 318.5 median: 318.5 (55%) max: 333 fps
specvp12 mediacal-01 + SPECviewperf 12 - specvp12 mediacal-01
min: 171 avg: 199 median: 199 (51%) max: 227 fps
specvp12 maya-04 + SPECviewperf 12 - specvp12 maya-04
min: 309 avg: 309.5 median: 309.5 (84%) max: 310 fps
specvp12 energy-01 + SPECviewperf 12 - specvp12 energy-01
min: 57.5 avg: 58.2 median: 58.2 (52%) max: 58.8 fps
specvp12 creo-01 + SPECviewperf 12 - specvp12 creo-01
min: 110 avg: 114 median: 114 (46%) max: 118 fps
specvp12 catia-04 + SPECviewperf 12 - specvp12 catia-04
min: 221 avg: 225 median: 225 (35%) max: 229 fps
specvp12 3dsmax-05 + SPECviewperf 12 - specvp12 3dsmax-05
min: 477 avg: 489.5 median: 489.5 (74%) max: 502 fps
SPECviewperf 13 specvp13 sw-04 + SPECviewperf 13 - specvp13 sw-04
min: 179 avg: 181 median: 181 (49%) max: 183 fps
specvp13 snx-03 + SPECviewperf 13 - specvp13 snx-03
min: 39 avg: 40.6 median: 40.6 (5%) max: 42.1 fps
specvp13 showcase-02 + SPECviewperf 13 - specvp13 showcase-02
min: 305 avg: 319.5 median: 319.5 (54%) max: 334 fps
specvp13 medical-02 + SPECviewperf 13 - specvp13 medical-02
min: 148 avg: 149 median: 149 (25%) max: 150 fps
specvp13 maya-05 + SPECviewperf 13 - specvp13 maya-05
min: 678 avg: 702 median: 702 (80%) max: 726 fps
specvp13 energy-02 + SPECviewperf 13 - specvp13 energy-02
min: 91.7 avg: 92.2 median: 92.2 (30%) max: 92.6 fps
specvp13 creo-02 + SPECviewperf 13 - specvp13 creo-02
min: 529 avg: 537 median: 536.5 (78%) max: 544 fps
specvp13 catia-05 + SPECviewperf 13 - specvp13 catia-05
min: 333 avg: 336.5 median: 336.5 (37%) max: 340 fps
specvp13 3dsmax-06 + SPECviewperf 13 - specvp13 3dsmax-06
min: 478 avg: 487.5 median: 487.5 (76%) max: 497 fps
SPECviewperf 2020 specvp2020 solidworks-05 4k + SPECviewperf 2020 - specvp2020 solidworks-05 4k
specvp2020 snx-04 4k + SPECviewperf 2020 - specvp2020 snx-04 4k
min: 31.9 avg: 33 median: 33 (3%) max: 34.1 fps
specvp2020 medical-03 4k + SPECviewperf 2020 - specvp2020 medical-03 4k
min: 28.3 avg: 30.3 median: 30.3 (19%) max: 32.2 fps
specvp2020 maya-06 4k + SPECviewperf 2020 - specvp2020 maya-06 4k
min: 426 avg: 436.5 median: 436.5 (63%) max: 447 fps
specvp2020 energy-03 4k + SPECviewperf 2020 - specvp2020 energy-03 4k
min: 45.6 avg: 68 median: 68 (15%) max: 90.4 fps
specvp2020 creo-03 4k + SPECviewperf 2020 - specvp2020 creo-03 4k
min: 128 avg: 132 median: 132 (59%) max: 136 fps
specvp2020 catia-06 4k + SPECviewperf 2020 - specvp2020 catia-06 4k
min: 75.5 avg: 76 median: 76 (50%) max: 76.5 fps
specvp2020 3dsmax-07 4k + SPECviewperf 2020 - specvp2020 3dsmax-07 4k
min: 172 avg: 175.5 median: 175.5 (59%) max: 179 fps
Cinebench R15 Cinebench R15 OpenGL 64 Bit + Cinebench R15 - Cinebench R15 OpenGL 64 Bit
min: 59.8 avg: 158.9 median: 158.9 (9%) max: 258 fps
Cinebench R15 OpenGL Ref. Match 64 Bit + Cinebench R15 - Cinebench R15 OpenGL Ref. Match 64 Bit
Basemark GPU 1.2 - Basemark GPU 1.2 Vulkan Official Medium Offscreen 1080
min: 600 avg: 1811 median: 1810.5 (44%) max: 3021 fps
Geekbench 6.7 - Geekbench 6.7.1 GPU OpenCL
min: 242144 avg: 247392 median: 247392 (63%) max: 252639 points
Geekbench 6.7 - Geekbench 6.7.1 GPU Vulkan
min: 168157 avg: 190889 median: 190888 (47%) max: 213620 points
LuxMark v2.0 64Bit - LuxMark v2.0 Room GPU
min: 9757 avg: 10193 median: 10261.5 (37%) max: 10491 Samples/s
LuxMark v2.0 64Bit - LuxMark v2.0 Sala GPU
min: 23809 avg: 24336 median: 24349.5 (43%) max: 24835 Samples/s
ComputeMark v2.1 - ComputeMark v2.1 Result
min: 59738 avg: 61857 median: 62468 (52%) max: 62753 points
Power Consumption - Furmark Stress Test Power Consumption - external Monitor *
min: 420 avg: 445.8 median: 447.5 (60%) max: 468 Watt
0 10 20 30 40 50 60 70 80 90 100 110 120 130 140 150 160 170 180 190 200 210 220 230 240 250 260 270 280 290 300 310 320 330 340 350 360 370 380 390 400 410 420 430 440 450 460 470 480 Tooltip NVIDIA GeForce RTX 4080 Founders Edition Idle: 72 W: Ø420 (402-461)
NVIDIA GeForce RTX 4080 Founders Edition 110% PT: Ø429 (423-436)
NVIDIA GeForce RTX 4080 Founders Edition 110% PT: Ø466 (461-488)
KFA2 GeForce RTX 4080 SG: Ø468 (453-480)
Power Consumption - The Witcher 3 Power Consumption - external Monitor *
min: 367 avg: 427.8 median: 440.5 (62%) max: 463 Watt
...
AMD Radeon RX 9070 GRE
...
0 10 20 30 40 50 60 70 80 90 100 110 120 130 140 150 160 170 180 190 200 210 220 230 240 250 260 270 280 290 300 310 320 330 340 350 360 370 380 390 400 410 420 430 440 450 460 470 480 Tooltip NVIDIA GeForce RTX 4080 Founders Edition Idle: 72 W: Ø367 (361-386)
NVIDIA GeForce RTX 4080 Founders Edition 110% PT: Ø420 (410-448)
NVIDIA GeForce RTX 4080 Founders Edition 110% PT: Ø463 (451-481)
KFA2 GeForce RTX 4080 SG: Ø461 (450-476)
Power Consumption - Power Efficiency - Witcher 3 ultra external Monitor
min: 0.549 avg: 0.6 median: 0.6 (48%) max: 0.581 fps per Watt
Power Consumption - Cyberpunk 2077 Power Consumption - external Monitor *
...
AMD Radeon RX 9070 GRE
...
0 15 30 45 60 75 90 105 120 135 150 165 180 195 210 225 240 255 270 285 300 315 330 345 360 375 390 405 420 435 450 465 480 495 Tooltip NVIDIA GeForce RTX 4080 Founders Edition Idle: 72 W: Ø488 (479-503)
Power Consumption - Power Efficiency - Cyberpunk 2077 ultra
- Range of benchmark values
- Average benchmark values
* Smaller numbers mean a higher performance

The following benchmarks stem from our benchmarks of review laptops. The performance depends on the used graphics memory, clock rate, processor, system settings, drivers, and operating systems. So the results don't have to be representative for all laptops with this GPU. For detailed information on the benchmark results, click on the fps number.

152.9 [X] NVIDIA GeForce RTX 4080 Founders Edition 2.21
Intel Core i9-14900K 3.2GHz
GeForce RTX 4080
min:
101.6 fps, max:
193.8 fps
187 [X] Desktop-PC Asus ROG Strix Z790-F Intel Core i9-13900K 3GHz
GeForce RTX 4080
min:
78 fps
~ 170 fps
+ Compare
- Hide Comparison
113.1 [X] NVIDIA GeForce RTX 4080 Founders Edition 2.21
Intel Core i9-14900K 3.2GHz
GeForce RTX 4080
min:
91 fps, max:
144.5 fps
125 [X] Desktop-PC Asus ROG Strix Z790-F Intel Core i9-13900K 3GHz
GeForce RTX 4080
min:
97 fps
~ 119 fps
+ Compare
- Hide Comparison
54.9 [X] NVIDIA GeForce RTX 4080 Founders Edition 2.21
Intel Core i9-14900K 3.2GHz
GeForce RTX 4080
min:
44.9 fps, max:
69.5 fps
61.7 [X] Desktop-PC Asus ROG Strix Z790-F Intel Core i9-13900K 3GHz
GeForce RTX 4080
min:
51 fps
~ 58 fps
+ Compare
- Hide Comparison
» With all tested laptops playable in detail settings ultra.
Additional Benchmarks
Ray Tracing Ultra Preset (DLSS off) 1920x1080
97.3 [X] Desktop-PC Asus ROG Strix Z790-F Intel Core i9-13900K 3GHz
GeForce RTX 4080
min:
60 fps
93.3 [X] NVIDIA GeForce RTX 4080 Founders Edition Intel Core i9-13900K 3GHz
GeForce RTX 4080
min:
74.9 fps, max:
125.5 fps
82.3 [X] NVIDIA GeForce RTX 4080 Founders Edition Intel Core i9-14900K 3.2GHz
GeForce RTX 4080
min:
72.6 fps, max:
91.6 fps
Ray Tracing Ultra Preset + DLSS3 Quality + FG 3840x2160
81.6 [X] Desktop-PC Asus ROG Strix Z790-F Intel Core i9-13900K 3GHz
GeForce RTX 4080
min:
70 fps
Ray Tracing Ultra Preset (DLSS off, no Path Tracing) 3840x2160
28.9 [X] NVIDIA GeForce RTX 4080 Founders Edition Intel Core i9-13900K 3GHz
GeForce RTX 4080
min:
25.6 fps, max:
35.2 fps
28.7 [X] NVIDIA GeForce RTX 4080 Founders Edition Intel Core i9-14900K 3.2GHz
GeForce RTX 4080
min:
25.7 fps, max:
34.6 fps
30min Start Ultra Preset (FSR off) 1920x1080
145.8 [X] NVIDIA GeForce RTX 4080 Founders Edition Intel Core i9-14900K 3.2GHz
GeForce RTX 4080
min:
28.5 fps, P0.1:
115.2 fps, P1:
122.7 fps, max:
208 fps
Ray Tracing Overdrive Preset + DLSS 4 Transformer Quality (no FG) 3840x2160
33.4 [X] NVIDIA GeForce RTX 4080 Founders Edition Intel Core i9-14900K 3.2GHz
GeForce RTX 4080
min:
30.3 fps, max:
37.9 fps