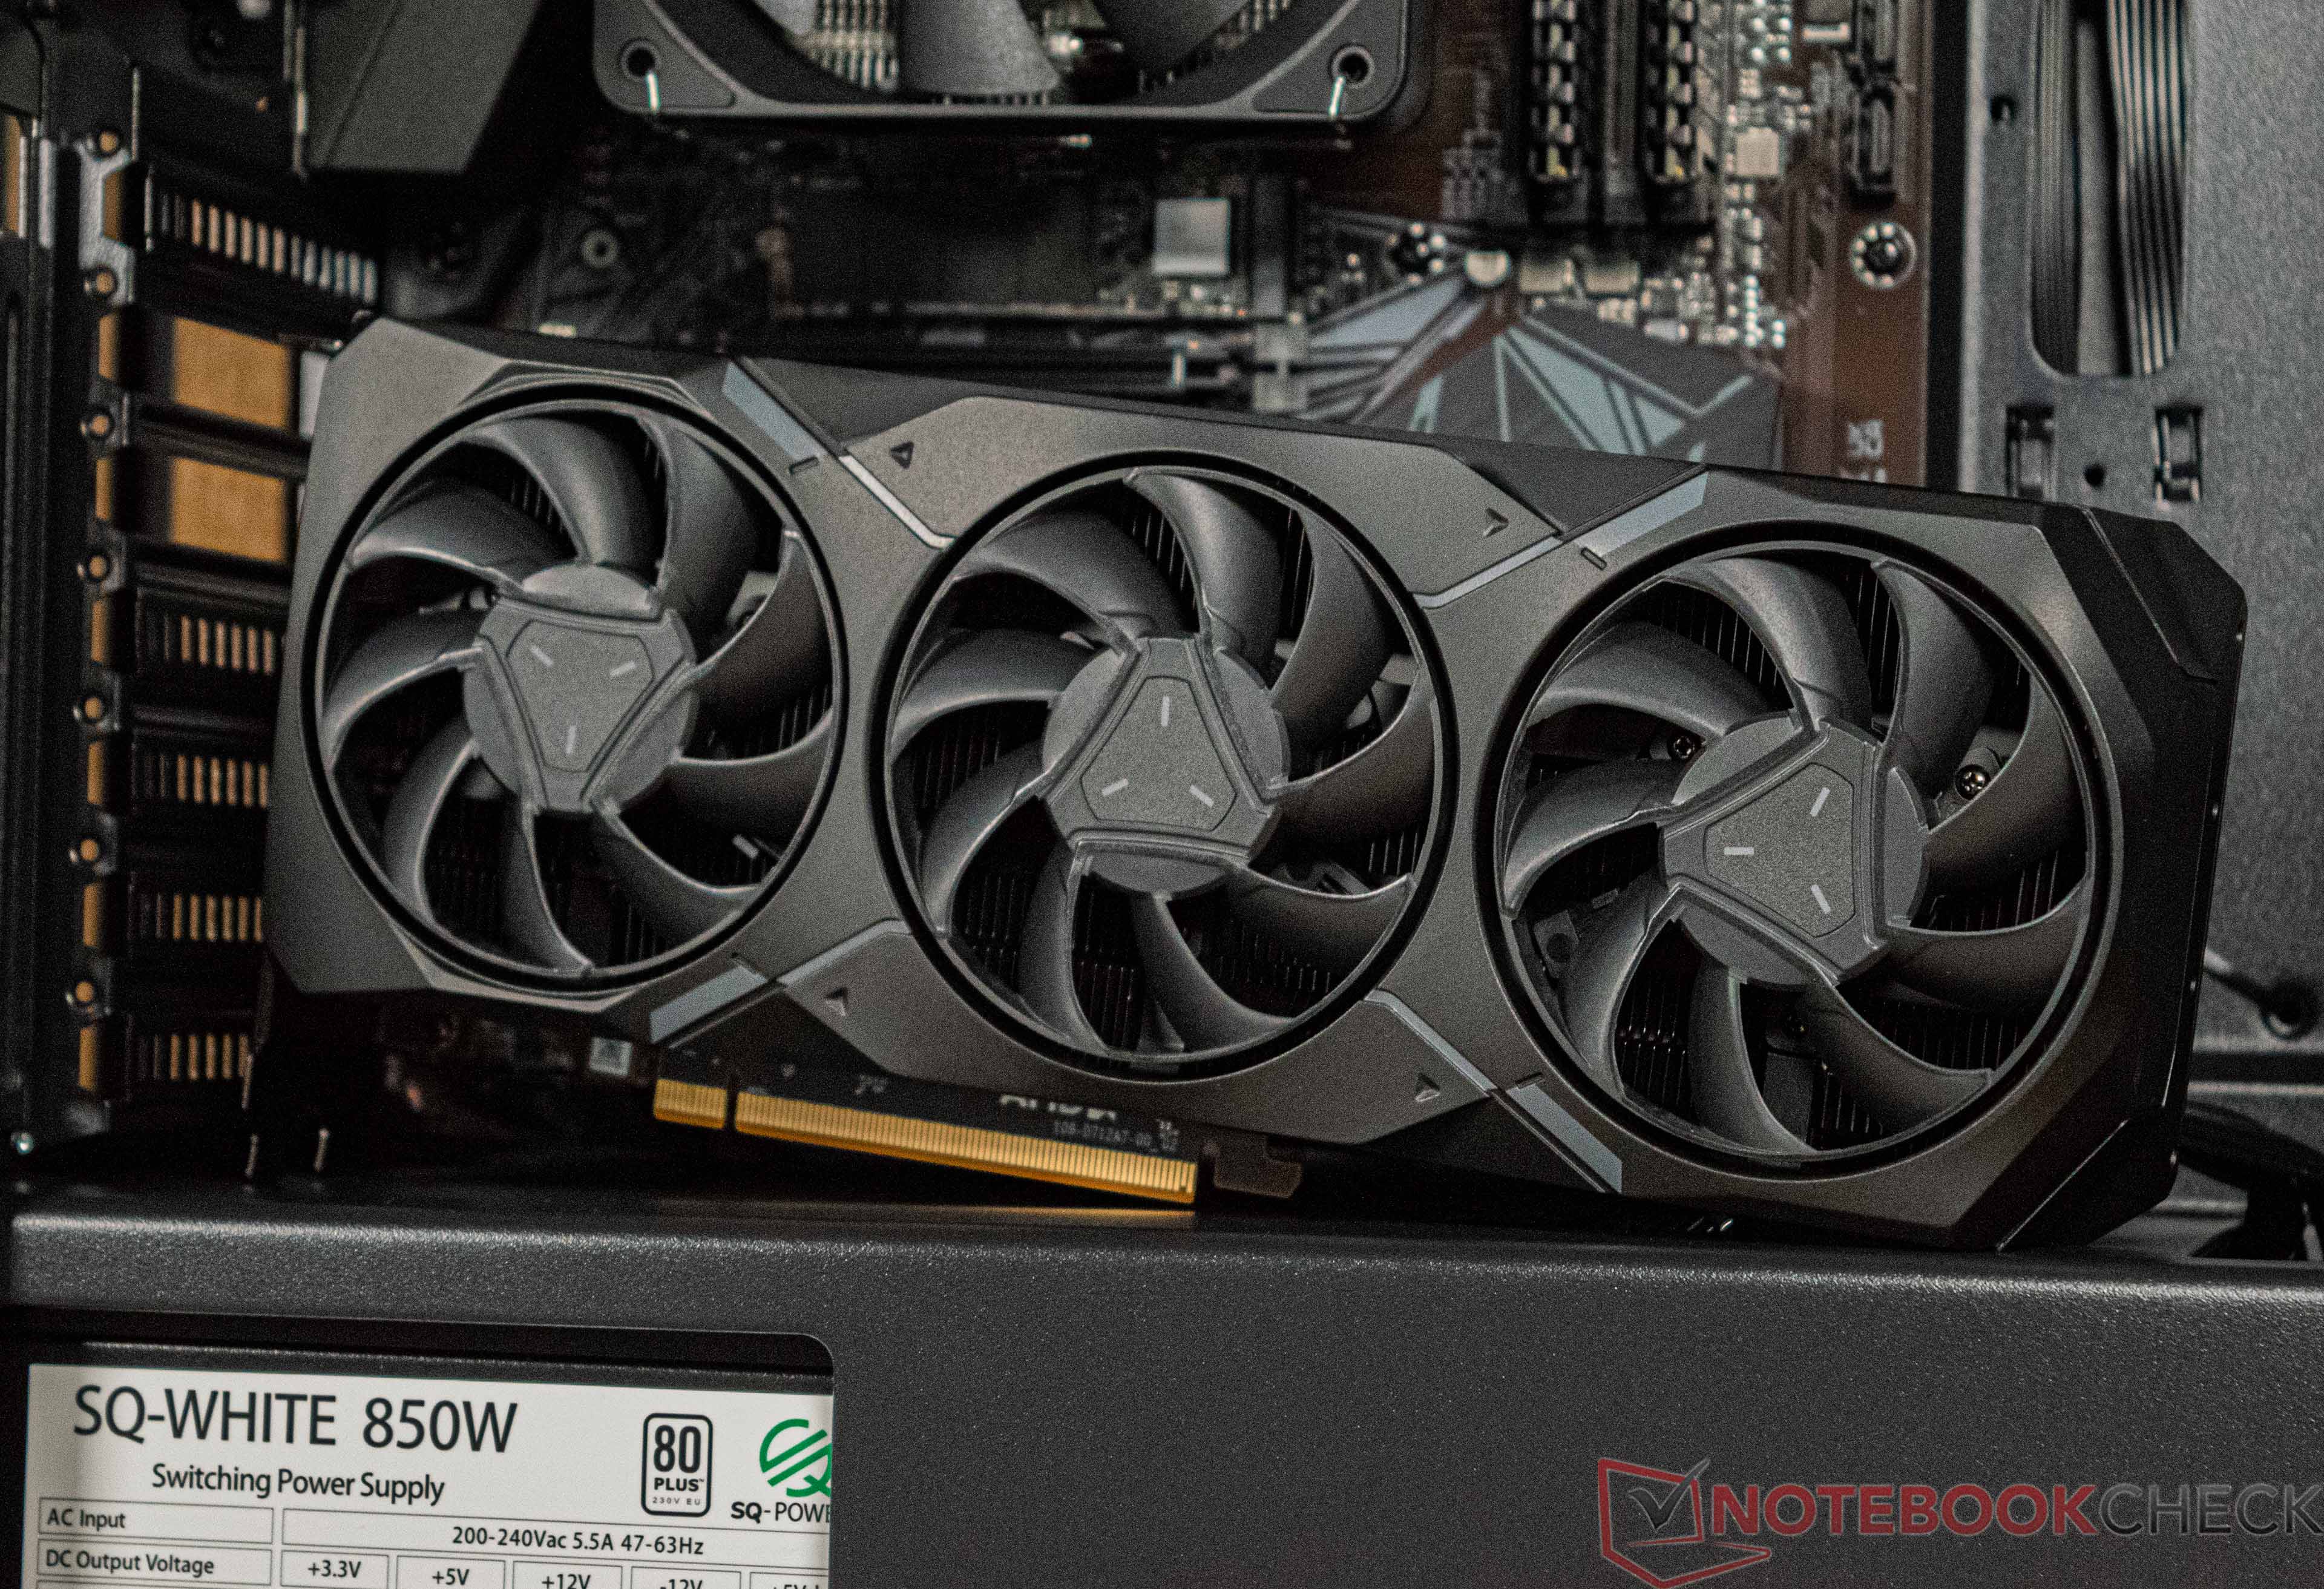
Notebookcheck Logo

AMD Radeon RX 7900 GRE

AMD Radeon RX 7900 GRE

The AMD Radeon RX 7900 GRE is a high end OEM desktop graphics card based on the RDNA 3 architecture. It uses the Navi 31 Chip with consists out of a Graphics Compute Die (GCD) manufactured in 5nm and five (out of six) Memory Cache Dies (MCD chiplets) in 6nm. The 7900 offers 5,120 cores clocked at up to 2.25 GHz (max, 1.88 GHz game average), 64 MB Infinity Cache (L3 cache) and 16 GB GDDR6 graphics memory with a 256 Bit memory bus and 18 Gbps effective speed (leading to 576 GB/s bandwidth).

The average gaming performance without Raytracing is similar to a GeForce RTX 4070 Ti in games. Therefore, the RX 7900 GRE is best suited for QHD (for higher frame rates) up to 4K resolution and maximum detail settings of 2022 games. Raytracing performance is still a bit lower than with Nvidia cards, but a big step up from the previous generation.

The integrated video en- and decoders support AV1, H.264, and HEVC videos wit up to 8K resolution. The display ports are a big advantage of the new chip supporting DisplayPort 2.1 with UHBR13.5 for up to 54 Gbps bandwidth (up to 8K 165 Hz with DSC possible).

The power consumption is rated 260 Watt (TDP).

Radeon RX 7000 Series

Radeon RX 7900 XTX compare 6144 @ 2.27 GHz384 Bit @ 20000 MHz
Radeon RX 7900 XT compare 5376 @ 2 GHz320 Bit @ 20000 MHz
Radeon RX 7900 GRE 5120 @ 2.25 GHz256 Bit @ 18000 MHz
Radeon RX 7800 XT compare 3840 @ 2.43 GHz256 Bit @ 19500 MHz
Radeon RX 7700 XT compare 3456 @ 1.7 - 2.54 GHz192 Bit @ 18000 MHz
CodenameNavi 31
ArchitectureRDNA 3
Pipelines5120 - unified
TMUs320
ROPs192
Raytracing Cores80
Tensor / AI Cores160
Core Speed2245 (Boost) MHz
Theoretical Performance91.96 TFLOPS FP16, 45.98 TFLOPS FP32, 1.437 TFLOPS FP64
CacheL2: 6 MB, L3: 64 MB
Memory Speed18000 effective = 2250 MHz
Memory Bus Width256 Bit
Memory TypeGDDR6
Max. Amount of Memory16 GB
Shared Memoryno
Memory Bandwidth576 GB/s
APIDirectX 12 Ultimate (12_2), Shader 6.7, OpenGL 4.6, OpenCL 2.2, Vulkan 1.3
Power Consumption260 Watt
Transistor Count57.7 Billion
Die Size 520 mm²
technology5 nm
PCIe4.0 x16
Displays4 Displays (max.), HDMI 2.1a, DisplayPort 2.1 UHBR13.5
Date of Announcement27.07.2023
Link to Manufacturer Pagewww.amd.com

Benchmarks

Performance Rating - 3DMark 11 + Fire Strike + Time Spy
24.9 pt (75%)
3DMark - 3DMark Ice Storm Unlimited Graphics
min: 560812     avg: 637522     median: 637522 (72%)     max: 714232 Points
3DMark - 3DMark Ice Storm Extreme Graphics
min: 431805     avg: 523496     median: 523496 (67%)     max: 615187 Points
3DMark - 3DMark Cloud Gate Graphics
min: 247050     avg: 247366     median: 247366 (65%)     max: 247681 Points
3DMark - 3DMark Fire Strike Standard Score
min: 38476     avg: 42408     median: 42407.5 (75%)     max: 46339 Points
3DMark - 3DMark Fire Strike Standard Graphics
min: 54400     avg: 54610     median: 54609.5 (62%)     max: 54819 Points
3DMark - 3DMark Ice Storm Graphics
min: 446871     avg: 555420     median: 555420 (67%)     max: 663969 Points
3DMark - 3DMark Night Raid Graphics Score
min: 169156     avg: 190129     median: 190128 (73%)     max: 211101 Points
3DMark 11 - 3DM11 Performance GPU
min: 66008     avg: 67134     median: 67134 (58%)     max: 68260 Points
3DMark Vantage
3DM Vant. Perf. total +
3DMark Vantage - 3DM Vant. Perf. total
min: 110273     avg: 122732     median: 122732 (36%)     max: 135190 Points
3DM Vant. Perf. GPU no PhysX +
3DMark Vantage - 3DM Vant. Perf. GPU no PhysX
min: 128176     avg: 138530     median: 138530 (79%)     max: 148884 Points
3DMark 06 3DMark 06 - Standard 1280x1024 +
3DMark 06
min: 51356     avg: 59003     median: 59002.5 (77%)     max: 66649 Points
SPECviewperf 12
specvp12 sw-03 +
SPECviewperf 12 - specvp12 sw-03
min: 278     avg: 298.5     median: 298.5 (74%)     max: 319 fps
specvp12 snx-02 +
SPECviewperf 12 - specvp12 snx-02
min: 335     avg: 338     median: 338 (50%)     max: 341 fps
specvp12 showcase-01 +
specvp12 mediacal-01 +
SPECviewperf 12 - specvp12 mediacal-01
min: 213     avg: 219.5     median: 219.5 (56%)     max: 226 fps
specvp12 maya-04 +
specvp12 energy-01 +
SPECviewperf 12 - specvp12 energy-01
min: 39.3     avg: 39.8     median: 39.8 (36%)     max: 40.3 fps
specvp12 creo-01 +
specvp12 catia-04 +
SPECviewperf 12 - specvp12 catia-04
min: 401     avg: 424.5     median: 424.5 (70%)     max: 448 fps
specvp12 3dsmax-05 +
SPECviewperf 13 specvp13 sw-04 +
SPECviewperf 13 - specvp13 sw-04
min: 248     avg: 267.5     median: 267.5 (72%)     max: 287 fps
specvp13 snx-03 +
SPECviewperf 13 - specvp13 snx-03
min: 600     avg: 609     median: 608.5 (68%)     max: 617 fps
specvp13 showcase-02 +
specvp13 medical-02 +
SPECviewperf 13 - specvp13 medical-02
min: 349     avg: 360.5     median: 360.5 (75%)     max: 372 fps
specvp13 maya-05 +
specvp13 energy-02 +
SPECviewperf 13 - specvp13 energy-02
min: 147     avg: 148.5     median: 148.5 (48%)     max: 150 fps
specvp13 creo-02 +
specvp13 catia-05 +
SPECviewperf 13 - specvp13 catia-05
min: 590     avg: 626     median: 625.5 (70%)     max: 661 fps
specvp13 3dsmax-06 +
SPECviewperf 2020 specvp2020 solidworks-05 4k +
specvp2020 snx-04 4k +
SPECviewperf 2020 - specvp2020 snx-04 4k
min: 395     avg: 398.5     median: 398.5 (41%)     max: 402 fps
specvp2020 medical-03 4k +
SPECviewperf 2020 - specvp2020 medical-03 4k
min: 71.1     avg: 73.6     median: 73.6 (70%)     max: 76.1 fps
specvp2020 maya-06 4k +
specvp2020 energy-03 4k +
SPECviewperf 2020 - specvp2020 energy-03 4k
min: 86.4     avg: 109.7     median: 109.7 (24%)     max: 133 fps
specvp2020 creo-03 4k +
SPECviewperf 2020 - specvp2020 creo-03 4k
min: 147     avg: 153     median: 153 (73%)     max: 159 fps
specvp2020 catia-06 4k +
SPECviewperf 2020 - specvp2020 catia-06 4k
min: 102     avg: 104.5     median: 104.5 (68%)     max: 107 fps
specvp2020 3dsmax-07 4k +
Cinebench R10 Cinebench R10 Shading (32bit) +
Cinebench R10 - Cinebench R10 Shading (32bit)
min: 20581     avg: 23019     median: 23018.5 (16%)     max: 25456 points
Cinebench R15
Cinebench R15 OpenGL 64 Bit +
Cinebench R15 - Cinebench R15 OpenGL 64 Bit
min: 292.02     avg: 356.9     median: 356.9 (21%)     max: 421.87 fps
Cinebench R15 OpenGL Ref. Match 64 Bit +
Basemark GPU 1.2 - Basemark GPU 1.2 Vulkan Official High Offscreen 2160
min: 3.64     avg: 89     median: 89 (20%)     max: 174.3 fps
Geekbench 6.2 - Geekbench 6.2 GPU OpenCL
min: 150110     avg: 155982     median: 155982 (45%)     max: 161854 points
Geekbench 6.2 - Geekbench 6.2 GPU Vulkan
min: 152526     avg: 155936     median: 155936 (51%)     max: 159345 points
LuxMark v2.0 64Bit - LuxMark v2.0 Sala GPU
min: 10837     avg: 11051     median: 11051 (19%)     max: 11265 Samples/s
ComputeMark v2.1 - ComputeMark v2.1 Result
min: 46784     avg: 47021     median: 47020.5 (51%)     max: 47257 points
Power Consumption - Furmark Stress Test Power Consumption - external Monitor *
min: 356     avg: 387     median: 387 (55%)     max: 418 Watt
0255075100125150175200225250275300325350375400425Tooltip
Power Consumption - The Witcher 3 Power Consumption - external Monitor *
min: 385     avg: 412.5     median: 412.5 (58%)     max: 440 Watt
0255075100125150175200225250275300325350375400425Tooltip
Power Consumption - Witcher 3 ultra Power Efficiency - external Monitor
min: 0.4777     avg: 0.5     median: 0.5 (42%)     max: 0.538 fps per Watt
- Range of benchmark values for this graphics card
- Average benchmark values for this graphics card
* Smaller numbers mean a higher performance

Game Benchmarks

The following benchmarks stem from our benchmarks of review laptops. The performance depends on the used graphics memory, clock rate, processor, system settings, drivers, and operating systems. So the results don't have to be representative for all laptops with this GPU. For detailed information on the benchmark results, click on the fps number.

low 1920x1080
192.4 193 ~ 193 fps    + Compare + 📈 Graph
med. 1920x1080
189.5 191.1 ~ 190 fps    + Compare + 📈 Graph
high 1920x1080
182.9 184.8 ~ 184 fps    + Compare + 📈 Graph
ultra 1920x1080
178.4 185.2 ~ 182 fps    + Compare + 📈 Graph
QHD 2560x1440
140.6 142.3 ~ 141 fps    + Compare + 📈 Graph
4K 3840x2160
76.6 78.4 ~ 78 fps    + Compare + 📈 Graph
» With all tested laptops playable in detail settings ultra.
Additional Benchmarks
Low Preset 1280x720
195.4
191.7
low 1920x1080
197 235 ~ 216 fps    + Compare + 📈 Graph
med. 1920x1080
177.2 204 ~ 191 fps    + Compare + 📈 Graph
high 1920x1080
158 175.3 ~ 167 fps    + Compare + 📈 Graph
ultra 1920x1080
159.8 170.3 ~ 165 fps    + Compare + 📈 Graph
QHD 2560x1440
120.6 124.5 ~ 123 fps    + Compare + 📈 Graph
4K 3840x2160
65.8 67.6 ~ 67 fps    + Compare + 📈 Graph
» With all tested laptops playable in detail settings ultra.
Additional Benchmarks
Low Preset 1280x720
217
281
low 1920x1080
146.8 175.3 ~ 161 fps    + Compare + 📈 Graph
med. 1920x1080
134.9 151.9 ~ 143 fps    + Compare + 📈 Graph
high 1920x1080
114.9 127.6 ~ 121 fps    + Compare + 📈 Graph
ultra 1920x1080
100 112.3 ~ 106 fps    + Compare + 📈 Graph
QHD 2560x1440
84.5 91.5 ~ 88 fps    + Compare + 📈 Graph
4K 3840x2160
57.6 60.2 ~ 59 fps    + Compare + 📈 Graph
» With all tested laptops playable in detail settings ultra.
Additional Benchmarks
Very Low Preset 1280x720
151.9
222
F1 23

F1 23

2023
low 1920x1080
384 523 ~ 454 fps    + Compare
med. 1920x1080
399 487 ~ 443 fps    + Compare
high 1920x1080
331 367 ~ 349 fps    + Compare
ultra 1920x1080
93.3 97.6 ~ 95 fps    + Compare
QHD 2560x1440
62.1 64.1 ~ 63 fps    + Compare
4K 3840x2160
31.6 32.1 ~ 32 fps    + Compare
» With all tested laptops playable in detail settings ultra.
Additional Benchmarks
Ultra Low Preset TAA 1280x720
329
482
Diablo 4

Diablo 4

2023
low 1920x1080
377 382 ~ 380 fps    + Compare + 📈 Graph
med. 1920x1080
344 364 ~ 354 fps    + Compare + 📈 Graph
high 1920x1080
312 330 ~ 321 fps    + Compare + 📈 Graph
ultra 1920x1080
273 294 ~ 284 fps    + Compare + 📈 Graph
QHD 2560x1440
199 205 ~ 202 fps    + Compare + 📈 Graph
4K 3840x2160
97.3 99.4 ~ 98 fps    + Compare + 📈 Graph
» With all tested laptops playable in detail settings ultra.
Additional Benchmarks
Low Preset 1280x720
377
384
low 1920x1080
107.2 155.5 ~ 131 fps    + Compare + 📈 Graph
med. 1920x1080
102.9 147.1 ~ 125 fps    + Compare + 📈 Graph
high 1920x1080
97.8 136.1 ~ 117 fps    + Compare + 📈 Graph
ultra 1920x1080
97.7 128.1 ~ 113 fps    + Compare + 📈 Graph
QHD 2560x1440
83.5 85.5 ~ 85 fps    + Compare + 📈 Graph
4K 3840x2160
39.9 42.4 ~ 41 fps    + Compare + 📈 Graph
» With all tested laptops playable in detail settings ultra.
Additional Benchmarks
Low Preset 1280x720
106.5
162.7
Epic Preset + Ray Tracing 1920x1080
77.9
84
Dead Island 2

Dead Island 2

2023
low 1920x1080
248 377 ~ 313 fps    + Compare + 📈 Graph
med. 1920x1080
239 368 ~ 304 fps    + Compare + 📈 Graph
high 1920x1080
206 298 ~ 252 fps    + Compare + 📈 Graph
ultra 1920x1080
172.2 207 ~ 190 fps    + Compare + 📈 Graph
QHD 2560x1440
151.5 155.1 ~ 153 fps    + Compare + 📈 Graph
4K 3840x2160
84.9 88.6 ~ 87 fps    + Compare + 📈 Graph
» With all tested laptops playable in detail settings ultra.
Additional Benchmarks
Low Preset Low TAA 1280x720
239
383
The Last of Us

The Last of Us

2023
low 1920x1080
117.2 171.9 ~ 145 fps    + Compare + 📈 Graph
med. 1920x1080
108 151.1 ~ 130 fps    + Compare + 📈 Graph
high 1920x1080
106 143.3 ~ 125 fps    + Compare + 📈 Graph
ultra 1920x1080
102.9 126.5 ~ 115 fps    + Compare + 📈 Graph
QHD 2560x1440
84.7 88.9 ~ 87 fps    + Compare + 📈 Graph
4K 3840x2160
43 44.8 ~ 44 fps    + Compare + 📈 Graph
» With all tested laptops playable in detail settings ultra.
Additional Benchmarks
Low Preset 1280x720
115.1
174.6
low 1920x1080
204 264 ~ 234 fps    + Compare + 📈 Graph
med. 1920x1080
200 217 ~ 209 fps    + Compare + 📈 Graph
high 1920x1080
180.7 190.8 ~ 186 fps    + Compare + 📈 Graph
ultra 1920x1080
110.2 133.8 ~ 122 fps    + Compare + 📈 Graph
QHD 2560x1440
100.6 109.2 ~ 105 fps    + Compare + 📈 Graph
4K 3840x2160
62.4 64.8 ~ 64 fps    + Compare + 📈 Graph
» With all tested laptops playable in detail settings ultra.
Additional Benchmarks
Prioritize Performance Preset 1280x720
222
275
low 1920x1080
296.5 352.2 ~ 324 fps    + Compare
med. 1920x1080
261.4 313.9 ~ 288 fps    + Compare
high 1920x1080
220.5 260.7 ~ 241 fps    + Compare
ultra 1920x1080
220.4 248.7 ~ 235 fps    + Compare
QHD 2560x1440
185.4 193.4 ~ 189 fps    + Compare
4K 3840x2160
103.2 105.8 ~ 105 fps    + Compare
» With all tested laptops playable in detail settings ultra.
Additional Benchmarks
Minimum Settings 1280x720
324
404.6
low 1920x1080
107.6 126.5 ~ 117 fps    + Compare + 📈 Graph
med. 1920x1080
101.4 123.6 ~ 113 fps    + Compare + 📈 Graph
high 1920x1080
98.4 121.8 ~ 110 fps    + Compare + 📈 Graph
ultra 1920x1080
96.6 119.2 ~ 108 fps    + Compare + 📈 Graph
QHD 2560x1440
94.9 117.8 ~ 106 fps    + Compare + 📈 Graph
4K 3840x2160
75 78.2 ~ 77 fps    + Compare + 📈 Graph
» With all tested laptops playable in detail settings ultra.
Additional Benchmarks
Ultra Low Preset 1280x720
110.7
130.2
low 1920x1080
263 342 ~ 303 fps    + Compare + 📈 Graph
med. 1920x1080
211 252 ~ 232 fps    + Compare + 📈 Graph
high 1920x1080
147 152.2 ~ 150 fps    + Compare + 📈 Graph
ultra 1920x1080
113.9 119 ~ 116 fps    + Compare + 📈 Graph
QHD 2560x1440
93.5 96.3 ~ 95 fps    + Compare + 📈 Graph
4K 3840x2160
57.4 58.8 ~ 58 fps    + Compare + 📈 Graph
» With all tested laptops playable in detail settings ultra.
Additional Benchmarks
Low Preset 1280x720
267
370
Returnal

Returnal

2023
low 1920x1080
184 208 ~ 196 fps    + Compare
med. 1920x1080
177 200 ~ 189 fps    + Compare
high 1920x1080
151 177 ~ 164 fps    + Compare
ultra 1920x1080
142 150 ~ 146 fps    + Compare
QHD 2560x1440
111 115 ~ 113 fps    + Compare
4K 3840x2160
64 67 ~ 66 fps    + Compare
» With all tested laptops playable in detail settings ultra.
Additional Benchmarks
Low Preset 1280x720
175
256
Epic Preset + Epic Ray-Tracing 1920x1080
96
99
Epic Preset + Epic Ray-Tracing 3840x2160
39
41
low 1920x1080
144.6 214 ~ 179 fps    + Compare + 📈 Graph
med. 1920x1080
125.1 188.3 ~ 157 fps    + Compare + 📈 Graph
high 1920x1080
107.6 154.9 ~ 131 fps    + Compare + 📈 Graph
ultra 1920x1080
100.5 118.1 ~ 109 fps    + Compare + 📈 Graph
QHD 2560x1440
79.9 91.2 ~ 86 fps    + Compare + 📈 Graph
4K 3840x2160
47.8 50.9 ~ 49 fps    + Compare + 📈 Graph
» With all tested laptops playable in detail settings ultra.
Additional Benchmarks
Low Preset Low TAA 1280x720
142.2
219
Ultra Preset + Full Ray Tracing High TAA 1920x1080
57.2
60.4
Ultra Preset + Full Ray Tracing High TAA 3840x2160
23.2
23.8
low 1920x1080
137.2 170 ~ 154 fps    + Compare + 📈 Graph
med. 1920x1080
136.8 163.6 ~ 150 fps    + Compare + 📈 Graph
high 1920x1080
125.4 142.4 ~ 134 fps    + Compare + 📈 Graph
ultra 1920x1080
126.3 141.7 ~ 134 fps    + Compare + 📈 Graph
QHD 2560x1440
94.8 98.6 ~ 97 fps    + Compare + 📈 Graph
4K 3840x2160
48.8 49.8 ~ 49 fps    + Compare + 📈 Graph
» With all tested laptops playable in detail settings ultra.
Additional Benchmarks
Low Preset TAA 1280x720
141
217
low 1920x1080
234.8 323.4 ~ 279 fps    + Compare
med. 1920x1080
194.5 282 ~ 238 fps    + Compare
high 1920x1080
170.1 257.4 ~ 214 fps    + Compare
ultra 1920x1080
161.1 217.7 ~ 189 fps    + Compare
QHD 2560x1440
144.5 155.6 ~ 150 fps    + Compare
4K 3840x2160
72.3 75.5 ~ 74 fps    + Compare
» With all tested laptops playable in detail settings ultra.
Additional Benchmarks
Low Preset / Off 1280x720
234
325.3
RT Ultra Preset / On FXAA 1920x1080
46.5
49
low 1920x1080
257 389 ~ 323 fps    + Compare + 📈 Graph
med. 1920x1080
233 312 ~ 273 fps    + Compare + 📈 Graph
high 1920x1080
198.7 230 ~ 214 fps    + Compare + 📈 Graph
ultra 1920x1080
171.4 179.4 ~ 175 fps    + Compare + 📈 Graph
QHD 2560x1440
108.8 112.2 ~ 111 fps    + Compare + 📈 Graph
4K 3840x2160
49.2 50.5 ~ 50 fps    + Compare + 📈 Graph
» With all tested laptops playable in detail settings ultra.
Additional Benchmarks
Low Preset 1280x720
258
401
low 1920x1080
180.1 251.7 ~ 216 fps    + Compare
med. 1920x1080
168.2 221 ~ 195 fps    + Compare
high 1920x1080
160.7 196.8 ~ 179 fps    + Compare
ultra 1920x1080
125.8 133 ~ 129 fps    + Compare
QHD 2560x1440
103.4 107.5 ~ 105 fps    + Compare
4K 3840x2160
68.7 70.1 ~ 69 fps    + Compare
» With all tested laptops playable in detail settings ultra.
Additional Benchmarks
Low Preset (without FSR Upscaling) 1280x720
185.1
269
Ultra Preset (without FSR Upscaling) + Full Ray-Tracing 1920x1080
76.7
99
low 1920x1080
124.9 174.9 ~ 150 fps    + Compare + 📈 Graph
med. 1920x1080
121 162.6 ~ 142 fps    + Compare + 📈 Graph
high 1920x1080
116.8 160.1 ~ 138 fps    + Compare + 📈 Graph
ultra 1920x1080
116.4 144.4 ~ 130 fps    + Compare + 📈 Graph
QHD 2560x1440
111.9 122.7 ~ 117 fps    + Compare + 📈 Graph
4K 3840x2160
72 73.1 ~ 73 fps    + Compare + 📈 Graph
» With all tested laptops playable in detail settings ultra.
Additional Benchmarks
Very Low Preset 1280x720
143.5
191.7
Very High Preset + Ray-Tracing TAA 1920x0180
68.9
78.6
low 1920x1080
115.8 134.7 ~ 125 fps    + Compare + 📈 Graph
med. 1920x1080
111.7 131.5 ~ 122 fps    + Compare + 📈 Graph
high 1920x1080
110.6 122 ~ 116 fps    + Compare + 📈 Graph
ultra 1920x1080
107 114.8 ~ 111 fps    + Compare + 📈 Graph
QHD 2560x1440
87 92.8 ~ 90 fps    + Compare + 📈 Graph
4K 3840x2160
53.9 56.4 ~ 55 fps    + Compare + 📈 Graph
» With all tested laptops playable in detail settings ultra.
Additional Benchmarks
Low Preset 1280x720
115.9
157.2
low 1920x1080
176.1 202 ~ 189 fps    + Compare + 📈 Graph
med. 1920x1080
144.9 157.4 ~ 151 fps    + Compare + 📈 Graph
high 1920x1080
114.9 120.6 ~ 118 fps    + Compare + 📈 Graph
ultra 1920x1080
87.7 91.9 ~ 90 fps    + Compare + 📈 Graph
QHD 2560x1440
67.5 70.3 ~ 69 fps    + Compare + 📈 Graph
4K 3840x2160
38.1 39.9 ~ 39 fps    + Compare + 📈 Graph
» With all tested laptops playable in detail settings ultra.
Additional Benchmarks
Low Preset 1280x720
168.8
229
low 1920x1080
271 293 ~ 282 fps    + Compare + 📈 Graph
med. 1920x1080
207 221 ~ 214 fps    + Compare + 📈 Graph
high 1920x1080
171.1 179.8 ~ 175 fps    + Compare + 📈 Graph
ultra 1920x1080
138.1 143.4 ~ 141 fps    + Compare + 📈 Graph
QHD 2560x1440
94.2 97.6 ~ 96 fps    + Compare + 📈 Graph
4K 3840x2160
50.1 52.9 ~ 52 fps    + Compare + 📈 Graph
» With all tested laptops playable in detail settings ultra.
Additional Benchmarks
Low Preset 1280x720
282
364
F1 22

F1 22

2022
low 1920x1080
369 474 ~ 422 fps    + Compare
med. 1920x1080
394 479 ~ 437 fps    + Compare
high 1920x1080
343 390 ~ 367 fps    + Compare
ultra 1920x1080
110.1 111.5 ~ 111 fps    + Compare
QHD 2560x1440
74.2 76.1 ~ 75 fps    + Compare
4K 3840x2160
38.1 38.7 ~ 38 fps    + Compare
» With all tested laptops playable in detail settings ultra.
Additional Benchmarks
Ultra Low Preset 16xAF TAA 1280x720
452
647
low 1920x1080
205 290 ~ 248 fps    + Compare + 📈 Graph
med. 1920x1080
196.4 282 ~ 239 fps    + Compare + 📈 Graph
high 1920x1080
193.7 278 ~ 236 fps    + Compare + 📈 Graph
ultra 1920x1080
188.8 272 ~ 230 fps    + Compare + 📈 Graph
QHD 2560x1440
179.2 194.7 ~ 187 fps    + Compare + 📈 Graph
4K 3840x2160
84.2 89.1 ~ 87 fps    + Compare + 📈 Graph
» With all tested laptops playable in detail settings ultra.
Additional Benchmarks
Lowest Settings 1280x720
220
312
Highest Settings + Maximum Ray Tracing 1920x1080
98.2
100.8
low 1920x1080
325 443 ~ 384 fps    + Compare
med. 1920x1080
251 345 ~ 298 fps    + Compare
high 1920x1080
206 218 ~ 212 fps    + Compare
ultra 1920x1080
162.2 168.5 ~ 165 fps    + Compare
QHD 2560x1440
111.2 114.8 ~ 113 fps    + Compare
4K 3840x2160
58.6 60.7 ~ 60 fps    + Compare
» With all tested laptops playable in detail settings ultra.
Additional Benchmarks
Lowest Preset (DX12) 1280x720
305
490
low 1920x1080
179.7 236 ~ 208 fps    + Compare
med. 1920x1080
169.4 197.8 ~ 184 fps    + Compare
high 1920x1080
149.1 166.4 ~ 158 fps    + Compare
ultra 1920x1080
141.2 155.3 ~ 148 fps    + Compare
QHD 2560x1440
94.8 101.1 ~ 98 fps    + Compare
4K 3840x2160
43.8 46 ~ 45 fps    + Compare
» With all tested laptops playable in detail settings ultra.
Additional Benchmarks
Low Preset 1280x720
180.1
266
Ray Tracing Ultra Preset (DLSS off) 1920x1080
45.9
50.6
Ray Tracing Ultra Preset (DLSS off) 3840x2160
13.9
15
low 1920x1080
207 278 ~ 243 fps    + Compare
med. 1920x1080
181.1 216 ~ 199 fps    + Compare
high 1920x1080
168.8 241 ~ 205 fps    + Compare
ultra 1920x1080
159 199.5 ~ 179 fps    + Compare
QHD 2560x1440
153.7 185 ~ 169 fps    + Compare
4K 3840x2160
126.4 140.5 ~ 133 fps    + Compare
» With all tested laptops playable in detail settings ultra.
Additional Benchmarks
Low Preset 1280x720
207
269
low 1920x1080
137.8 221 ~ 179 fps    + Compare + 📈 Graph
med. 1920x1080
135.3 214 ~ 175 fps    + Compare + 📈 Graph
high 1920x1080
133.3 180.3 ~ 157 fps    + Compare + 📈 Graph
ultra 1920x1080
124 128.3 ~ 126 fps    + Compare + 📈 Graph
QHD 2560x1440
102.9 104.2 ~ 104 fps    + Compare + 📈 Graph
4K 3840x2160
66.5 68.2 ~ 67 fps    + Compare + 📈 Graph
» With all tested laptops playable in detail settings ultra.
Additional Benchmarks
Low Preset 1280x720
129.7
222
low 1280x720
138 218 ~ 178 fps    + Compare
med. 1920x1080
137 218 ~ 178 fps    + Compare
high 1920x1080
135 218 ~ 177 fps    + Compare
ultra 1920x1080
134 214 ~ 174 fps    + Compare
QHD 2560x1440
134 178 ~ 156 fps    + Compare
4K 3840x2160
97 101 ~ 99 fps    + Compare
» With all tested laptops playable in detail settings ultra.
Additional Benchmarks
Low Preset 1920x1080
136
219
Ultra Preset + Ultra Ray-Tracing 1920x1080
103
105
Far Cry 6

Far Cry 6

2021
low 1280x720
174.8 238 ~ 206 fps    + Compare + 📈 Graph
med. 1920x1080
152.9 212 ~ 182 fps    + Compare + 📈 Graph
high 1920x1080
138.3 195.3 ~ 167 fps    + Compare + 📈 Graph
ultra 1920x1080
128.7 186.4 ~ 158 fps    + Compare + 📈 Graph
QHD 2560x1440
121.3 151.5 ~ 136 fps    + Compare + 📈 Graph
4K 3840x2160
85.7 88.1 ~ 87 fps    + Compare + 📈 Graph
» With all tested laptops playable in detail settings ultra.
Additional Benchmarks
Low Graphics Quality 1920x1080
169.1
235
Ultra Graphics Quality + HD Textures + DXR TAA 1920x1080
103.1
136.7
F1 2021

F1 2021

2021
low 1280x720
544 676 ~ 610 fps    + Compare
med. 1920x1080
504 630 ~ 567 fps    + Compare
high 1920x1080
420 483 ~ 452 fps    + Compare
ultra 1920x1080
200 209 ~ 205 fps    + Compare
QHD 2560x1440
155.9 161.2 ~ 159 fps    + Compare
4K 3840x2160
91.8 93.8 ~ 93 fps    + Compare
» With all tested laptops playable in detail settings ultra.
low 1280x720
236  fps    + Compare + 📈 Graph
med. 1920x1080
235  fps    + Compare + 📈 Graph
high 1920x1080
234  fps    + Compare + 📈 Graph
ultra 1920x1080
233  fps    + Compare + 📈 Graph
QHD 2560x1440
211  fps    + Compare + 📈 Graph
4K 3840x2160
118.1  fps    + Compare + 📈 Graph
» With all tested laptops playable in detail settings ultra.
F1 2020

F1 2020

2020
low 1280x720
494 562 ~ 528 fps    + Compare
med. 1920x1080
414 477 ~ 446 fps    + Compare
high 1920x1080
394 439 ~ 417 fps    + Compare
ultra 1920x1080
287 300 ~ 294 fps    + Compare
QHD 2560x1440
228 233 ~ 231 fps    + Compare
4K 3840x2160
139.4 141.5 ~ 140 fps    + Compare
» With all tested laptops playable in detail settings ultra.
low 1280x720
170.6 247 ~ 209 fps    + Compare
med. 1920x1080
147.8 222 ~ 185 fps    + Compare
high 1920x1080
135.5 185.4 ~ 160 fps    + Compare
ultra 1920x1080
123.4 153.4 ~ 138 fps    + Compare
QHD 2560x1440
104.6 115.5 ~ 110 fps    + Compare
4K 3840x2160
61.7 64.1 ~ 63 fps    + Compare
» With all tested laptops playable in detail settings ultra.
Additional Benchmarks
Very Low Overall Quality (DX11) 1920x1080
169.5
245
Control

Control

2019
low 1280x720
240 240 ~ 240 fps    + Compare + 📈 Graph
med. 1920x1080
239 240 ~ 240 fps    + Compare + 📈 Graph
high 1920x1080
197.2 202 ~ 200 fps    + Compare + 📈 Graph
QHD 2560x1440
126.9 128.8 ~ 128 fps    + Compare + 📈 Graph
4K 3840x2160
60.9 62 ~ 61 fps    + Compare + 📈 Graph
» With all tested laptops playable in detail settings high.
Additional Benchmarks
High Quality Preset & High Ray Tracing Preset (DX12) 1920x1080
99.4
101.6
High Quality Preset & High Ray Tracing Preset (DX12) 3840x2160
30.9
31.4
low 1280x720
145 185 ~ 165 fps    + Compare + 📈 Graph
med. 1920x1080
131 166 ~ 149 fps    + Compare + 📈 Graph
high 1920x1080
126 158 ~ 142 fps    + Compare + 📈 Graph
ultra 1920x1080
113 143 ~ 128 fps    + Compare + 📈 Graph
QHD 2560x1440
113 142 ~ 128 fps    + Compare + 📈 Graph
4K 3840x2160
103 115 ~ 109 fps    + Compare + 📈 Graph
» With all tested laptops playable in detail settings ultra.
low 1280x720
228 333 ~ 281 fps    + Compare
med. 1920x1080
218 241 ~ 230 fps    + Compare
high 1920x1080
169.2 177.7 ~ 173 fps    + Compare
ultra 1920x1080
132.4 137.3 ~ 135 fps    + Compare
QHD 2560x1440
109.3 112 ~ 111 fps    + Compare
4K 3840x2160
69.4 71.6 ~ 71 fps    + Compare
» With all tested laptops playable in detail settings ultra.
Additional Benchmarks
Ultra Quality DXR 16xAF 1920x1080
101.5
103.8
low 1280x720
237 375 ~ 306 fps    + Compare
med. 1920x1080
206 288 ~ 247 fps    + Compare
high 1920x1080
205 273 ~ 239 fps    + Compare
ultra 1920x1080
192.9 241 ~ 217 fps    + Compare
QHD 2560x1440
158.3 169.6 ~ 164 fps    + Compare
4K 3840x2160
85 88 ~ 87 fps    + Compare
» With all tested laptops playable in detail settings ultra.
Additional Benchmarks
Lowest Preset 1920x1080
237
370
Strange Brigade

Strange Brigade

2018
low 1280x720
664 755 ~ 710 fps    + Compare
med. 1920x1080
475 498 ~ 487 fps    + Compare
high 1920x1080
397 409 ~ 403 fps    + Compare
ultra 1920x1080
345 361 ~ 353 fps    + Compare
QHD 2560x1440
250 254 ~ 252 fps    + Compare
4K 3840x2160
130.2 132.1 ~ 131 fps    + Compare
» With all tested laptops playable in detail settings ultra.
Far Cry 5

Far Cry 5

2018
low 1280x720
170 222 ~ 196 fps    + Compare + 📈 Graph
med. 1920x1080
152 196 ~ 174 fps    + Compare + 📈 Graph
high 1920x1080
147 188 ~ 168 fps    + Compare + 📈 Graph
ultra 1920x1080
136 173 ~ 155 fps    + Compare + 📈 Graph
QHD 2560x1440
135 173 ~ 154 fps    + Compare + 📈 Graph
4K 3840x2160
106 108 ~ 107 fps    + Compare + 📈 Graph
» With all tested laptops playable in detail settings ultra.
Additional Benchmarks
Low Preset TAA 1920x1080
169
220
low 1280x720
139.2 180.2 ~ 160 fps    + Compare
med. 1920x1080
115.1 146 ~ 131 fps    + Compare
high 1920x1080
88.2 112.7 ~ 100 fps    + Compare
4K 3840x2160
68 83.4 ~ 76 fps    + Compare
» With all tested laptops playable in detail settings high.
low 1280x720
226 235 ~ 231 fps    + Compare
med. 1920x1080
225 237 ~ 231 fps    + Compare
high 1920x1080
162.6 174.5 ~ 169 fps    + Compare
QHD 2560x1440
126.3 133 ~ 130 fps    + Compare
4K 3840x2160
74.2 75.5 ~ 75 fps    + Compare
» With all tested laptops playable in detail settings high.
low 1280x720
214 297 ~ 256 fps    + Compare
med. 1366x768
176.2 236 ~ 206 fps    + Compare
high 1920x1080
184.9 218 ~ 201 fps    + Compare
ultra 1920x1080
149.6 217 ~ 183 fps    + Compare
4K 3840x2160
136.8 154.4 ~ 146 fps    + Compare
» With all tested laptops playable in detail settings ultra.
low 1024x768
484.7 794.3 ~ 640 fps    + Compare
med. 1366x768
398.3 578 ~ 488 fps    + Compare
high 1920x1080
374.8 390 ~ 382 fps    + Compare
ultra 1920x1080
207.3 210.2 ~ 209 fps    + Compare
QHD 2560x1440
153.9 157.4 ~ 156 fps    + Compare
4K 3840x2160
124.7 124.8 ~ 125 fps    + Compare
» With all tested laptops playable in detail settings ultra.
Additional Benchmarks
Ultra Graphics & Postprocessing (HBAO+) 3840x2160
84.8
86.8
Medium Graphics & Postprocessing 1920x1080
424.6
464.4
GTA V

GTA V

2015
low 1024x768
186.7 187.9 ~ 187 fps    + Compare
med. 1366x768
184.5 187.4 ~ 186 fps    + Compare
high 1920x1080
177.6 186.4 ~ 182 fps    + Compare
ultra 1920x1080
120.6 172.2 ~ 146 fps    + Compare
QHD 2560x1440
116.4 142.7 ~ 130 fps    + Compare
4K 3840x2160
149 153.3 ~ 151 fps    + Compare
» With all tested laptops playable in detail settings ultra.
Additional Benchmarks
Highest Settings possible 16xAF 4xMSAA + FXAA 3840x2160
64.2
65.2
Normal/Off 4xAF 1920x1080
184.4
187.5
Lowest Settings possible 1920x1080
186.5
187.4
lowmed.highultraQHD4K
Atlas Fallen19319018418214178
Baldur's Gate 321619116716512367
Ratchet & Clank Rift Apart1611431211068859
F1 23454443349956332
Diablo 438035432128420298
Star Wars Jedi Survivor1311251171138541
Dead Island 231330425219015387
The Last of Us1451301251158744
Resident Evil 4 Remake23420918612210564
Company of Heroes 3324288241235189105
Sons of the Forest11711311010810677
Atomic Heart3032321501169558
Returnal19618916414611366
Hogwarts Legacy1791571311098649
Dead Space Remake1541501341349749
The Witcher 3 v4.0027923821418915074
High On Life32327321417511150
The Callisto Protocol21619517912910569
Spider-Man Miles Morales15014213813011773
Uncharted Legacy of Thieves Collection1251221161119055
A Plague Tale Requiem189151118906939
The Quarry2822141751419652
F1 224224373671117538
Ghostwire Tokyo24823923623018787
Tiny Tina's Wonderlands38429821216511360
Cyberpunk 2077 1.62081841581489845
GRID Legends243199205179169133
God of War17917515712610467
Guardians of the Galaxy17817817717415699
Far Cry 620618216715813687
F1 202161056745220515993
Death Stranding236235234233211118.1
F1 2020528446417294231140
Borderlands 320918516013811063
Control24024020012861
Far Cry New Dawn165149142128128109
Metro Exodus28123017313511171
Shadow of the Tomb Raider30624723921716487
Strange Brigade710487403353252131
Far Cry 5196174168155154107
X-Plane 11.1116013110076
Final Fantasy XV Benchmark23123116913075
Dota 2 Reborn256206201183146
The Witcher 3640488382209156125
GTA V187186182146130151
< 30 fps
< 60 fps
< 120 fps
≥ 120 fps


1
44


1
44


5
40


10
32


22
21

13
26
6

For more games that might be playable and a list of all games and graphics cards visit our Gaming List

Add one or more devices and compare

In the following list you can select (and also search for) devices that should be added to the comparison. You can select more than one device.

restrict list:

show all (including archived), 2024, 2023
v1.26
log 25. 16:15:07

#0 no ids found in url (should be separated by "_") +0s ... 0s

#1 not redirecting to Ajax server +0s ... 0s

#2 did not recreate cache, as it is less than 5 days old! Created at Thu, 25 Apr 2024 05:40:10 +0200 +0.001s ... 0.001s

#3 composed specs +0.042s ... 0.043s

#4 did output specs +0s ... 0.043s

#5 start showIntegratedCPUs +0s ... 0.043s

#6 getting avg benchmarks for device 11594 +0.026s ... 0.069s

#7 got single benchmarks 11594 +0.016s ... 0.085s

#8 got avg benchmarks for devices +0s ... 0.085s

#9 min, max, avg, median took s +0.835s ... 0.92s

#10 before gaming benchmark output +0s ... 0.92s

#11 Got 524 rows for game benchmarks. +0.105s ... 1.026s

#12 composed SQL query for gamebenchmarks +0s ... 1.026s

#13 got data and put it in $dataArray +0.033s ... 1.059s

#14 benchmarks composed for output. +2.414s ... 3.472s

#15 return log +0.056s ... 3.528s

Please share our article, every link counts!

» Comparison of GPUs
Detailed list of all laptop GPUs sorted by class and performance.

» Benchmark List
Sort and restrict laptop GPUs based on performance in synthetic benchmarks.

» Notebook Gaming List
Playable games for each graphics card and their average FPS results.

Class 1

Arc A580 Desktop

Class 2

Arc A380 Desktop

Class 3

UHD Graphics 32EUs
UHD Graphics 750

Class 4

* Approximate position of the graphics adapter

> Expert Reviews and News on Laptops, Smartphones and Tech Innovations > Benchmarks / Tech > Comparison of Laptop Graphics Cards > AMD Radeon RX 7900 GRE GPU - Benchmarks and Specs
Klaus Hinum (Update: 2023-08-19)