


Comino GRANDO RM V2-S professional high-end workstation in review - 4 RTX A6000 meet Ryzen Threadripper Pro 3975WX
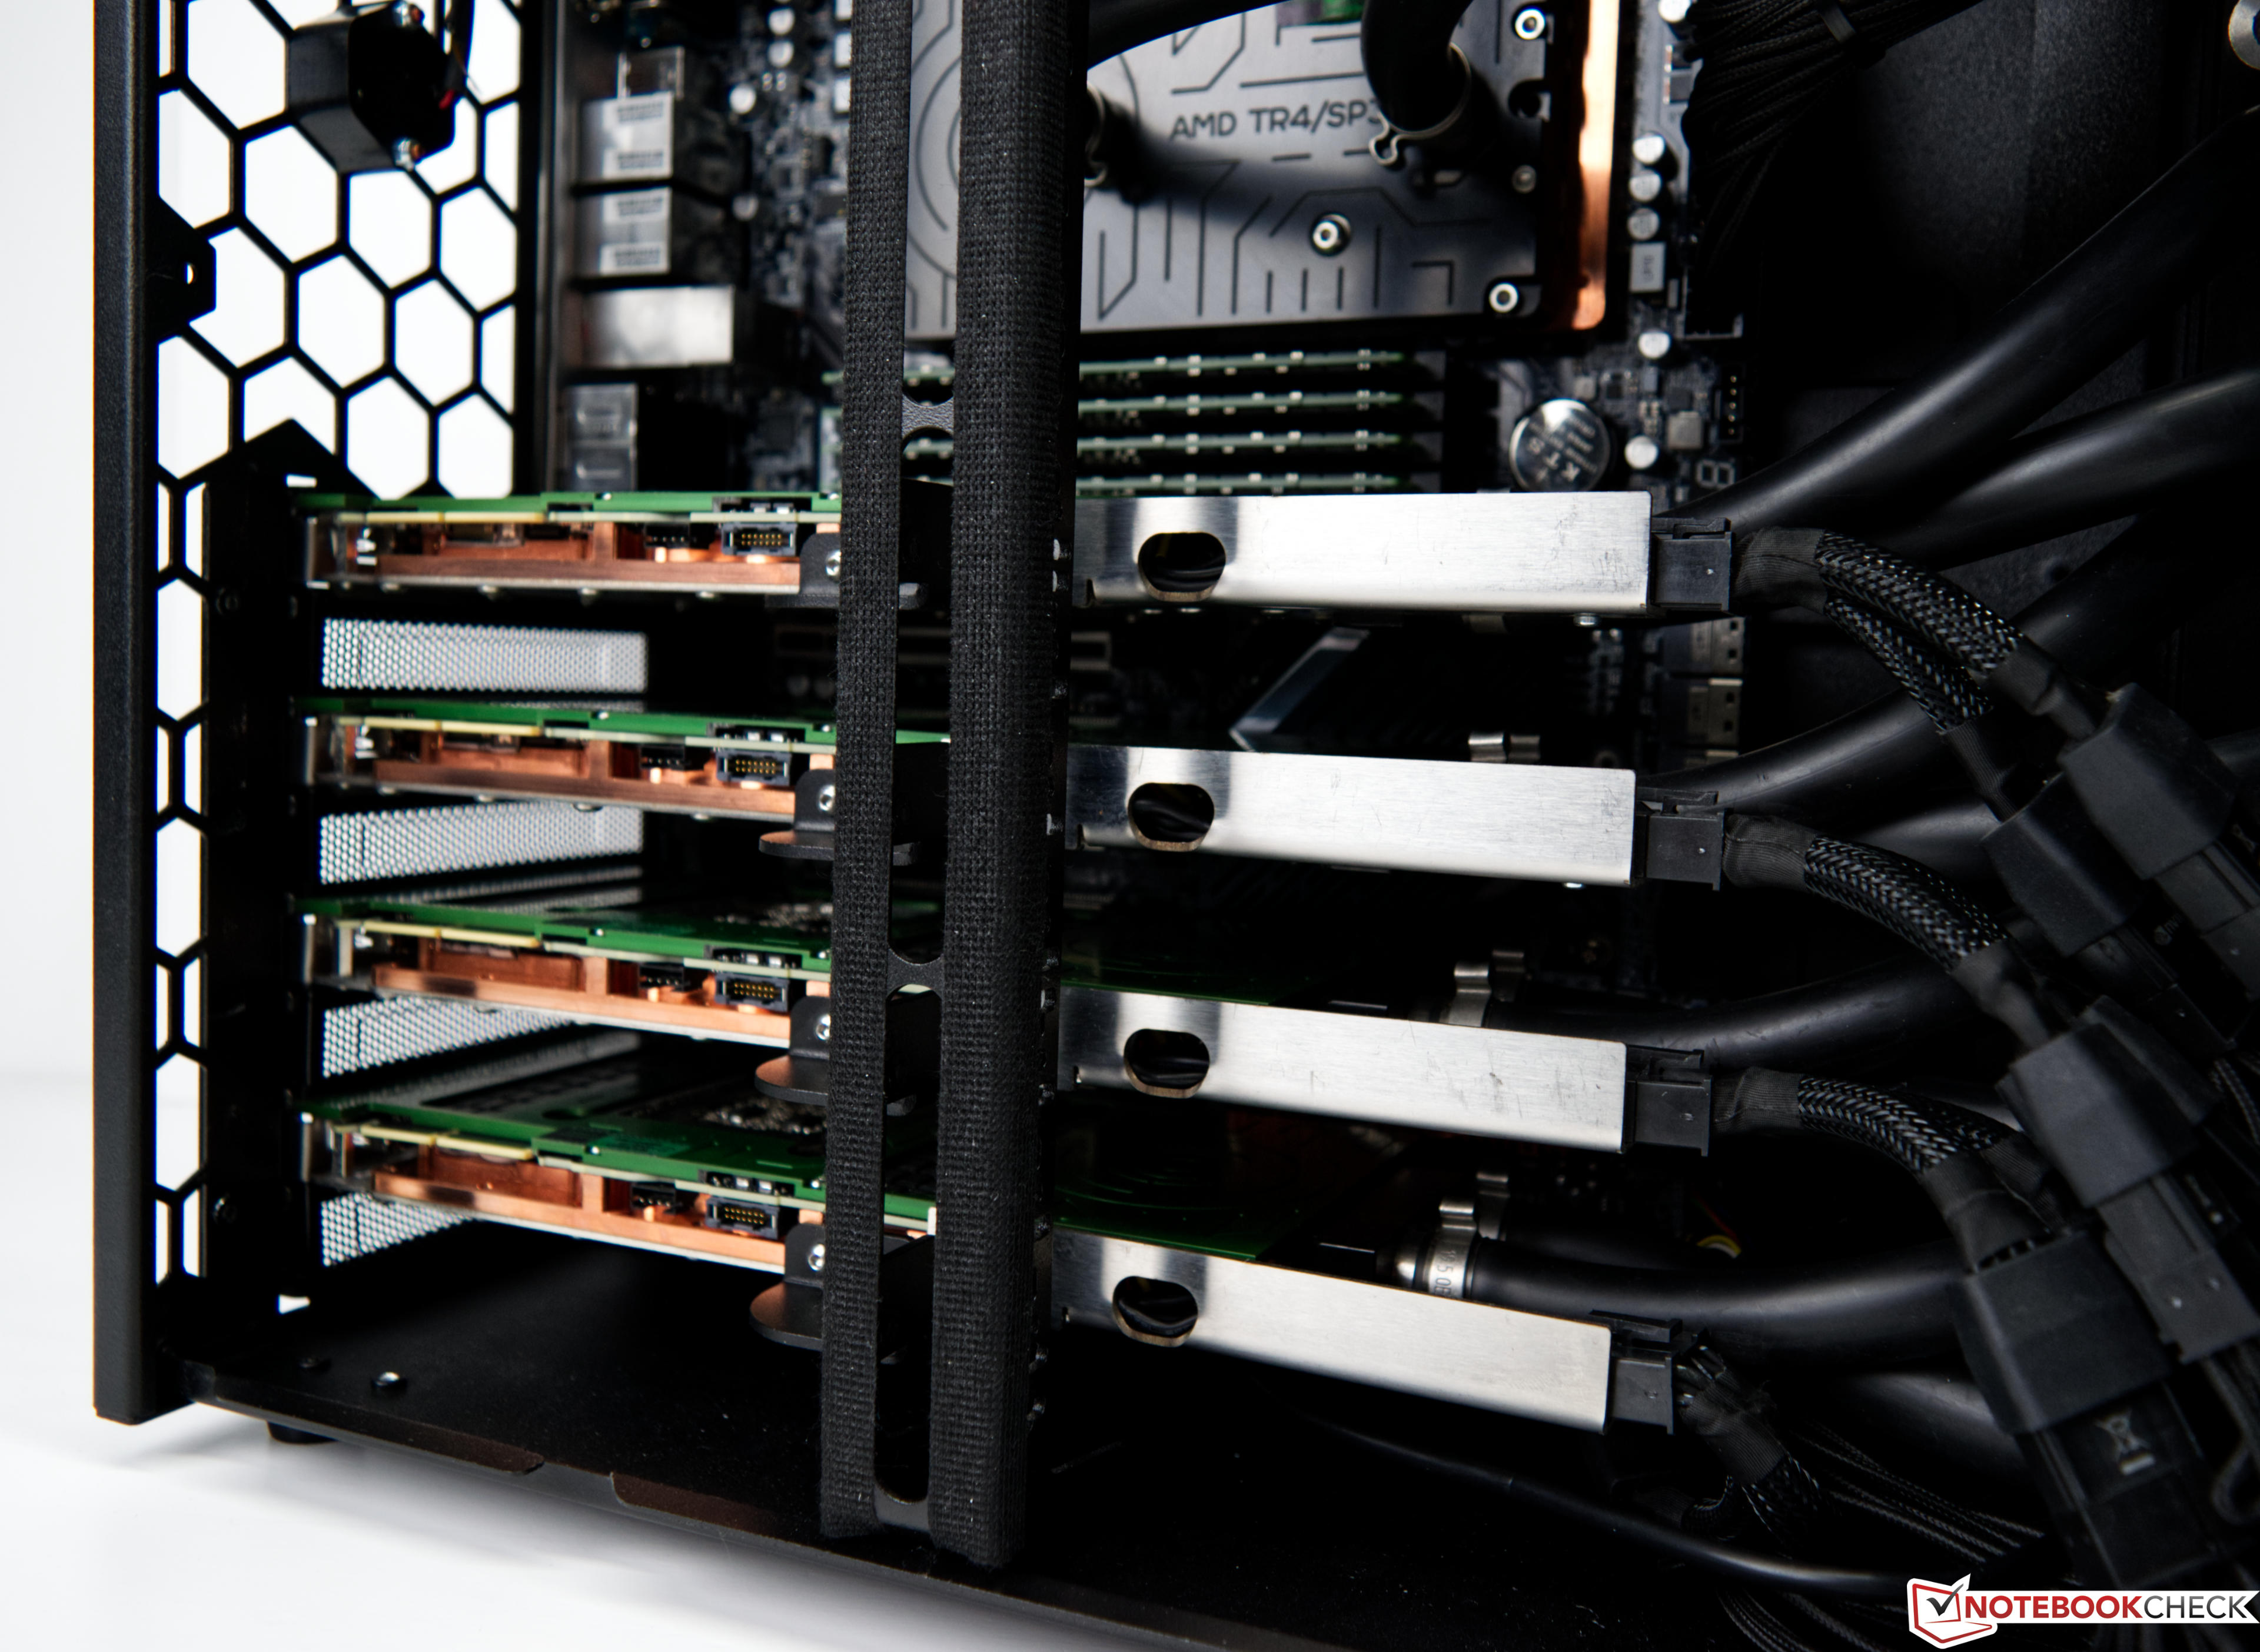
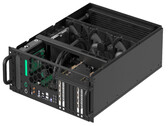
We received a compact 19-inch workstation from Comino, which is equipped with four Nvidia A6000s and an AMD Ryzen Threadripper Pro 3975WX. In addition, there is liquid cooling, which is supposed to keep both the CPU and the GPUs in check. We took a closer look at the system and explain the pros and cons.
AMD Ryzen Threadripper PRO 3975WX, 4x NVIDIA RTX A6000