


AMD Radeon RX 7700 XT desktop graphics card review with 12 GB VRAM for less than 500 Euros
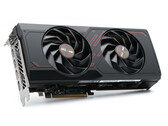
The AMD Radeon RX 7700 XT follows in the footsteps of the AMD Radeon RX 6700 XT, which was able to score with a good price-performance ratio in the past. We evaluated the AMD Radeon RX 7700 XT in form of the Sapphire Pulse AMD Radeon RX 7700 XT, analyzing it with various tests and benchmarks to find out whether it is a worthy successor of the RX 6700 XT.
AMD Ryzen 9 7950X, Radeon RX 7700 XT, 32", 1.1 kg