


Acer Predator BiFrost Arc A770 OC desktop graphics card review - How does Intel's most powerful gaming card with 16 GB VRAM perform?
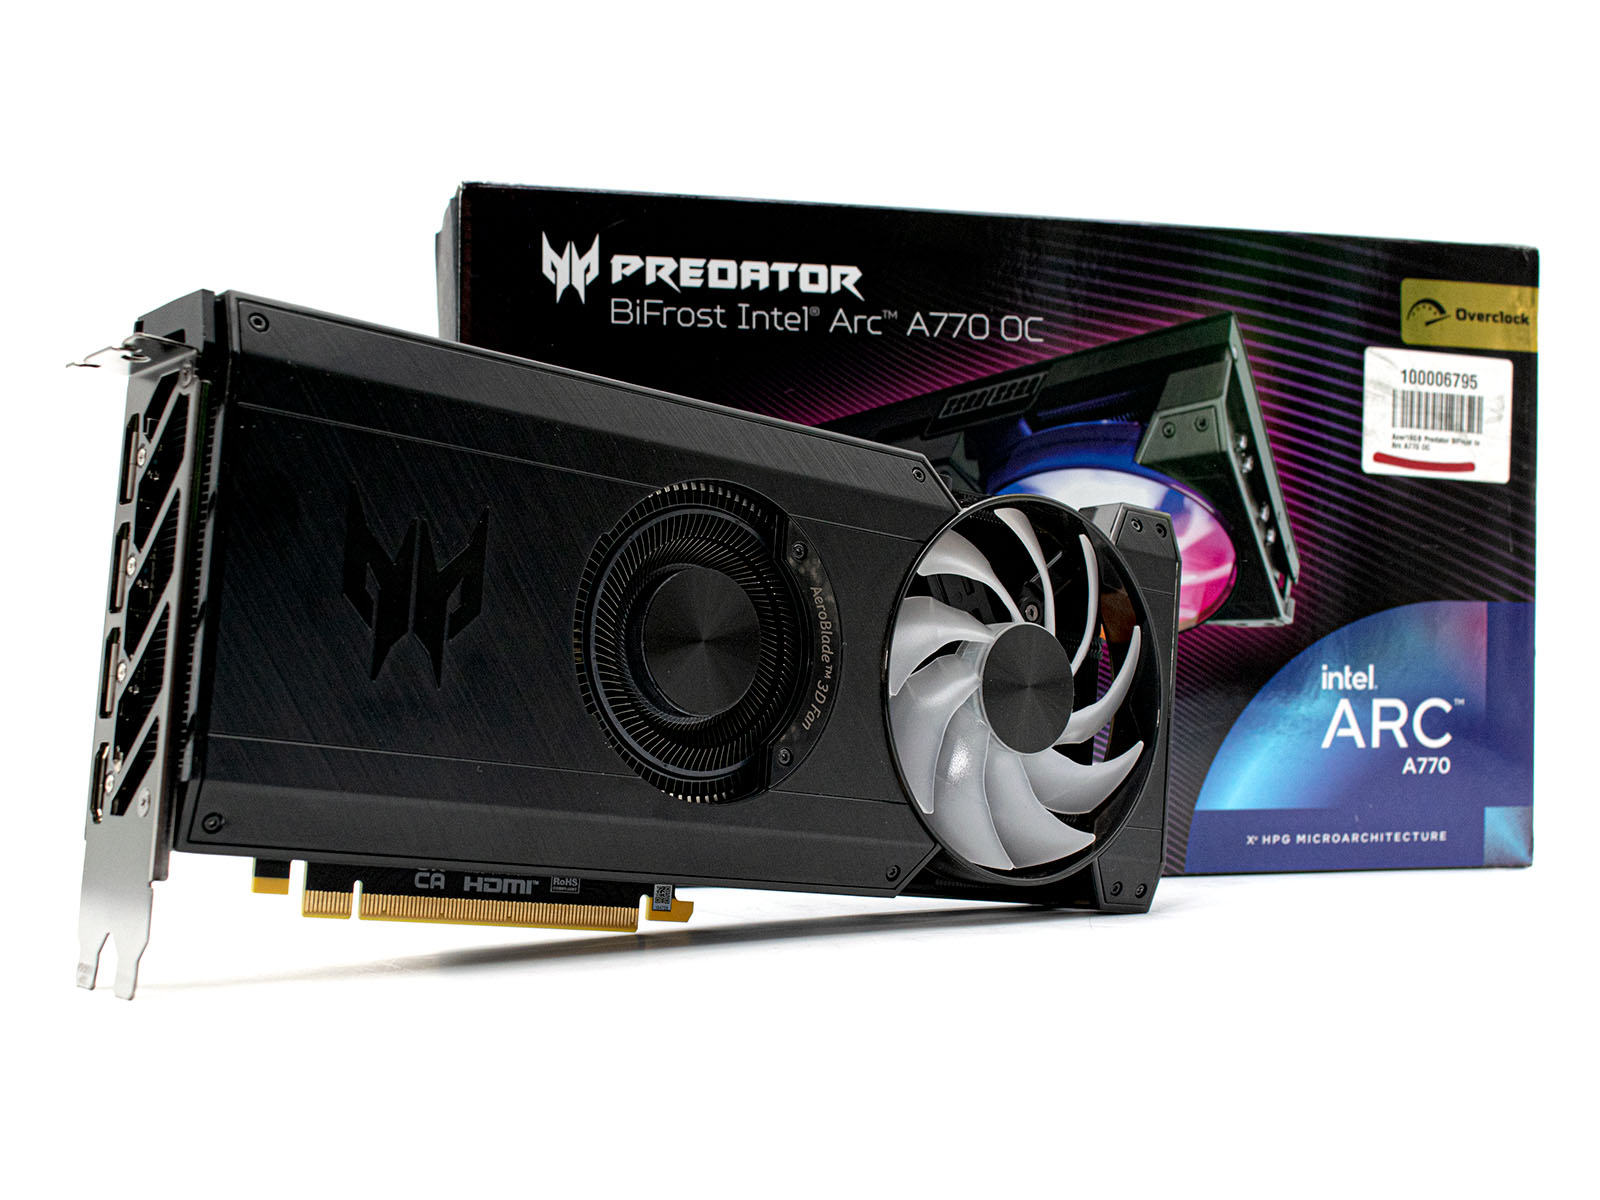
The two big players, Nvidia and AMD, often represent the first choice in the gaming industry. But for about a year now, Intel also has been playing a role in the area of the dedicated desktop GPUs. In this review, we evaluate the performance capabilities of the Acer Predator BiFrost Arc A770 OC on the basis of the current drivers. With 16 GB of VRAM, Intel isn't stingy, and their price also makes the models of the Arc series very attractive.
AMD Ryzen 9 7950X, Intel Arc A770, 32", 1.2 kg