Notebook reviews with Intel Graphics 4-Core iGPU (Meteor / Arrow Lake) graphics card
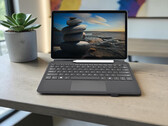
Ninkear S13 review: Windows tablet with Core Ultra 5 in Surface Pro design
With the Ninkear S13, the manufacturer is launching a versatile Windows tablet with a detachable keyboard and Intel Core Ultra 5 115U. The device combines a productive 13-inch form factor with modern hardware and is primarily aimed at users who want to work flexibly on the go. But how does the 2-in-1 device perform in everyday use in terms of performance, display, mobility, and battery life? Our test provides the answers.
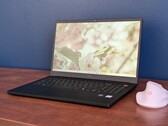
Intel Core Ultra 5 115U, Graphics 4-Core iGPU (Arrow Lake), 13", 870 gLG Gram Book 15U55T laptop review: Way too many cut corners
By targeting the budget category, the Gram Book 15 loses all the selling points that make the Gram series so special in the first place. The few redeeming qualities aren't enough to make the system an easy recommendation.
Intel Core Ultra 7 255U, Graphics 4-Core iGPU (Arrow Lake), 15.6", 1.6 kgGMK NucBox K15 review: Affordable mini PC with an oversized design
The Intel Core Ultra 5 125U doesn't require a lot of cooling, but pair it with a larger-than-usual chassis design and the resulting system barely makes a peep.
Intel Core Ultra 5 125U, Graphics 4-Core iGPU (Arrow Lake), 885 gMinisforum MS-02 Ultra review: Workstation as a mini PC with Intel Core Ultra, PCIe & high-speed network
The Minisforum MS-02 Ultra combines powerful Intel Core Ultra hardware with an exceptionally extensive range of features in a compact format. Thanks to its high computing power, integrated AI acceleration, and versatile expansion and network options, it is aimed at demanding users. Does the MS-02 Ultra 2025 belong to the top class of mini PCs? Our test provides the answers.
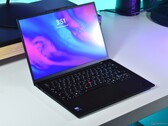
Intel Core Ultra 9 285HX, Graphics 4-Core iGPU (Arrow Lake), 3.5 kgTrading efficiency for optional 5G and Lunar Lake for Arrow Lake: Lenovo ThinkPad X1 Carbon Gen 13 laptop review
We already tested the Lenovo ThinkPad X1 Carbon Gen 13, but only the model with Intel Lunar Lake and the OLED screen. Many customers are asking: What about the Arrow Lake version with IPS display, which is often cheaper and more readily available? We have tested it, to see what the differences are.
Intel Core Ultra 5 225U, Graphics 4-Core iGPU (Arrow Lake), 14", 1.2 kgHP Omnibook 5 16-af1037nr: Intel Core Ultra 7 255U, 16.00", 1.7 kg
Review » HP Omnibook 5 16 laptop review: Just the basics for a cheap price
HP 17t-cn500: Intel Core Ultra 7 255U, 17.30", 2.1 kg
Review » HP 17t-cn500 laptop review: Big screen for basic multimedia
HP EliteBook 8 Flip G1i 13: Intel Core Ultra 7 265U, 13.30", 1.4 kg
Review » HP EliteBook 8 Flip G1i 13 convertible review: Comfortable and super efficient
Lenovo ThinkPad T14s 2in1 Gen1: Intel Core Ultra 7 255U, 14.00", 1.4 kg
Review » Lenovo ThinkPad T14s 2-in-1 Gen1 Review - New business convertible raises questions
Lenovo IdeaPad 5 2-in-1 16IAL10: Intel Core Ultra 7 255U, 16.00", 2.1 kg
Review » Lenovo IdeaPad 5 2-in-1 16IAL10 review: Big screen convertible with Intel Arrow Lake
Asus ExpertBook B5 B5404CMA: Intel Core Ultra 7 155U, 14.00", 1.3 kg
Review » Asus ExpertBook B5 B5404CMA Laptop Review: A compelling business laptop with all-day battery life that overlooks one important aspect
Lenovo ThinkPad E16 G3-21SSS00F00: Intel Core Ultra 5 225U, 16.00", 1.7 kg
Review » Lenovo ThinkPad E16 G3 Review - Affordable office laptop is even better with a 120 Hz display
Durabook S14I G3: Intel Core Ultra 7 165U, 14.00", 2.7 kg
Review » Built for extremes - Durabook S14I industrial laptop review
HP Envy x360 15 fe1071cl: Intel Core Ultra 7 155U, 15.60", 1.9 kg
Review » HP Envy x360 15 Core Ultra 7 convertible review: Disappointing for the price
Lenovo ThinkPad L13 2in1 G5 21LNS4AM00: Intel Core Ultra 5 125U, 13.30", 1.3 kg
Review » Lenovo ThinkPad L13 2-in-1 G5 review - A business 2-in-1 with a matte touchscreen
Acer Aspire Spin 14 ASP14-52MTN-51V5: Intel Core Ultra 5 115U, 14.00", 1.6 kg
Review » Acer Aspire Spin 14 review: The crazy world of the 2-in-1 laptop
Lenovo ThinkPad X12 Detachable G2: Intel Core Ultra 5 134U, 12.30", 1.1 kg
Review » Lenovo ThinkPad X12 Detachable G2 review: The versatile laptop-tablet hybrid for everyday business use
Lenovo ThinkBook 16 G7 IML: Intel Core Ultra 5 125U, 16.00", 1.8 kg
Review » Lenovo ThinkBook 16 G7 IML laptop review: Affordable yet professional
Lenovo ThinkPad X13 2-in-1 Gen 5: Intel Core Ultra 7 165U, 13.30", 1.3 kg
Review » Lenovo ThinkPad X13 2-in-1 Gen 5 laptop review: The high-performance Yoga convertible successor
Lenovo ThinkPad E14 G6: Intel Core Ultra 7 155U, 14.00", 1.5 kg
Review » Lenovo ThinkPad E14 G6 laptop review: Fixes lots of problems on the E14 G5
Lenovo ThinkPad T16 Gen 3 21MN005XGE: Intel Core Ultra 5 125U, 16.00", 2 kg
Review » Lenovo ThinkPad T16 Gen 3 laptop in review: Big screen, big battery, but not big on performance
Dell Latitude 7450 2-in-1: Intel Core Ultra 7 165U, 14.00", 1.5 kg
Review » Dell Latitude 7450 2-in-1 Laptop Review: Versatile business convertible that delivers on most fronts
Dell Latitude 7350 Detachable: Intel Core Ultra 7 164U, 13.00", 0.9 kg
Review » Core Ultra 7 164U performance debut: Dell Latitude 7350 Detachable review
Lenovo ThinkPad T14 G5 21ML005JGE: Intel Core Ultra 7 155U, 14.00", 1.5 kg
Review » Lenovo ThinkPad T14 Gen 5 Intel laptop review: Upgradeable RAM returns to the T series
Lenovo Yoga 7 2-in-1 14IML9: Intel Core Ultra 5 125U, 14.00", 1.6 kg
Review » Lenovo Yoga 7 2-in-1 14IML9 convertible review: Classy for under $700
Lenovo ThinkPad T14s Gen 5 21LS001PGE: Intel Core Ultra 5 125U, 14.00", 1.3 kg
Review » Lenovo ThinkPad T14s Gen 5 laptop review: The premium T-ThinkPad with Intel Core Ultra
Dell Latitude 13 7350: Intel Core Ultra 5 135U, 13.30", 1.1 kg
Review » Core Ultra 5 135U performance debut: Dell Latitude 13 7350 laptop review
HP Envy x360 2-in-1 14-fc0078TU: Intel Core Ultra 5 125U, 14.00", 1.4 kg
Review » HP Envy x360 2-in-1 14 (2024) Laptop Review: A near-premium convertible experience that leaves us wanting more
Lenovo ThinkPad X1 2in1 G9 21KE004AGE: Intel Core Ultra 7 165U, 14.00", 1.3 kg
Review » Lenovo ThinkPad X1 2in1 G9 review - The high-end business convertible with 120-Hz OLED and without TrackPoint buttons
Lenovo ThinkBook 14 2-in-1 G4 IML: Intel Core Ultra 5 125U, 14.00", 1.6 kg
Review » Lenovo ThinkBook 14 2-in-1 G4 IML review: New sleek look with Meteor Lake-U
Lenovo Yoga 7 2-in-1 16IML9: Intel Core Ultra 5 125U, 16.00", 2.1 kg
Review » Core Ultra 5 125U performance debut: Lenovo Yoga 7 2-in-1 16IML9 convertible review
Lenovo Yoga Book 9 13IMU9: Intel Core Ultra 7 155U, 13.30", 1.4 kg
Review » Lenovo Yoga Book 9 13IMU9 2-in-1 dual screen review: Core Ultra 7 155U and Arc 4 are a mixed bag
Dell Latitude 9450 2-in-1: Intel Core Ultra 7 165U, 14.00", 1.6 kg
Review » Core Ultra 7 165U performance debut: Dell Latitude 9450 2-in-1 review
Lenovo ThinkPad E16 G3-21SSS00F00: Intel Core Ultra 5 225U, 16.00", 1.7 kg
External Review » Lenovo ThinkPad E16 G3-21SSS00F00 - Reviews and Specs
Lenovo ThinkPad X13 G6, Core 7 255U: Intel Core Ultra 7 255U, 13.30", 1 kg
External Review » Lenovo ThinkPad X13 G6, Core 7 255U
Lenovo ThinkPad T14 G6 Intel: Intel Core Ultra 5 225U, 14.00", 1.4 kg
External Review » Lenovo ThinkPad T14 G6 Intel
HP ProBook 4 G1i 16: Intel Core Ultra 5 225U, 16.00", 1.7 kg
External Review » HP ProBook 4 G1i 16
Samsung Galaxy Book5 15 NP750XHD: Intel Core Ultra 7 255U, 15.60", 1.6 kg
External Review » Samsung Galaxy Book5 15 NP750XHD
HP Elitebook 6 G1i 13: Intel Core Ultra 5 225U, 13.30", 1.3 kg
External Review » HP Elitebook 6 G1i 13
HP Omnibook 5 16-af1037nr: Intel Core Ultra 7 255U, 16.00", 1.7 kg
External Review » HP Omnibook 5 16-af1037nr
Lenovo ThinkPad T14s 2in1 Gen1: Intel Core Ultra 7 255U, 14.00", 1.4 kg
External Review » Lenovo ThinkPad T14s 2in1 Gen1
Lenovo ThinkPad X13 G6 Intel: Intel Core Ultra 5 225U, 13.30", 1 kg
External Review » Lenovo ThinkPad X13 G6 Intel
Dell Pro 14 PC14250: Intel Core Ultra 7 255U, 14.00", 1.4 kg
External Review » Dell Pro 14 PC14250
HP EliteBook 8 Flip G1i 13: Intel Core Ultra 7 265U, 13.30", 1.4 kg
External Review » HP EliteBook 8 Flip G1i 13
Dynabook Portégé X40-M: Intel Core Ultra 5 225U, 14.00", 1.4 kg
External Review » Dynabook Portégé X40-M
Lenovo IdeaPad 5 2-in-1 16IAL10: Intel Core Ultra 7 255U, 16.00", 2.1 kg
External Review » Lenovo IdeaPad 5 2-in-1 16IAL10
HP OmniBook 7 AI 14-fr0000: Intel Core Ultra 5 225U, 14.00", 2.5 kg
External Review » HP OmniBook 7 AI 14-fr0000
Dell Pro 16 PC16250: Intel Core Ultra 7 265U, 16.00", 1.9 kg
External Review » Dell Pro 16 PC16250
Lenovo ThinkPad X13 2-in-1 Gen 5: Intel Core Ultra 7 165U, 13.30", 1.3 kg
External Review » Lenovo ThinkPad X13 2-in-1 Gen 5
Acer Swift Neo AI 14 SFN14-54H: Intel Core Ultra 5 115U, 14.00", 1.3 kg
External Review » Acer Swift Neo AI 14 SFN14-54H
Acer Swift Lite 14 AI SFL14-51M, Ultra 5 115U: Intel Core Ultra 5 115U, 14.00", 1.3 kg
External Review » Acer Swift Lite 14 AI SFL14-51M, Ultra 5 115U
Lenovo ThinkPad T14s Gen 5 21LS001PGE: Intel Core Ultra 5 125U, 14.00", 1.3 kg
External Review » Lenovo ThinkPad T14s Gen 5 21LS001PGE
Acer Swift Lite 16 AI SFL16-51M: Intel Core Ultra 7 155U, 16.00", 1.2 kg
External Review » Acer Swift Lite 16 AI SFL16-51M
Acer Swift Go 14 OLED SFG14-73, Ultra 5 125U: Intel Core Ultra 5 125U, 14.00", 1.3 kg
External Review » Acer Swift Go 14 OLED SFG14-73, Ultra 5 125U
Lenovo ThinkPad L13 G5: Intel Core Ultra 5 125U, 13.30", 1.2 kg
External Review » Lenovo ThinkPad L13 G5
HP EliteBook 640 G11: Intel Core Ultra 7 155U, 14.00", 1.4 kg
External Review » HP EliteBook 640 G11
HP Pavilion 16-af0075ng: Intel Core Ultra 5 125U, 16.00", 1.8 kg
External Review » HP Pavilion 16-af0075ng
Lenovo ThinkPad E14 G6: Intel Core Ultra 7 155U, 14.00", 1.5 kg
External Review » Lenovo ThinkPad E14 G6
Acer Chromebook Plus Spin 714-1H, Ultra 5 115U: Intel Core Ultra 5 115U, 14.00", 1.5 kg
External Review » Acer Chromebook Plus Spin 714-1H, Ultra 5 115U
Asus ExpertBook CX5403, Ultra 5 115U: Intel Core Ultra 5 115U, 14.00", 1.4 kg
External Review » Asus ExpertBook CX5403, Ultra 5 115U
Acer Swift Lite 14 AI SFL14-51M, Ultra 5 125U: Intel Core Ultra 5 125U, 14.00", 1.3 kg
External Review » Acer Swift Lite 14 AI SFL14-51M, Ultra 5 125U
HP Probook 440 G11: Intel Core Ultra 5 125U, 14.00", 1.4 kg
External Review » HP Probook 440 G11
HP Pavilion 16-af0000ng: Intel Core Ultra 5 125U, 16.00", 1.8 kg
External Review » HP Pavilion 16-af0000ng
HP EliteBook 830 G11: Intel Core Ultra 7 155U, 13.30", 1.3 kg
External Review » HP EliteBook 830 G11
HP EliteBook 840 G11: Intel Core Ultra 7 155U, 14.00", 1.4 kg
External Review » HP EliteBook 840 G11
HP EliteBook 660 G11: Intel Core Ultra 7 155U, 16.00", 1.7 kg
External Review » HP EliteBook 660 G11
Lenovo ThinkPad T14 G5, Ultra 5 125U: Intel Core Ultra 5 125U, 14.00", 1.4 kg
External Review » Lenovo ThinkPad T14 G5, Ultra 5 125U
Lenovo ThinkPad X12 Detachable G2: Intel Core Ultra 5 134U, 12.30", 1.1 kg
External Review » Lenovo ThinkPad X12 Detachable G2
Acer TravelMate P4 Spin 14 TMP414RN-54: Intel Core Ultra 5 125U, 14.00", 1.5 kg
External Review » Acer TravelMate P4 Spin 14 TMP414RN-54
Lenovo ThinkPad T16 Gen 3 21MN005XGE: Intel Core Ultra 5 125U, 16.00", 2 kg
External Review » Lenovo ThinkPad T16 Gen 3 21MN005XGE
Lenovo ThinkBook 14 G7 IML, Ultra 5 125U: Intel Core Ultra 5 125U, 14.00", 1.4 kg
External Review » Lenovo ThinkBook 14 G7 IML, Ultra 5 125U
HP ProBook 460 G11: Intel Core Ultra 5 125U, 16.00", 1.7 kg
External Review » HP ProBook 460 G11
Lenovo ThinkPad L14 G5: Intel Core Ultra 7 155U, 14.00", 1.4 kg
External Review » Lenovo ThinkPad L14 G5
HP EliteBook 860 G11: Intel Core Ultra 7 155U, 16.00", 1.7 kg
External Review » HP EliteBook 860 G11
Acer Swift Lite 14 AI SFL14-51M: Intel Core Ultra 7 155U, 14.00", 1.3 kg
External Review » Acer Swift Lite 14 AI SFL14-51M
Dell Latitude 7450 2-in-1: Intel Core Ultra 7 155U, 14.00", 1.1 kg
External Review » Dell Latitude 7450 2-in-1
Asus ExpertBook CX5403, Ultra 5 125U: Intel Core Ultra 5 125U, 14.00", 1.4 kg
External Review » Asus ExpertBook CX5403, Core 5 125U
Lenovo ThinkBook 14 2-in-1 G4 IML, Ultra 7 155U: Intel Core Ultra 7 155U, 14.00", 1.6 kg
External Review » Lenovo ThinkBook 14 2-in-1 G4 IML, Ultra 7 155U
Lenovo ThinkPad L16 G1, Ultra 5 125U: Intel Core Ultra 5 125U, 16.00", 1.8 kg
External Review » Lenovo ThinkPad L16 G1, Ultra 5 125U
HP Pavilion 16-af0000: Intel Core Ultra 7 155U, 16.00", 1.8 kg
External Review » HP Pavilion 16-af0000
Asus ExpertBook B5404CMA: Intel Core Ultra 7 155U, 14.00", 1.4 kg
External Review » Asus ExpertBook B5404CMA
Asus Zenbook S 13 UX5304MA: Intel Core Ultra 7 155U, 13.30", 1 kg
External Review » Asus Zenbook S 13 UX5304MA
Lenovo ThinkPad X13 2-in-1 G5: Intel Core Ultra 7 155U, 13.30", 1.3 kg
External Review » Lenovo ThinkPad X13 2-in-1 G5
Lenovo ThinkPad T14 G5 21ML005JGE: Intel Core Ultra 7 155U, 14.00", 1.5 kg
External Review » Lenovo ThinkPad T14 G5 21ML005JGE
Dell Latitude 5450: Intel Core Ultra 7 155U, 14.00", 1.4 kg
External Review » Dell Latitude 5450
Dell Latitude 5550: Intel Core Ultra 7 155U, 15.60", 1.6 kg
External Review » Dell Latitude 5550
Dell Latitude 9450 2-in-1: Intel Core Ultra 7 165U, 14.00", 1.6 kg
External Review » Dell Latitude 9450 2-in-1
Asus ExpertBook CX5403: Intel Core Ultra 7 155U, 14.00", 1.4 kg
External Review » Asus ExpertBook CX5403
Dell Latitude 7350 Detachable 2024: Intel Core Ultra 7 164U, 13.30", 0.9 kg
External Review » Dell Latitude 7350 Detachable 2024
Dell Latitude 13 7350, Ultra 7 165U: Intel Core Ultra 7 165U, 13.30", 1.3 kg
External Review » Dell Latitude 13 7350, Ultra 7 165U
Lenovo ThinkBook 14 2-in-1 G4 IML: Intel Core Ultra 5 125U, 14.00", 1.6 kg
External Review » Lenovo ThinkBook 14 2-in-1 G4 IML
Acer Aspire Vero AV16-51P, Ultra 5 125U: Intel Core Ultra 5 125U, 16.00", 1.8 kg
External Review » Acer Aspire Vero AV16-51P, Ultra 5 125U
Dell Latitude 7450: Intel Core Ultra 7 165U, 14.00", 1.5 kg
External Review » Dell Latitude 7450
Acer Chromebook Plus Spin 714-1H: Intel Core Ultra 5 125U, 14.00", 1.5 kg
External Review » Acer Chromebook Plus Spin 714-1H
Dell Latitude 13 7350: Intel Core Ultra 5 135U, 13.30", 1.1 kg
External Review » Dell Latitude 13 7350
Lenovo ThinkPad X1 2in1 G9 21KE004AGE: Intel Core Ultra 7 165U, 14.00", 1.3 kg
External Review » Lenovo ThinkPad X1 2in1 G9 21KE004AGE
HP Envy x360 14-fc: Intel Core Ultra 7 155U, 14.00", 1.4 kg
External Review » HP Envy x360 14-fc
Asus ZenBook S13 OLED UX5304MA: Intel Core Ultra 7 155U, 13.30", 1 kg
External Review » Asus ZenBook S13 OLED UX5304MA
Lenovo Yoga 7 16IML9: Intel Core Ultra 5 125U, 16.00", 2 kg
External Review » Lenovo Yoga 7 16IML9
Microsoft Surface Pro 10: Intel Core Ultra 5 135U, 13.00", 0.9 kg
External Review » Microsoft Surface Pro 10
Lenovo Yoga Book 9 13IMU9: Intel Core Ultra 7 155U, 13.30", 1.4 kg
External Review » Lenovo Yoga Book 9 13IMU9
HP Envy x360 14-fc0000: Intel Core Ultra 5 125U, 14.00", 1.4 kg
External Review » HP Envy x360 14-fc0000
Lenovo ThinkBook 14 IML G4: Intel Core Ultra 5 125U, 14.00", 1.6 kg
External Review » Lenovo ThinkBook 14 IML G4
Acer Aspire Vero AV16-51P: Intel Core Ultra 7 155U, 16.00", 1.8 kg
External Review » Acer Aspire Vero AV16-51P
Ninkear S13, 16+1TB: Intel Core Ultra 5 115U, 13.00", 0.9 kg
» New perspective for mobile working: Ninkear S13 as a 2-in-1 tablet and laptop
LG Gram 15U55T: Intel Core Ultra 7 255U, 15.60", 1.6 kg
» LG Gram Book 15 sacrifices processor performance for a much quieter fan
» LG Gram Book 15 has one of the worst IPS displays in the series
GMK NucBox K15: Intel Core Ultra 5 125U, 0.9 kg
» GMKtec K15 mini PC trades away compactness for quieter operation
Minisforum MS-02 Ultra: Intel Core Ultra 9 285HX, 3.5 kg
» Minisforum MS-02 Ultra review: High-performance mini PC for professionals with up to 256 GB RAM, 25G LAN & PCIe
Lenovo ThinkPad X1 Carbon Gen 13 21NX008PGE: Intel Core Ultra 5 225U, 14.00", 1.2 kg
» Too many confusion options: Why Lenovo should simplify the ThinkPad X1 Carbon offering
HP Omnibook 5 16-af1037nr: Intel Core Ultra 7 255U, 16.00", 1.7 kg
» HP OmniBook 5 16 vs. Dell 16 Plus: Lunar Lake-V makes all the difference
» HP OmniBook 5 16 offers nothing special, but that's probably for the best
HP 17t-cn500: Intel Core Ultra 7 255U, 17.30", 2.1 kg
» Budget HP 17t series now on sale for over half off starting at just $420
» Core Ultra 7 255U can run much slower than the Core Ultra 7 155U depending on the laptop
HP EliteBook 8 Flip G1i 13: Intel Core Ultra 7 265U, 13.30", 1.4 kg
» Core Ultra 7 265U vs. Core Ultra 7 165U: Almost no performance differences between them
» HP EliteBook 8 Flip G1i 13 is better than the EliteBook x360 830 G10 in almost every way
Lenovo ThinkPad T14s 2in1 Gen1: Intel Core Ultra 7 255U, 14.00", 1.4 kg
» Intel's Arrow Lake processor is the worst choice for the Lenovo ThinkPad T14s 2-in-1
» Lenovo's new business convertible ThinkPad T14s 2-in-1 suffers from the 60 Hz display
Lenovo IdeaPad 5 2-in-1 16IAL10: Intel Core Ultra 7 255U, 16.00", 2.1 kg
» Core Ultra 7 255U vs. Core Ultra 155U: Early benchmarks show good multi-thread performance improvements
» Lenovo IdeaPad 2-in-1 16 with Intel Arrow Lake offers too little for the price
Lenovo ThinkPad E16 G3-21SSS00F00: Intel Core Ultra 5 225U, 16.00", 1.7 kg
» Lenovo's new ThinkPad E16 G3 is currently the best budget office laptop
HP Envy x360 2-in-1 14-fc0078TU: Intel Core Ultra 5 125U, 14.00", 1.4 kg
» HP Envy x360 14 convertible with 2.8K OLED and Core Ultra 7 155U slashed to just $800
Lenovo ThinkPad T16 Gen 3 21MN005XGE: Intel Core Ultra 5 125U, 16.00", 2 kg
» Laptops and the right to repair: Why is this feature of the Lenovo ThinkPad T16 so rare?
Lenovo ThinkPad T14 G5 21ML005JGE: Intel Core Ultra 7 155U, 14.00", 1.5 kg
» Lenovo ThinkPad T14 G5: A nearly perfect business laptop
Lenovo Yoga 7 2-in-1 14IML9: Intel Core Ultra 5 125U, 14.00", 1.6 kg
» Highly-rated Lenovo Yoga 9i Gen 9 with Core Ultra 7 155H and 120 Hz OLED display is back on sale at record low price
Lenovo Yoga 7 2-in-1 16IML9: Intel Core Ultra 5 125U, 16.00", 2.1 kg
» Highly-rated Lenovo Yoga 9i Gen 9 with Core Ultra 7 155H and 120 Hz OLED display is back on sale at record low price
Lenovo Yoga Book 9 13IMU9: Intel Core Ultra 7 155U, 13.30", 1.4 kg
» Highly-rated Lenovo Yoga 9i Gen 9 with Core Ultra 7 155H and 120 Hz OLED display is back on sale at record low price
Lenovo Yoga 7 2-in-1 16IML9: Intel Core Ultra 5 125U, 16.00", 2.1 kg
» 2024 Lenovo Yoga 7i 16 convertible with Meteor Lake processor sees 33% price cut at Best Buy