NVIDIA GeForce GTX 675MX
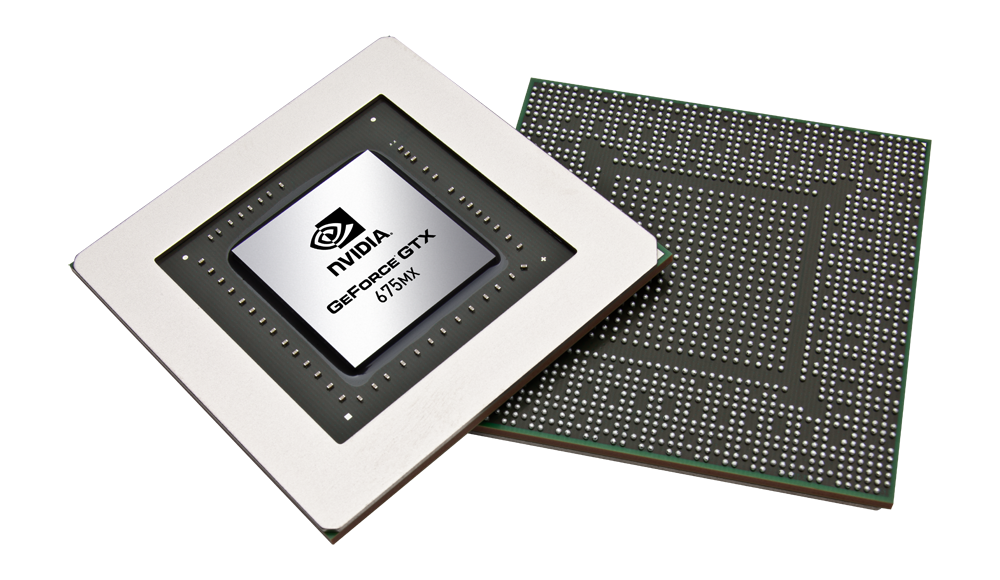
The NVIDIA GeForce GTX 675MX is a high-end DirectX 11.1-compatible graphics card for laptops and was announced in October 2012. As opposed to the Fermi-based GTX 675M, the 675MX uses a newer 28nm GK104 core based on the Kepler architecture, similar to the GeForce 680M.
Architecture
The Kepler architecture is the successor to the Fermi architecture that first appeared in laptops with the GeForce 400M series. The GK104 Kepler core offers eight shader blocks, called SMX, that are clocked at the same speed as the central core. In the GTX 675MX, five blocks are active for a total of 1344 CUDA cores. Although the Kepler architecture can utilize more shader cores than a Fermi chip, its shaders can be up to twice as power efficient. However, due to the missing hot clock of the shader domain, two shaders of a Kepler chip are of similar speed to one shader of a Fermi chip (as the latter is clocked twice as fast).
PCIe 3.0 is now supported by the mobile Kepler series and an optional Turbo mode can automatically overclock the Nvidia card by a theoretical 15 percent if the laptop cooling system allows it. The implementation of this boost mode is done in the BIOS, but it is ultimately dependent upon the manufacturer of the laptop.
Performance
The graphics performance of the GeForce GTX 675MX is significantly higher than the old Fermi based GTX 675M and therefore similar fast as the Geforce GTX 560M SLI combination. Even demanding games of 2012 run fluently in highest detail settings, except for titles like Sleeping Dogs or Guild Wars 2.
Features
The improved feature set now includes support for up to 4 active displays. Furthermore, high resolution monitors of up to 3840x2160 pixels can now be connected using DisplayPort 1.2 or HDMI 1.4a if available. HD-Audio codecs, such as Dolby TrueHD and DTS-HD, can be transmitted via bitstream mode through the HDMI port. However, as most laptops will feature Optimus, the integrated GPU will likely have direct control over the display ports and may limit the feature set available by the Nvidia Kepler cards.
The 5th generation PureVideo HD video processor (VP5) is also integrated in the GK104 core and offers hardware decoding of HD videos. Common codecs such as MPEG-1/2, MPEG-4 ASP, H.264 and VC1/WMV9 are fully supported up to 4K resolutions while VC1 and MPEG-4 are supported up to 1080p. Two streams can be decoded in parallel for features such as Picture-in-Picture. Another novelty is the inclusion of a dedicated video encoding engine similar to Intel QuickSync that can be accessed by the NVENC API.
The power consumption of the GeForce GTX 675M should be slightly below the GTX 680M but still only suited for large notebooks (17-inches or greater) and desktop replacements.
GeForce GTX 600M Series
| |||||||||||||||||||||||||||||||
| Codename | N13E-GSR | ||||||||||||||||||||||||||||||
| Architecture | Kepler | ||||||||||||||||||||||||||||||
| Pipelines | 960 - unified | ||||||||||||||||||||||||||||||
| Core Speed | 600 MHz | ||||||||||||||||||||||||||||||
| Memory Speed | 3600 MHz | ||||||||||||||||||||||||||||||
| Memory Bus Width | 256 Bit | ||||||||||||||||||||||||||||||
| Memory Type | GDDR5 | ||||||||||||||||||||||||||||||
| Shared Memory | no | ||||||||||||||||||||||||||||||
| API | DirectX 11, Shader 5.0, OpenGL 4.1 | ||||||||||||||||||||||||||||||
| Power Consumption | 100 Watt | ||||||||||||||||||||||||||||||
| Transistor Count | 3.5 Billion | ||||||||||||||||||||||||||||||
| Man. Technology | 28 nm | ||||||||||||||||||||||||||||||
| Features | Optimus, PhysX, Verde Drivers, CUDA, 3D Vision, 3DTV Play | ||||||||||||||||||||||||||||||
| Notebook Size | large | ||||||||||||||||||||||||||||||
| Date of Announcement | 01.10.2012 | ||||||||||||||||||||||||||||||
| Link to Manufacturer Page | www.geforce.com | ||||||||||||||||||||||||||||||
Benchmarks

3DM Vant. Perf. total +
specvp11 snx-01 +
* Smaller numbers mean a higher performance
Game Benchmarks
The following benchmarks stem from our benchmarks of review laptops. The performance depends on the used graphics memory, clock rate, processor, system settings, drivers, and operating systems. So the results don't have to be representative for all laptops with this GPU. For detailed information on the benchmark results, click on the fps number.

Titanfall
2014
Thief
2014
X-Plane 10.25
2013
Call of Duty: Ghosts
2013
Battlefield 4
2013

F1 2013
2013
Fifa 14
2013
Total War: Rome II
2013
Saints Row IV
2013


Dota 2
2013
Company of Heroes 2
2013
GRID 2
2013
Metro: Last Light
2013BioShock Infinite
2013SimCity
2013
Tomb Raider
2013Crysis 3
2013Dead Space 3
2013
Far Cry 3
2012
Assassin´s Creed III
2012
Hitman: Absolution
2012


Dishonored
2012
World of Tanks v8
2012Fifa 13
2012
F1 2012
2012
Borderlands 2
2012
Guild Wars 2
2012Counter-Strike: GO
2012Darksiders II
2012Sleeping Dogs
2012
Max Payne 3
2012Dirt Showdown
2012
Diablo III
2012
Risen 2: Dark Waters
2012
Mass Effect 3
2012Alan Wake
2012
Anno 2070
2011

Battlefield 3
2011| low | med. | high | ultra | QHD | 4K | |
|---|---|---|---|---|---|---|
| Titanfall | 60 | 59 | 52.1 | 39.7 | ||
| Thief | 55 | 46.6 | 41 | 23.4 | ||
| Assassin´s Creed IV: Black Flag | 61.4 | 59.4 | 39.8 | 21 | ||
| X-Plane 10.25 | 83.1 | 39 | 21.3 | 13.7 | ||
| Call of Duty: Ghosts | 76.5 | 74.3 | 44.8 | 25.8 | ||
| Battlefield 4 | 109.1 | 80.1 | 53.2 | 23.9 | ||
| Batman: Arkham Origins | 230 | 162 | 87 | 43 | ||
| F1 2013 | 155 | 120 | 114 | 73 | ||
| Fifa 14 | 432.3 | 319.1 | 312.9 | 268.6 | ||
| Total War: Rome II | 186.8 | 138.2 | 106.7 | 18.5 | ||
| Saints Row IV | 79.1 | 68.2 | 49 | 32.8 | ||
| The Bureau: XCOM Declassified | 121.7 | 91.1 | 41.5 | 25.7 | ||
| Splinter Cell: Blacklist | 94.3 | 100.7 | 48.9 | 25.4 | ||
| Dota 2 | 107.3 | 89.2 | 51.1 | |||
| Company of Heroes 2 | 46.8 | 39.5 | 25.9 | 12.4 | ||
| GRID 2 | 145.4 | 111.1 | 103.6 | 37.2 | ||
| Metro: Last Light | 87.6 | 72.5 | 41.9 | 22.7 | ||
| BioShock Infinite | 177.2 | 111.9 | 98.6 | 36.2 | ||
| StarCraft II: Heart of the Swarm | 260.3 | 113.7 | 100.8 | 44 | ||
| SimCity | 71.5 | 47 | 39 | 24.9 | ||
| Tomb Raider | 212.5 | 117.2 | 76.9 | 23.4 | ||
| Crysis 3 | 84.8 | 59.1 | 40.9 | 16.3 | ||
| Dead Space 3 | 258.7 | 171.6 | 132.1 | 79.9 | ||
| Far Cry 3 | 76.3 | 69.3 | 55.1 | 17.5 | ||
| Assassin´s Creed III | 66.8 | 64 | 27.8 | |||
| Hitman: Absolution | 72 | 66.4 | 41.4 | 19.3 | ||
| Call of Duty: Black Ops 2 | 186.6 | 151.1 | 91.5 | 57.4 | ||
| Need for Speed: Most Wanted | 59.8 | 59.8 | 59.3 | 38.2 | ||
| Medal of Honor: Warfighter | 143.8 | 98.4 | 79.3 | 34 | ||
| Dishonored | 122.4 | 122.9 | 122.1 | 103 | ||
| World of Tanks v8 | 44.2 | 38.8 | 26.7 | |||
| Fifa 13 | 326.3 | 311.7 | 248 | |||
| F1 2012 | 104 | 97 | 62 | |||
| Borderlands 2 | 94.1 | 82.8 | 62.9 | |||
| Guild Wars 2 | 43.3 | 24.7 | ||||
| Counter-Strike: GO | 220.6 | 193.3 | 131 | |||
| Darksiders II | 134.5 | 80.2 | ||||
| Sleeping Dogs | 100.2 | 59.4 | 16.1 | |||
| Ghost Recon: Future Soldier | 58.5 | 30.9 | ||||
| Max Payne 3 | 77.3 | 39.4 | 30.5 | |||
| Dirt Showdown | 80.3 | 84.5 | 39.4 | |||
| Diablo III | 194.6 | 176 | 109.9 | |||
| Risen 2: Dark Waters | 82 | 64.7 | 31.6 | |||
| Mass Effect 3 | 59.8 | 59.8 | ||||
| Alan Wake | 70 | 32.4 | ||||
| Anno 2070 | 116.9 | 73.9 | 37.7 | |||
| The Elder Scrolls V: Skyrim | 95.4 | 74 | 44 | |||
| CoD: Modern Warfare 3 | 139.1 | 125.3 | 80.6 | |||
| Battlefield 3 | 73.2 | 58.8 | 28.6 | |||
| low | med. | high | ultra | QHD | 4K | < 30 fps < 60 fps < 120 fps ≥ 120 fps | 3 13 13 | 10 25 12 | 2 20 16 7 | 20 18 8 3 | | |
For more games that might be playable and a list of all games and graphics cards visit our Gaming List
- $664.07MSI GF63 Thin 11SC-693 15.6" Gaming Laptop, Intel Core i5-11400H, NVIDIA GeForce GTX 1650, 8GB Memory, 256GB NVMe SSD, Windows 11
- $529.00MSI Computer GF63, NVIDIA GeForce GTX 1650 Graphics, 15.6" 8GB 256GB Intel Core i5-10300H X4 2.5GHz Win10, Black
- $699.00HP - Victus 15.6" Gaming Laptop - Intel Core i5-12450H - 8GB Memory - NVIDIA GeForce GTX 1650-512GB SSD - Mica Silver - Model 15-fa0031dx
- $970.00msi Thin 15 15.6” 144Hz FHD Gaming Laptop: Intel Core i7-12650H, NVIDIA Geforce RTX 4050, 16GB DDR5, 512GB NVMe SSD, Cooler Boost 5, Win 11: Black B12VE-2023US
- $818.98ASUS ROG Strix G Gaming Laptop, 15.6” 120Hz IPS Type Full HD, NVIDIA GeForce GTX 1660 Ti, Intel Core i5-9300H, 8GB DDR4, 512GB PCIe NVMe SSD, RGB KB, Windows 10, GL531GU-WB53
Notebook reviews with NVIDIA GeForce GTX 675MX graphics card
Cyberpower Fangbook X7-200: Intel Core i7-3630QM, 17.30", 3.9 kg
External Review » Cyberpower Fangbook X7-200
MSI GT70H-75X2817B: Intel Core i7-3630QM, 17.30", 3.9 kg
External Review » MSI GT70H-75X2817B