Notebook reviews with Intel Iris Plus Graphics G4 (Ice Lake 48 EU) graphics card
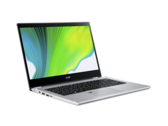
Acer Spin 3 SP314: Stylish convertible convinces in review
The Acer Spin 3 convertible is half laptop, half tablet. Is the device a lazy compromise in both categories, or is the compact 14-inch device a cheap deal with its Intel Core i5-1035G4 and Iris Plus Graphics G4 paired with 8 GB of RAM at around 800 Euros (~$954)?
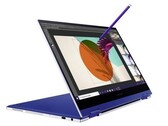
Intel Core i5-1035G4, Iris Plus Graphics G4 (Ice Lake 48 EU), 14", 1.5 kgGalaxy Book Flex 13.3 in review: Samsung convertible with bright display
The Samsung Galaxy Book Flex 13.3 features a fancy aluminum case and a bright touchscreen. But the Windows convertible has to prove in our test that its inner components are convincing too.
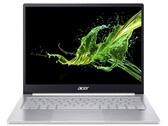
Intel Core i5-1035G4, Iris Plus Graphics G4 (Ice Lake 48 EU), 13.3", 1.2 kgAcer Swift 3 SF313 laptop review: Also a good subnotebook with i5
After the Acer Swift 3 SF313 was able to make a good impression in its full configuration, the Intel Core i5 model now has to show if it can deliver a similarly good performance. However, it also inherits the small weaknesses we already encountered in the first test. In our review we'll clarify to what extent this has an impact on the overall impression.
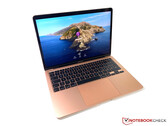
Intel Core i5-1035G4, Iris Plus Graphics G4 (Ice Lake 48 EU), 13.5", 1.2 kgApple MacBook Air 2020 Review: Is the Core i3 the better choice?
Apple equips the entry-level SKU of the MacBook Air with a dual-core processor, but is the performance still sufficient in 2020? Or should you get a configuration with a quad-core CPU? And: What are the effects on the temperatures and the fan noise?
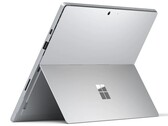
Intel Core i3-1000NG4, Iris Plus Graphics G4 (Ice Lake 48 EU), 13.3", 1.3 kgMicrosoft Surface Pro 7 Core i5 Review: More Like a Surface Pro 6.5
The Surface Pro 7 doesn't bring enough to the table to warrant a whole digit upgrade over the Surface Pro 6. Unless if you really value the integrated USB Type-C port or Iris Plus graphics update, last year's model will suffice.
Intel Core i5-1035G4, Iris Plus Graphics G4 (Ice Lake 48 EU), 12.3", 1.1 kgAsus ZenBook 13 UX325JA-I58512G0R: Intel Core i5-1035G4, 13.30", 1.3 kg
External Review » Asus ZenBook 13 UX325JA-I58512G0R
Asus ZenBook Flip 13 UX363JA-EM189T: Intel Core i5-1035G4, 13.30", 1.3 kg
External Review » Asus ZenBook Flip 13 UX363JA-EM189T
LG Gram 14Z90N-V.AR51B: Intel Core i5-1035G4, 14.00", 1 kg
External Review » LG Gram 14Z90N-V.AR51B
Lenovo ThinkBook 15-IIL-20SM001VMH: Intel Core i5-1035G4, 15.60", 1.8 kg
External Review » Lenovo ThinkBook 15-IIL-20SM001VMH
Samsung Galaxy Book Flex 13.3 NP930QCG-K01IT: Intel Core i5-1035G4, 13.30", 1.2 kg
External Review » Samsung Galaxy Book Flex 13.3 NP930QCG-K01IT
Acer Swift 3 Air 2 SF313-52-72PM: Intel Core i5-1035G4, 13.50"
External Review » Acer Swift 3 Air 2 SF313-52-72PM
Lenovo Yoga Slim 7 14IIL05, i5-1035G4: Intel Core i5-1035G4, 14.00", 1.6 kg
External Review » Lenovo Yoga Slim 7 14IIL05, i5-1035G4
Acer Swift 3 SF313-52-52AS: Intel Core i5-1035G4, 13.50", 1.2 kg
External Review » Acer Swift 3 SF313-52-52AS
Acer Spin 3 SP314-54N-58Q7: Intel Core i5-1035G4, 14.00", 1.5 kg
External Review » Acer Spin 3 SP314-54N-58Q7
Acer Swift 3 SF313-52-55UT: Intel Core i5-1035G4, 13.50", 1.2 kg
External Review » Acer Swift 3 SF313-52-55UT
Acer Spin 5 SP513-54N-58JN: Intel Core i5-1035G4, 13.30", 1.2 kg
External Review » Acer Spin 5 SP513-54N-58JN
Samsung Galaxy Book Flex 15 NP950QCG-K01DE: Intel Core i5-1035G4, 15.60", 1.6 kg
External Review » Samsung Galaxy Book Flex 15 NP950QCG-K01DE
Lenovo ThinkBook 14-IIL-20SL0022CK: Intel Core i5-1035G4, 14.00", 1.6 kg
External Review » Lenovo ThinkBook 14-IIL-20SL0022CK
Samsung Galaxy Book Flex 13.3: Intel Core i5-1035G4, 13.30", 1.2 kg
External Review » Samsung Galaxy Book Flex 13.3
Acer Swift 3 SF313-52-55T8: Intel Core i5-1035G4, 13.50", 1.2 kg
External Review » Acer Swift 3 SF313-52-55T8
HP Spectre x360 13-aw0015ng: Intel Core i5-1035G4, 13.30", 1.3 kg
External Review » HP Spectre x360 13-aw0015ng
HP Spectre x360 13-aw0001nl: Intel Core i5-1035G4, 13.30", 1.3 kg
External Review » HP Spectre x360 13-aw0001nl
Apple MacBook Air 2020 i3: Intel Core i3-1000NG4, 13.30", 1.3 kg
External Review » Apple MacBook Air 2020 i3
Acer Spin 3 SP314-54N-53GH: Intel Core i5-1035G4, 14.00", 1.5 kg
External Review » Acer Spin 3 SP314-54N-53GH
Acer Swift 3 SF313-52-52AS: Intel Core i5-1035G4, 13.50", 1.2 kg
External Review » Acer Swift 3 SF313-52-52AS
Lenovo Yoga S740-14IIL-81RS001DGE: Intel Core i5-1035G4, 14.00", 1.4 kg
External Review » Lenovo Yoga S740-14IIL-81RS001DGE
Lenovo Yoga C940-14IIL-81Q90020GE: Intel Core i5-1035G4, 14.00", 1.4 kg
External Review » Lenovo Yoga C940-14IIL-81Q90020GE
Microsoft Surface Pro 7 Core i5-1035G4: Intel Core i5-1035G4, 12.30", 1.1 kg
External Review » Microsoft Surface Pro 7 Core i5-1035G4
Microsoft Surface Pro 7, i5-1035G4: Intel Core i5-1035G4, 12.30", 0.8 kg
External Review » Microsoft Surface Pro 7, i5-1035G4
Samsung Galaxy Book Flex 13.3: Intel Core i5-1035G4, 13.30", 1.2 kg
» Samsung Galaxy Book Flex 13.3: Minor improvements to be desired
Acer Swift 3 SF313-52-52AS: Intel Core i5-1035G4, 13.50", 1.2 kg
» Acer Swift 3 SF313-52-52AS: Should buyers rather choose the Core i5?
Apple MacBook Air 2020 i3: Intel Core i3-1000NG4, 13.30", 1.3 kg
» The entry-level Apple MacBook Air is the better choice for many users
» The Apple MacBook Air 2020 is 30% brighter when you use Windows