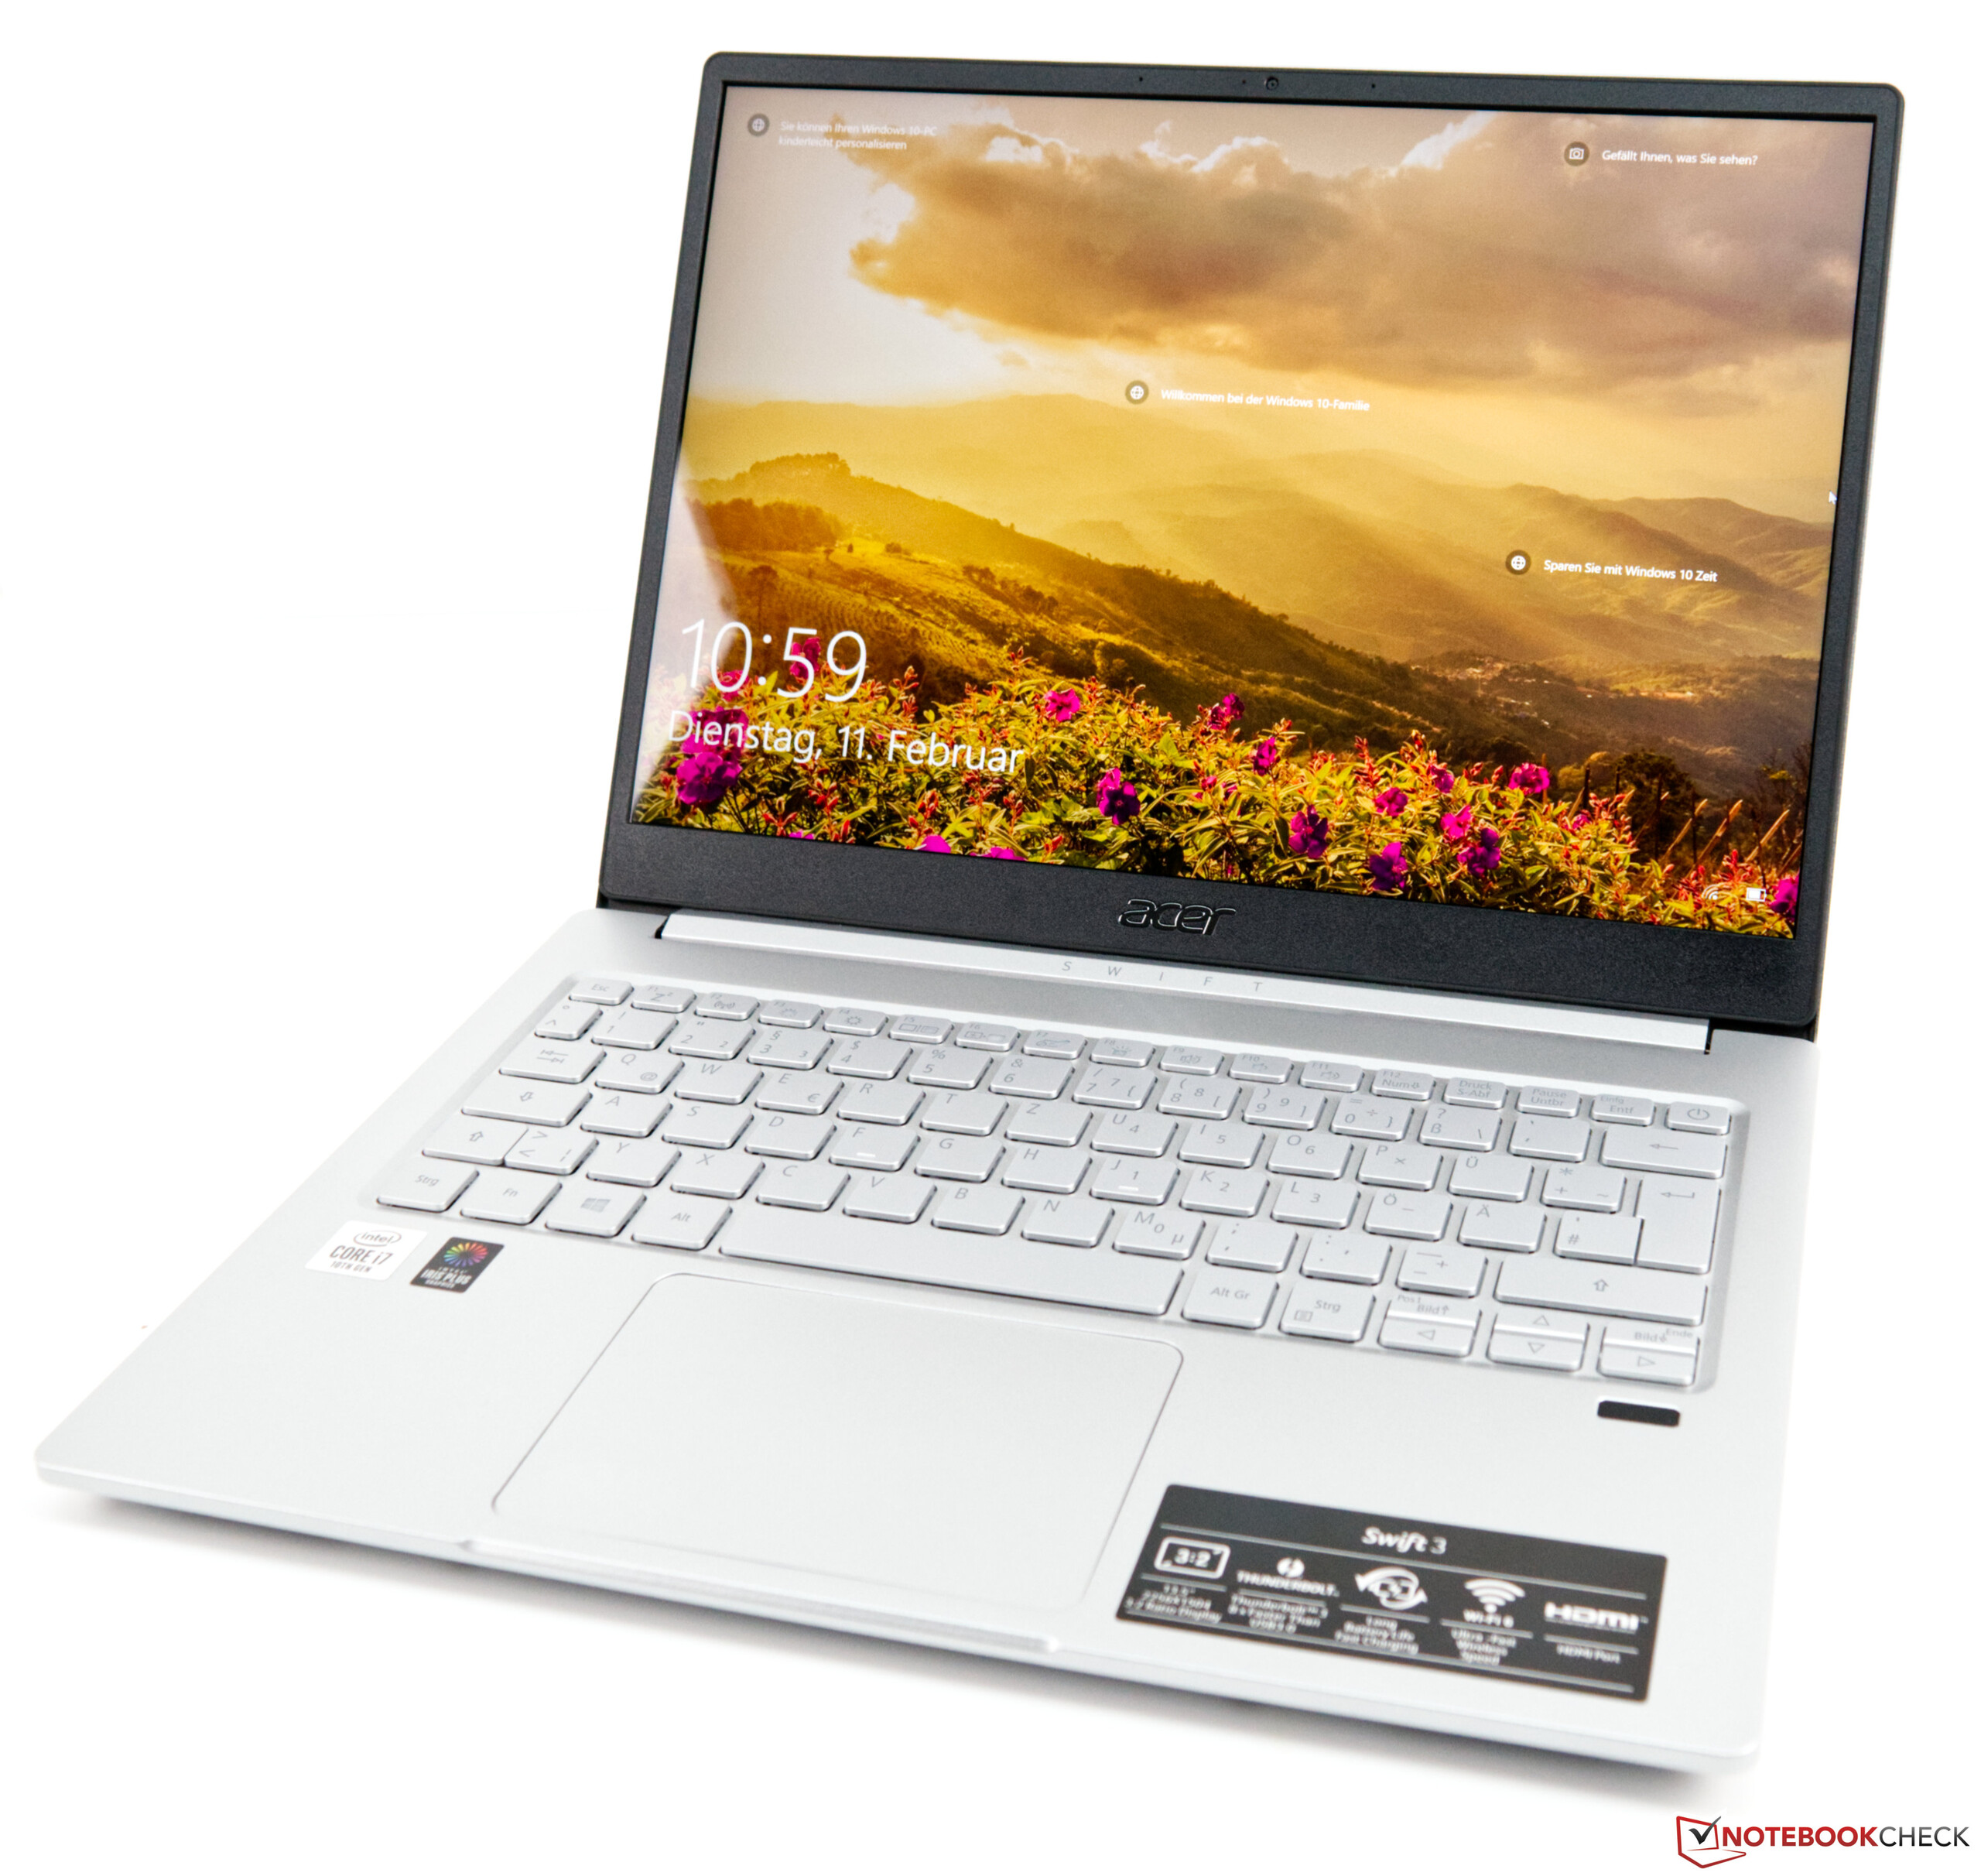
Acer Swift 3 SF313 laptop review: Also a good subnotebook with i5

With a list price of just under 900 Euros (~$1,016), the Acer Swift 3 SF313 with the Intel Core i5-1035G4 is 400 Euros (~$452) cheaper than the Acer Swift 3 SF313 with a full configuration. In return, buyers get a smaller memory configuration with 8 GB of RAM and a 512 GB SSD, but the 13.5-inch screen in 3:2 format is also on board. Since it could already show its strengths in an earlier review and the Swift 3 SF313's design has also remained the same, we'll concentrate below on the hardware's performance.
For this purpose, we not only compare the i5 variant of the SF313 with the full configuration but also with the competing devices listed below. You can also add more laptops from our database under each section.
Rating | Date | Model | Weight | Height | Size | Resolution | Price |
|---|---|---|---|---|---|---|---|
| 85.9 % v7 (old) | 06 / 2020 | Acer Swift 3 SF313-52-52AS i5-1035G4, Iris Plus Graphics G4 (Ice Lake 48 EU) | 1.2 kg | 16.6 mm | 13.50" | 2256x1504 | |
| 87 % v7 (old) | 02 / 2020 | Acer Swift 3 SF313-52-71Y7 i7-1065G7, Iris Plus Graphics G7 (Ice Lake 64 EU) | 1.2 kg | 16.6 mm | 13.50" | 2256x1504 | |
| 84.5 % v7 (old) | 05 / 2020 | HP ProBook 430 G7-8VU53EA i7-10510U, UHD Graphics 620 | 1.4 kg | 18 mm | 13.30" | 1920x1080 | |
| 84.9 % v7 (old) | 12 / 2019 | Lenovo IdeaPad S540-13API R5 3550H, Vega 8 | 1.3 kg | 16 mm | 13.30" | 2560x1600 | |
| 84 % v7 (old) | 02 / 2020 | Microsoft Surface Laptop 3 13 Core i5-1035G7 i5-1035G7, Iris Plus Graphics G7 (Ice Lake 64 EU) | 1.3 kg | 14.5 mm | 13.50" | 2256x1504 |
Case and connectivity - Faster WLAN in the Acer Swift 3 SF313
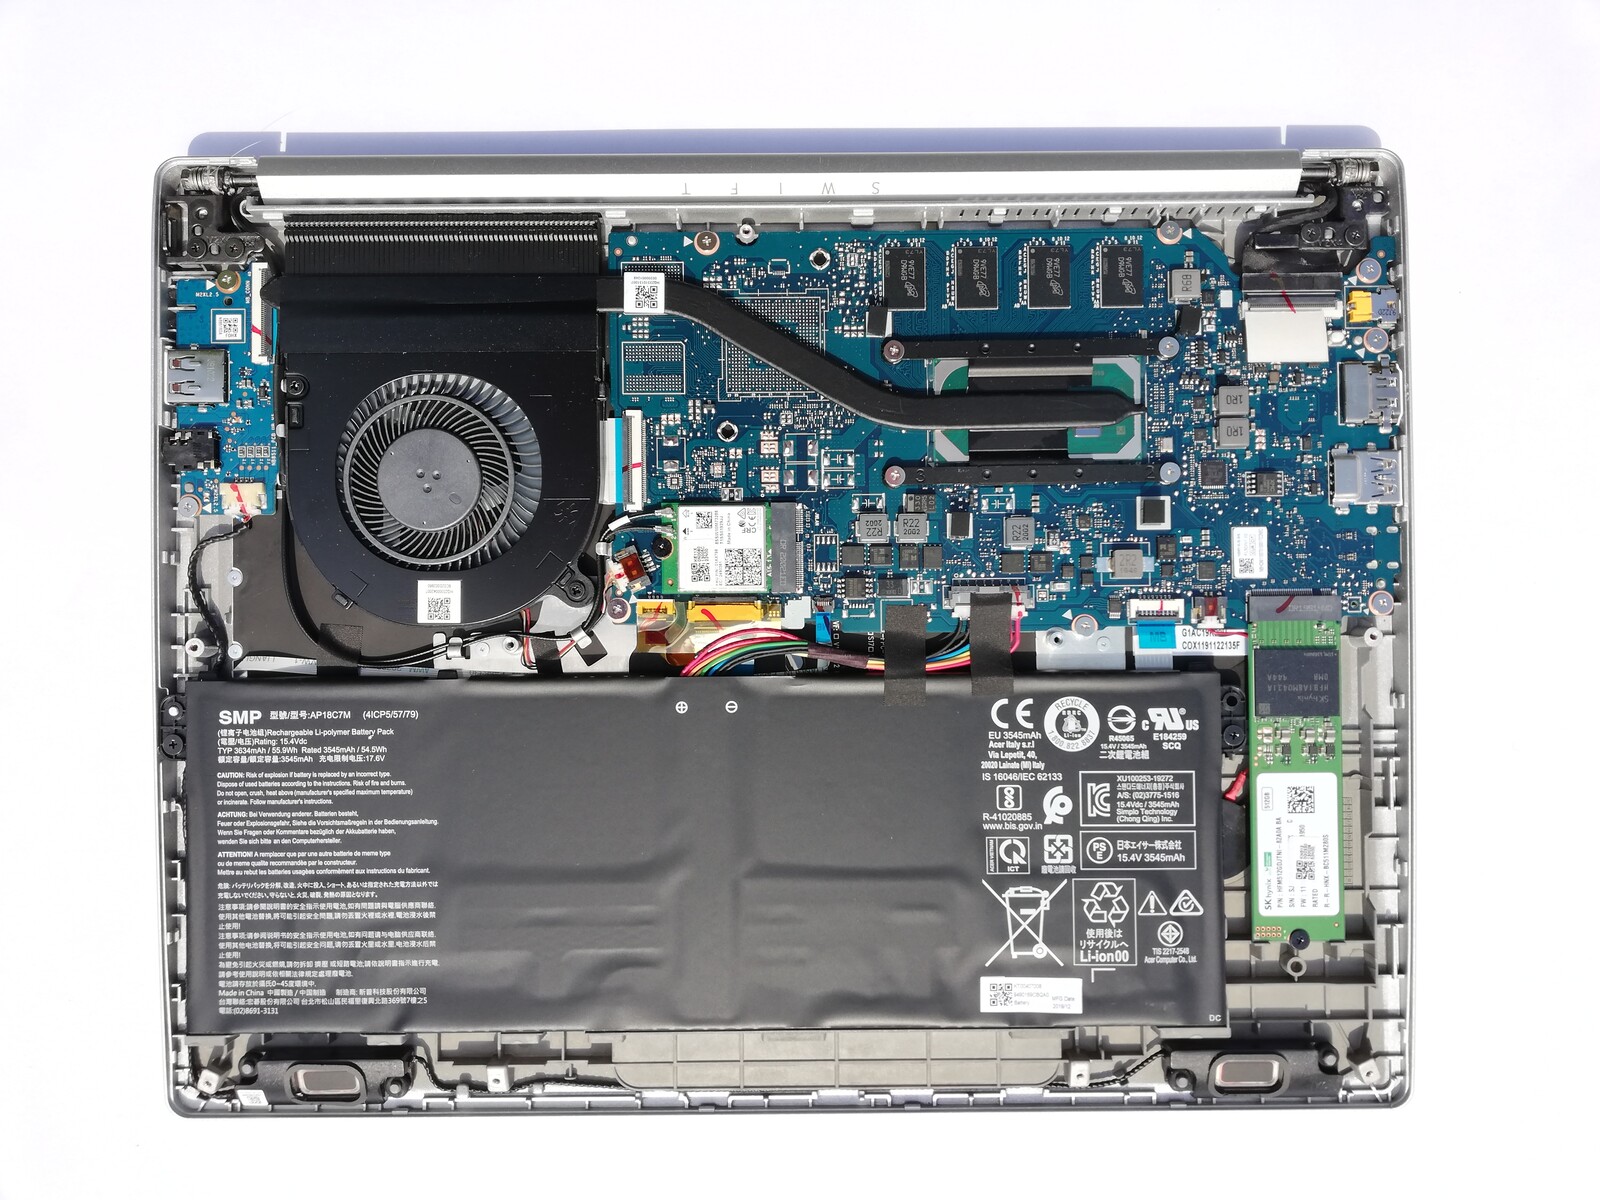
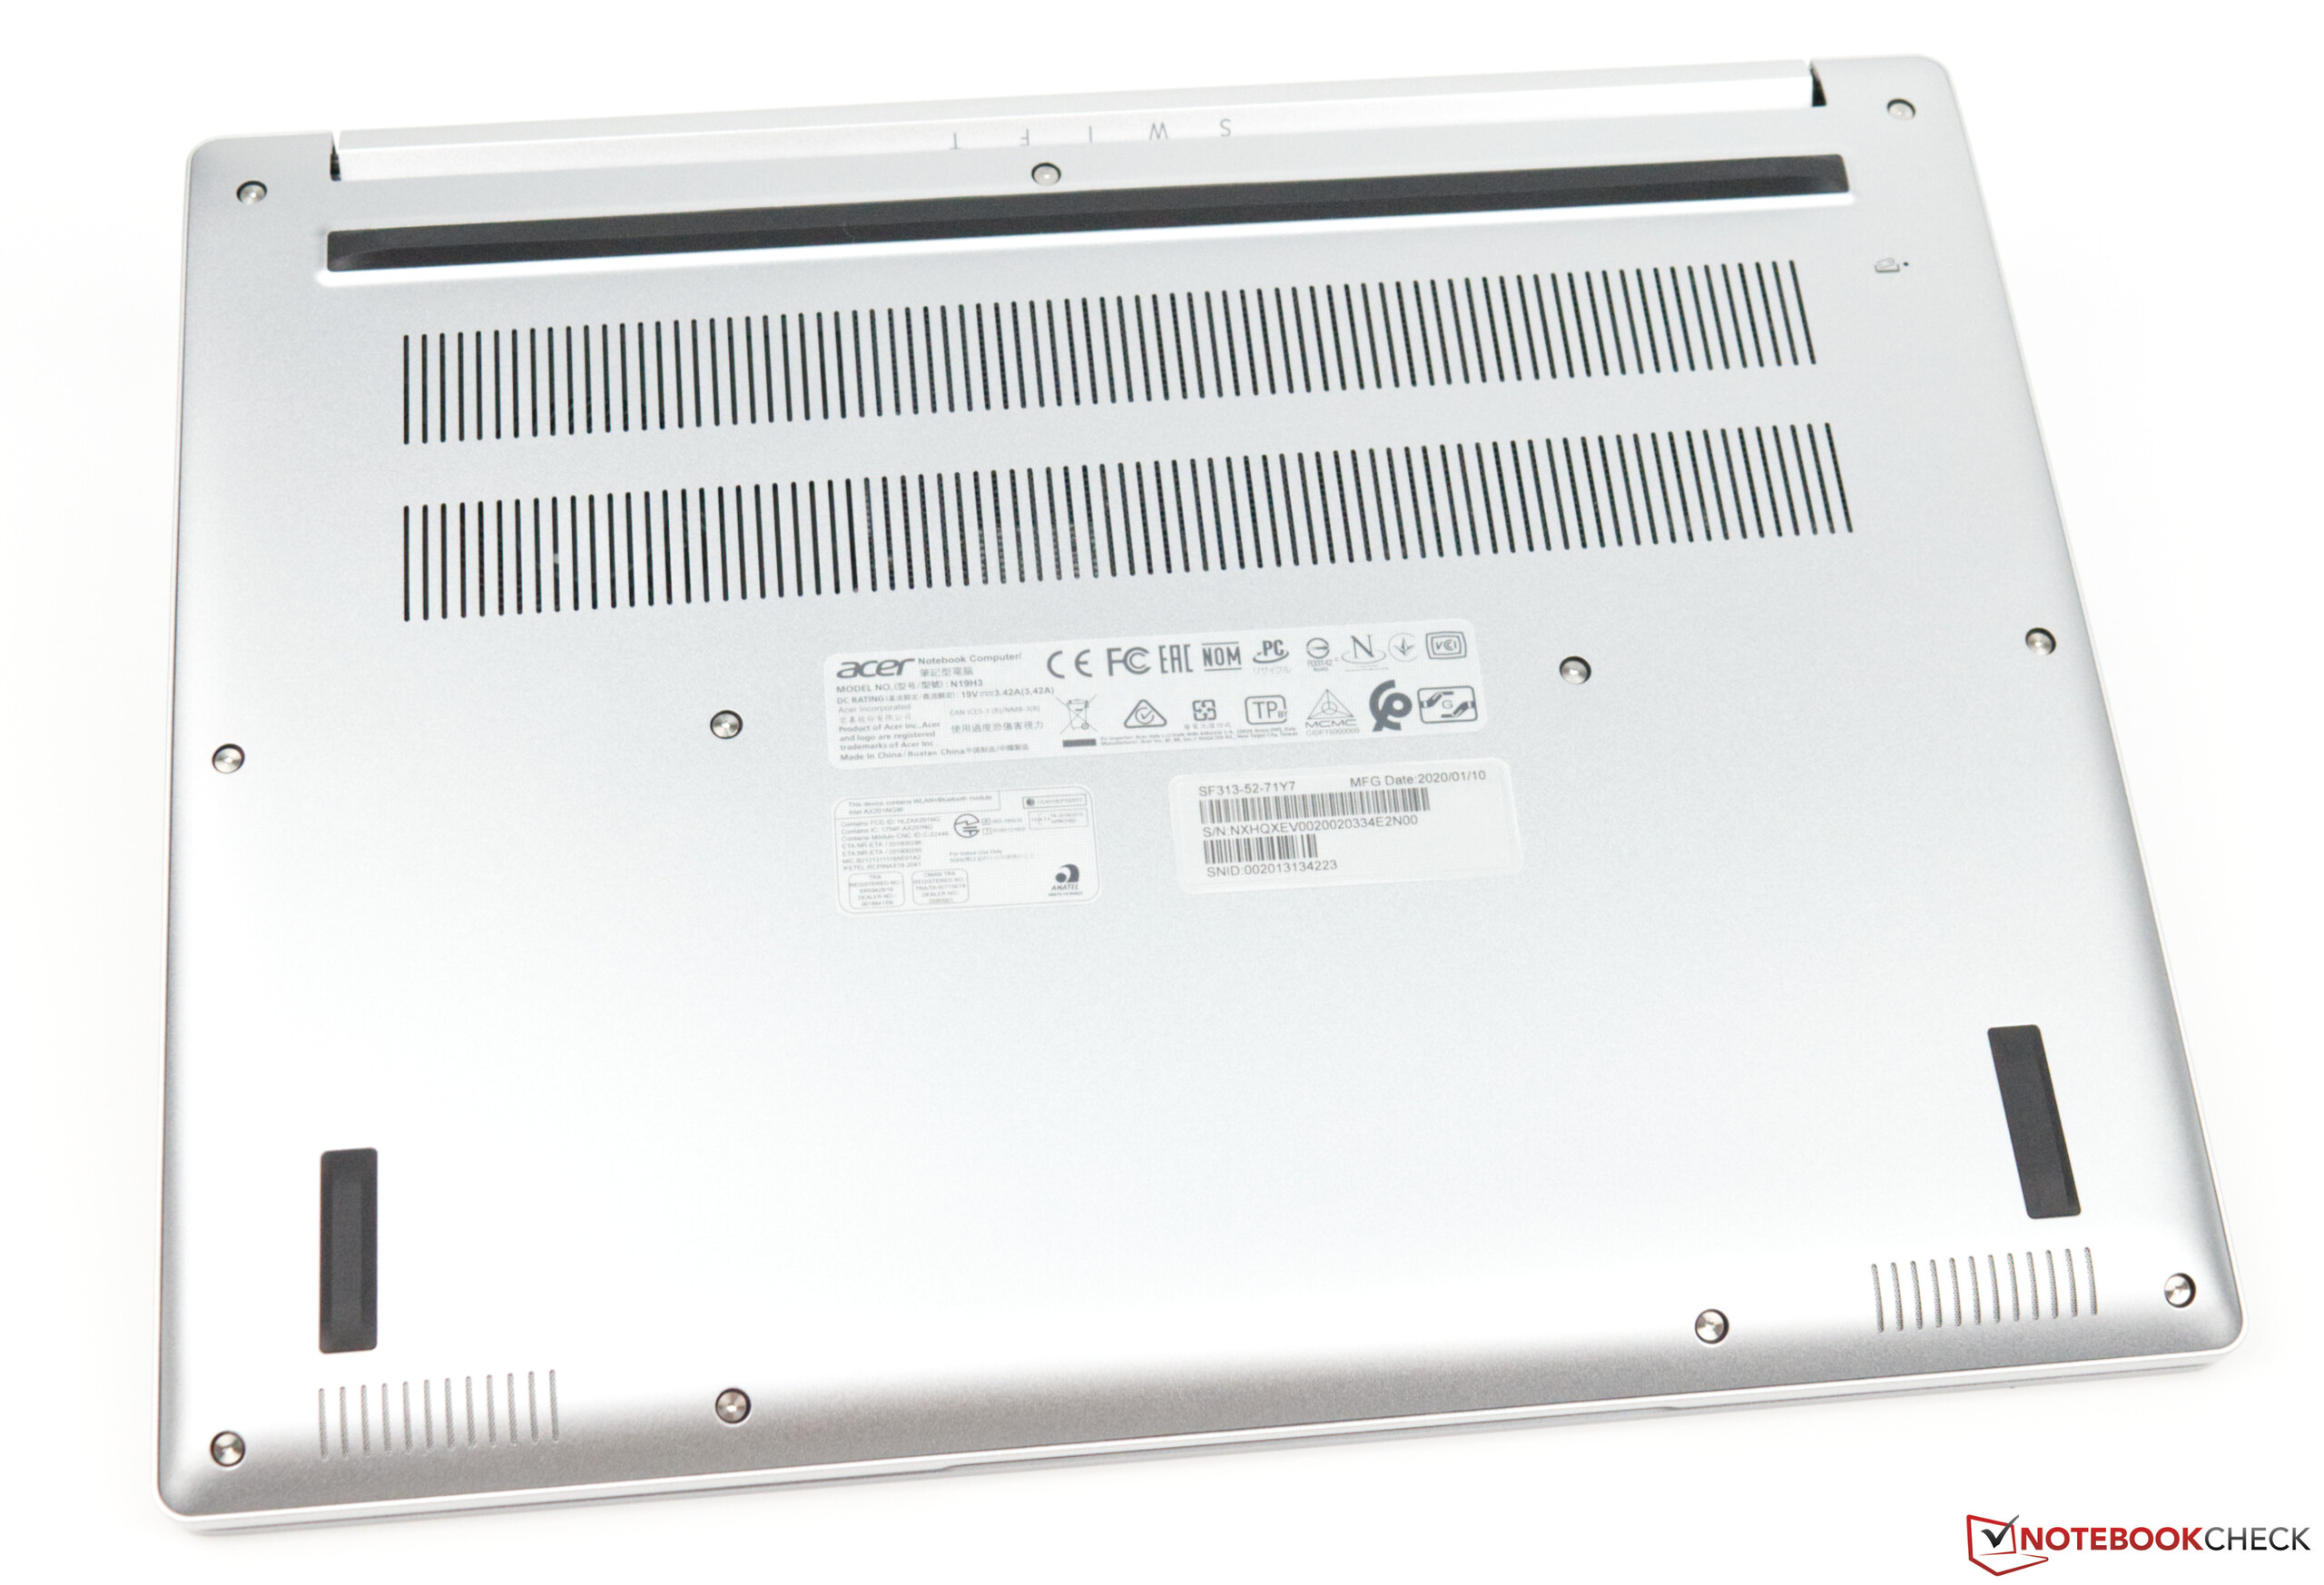
For a detailed description of the external impression, we point you to the review of the identically built Acer Swift 3 SF313-52-71Y7. The base plate can also be removed in the Core i5 variant and allows access to the mass storage device. In return, the RAM is soldered so that there's no possibility for expansion here.
In our WLAN test with the Netgear Nighthawk AX12 reference router, the significantly higher speed of our test model in comparison to the previously tested variant is noticeable. Although the same WLAN adapter is built in, the SF313-52-52AS scores significantly better with an average of 870 Mb/s for receiving data and 696 Mb/s for sending data. In a direct comparison with our chosen competitors, the result is enough for a place in the midfield.
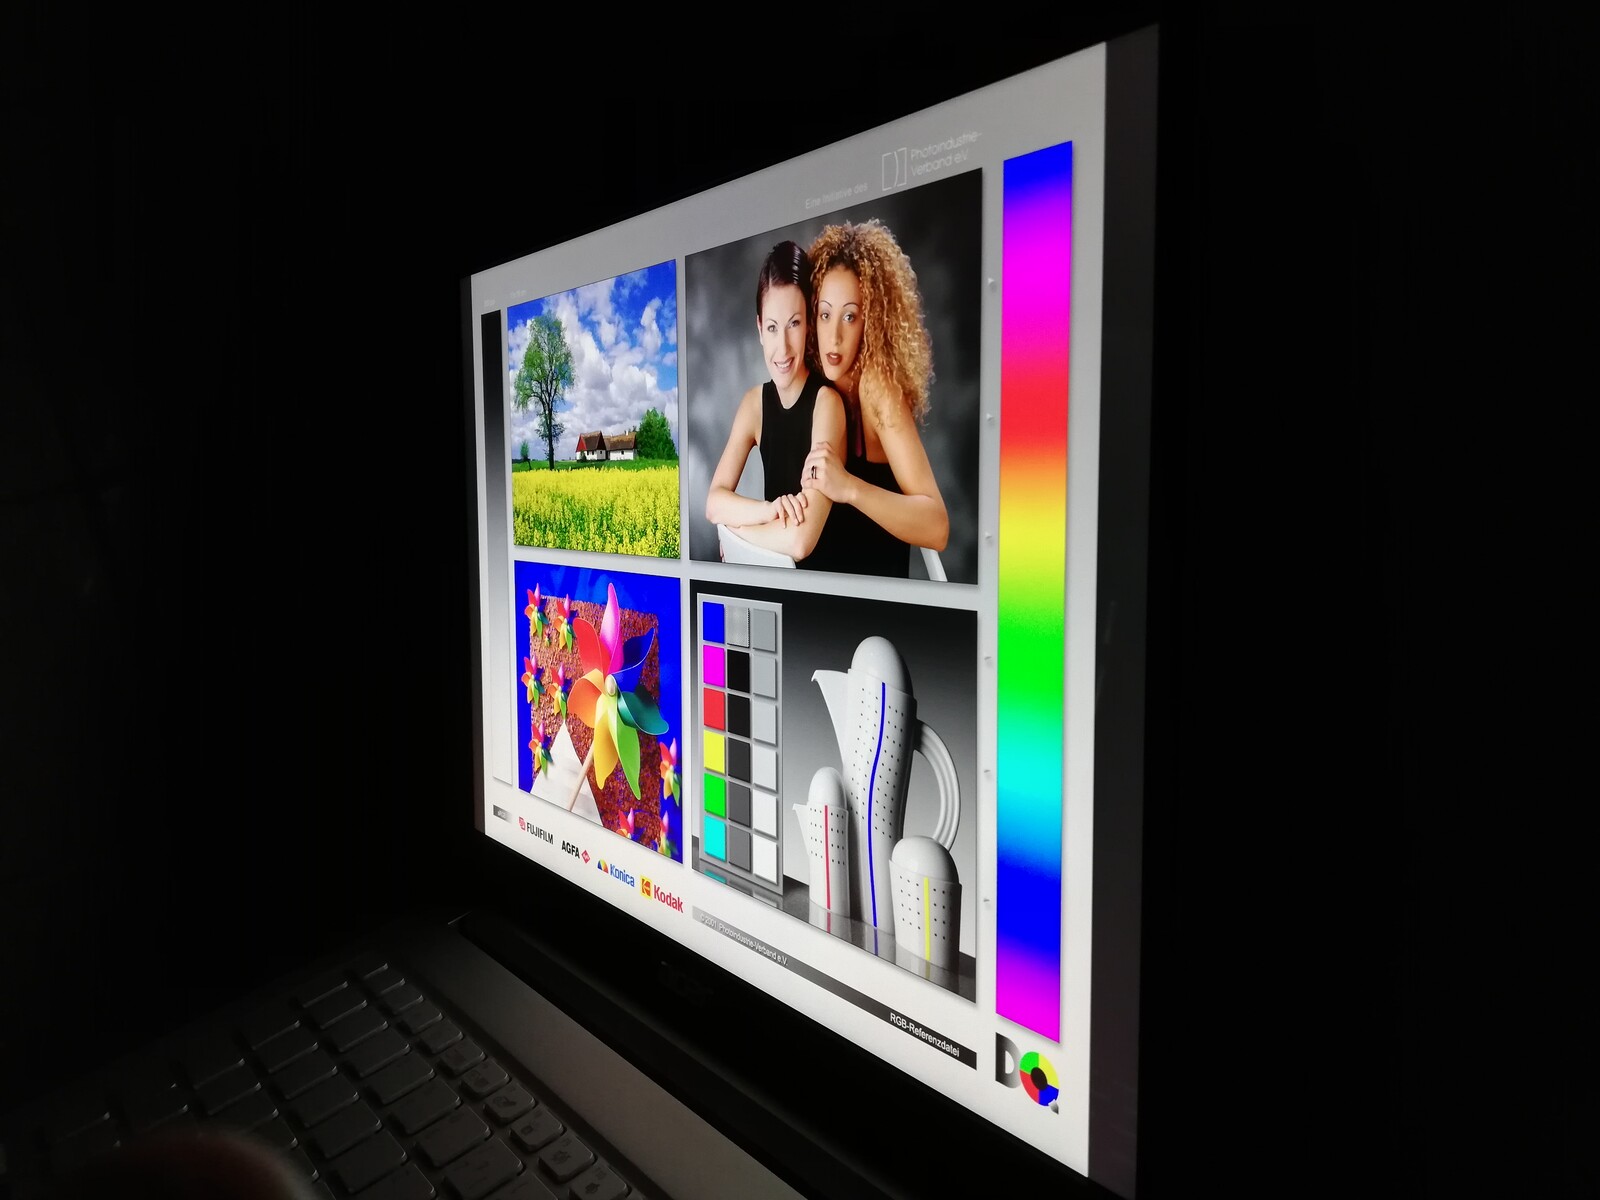
The webcam's performance is as moderate as we've seen in the multitude of other laptops with cameras that only have a 0.9 MP resolution. The colors of the ColorChecker Passport are reproduced much brighter than they should be, and the test chart is only just clearly recognizable under very good lighting conditions.
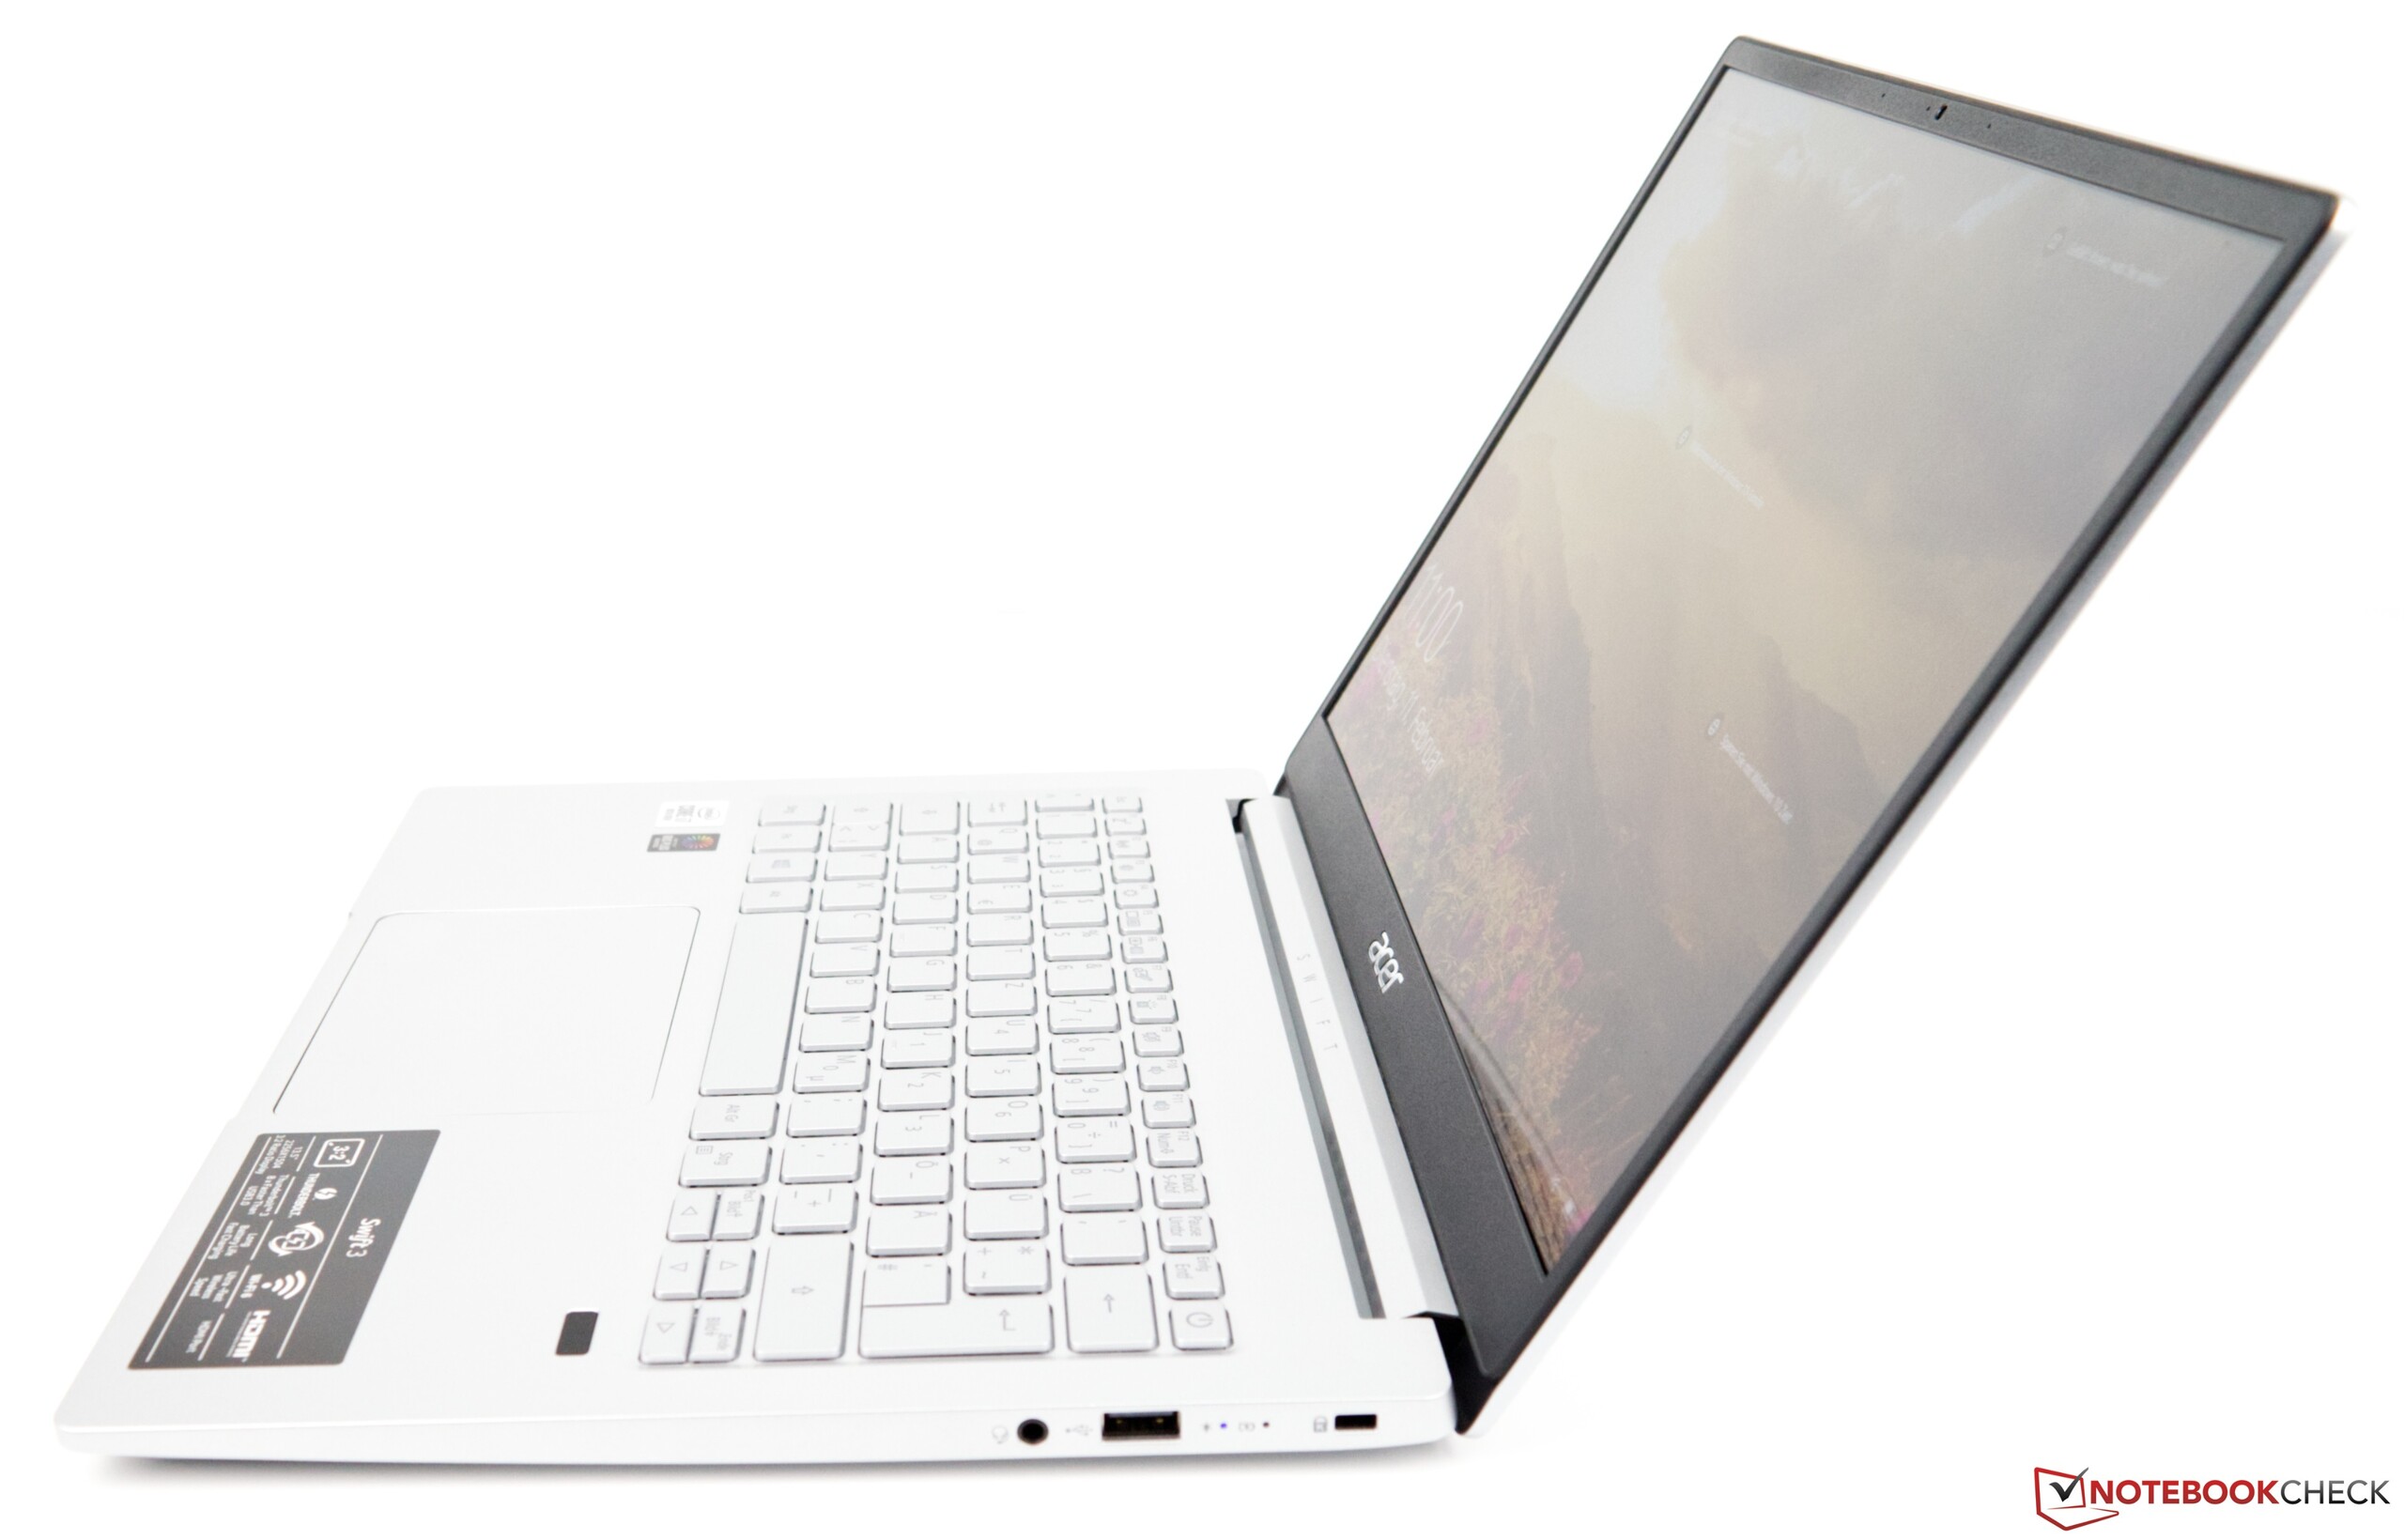
Port configuration
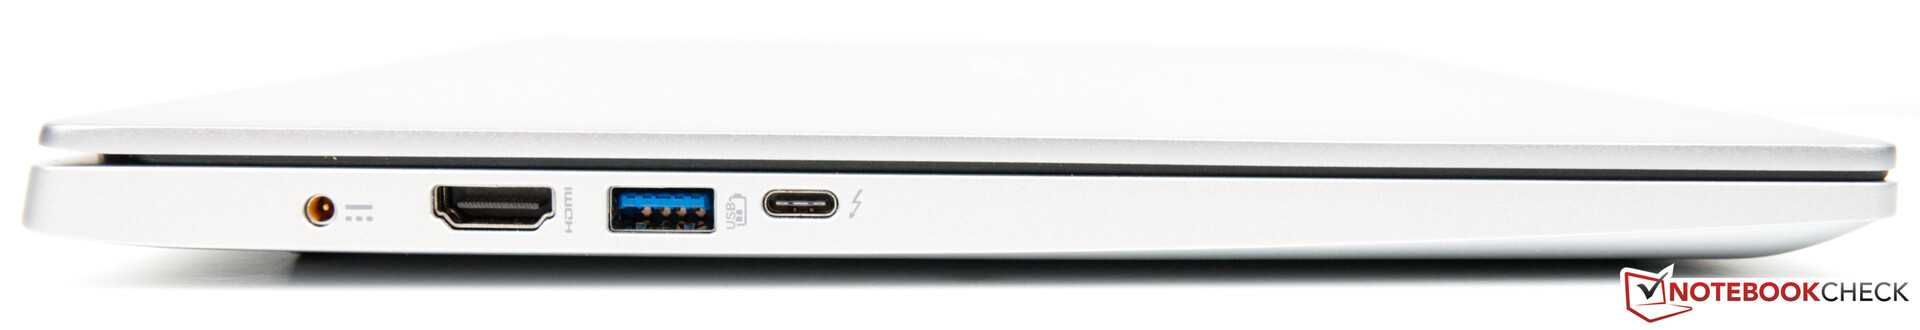
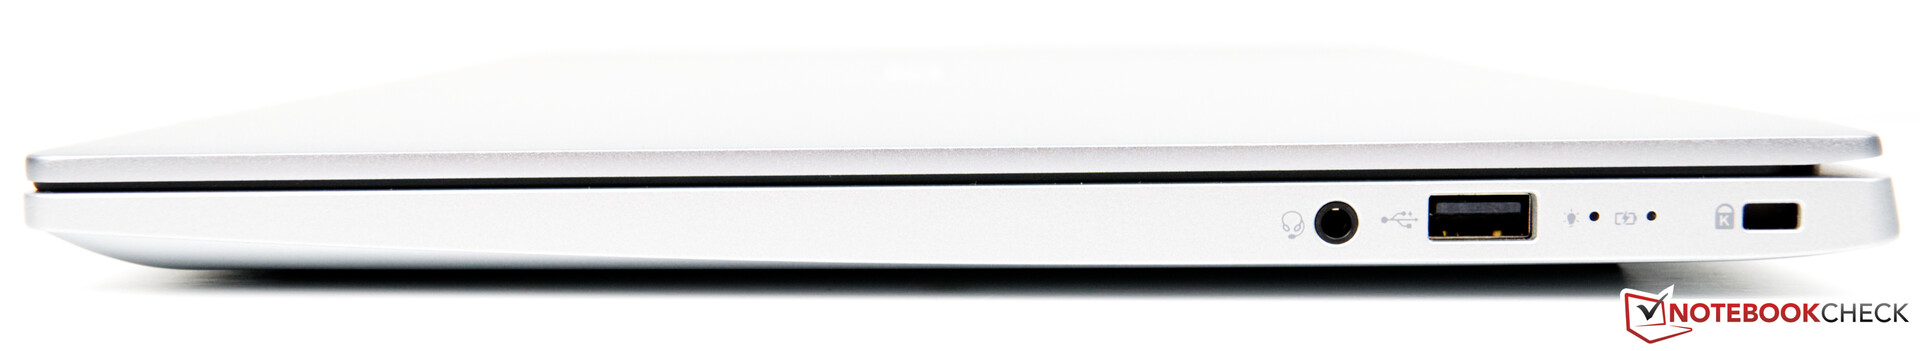

, i5-1035G4, SK Hynix BC501 HFM512GDJTNG")
, i5-1035G4, SK Hynix BC501 HFM512GDJTNG")
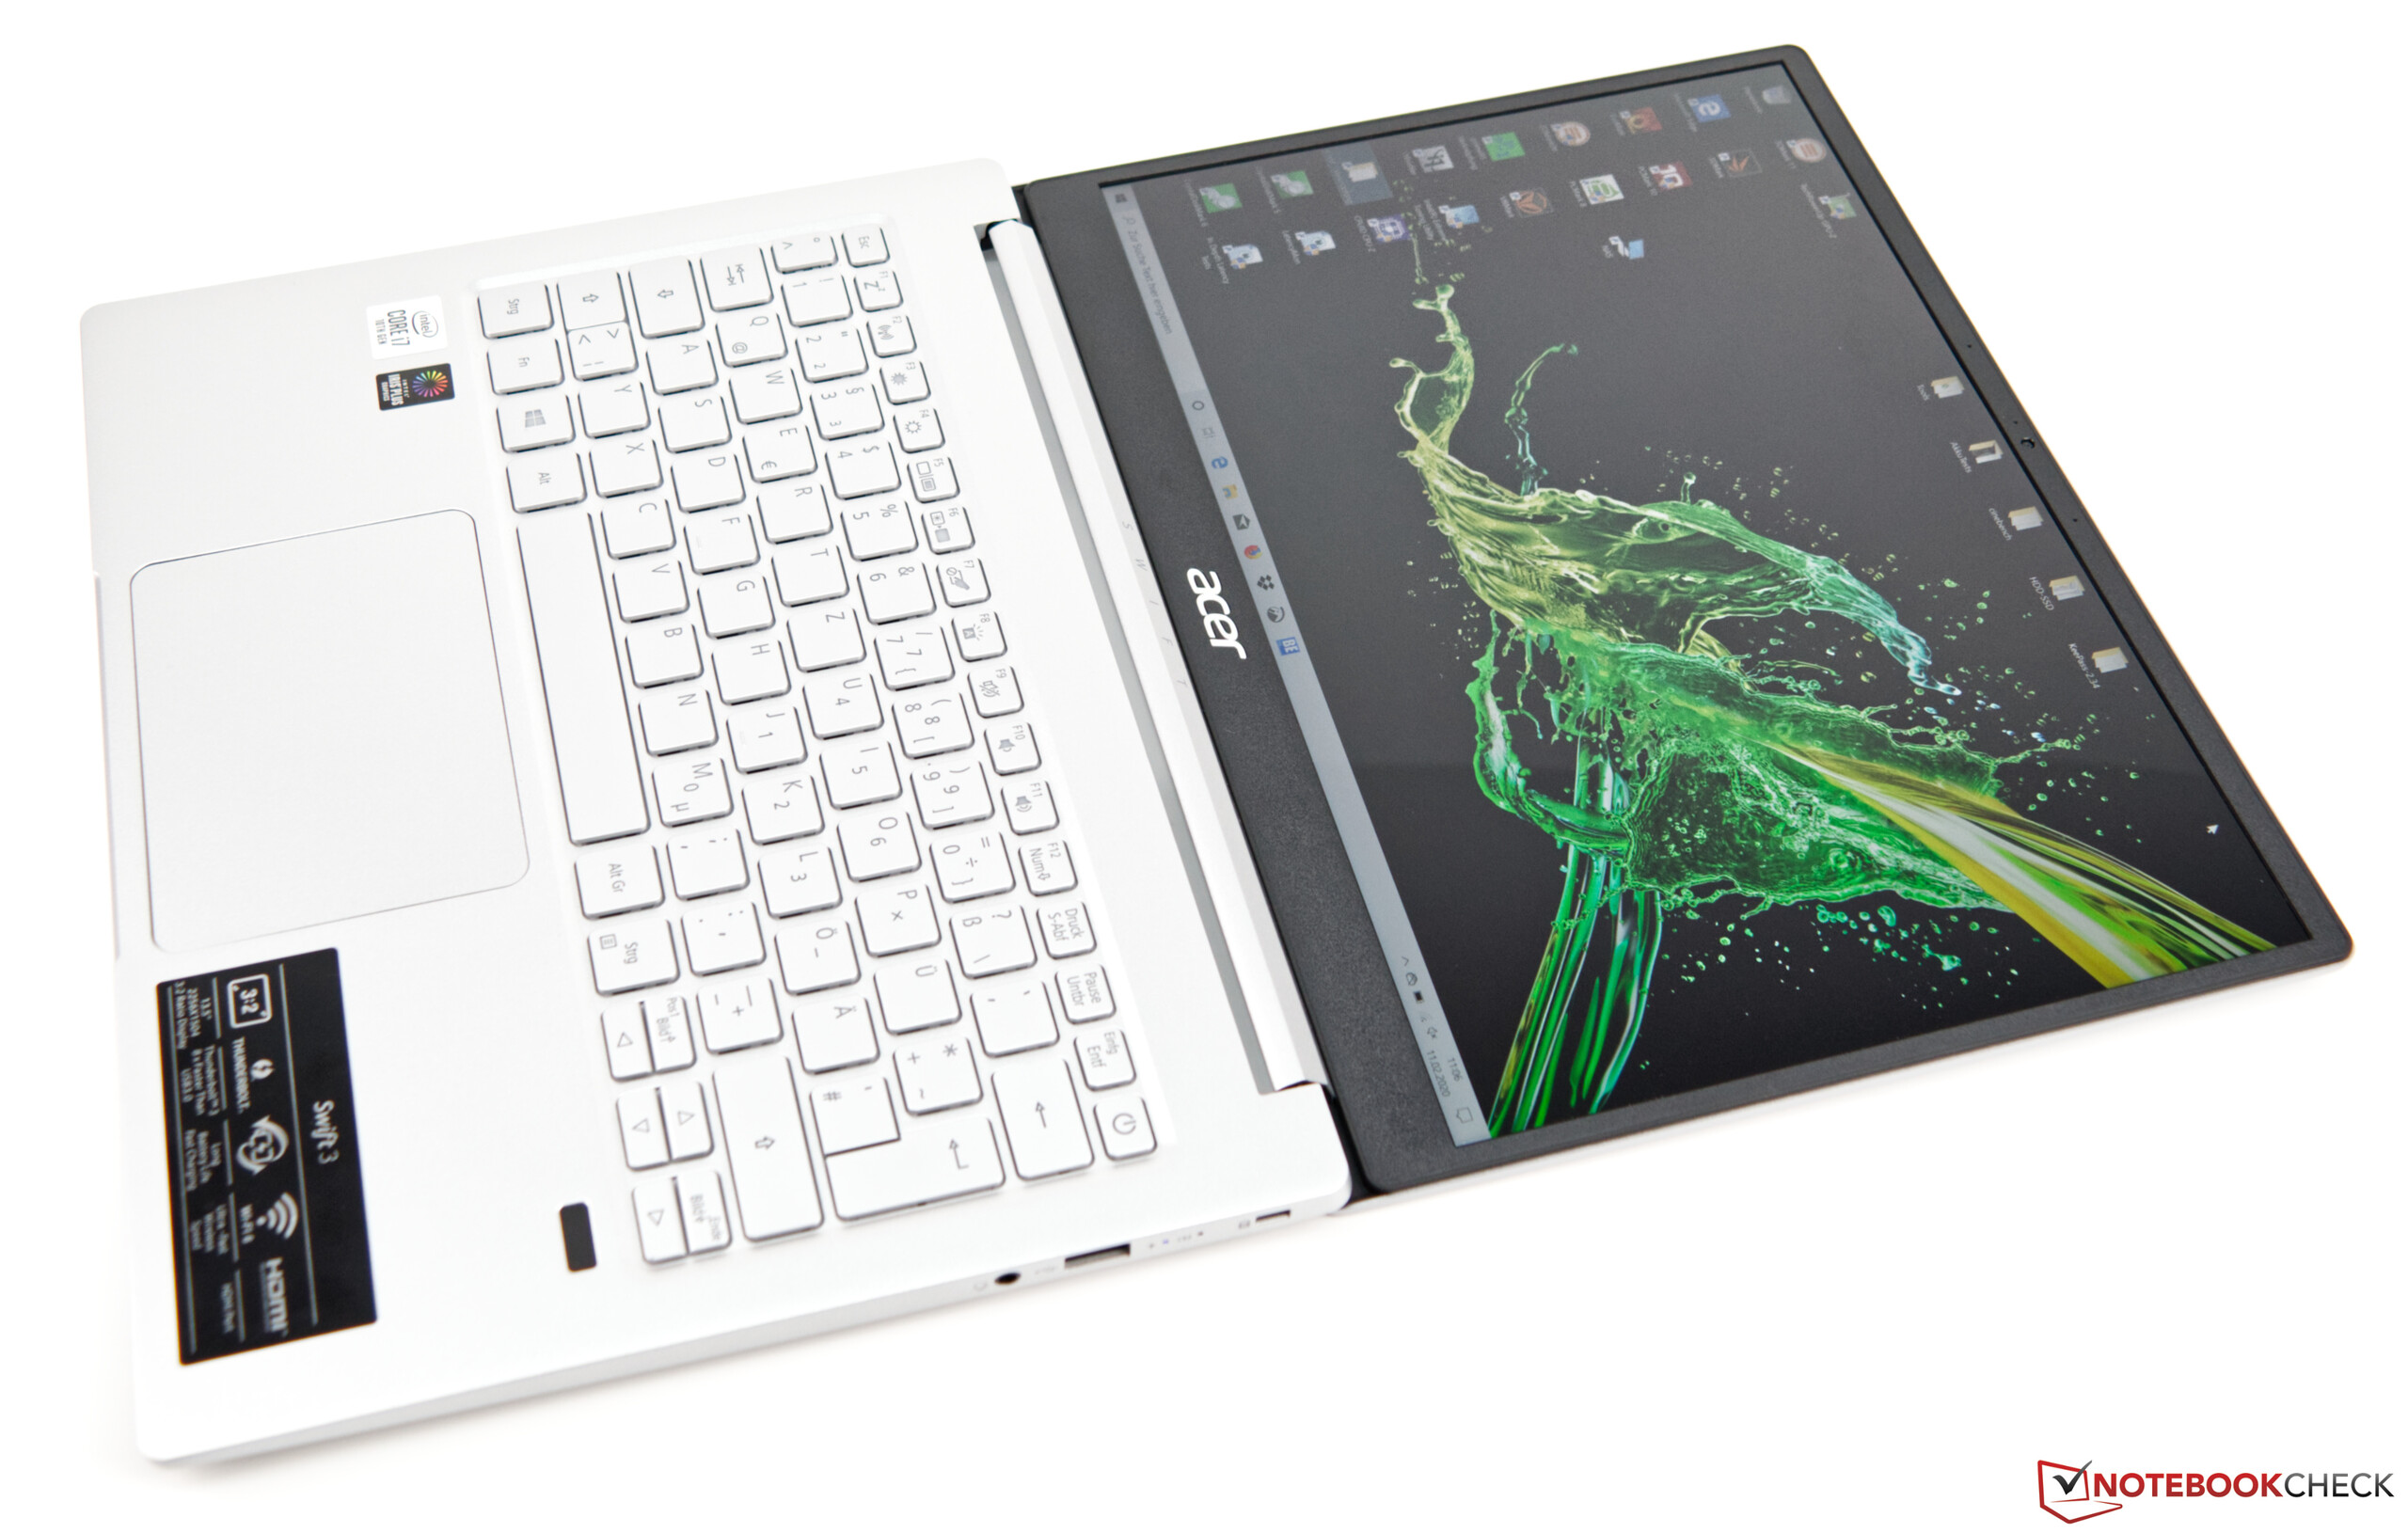
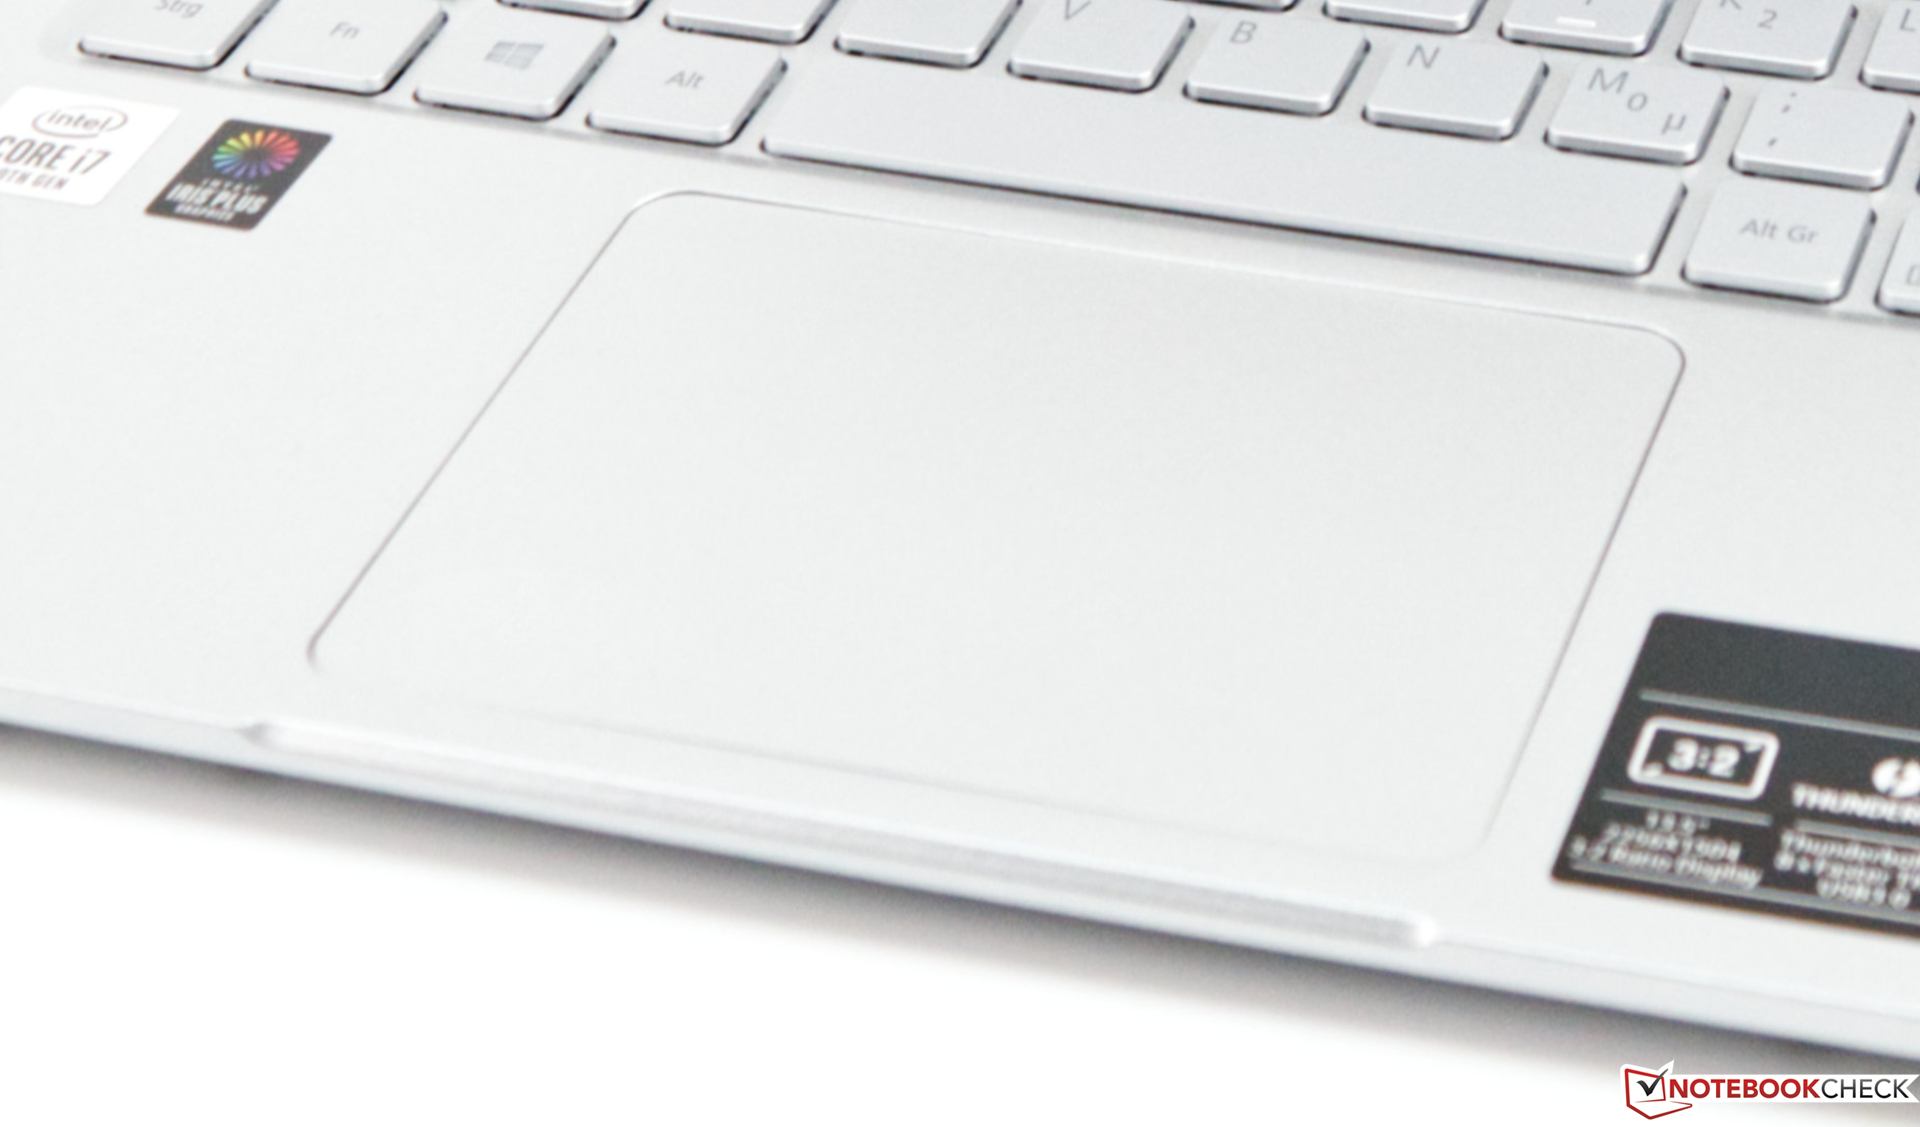
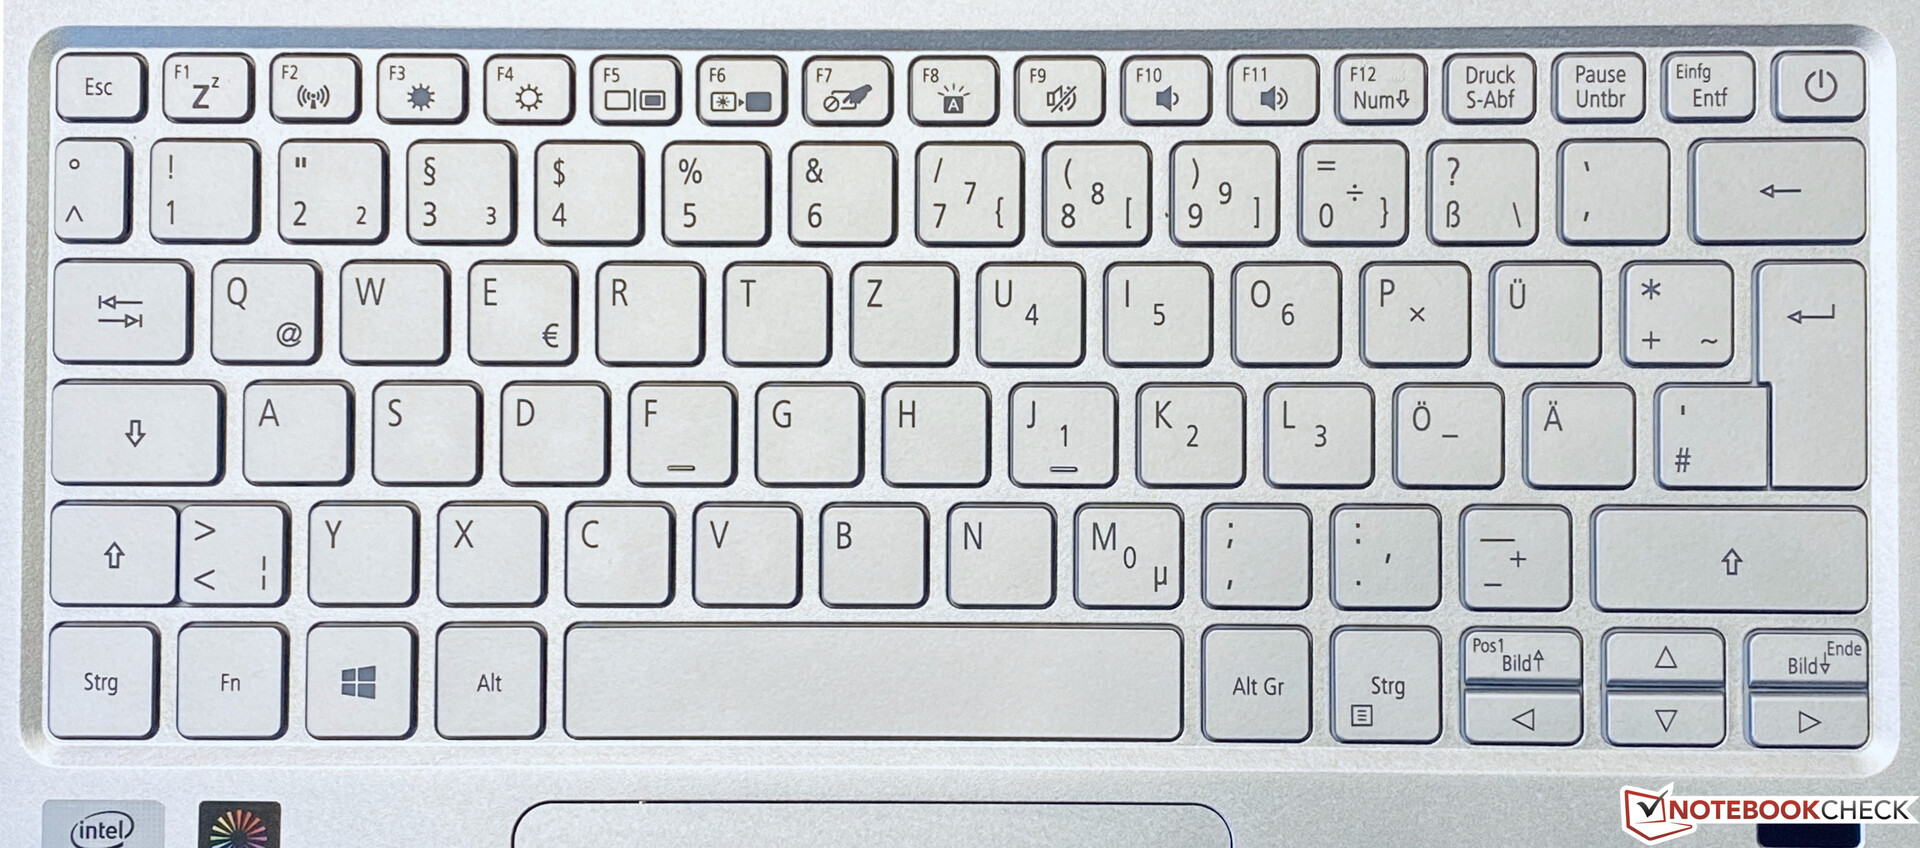
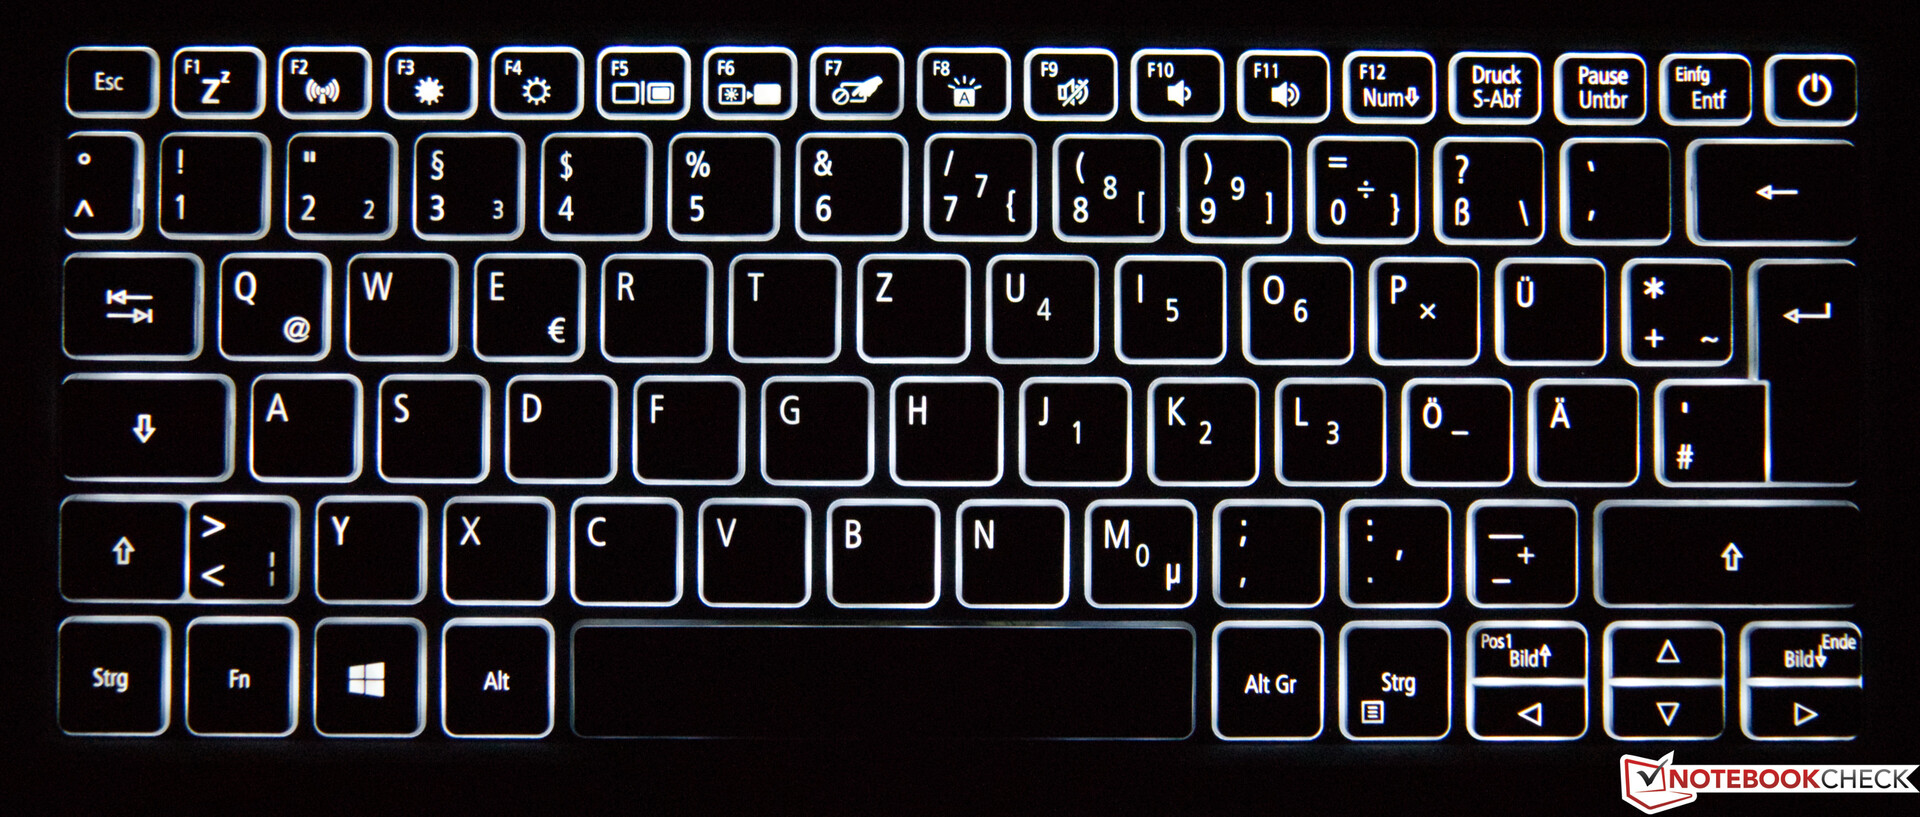
Input devices - 13-inch laptop with fingerprint scanner
A detailed description of the input devices can also be found in the detailed review of the Acer Swift 3 SF313-52-71Y7.
Display - Bright display in 3:2 format

The screen of the Acer Swift 3 SF313 consists of a 13.5-inch IPS panel in 3:2 format and offers a resolution of 2256x1504 pixels. The brightness is very good at an average of 432 cd/m², and the illumination is on a medium level at 88%.
Our measurements also show that the Swift 3 uses PWM starting from a brightness level of under 90%. The frequency is quite low at 192 Hz, which can lead to problems in the long run even for users with less-sensitive eyes.
| |||||||||||||||||||||||||
Brightness Distribution: 88 %
Center on Battery: 436 cd/m²
Contrast: 1425:1 (Black: 0.32 cd/m²)
ΔE ColorChecker Calman: 3.49 | ∀{0.5-29.43 Ø4.72}
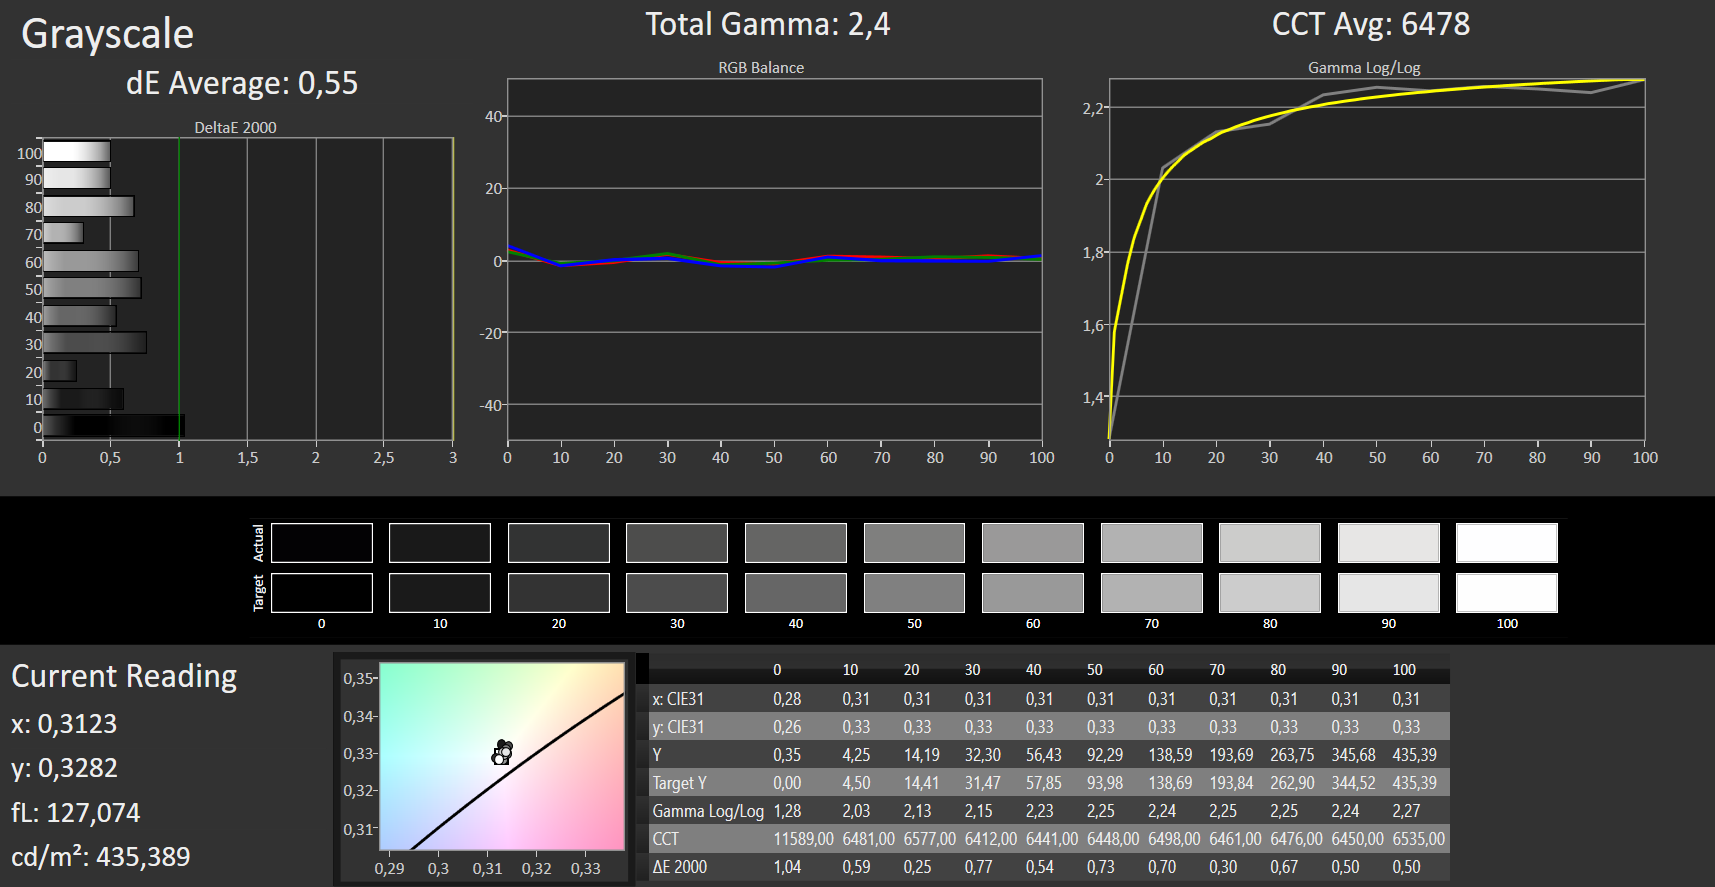
calibrated: 0.72
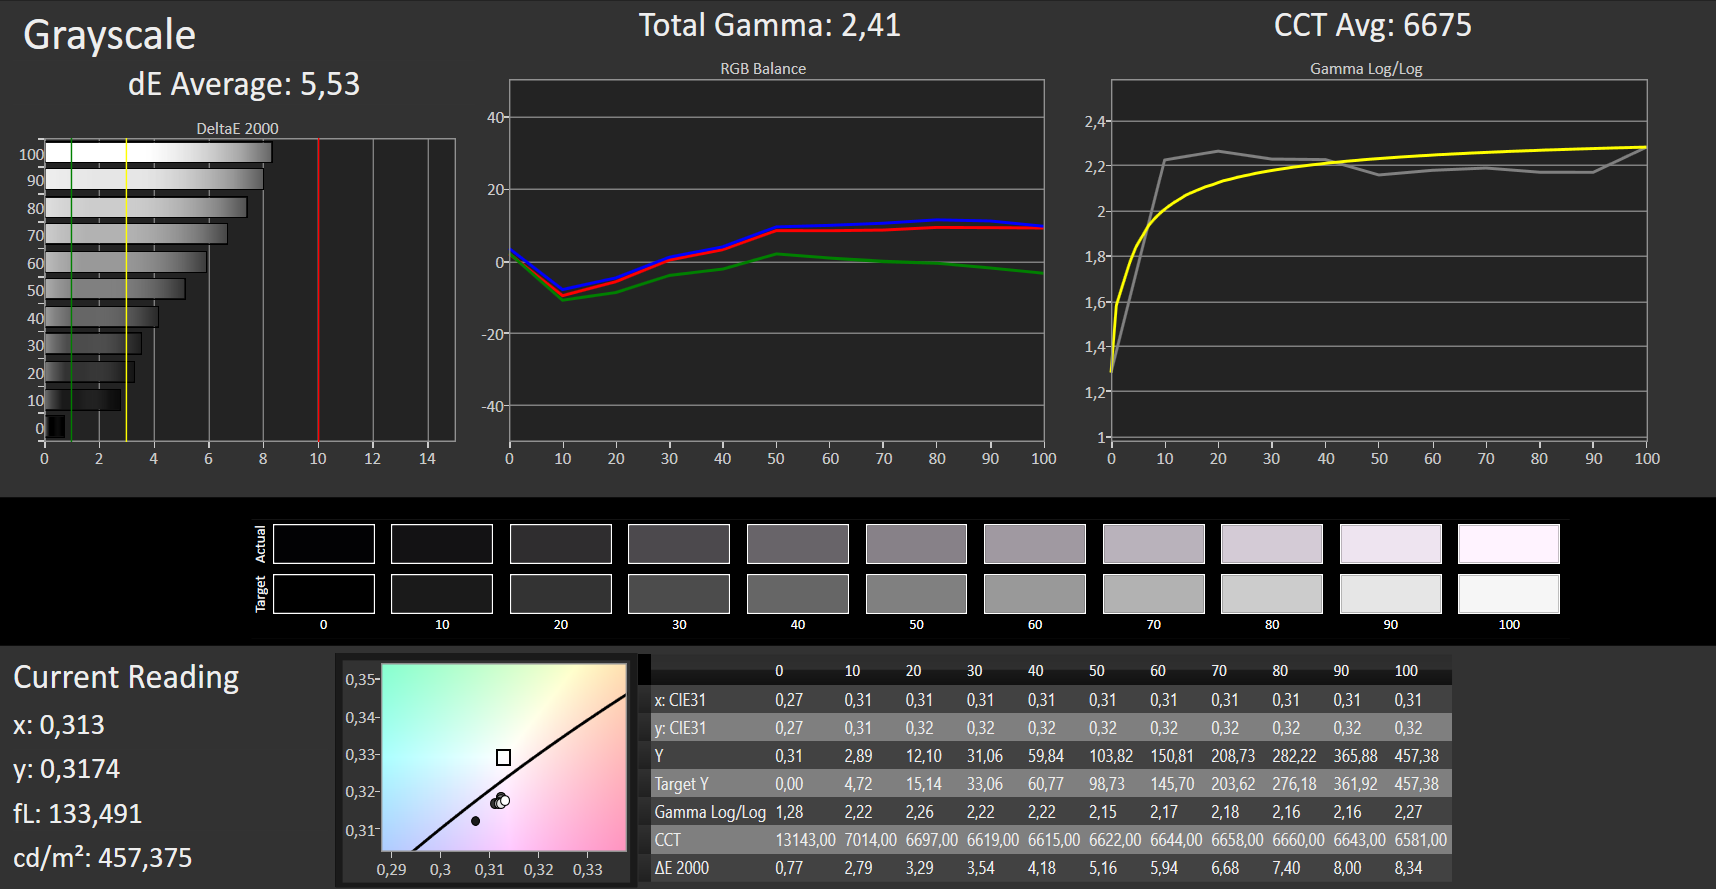
ΔE Greyscale Calman: 5.53 | ∀{0.09-98 Ø4.97}
100% sRGB (Argyll 1.6.3 3D)
65% AdobeRGB 1998 (Argyll 1.6.3 3D)
71.3% AdobeRGB 1998 (Argyll 3D)
99.8% sRGB (Argyll 3D)
70.3% Display P3 (Argyll 3D)
Gamma: 2.41
CCT: 6675 K
| Acer Swift 3 SF313-52-52AS BOE08BC, IPS, 2256x1504, 13.5" | Acer Swift 3 SF313-52-71Y7 BOE, NE135FBM-N41, IPS, 2256x1504, 13.5" | HP ProBook 430 G7-8VU53EA BOE08A6, IPS LED, 1920x1080, 13.3" | Lenovo IdeaPad S540-13API CSOT T3 MND307DA1-2, IPS, 2560x1600, 13.3" | Microsoft Surface Laptop 3 13 Core i5-1035G7 Sharp LQ135P1JX51, IPS, 2256x1504, 13.5" | |
|---|---|---|---|---|---|
| Display | 0% | -38% | 2% | -4% | |
| Display P3 Coverage (%) | 70.3 | 70.1 0% | 42.79 -39% | 73.4 4% | 65.7 -7% |
| sRGB Coverage (%) | 99.8 | 99.8 0% | 62.8 -37% | 98.6 -1% | 98.6 -1% |
| AdobeRGB 1998 Coverage (%) | 71.3 | 71.2 0% | 44.21 -38% | 72.6 2% | 67.8 -5% |
| Response Times | -5% | -1% | 5% | -26% | |
| Response Time Grey 50% / Grey 80% * (ms) | 50 ? | 55 ? -10% | 48.8 ? 2% | 45.6 ? 9% | 59.2 ? -18% |
| Response Time Black / White * (ms) | 31 ? | 31 ? -0% | 32 ? -3% | 30.8 ? 1% | 41.6 ? -34% |
| PWM Frequency (Hz) | 192 ? | 208 ? | 1000 ? | 21740 ? | |
| Screen | -15% | -78% | -5% | 12% | |
| Brightness middle (cd/m²) | 456 | 474 4% | 300 -34% | 321 -30% | 403.4 -12% |
| Brightness (cd/m²) | 432 | 426 -1% | 285 -34% | 314 -27% | 397 -8% |
| Brightness Distribution (%) | 88 | 82 -7% | 90 2% | 94 7% | 89 1% |
| Black Level * (cd/m²) | 0.32 | 0.29 9% | 0.25 22% | 0.19 41% | 0.34 -6% |
| Contrast (:1) | 1425 | 1634 15% | 1200 -16% | 1689 19% | 1186 -17% |
| Colorchecker dE 2000 * | 3.49 | 2.38 32% | 5.9 -69% | 3.3 5% | 0.94 73% |
| Colorchecker dE 2000 max. * | 8.4 | 5.88 30% | 20 -138% | 6 29% | 2.92 65% |
| Colorchecker dE 2000 calibrated * | 0.72 | 2.69 -274% | 4.6 -539% | 1.7 -136% | 0.99 -38% |
| Greyscale dE 2000 * | 5.53 | 3.75 32% | 4 28% | 3.5 37% | 0.9 84% |
| Gamma | 2.41 91% | 2.37 93% | 2.23 99% | 2.08 106% | 2.13 103% |
| CCT | 6675 97% | 6466 101% | 7154 91% | 7245 90% | 6620 98% |
| Color Space (Percent of AdobeRGB 1998) (%) | 65 | 65 0% | 40.4 -38% | 64.5 -1% | 62.3 -4% |
| Color Space (Percent of sRGB) (%) | 100 | 100 0% | 62.4 -38% | 98.4 -2% | 98.7 -1% |
| Total Average (Program / Settings) | -7% /
-11% | -39% /
-61% | 1% /
-3% | -6% /
5% |
* ... smaller is better
Display Response Times
| ↔ Response Time Black to White | ||
|---|---|---|
| 31 ms ... rise ↗ and fall ↘ combined | ↗ 18 ms rise | 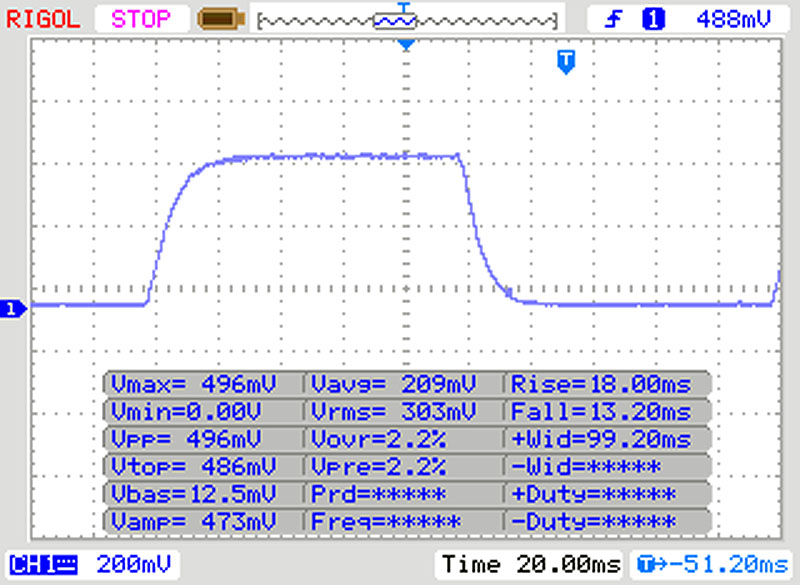 |
| ↘ 13 ms fall | ||
| The screen shows slow response rates in our tests and will be unsatisfactory for gamers. In comparison, all tested devices range from 0.1 (minimum) to 240 (maximum) ms. » 84 % of all devices are better. This means that the measured response time is worse than the average of all tested devices (19.8 ms). | ||
| ↔ Response Time 50% Grey to 80% Grey | ||
| 50 ms ... rise ↗ and fall ↘ combined | ↗ 24 ms rise | 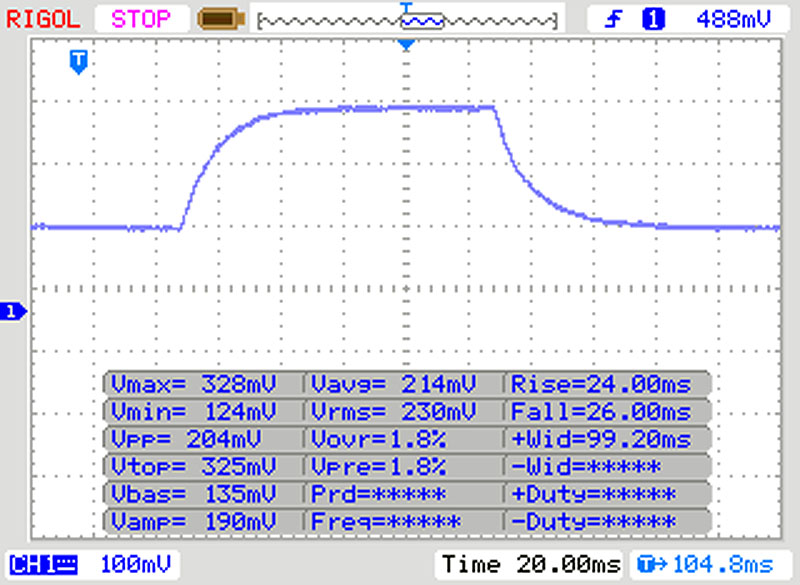 |
| ↘ 26 ms fall | ||
| The screen shows slow response rates in our tests and will be unsatisfactory for gamers. In comparison, all tested devices range from 0.165 (minimum) to 636 (maximum) ms. » 86 % of all devices are better. This means that the measured response time is worse than the average of all tested devices (31 ms). | ||
Screen Flickering / PWM (Pulse-Width Modulation)
| Screen flickering / PWM detected | 192 Hz | ≤ 90 % brightness setting | 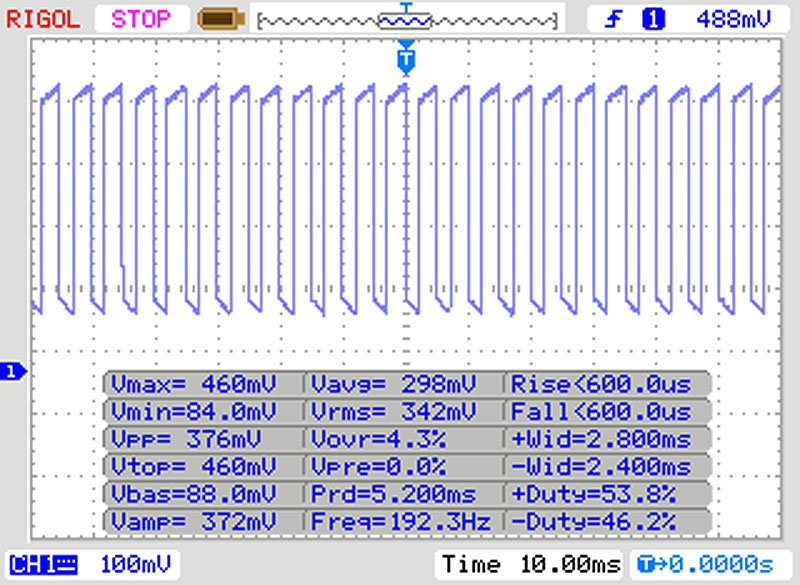 |
The display backlight flickers at 192 Hz (worst case, e.g., utilizing PWM) Flickering detected at a brightness setting of 90 % and below. There should be no flickering or PWM above this brightness setting. The frequency of 192 Hz is relatively low, so sensitive users will likely notice flickering and experience eyestrain at the stated brightness setting and below. In comparison: 52 % of all tested devices do not use PWM to dim the display. If PWM was detected, an average of 7781 (minimum: 5 - maximum: 343500) Hz was measured. | |||
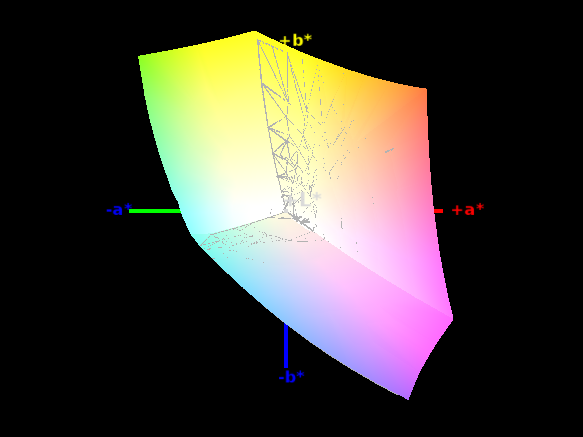
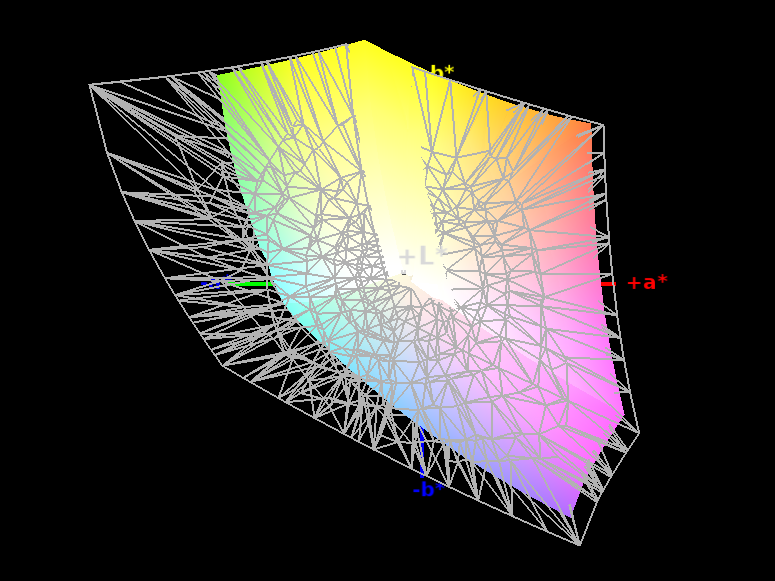
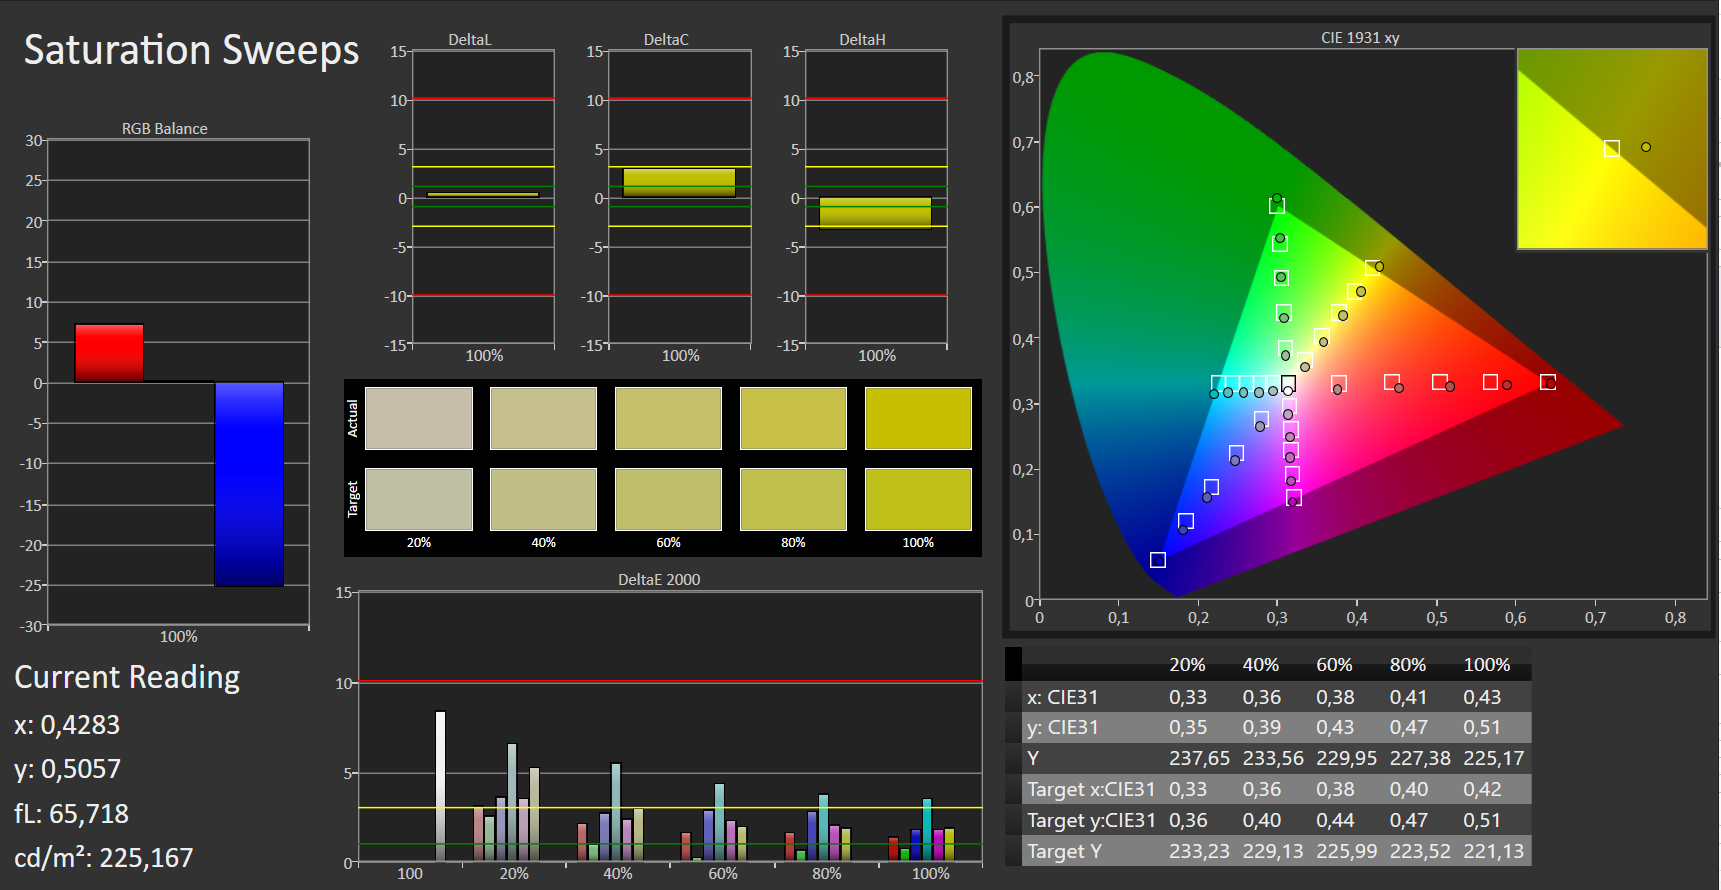
The CalMAN analysis shows that the displays in the Swift 3 SF313-52-52AS and the SF313-52-71Y7 have similar characteristics. Although most of the values may drift apart only due to production reasons, the contrast ratio of 1425:1 is lower than expected. The Delta E 2000 deviation is also significantly higher but can be balanced better with calibration. The respective ICC file can be downloaded in the window above to the right of the display's brightness distribution graph.
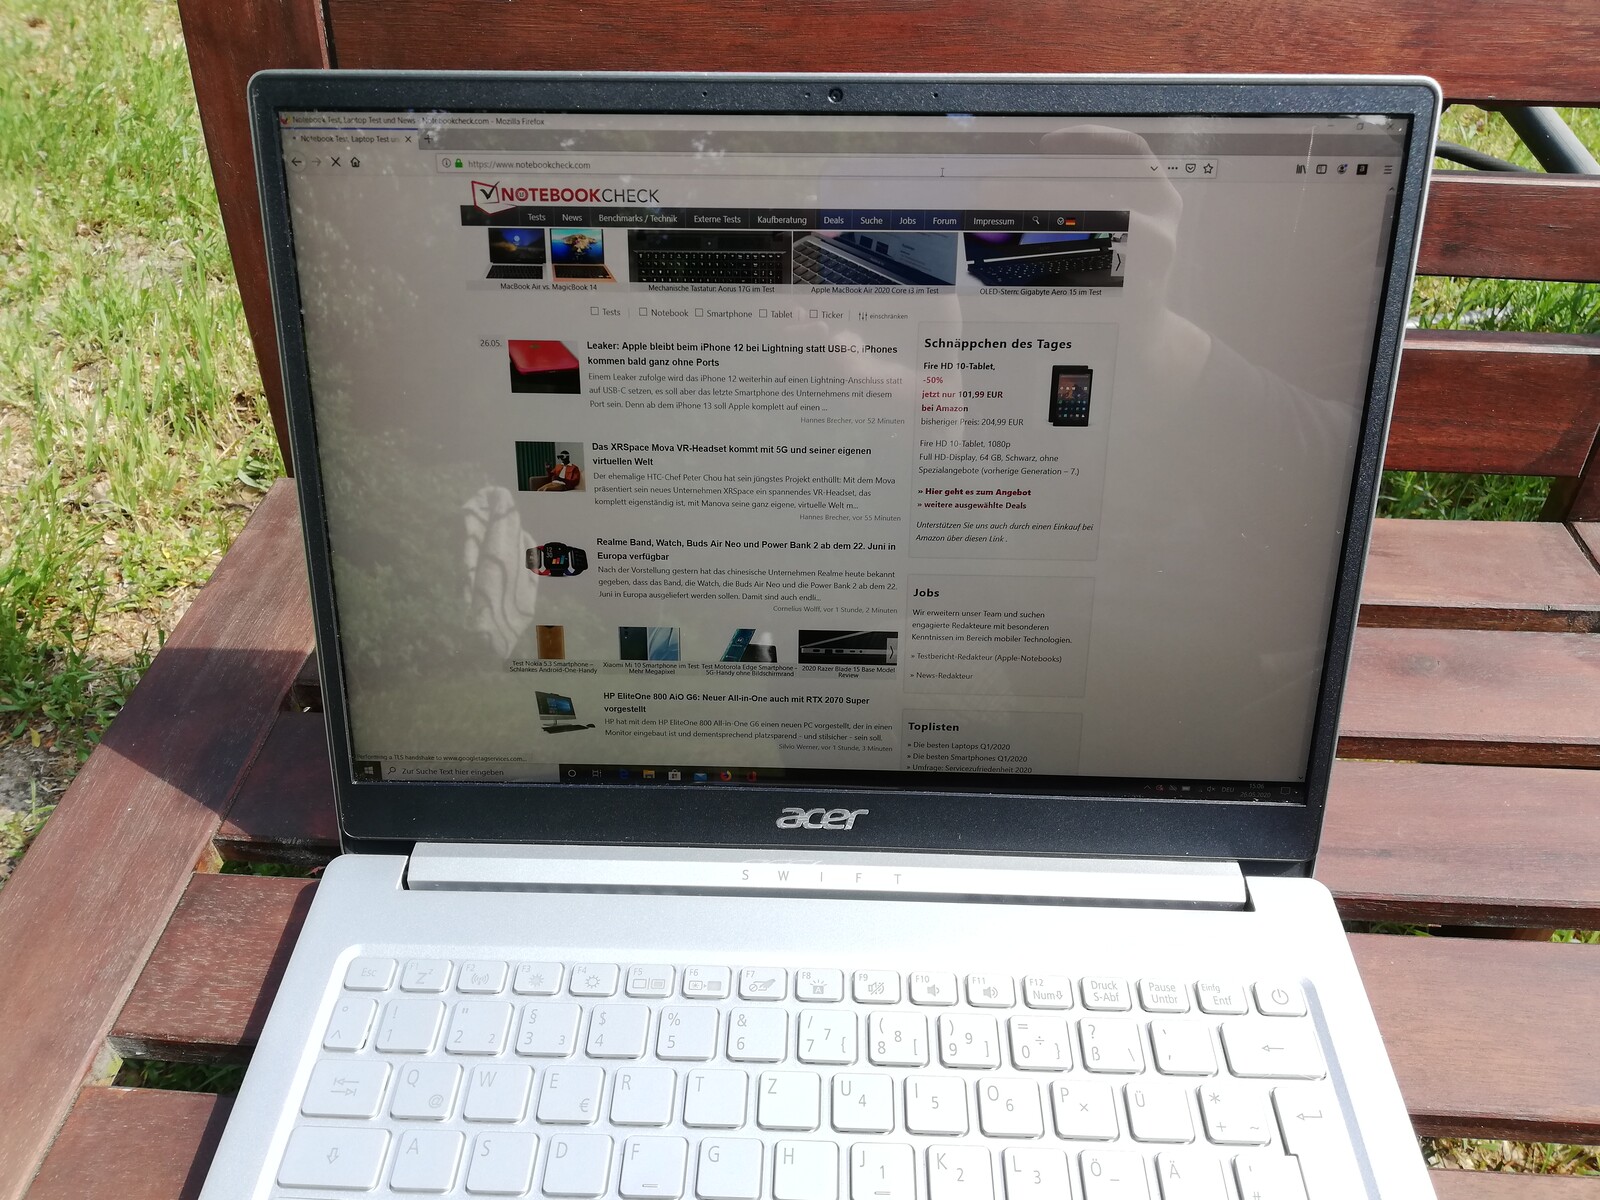
The viewing-angle stability of the IPS panel is very good, and the screen bleeding doesn't stand out negatively either. But outdoors, the reflective screen surface provides some strong reflections, which makes it hard to make out the content on the screen.


Performance - Satisfactory performance with the Intel Core i5
Acer also offers the Swift 3 SF313 with the Intel Core i7-1065G7, 16 GB of RAM and a 1 TB SSD in addition to the configuration variant tested here. In both models, performance is aimed at office users and offers enough power for somewhat more-demanding tasks. However, users should refrain from applications with a higher demand on graphics performance, since only the CPU's internal graphics unit is available.
Processor
The Intel Core i5-1035G4 installed here is a quad-core processor that can handle up to eight threads simultaneously. The clock speeds are between 1.1 and 3.7 GHz, whereby the maximum clock rate can only be maintained over a longer period of time depending on the cooling system. In our Cinebench R15 continuous load loop, the performance drops by about 7% after a short time, but the subsequent value can be maintained evenly.
The i5-1035G4 scores slightly below average in the individual disciplines for single and multi-core performance. The results are up to 20% below the average of other devices with this CPU that we've tested. Compared to the Core i7-1065G7 in the SF313-52-71Y7, the multi-core values are about 28% lower. However, this difference is hardly noticeable in everyday use and only affects the speed when loading very large Excel files, for example.
Cinebench R15: CPU Single 64Bit | CPU Multi 64Bit
Blender: v2.79 BMW27 CPU
7-Zip 18.03: 7z b 4 -mmt1 | 7z b 4
Geekbench 5.5: Single-Core | Multi-Core
HWBOT x265 Benchmark v2.2: 4k Preset
LibreOffice : 20 Documents To PDF
R Benchmark 2.5: Overall mean
| Cinebench R20 / CPU (Single Core) | |
| Average of class Subnotebook (128 - 832, n=56, last 2 years) | |
| Acer Swift 3 SF313-52-71Y7 | |
| HP ProBook 430 G7-8VU53EA | |
| HP ProBook 430 G7-8VU53EA | |
| Microsoft Surface Laptop 3 13 Core i5-1035G7 | |
| Average Intel Core i5-1035G4 (357 - 441, n=6) | |
| Lenovo IdeaPad S540-13API | |
| Acer Swift 3 SF313-52-52AS | |
| Acer Swift 3 SF313-52-52AS | |
| Cinebench R20 / CPU (Multi Core) | |
| Average of class Subnotebook (579 - 8541, n=56, last 2 years) | |
| Microsoft Surface Laptop 3 13 Core i5-1035G7 | |
| Lenovo IdeaPad S540-13API | |
| Acer Swift 3 SF313-52-71Y7 | |
| HP ProBook 430 G7-8VU53EA | |
| HP ProBook 430 G7-8VU53EA | |
| Average Intel Core i5-1035G4 (892 - 1648, n=6) | |
| Acer Swift 3 SF313-52-52AS | |
| Acer Swift 3 SF313-52-52AS | |
| Cinebench R15 / CPU Single 64Bit | |
| Average of class Subnotebook (72.4 - 322, n=56, last 2 years) | |
| HP ProBook 430 G7-8VU53EA | |
| Acer Swift 3 SF313-52-71Y7 | |
| Microsoft Surface Laptop 3 13 Core i5-1035G7 | |
| Average Intel Core i5-1035G4 (146.4 - 172, n=5) | |
| Acer Swift 3 SF313-52-52AS | |
| Lenovo IdeaPad S540-13API | |
| Cinebench R15 / CPU Multi 64Bit | |
| Average of class Subnotebook (327 - 3345, n=56, last 2 years) | |
| Microsoft Surface Laptop 3 13 Core i5-1035G7 | |
| Lenovo IdeaPad S540-13API | |
| Acer Swift 3 SF313-52-71Y7 | |
| HP ProBook 430 G7-8VU53EA | |
| Average Intel Core i5-1035G4 (490 - 676, n=6) | |
| Acer Swift 3 SF313-52-52AS | |
| Blender / v2.79 BMW27 CPU | |
| Acer Swift 3 SF313-52-52AS | |
| Acer Swift 3 SF313-52-52AS | |
| Average Intel Core i5-1035G4 (703 - 1075, n=6) | |
| HP ProBook 430 G7-8VU53EA | |
| HP ProBook 430 G7-8VU53EA | |
| Acer Swift 3 SF313-52-71Y7 | |
| Microsoft Surface Laptop 3 13 Core i5-1035G7 | |
| Lenovo IdeaPad S540-13API | |
| Average of class Subnotebook (159 - 2271, n=57, last 2 years) | |
| 7-Zip 18.03 / 7z b 4 -mmt1 | |
| Average of class Subnotebook (2643 - 6699, n=58, last 2 years) | |
| HP ProBook 430 G7-8VU53EA | |
| HP ProBook 430 G7-8VU53EA | |
| Acer Swift 3 SF313-52-71Y7 | |
| Microsoft Surface Laptop 3 13 Core i5-1035G7 | |
| Acer Swift 3 SF313-52-52AS | |
| Acer Swift 3 SF313-52-52AS | |
| Average Intel Core i5-1035G4 (1307 - 4190, n=6) | |
| Lenovo IdeaPad S540-13API | |
| 7-Zip 18.03 / 7z b 4 | |
| Average of class Subnotebook (11668 - 77867, n=56, last 2 years) | |
| Microsoft Surface Laptop 3 13 Core i5-1035G7 | |
| HP ProBook 430 G7-8VU53EA | |
| HP ProBook 430 G7-8VU53EA | |
| Acer Swift 3 SF313-52-71Y7 | |
| Lenovo IdeaPad S540-13API | |
| Average Intel Core i5-1035G4 (11030 - 19548, n=6) | |
| Acer Swift 3 SF313-52-52AS | |
| Acer Swift 3 SF313-52-52AS | |
| Geekbench 5.5 / Single-Core | |
| Average of class Subnotebook (726 - 2224, n=48, last 2 years) | |
| Acer Swift 3 SF313-52-71Y7 | |
| HP ProBook 430 G7-8VU53EA | |
| HP ProBook 430 G7-8VU53EA | |
| HP ProBook 430 G7-8VU53EA | |
| Average Intel Core i5-1035G4 (1081 - 1277, n=5) | |
| Acer Swift 3 SF313-52-52AS | |
| Acer Swift 3 SF313-52-52AS | |
| Geekbench 5.5 / Multi-Core | |
| Average of class Subnotebook (2557 - 17218, n=48, last 2 years) | |
| Acer Swift 3 SF313-52-71Y7 | |
| Average Intel Core i5-1035G4 (3261 - 4315, n=5) | |
| Acer Swift 3 SF313-52-52AS | |
| Acer Swift 3 SF313-52-52AS | |
| HP ProBook 430 G7-8VU53EA | |
| HP ProBook 430 G7-8VU53EA | |
| HP ProBook 430 G7-8VU53EA | |
| HWBOT x265 Benchmark v2.2 / 4k Preset | |
| Average of class Subnotebook (0.97 - 25.1, n=56, last 2 years) | |
| Acer Swift 3 SF313-52-71Y7 | |
| Microsoft Surface Laptop 3 13 Core i5-1035G7 | |
| HP ProBook 430 G7-8VU53EA | |
| HP ProBook 430 G7-8VU53EA | |
| Average Intel Core i5-1035G4 (3.37 - 5.61, n=6) | |
| Lenovo IdeaPad S540-13API | |
| Acer Swift 3 SF313-52-52AS | |
| Acer Swift 3 SF313-52-52AS | |
| LibreOffice / 20 Documents To PDF | |
| Acer Swift 3 SF313-52-52AS | |
| Acer Swift 3 SF313-52-52AS | |
| HP ProBook 430 G7-8VU53EA | |
| HP ProBook 430 G7-8VU53EA | |
| Average Intel Core i5-1035G4 (58.4 - 78.3, n=5) | |
| Average of class Subnotebook (39.9 - 220, n=55, last 2 years) | |
| R Benchmark 2.5 / Overall mean | |
| Acer Swift 3 SF313-52-52AS | |
| Acer Swift 3 SF313-52-52AS | |
| Average Intel Core i5-1035G4 (0.701 - 0.825, n=5) | |
| Acer Swift 3 SF313-52-71Y7 | |
| HP ProBook 430 G7-8VU53EA | |
| HP ProBook 430 G7-8VU53EA | |
| Average of class Subnotebook (0.4024 - 1.456, n=57, last 2 years) | |
* ... smaller is better
System performance
In the PCMark 10 benchmark, the Acer Swift 3 SF313-52-52AS also achieves results that fall short of the hardware expectations. In everyday use, however, the Intel Core i5-1035G4, in combination with 8 GB of RAM in dual-channel mode and a fast SSD, ensures a smooth system operation. Applications and folders were opened quickly, and the system ran smoothly at all times. For users who like to work with a lot of open browser tabs, RAM could turn out to be a bit too scarce, though.
The performance achieved by other laptops in our tests can be found in our CPU Benchmarks article.
| PCMark 10 Score | 3790 points | |
Help | ||
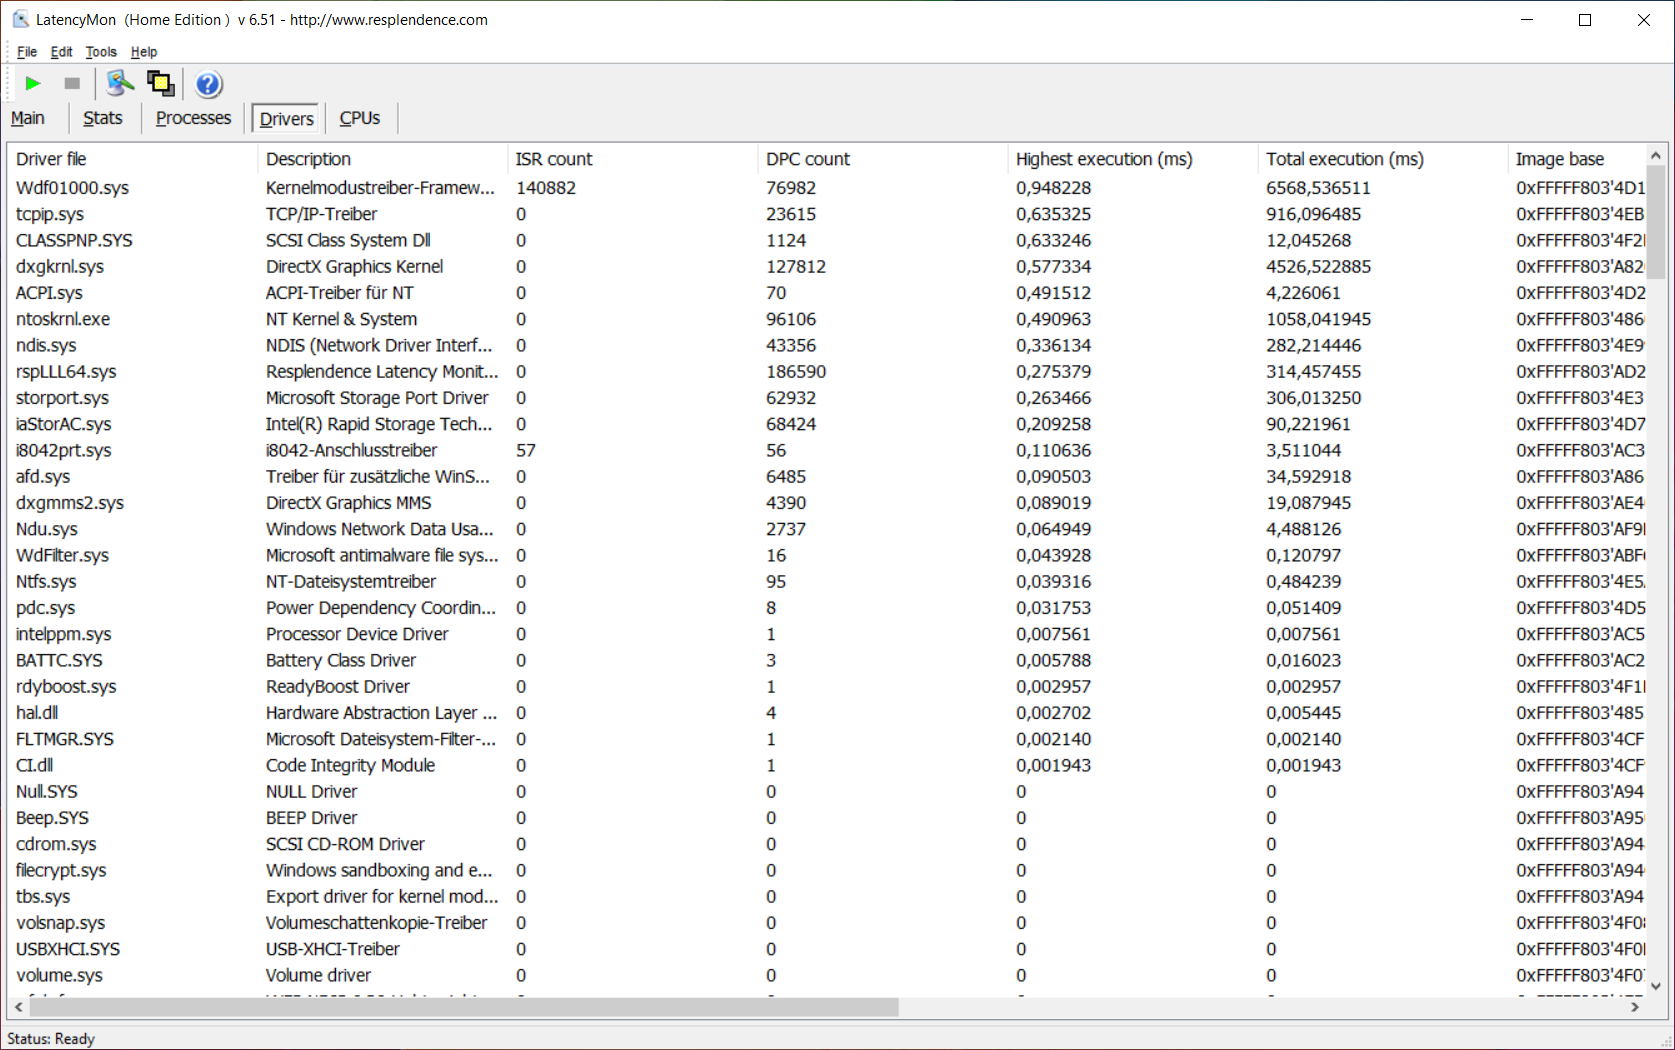
DPC latency
In our test, the Acer Swift 3 SF313-52-52AS didn't show any problems in the latency test and is, therefore, suitable for editing real-time audio and video content.
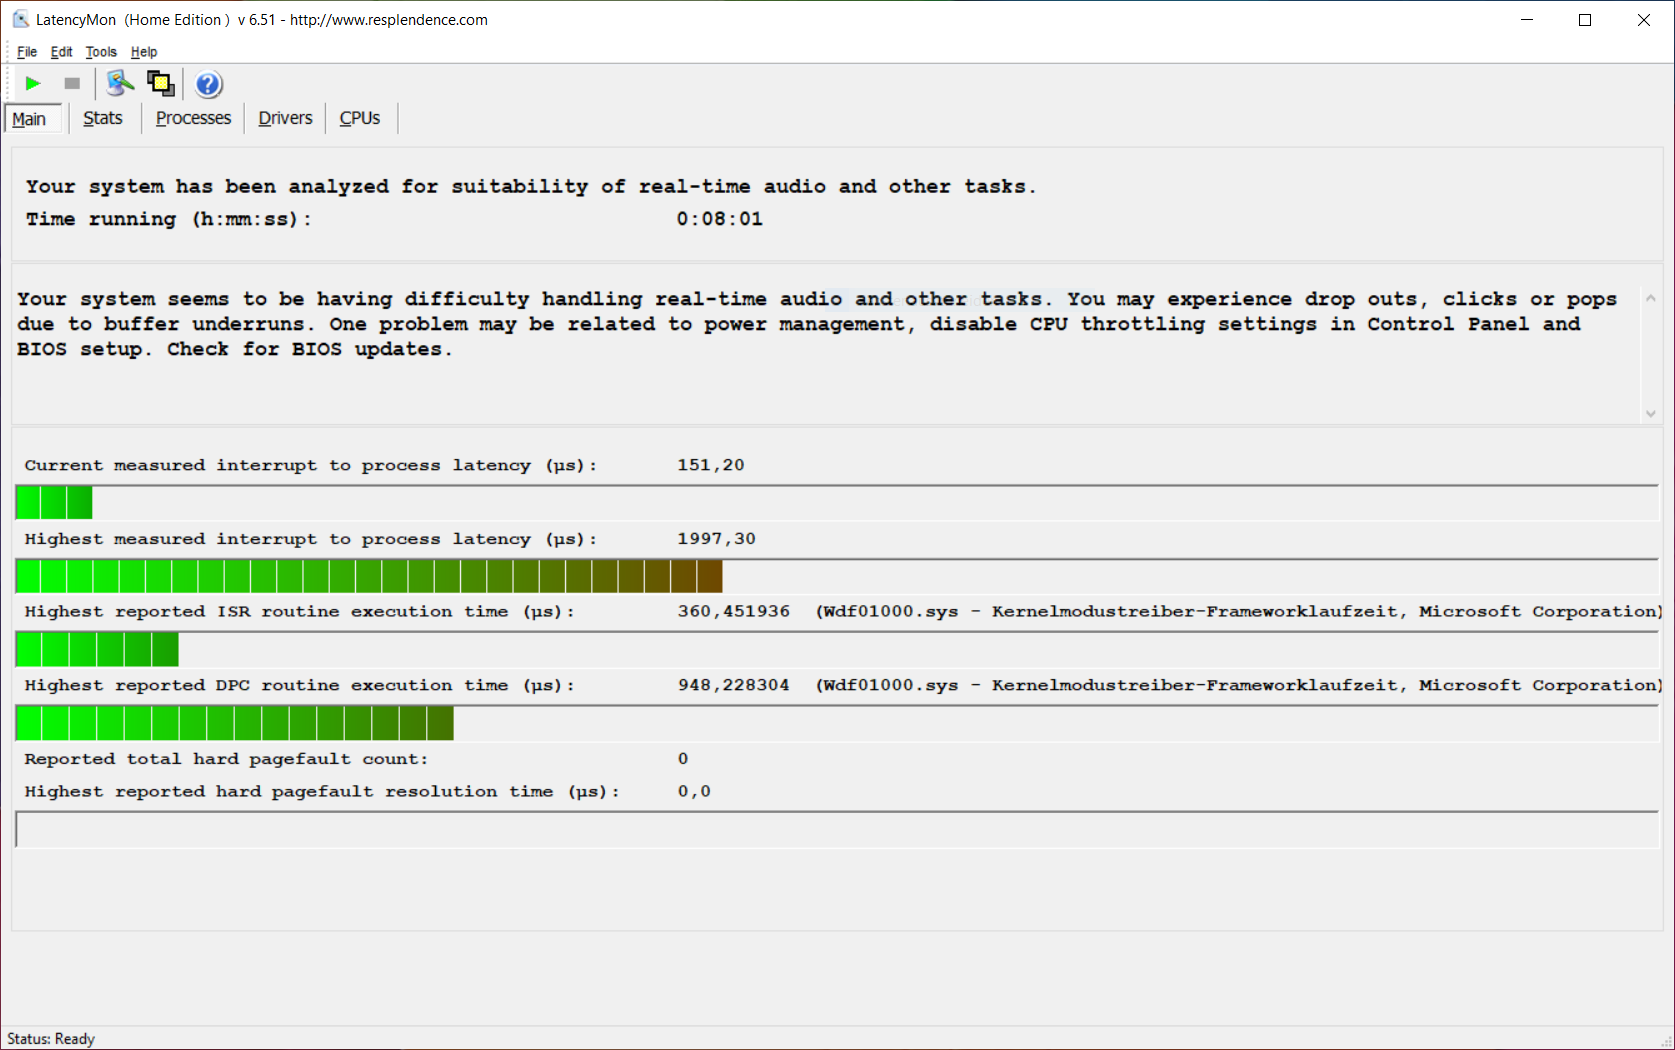
| DPC Latencies / LatencyMon - interrupt to process latency (max), Web, Youtube, Prime95 | |
| HP ProBook 430 G7-8VU53EA | |
| Acer Swift 3 SF313-52-52AS | |
* ... smaller is better
Storage
Acer has installed a 512 GB SSD in the Swift 3 SF313-52-52AS, out of which about 480 GB is available for installing programs and storing your own files. In the storage benchmarks, the storage device shows average write and read speeds; this is reflected in fast file access, and the speeds don't drop even during longer read operations.
In our HDD/SSD Benchmarks article you can compare the performance of other mass storage devices in relation to the SSD used here.
| Acer Swift 3 SF313-52-52AS SK Hynix BC501 HFM512GDJTNG | Acer Swift 3 SF313-52-71Y7 Intel SSD 660p 1TB SSDPEKNW010T8 | HP ProBook 430 G7-8VU53EA Toshiba KBG30ZMV256G | Lenovo IdeaPad S540-13API Samsung SSD PM981 MZVLB512HAJQ | Microsoft Surface Laptop 3 13 Core i5-1035G7 SK hynix BC501 HFM256GDGTNG | Average SK Hynix BC501 HFM512GDJTNG | Average of class Subnotebook | |
|---|---|---|---|---|---|---|---|
| CrystalDiskMark 5.2 / 6 | 41% | -11% | 60% | -13% | -18% | 123% | |
| Write 4K (MB/s) | 120.6 | 187.4 55% | 124.7 3% | 133.9 11% | 112.3 -7% | 95.5 ? -21% | 155.4 ? 29% |
| Read 4K (MB/s) | 46.88 | 63.8 36% | 48.17 3% | 44.98 -4% | 42.13 -10% | 38.3 ? -18% | 64.3 ? 37% |
| Write Seq (MB/s) | 1044 | 1776 70% | 694 -34% | 2730 161% | 630 -40% | 759 ? -27% | 2846 ? 173% |
| Read Seq (MB/s) | 1147 | 1693 48% | 757 -34% | 2403 110% | 1023 -11% | 1022 ? -11% | 3299 ? 188% |
| Write 4K Q32T1 (MB/s) | 332.4 | 492.3 48% | 311 -6% | 252.2 -24% | 336.6 1% | 303 ? -9% | 431 ? 30% |
| Read 4K Q32T1 (MB/s) | 443.3 | 539 22% | 495.5 12% | 335.6 -24% | 399.6 -10% | 317 ? -28% | 504 ? 14% |
| Write Seq Q32T1 (MB/s) | 1052 | 1770 68% | 1017 -3% | 2983 184% | 821 -22% | 885 ? -16% | 4671 ? 344% |
| Read Seq Q32T1 (MB/s) | 2171 | 1715 -21% | 1530 -30% | 3535 63% | 2030 -6% | 1803 ? -17% | 5833 ? 169% |
| Write 4K Q8T8 (MB/s) | 899 | 306 ? | 899 ? | ||||
| Read 4K Q8T8 (MB/s) | 630 | 698 ? | 1277 ? | ||||
| AS SSD | 9% | -58% | 58% | -43% | -12% | 84% | |
| Seq Read (MB/s) | 1370 | 1703 24% | 1342 -2% | 2792 104% | 1387 1% | 1323 ? -3% | 4499 ? 228% |
| Seq Write (MB/s) | 1019 | 1373 35% | 768 -25% | 2564 152% | 504 -51% | 697 ? -32% | 2974 ? 192% |
| 4K Read (MB/s) | 50.8 | 56.8 12% | 48.56 -4% | 47.14 -7% | 42.35 -17% | 40.4 ? -20% | 59.5 ? 17% |
| 4K Write (MB/s) | 111.2 | 164.4 48% | 127.7 15% | 89.5 -20% | 120 8% | 100.8 ? -9% | 168.1 ? 51% |
| 4K-64 Read (MB/s) | 770 | 584 -24% | 644 -16% | 1159 51% | 497.4 -35% | 686 ? -11% | 862 ? 12% |
| 4K-64 Write (MB/s) | 713 | 783 10% | 317.3 -55% | 1468 106% | 354.9 -50% | 660 ? -7% | 1701 ? 139% |
| Access Time Read * (ms) | 0.044 | 0.417 | 0.069 | 0.055 | 0.06071 ? | 0.06605 ? | |
| Access Time Write * (ms) | 0.034 | 0.038 -12% | 0.174 -412% | 0.043 -26% | 0.093 -174% | 0.037 ? -9% | 0.05162 ? -52% |
| Score Read (Points) | 958 | 811 -15% | 827 -14% | 1486 55% | 678 -29% | 858 ? -10% | 1370 ? 43% |
| Score Write (Points) | 926 | 1085 17% | 522 -44% | 1814 96% | 525 -43% | 830 ? -10% | 2166 ? 134% |
| Score Total (Points) | 2370 | 2313 -2% | 1757 -26% | 4054 71% | 1520 -36% | 2107 ? -11% | 4175 ? 76% |
| Total Average (Program / Settings) | 25% /
23% | -35% /
-37% | 59% /
59% | -28% /
-30% | -15% /
-15% | 104% /
101% |
* ... smaller is better

Continuous load read: DiskSpd Read Loop, Queue Depth 8
Graphics card
In the Acer Swift 3 SF313-52-52AS, the Intel Iris Plus Graphics G4 internal graphics unit takes care of displaying image content. It benefits from the RAM's dual-channel configuration used here and achieves slightly above-average results in the 3DMark benchmarks; therefore, simple image-editing tasks, for example, can be carried out without any problems.
The performance of other graphic cards in our tests can be found in our GPU Benchmark article.
| 3DMark 11 Performance | 3001 points | |
| 3DMark Fire Strike Score | 1820 points | |
Help | ||
Gaming performance
The Intel Iris Plus Graphics G4 internal graphics unit is only suitable for old games or titles with a low demand on graphics performance. We tested the Dota 2 Reborn title, and it still showed smooth frame rates even at medium graphics settings, whereas the more demanding X-Plane 11.11 could be executed somewhat smoothly only at low settings.
The expected performance for the Intel Iris Plus Graphics G4 in various games can be found in our GPU Games article.
| low | med. | high | ultra | |
|---|---|---|---|---|
| Dota 2 Reborn (2015) | 69.3 | 41.6 | 19.6 | |
| X-Plane 11.11 (2018) | 26.3 | 14.2 | 13.2 |
Emissions and energy - Longer battery life with less performance
Noise emissions
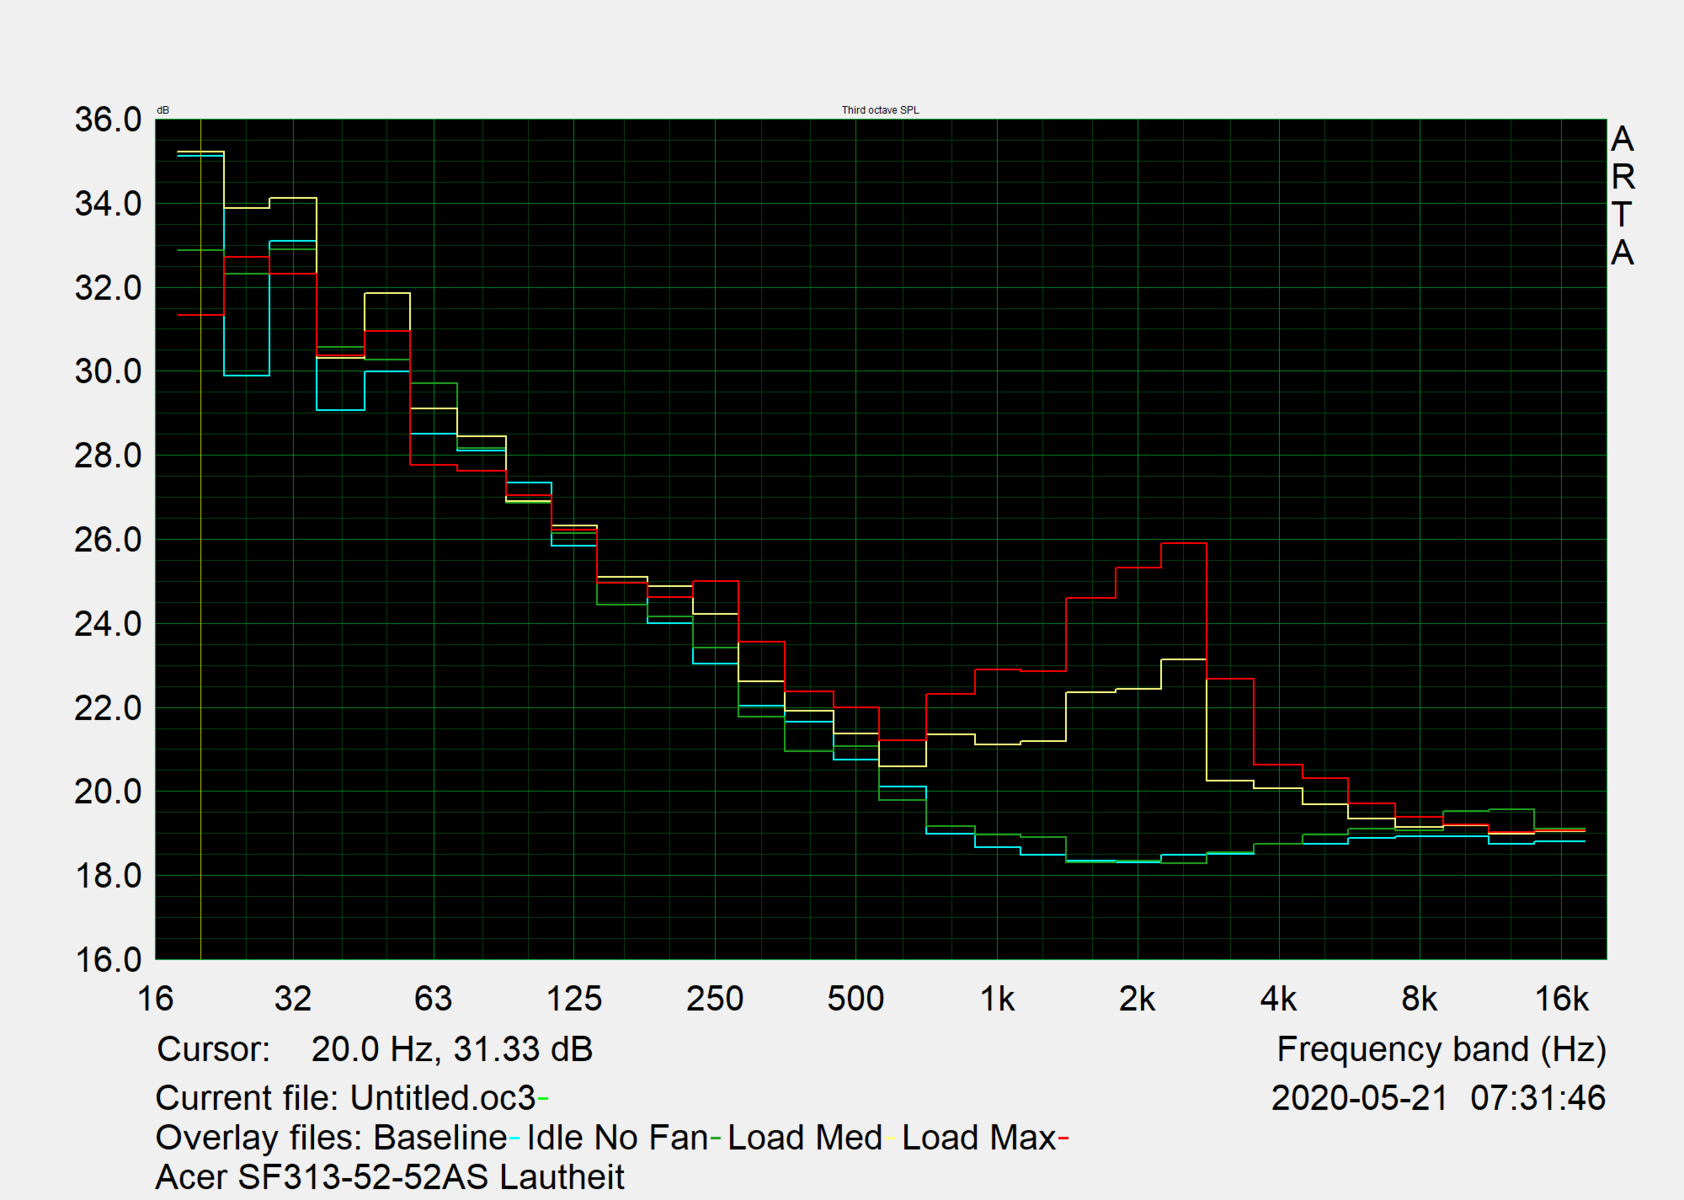
The Acer Swift 3 SF313-52-52AS is mostly silent in daily use. If simple office applications and the internet browser are ran, the fans only start up very rarely. They run continuously under load and produce a uniform noise, which is audible but not disturbing.
Noise level
| Idle |
| 31.2 / 31.2 / 31.2 dB(A) |
| Load |
| 33.2 / 34.9 dB(A) |
 | ||
30 dB silent 40 dB(A) audible 50 dB(A) loud |
||
min: | ||
Temperature
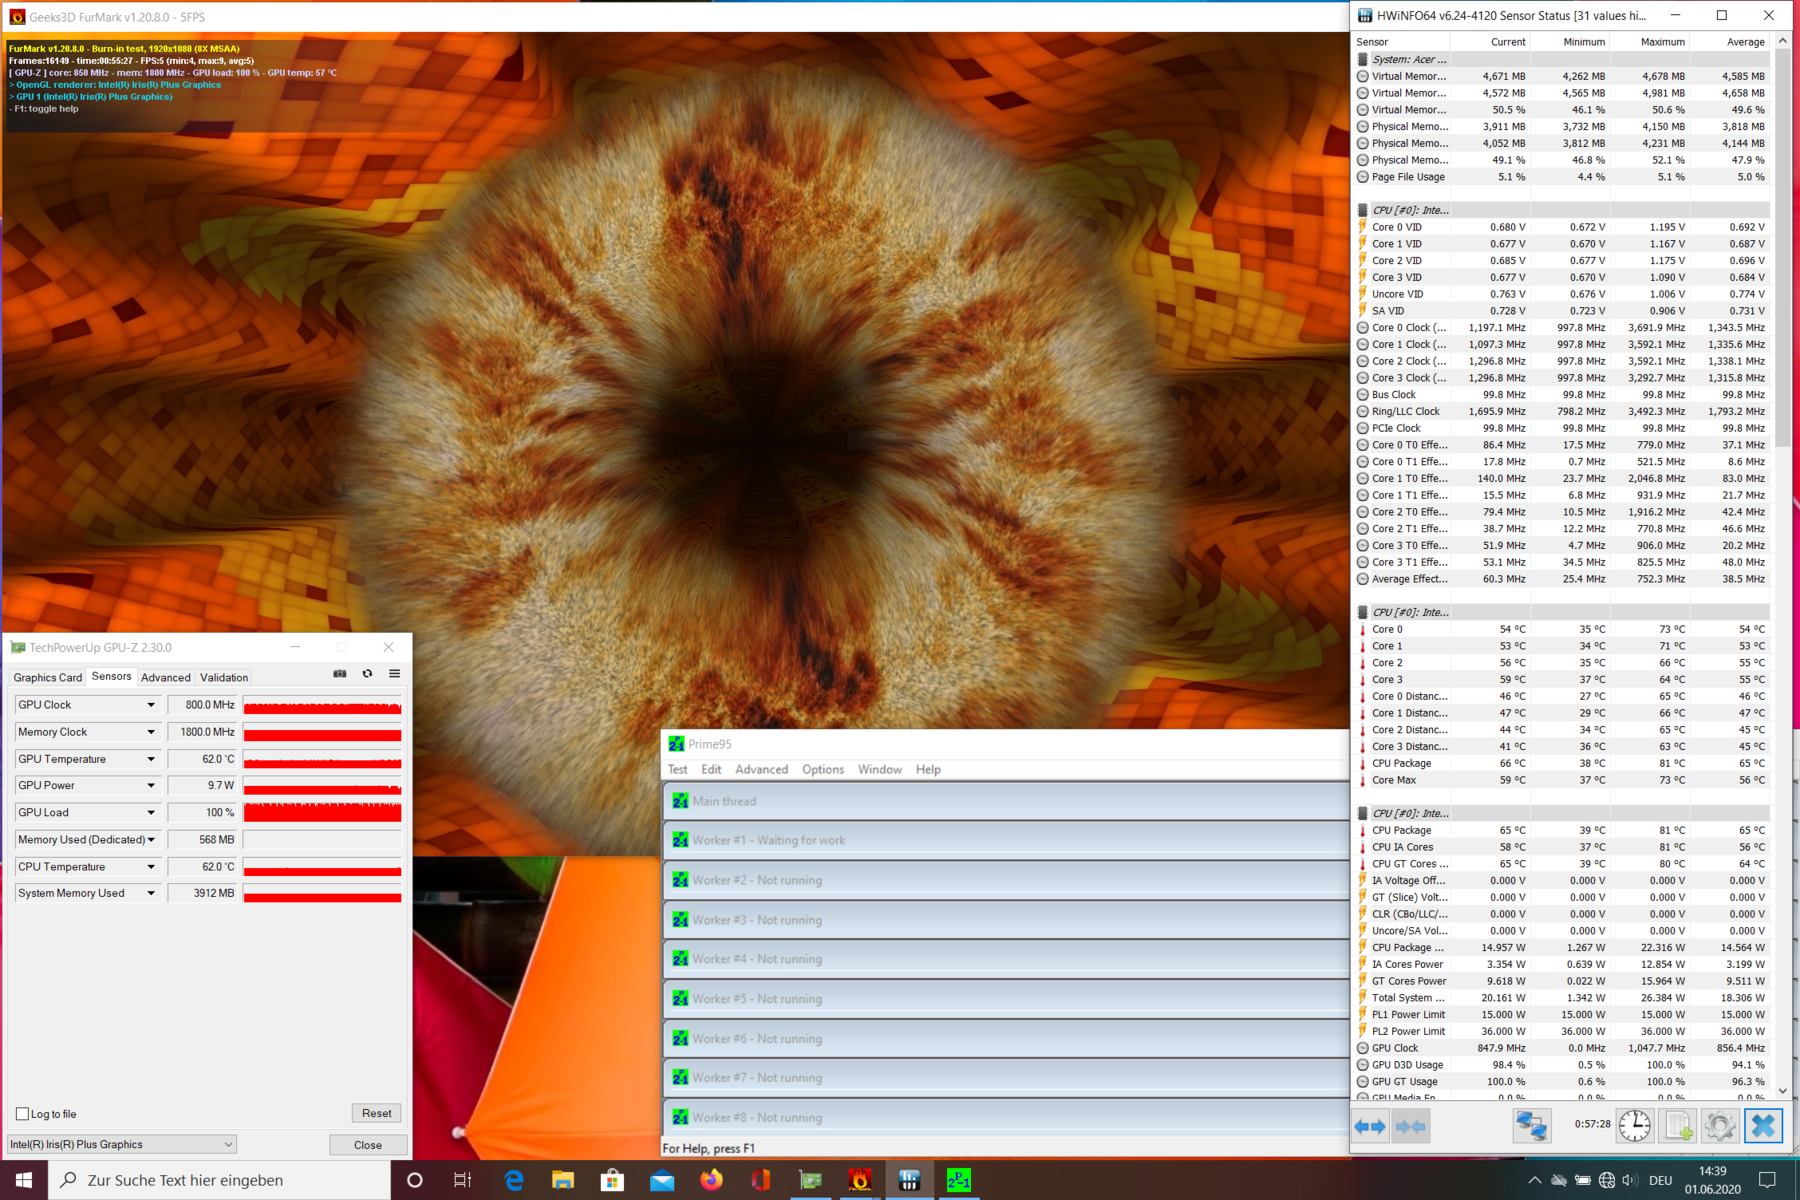
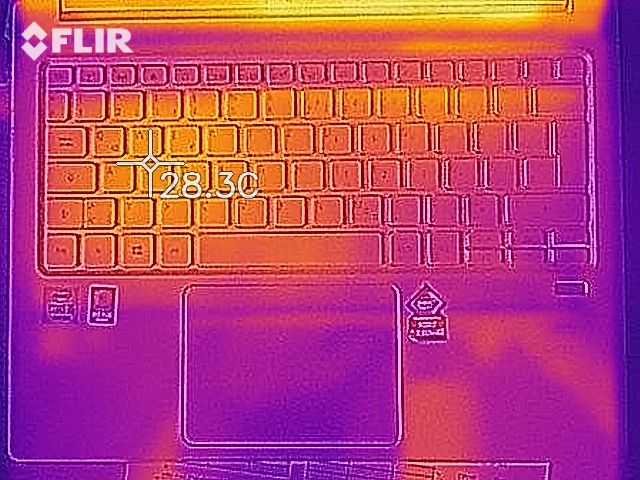
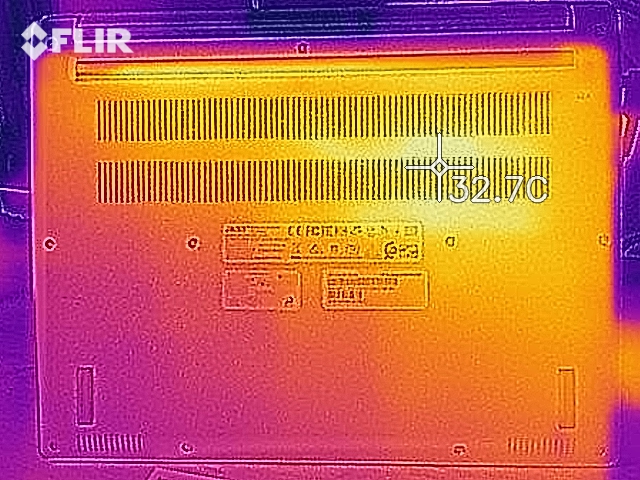
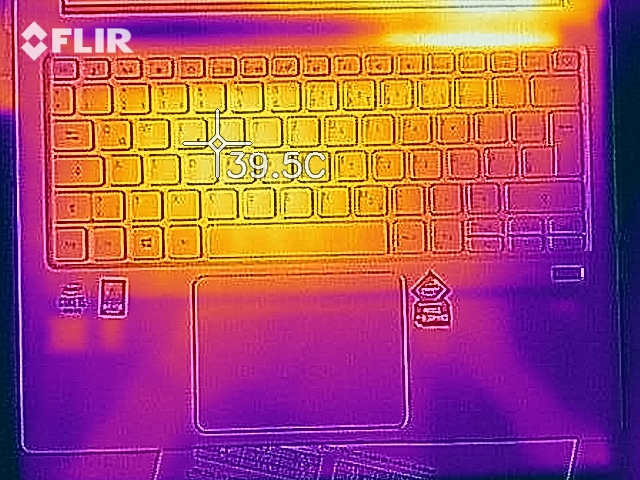
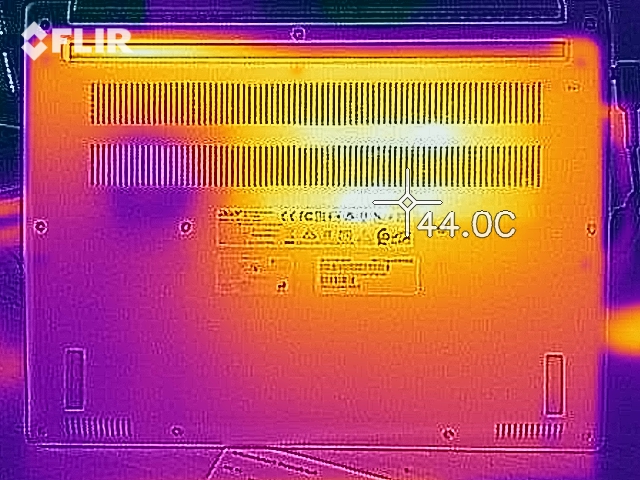
In our test, the Acer Swift 3 SF313's surface temperatures rose up to 36.4 °C (~98 °F); therefore, it never got too hot to be able to place it on the lap, for example. During our approximately one-hour stress test, the temperatures inside rose up to 73 °C (~163 °F). The clock speeds were 1.3 GHz on average, which is above the base rate. As a result, users shouldn't expect restrictions due to the temperatures being too high.
(+) The maximum temperature on the upper side is 34.7 °C / 94 F, compared to the average of 35.9 °C / 97 F, ranging from 21.4 to 59 °C for the class Subnotebook.
(+) The bottom heats up to a maximum of 36.4 °C / 98 F, compared to the average of 39.2 °C / 103 F
(+) In idle usage, the average temperature for the upper side is 25.9 °C / 79 F, compared to the device average of 30.8 °C / 87 F.
(+) The palmrests and touchpad are cooler than skin temperature with a maximum of 29.2 °C / 84.6 F and are therefore cool to the touch.
(±) The average temperature of the palmrest area of similar devices was 28.2 °C / 82.8 F (-1 °C / -1.8 F).
Speakers
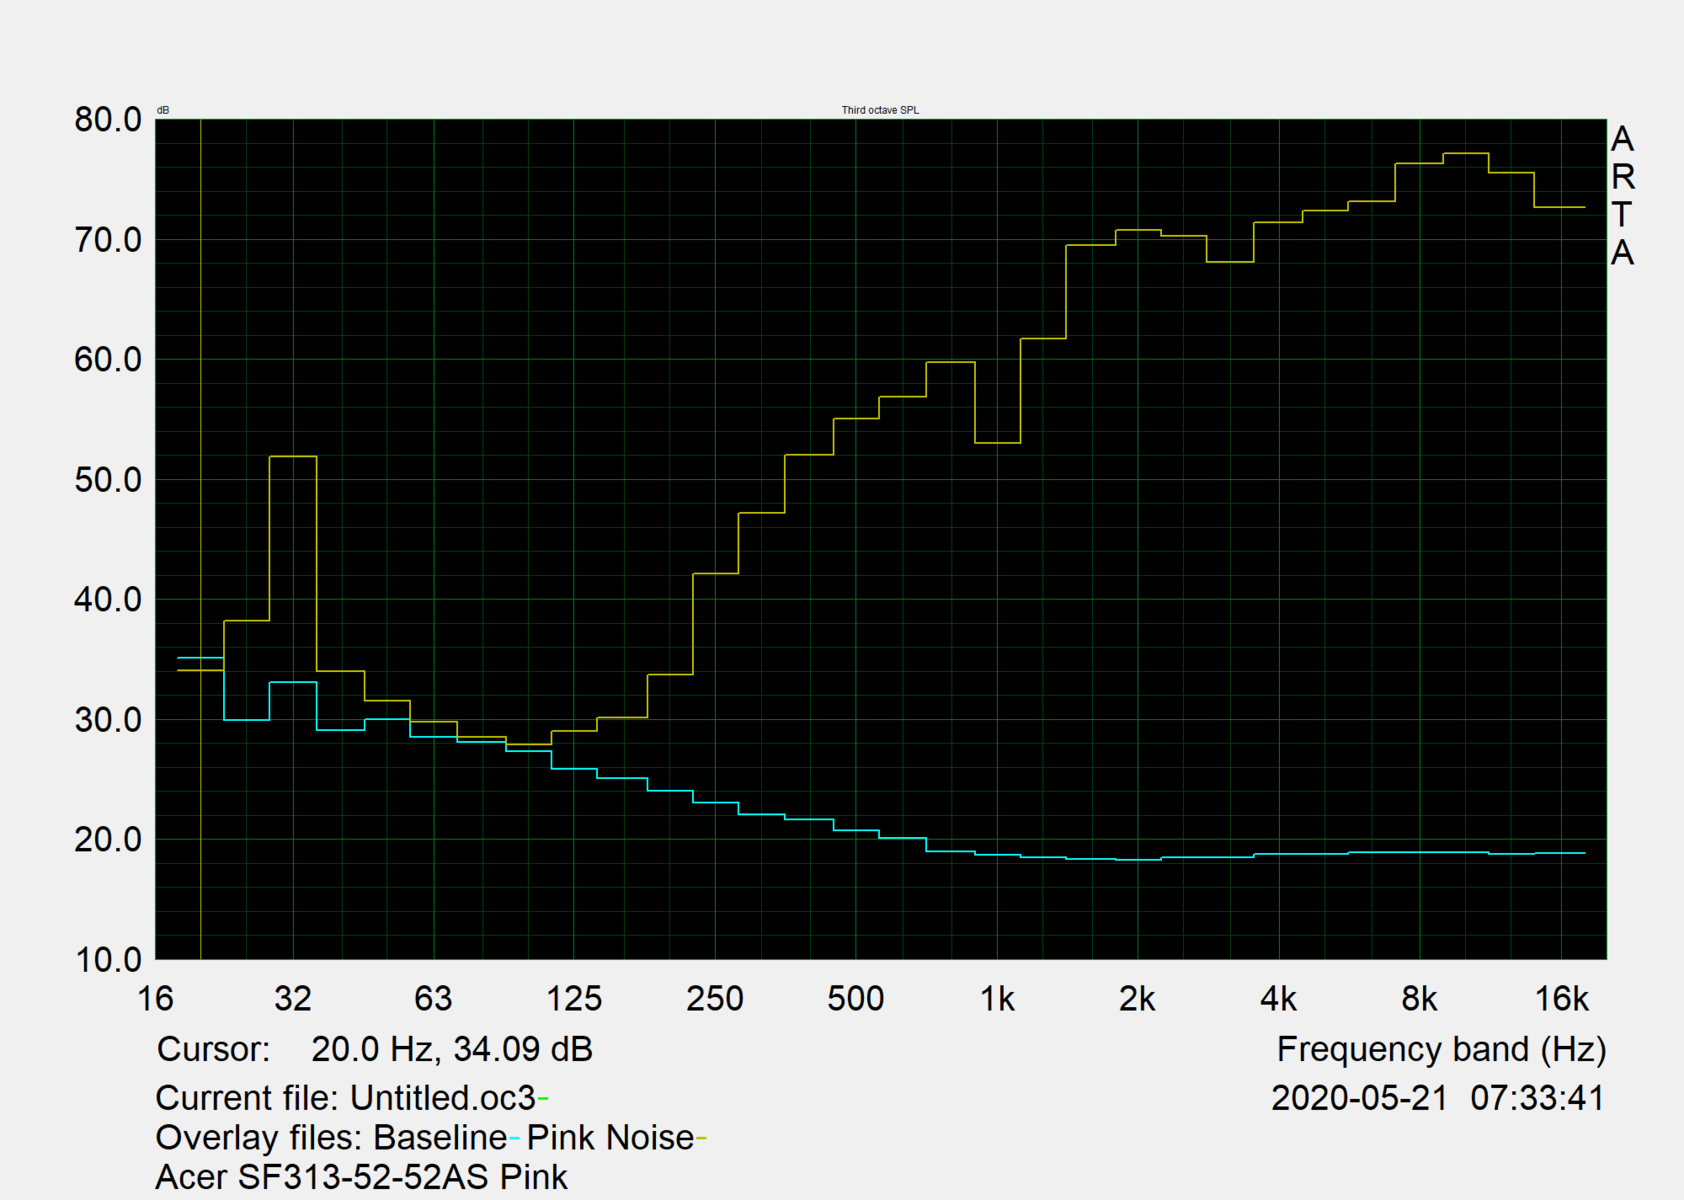
The speakers in the Acer Swift 3 offer medium volume and a sound spectrum tuned to the higher pitches. This makes it adequate for speech reproduction, for example, but less suitable for the long-term consumption of media content.
Acer Swift 3 SF313-52-52AS audio analysis
(±) | speaker loudness is average but good (77.1 dB)
Bass 100 - 315 Hz
(-) | nearly no bass - on average 26.7% lower than median
(±) | linearity of bass is average (7.8% delta to prev. frequency)
Mids 400 - 2000 Hz
(±) | reduced mids - on average 6.1% lower than median
(±) | linearity of mids is average (10.8% delta to prev. frequency)
Highs 2 - 16 kHz
(±) | higher highs - on average 11% higher than median
(+) | highs are linear (3.9% delta to prev. frequency)
Overall 100 - 16.000 Hz
(-) | overall sound is not linear (32.2% difference to median)
Compared to same class
» 94% of all tested devices in this class were better, 2% similar, 4% worse
» The best had a delta of 5%, average was 18%, worst was 53%
Compared to all devices tested
» 91% of all tested devices were better, 2% similar, 7% worse
» The best had a delta of 4%, average was 24%, worst was 134%
Apple MacBook 12 (Early 2016) 1.1 GHz audio analysis
(+) | speakers can play relatively loud (83.6 dB)
Bass 100 - 315 Hz
(±) | reduced bass - on average 11.3% lower than median
(±) | linearity of bass is average (14.2% delta to prev. frequency)
Mids 400 - 2000 Hz
(+) | balanced mids - only 2.4% away from median
(+) | mids are linear (5.5% delta to prev. frequency)
Highs 2 - 16 kHz
(+) | balanced highs - only 2% away from median
(+) | highs are linear (4.5% delta to prev. frequency)
Overall 100 - 16.000 Hz
(+) | overall sound is linear (10.2% difference to median)
Compared to same class
» 7% of all tested devices in this class were better, 2% similar, 91% worse
» The best had a delta of 5%, average was 18%, worst was 53%
Compared to all devices tested
» 5% of all tested devices were better, 1% similar, 94% worse
» The best had a delta of 4%, average was 24%, worst was 134%
Energy consumption
The Acer Swift 3 SF313-52-52AS is quite an energy-efficient device with a maximum power consumption of 27.6 watts under load. The included 64-watt power adapter also has enough capacity to be able to guarantee a secure power supply at all times.
| Off / Standby | |
| Idle | |
| Load |
|
Key:
min: | |
Battery life
In our practical WLAN test, the laptop from Acer achieves a runtime of 10 h 48 m. In this way, it can make good use of its 54.4 Wh battery and reaches first place in our test field.
The battery is also fully charged again after about two hours with the included charger.
Pros
Cons
Verdict - Good Acer laptop with minor weaknesses only
After the test, the Acer Swift 3 SF313 with the Intel Core i5 leaves a similar impression to the fully configured Acer Swift 3 SF313 that we reviewed before. The performance is good, and both the display and the case's workmanship are also convincing. We also like the increased WLAN performance very much, since the performance of the stronger model was still far behind the hardware's capabilities. The battery life also deserves a mention, as it increases by about half an hour with the Core i5.
Buyers of the Acer Swift 3 SF313-52-52AS have to live with a somewhat lower performance but pay less for it in return and get longer battery life.
However, the feeling remains that there should have been more inside here. The display in the 3:2 format certainly appeals to some prospective buyers with its high resolution, but it would have also delivered similarly good values with a matte surface. The CPU performance stays a bit below expectations as well but can guarantee a smooth system operation in combination with the other components. Users who are considering a purchase and aren't dependent on the Core i7's performance will, therefore, also get a good laptop with the Acer Swift 3 SF313-52-52AS but at a significantly lower price.
Acer Swift 3 SF313-52-52AS
- 06/01/2020 v7 (old)
Mike Wobker
Price comparison

