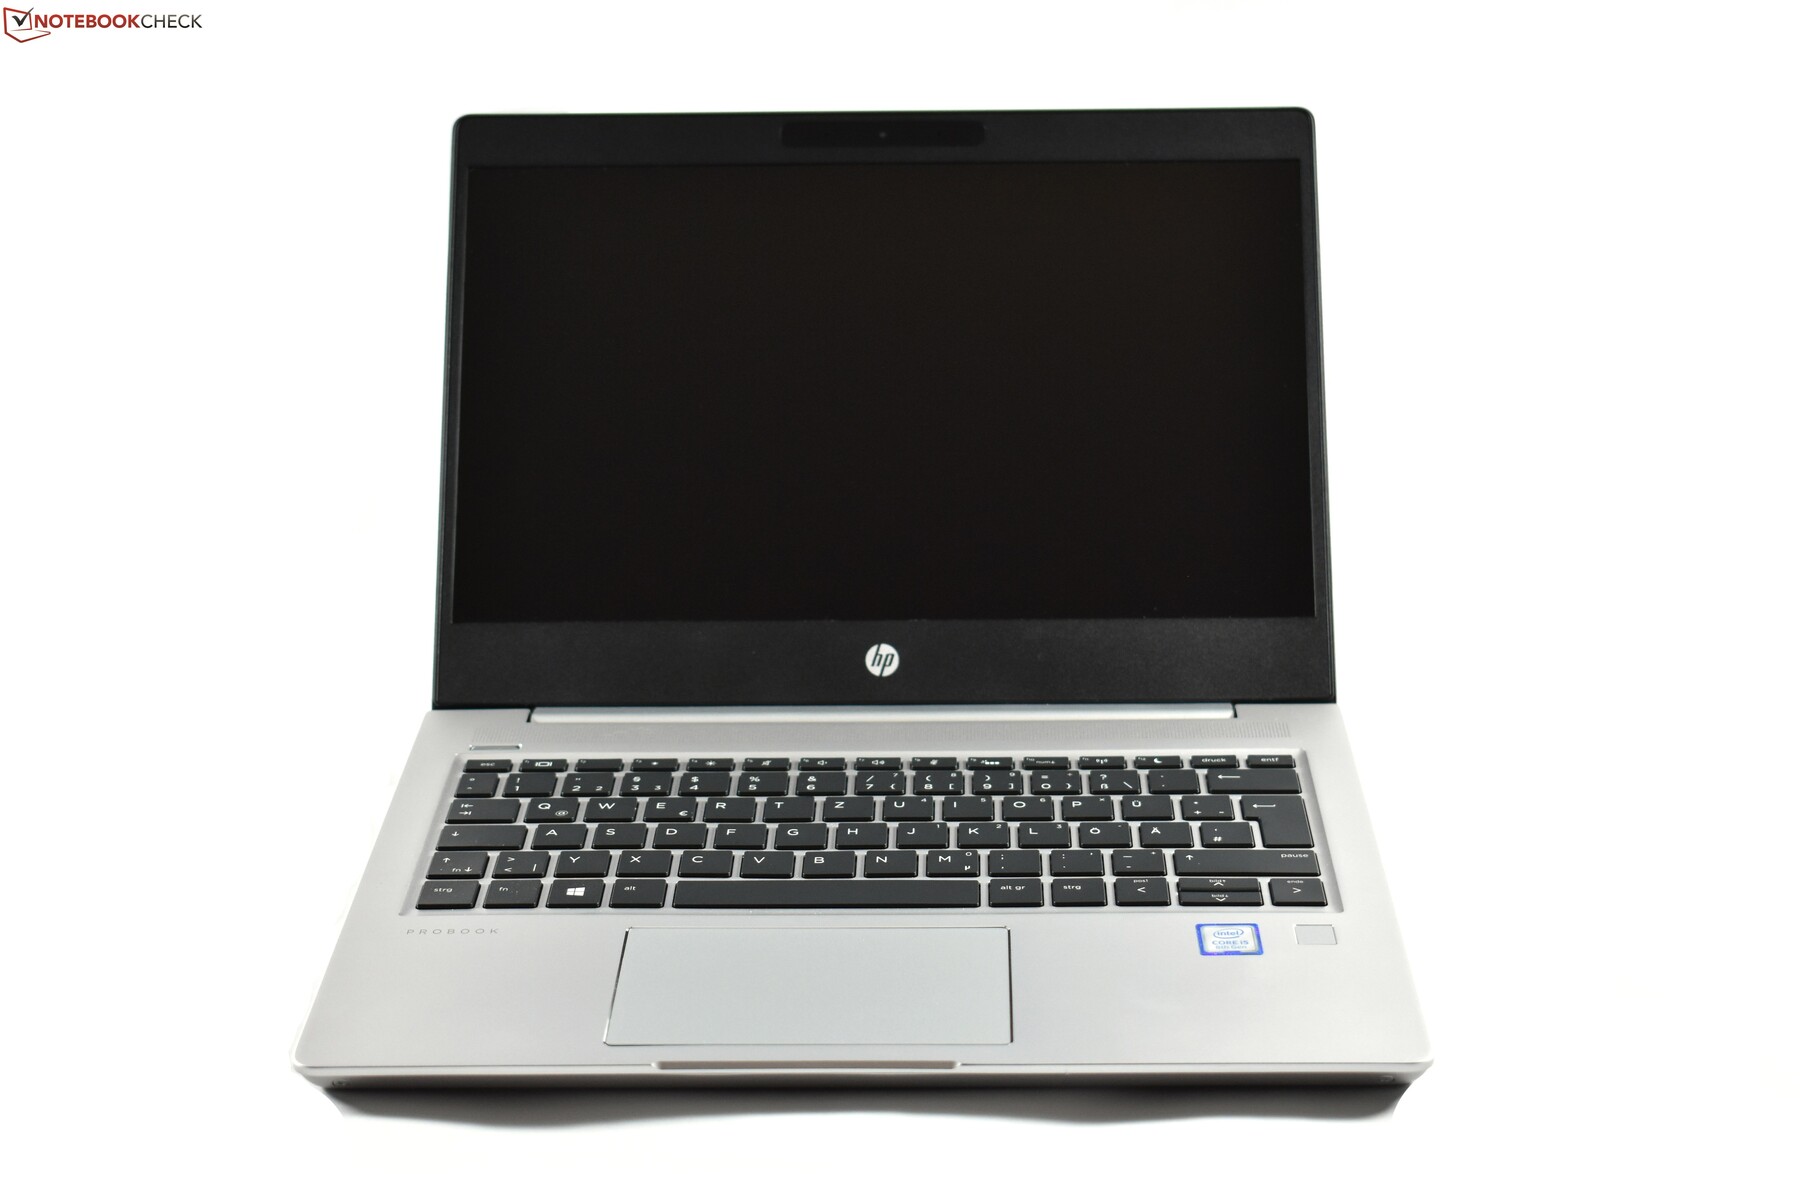
HP ProBook 430 G7 Laptop Review: No big improvement with Comet Lake
HP has updated the ProBooks with 2020 technology. Models with Intel CPUs like the ProBook 430 G7 use the Comet Lake U series. Today's review-unit is the smallest model of the most affordable ProBook 400 series: The ProBook 430 G7 has a 13.3-inch screen that has a resolution of 1,920 x 1,080 (FHD). The other cornerstones of the device: 8 GB RAM, a 256 GB SSD and the Intel Core i7-10510U. This configuration costs at least €899 (~$980) in Germany.
Apart from last years HP ProBook 430 G6, another HP laptop serves for our comparison purposes: The more expensive HP EliteBook 830 G5. From other manufacturers, we use the Lenovo ThinkPad L390 as well as the Dell Latitude 5300 as comparable systems.
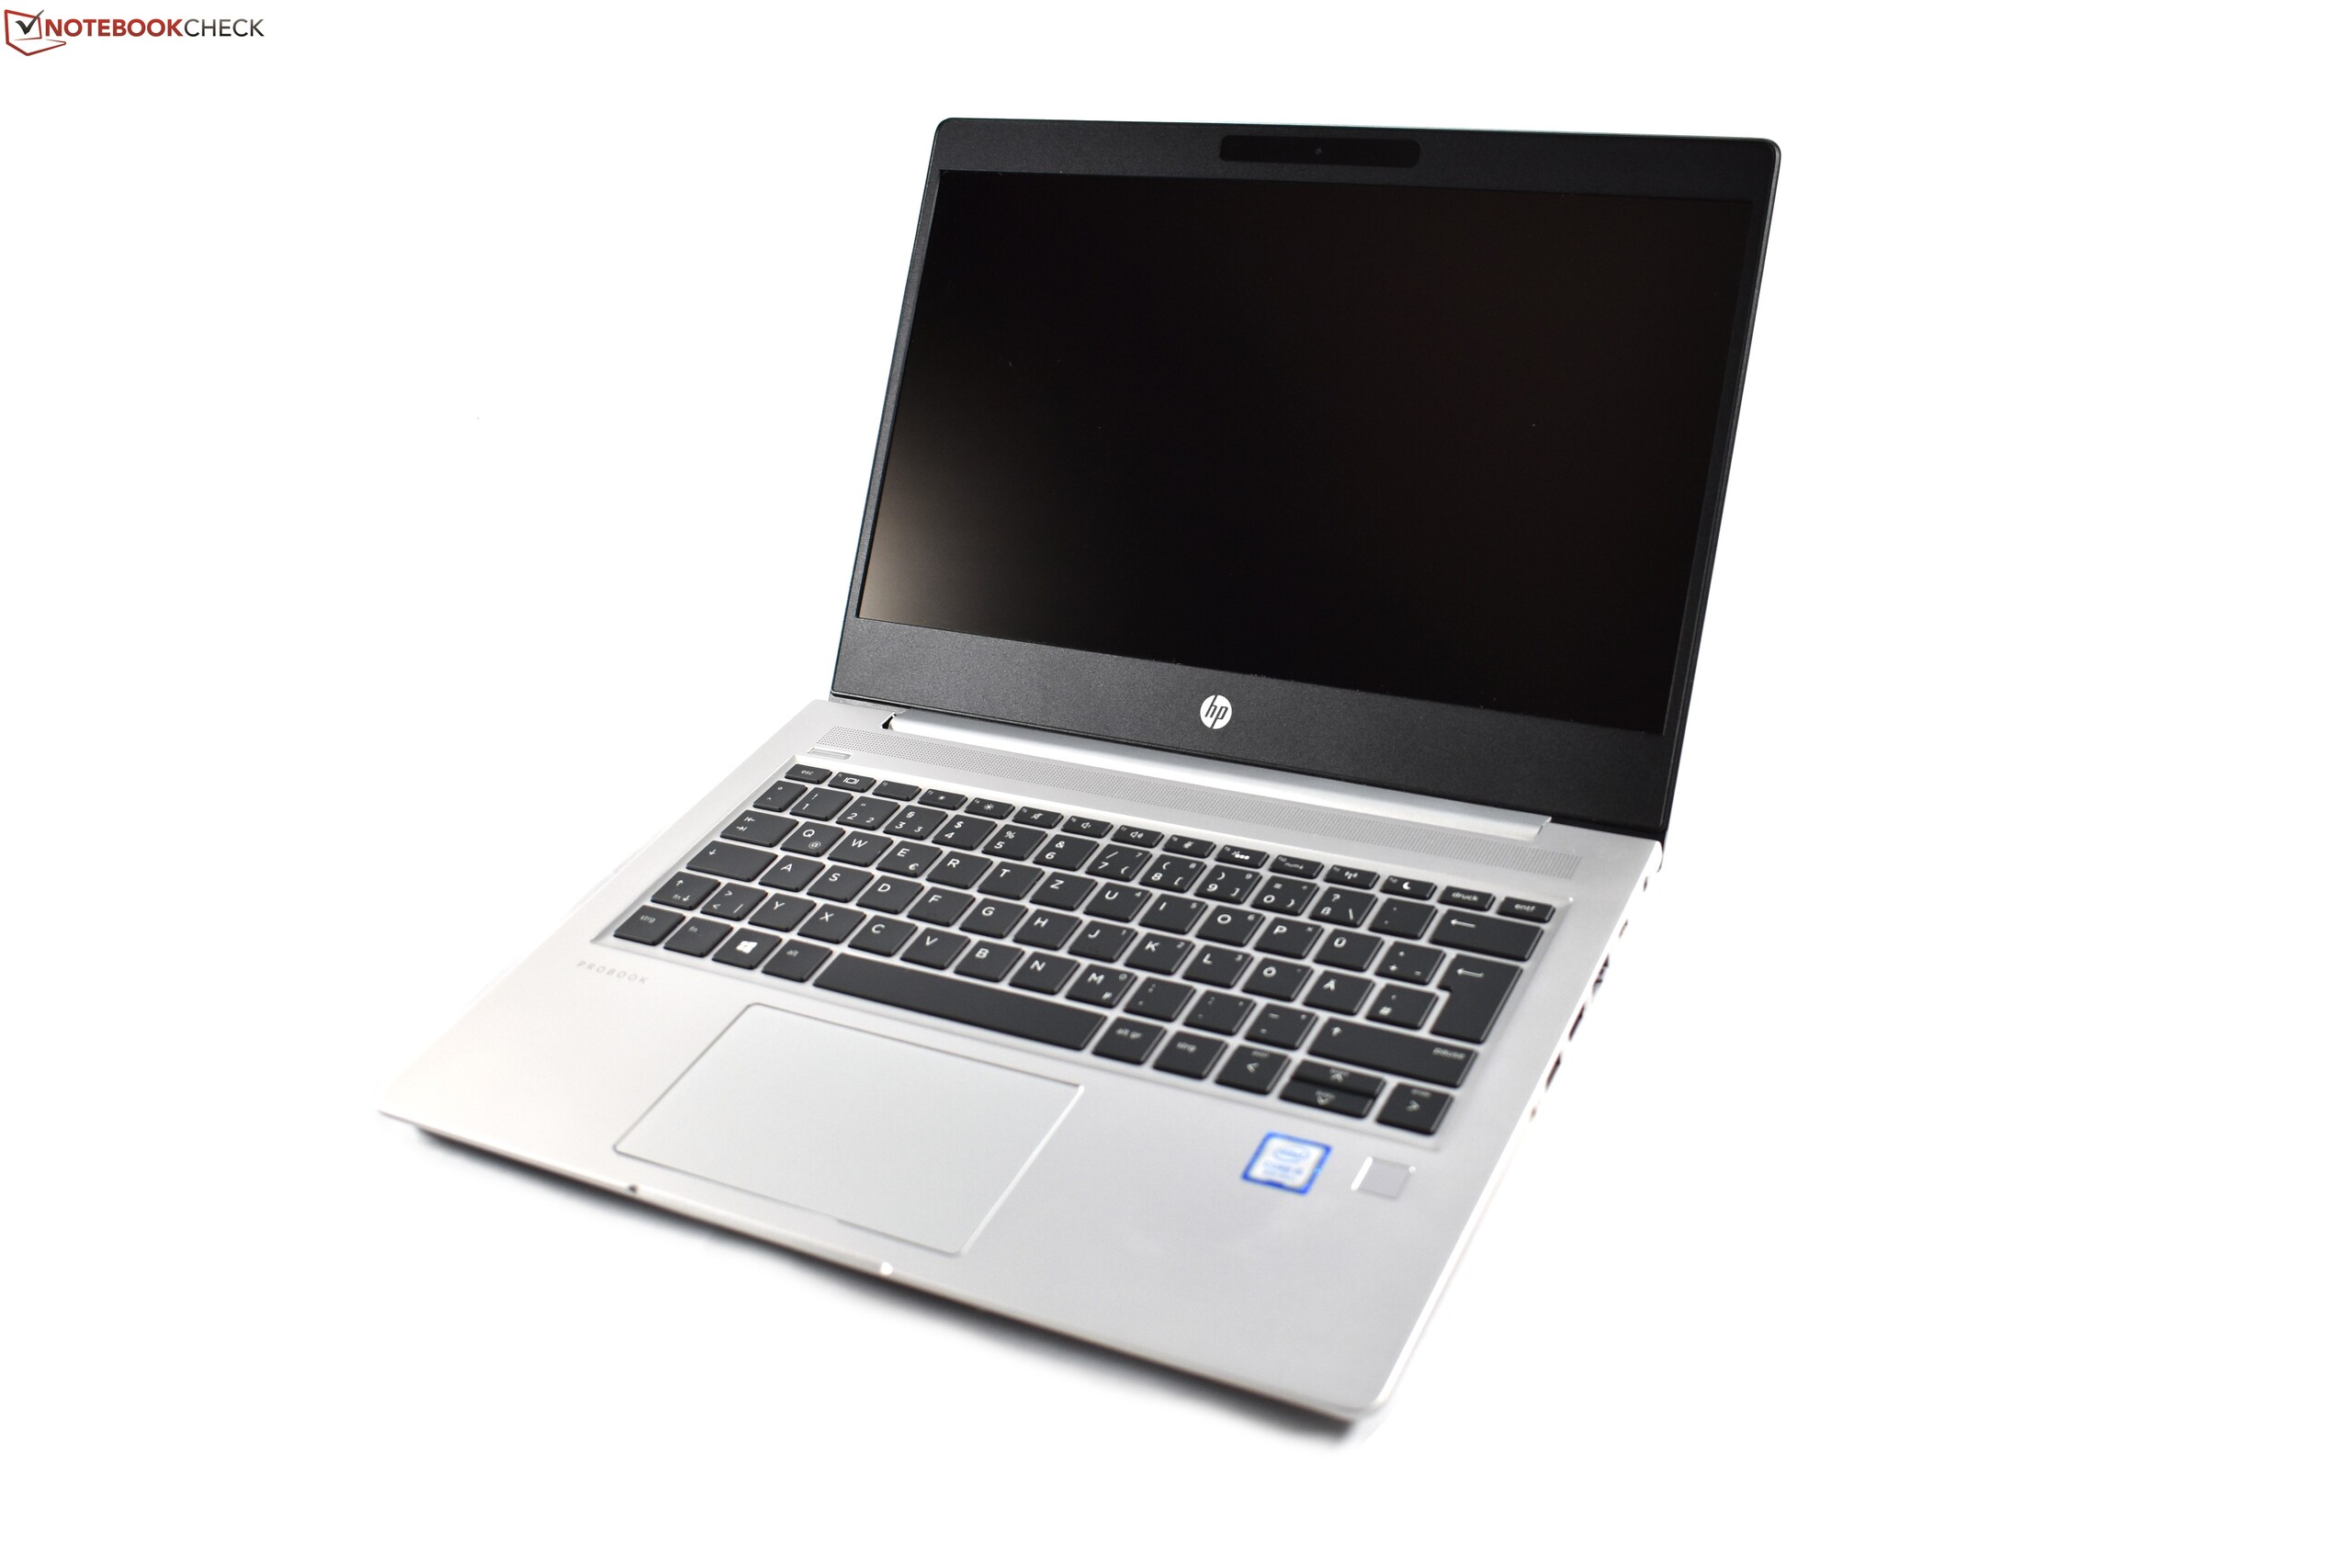
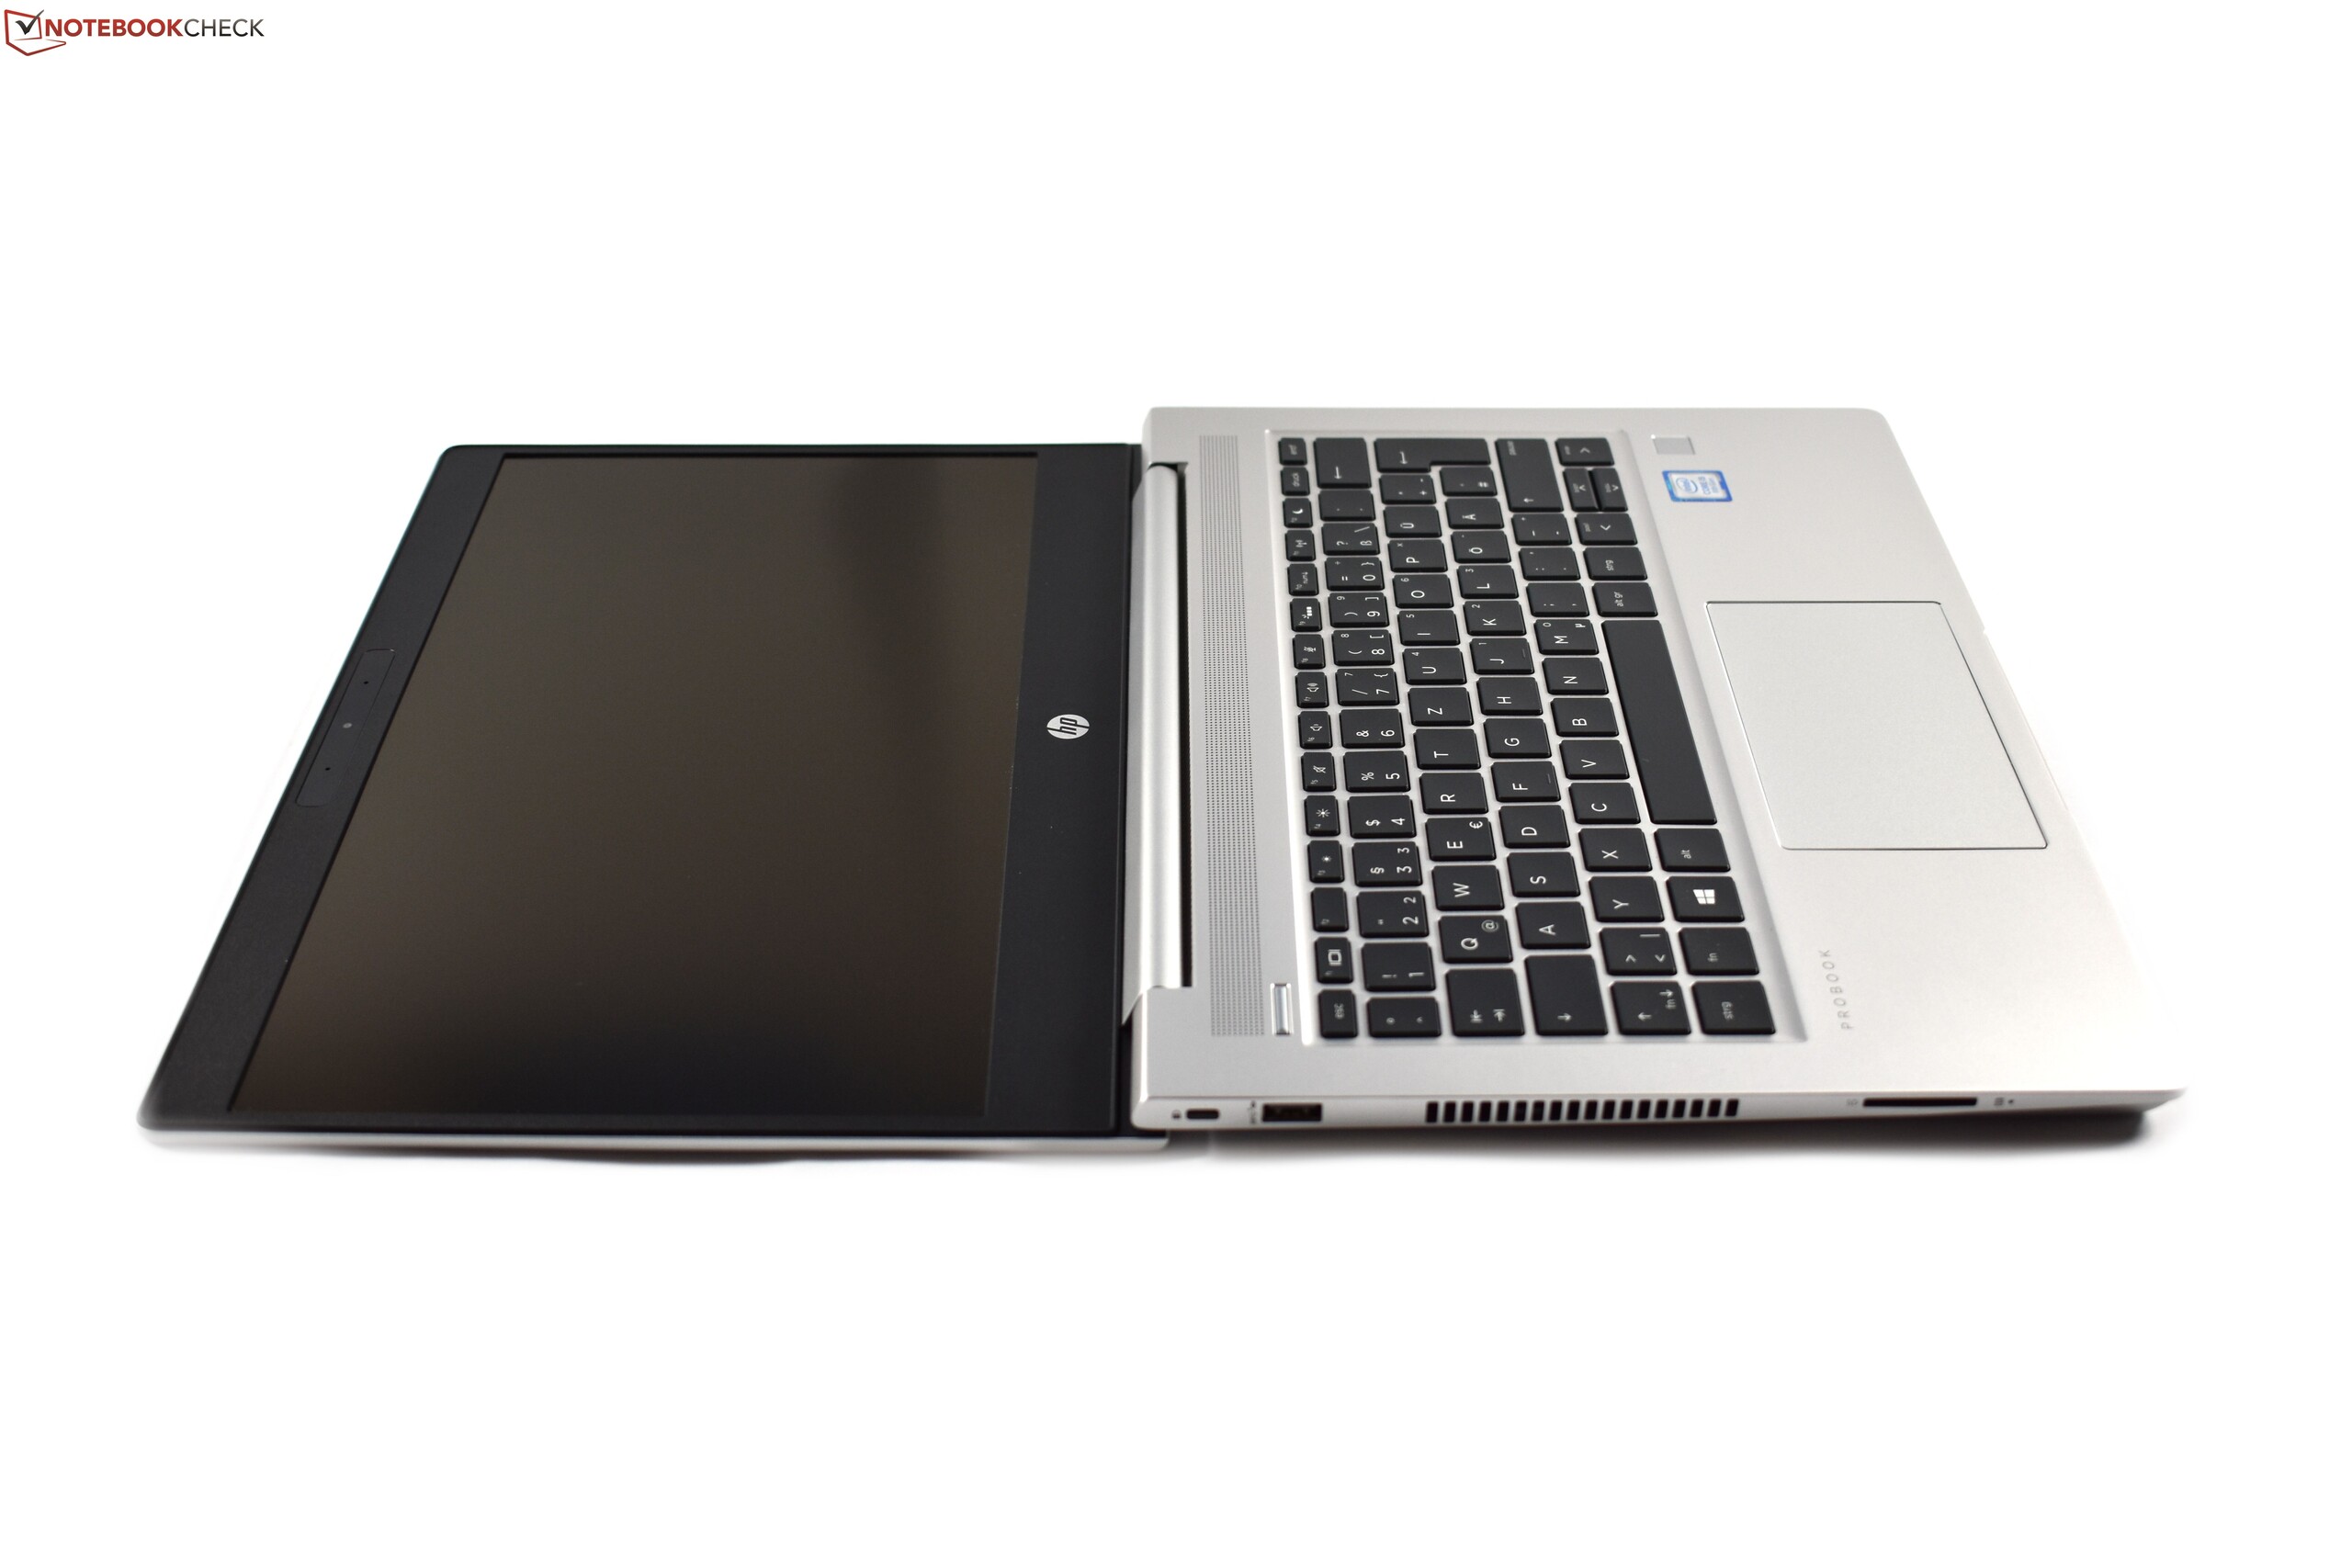
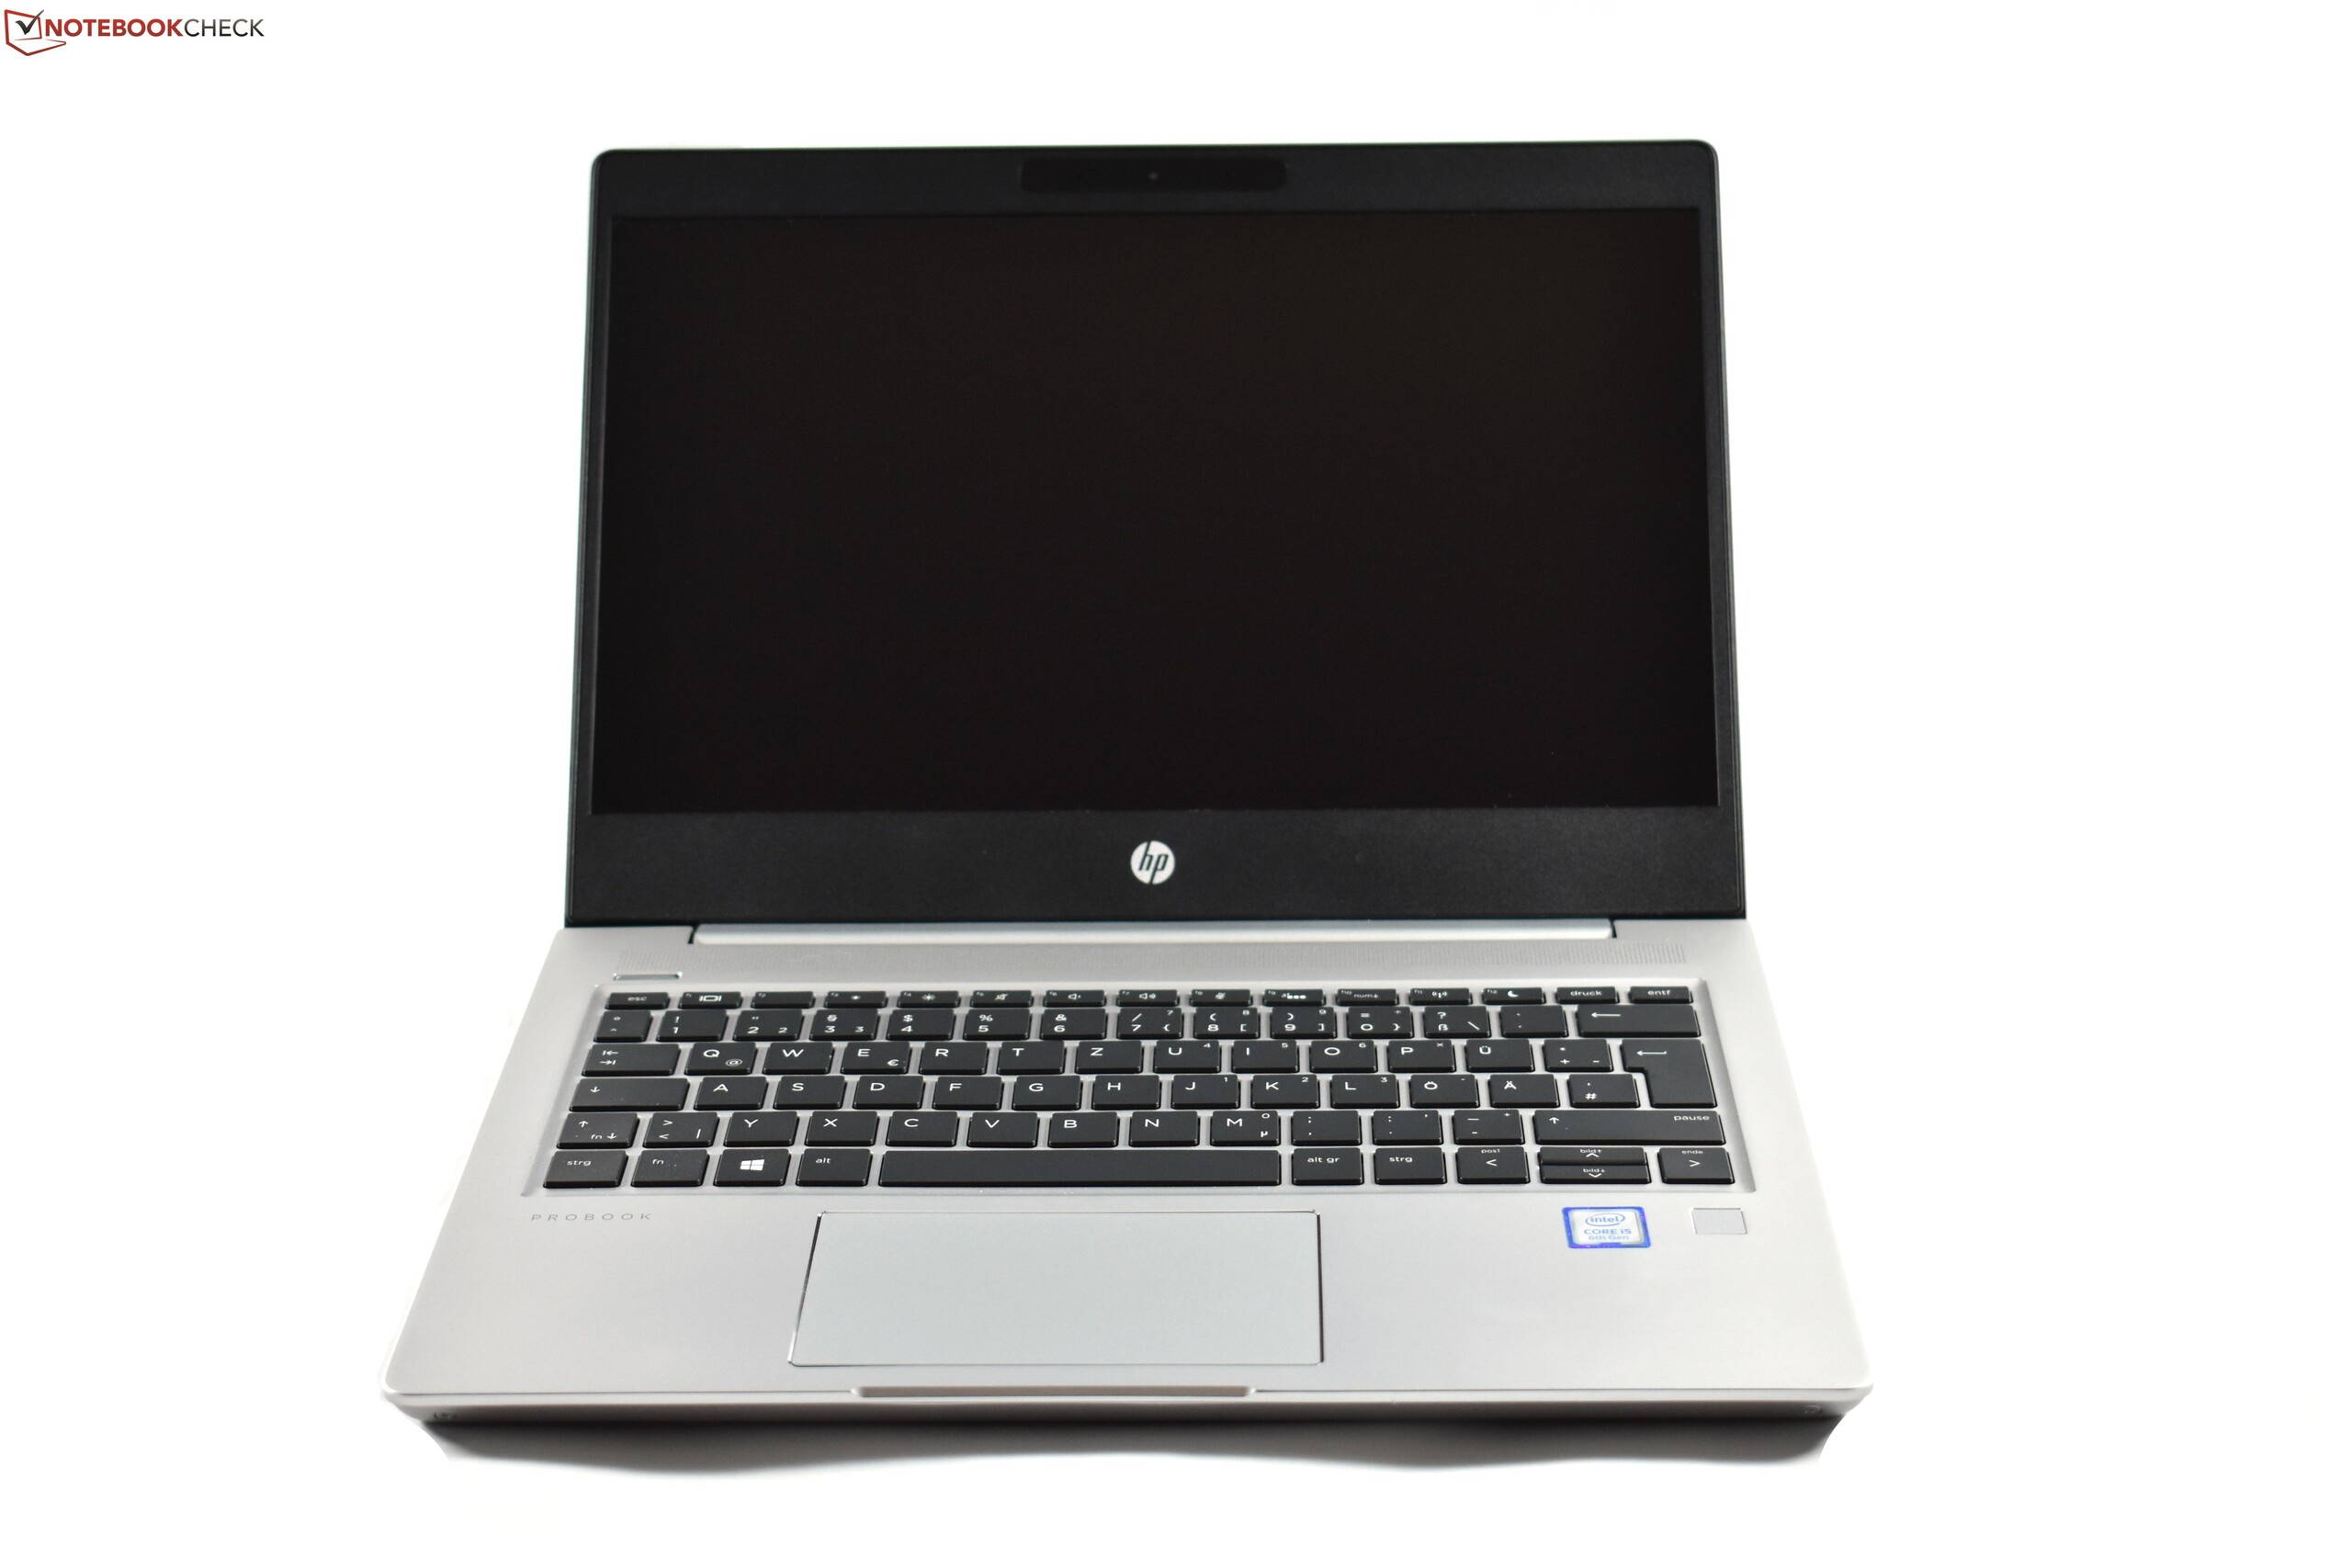
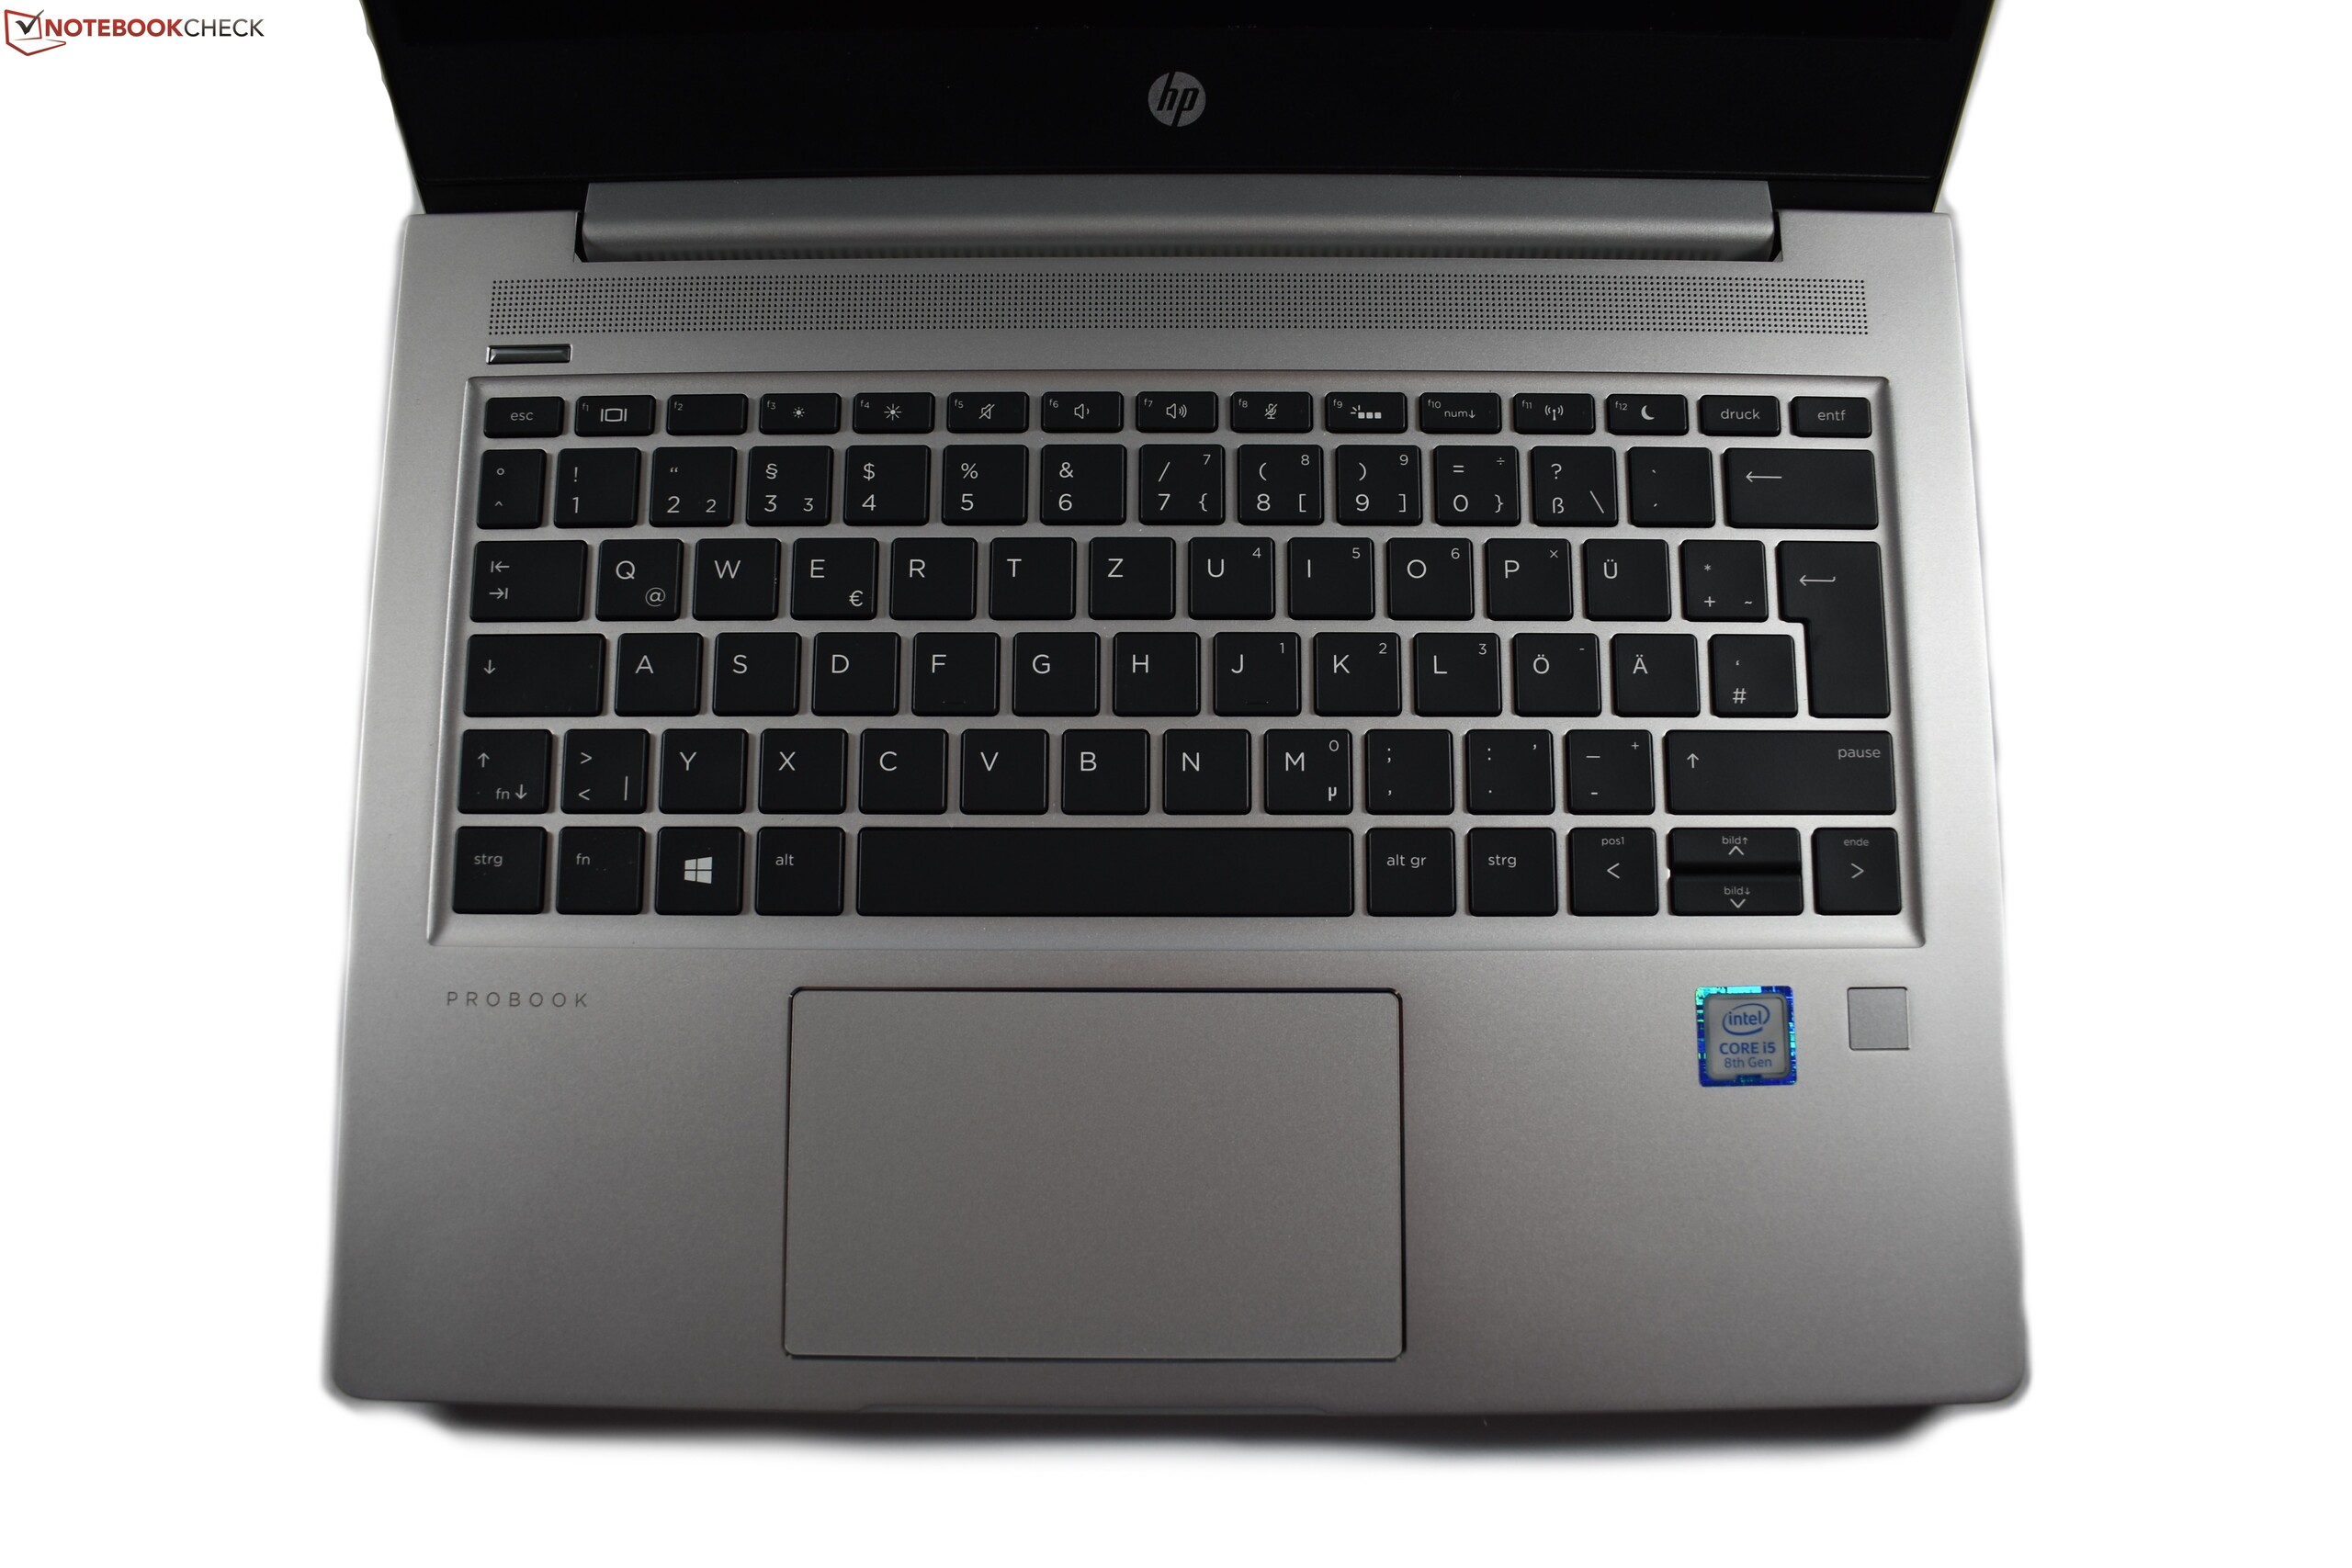
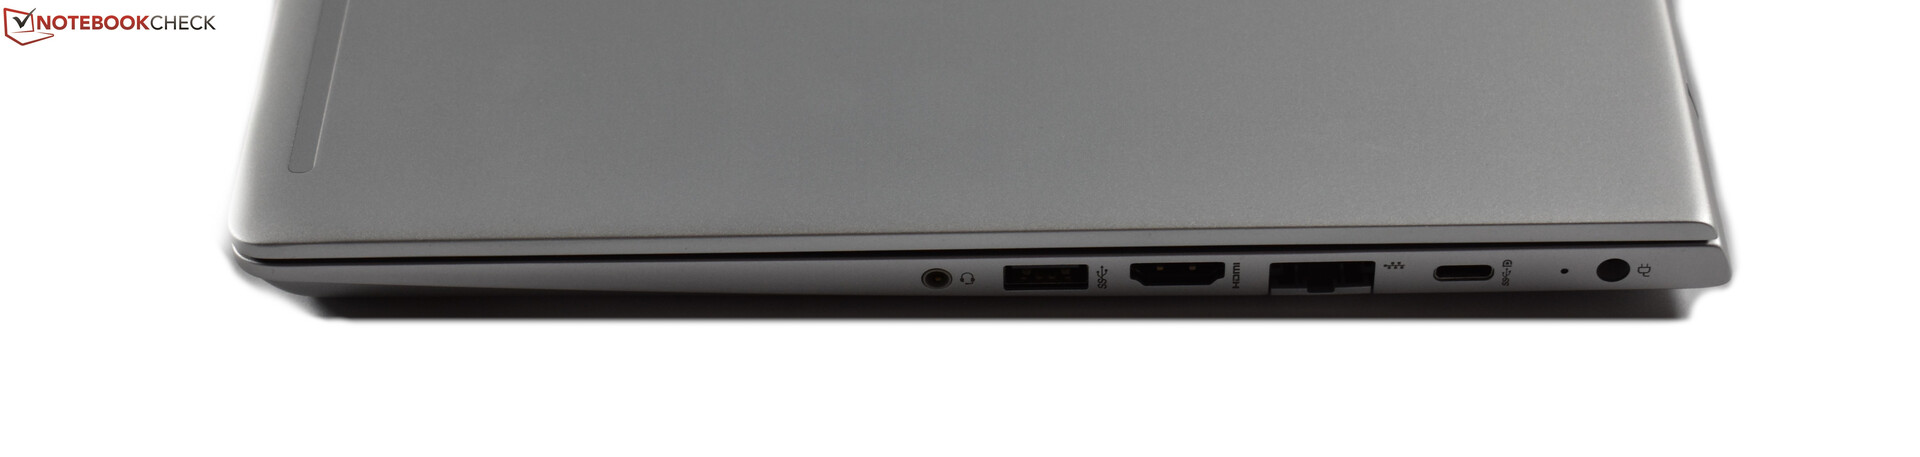
Since HP has refrained from making any design changes compared to last years model, we skip over the description of the chassis, the port-selection and the input devices in this review.
Rating | Date | Model | Weight | Height | Size | Resolution | Price |
|---|---|---|---|---|---|---|---|
| 84.5 % v7 (old) | 05 / 2020 | HP ProBook 430 G7-8VU53EA i7-10510U, UHD Graphics 620 | 1.4 kg | 18 mm | 13.30" | 1920x1080 | |
| 83.8 % v7 (old) | 03 / 2019 | HP ProBook 430 G6-5TJ89EA i5-8265U, UHD Graphics 620 | 1.4 kg | 18 mm | 13.30" | 1920x1080 | |
| 88.2 % v6 (old) | 05 / 2018 | HP EliteBook 830 G5-3JX74EA i5-8550U, UHD Graphics 620 | 1.3 kg | 17.7 mm | 13.30" | 1920x1080 | |
| 88.4 % v6 (old) | 02 / 2019 | Lenovo ThinkPad L390-20NR0013GE i5-8265U, UHD Graphics 620 | 1.5 kg | 18.8 mm | 13.30" | 1920x1080 | |
| 84.9 % v7 (old) | 08 / 2019 | Dell Latitude 5300 i5-8365U, UHD Graphics 620 | 1.4 kg | 19 mm | 13.30" | 1920x1080 |
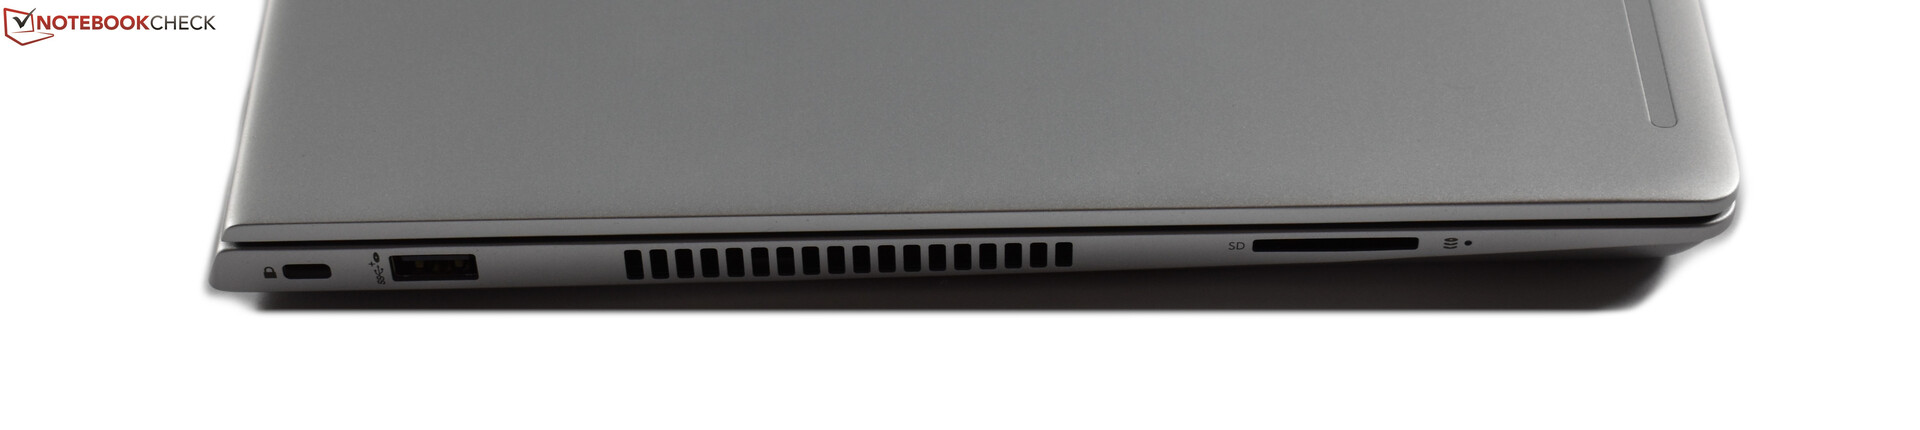
| SD Card Reader | |
| average JPG Copy Test (av. of 3 runs) | |
| Dell Latitude 5300 (Toshiba Exceria Pro M501 64 GB UHS-II) | |
| Lenovo ThinkPad L390-20NR0013GE (Toshiba Exceria Pro M501 UHS-II) | |
| HP ProBook 430 G6-5TJ89EA (Toshiba Exceria Pro SDXC 64 GB UHS-II) | |
| HP ProBook 430 G7-8VU53EA | |
| Average of class Office (22.4 - 198.5, n=22, last 2 years) | |
| maximum AS SSD Seq Read Test (1GB) | |
| Dell Latitude 5300 (Toshiba Exceria Pro M501 64 GB UHS-II) | |
| Lenovo ThinkPad L390-20NR0013GE (Toshiba Exceria Pro M501 UHS-II) | |
| HP ProBook 430 G7-8VU53EA (Toshiba Exceria Pro SDXC 64 GB UHS-II) | |
| HP ProBook 430 G6-5TJ89EA (Toshiba Exceria Pro SDXC 64 GB UHS-II) | |
| Average of class Office (27.4 - 249, n=20, last 2 years) | |
Communication
Wi-Fi-6 is used for the first time in the affordable ProBook series with the ProBook 430 G7. In the predecessor, the Intel Wireless 9560AC was responsible for the wireless internet connection. In the new ProBook, this job is occupied by the Intel Wireless AX201, a modern 2x2-AX-Wi-Fi card. In the benchmarks, this WLAN module easily beats the older AC cards – though you need an Wi-Fi 6 router for that, of course.
Webcam


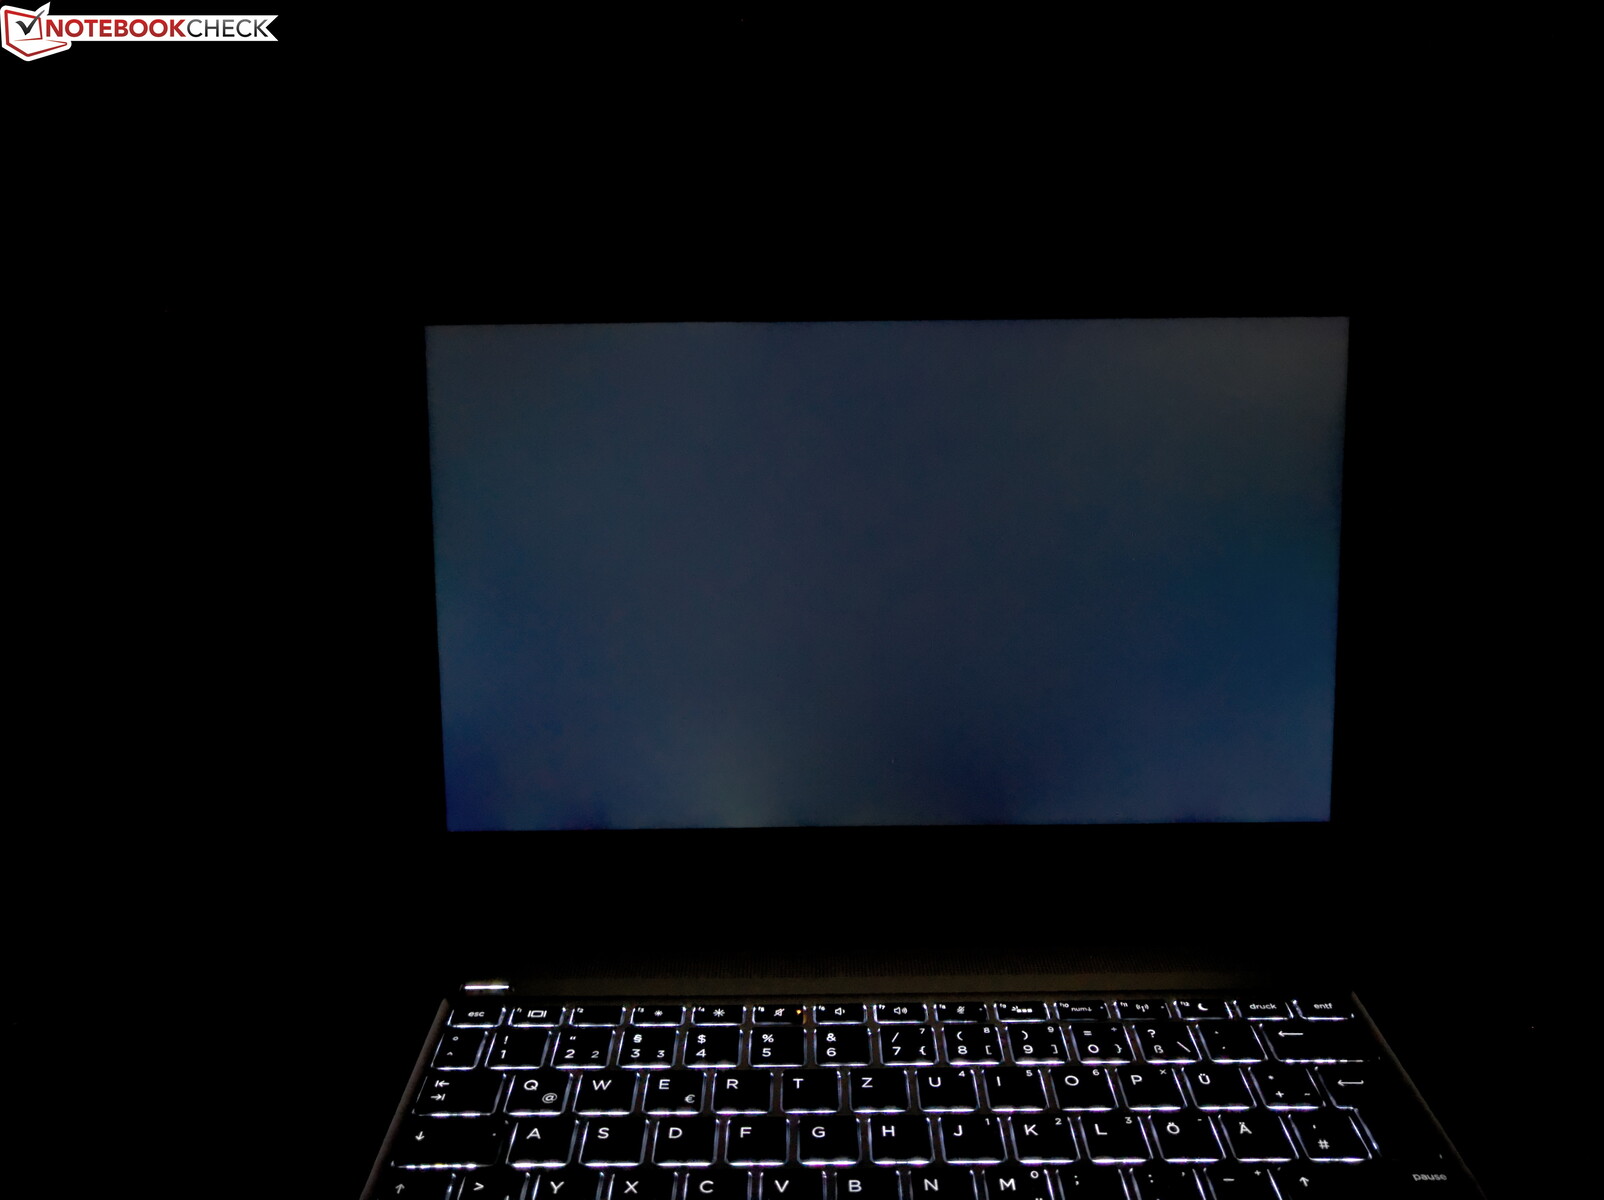
HP laptop with matte FHD display
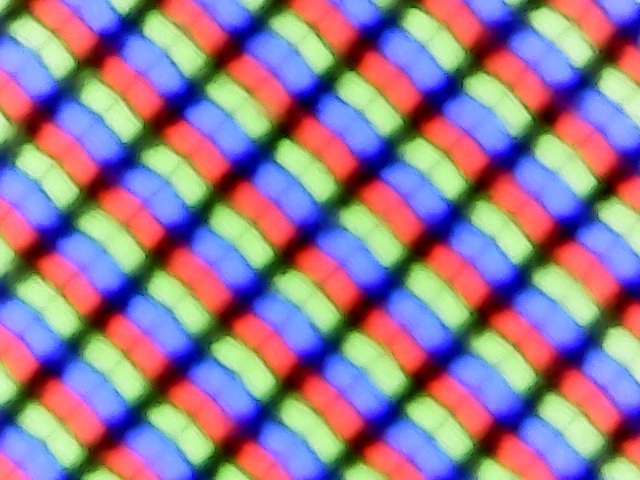
HP serves up quite a few screen options with the ProBook 430 G7. At the lower end, we find a HD TN panel. As the middle-of-the-road option, there is an FHD IPS panel and finally, the premium choice is a SureView FHD IPS screen with up to 1,000 cd/m². It gets more complicated because of the touch-options: There are HD and FHD panels with touch – both of which are TN based. There are no IPS touch-panels available. The touchscreens are glossy, the non-touch panels are matte.
For the normal non-touch FHD screen, HP advertises a brightness value of 250 cd/m². With an average of 284 cd/m², the review sample clearly beats this mark. The screen is roughly 50 cd/m² brighter than the panel used in the predecessor. This is progress, but the FHD LCD of the more expensive HP EliteBook 830 G5 is still a lot brighter. This is one point where the price difference is clearly visible.
The measured PWM value of 1000 Hz does not give us headaches, it would have to be substantially lower for that.
| |||||||||||||||||||||||||
Brightness Distribution: 90 %
Center on Battery: 296 cd/m²
Contrast: 1200:1 (Black: 0.25 cd/m²)
ΔE ColorChecker Calman: 5.9 | ∀{0.5-29.43 Ø4.73}
calibrated: 4.6
ΔE Greyscale Calman: 4 | ∀{0.09-98 Ø4.97}
62.4% sRGB (Calman 2D)
62.4% sRGB (Argyll 1.6.3 3D)
40.4% AdobeRGB 1998 (Argyll 1.6.3 3D)
44.21% AdobeRGB 1998 (Argyll 3D)
62.8% sRGB (Argyll 3D)
42.79% Display P3 (Argyll 3D)
Gamma: 2.23
CCT: 7154 K
| HP ProBook 430 G7-8VU53EA BOE08A6, IPS LED, 1920x1080, 13.3" | HP ProBook 430 G6-5TJ89EA CMN1375, IPS LED, 1920x1080, 13.3" | HP EliteBook 830 G5-3JX74EA IVO M133NVF3-R0, IPS LED, 1920x1080, 13.3" | Lenovo ThinkPad L390-20NR0013GE LP133WF2-SPL8, IPS LED, 1920x1080, 13.3" | Dell Latitude 5300 LGD05ED-133WF6, IPS, 1920x1080, 13.3" | |
|---|---|---|---|---|---|
| Display | -1% | 46% | -5% | 55% | |
| Display P3 Coverage (%) | 42.79 | 41.87 -2% | 64.2 50% | 40.42 -6% | 68.2 59% |
| sRGB Coverage (%) | 62.8 | 62.6 0% | 89.2 42% | 60.4 -4% | 94.4 50% |
| AdobeRGB 1998 Coverage (%) | 44.21 | 43.3 -2% | 65.2 47% | 41.8 -5% | 68.7 55% |
| Response Times | 11% | 24% | 9% | 19% | |
| Response Time Grey 50% / Grey 80% * (ms) | 48.8 ? | 40.8 ? 16% | 36 ? 26% | 42.8 ? 12% | 38 ? 22% |
| Response Time Black / White * (ms) | 32 ? | 30.4 ? 5% | 24.8 ? 22% | 30 ? 6% | 27.2 ? 15% |
| PWM Frequency (Hz) | 1000 ? | 26040 ? | 1020 ? | 30490 ? | |
| Screen | 3% | 21% | -14% | 28% | |
| Brightness middle (cd/m²) | 300 | 255 -15% | 316 5% | 298 -1% | 326 9% |
| Brightness (cd/m²) | 285 | 238 -16% | 326 14% | 278 -2% | 313 10% |
| Brightness Distribution (%) | 90 | 88 -2% | 85 -6% | 81 -10% | 87 -3% |
| Black Level * (cd/m²) | 0.25 | 0.18 28% | 0.19 24% | 0.33 -32% | 0.27 -8% |
| Contrast (:1) | 1200 | 1417 18% | 1663 39% | 903 -25% | 1207 1% |
| Colorchecker dE 2000 * | 5.9 | 5.4 8% | 4.5 24% | 6.5 -10% | 3.2 46% |
| Colorchecker dE 2000 max. * | 20 | 19.5 2% | 12.1 39% | 23.9 -19% | 6.3 68% |
| Colorchecker dE 2000 calibrated * | 4.6 | 4.1 11% | 2.9 37% | 4.9 -7% | 1.6 65% |
| Greyscale dE 2000 * | 4 | 3.8 5% | 5 -25% | 5.6 -40% | 3.8 5% |
| Gamma | 2.23 99% | 2.41 91% | 2.22 99% | 2.08 106% | 2.14 103% |
| CCT | 7154 91% | 7100 92% | 6018 108% | 6669 97% | 6900 94% |
| Color Space (Percent of AdobeRGB 1998) (%) | 40.4 | 39.4 -2% | 57.9 43% | 38.4 -5% | 63.8 58% |
| Color Space (Percent of sRGB) (%) | 62.4 | 62.5 0% | 87.3 40% | 60.1 -4% | 94.8 52% |
| Total Average (Program / Settings) | 4% /
3% | 30% /
26% | -3% /
-10% | 34% /
32% |
* ... smaller is better
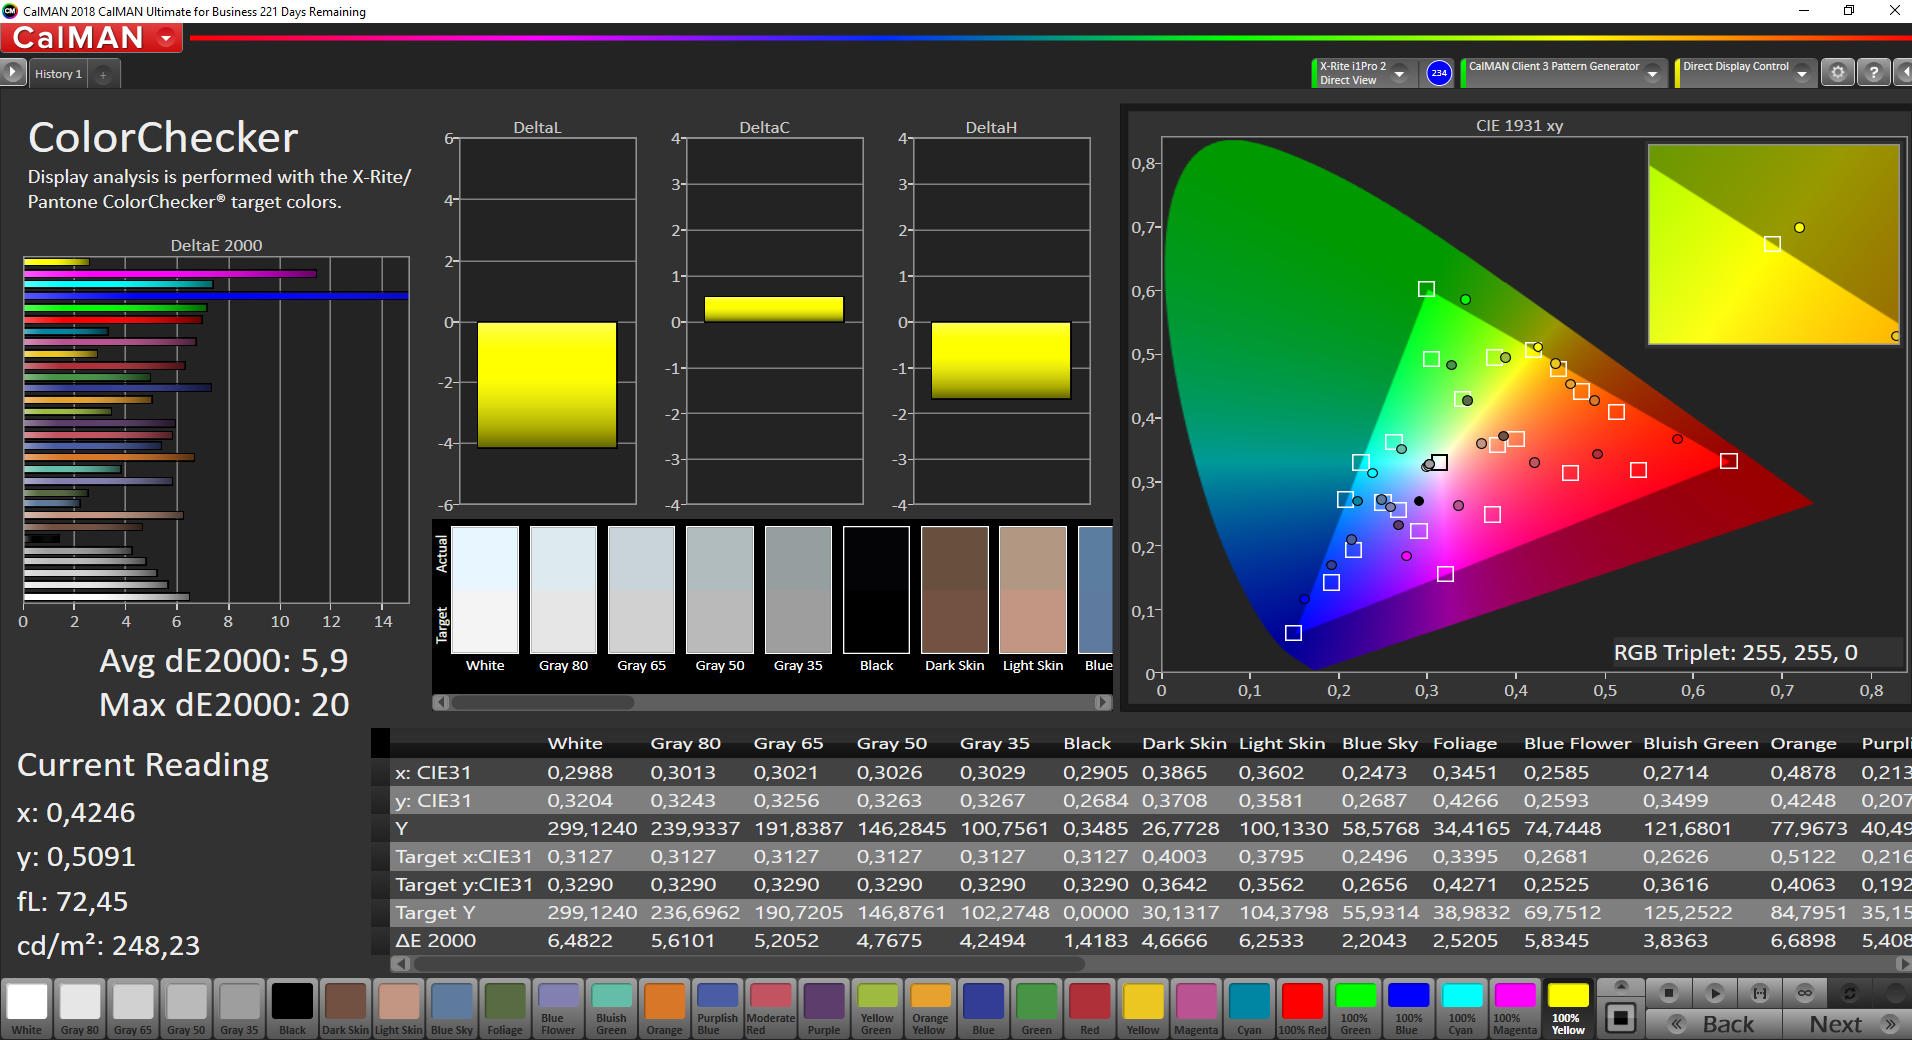
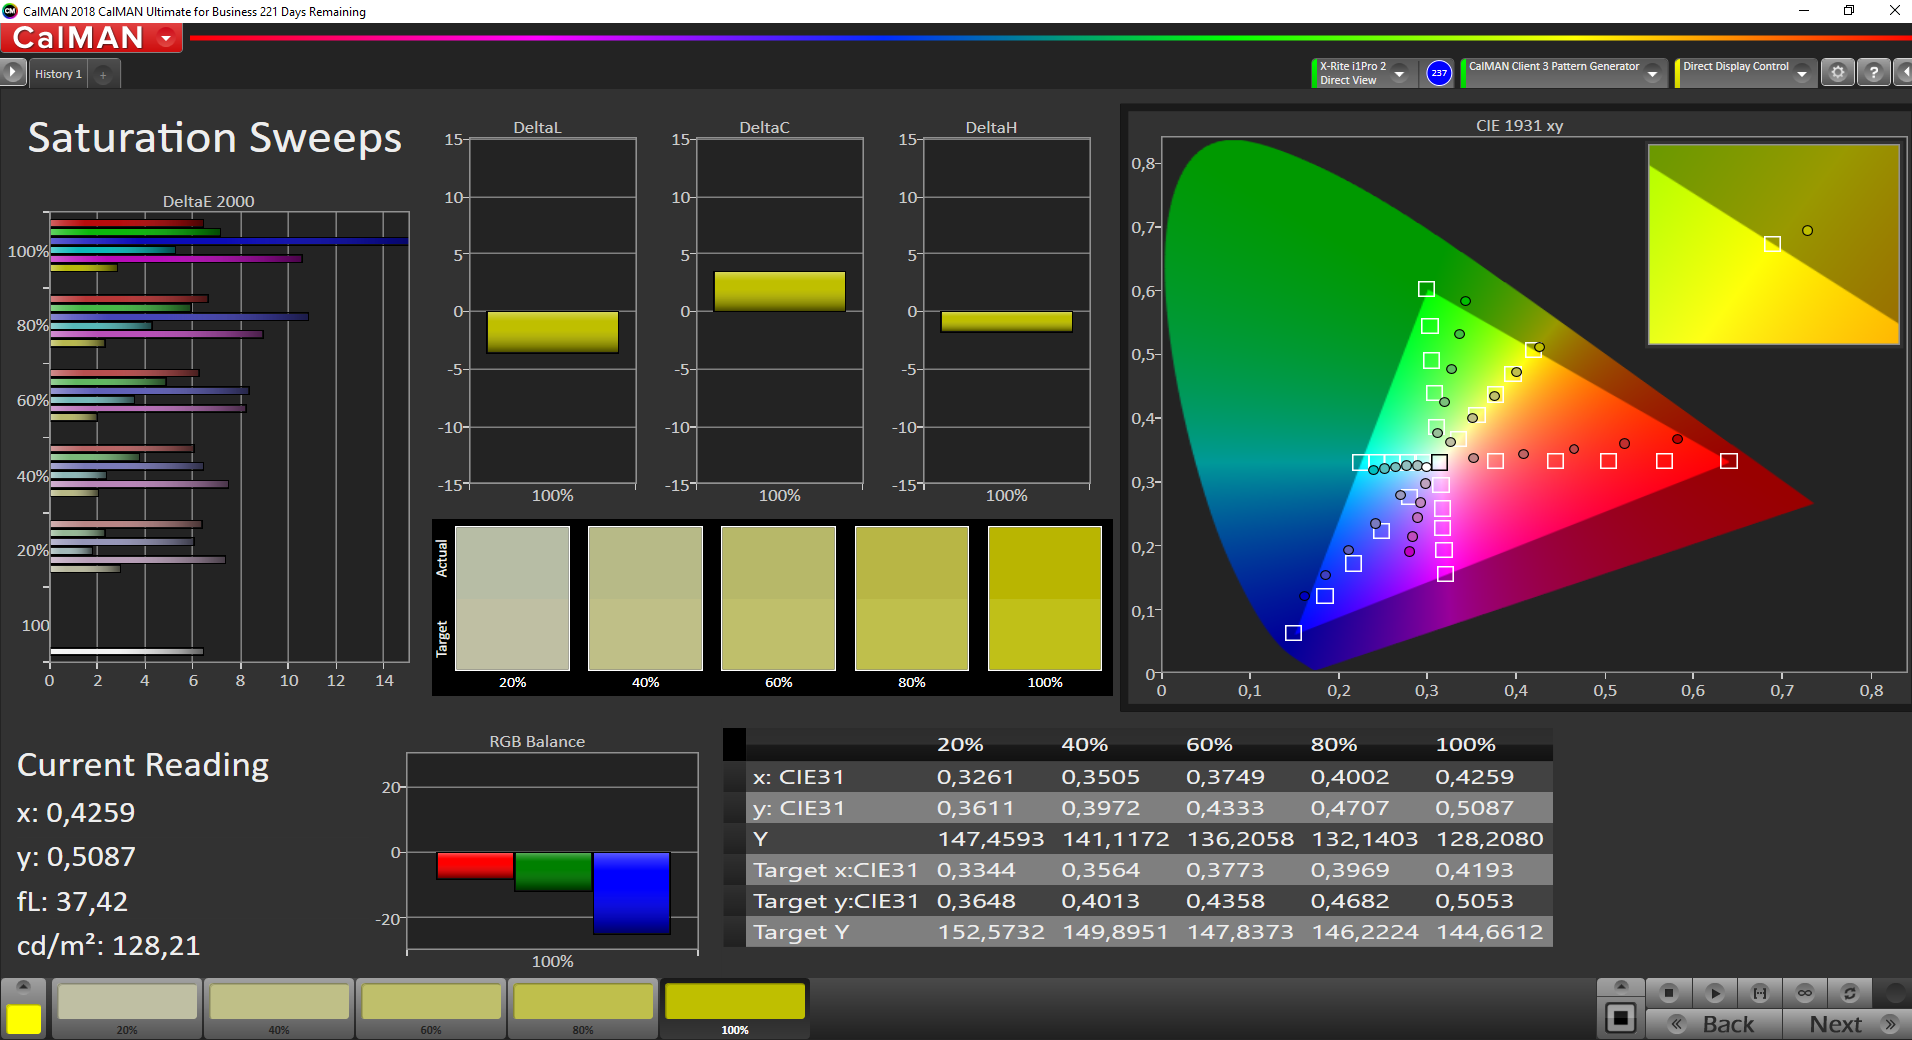
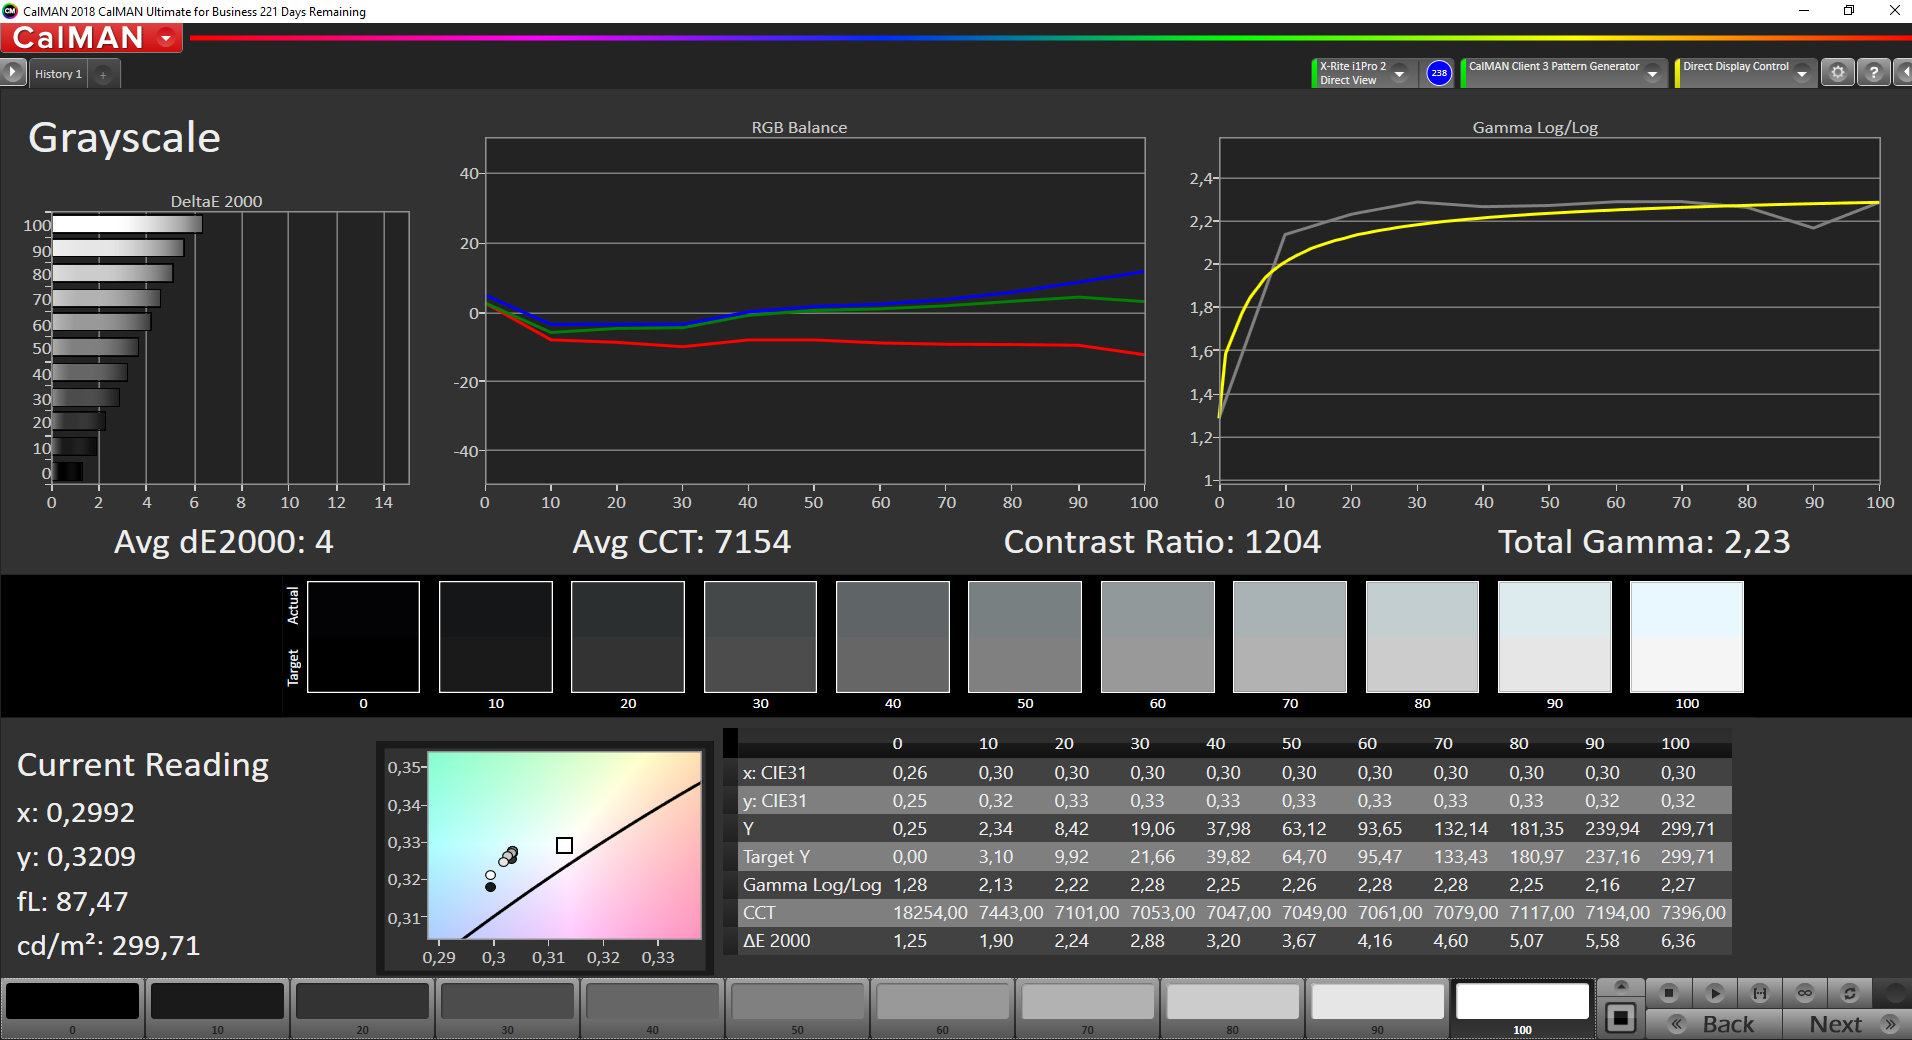
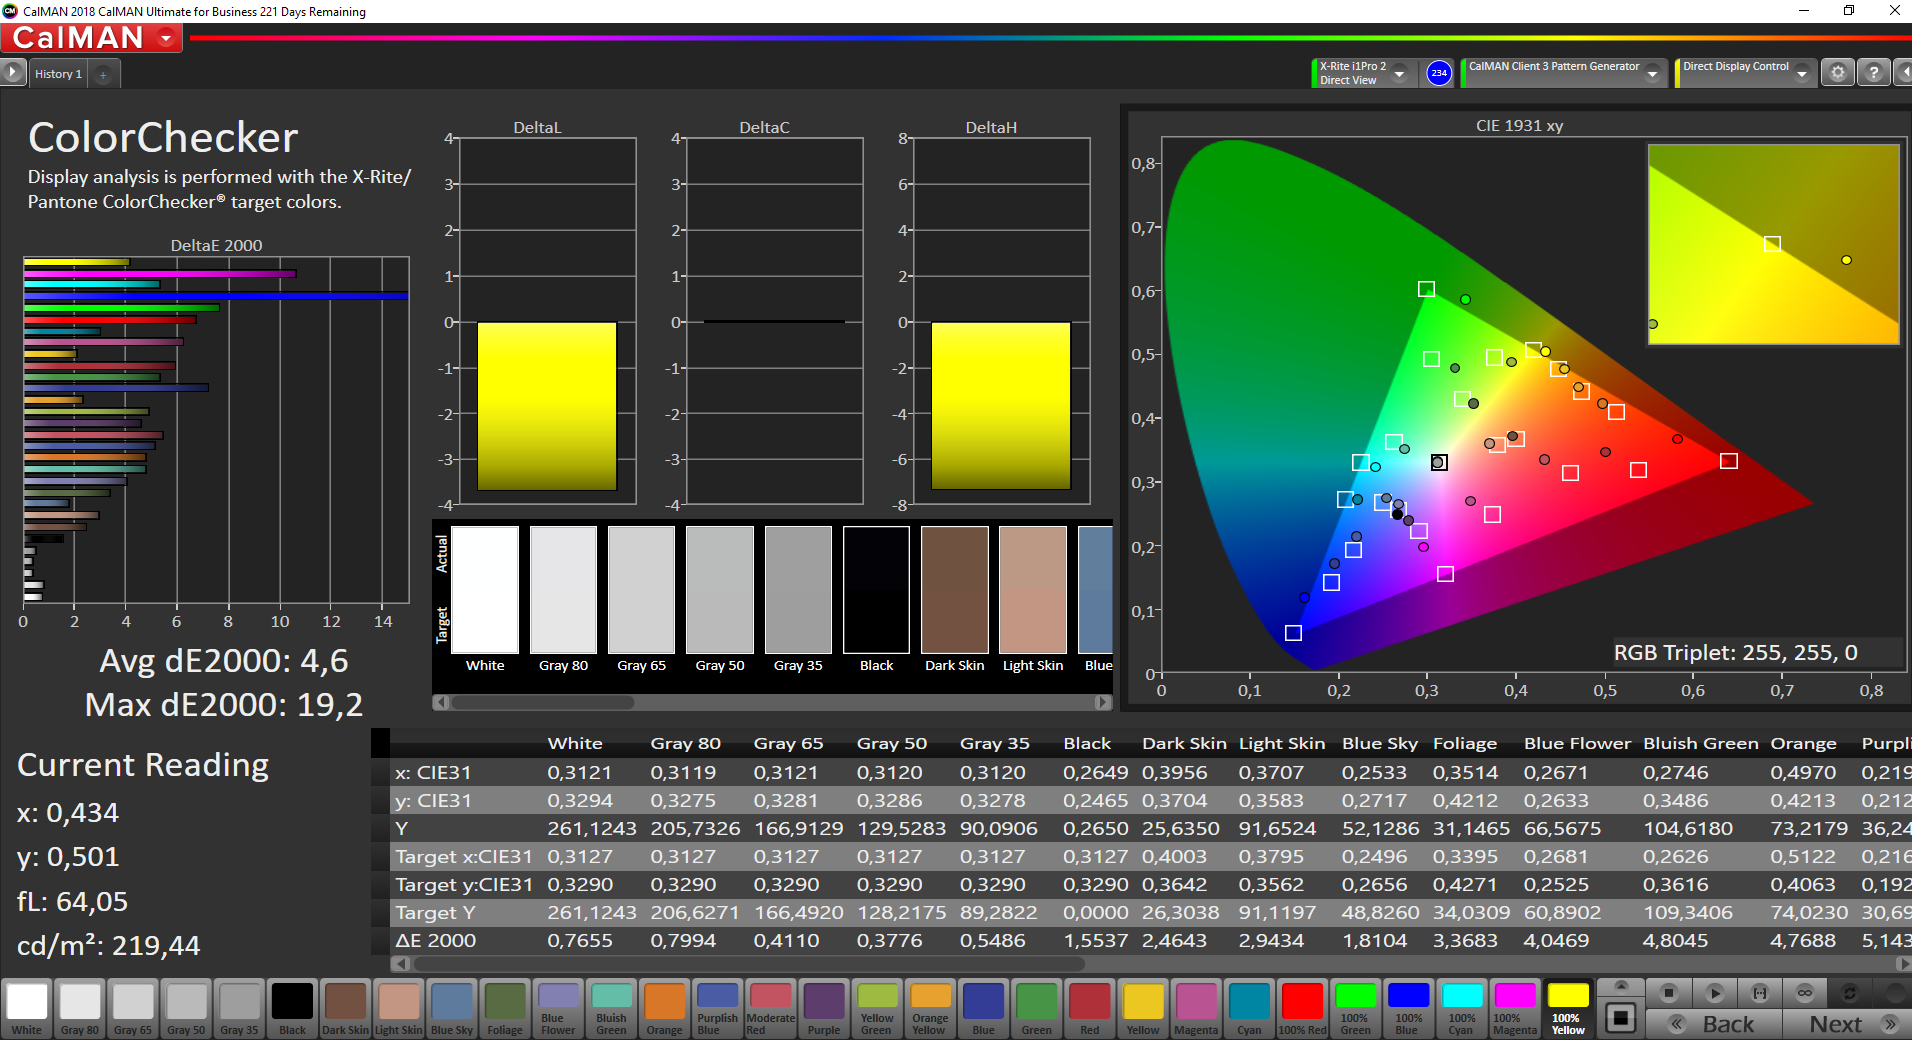
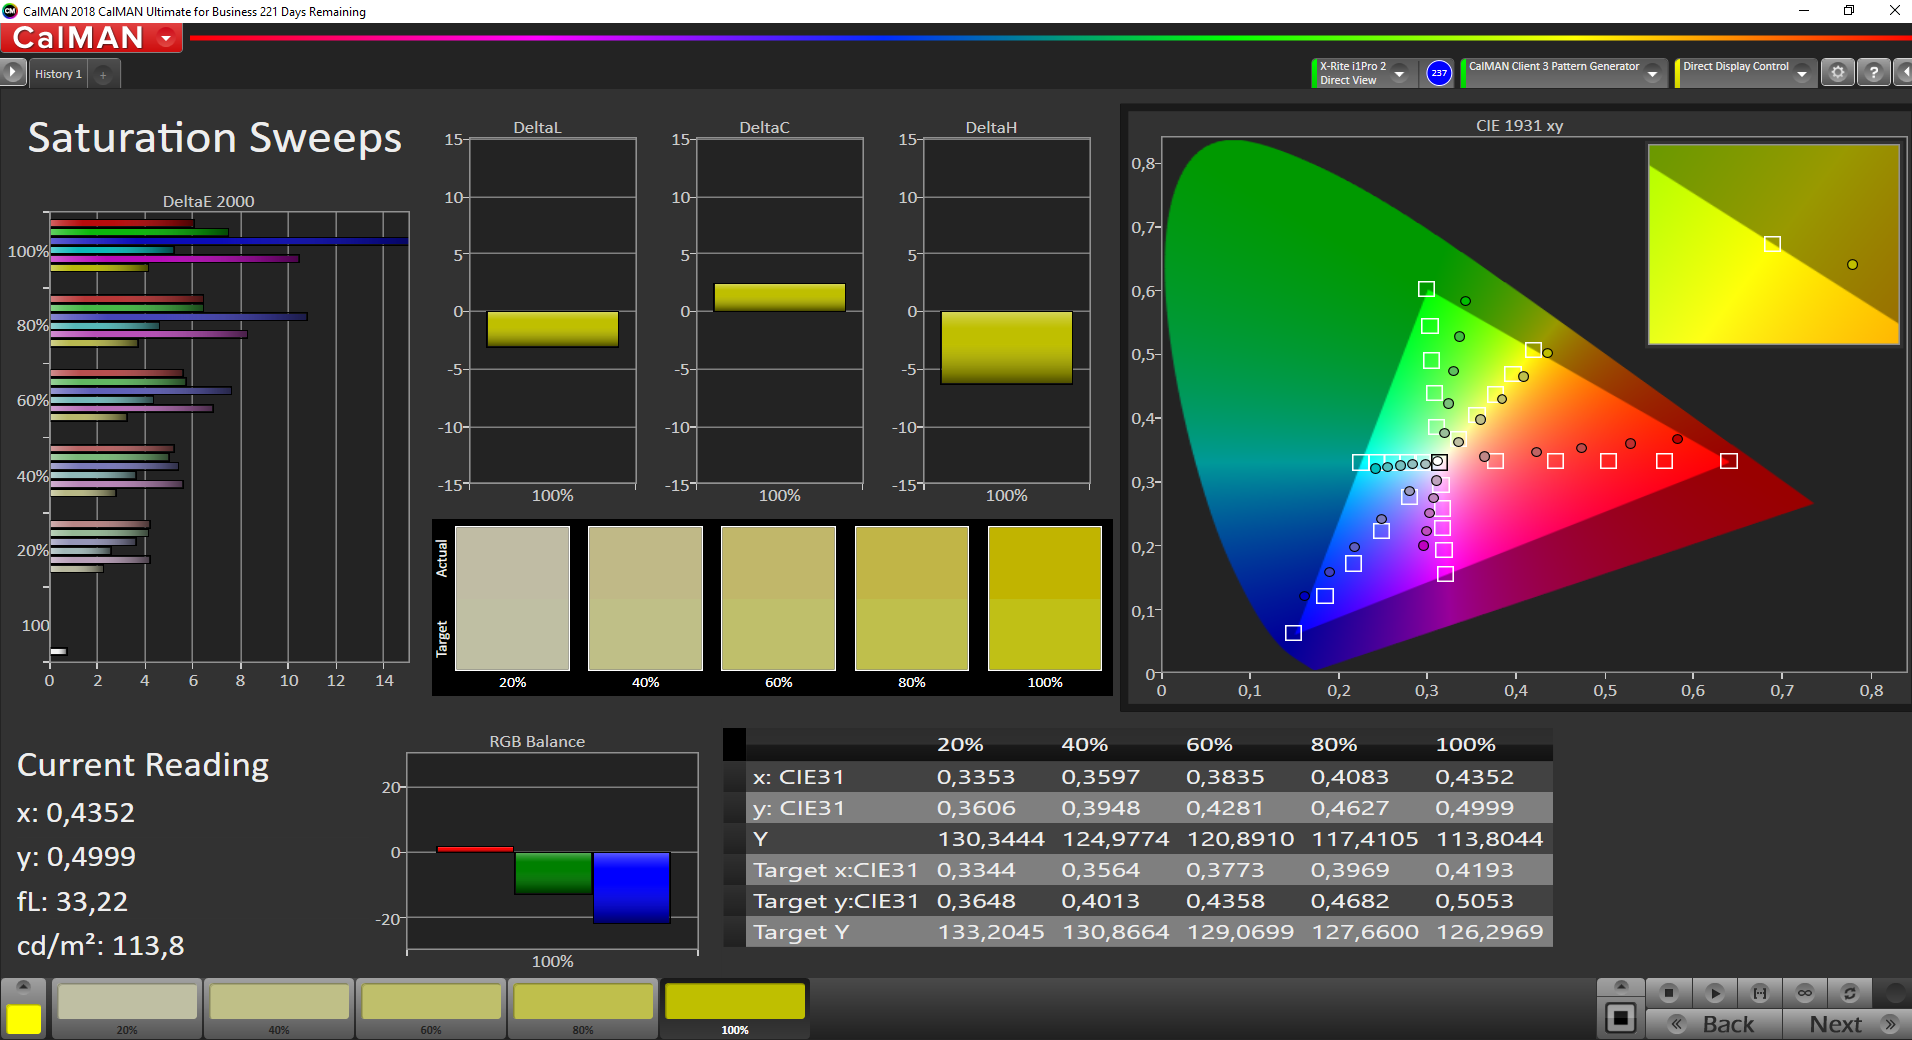
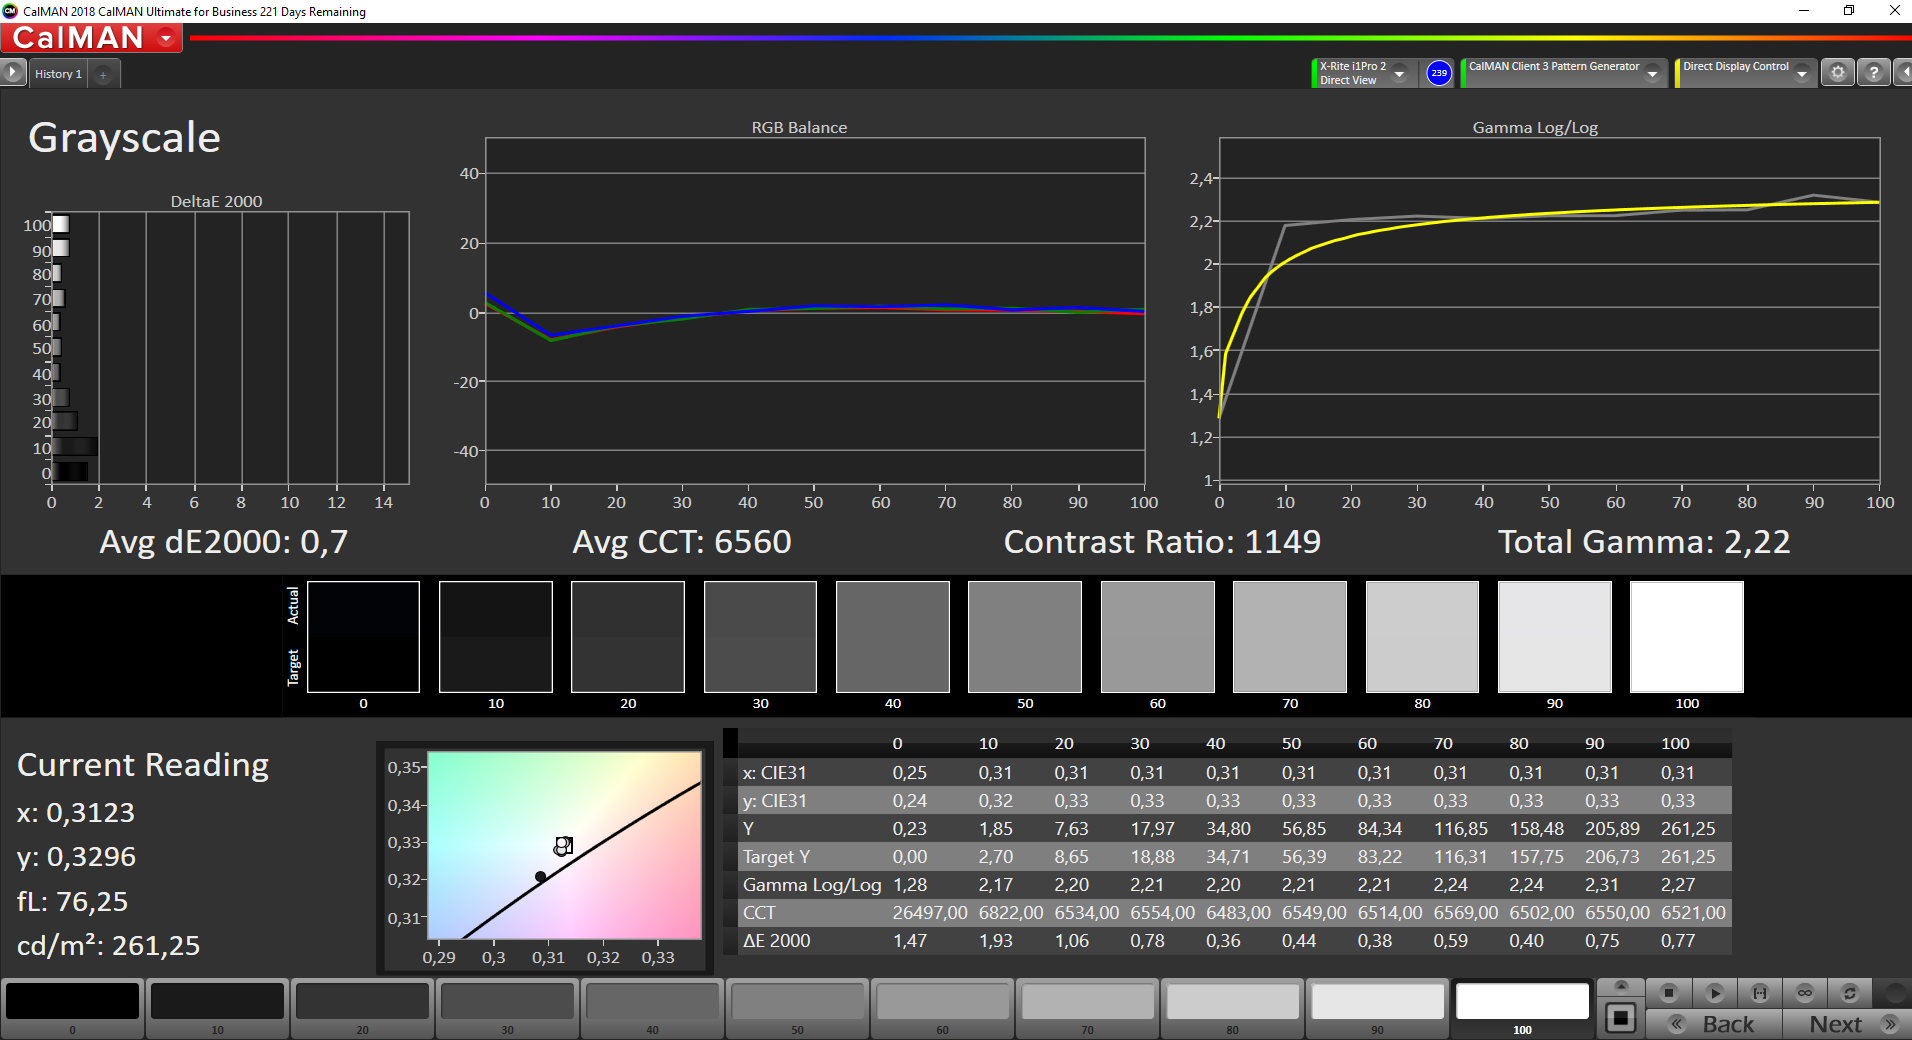
The factory profile, which we measured with CalMan and the X-Rite i1Pro 2 color-sensor, has a light blue tint. Through a calibration, we were able to correct it. We can not complain about the contrast value of 1200:1, even though the preceding model was slightly better here.
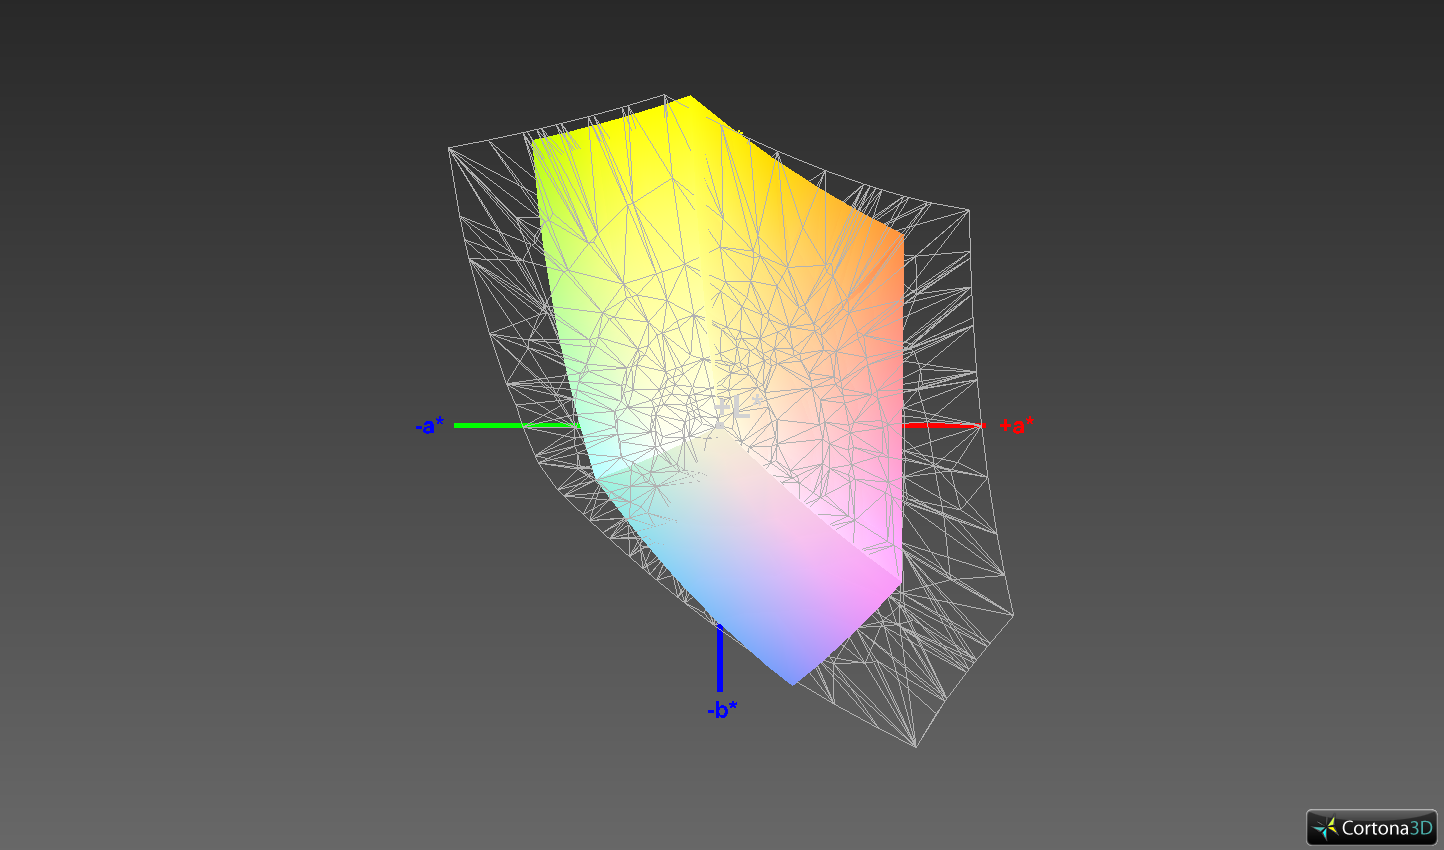
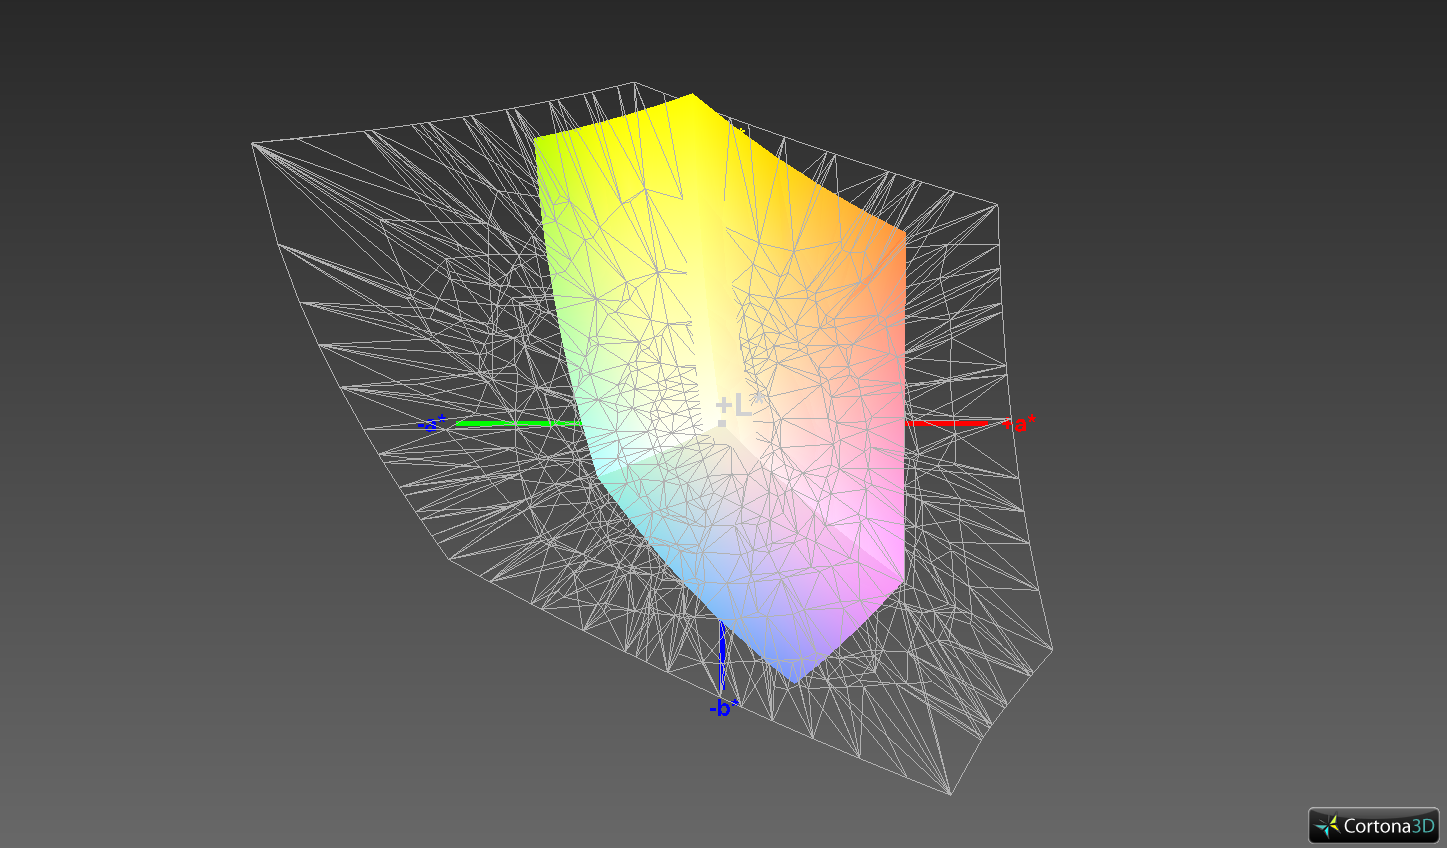
Typical for affordable business laptops: a bad color gamut coverage. With just 62.4% of the sRGB gamut, serious photo-editing is a pipe dream.
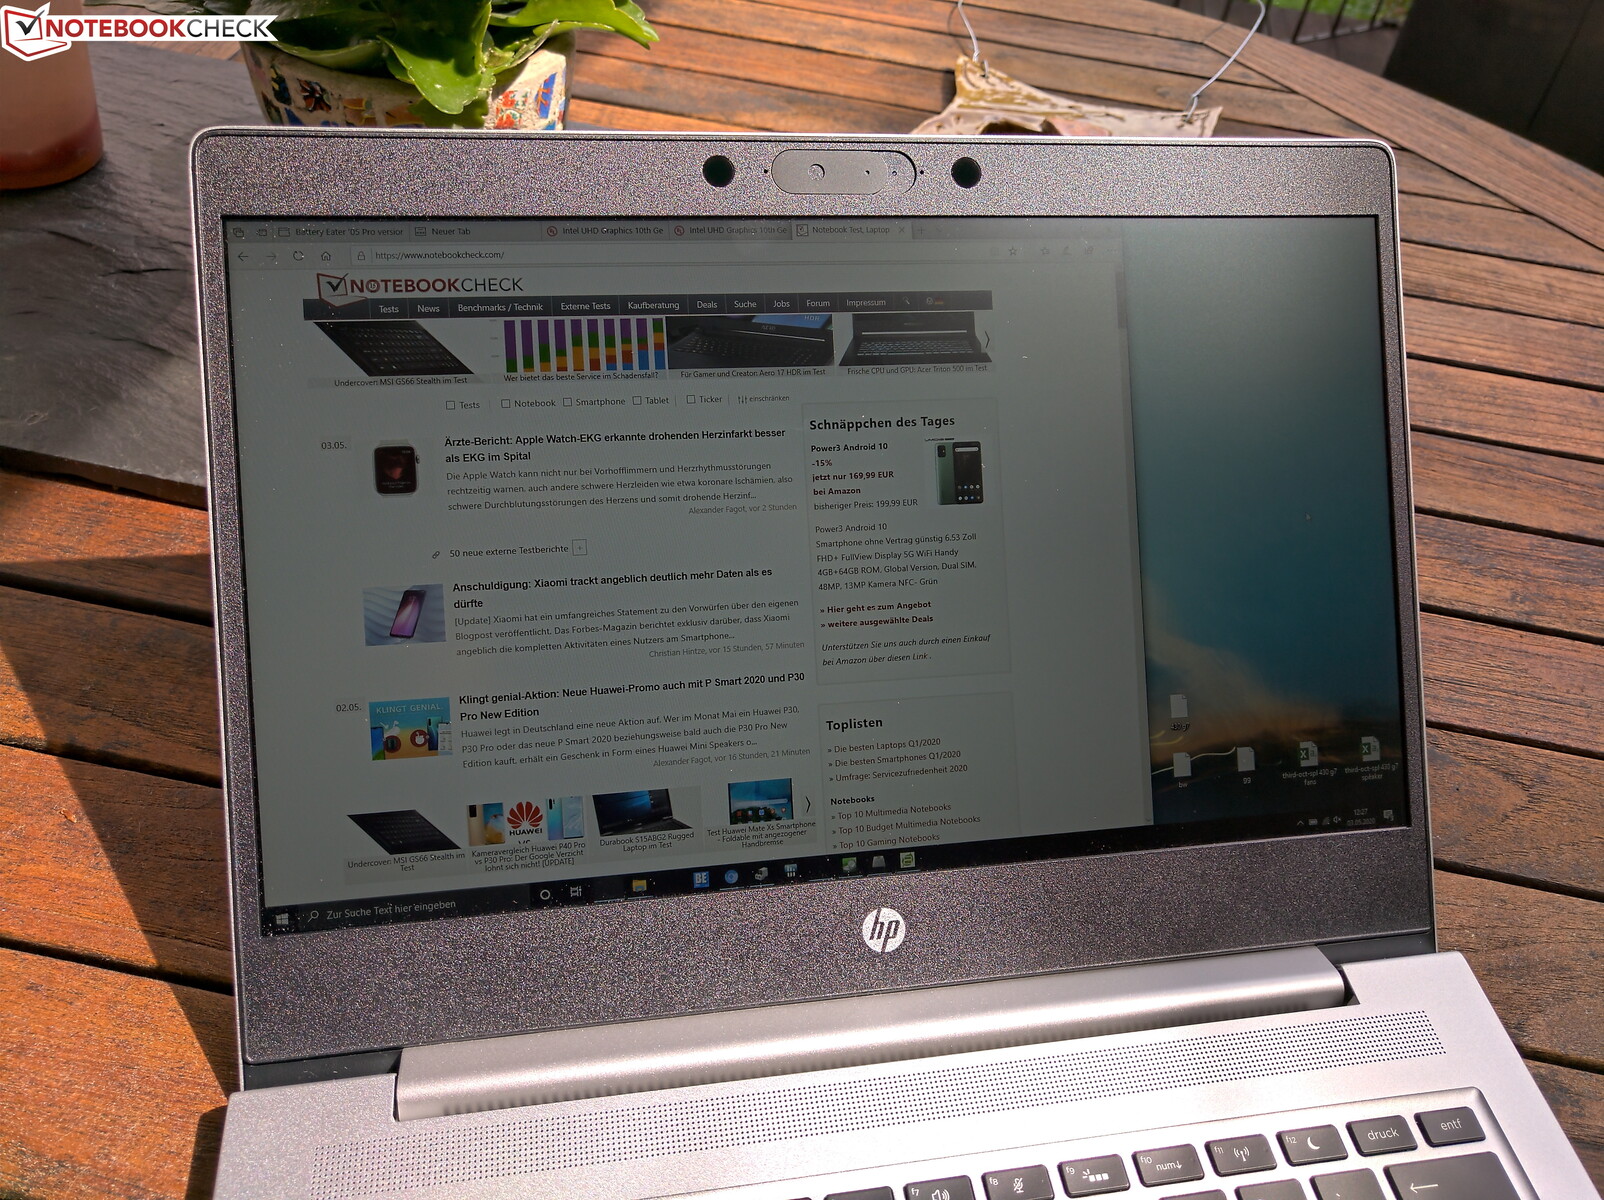
The ProBook is outdoor-capable, thanks to the matte screen surface. The LCD panel does not fare well against direct sunlight, however. Using the device in the shadow is advisable.
Display Response Times
| ↔ Response Time Black to White | ||
|---|---|---|
| 32 ms ... rise ↗ and fall ↘ combined | ↗ 16.4 ms rise | 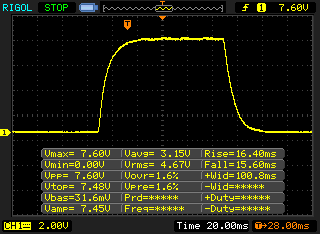 |
| ↘ 15.6 ms fall | ||
| The screen shows slow response rates in our tests and will be unsatisfactory for gamers. In comparison, all tested devices range from 0.1 (minimum) to 240 (maximum) ms. » 86 % of all devices are better. This means that the measured response time is worse than the average of all tested devices (19.9 ms). | ||
| ↔ Response Time 50% Grey to 80% Grey | ||
| 48.8 ms ... rise ↗ and fall ↘ combined | ↗ 24.4 ms rise | 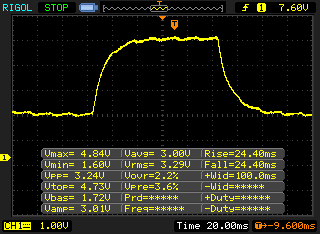 |
| ↘ 24.4 ms fall | ||
| The screen shows slow response rates in our tests and will be unsatisfactory for gamers. In comparison, all tested devices range from 0.165 (minimum) to 636 (maximum) ms. » 84 % of all devices are better. This means that the measured response time is worse than the average of all tested devices (31.1 ms). | ||
Screen Flickering / PWM (Pulse-Width Modulation)
| Screen flickering / PWM detected | 1000 Hz | ≤ 99 % brightness setting | 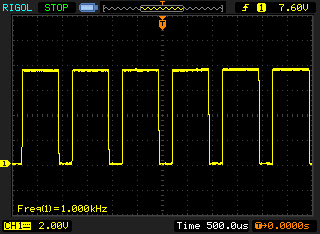 |
The display backlight flickers at 1000 Hz (worst case, e.g., utilizing PWM) Flickering detected at a brightness setting of 99 % and below. There should be no flickering or PWM above this brightness setting. The frequency of 1000 Hz is quite high, so most users sensitive to PWM should not notice any flickering. In comparison: 52 % of all tested devices do not use PWM to dim the display. If PWM was detected, an average of 7798 (minimum: 5 - maximum: 343500) Hz was measured. | |||
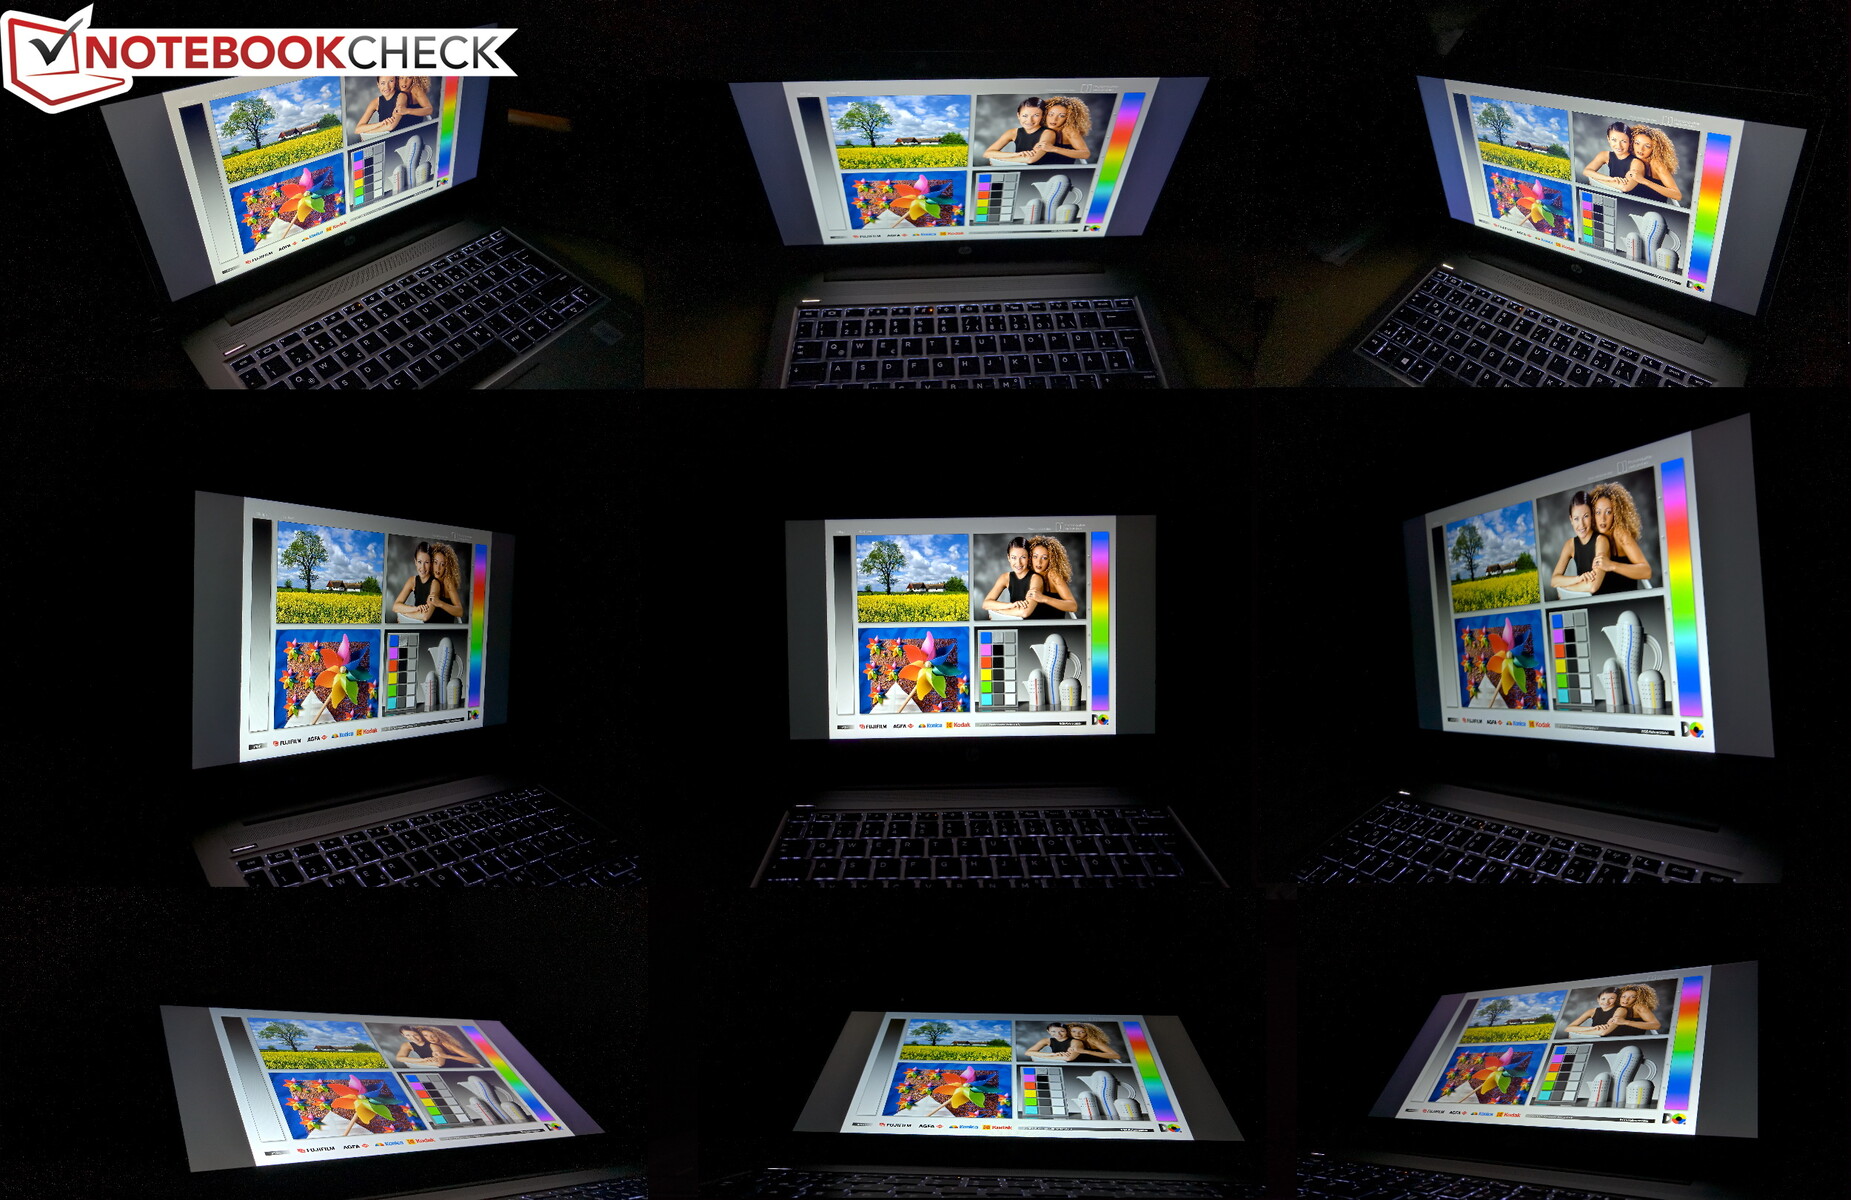
There is nothing to critique about the viewing angle stability. Luckily, IPS panels have pretty much solved any problems in this area.
HP ProBook with performance-stagnation
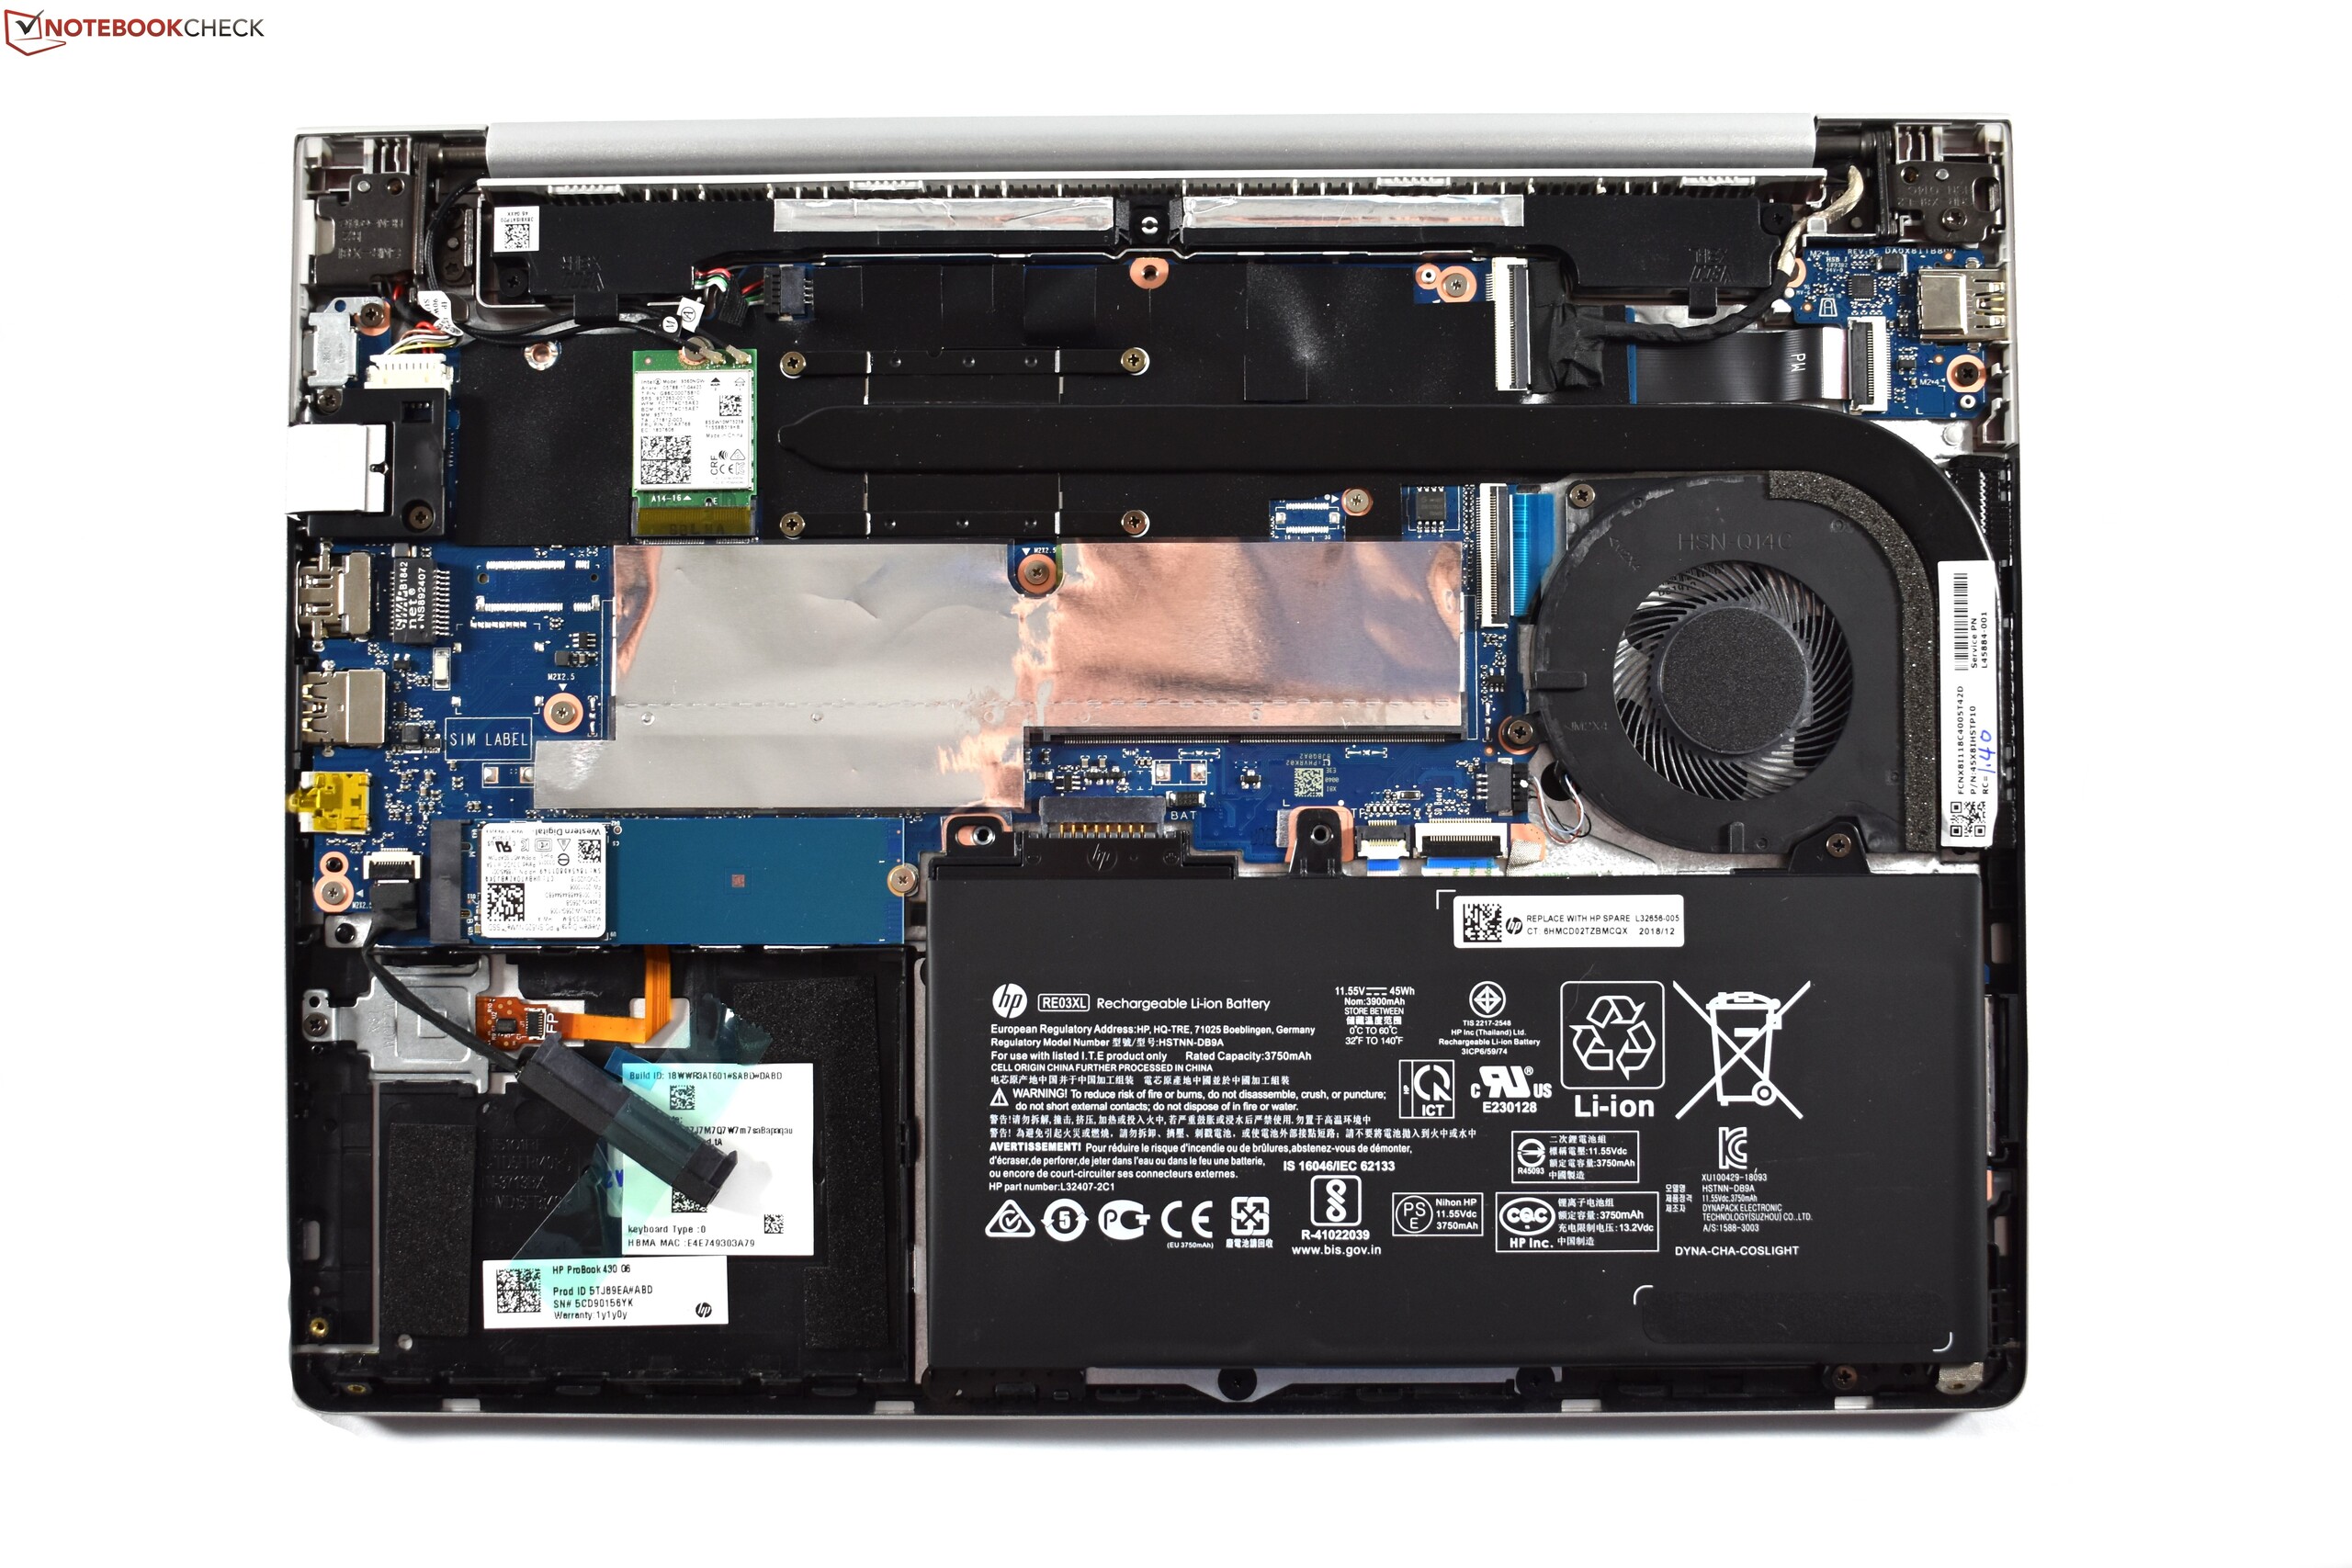
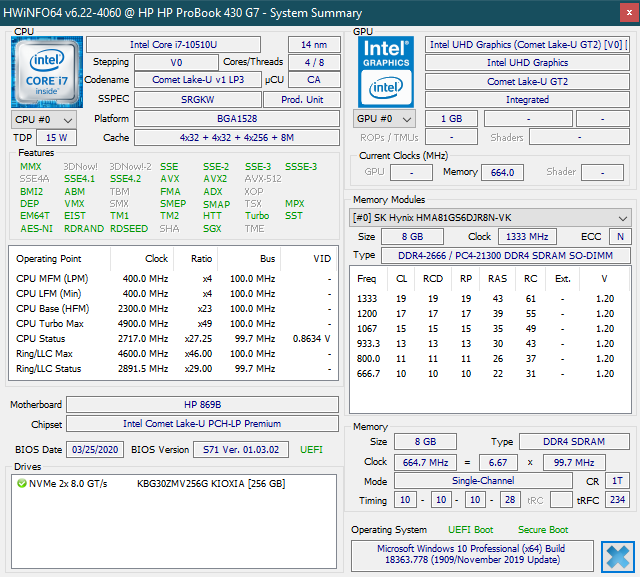
There is not a lot of choice in terms of CPUs and GPUs with the ProBook 430 G7: Buyers can choose between the Intel Core i5-10210U and the Core i7-10510U. Both contain the Intel UHD Graphics 620. There is a little more variety with the DDR4-2400-RAM: Since it has two SO-DIMM slots, HP offers 8, 16 or 32 GB (optional upgradability to 64 GB). In terms of storage, there is a single M.2 SSD with up to 512 GB and a 2.5-inch HDD.
Processor
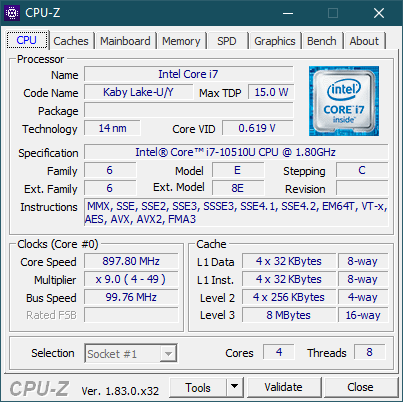
The Intel Core i7-10510U is the strongest quad core processor of the Comet Lake U series. The four cores work with 1.8 to 4.8 GHz, with a typical maximum consumption of 15 W. The CPU benchmark-list allows for comparisons with other CPUs.
In the Cinebench test, the CPU can consume 25 W for 30 seconds. Afterwards, a TDP limitation of 17 W goes into effect. In the loop test, this consumption can be held for a few runs, then it falls to 15 W. The clock-rates sit at 2.5 GHz at this point and CPU temperatures hover around 82 degrees Celsius (179.6 °F). The CPU performance disappoints a little, as it is only on-par with the preceding ProBook 430 G6. The older model only contained an i5, however. CPU performance is not worse, but also not better.
In the battery mode, we were able to detect a performance limitation. Instead of 600 points, the HP laptops only scored around 450 points in the Cinebench R15 multicore test.
System performance
The system performance is pretty much without flaw. Although the HP laptop ProBook 430 G7 only reaches middling results in the PCMark ranking, it shows no signs of slowing down in everyday use.
| PCMark 8 Home Score Accelerated v2 | 3494 points | |
| PCMark 8 Work Score Accelerated v2 | 5045 points | |
| PCMark 10 Score | 4005 points | |
Help | ||
DPC latency
Unfortunately, the ProBook 430 G7 struggles with DPC latency when playing YouTube videos and during the Prime95 test. At least there were no problems when it was loading websites.
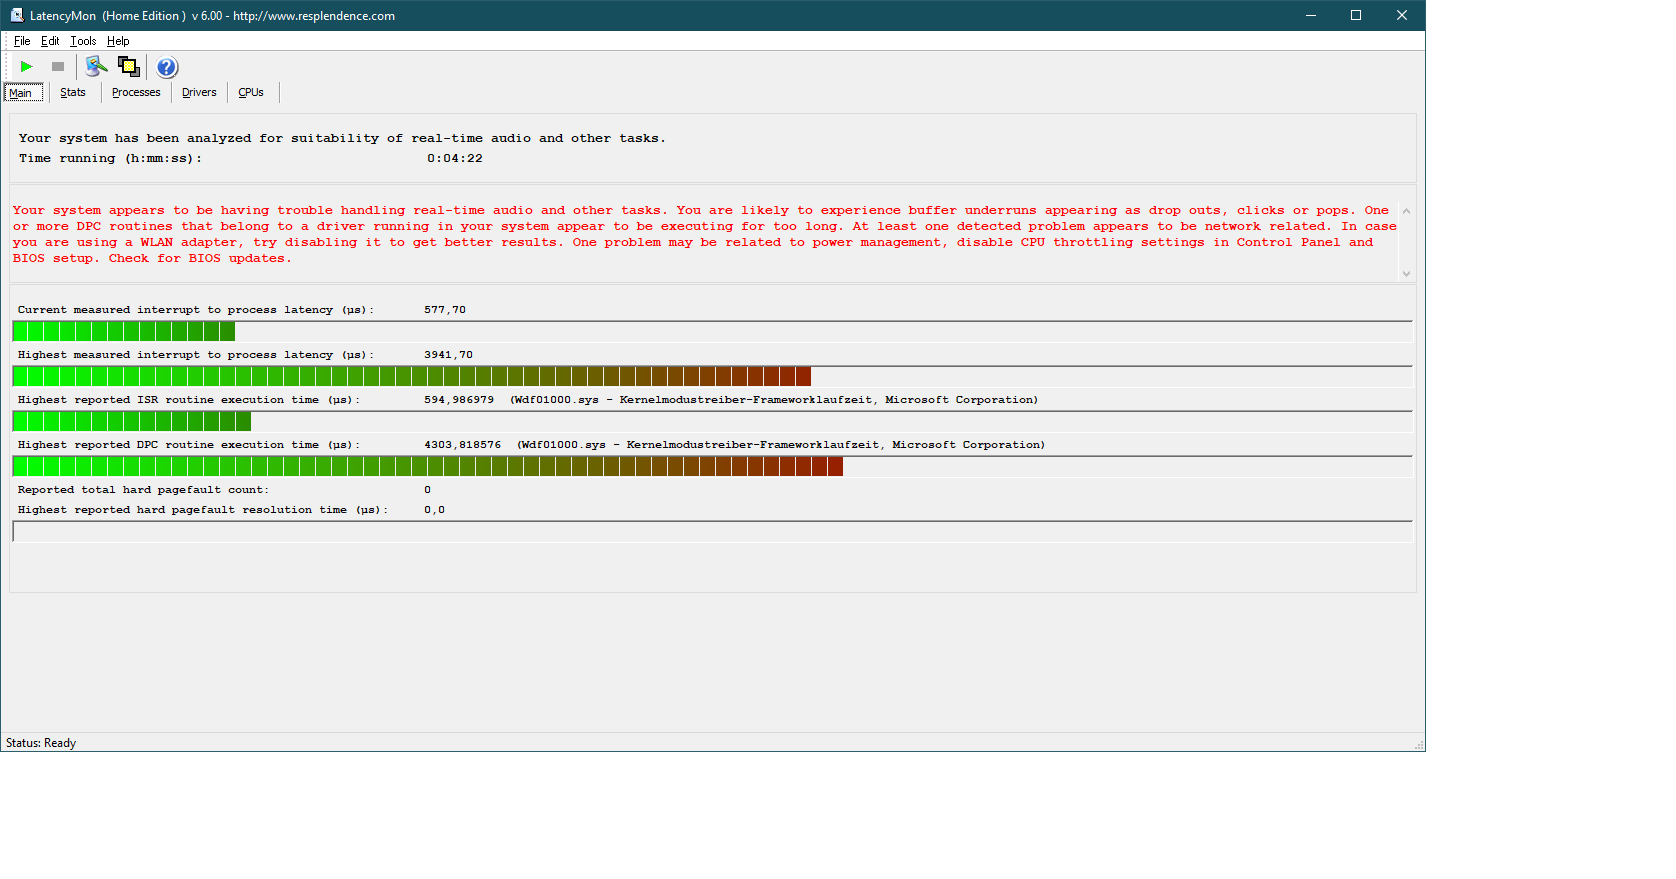
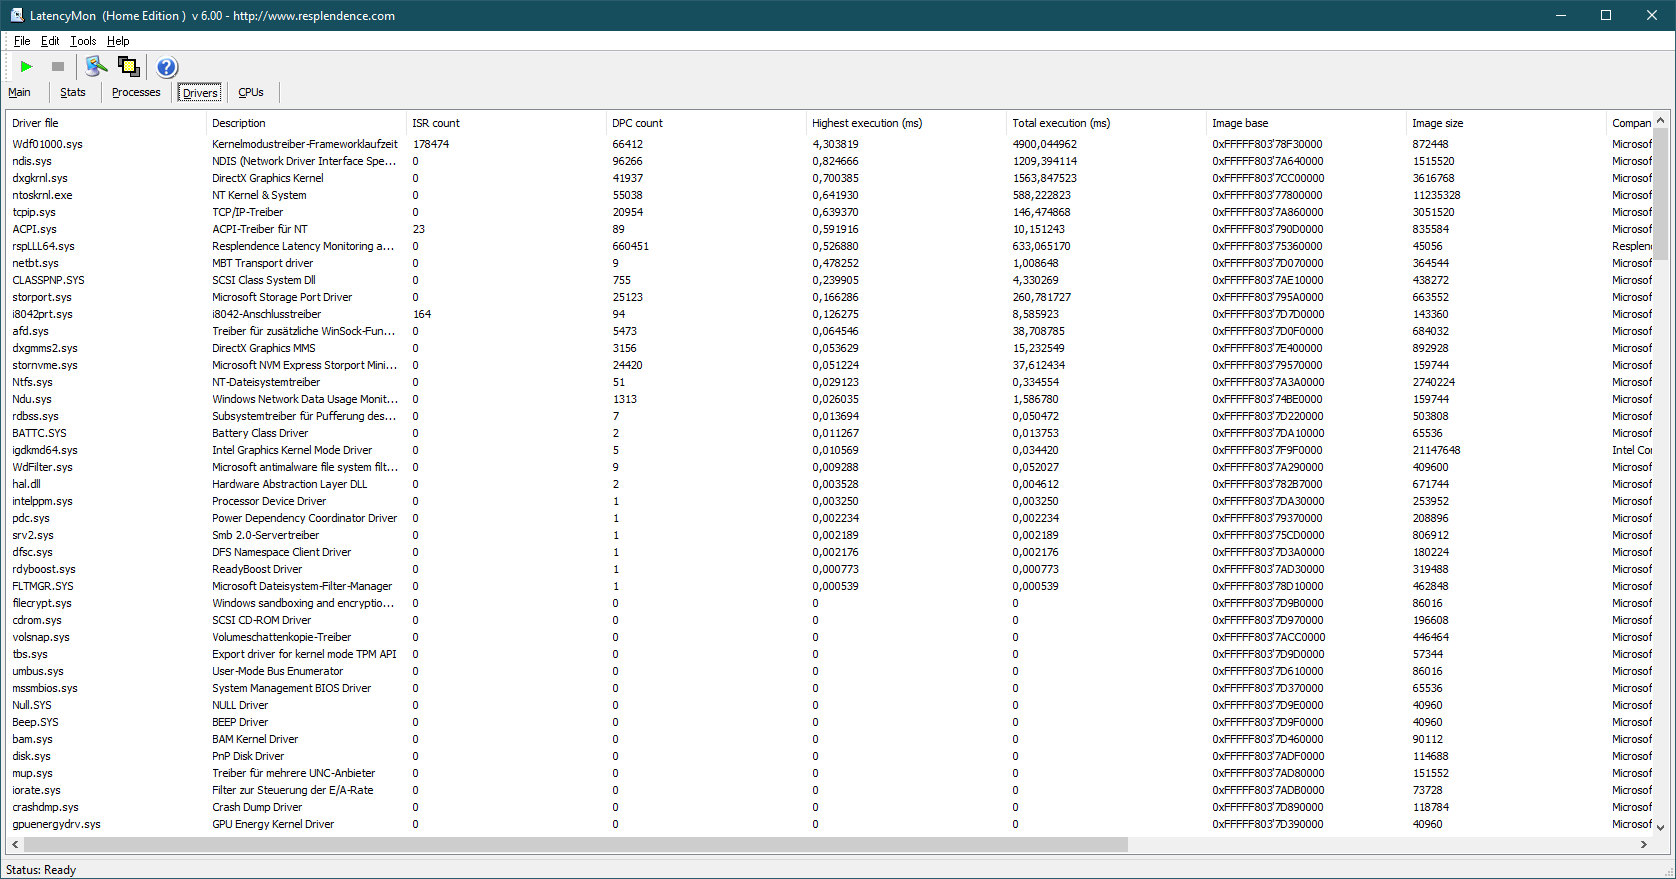
| DPC Latencies / LatencyMon - interrupt to process latency (max), Web, Youtube, Prime95 | |
| HP ProBook 430 G7-8VU53EA | |
* ... smaller is better
Storage
Permanent storage is covered by an M.2 2280 SSD by Toshiba. The PCIe SSD with a capacity of 256 GB is slower than the SSDs of the comparable office laptops, especially when it comes to the maximum transfer rates in the Sequential Q32T1. Especially for larger files, this SSDs will be slower than others.
| HP ProBook 430 G7-8VU53EA Toshiba KBG30ZMV256G | HP ProBook 430 G6-5TJ89EA WDC PC SN520 SDAPNUW-256G | HP EliteBook 830 G5-3JX74EA Samsung SSD PM961 1TB M.2 PCIe 3.0 x4 NVMe (MZVLW1T0) | Lenovo ThinkPad L390-20NR0013GE Samsung SSD PM981 MZVLB256HAHQ | Dell Latitude 5300 SK Hynix PC401 512GB M.2 (HFS512GD9TNG) | Average Toshiba KBG30ZMV256G | |
|---|---|---|---|---|---|---|
| CrystalDiskMark 5.2 / 6 | 16% | 47% | 50% | 36% | -5% | |
| Write 4K (MB/s) | 124.7 | 101.8 -18% | 108.5 -13% | 99.6 -20% | 119.2 -4% | 114.9 ? -8% |
| Read 4K (MB/s) | 48.17 | 41.35 -14% | 40.53 -16% | 37.22 -23% | 41.43 -14% | 48 ? 0% |
| Write Seq (MB/s) | 694 | 929 34% | 1026 48% | 1432 106% | 1240 79% | 727 ? 5% |
| Read Seq (MB/s) | 757 | 1388 83% | 2080 175% | 2072 174% | 1668 120% | 885 ? 17% |
| Write 4K Q32T1 (MB/s) | 311 | 453.5 46% | 451 45% | 439.7 41% | 381.7 23% | 253 ? -19% |
| Read 4K Q32T1 (MB/s) | 495.5 | 286.2 -42% | 269.7 -46% | 264.8 -47% | 371.5 -25% | 400 ? -19% |
| Write Seq Q32T1 (MB/s) | 1017 | 1302 28% | 1770 74% | 1549 52% | 1369 35% | 849 ? -17% |
| Read Seq Q32T1 (MB/s) | 1530 | 1751 14% | 3214 110% | 3318 117% | 2652 73% | 1493 ? -2% |

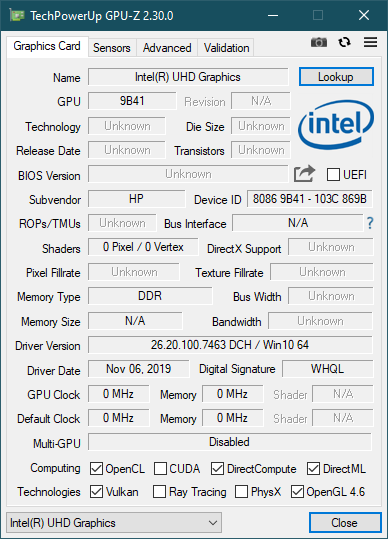
GPU
There is only a single GPU option for the HP ProBook 430 G7: The Intel UHD Graphics 620. This integrated GPU has no dedicated memory and has to rely on the main system memory. Since it runs in single-channel mode, thanks to the lack of the second RAM module, the GPU can not reach its full potential. But it is very limited anyway, as the UHD Graphics 620 is already quite old at this point. It is too weak for demanding programs or games.
When the GPU performance is tested in battery mode, the ProBook 430 G7 only manages to reach a score of 1,296 instead of 1,836 points in the 3DMark11 GPU score.
| 3DMark 11 Performance | 2006 points | |
| 3DMark Cloud Gate Standard Score | 7853 points | |
| 3DMark Fire Strike Score | 1019 points | |
| 3DMark Time Spy Score | 435 points | |
Help | ||
| low | med. | high | ultra | |
|---|---|---|---|---|
| BioShock Infinite (2013) | 59 | 32.7 | 25.7 | 8.4 |
| Dota 2 Reborn (2015) | 68.6 | 41.6 | 18.1 | 15.8 |
| X-Plane 11.11 (2018) | 21.6 | 14.1 | 12.8 | |
| Shadow of the Tomb Raider (2018) | 14 | |||
| Total War: Three Kingdoms (2019) | 22.4 |
Emissions
Noise
The noise measurements leave us somewhat torn up. While idling, the fan does stay off most of the time and it also does not get that loud under load. Sadly, it does start up sometimes while idling. Even worse, the fan exhibits very annoying pulsing. Overall, this stains the otherwise good impression, even though there is no coil whine.
Noise level
| Idle |
| 29.7 / 29.7 / 30.3 dB(A) |
| Load |
| 30.4 / 31.2 dB(A) |
 | ||
30 dB silent 40 dB(A) audible 50 dB(A) loud |
||
min: | ||
Temperatures
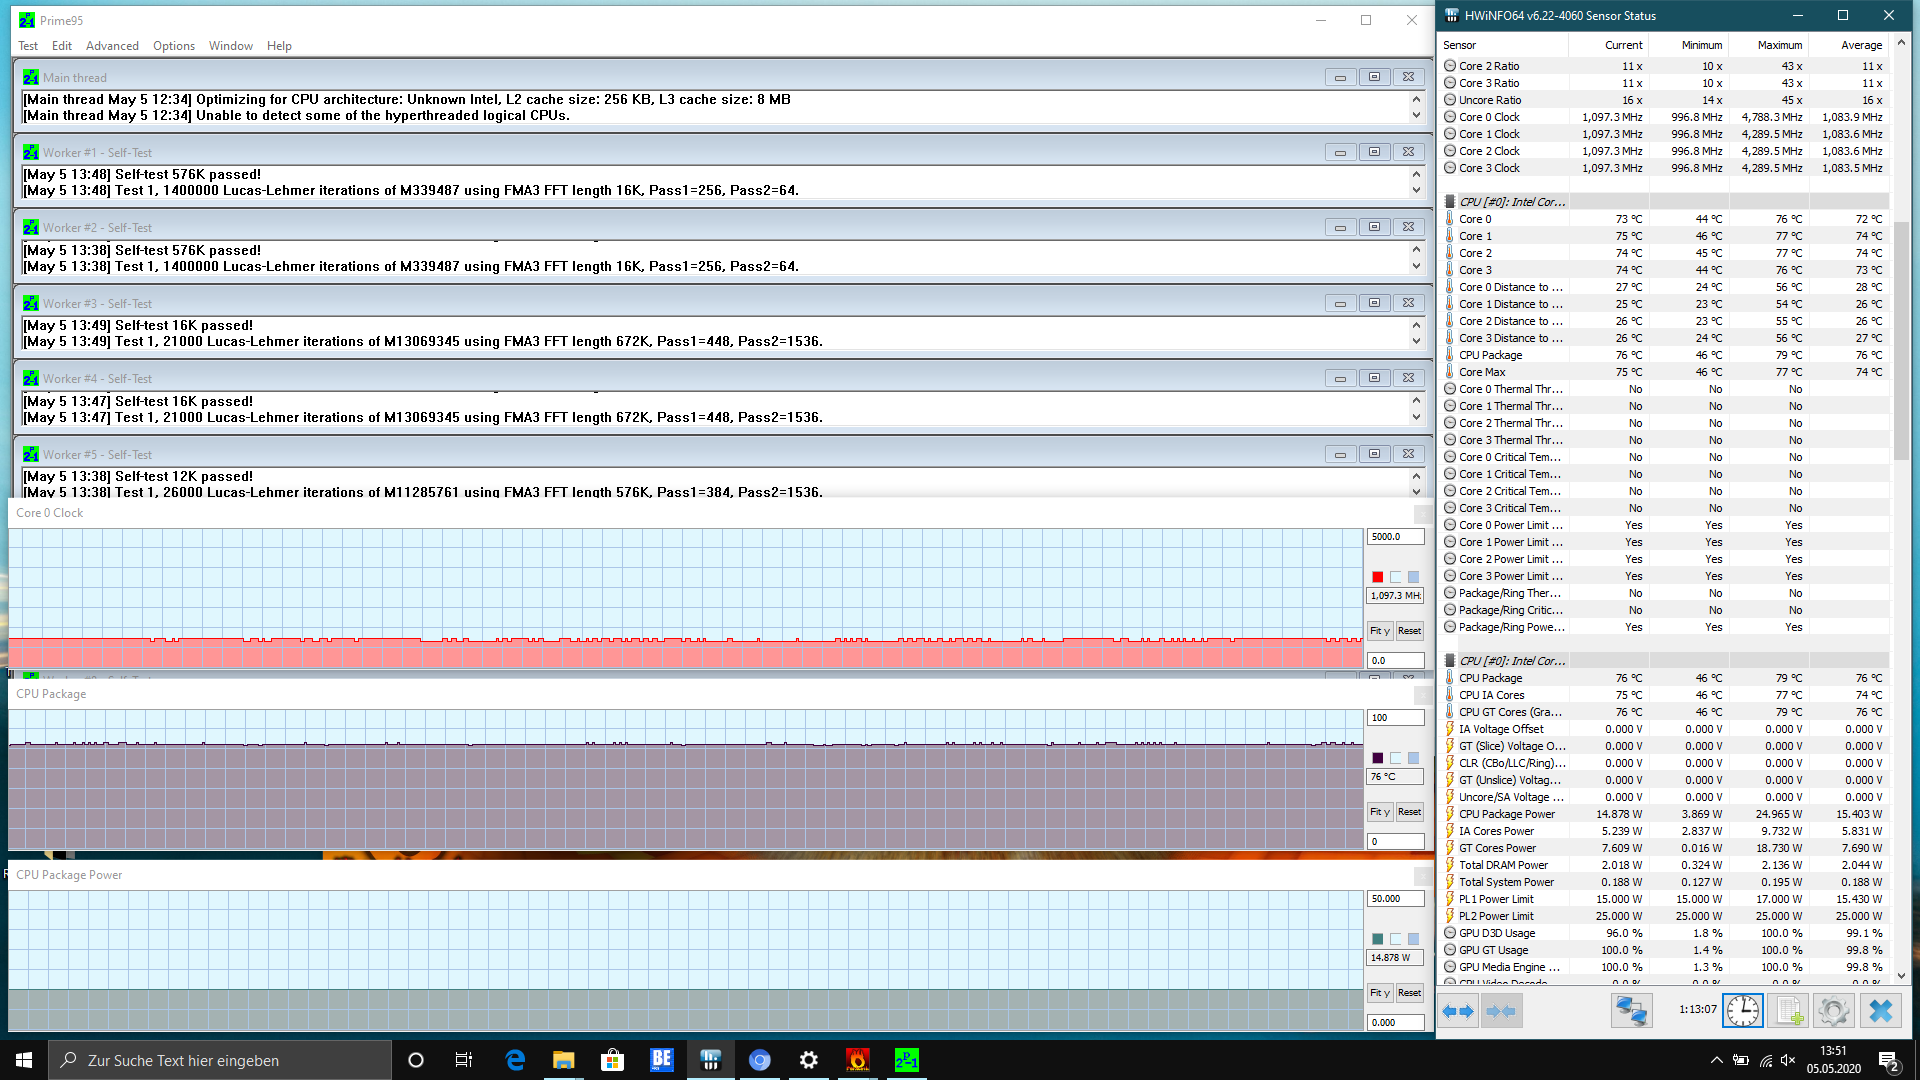
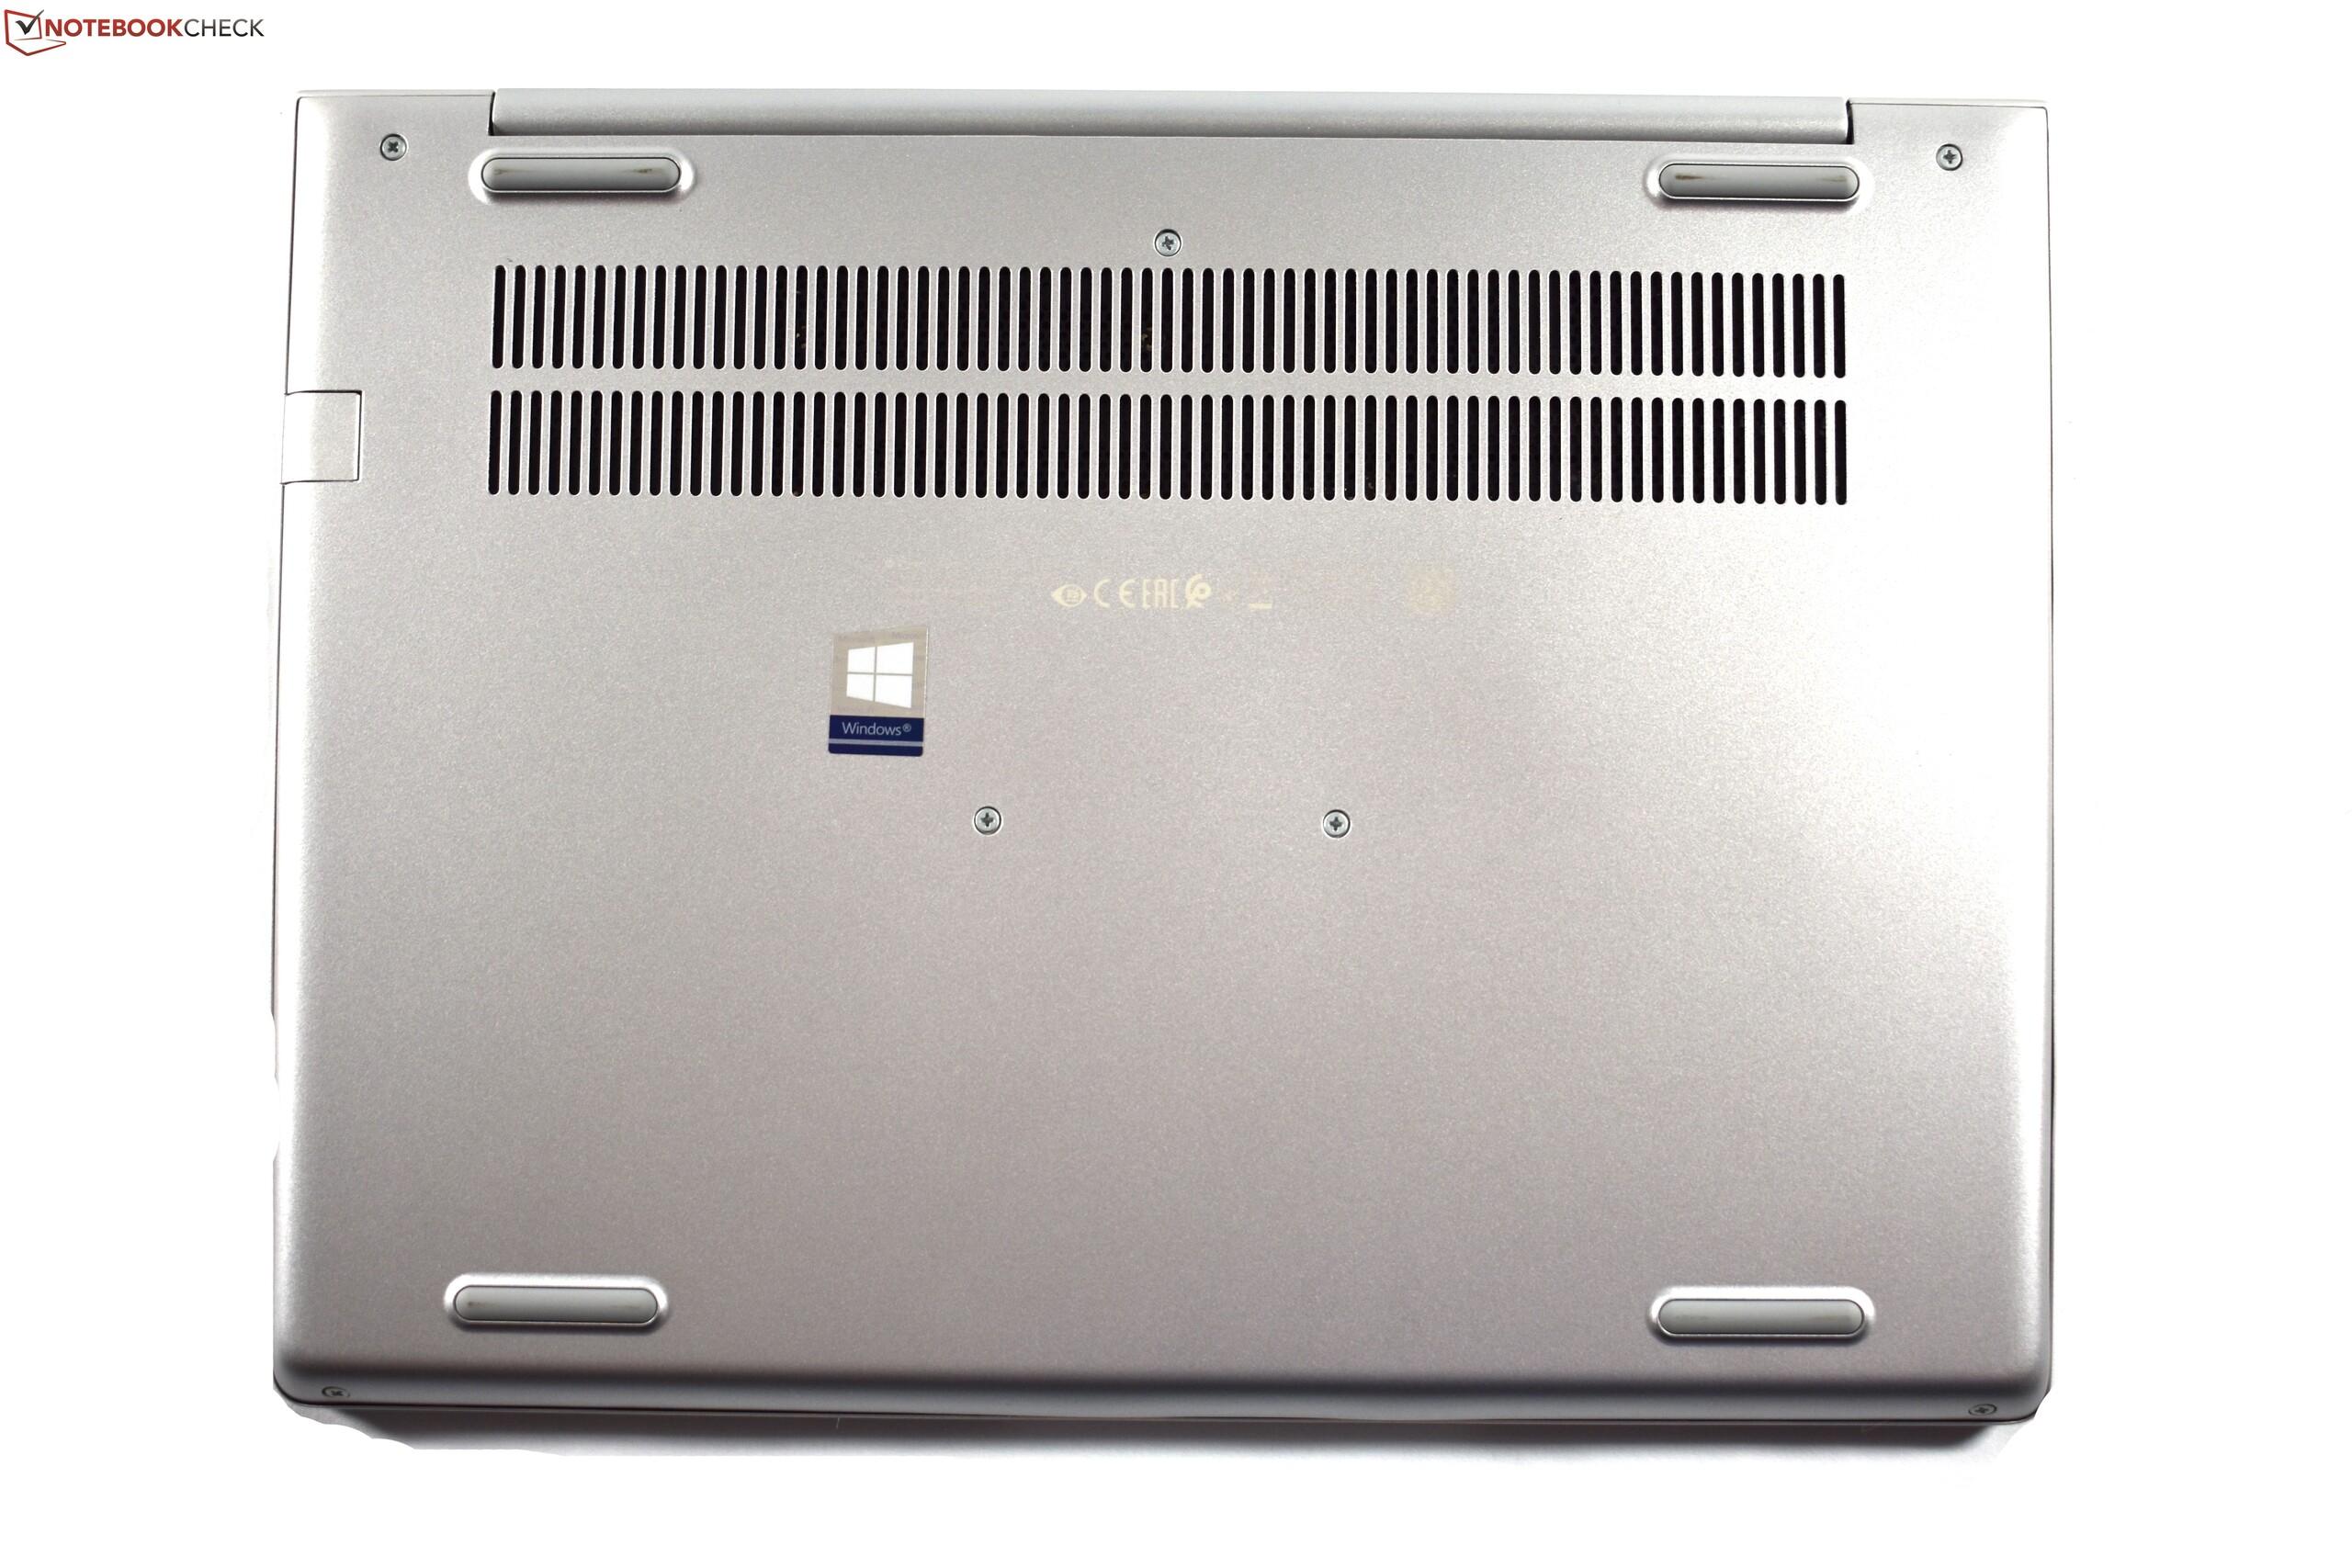
We measure 47.8 degrees Celsius (~118 °F) at the bottom of the HP ProBook 430 G7 – a warm temperature, but in no way critical and also contained to a small part of the chassis.
In the combined Prime95 and FurMark stresstest, the processor can consume 25 W for a short period. Afterwards the consumption is limited to 15 W. Since CPU and GPU have to share the "consumption budget", the CPU clock-rate falls to 1 GHz. This CPU throttling should have no influence in everyday use.
(+) The maximum temperature on the upper side is 39.2 °C / 103 F, compared to the average of 34.3 °C / 94 F, ranging from 21.2 to 62.5 °C for the class Office.
(-) The bottom heats up to a maximum of 47.8 °C / 118 F, compared to the average of 36.8 °C / 98 F
(+) In idle usage, the average temperature for the upper side is 24.6 °C / 76 F, compared to the device average of 29.5 °C / 85 F.
(+) The palmrests and touchpad are cooler than skin temperature with a maximum of 27.8 °C / 82 F and are therefore cool to the touch.
(±) The average temperature of the palmrest area of similar devices was 27.5 °C / 81.5 F (-0.3 °C / -0.5 F).
Speakers
For a somewhat budget-oriented laptop, the speakers of the ProBook 430 G7 are pretty good. They are not extremely loud and missing base, but the sound is impressive otherwise. The combo-audio port can be used to get an even better result.
HP ProBook 430 G7-8VU53EA audio analysis
(±) | speaker loudness is average but good (76.1 dB)
Bass 100 - 315 Hz
(-) | nearly no bass - on average 18.8% lower than median
(±) | linearity of bass is average (10.9% delta to prev. frequency)
Mids 400 - 2000 Hz
(+) | balanced mids - only 2.2% away from median
(+) | mids are linear (6.4% delta to prev. frequency)
Highs 2 - 16 kHz
(+) | balanced highs - only 2.8% away from median
(+) | highs are linear (4.8% delta to prev. frequency)
Overall 100 - 16.000 Hz
(±) | linearity of overall sound is average (19.3% difference to median)
Compared to same class
» 38% of all tested devices in this class were better, 7% similar, 55% worse
» The best had a delta of 7%, average was 21%, worst was 53%
Compared to all devices tested
» 47% of all tested devices were better, 8% similar, 46% worse
» The best had a delta of 4%, average was 24%, worst was 134%
Apple MacBook 12 (Early 2016) 1.1 GHz audio analysis
(+) | speakers can play relatively loud (83.6 dB)
Bass 100 - 315 Hz
(±) | reduced bass - on average 11.3% lower than median
(±) | linearity of bass is average (14.2% delta to prev. frequency)
Mids 400 - 2000 Hz
(+) | balanced mids - only 2.4% away from median
(+) | mids are linear (5.5% delta to prev. frequency)
Highs 2 - 16 kHz
(+) | balanced highs - only 2% away from median
(+) | highs are linear (4.5% delta to prev. frequency)
Overall 100 - 16.000 Hz
(+) | overall sound is linear (10.2% difference to median)
Compared to same class
» 7% of all tested devices in this class were better, 2% similar, 91% worse
» The best had a delta of 5%, average was 18%, worst was 53%
Compared to all devices tested
» 5% of all tested devices were better, 1% similar, 94% worse
» The best had a delta of 4%, average was 24%, worst was 134%
Energy management: less battery life than HP ProBook 430 G6
Power consumption
We can not find any faults in HP's energy management, as the HP ProBook 430 G7 consumes less than all competitors. Only the predecessor ProBook 430 G6 is as efficient while idling.
For the charger, the maximum power consumption of 42 W are not a challenge. The consumption also quickly plummets down to 31 W.
| Off / Standby | |
| Idle | |
| Load |
|
Key:
min: | |
| HP ProBook 430 G7-8VU53EA i7-10510U, UHD Graphics 620, Toshiba KBG30ZMV256G, IPS LED, 1920x1080, 13.3" | HP EliteBook 830 G5-3JX74EA i5-8550U, UHD Graphics 620, Samsung SSD PM961 1TB M.2 PCIe 3.0 x4 NVMe (MZVLW1T0), IPS LED, 1920x1080, 13.3" | HP ProBook 430 G6-5TJ89EA i5-8265U, UHD Graphics 620, WDC PC SN520 SDAPNUW-256G, IPS LED, 1920x1080, 13.3" | Lenovo ThinkPad L390-20NR0013GE i5-8265U, UHD Graphics 620, Samsung SSD PM981 MZVLB256HAHQ, IPS LED, 1920x1080, 13.3" | Dell Latitude 5300 i5-8365U, UHD Graphics 620, SK Hynix PC401 512GB M.2 (HFS512GD9TNG), IPS, 1920x1080, 13.3" | Average Intel UHD Graphics 620 | Average of class Office | |
|---|---|---|---|---|---|---|---|
| Power Consumption | -22% | -2% | -12% | -18% | -10% | -27% | |
| Idle Minimum * (Watt) | 3.3 | 4.5 -36% | 3.5 -6% | 3.8 -15% | 3.8 -15% | 3.81 ? -15% | 4.4 ? -33% |
| Idle Average * (Watt) | 6.1 | 6.4 -5% | 5.76 6% | 6.8 -11% | 6.9 -13% | 6.94 ? -14% | 7.32 ? -20% |
| Idle Maximum * (Watt) | 8.6 | 9.2 -7% | 8.3 3% | 9.8 -14% | 7.5 13% | 8.75 ? -2% | 8.56 ? -0% |
| Load Average * (Watt) | 32.4 | 35.7 -10% | 34.8 -7% | 32.4 -0% | 41.4 -28% | 35 ? -8% | 42.5 ? -31% |
| Load Maximum * (Watt) | 42.7 | 65.4 -53% | 45.7 -7% | 52 -22% | 63.1 -48% | 47.5 ? -11% | 64.1 ? -50% |
* ... smaller is better
Battery life
In the Wi-Fi test with 150 cd/m² screen brightness, the ProBook 430 G7 lasts almost seven hours. This means a reduction of roughly 20% compared to the predecessor, despite no changes to the 45 Wh battery. At least the competitor from Lenovo, the ThinkPad L390, is even worse in this regard.
| HP ProBook 430 G7-8VU53EA i7-10510U, UHD Graphics 620, 45 Wh | HP ProBook 430 G6-5TJ89EA i5-8265U, UHD Graphics 620, 45 Wh | HP EliteBook 830 G5-3JX74EA i5-8550U, UHD Graphics 620, 49 Wh | Lenovo ThinkPad L390-20NR0013GE i5-8265U, UHD Graphics 620, 45 Wh | Dell Latitude 5300 i5-8365U, UHD Graphics 620, 60 Wh | Average of class Office | |
|---|---|---|---|---|---|---|
| Battery runtime | -0% | -15% | -22% | 5% | 27% | |
| H.264 (h) | 9.8 | 9.1 -7% | 8 -18% | 9.4 -4% | 15 ? 53% | |
| WiFi v1.3 (h) | 7.9 | 9.5 20% | 7.1 -10% | 7 -11% | 8.3 5% | 12.9 ? 63% |
| Load (h) | 2.8 | 2.4 -14% | 2.3 -18% | 1.4 -50% | 1.807 ? -35% | |
| Reader / Idle (h) | 16.2 | 12.8 | 16.2 | 23.7 ? |
Pros
Cons
Verdict
HP stays with the established design of last year's model and only makes a few modifications "under the hood".
The basic verdict of the HP ProBook 430 G6 holds true. The comparably affordable office laptop has many positives on its side: The comfortable keyboard, the extremely good upgradability or the SD card reader. All of these points should be enough to make the ProBook into an ideal companion device for many students or self-employed users.
The internal changes are at the same time both positive and negative. Wi-Fi 6 is with no doubt a great improvement. The newer Comet Lake processor on the other hand does not manage to outperform the older Whiskey Lake predecessor. Despite the performance stagnation, the ProBook runs warmer than the older model and is less enduring when it comes to the battery life. Those are not bad enough to be outright negatives, but they also are not really positive aspects. There are other new problems: The pulsating fan and the DPC latency problem. Apart from those, the negatives of the old model remain: The screen has a weak color gamut coverage, Thunderbolt and business features are missing and there is no pointing-stick.
The HP ProBook 430 G7 is not a big upgrade by any means. But that was also not really necessary, as the older model was already a pretty good office laptop.
Should owners of the ProBook 430 G6 upgrade? Not really. In general, we do recommend the ProBook, but HP should at least fix the annoying pulsating fan with a firmware-update.
HP ProBook 430 G7-8VU53EA
- 05/13/2020 v7 (old)
Benjamin Herzig
Price comparison
