Acer TravelMate P2 TMP215-52 Laptop Review: Affordable Business
The 2020 TravelMate P2 P215 is an update to the 2018 TravelMate P2510. The Kaby Lake-R CPU and optional GeForce MX130 GPU have been swapped for Comet Lake-U and optional GeForce MX230 parts, respectively, while the new chassis design carries several important changes. Our test unit as configured retails for about $1000 USD while lesser Core i3/i5 and 768p options are available for as low as $600 USD.
Competitors in this space include other budget 15.6-inch business laptops like the Dell Latitude 3590, HP ProBook 450 G7, or Lenovo ThinkPad L590.
More Acer reviews:
Rating | Date | Model | Weight | Height | Size | Resolution | Price |
|---|---|---|---|---|---|---|---|
| 82 % v7 (old) | 08 / 2020 | Acer TravelMate P215-52 i7-10510U, UHD Graphics 620 | 1.8 kg | 19.9 mm | 15.60" | 1920x1080 | |
| 81.4 % v7 (old) | 08 / 2020 | HP ProBook 450 G7 8WC04UT i7-10510U, GeForce MX250 | 1.9 kg | 19 mm | 15.60" | 1920x1080 | |
| 76.6 % v7 (old) | 02 / 2020 | Acer Extensa 15 EX215-51-56UX i5-10210U, UHD Graphics 620 | 1.9 kg | 19.9 mm | 15.60" | 1920x1080 | |
| 78.5 % v7 (old) | 02 / 2020 | HP 15s-fq1556ng i5-1035G1, UHD Graphics G1 (Ice Lake 32 EU) | 1.7 kg | 18 mm | 15.60" | 1920x1080 | |
| 83.2 % v7 (old) | 10 / 2019 | Lenovo ThinkPad L590-20Q70019GE i5-8265U, UHD Graphics 620 | 2 kg | 23 mm | 15.60" | 1920x1080 | |
| 79.6 % v6 (old) | 06 / 2019 | Dell Latitude 15 3590 i5-8250U, UHD Graphics 620 | 2.1 kg | 22 mm | 15.60" | 1920x1080 |
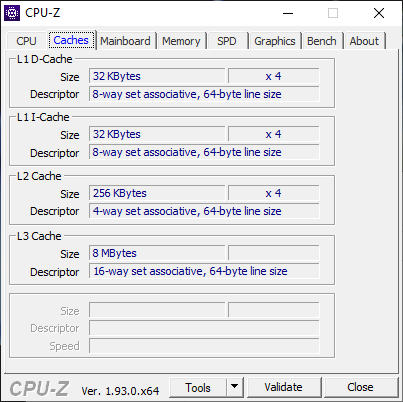
Case
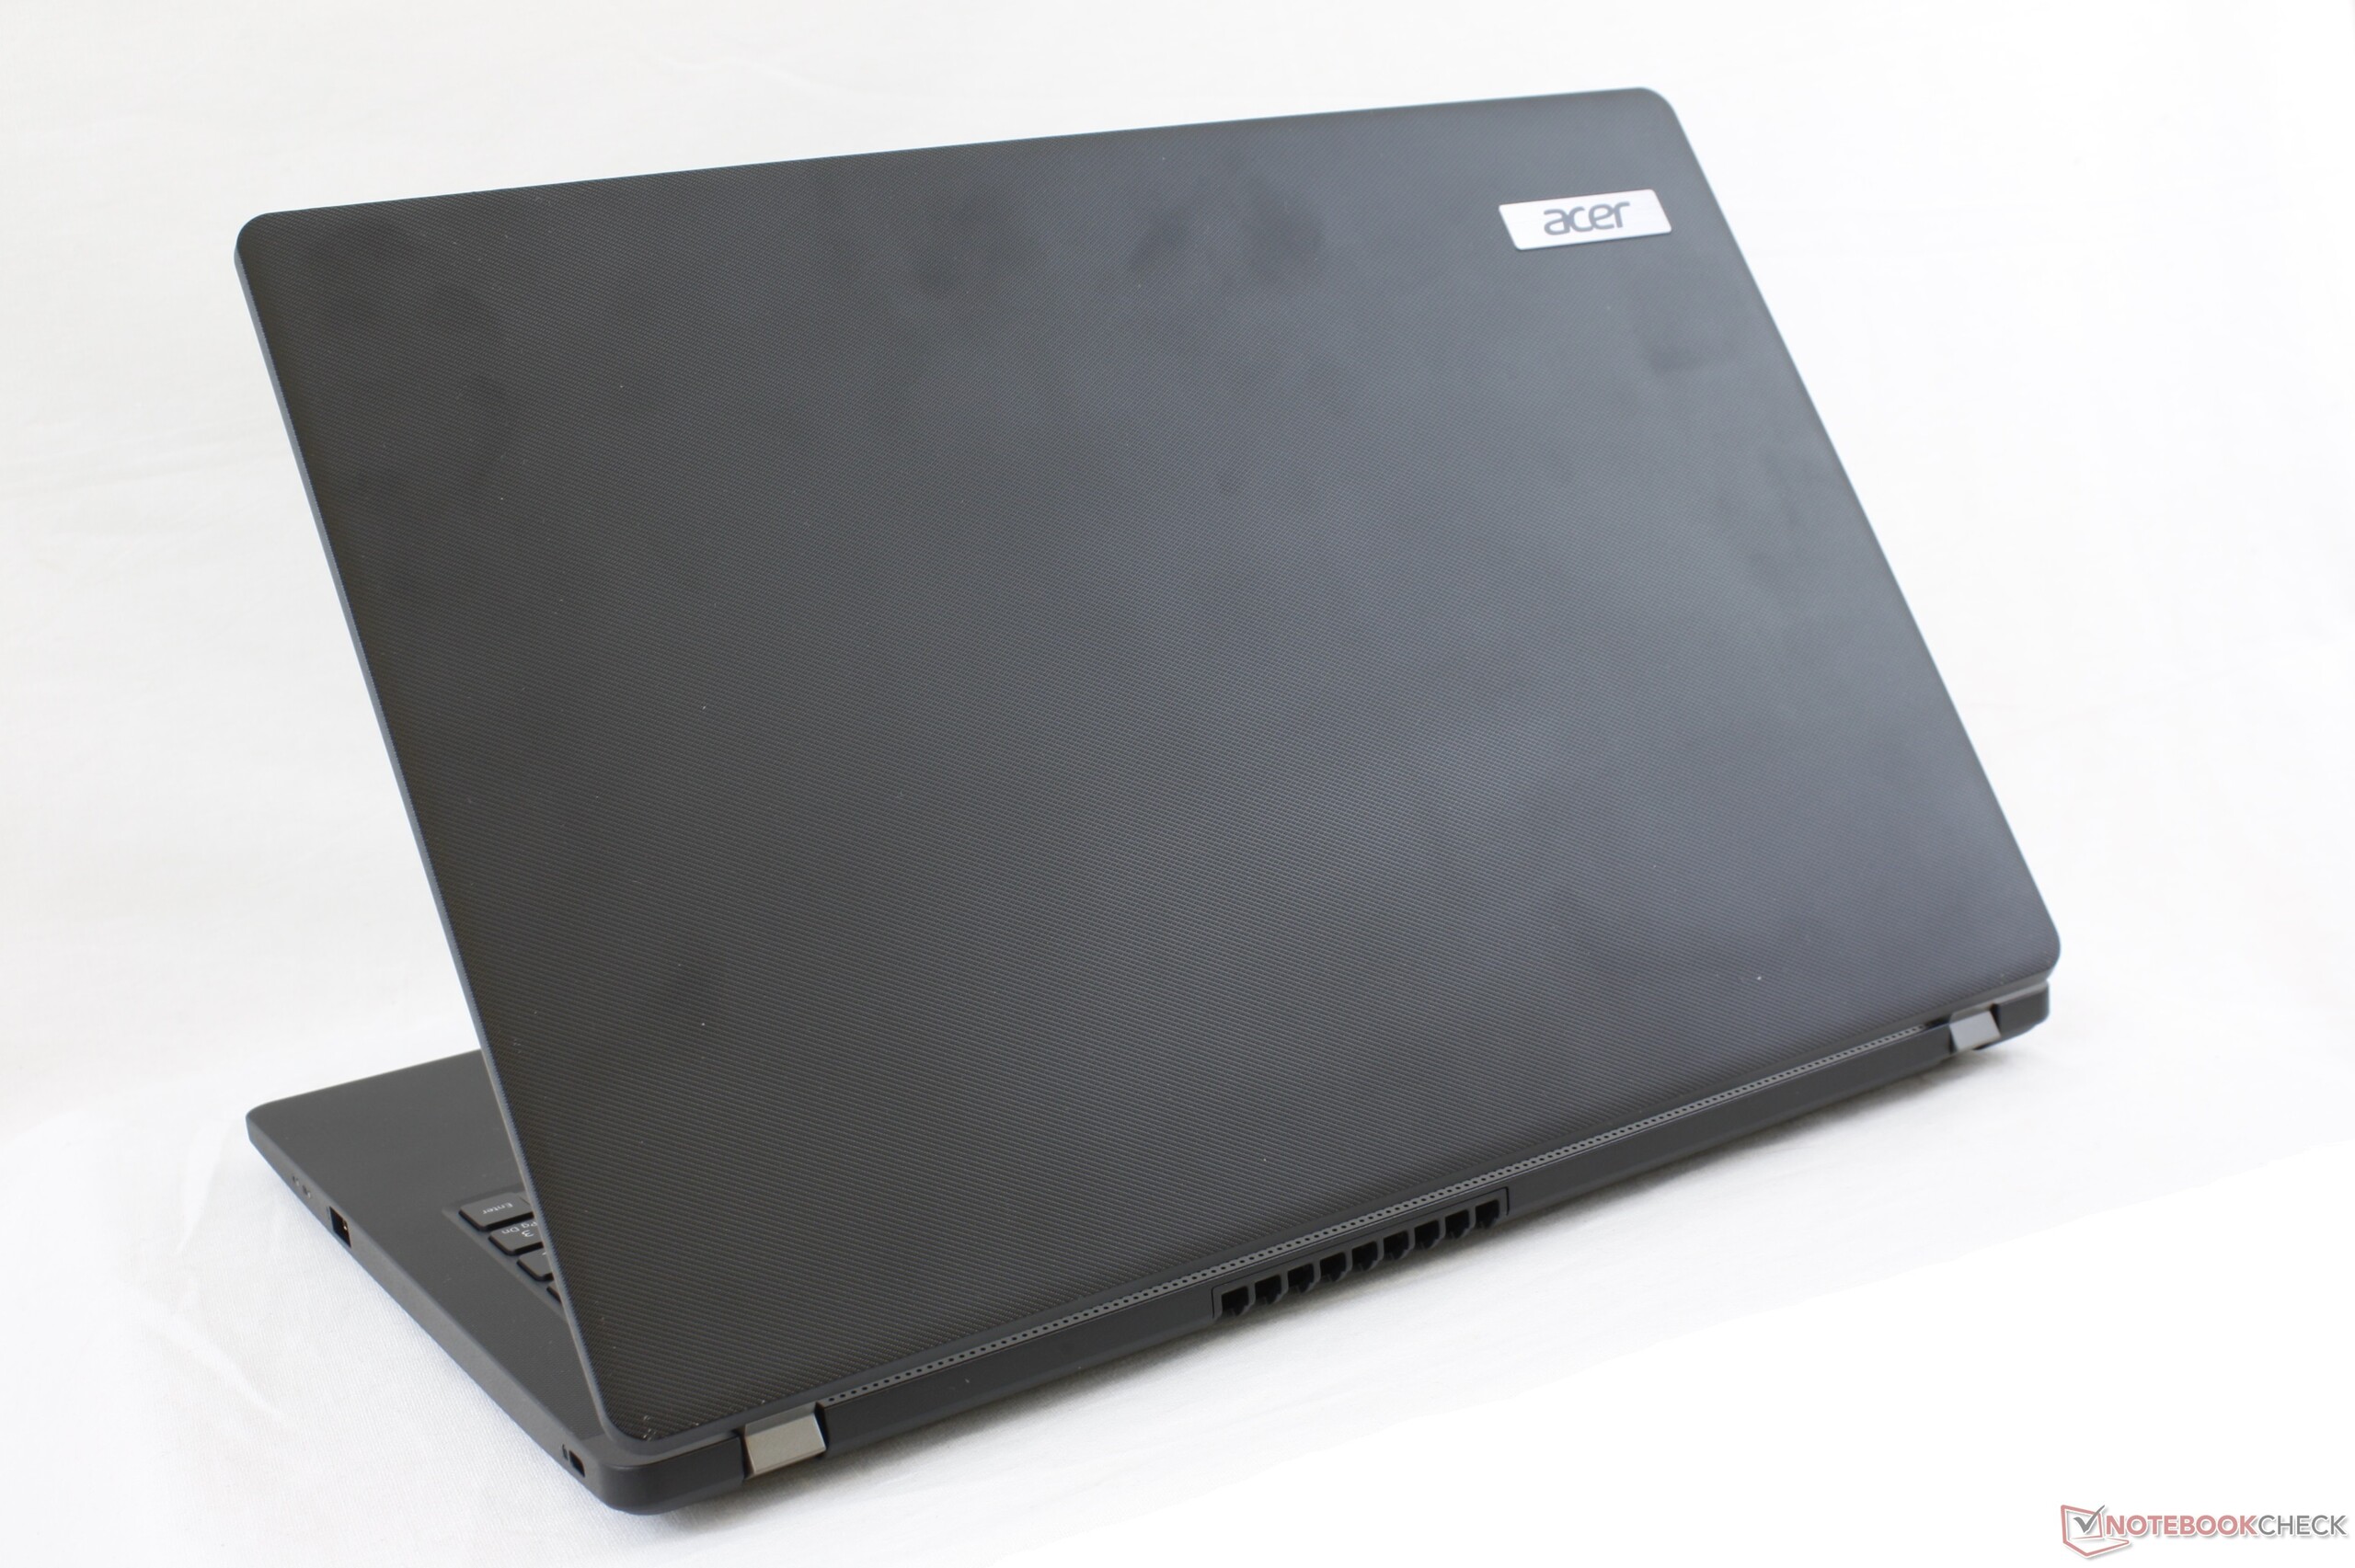
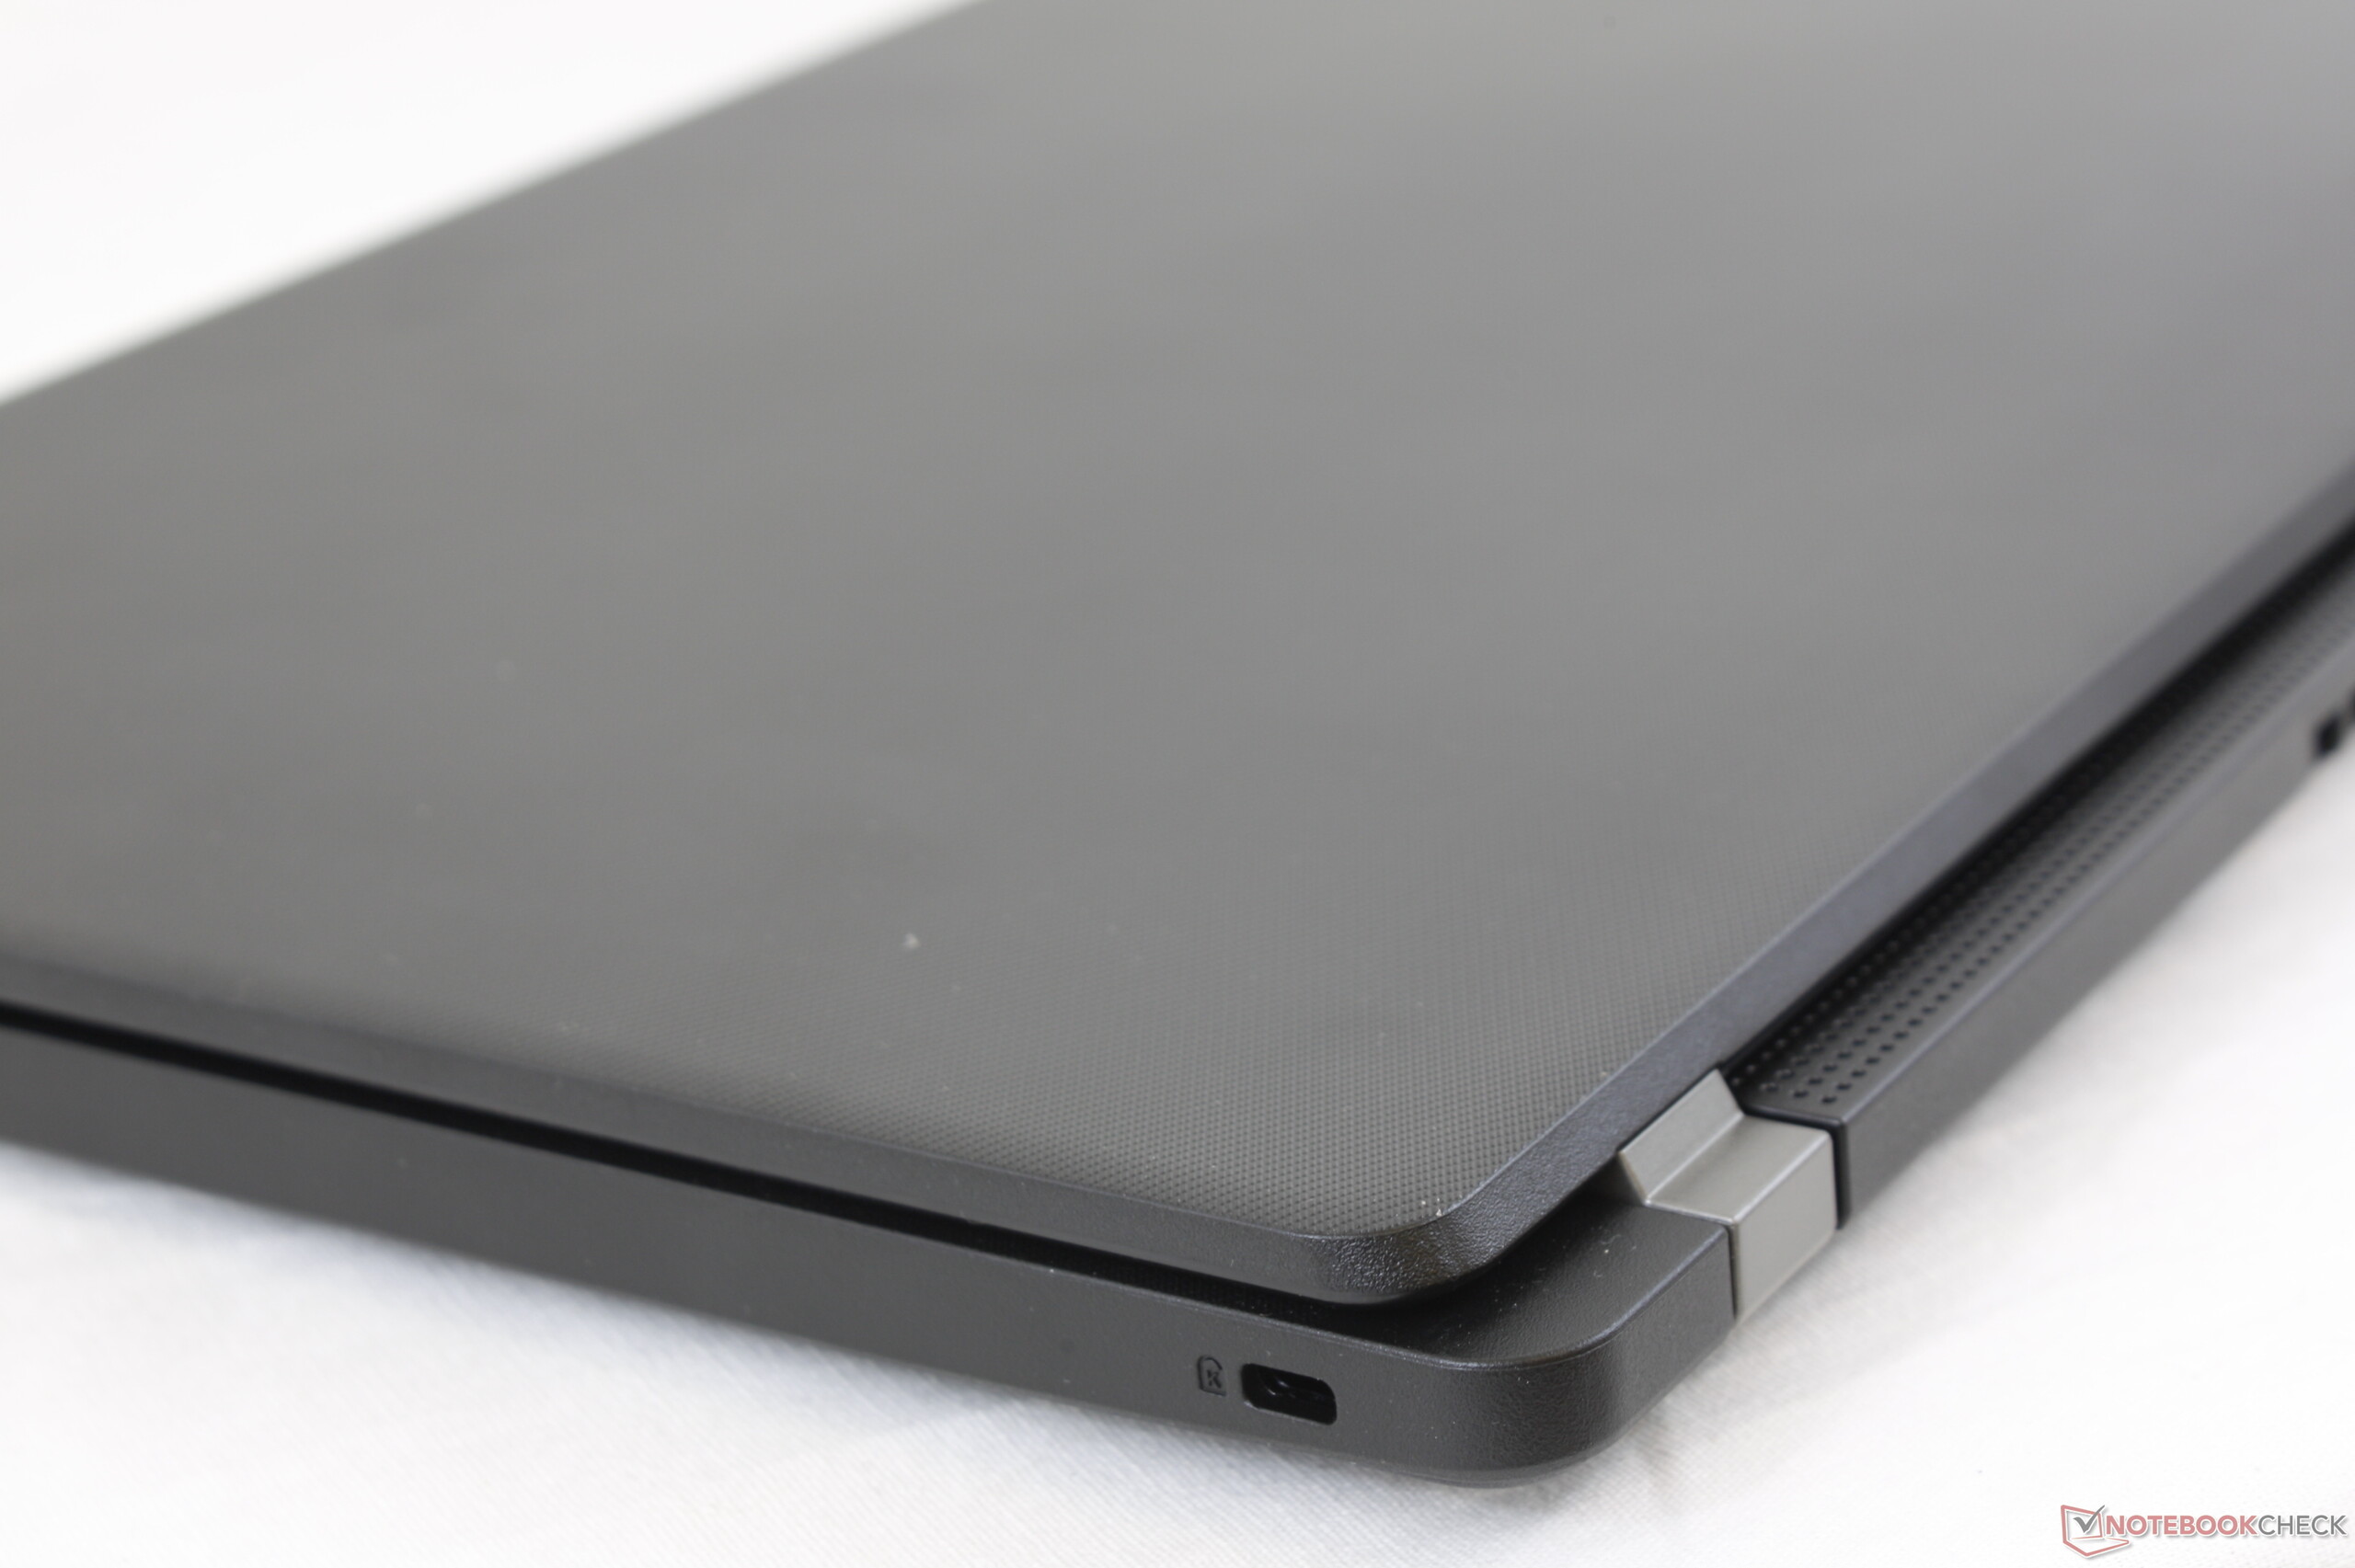
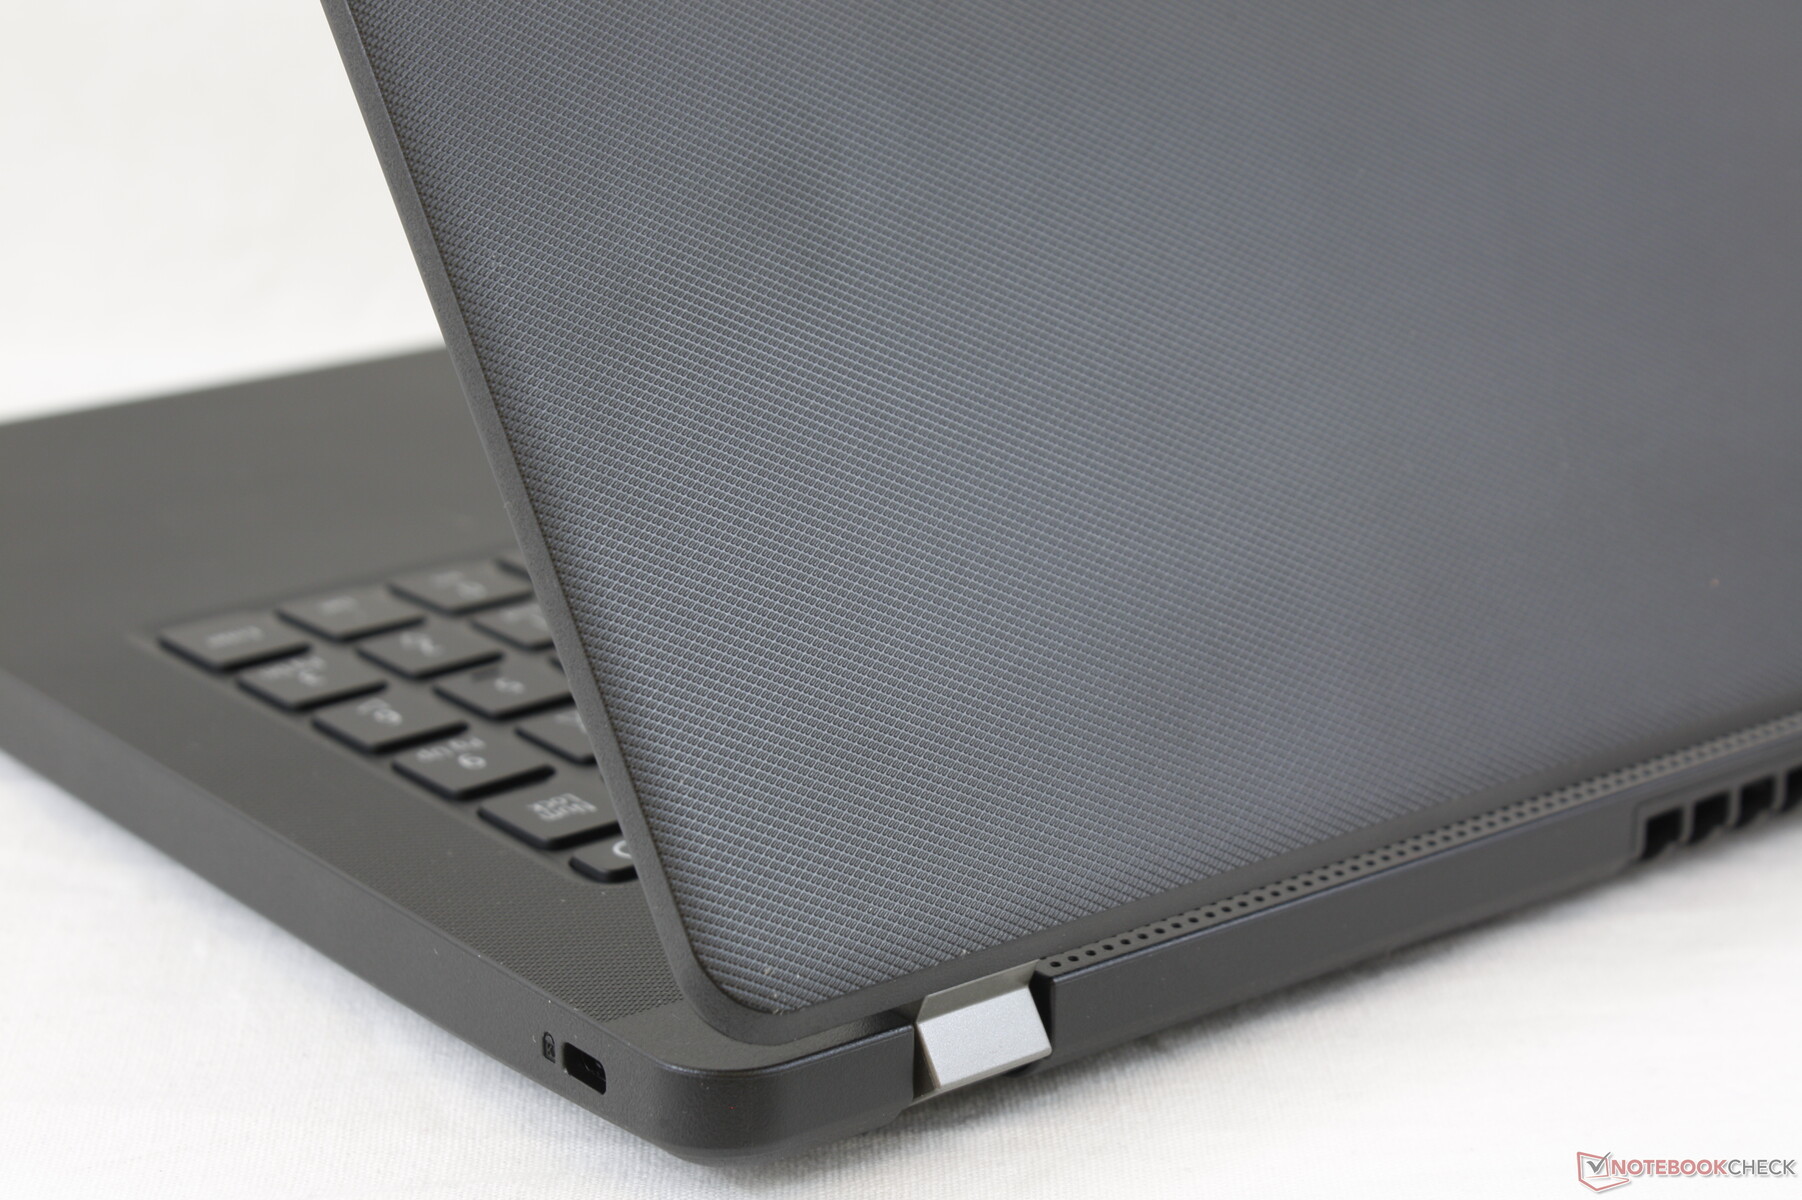
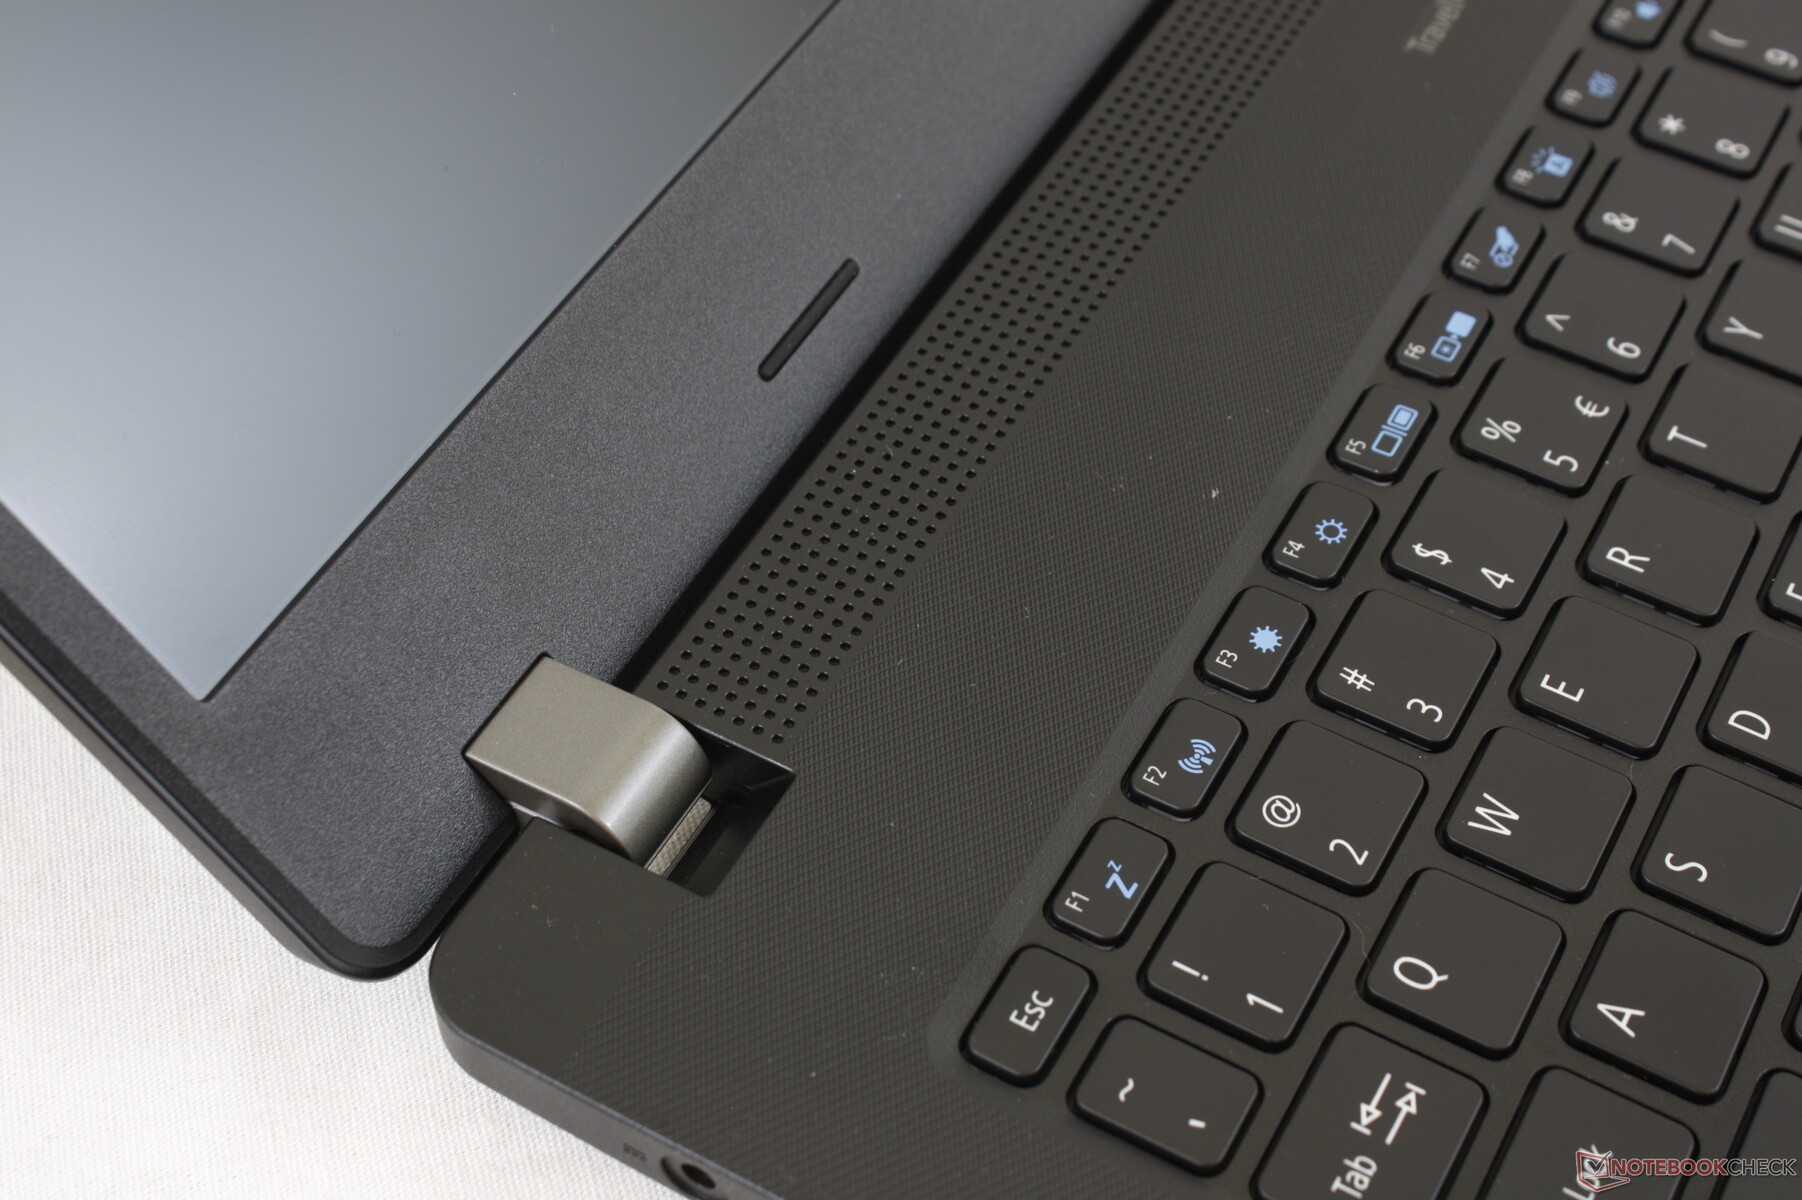
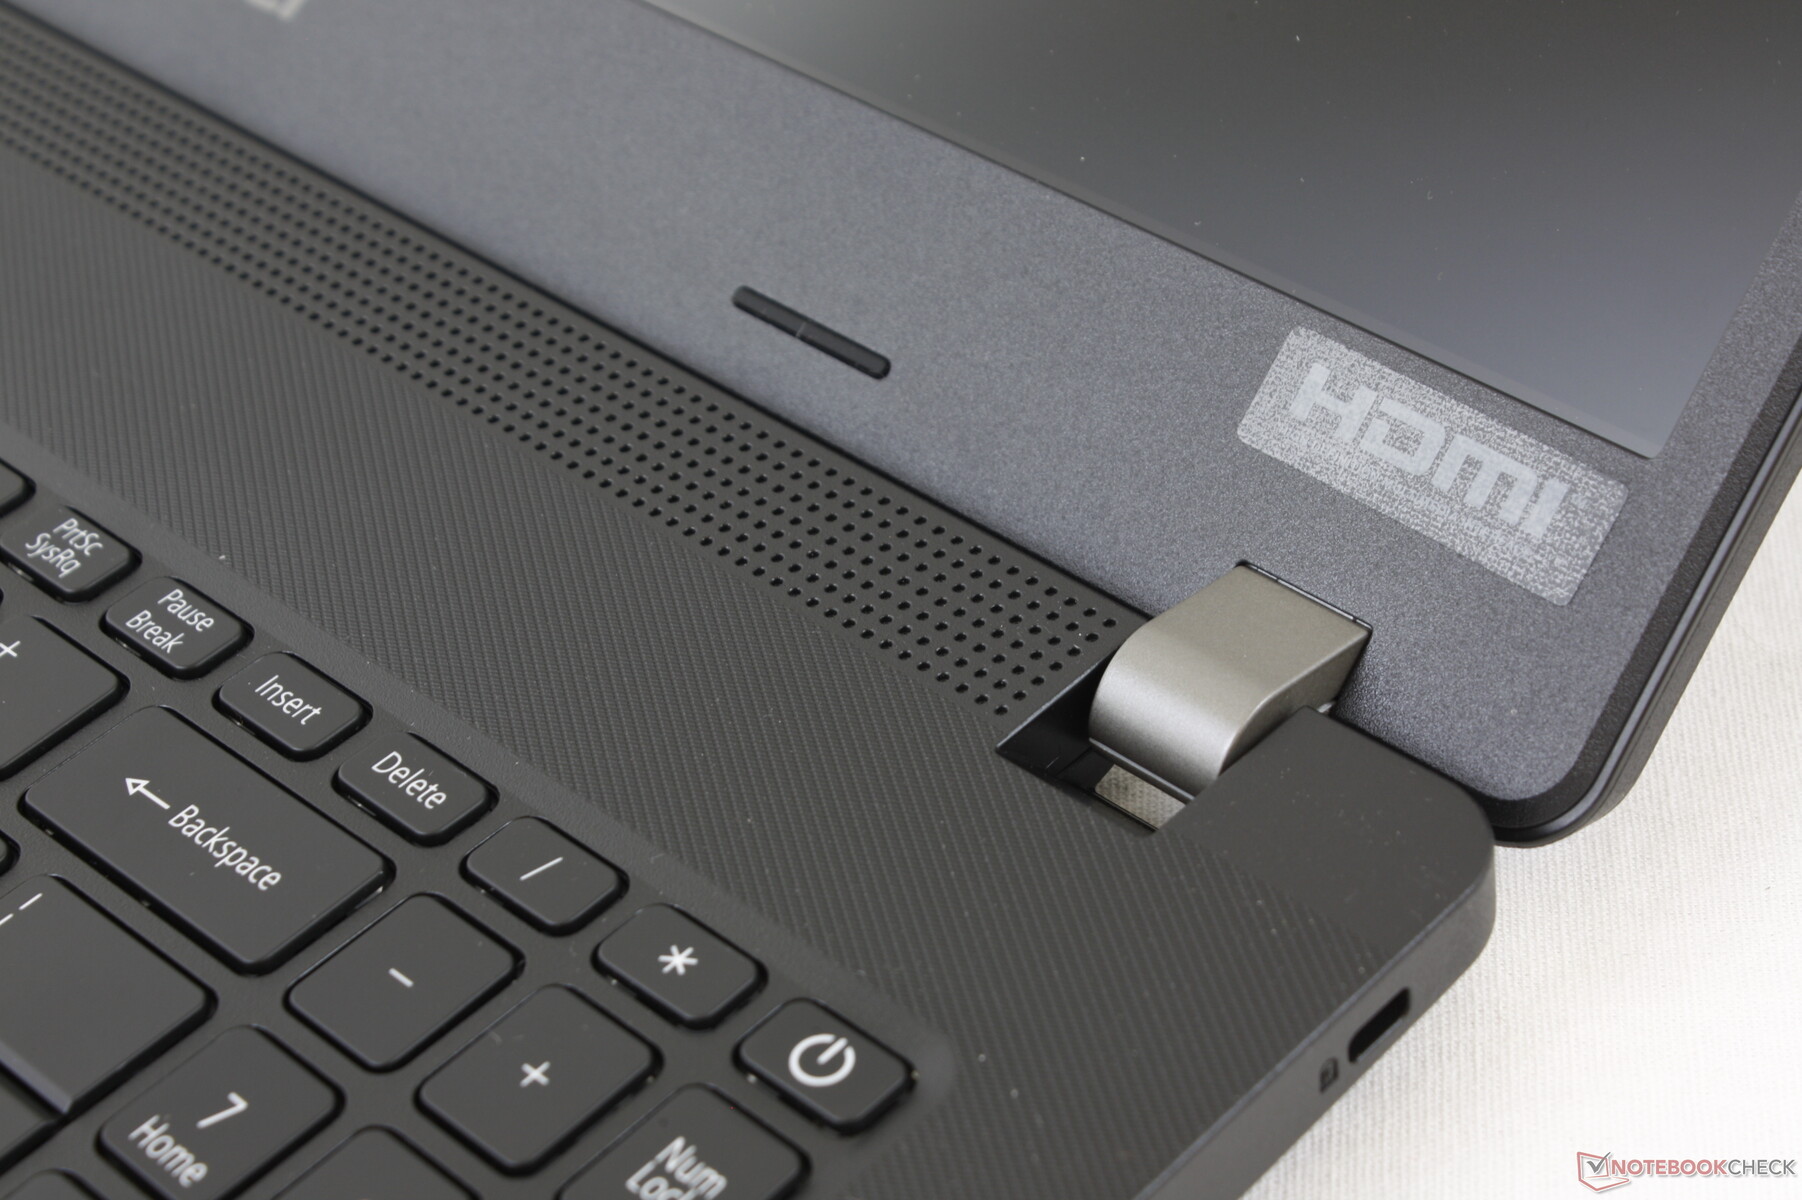
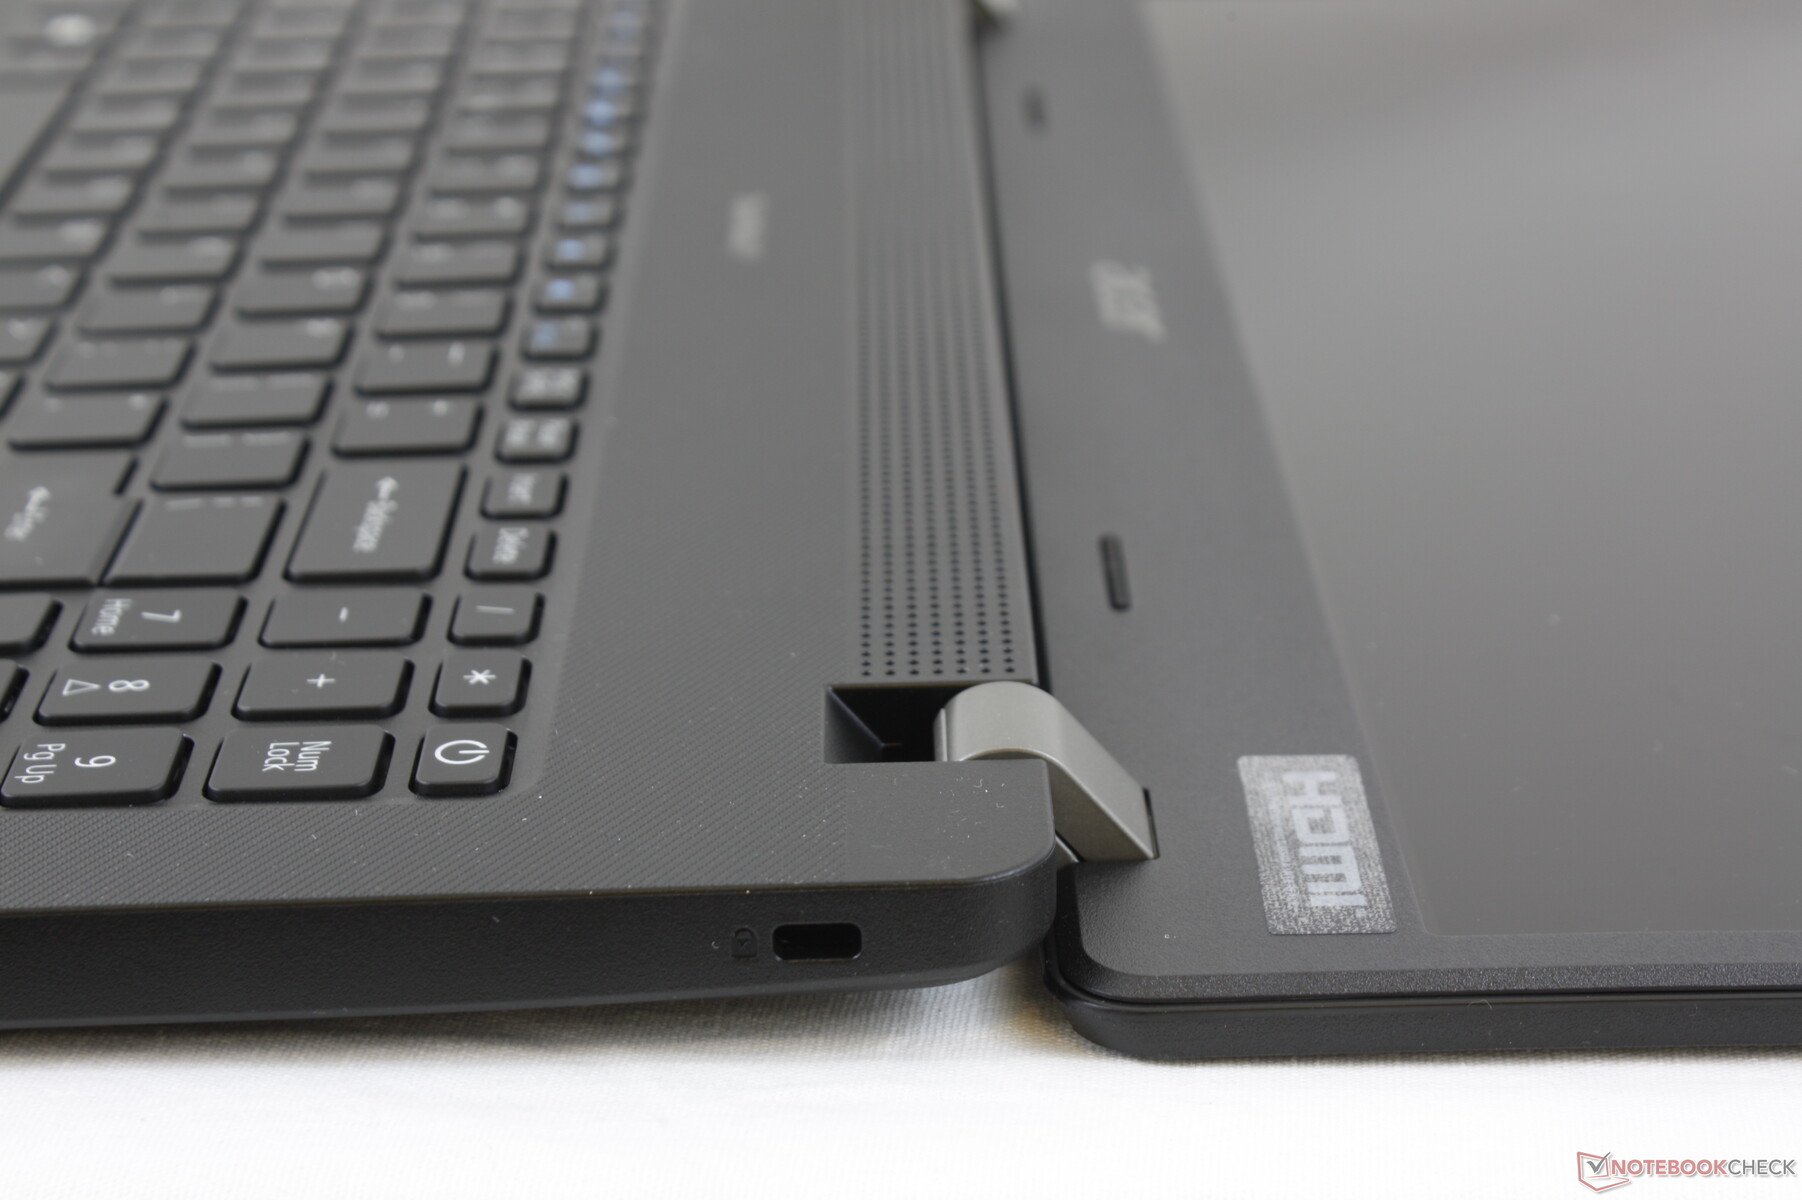
The P215 retains the same visual design language as its P2510 predecessor but with important improvements. Firstly, the bezels along the right and left edges are now much narrower for a more updated look. Secondly, the hinges are now gray in color and a bit larger than before for increased longevity. Thirdly, the webcam now has a physical shutter to address privacy concerns. And lastly, the keyboard and clickpad are different in layout.
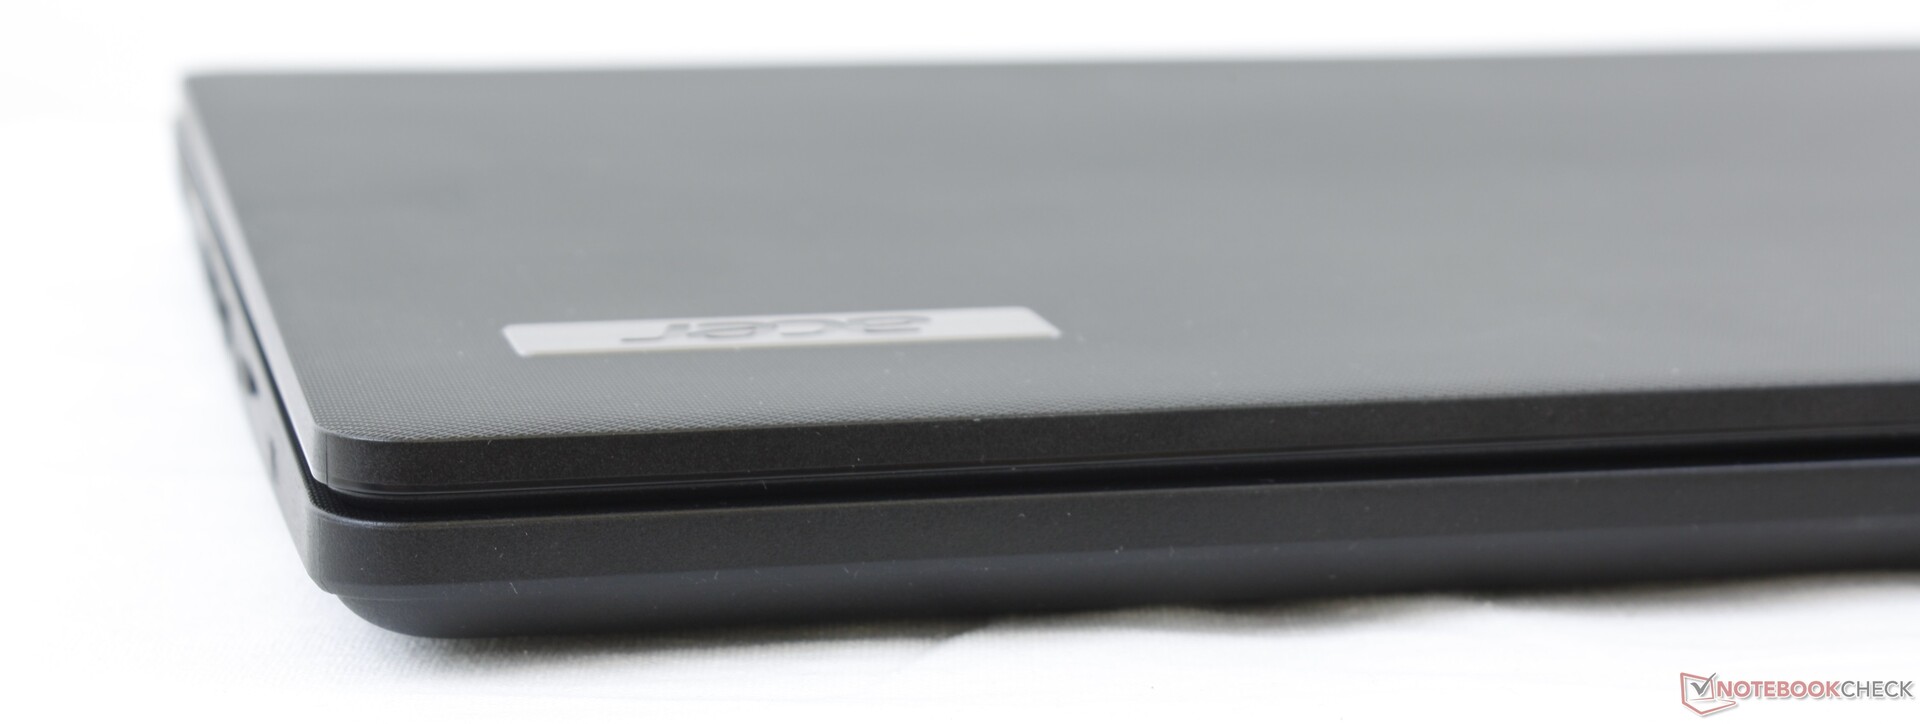
Overall chassis materials and rigidity remain almost identical year-over-year. Thus, the newer model is noticeably lighter and smaller without feeling any weaker or stronger than before.
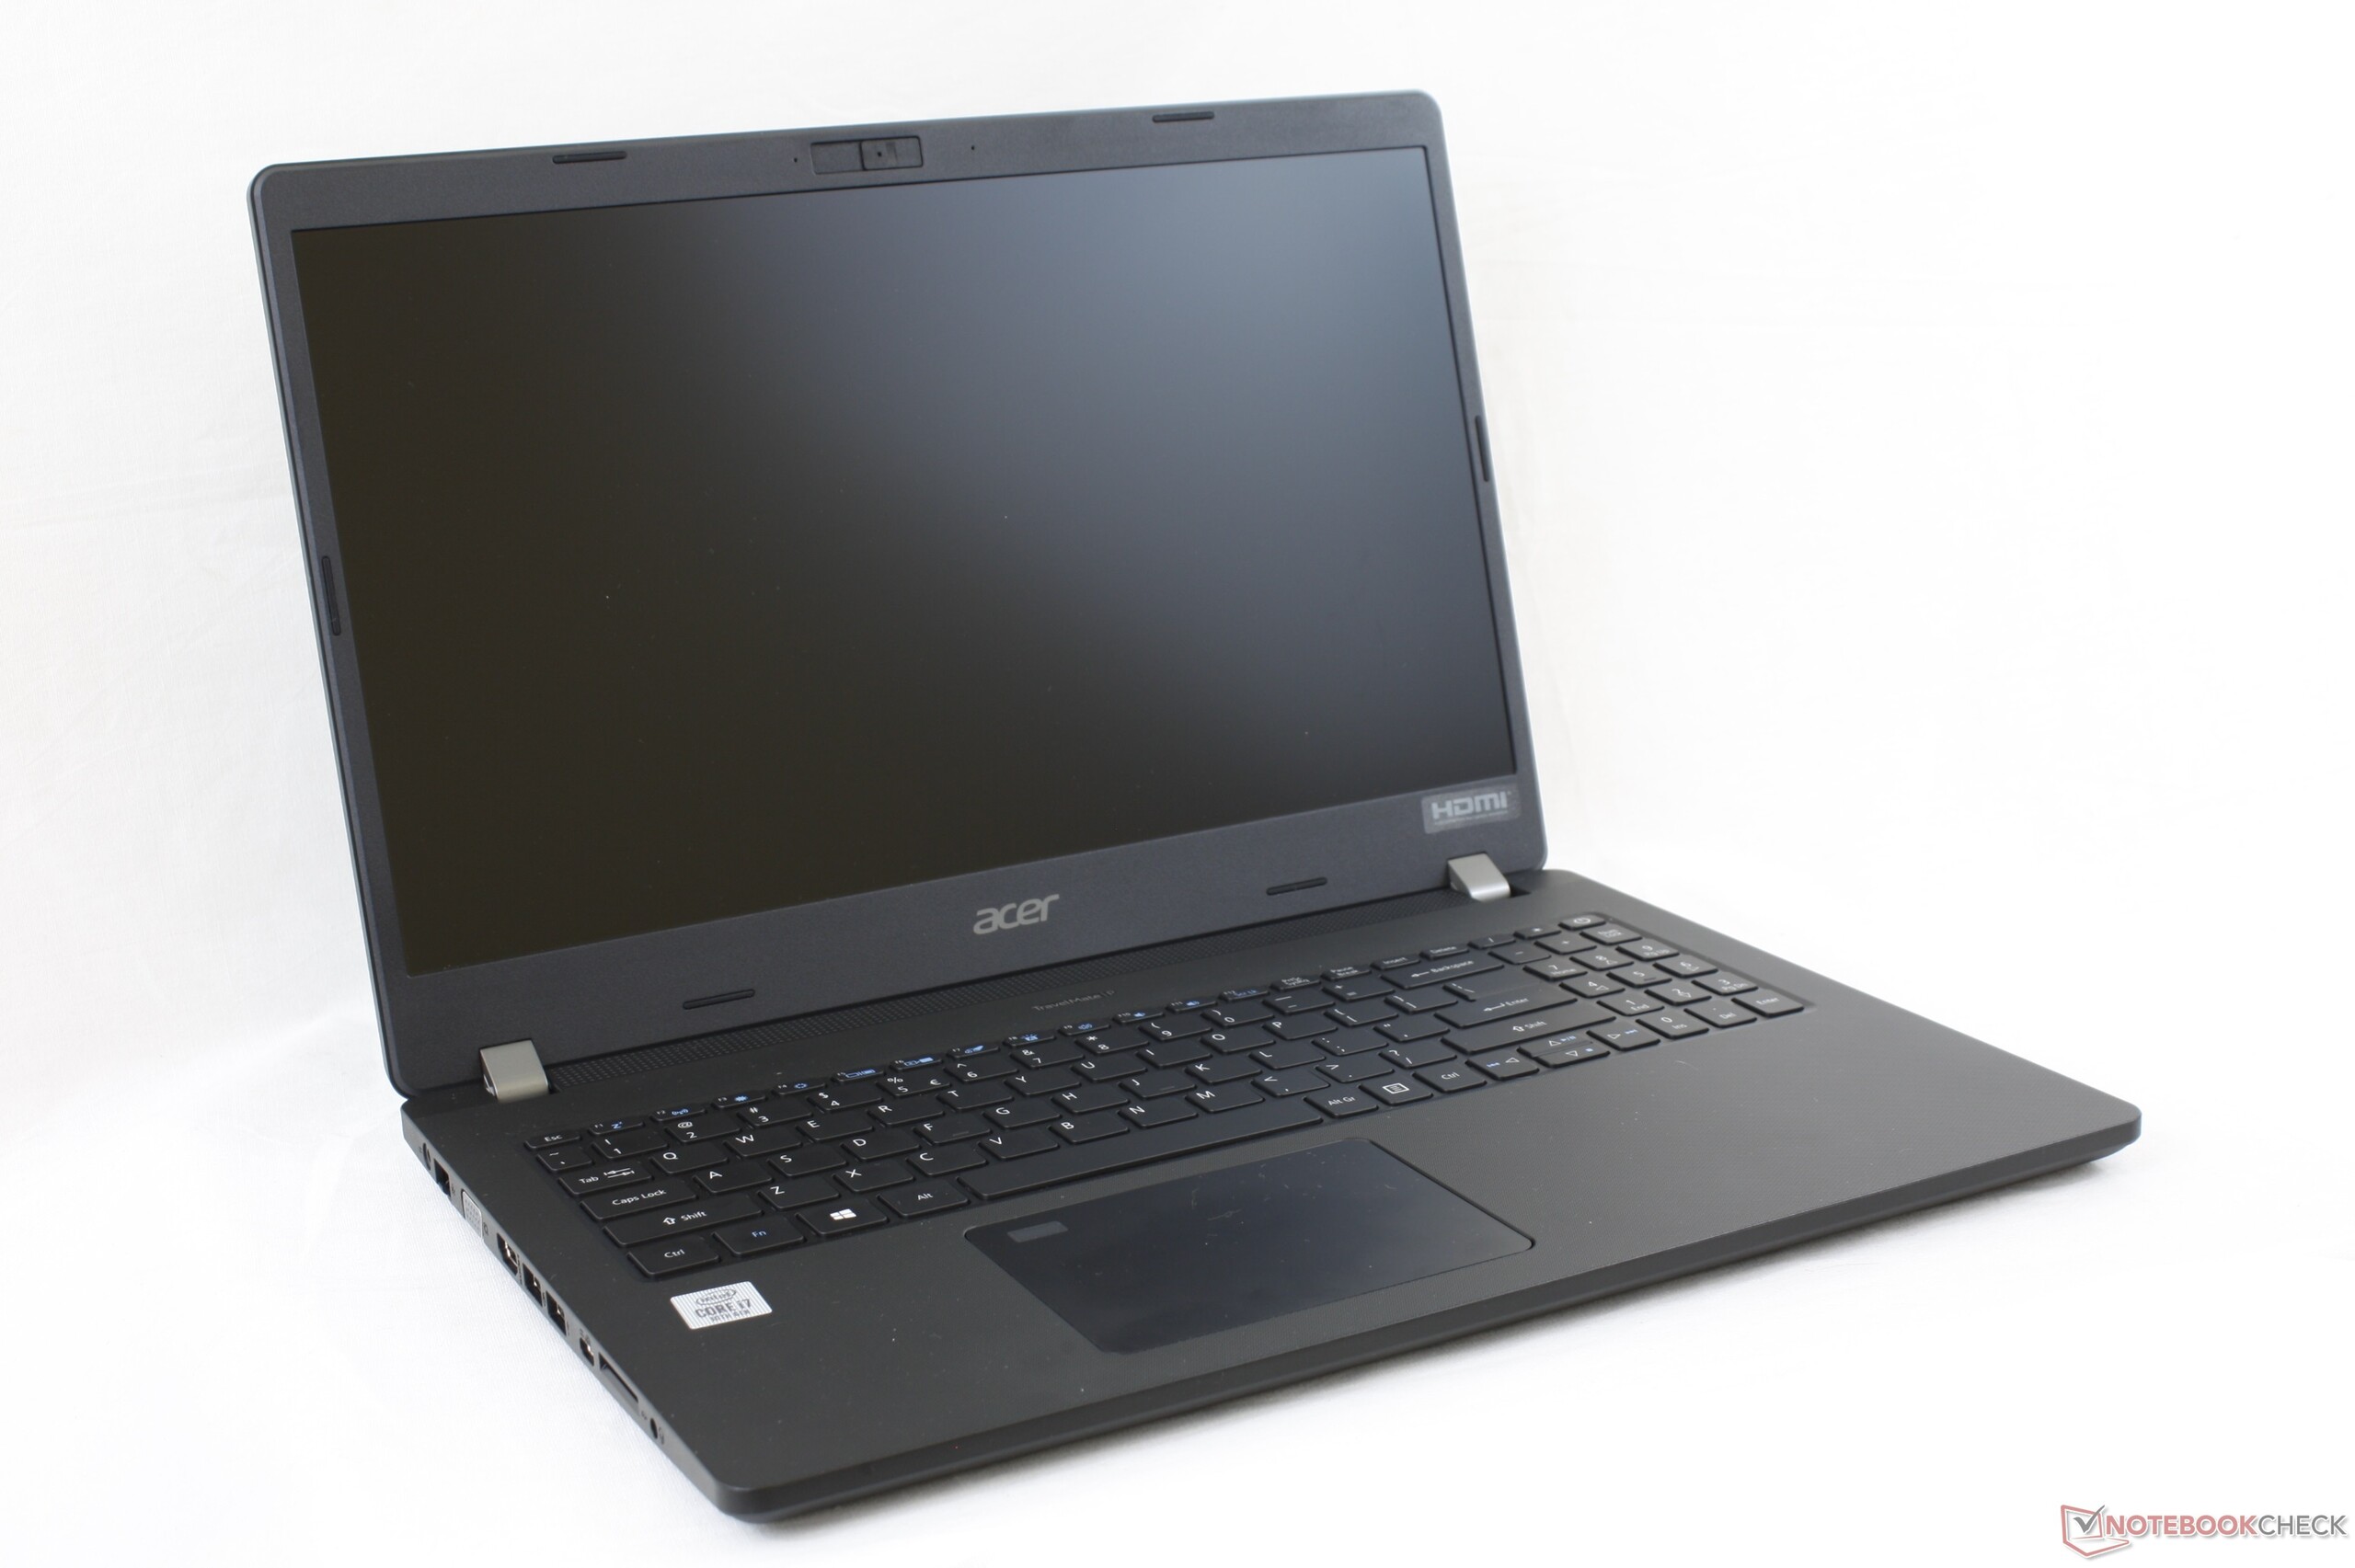
The system weighs about 300 g lighter than the older TravelMate P2510 while being about 17 mm shorter in length due to the narrower display bezels. It's small and lightweight for a budget office laptop especially when compared to the competing Dell Latitude 3590.
Connectivity
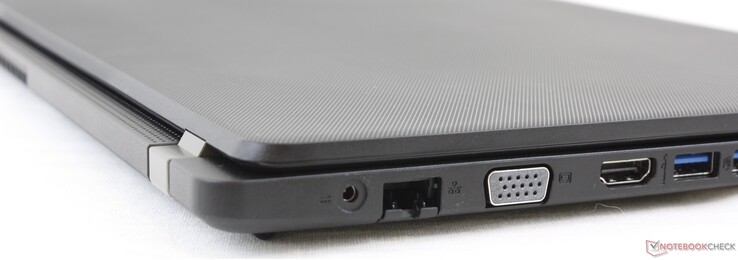
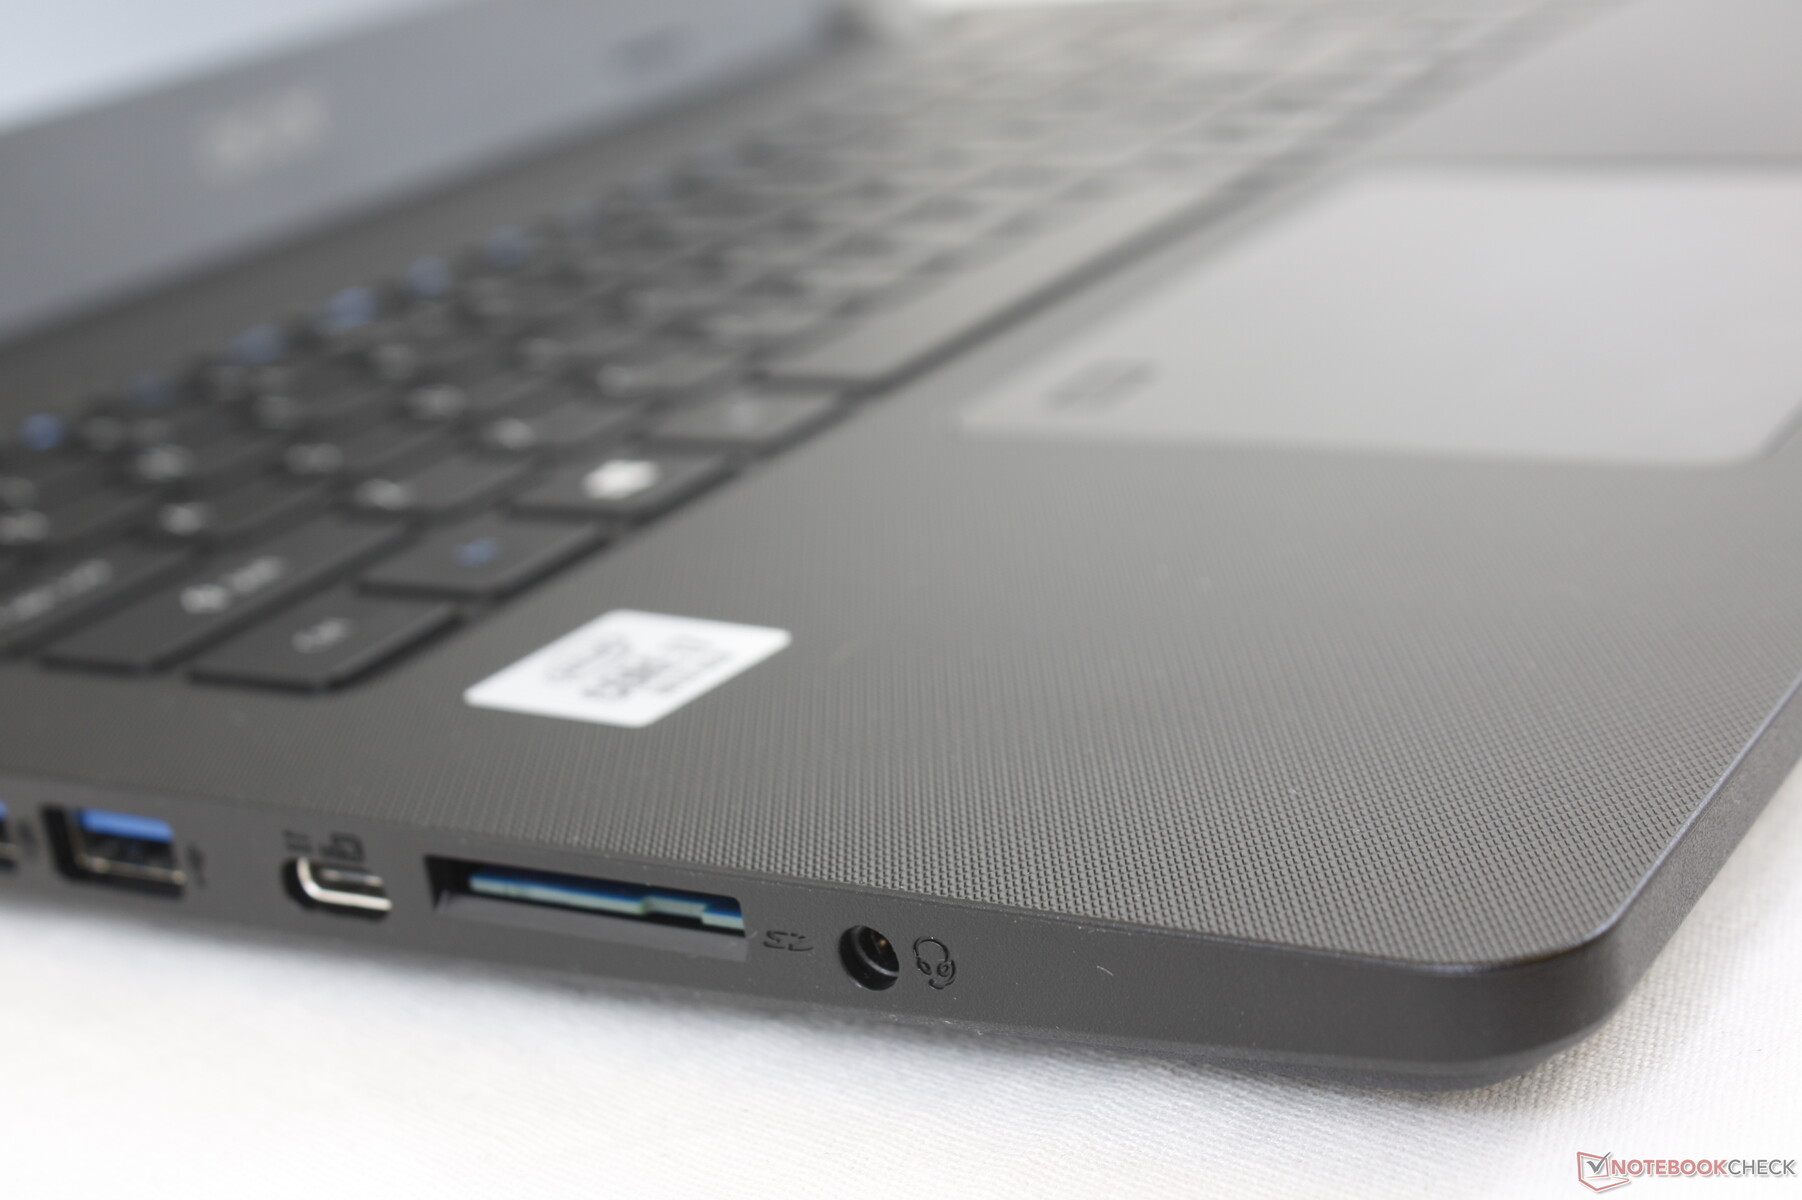
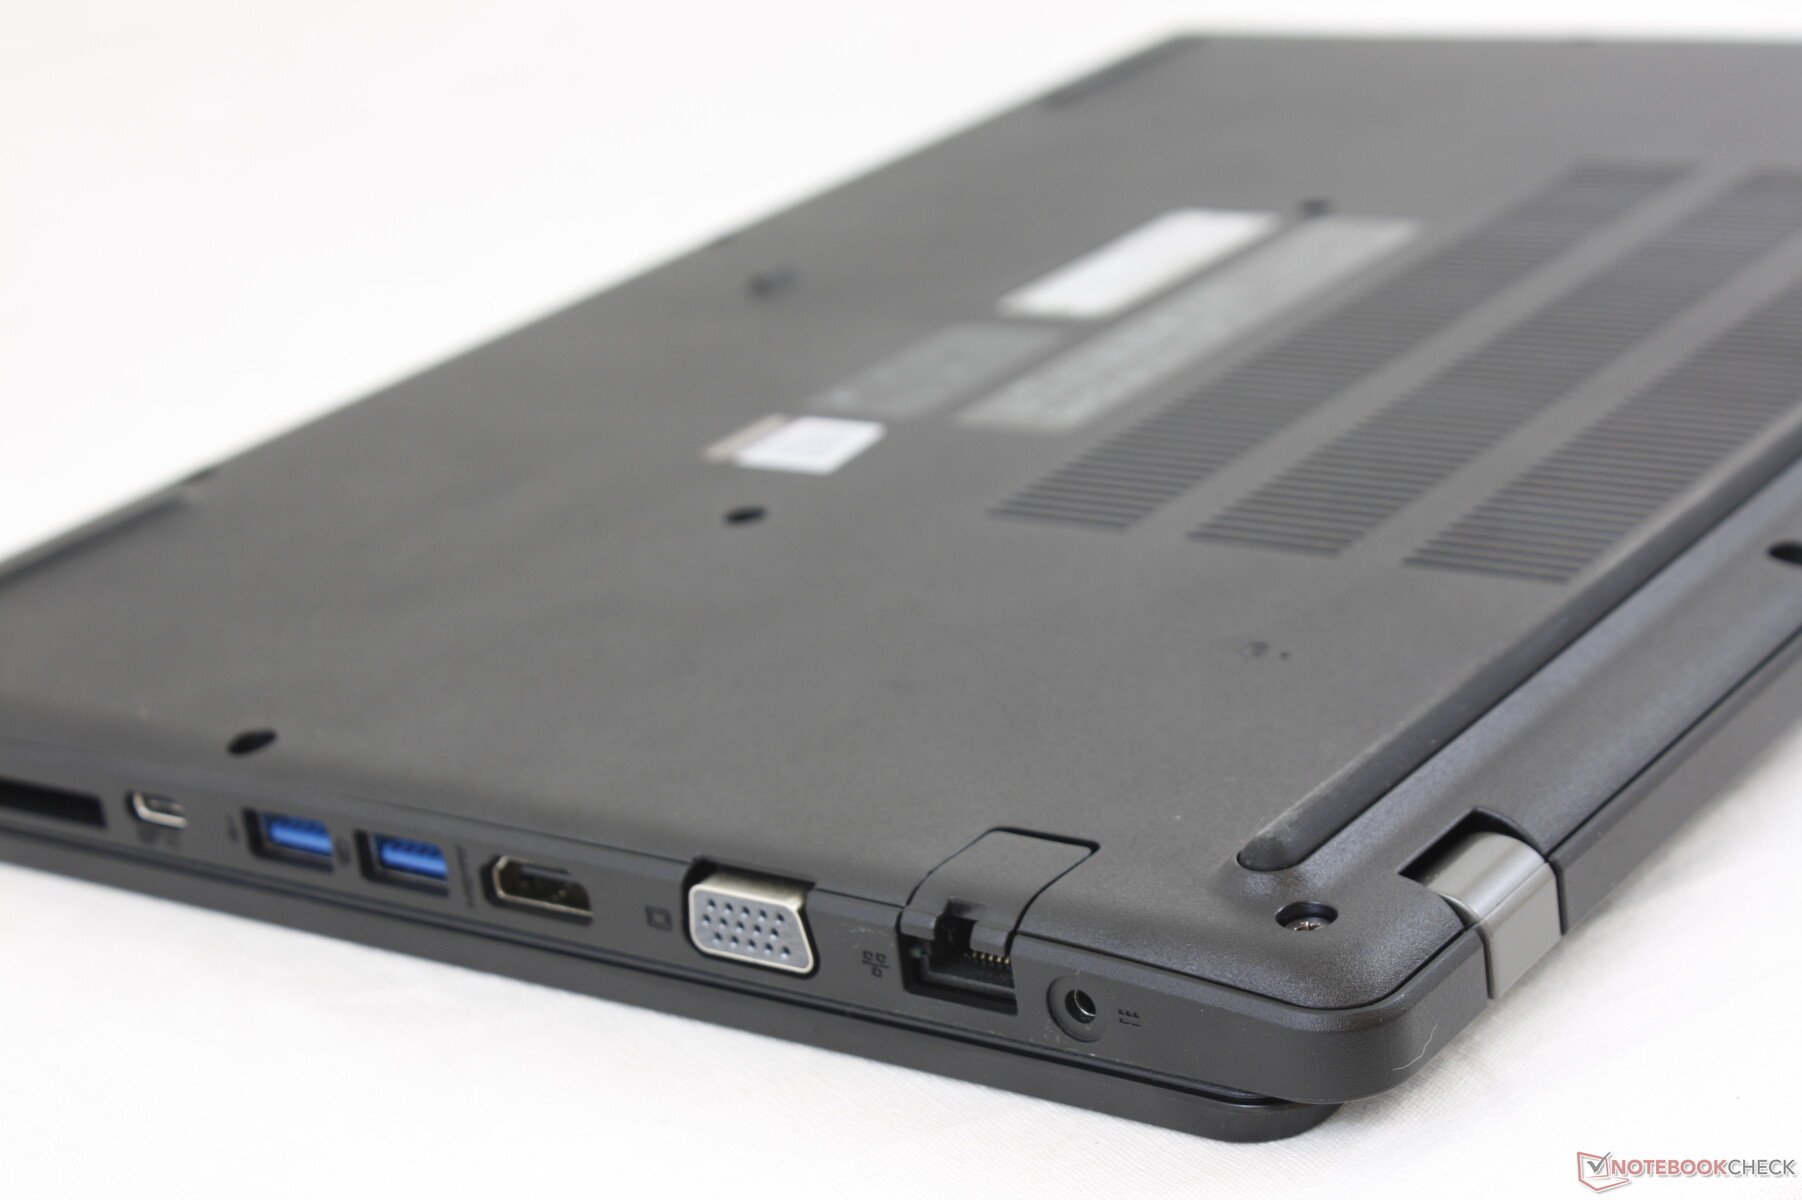
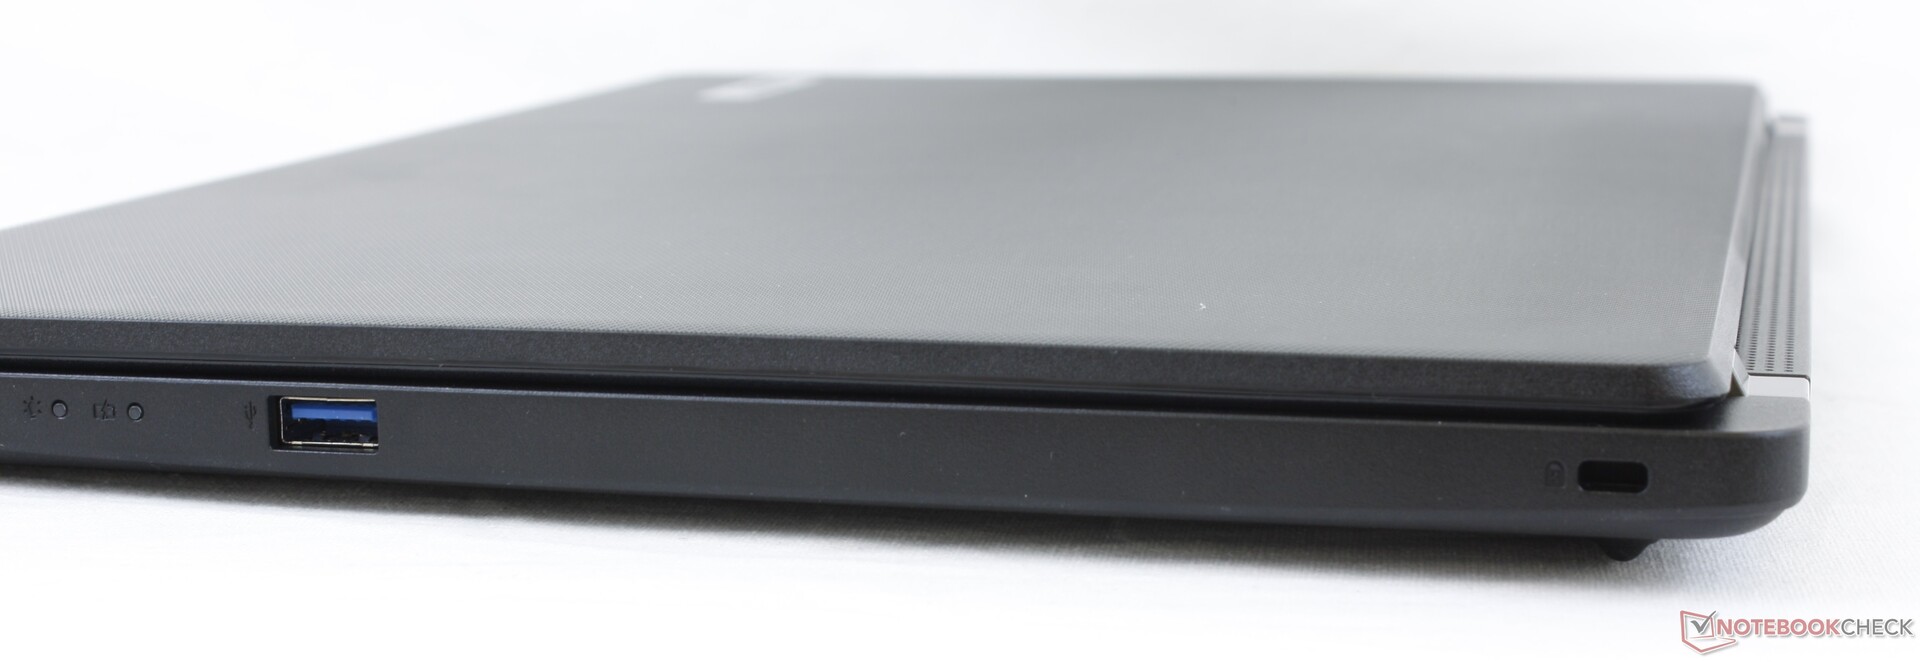
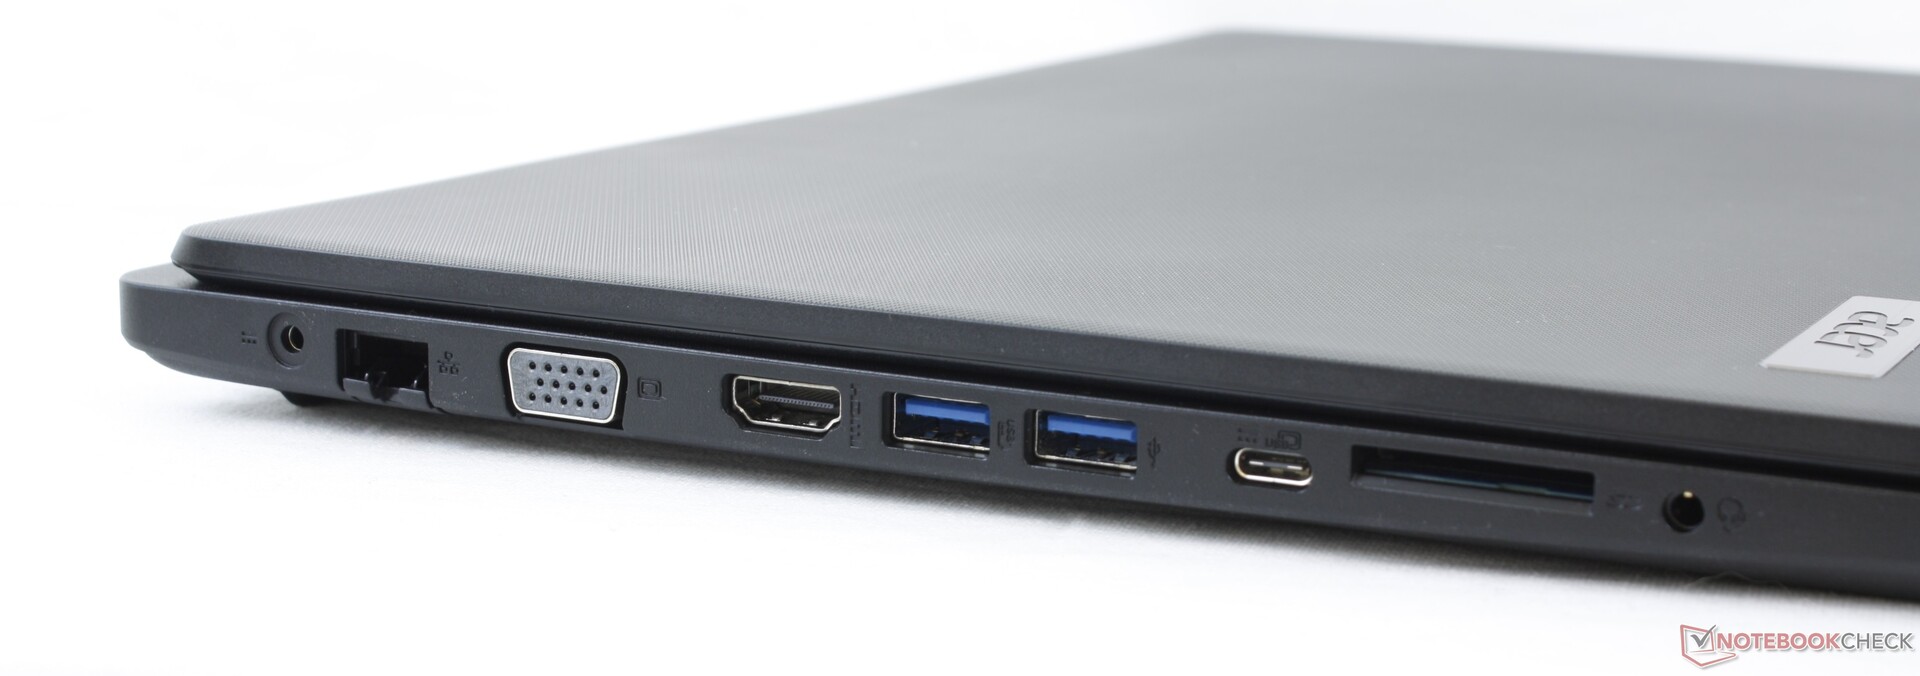
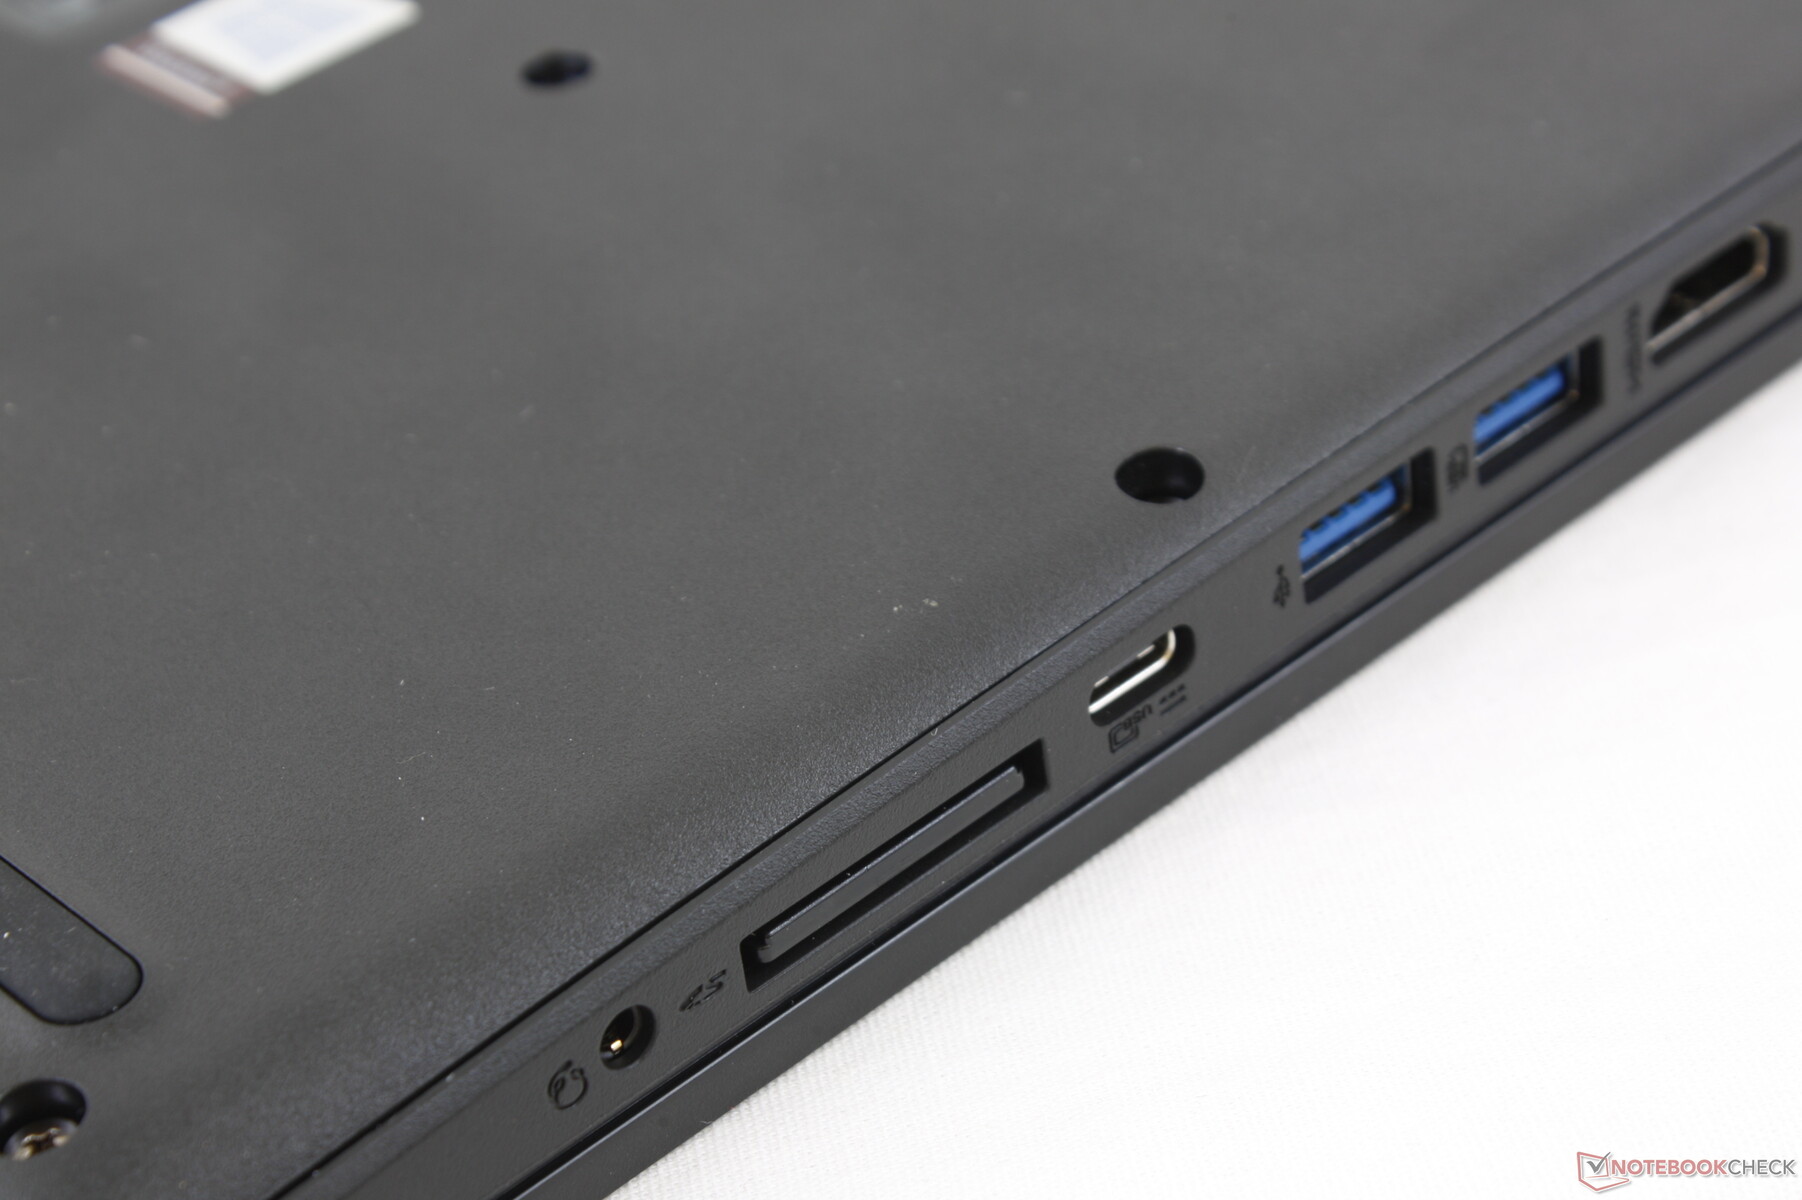
The TravelMate P2 is one of the few laptops still shipping with VGA-out, full-size HDMI, RJ-45, and USB-C with DisplayPort compatibility all on one machine. When compared to the older TravelMate P2510, Acer has relocated one USB-A port from the right edge to the left edge. We're not sure if this was necessary since the left edge is now even more jam-packed with ports than ever before.
SD Card Reader
Transfer rates from the spring-laded SD card reader is very slow at just 17 MB/s. Moving 1 GB of pictures from our UHS-II test card to desktop takes a full minute compared to just 14 seconds on the HP ProBook 450 G7. Be prepared to wait longer than usual if you use SD cards often.
| SD Card Reader | |
| average JPG Copy Test (av. of 3 runs) | |
| HP ProBook 450 G7 8WC04UT (Toshiba Exceria Pro SDXC 64 GB UHS-II) | |
| Lenovo ThinkPad L590-20Q70019GE (Toshiba Exceria Pro M501 64 GB UHS-II) | |
| Dell Latitude 15 3590 (Toshiba Exceria Pro SDXC 64 GB UHS-II) | |
| Acer TravelMate P215-52 (Toshiba Exceria Pro SDXC 64 GB UHS-II) | |
| maximum AS SSD Seq Read Test (1GB) | |
| Lenovo ThinkPad L590-20Q70019GE (Toshiba Exceria Pro M501 64 GB UHS-II) | |
| HP ProBook 450 G7 8WC04UT (Toshiba Exceria Pro SDXC 64 GB UHS-II) | |
| Dell Latitude 15 3590 (Toshiba Exceria Pro SDXC 64 GB UHS-II) | |
| Acer TravelMate P215-52 (Toshiba Exceria Pro SDXC 64 GB UHS-II) | |
Communication
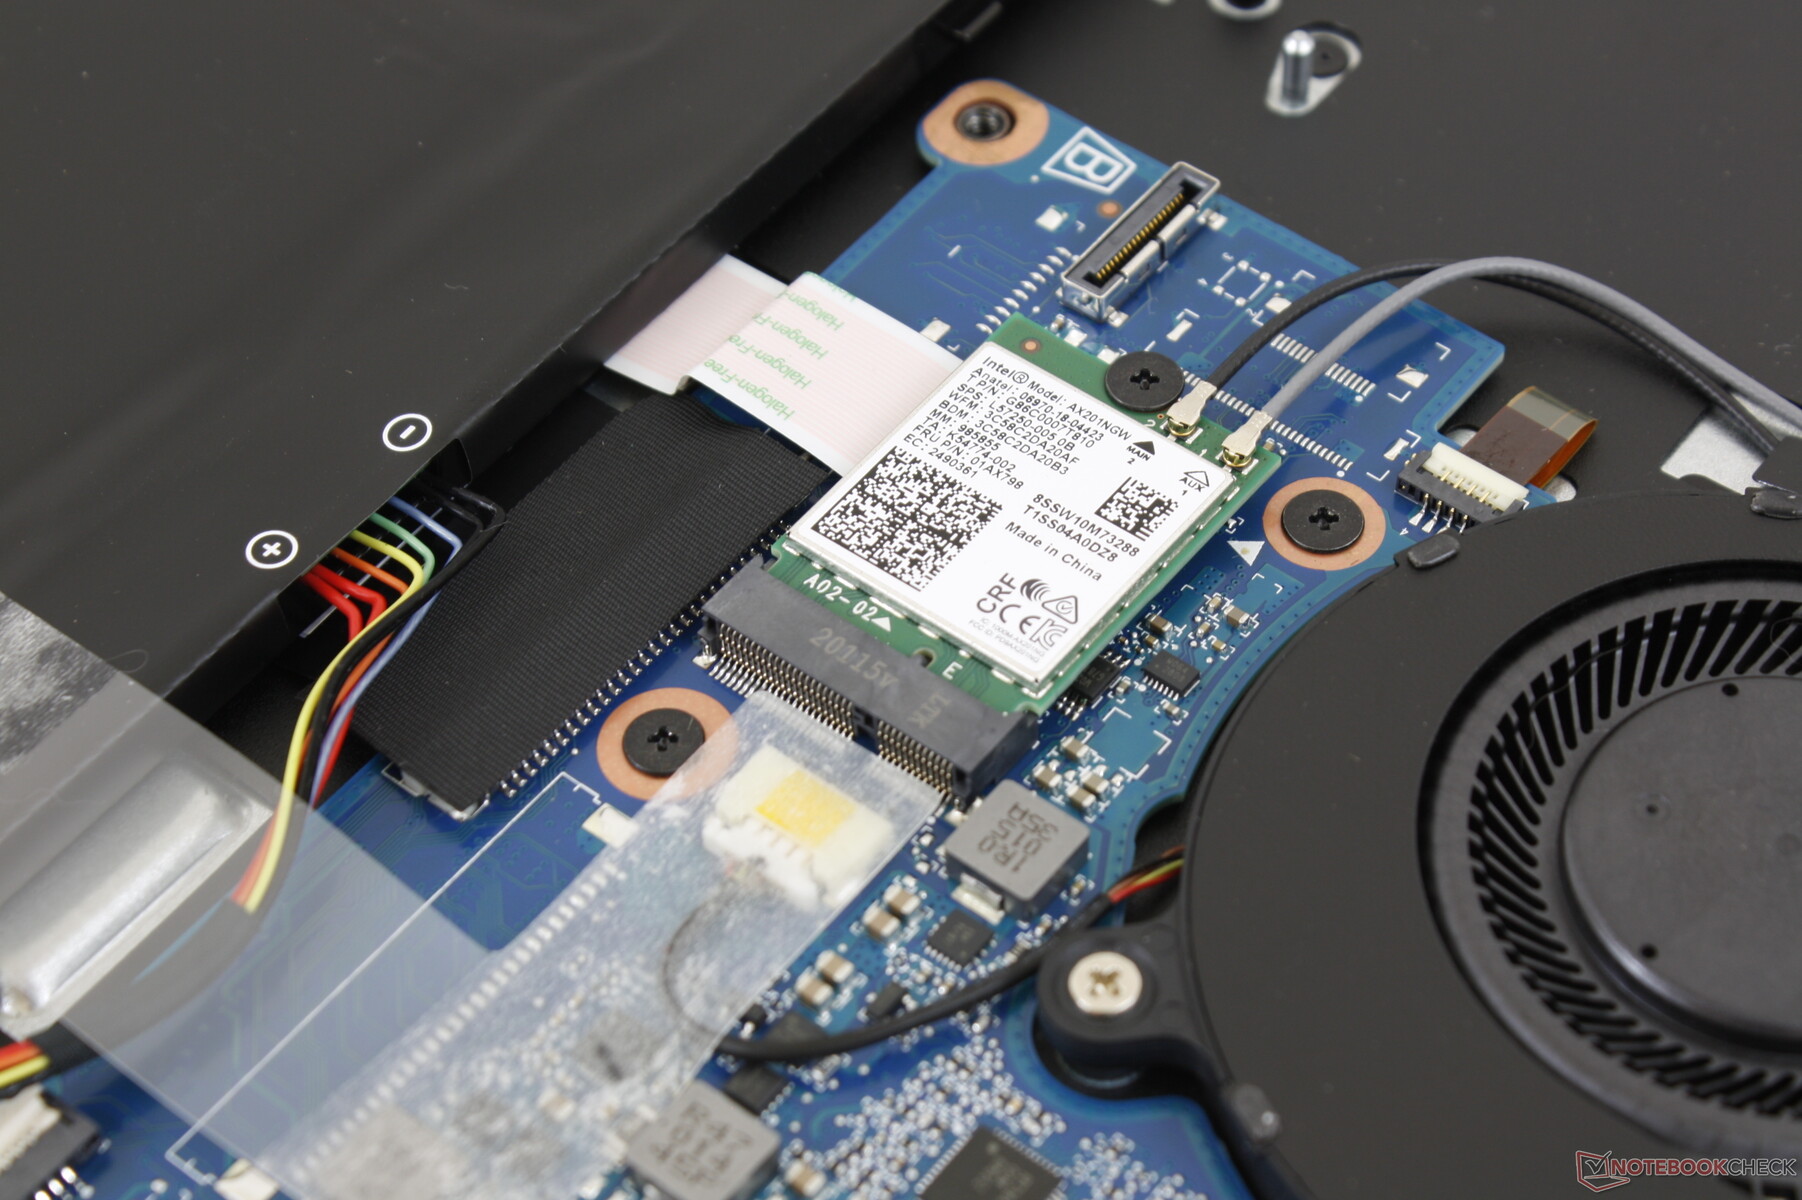
The Intel AX201 comes standard for Wi-Fi 6 and Bluetooth 5 connectivity. We experienced no issues when connected to our Netgear RAX200 test router.
Webcam


Security
Acer ProShield Security Manager is included with file encryption/decryption, data removal, TPM, and BIOS protection features. Fingerprint reader and Kensington Lock are available, but an IR camera is not.
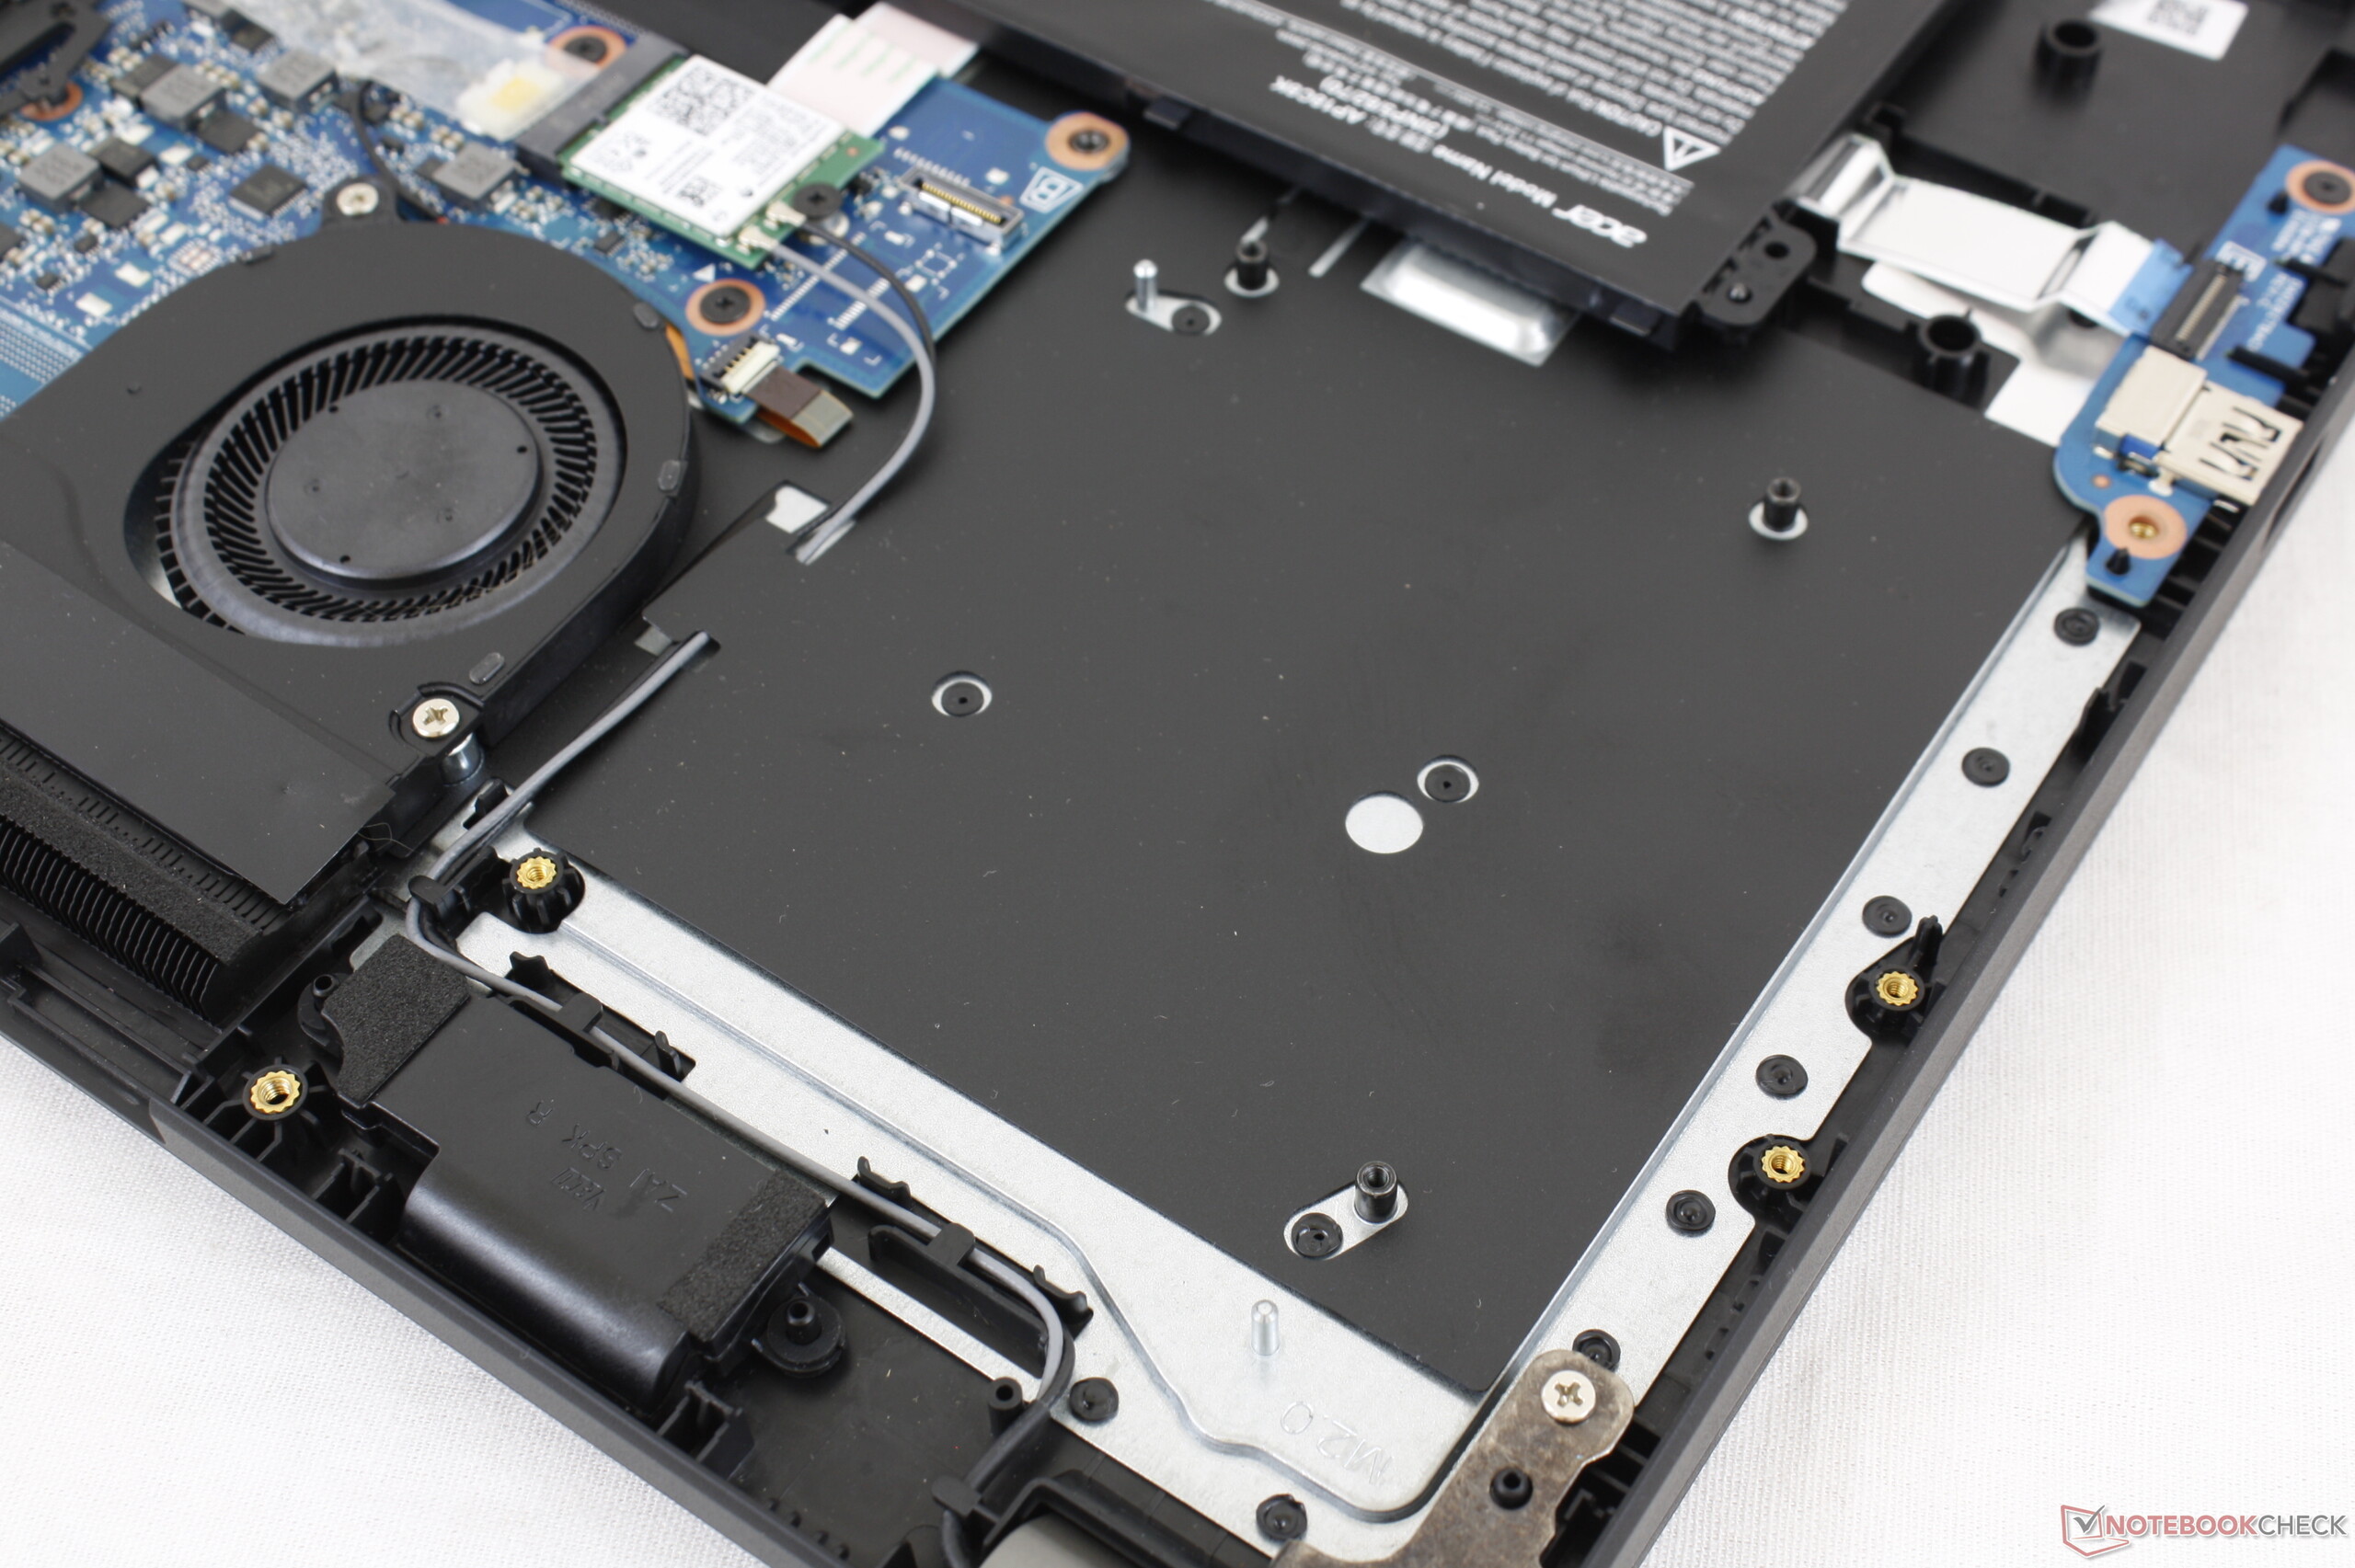
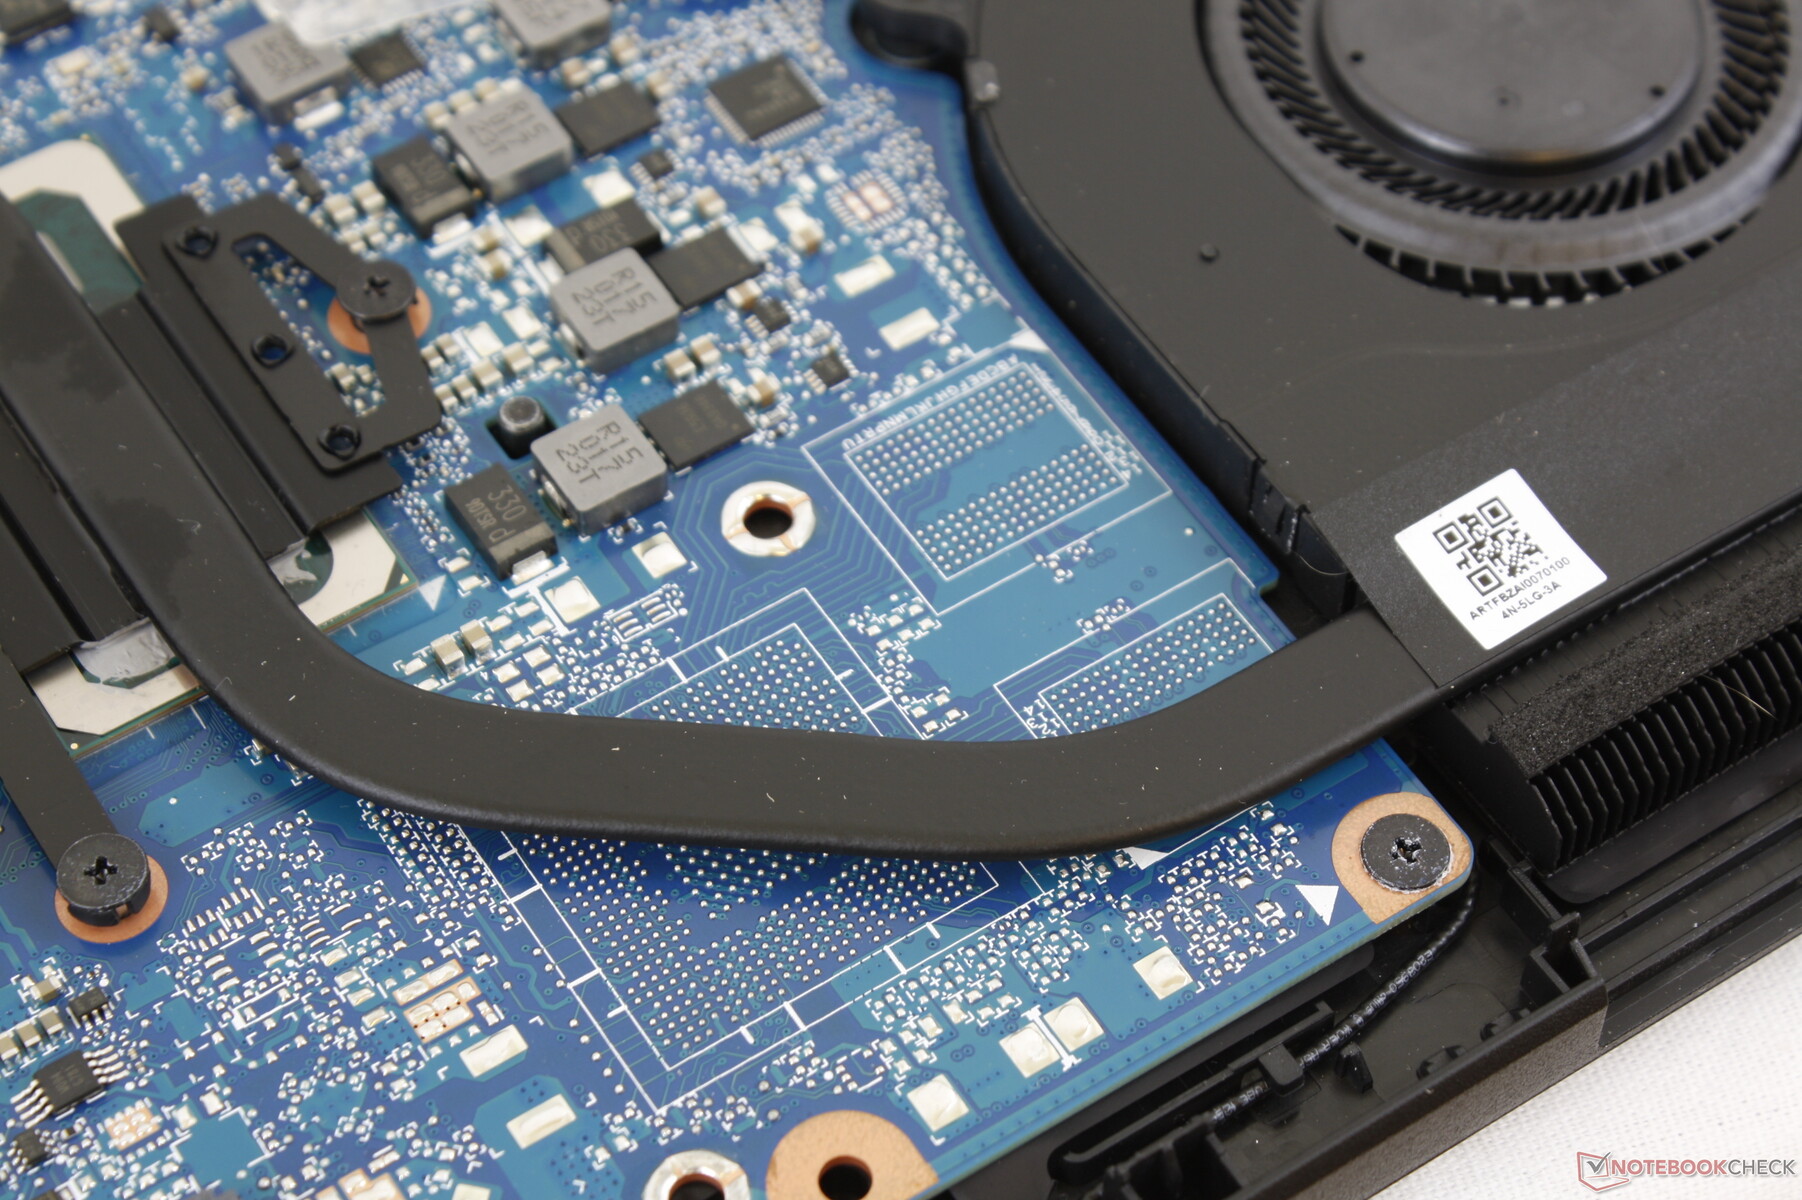
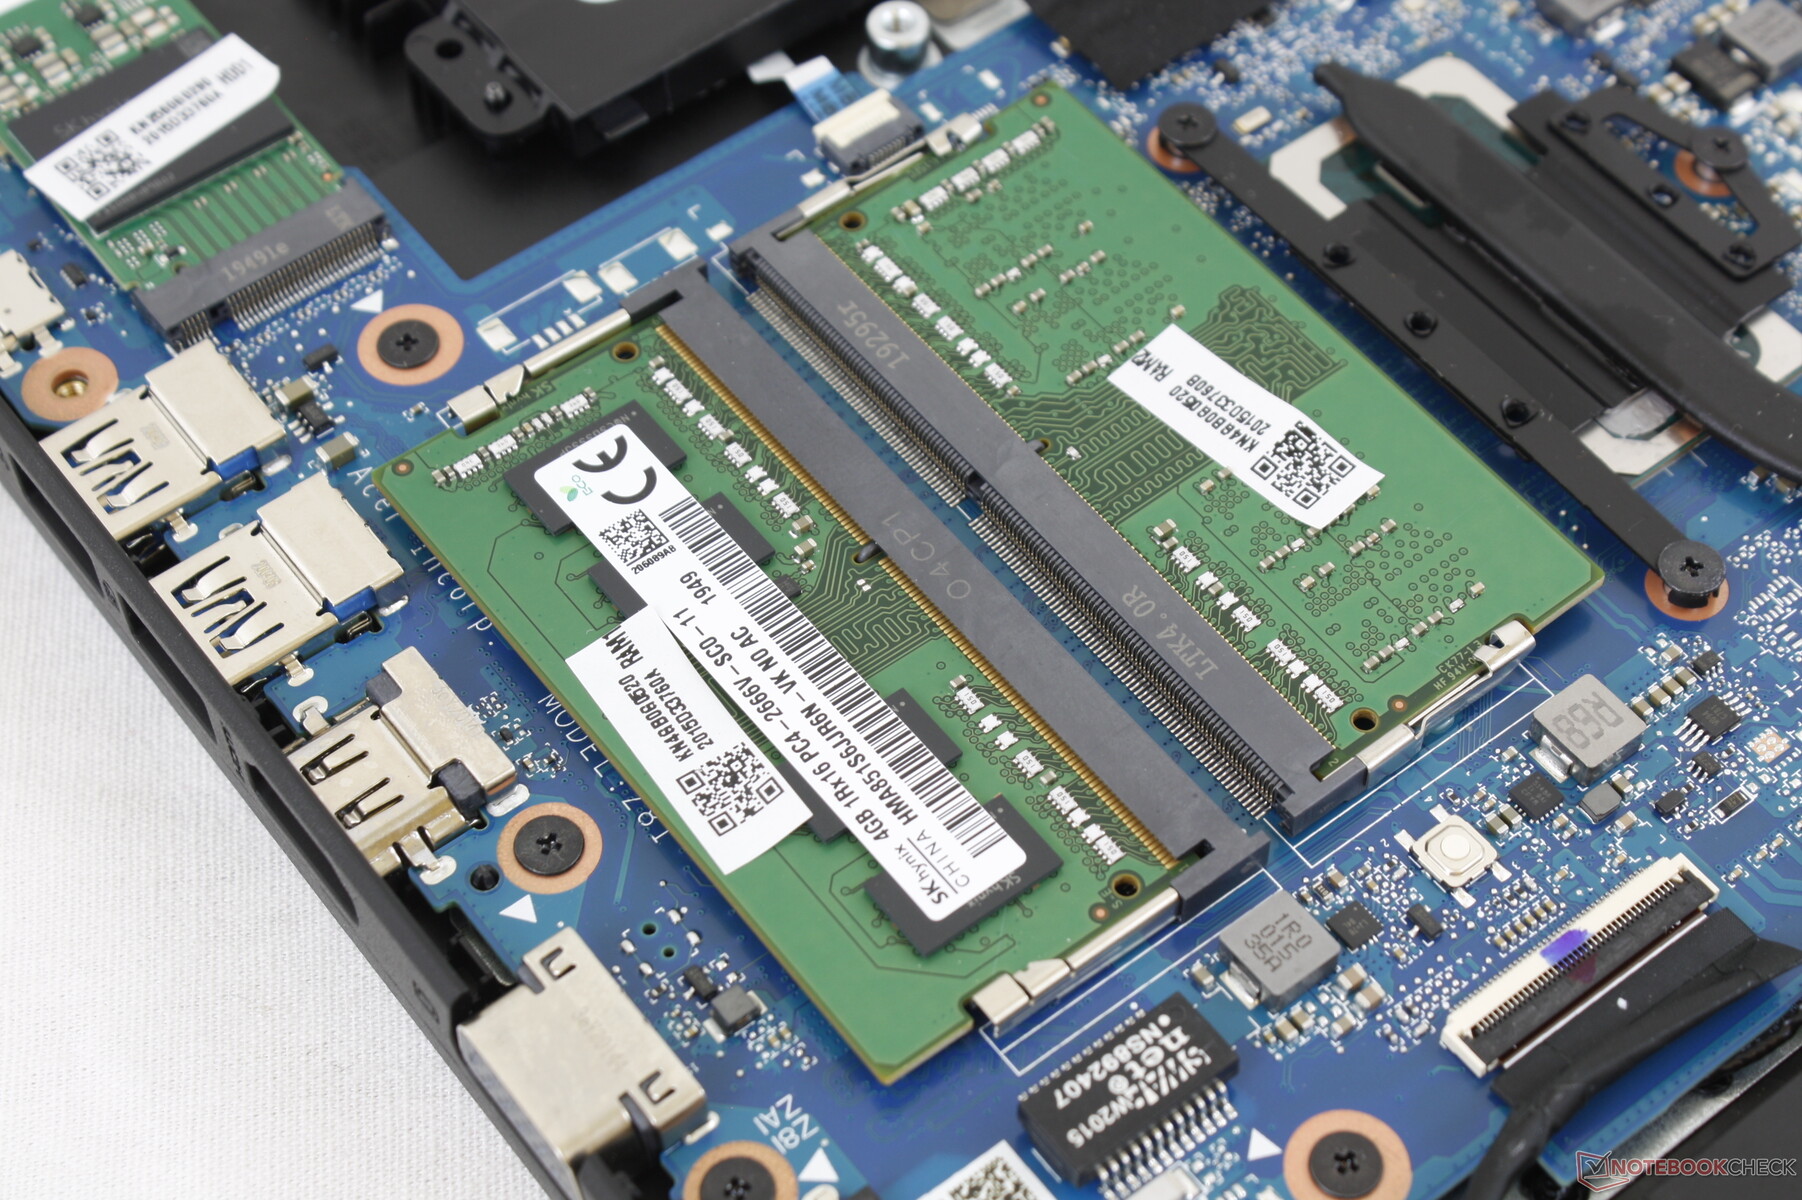
Maintenance
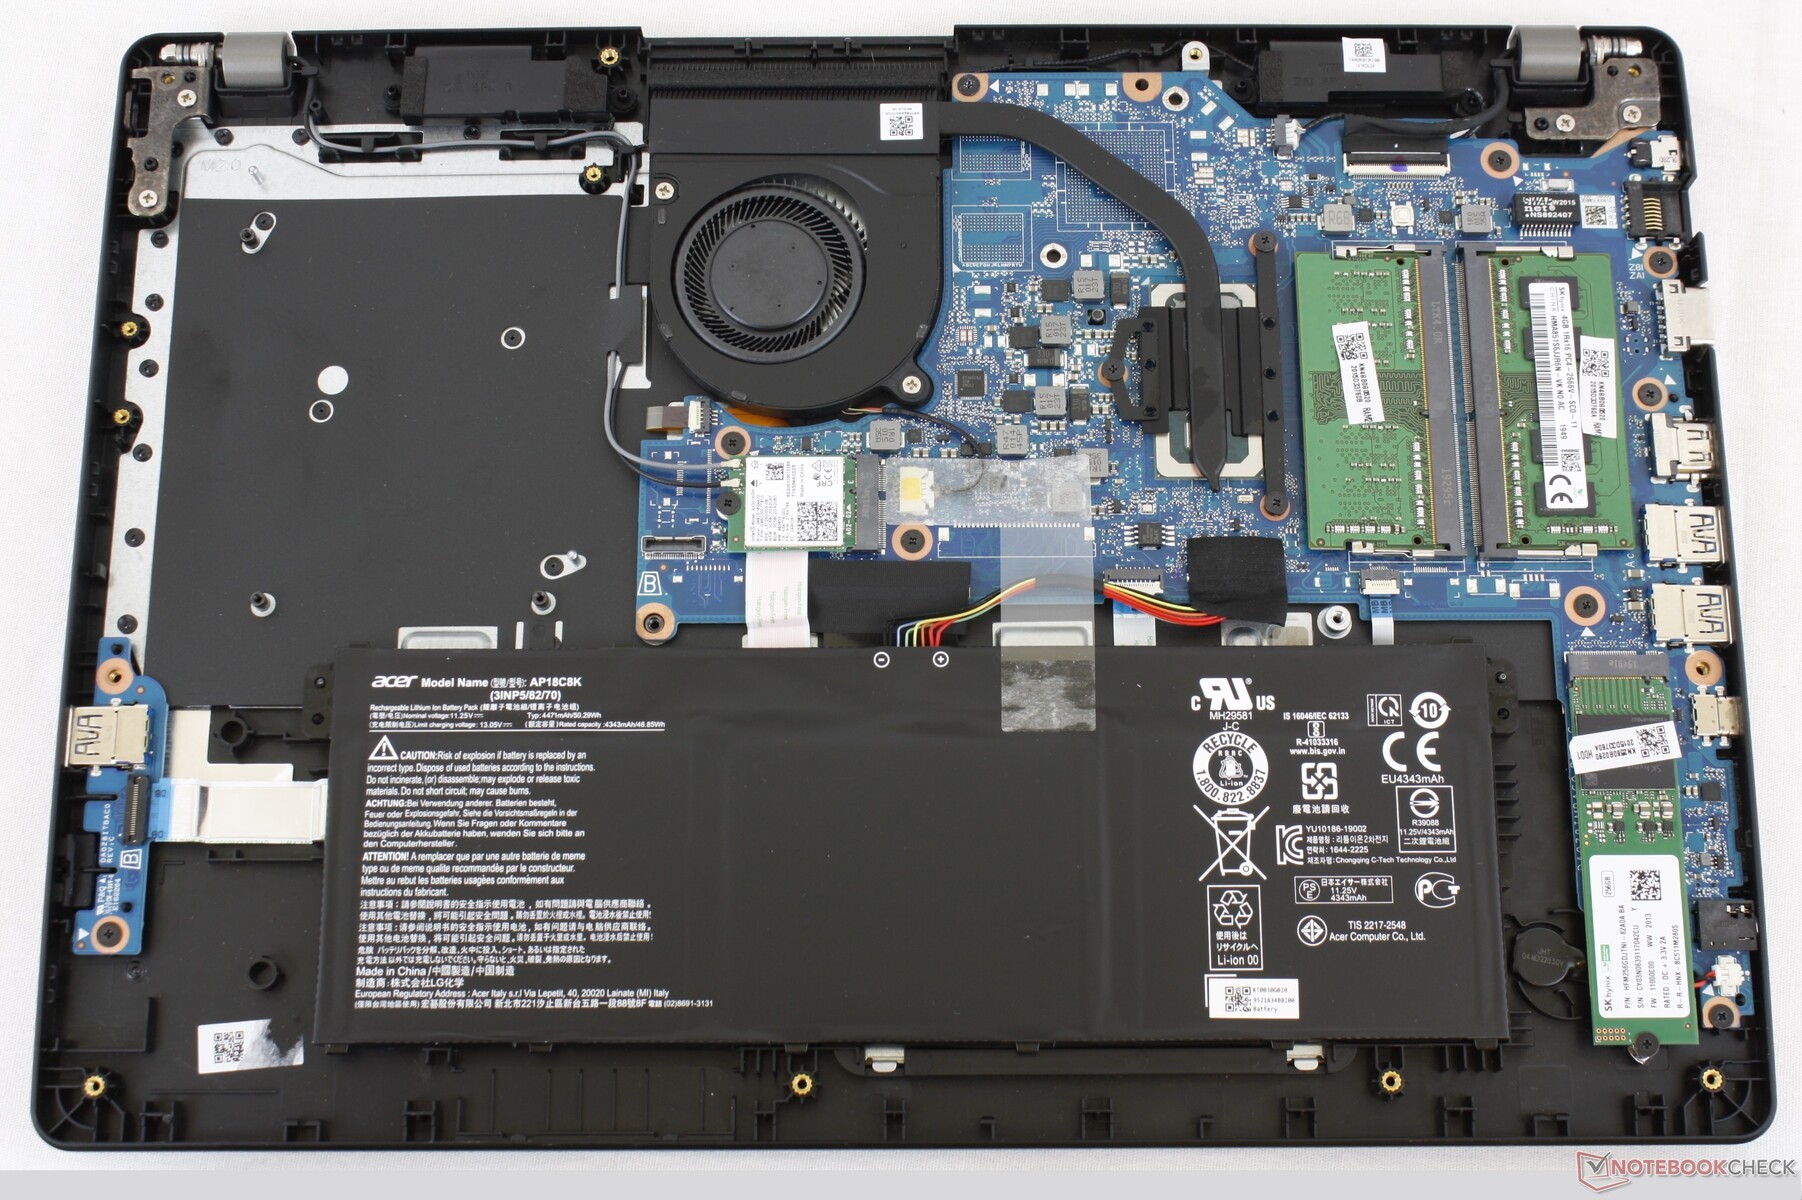
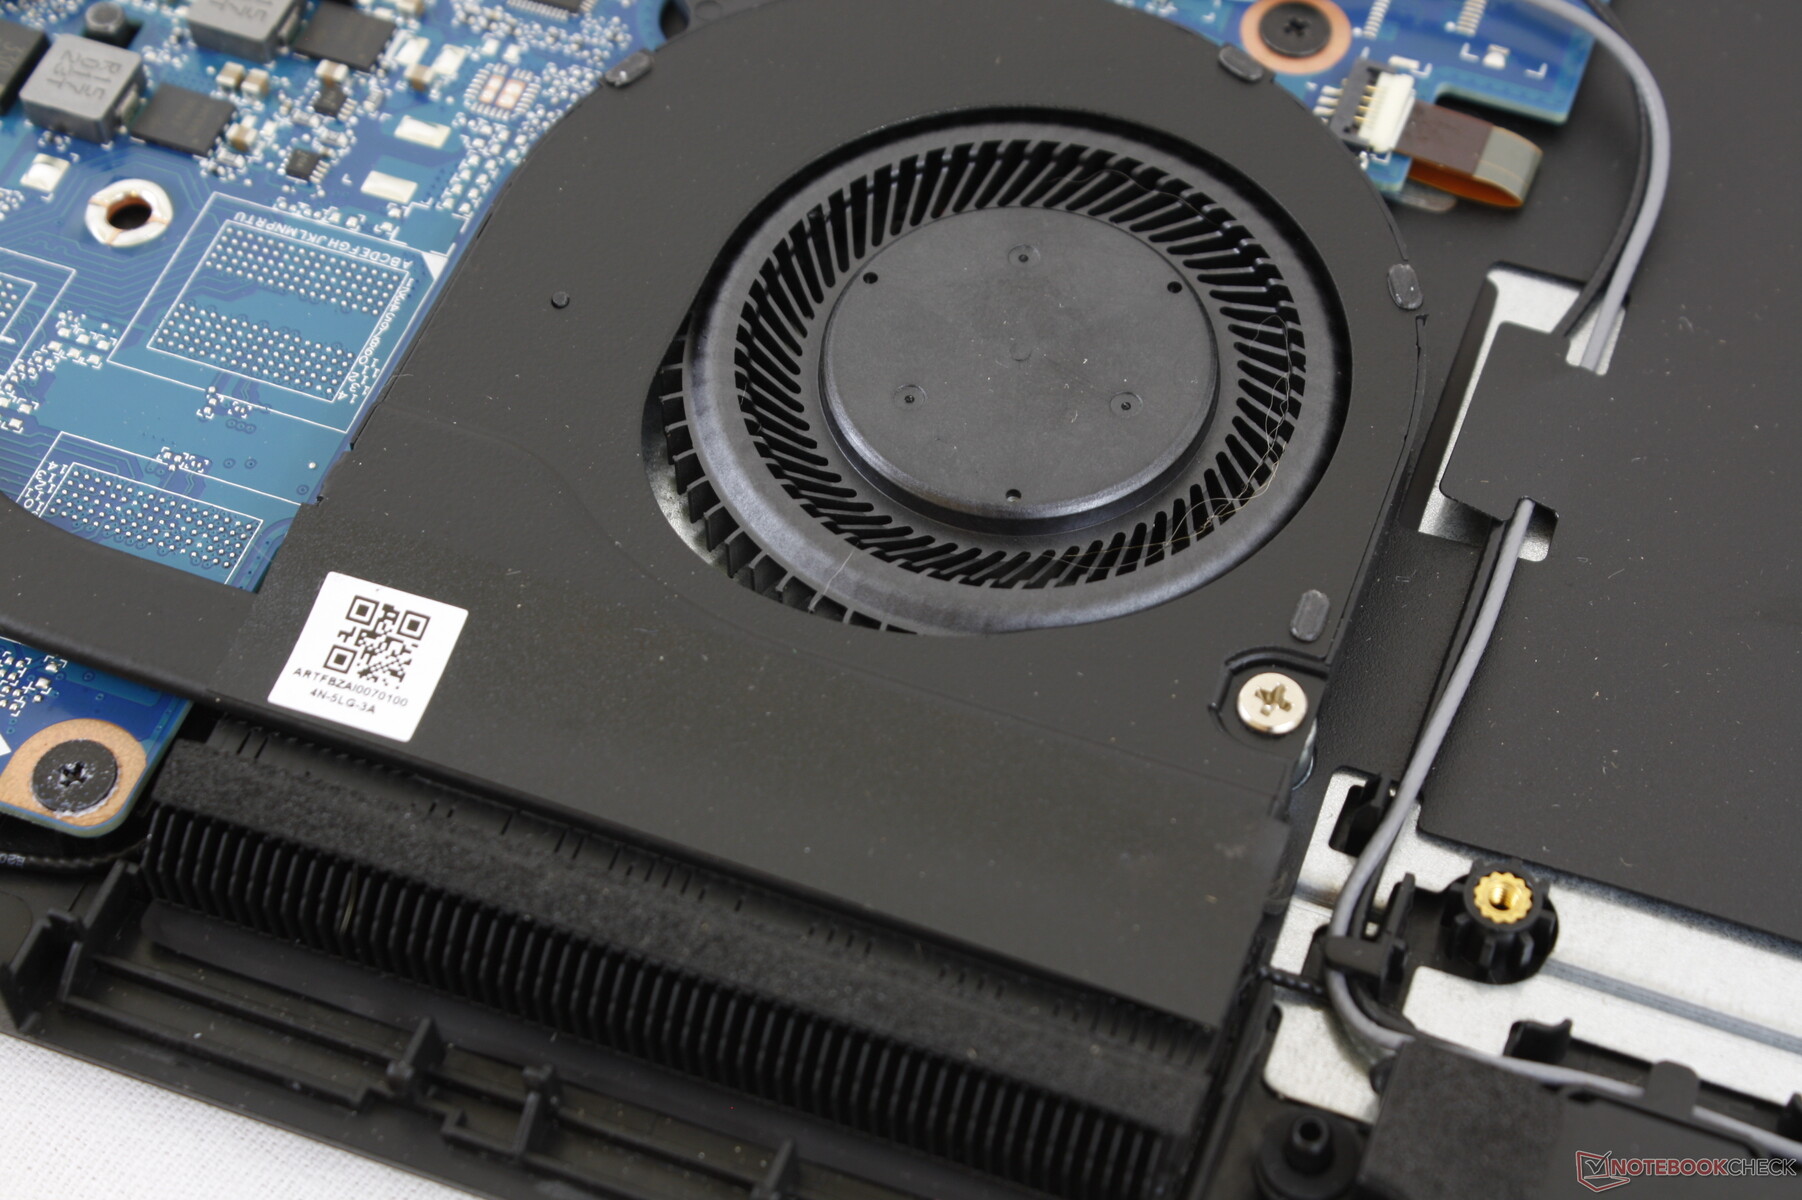
The bottom panel is secured by 12 Philips screws and, unlike most other laptops these days, the edges and corners are not very sharp for easy servicing. Users will have one storage bay and two SODIMM slots to work with once inside.
Accessories and Warranty
There are no extras in the box other than the usual AC adapter and paperwork. Acer's one-year International Traveler's warranty applies.
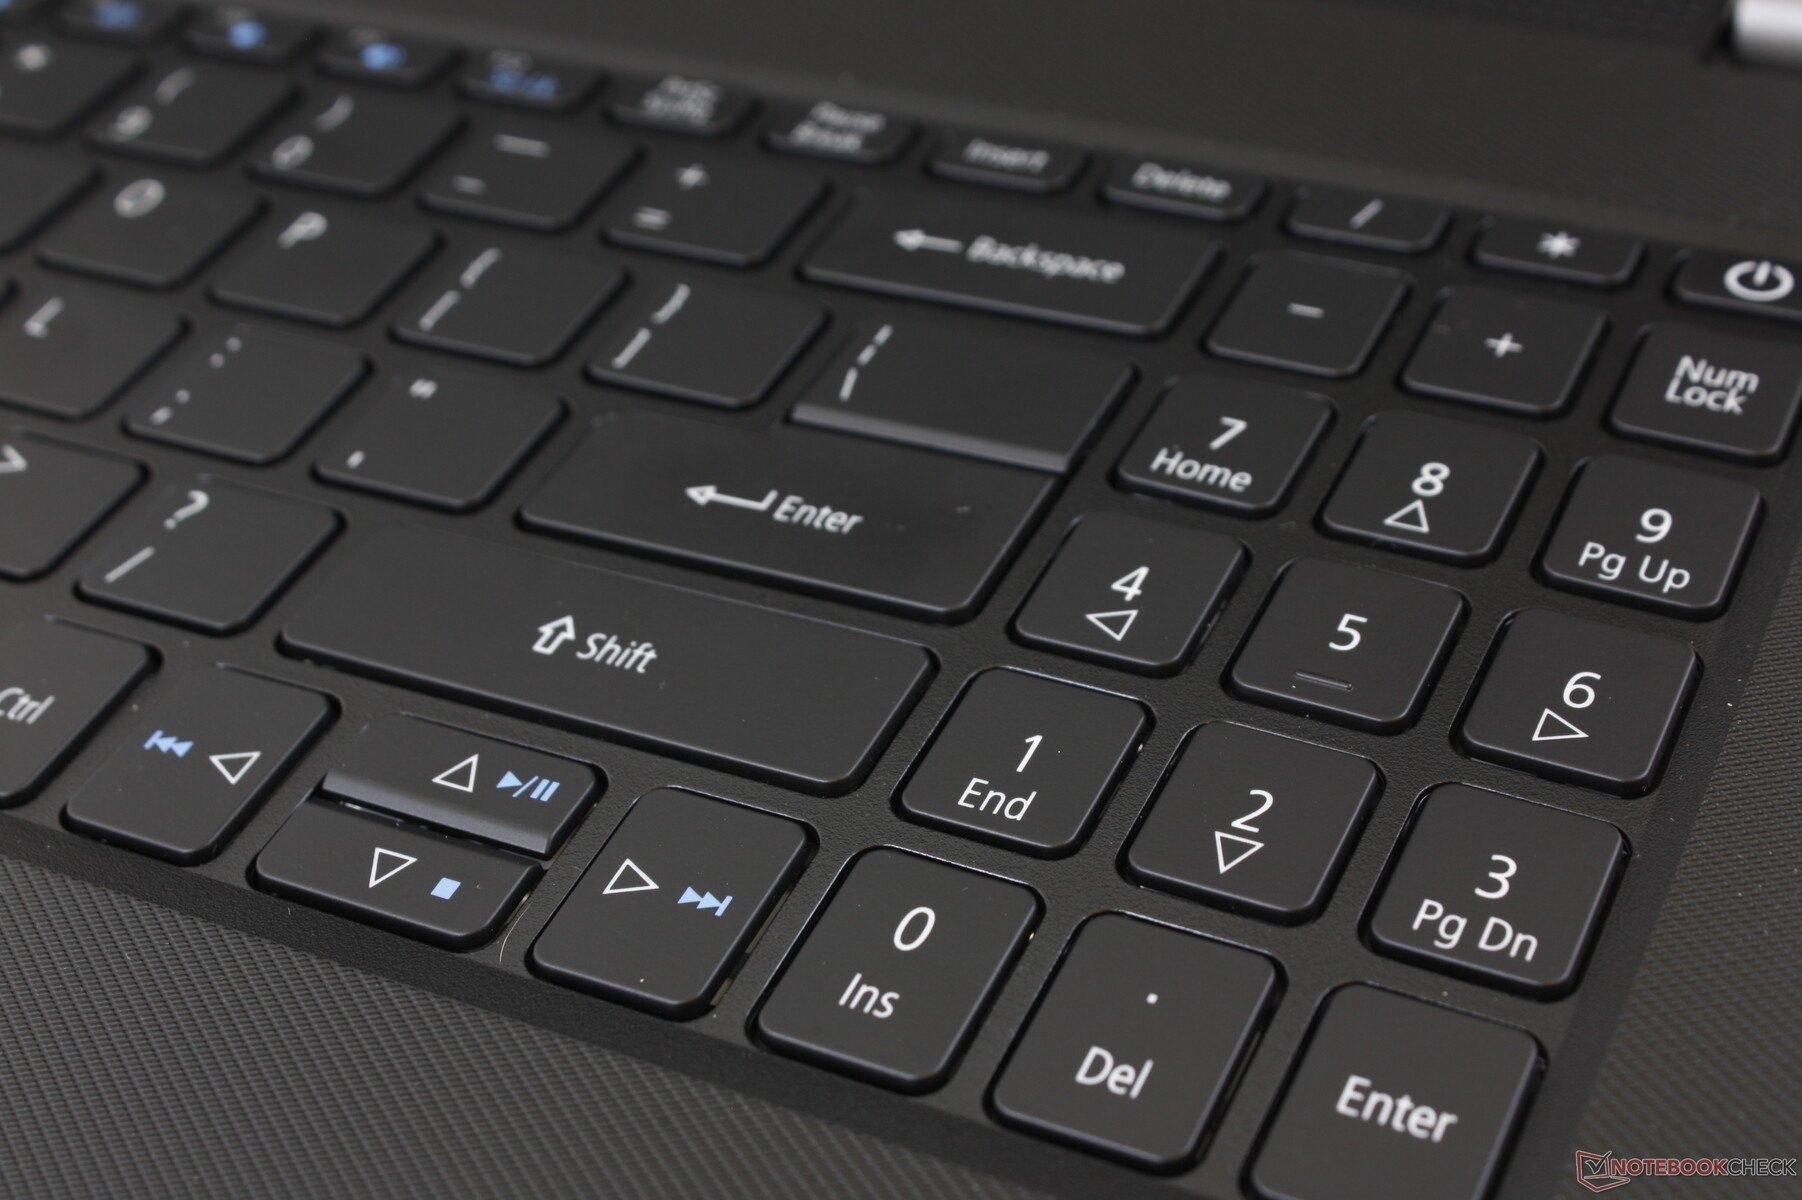
Input Devices
Keyboard
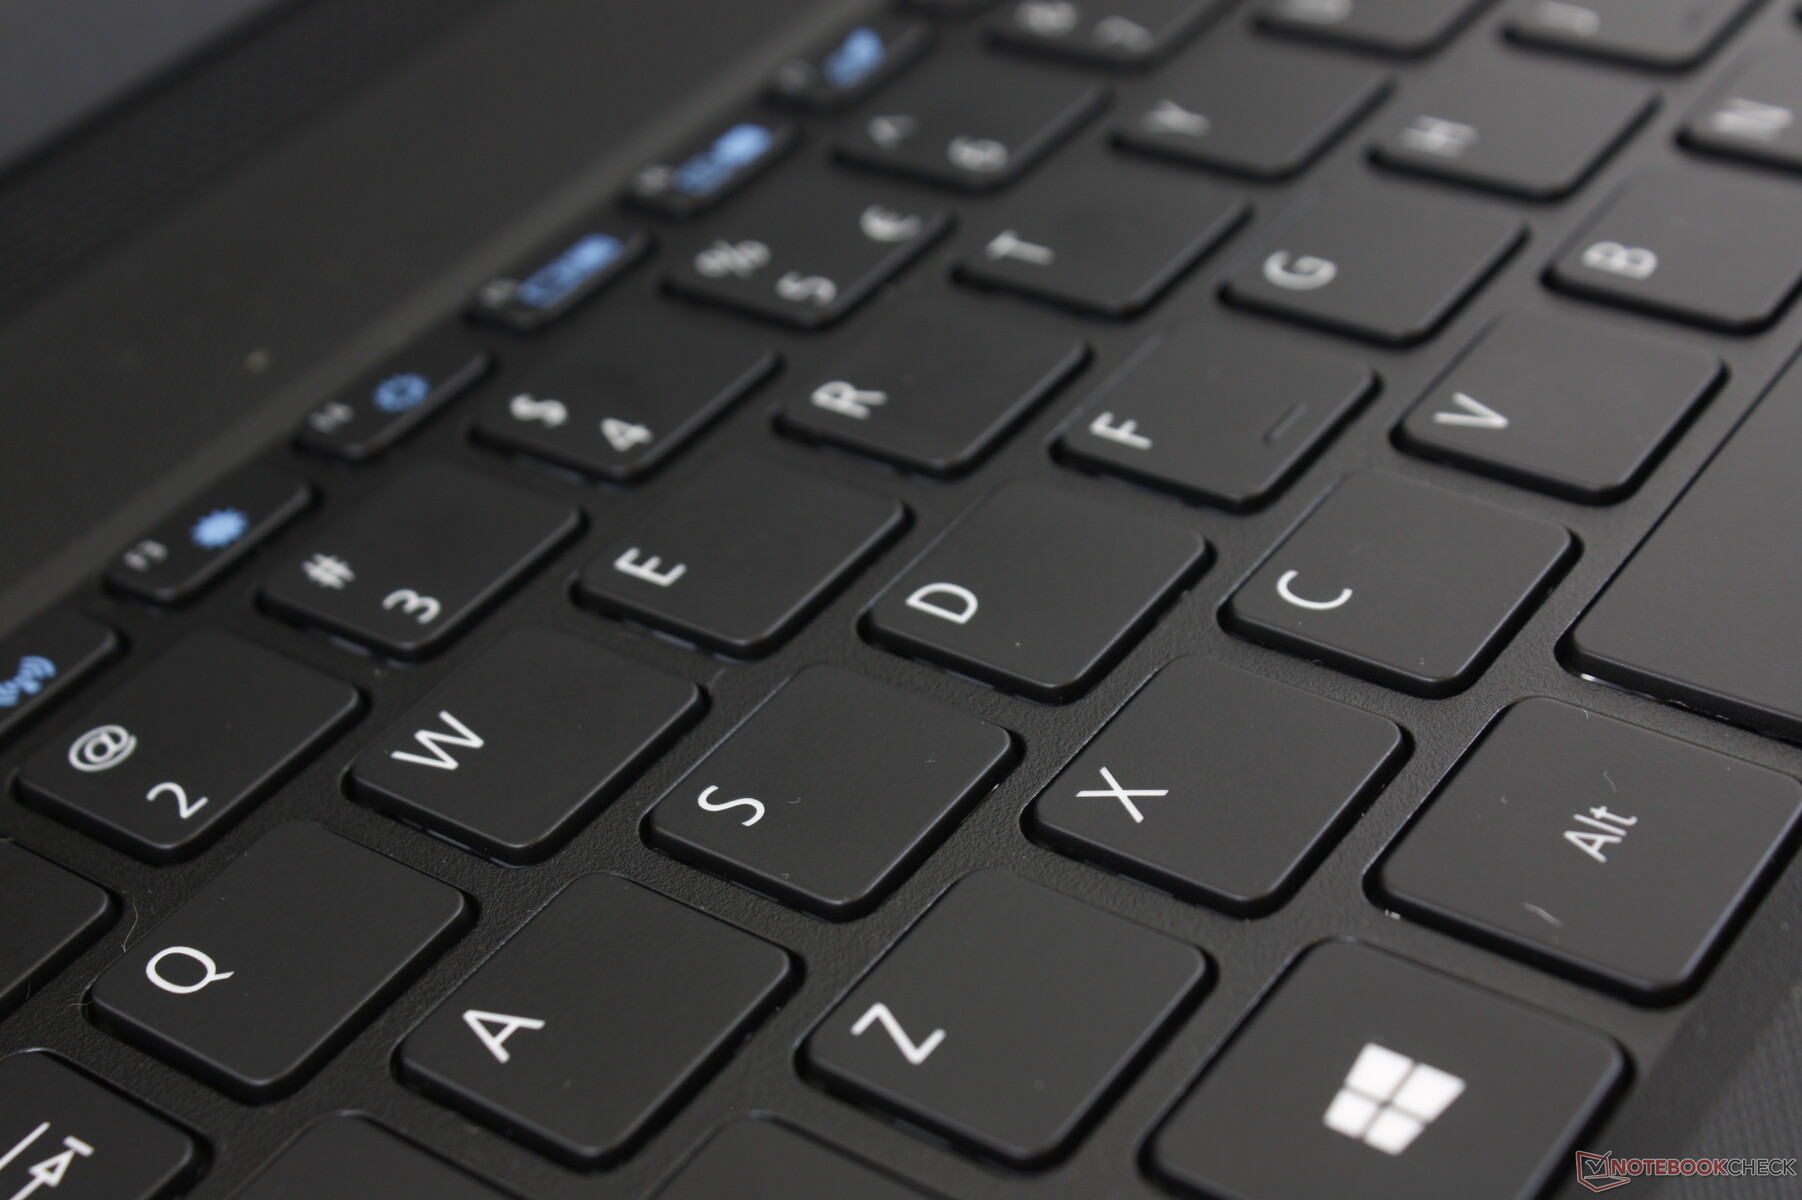
The backlit keys are shallower in travel than on most other laptops for a lighter feel when typing. The Enter and Space keys, for example, do not feel as deep or "clicky" on the TravelMate. It takes some getting used to especially if you are coming from a desktop keyboard.
Our least favorite aspect of the keyboard is the small size of the NumPad keys which are narrower and spongier than the main QWERTY keys. You'd be better off with a USB NumPad if your routine involves fast number inputs.
Touchpad
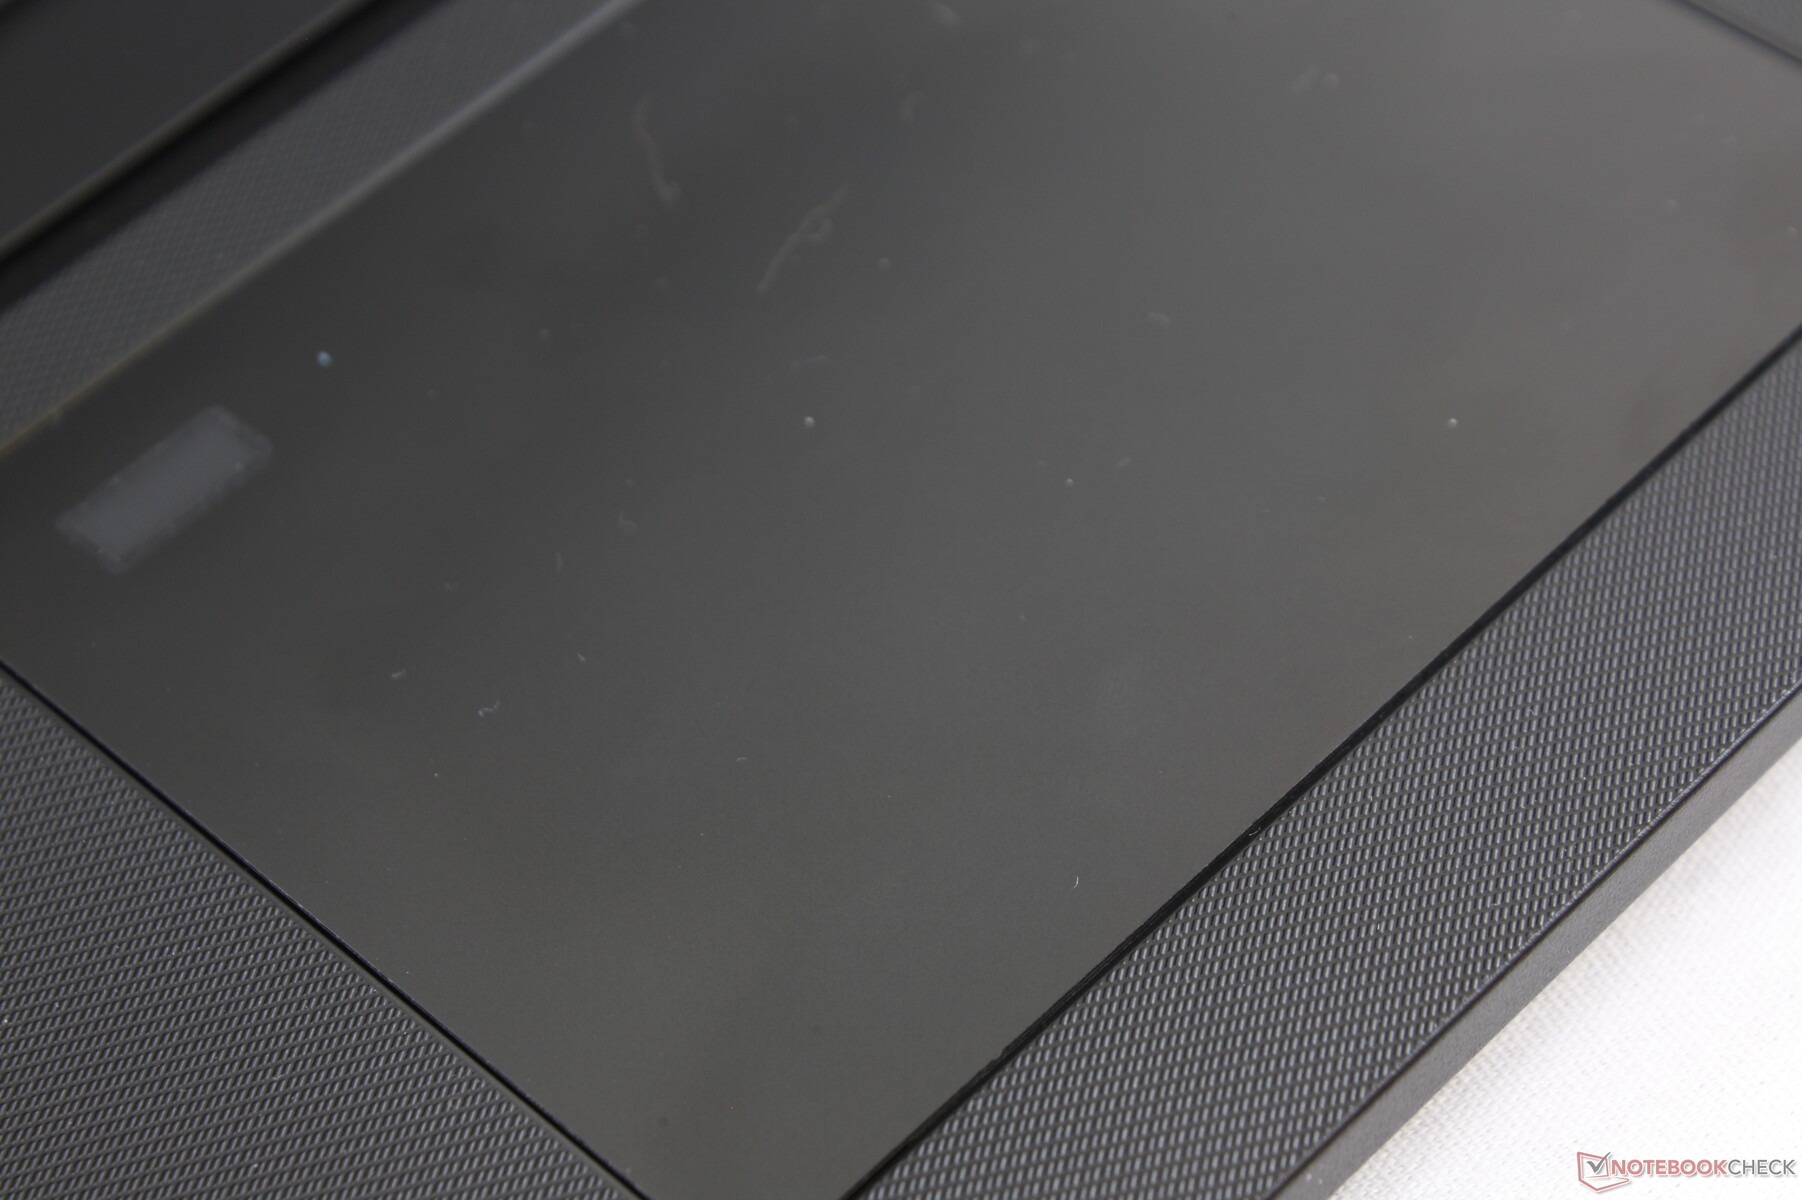
The Precision clickpad (10 x 8 cm) is smooth in contrast to the textured palm rests with only minimal sticking when gliding at slow speeds. The integrated mouse keys are shallow in travel but with firmer click and feedback than expected for the category. Nonetheless, we still prefer the dedicated mouse buttons on last year's TravelMate P2510 because of their superior accuracy.

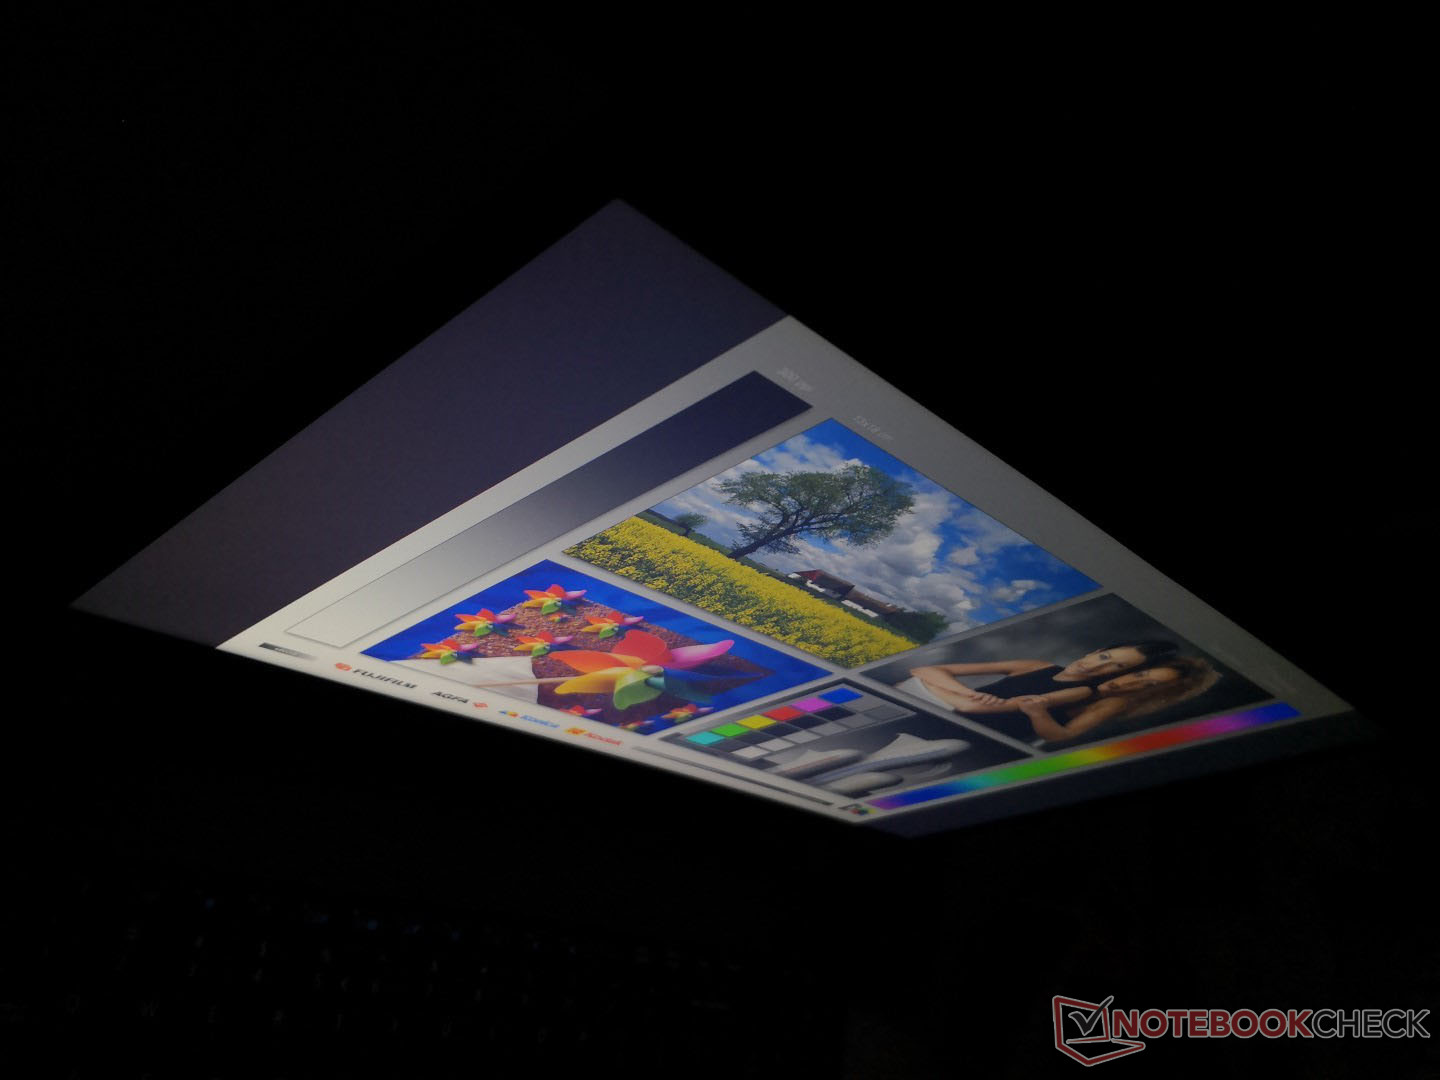
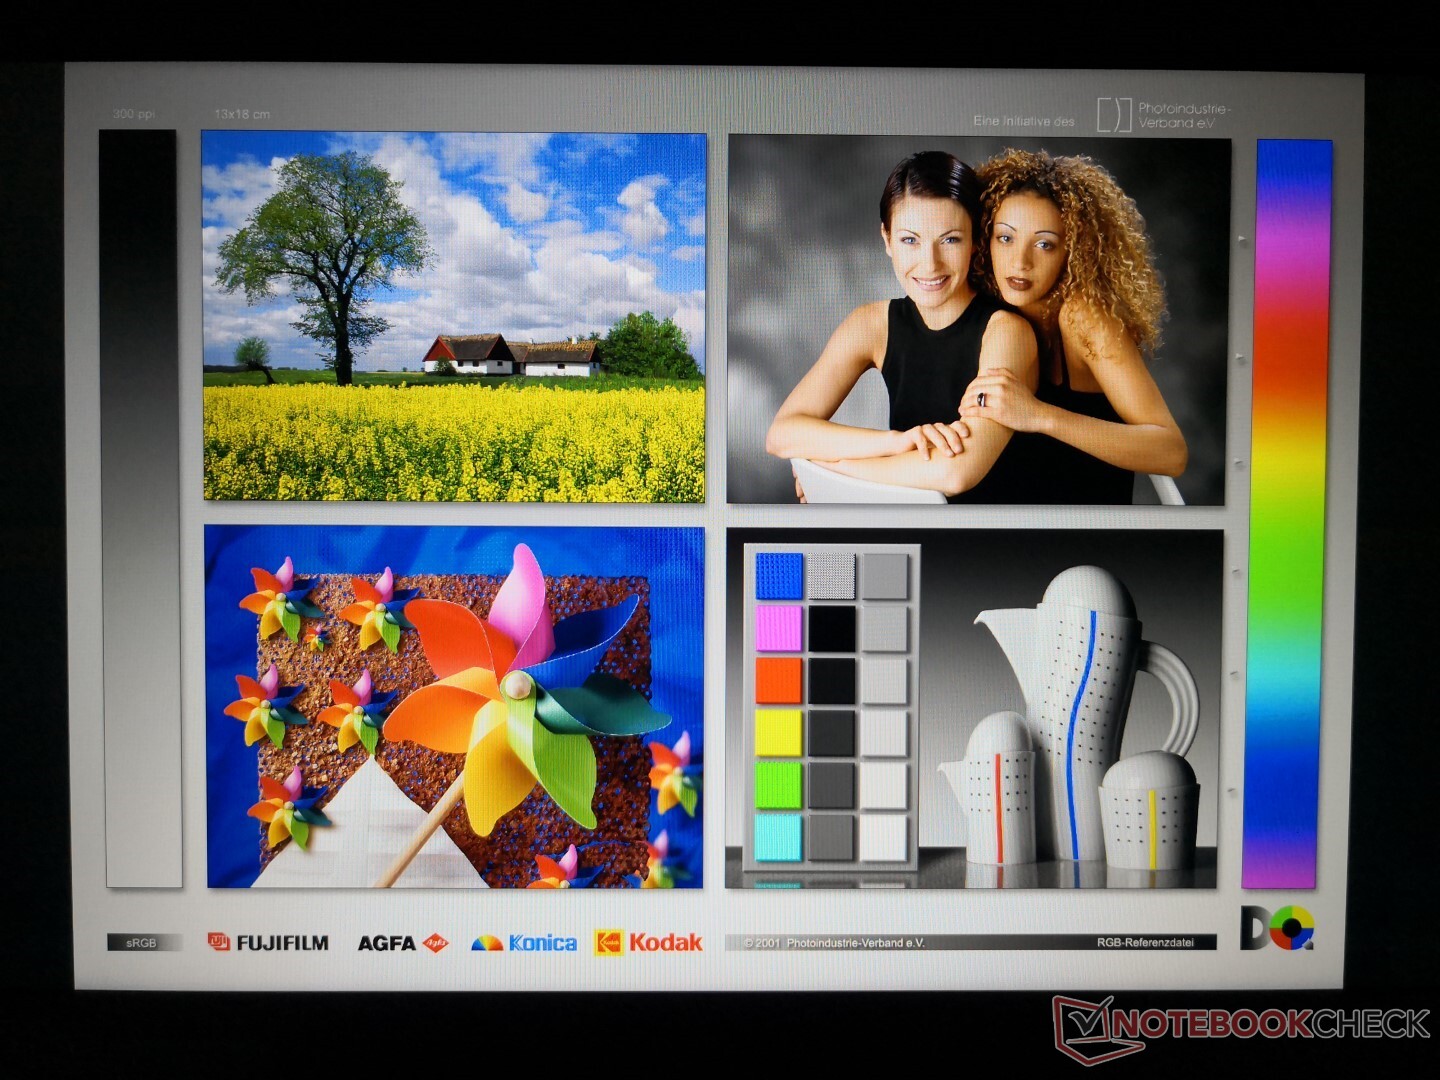
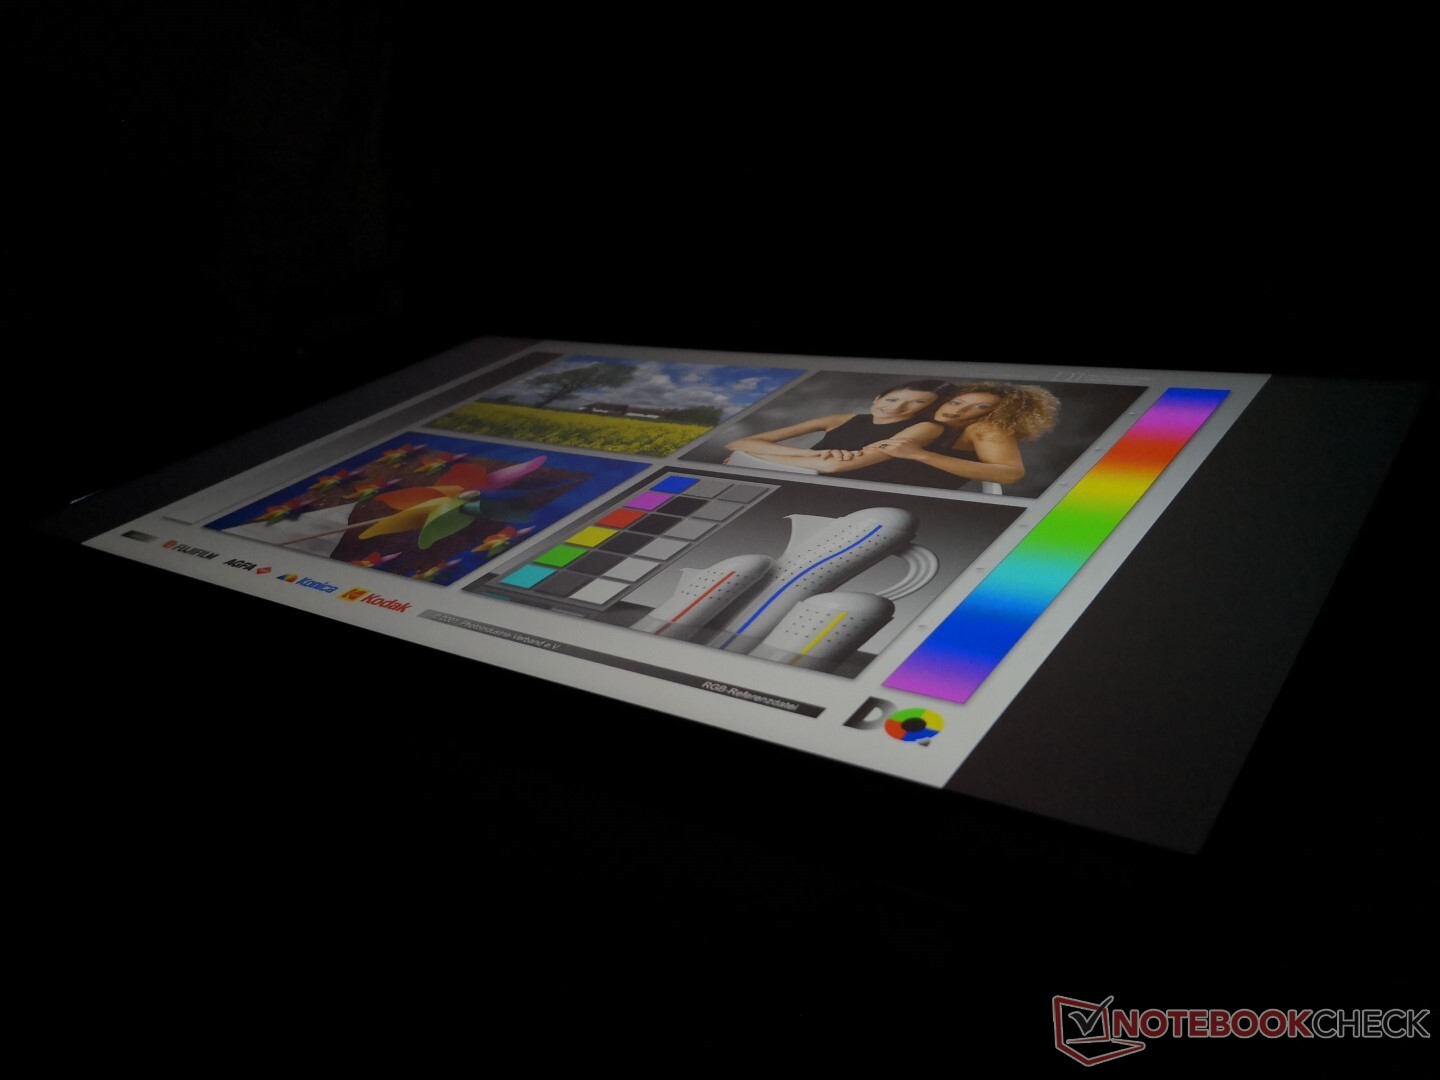
Display
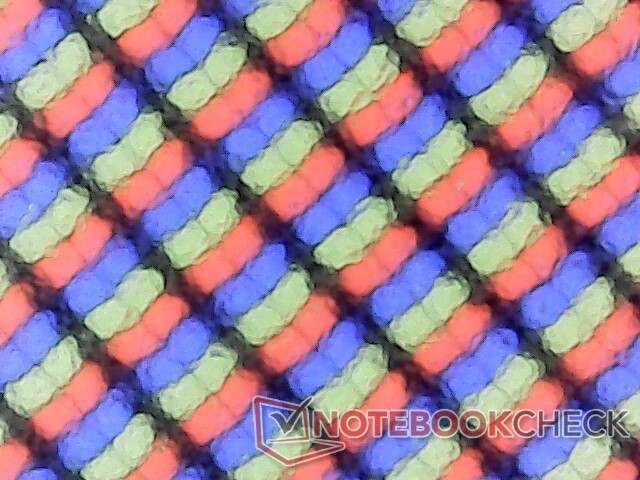
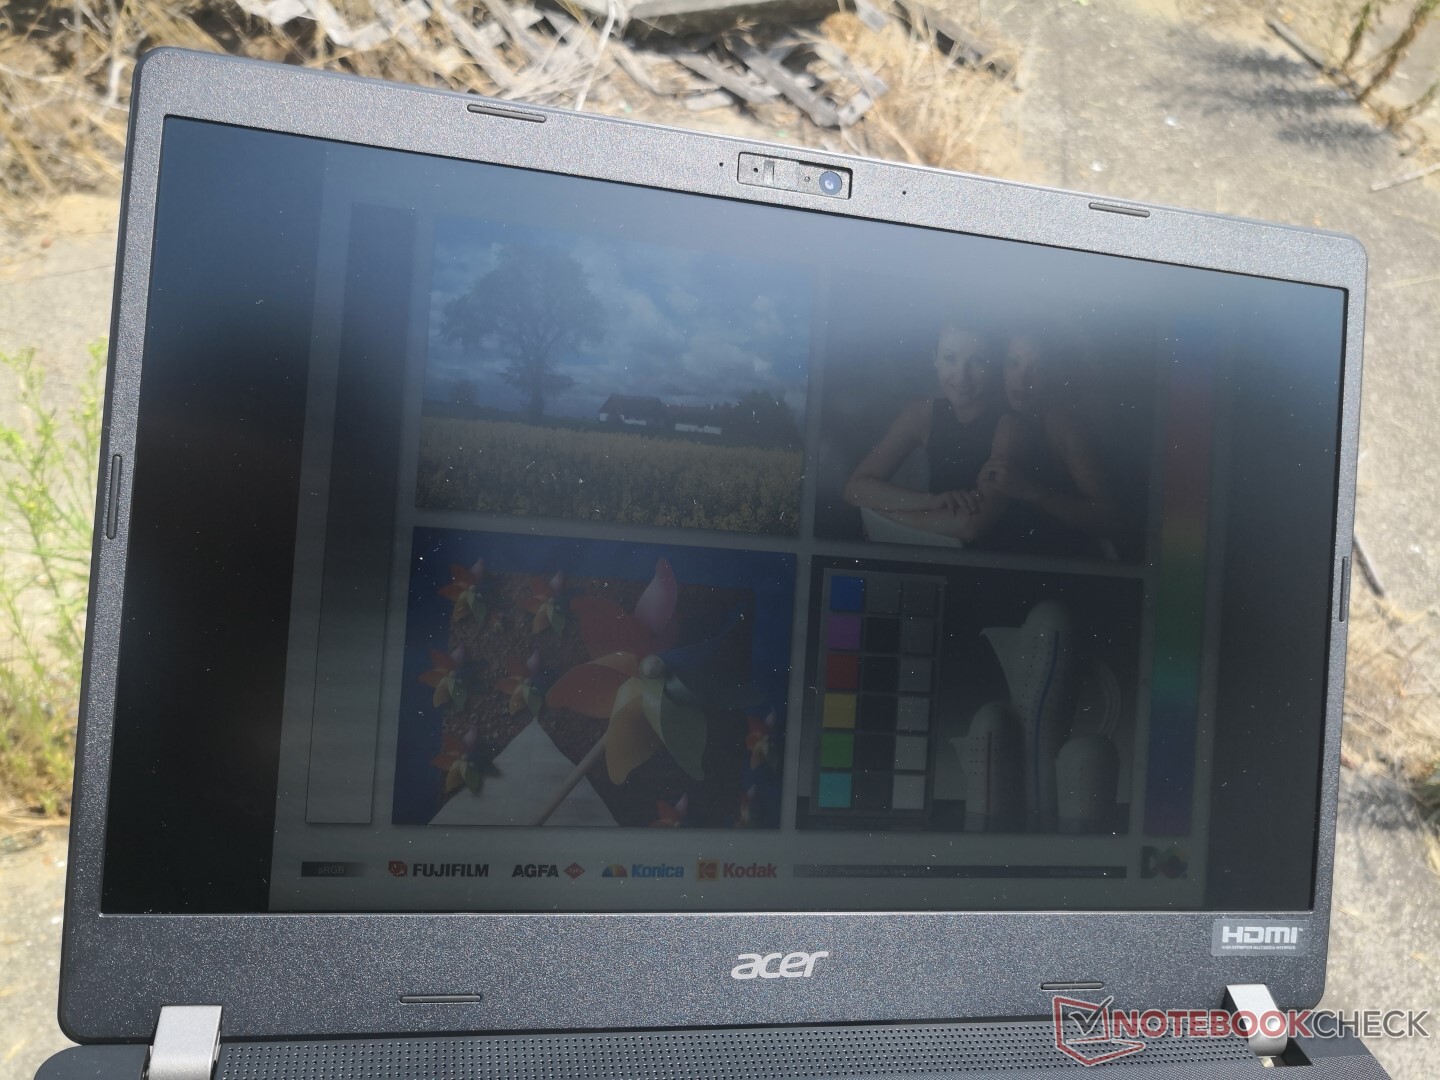
The TravelMate P2 P215 shares the same BOE NV156FHM-N48 IPS panel as found on some other inexpensive 15.6-inch laptops including the Lenovo Flex 5 15, IdeaPad C340-15, and many of Acer's own laptops like the 2017 Swift 3 SF315 or Aspire 5 A515. Contrast ratio, colors, and response times are average at best especially when compared to the panels on high-end consumer Ultrabooks like the Lenovo Yoga S940, Dell XPS 15, or HP Spectre x360 15.
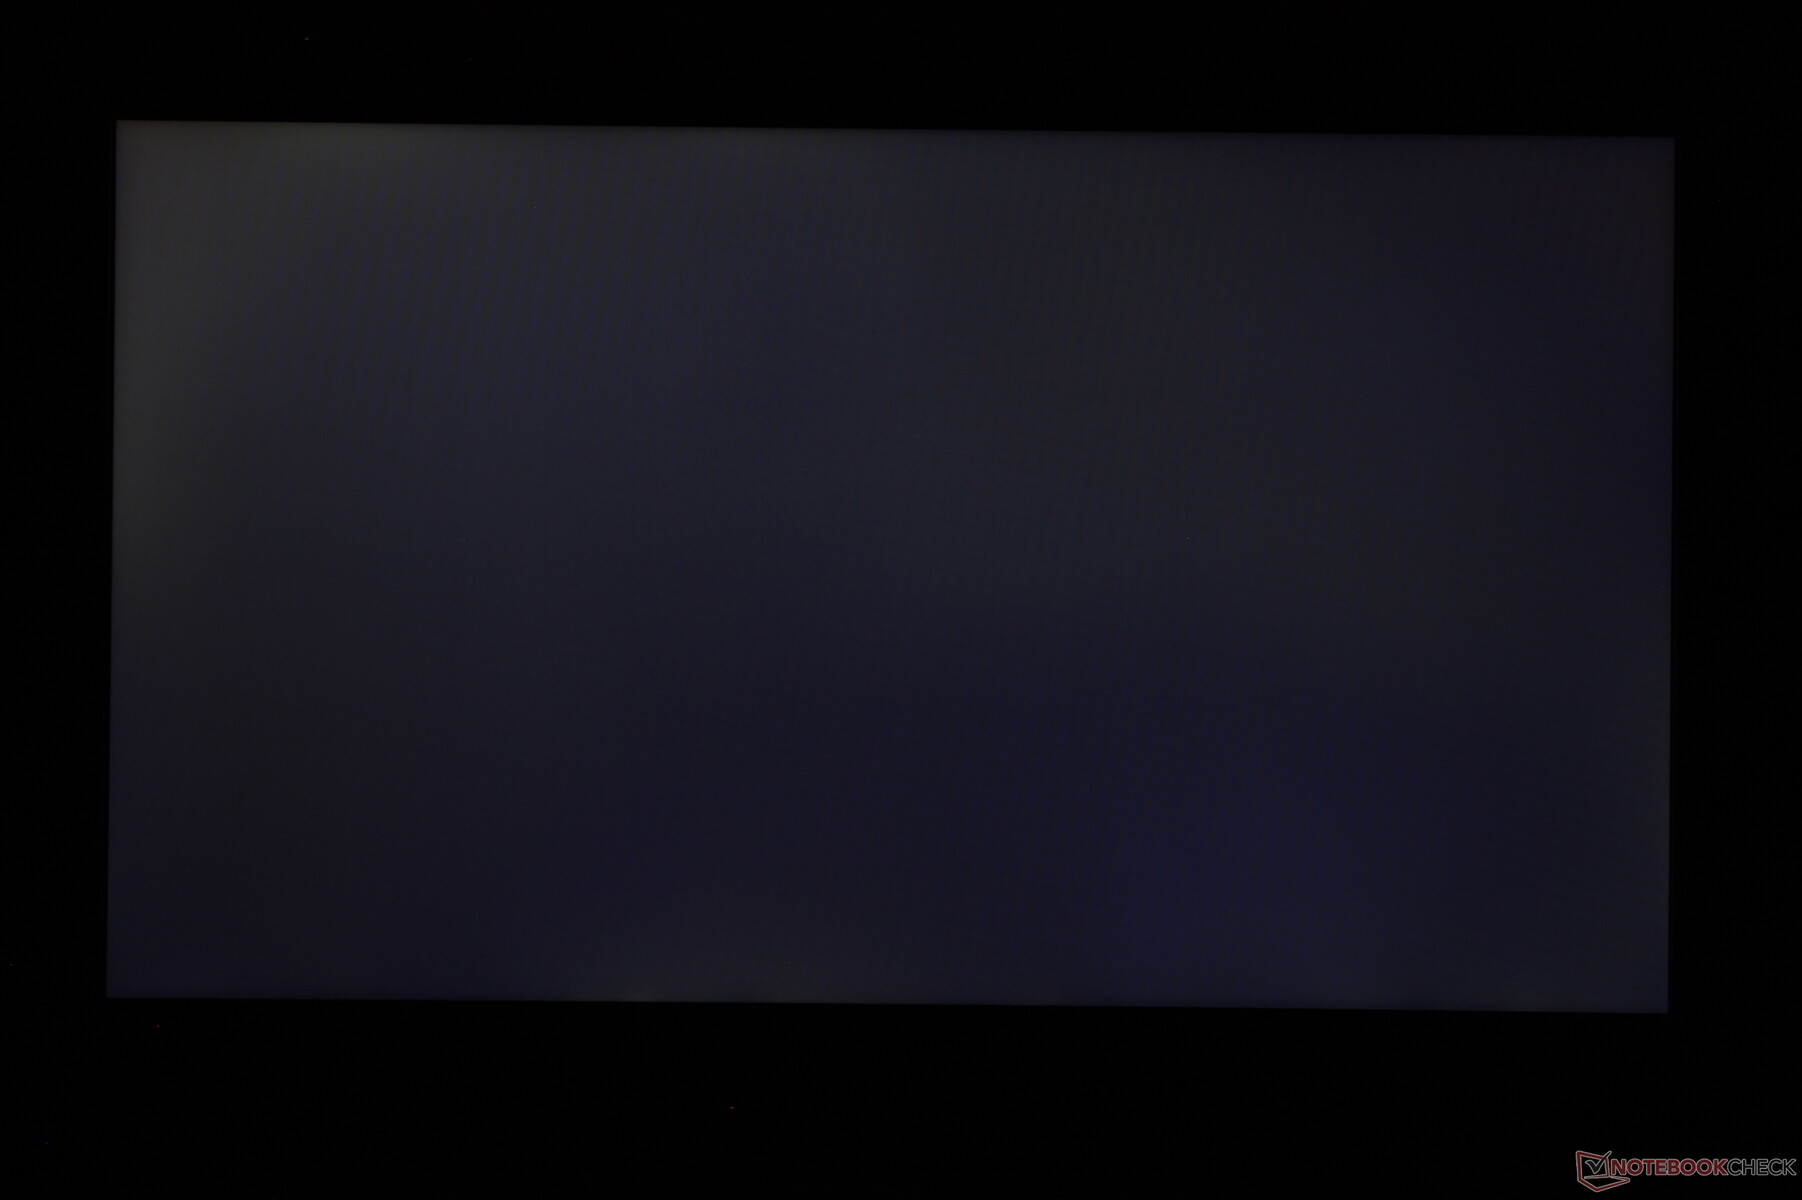
The most notable drawback to the display is the presence of pulse-width modulation on all brightness levels up to 99 percent. If your eyes are sensitive to onscreen flickering, then it would be best to avoid using this laptop for long periods or remain at 100 percent brightness whenever possible.
| |||||||||||||||||||||||||
Brightness Distribution: 78 %
Center on Battery: 255.9 cd/m²
Contrast: 556:1 (Black: 0.46 cd/m²)
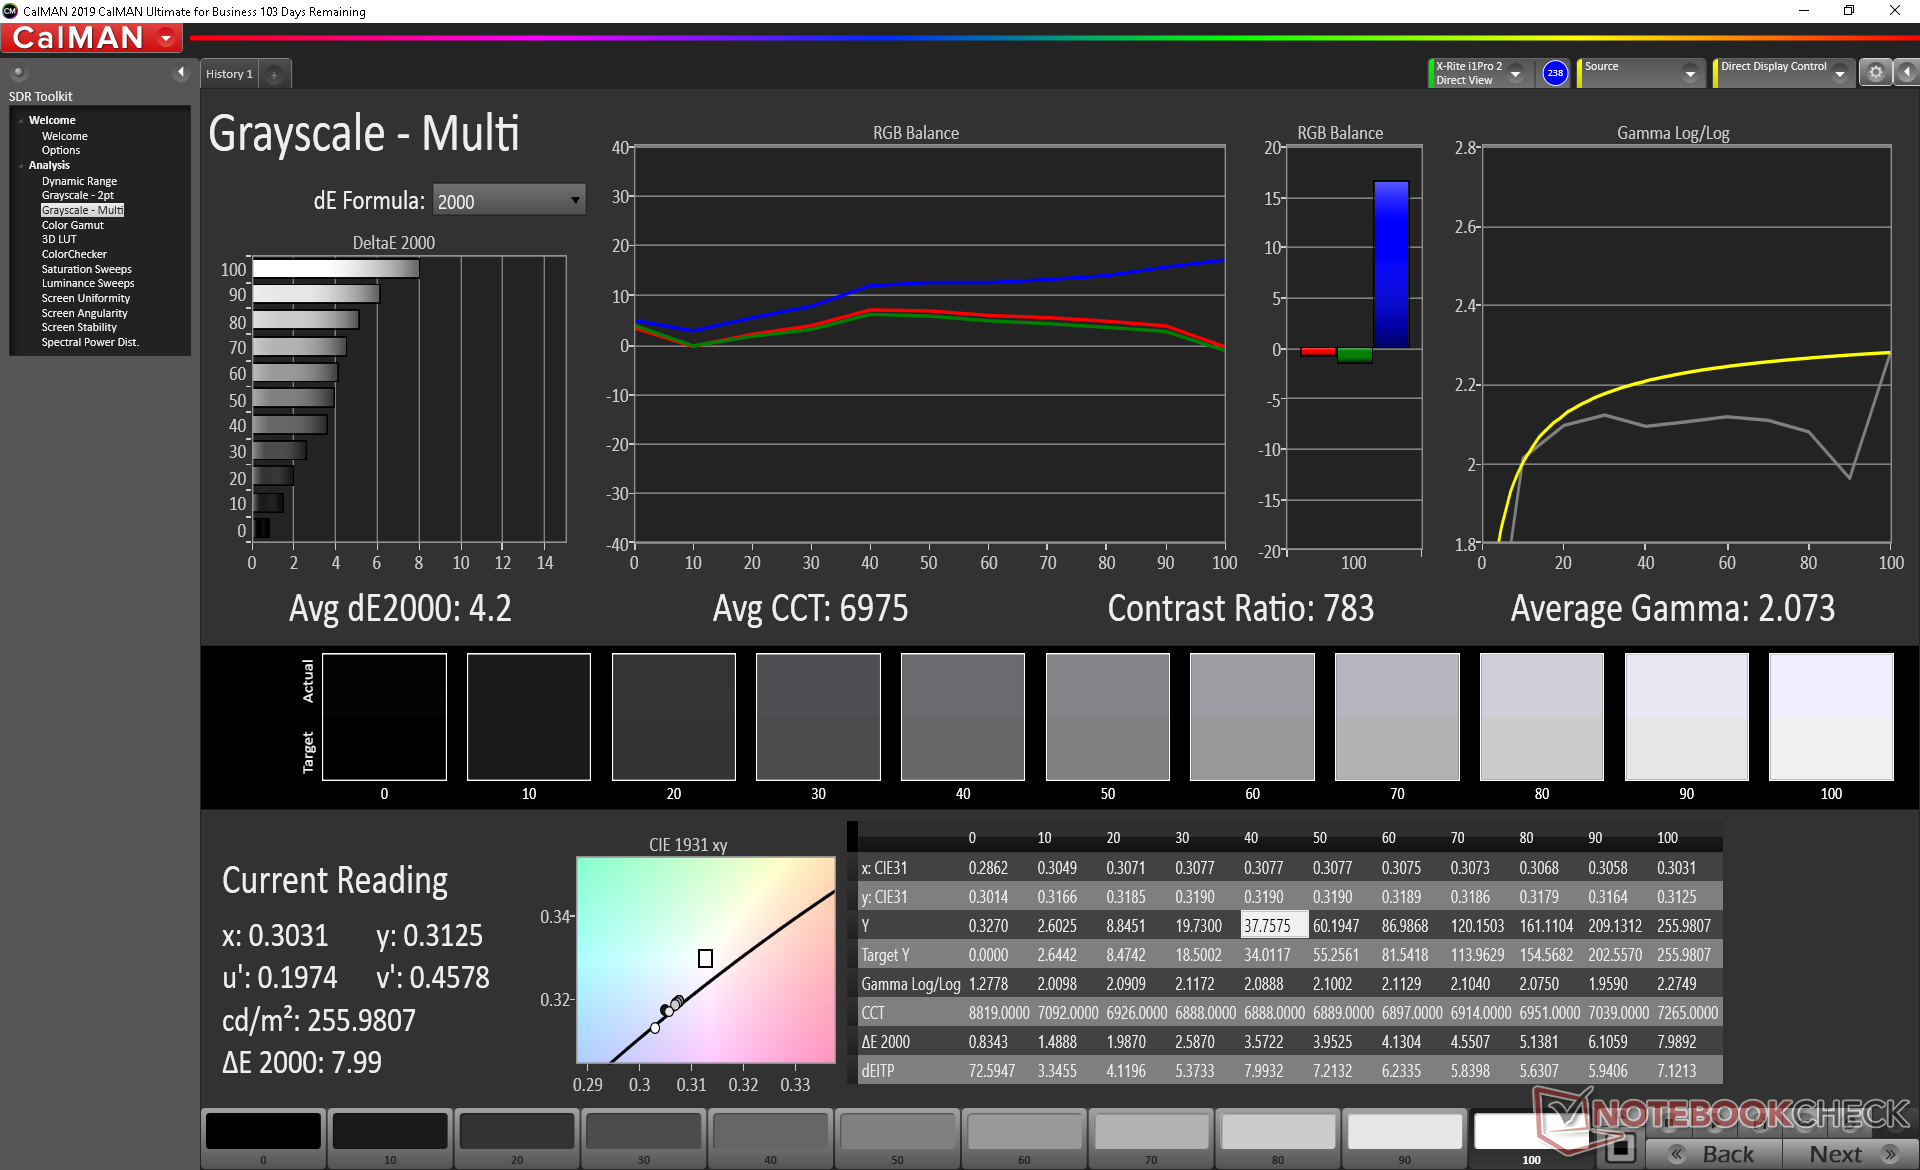
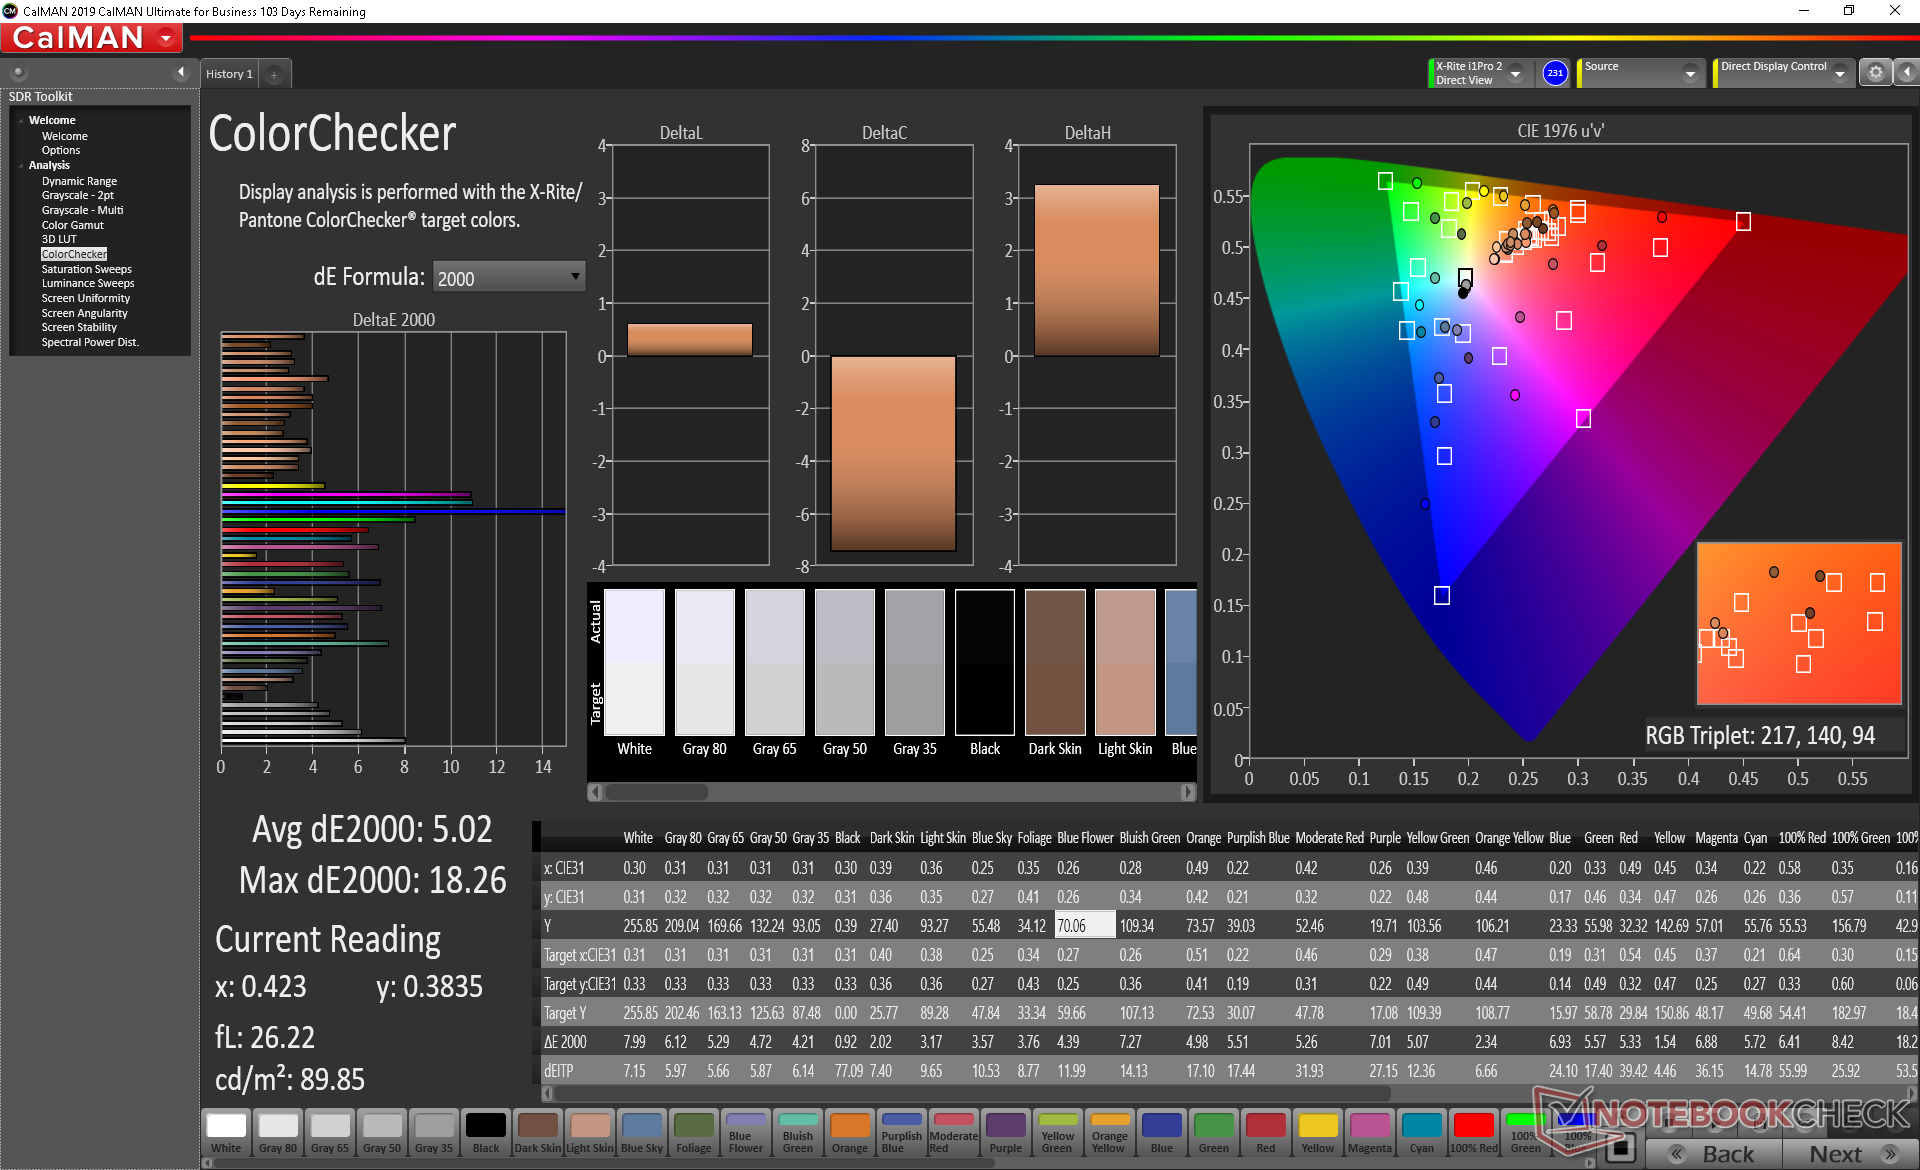
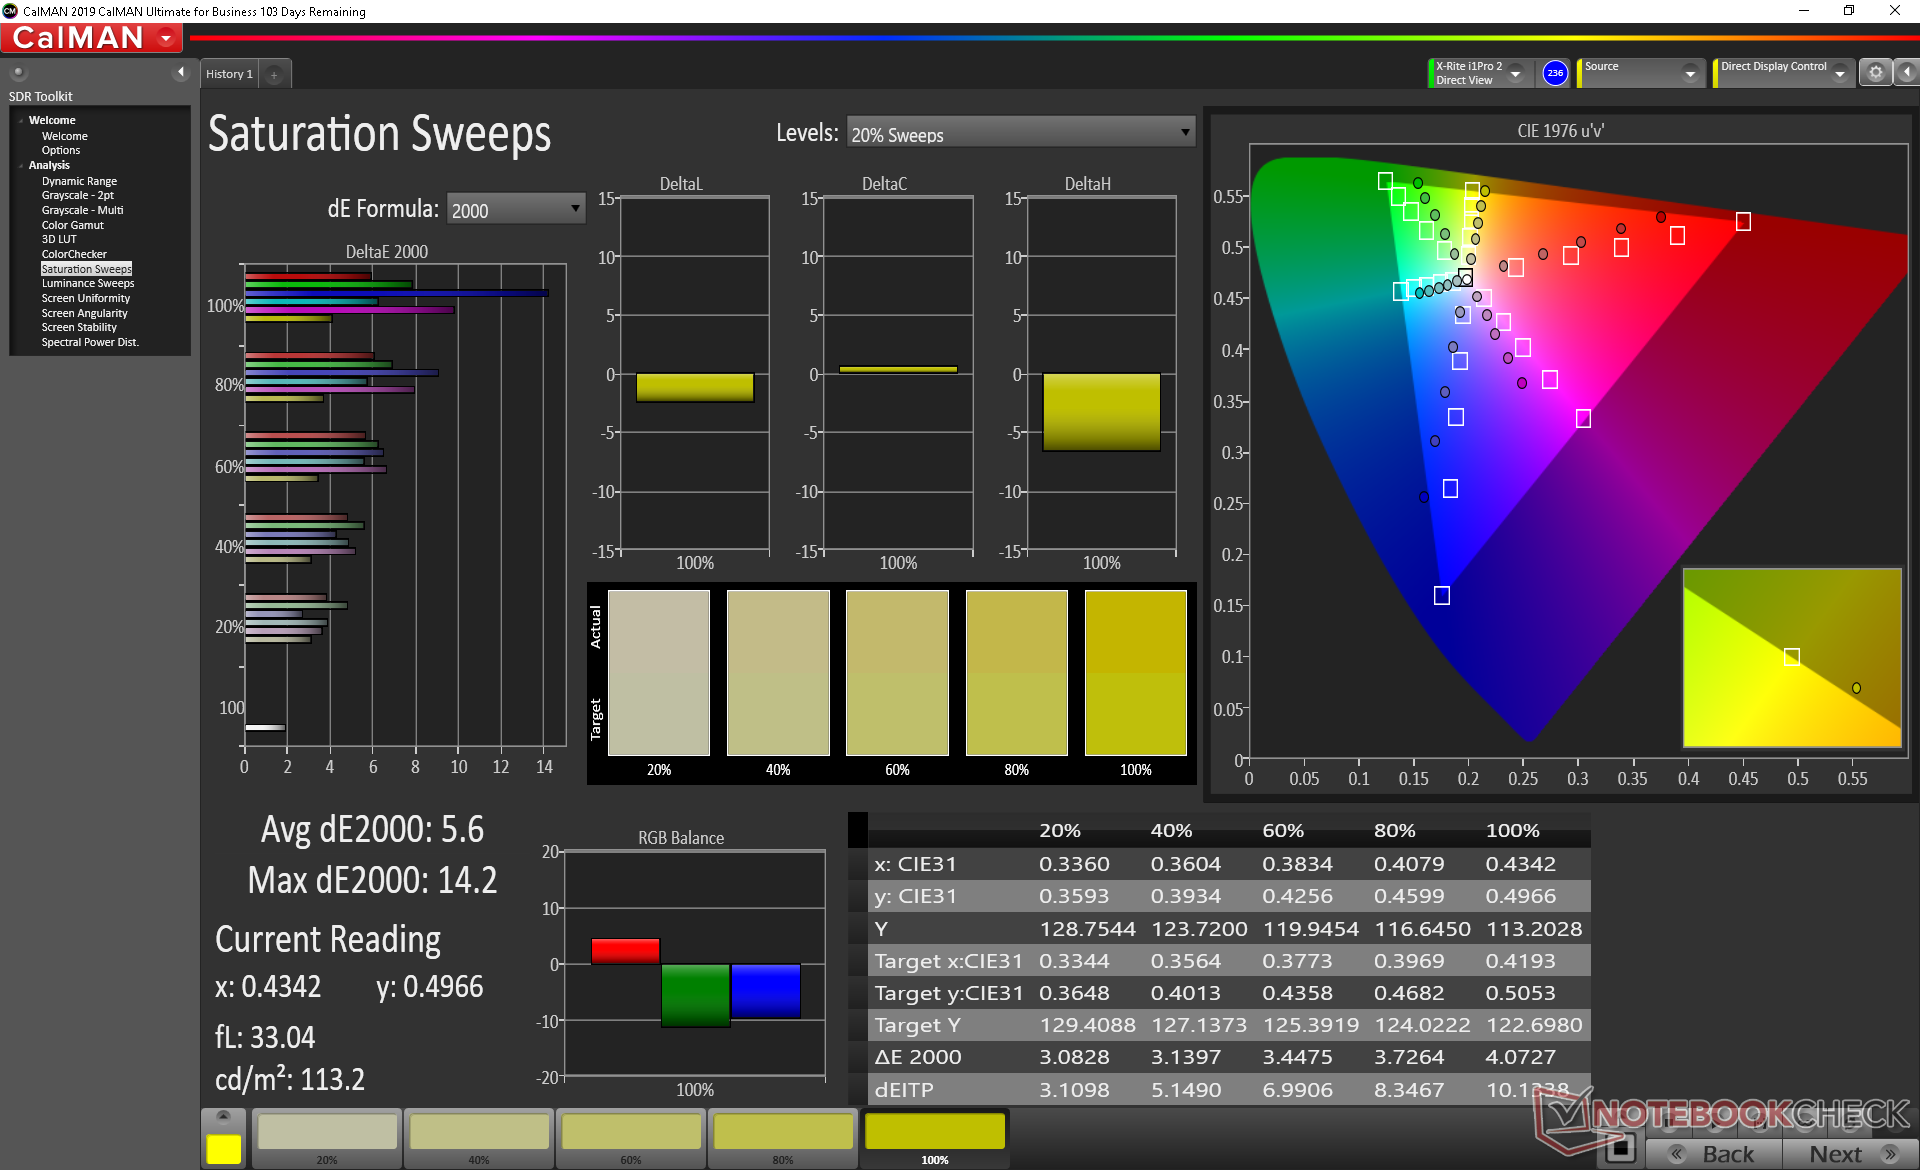
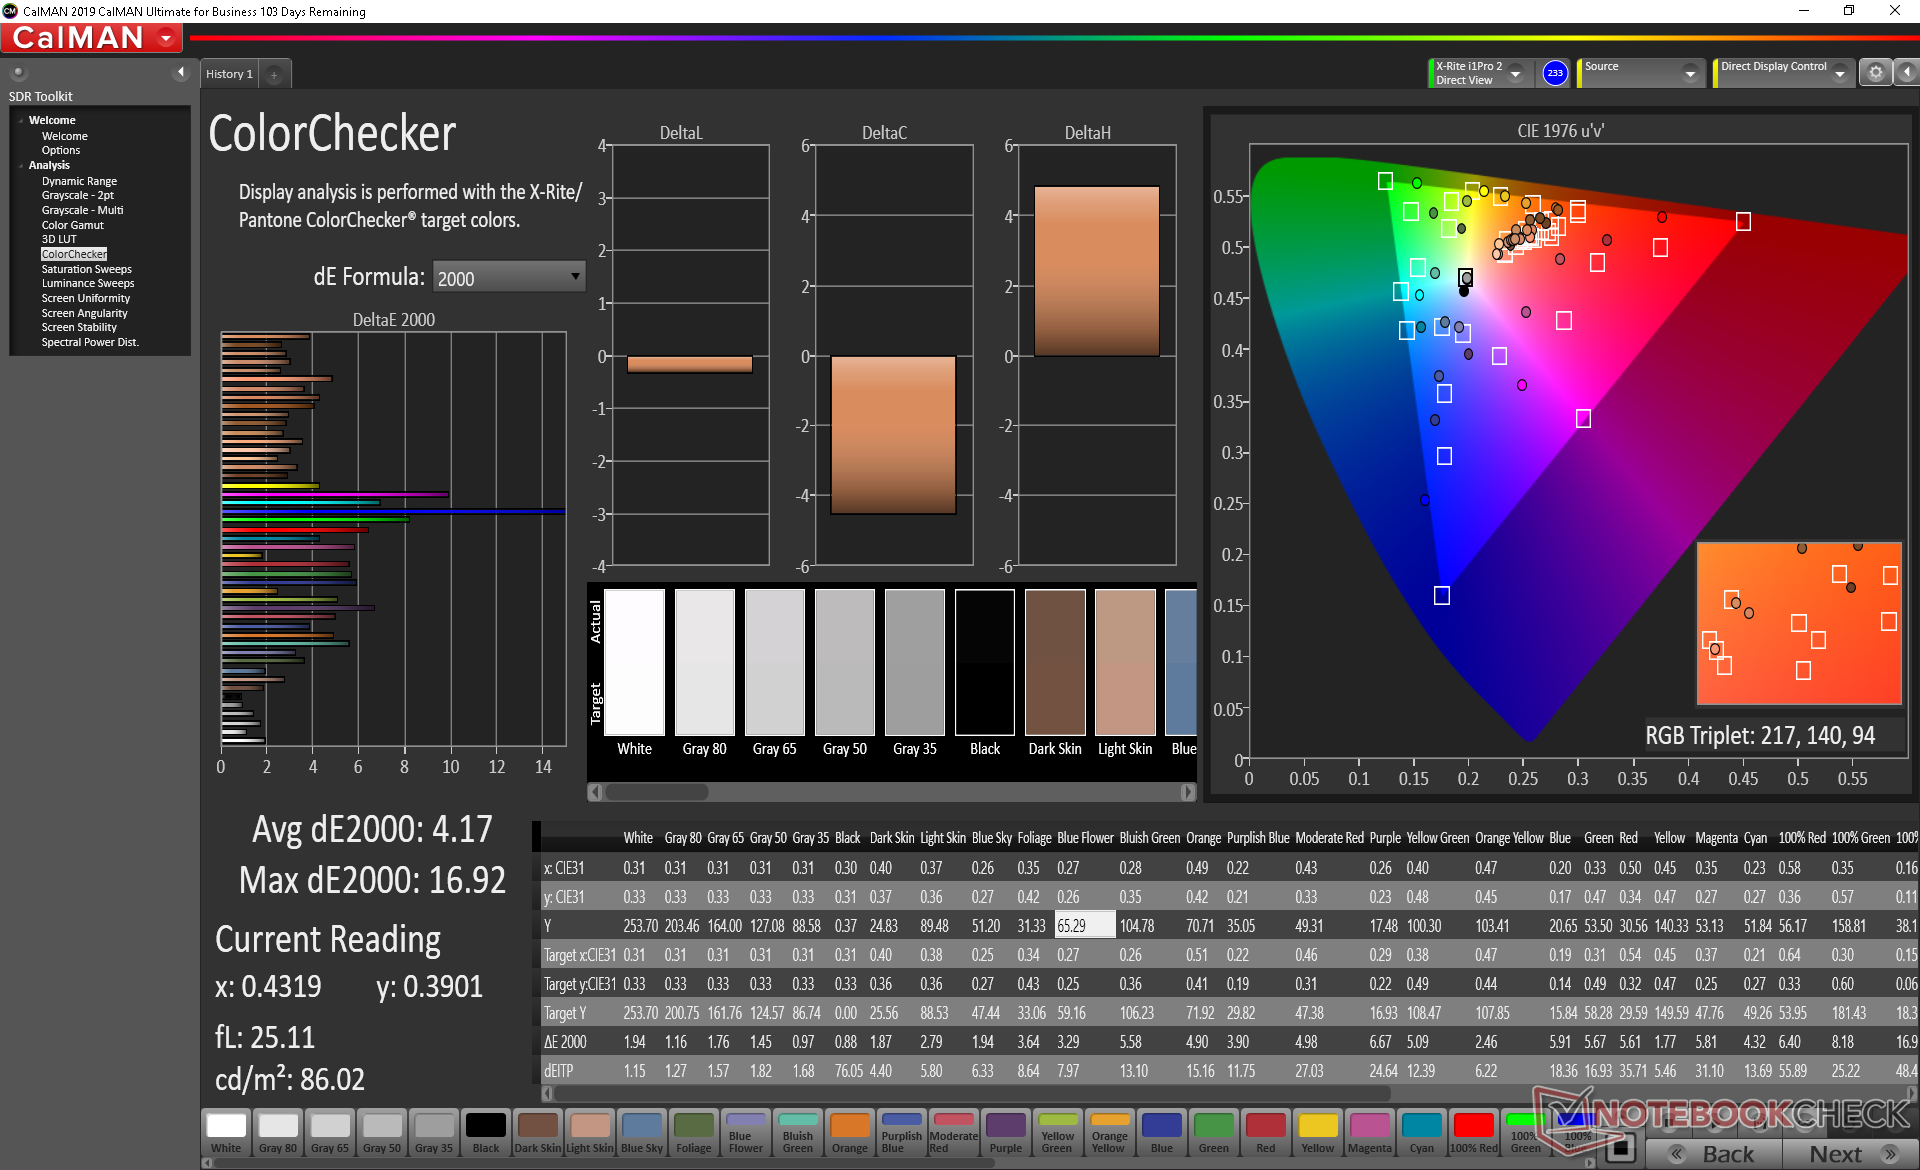
ΔE ColorChecker Calman: 5.02 | ∀{0.5-29.43 Ø4.73}
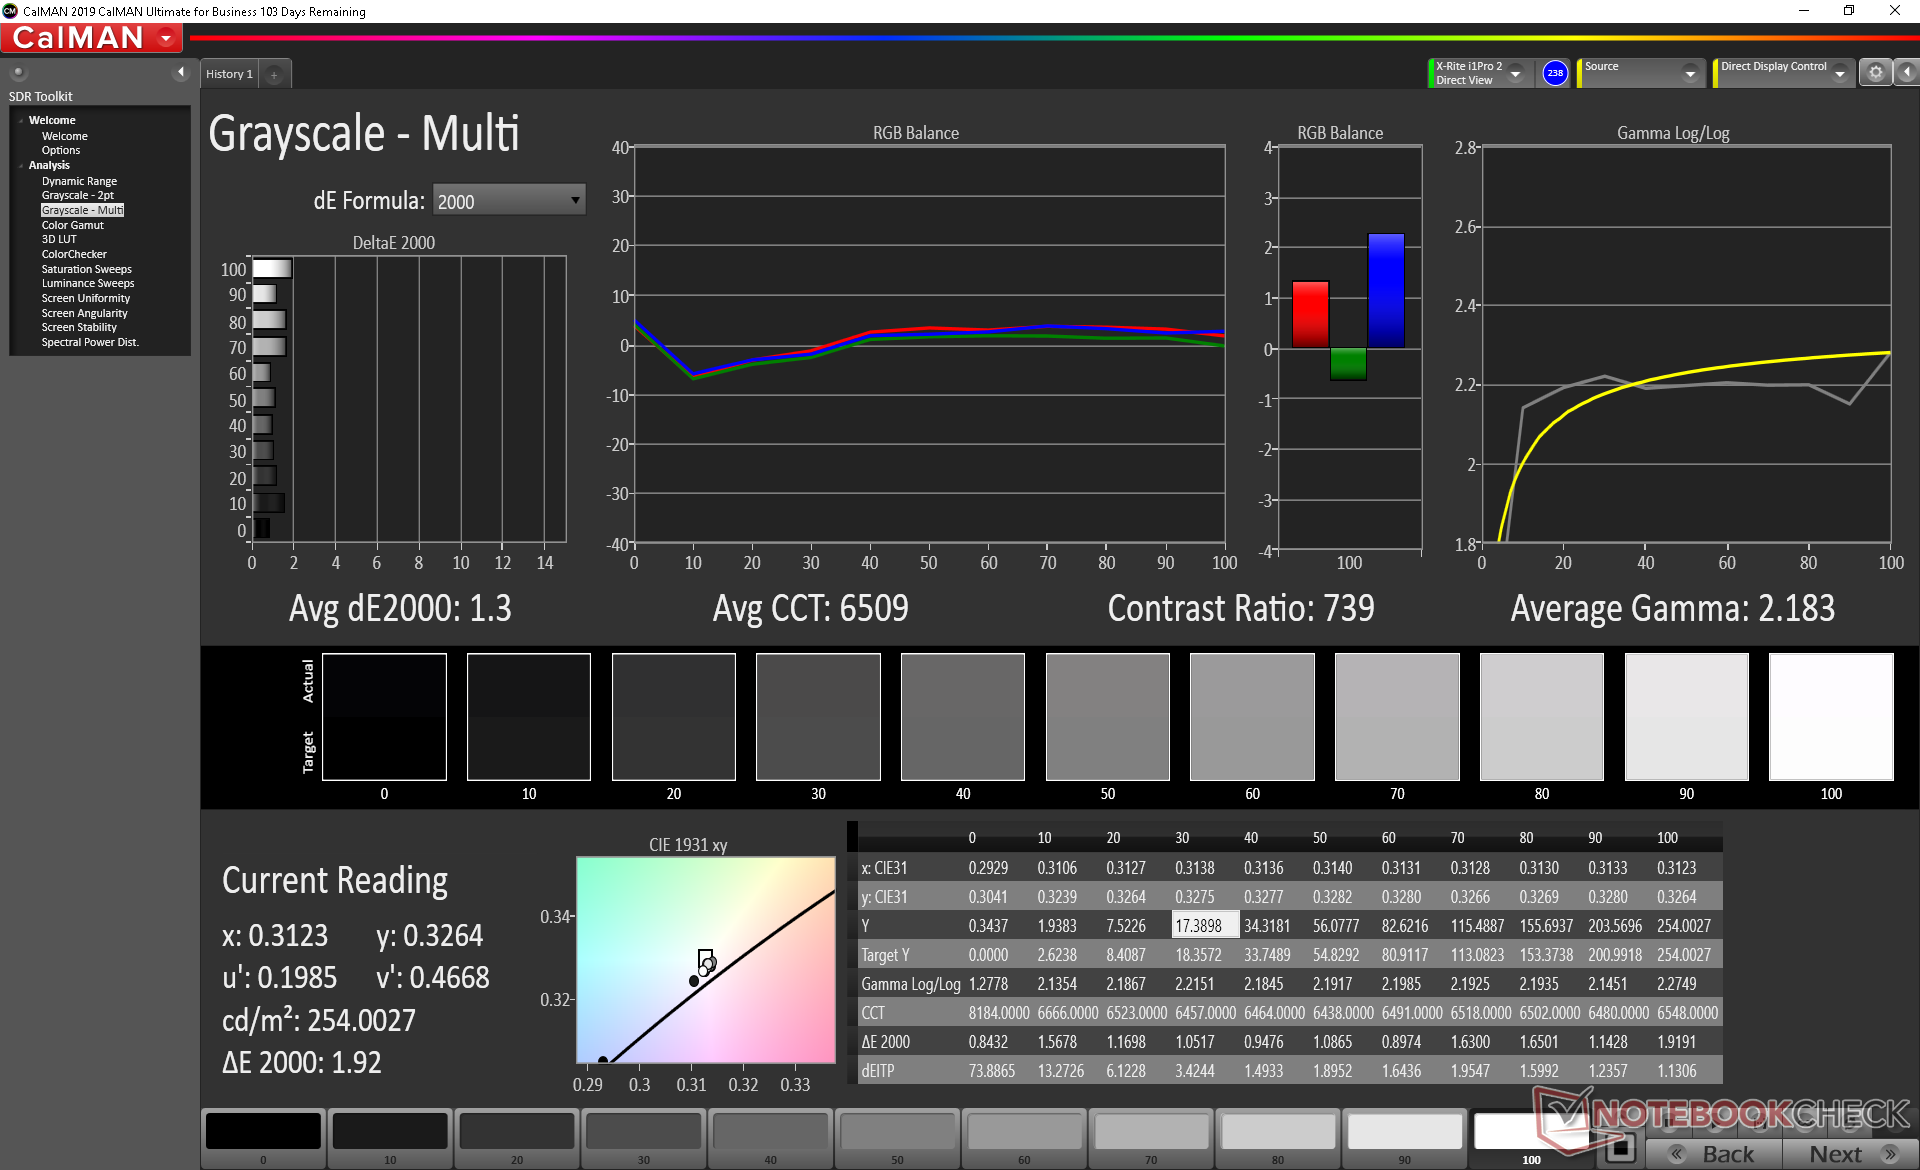
calibrated: 4.17
ΔE Greyscale Calman: 4.2 | ∀{0.09-98 Ø4.97}
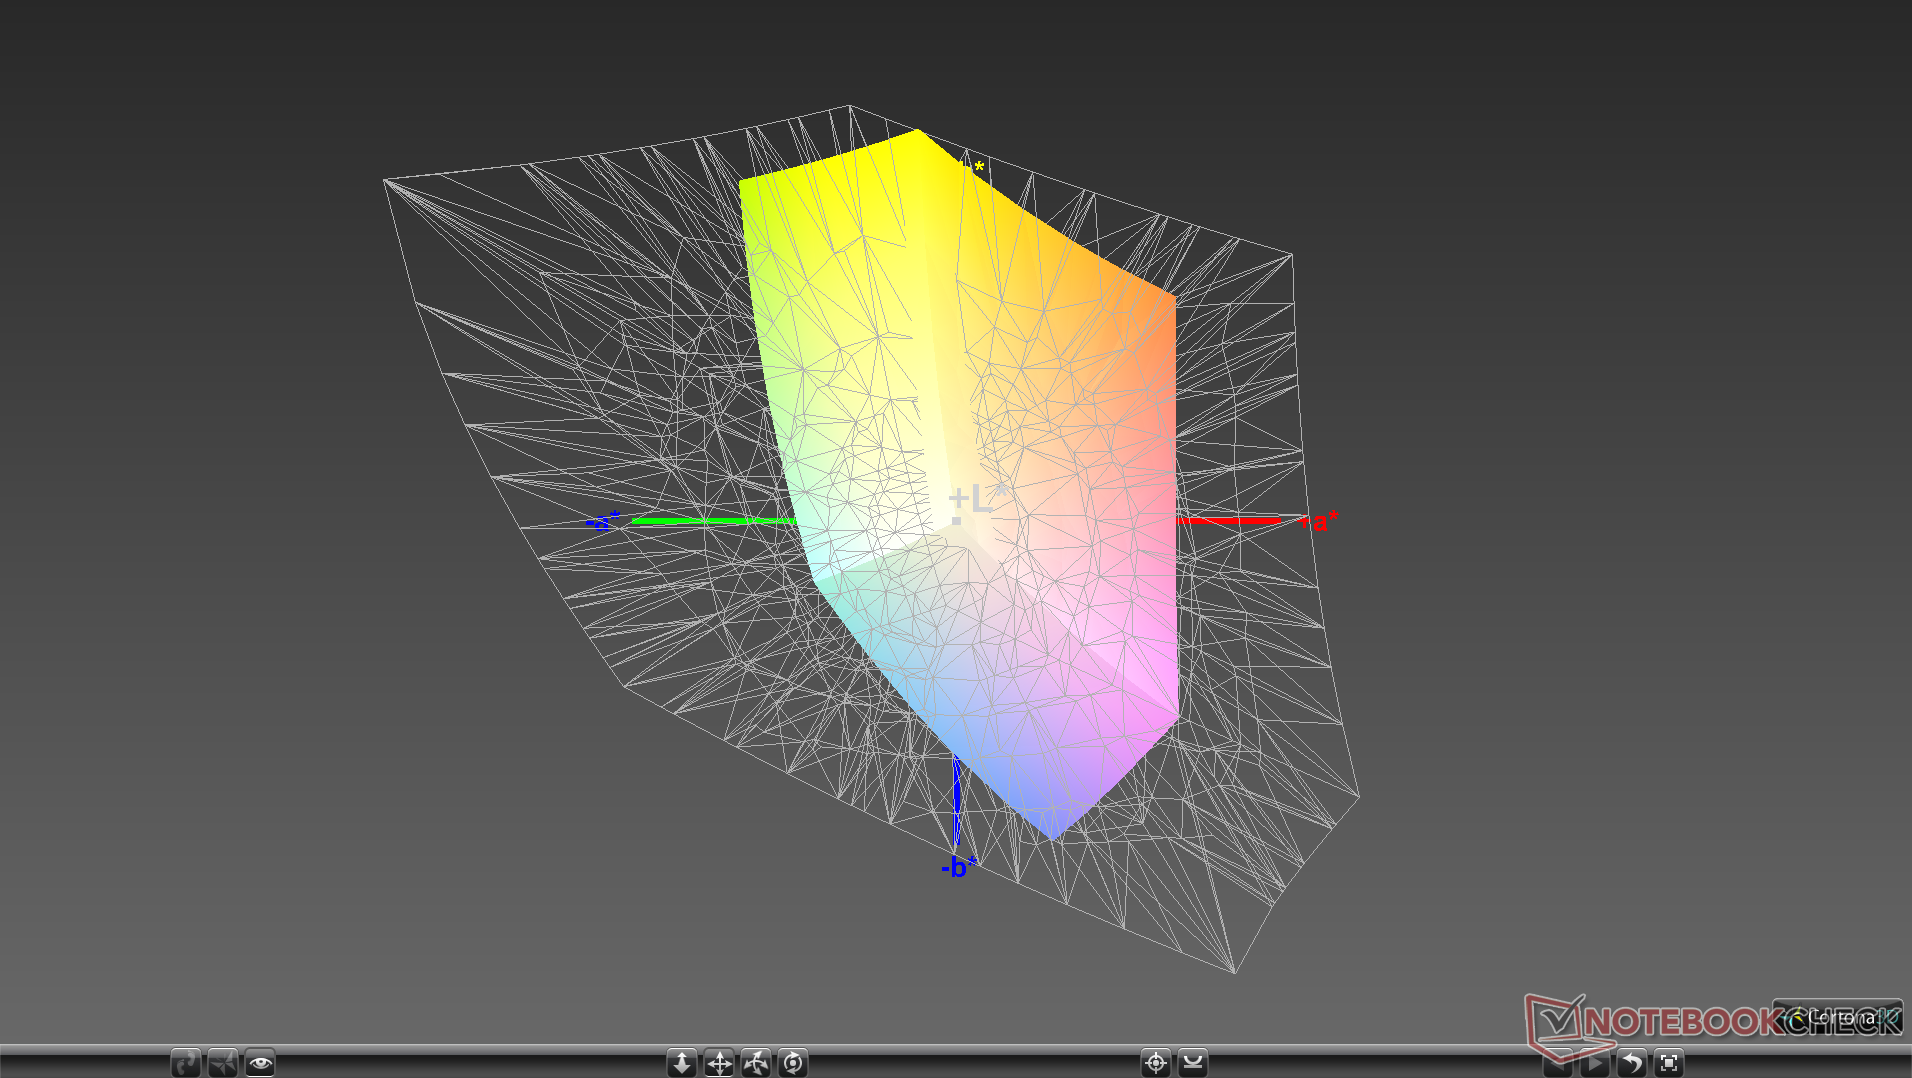
60.4% sRGB (Argyll 1.6.3 3D)
38.6% AdobeRGB 1998 (Argyll 1.6.3 3D)
42.01% AdobeRGB 1998 (Argyll 3D)
60.6% sRGB (Argyll 3D)
40.66% Display P3 (Argyll 3D)
Gamma: 2.07
CCT: 6975 K
| Acer TravelMate P215-52 BOE CQ NV156FHM-N48, IPS, 15.6", 1920x1080 | HP ProBook 450 G7 8WC04UT LG Philips LGD062E, IPS, 15.6", 1920x1080 | Acer Extensa 15 EX215-51-56UX BOE CQ NT156FHM-N61, TN LED, 15.6", 1920x1080 | HP 15s-fq1556ng AU Optronics B156HW02, IPS, 15.6", 1920x1080 | Lenovo ThinkPad L590-20Q70019GE N156HCE-EAA, IPS, 15.6", 1920x1080 | Dell Latitude 15 3590 BOE0802 / NT15N41 / Dell: M9P74, TN LED, 15.6", 1920x1080 | |
|---|---|---|---|---|---|---|
| Display | -7% | -6% | -7% | 6% | -2% | |
| Display P3 Coverage (%) | 40.66 | 37.9 -7% | 38.17 -6% | 37.66 -7% | 43.3 6% | 39.67 -2% |
| sRGB Coverage (%) | 60.6 | 56.5 -7% | 57.5 -5% | 56.4 -7% | 64.4 6% | 59.7 -1% |
| AdobeRGB 1998 Coverage (%) | 42.01 | 39.08 -7% | 39.44 -6% | 38.91 -7% | 44.81 7% | 40.99 -2% |
| Response Times | -24% | -10% | -60% | -40% | -5% | |
| Response Time Grey 50% / Grey 80% * (ms) | 24.4 ? | 35.2 ? -44% | 41 ? -68% | 51 ? -109% | 42.8 ? -75% | 41 ? -68% |
| Response Time Black / White * (ms) | 29.2 ? | 30.4 ? -4% | 15 ? 49% | 32 ? -10% | 30.8 ? -5% | 12 ? 59% |
| PWM Frequency (Hz) | 1000 ? | 24510 ? | 250 ? | |||
| Screen | 1% | -44% | 20% | 13% | -26% | |
| Brightness middle (cd/m²) | 255.9 | 259.8 2% | 203 -21% | 254 -1% | 247 -3% | 215 -16% |
| Brightness (cd/m²) | 234 | 251 7% | 188 -20% | 234 0% | 228 -3% | 214 -9% |
| Brightness Distribution (%) | 78 | 91 17% | 87 12% | 86 10% | 81 4% | 91 17% |
| Black Level * (cd/m²) | 0.46 | 0.42 9% | 0.635 -38% | 0.18 61% | 0.18 61% | 0.385 16% |
| Contrast (:1) | 556 | 619 11% | 320 -42% | 1411 154% | 1372 147% | 558 0% |
| Colorchecker dE 2000 * | 5.02 | 6.09 -21% | 10.84 -116% | 5.58 -11% | 5.9 -18% | 10.31 -105% |
| Colorchecker dE 2000 max. * | 18.26 | 16.33 11% | 22.18 -21% | 9.83 46% | 22.9 -25% | 20.44 -12% |
| Colorchecker dE 2000 calibrated * | 4.17 | 5.2 -25% | 5.09 -22% | 4.53 -9% | 4.7 -13% | 3.88 7% |
| Greyscale dE 2000 * | 4.2 | 3.7 12% | 12.87 -206% | 5.02 -20% | 5.1 -21% | 11.84 -182% |
| Gamma | 2.07 106% | 2.56 86% | 2.58 85% | 2.83 78% | 2.21 100% | 2.67 82% |
| CCT | 6975 93% | 6759 96% | 15854 41% | 6570 99% | 6398 102% | 13398 49% |
| Color Space (Percent of AdobeRGB 1998) (%) | 38.6 | 35.7 -8% | 36.4 -6% | 36 -7% | 41.2 7% | 39 1% |
| Color Space (Percent of sRGB) (%) | 60.4 | 56.2 -7% | 57.4 -5% | 56 -7% | 64.1 6% | 61 1% |
| Total Average (Program / Settings) | -10% /
-4% | -20% /
-33% | -16% /
5% | -7% /
5% | -11% /
-19% |
* ... smaller is better
Color space is narrow at just 60 percent of sRGB to indicate a budget panel. This is common on many inexpensive business laptops where color accuracy is usually not a concern. Most mid-range to high-end consumer Ultrabooks these days cover at least 90 percent of sRGB for deeper and more accurate colors.
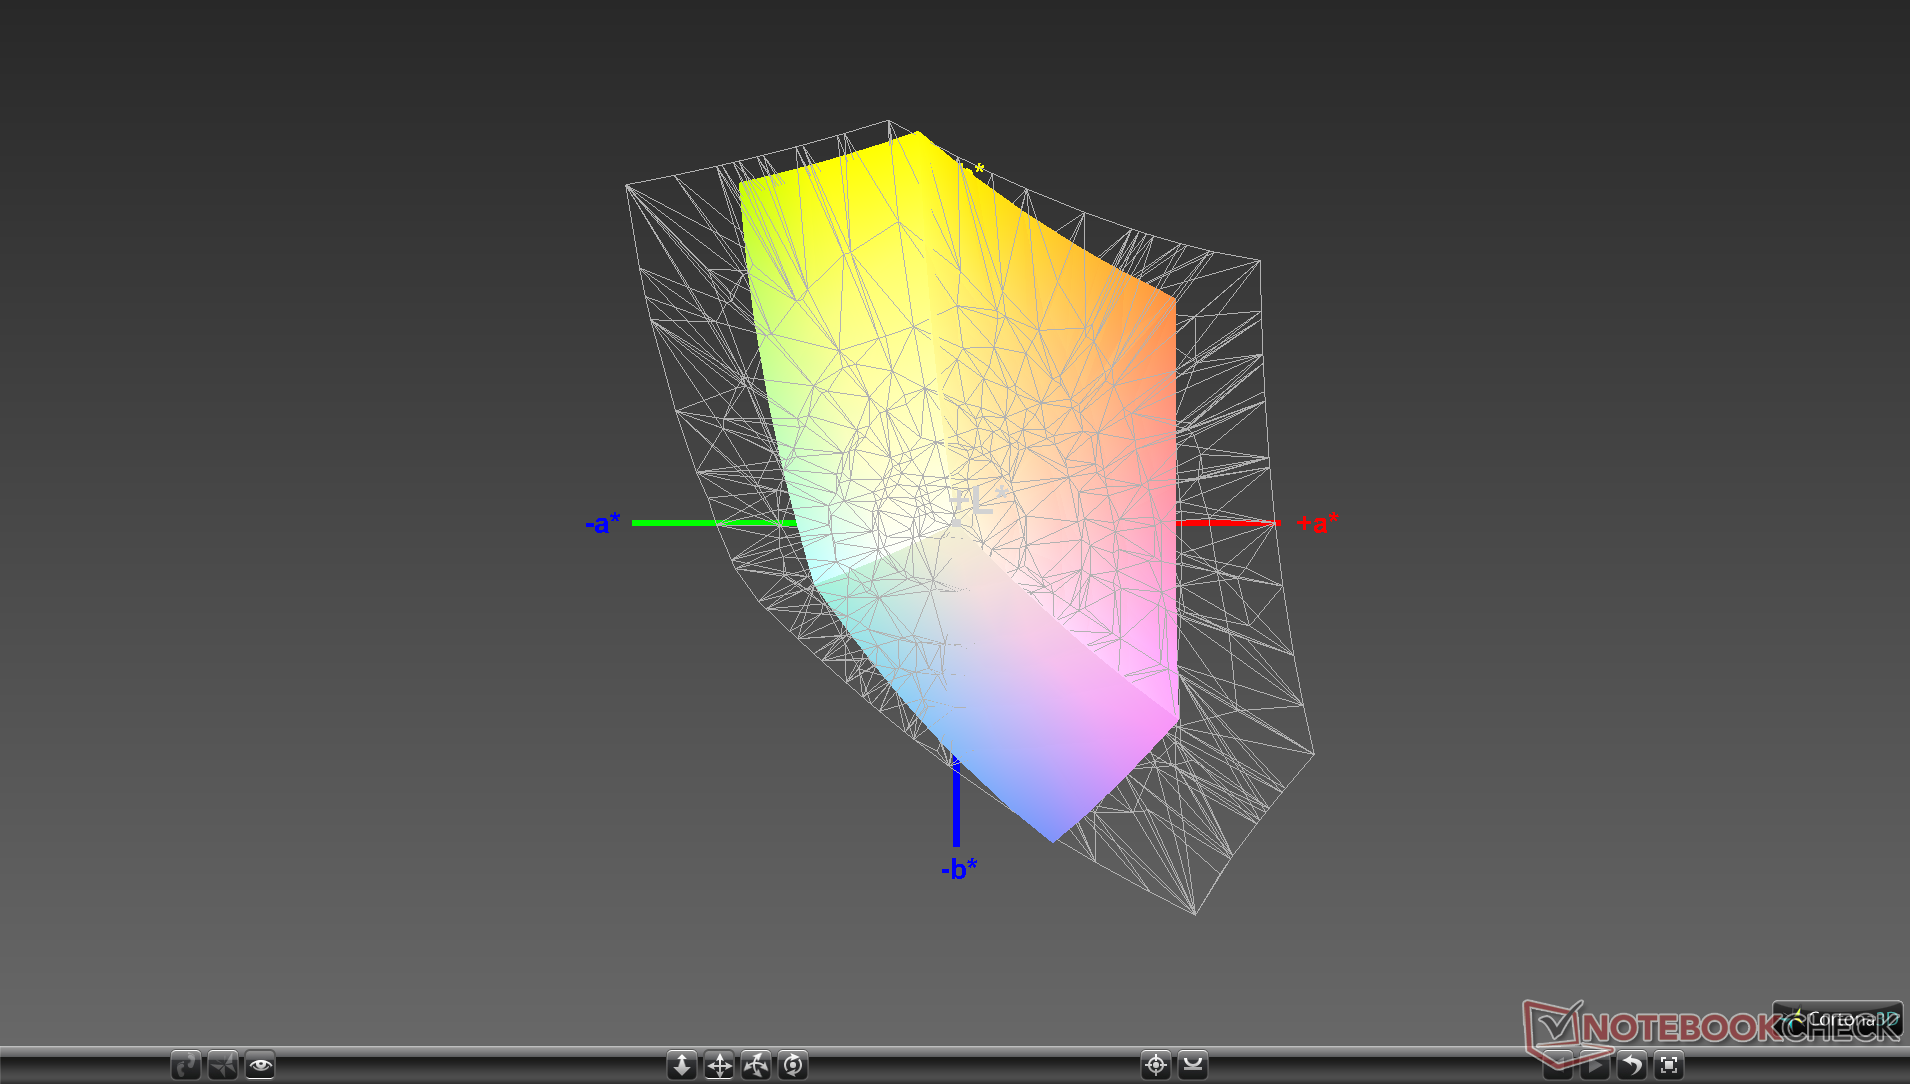
Further measurements with an X-Rite colorimeter show an overly cool color temperature and an average grayscale deltaE value of 4.2. These drawbacks improve noticeably after calibrating the panel ourselves, but colors remain about the same due to the limited gamut mentioned above. Our calibrated ICM profile is available above free of charge.

Display Response Times
| ↔ Response Time Black to White | ||
|---|---|---|
| 29.2 ms ... rise ↗ and fall ↘ combined | ↗ 15.2 ms rise | 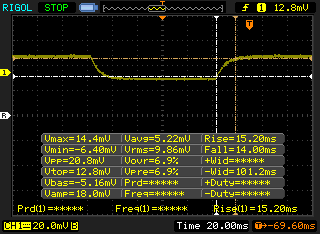 |
| ↘ 14 ms fall | ||
| The screen shows relatively slow response rates in our tests and may be too slow for gamers. In comparison, all tested devices range from 0.1 (minimum) to 240 (maximum) ms. » 78 % of all devices are better. This means that the measured response time is worse than the average of all tested devices (19.9 ms). | ||
| ↔ Response Time 50% Grey to 80% Grey | ||
| 24.4 ms ... rise ↗ and fall ↘ combined | ↗ 14 ms rise | 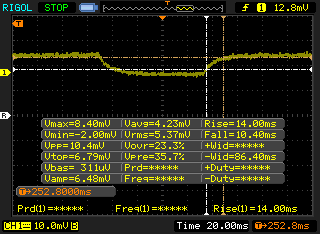 |
| ↘ 10.4 ms fall | ||
| The screen shows good response rates in our tests, but may be too slow for competitive gamers. In comparison, all tested devices range from 0.165 (minimum) to 636 (maximum) ms. » 35 % of all devices are better. This means that the measured response time is better than the average of all tested devices (31.1 ms). | ||
Screen Flickering / PWM (Pulse-Width Modulation)
| Screen flickering / PWM detected | 1000 Hz | ≤ 99 % brightness setting | 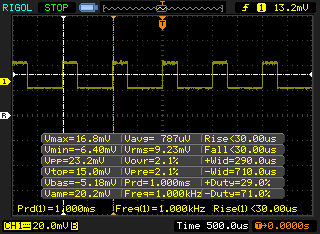 |
The display backlight flickers at 1000 Hz (worst case, e.g., utilizing PWM) Flickering detected at a brightness setting of 99 % and below. There should be no flickering or PWM above this brightness setting. The frequency of 1000 Hz is quite high, so most users sensitive to PWM should not notice any flickering. In comparison: 52 % of all tested devices do not use PWM to dim the display. If PWM was detected, an average of 7798 (minimum: 5 - maximum: 343500) Hz was measured. | |||
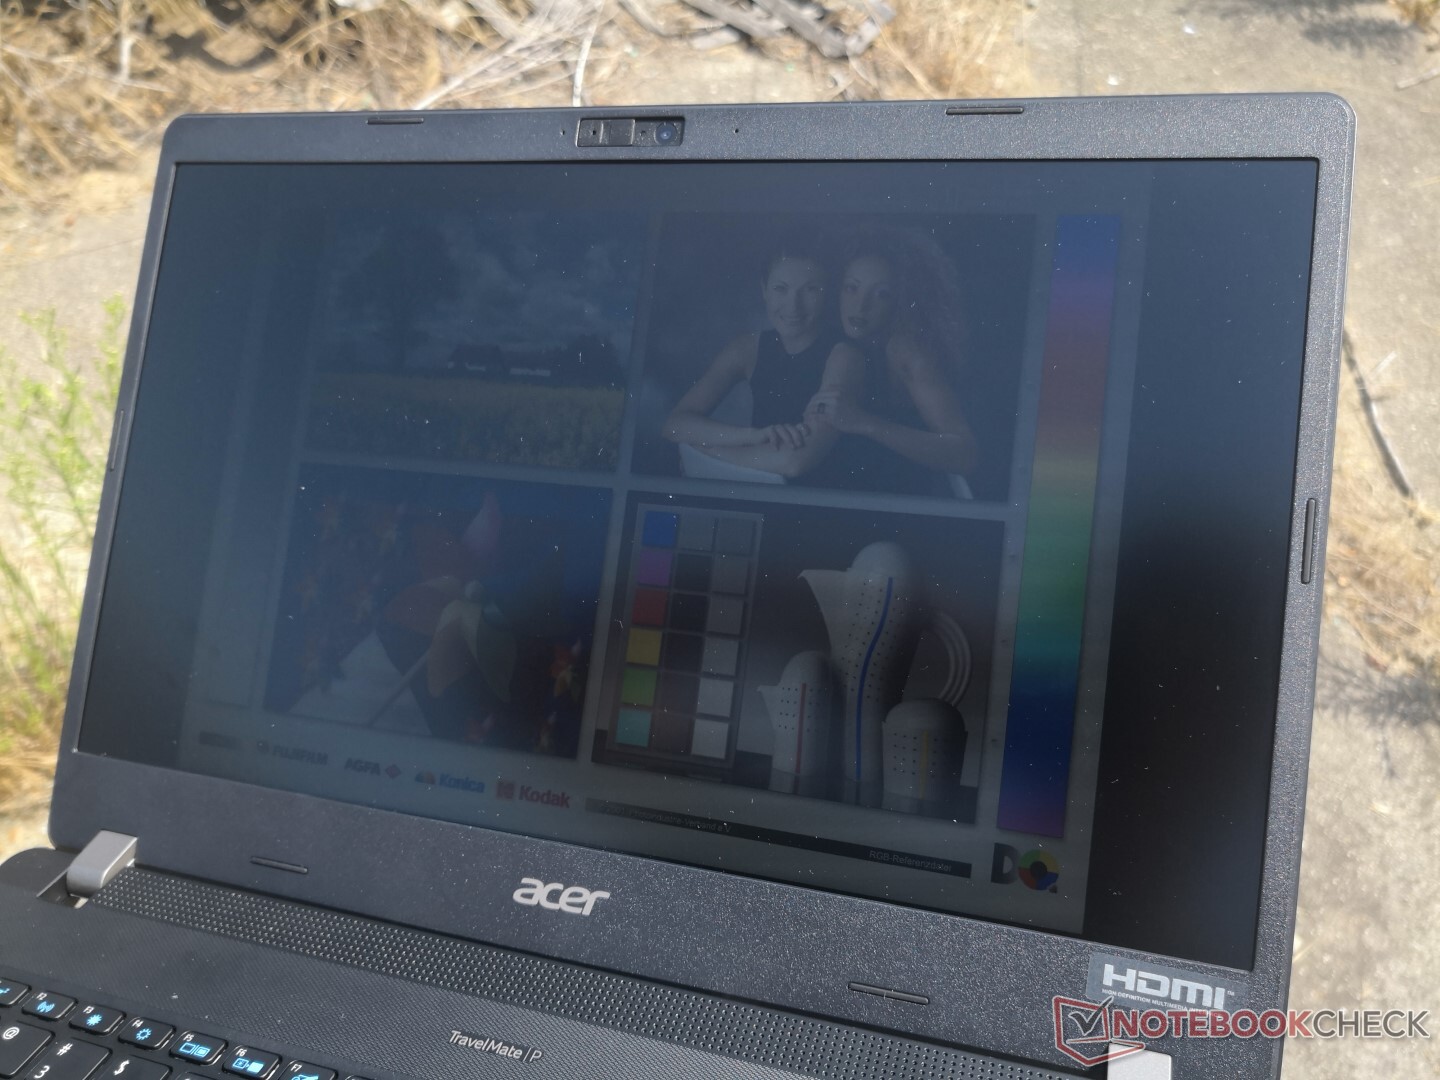
Outdoor visibility is average at best even when under shade as the backlight isn't bright enough to overcome the ambient lighting. You're going to want to invest in pricier business laptops like the HP EliteBook where 1000-nit panels are available.
Performance
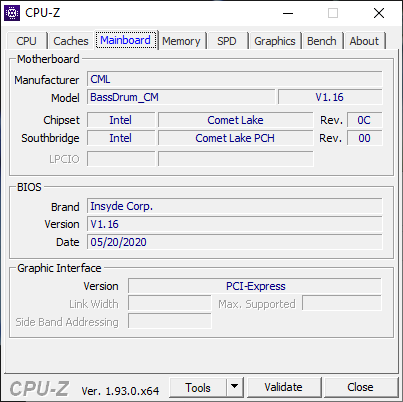

Processor
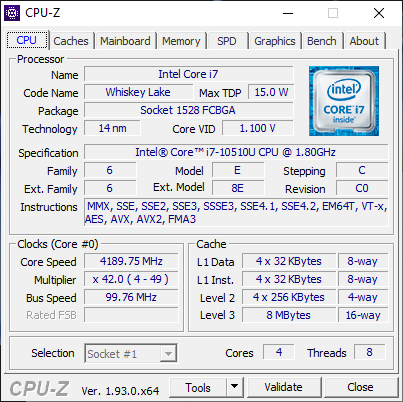
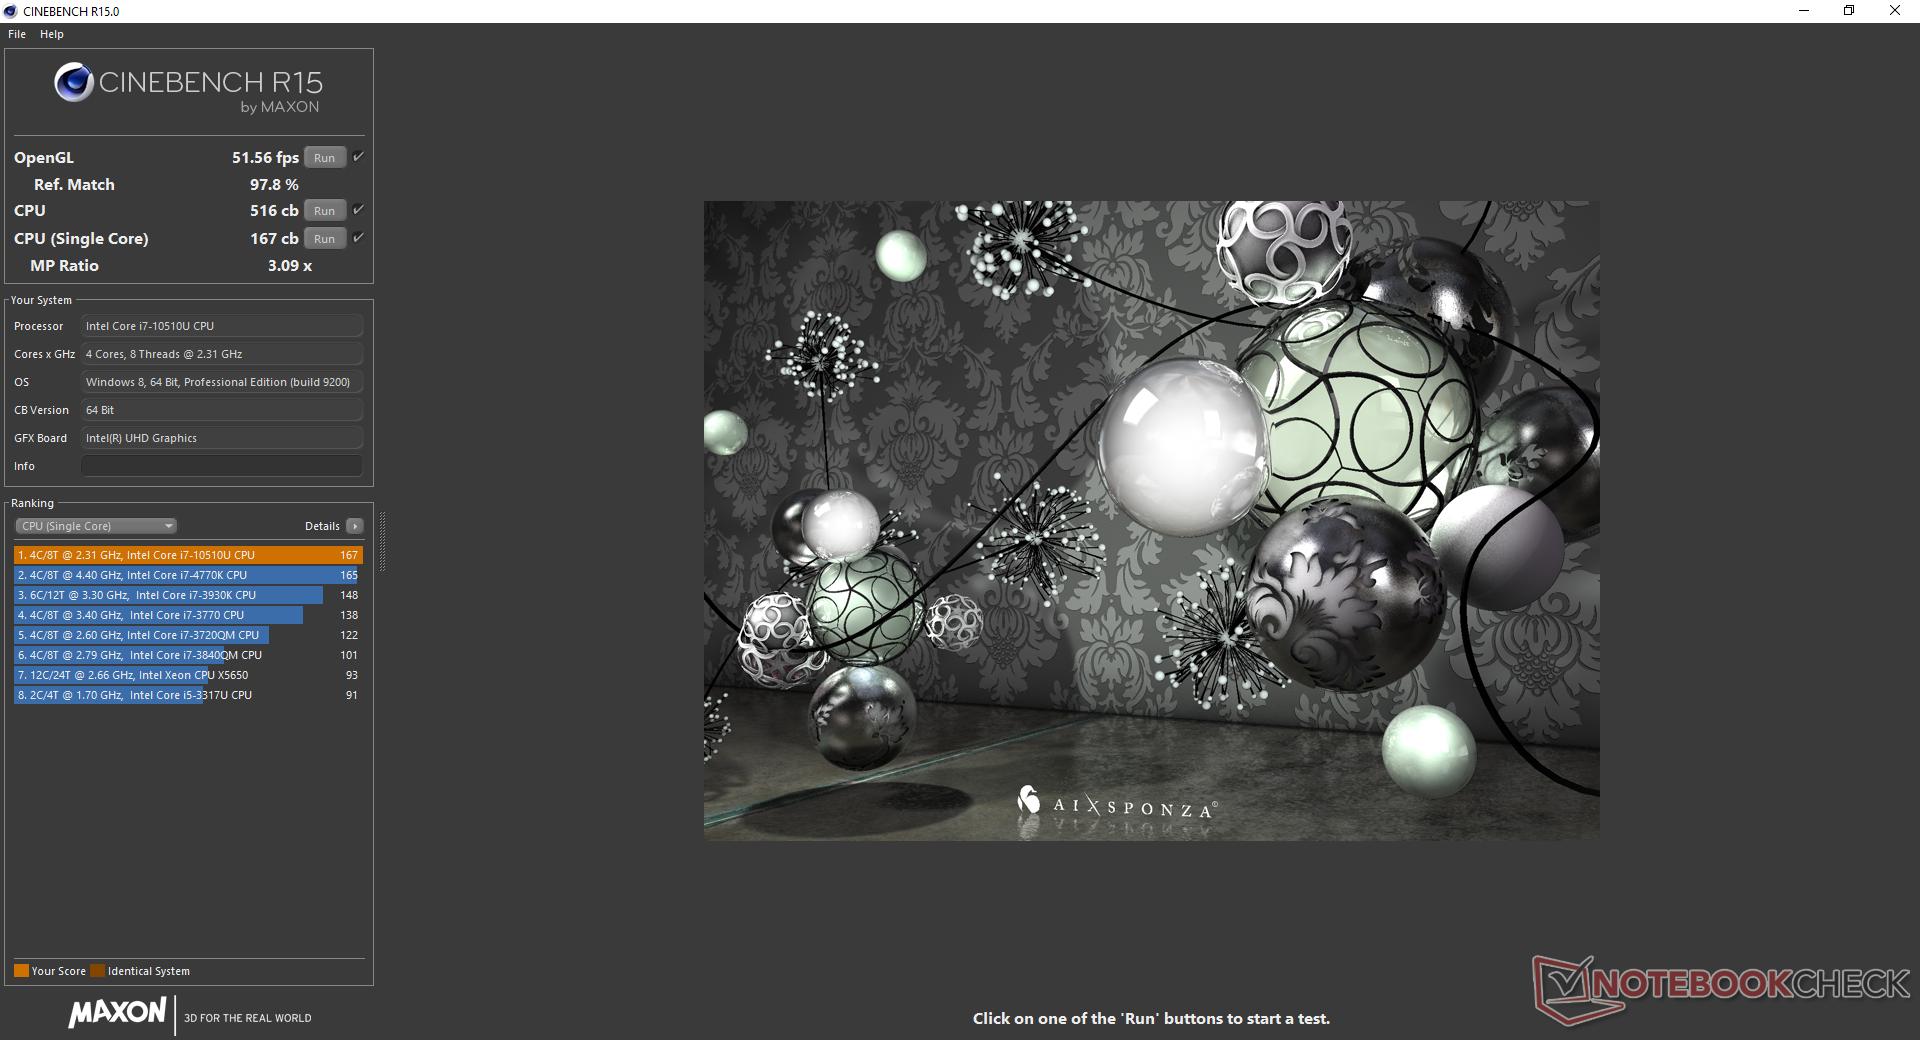
CPU performance is slower than the average Core i7-10510U in our database by about 17 to 24 percent. In fact, this deficit puts the processor in our Acer on equal footing to the older and less expensive Core i5-8265U. Performance sustainability is still pretty good as exemplified by our CineBench R15 xT loop results below, but it's disappointing to see that most systems running on older 9th gen Intel Whiskey Lake-U processors are able to outperform our Acer.
See our dedicated page on the Core i7-10510U for more technical information and benchmark comparisons.
Cinebench R15: CPU Multi 64Bit | CPU Single 64Bit
Blender: v2.79 BMW27 CPU
7-Zip 18.03: 7z b 4 -mmt1 | 7z b 4
Geekbench 5.5: Single-Core | Multi-Core
HWBOT x265 Benchmark v2.2: 4k Preset
LibreOffice : 20 Documents To PDF
R Benchmark 2.5: Overall mean
| Geekbench 5.5 / Single-Core | |
| HP 15s-fq1440ng | |
| Average Intel Core i7-10510U (977 - 1287, n=31) | |
| Lenovo IdeaPad 3 14IIL05 | |
| HP ProBook 455 G7-175W8EA | |
| Acer TravelMate P215-52 | |
| HP ProBook 445 G7 175W4EA | |
| Lenovo ThinkPad T14s-20T00044GE | |
| Acer Swift 3 SF314-42-R27B | |
| Geekbench 5.5 / Multi-Core | |
| HP ProBook 455 G7-175W8EA | |
| HP ProBook 445 G7 175W4EA | |
| HP 15s-fq1440ng | |
| Lenovo ThinkPad T14s-20T00044GE | |
| Average Intel Core i7-10510U (2474 - 4484, n=31) | |
| Acer Swift 3 SF314-42-R27B | |
| Acer TravelMate P215-52 | |
| Lenovo IdeaPad 3 14IIL05 | |
| HWBOT x265 Benchmark v2.2 / 4k Preset | |
| HP ProBook 455 G7-175W8EA | |
| Dell XPS 13 7390 Core i7-10710U | |
| Lenovo ThinkPad T590-20N4002VGE | |
| Average Intel Core i7-10510U (3.41 - 6.04, n=31) | |
| Lenovo ThinkPad T14s-20T00044GE | |
| Acer Swift 3 SF314-42-R27B | |
| HP 15s-fq1440ng | |
| Acer TravelMate P215-52 | |
| Lenovo ThinkPad L590-20Q70019GE | |
| Lenovo IdeaPad 3 14IIL05 | |
| LibreOffice / 20 Documents To PDF | |
| HP ProBook 455 G7-175W8EA | |
| HP ProBook 445 G7 175W4EA | |
| Acer Swift 3 SF314-42-R27B | |
| Average Intel Core i7-10510U (50.7 - 77.8, n=27) | |
| Lenovo IdeaPad 3 14IIL05 | |
| Acer TravelMate P215-52 | |
| Lenovo ThinkPad T14s-20T00044GE | |
| HP 15s-fq1440ng | |
| R Benchmark 2.5 / Overall mean | |
| Lenovo IdeaPad 3 14IIL05 | |
| Lenovo ThinkPad T14s-20T00044GE | |
| Acer TravelMate P215-52 | |
| Acer Swift 3 SF314-42-R27B | |
| Average Intel Core i7-10510U (0.637 - 0.81, n=28) | |
| HP 15s-fq1440ng | |
| HP ProBook 455 G7-175W8EA | |
* ... smaller is better
System Performance
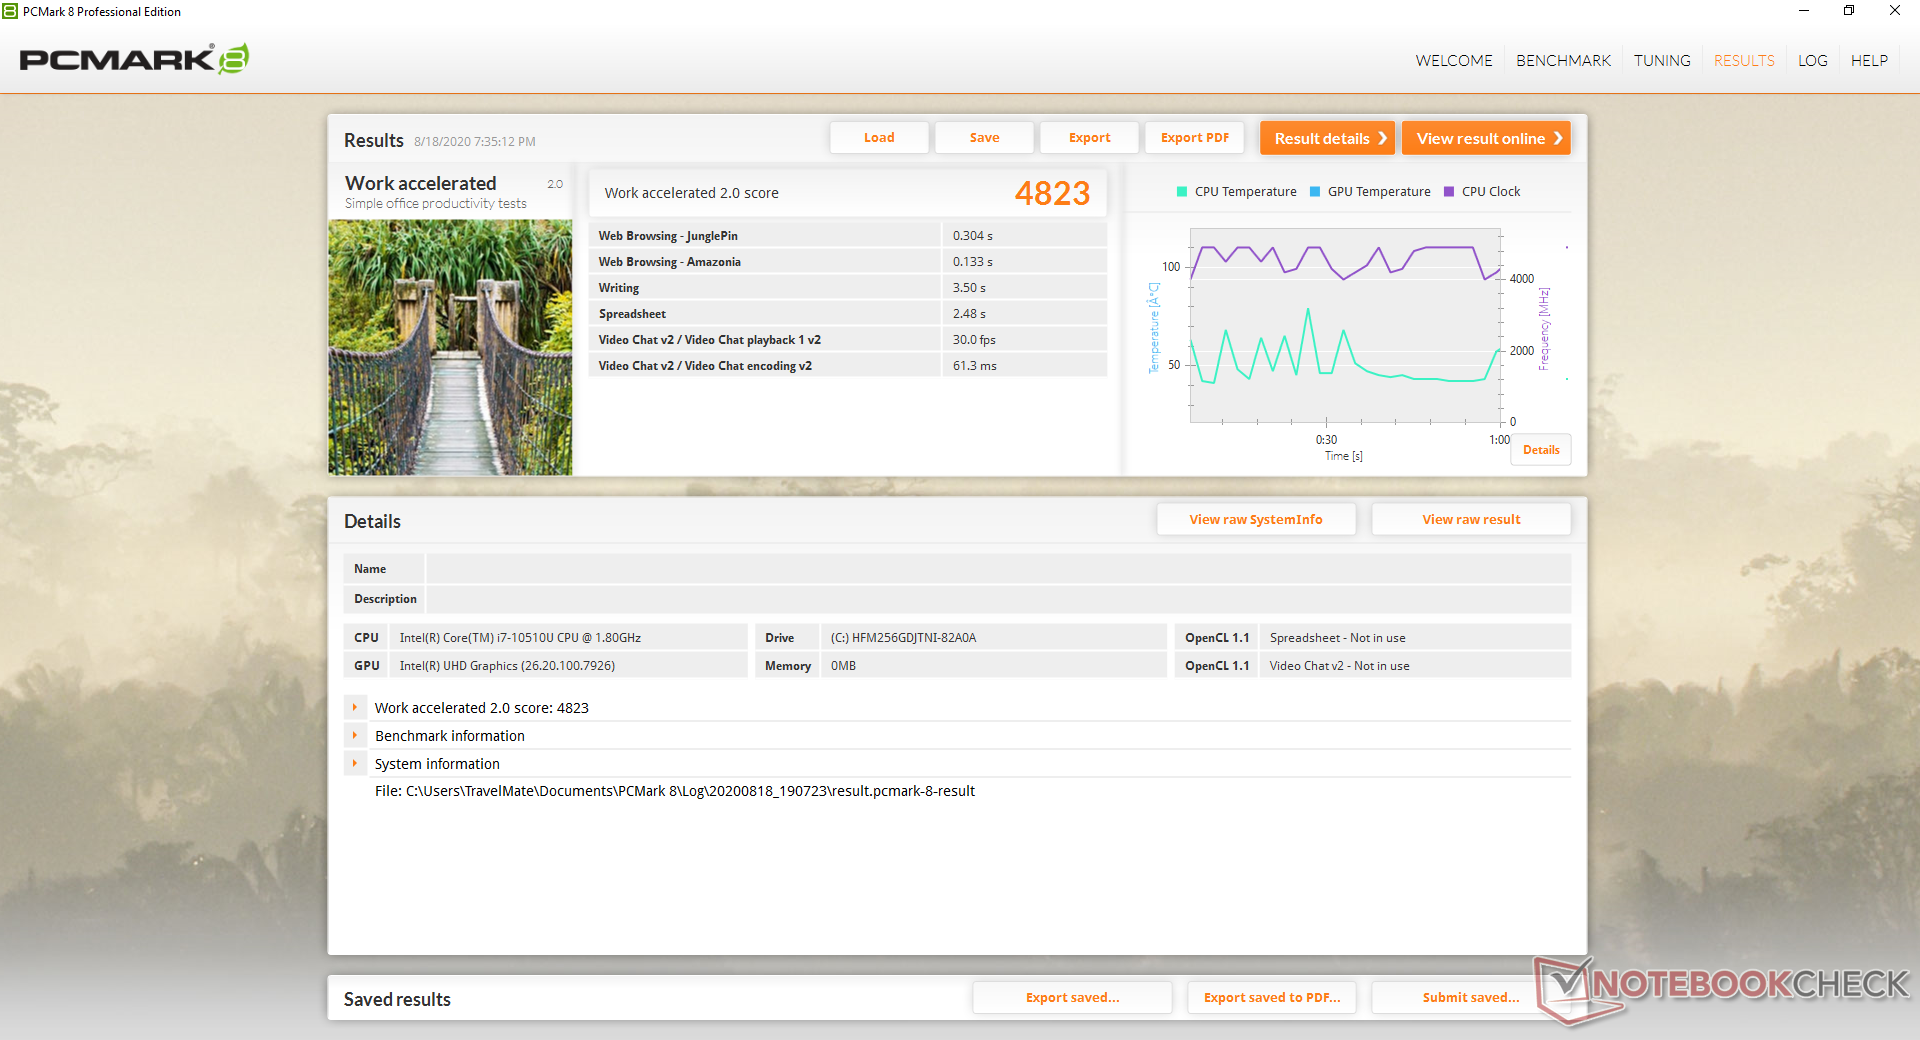
PCMark results are 12 percent lower than the average laptop in our database equipped with the same Core i7-10510U CPU and integrated UHD Graphics 620 GPU. We suspect that the slower-than-average CPU and SK Hynix SSD in our Acer may be responsible for the lower numbers. We otherwise experienced no software or hardware issues during our time with the test unit.
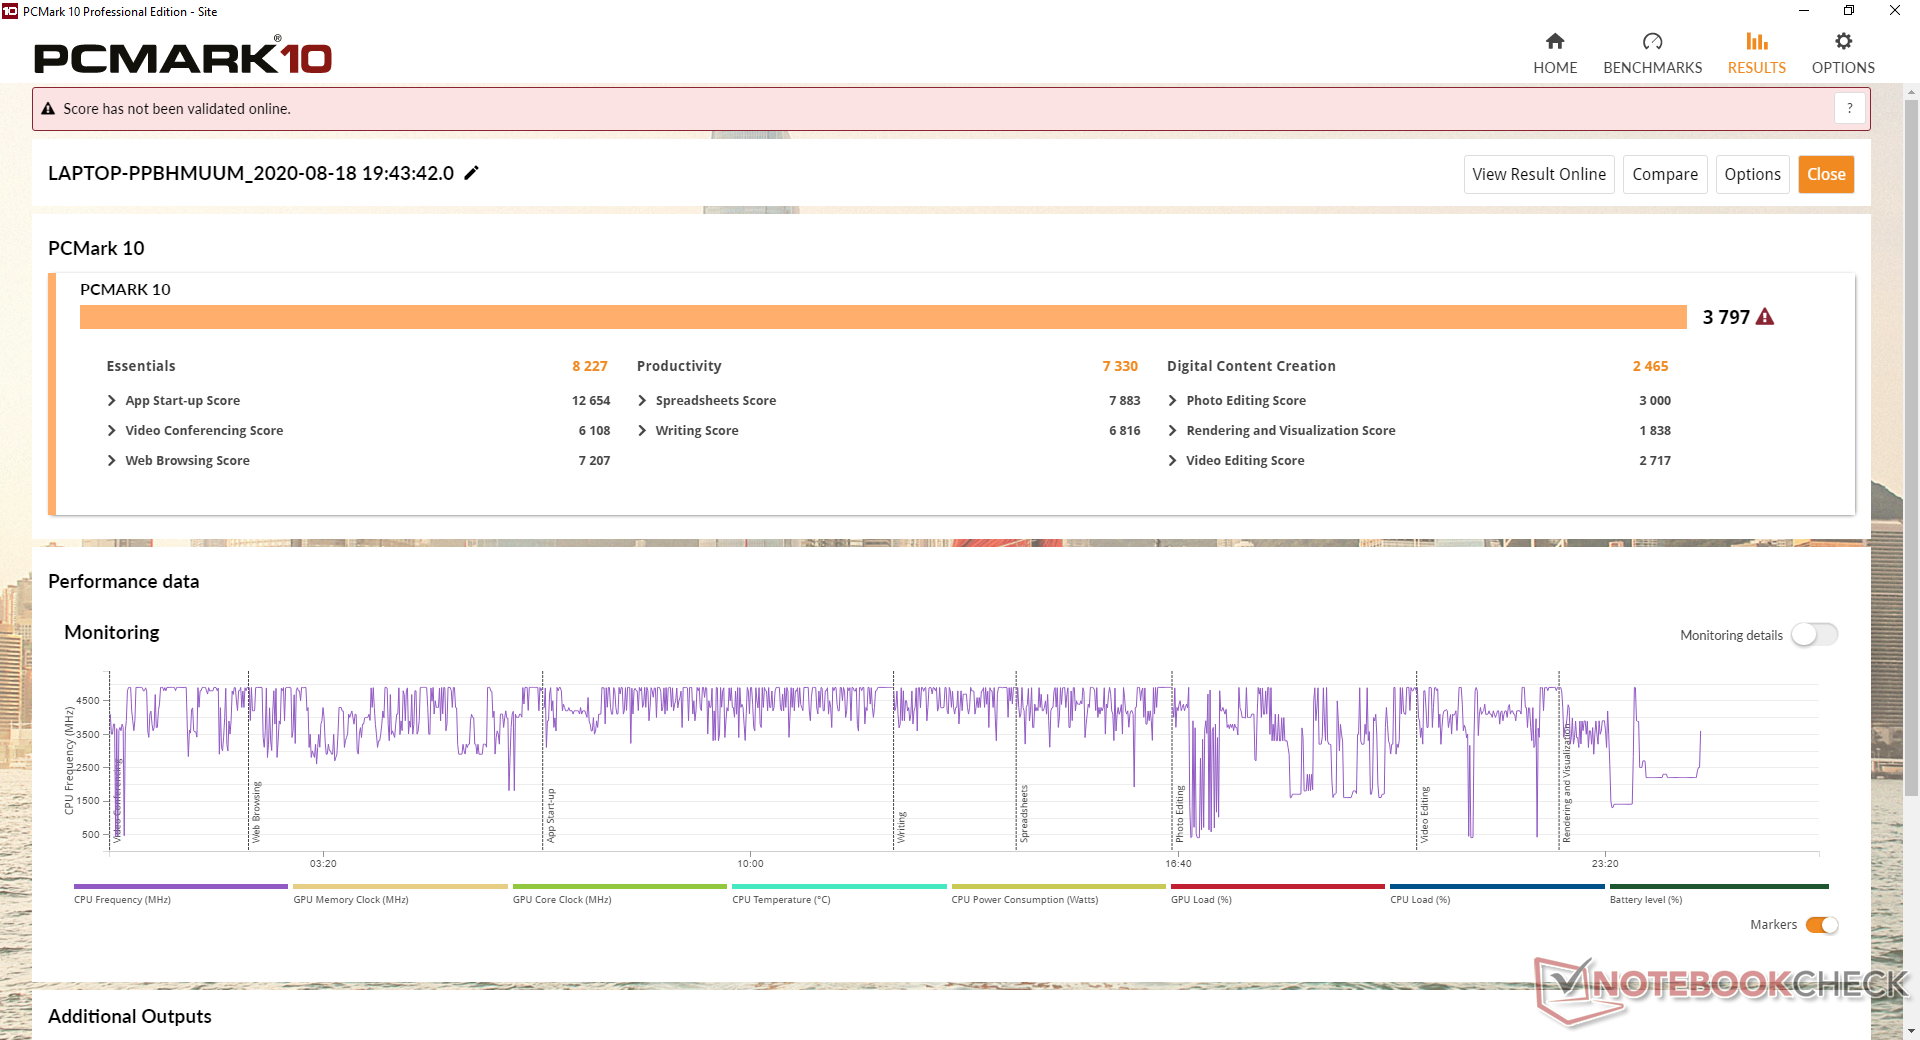
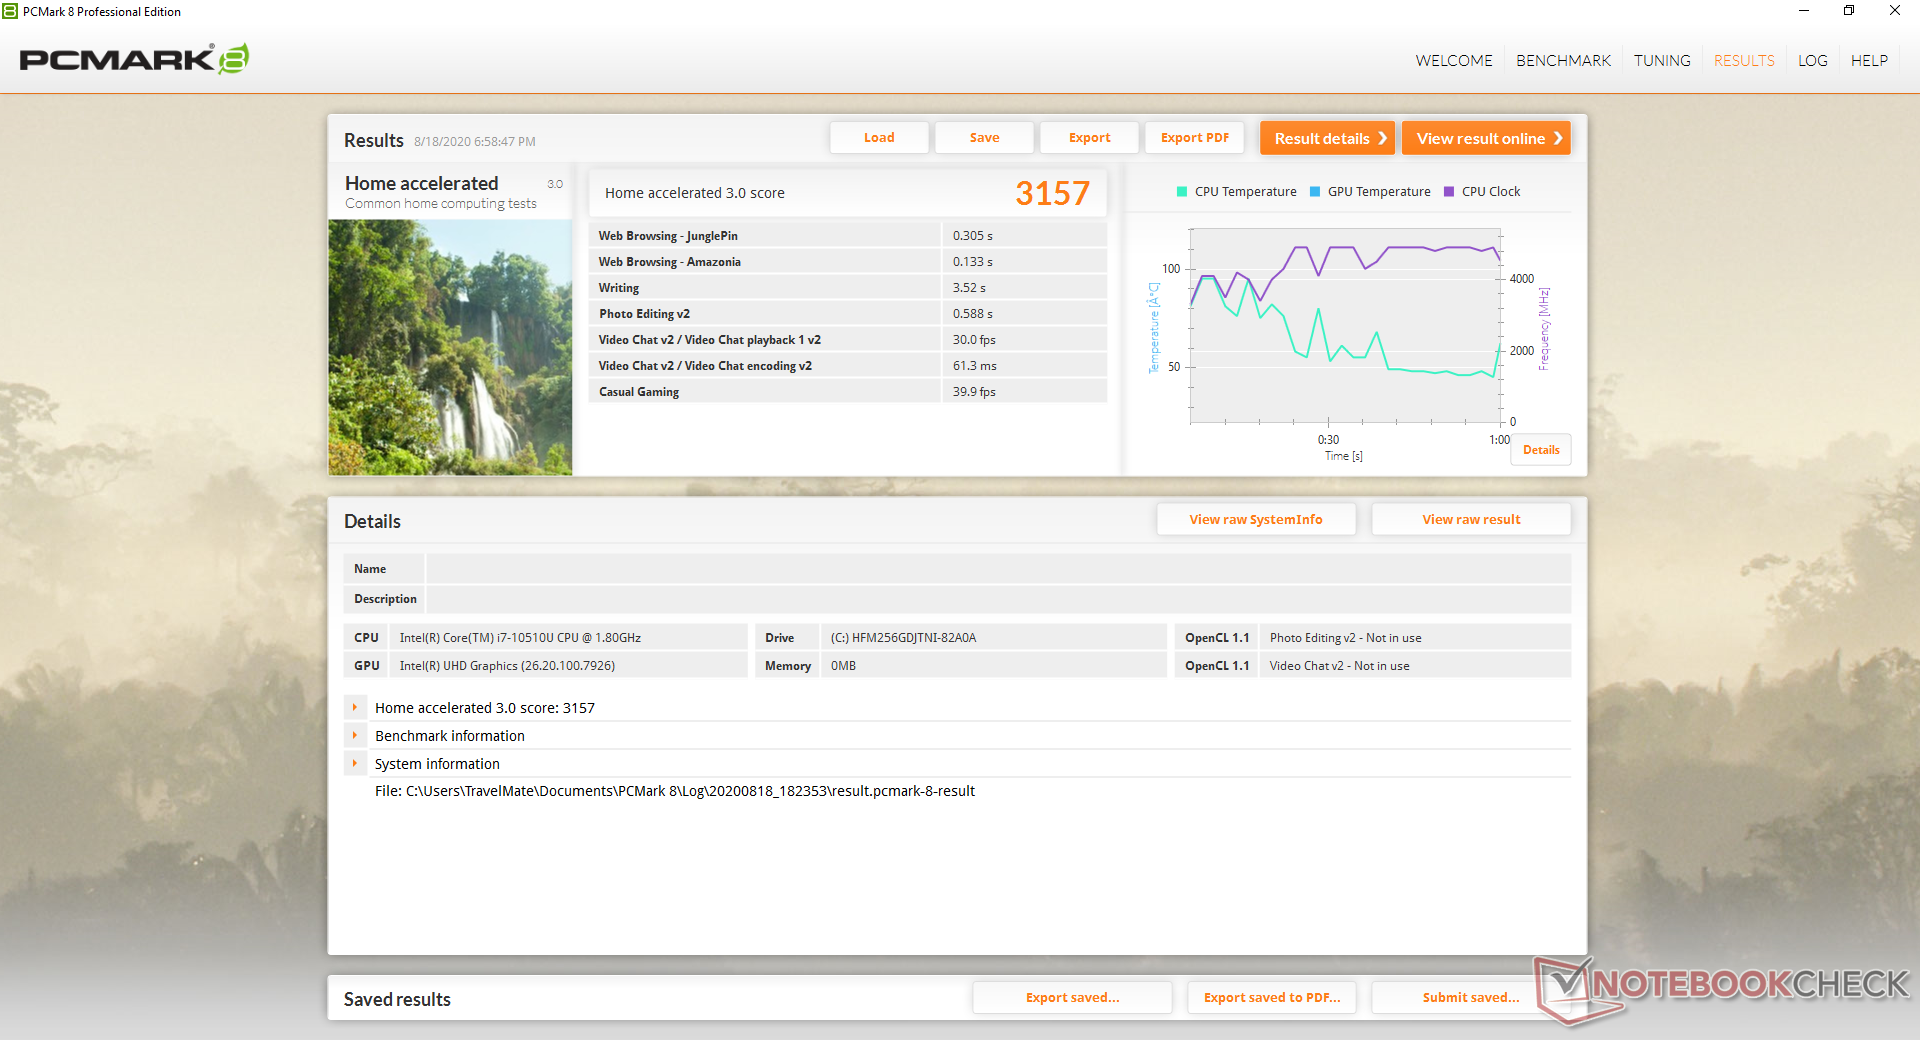
| PCMark 8 Home Score Accelerated v2 | 3157 points | |
| PCMark 8 Work Score Accelerated v2 | 4823 points | |
| PCMark 10 Score | 3797 points | |
Help | ||
DPC Latency
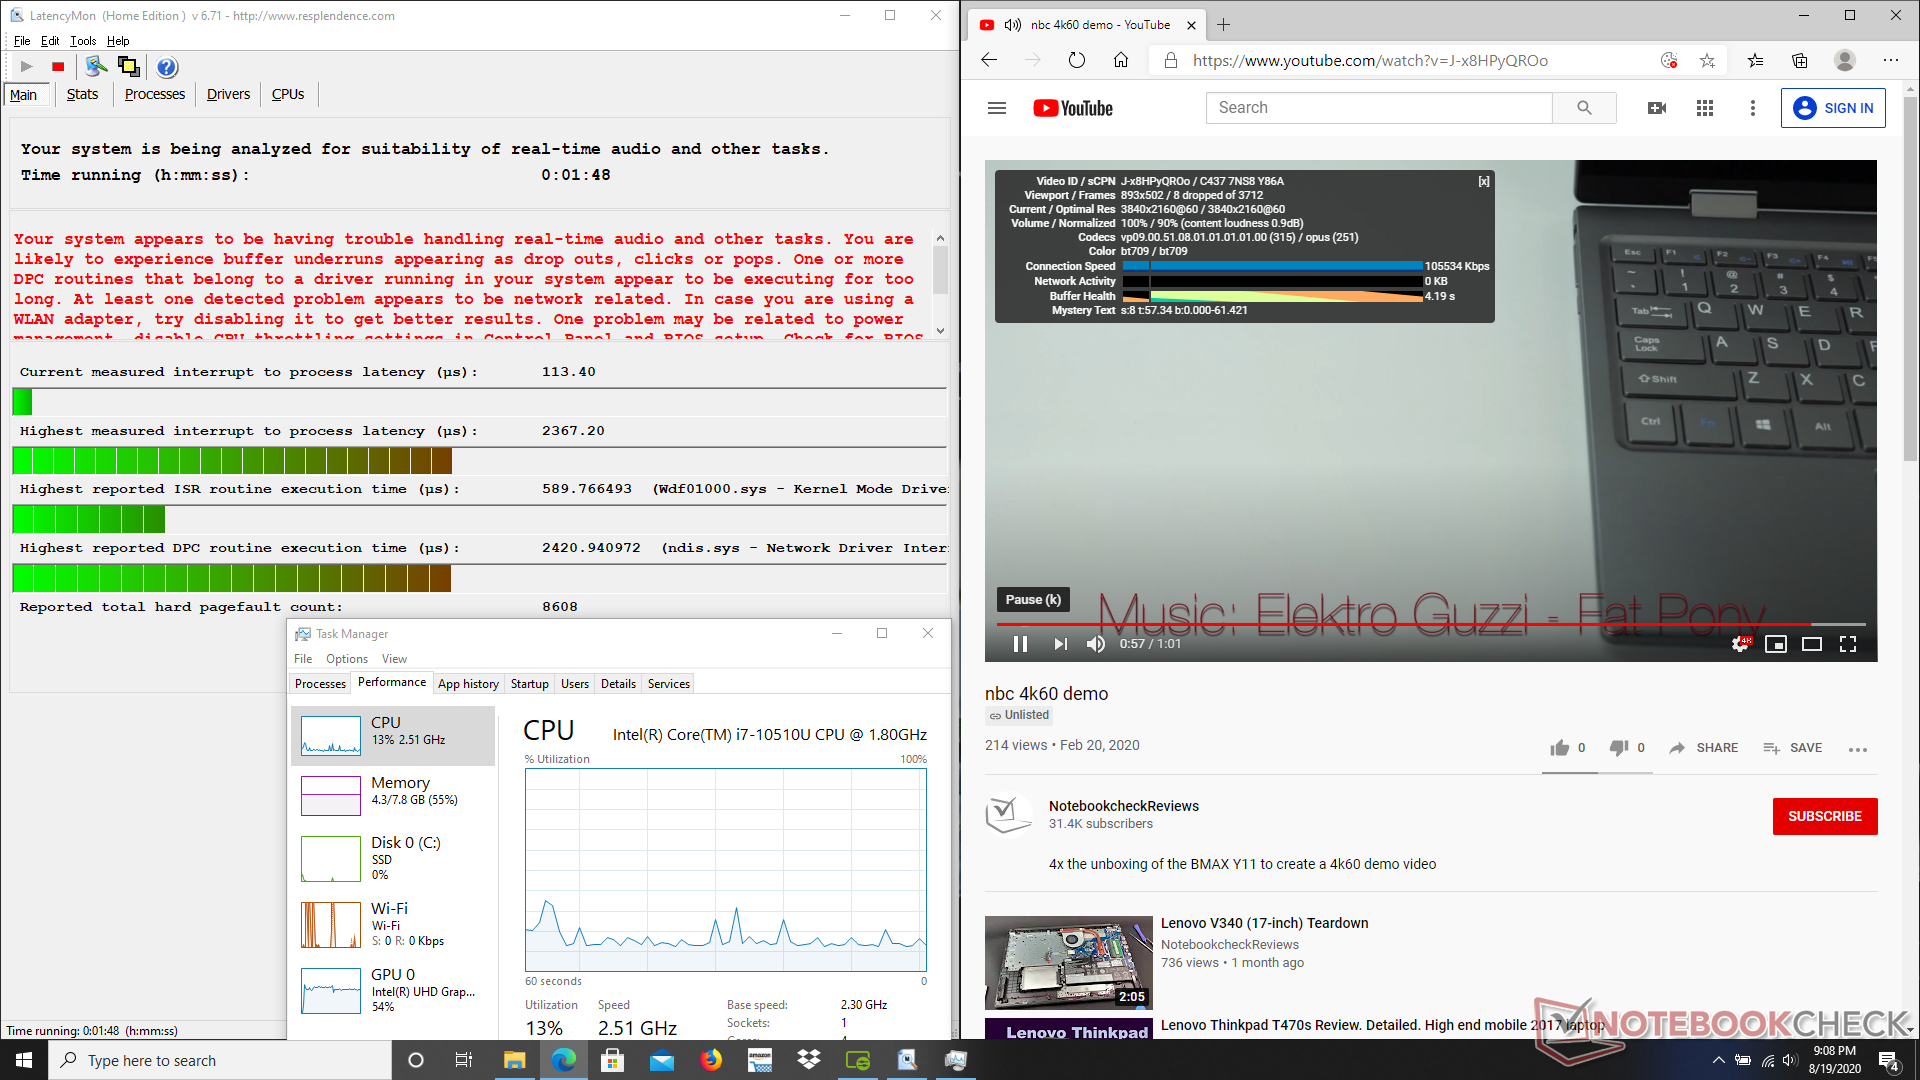
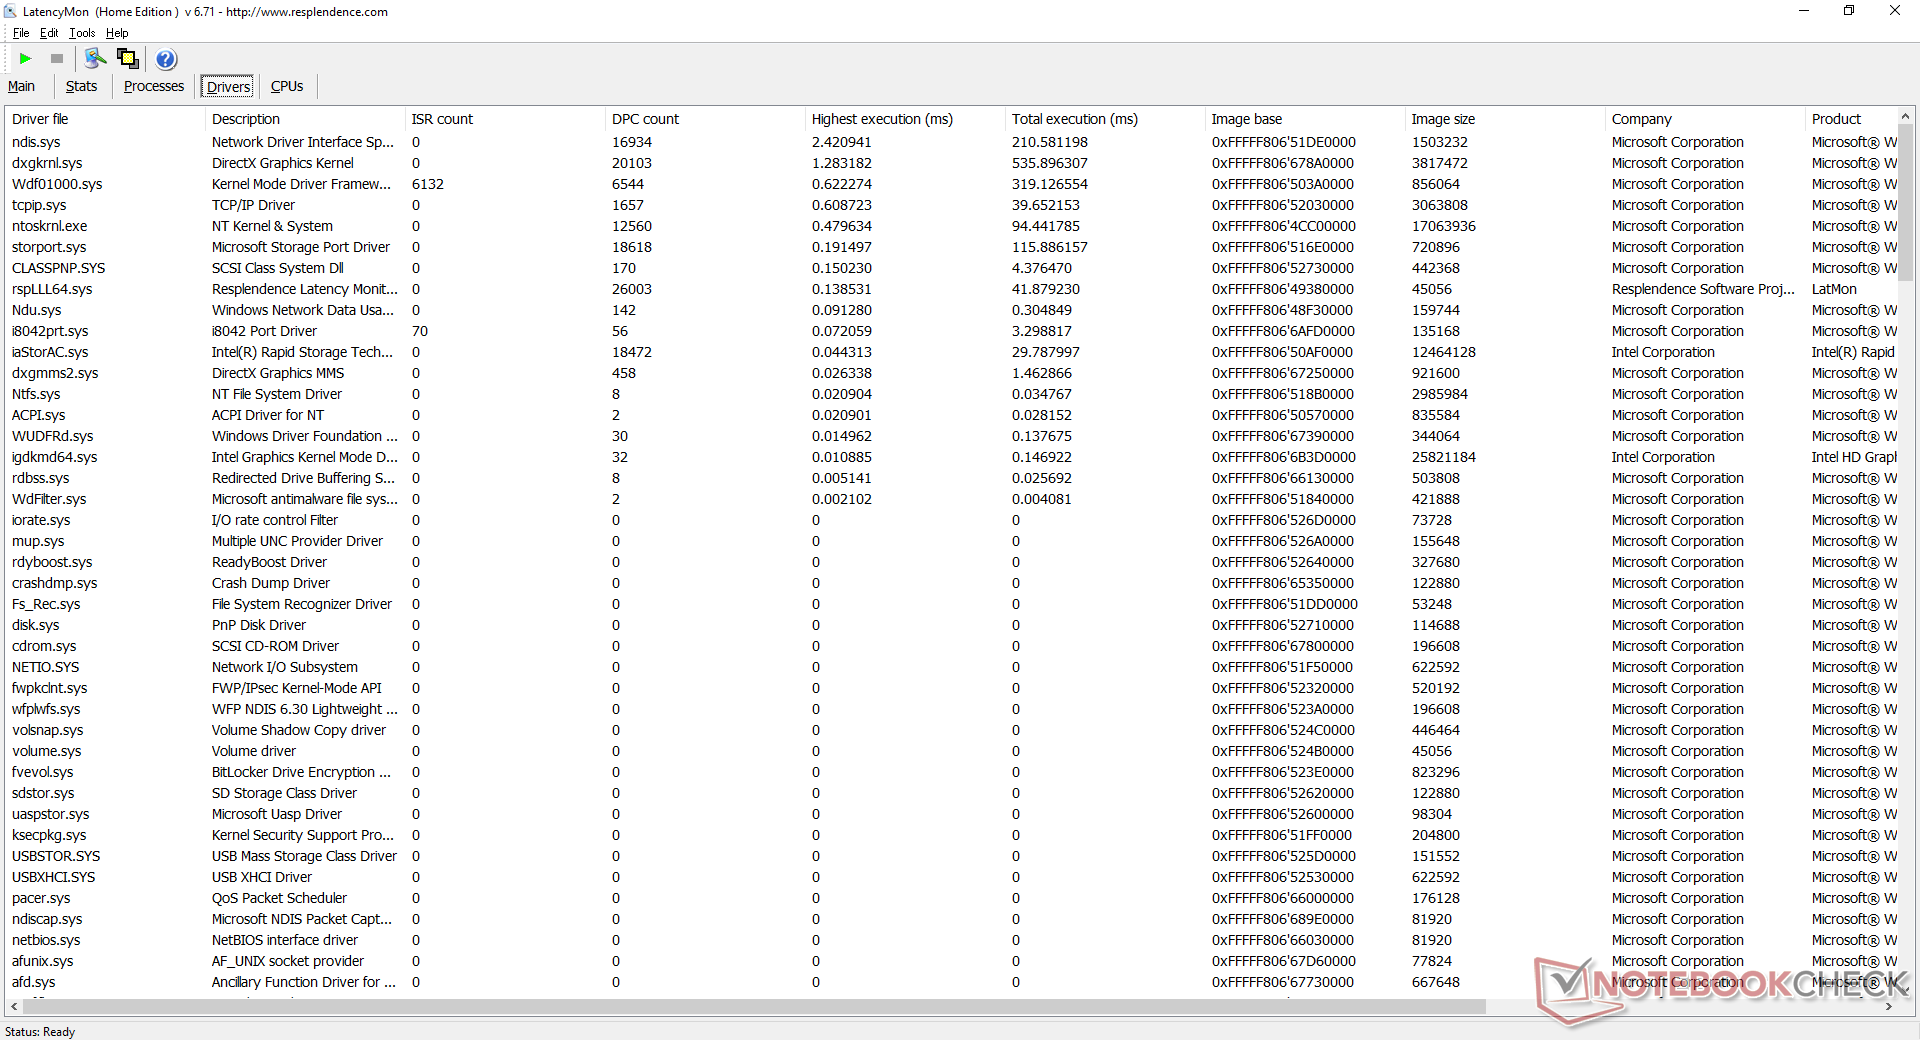
LatencyMon reveals DPC latency issues related to network drivers. 4K UHD video playback on YouTube is smooth but not perfect as we were able to record 8 dropped frames during our minute-long test video.
| DPC Latencies / LatencyMon - interrupt to process latency (max), Web, Youtube, Prime95 | |
| Dell XPS 15 9500 Core i7 4K UHD | |
| HP ProBook 450 G7 8WC04UT | |
| Acer TravelMate P215-52 | |
| HP 470 G7 8VU24EA | |
| Lenovo ThinkPad T14s-20T00044GE | |
| HP ProBook 455 G7-175W8EA | |
| HP ProBook 445 G7 175W4EA | |
| Acer Swift 3 SF314-42-R27B | |
| HP 15s-fq1440ng | |
| Lenovo IdeaPad 3 14IIL05 | |
| Lenovo ThinkPad E14 Gen2-20T7S00W00 | |
* ... smaller is better
Storage Devices
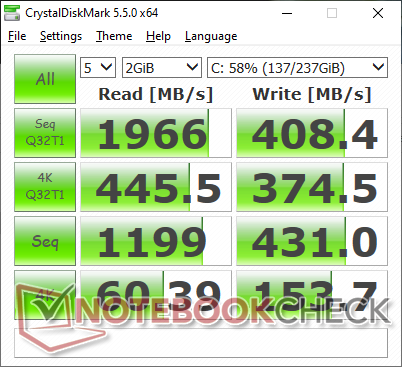
Though our test unit comes with a 256 GB SK Hynix NVMe SSD, users can configure up to 512 GB. Sequential write rates are slow at only around 350 MB/s to indicate a budget NVMe SSD whereas more expensive alternatives like the Samsung PM981a can reach over 2000 MB/s. Sequential read rates are still very fast at over 2000 MB/s, but it can take many read iterations before reaching such speeds as shown by our DiskSpd loop test below.
See our table of HDDs and SSDs for more technical information and benchmark comparisons.

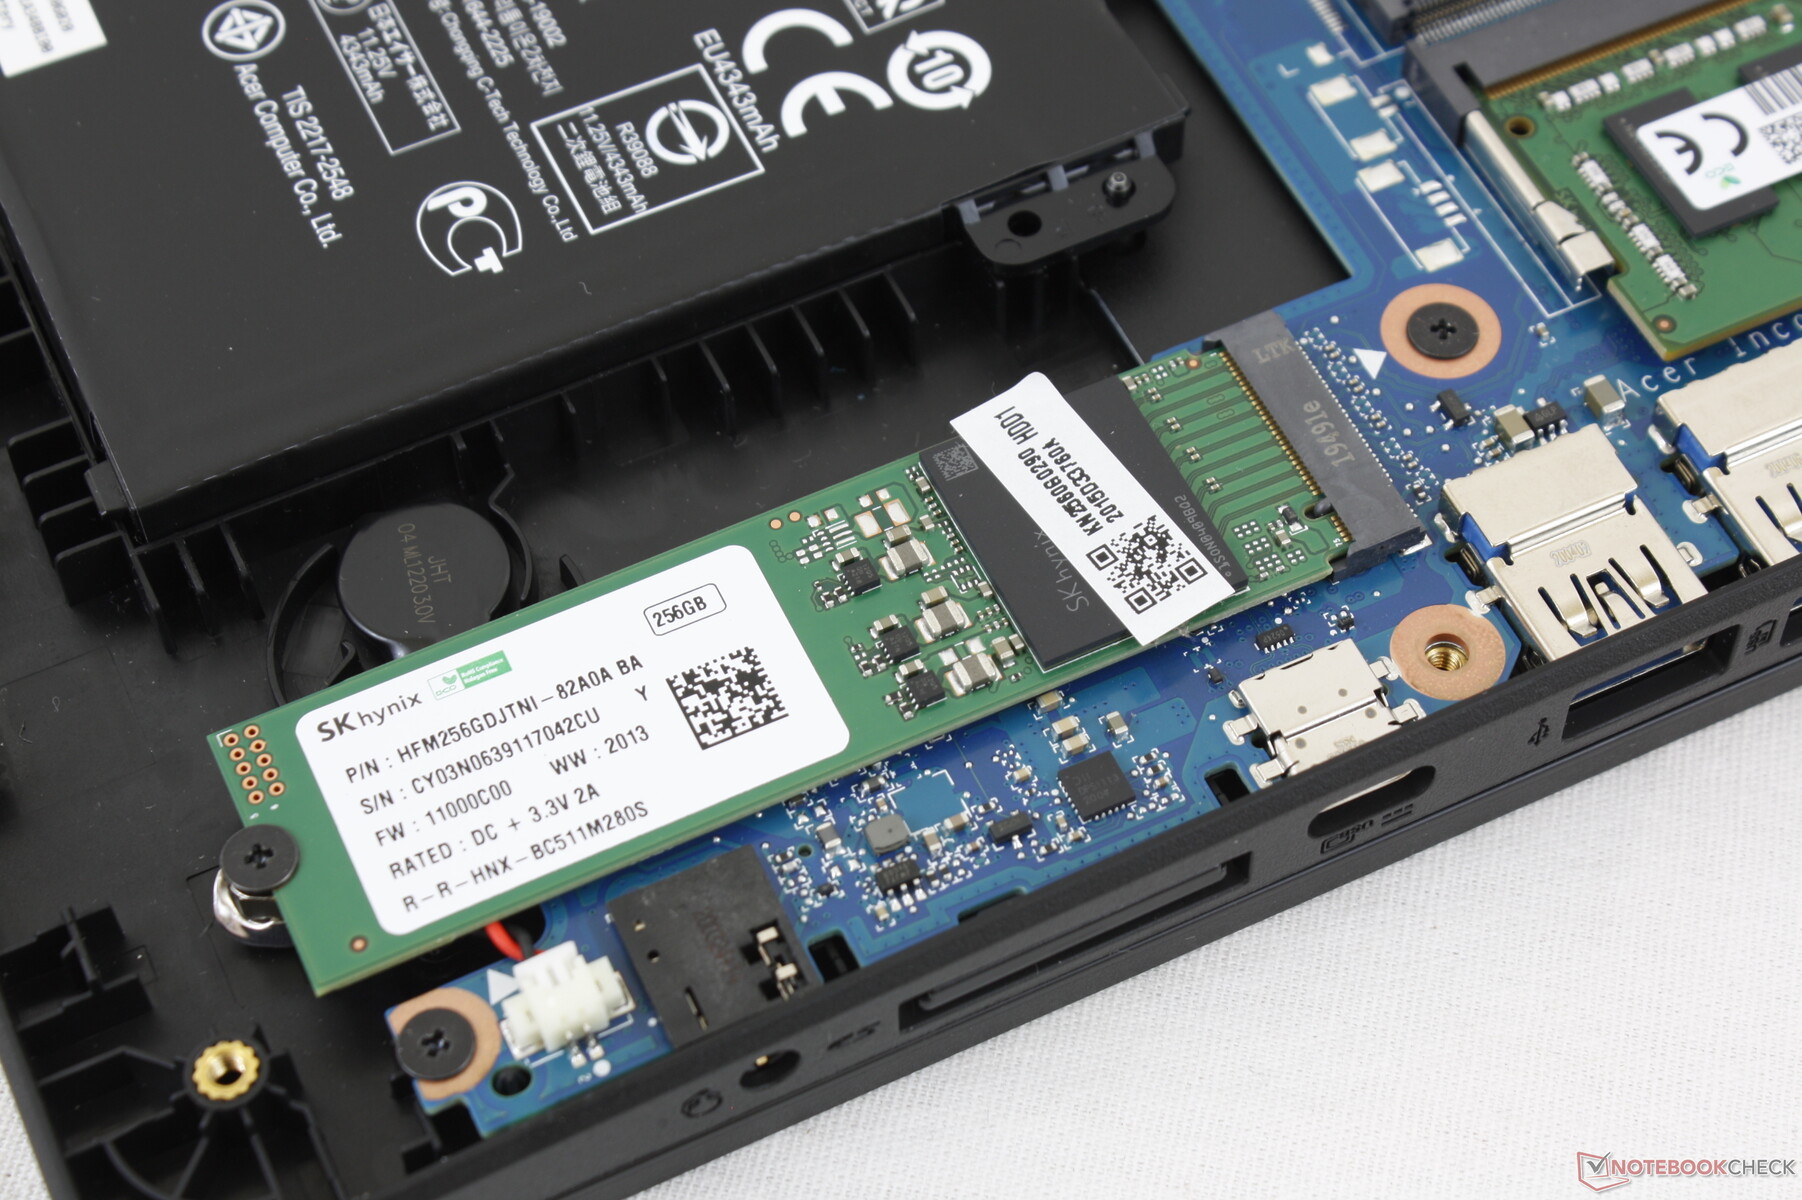
| Acer TravelMate P215-52 SK hynix BC511 HFM256GDJTNI-82A0 | HP ProBook 450 G7 8WC04UT Crucial P1 SSD CT1000P1SSD8 | Acer Extensa 15 EX215-51-56UX WDC PC SN520 SDAPNUW-512G | HP 15s-fq1556ng Intel SSD 660p SSDPEKNW512G8 | Lenovo ThinkPad L590-20Q70019GE Toshiba XG6 KXG6AZNV512G | Dell Latitude 15 3590 Samsung SSD PM871b MZ7LN256HAJQ | |
|---|---|---|---|---|---|---|
| AS SSD | 84% | 147% | 106% | 170% | 4% | |
| Seq Read (MB/s) | 1770 | 1155 -35% | 1542 -13% | 1705 -4% | 1383 -22% | 498.7 -72% |
| Seq Write (MB/s) | 354.5 | 984 178% | 1249 252% | 904 155% | 852 140% | 361.7 2% |
| 4K Read (MB/s) | 38.18 | 48.85 28% | 38.79 2% | 58.5 53% | 45.72 20% | 34.65 -9% |
| 4K Write (MB/s) | 95.9 | 96.6 1% | 89.3 -7% | 165.4 72% | 120.2 25% | 79.8 -17% |
| 4K-64 Read (MB/s) | 423.4 | 581 37% | 966 128% | 323.1 -24% | 1344 217% | 372.5 -12% |
| 4K-64 Write (MB/s) | 141.1 | 658 366% | 885 527% | 827 486% | 926 556% | 247.7 76% |
| Access Time Read * (ms) | 0.071 | 0.066 7% | 0.056 21% | 0.063 11% | 0.06 15% | |
| Access Time Write * (ms) | 0.117 | 0.207 -77% | 0.044 62% | 0.044 62% | 0.036 69% | 0.042 64% |
| Score Read (Points) | 639 | 745 17% | 1159 81% | 522 -18% | 1528 139% | 457 -28% |
| Score Write (Points) | 272 | 853 214% | 1099 304% | 1083 298% | 1132 316% | 364 34% |
| Score Total (Points) | 1178 | 1986 69% | 2842 141% | 1901 61% | 3420 190% | 1060 -10% |
| Copy ISO MB/s (MB/s) | 634 | 2635 316% | 894 41% | 1147 81% | ||
| Copy Program MB/s (MB/s) | 96.2 | 95.1 -1% | 304.9 217% | 419.8 336% | ||
| Copy Game MB/s (MB/s) | 228.9 | 361.9 58% | 642 180% | 928 305% | ||
| CrystalDiskMark 5.2 / 6 | 30% | 62% | 45% | 51% | -30% | |
| Write 4K (MB/s) | 153.7 | 111.1 -28% | 176.1 15% | 203.1 32% | 115.3 -25% | 79.5 -48% |
| Read 4K (MB/s) | 60.4 | 56.3 -7% | 50.4 -17% | 65.3 8% | 43.34 -28% | 32.72 -46% |
| Write Seq (MB/s) | 431 | 559 30% | 1457 238% | 973 126% | 1014 135% | 472.5 10% |
| Read Seq (MB/s) | 1199 | 1348 12% | 1424 19% | 1651 38% | 1481 24% | 504 -58% |
| Write 4K Q32T1 (MB/s) | 374.5 | 277.1 -26% | 381 2% | 526 40% | 495.4 32% | 322.6 -14% |
| Read 4K Q32T1 (MB/s) | 445.5 | 312.1 -30% | 436.5 -2% | 345.2 -23% | 332.6 -25% | 249.9 -44% |
| Write Seq Q32T1 (MB/s) | 408.4 | 1652 305% | 1455 256% | 980 140% | 1654 305% | 531 30% |
| Read Seq Q32T1 (MB/s) | 1966 | 1588 -19% | 1725 -12% | 1883 -4% | 1746 -11% | 544 -72% |
| Write 4K Q8T8 (MB/s) | 1033 | |||||
| Read 4K Q8T8 (MB/s) | 892 | |||||
| Total Average (Program / Settings) | 57% /
64% | 105% /
115% | 76% /
80% | 111% /
127% | -13% /
-10% |
* ... smaller is better

Disk Throttling: DiskSpd Read Loop, Queue Depth 8
GPU Performance
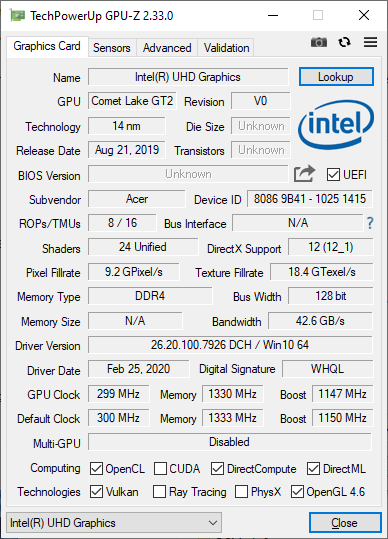
The integrated UHD Graphics 620 in our Acer is performing exactly where we expect it to be relative to other laptops in our database despite the slower-than-average CPU performance mentioned above. This ancient GPU is sufficient for 4K UHD video playback despite the fact that it is now handily outclassed by even the cheapest integrated Zen Radeon GPU in the market.
Upgrading to the GeForce MX230 configuration will bring roughly 100 to 125 percent faster graphics performance than the UHD Graphics 620.
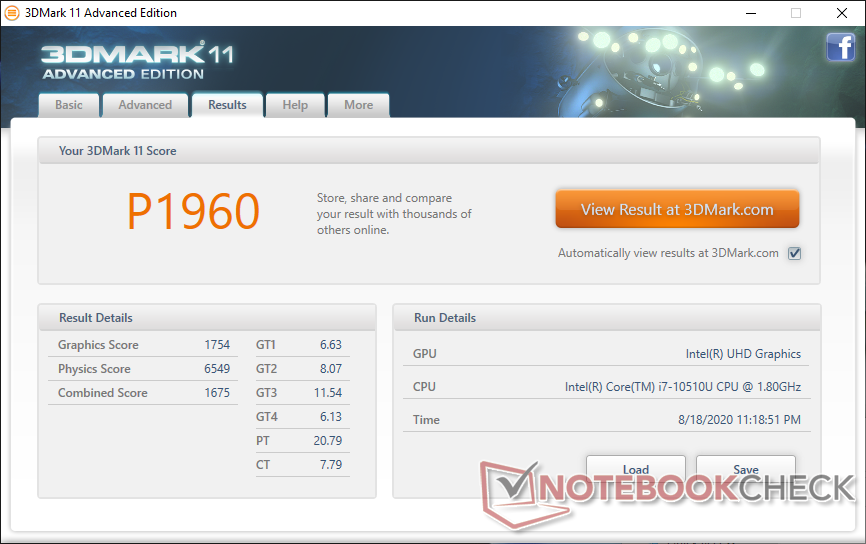
| 3DMark 11 Performance | 1960 points | |
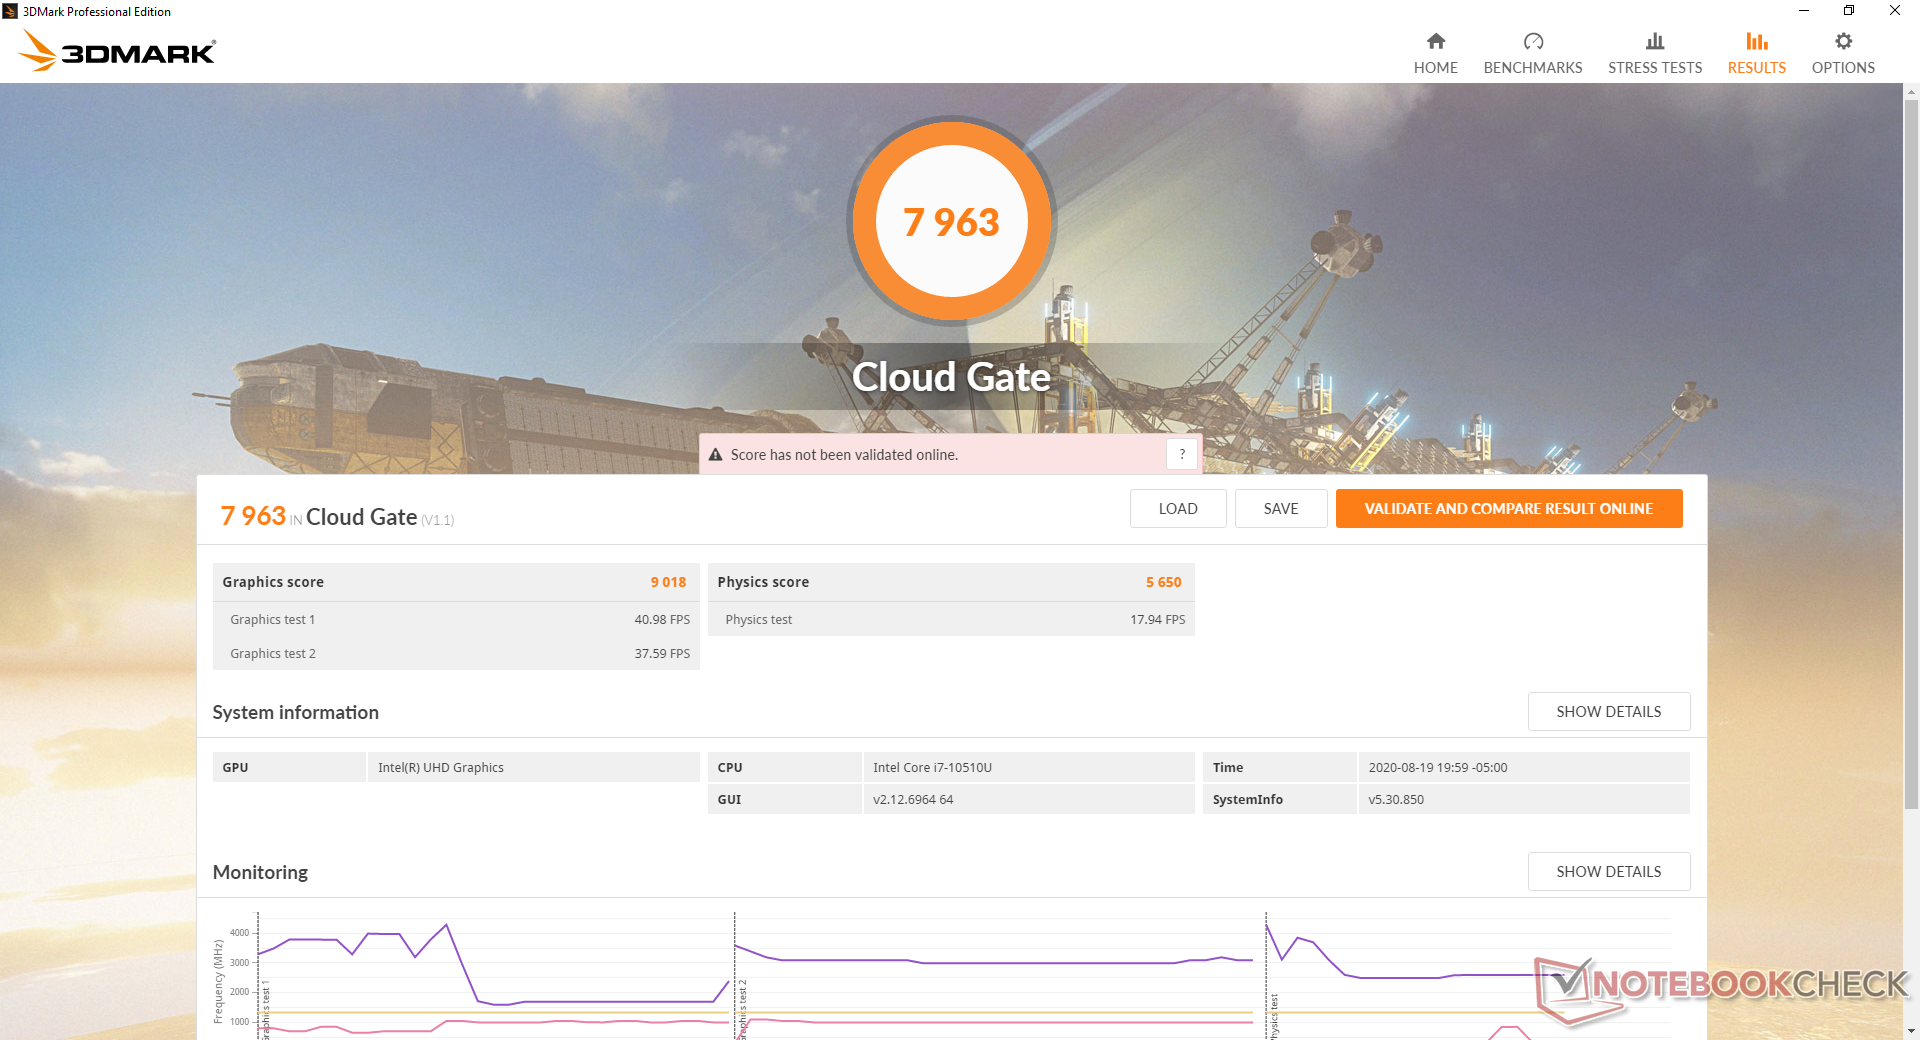
| 3DMark Cloud Gate Standard Score | 7963 points | |
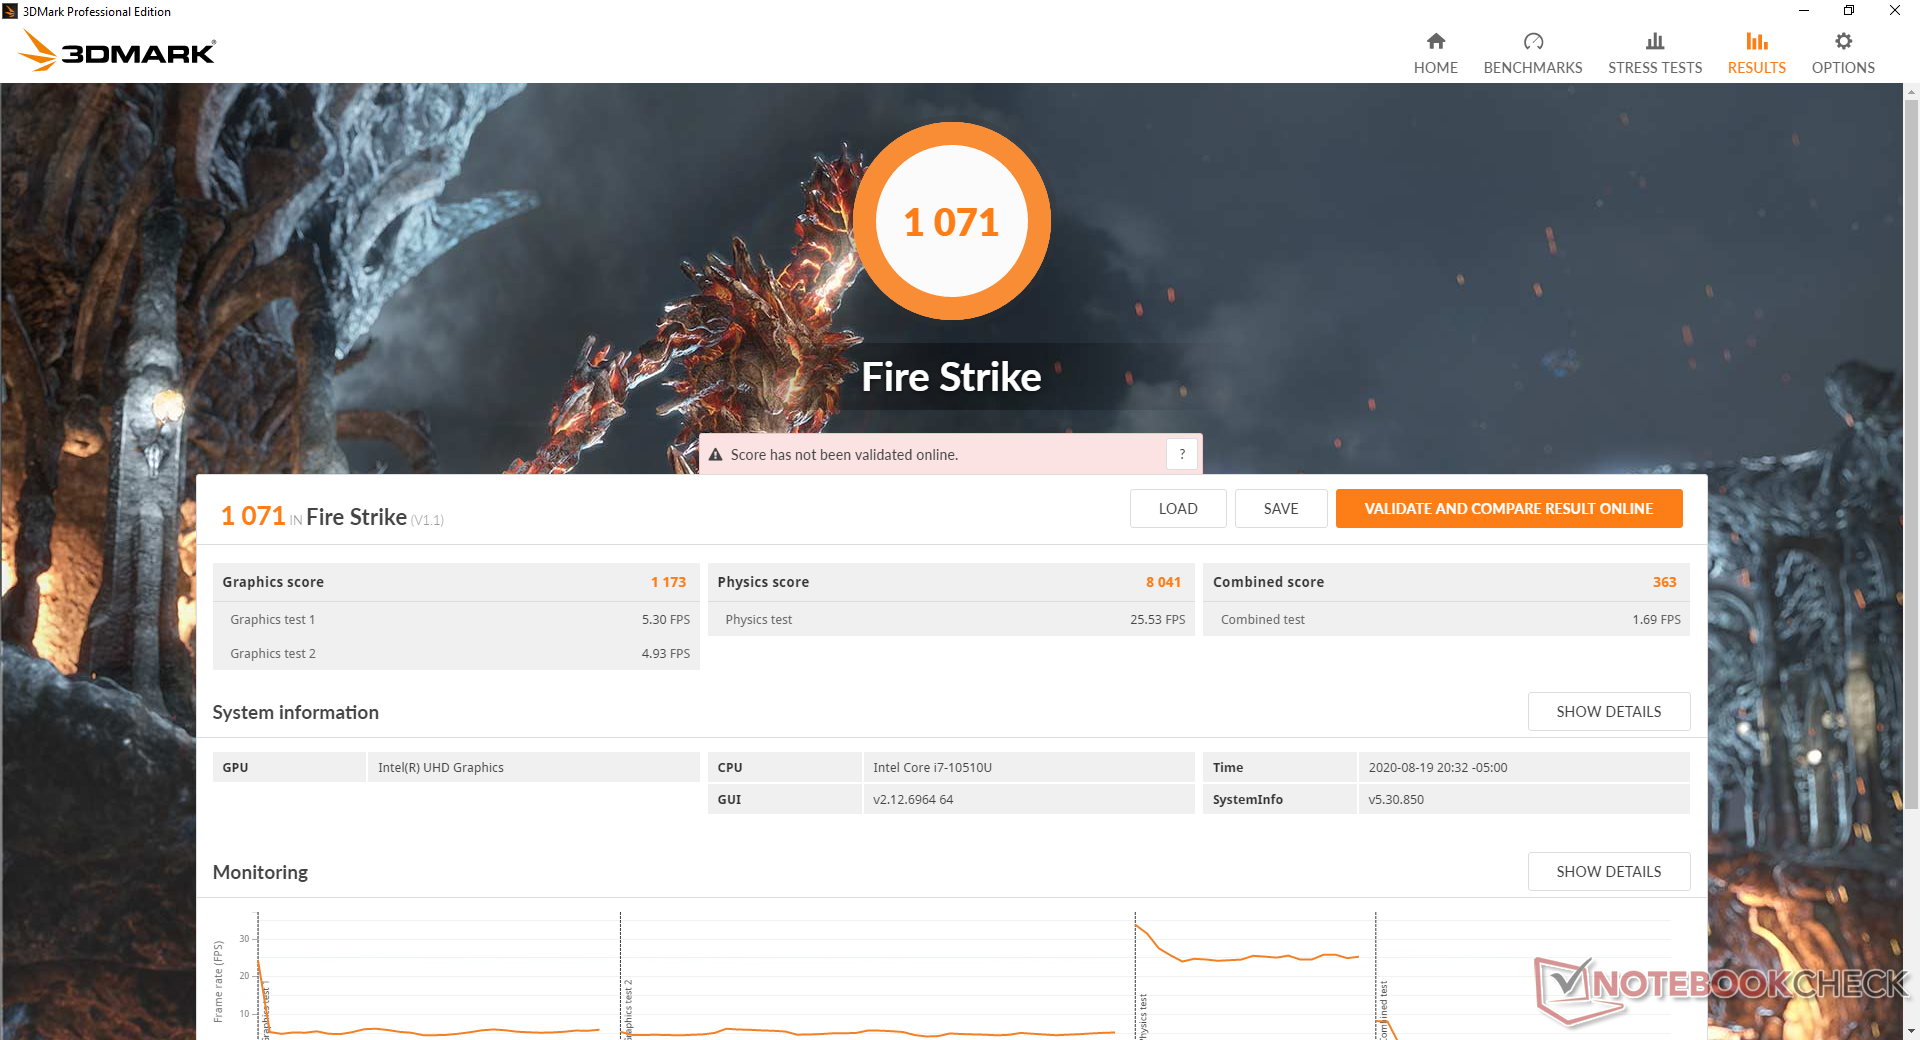
| 3DMark Fire Strike Score | 1071 points | |
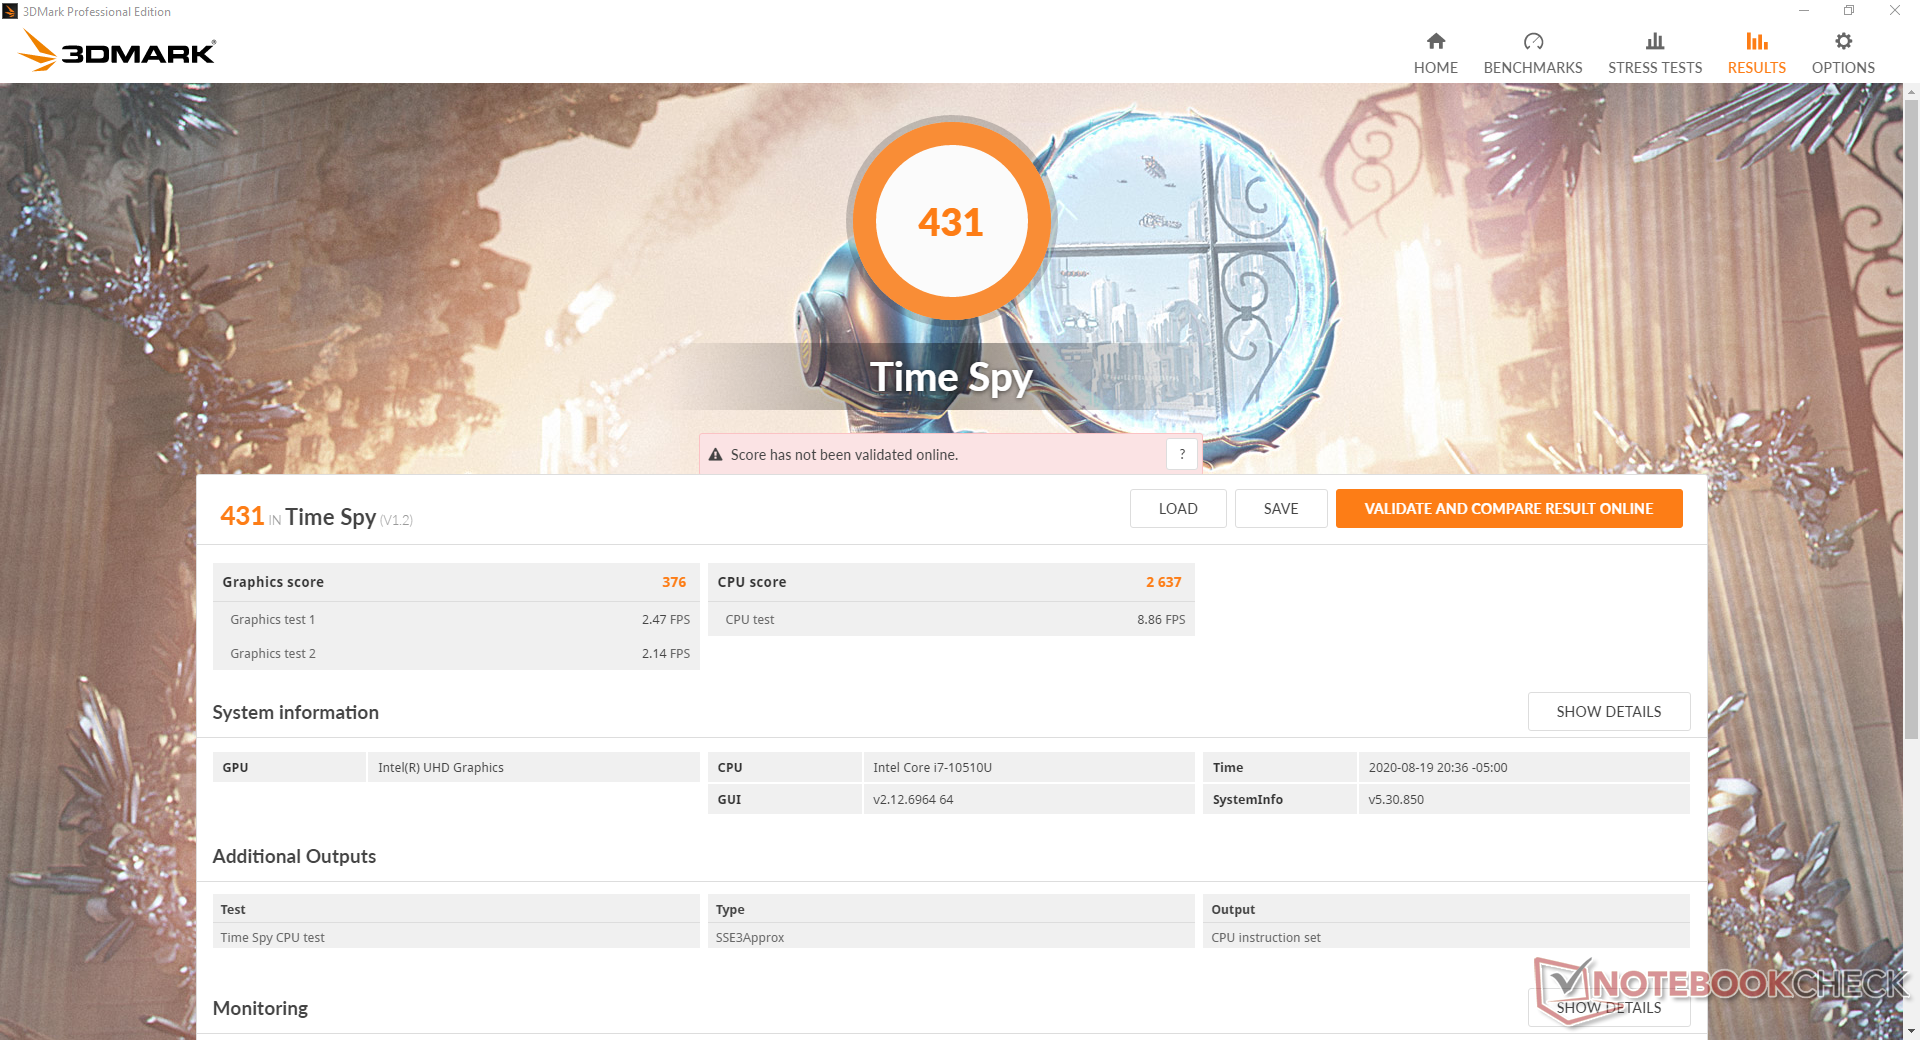
| 3DMark Time Spy Score | 431 points | |
Help | ||
| low | med. | high | ultra | |
|---|---|---|---|---|
| Dota 2 Reborn (2015) | 68 | 43 | 20.4 | 18.1 |
| X-Plane 11.11 (2018) | 21.4 | 14.5 | 13.1 |
Emissions
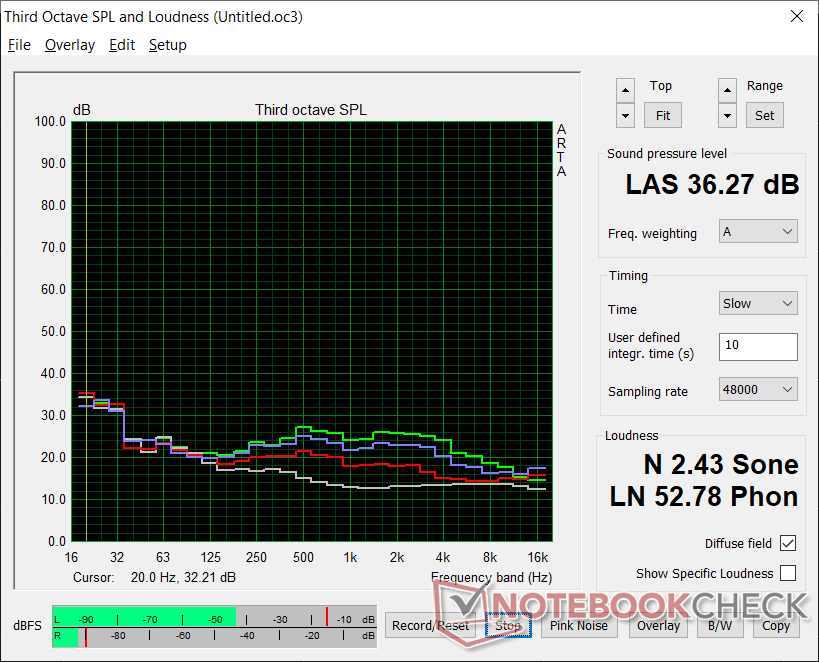
System Noise
Fan noise is at a minimum during everyday loads like browsing or video streaming. It's silent at best and only about 33 dB(A) at worst. Extreme loads like Prime95 will induce a maximum fan noise of just 36.3 dB(A). Note that this may change if configured with the discrete GeForce GPU since it will share the same heat pipe and fan as the CPU.
| Acer TravelMate P215-52 UHD Graphics 620, i7-10510U, SK hynix BC511 HFM256GDJTNI-82A0 | HP ProBook 450 G7 8WC04UT GeForce MX250, i7-10510U, Crucial P1 SSD CT1000P1SSD8 | Acer Extensa 15 EX215-51-56UX UHD Graphics 620, i5-10210U, WDC PC SN520 SDAPNUW-512G | HP 15s-fq1556ng UHD Graphics G1 (Ice Lake 32 EU), i5-1035G1, Intel SSD 660p SSDPEKNW512G8 | Lenovo ThinkPad L590-20Q70019GE UHD Graphics 620, i5-8265U, Toshiba XG6 KXG6AZNV512G | Dell Latitude 15 3590 UHD Graphics 620, i5-8250U, Samsung SSD PM871b MZ7LN256HAJQ | |
|---|---|---|---|---|---|---|
| Noise | -8% | -10% | -15% | -5% | -18% | |
| off / environment * (dB) | 25.7 | 26.2 -2% | 30.3 -18% | 30.3 -18% | 29 -13% | 30.6 -19% |
| Idle Minimum * (dB) | 25.7 | 26.2 -2% | 30.3 -18% | 30.3 -18% | 29 -13% | 30.6 -19% |
| Idle Average * (dB) | 25.7 | 26.2 -2% | 30.3 -18% | 30.3 -18% | 29 -13% | 31.9 -24% |
| Idle Maximum * (dB) | 25.7 | 26.2 -2% | 30.3 -18% | 30.3 -18% | 29 -13% | 31.9 -24% |
| Load Average * (dB) | 33.8 | 38.1 -13% | 32.7 3% | 34 -1% | 29 14% | 39 -15% |
| Load Maximum * (dB) | 36.3 | 47 -29% | 32.8 10% | 41.3 -14% | 33.8 7% | 39.1 -8% |
| Witcher 3 ultra * (dB) | 37.5 |
* ... smaller is better
Noise level
| Idle |
| 25.7 / 25.7 / 25.7 dB(A) |
| Load |
| 33.8 / 36.3 dB(A) |
 | ||
30 dB silent 40 dB(A) audible 50 dB(A) loud |
||
min: | ||
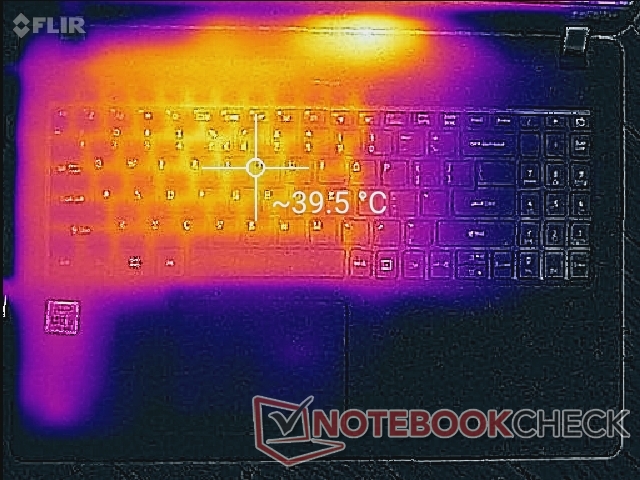
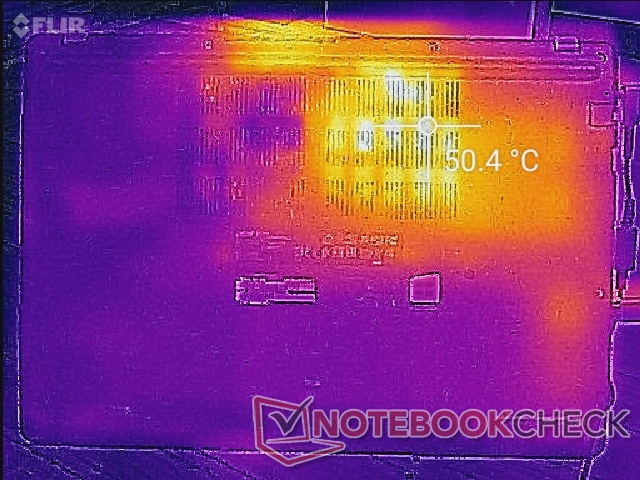
Temperature
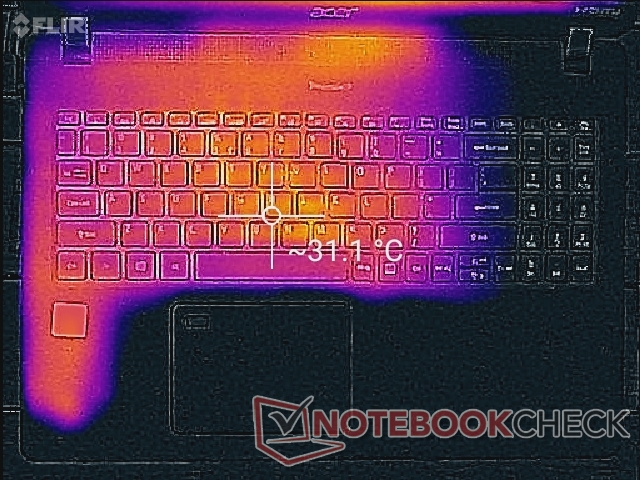
The left half of the laptop will always be warmer than the right half due to how the motherboard components are positioned inside. The keyboard center can become as warm as 40 C when under high loads compared to 44 C on the more powerful HP ProBook 450 G7. It never becomes uncomfortable to type on since the palm rests remain cool no matter the load.
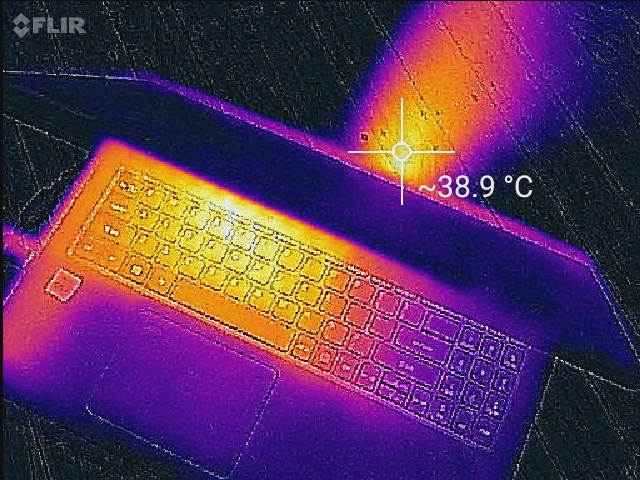
(-) The maximum temperature on the upper side is 49 °C / 120 F, compared to the average of 34.3 °C / 94 F, ranging from 21.2 to 62.5 °C for the class Office.
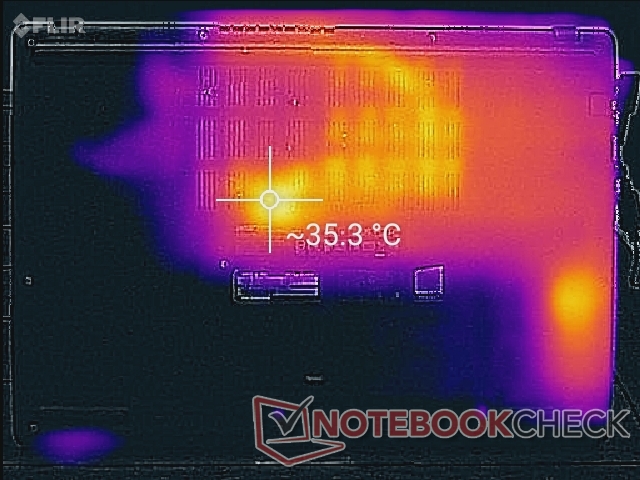
(±) The bottom heats up to a maximum of 41.2 °C / 106 F, compared to the average of 36.8 °C / 98 F
(+) In idle usage, the average temperature for the upper side is 29.6 °C / 85 F, compared to the device average of 29.5 °C / 85 F.
(+) The palmrests and touchpad are reaching skin temperature as a maximum (32 °C / 89.6 F) and are therefore not hot.
(-) The average temperature of the palmrest area of similar devices was 27.5 °C / 81.5 F (-4.5 °C / -8.1 F).
Stress Test
We stress the system with synthetic loads to identify for any potential throttling issues. When running Prime95, the CPU would boost to 3.1 GHz for about 15 seconds until hitting a core temperature of 90 C. Clock rates and temperature would then fall and stabilize at 2.1 to 2.2 GHz and 73 C, respectively. This behavior matches our power consumption observations in the section below.
Running on batteries will not limit performance. A Fire Strike run on battery power would return almost identical Physics and Graphics scores as the same test on mains.
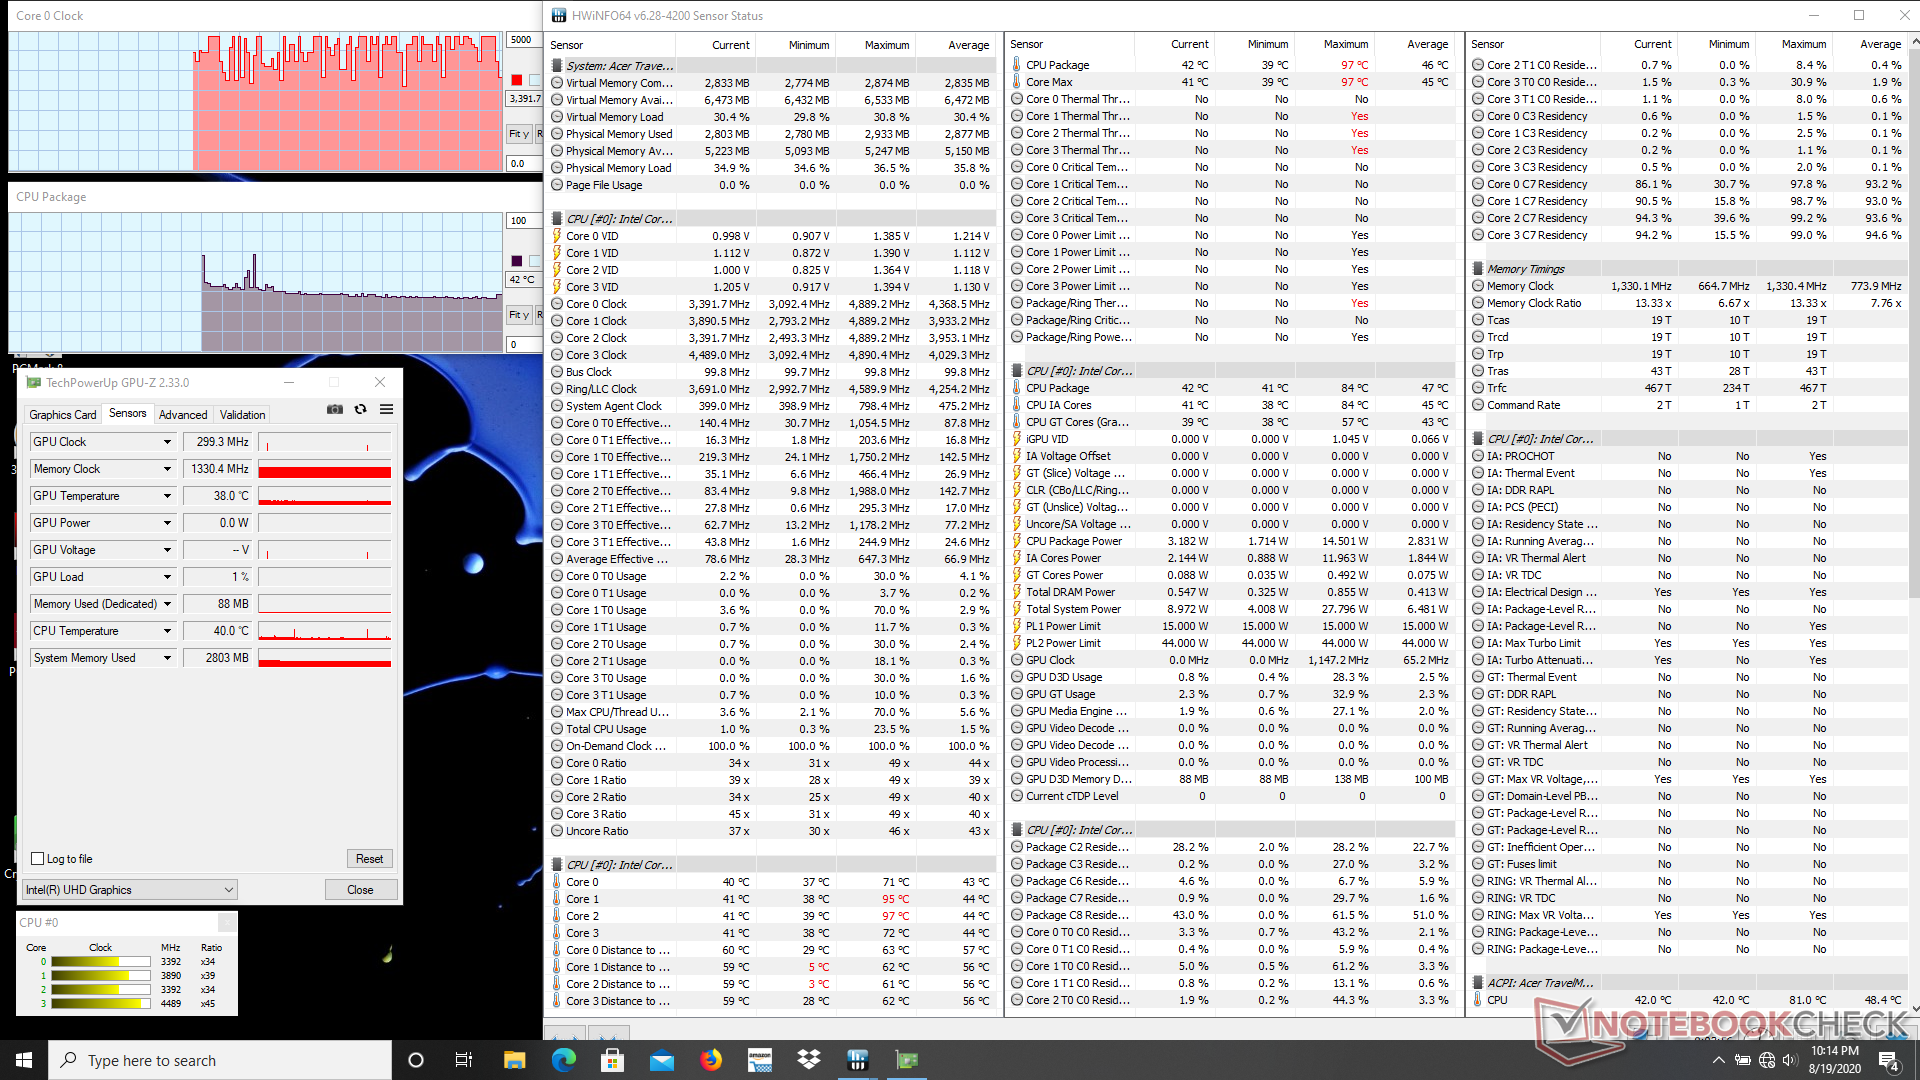
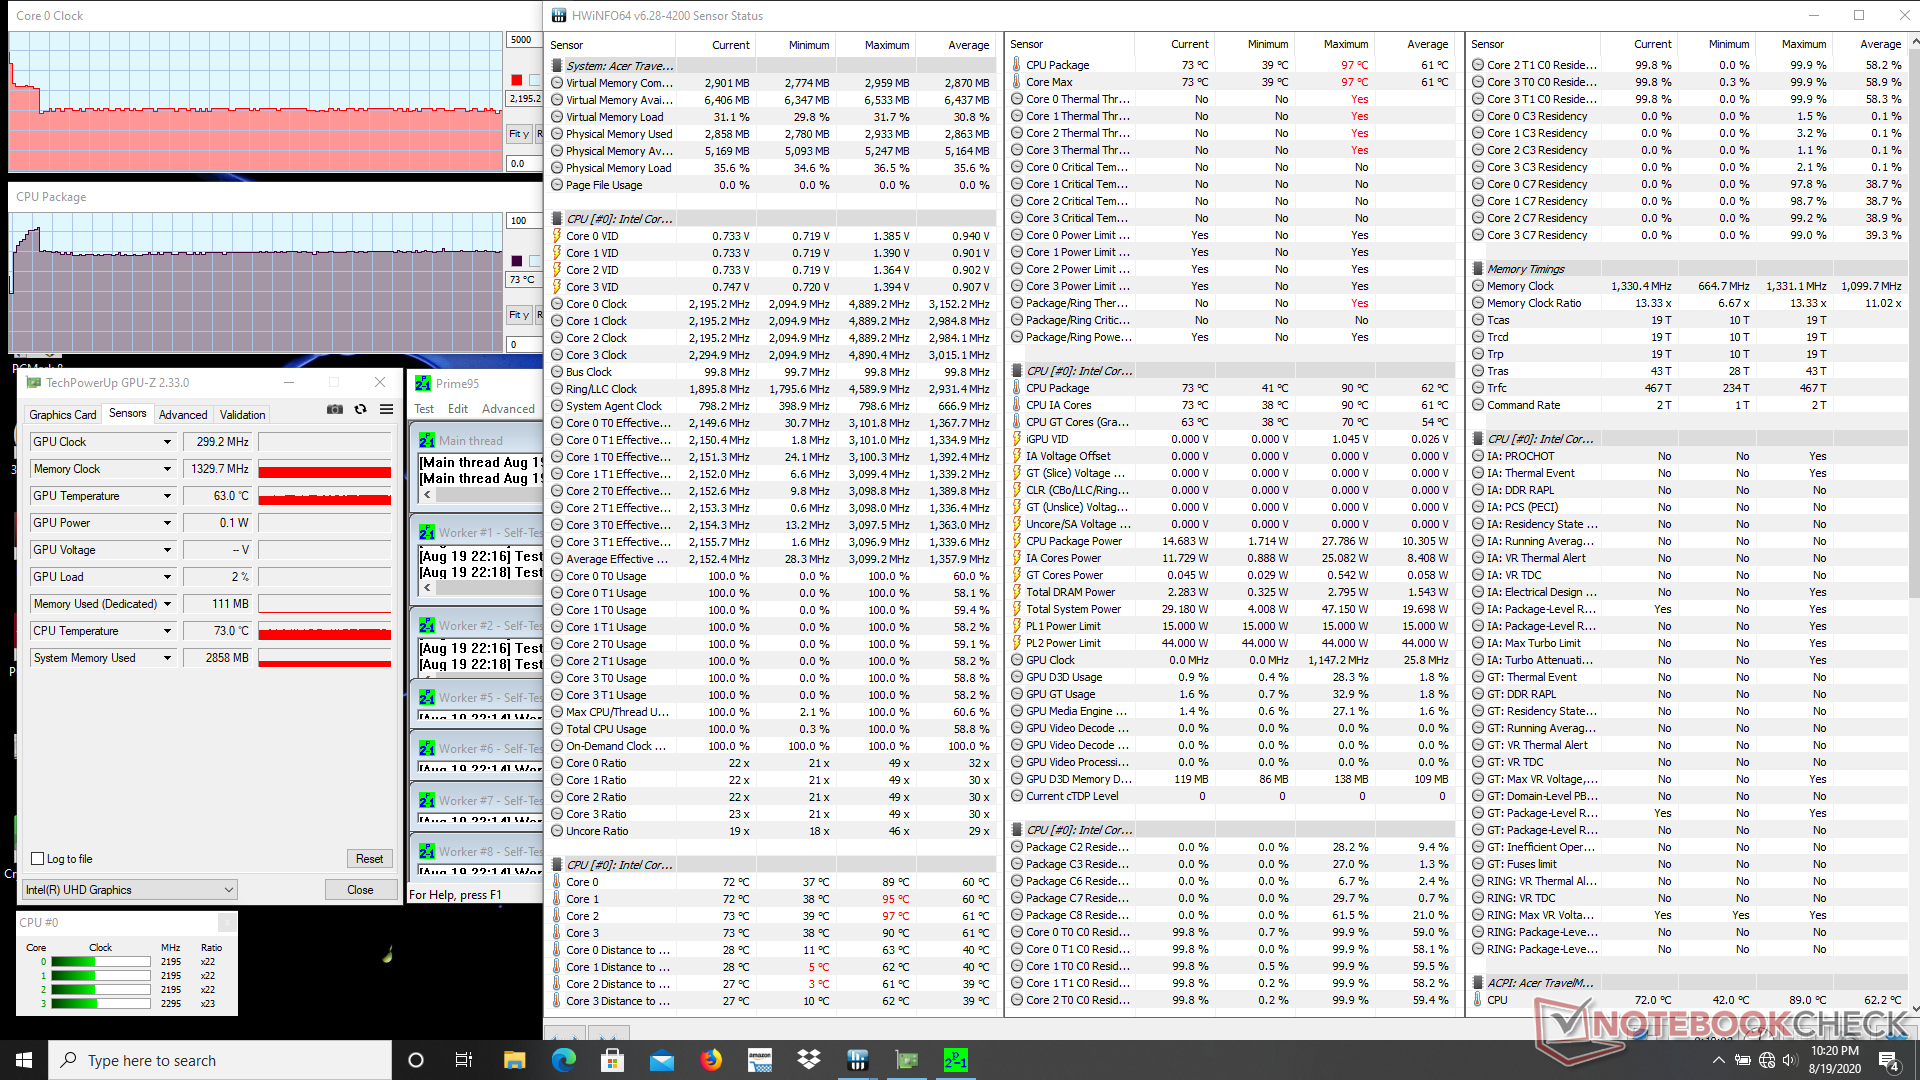
| CPU Clock (GHz) | GPU Clock (MHz) | Average CPU Temperature (°C) | |
| System Idle | -- | -- | 41 |
| Prime95 Stress | 2.1 - 2.2 | -- | 73 |
| Prime95 + FurMark Stress | 0.8 - 0.9 | 748 | 68 |
Speakers


Acer TravelMate P215-52 audio analysis
(±) | speaker loudness is average but good (75 dB)
Bass 100 - 315 Hz
(-) | nearly no bass - on average 27.6% lower than median
(-) | bass is not linear (15% delta to prev. frequency)
Mids 400 - 2000 Hz
(+) | balanced mids - only 3.4% away from median
(+) | mids are linear (5.2% delta to prev. frequency)
Highs 2 - 16 kHz
(+) | balanced highs - only 2.9% away from median
(+) | highs are linear (4.5% delta to prev. frequency)
Overall 100 - 16.000 Hz
(±) | linearity of overall sound is average (25.8% difference to median)
Compared to same class
» 78% of all tested devices in this class were better, 7% similar, 15% worse
» The best had a delta of 7%, average was 21%, worst was 53%
Compared to all devices tested
» 79% of all tested devices were better, 4% similar, 17% worse
» The best had a delta of 4%, average was 24%, worst was 134%
Apple MacBook 12 (Early 2016) 1.1 GHz audio analysis
(+) | speakers can play relatively loud (83.6 dB)
Bass 100 - 315 Hz
(±) | reduced bass - on average 11.3% lower than median
(±) | linearity of bass is average (14.2% delta to prev. frequency)
Mids 400 - 2000 Hz
(+) | balanced mids - only 2.4% away from median
(+) | mids are linear (5.5% delta to prev. frequency)
Highs 2 - 16 kHz
(+) | balanced highs - only 2% away from median
(+) | highs are linear (4.5% delta to prev. frequency)
Overall 100 - 16.000 Hz
(+) | overall sound is linear (10.2% difference to median)
Compared to same class
» 7% of all tested devices in this class were better, 2% similar, 91% worse
» The best had a delta of 5%, average was 18%, worst was 53%
Compared to all devices tested
» 5% of all tested devices were better, 1% similar, 94% worse
» The best had a delta of 4%, average was 24%, worst was 134%
Energy Management
Power Consumption
Laptops running on Intel Comet Lake-U are generally very power efficient and this remains true on the TravelMate P2. Running 3DMark 06, for example, consumes an average of 31 W compared to 44 W on the Lenovo ThinkPad E15 powered by the faster Ryzen 7 4700U.
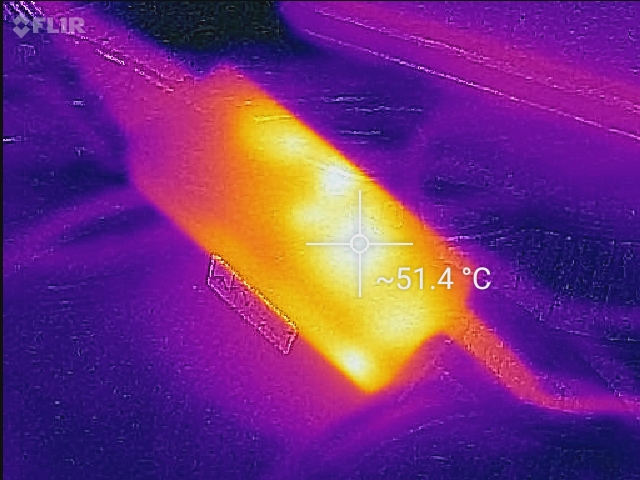
We're able to measure a maximum consumption of 43.3 W from the small (~9.5 x 4 x 2.7 cm) 45 W AC adapter. This rate is only temporary as shown by our graphs below since maximum Turbo Boost clock rates are not sustainable on this machine.
| Off / Standby | |
| Idle | |
| Load |
|
Key:
min: | |
| Acer TravelMate P215-52 i7-10510U, UHD Graphics 620, SK hynix BC511 HFM256GDJTNI-82A0, IPS, 1920x1080, 15.6" | HP ProBook 450 G7 8WC04UT i7-10510U, GeForce MX250, Crucial P1 SSD CT1000P1SSD8, IPS, 1920x1080, 15.6" | HP 15s-fq1556ng i5-1035G1, UHD Graphics G1 (Ice Lake 32 EU), Intel SSD 660p SSDPEKNW512G8, IPS, 1920x1080, 15.6" | Lenovo ThinkPad L590-20Q70019GE i5-8265U, UHD Graphics 620, Toshiba XG6 KXG6AZNV512G, IPS, 1920x1080, 15.6" | Dell Latitude 15 3590 i5-8250U, UHD Graphics 620, Samsung SSD PM871b MZ7LN256HAJQ, TN LED, 1920x1080, 15.6" | Lenovo ThinkPad E15 20RD0011GE i7-10510U, Radeon RX 640, Samsung PM991 MZALQ512HALU, IPS LED, 1920x1080, 15.6" | |
|---|---|---|---|---|---|---|
| Power Consumption | -61% | 1% | -14% | -12% | -27% | |
| Idle Minimum * (Watt) | 3.5 | 4.8 -37% | 3.3 6% | 3.96 -13% | 4.3 -23% | 3.2 9% |
| Idle Average * (Watt) | 6.2 | 9.5 -53% | 6.4 -3% | 6.9 -11% | 7.2 -16% | 6.8 -10% |
| Idle Maximum * (Watt) | 6.9 | 10.7 -55% | 6.8 1% | 9.8 -42% | 9.8 -42% | 9.5 -38% |
| Load Average * (Watt) | 31 | 61.8 -99% | 29 6% | 31.4 -1% | 38 -23% | 44 -42% |
| Load Maximum * (Watt) | 43.3 | 69 -59% | 46 -6% | 45.4 -5% | 24 45% | 66.4 -53% |
| Witcher 3 ultra * (Watt) | 50 |
* ... smaller is better
Battery Life
Runtimes are respectable at almost 8 whole hours of real-world WLAN use from the relatively small 48 Wh internal battery pack. Recharging from empty to full capacity takes about 1.5 hours with the included AC adapter. The laptop can be recharged with generic USB-C power adapters as well.

| Acer TravelMate P215-52 i7-10510U, UHD Graphics 620, 48 Wh | HP ProBook 450 G7 8WC04UT i7-10510U, GeForce MX250, 45 Wh | Acer Extensa 15 EX215-51-56UX i5-10210U, UHD Graphics 620, 37 Wh | HP 15s-fq1556ng i5-1035G1, UHD Graphics G1 (Ice Lake 32 EU), 41 Wh | Lenovo ThinkPad L590-20Q70019GE i5-8265U, UHD Graphics 620, 45 Wh | Dell Latitude 15 3590 i5-8250U, UHD Graphics 620, 56 Wh | |
|---|---|---|---|---|---|---|
| Battery runtime | -15% | -21% | -28% | 2% | 4% | |
| Reader / Idle (h) | 25.1 | 14.8 -41% | 17.4 -31% | 13.1 -48% | 17.4 -31% | 20.2 -20% |
| WiFi v1.3 (h) | 7.9 | 7.2 -9% | 6.7 -15% | 6 -24% | 7.2 -9% | 9.1 15% |
| Load (h) | 1.9 | 2 5% | 1.6 -16% | 1.7 -11% | 2.8 47% | 2.2 16% |
Pros
Cons
Verdict
If you value having a lightweight business laptop with an integrated VGA port, then the relatively inexpensive TravelMate P2 TMP215 might be what you're looking for. It's a basic no-frills machine much like its predecessor but in a smaller and more portable chassis with plenty of ports.
However, the system is marred by a few drawbacks. PWM is present on almost all brightness levels and CPU performance is slower than expected. The NumPad keys are small and uncomfortable to use and some users may lament the removal of the dedicated mouse buttons. Though it's supposed to be a budget business laptop, we think these aspects could have been better without affecting the price of the model. The average display will turn off a lot of users who may also want to stream videos on their work laptops.
The Acer TravelMate P2 TMP215 is notable for being relatively lightweight and inexpensive while retaining a wide selection of ports. The competing HP ProBook 450 G7 leaves a better impression overall if you don't mind a slightly bigger and heavier system.
Acer TravelMate P215-52
- 08/21/2020 v7 (old)
Allen Ngo
Price comparison
