Office laptop HP 15s-fq1440ng in the test: hardware deceives - potential wasted
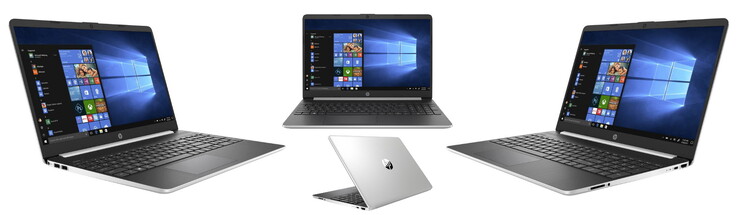
The HP 15 presents itself as a visually simple office laptop. Under the hood, however, lies a Core i7 processor of the Ice Lake architecture, including the most powerful integrated Intel Iris Plus GPU G7. This should result in more use cases for the HP 15s than just writing or surfing. Generous 16 GB RAM and a 512 GB SSD complete the package. In February we tested the first HP 15s with the tag "fq1556ng". In comparison, our current model has a stronger processor (i7 instead of i5) and thus also better internal graphics (Iris G7 instead of G1), but has a TN instead of an IPS panel. We use the sister model for comparison to see whether the processor really produces a performance difference or is just throttled. According to Intel, the Iris G7 graphics supposedly beats an AMD RX Vega 10 and catches up with the dedicated Geforce MX150, and the processor performance should correspond to a Core i7-8665U. Corresponding comparison devices in our test are listed in the table below.
Rating | Date | Model | Weight | Height | Size | Resolution | Price |
|---|---|---|---|---|---|---|---|
| 77.9 % v7 (old) | 06 / 2020 | HP 15s-fq1440ng i7-1065G7, Iris Plus Graphics G7 (Ice Lake 64 EU) | 1.6 kg | 17.9 mm | 15.60" | 1920x1080 | |
| 78.5 % v7 (old) | 02 / 2020 | HP 15s-fq1556ng i5-1035G1, UHD Graphics G1 (Ice Lake 32 EU) | 1.7 kg | 18 mm | 15.60" | 1920x1080 | |
| 83.9 % v7 (old) | 12 / 2019 | Microsoft Surface Laptop 3 15 i7-1065G7 i7-1065G7, Iris Plus Graphics G7 (Ice Lake 64 EU) | 1.5 kg | 14.7 mm | 15.00" | 2496x1664 | |
| 79.4 % v7 (old) | 03 / 2020 | Lenovo Ideapad S340-15IIL i7-1065G7, Iris Plus Graphics G7 (Ice Lake 64 EU) | 1.8 kg | 17.9 mm | 15.60" | 1920x1080 | |
| 79.7 % v6 (old) | 08 / 2019 | Dell Inspiron 15 5000 5585 R7 3700U, Vega 10 | 1.8 kg | 19.5 mm | 15.60" | 1920x1080 | |
| 82.8 % v6 (old) | 12 / 2018 | Dell Inspiron 15 7000 2-in-1 Black Edition i7-8565U, GeForce MX150 | 2.1 kg | 17 mm | 15.60" | 3840x2160 |
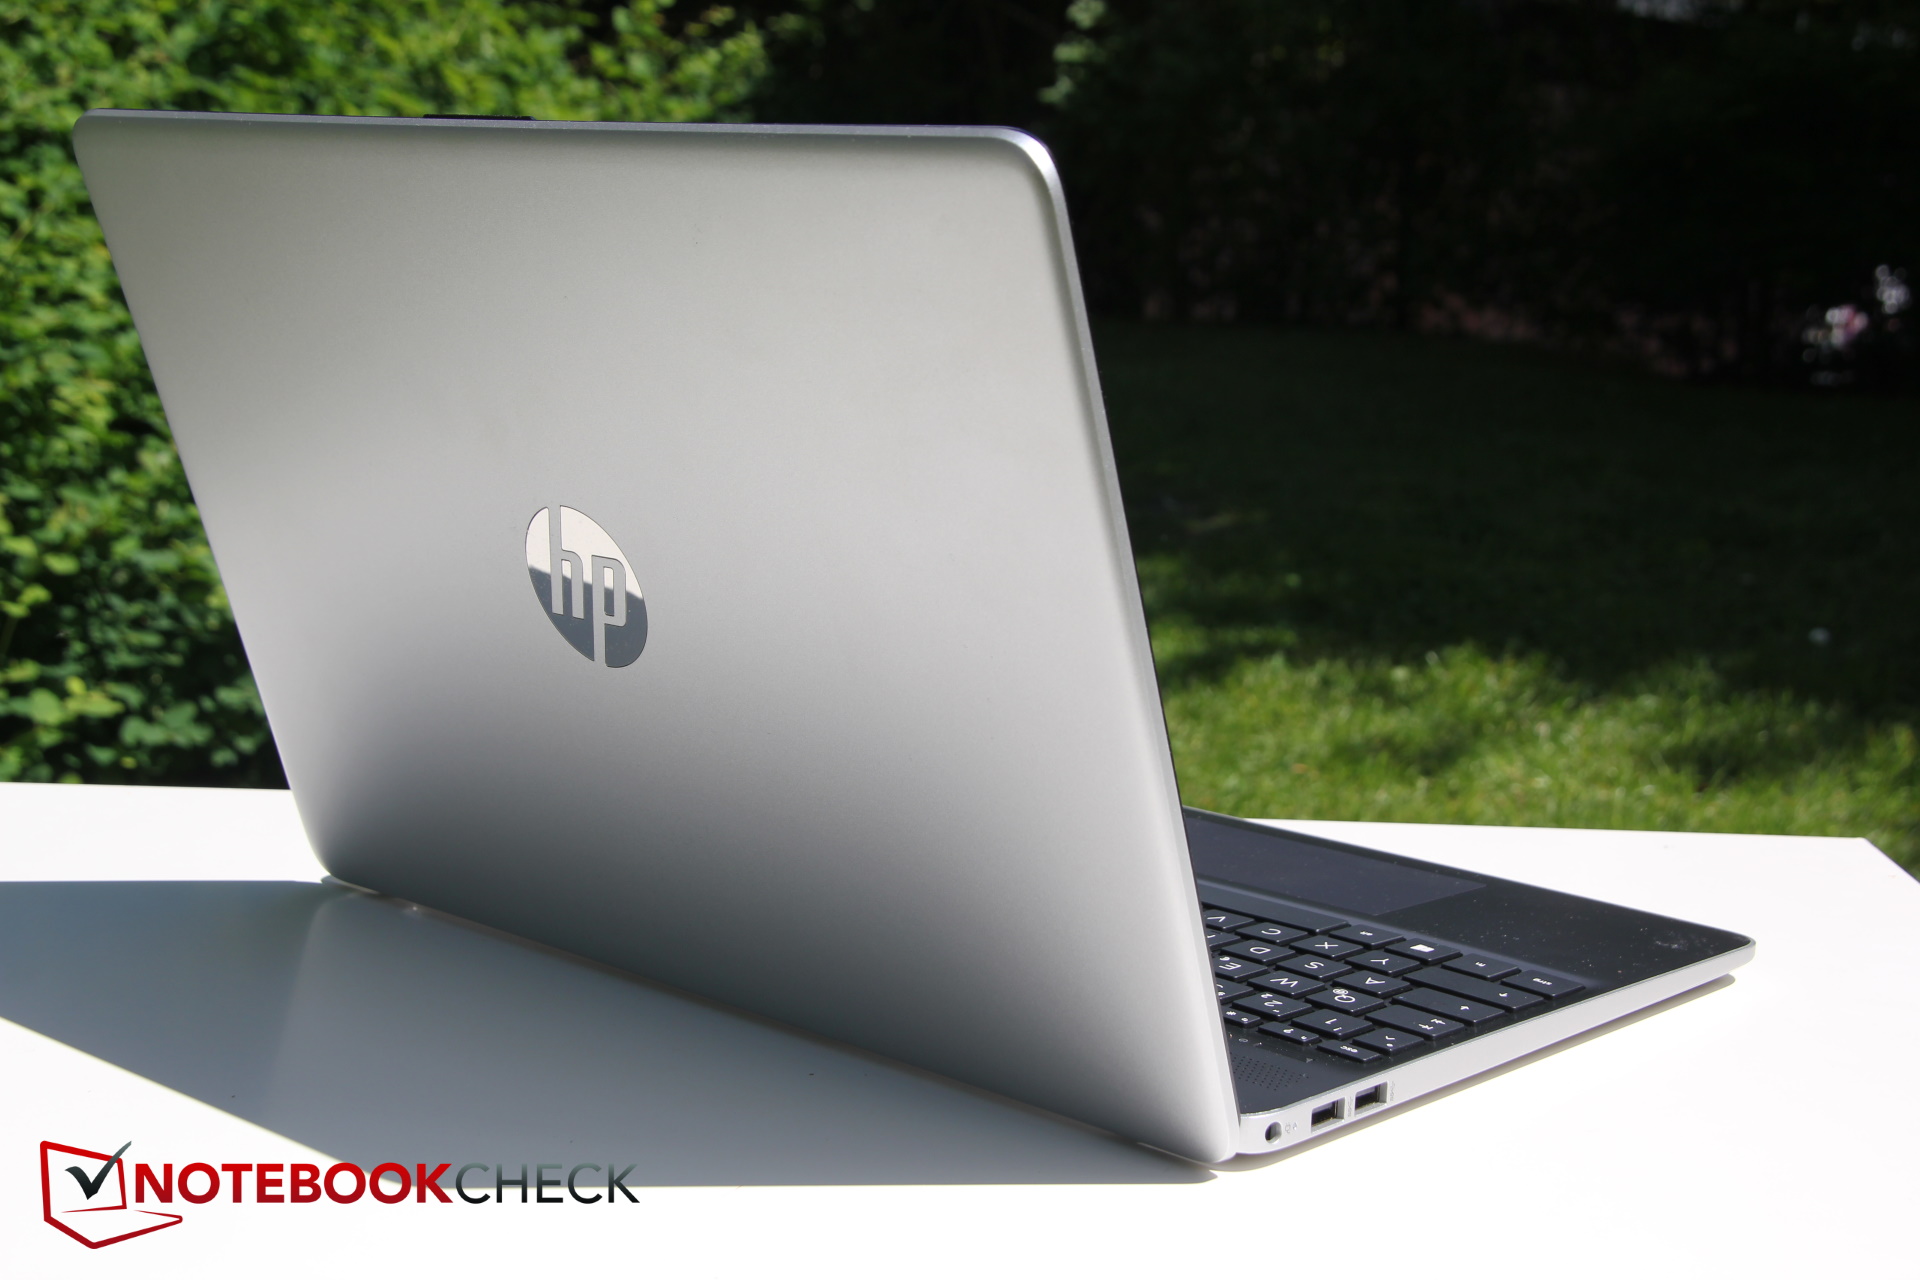
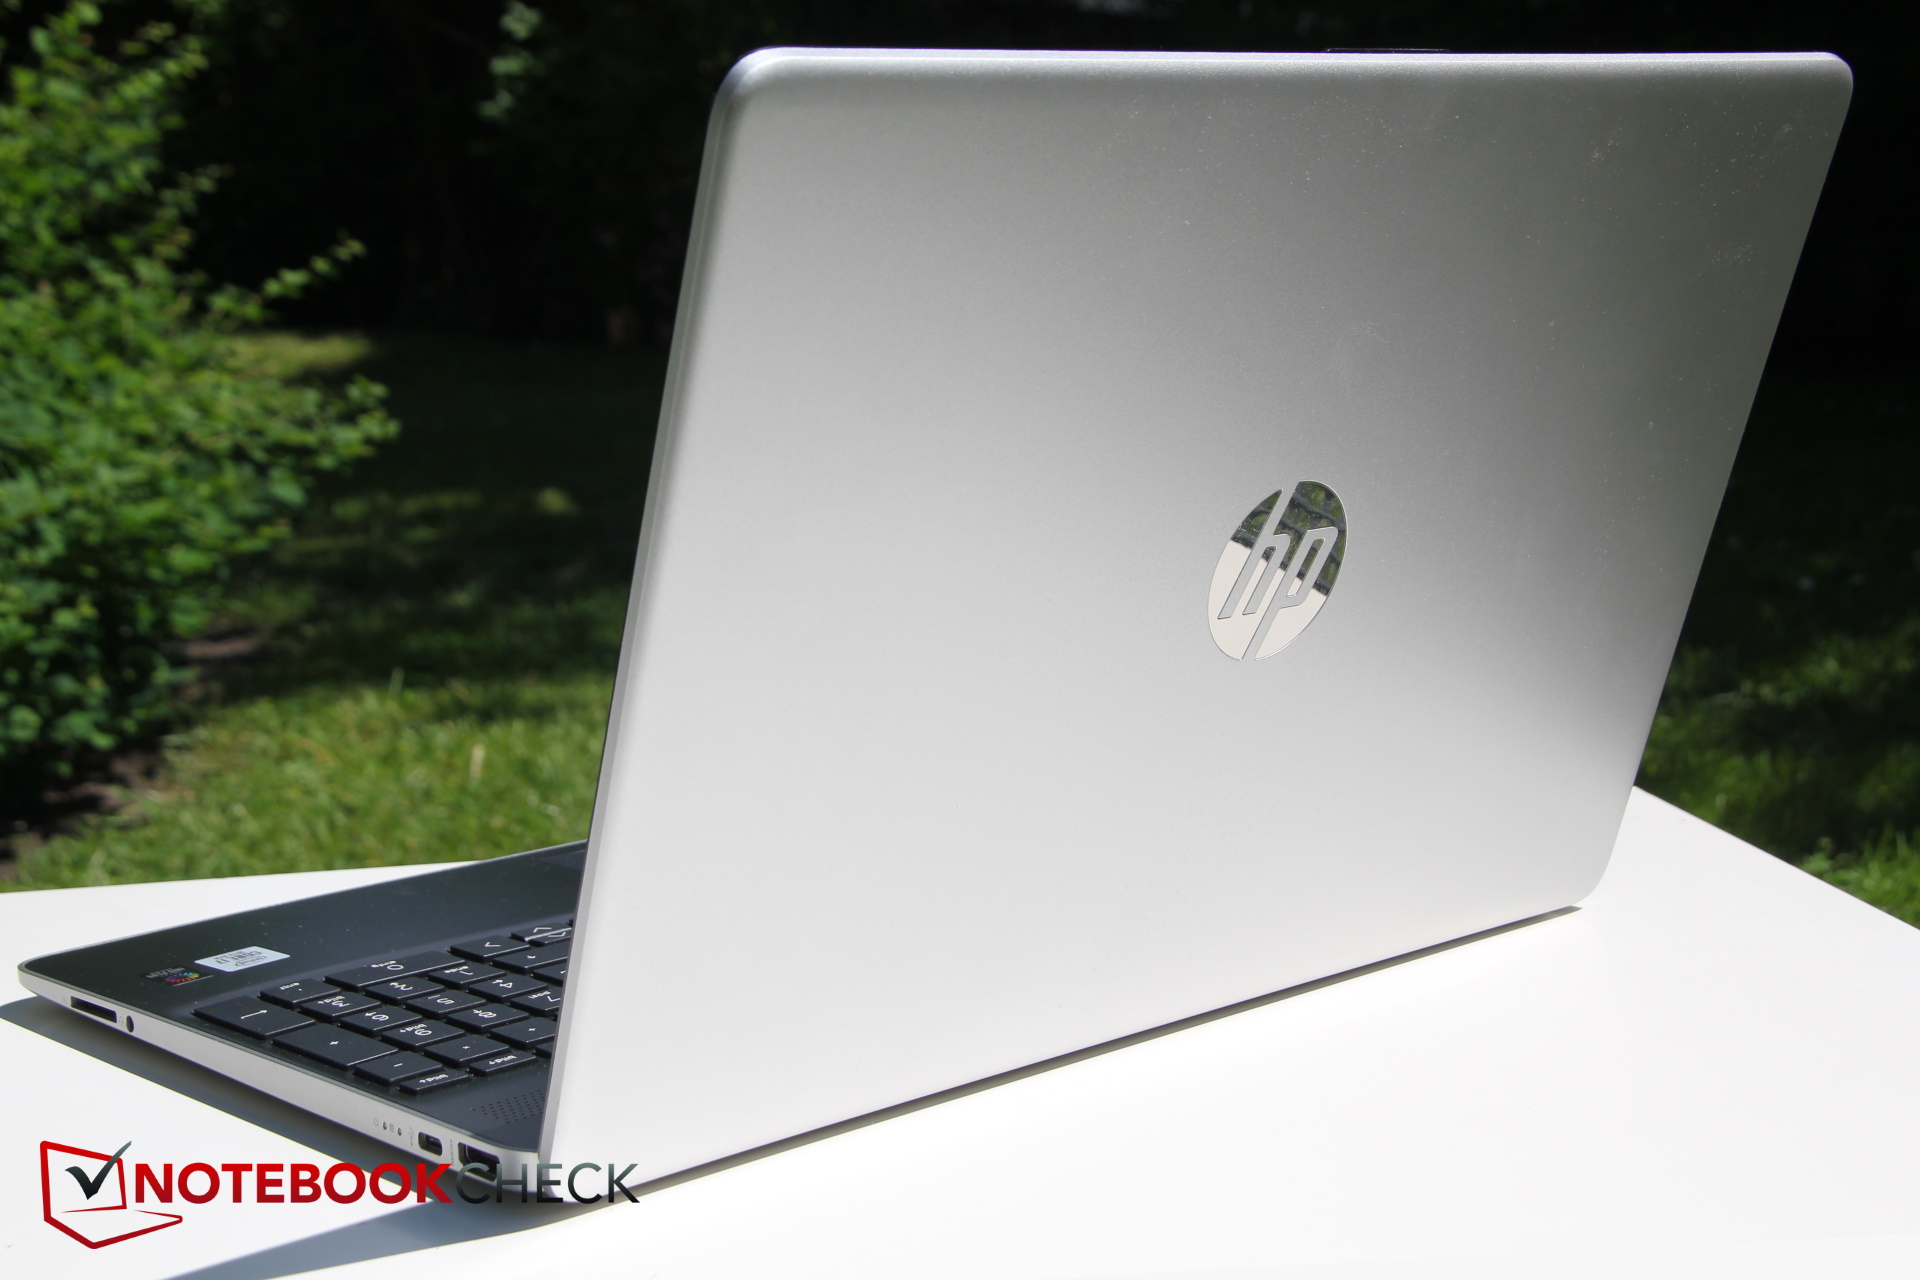
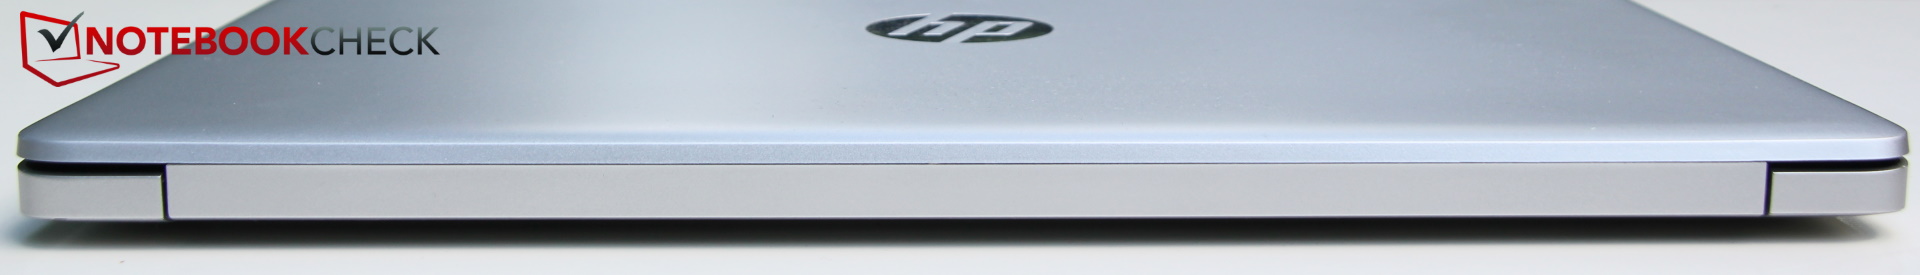
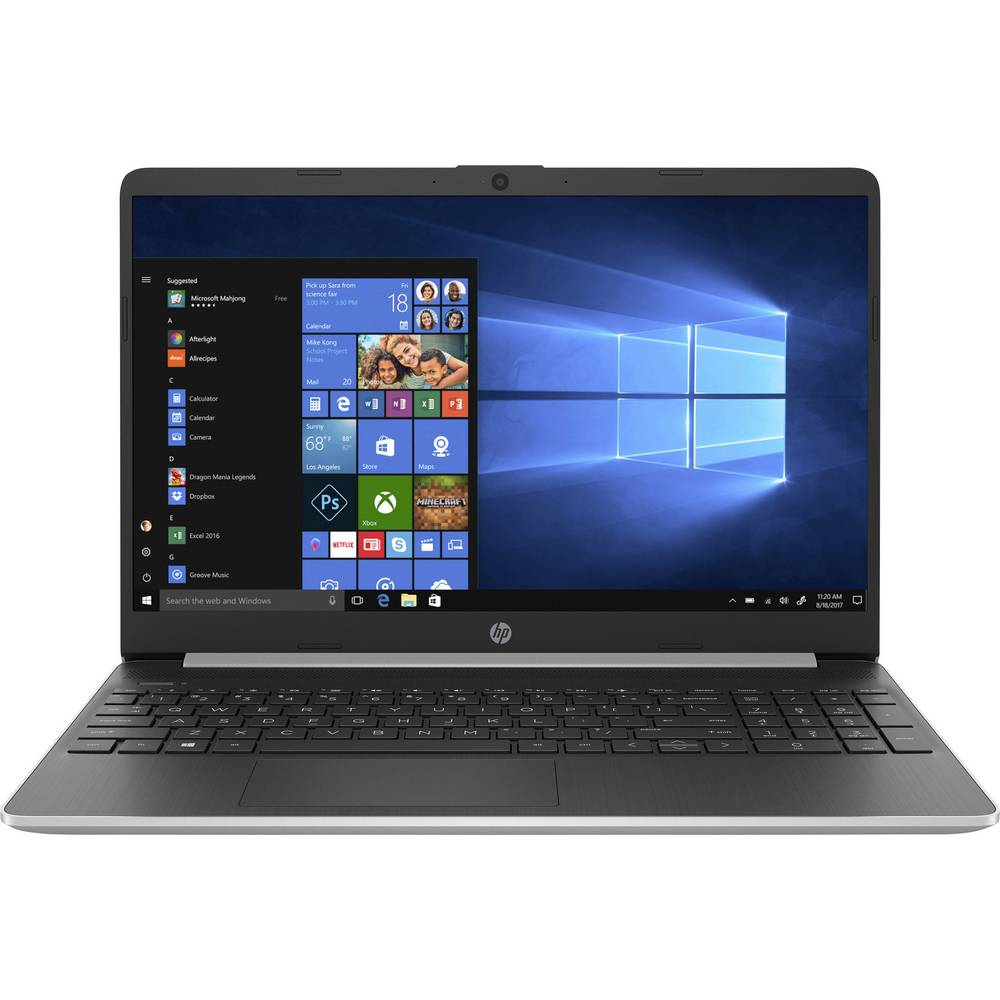
Case - HP 15s in a plain aluminum look
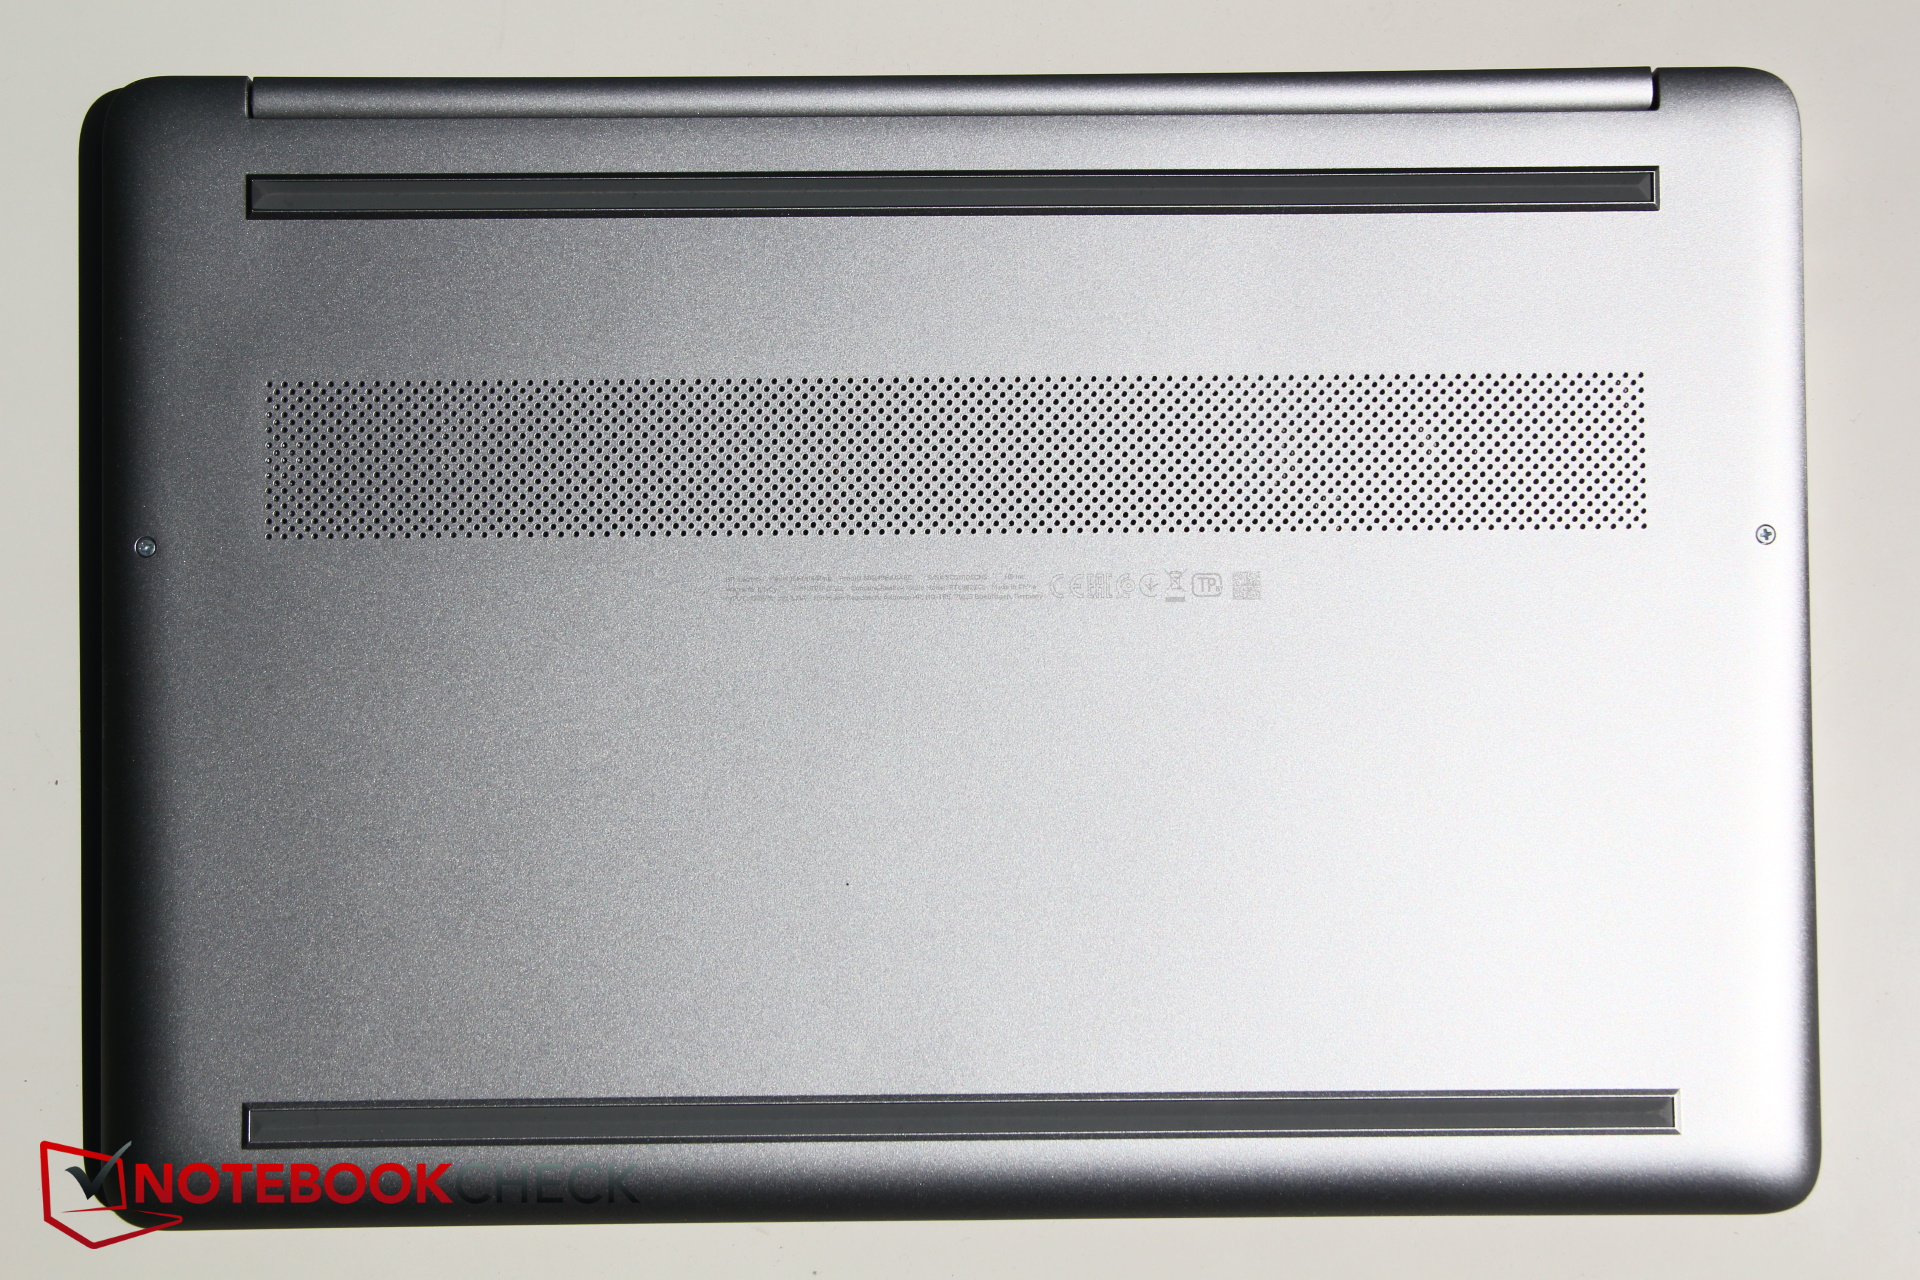
The case consists almost entirely of heat-dissipating aluminum, black plastic is only used on the rather wide display edges. Despite the metal body and the many rounded edges and corners, the HP 15s looks very plain from the outside, if not a bit staid. The HP 15s draws in air via the base plate, and the waste heat produced is passed upwards to the display via slots next to the hinge. The keyboard base stands out in color with its slightly patterned black from the silver tone of the chassis. The keys are recessed a little lower here, the transitions on all sides are realized by gently curved metal, which looks very good.
The display lid is of course not as rigid as the base, which clicks slightly inside on the left when pressed. The display reacts to pressure with slight deformations in the display, the large hinge should be a little more stable for our taste. If you wiggle your laptop, the display soon moves as well, and the hinge also seems to rattle slightly. The edging around the base joins the bottom and the keyboard base, can be easily pushed away and then reveals larger gaps. Overall, the build quality is not great but okay, the aluminum housing in particular makes a good impression. Unfortunately, there is no maintenance hatch, access to the innards is difficult or impossible, more on that later.
In terms of dimensions, all direct competitors are roughly the same, only the 2,000 Euro (~$2258) Surface 3 is significantly lighter and narrower here, the Dell Inspiron 15 7000 is 400 grams (~0.9 lb) heavier.
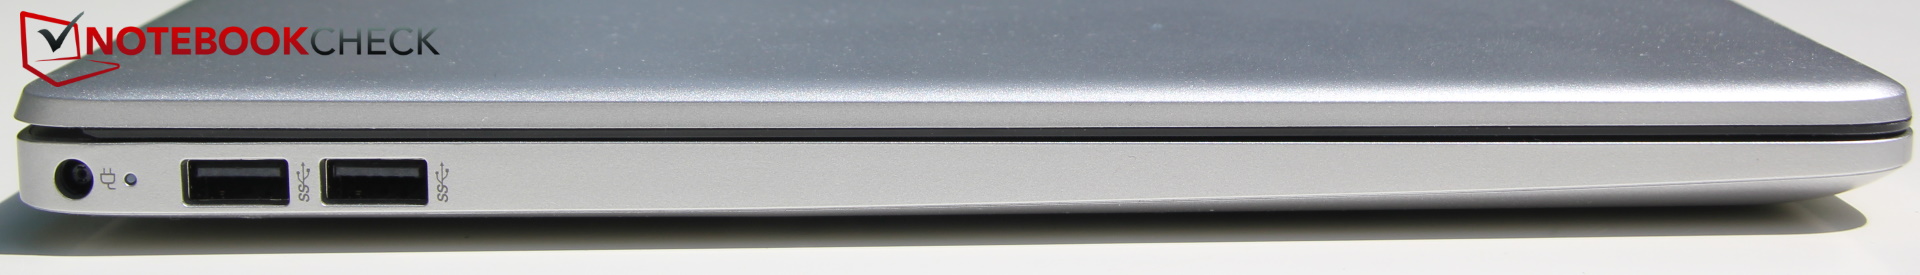
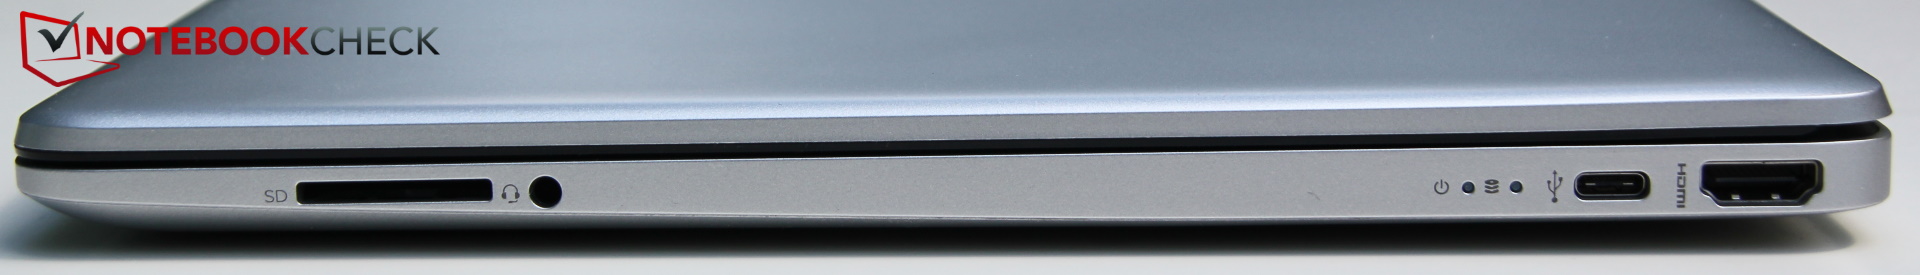
Connectivity - Stingy HP laptop
HP is stingy with the connections. Three USB 3.0 slots, one of them of type C, plus an HDMI and a jack port, that was actually it. After all, an SD reader is still included. However, the cards cannot be snapped into place with a click, they are only inserted, and they protrude just a few millimeters, so that it is unnecessarily cumbersome to wind them out with your fingernails.
The few ports should hardly cause any problems with the arrangement - you might think, but HP doesn't make the best decisions here. Most ports are on the right, including SD and jack inputs, which could interfere with the right mouse hand, and the HDMI input with usually thick and rigid cables is also on the right side. Left-handers should therefore rather welcome the arrangement of the HP 15s.
SD Card Reader
The HP 15s doesn't copy content to our Toshiba Exceria Pro SDXC 64 GB UHS-II reference memory card very quickly, the class average is about twice as fast.
| SD Card Reader | |
| average JPG Copy Test (av. of 3 runs) | |
| Lenovo Ideapad S340-15IIL (Toshiba Exceria Pro SDXC 64 GB UHS-II) | |
| Average of class Office (19.8 - 198.5, n=22, last 2 years) | |
| Dell Inspiron 15 5000 5585 (Toshiba Exceria Pro SDXC 64 GB UHS-II) | |
| HP 15s-fq1440ng (Toshiba Exceria Pro SDXC 64 GB UHS-II) | |
| Dell Inspiron 15 7000 2-in-1 Black Edition (Toshiba Exceria Pro SDXC 64 GB UHS-II) | |
| maximum AS SSD Seq Read Test (1GB) | |
| Lenovo Ideapad S340-15IIL (Toshiba Exceria Pro SDXC 64 GB UHS-II) | |
| Average of class Office (27.4 - 249, n=21, last 2 years) | |
| Dell Inspiron 15 5000 5585 (Toshiba Exceria Pro SDXC 64 GB UHS-II) | |
| Dell Inspiron 15 7000 2-in-1 Black Edition (Toshiba Exceria Pro SDXC 64 GB UHS-II) | |
Communication
When it comes to WLAN communication, the HP is somewhat above the class average. From the competition listed here only the Lenovo IdeaPad is better, all others do worse.
Webcam
The 1 MP webcam is mandatory and doesn't look like much. The pictures are not very colorful, appear milky and quickly become blurred. An external model should be used for the chat with the demanding boss.

, i7-1065G7, Samsung PM991 MZVLQ512HALU")
, i7-1065G7, Samsung PM991 MZVLQ512HALU")
Security
Apart from TPM through the Intel chip, the HP 15s has no other security features to offer, and even a Kensington port is missing.
Accessories
Only the laptop and a power adapter are in the packaging. Additional accessories can be ordered for a fee on the HP website.
Maintenance
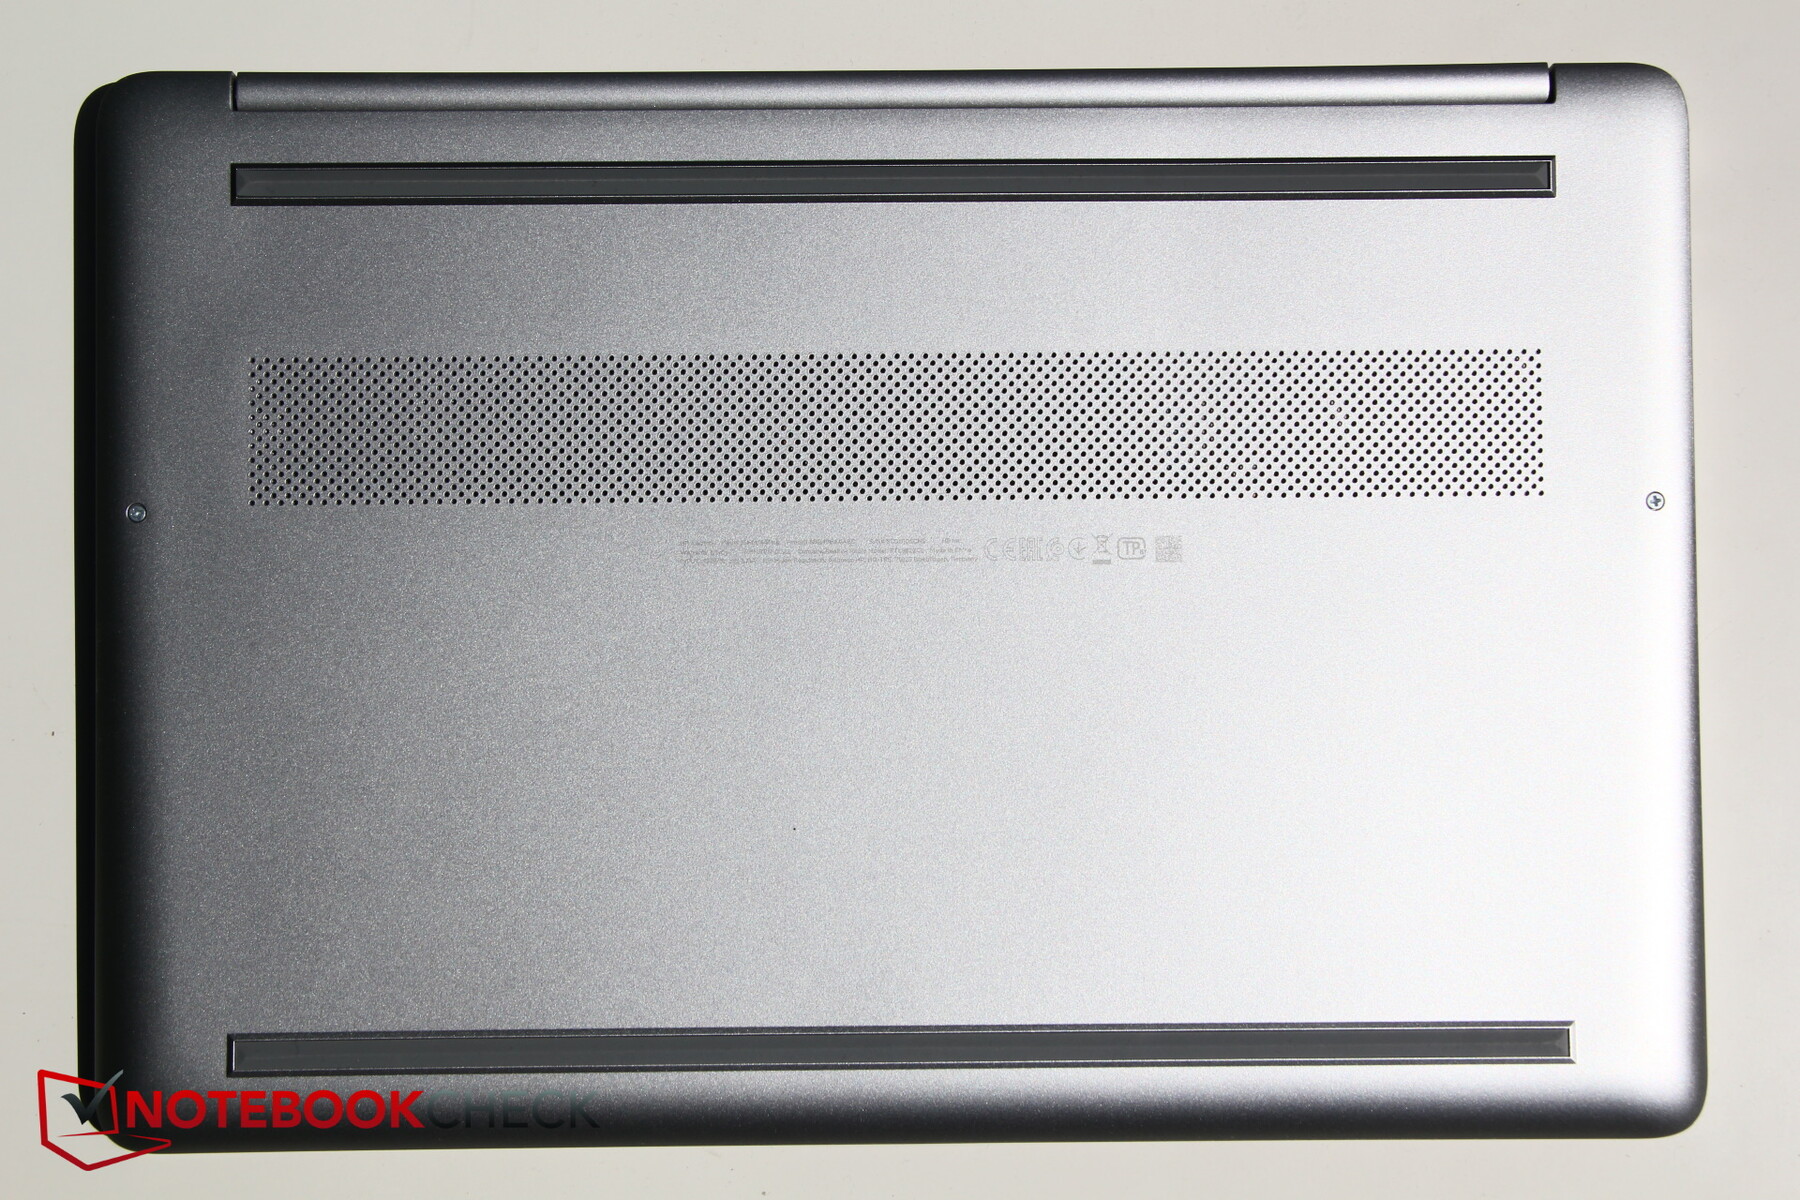
A maintenance hatch is unfortunately not available. Only two screws are visible on the bottom, but removing the screws does not lead to the desired opening of the notebook, even with a suitable lever device. The suspicion is obvious that additional screws are housed below the two long rubber feet. This is unnecessarily anti-maintenance and a clear minus for the HP 15s. In any case, we stopped trying to unscrew the device for fear of damaging it.
Warranty
Unfortunately, the data sheet for the HP 15s does not contain any information about the warranty period. The manufacturer probably relies on the usual statutory minimum level of warranty.
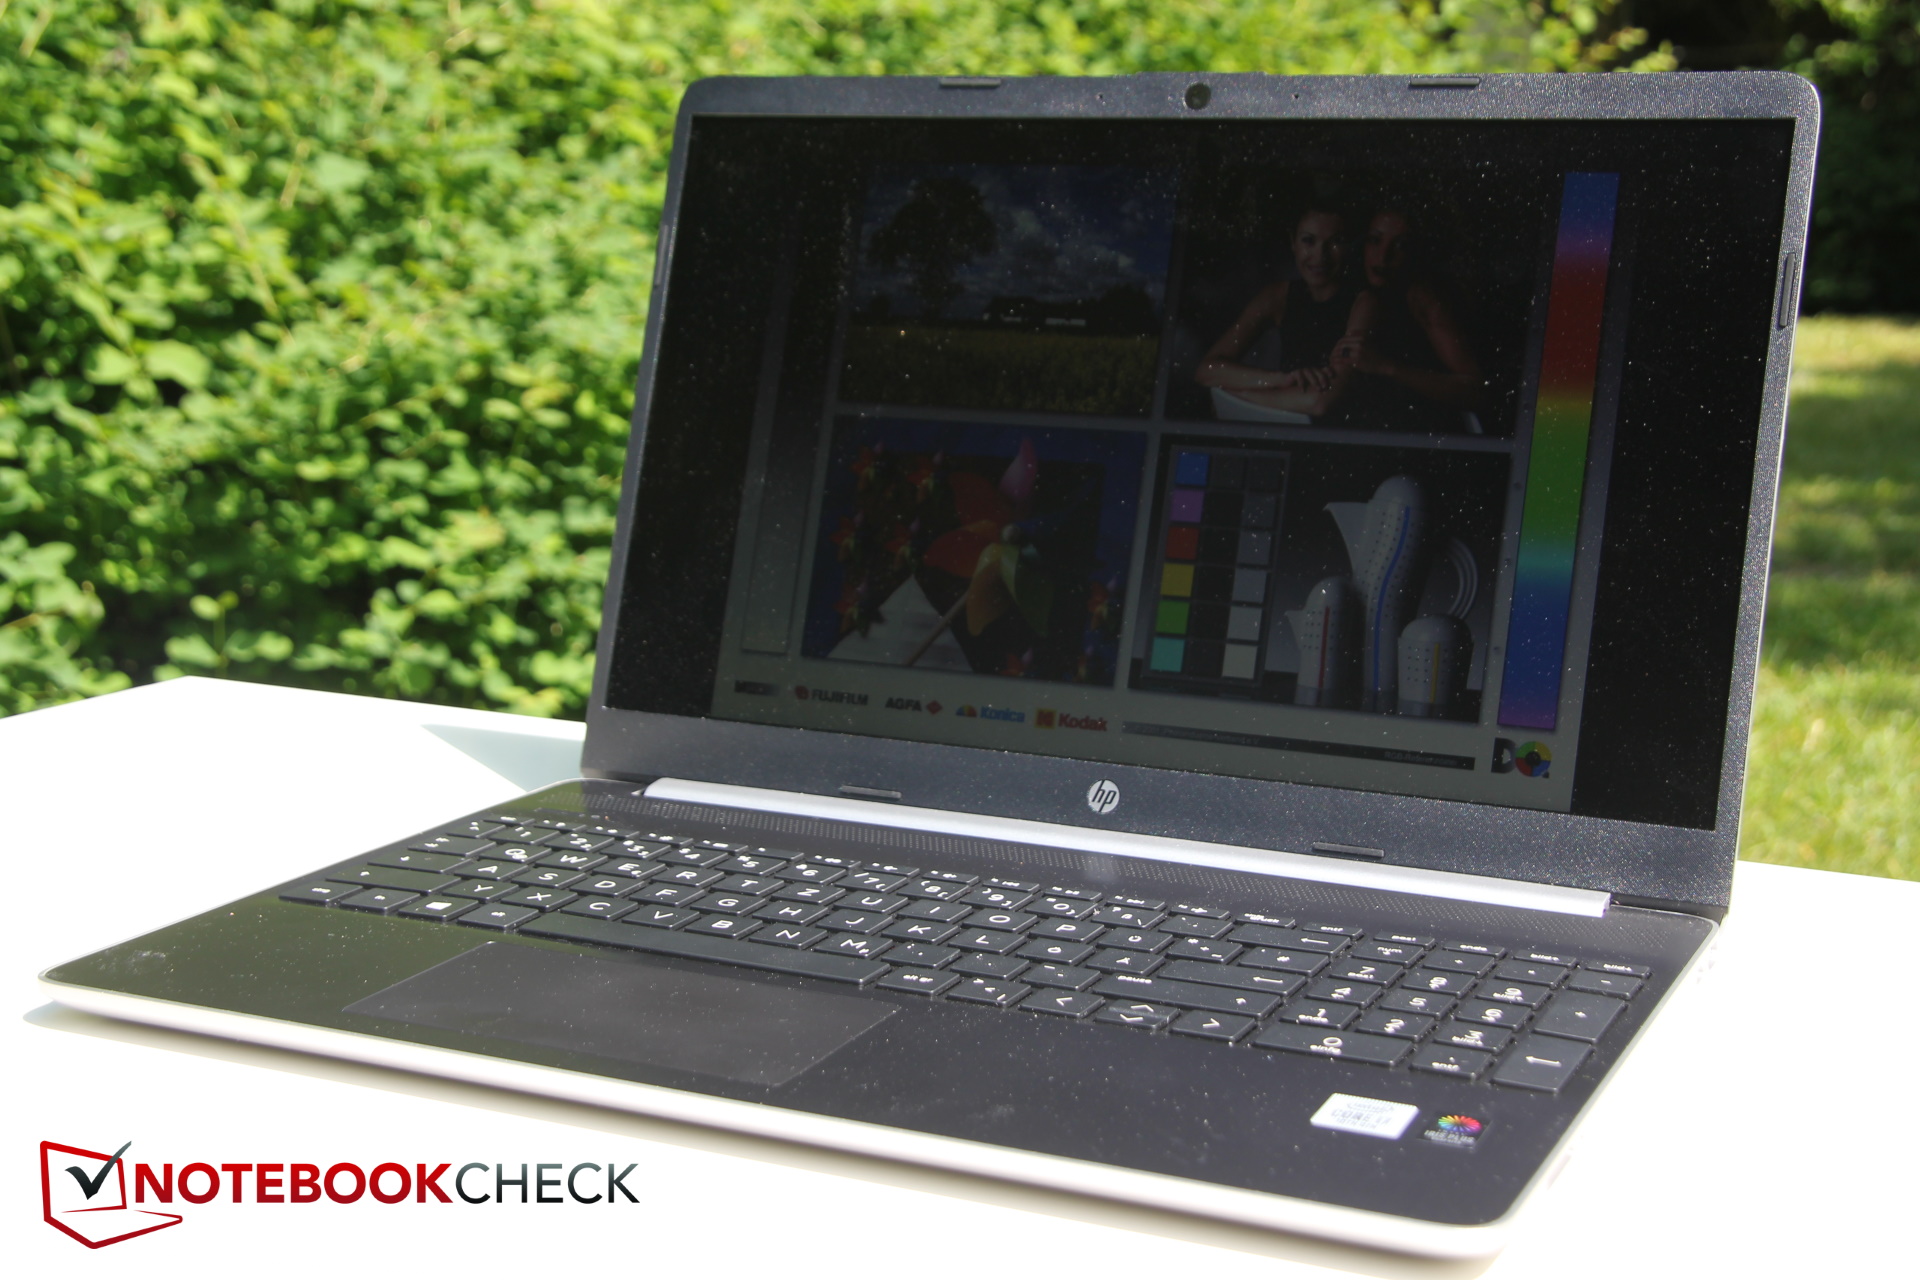
Input devices - Mediocre office HP
Keyboard
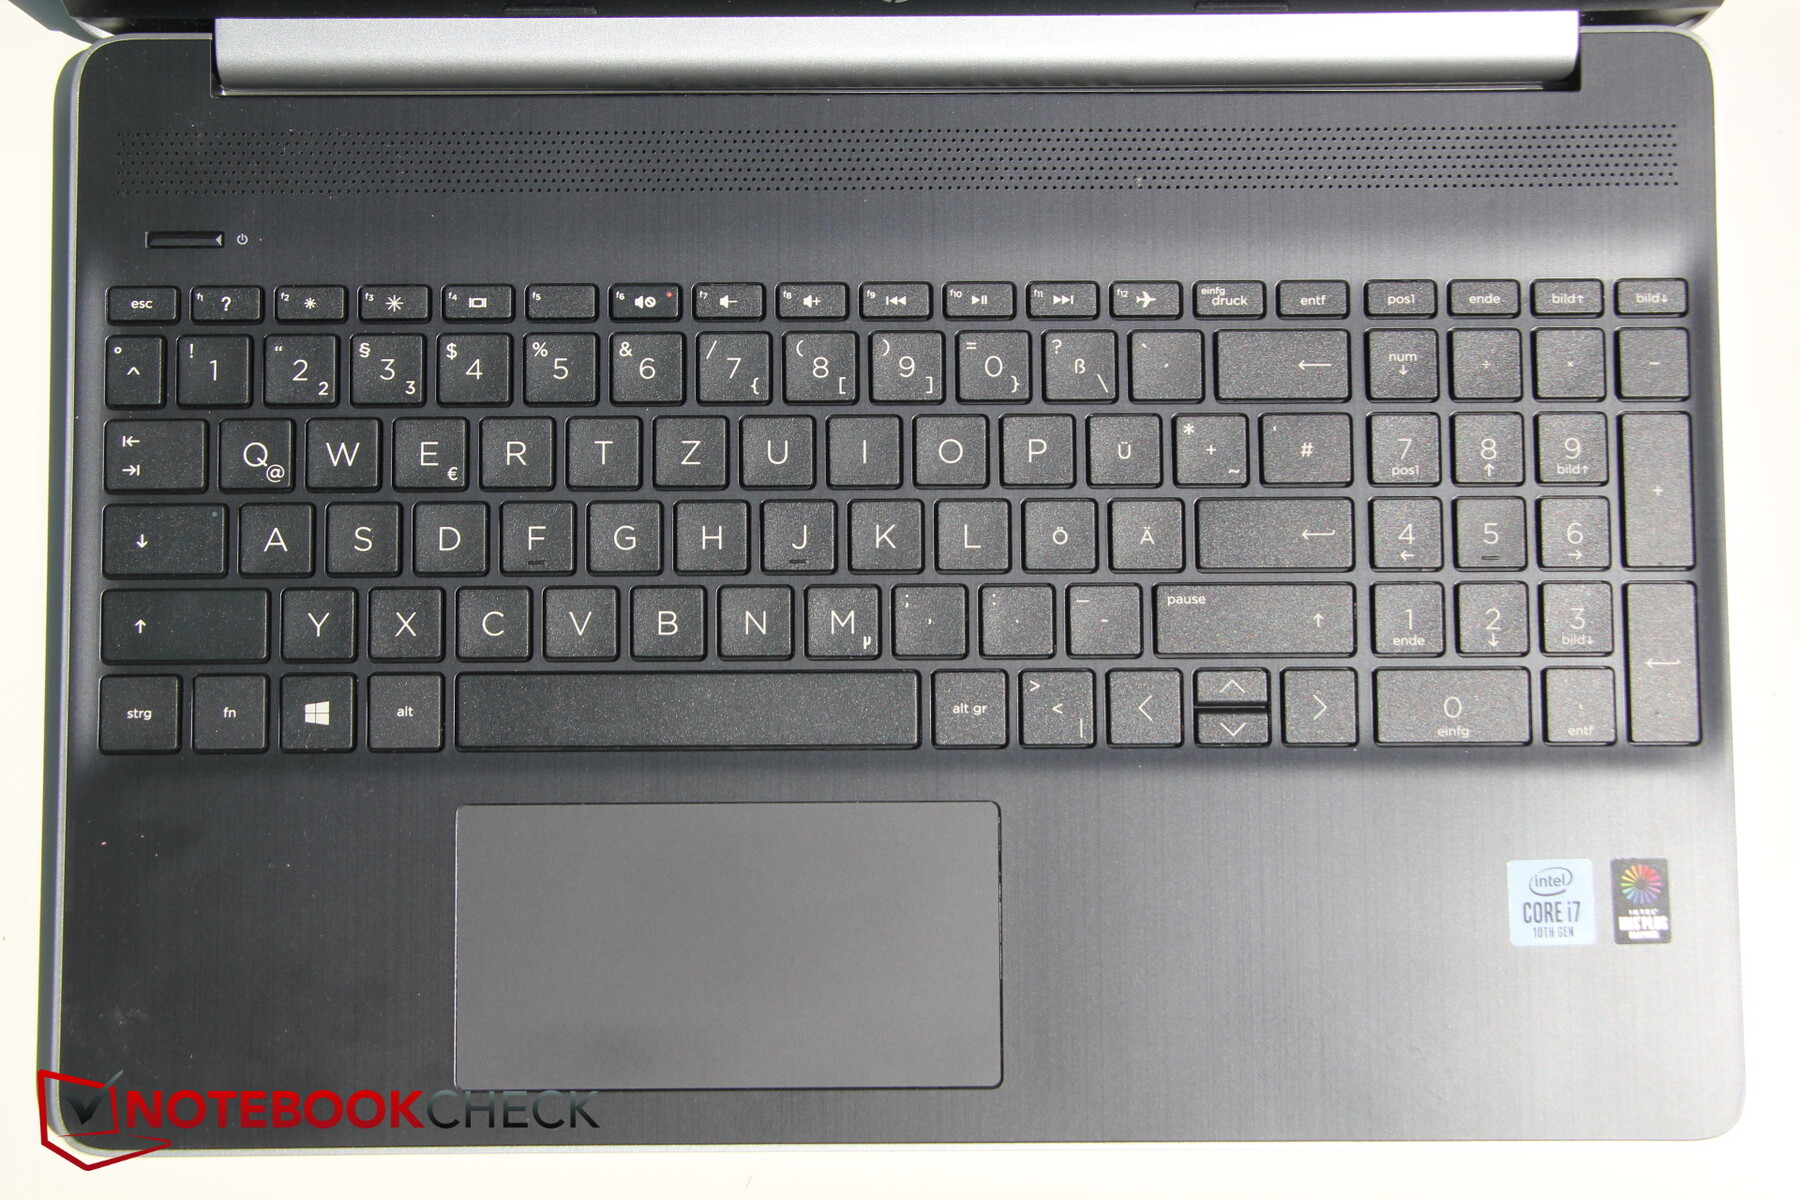
The chiclet keyboard does not sport a backlight, but a number pad is installed. The travel of the keys is relatively short, the feedback a bit spongy, but still within limits. The material of the keys feels rather cheap. Writing is still quick, but it's not really fun, the noises generated are acceptable. The large labels on the buttons are a plus. The up / down buttons unfortunately have to share a space, otherwise the layout is fine. The very narrow power switch is located separately on the top left.
Touchpad
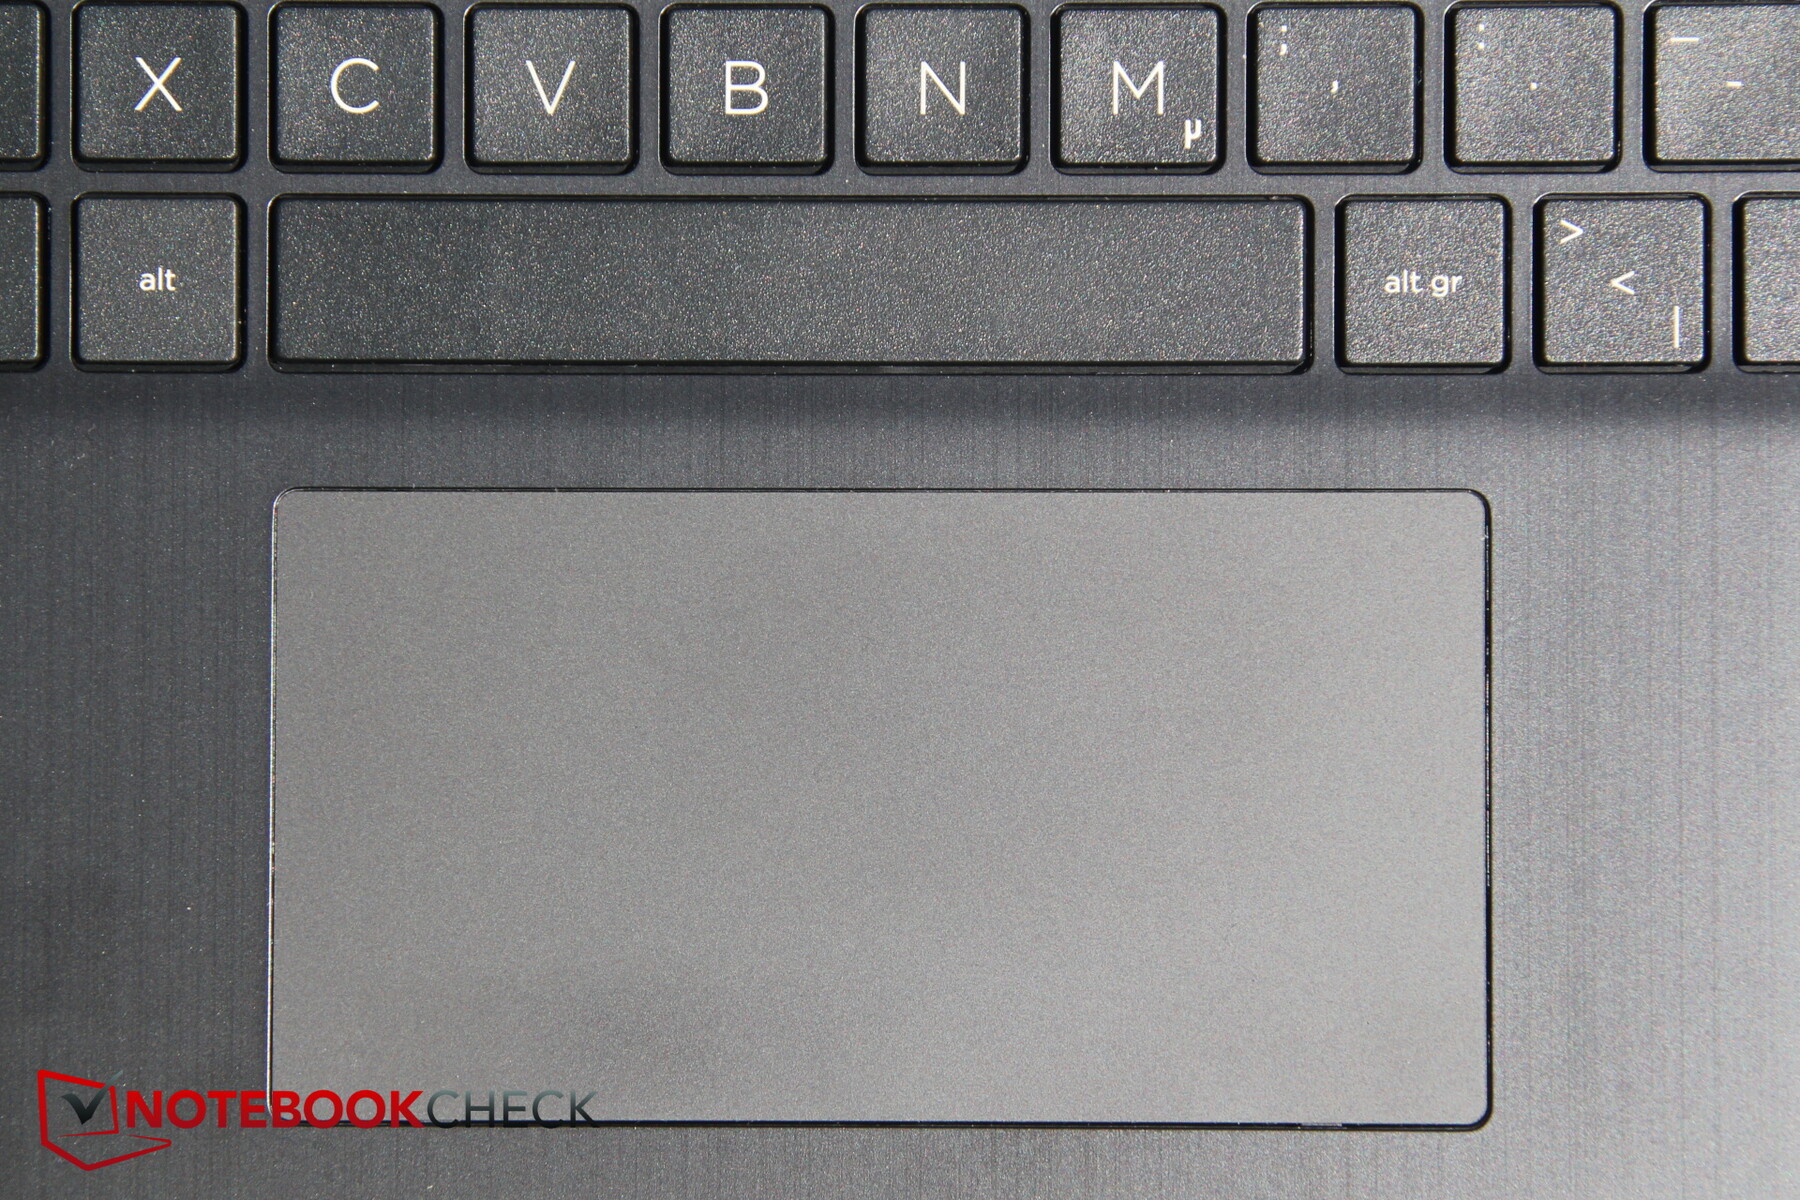
The touchpad is unusually large, at least in the lateral dimensions, you almost have a widescreen touchpad here. The surface is smooth and has good sliding properties. The integrated buttons trigger reliably, but could be a bit quieter. 4-finger gestures are easily recognized.
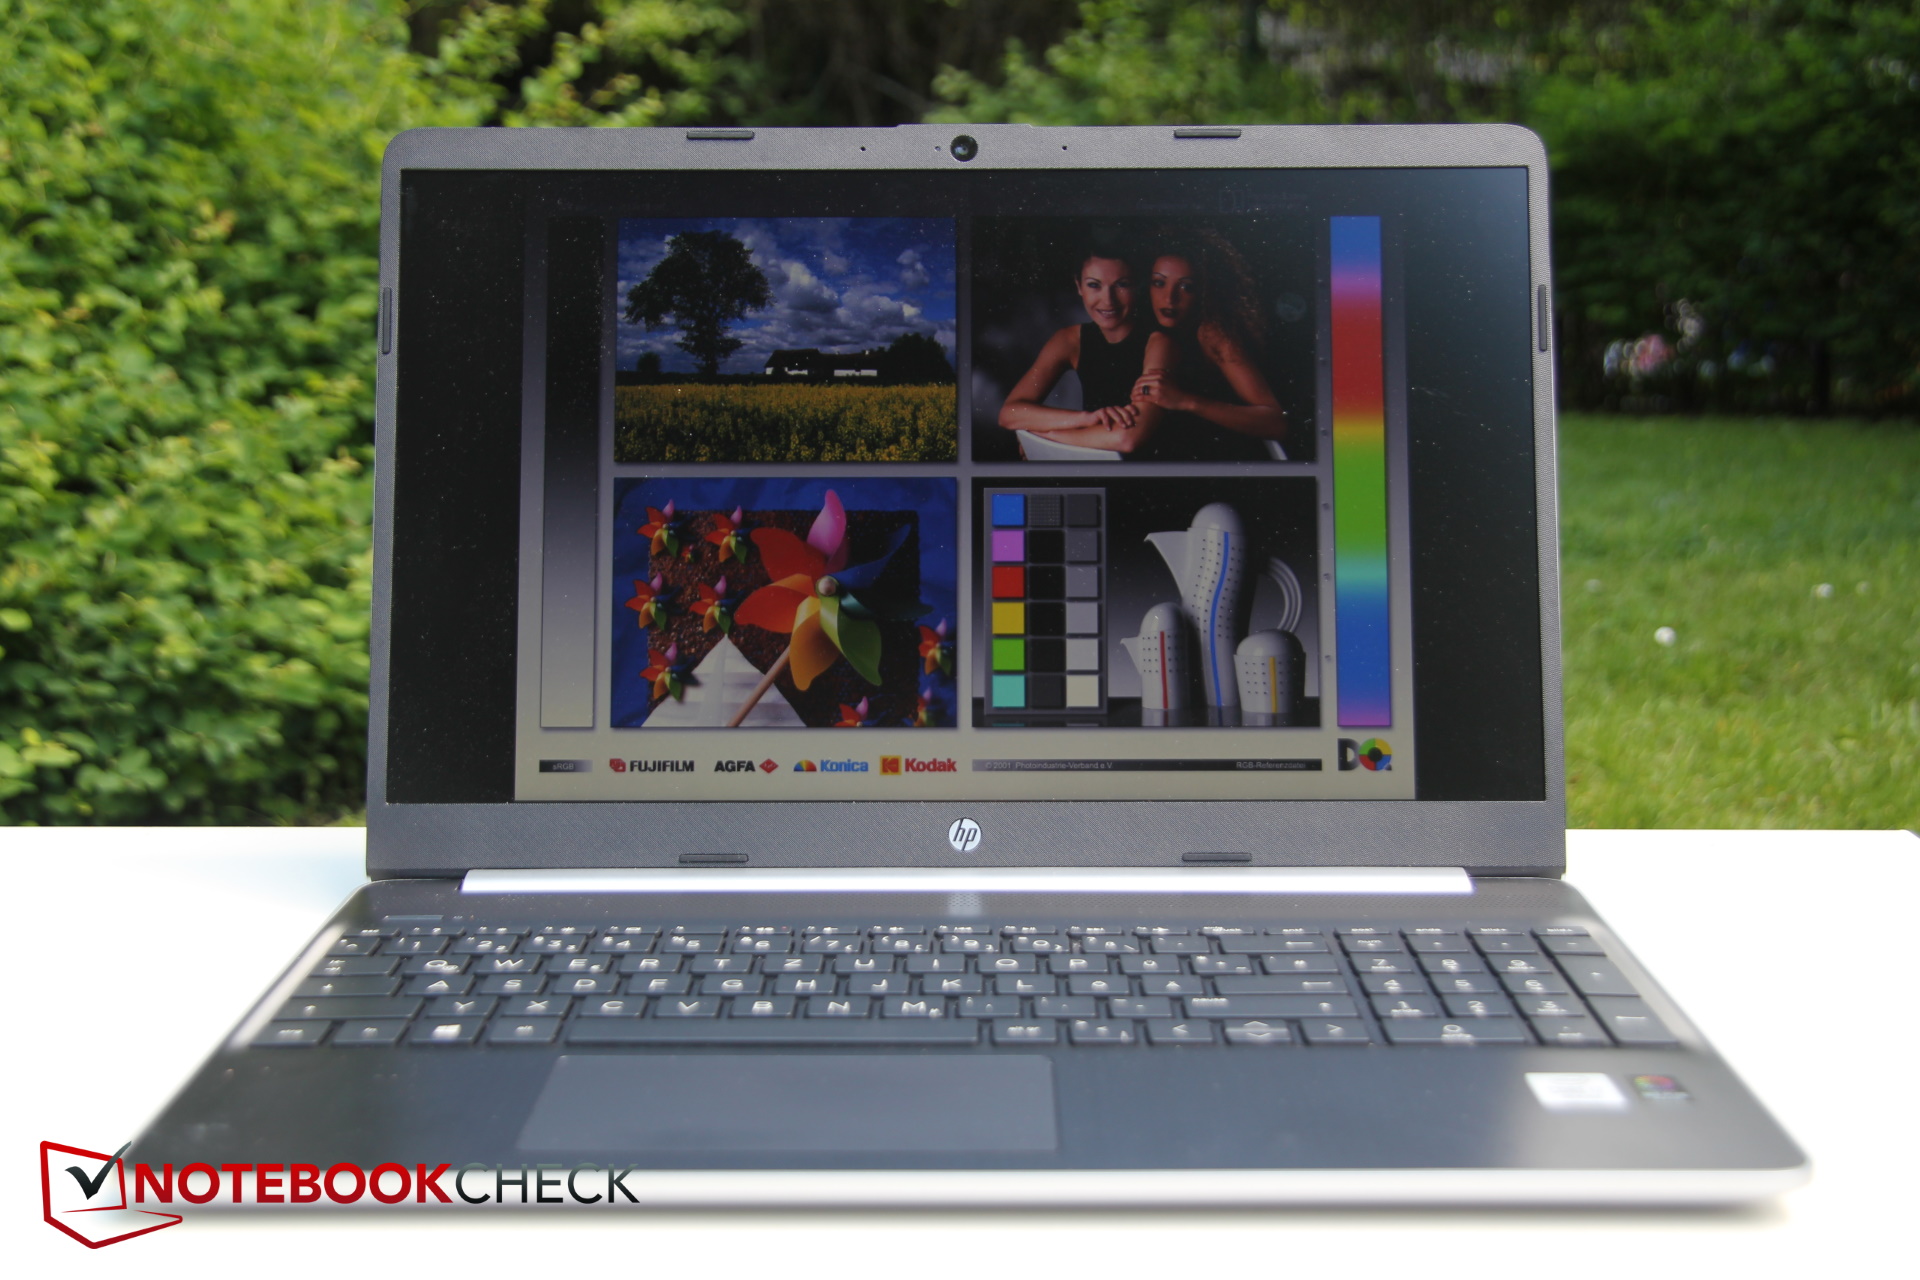
Display - HP notebook with poor TN panel
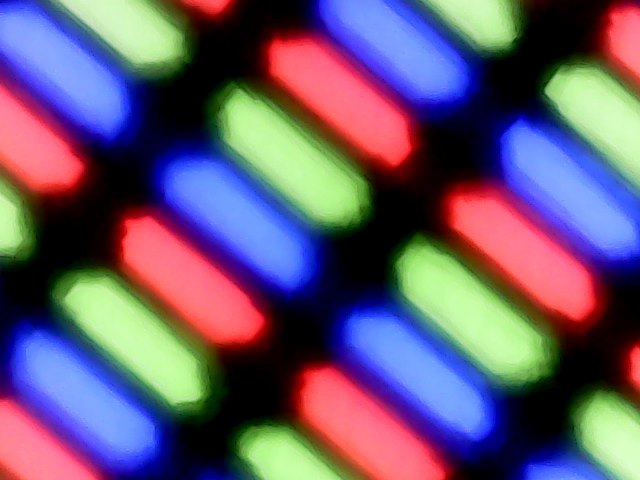
Since with a 15-inch laptop one looks at the integrated screen most of the time, the manufacturer should save the least here - HP does it anyway and installs a bad TN panel. This is particularly surprising since the sister model's IPS display is not bad at all. The panel of our test device dissolves with Full HD and has a matt surface. Otherwise, it is mercilessly inferior to the competition in almost all points. The brightness comes just within the acceptable range with an average of 215 nits, the distribution of brightness is already below average with 79 percent. After all, screen bleeding is hardly a problem with TN panels.
| |||||||||||||||||||||||||
Brightness Distribution: 79 %
Center on Battery: 197 cd/m²
Contrast: 568:1 (Black: 0.4 cd/m²)
ΔE ColorChecker Calman: 10.48 | ∀{0.5-29.43 Ø4.71}
calibrated: 4.64
ΔE Greyscale Calman: 12.44 | ∀{0.09-98 Ø4.96}
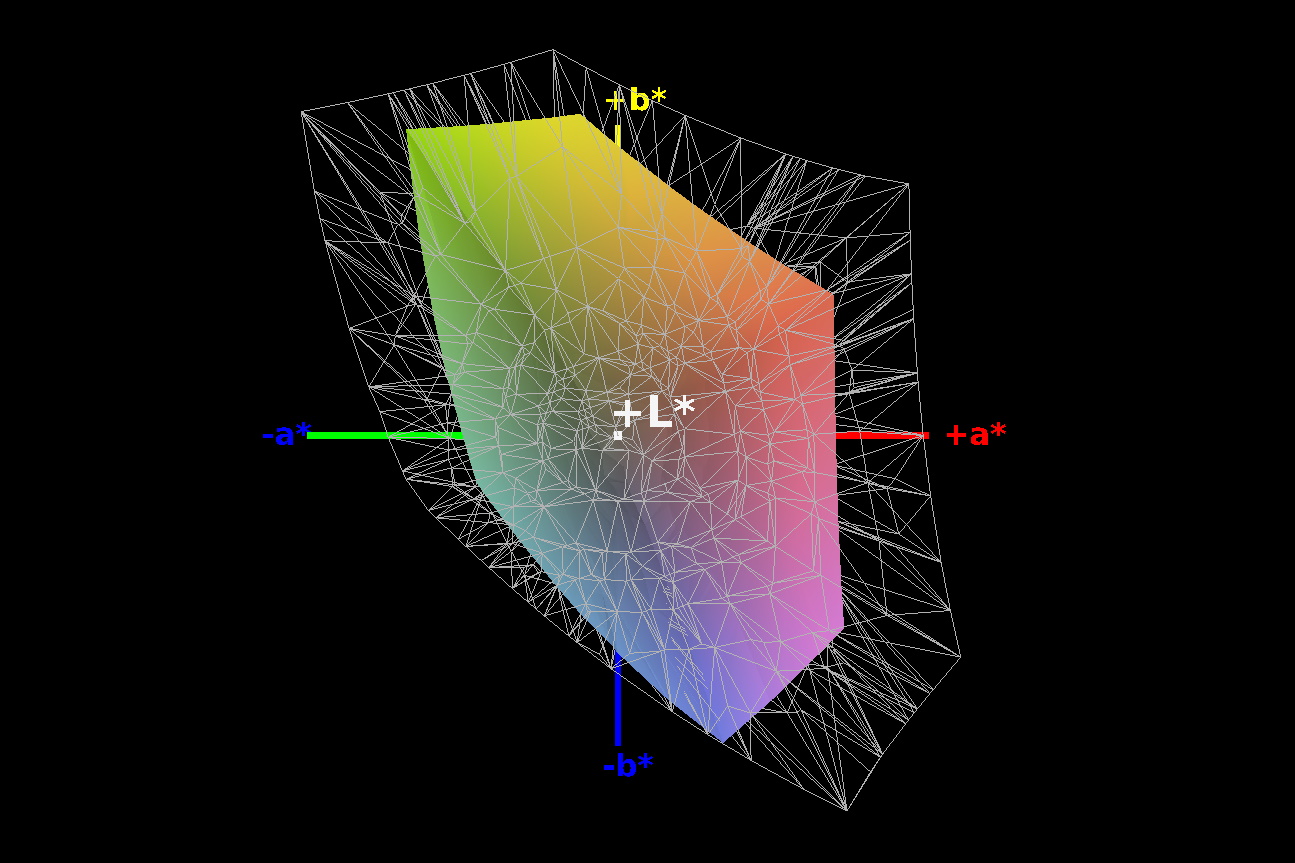
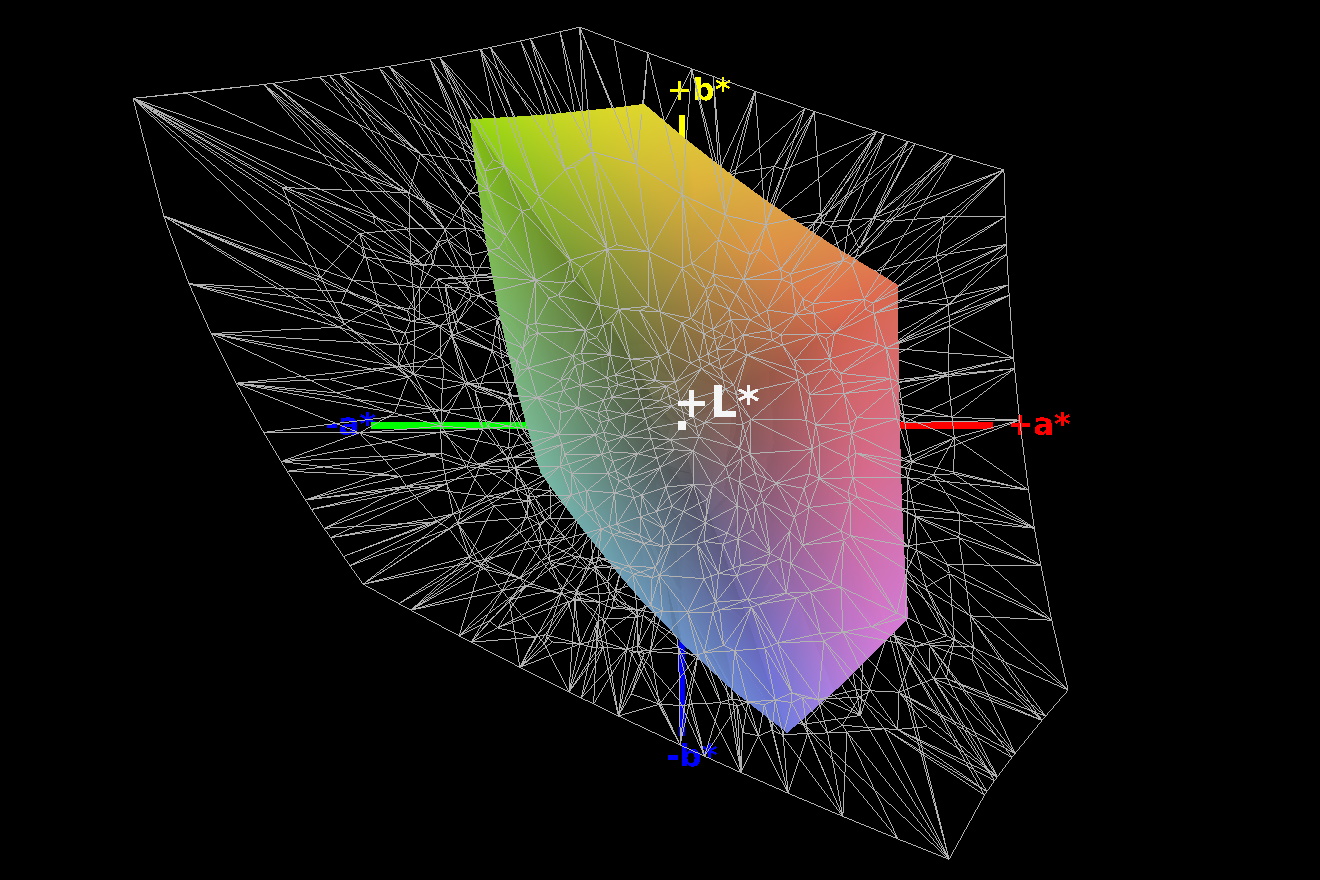
54% sRGB (Argyll 1.6.3 3D)
34% AdobeRGB 1998 (Argyll 1.6.3 3D)
37.24% AdobeRGB 1998 (Argyll 3D)
54.2% sRGB (Argyll 3D)
36.04% Display P3 (Argyll 3D)
Gamma: 2.77
CCT: 13027 K
| HP 15s-fq1440ng AU Optronics AUO61ED, TN, 1920x1080, 15.6" | HP 15s-fq1556ng AU Optronics B156HW02, IPS, 1920x1080, 15.6" | Microsoft Surface Laptop 3 15 i7-1065G7 Sharp LQ150P1JX51, IPS, 2496x1664, 15" | Lenovo Ideapad S340-15IIL BOE CQ NV156FHM-T03, IPS, 1920x1080, 15.6" | Dell Inspiron 15 5000 5585 LG Philips 156WFC, IPS, 1920x1080, 15.6" | Dell Inspiron 15 7000 2-in-1 Black Edition AUO34EB, IPS, 3840x2160, 15.6" | |
|---|---|---|---|---|---|---|
| Display | 4% | 82% | 11% | 4% | 99% | |
| Display P3 Coverage (%) | 36.04 | 37.66 4% | 65.6 82% | 40.43 12% | 37.31 4% | 75.7 110% |
| sRGB Coverage (%) | 54.2 | 56.4 4% | 98.4 82% | 58.8 8% | 56.2 4% | 99.3 83% |
| AdobeRGB 1998 Coverage (%) | 37.24 | 38.91 4% | 67.8 82% | 41.77 12% | 38.55 4% | 75.7 103% |
| Response Times | -93% | -124% | -101% | -47% | -75% | |
| Response Time Grey 50% / Grey 80% * (ms) | 43 ? | 51 ? -19% | 56 ? -30% | 46.4 ? -8% | 28.4 ? 34% | 48 ? -12% |
| Response Time Black / White * (ms) | 12 ? | 32 ? -167% | 38 ? -217% | 35.2 ? -193% | 27.2 ? -127% | 28.4 ? -137% |
| PWM Frequency (Hz) | 21370 ? | |||||
| Screen | 37% | 72% | 30% | 25% | 49% | |
| Brightness middle (cd/m²) | 227 | 254 12% | 412.4 82% | 320.8 41% | 253.6 12% | 321.1 41% |
| Brightness (cd/m²) | 215 | 234 9% | 374 74% | 309 44% | 227 6% | 315 47% |
| Brightness Distribution (%) | 79 | 86 9% | 78 -1% | 87 10% | 84 6% | 95 20% |
| Black Level * (cd/m²) | 0.4 | 0.18 55% | 0.35 13% | 0.27 32% | 0.27 32% | 0.36 10% |
| Contrast (:1) | 568 | 1411 148% | 1178 107% | 1188 109% | 939 65% | 892 57% |
| Colorchecker dE 2000 * | 10.48 | 5.58 47% | 1.04 90% | 7.68 27% | 6.05 42% | 5.45 48% |
| Colorchecker dE 2000 max. * | 22.49 | 9.83 56% | 2.83 87% | 21.97 2% | 14.03 38% | 12.6 44% |
| Colorchecker dE 2000 calibrated * | 4.64 | 4.53 2% | 0.74 84% | 4.65 -0% | 4.97 -7% | 2.08 55% |
| Greyscale dE 2000 * | 12.44 | 5.02 60% | 1.3 90% | 7.3 41% | 3.2 74% | 8.1 35% |
| Gamma | 2.77 79% | 2.83 78% | 2.07 106% | 2.12 104% | 2 110% | 2.207 100% |
| CCT | 13027 50% | 6570 99% | 6634 98% | 6213 105% | 6820 95% | 6845 95% |
| Color Space (Percent of AdobeRGB 1998) (%) | 34 | 36 6% | 62.4 84% | 37.8 11% | 35.5 4% | 67.3 98% |
| Color Space (Percent of sRGB) (%) | 54 | 56 4% | 98.4 82% | 58.3 8% | 55.6 3% | 99.3 84% |
| Total Average (Program / Settings) | -17% /
15% | 10% /
49% | -20% /
10% | -6% /
12% | 24% /
43% |
* ... smaller is better
The contrast is an unfortunate 568: 1, the competition usually comes close to at least 1,000: 1. A black level of 0.4 is rather poor. Not surprisingly, the color space shown does not convince (sRGB = 54 percent, AdobeRGB = 34 percent).
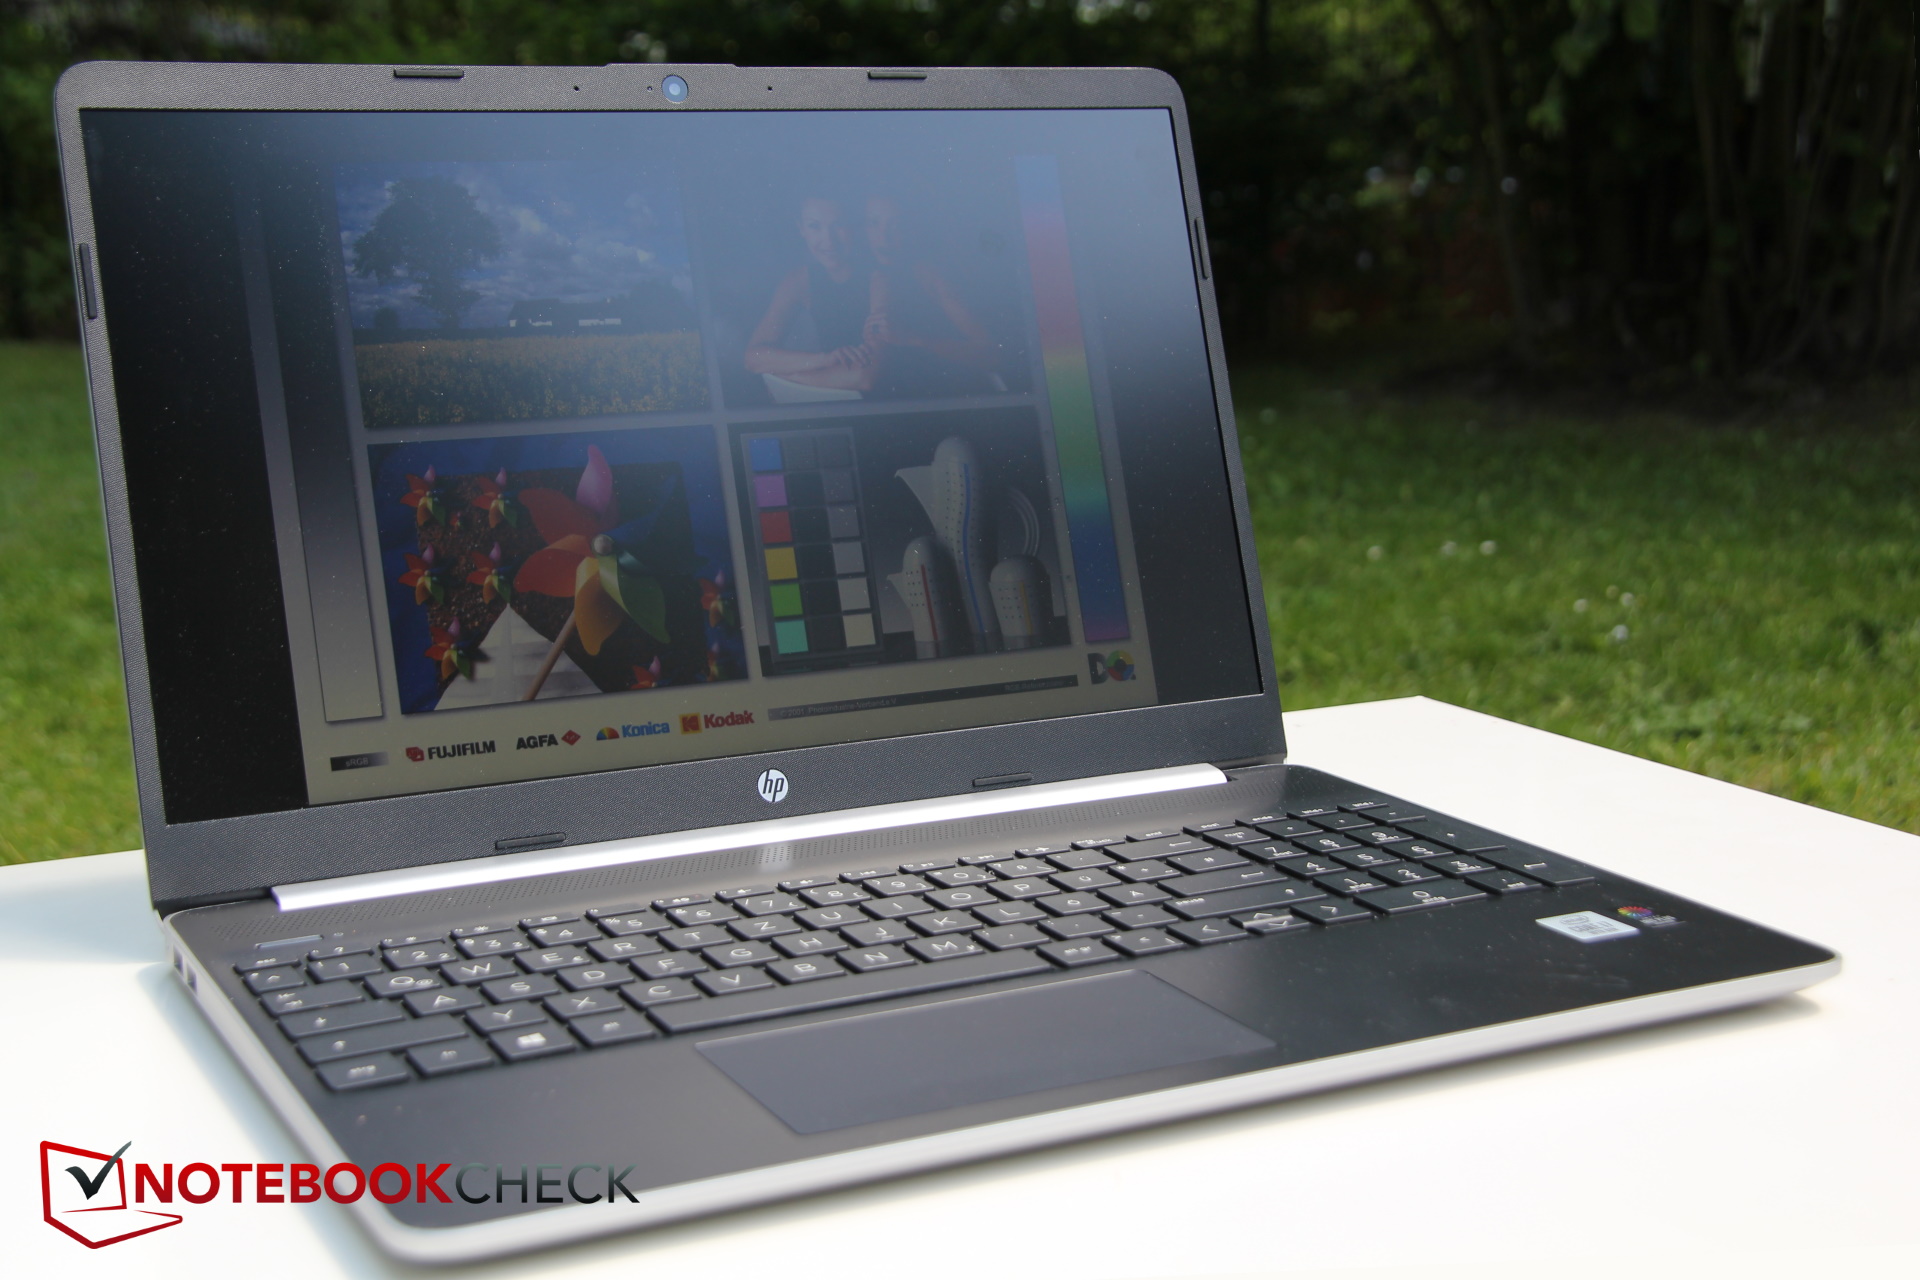
Subjectively, the TN panel does not make a good impression, the colors look pale, and the panel is anything but stable from a viewing angle, and the image quickly becomes either very milky or very dark.
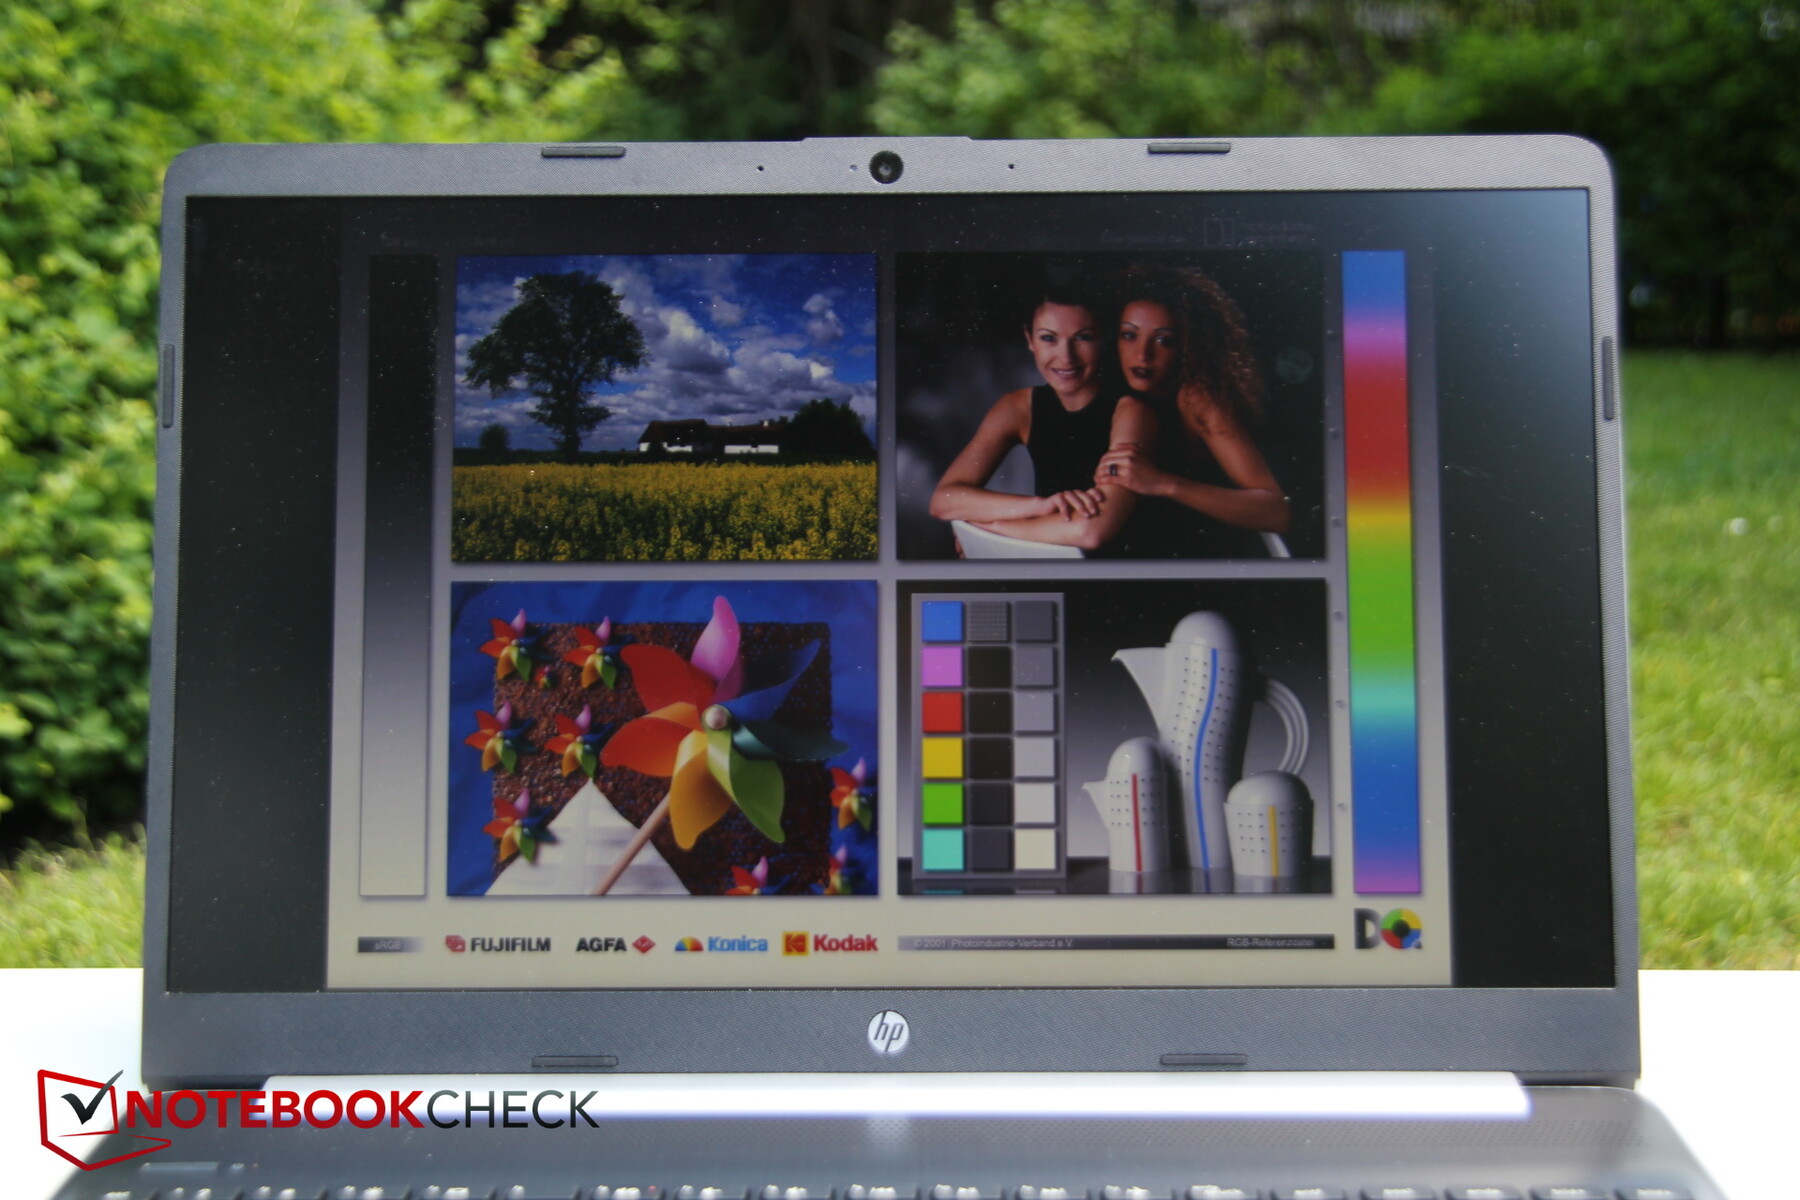
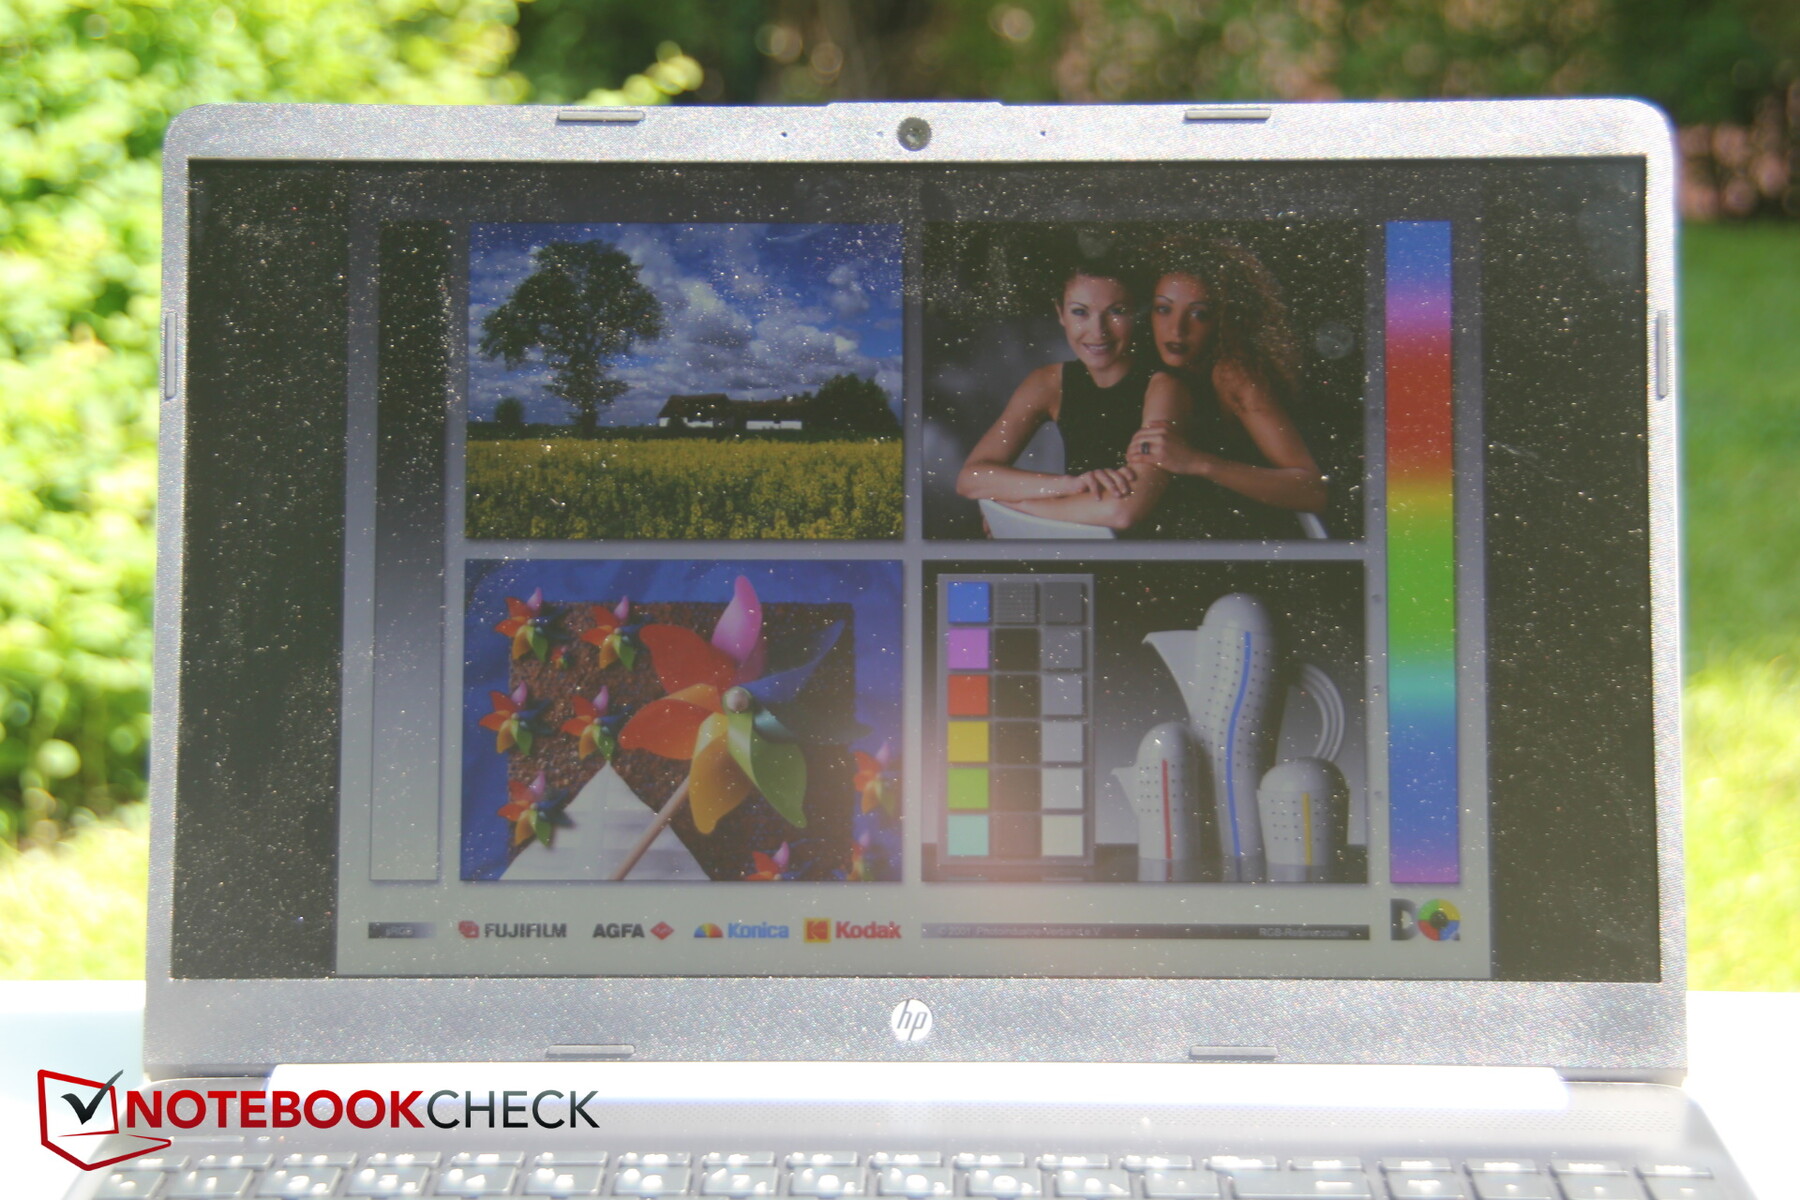
The HP 15s can be used outdoors, at least in shady places. Reflections are less of a problem due to the matt surface, but the low brightness has a negative impact in sunshine.
Display Response Times
| ↔ Response Time Black to White | ||
|---|---|---|
| 12 ms ... rise ↗ and fall ↘ combined | ↗ 9 ms rise |  |
| ↘ 3 ms fall | ||
| The screen shows good response rates in our tests, but may be too slow for competitive gamers. In comparison, all tested devices range from 0.1 (minimum) to 240 (maximum) ms. » 32 % of all devices are better. This means that the measured response time is better than the average of all tested devices (19.8 ms). | ||
| ↔ Response Time 50% Grey to 80% Grey | ||
| 43 ms ... rise ↗ and fall ↘ combined | ↗ 24 ms rise |  |
| ↘ 19 ms fall | ||
| The screen shows slow response rates in our tests and will be unsatisfactory for gamers. In comparison, all tested devices range from 0.165 (minimum) to 636 (maximum) ms. » 71 % of all devices are better. This means that the measured response time is worse than the average of all tested devices (30.9 ms). | ||
Screen Flickering / PWM (Pulse-Width Modulation)
| Screen flickering / PWM not detected | 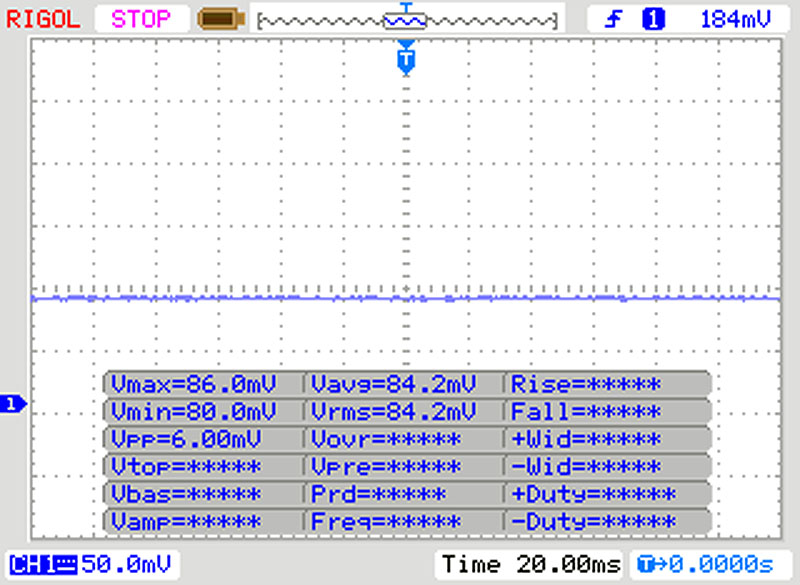 | ||
In comparison: 52 % of all tested devices do not use PWM to dim the display. If PWM was detected, an average of 7744 (minimum: 5 - maximum: 343500) Hz was measured. | |||
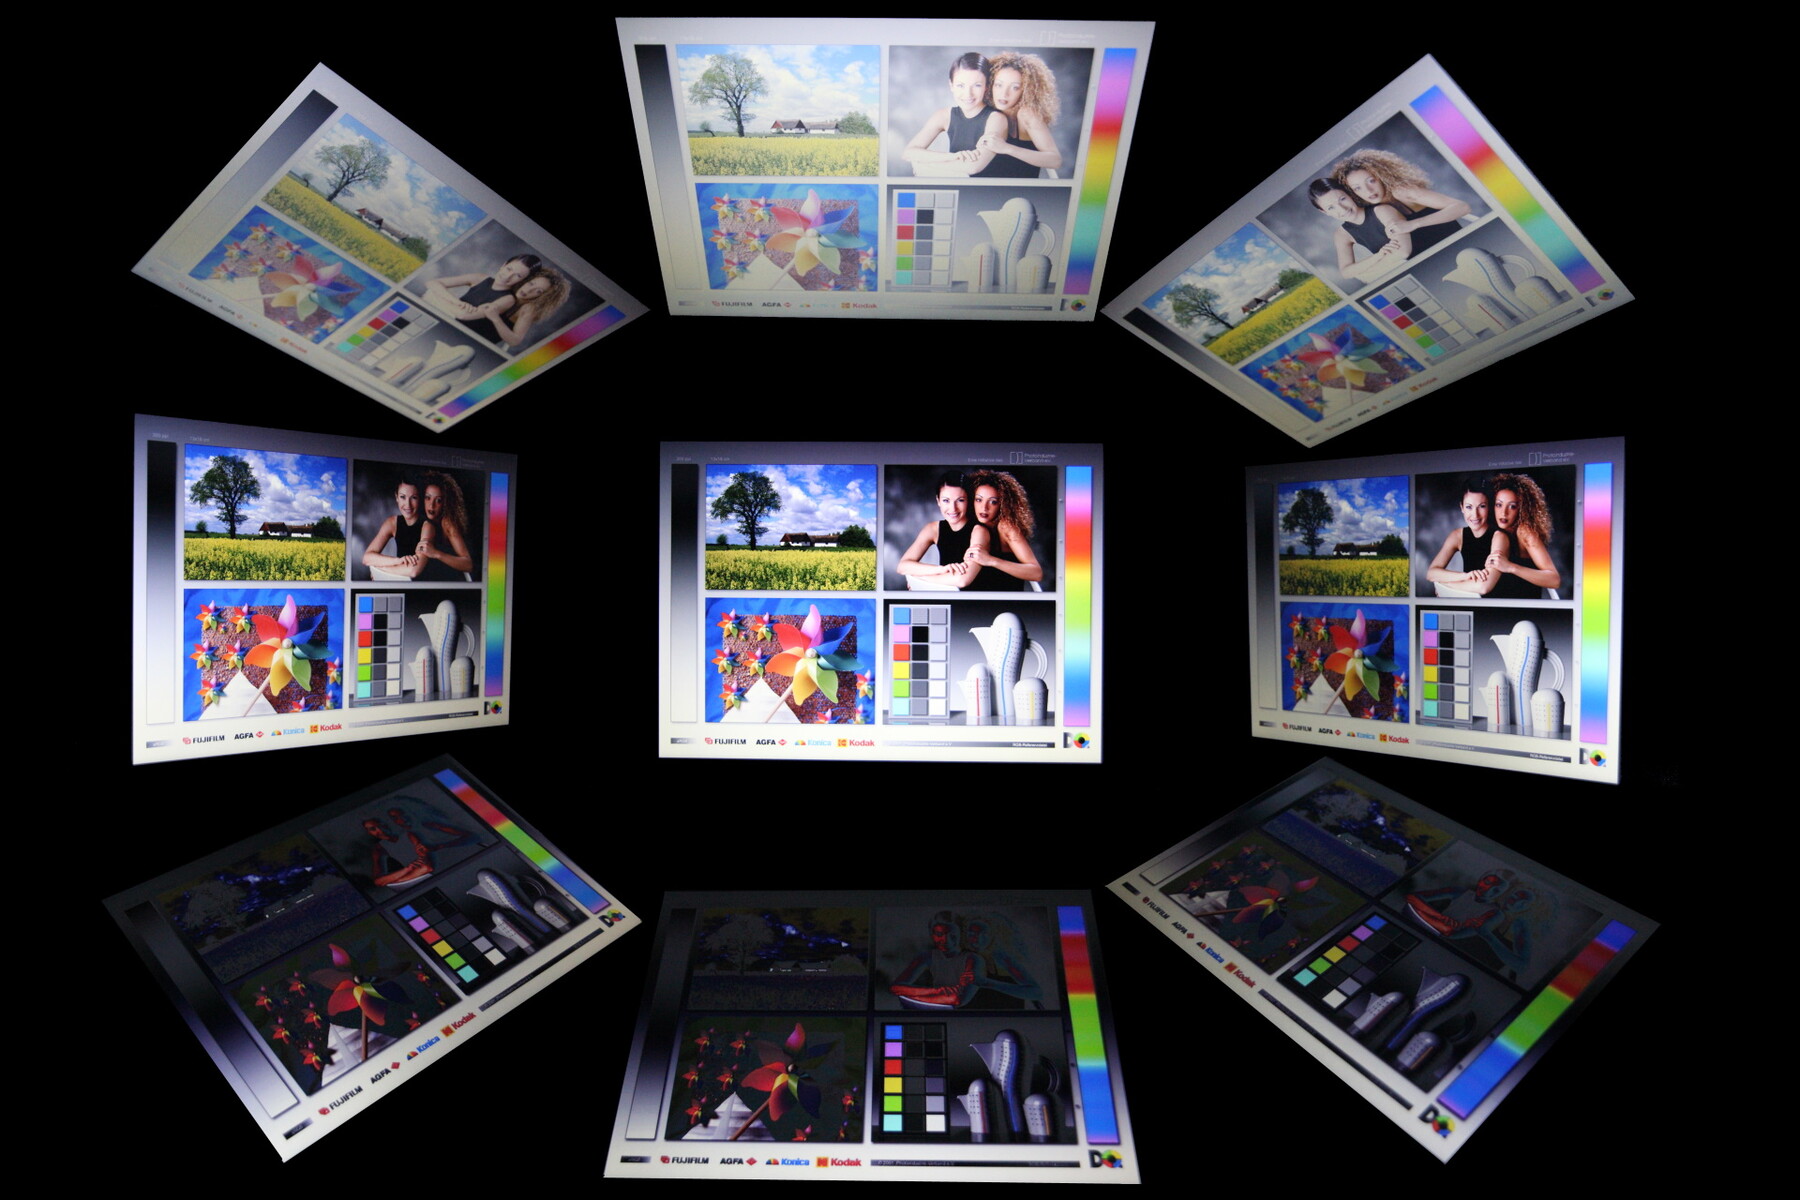
The TN panel suffers from a lack of viewing angle stability. When viewed from the side, the problem is less noticeable, but the view from above or below is extremely unattractive. Especially from above, the picture becomes milky very quickly, all details are lost, when viewed from below everything quickly darkens. It is therefore imperative to ensure that the display lid is optimally positioned, which is only moderately successful, especially on the lap.
Performance - throttle HP
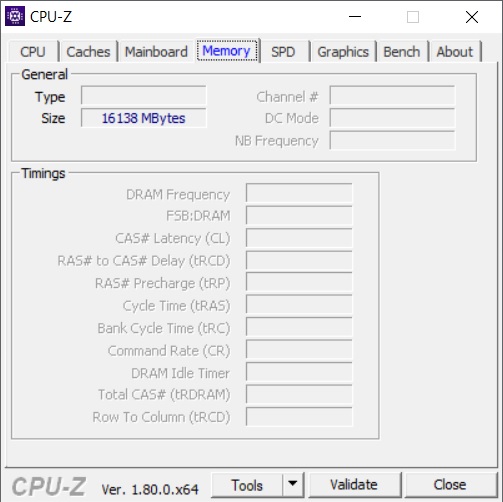
The performance, at least on paper, can be rated as quite high for an office laptop. The Core i7 processor with Ice Lake architecture and Intel Iris Plus G7 graphics should be able to master all tasks of the class with ease, even playing a few less demanding games should be possible. In addition, the performance should theoretically be higher than that of the HP 15s-fq1556ng with a Core i5 and Iris G1 graphics. A 512 GB SSD from Samsung also suggests good performance and a generous 16 GB of RAM promise fast OS handling.
Processor
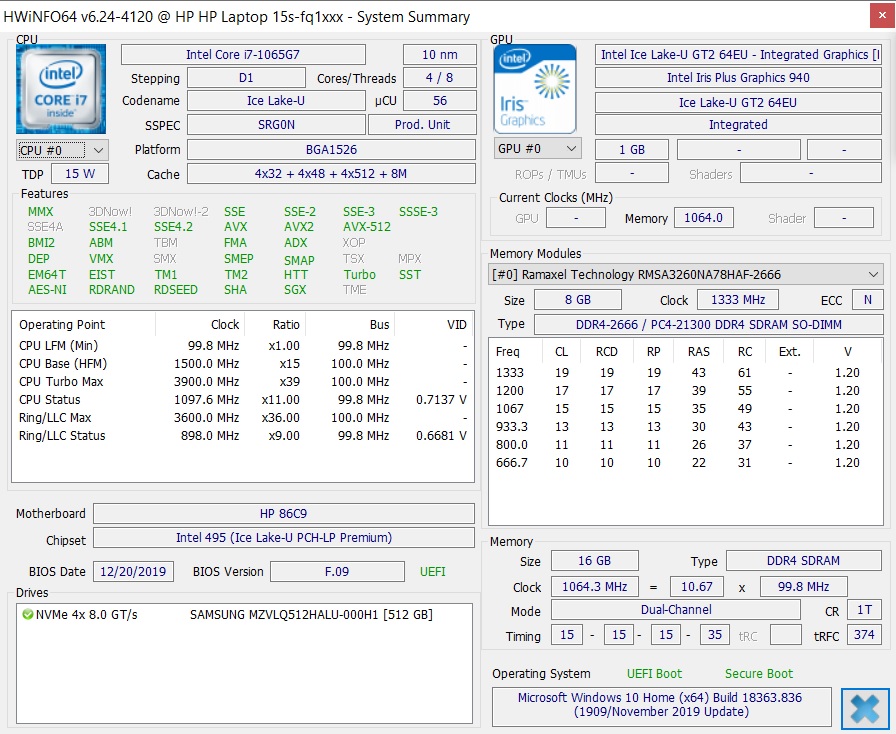
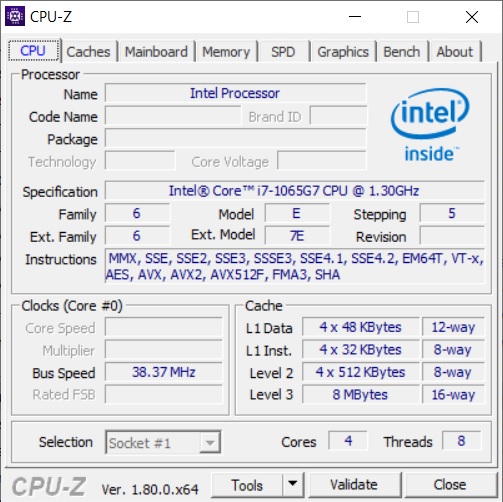
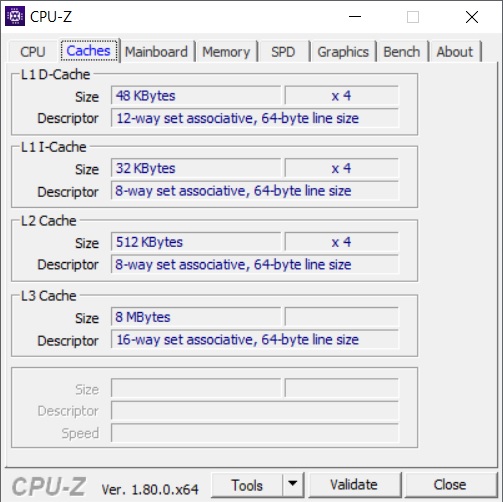
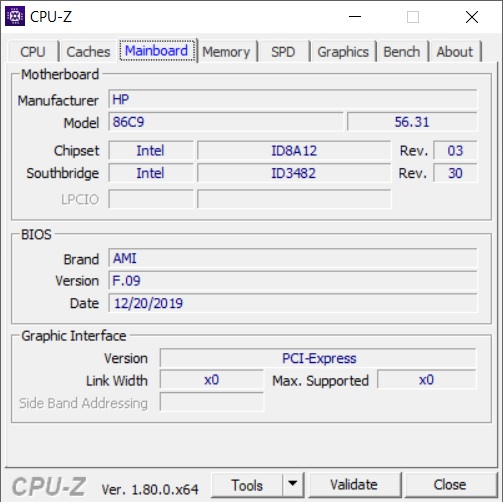
HP installs an Intel Core i7-1065G7 based on the Ice Lake architecture. Intel guarantees a basic clock of economical 1.3 GHz, but if necessary, the four cores can individually clock up to 3.9 GHz, together they still reach 3.5 GHz in Turbo mode.
The Cinebench R15 loop shows the usual behavior: the laptop achieves particularly high values for the first one or two runs, after which the performance levels down further. The starting level is on par with the Core i7-8565U in the Inspiron 15 7000, but the long-term performance is somewhat higher and also exceeds that of the IdeaPad S340 with the same CPU, which however has a significantly higher starting level and is therefore faster for short computing tasks. Fortunately, the apparently wild behavior of the Intel Core i5-1035G1 in the sister model could not be reproduced. This makes a direct comparison of both models difficult, but it seems as if the nominally weaker G1 CPU is on a level with the G7 CPU in our test model.
In battery mode, the power does not decrease significantly, it is about 13 percent lower than usual, but still higher than the constant power over time.
The CPU in the HP 15s practically achieves the expected across all tests, the only difference is in the LibreOffice benchmark (-23 percent).
Cinebench R15: CPU Single 64Bit | CPU Multi 64Bit
Blender: v2.79 BMW27 CPU
7-Zip 18.03: 7z b 4 -mmt1 | 7z b 4
Geekbench 5.5: Single-Core | Multi-Core
HWBOT x265 Benchmark v2.2: 4k Preset
LibreOffice : 20 Documents To PDF
R Benchmark 2.5: Overall mean
| Cinebench R20 / CPU (Single Core) | |
| Average of class Office (345 - 816, n=75, last 2 years) | |
| Microsoft Surface Laptop 3 15 i7-1065G7 | |
| HP 15s-fq1440ng | |
| Lenovo Ideapad S340-15IIL | |
| Average Intel Core i7-1065G7 (358 - 474, n=31) | |
| Dell Inspiron 15 5000 5585 | |
| Cinebench R20 / CPU (Multi Core) | |
| Average of class Office (648 - 8840, n=75, last 2 years) | |
| Microsoft Surface Laptop 3 15 i7-1065G7 | |
| Lenovo Ideapad S340-15IIL | |
| Average Intel Core i7-1065G7 (1081 - 2024, n=31) | |
| Dell Inspiron 15 5000 5585 | |
| HP 15s-fq1440ng | |
| Cinebench R15 / CPU Single 64Bit | |
| Average of class Office (99.5 - 316, n=77, last 2 years) | |
| Dell Inspiron 15 7000 2-in-1 Black Edition | |
| Microsoft Surface Laptop 3 15 i7-1065G7 | |
| Lenovo Ideapad S340-15IIL | |
| HP 15s-fq1440ng | |
| Average Intel Core i7-1065G7 (141 - 190, n=35) | |
| HP 15s-fq1556ng | |
| Dell Inspiron 15 5000 5585 | |
| Cinebench R15 / CPU Multi 64Bit | |
| Average of class Office (250 - 3380, n=77, last 2 years) | |
| Lenovo Ideapad S340-15IIL | |
| Microsoft Surface Laptop 3 15 i7-1065G7 | |
| Dell Inspiron 15 5000 5585 | |
| Average Intel Core i7-1065G7 (288 - 836, n=36) | |
| HP 15s-fq1440ng | |
| Dell Inspiron 15 7000 2-in-1 Black Edition | |
| HP 15s-fq1556ng | |
| Blender / v2.79 BMW27 CPU | |
| HP 15s-fq1440ng | |
| Average Intel Core i7-1065G7 (675 - 1650, n=23) | |
| HP 15s-fq1556ng | |
| Average of class Office (158 - 1940, n=76, last 2 years) | |
| 7-Zip 18.03 / 7z b 4 -mmt1 | |
| Average of class Office (3387 - 6469, n=77, last 2 years) | |
| HP 15s-fq1440ng | |
| Average Intel Core i7-1065G7 (3289 - 4589, n=24) | |
| 7-Zip 18.03 / 7z b 4 | |
| Average of class Office (7098 - 76886, n=77, last 2 years) | |
| Average Intel Core i7-1065G7 (10406 - 22898, n=24) | |
| HP 15s-fq1440ng | |
| Geekbench 5.5 / Single-Core | |
| Average of class Office (811 - 2175, n=73, last 2 years) | |
| HP 15s-fq1440ng | |
| Average Intel Core i7-1065G7 (948 - 1348, n=18) | |
| Geekbench 5.5 / Multi-Core | |
| Average of class Office (1483 - 16999, n=73, last 2 years) | |
| Average Intel Core i7-1065G7 (2464 - 4855, n=18) | |
| HP 15s-fq1440ng | |
| HWBOT x265 Benchmark v2.2 / 4k Preset | |
| Average of class Office (2.21 - 26, n=76, last 2 years) | |
| Average Intel Core i7-1065G7 (2.2 - 6.38, n=22) | |
| HP 15s-fq1440ng | |
| LibreOffice / 20 Documents To PDF | |
| Average Intel Core i7-1065G7 (46.9 - 85.3, n=19) | |
| Average of class Office (39.9 - 102.3, n=76, last 2 years) | |
| HP 15s-fq1440ng | |
| R Benchmark 2.5 / Overall mean | |
| Average Intel Core i7-1065G7 (0.661 - 0.798, n=18) | |
| HP 15s-fq1440ng | |
| Average of class Office (0.393 - 0.888, n=76, last 2 years) | |
* ... smaller is better
System Performance
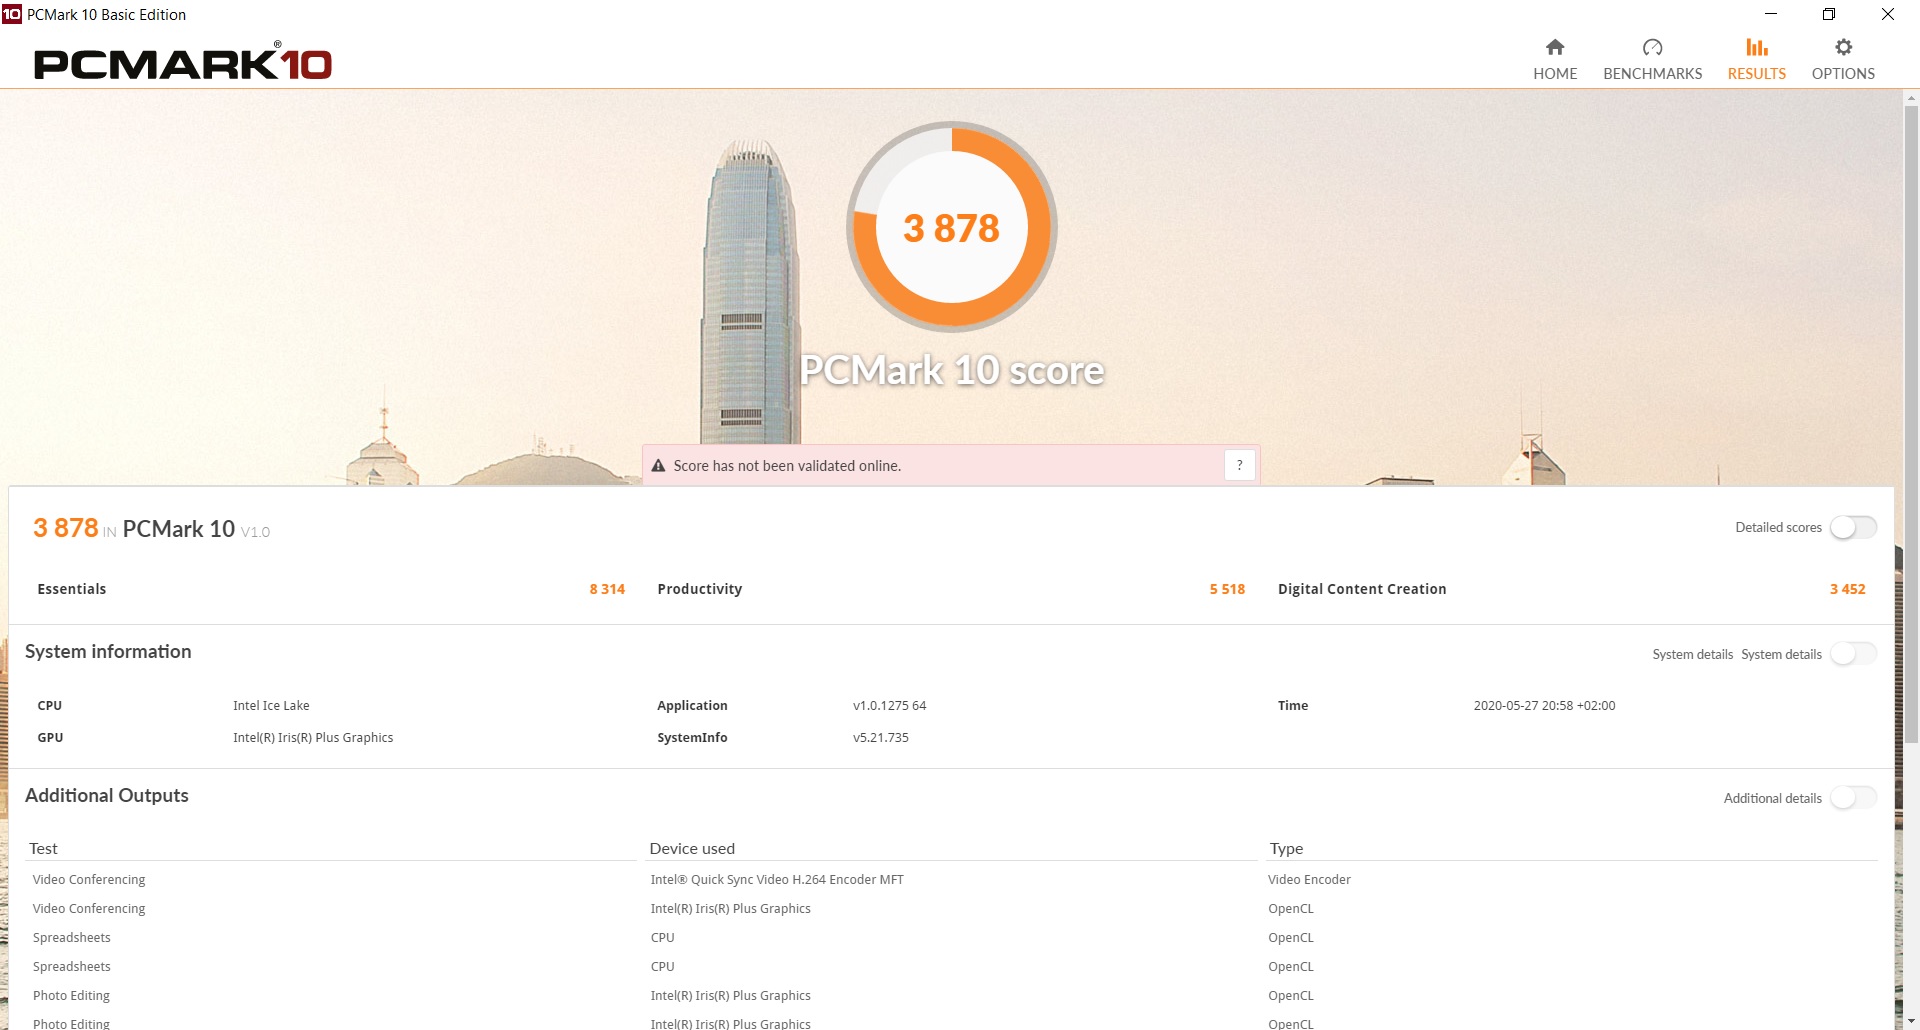
HP's synthetic benchmark scores are about 10 percent lower than the average of all devices with the same CPU. Above all, the Surface 3, but also the Lenovo IdeaPad, are a bit faster from the competition (approx. 15 percent, PCMark 10). In normal everyday work, however, there is no trace of this, all inputs are processed smoothly. The pre-installed HP support assistant can be used to keep the drivers of all components up to date.
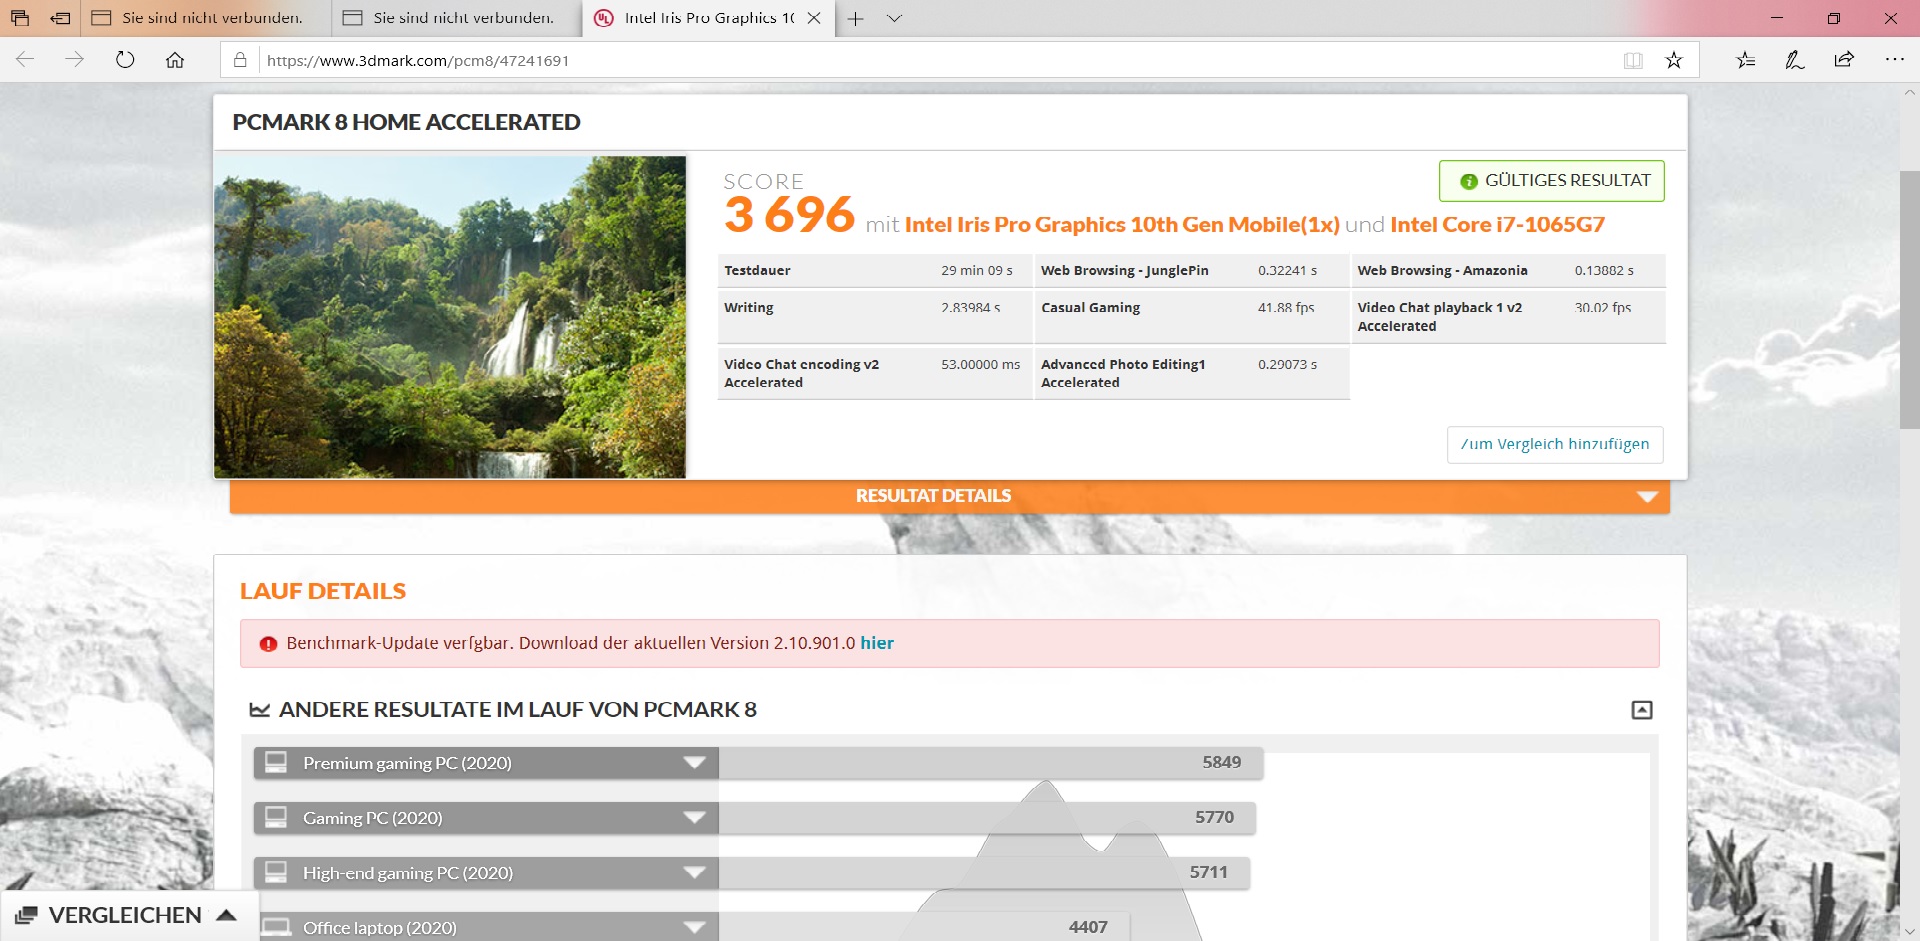
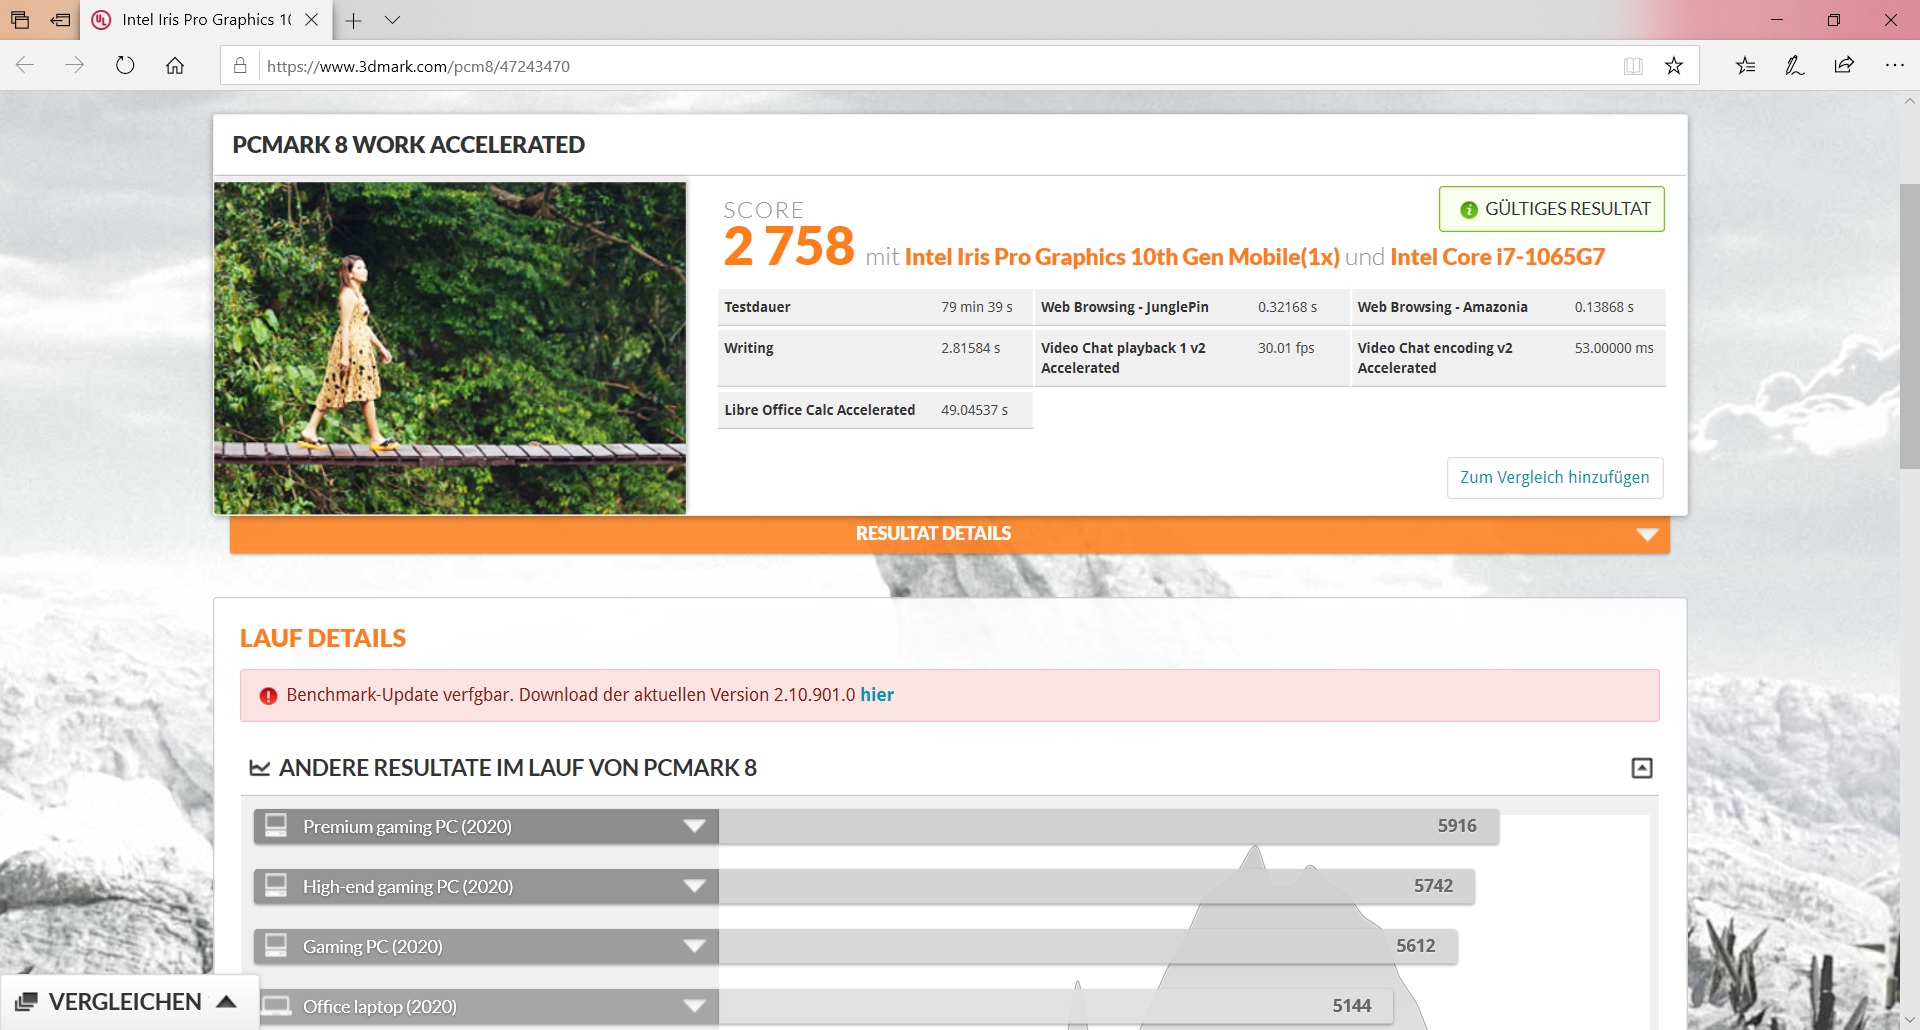
| PCMark 8 Home Score Accelerated v2 | 3696 points | |
| PCMark 8 Work Score Accelerated v2 | 2768 points | |
| PCMark 10 Score | 3878 points | |
Help | ||
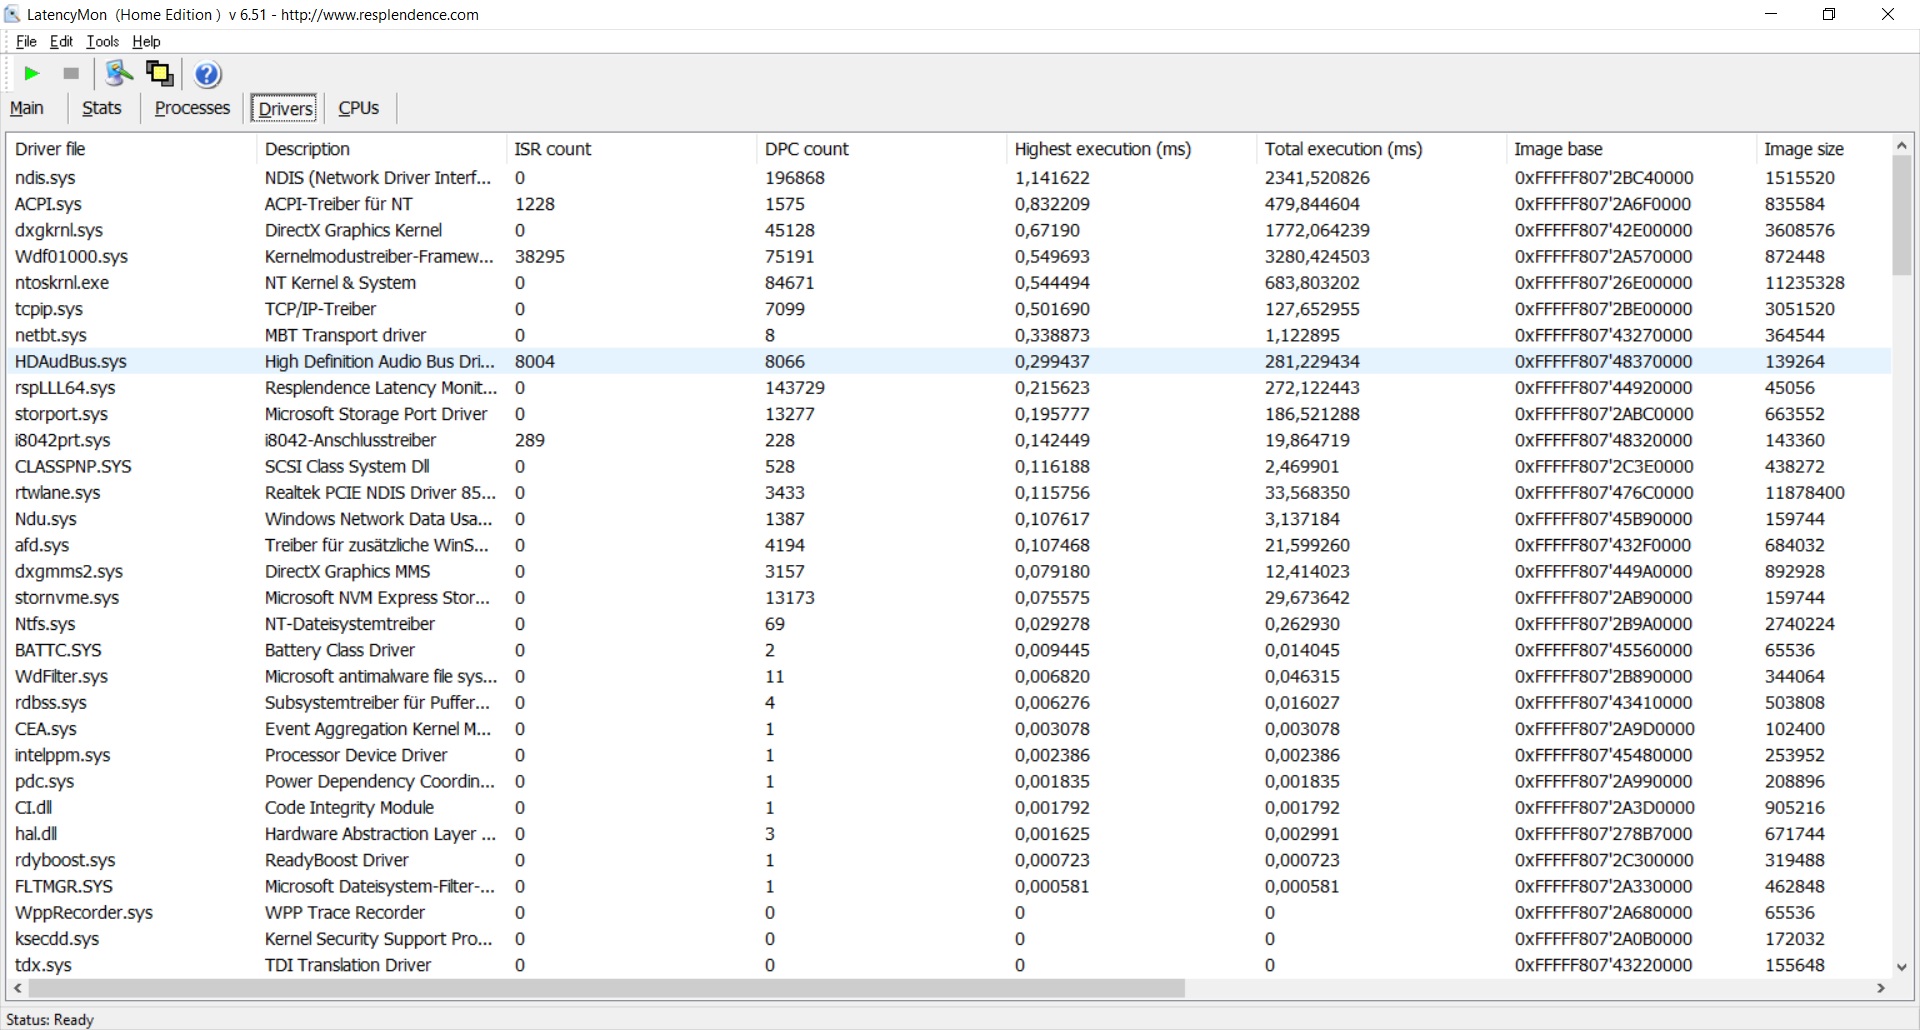
DPC Latencies
Unfortunately, we noticed delays with the LatencyMon tool. The network driver in particular appears to be causing latencies.
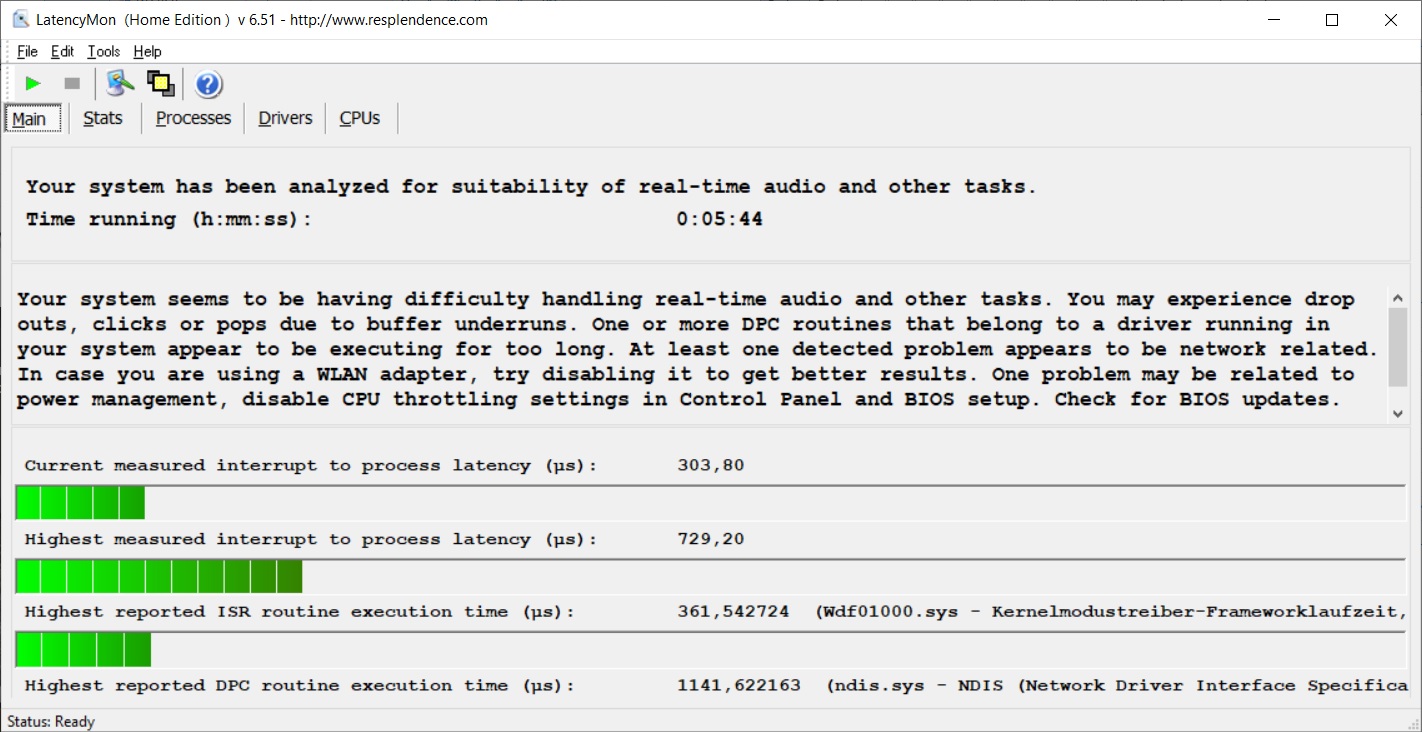
| DPC Latencies / LatencyMon - interrupt to process latency (max), Web, Youtube, Prime95 | |
| HP 15s-fq1440ng | |
* ... smaller is better
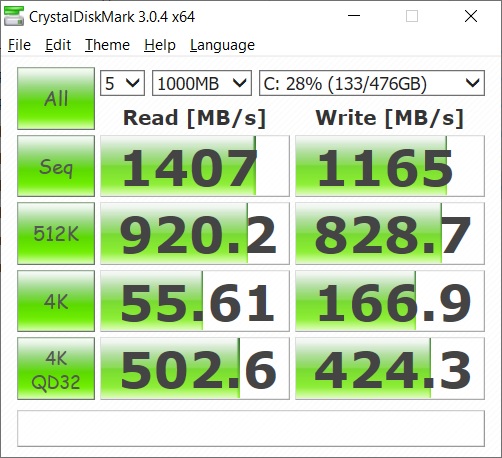
Storage Solution
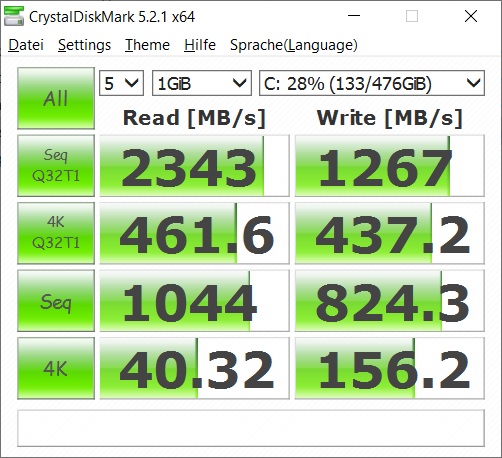
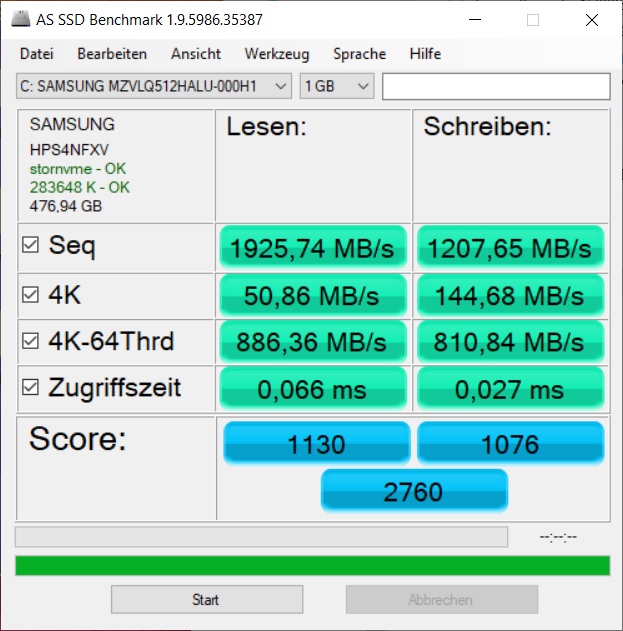
A 512 GB SSD from Samsung is used as storage. It is still a fairly new model, but our results confirm that the memory has a very high performance. Taking all the tests together, it beats the competition. In our SSD / HDD benchmark table there are further test results for storage devices.
| HP 15s-fq1440ng Samsung PM991 MZVLQ512HALU | HP 15s-fq1556ng Intel SSD 660p SSDPEKNW512G8 | Lenovo Ideapad S340-15IIL Intel SSD 660p SSDPEKNW512G8 | Dell Inspiron 15 7000 2-in-1 Black Edition Toshiba BG3 KBG30ZMS256G | Microsoft Surface Laptop 3 15 i7-1065G7 Toshiba KBG40ZNS256G NVMe | Dell Inspiron 15 5000 5585 WDC PC SN520 SDAPNUW-512G | Average Samsung PM991 MZVLQ512HALU | |
|---|---|---|---|---|---|---|---|
| CrystalDiskMark 5.2 / 6 / Write 4K | |||||||
| Write 4K (MB/s) | 156.2 | 203.1 30% | 130.8 -16% | 83.4 -47% | 125 -20% | 105.9 -32% | 131.8 ? -16% |
| CrystalDiskMark 5.2 / 6 / Read 4K | |||||||
| Read 4K (MB/s) | 40.32 | 65.3 62% | 54.8 36% | 32.22 -20% | 54.9 36% | 36.56 -9% | 44.9 ? 11% |
| CrystalDiskMark 5.2 / 6 / Write Seq | |||||||
| Write Seq (MB/s) | 824 | 973 18% | 978 19% | 171.7 -79% | 1220 48% | 1165 41% | 1162 ? 41% |
| CrystalDiskMark 5.2 / 6 / Read Seq | |||||||
| Read Seq (MB/s) | 1044 | 1651 58% | 1627 56% | 924 -11% | 1690 62% | 423.2 -59% | 1473 ? 41% |
| CrystalDiskMark 5.2 / 6 / Write 4K Q32T1 | |||||||
| Write 4K Q32T1 (MB/s) | 437.2 | 526 20% | 450.1 3% | 161.5 -63% | 348.3 -20% | 332.1 -24% | 399 ? -9% |
| CrystalDiskMark 5.2 / 6 / Read 4K Q32T1 | |||||||
| Read 4K Q32T1 (MB/s) | 461.6 | 345.2 -25% | 345.9 -25% | 301.1 -35% | 423.7 -8% | 229.3 -50% | 426 ? -8% |
| CrystalDiskMark 5.2 / 6 / Write Seq Q32T1 | |||||||
| Write Seq Q32T1 (MB/s) | 1267 | 980 -23% | 982 -22% | 222.3 -82% | 1570 24% | 1460 15% | 1348 ? 6% |
| CrystalDiskMark 5.2 / 6 / Read Seq Q32T1 | |||||||
| Read Seq Q32T1 (MB/s) | 2343 | 1883 -20% | 1842 -21% | 1300 -45% | 2378 1% | 472.5 -80% | 2398 ? 2% |
| AS SSD / Seq Read | |||||||
| Seq Read (MB/s) | 1925 | 1705 -11% | 1447 -25% | 1123 -42% | 1756 -9% | 398.9 -79% | 1921 ? 0% |
| AS SSD / Seq Write | |||||||
| Seq Write (MB/s) | 1207 | 904 -25% | 926 -23% | 208.9 -83% | 818 -32% | 884 -27% | 1128 ? -7% |
| AS SSD / 4K Read | |||||||
| 4K Read (MB/s) | 50.9 | 58.5 15% | 40.06 -21% | 27.36 -46% | 52.3 3% | 34.54 -32% | 47.6 ? -6% |
| AS SSD / 4K Write | |||||||
| 4K Write (MB/s) | 144.7 | 165.4 14% | 97.9 -32% | 65 -55% | 112.2 -22% | 82.1 -43% | 137.9 ? -5% |
| AS SSD / 4K-64 Read | |||||||
| 4K-64 Read (MB/s) | 886 | 323.1 -64% | 323.7 -63% | 313.2 -65% | 985 11% | 647 -27% | 878 ? -1% |
| AS SSD / 4K-64 Write | |||||||
| 4K-64 Write (MB/s) | 811 | 827 2% | 791 -2% | 111.2 -86% | 292.7 -64% | 985 21% | 782 ? -4% |
| AS SSD / Access Time Read | |||||||
| Access Time Read * (ms) | 0.066 | 0.056 15% | 0.06 9% | 0.684 -936% | 0.083 -26% | 0.072 -9% | 0.09367 ? -42% |
| AS SSD / Access Time Write | |||||||
| Access Time Write * (ms) | 0.027 | 0.044 -63% | 0.144 -433% | 0.344 -1174% | 0.619 -2193% | 0.047 -74% | 0.03708 ? -37% |
| AS SSD / Score Read | |||||||
| Score Read (Points) | 1130 | 522 -54% | 508 -55% | 453 -60% | 1213 7% | 721 -36% | 1118 ? -1% |
| AS SSD / Score Write | |||||||
| Score Write (Points) | 1076 | 1083 1% | 982 -9% | 197 -82% | 487 -55% | 1155 7% | 1033 ? -4% |
| AS SSD / Score Total | |||||||
| Score Total (Points) | 2760 | 1901 -31% | 1738 -37% | 844 -69% | 2285 -17% | 2279 -17% | 2694 ? -2% |
| AS SSD / Copy ISO MB/s | |||||||
| Copy ISO MB/s (MB/s) | 1384 | 943 -32% | 927 -33% | 1192 -14% | 862 -38% | 1347 ? -3% | |
| AS SSD / Copy Program MB/s | |||||||
| Copy Program MB/s (MB/s) | 344.8 | 612 77% | 206.4 -40% | 604 75% | 457 33% | 421 ? 22% | |
| AS SSD / Copy Game MB/s | |||||||
| Copy Game MB/s (MB/s) | 741 | 826 11% | 360.4 -51% | 1136 53% | 902 22% | 825 ? 11% | |
| Total Average (Program / Settings) | -4% /
-4% | -28% /
-28% | -146% /
-146% | -98% /
-98% | -23% /
-23% | -1% /
-1% |
* ... smaller is better

Continuous reading: DiskSpd Read Loop, Queue Depth 8
Graphics card
The Intel Iris Plus Graphics G7 integrated in the processor functions as the graphics card. It marks the best performing Iris variant and is said to clearly outperform the older Intel HD Graphics. Even AMD's Vega 10 is said to be the loser in comparison, but of course the speed mainly depends on the clock speed of the processor. The performance should be sufficient for older or less demanding titles such as "Fortnite" or "Rocket League".
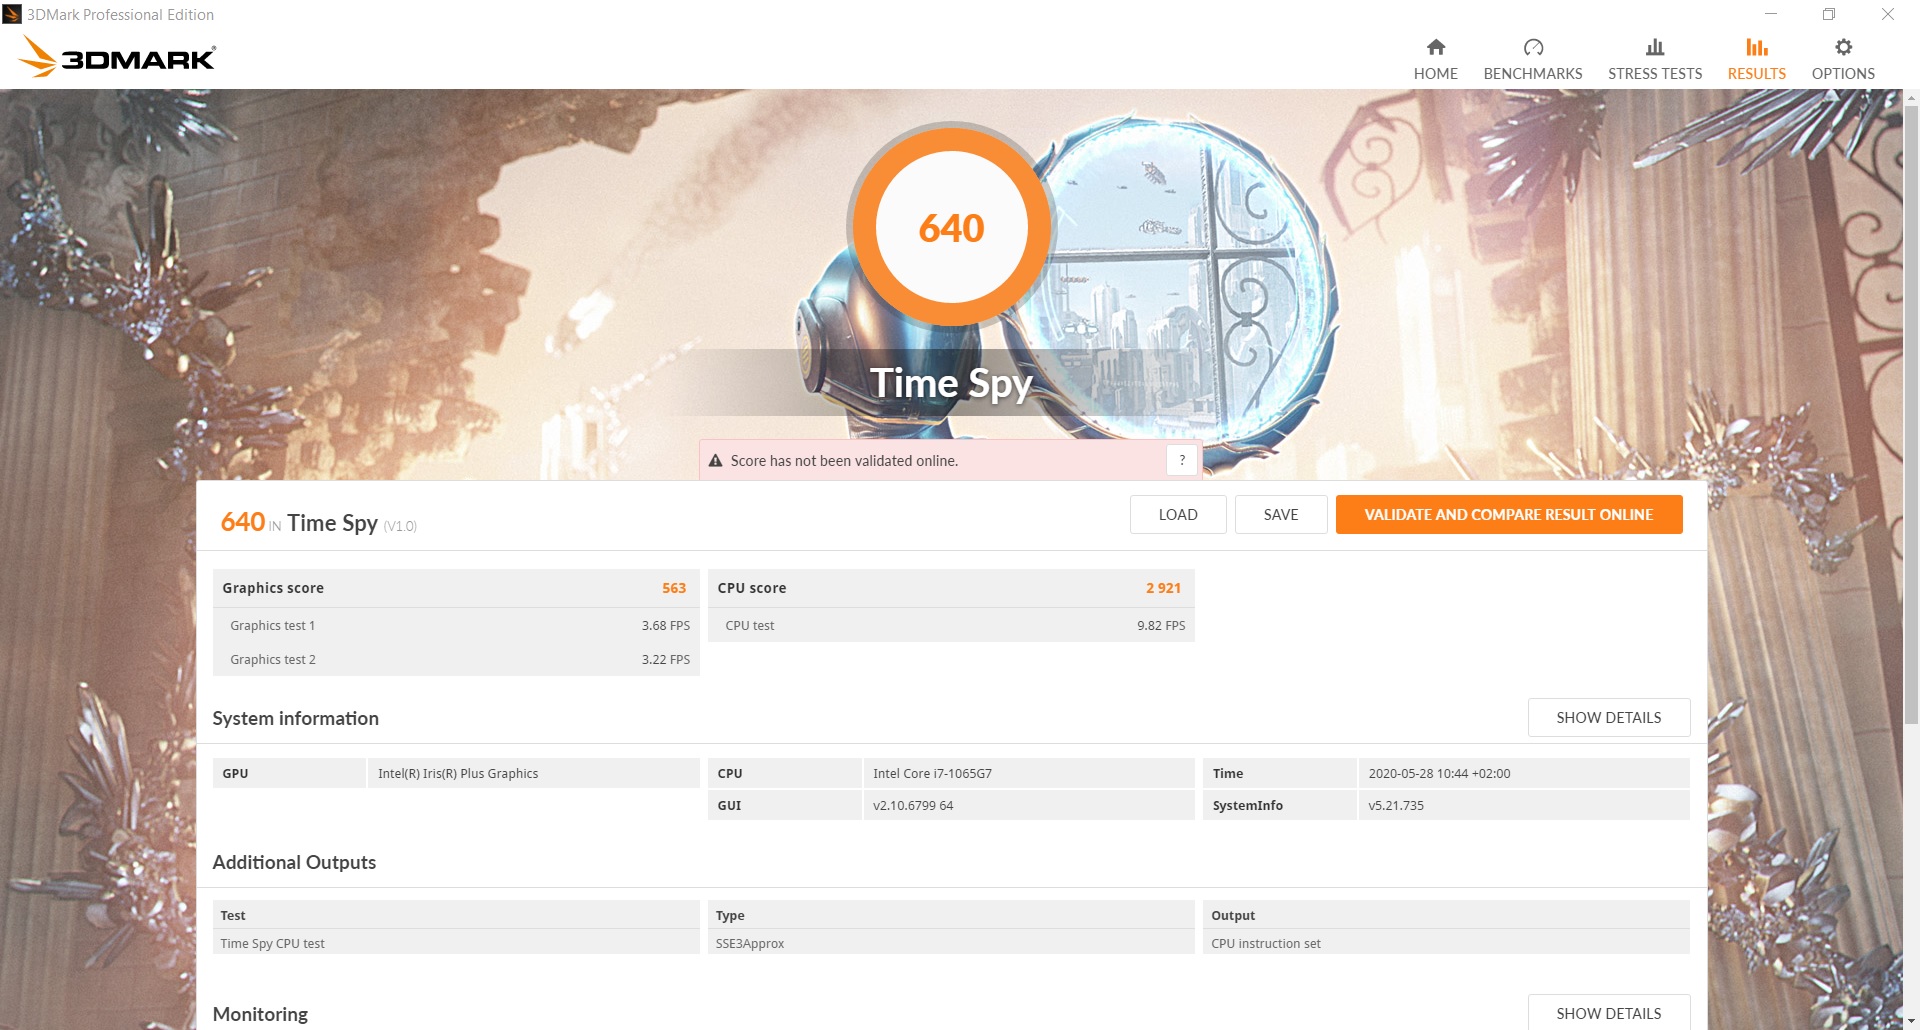
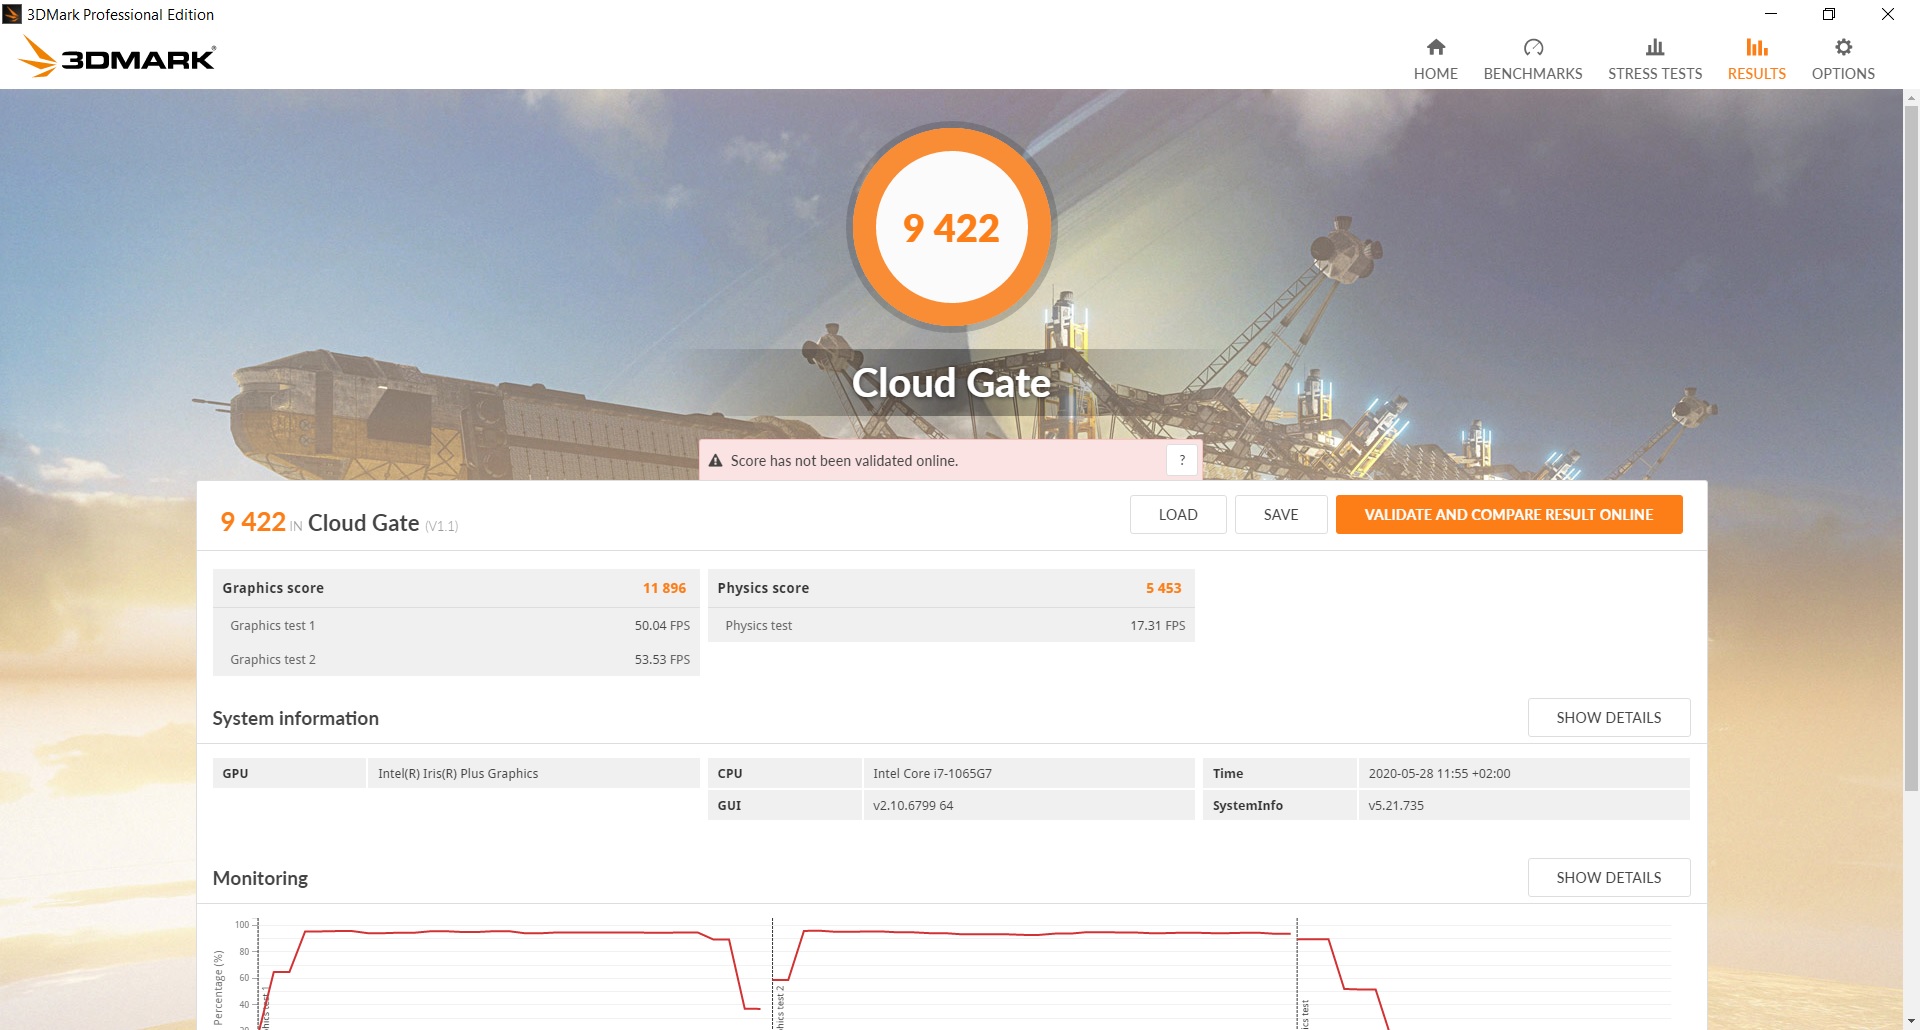
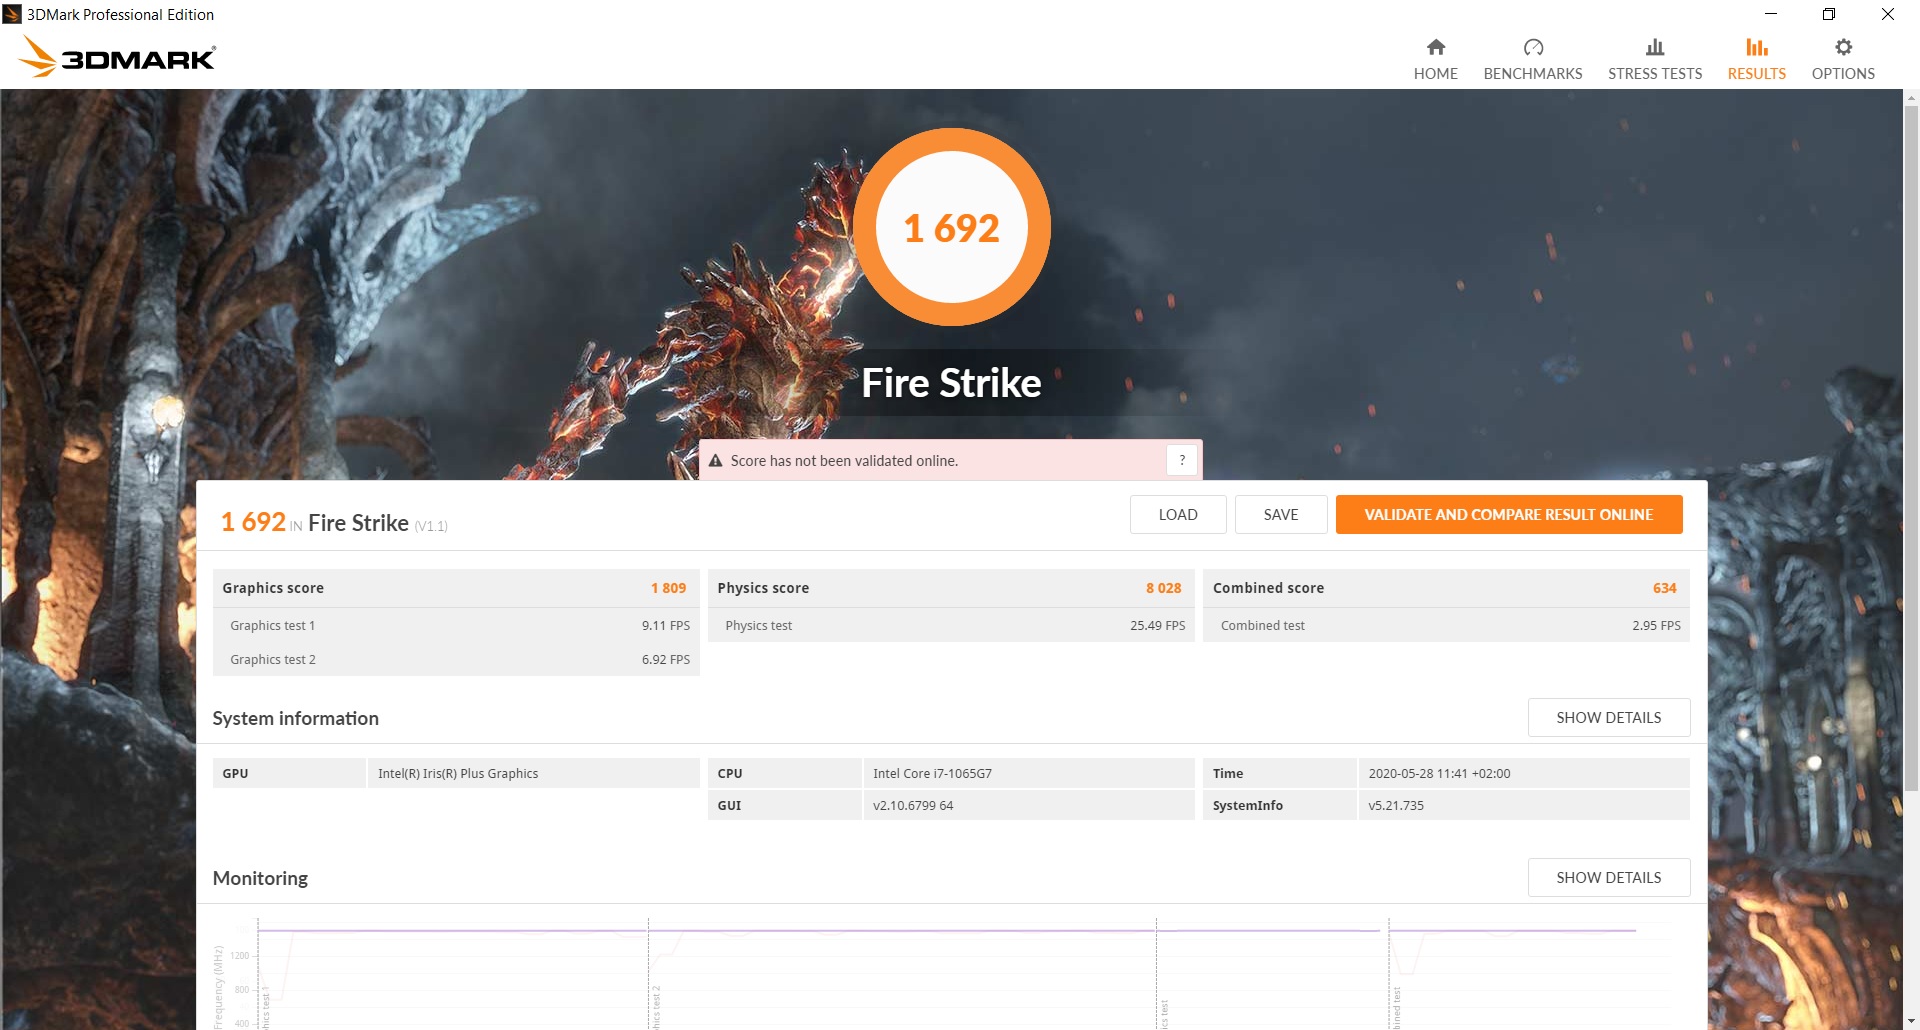
With the 3DMarks, the Iris Plus G7 does not reach its full potential and is 15 to 25 percent behind its reference model. Apparently, HP is not delivering on Intel's promises and is throttling the GPU performance instead. This puts the competition with AMD Vega 10 and GeForce MX150 clearly ahead. The also throttled IdeaPad with the same graphics is about 15 percent ahead of the HP. Only the Surface 3 shows what the new Intel GPU can do with a performance increase of up to 50 percent compared to the throttle variants! The sister model with Iris Plus G1 is about 30 percent behind. Even worse: the Acer Swift 3 despite less potent Vega 7 is at the top of almost all 3DMark tests, unnecessarily all potentially higher quality graphics cards fade due to strong throttling.
Apart from the socket, the GPU continues to lose performance, the lag to power operation is about 20 percent.
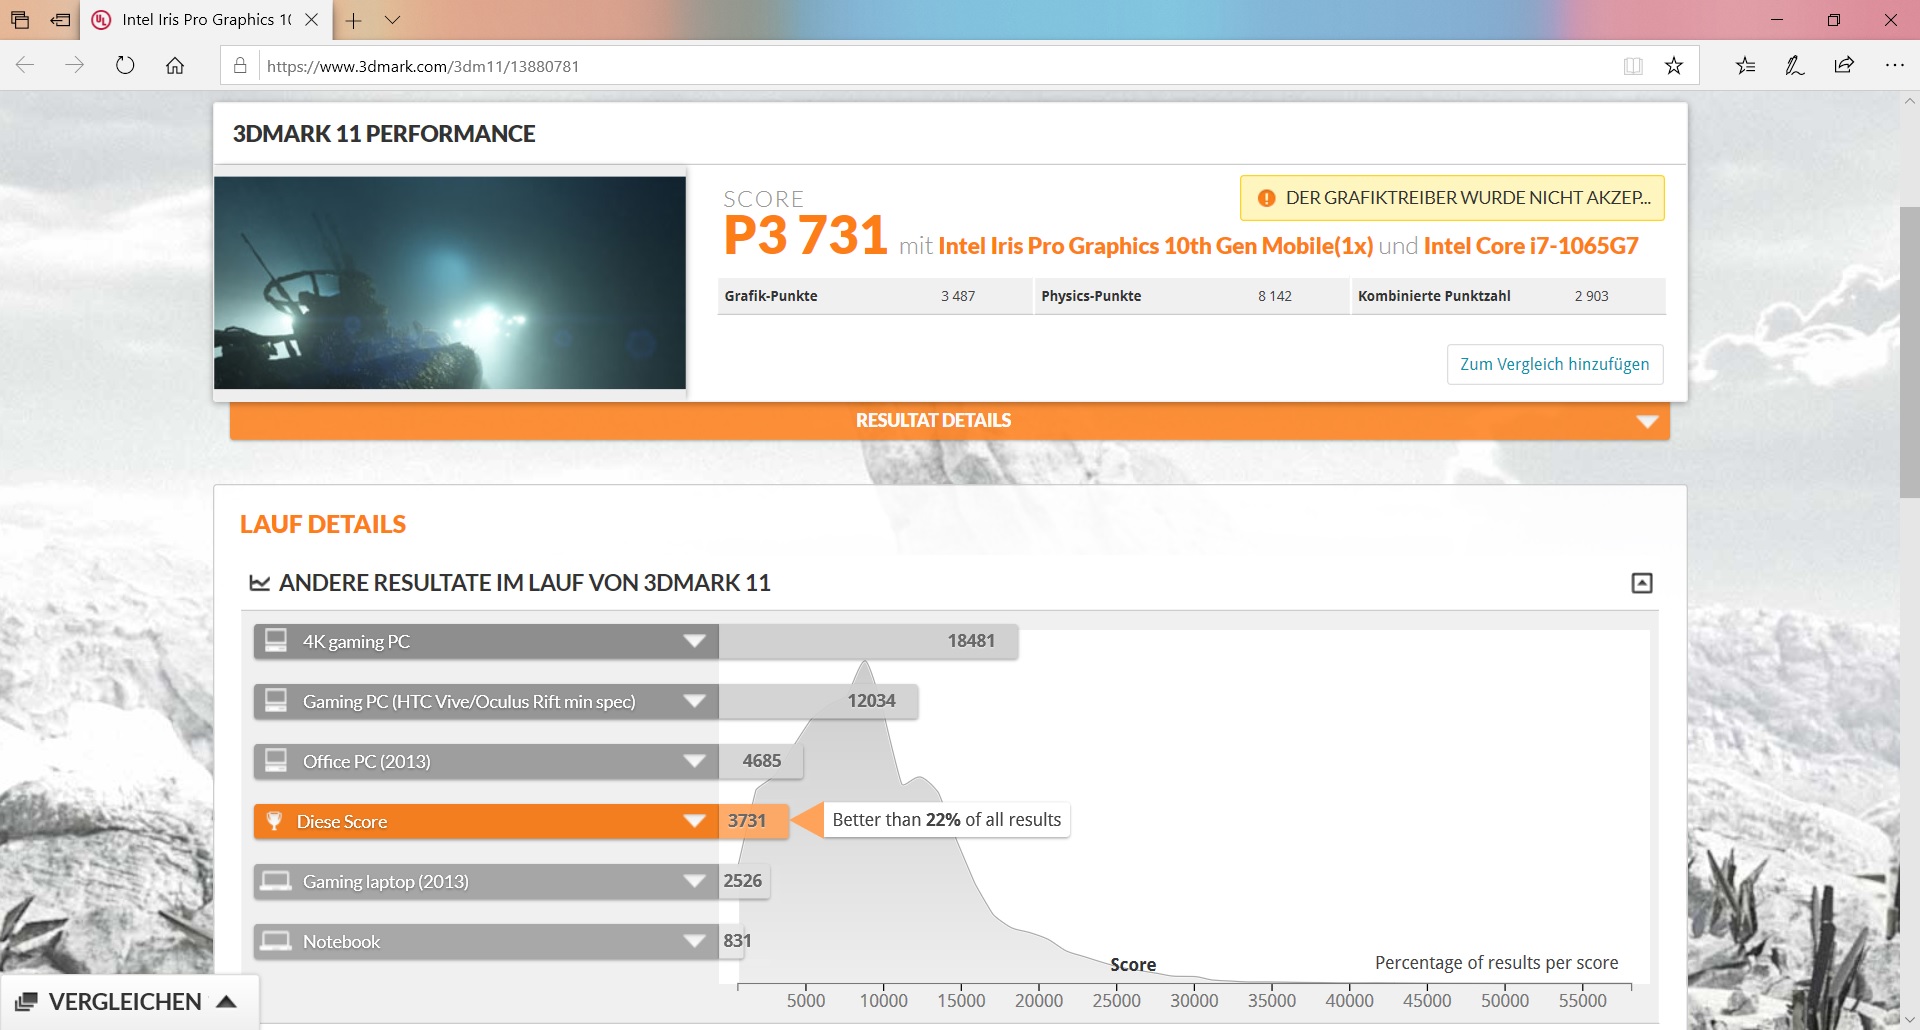
| 3DMark 11 Performance | 3731 points | |
| 3DMark Cloud Gate Standard Score | 9422 points | |
| 3DMark Fire Strike Score | 1692 points | |
| 3DMark Time Spy Score | 640 points | |
Help | ||
Gaming Performance
The graphics performance is also disappointing in games. "The Witcher 3" can be played in the lowest resolution and the lowest details only. The Surface 3 with the same GPU has 40 to 50 percent more frames in "The Witcher 3" and can also set medium details here. The Surface 3 can display "Rocket League" in the highest details in Full HD, our HP 15s only with medium details (around 40 percent behind). Far Cry 5 does not run smoothly.
Overall, the gaming performance is disappointing because the potential of the GPU is untapped. Although the GPU is still faster than the old HD graphics from Intel, the throttling in the HP means it has no chance compared to AMD's Vega 10 or Nvidia's MX150 or even Vega 7 in the Acer Swift 3. Accordingly, the performance suffices only for little details and low resolutions, newer and more demanding titles do not run smoothly.
| low | med. | high | ultra | |
|---|---|---|---|---|
| The Witcher 3 (2015) | 38.7 | 21.9 | 13.3 | 7.4 |
| Dota 2 Reborn (2015) | 71.5 | 45.6 | 29.4 | 27.4 |
| Rocket League (2017) | 67.3 | 48 | 28.9 | |
| X-Plane 11.11 (2018) | 33.6 | 18.7 | 17.3 | |
| Far Cry 5 (2018) | 22 | 12 | 11 | 10 |
Emissions - cool, but unbalanced
Noise emissions
The fan control was one of the weak points in the test of the HP 15s-fq1556ng and this is no different with our current test model. The fans are sometimes completely silent, but then apparently rise to full load for no apparent reason. For example, the fan briefly activates to full power after Windows has started up only to deactivate some time later.
The fan volume itself is not higher than that of the competition, but the control seems to only know the "off" and "full steam" states and to switch them around, at least in idle, quite arbitrarily. Particularly sensitive people might notice that the fans seem to pulsate minimally, but you would have to be very attentive.
Noise level
| Idle |
| 31.2 / 31.2 / 31.2 dB(A) |
| Load |
| 36 / 40.7 dB(A) |
 | ||
30 dB silent 40 dB(A) audible 50 dB(A) loud |
||
min: | ||
| HP 15s-fq1440ng Iris Plus Graphics G7 (Ice Lake 64 EU), i7-1065G7, Samsung PM991 MZVLQ512HALU | HP 15s-fq1556ng UHD Graphics G1 (Ice Lake 32 EU), i5-1035G1, Intel SSD 660p SSDPEKNW512G8 | Microsoft Surface Laptop 3 15 i7-1065G7 Iris Plus Graphics G7 (Ice Lake 64 EU), i7-1065G7, Toshiba KBG40ZNS256G NVMe | Lenovo Ideapad S340-15IIL Iris Plus Graphics G7 (Ice Lake 64 EU), i7-1065G7, Intel SSD 660p SSDPEKNW512G8 | Dell Inspiron 15 5000 5585 Vega 10, R7 3700U, WDC PC SN520 SDAPNUW-512G | Dell Inspiron 15 7000 2-in-1 Black Edition GeForce MX150, i7-8565U, Toshiba BG3 KBG30ZMS256G | |
|---|---|---|---|---|---|---|
| Noise | 3% | 9% | 11% | 8% | -3% | |
| off / environment * (dB) | 31.2 | 30.3 3% | 28.5 9% | 28.5 9% | 28.3 9% | 28 10% |
| Idle Minimum * (dB) | 31.2 | 30.3 3% | 28.5 9% | 28.5 9% | 28.3 9% | 28 10% |
| Idle Average * (dB) | 31.2 | 30.3 3% | 28.5 9% | 28.5 9% | 28.3 9% | 28 10% |
| Idle Maximum * (dB) | 31.2 | 30.3 3% | 28.7 8% | 28.5 9% | 28.3 9% | 28.4 9% |
| Load Average * (dB) | 36 | 34 6% | 30 17% | 30.3 16% | 31.4 13% | 48.6 -35% |
| Load Maximum * (dB) | 40.7 | 41.3 -1% | 41.2 -1% | 35.5 13% | 41.4 -2% | 49.2 -21% |
| Witcher 3 ultra * (dB) | 39.2 | 41.4 | 47.9 |
* ... smaller is better
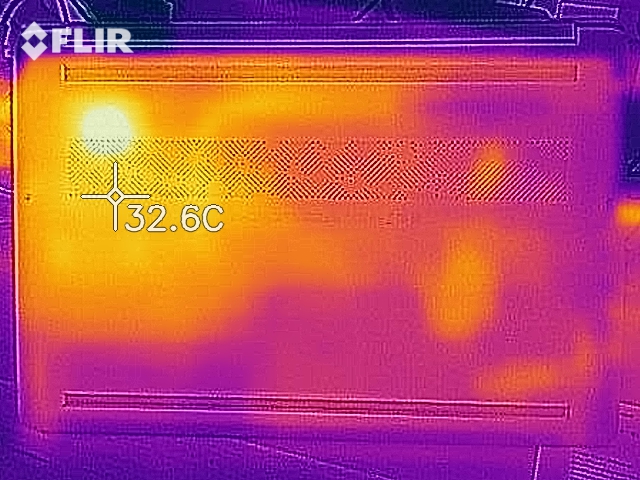
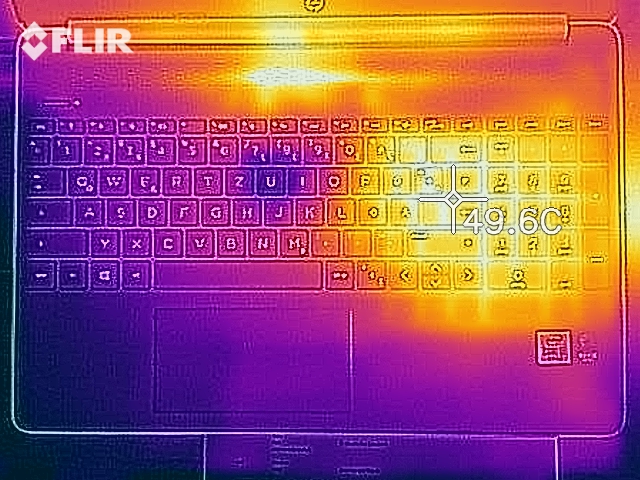
Temperature
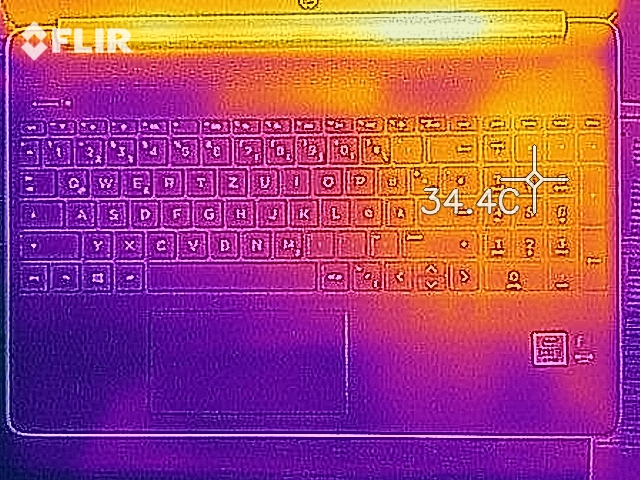
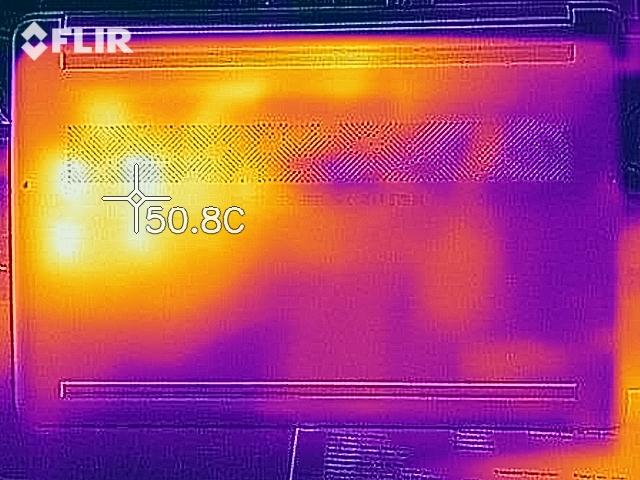
Fortunately, the device never gets really hot on the surface, the maximum temperature is 40 degrees Celsius (~104 degrees Fahrenheit), but the bottom is warmest, which can be uncomfortable on the lap with a lot of load. The palm rests always stay cool, the right side of the keyboard gets a little warmer.
(+) The maximum temperature on the upper side is 38.6 °C / 101 F, compared to the average of 34.3 °C / 94 F, ranging from 21.2 to 62.5 °C for the class Office.
(±) The bottom heats up to a maximum of 40.2 °C / 104 F, compared to the average of 36.8 °C / 98 F
(+) In idle usage, the average temperature for the upper side is 24.6 °C / 76 F, compared to the device average of 29.5 °C / 85 F.
(+) The palmrests and touchpad are cooler than skin temperature with a maximum of 25.5 °C / 77.9 F and are therefore cool to the touch.
(+) The average temperature of the palmrest area of similar devices was 27.6 °C / 81.7 F (+2.1 °C / 3.8 F).
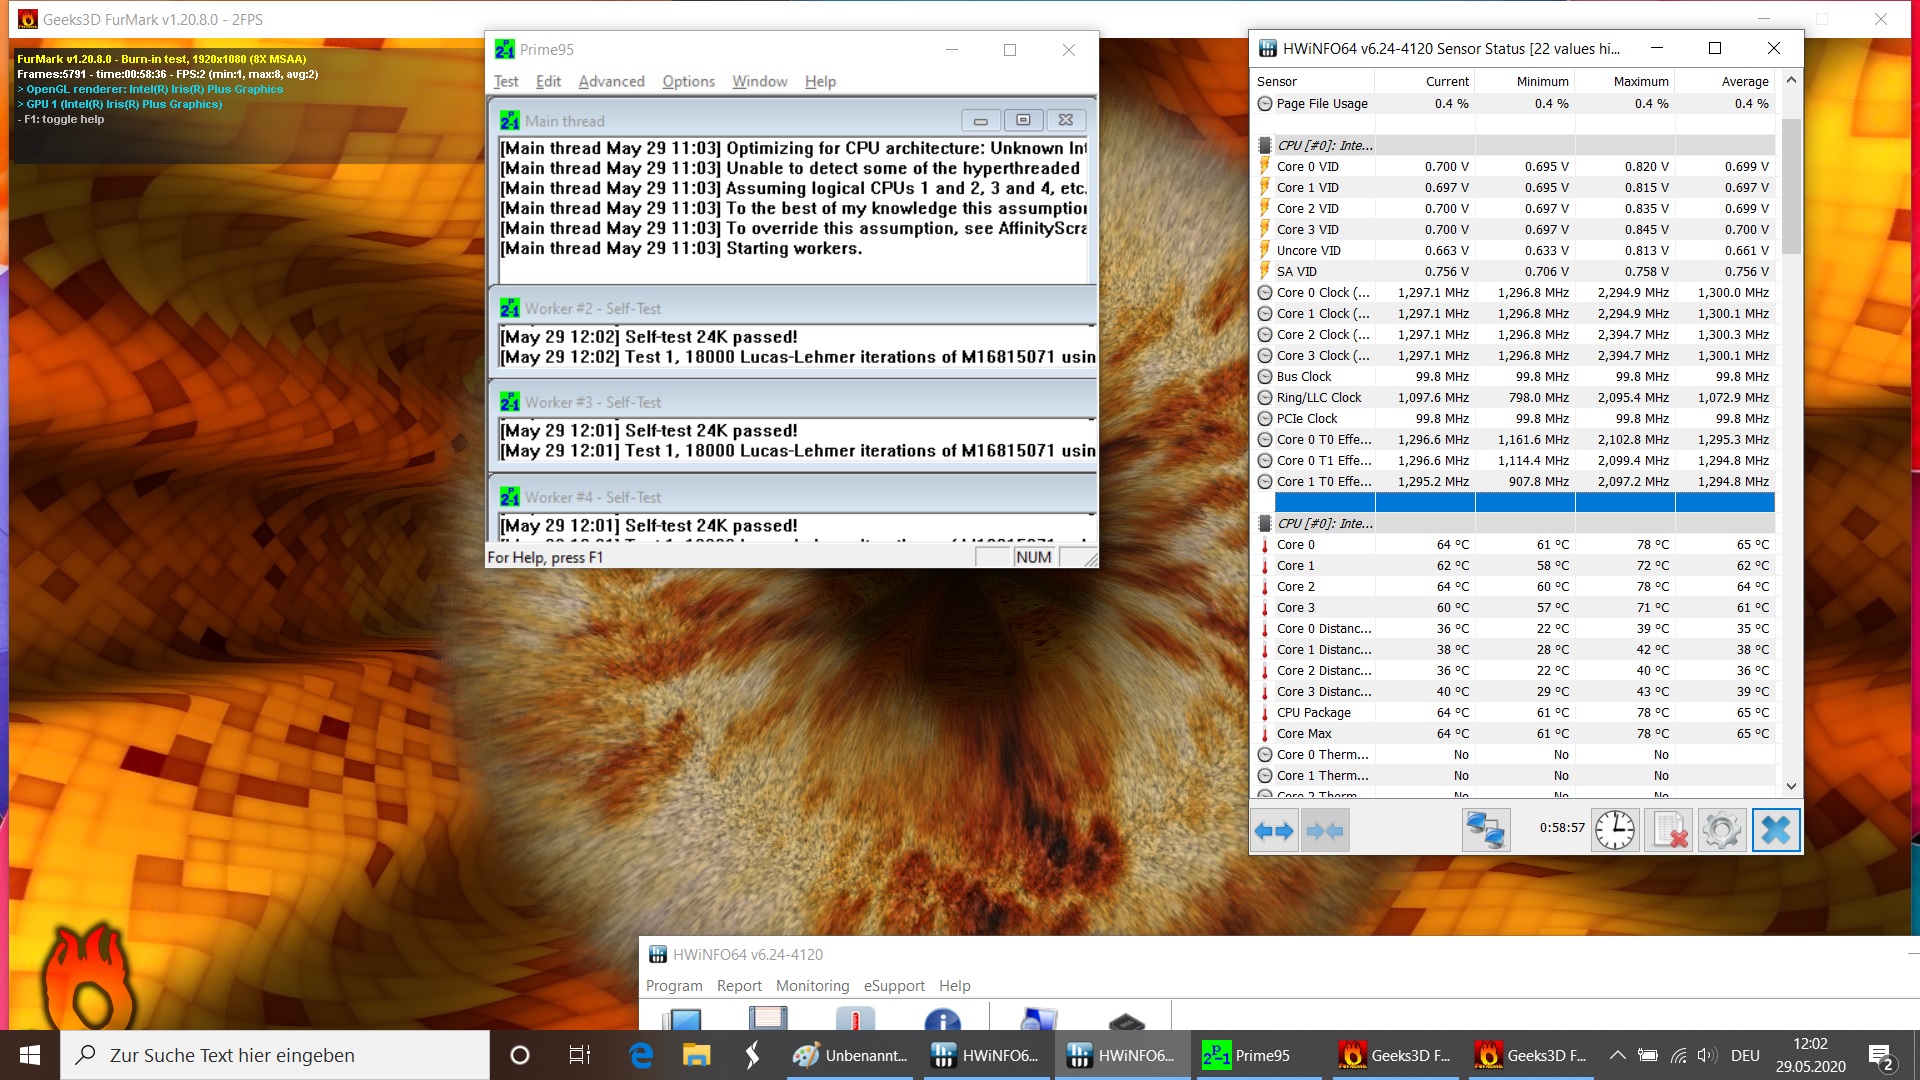
The HP only does the bare essentials in the stress test. In fact, one can say positively that it keeps the guaranteed base clock of 1.3 GHz. However, it breaks down to this clock rate right from the start and never performs more than that. The core temperatures of the CPU are only around 62 degrees Celsius (~144 degrees Fahrenheit) after 1 hour, so the system is not nearly fully occupied.
Speakers
HP installs stereo speakers, which are generally too quiet. Also, at full volume they sound tinny and distorted. There is hardly any bass noticeable. You should therefore use the combined jack connection (or Bluetooth) to use external devices (headphones, external speakers) for sound output.
HP 15s-fq1440ng audio analysis
(±) | speaker loudness is average but good (72.4 dB)
Bass 100 - 315 Hz
(-) | nearly no bass - on average 19.3% lower than median
(±) | linearity of bass is average (12.3% delta to prev. frequency)
Mids 400 - 2000 Hz
(+) | balanced mids - only 3.2% away from median
(±) | linearity of mids is average (7.3% delta to prev. frequency)
Highs 2 - 16 kHz
(+) | balanced highs - only 2.3% away from median
(+) | highs are linear (4.3% delta to prev. frequency)
Overall 100 - 16.000 Hz
(±) | linearity of overall sound is average (18.3% difference to median)
Compared to same class
» 33% of all tested devices in this class were better, 6% similar, 61% worse
» The best had a delta of 7%, average was 21%, worst was 53%
Compared to all devices tested
» 40% of all tested devices were better, 8% similar, 52% worse
» The best had a delta of 4%, average was 23%, worst was 134%
Microsoft Surface Laptop 3 15 i7-1065G7 audio analysis
(±) | speaker loudness is average but good (80.5 dB)
Bass 100 - 315 Hz
(±) | reduced bass - on average 5.3% lower than median
(±) | linearity of bass is average (10.3% delta to prev. frequency)
Mids 400 - 2000 Hz
(+) | balanced mids - only 2.7% away from median
(+) | mids are linear (6.7% delta to prev. frequency)
Highs 2 - 16 kHz
(+) | balanced highs - only 2.7% away from median
(±) | linearity of highs is average (8.5% delta to prev. frequency)
Overall 100 - 16.000 Hz
(+) | overall sound is linear (11.7% difference to median)
Compared to same class
» 4% of all tested devices in this class were better, 2% similar, 95% worse
» The best had a delta of 7%, average was 21%, worst was 53%
Compared to all devices tested
» 8% of all tested devices were better, 3% similar, 89% worse
» The best had a delta of 4%, average was 23%, worst was 134%
Lenovo Ideapad S340-15IIL audio analysis
(+) | speakers can play relatively loud (83.4 dB)
Bass 100 - 315 Hz
(-) | nearly no bass - on average 21.2% lower than median
(±) | linearity of bass is average (11.4% delta to prev. frequency)
Mids 400 - 2000 Hz
(+) | balanced mids - only 4.8% away from median
(±) | linearity of mids is average (7% delta to prev. frequency)
Highs 2 - 16 kHz
(+) | balanced highs - only 2.5% away from median
(+) | highs are linear (4% delta to prev. frequency)
Overall 100 - 16.000 Hz
(±) | linearity of overall sound is average (22% difference to median)
Compared to same class
» 78% of all tested devices in this class were better, 4% similar, 17% worse
» The best had a delta of 5%, average was 17%, worst was 45%
Compared to all devices tested
» 64% of all tested devices were better, 6% similar, 30% worse
» The best had a delta of 4%, average was 23%, worst was 134%
Dell Inspiron 15 7000 2-in-1 Black Edition audio analysis
(±) | speaker loudness is average but good (78.7 dB)
Bass 100 - 315 Hz
(-) | nearly no bass - on average 15% lower than median
(±) | linearity of bass is average (14% delta to prev. frequency)
Mids 400 - 2000 Hz
(+) | balanced mids - only 4.5% away from median
(+) | mids are linear (6% delta to prev. frequency)
Highs 2 - 16 kHz
(+) | balanced highs - only 2.9% away from median
(±) | linearity of highs is average (10.6% delta to prev. frequency)
Overall 100 - 16.000 Hz
(±) | linearity of overall sound is average (18.1% difference to median)
Compared to same class
» 54% of all tested devices in this class were better, 8% similar, 38% worse
» The best had a delta of 5%, average was 17%, worst was 45%
Compared to all devices tested
» 39% of all tested devices were better, 8% similar, 54% worse
» The best had a delta of 4%, average was 23%, worst was 134%
Energy management - increased idle consumption
Power consumption
The HP 15s-fq1440ng consumes almost as much as the HP 15s-fq1556ng under load, despite the more powerful components. But in idle, our test model consumes almost a third more than the other HP. The rest of the competition is also significantly more economical here. This may also be due to the unbalanced fan control. The maximum power consumption is around 45 watts. However, these peak loads are only rarely reached, the average consumption under load is only 31 watts, which is why the power supply of 45 watts should be sufficiently large.
| Off / Standby | |
| Idle | |
| Load |
|
Key:
min: | |
| HP 15s-fq1440ng i7-1065G7, Iris Plus Graphics G7 (Ice Lake 64 EU), Samsung PM991 MZVLQ512HALU, TN, 1920x1080, 15.6" | HP 15s-fq1556ng i5-1035G1, UHD Graphics G1 (Ice Lake 32 EU), Intel SSD 660p SSDPEKNW512G8, IPS, 1920x1080, 15.6" | Lenovo Ideapad S340-15IIL i7-1065G7, Iris Plus Graphics G7 (Ice Lake 64 EU), Intel SSD 660p SSDPEKNW512G8, IPS, 1920x1080, 15.6" | Dell Inspiron 15 7000 2-in-1 Black Edition i7-8565U, GeForce MX150, Toshiba BG3 KBG30ZMS256G, IPS, 3840x2160, 15.6" | Microsoft Surface Laptop 3 15 i7-1065G7 i7-1065G7, Iris Plus Graphics G7 (Ice Lake 64 EU), Toshiba KBG40ZNS256G NVMe, IPS, 2496x1664, 15" | Dell Inspiron 15 5000 5585 R7 3700U, Vega 10, WDC PC SN520 SDAPNUW-512G, IPS, 1920x1080, 15.6" | Average Intel Iris Plus Graphics G7 (Ice Lake 64 EU) | Average of class Office | |
|---|---|---|---|---|---|---|---|---|
| Power Consumption | 23% | 9% | -14% | -6% | 15% | 6% | -3% | |
| Idle Minimum * (Watt) | 6.9 | 3.3 52% | 3.8 45% | 4.2 39% | 4.4 36% | 4.2 39% | 3.91 ? 43% | 4.25 ? 38% |
| Idle Average * (Watt) | 9.2 | 6.4 30% | 6.9 25% | 7.8 15% | 8.3 10% | 6.8 26% | 7.33 ? 20% | 7.3 ? 21% |
| Idle Maximum * (Watt) | 9.5 | 6.8 28% | 7.7 19% | 8.5 11% | 8.6 9% | 7 26% | 9.16 ? 4% | 8.57 ? 10% |
| Load Average * (Watt) | 31 | 29 6% | 43.3 -40% | 57 -84% | 43.6 -41% | 36.5 -18% | 39.2 ? -26% | 43.8 ? -41% |
| Load Maximum * (Watt) | 45.4 | 46 -1% | 47.5 -5% | 68 -50% | 64.4 -42% | 44 3% | 49.8 ? -10% | 64.5 ? -42% |
| Witcher 3 ultra * (Watt) | 40.4 | 57.3 | 41.5 | 37.9 |
* ... smaller is better
Battery life
HP uses a very small 3-cell battery with 41 Wh. The competition is only partially satisfied with more capacity.
Our first practical test simulates surfing in the WLAN via script. The HP 15s lasted 5 hours and 18 minutes with minimally reduced brightness and the Windows power regulator at three quarters. Only the Lenovo IdeaPad is worse with its 36 Wh battery.
For the playback of a video in the continuous loop, we have deactivated all communication devices, the brightness is almost at maximum. An extensive film evening can be organized for around 6 hours.
The HP unwinds the best battery life in comparison, of all things, under load, possibly because of the strong throttling, it keeps up for two hours.
The comparison to the sister model with weaker specs is interesting. The latter lasts almost the same over all tests. The throttling of the actually more potent hardware is also evident here, but the better IPS display in the comparison device may also be consuming more power.
| HP 15s-fq1440ng i7-1065G7, Iris Plus Graphics G7 (Ice Lake 64 EU), 41 Wh | HP 15s-fq1556ng i5-1035G1, UHD Graphics G1 (Ice Lake 32 EU), 41 Wh | Microsoft Surface Laptop 3 15 i7-1065G7 i7-1065G7, Iris Plus Graphics G7 (Ice Lake 64 EU), 45 Wh | Lenovo Ideapad S340-15IIL i7-1065G7, Iris Plus Graphics G7 (Ice Lake 64 EU), 36 Wh | Dell Inspiron 15 5000 5585 R7 3700U, Vega 10, 42 Wh | Dell Inspiron 15 7000 2-in-1 Black Edition i7-8565U, GeForce MX150, 56 Wh | Average of class Office | |
|---|---|---|---|---|---|---|---|
| Battery runtime | -5% | 60% | -33% | -1% | 25% | 86% | |
| Reader / Idle (h) | 15.2 | 13.1 -14% | 35 130% | 10 -34% | 14.3 -6% | 22.2 ? 46% | |
| H.264 (h) | 6 | 15.4 ? 157% | |||||
| WiFi v1.3 (h) | 5.3 | 6 13% | 8.2 55% | 4.3 -19% | 7 32% | 6.6 25% | 13.2 ? 149% |
| Load (h) | 2 | 1.7 -15% | 1.9 -5% | 1.1 -45% | 1.4 -30% | 1.808 ? -10% |
Pros
Cons
Verdict - good on paper, but many weaknesses
Unfortunately, we cannot make a purchase recommendation for the HP 15s. Customers who do not use the laptop exclusively on an external monitor (i.e. approx. 99 percent of all customers) should be put off by the bad TN display. HP probably skimps in favor of the new processor with Iris Plus graphics, which can only convince on paper, but is throttled here by the manufacturer. Therefore, the customer would be wiser to go with a similarly fast, older and cheaper alternative with a better screen. The GPU suggests that the laptop is capable of more than just office, but in practice this is put into perspective.
The HP 15s is a deceiver. The hardware with a new Intel processor and especially the potentially strong Iris Plus graphics impresses on paper, but unfortunately not in the test. In addition to the good CPU performance, there are only a few bright spots, but numerous weaknesses.
So why should you buy a laptop that has a bad screen, is throttled, hardly has any connections, at best has mediocre input devices, has a suboptimal fan control and consumes unnecessarily a lot in idle? We don't know either. One of the few positive factors is the fairly decent CPU performance, which, however, cannot remedy the many weak points. Apart from the pure specs, a lot seems to be saved. For the price of 850 to 900 Euros (~$960 to $1000), there are better alternatives (our top 10 best notebooks under 1,000 Euros/~$1130).
HP 15s-fq1440ng
- 06/03/2020 v7 (old)
Christian Hintze
Price comparison
