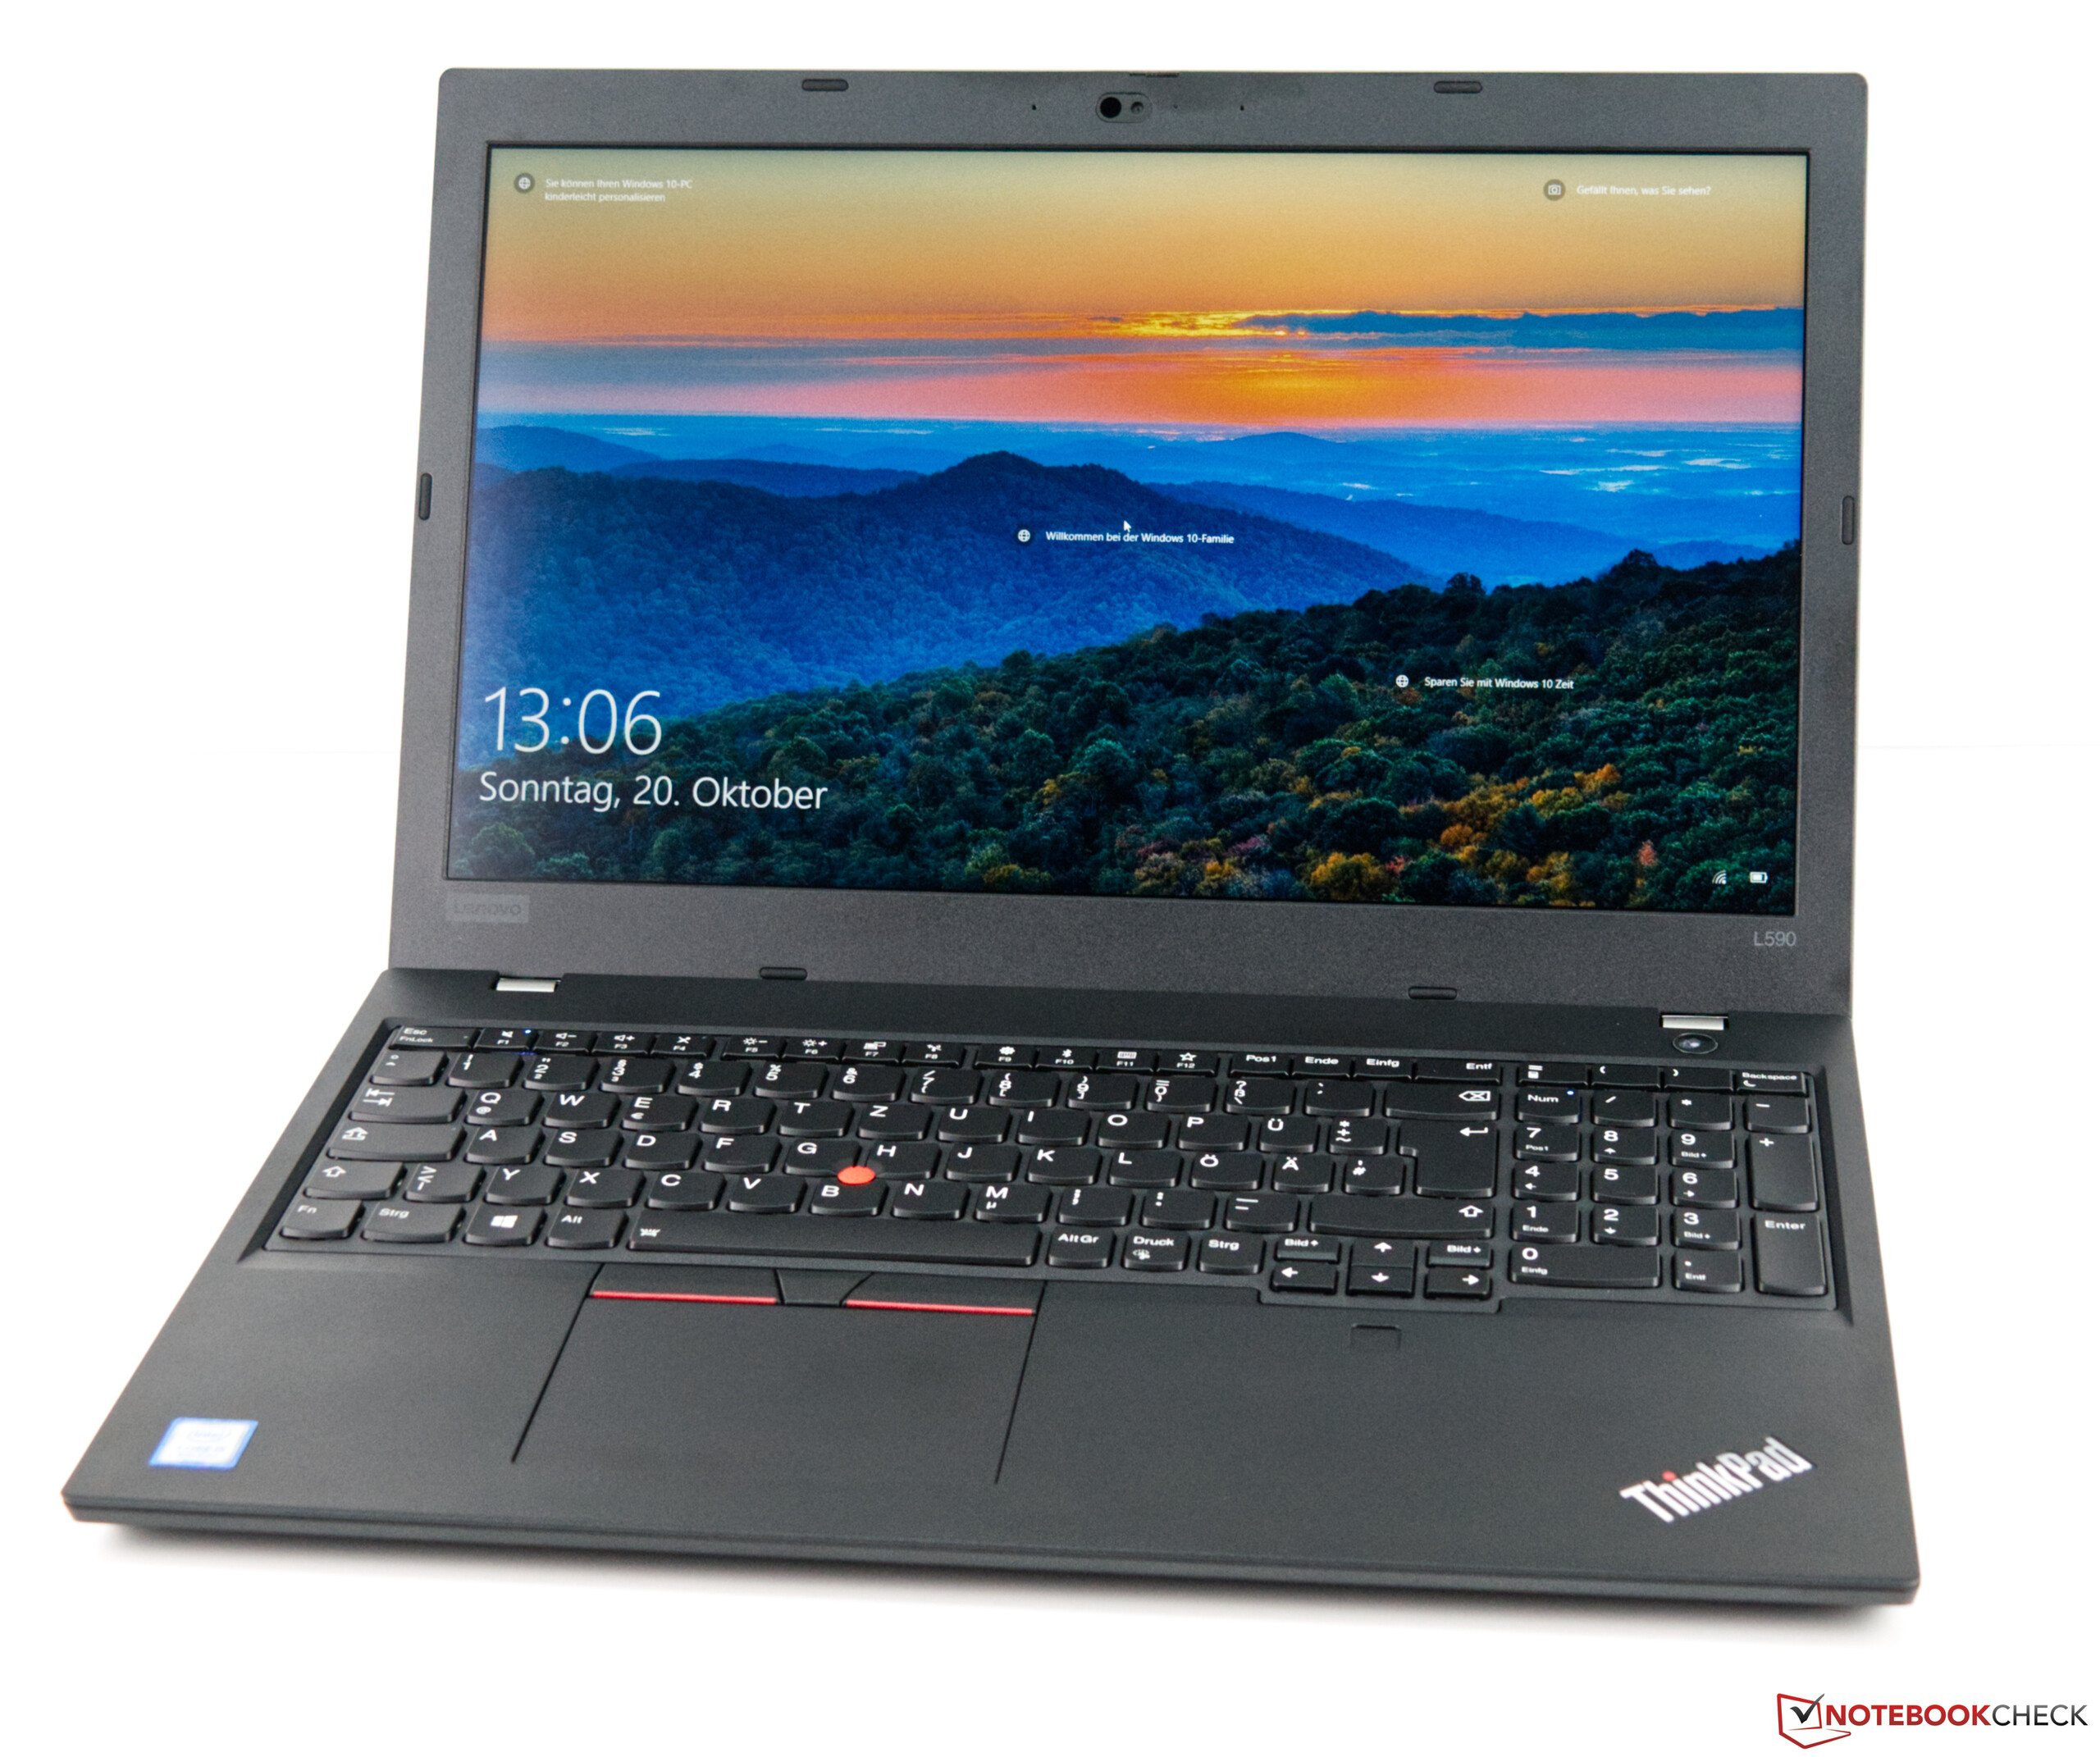
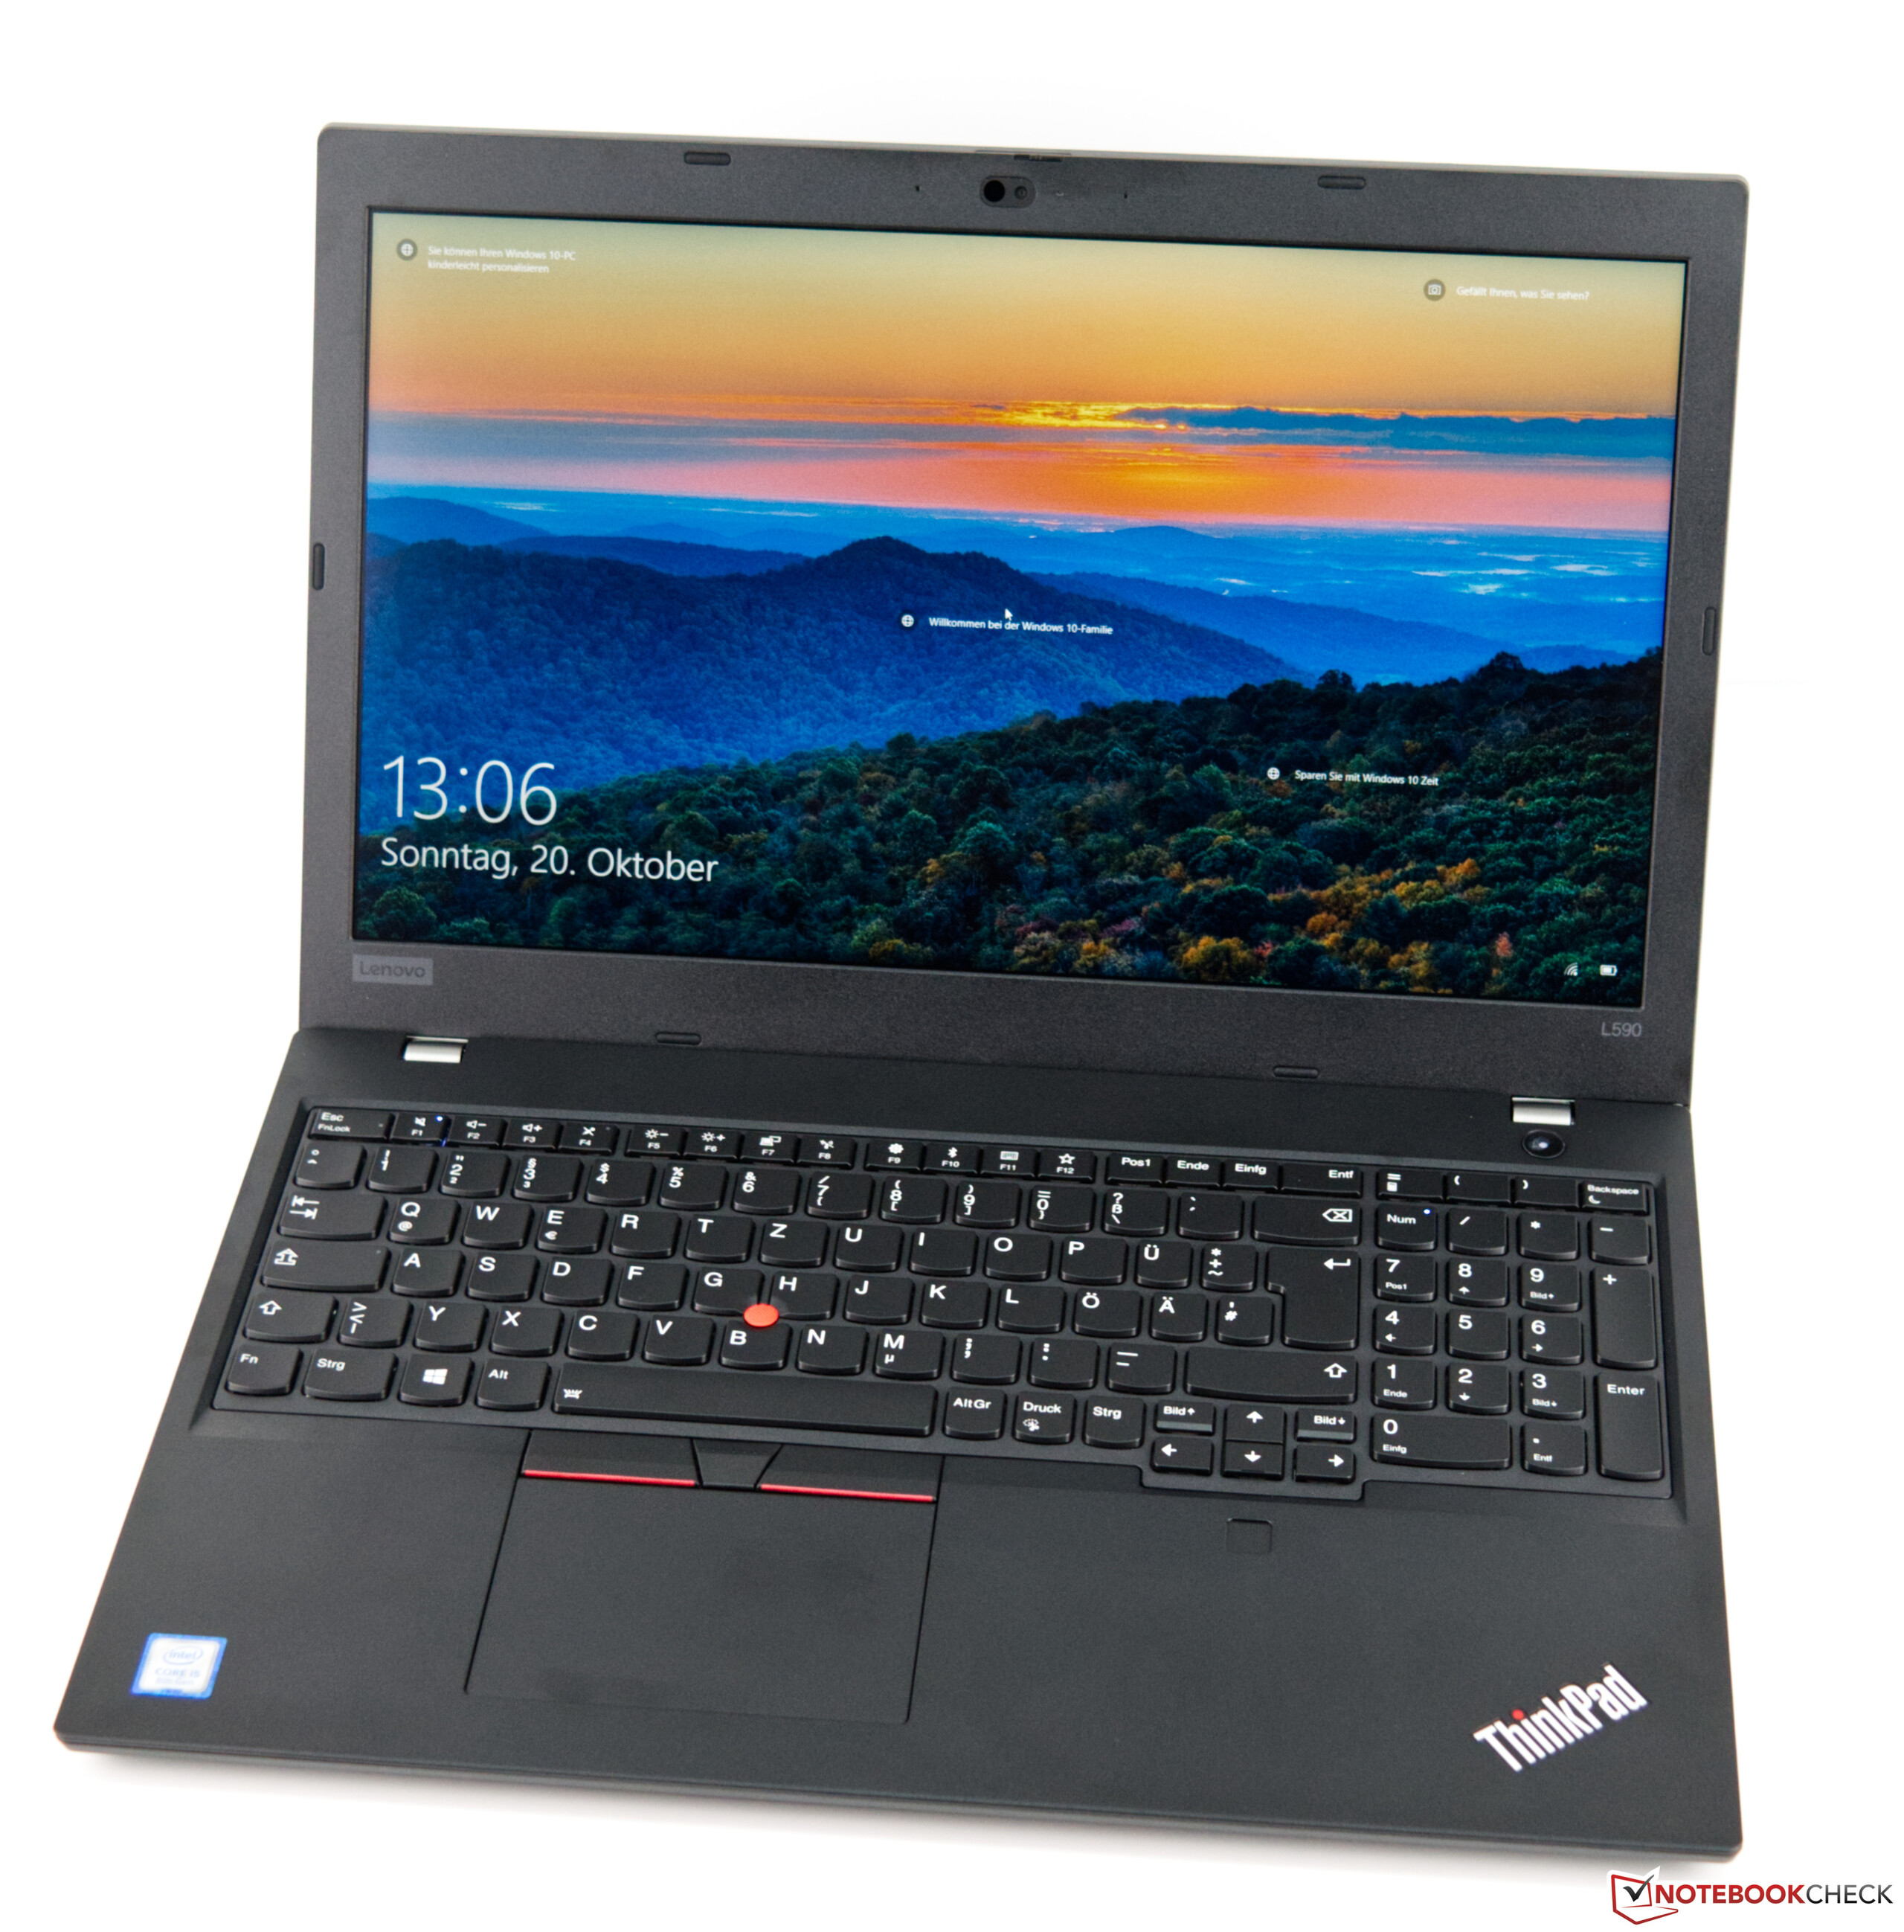
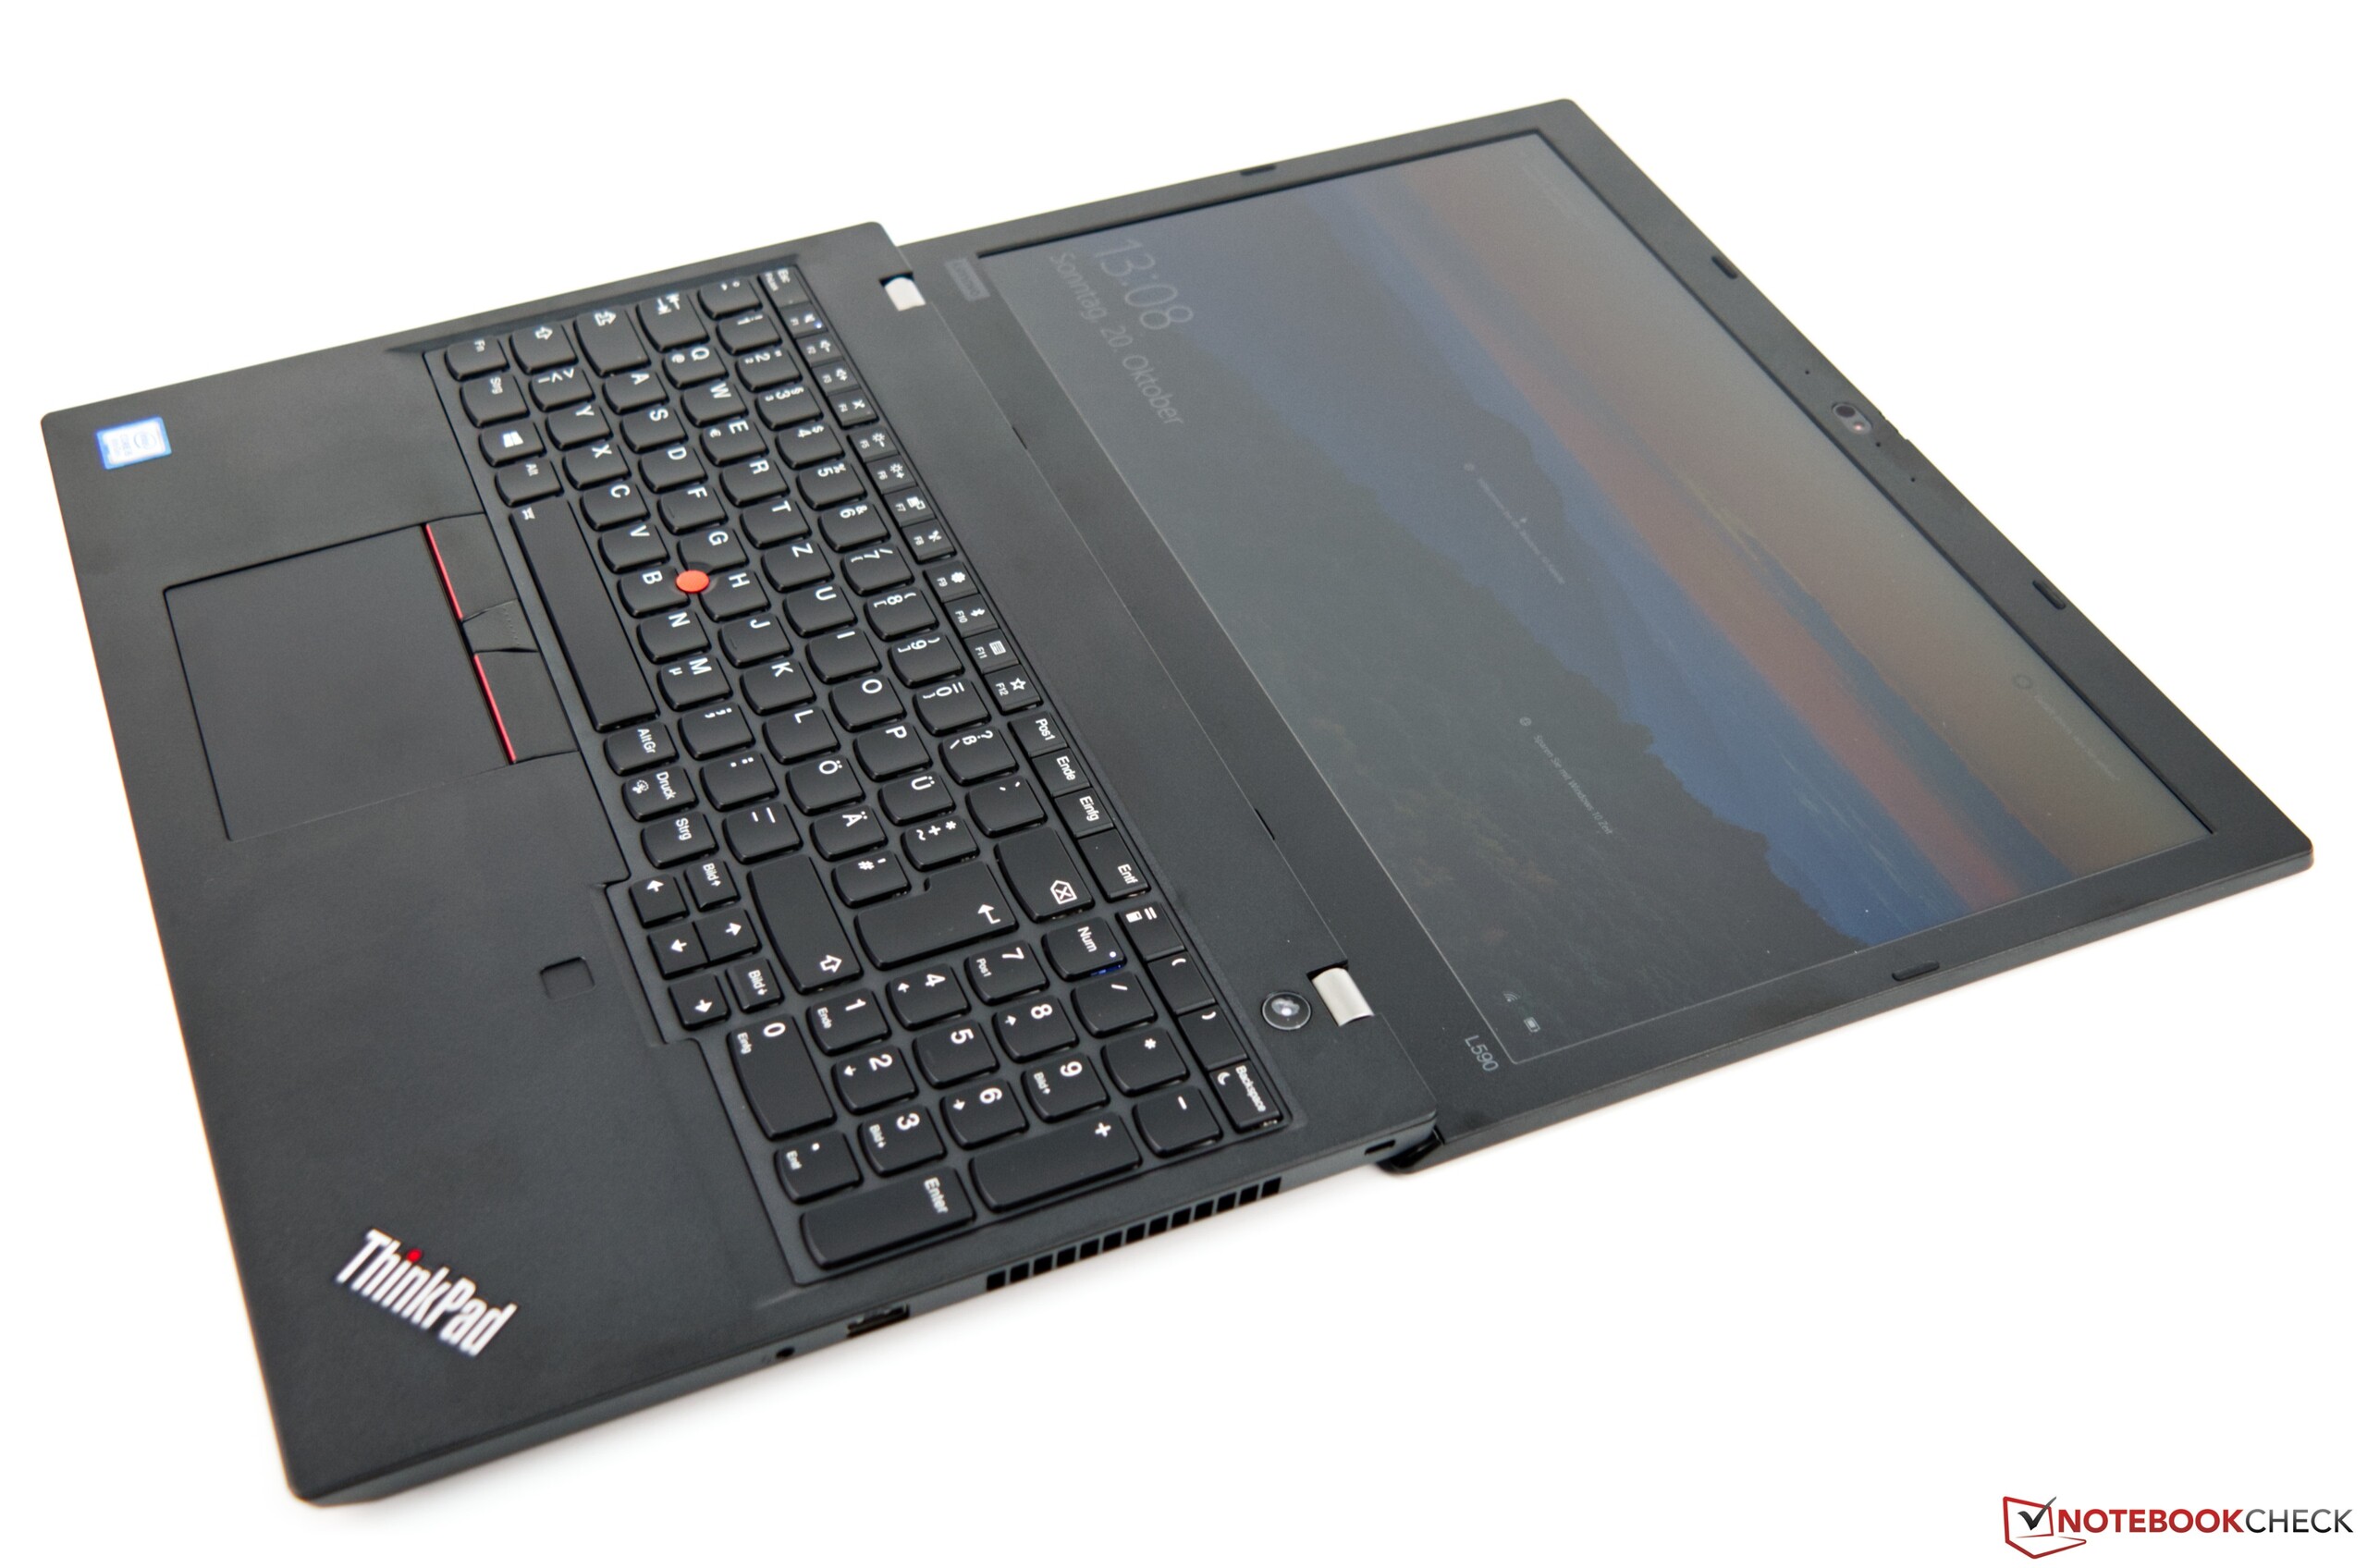
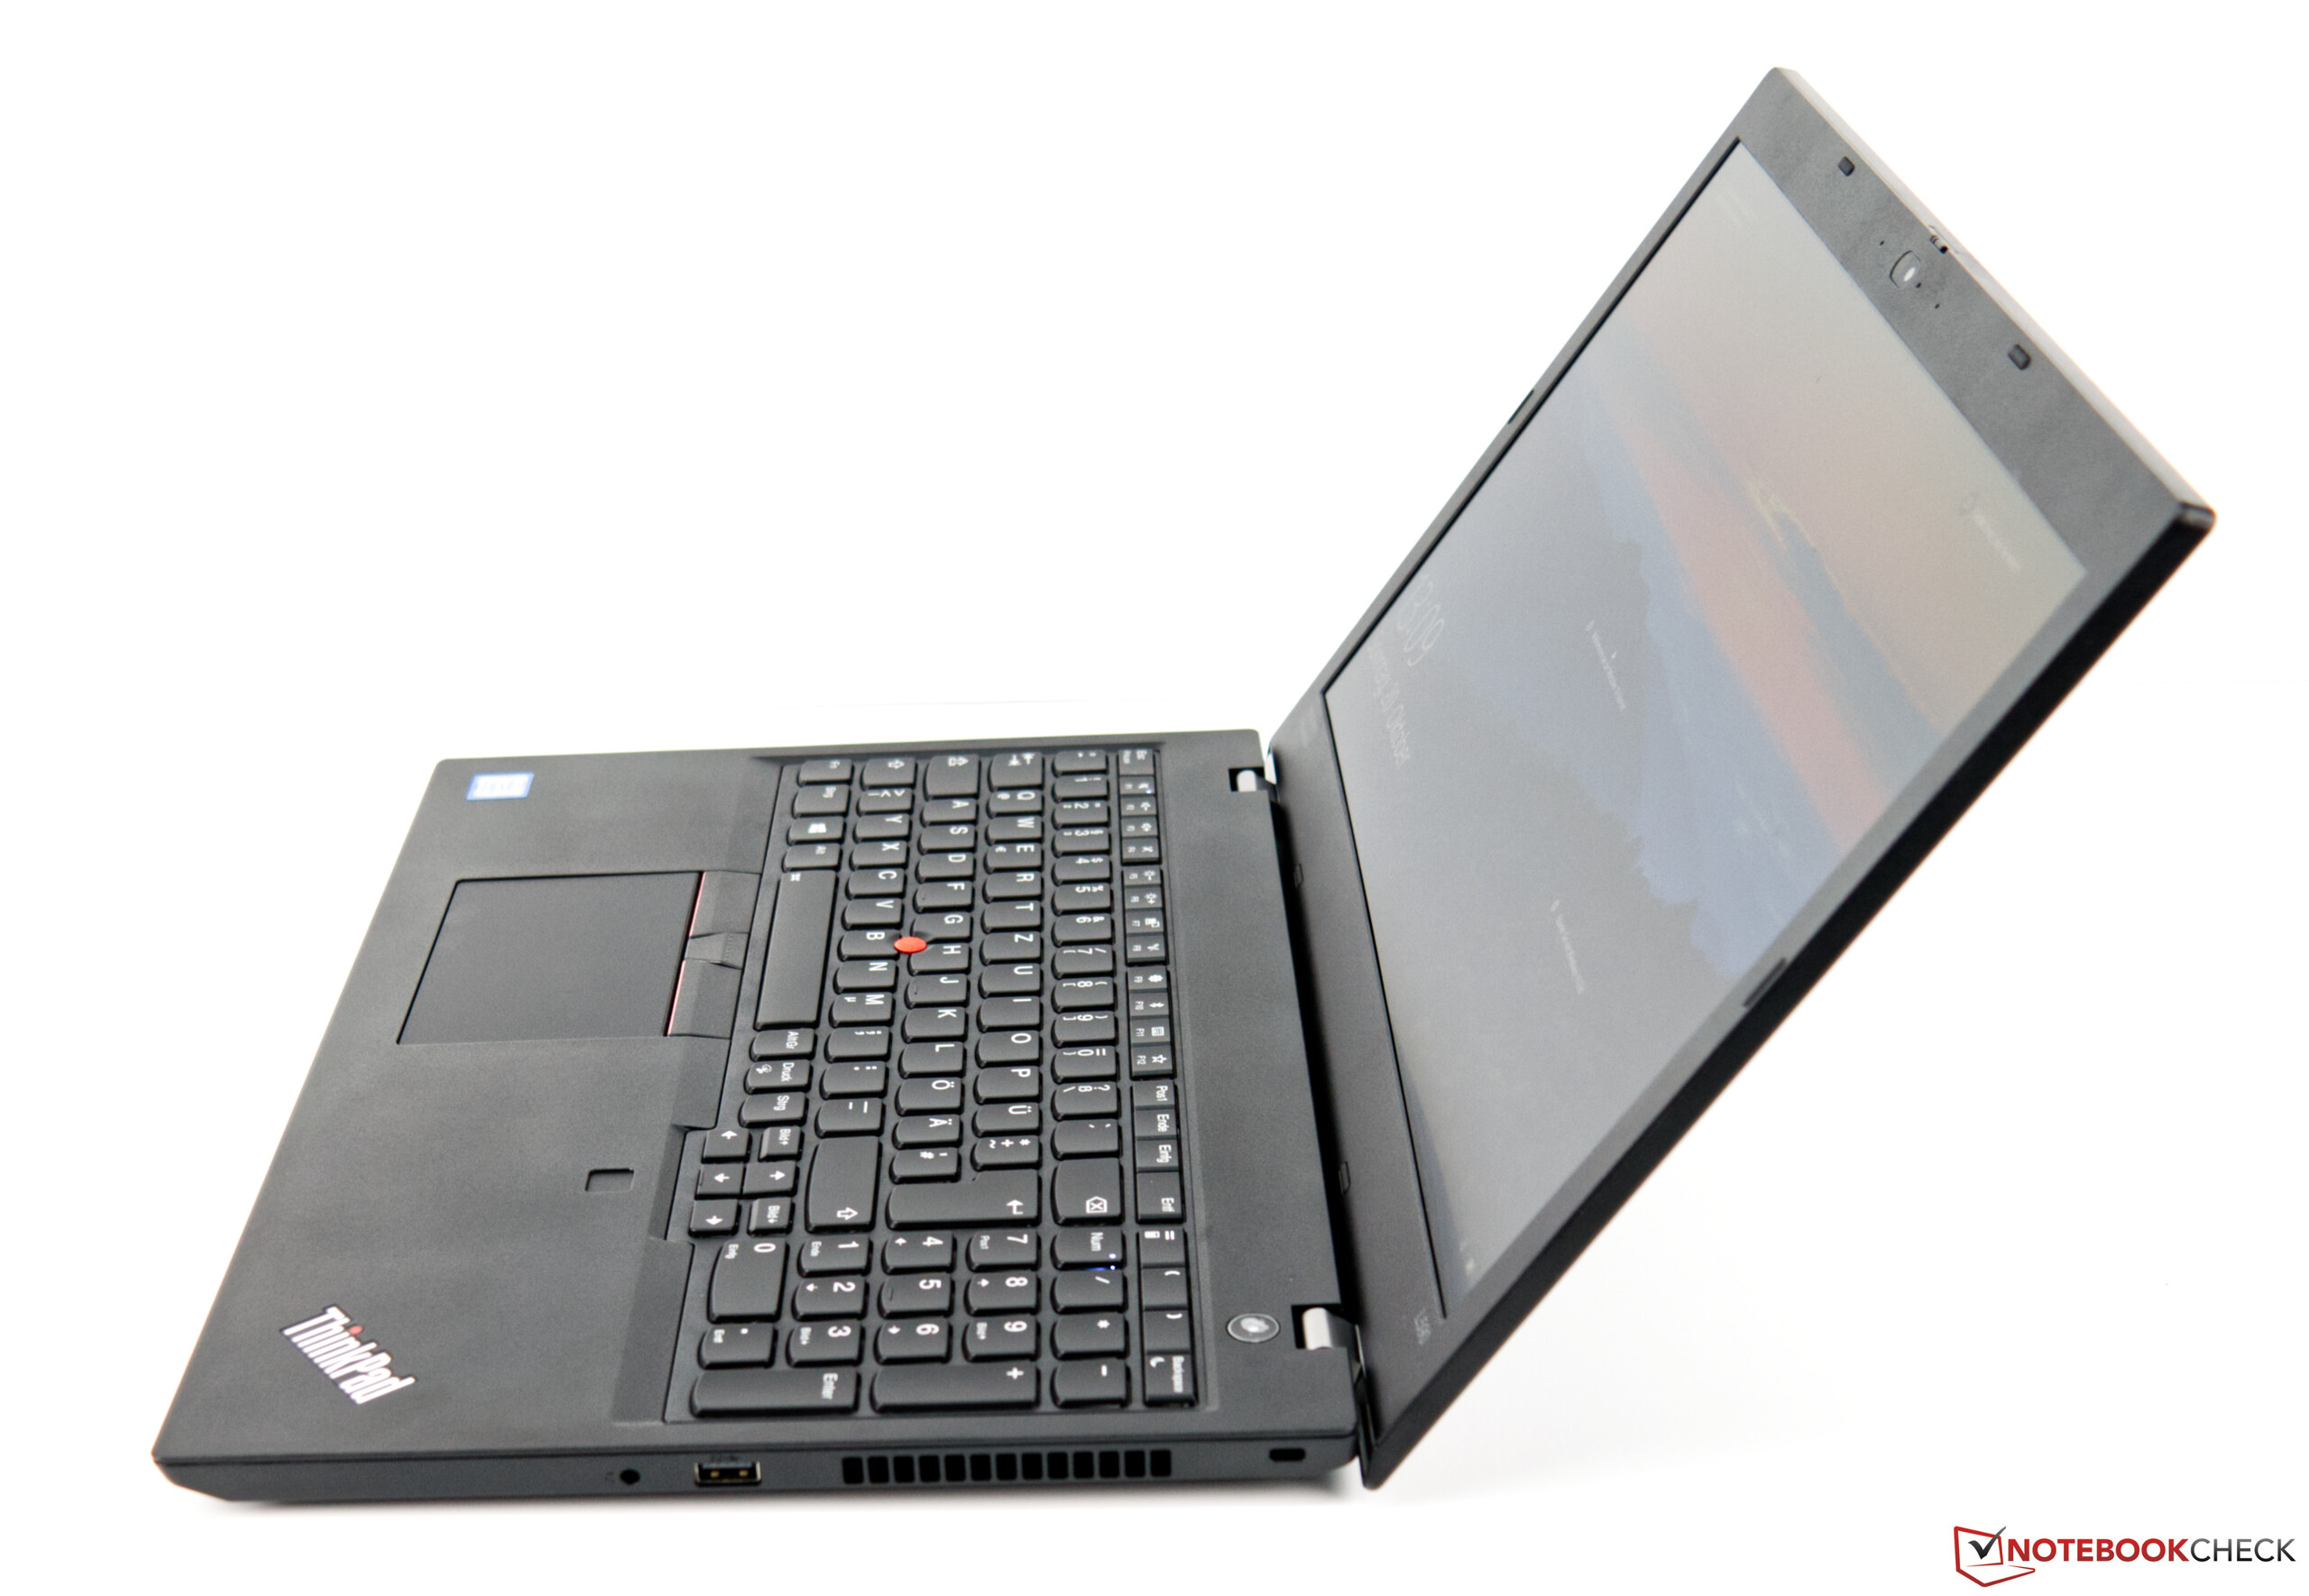
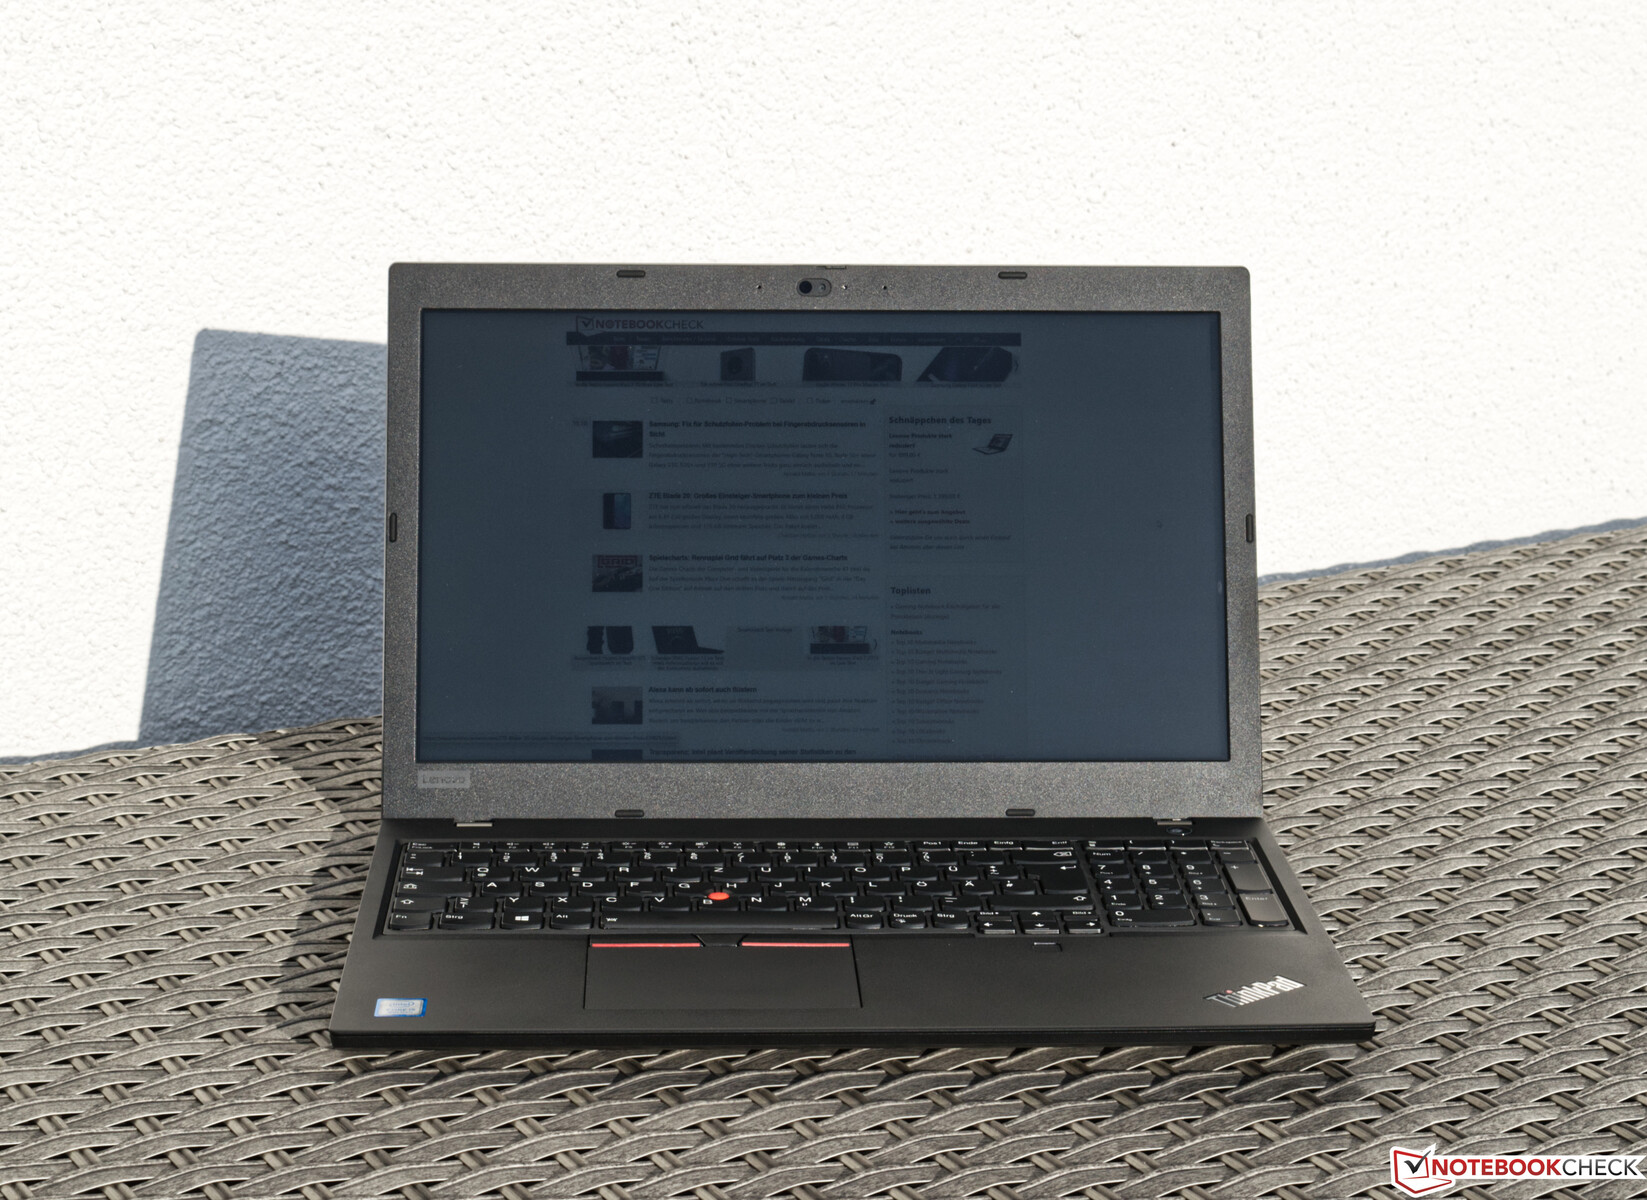
Lenovo ThinkPad L590 Laptop Review: A business laptop with good input devices
The Lenovo ThinkPad L Series offers well-equipped business laptops for those who operate on a budget. The L590 is the company's latest 15.6-inch device and one which it has based on the L580. While the L590 has a newer Whiskey Lake CPU, it shares its chassis with its predecessor. Hence, the two laptops offer broadly the same advantages and disadvantages as each other.
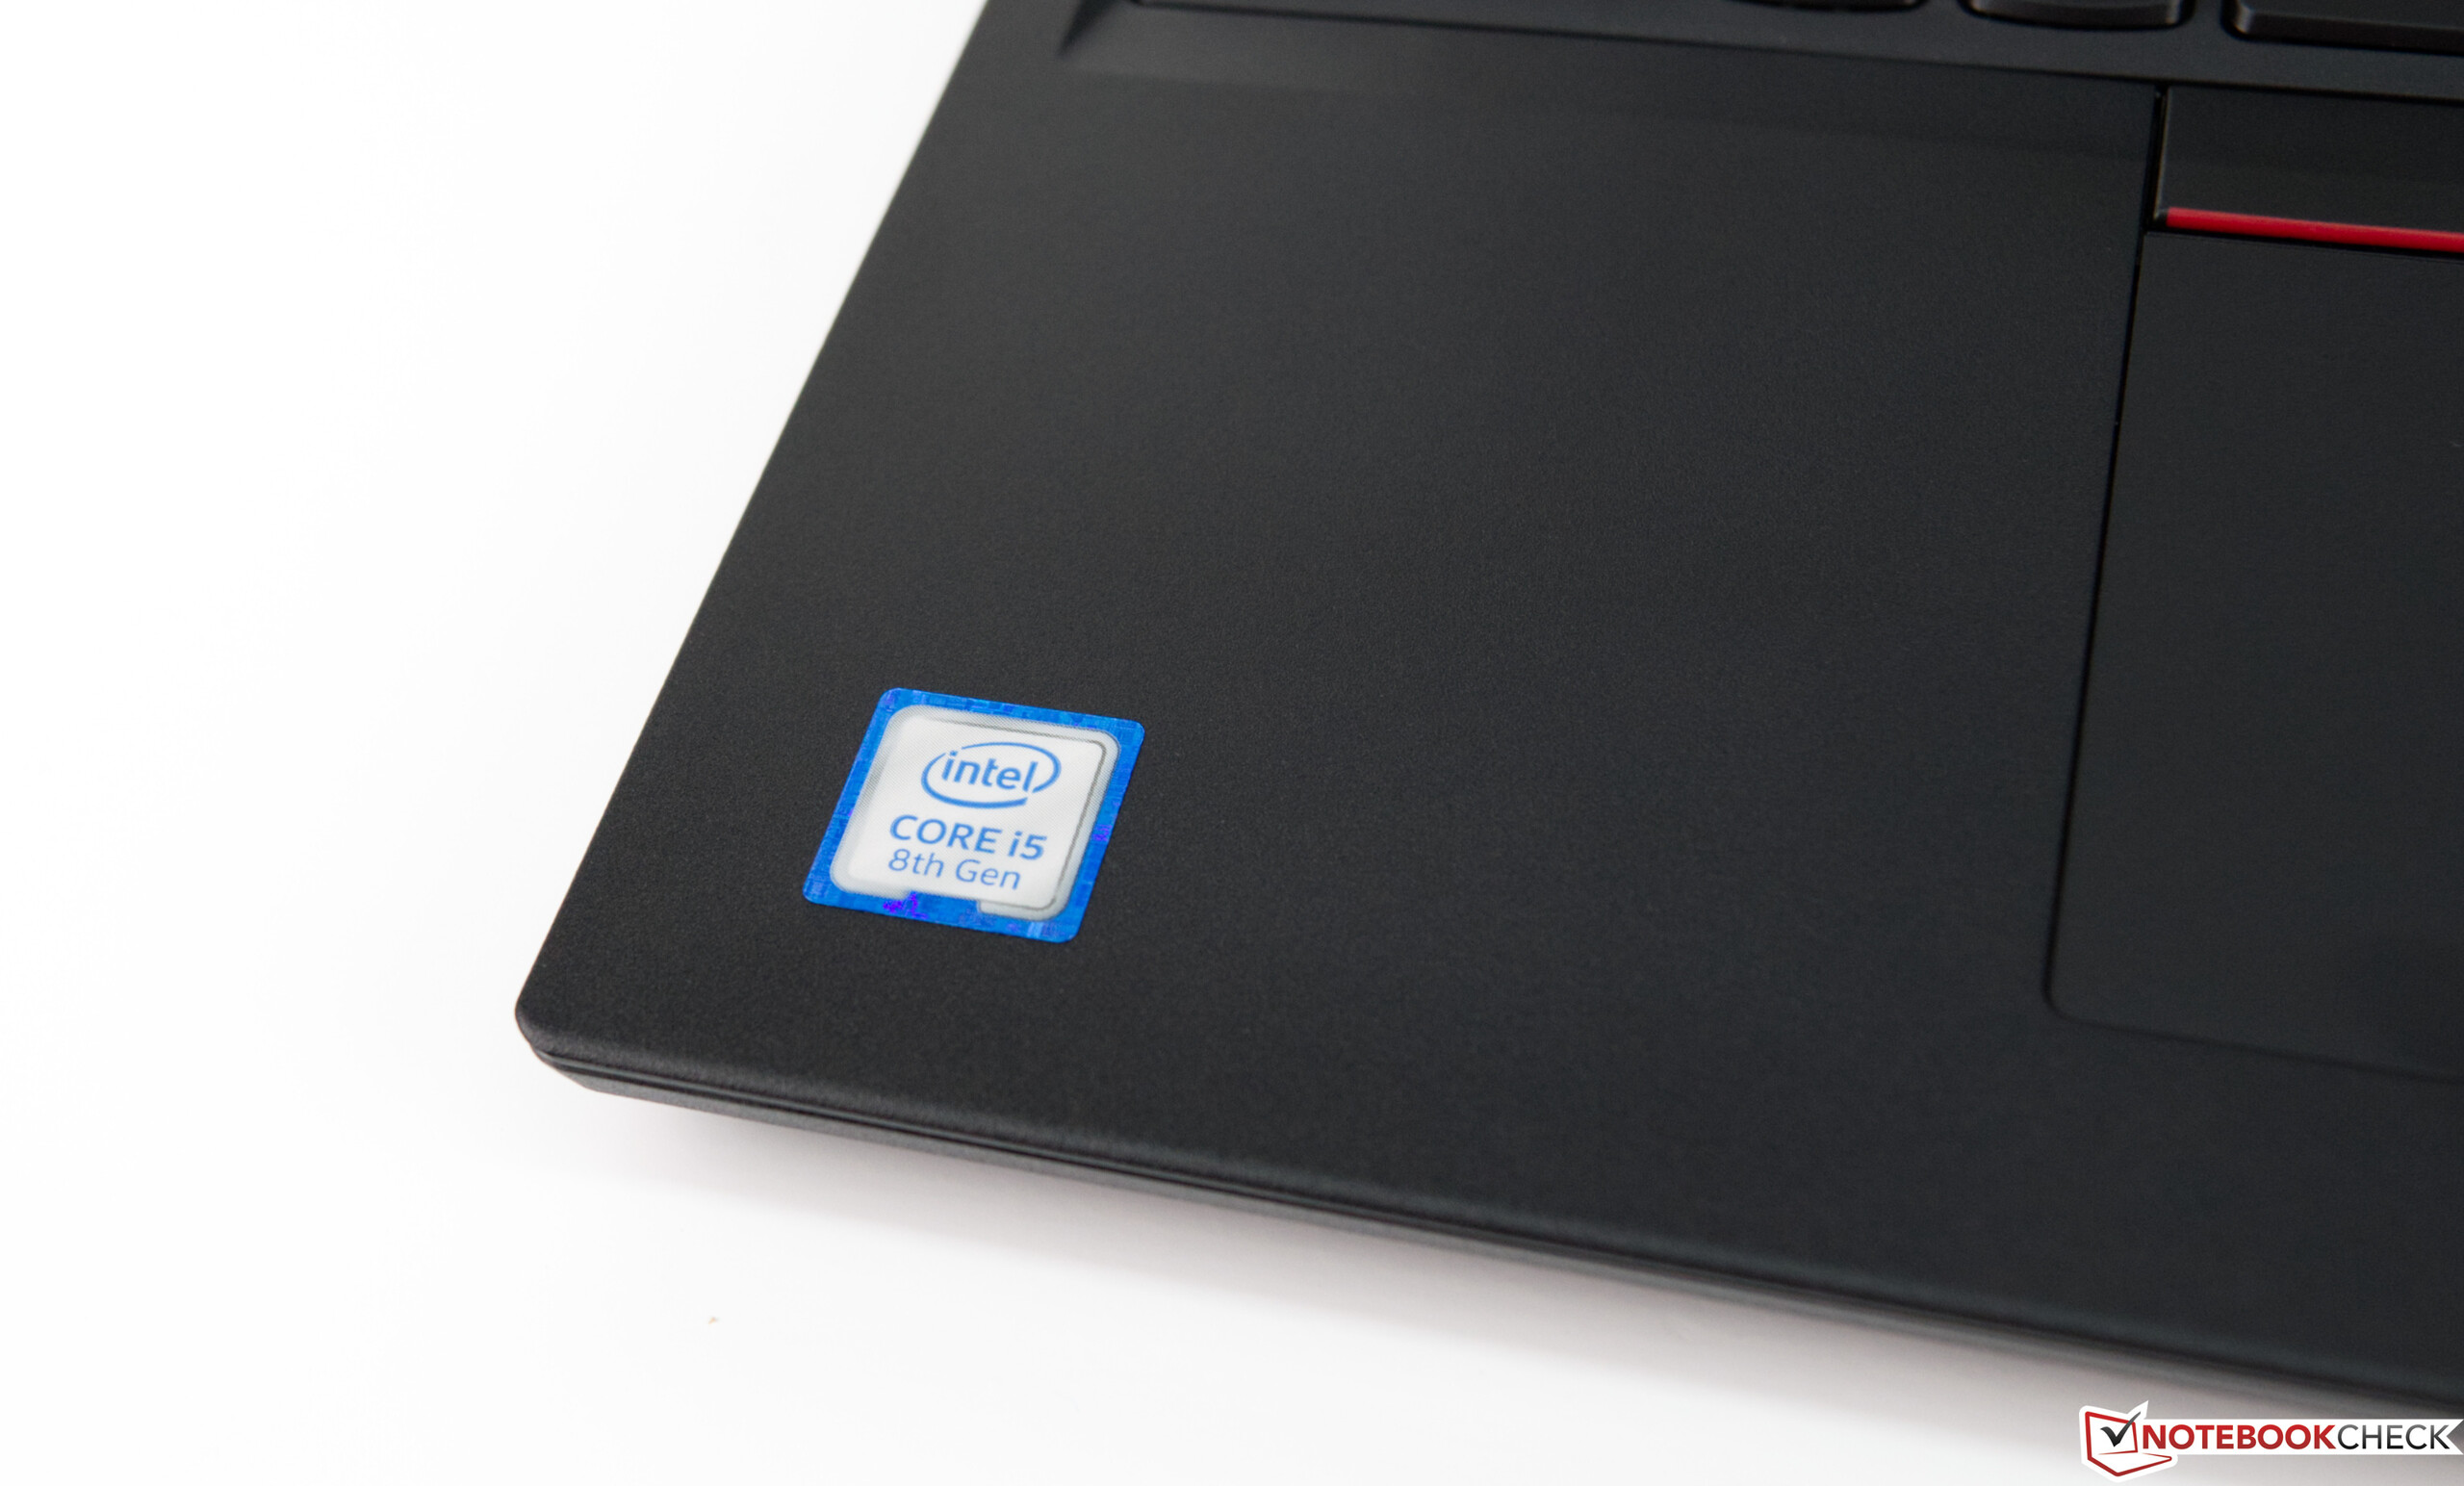
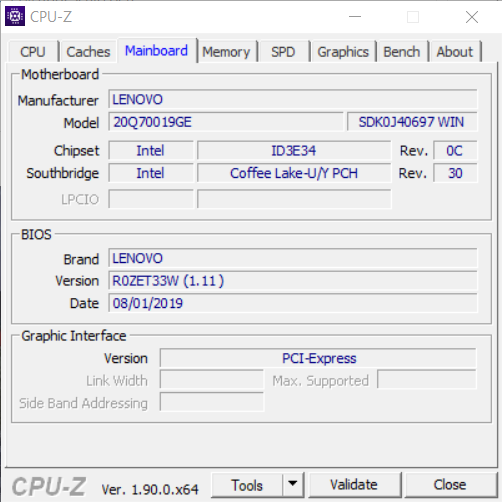
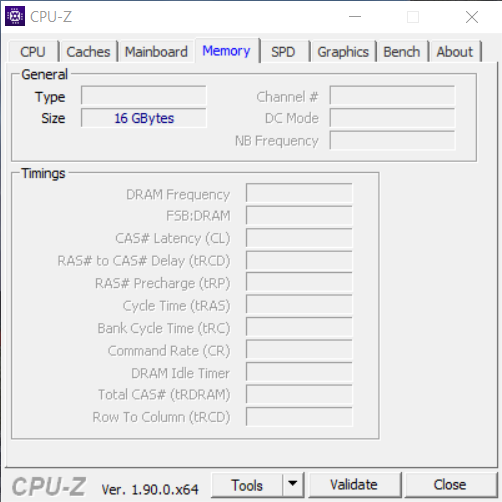
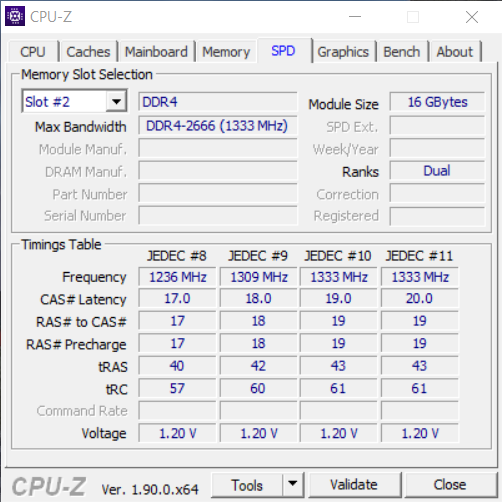
Lenovo sells the ThinkPad L590 in numerous configurations, including versions for students and teachers. Our review unit is the 20Q70019GE, which costs 900 Euros (~$998) and comes with an Intel Core i5-8265U processor, 16 GB of RAM and a 512 GB NVMe SSD. The device has a 15.6-inch IPS display too that resolves at 1920x1080 and has a matte finish.
We shall compare the L590 not only with the L580 but also with the Acer TravelMate X3410, Lenovo ThinkPad E590, Schenker Slim 15 RED and the Tuxedo Book BU1307. We have included an overview of all the devices in the table below.
Rating | Date | Model | Weight | Height | Size | Resolution | Price |
|---|---|---|---|---|---|---|---|
| 83.2 % v7 (old) | 10 / 2019 | Lenovo ThinkPad L590-20Q70019GE i5-8265U, UHD Graphics 620 | 2 kg | 23 mm | 15.60" | 1920x1080 | |
| 84.3 % v7 (old) | 10 / 2019 | Lenovo ThinkPad L580-20LW000VGE i5-8250U, UHD Graphics 620 | 2 kg | 23 mm | 15.60" | 1920x1080 | |
| 82.6 % v6 (old) | 03 / 2019 | Schenker Slim 15-RE-E19 i5-8265U, UHD Graphics 620 | 1.5 kg | 19.9 mm | 15.60" | 2x1 | |
| 83.4 % v7 (old) | 03 / 2019 | Lenovo ThinkPad E590-20NC0003GE i7-8565U, UHD Graphics 620 | 1.9 kg | 19.9 mm | 15.60" | 1920x1080 | |
| 83.9 % v6 (old) | 02 / 2019 | Tuxedo Book BU1307 i5-8550U, UHD Graphics 620 | 1.4 kg | 21 mm | 13.30" | 1920x1080 | |
| 84 % v7 (old) | 01 / 2019 | Acer TravelMate X3410-M-50DD i5-8550U, GeForce MX130 | 1.7 kg | 19.9 mm | 14.00" | 1920x1080 |
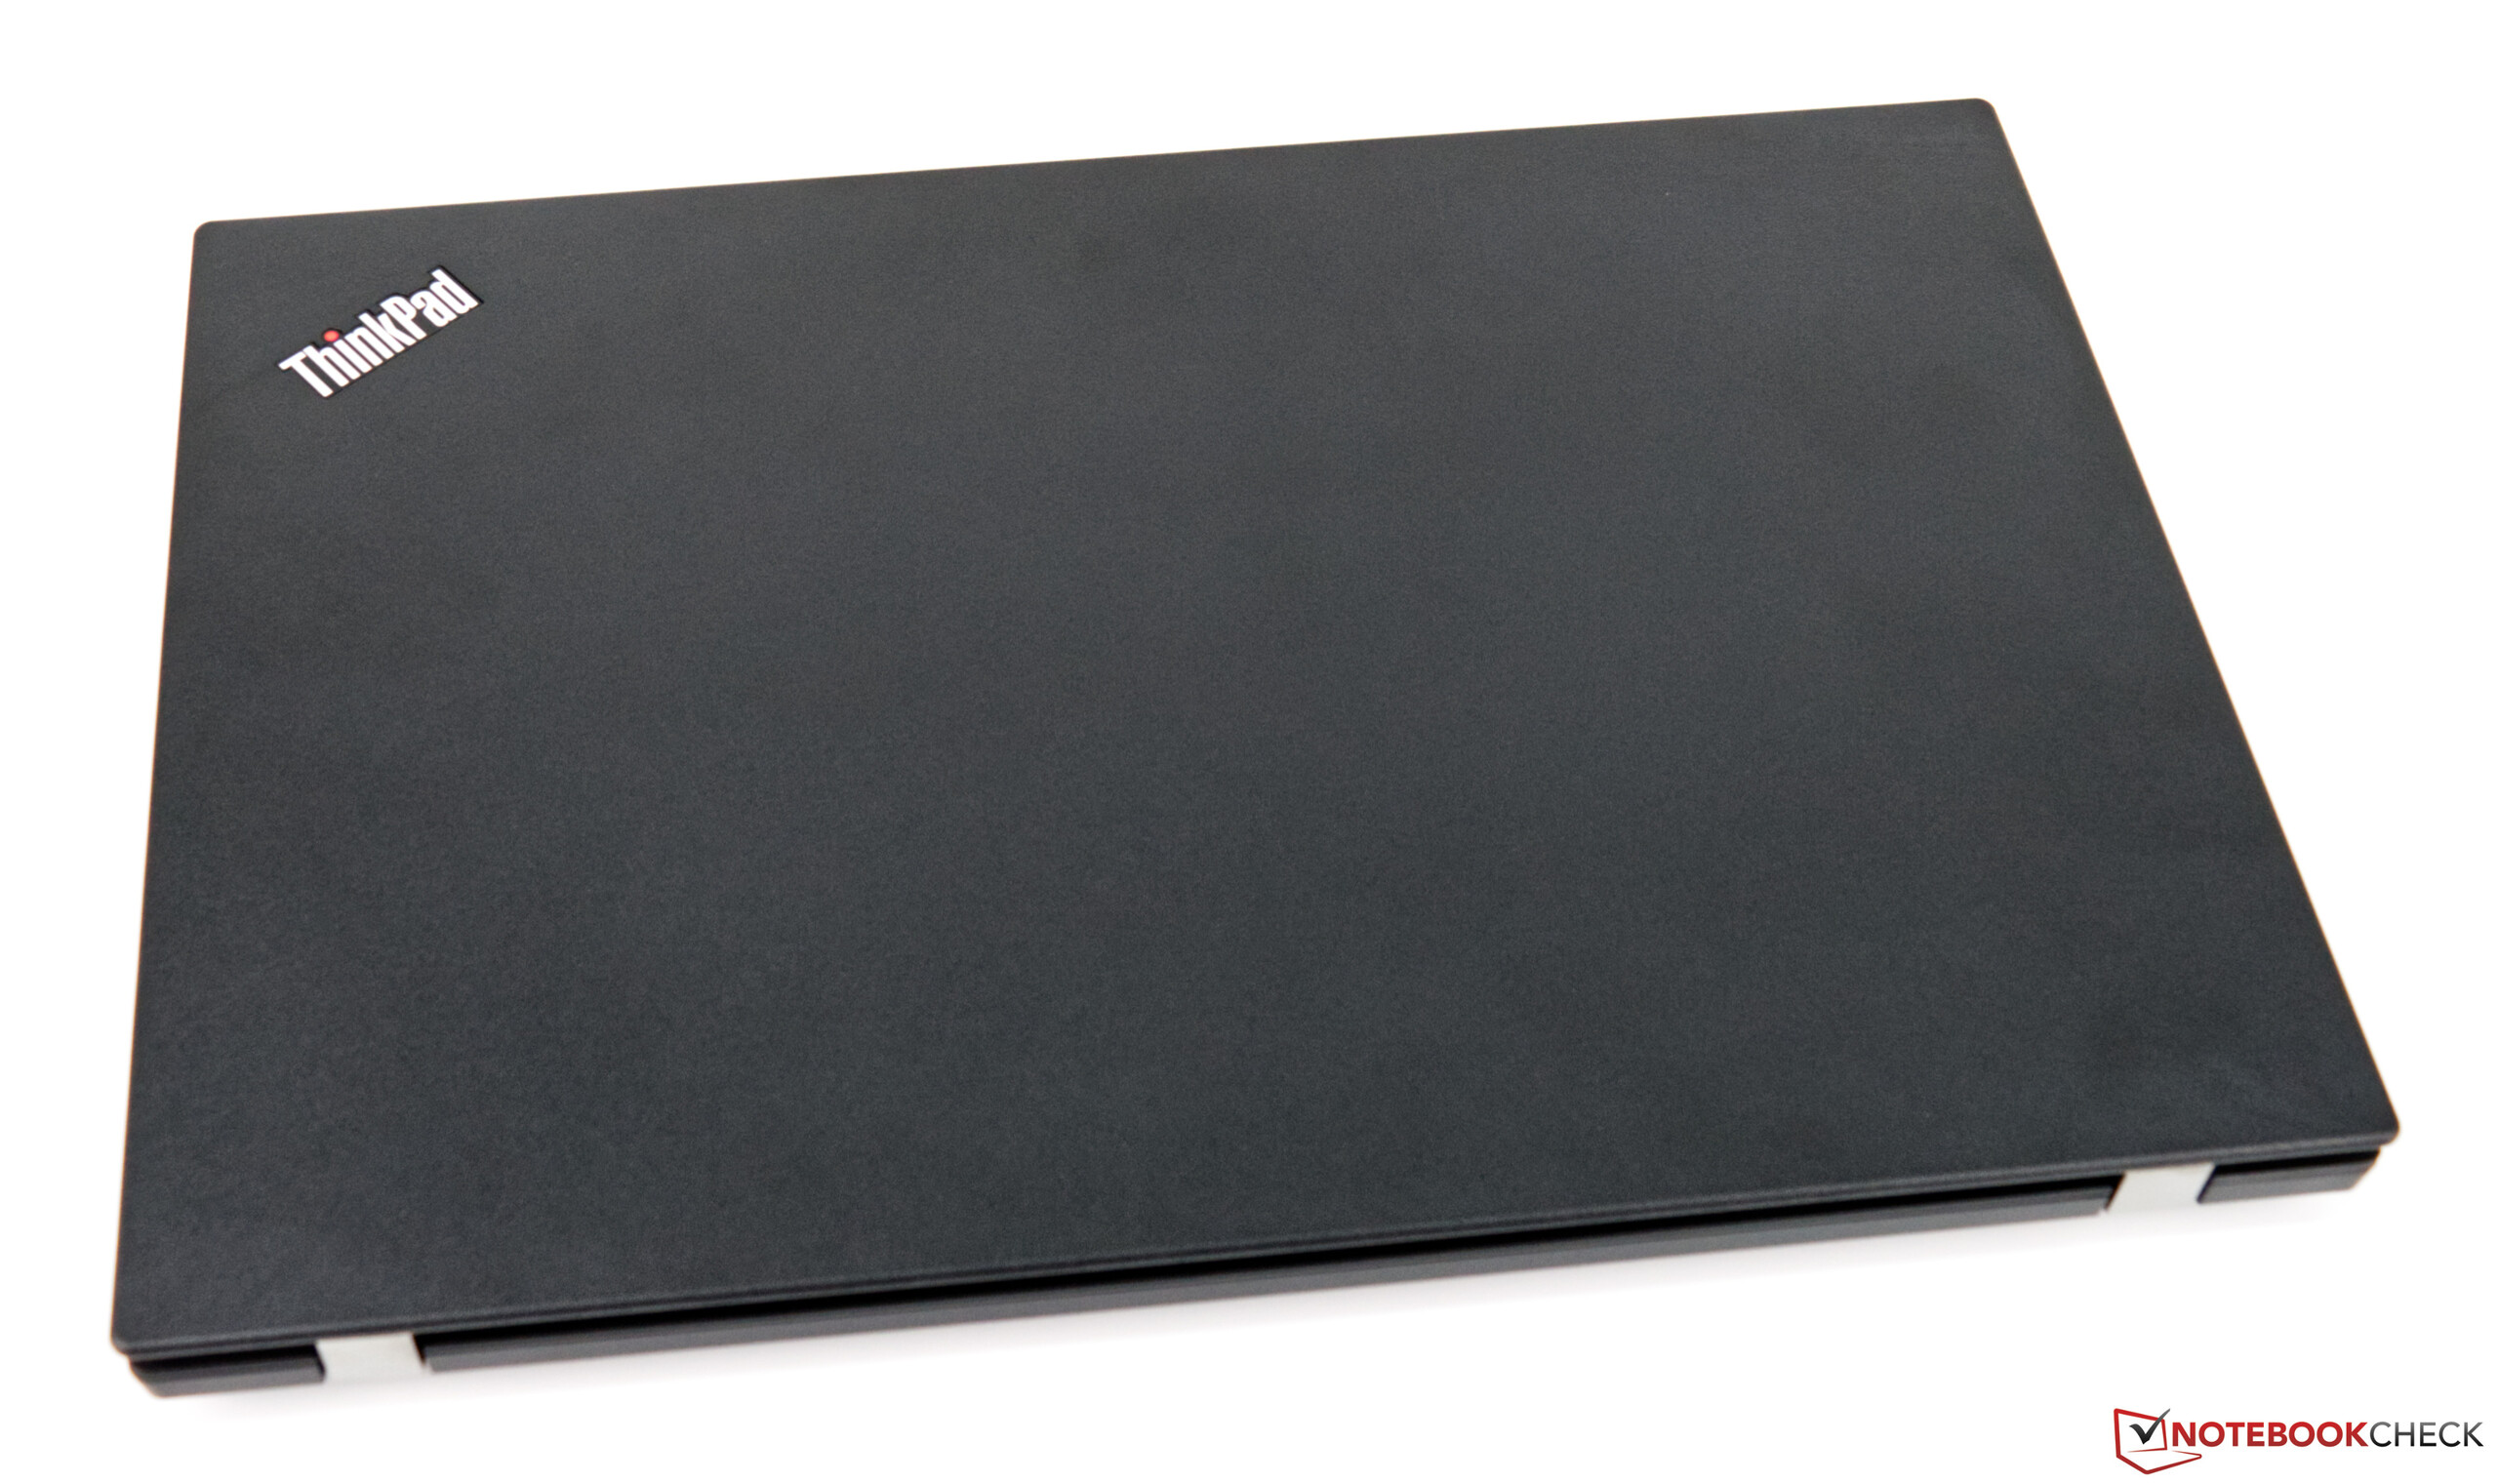
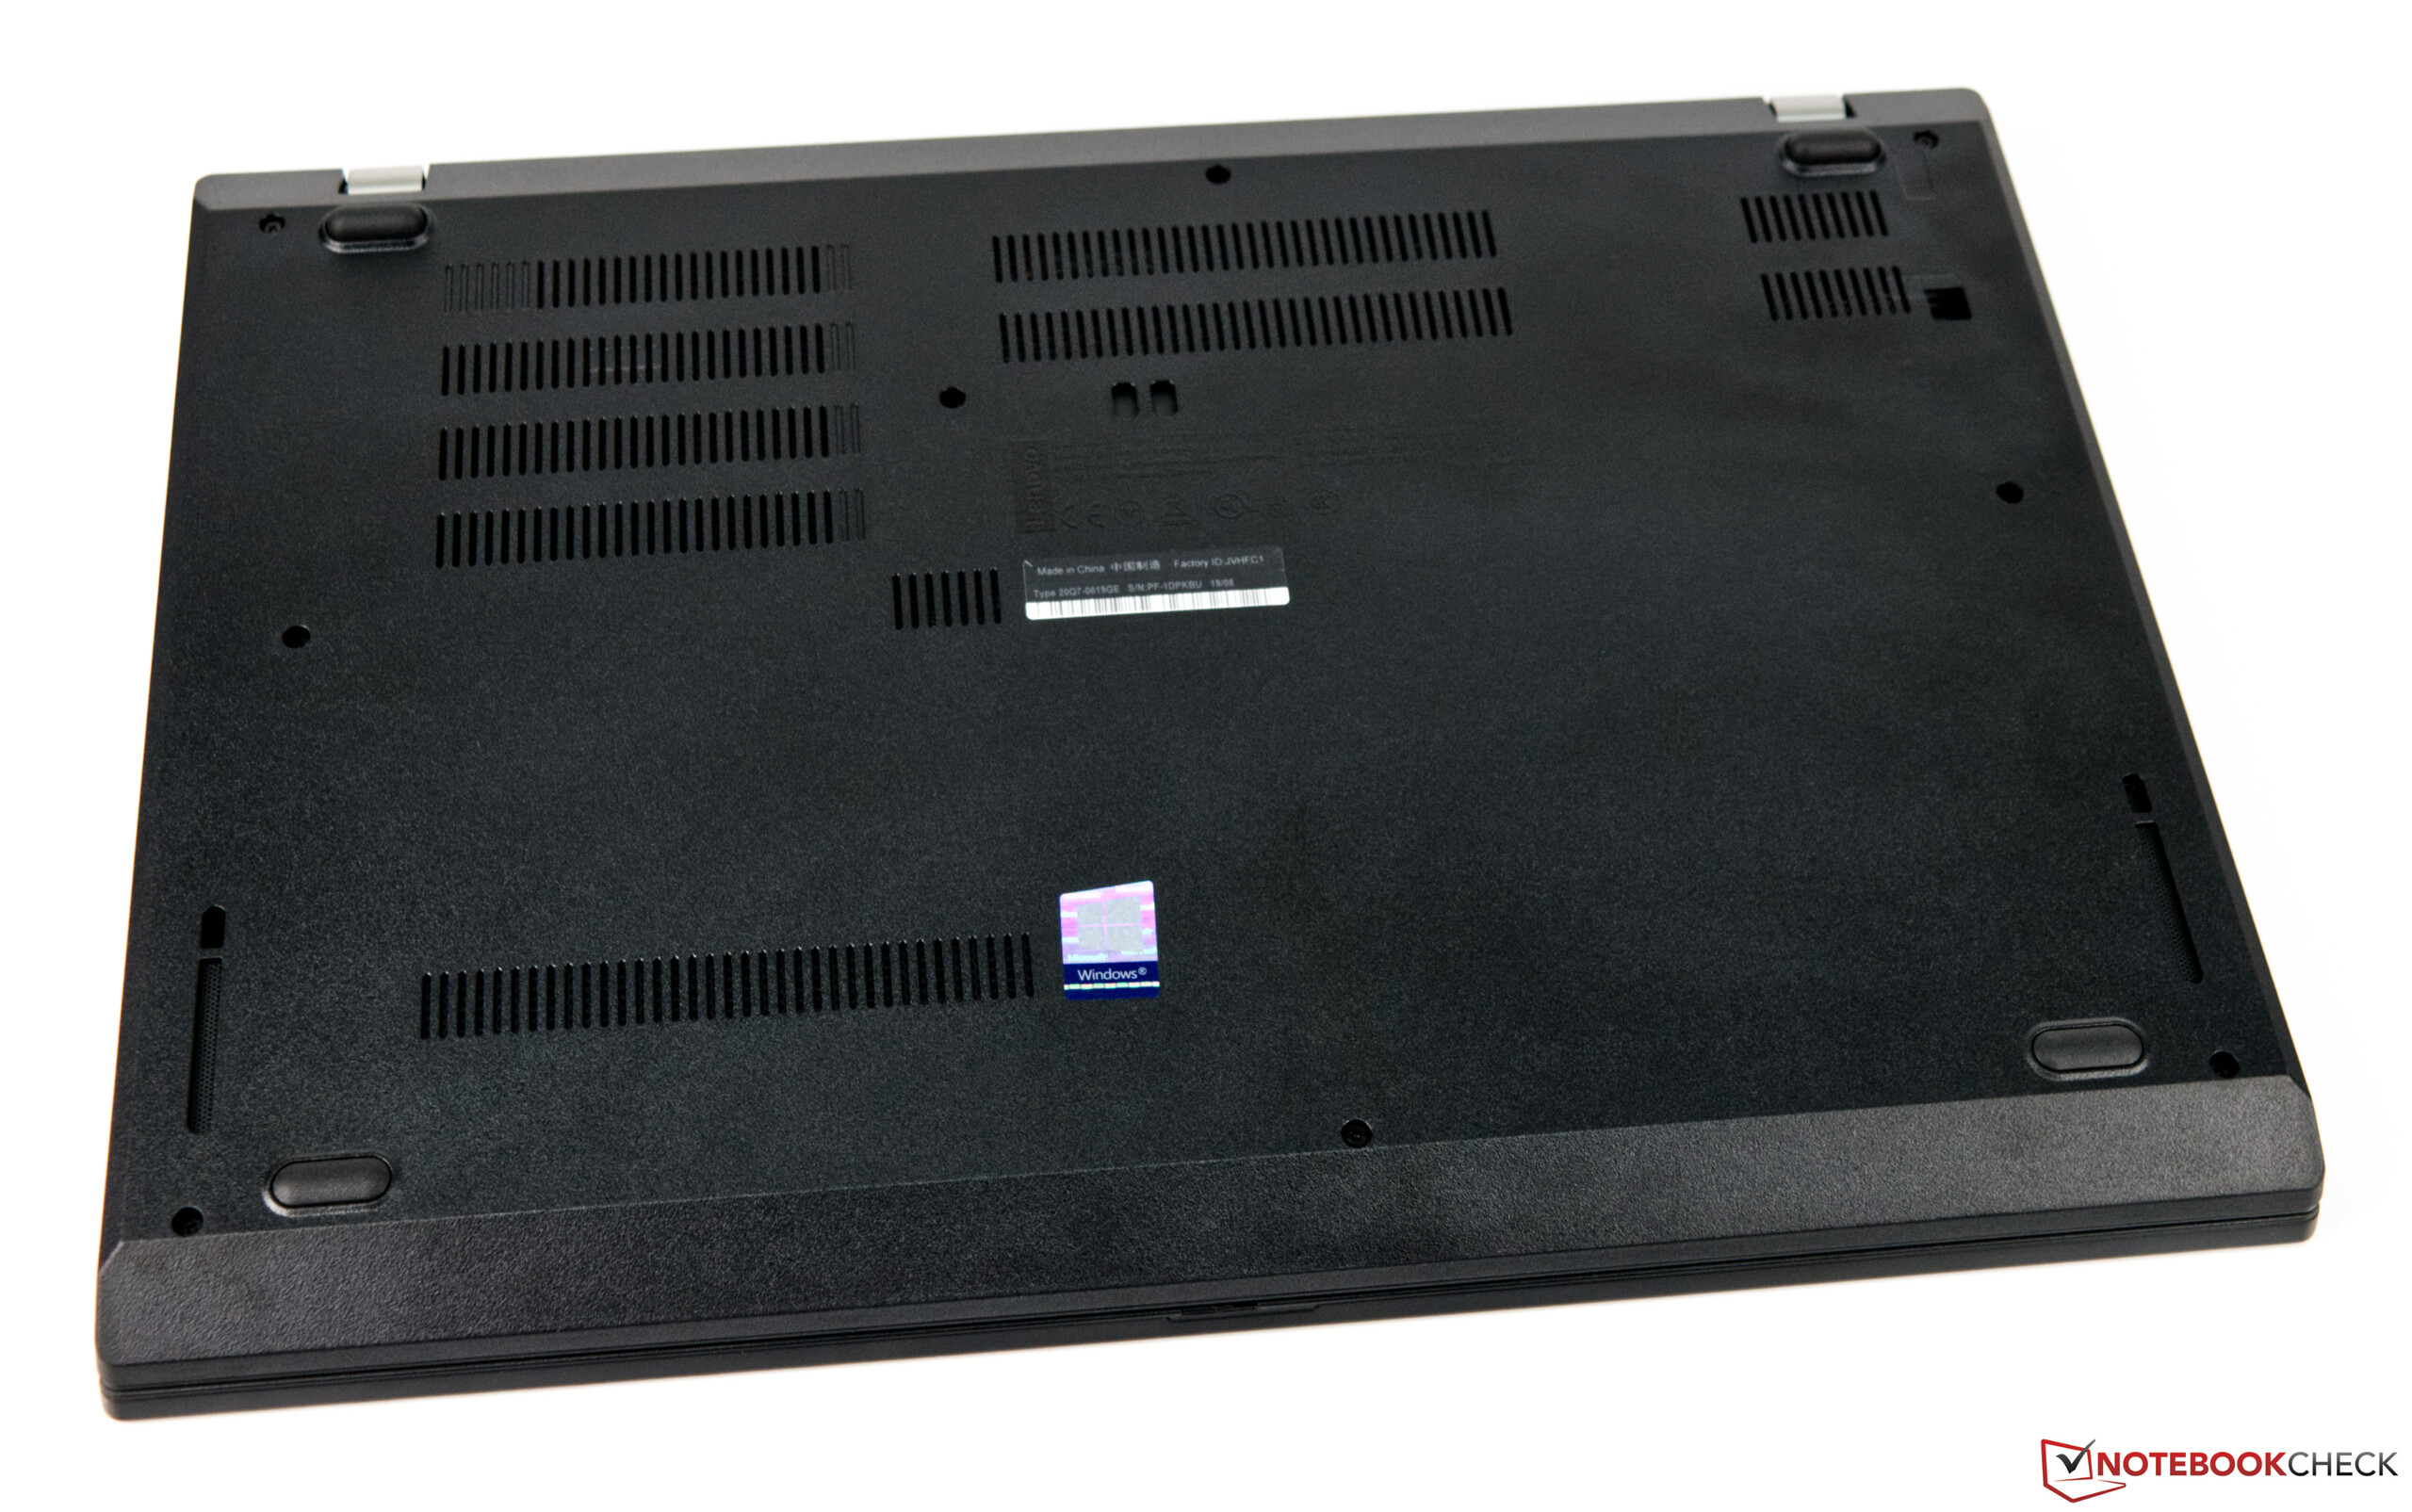
Case
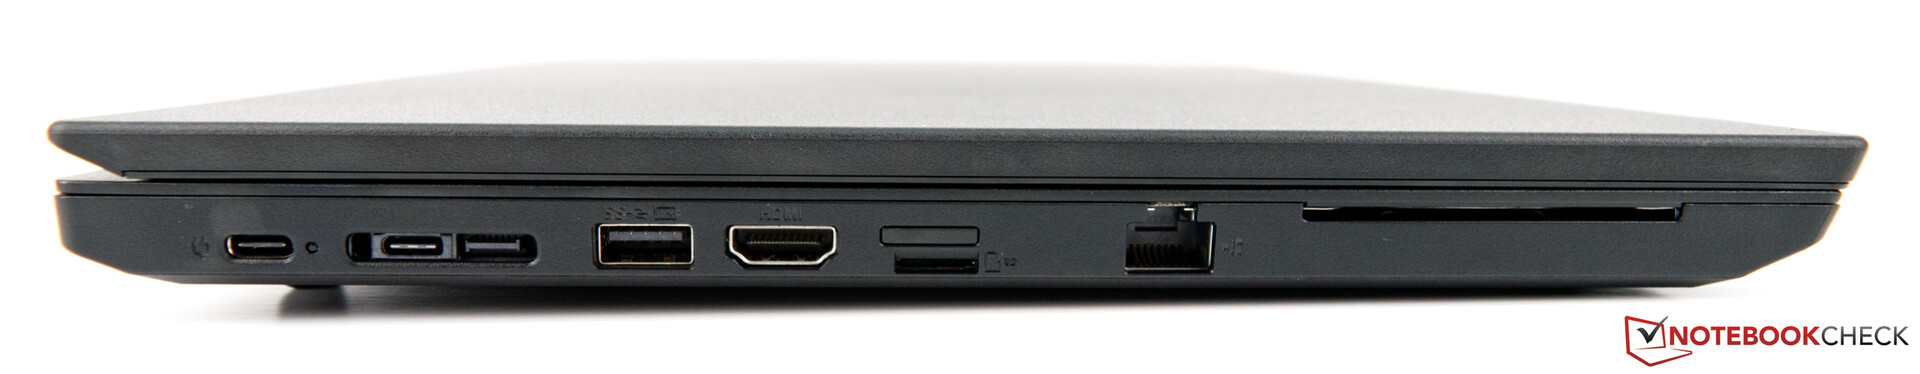
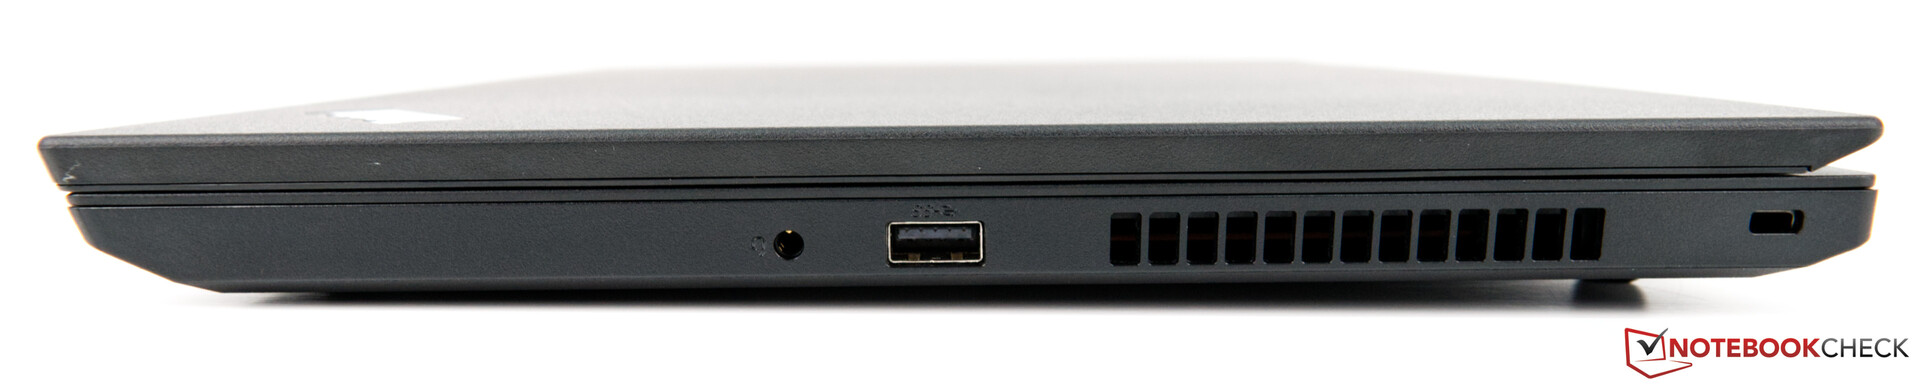
The L590 shares its chassis, ports and connectivity with its predecessor, the L580. Hence, please see our ThinkPad L580 review for our thoughts on these areas.


| SD Card Reader | |
| average JPG Copy Test (av. of 3 runs) | |
| Lenovo ThinkPad E590-20NC0003GE (Toshiba Exceria Pro M501 64 GB UHS-II) | |
| Lenovo ThinkPad L580-20LW000VGE (Toshiba Exceria Pro M501) | |
| Lenovo ThinkPad L590-20Q70019GE (Toshiba Exceria Pro M501 64 GB UHS-II) | |
| Schenker Slim 15-RE-E19 (Toshiba Exceria Pro SDXC 64 GB UHS-II) | |
| Average of class Office (19.8 - 198.5, n=22, last 2 years) | |
| Tuxedo Book BU1307 (Toshiba Exceria Pro SDXC 64 GB UHS-II) | |
| Acer TravelMate X3410-M-50DD (Toshiba Exceria Pro SDXC 64 GB UHS-II) | |
| maximum AS SSD Seq Read Test (1GB) | |
| Lenovo ThinkPad L580-20LW000VGE (Toshiba Exceria Pro M501) | |
| Lenovo ThinkPad E590-20NC0003GE (Toshiba Exceria Pro M501 64 GB UHS-II) | |
| Lenovo ThinkPad L590-20Q70019GE (Toshiba Exceria Pro M501 64 GB UHS-II) | |
| Schenker Slim 15-RE-E19 (Toshiba Exceria Pro SDXC 64 GB UHS-II) | |
| Average of class Office (27.4 - 249, n=21, last 2 years) | |
| Acer TravelMate X3410-M-50DD (Toshiba Exceria Pro SDXC 64 GB UHS-II) | |
Display - A dim IPS panel with a matte finish
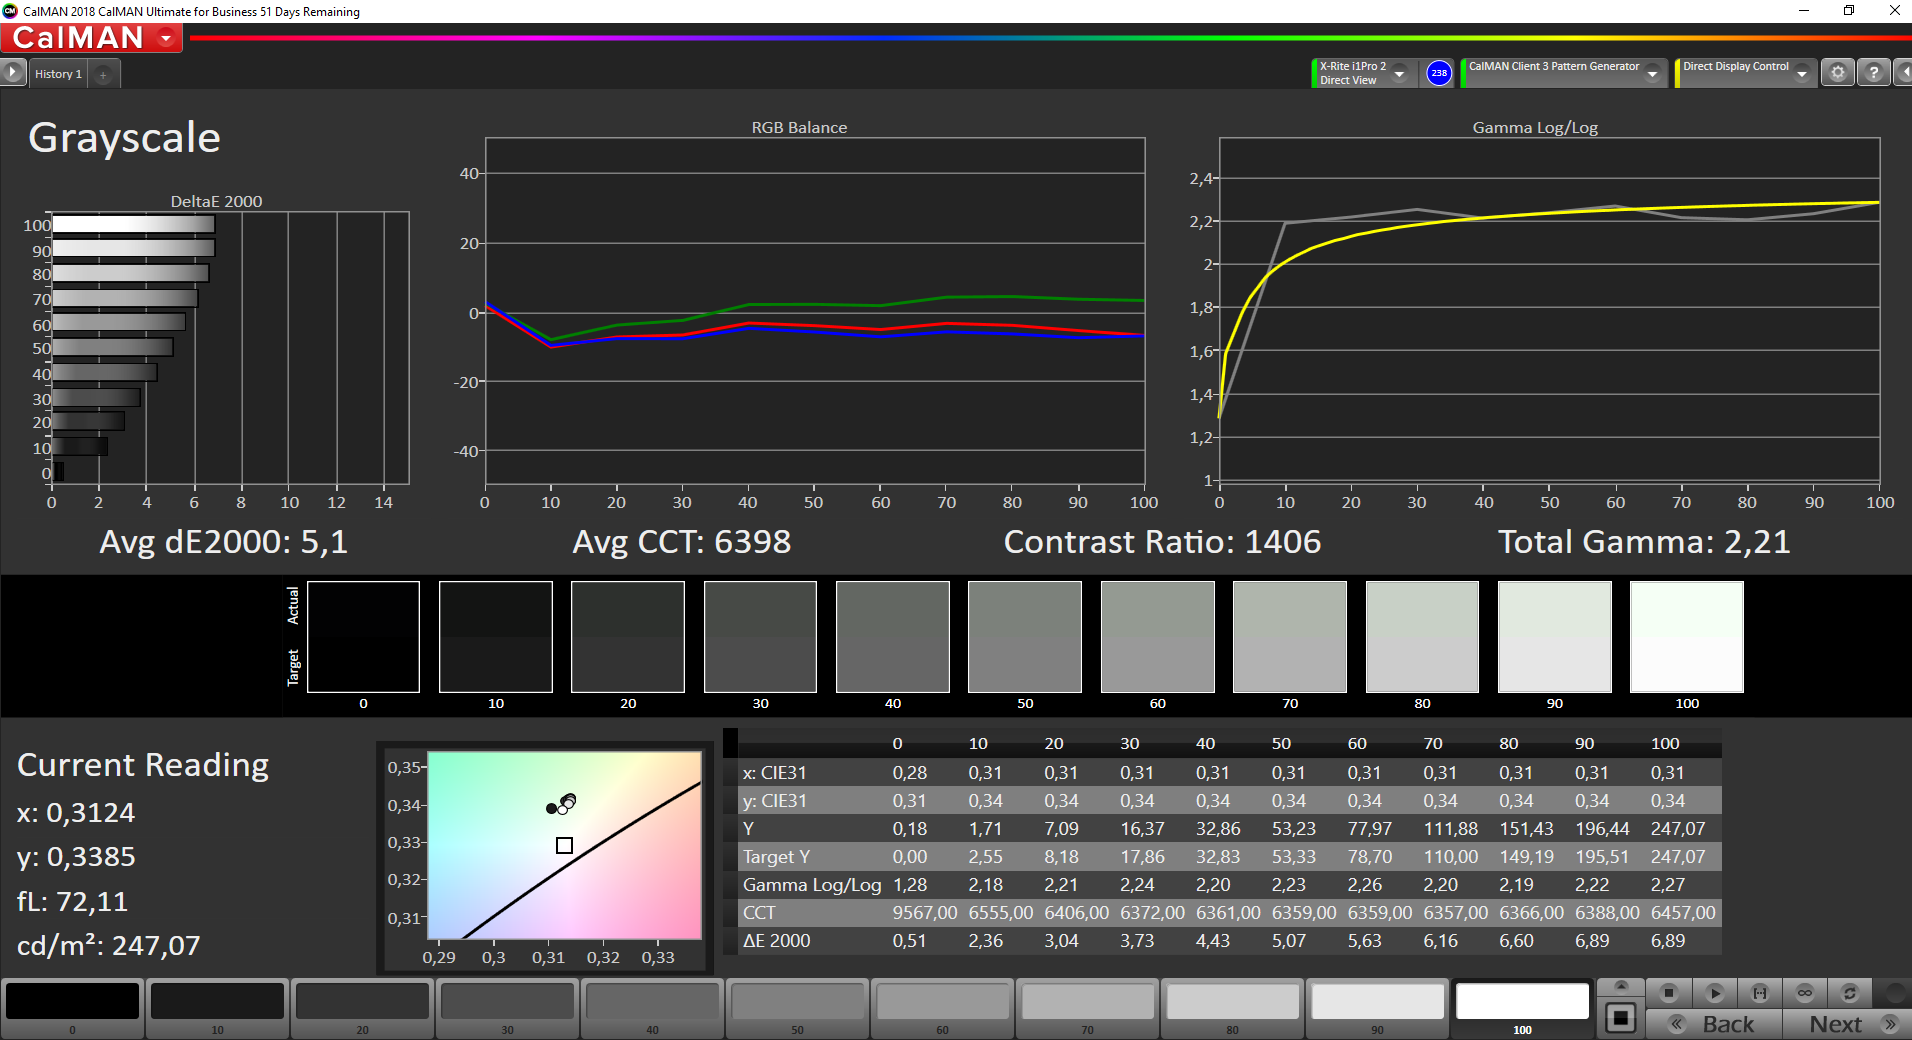
Lenovo currently offers the L590 with two displays. The cheaper of the two is a TN panel, which operates at 720p. The more expensive version is an IPS panel that not only runs at a higher resolution but also has better colour accuracy and viewing angles. The 1080p panel is not that bright though, with the one in our review unit averaging 2228 cd/m² at peak luminosity. Only the centre of the display gets close to Lenovo's claim of 250 cd/m².
Subjectively, the Innolux panel looks good. Images look sharp despite the matte finish, while the comparatively low black level ensures an excellent contrast ratio. It is only 81% evenly lit though, which is mediocre even by the standards of our comparison devices.
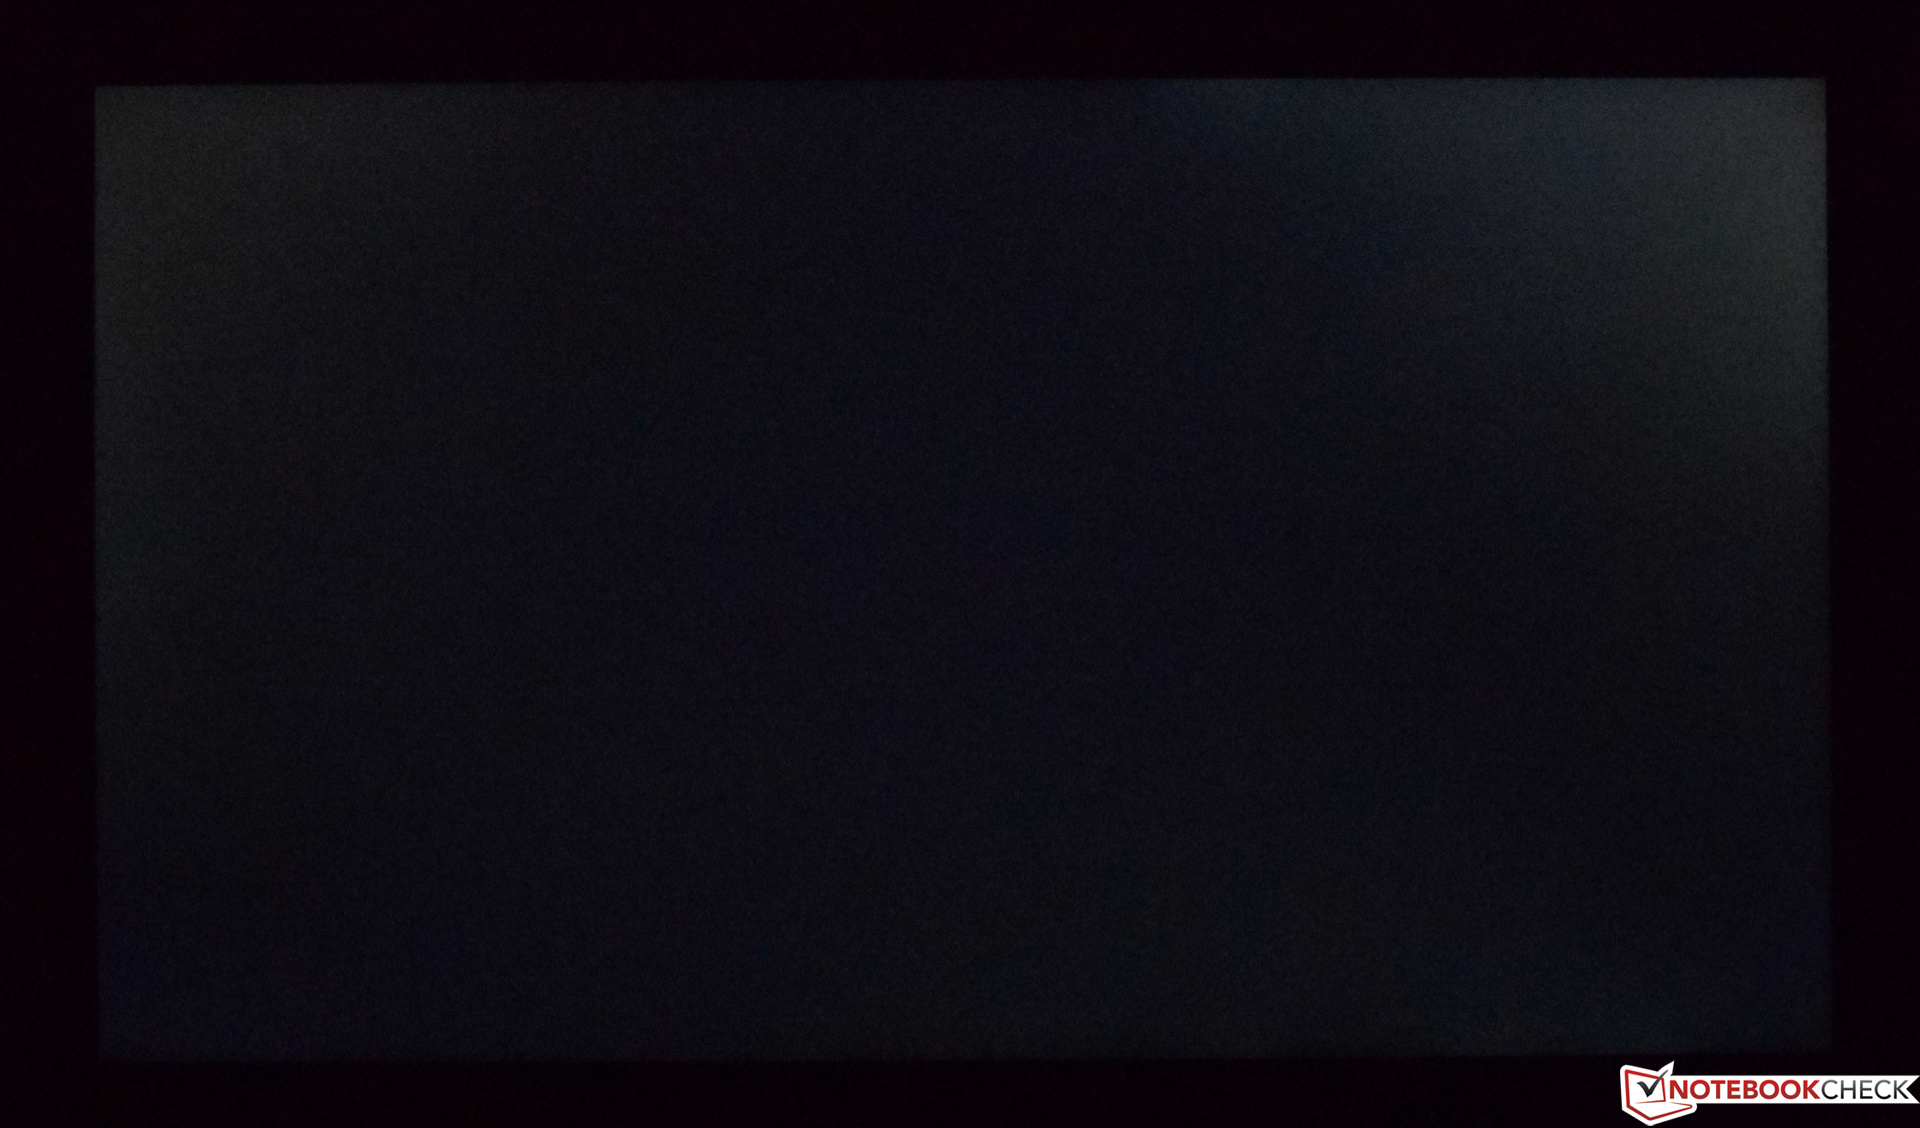
PWM and backlight bleed are issues too. We measure the former at 24,510 Hz, which is high enough to not cause most people headaches or eyestrain. Our review unit suffers from backlight bleeding in the top corners of the display, which we have tried to reproduce in the photo to the right. This did not bother us in daily use, though.
| |||||||||||||||||||||||||
Brightness Distribution: 81 %
Center on Battery: 245 cd/m²
Contrast: 1372:1 (Black: 0.18 cd/m²)
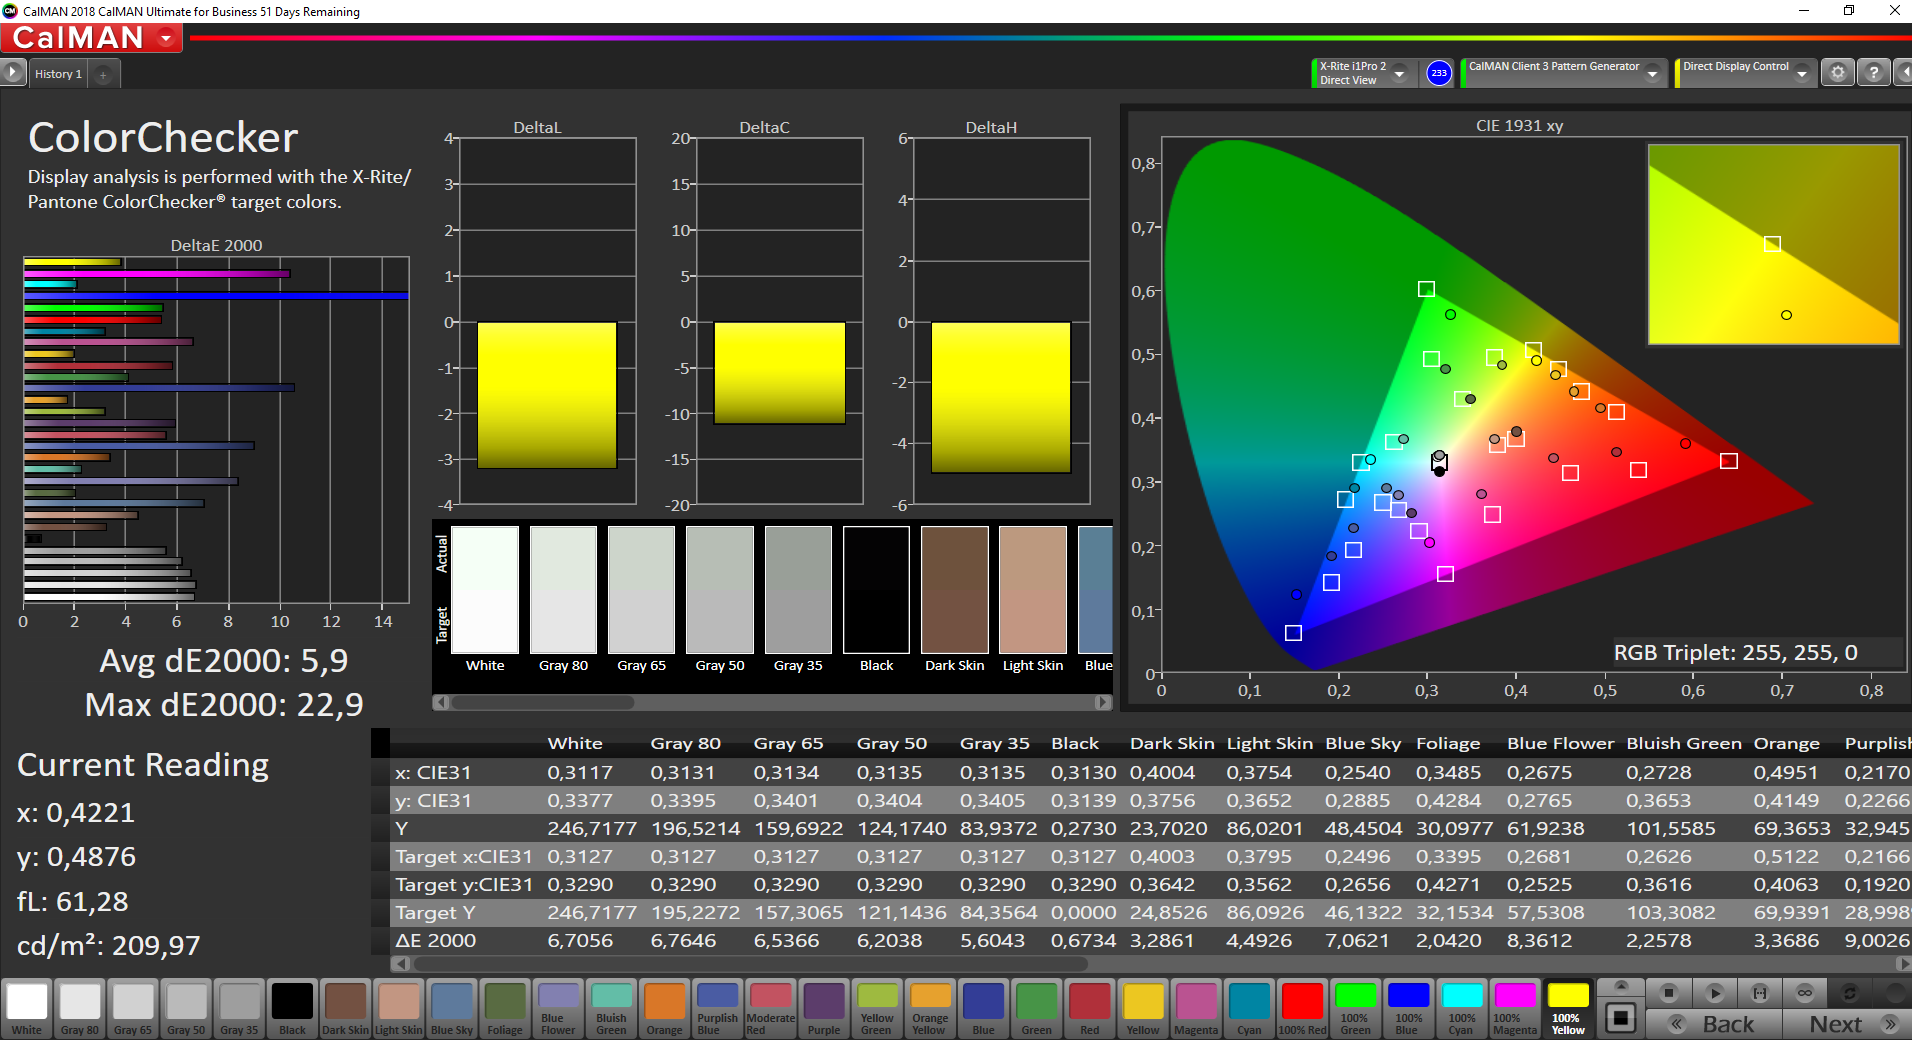
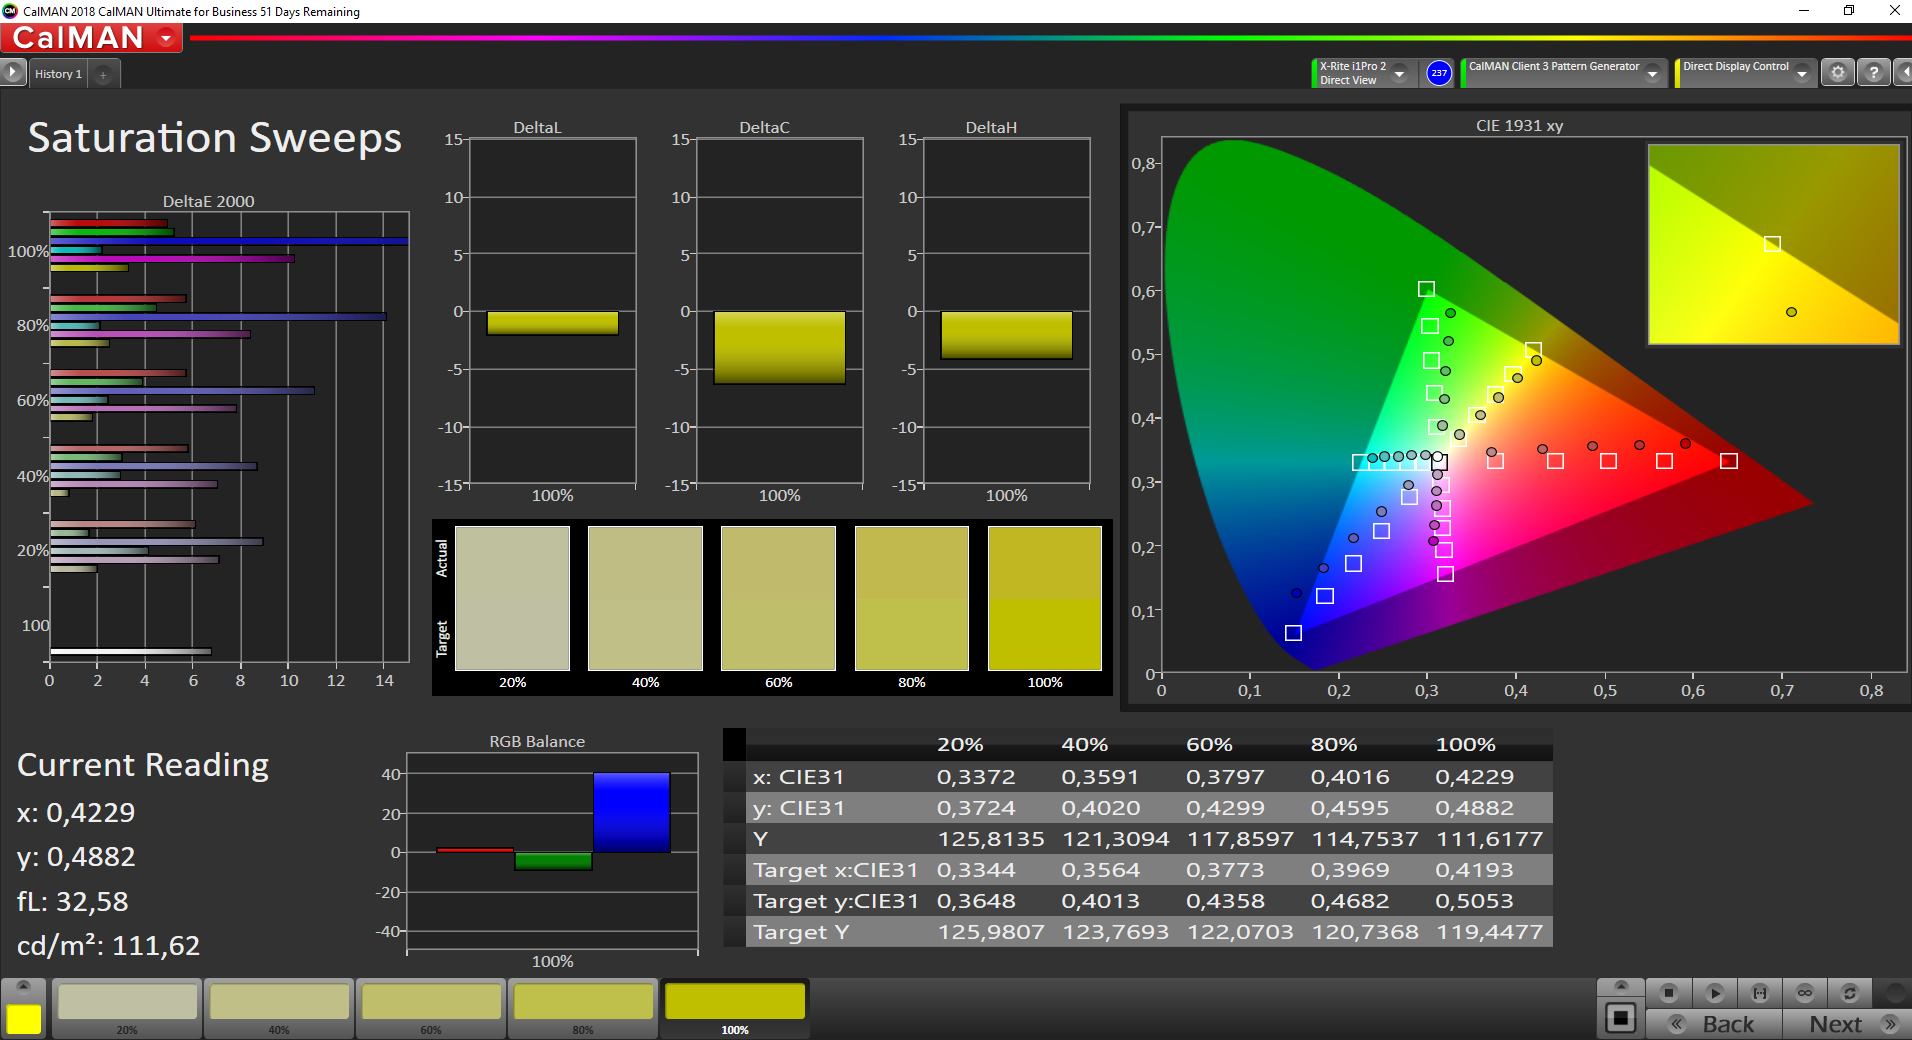
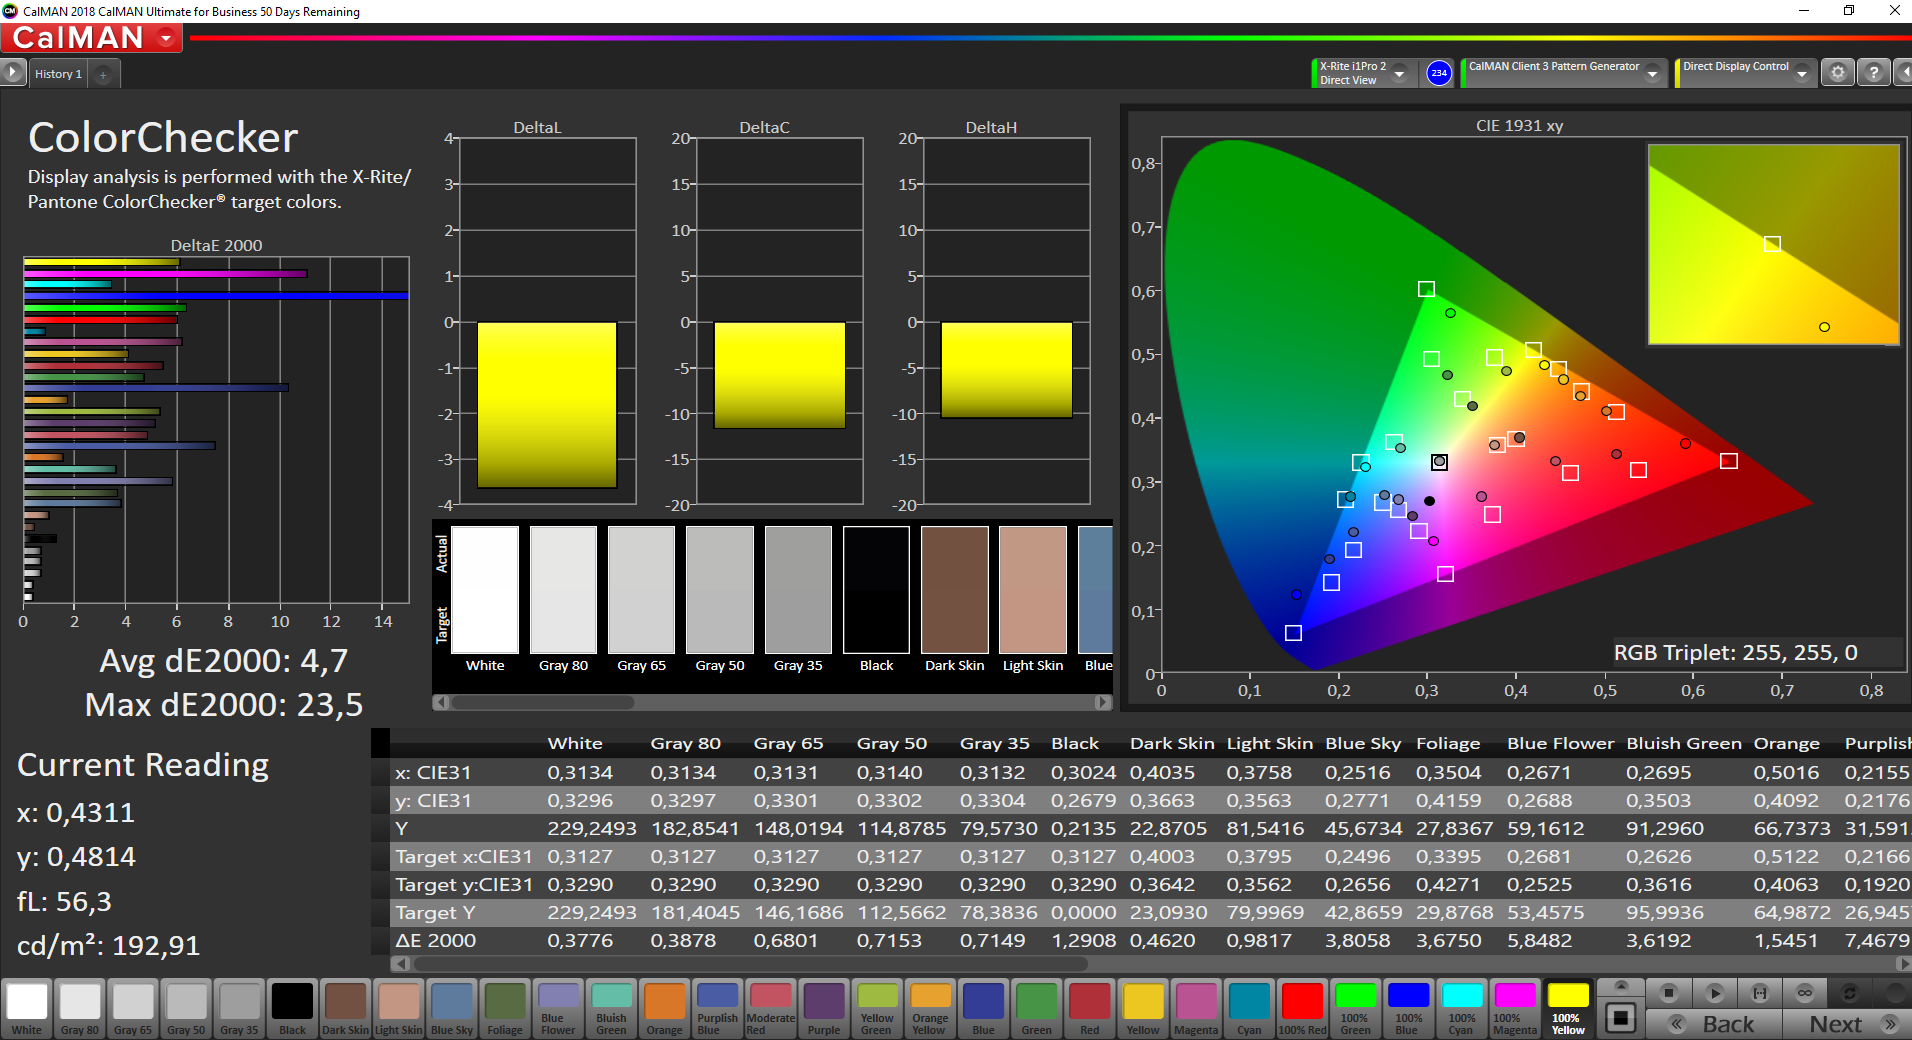
ΔE ColorChecker Calman: 5.9 | ∀{0.5-29.43 Ø4.71}
calibrated: 4.7
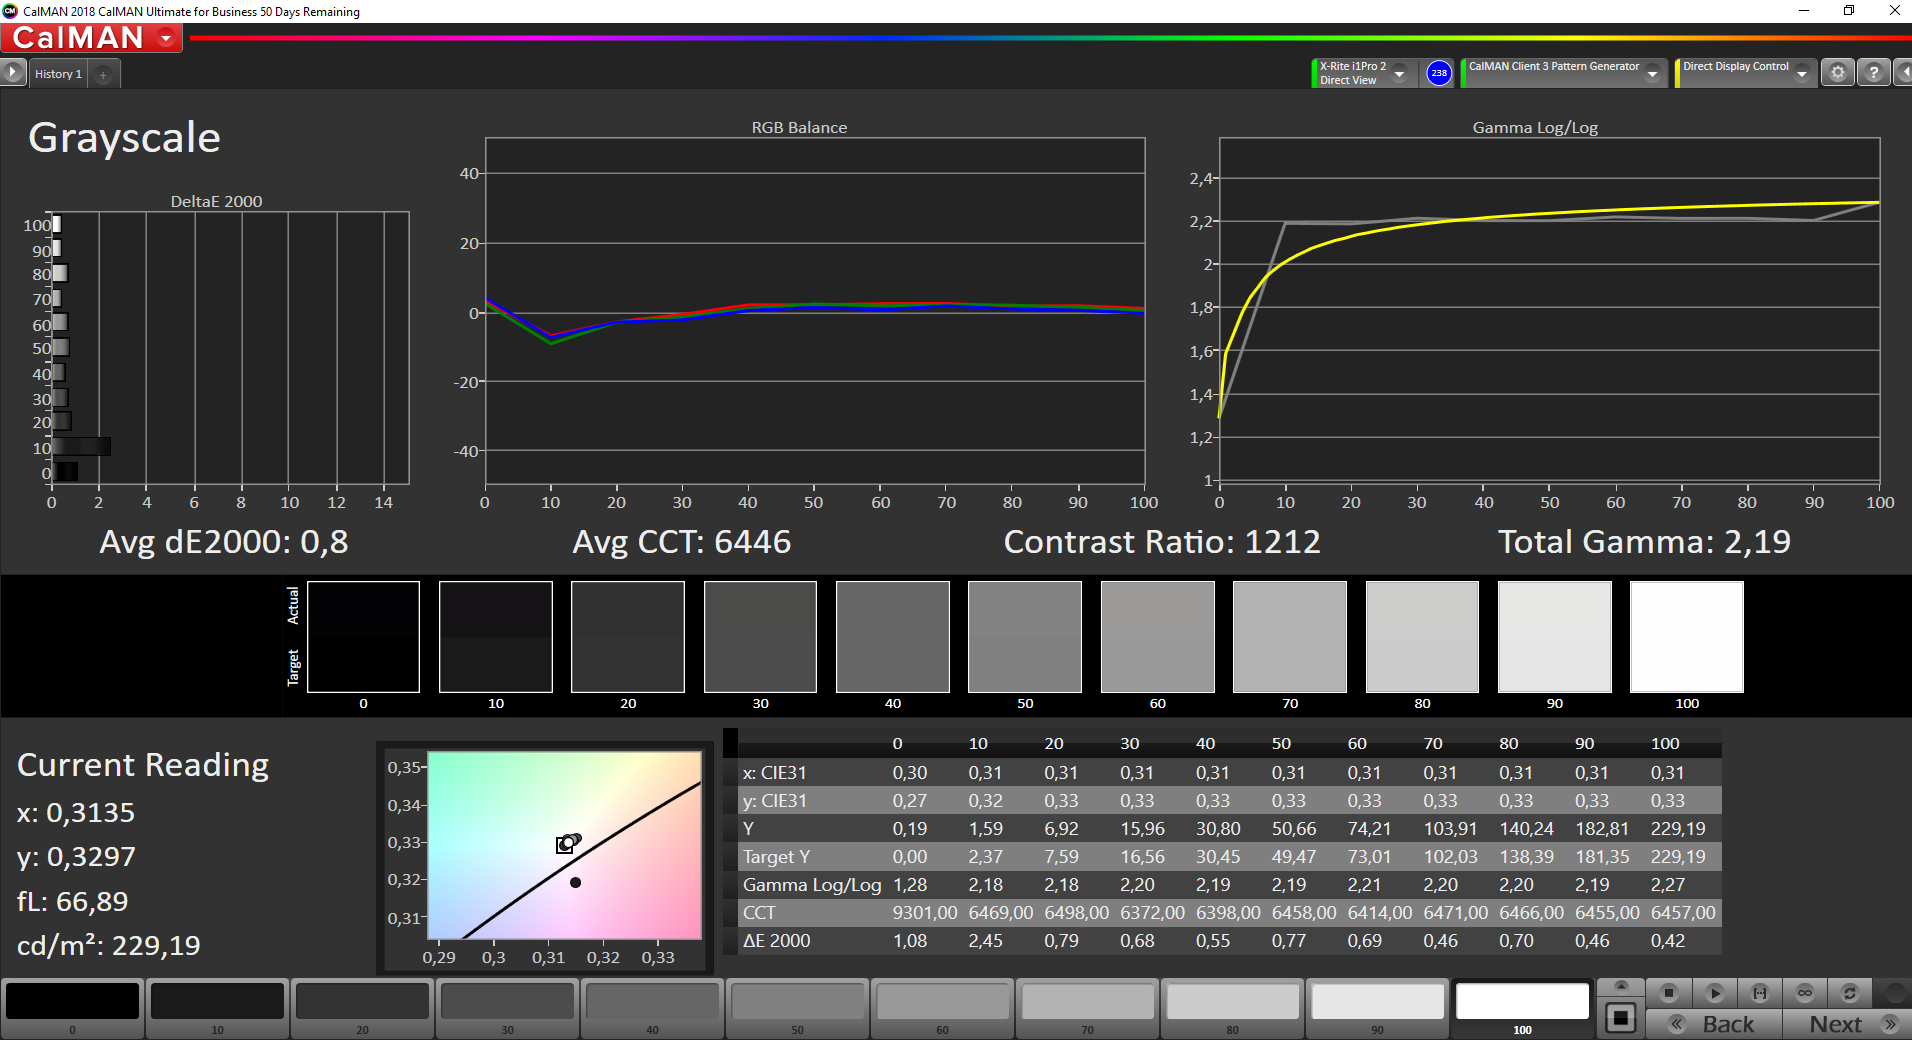
ΔE Greyscale Calman: 5.1 | ∀{0.09-98 Ø4.96}
64.1% sRGB (Argyll 1.6.3 3D)
41.2% AdobeRGB 1998 (Argyll 1.6.3 3D)
44.81% AdobeRGB 1998 (Argyll 3D)
64.4% sRGB (Argyll 3D)
43.3% Display P3 (Argyll 3D)
Gamma: 2.21
CCT: 6398 K
| Lenovo ThinkPad L590-20Q70019GE N156HCE-EAA, IPS, 1920x1080, 15.6" | Lenovo ThinkPad L580-20LW000VGE N156HCE-EAA, IPS, 1920x1080, 15.6" | Schenker Slim 15-RE-E19 Chi Mei CMN15E8, IPS, 2x1, 15.6" | Lenovo ThinkPad E590-20NC0003GE LP156WFC-SPDB, IPS LED, 1920x1080, 15.6" | Tuxedo Book BU1307 AUO272D, IPS, 1920x1080, 13.3" | Acer TravelMate X3410-M-50DD N140HCA-EAC, IPS LED, 1920x1080, 14" | |
|---|---|---|---|---|---|---|
| Display | -1% | 42% | -12% | -3% | ||
| Display P3 Coverage (%) | 43.3 | 42.86 -1% | 63.7 47% | 38.21 -12% | 41.96 -3% | |
| sRGB Coverage (%) | 64.4 | 64.4 0% | 87.7 36% | 57.5 -11% | 63 -2% | |
| AdobeRGB 1998 Coverage (%) | 44.81 | 44.29 -1% | 63.9 43% | 39.47 -12% | 43.37 -3% | |
| Response Times | 16% | 18% | 9% | 27% | 3% | |
| Response Time Grey 50% / Grey 80% * (ms) | 42.8 ? | 33.6 ? 21% | 37 ? 14% | 40 ? 7% | 34 ? 21% | 42 ? 2% |
| Response Time Black / White * (ms) | 30.8 ? | 27.6 ? 10% | 24 ? 22% | 27.6 ? 10% | 21 ? 32% | 30 ? 3% |
| PWM Frequency (Hz) | 24510 ? | 24750 ? | 25000 ? | 400 ? | 24500 ? | |
| Screen | 13% | 11% | 5% | -9% | 24% | |
| Brightness middle (cd/m²) | 247 | 269 9% | 289 17% | 254 3% | 333 35% | 255 3% |
| Brightness (cd/m²) | 228 | 237 4% | 280 23% | 251 10% | 319 40% | 218 -4% |
| Brightness Distribution (%) | 81 | 80 -1% | 87 7% | 90 11% | 83 2% | 72 -11% |
| Black Level * (cd/m²) | 0.18 | 0.21 -17% | 0.36 -100% | 0.2 -11% | 0.3 -67% | 0.08 56% |
| Contrast (:1) | 1372 | 1281 -7% | 803 -41% | 1270 -7% | 1110 -19% | 3188 132% |
| Colorchecker dE 2000 * | 5.9 | 3.9 34% | 3.93 33% | 5.6 5% | 5.01 15% | |
| Colorchecker dE 2000 max. * | 22.9 | 16.3 29% | 6.98 70% | 15.4 33% | 17.44 24% | |
| Colorchecker dE 2000 calibrated * | 4.7 | 3.7 21% | 4.9 -4% | 4.06 14% | ||
| Greyscale dE 2000 * | 5.1 | 1.5 71% | 3.73 27% | 3.1 39% | 7.35 -44% | 3 41% |
| Gamma | 2.21 100% | 2.21 100% | 2.42 91% | 2.22 99% | 2.35 94% | 2.26 97% |
| CCT | 6398 102% | 6332 103% | 6802 96% | 6450 101% | 7156 91% | 6185 105% |
| Color Space (Percent of AdobeRGB 1998) (%) | 41.2 | 40.8 -1% | 57 38% | 36.3 -12% | 40 -3% | |
| Color Space (Percent of sRGB) (%) | 64.1 | 64.3 0% | 87 36% | 57.1 -11% | 63 -2% | |
| Total Average (Program / Settings) | 9% /
11% | 24% /
18% | 1% /
2% | 9% /
0% | 8% /
16% |
* ... smaller is better
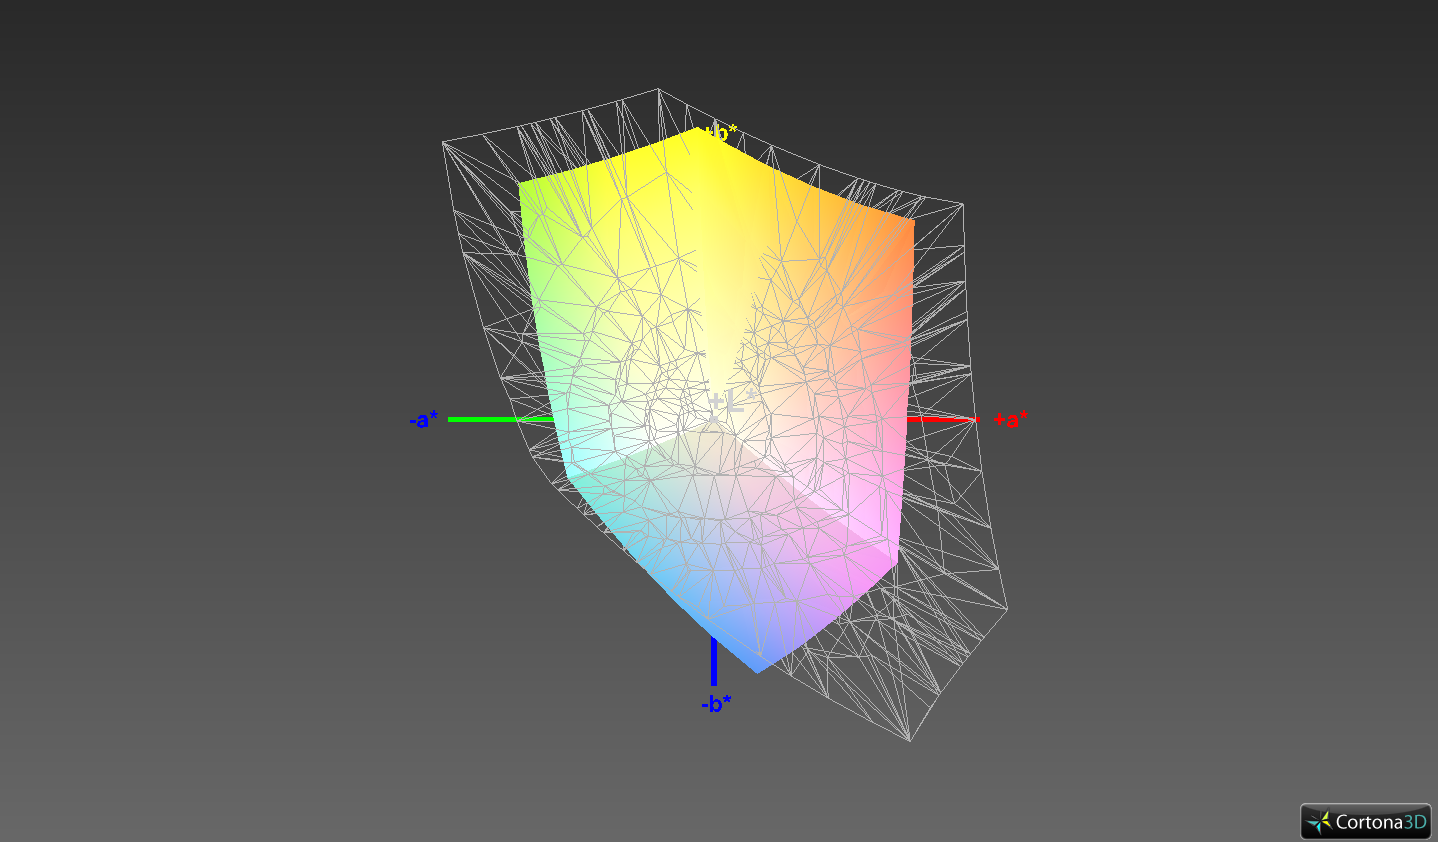
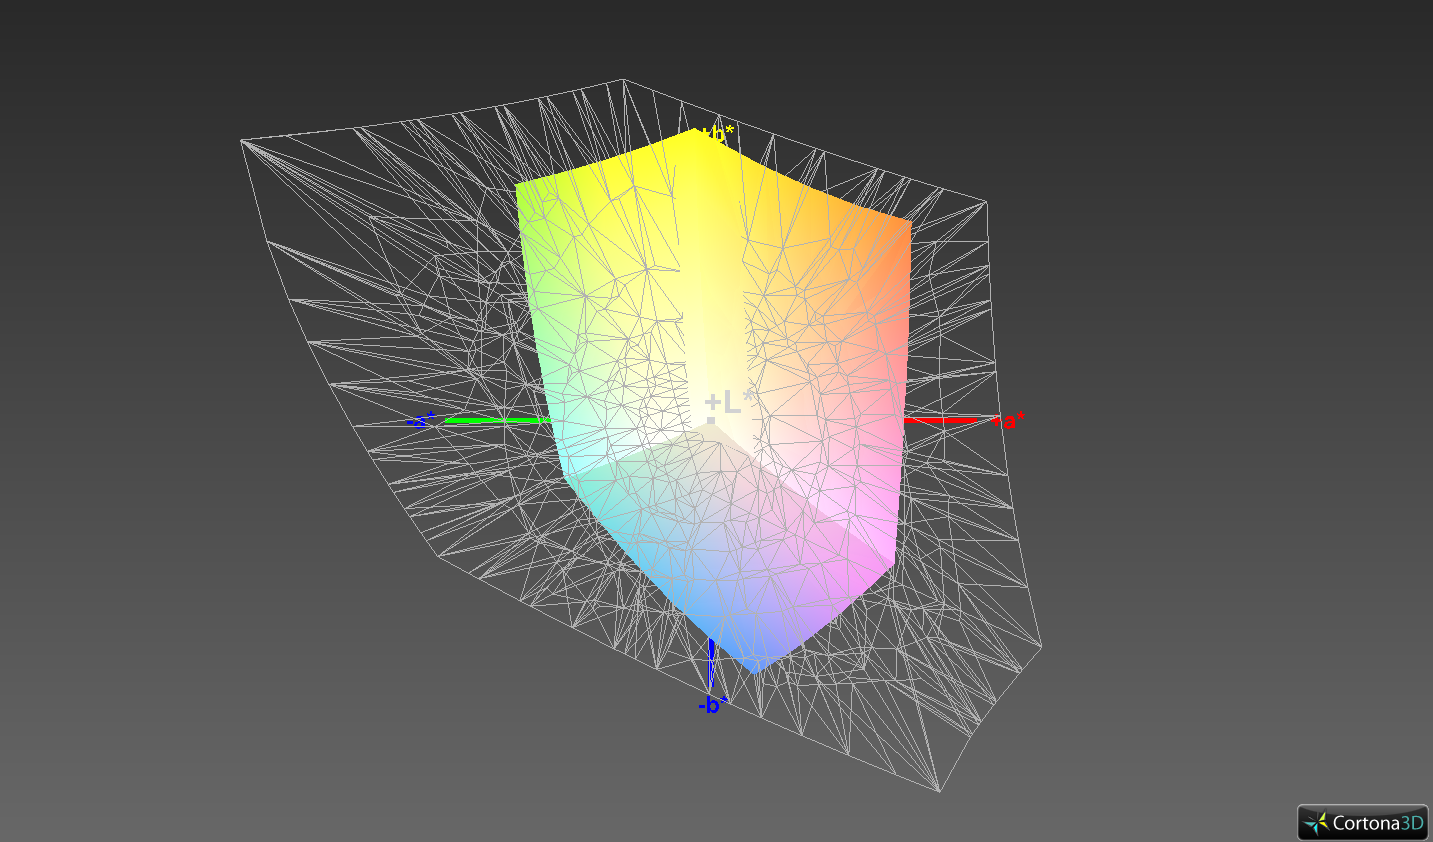
The display in our review unit is less colour-accurate out of the box than the one in its predecessor L580, significantly so in some cases. Calibrating the panel reduced DeltaE deviations, though. While the L590 and L580 have the same display, no two panels are identical. Hence, it is no surprise that their black level, peak brightness and contrast ratio differ. The two displays have subtly different colour space coverages too, but neither is accurate enough for professional image-editing. You could always use an external monitor for colour critical work, as the L590 offers no other restrictions in this regard.
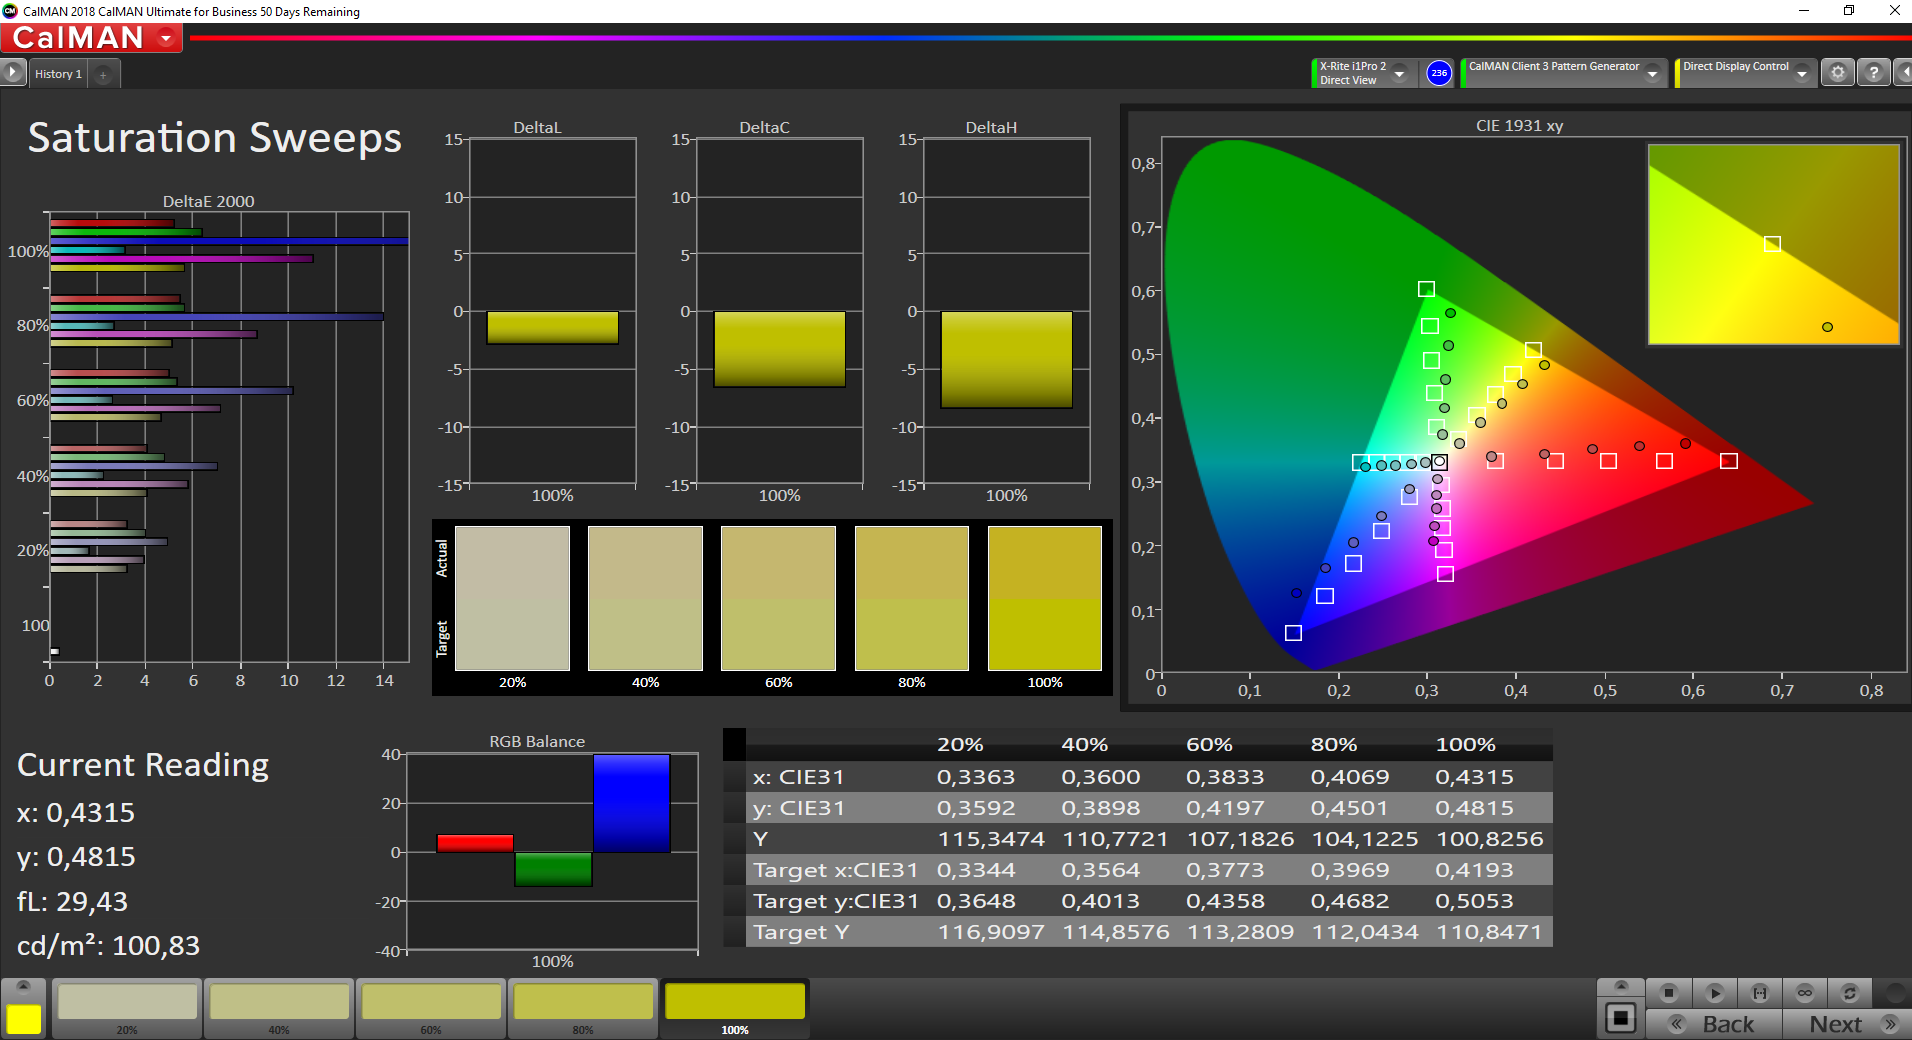
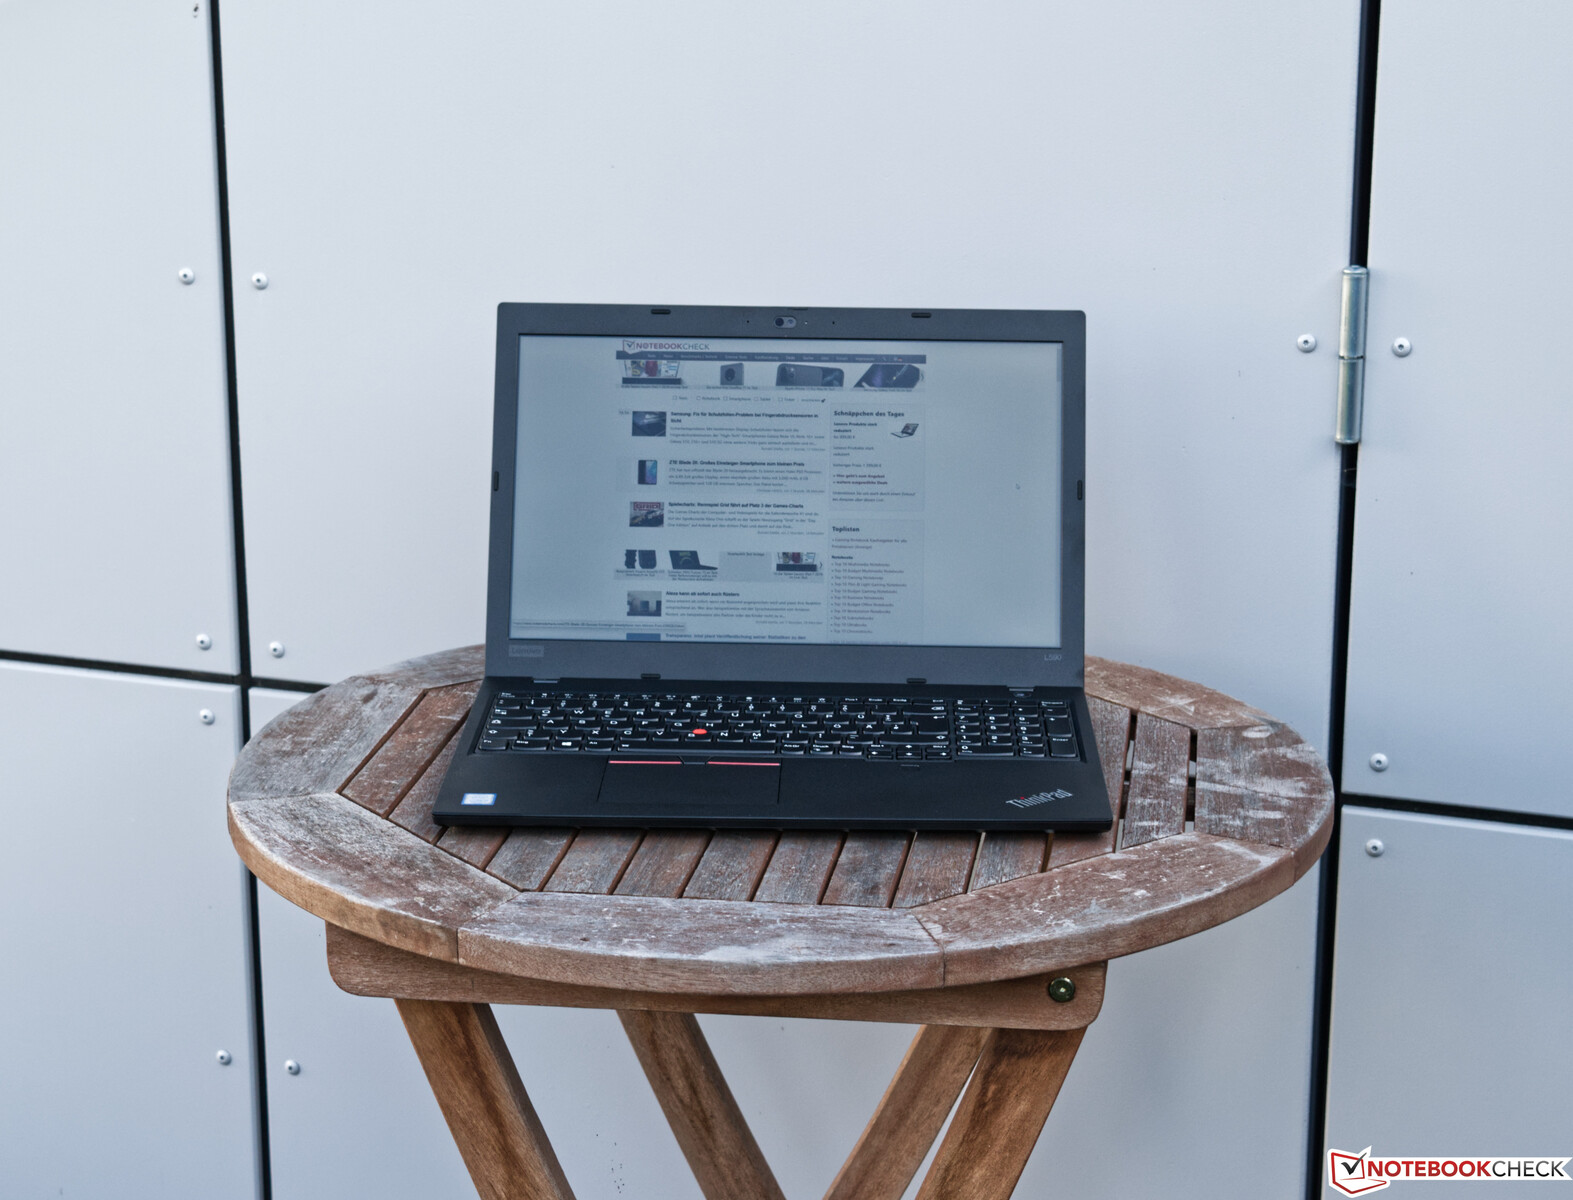
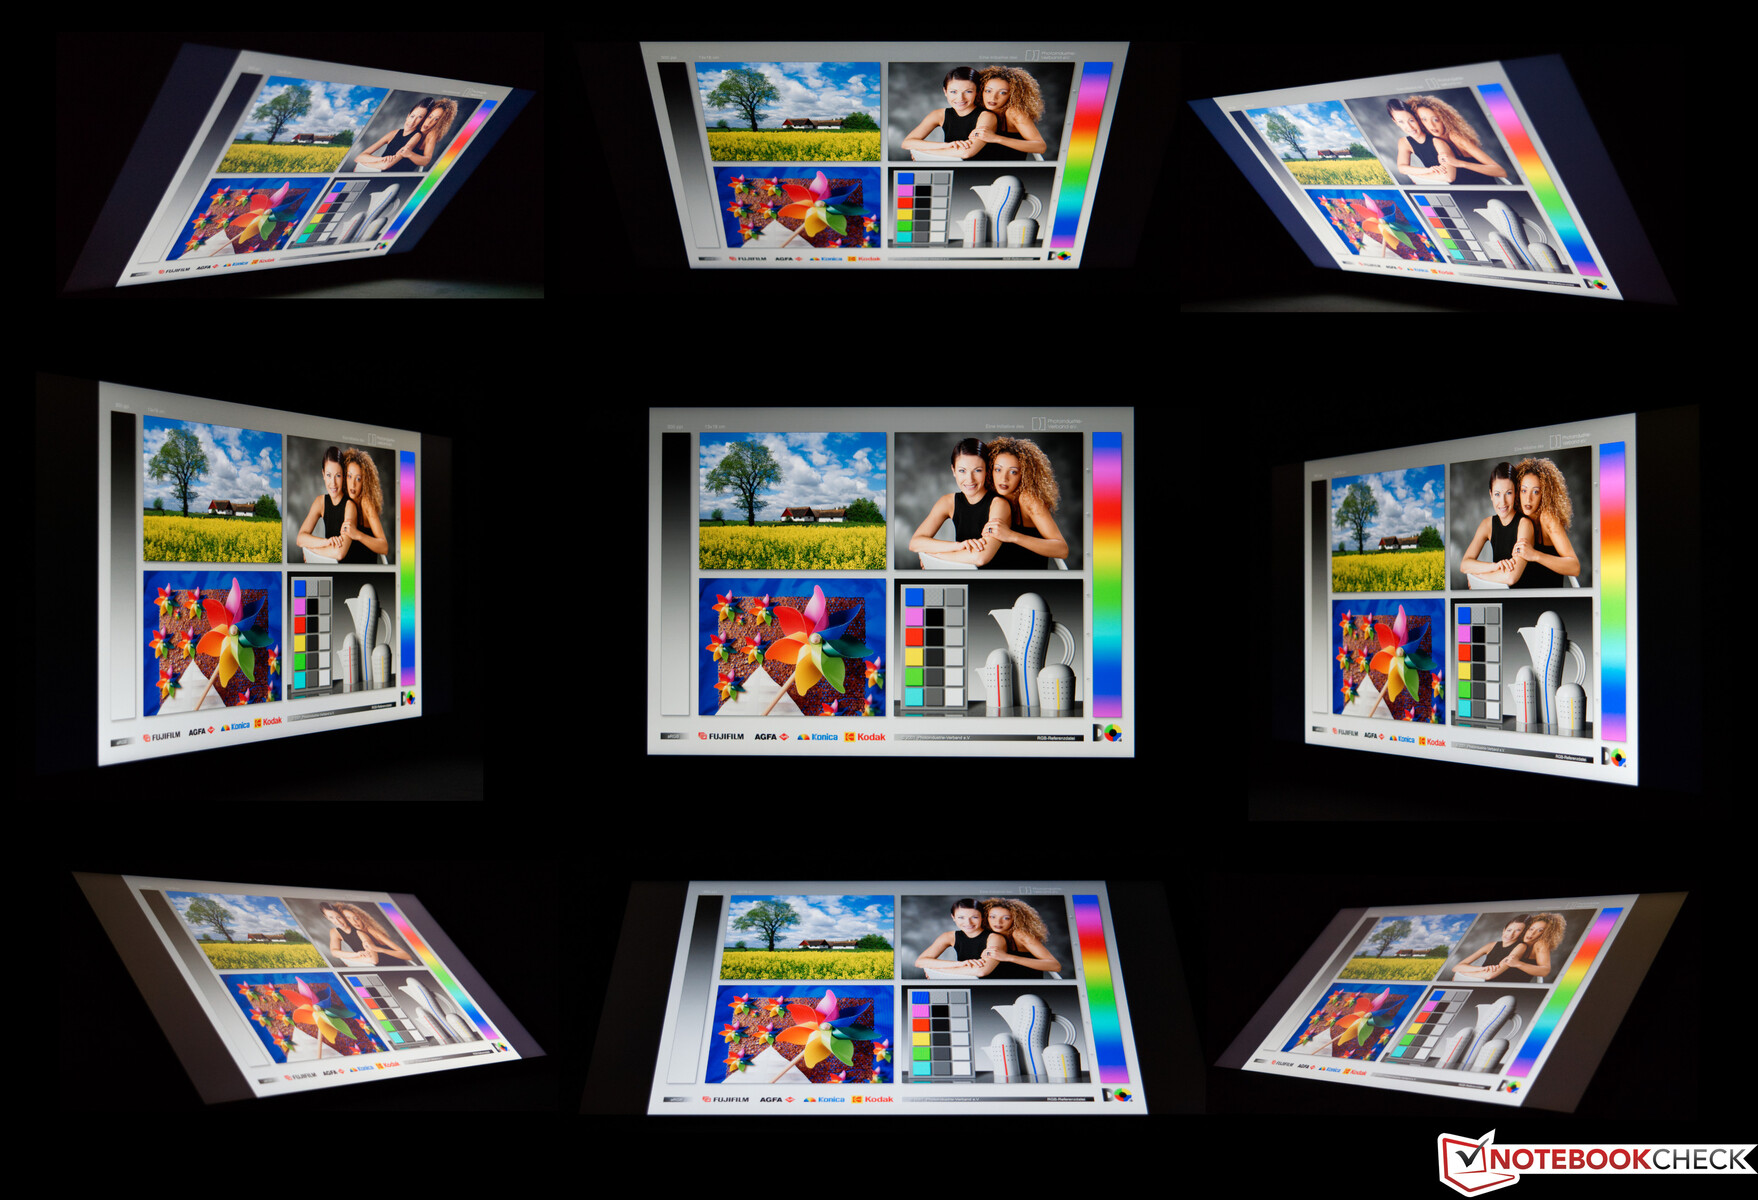
The L590 has stable viewing angles too, which is typical of devices with IPS panels. The matte finish proved useful when using our review unit outdoors, but the display still looks washed-out in bright sunshine. Hence, we would recommend finding a shady spot on a sunny day, if possible.
Display Response Times
| ↔ Response Time Black to White | ||
|---|---|---|
| 30.8 ms ... rise ↗ and fall ↘ combined | ↗ 18 ms rise | 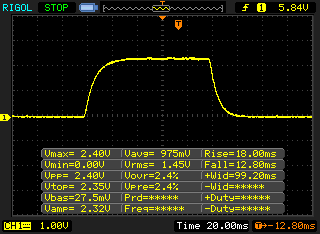 |
| ↘ 12.8 ms fall | ||
| The screen shows slow response rates in our tests and will be unsatisfactory for gamers. In comparison, all tested devices range from 0.1 (minimum) to 240 (maximum) ms. » 83 % of all devices are better. This means that the measured response time is worse than the average of all tested devices (19.8 ms). | ||
| ↔ Response Time 50% Grey to 80% Grey | ||
| 42.8 ms ... rise ↗ and fall ↘ combined | ↗ 22.8 ms rise | 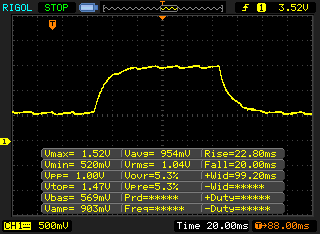 |
| ↘ 20 ms fall | ||
| The screen shows slow response rates in our tests and will be unsatisfactory for gamers. In comparison, all tested devices range from 0.165 (minimum) to 636 (maximum) ms. » 71 % of all devices are better. This means that the measured response time is worse than the average of all tested devices (30.9 ms). | ||
Screen Flickering / PWM (Pulse-Width Modulation)
| Screen flickering / PWM detected | 24510 Hz | ≤ 40 % brightness setting | 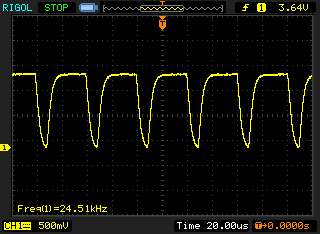 |
The display backlight flickers at 24510 Hz (worst case, e.g., utilizing PWM) Flickering detected at a brightness setting of 40 % and below. There should be no flickering or PWM above this brightness setting. The frequency of 24510 Hz is quite high, so most users sensitive to PWM should not notice any flickering. In comparison: 52 % of all tested devices do not use PWM to dim the display. If PWM was detected, an average of 7741 (minimum: 5 - maximum: 343500) Hz was measured. | |||
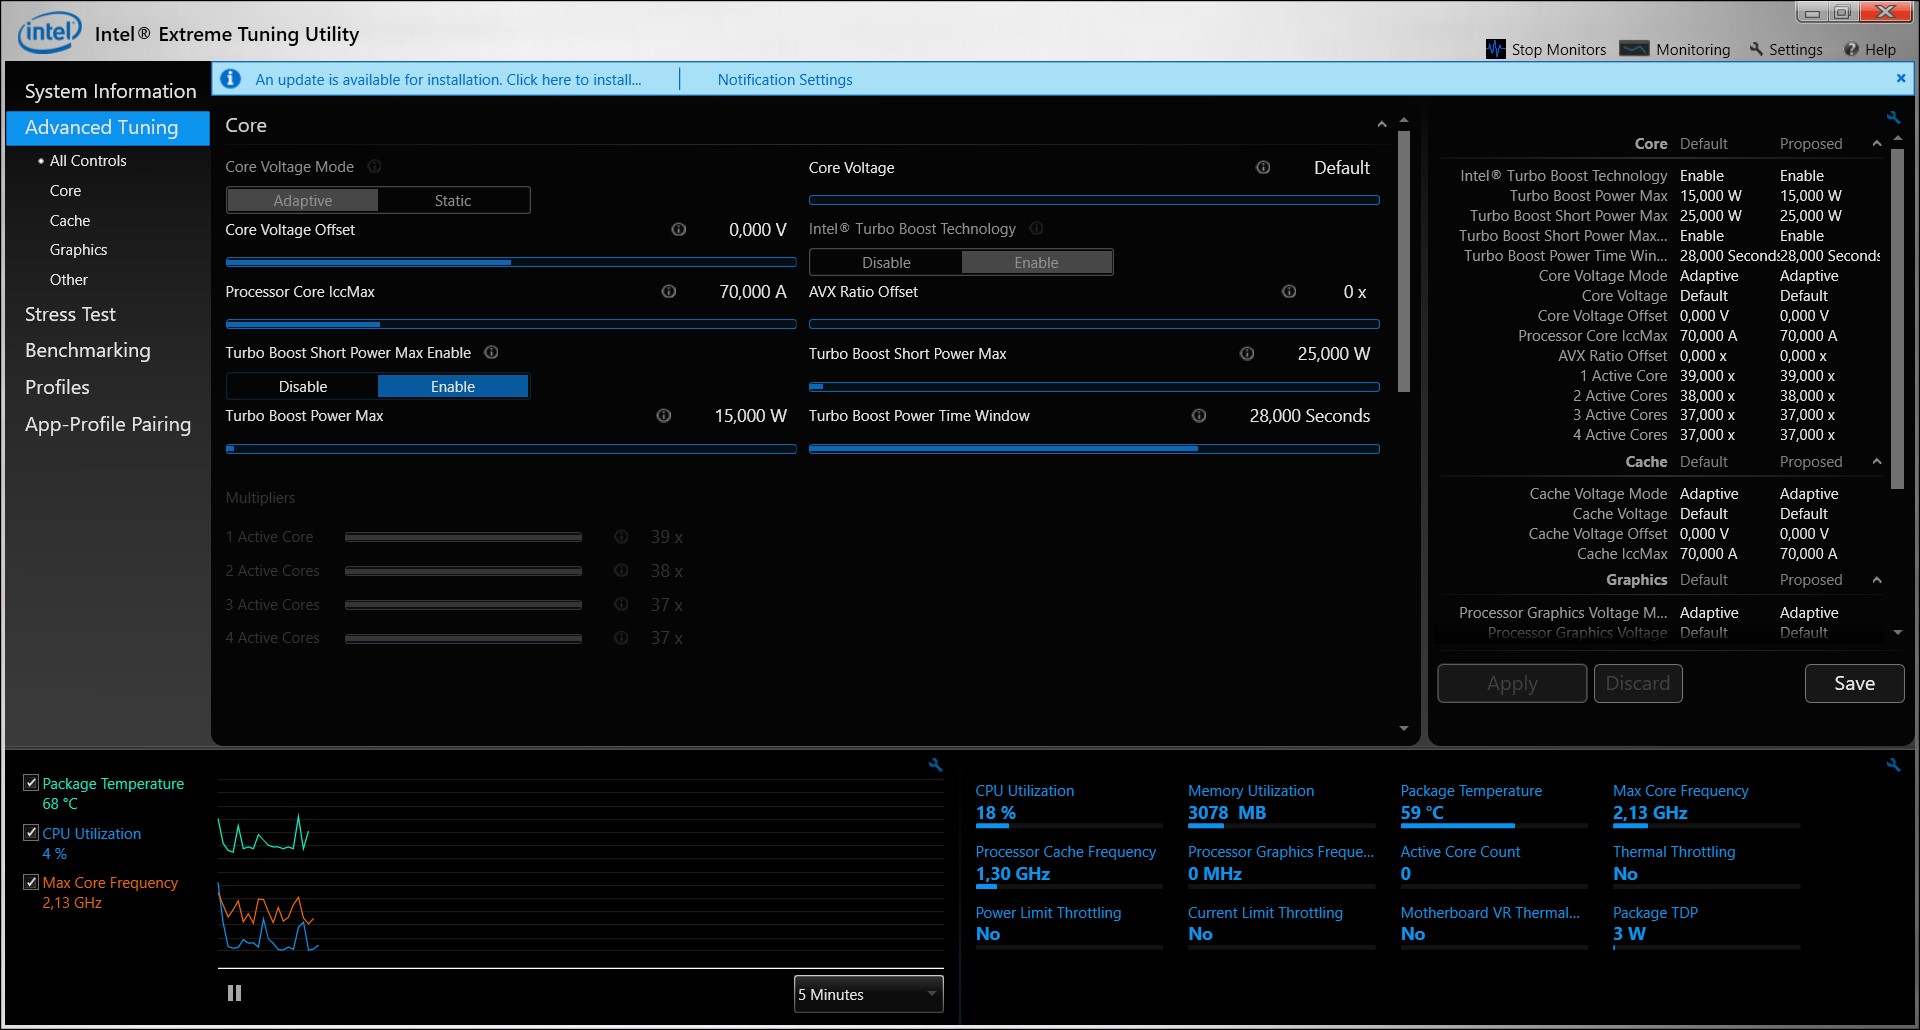
Performance - An everyday ThinkPad
The L590 delivers enough performance for everyday office work. However, the L580 offers better multi-core performance, which we will cover in the next section of this review. 16 GB of RAM and a 512 GB NVMe SSD help the L590 achieve decent system performance, though. It is a shame that the device cannot get the most from its Core i5-8265U processor, which appears to be a cooling issue. While Lenovo sells a Core i7-8565U version that theoretically should provide better performance than its Core i5 counterpart, it will likely also suffer from the same performance issues. Expanding the RAM up to 64 GB may yield some performance improvements too, though.
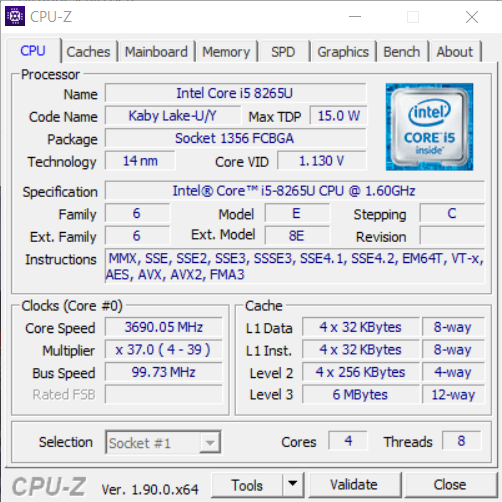
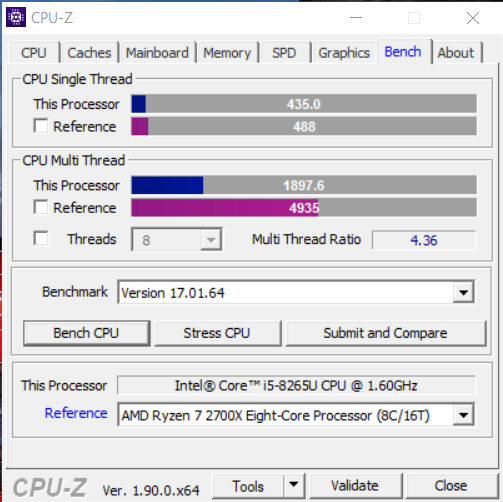

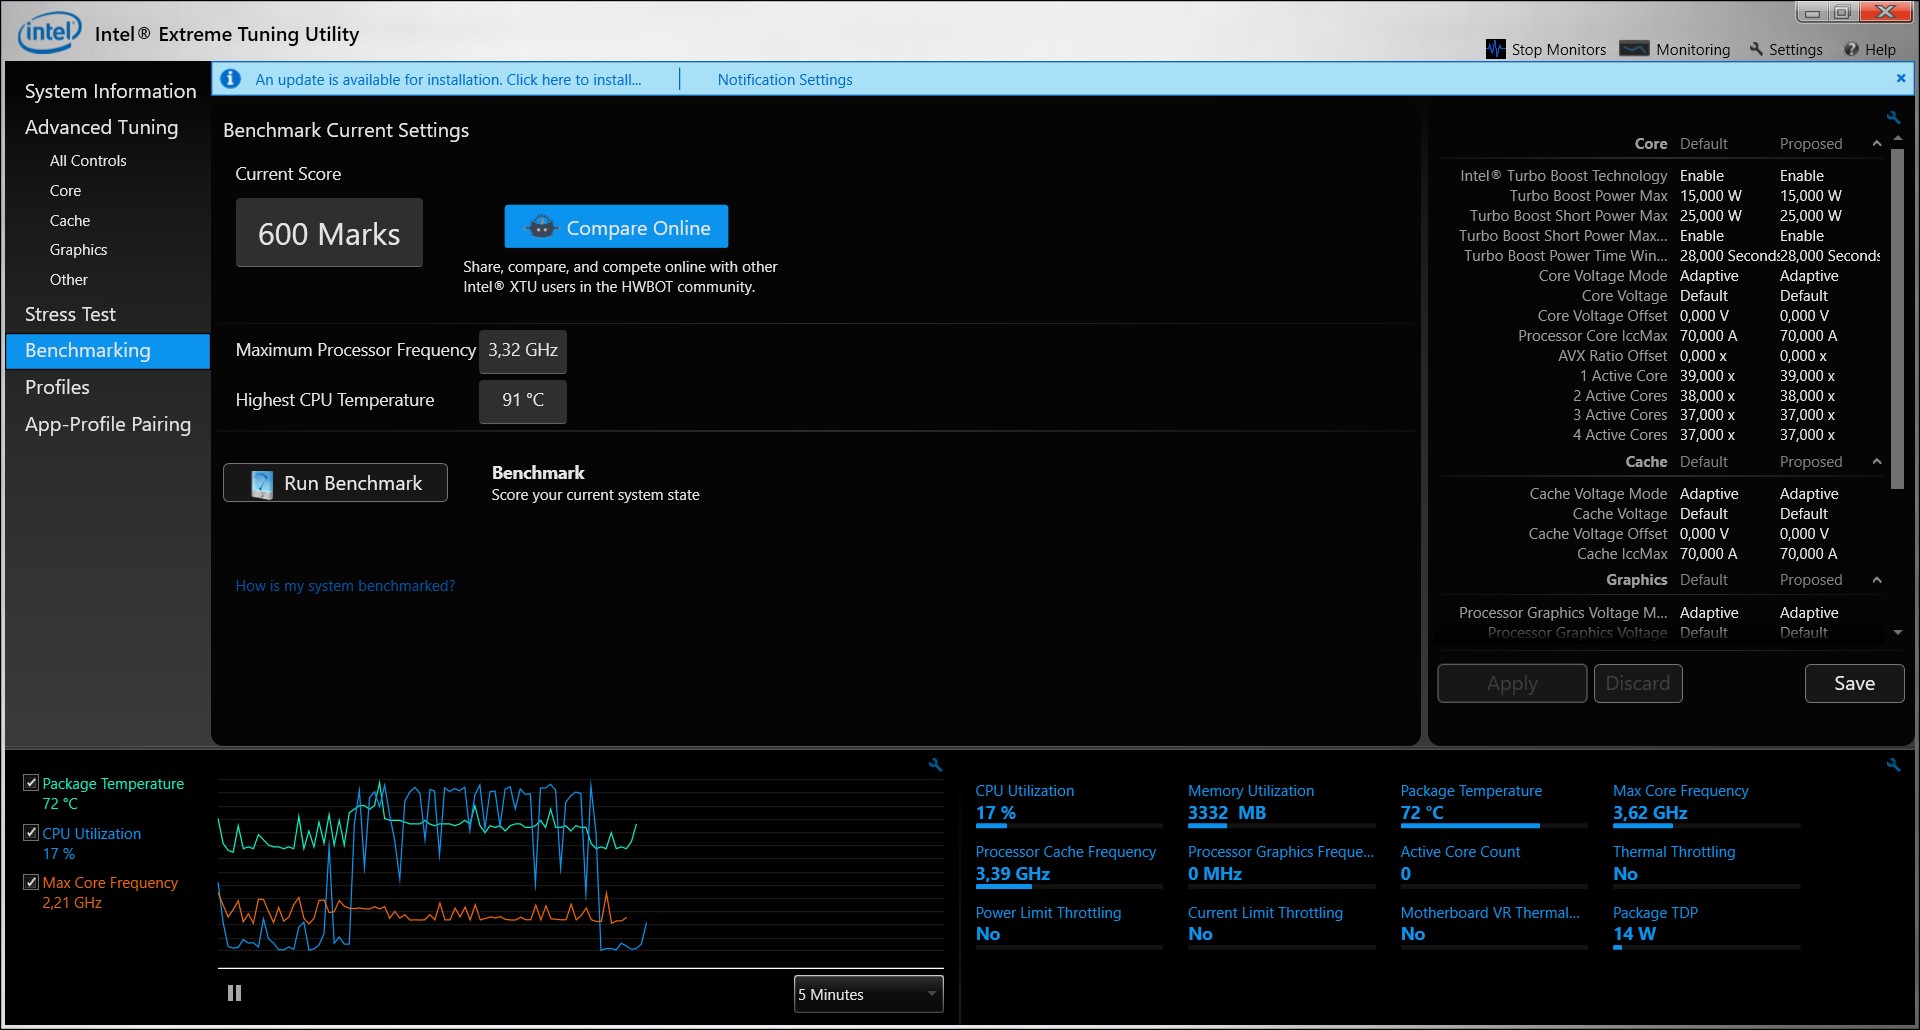
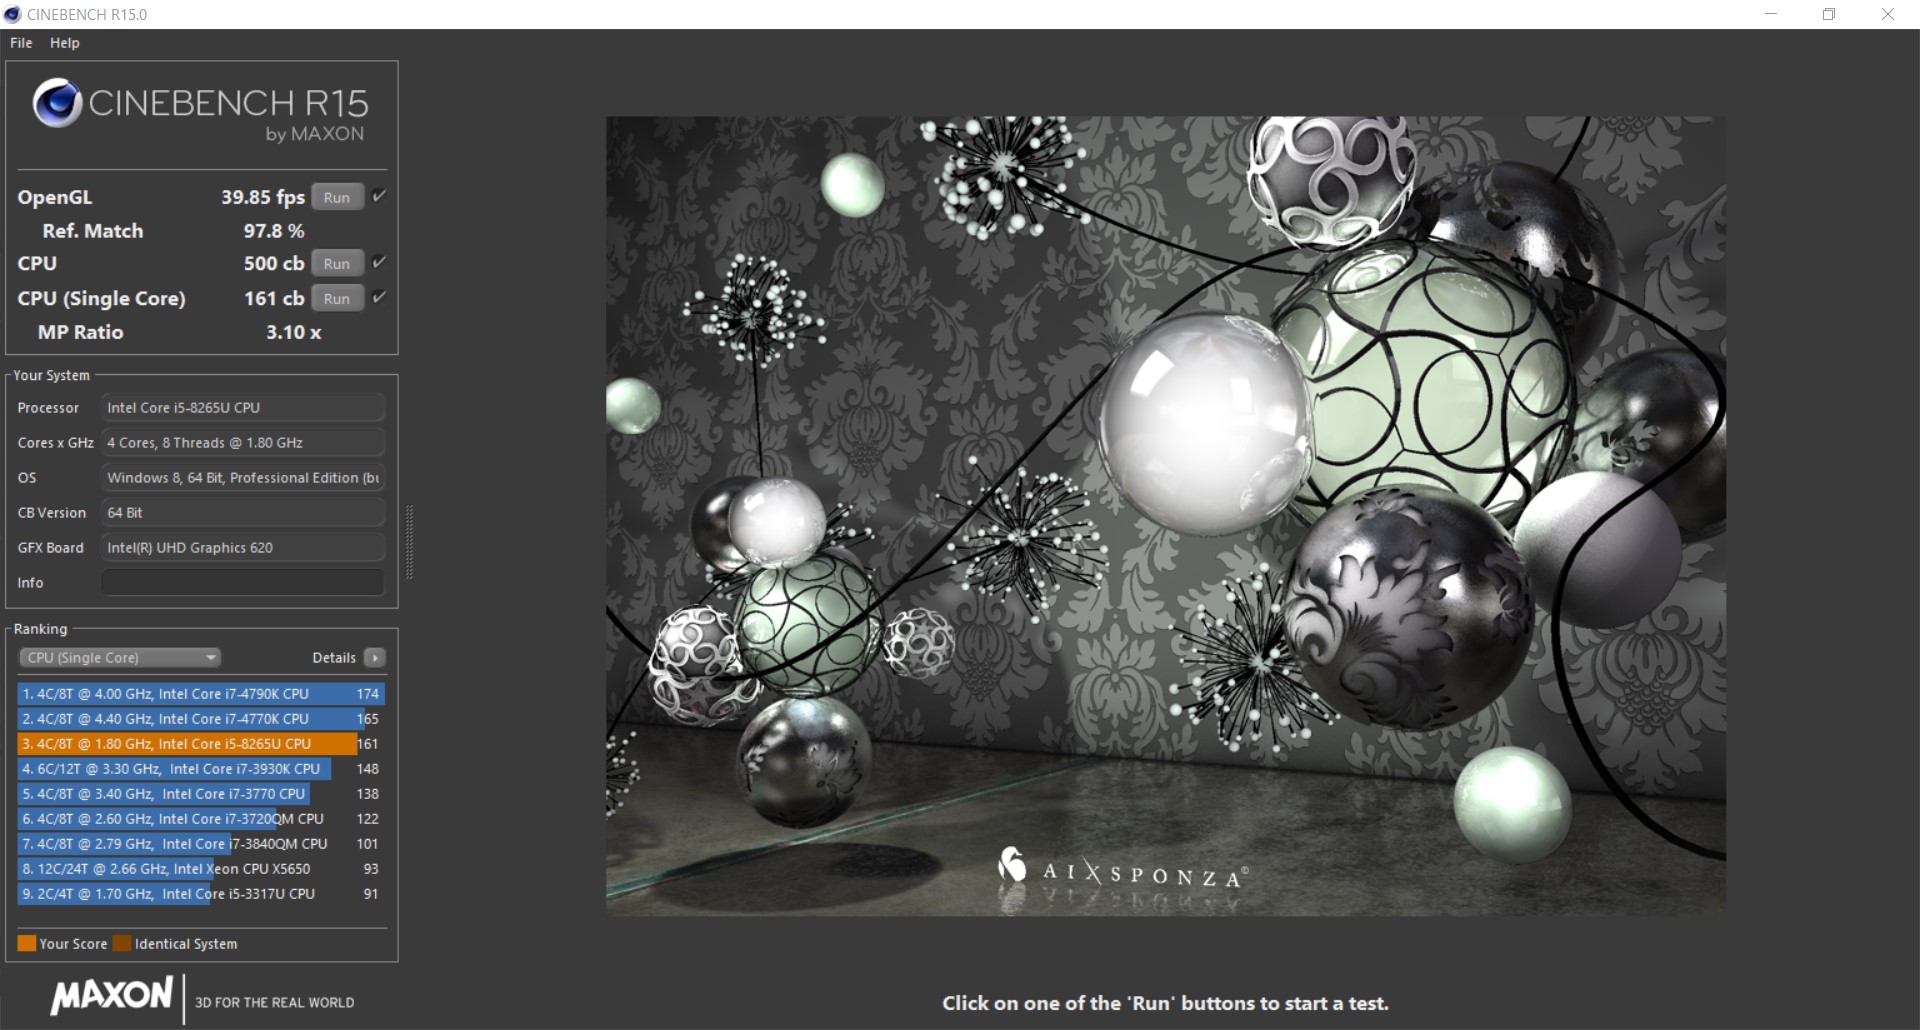
Processor
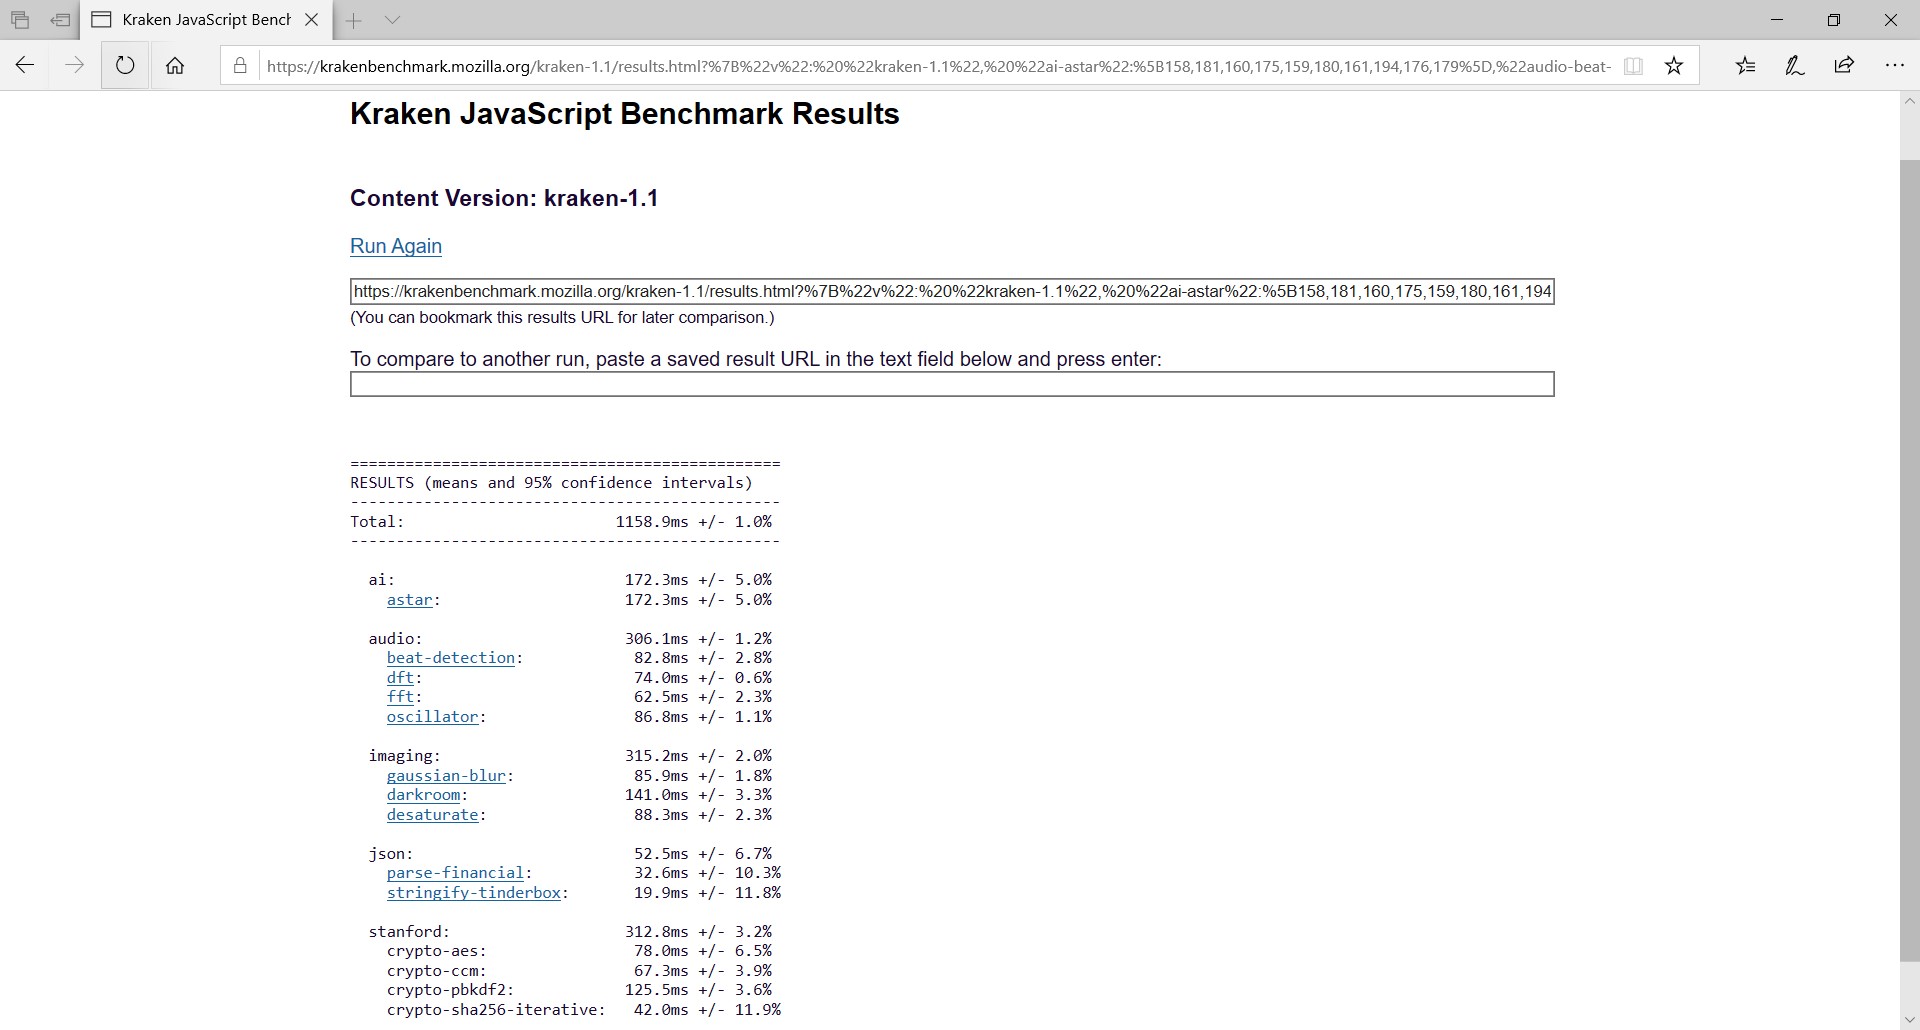
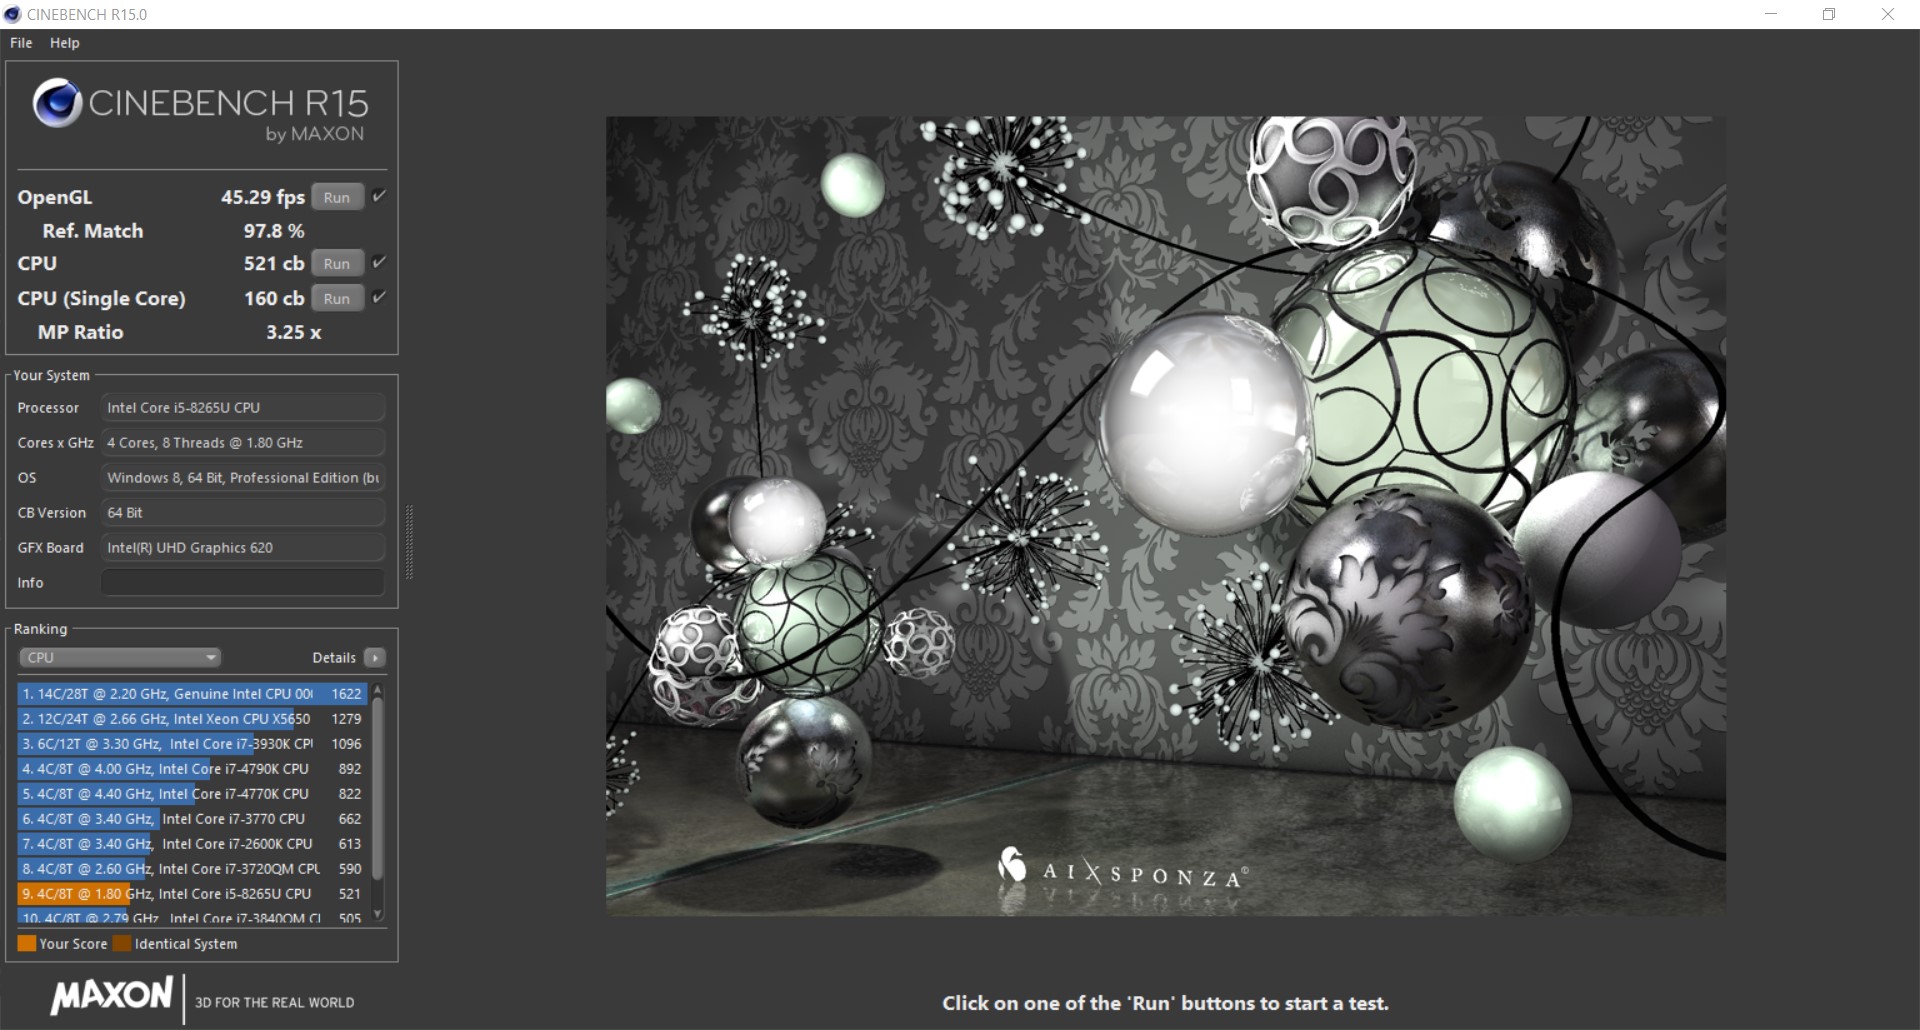
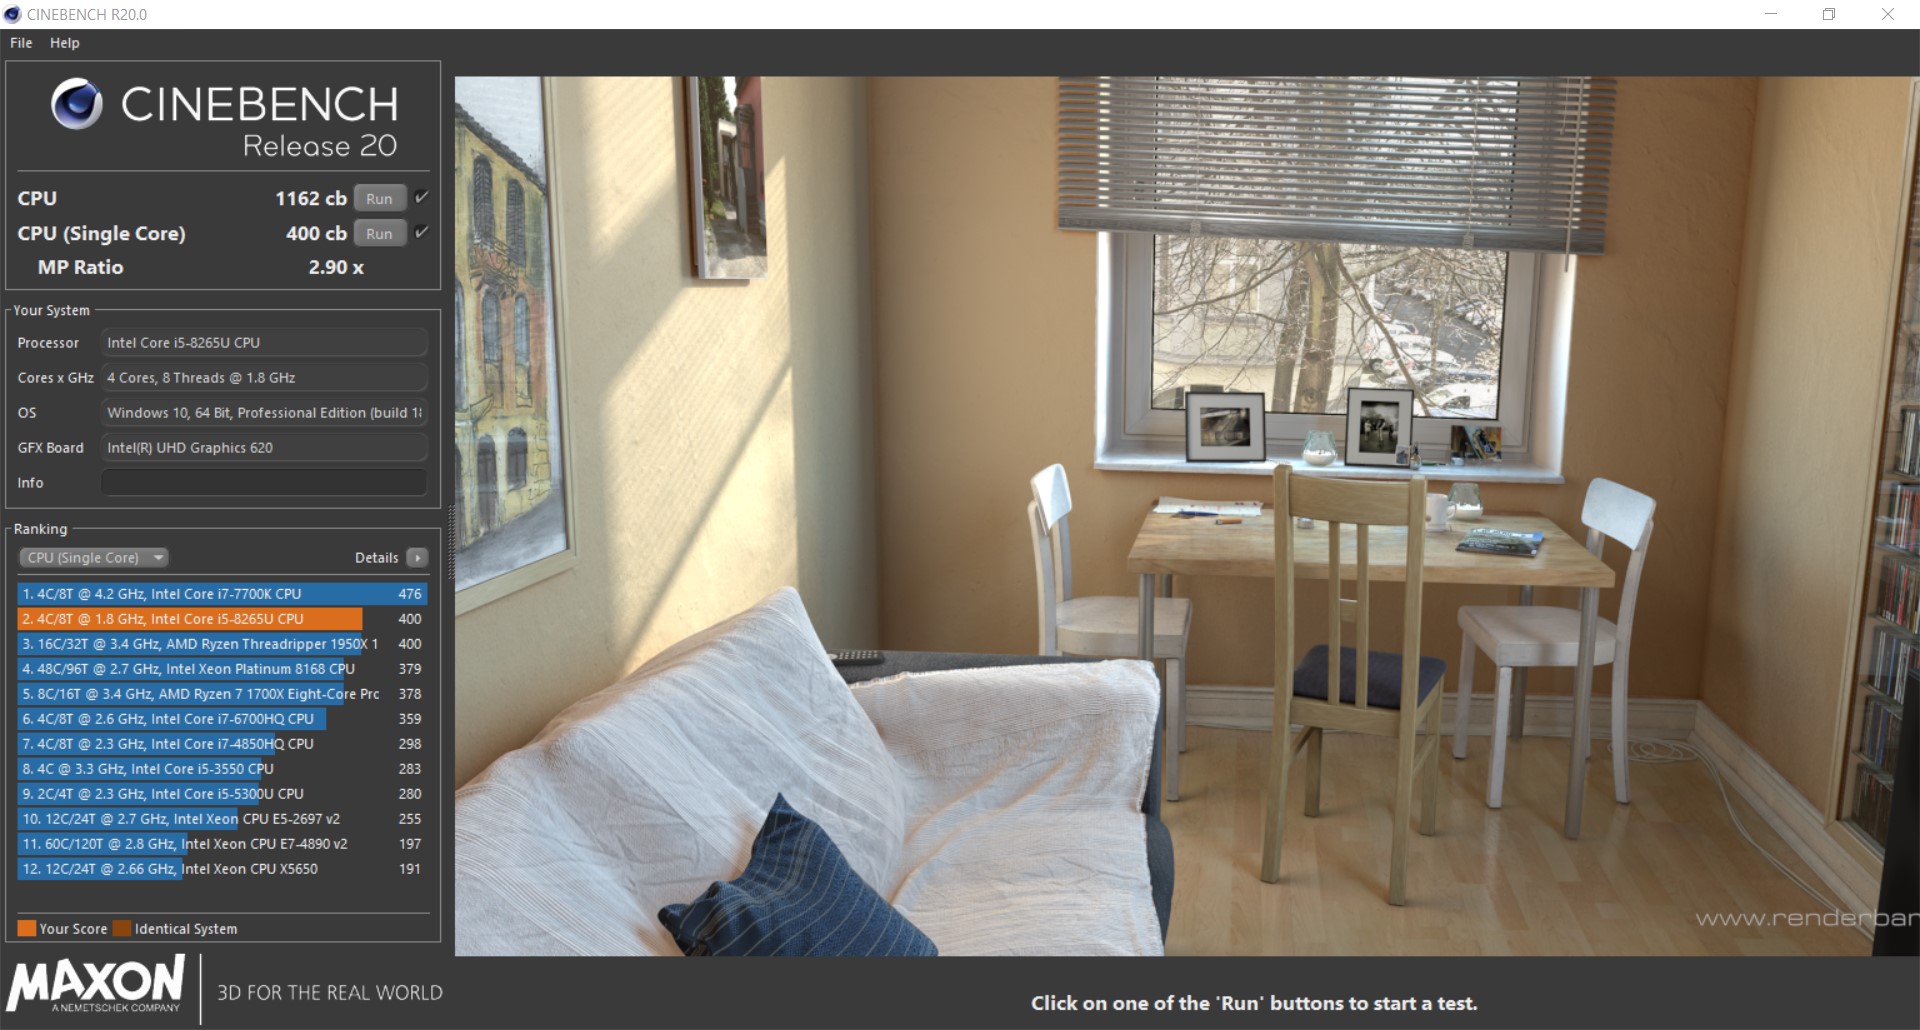
The Core i5-8265U has a 15 W TDP, which it can briefly increase to 25 W when required. As we mentioned in the preceding section, the L590 falls short of the L580 in synthetic benchmarks despite being equipped with a nominally more powerful CPU. While the L590 scores slightly above average in single-threaded benchmarks like Cinebench R15 Single 64Bit, it can only manage 13% less in the corresponding multi-core benchmark. Please see our CPU benchmarks page for more information about the Core i5-8265U and how it compares against other processors.
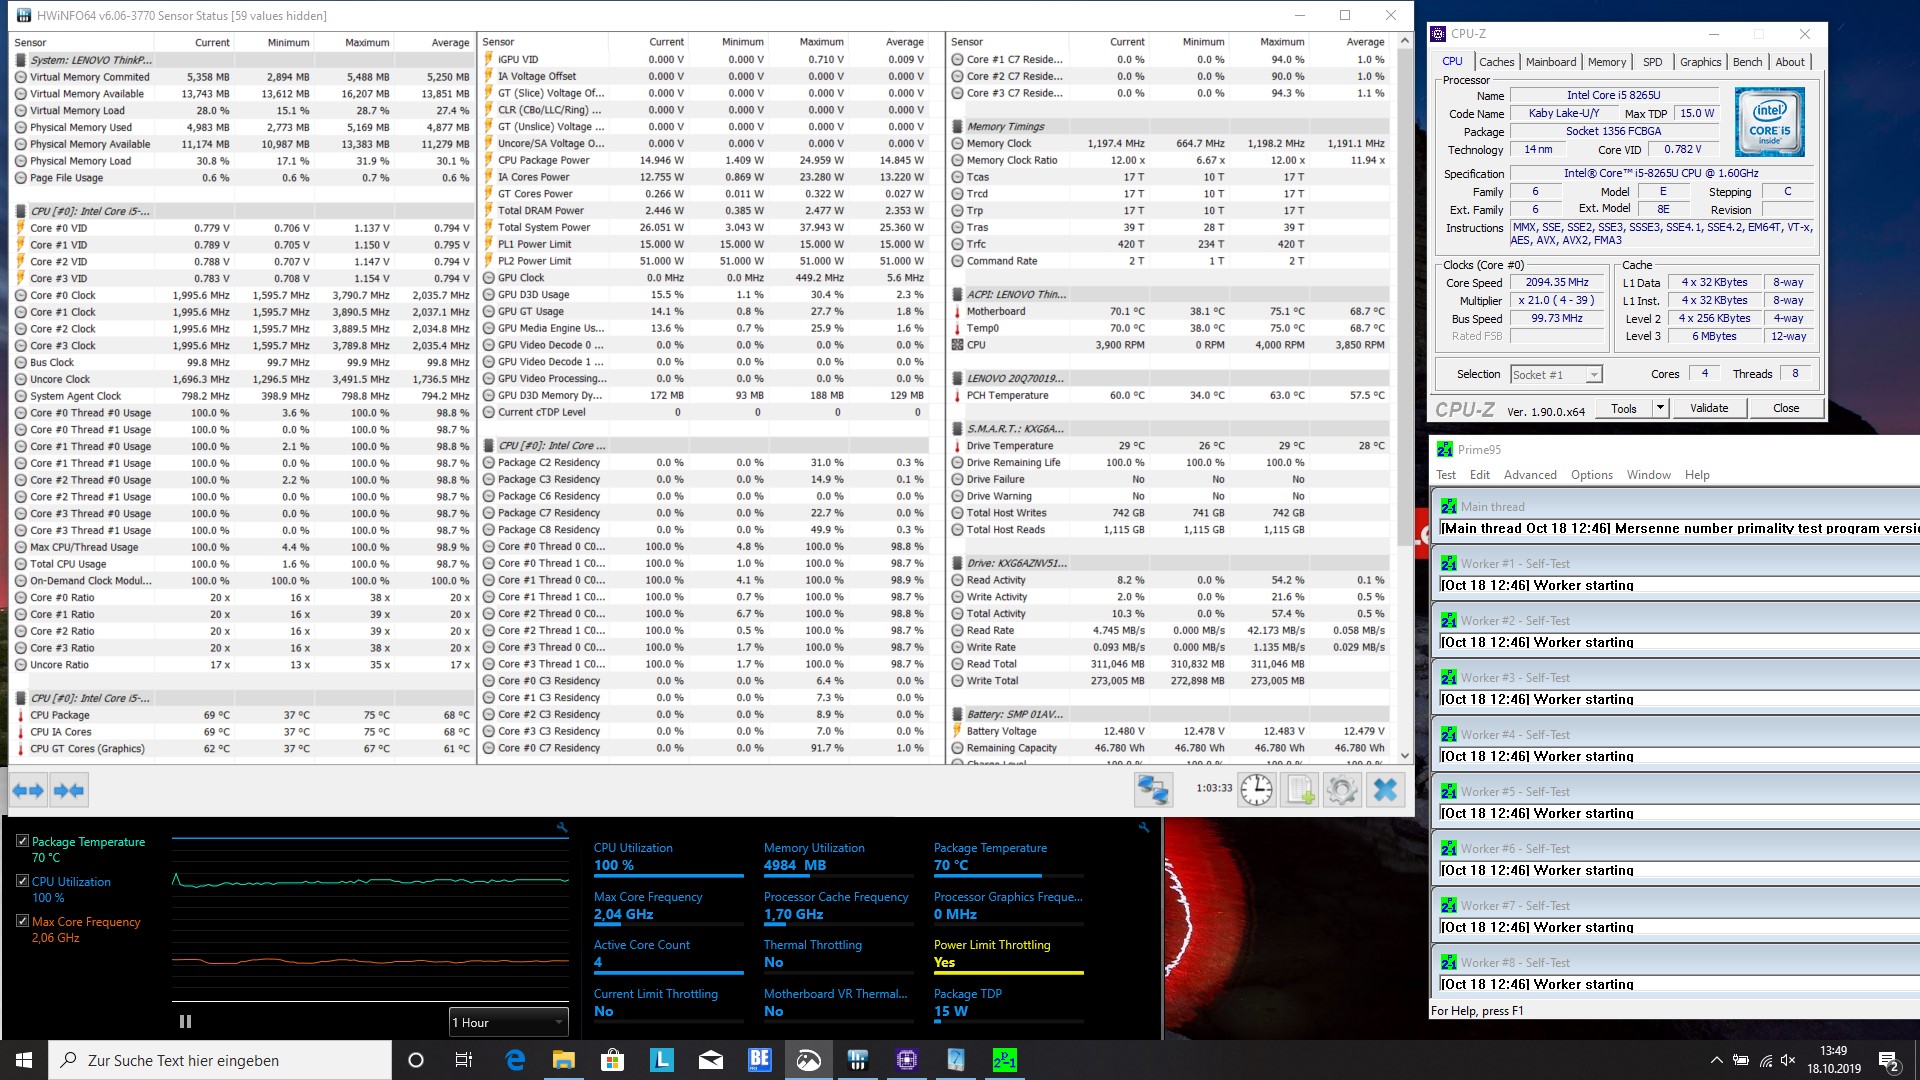
Overall, the L590 has comparatively poor CPU performance for a Core i5-8265U-equipped laptop. Not only does it fall short of our comparison devices, but it also throttles under sustained load. As our CB R15 Multi 64Bit loop graph below demonstrates, the L590 throttles almost as heavily as many of our comparison devices, despite its lowly multi-core performance.
| Cinebench R20 | |
| CPU (Single Core) | |
| Lenovo ThinkPad L590-20Q70019GE | |
| Average Intel Core i5-8265U (325 - 403, n=16) | |
| CPU (Multi Core) | |
| Average Intel Core i5-8265U (972 - 1564, n=16) | |
| Lenovo ThinkPad L590-20Q70019GE | |
| Blender - v2.79 BMW27 CPU | |
| Lenovo ThinkPad L590-20Q70019GE | |
| Average Intel Core i5-8265U (769 - 1098, n=15) | |
| Geekbench 4.4 | |
| 64 Bit Single-Core Score | |
| Average Intel Core i5-8265U (2106 - 4830, n=19) | |
| Lenovo ThinkPad L590-20Q70019GE | |
| Lenovo ThinkPad L590-20Q70019GE | |
| 64 Bit Multi-Core Score | |
| Average Intel Core i5-8265U (7144 - 16249, n=19) | |
| Lenovo ThinkPad L590-20Q70019GE | |
| Lenovo ThinkPad L590-20Q70019GE | |
| 7-Zip 18.03 | |
| 7z b 4 | |
| Average Intel Core i5-8265U (13731 - 18802, n=15) | |
| Lenovo ThinkPad L590-20Q70019GE | |
| 7z b 4 -mmt1 | |
| Average Intel Core i5-8265U (3780 - 4195, n=15) | |
| Lenovo ThinkPad L590-20Q70019GE | |
* ... smaller is better
System Performance
The device's limited CPU performance also affects its system performance, which PCMark demonstrates. In short, our comparison devices leave the L590 in their wake, with it cemented in last place. The L590 even falls behind the E590, which we also criticised for having comparatively poor system performance.
However, we did not notice any performance issues in daily use. We encountered no crashes or stutters too.
| PCMark 8 Home Score Accelerated v2 | 2747 points | |
| PCMark 8 Creative Score Accelerated v2 | 3504 points | |
| PCMark 8 Work Score Accelerated v2 | 3132 points | |
| PCMark 10 Score | 2247 points | |
Help | ||
Storage Devices
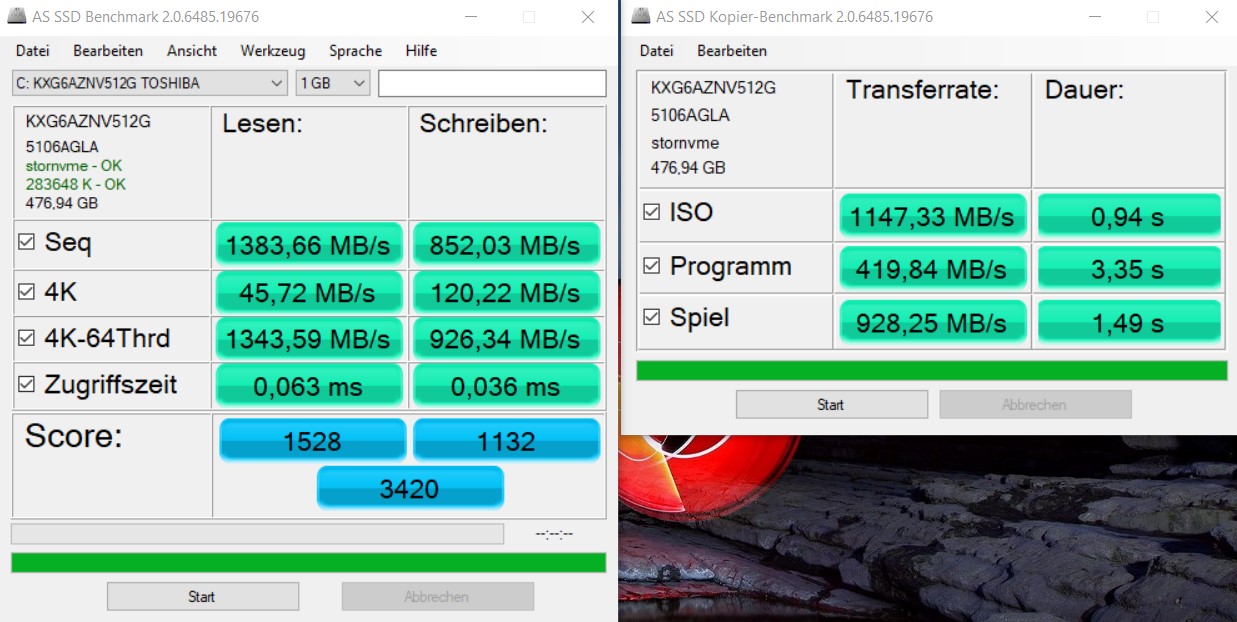
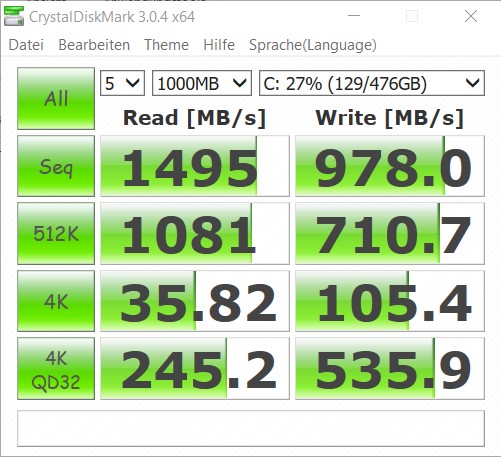
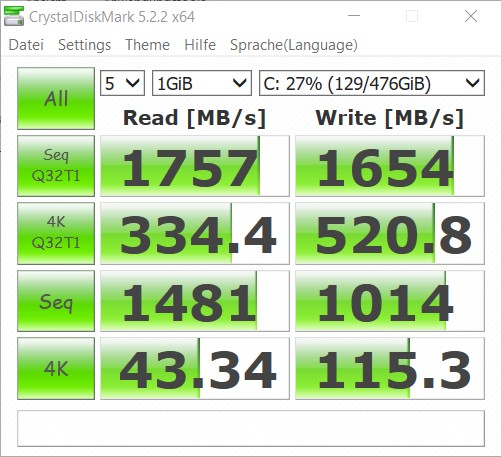
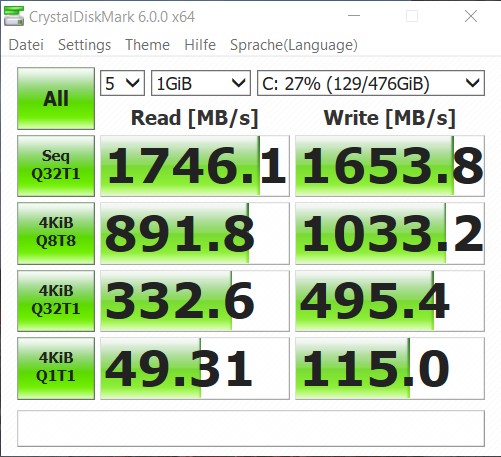
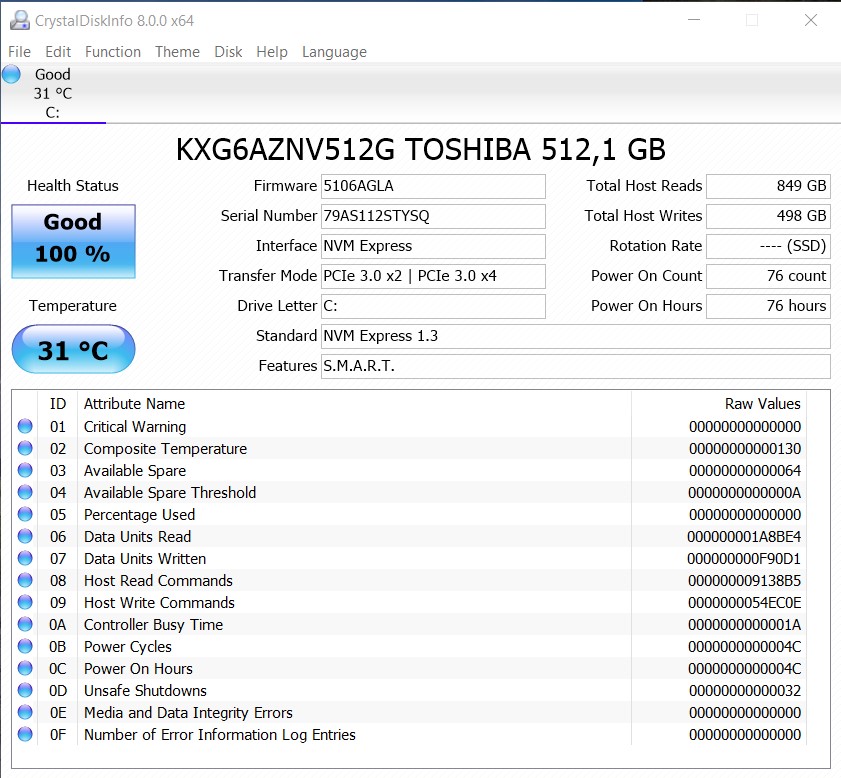
Lenovo has equipped our review unit with a 512 GB PCIe NVMe SSD that should offer enough storage for most people. The Toshiba XG6 that Lenovo included in the device is about as fast as competing Samsung drives, one of which it used in the L580 that we reviewed. Both SSDs have comparatively good 4K write speeds, with the Toshiba averaging around 45 MB/s in our tests.
Please see our HDD/SSD page for more benchmarks and comparisons.
| Lenovo ThinkPad L590-20Q70019GE Toshiba XG6 KXG6AZNV512G | Lenovo ThinkPad L580-20LW000VGE Samsung PM961 MZVLW256HEHP | Schenker Slim 15-RE-E19 Samsung SSD 970 EVO Plus 500GB | Lenovo ThinkPad E590-20NC0003GE Toshiba KBG30ZMT512G | Tuxedo Book BU1307 Samsung SSD 970 EVO 250GB | Acer TravelMate X3410-M-50DD Micron 1100 MTFDDAV256TBN | Average Toshiba XG6 KXG6AZNV512G | |
|---|---|---|---|---|---|---|---|
| CrystalDiskMark 5.2 / 6 | -0% | 45% | -45% | 16% | -58% | 31% | |
| Write 4K (MB/s) | 115.3 | 117 1% | 187.2 62% | 53.4 -54% | 158.2 37% | 85.4 -26% | 139 ? 21% |
| Read 4K (MB/s) | 43.34 | 41.47 -4% | 51.8 20% | 33.03 -24% | 38.78 -11% | 26.4 -39% | 45.8 ? 6% |
| Write Seq (MB/s) | 1014 | 791 -22% | 1438 42% | 624 -38% | 1487 47% | 402.5 -60% | 1628 ? 61% |
| Read Seq (MB/s) | 1481 | 1390 -6% | 1347 -9% | 835 -44% | 913 -38% | 461.2 -69% | 1647 ? 11% |
| Write 4K Q32T1 (MB/s) | 495.4 | 651 31% | 396.7 -20% | 87.4 -82% | 330.5 -33% | 175.8 -65% | 547 ? 10% |
| Read 4K Q32T1 (MB/s) | 332.6 | 408.9 23% | 534 61% | 135.9 -59% | 423.8 27% | 228.8 -31% | 436 ? 31% |
| Write Seq Q32T1 (MB/s) | 1654 | 1227 -26% | 3280 98% | 784 -53% | 1540 -7% | 442.9 -73% | 2522 ? 52% |
| Read Seq Q32T1 (MB/s) | 1746 | 1779 2% | 3556 104% | 1623 -7% | 3556 104% | 522 -70% | 2739 ? 57% |
| Write 4K Q8T8 (MB/s) | 1033 | 309 -70% | 1266 ? 23% | ||||
| Read 4K Q8T8 (MB/s) | 892 | 247.1 -72% | 1212 ? 36% | ||||
| AS SSD | -10% | 52% | -58% | -723% | -50% | 18% | |
| Seq Read (MB/s) | 1383 | 1315 -5% | 2661 92% | 1348 -3% | 2406 74% | 492.9 -64% | 2383 ? 72% |
| Seq Write (MB/s) | 852 | 741 -13% | 2426 185% | 789 -7% | 435.1 -49% | 462.2 -46% | 1459 ? 71% |
| 4K Read (MB/s) | 45.72 | 45.28 -1% | 59 29% | 38.82 -15% | 50.2 10% | 26.89 -41% | 46.8 ? 2% |
| 4K Write (MB/s) | 120.2 | 119.9 0% | 166 38% | 81.8 -32% | 1.45 -99% | 85.1 -29% | 125.1 ? 4% |
| 4K-64 Read (MB/s) | 1344 | 1186 -12% | 1314 -2% | 825 -39% | 818 -39% | 234.2 -83% | 1294 ? -4% |
| 4K-64 Write (MB/s) | 926 | 456.3 -51% | 1494 61% | 488 -47% | 145.6 -84% | 312.8 -66% | 1276 ? 38% |
| Access Time Read * (ms) | 0.063 | 0.043 32% | 0.046 27% | 0.081 -29% | 0.047 25% | 0.0825 ? -31% | |
| Access Time Write * (ms) | 0.036 | 0.029 19% | 0.023 36% | 0.188 -422% | 2.784 -7633% | 0.056 -56% | 0.0335 ? 7% |
| Score Read (Points) | 1528 | 1363 -11% | 1639 7% | 999 -35% | 1108 -27% | 310 -80% | 1580 ? 3% |
| Score Write (Points) | 1132 | 650 -43% | 1902 68% | 649 -43% | 191 -83% | 444 -61% | 1547 ? 37% |
| Score Total (Points) | 3420 | 2689 -21% | 4379 28% | 2139 -37% | 1780 -48% | 922 -73% | 3893 ? 14% |
| Copy ISO MB/s (MB/s) | 1147 | 876 -24% | 923 -20% | 1645 ? 43% | |||
| Copy Program MB/s (MB/s) | 419.8 | 209.7 -50% | 453.6 8% | 425 ? 1% | |||
| Copy Game MB/s (MB/s) | 928 | 599 -35% | 523 -44% | 933 ? 1% | |||
| Total Average (Program / Settings) | -5% /
-6% | 49% /
49% | -52% /
-54% | -354% /
-412% | -54% /
-53% | 25% /
24% |
* ... smaller is better

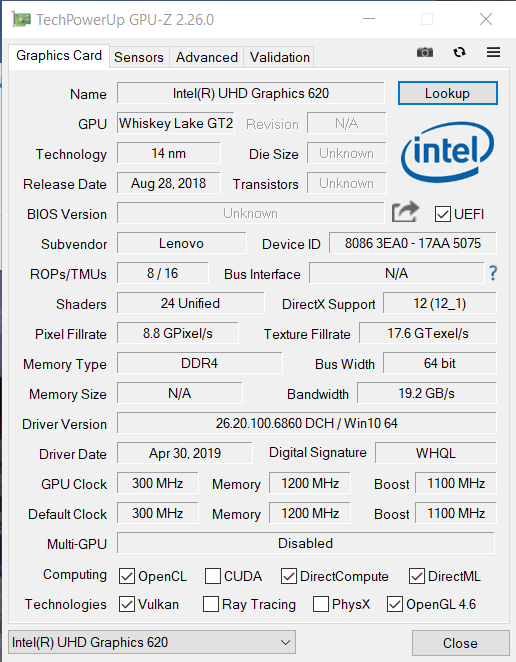
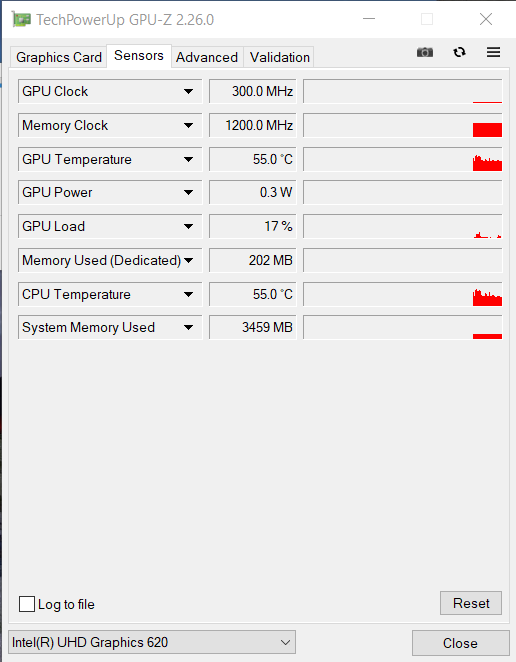
Graphics Card
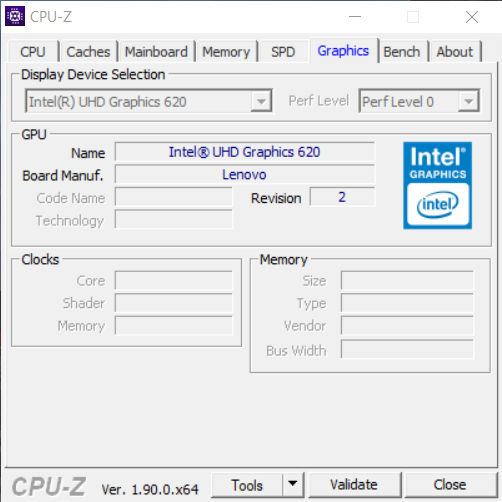
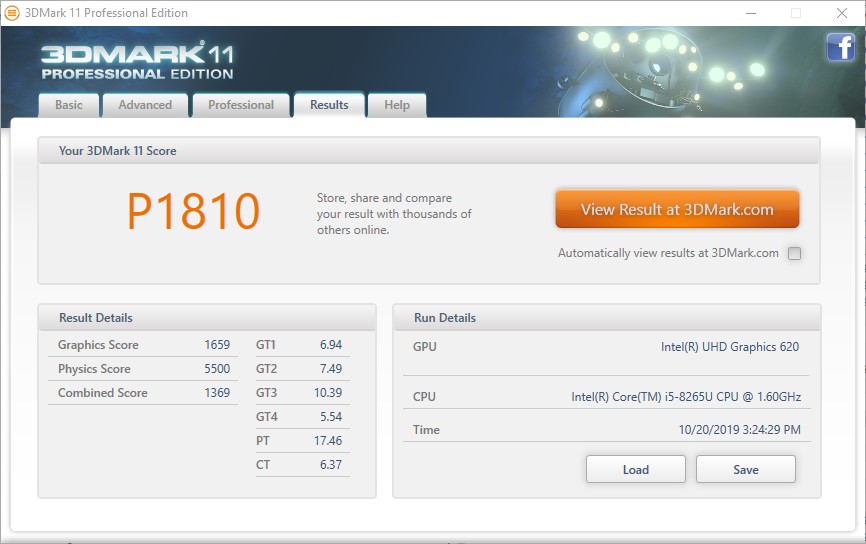
The L590 relies on the UHD Graphics 620 for graphics output, which Intel integrates within the Core i5-8265U. While the GPU is powerful enough for general office tasks and even high-resolution video streaming, it is overwhelmed by most modern games. Only older titles like BioShock Infinite and Dota 2 Reborn run smoothly, but only at low resolutions and graphics levels.
| 3DMark 11 Performance | 1846 points | |
| 3DMark Ice Storm Standard Score | 41848 points | |
| 3DMark Cloud Gate Standard Score | 6555 points | |
| 3DMark Fire Strike Score | 1043 points | |
| 3DMark Fire Strike Extreme Score | 501 points | |
| 3DMark Time Spy Score | 412 points | |
Help | ||
| low | med. | high | ultra | |
|---|---|---|---|---|
| BioShock Infinite (2013) | 56 | 31 | 24 | 8 |
| Dota 2 Reborn (2015) | 60.4 | 36.7 | 18 | 16.2 |
| Rise of the Tomb Raider (2016) | 16.6 | 12.3 | 6.5 | |
| X-Plane 11.11 (2018) | 17.6 | 12.8 | 11.1 |
Emissions
Fan Noise
The ThinkPad L590 generally operates silently during undemanding tasks, although its fan occasionally ramps up to 29 dB(A). The device remains comparatively quiet under load though, with it peaking at 33.8 dB(A) during our tests. Only the E590 stayed quieter than the L590 of our comparison devices, for reference.
As the table below demonstrates, the L590 runs more quietly than its predecessor. However, this is probably why the L590 performs worse under load too. It seems that Lenovo has changed the fan curve a bit between generations that results in CPU core temperatures increasing more quickly than they previously did.
Noise level
| Idle |
| 29 / 29 / 29 dB(A) |
| Load |
| 29 / 33.8 dB(A) |
 | ||
30 dB silent 40 dB(A) audible 50 dB(A) loud |
||
min: | ||
| Lenovo ThinkPad L590-20Q70019GE UHD Graphics 620, i5-8265U, Toshiba XG6 KXG6AZNV512G | Lenovo ThinkPad L580-20LW000VGE UHD Graphics 620, i5-8250U, Samsung PM961 MZVLW256HEHP | Schenker Slim 15-RE-E19 UHD Graphics 620, i5-8265U, Samsung SSD 970 EVO Plus 500GB | Lenovo ThinkPad E590-20NC0003GE UHD Graphics 620, i7-8565U, Toshiba KBG30ZMT512G | Tuxedo Book BU1307 UHD Graphics 620, i5-8550U, Samsung SSD 970 EVO 250GB | Acer TravelMate X3410-M-50DD GeForce MX130, i5-8550U, Micron 1100 MTFDDAV256TBN | |
|---|---|---|---|---|---|---|
| Noise | -7% | -19% | -0% | -7% | -9% | |
| off / environment * (dB) | 29 | 29.9 -3% | 30.4 -5% | 29.3 -1% | 30.5 -5% | 30.2 -4% |
| Idle Minimum * (dB) | 29 | 29.9 -3% | 30.4 -5% | 29.3 -1% | 30.5 -5% | 30.2 -4% |
| Idle Average * (dB) | 29 | 29.9 -3% | 30.4 -5% | 29.3 -1% | 30.8 -6% | 30.2 -4% |
| Idle Maximum * (dB) | 29 | 31.6 -9% | 31.6 -9% | 29.3 -1% | 30.8 -6% | 30.2 -4% |
| Load Average * (dB) | 29 | 33.1 -14% | 44.8 -54% | 30.6 -6% | 34.3 -18% | 36.8 -27% |
| Load Maximum * (dB) | 33.8 | 36 -7% | 44.8 -33% | 30.6 9% | 34.3 -1% | 36.8 -9% |
* ... smaller is better
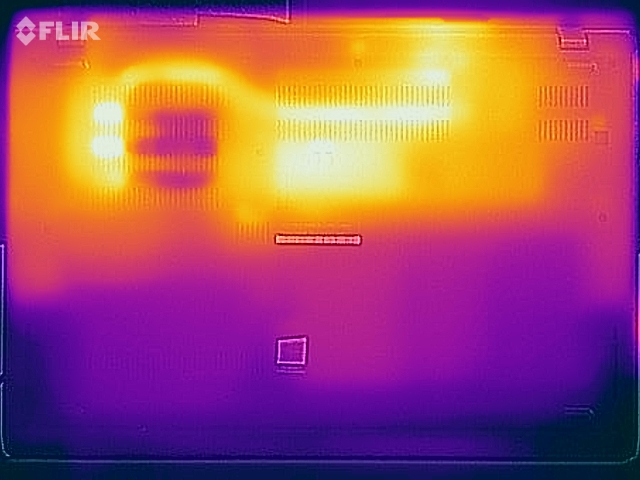
Temperature
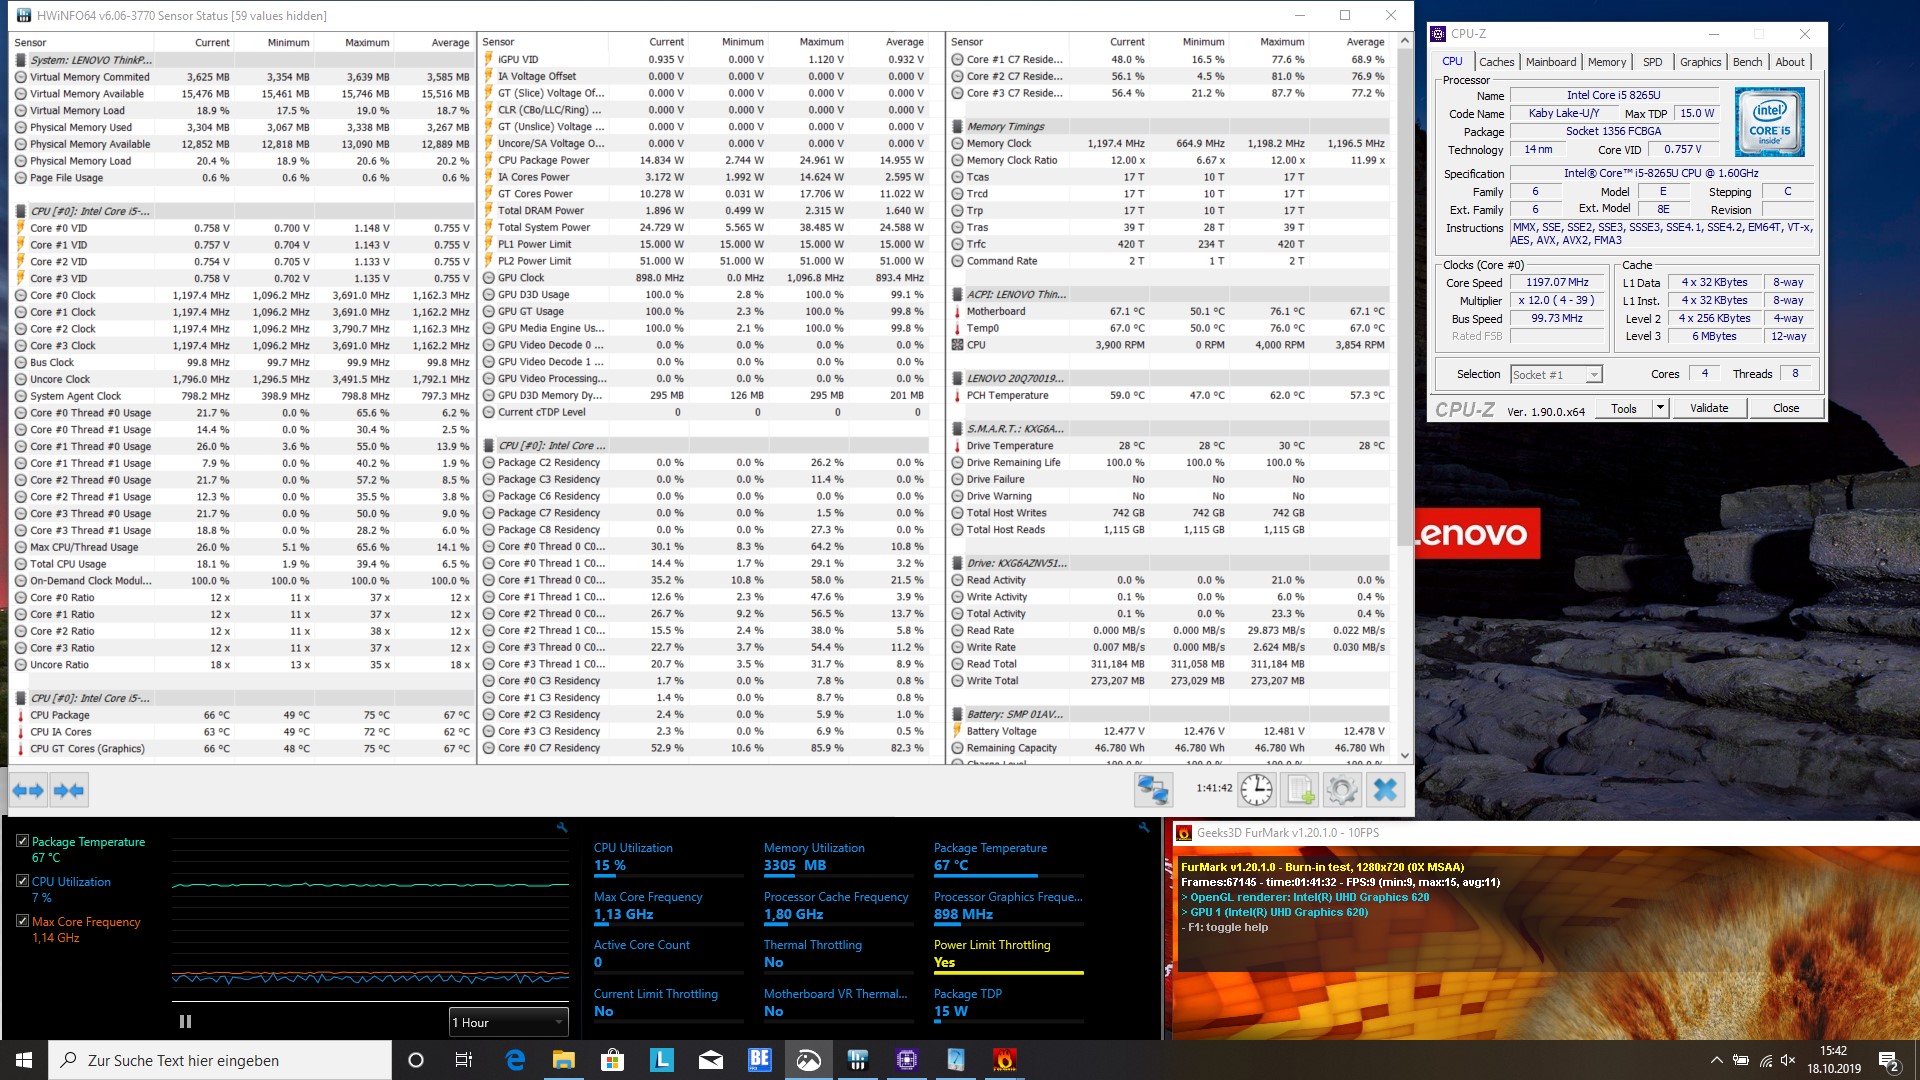
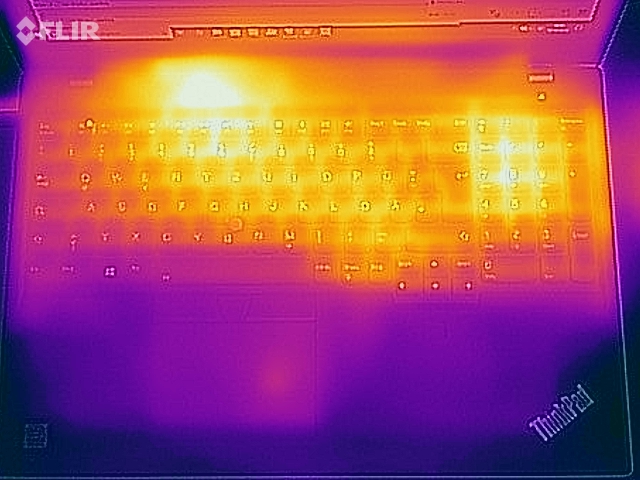
The reduced fan speed has also caused surface temperatures to rise, with the L590 getting noticeably hotter than its predecessor does. Four areas on the bottom case of the former exceeded 49 °C under sustained load, which will feel hot to the touch. Hence, using the L590 on your lap will feel uncomfortable if you are pushing the system hard. The palm rest always remains at around 25 °C though, so you should never feel the device getting hot if you are using it on a desk, for example.
CPU core temperatures quickly reached 75 °C during our stress tests, which caused it to throttle back to 15 W. The chip did not downclock below 2 GHz though, which is 400 MHz above its base clock speed. Our stress test did not have a lasting effect on 3D performance, either.

(±) The maximum temperature on the upper side is 42.7 °C / 109 F, compared to the average of 34.3 °C / 94 F, ranging from 21.2 to 62.5 °C for the class Office.
(-) The bottom heats up to a maximum of 51 °C / 124 F, compared to the average of 36.8 °C / 98 F
(+) In idle usage, the average temperature for the upper side is 24.8 °C / 77 F, compared to the device average of 29.5 °C / 85 F.
(+) The palmrests and touchpad are cooler than skin temperature with a maximum of 25.2 °C / 77.4 F and are therefore cool to the touch.
(+) The average temperature of the palmrest area of similar devices was 27.6 °C / 81.7 F (+2.4 °C / 4.3 F).
| Lenovo ThinkPad L590-20Q70019GE UHD Graphics 620, i5-8265U, Toshiba XG6 KXG6AZNV512G | Lenovo ThinkPad L580-20LW000VGE UHD Graphics 620, i5-8250U, Samsung PM961 MZVLW256HEHP | Schenker Slim 15-RE-E19 UHD Graphics 620, i5-8265U, Samsung SSD 970 EVO Plus 500GB | Lenovo ThinkPad E590-20NC0003GE UHD Graphics 620, i7-8565U, Toshiba KBG30ZMT512G | Tuxedo Book BU1307 UHD Graphics 620, i5-8550U, Samsung SSD 970 EVO 250GB | Acer TravelMate X3410-M-50DD GeForce MX130, i5-8550U, Micron 1100 MTFDDAV256TBN | |
|---|---|---|---|---|---|---|
| Heat | 7% | 6% | 5% | 10% | -1% | |
| Maximum Upper Side * (°C) | 42.7 | 43 -1% | 40.3 6% | 43.8 -3% | 35.9 16% | 48.4 -13% |
| Maximum Bottom * (°C) | 51 | 46.2 9% | 47.1 8% | 43.9 14% | 39.2 23% | 45 12% |
| Idle Upper Side * (°C) | 25.9 | 24.1 7% | 25 3% | 25.5 2% | 25.6 1% | 27.2 -5% |
| Idle Bottom * (°C) | 28.3 | 25.3 11% | 26.4 7% | 27 5% | 28.7 -1% | 27.2 4% |
* ... smaller is better
Speakers
You should not expect too much from laptop speakers, but the stereo drivers in the ThinkPad L590 deliver acceptable audio quality. Music and videos sound tinny and thin to our ears, so we would recommend using external audio equipment like headphones and speakers where possible. You can use the 3.5 mm jack or Bluetooth for connecting headphones or speakers, but the built-in ones are good enough for conference calls, for example. The onboard microphone is also decent and forgoes the need to buy an external microphone.
Lenovo ThinkPad L590-20Q70019GE audio analysis
(-) | not very loud speakers (68 dB)
Bass 100 - 315 Hz
(±) | reduced bass - on average 14.1% lower than median
(±) | linearity of bass is average (13% delta to prev. frequency)
Mids 400 - 2000 Hz
(±) | higher mids - on average 7.4% higher than median
(±) | linearity of mids is average (10% delta to prev. frequency)
Highs 2 - 16 kHz
(+) | balanced highs - only 1.9% away from median
(±) | linearity of highs is average (10.9% delta to prev. frequency)
Overall 100 - 16.000 Hz
(±) | linearity of overall sound is average (27.5% difference to median)
Compared to same class
» 86% of all tested devices in this class were better, 4% similar, 10% worse
» The best had a delta of 7%, average was 21%, worst was 53%
Compared to all devices tested
» 84% of all tested devices were better, 3% similar, 13% worse
» The best had a delta of 4%, average was 23%, worst was 134%
Acer TravelMate X3410-M-50DD audio analysis
(-) | not very loud speakers (65 dB)
Bass 100 - 315 Hz
(±) | reduced bass - on average 10% lower than median
(±) | linearity of bass is average (8% delta to prev. frequency)
Mids 400 - 2000 Hz
(±) | higher mids - on average 5.3% higher than median
(±) | linearity of mids is average (9.3% delta to prev. frequency)
Highs 2 - 16 kHz
(+) | balanced highs - only 1.2% away from median
(+) | highs are linear (6.5% delta to prev. frequency)
Overall 100 - 16.000 Hz
(±) | linearity of overall sound is average (19.5% difference to median)
Compared to same class
» 40% of all tested devices in this class were better, 7% similar, 52% worse
» The best had a delta of 7%, average was 21%, worst was 53%
Compared to all devices tested
» 49% of all tested devices were better, 7% similar, 44% worse
» The best had a delta of 4%, average was 23%, worst was 134%
Power Management
Power Consumption
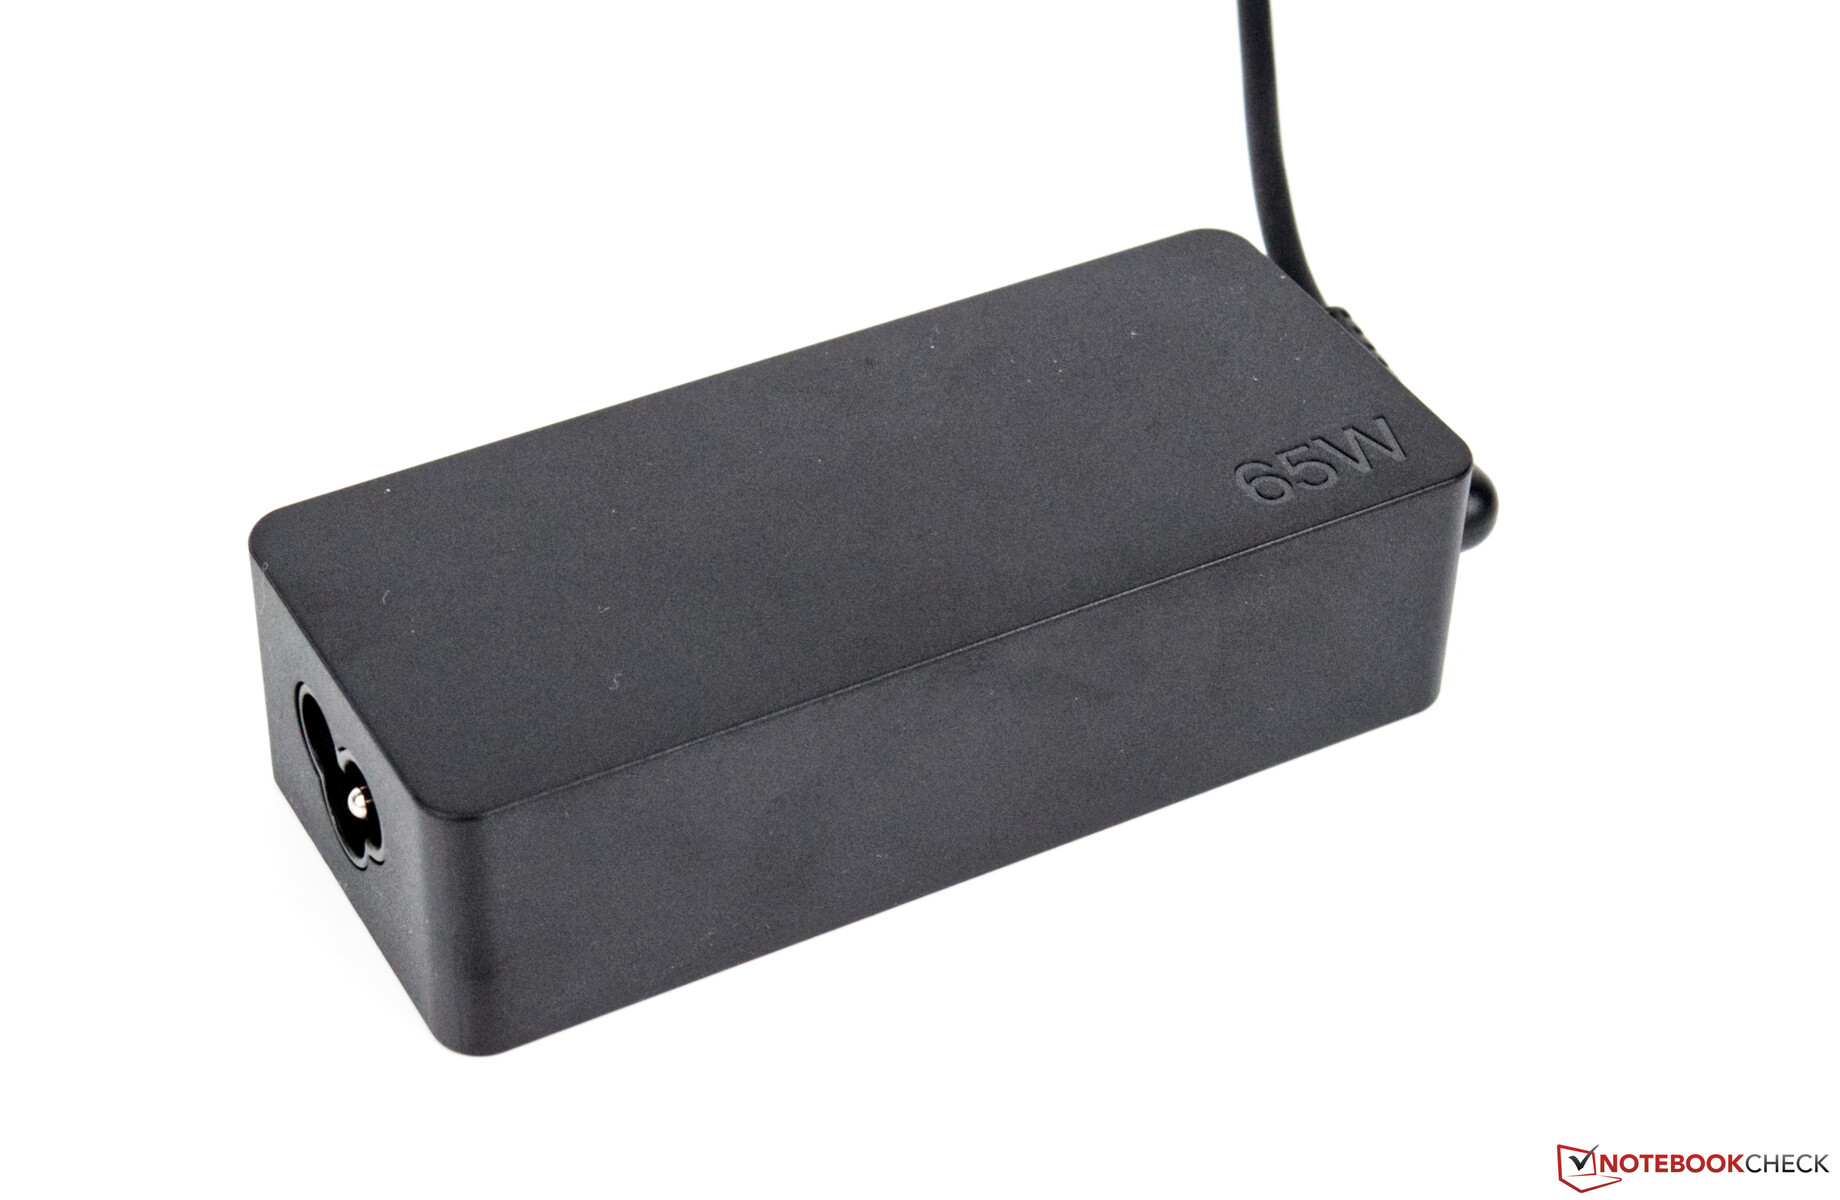
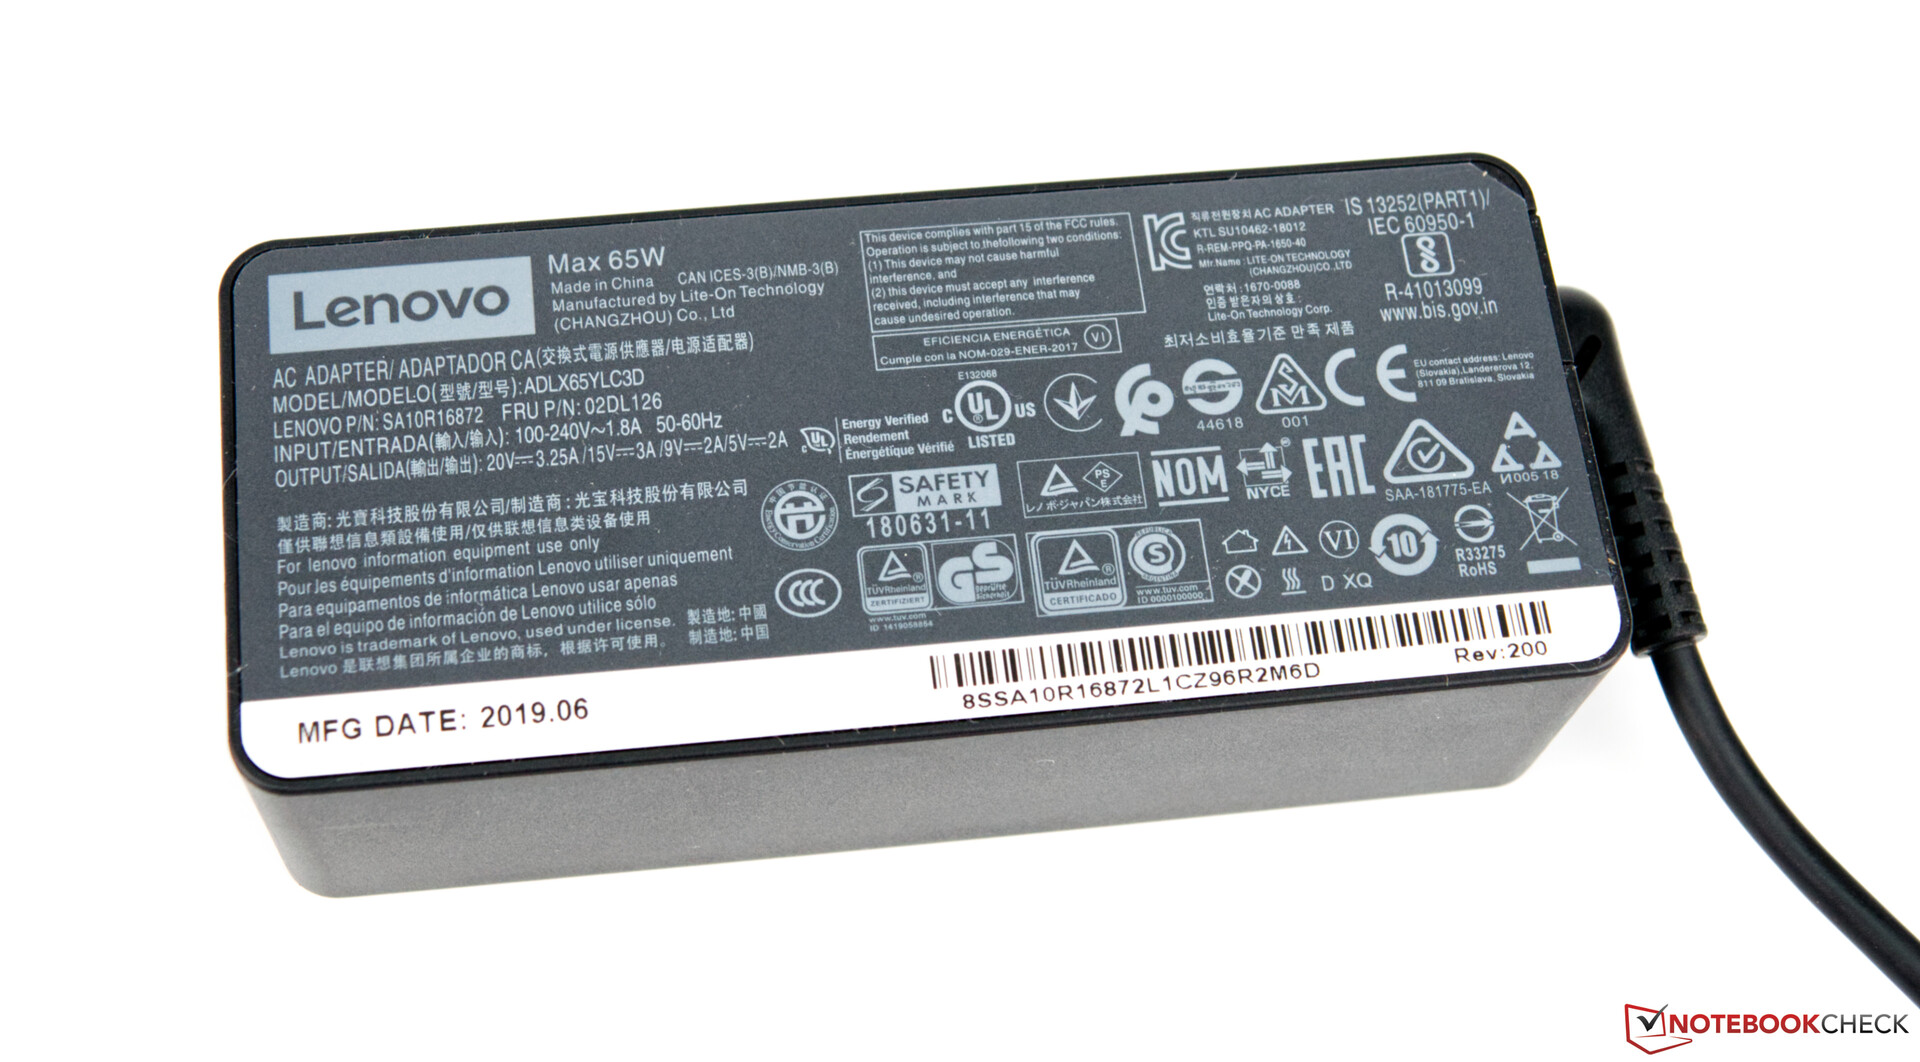
The L590 performed just as well as the L580 did in our power consumption tests. Our review unit peaked at 45.4 W under sustained load but can only maintain this for a few seconds before settling at around 30 W. Hence, the 65 W charger that Lenovo includes in the box is powerful enough to keep the L590 charging even under sustained load.
| Off / Standby | |
| Idle | |
| Load |
|
Key:
min: | |
| Lenovo ThinkPad L590-20Q70019GE i5-8265U, UHD Graphics 620, Toshiba XG6 KXG6AZNV512G, IPS, 1920x1080, 15.6" | Lenovo ThinkPad L580-20LW000VGE i5-8250U, UHD Graphics 620, Samsung PM961 MZVLW256HEHP, IPS, 1920x1080, 15.6" | Schenker Slim 15-RE-E19 i5-8265U, UHD Graphics 620, Samsung SSD 970 EVO Plus 500GB, IPS, 2x1, 15.6" | Lenovo ThinkPad E590-20NC0003GE i7-8565U, UHD Graphics 620, Toshiba KBG30ZMT512G, IPS LED, 1920x1080, 15.6" | Tuxedo Book BU1307 i5-8550U, UHD Graphics 620, Samsung SSD 970 EVO 250GB, IPS, 1920x1080, 13.3" | Acer TravelMate X3410-M-50DD i5-8550U, GeForce MX130, Micron 1100 MTFDDAV256TBN, IPS LED, 1920x1080, 14" | Average Intel UHD Graphics 620 | Average of class Office | |
|---|---|---|---|---|---|---|---|---|
| Power Consumption | -2% | 3% | -1% | -15% | -25% | -0% | -16% | |
| Idle Minimum * (Watt) | 3.96 | 4.4 -11% | 3.2 19% | 3.72 6% | 5.5 -39% | 4.6 -16% | 3.81 ? 4% | 4.25 ? -7% |
| Idle Average * (Watt) | 6.9 | 7.2 -4% | 6.5 6% | 7.8 -13% | 8.9 -29% | 6.5 6% | 6.94 ? -1% | 7.3 ? -6% |
| Idle Maximum * (Watt) | 9.8 | 8.3 15% | 11.3 -15% | 10.32 -5% | 11.5 -17% | 8.5 13% | 8.75 ? 11% | 8.57 ? 13% |
| Load Average * (Watt) | 31.4 | 36.4 -16% | 32 -2% | 30.24 4% | 34.6 -10% | 56 -78% | 35 ? -11% | 43.8 ? -39% |
| Load Maximum * (Watt) | 45.4 | 42.5 6% | 42.2 7% | 44 3% | 36.6 19% | 67 -48% | 47.5 ? -5% | 64.3 ? -42% |
* ... smaller is better
Battery Life

The L590 is slightly thirstier than the L580, a fact that its runtimes reflect. Our review unit has a 45 Wh battery like its predecessor, a capacity that will not deliver stellar battery life in any laptop form factor, let alone a 15.6-inch device. Nonetheless, the L590 achieved a respectable 5:57 hours in our practical Wi-Fi battery life test, putting it only a few minutes ahead of the class average.


| Lenovo ThinkPad L590-20Q70019GE i5-8265U, UHD Graphics 620, 45 Wh | Lenovo ThinkPad L580-20LW000VGE i5-8250U, UHD Graphics 620, 45 Wh | Schenker Slim 15-RE-E19 i5-8265U, UHD Graphics 620, 36 Wh | Lenovo ThinkPad E590-20NC0003GE i7-8565U, UHD Graphics 620, 45 Wh | Tuxedo Book BU1307 i5-8550U, UHD Graphics 620, 66 Wh | Acer TravelMate X3410-M-50DD i5-8550U, GeForce MX130, 57 Wh | Average of class Office | |
|---|---|---|---|---|---|---|---|
| Battery runtime | 6% | -37% | -12% | 28% | 15% | 37% | |
| Reader / Idle (h) | 17.4 | 18.3 5% | 17.4 0% | 22.2 ? 28% | |||
| H.264 (h) | 9 | 8.4 -7% | 11.6 29% | 15.4 ? 71% | |||
| WiFi v1.3 (h) | 7.2 | 7.6 6% | 4.5 -37% | 6.4 -11% | 9.2 28% | 10.9 51% | 13.2 ? 83% |
| Load (h) | 2.8 | 1.8 -36% | 2.2 -21% | 1.808 ? -35% |
Pros
Cons
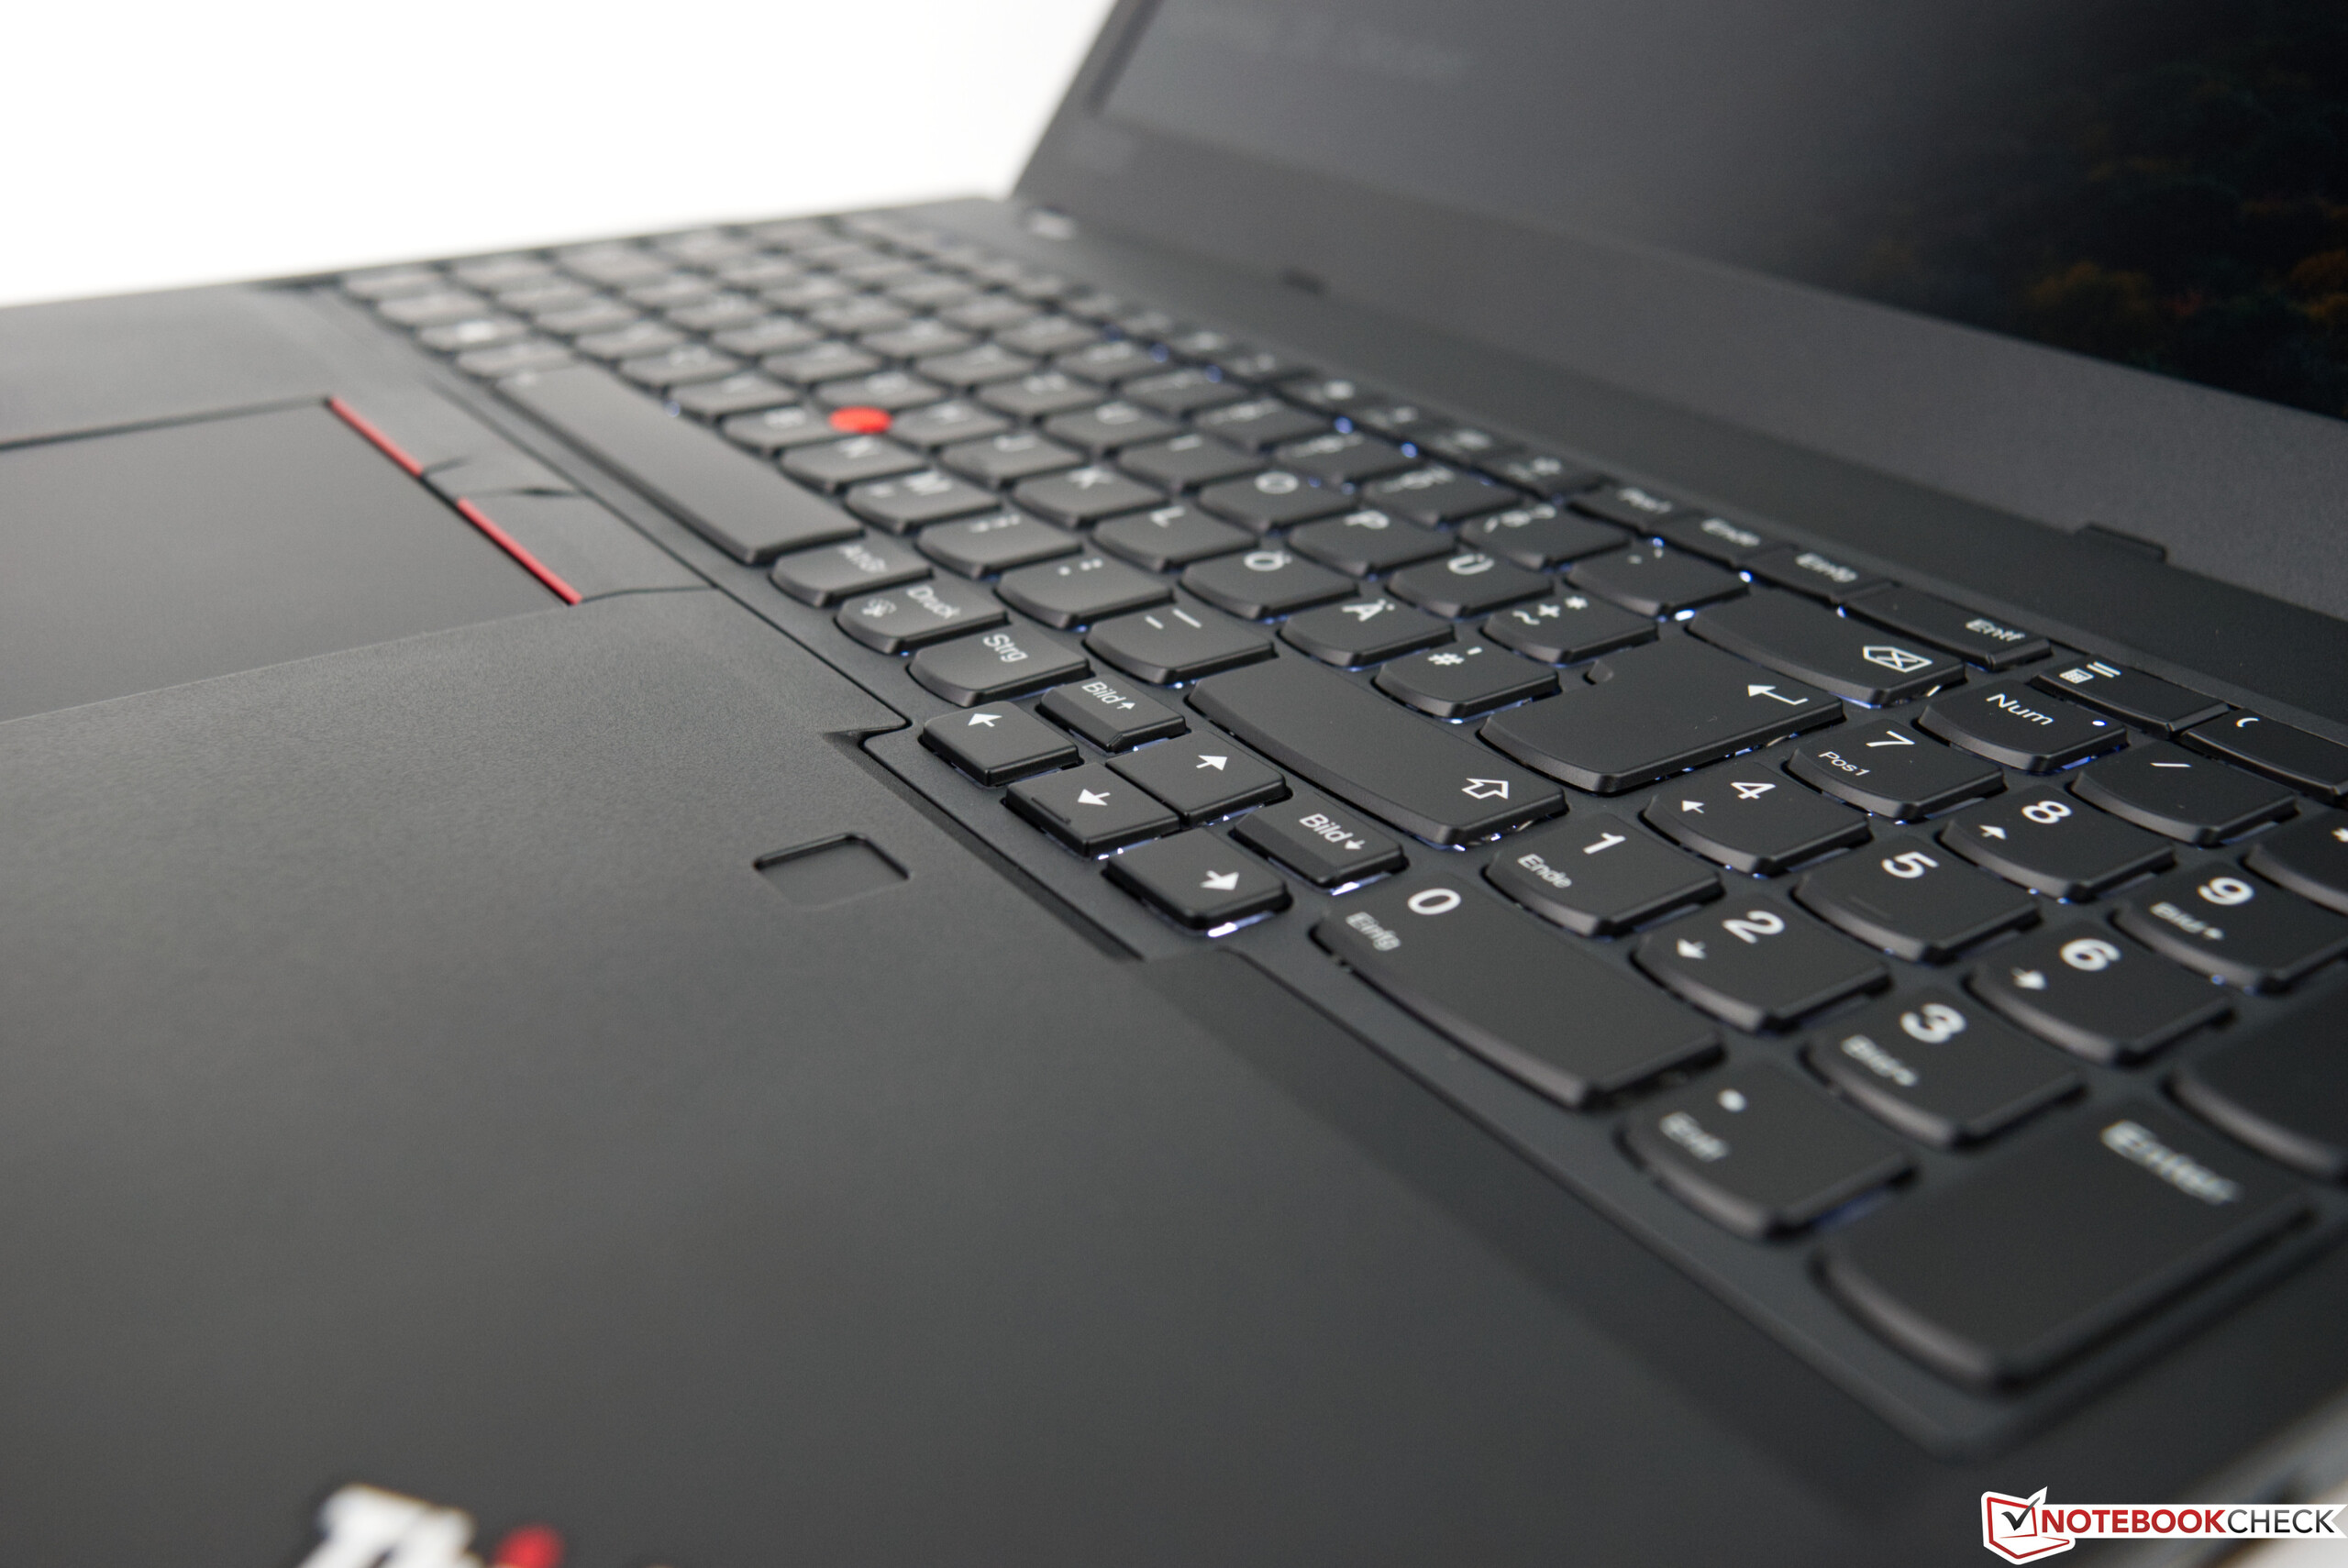
Verdict - Good connectivity & input devices for under 1,000 Euros

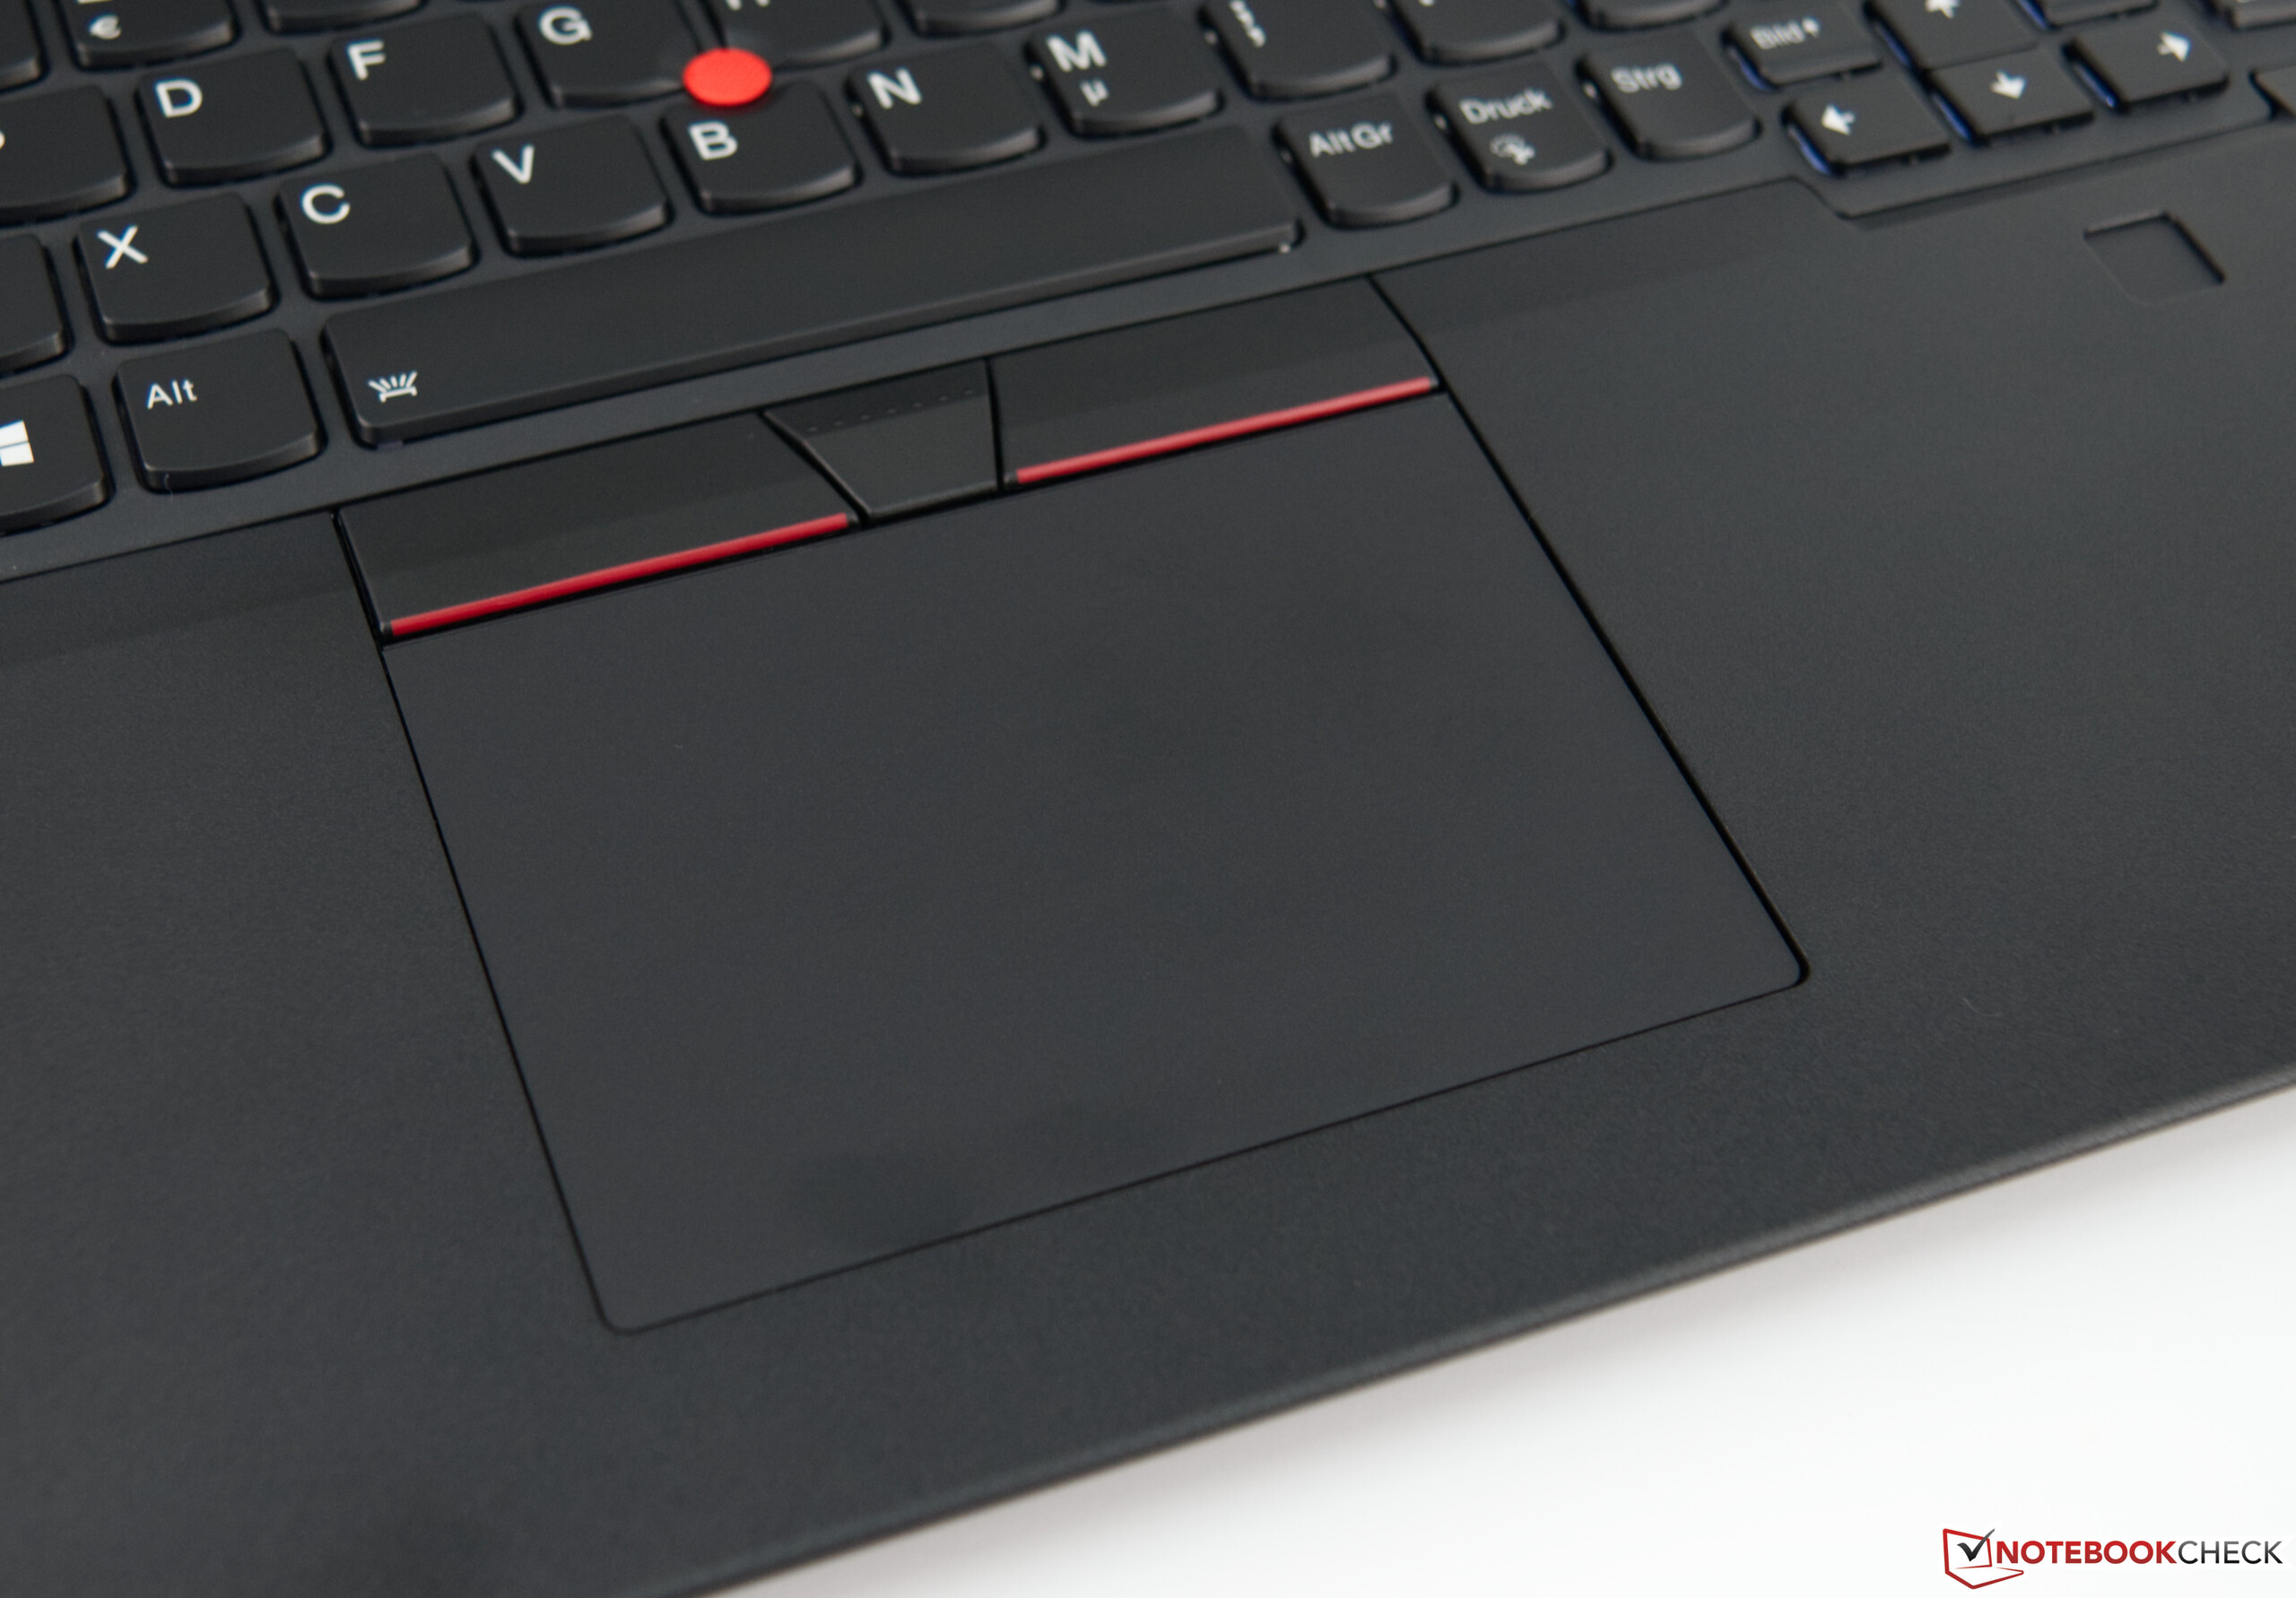
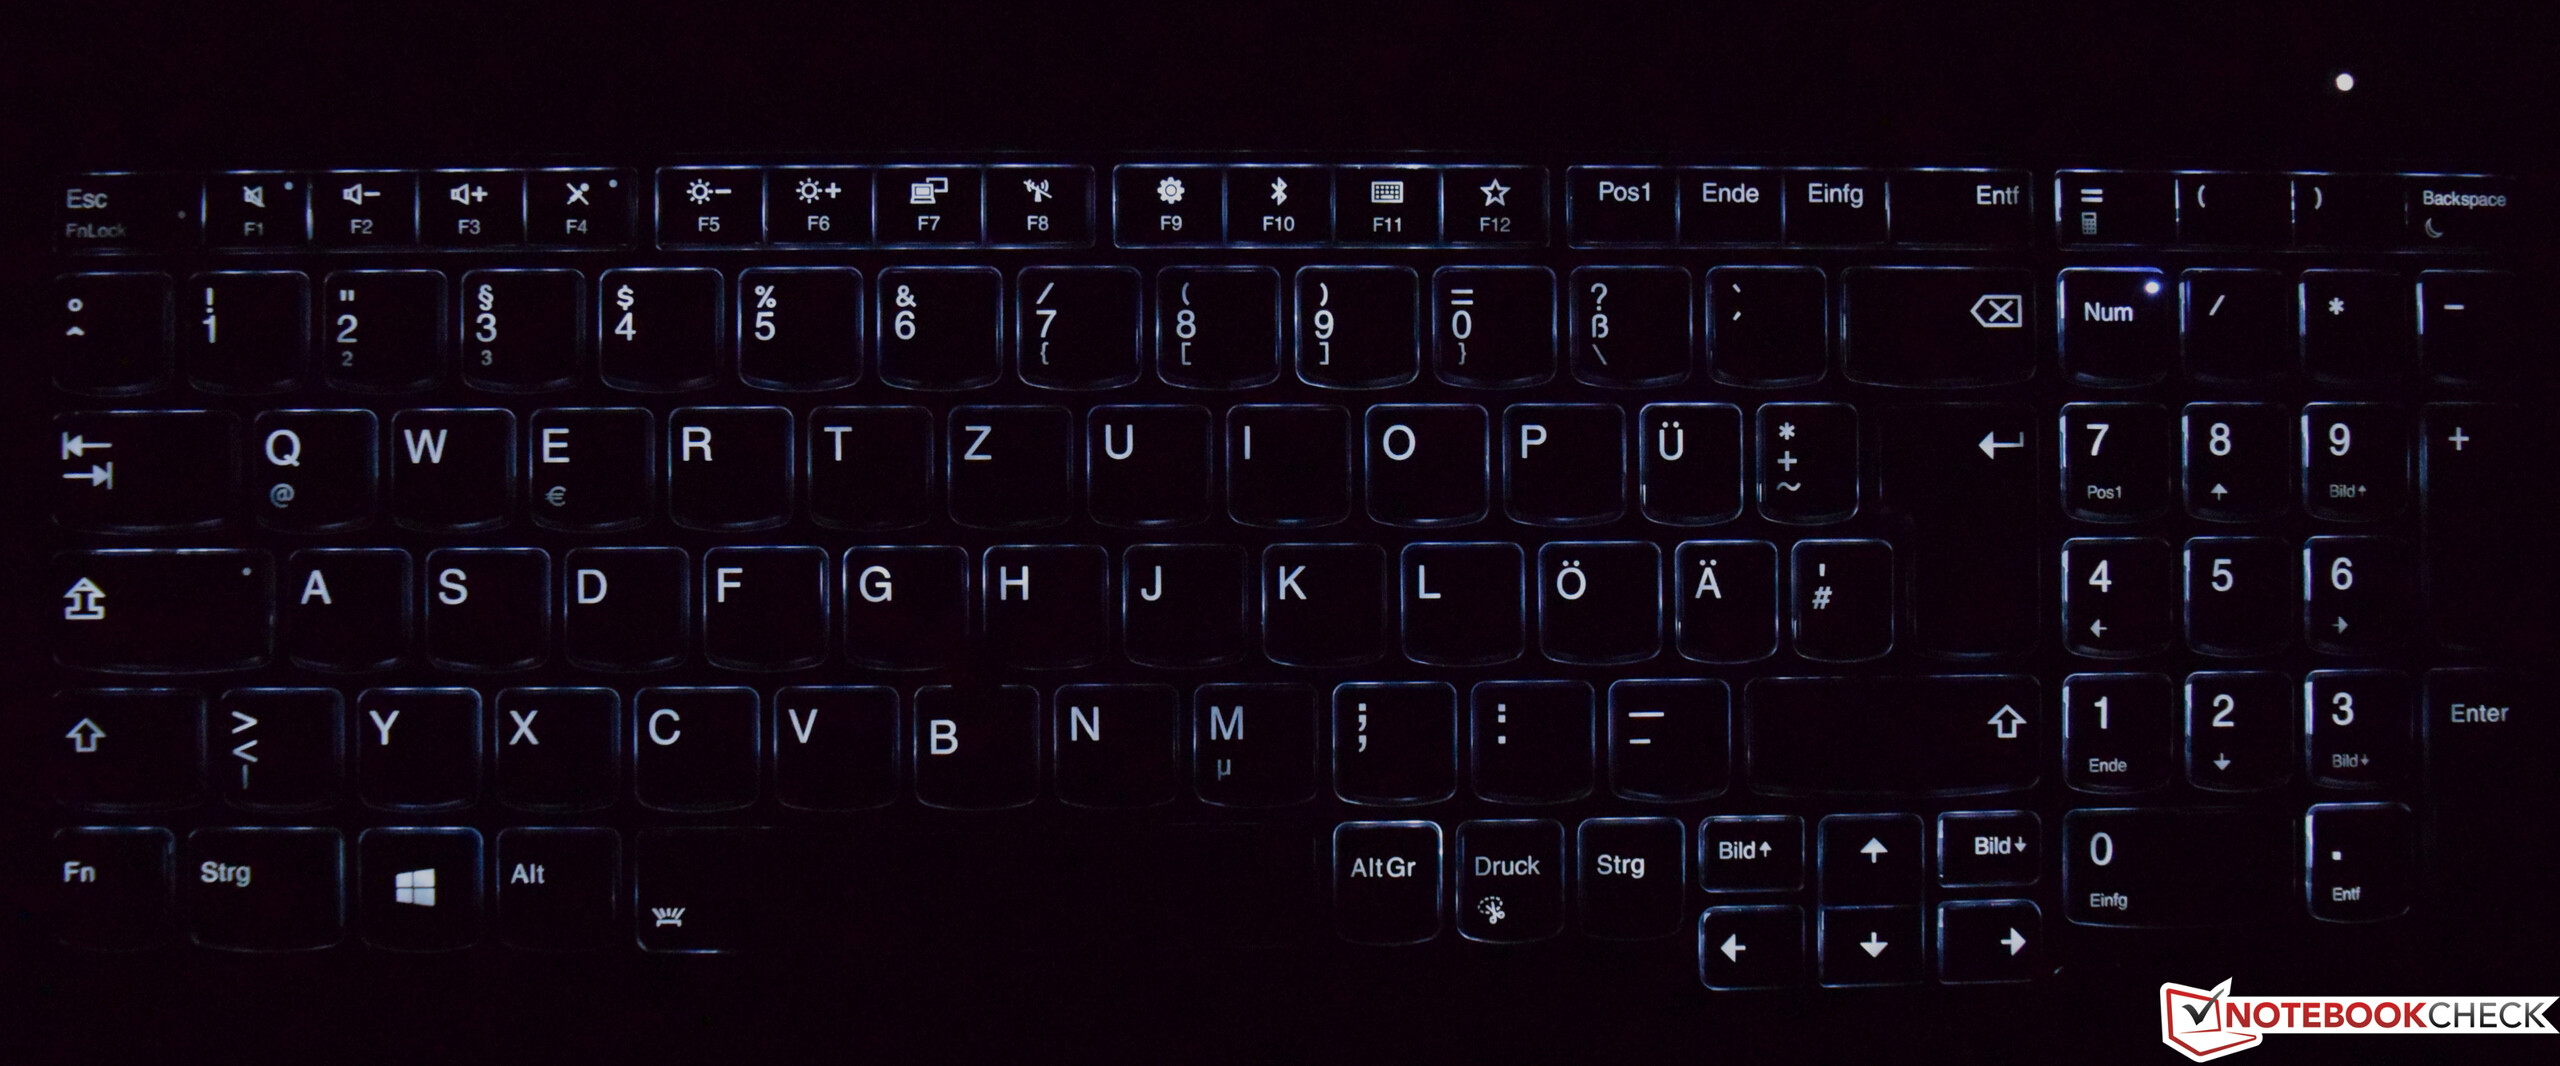
The ThinkPad L590 is a simple office laptop that impressed us with its first-rate input devices above all else. The device has few other unique selling points though, as many OEMs have now caught up with Lenovo in other areas. The L590 has its downsides too, including its dim display that also has unacceptably small colour space coverages. The competition is not much better on this point, either.
The L590, like its predecessor, cannot take advantage of the potential performance of its quad-core processor. The cause of this weak performance seems to be a weak cooling system, so it would be prudent of Lenovo to invest in a more efficient one for subsequent L-series devices. We have no complaints about the selection of ports that the L590 offers, though. All the ones that most people would need are here, and the speakers did not disappoint during our tests, either.
If you are looking for a reasonably priced office laptop, then you will not go far wrong with the Lenovo ThinkPad L590. The device is worth a look for its connectivity and input devices alone at less than 1,000 Euros (~$1,108), but you must put up with some shortcomings too.
Lenovo ThinkPad L590-20Q70019GE
- 10/25/2019 v7 (old)
Sebastian Bade
Price comparison

