Notebookcheck Logo

SK Hynix BC501 HFM512GDJTNG

The SK hynix BC501 HFM512GDJTNG is a mid range PCIe M.2 2280 SSD. It is specified at 1600 MB/s read and 860 MB/s write and 3 W reading, 3.5 W writing. Idle it consumes 40 mW and in L1.2 state 5mW.

TypeSSD
SizeM.2 2280
Capacity512 GB
InterfaceNVMe
Announced01.10.2018

Benchmarks

Performance Rating - DiskSpd
17.3 pt (26%)
64 GB eMMC Flash
2.27 -87%
...
Toshiba XG5-P KXG50PNV2T04
16.8 -3%
16.8 -3%
16.8 -3%
Toshiba KBG40ZNS256G NVMe
17 -2%
17.1 -1%
SK hynix BC501 HFM512GDHTNG-8310A
17.1 -1%
17.1 -1%
17.2 -1%
17.3 0%
SK Hynix BC501 HFM512GDJTNG
17.3
WDC PC SN530 SDBQNPZ-512G
17.4 1%
17.4 1%
WDC PC SN520 SDAPNUW-512G
17.5 1%
17.5 1%
WDC PC SN520 SDAPMUW-512
17.6 2%
17.6 2%
Toshiba KBG30ZMT512G
17.7 2%
Samsung SSD 950 Pro 512GB m.2 NVMe
17.8 3%
Kingston OM8PCP3512F-AB
17.8 3%
...
66.5 284%
0%
100%
AS SSD - Copy Game
min: 282     avg: 486.7     median: 482.5 (8%)     max: 700 MB/s
AS SSD - Copy Program
min: 236     avg: 265.1     median: 248.6 (9%)     max: 327.1 MB/s
AS SSD - Copy ISO
min: 521     avg: 802     median: 866.5 (8%)     max: 955 MB/s
AS SSD - Score Total
min: 1653     avg: 2107     median: 2114 (20%)     max: 2384 Points
AS SSD - Score Write
min: 657     avg: 830     median: 841 (15%)     max: 932 Points
AS SSD - Score Read
min: 674     avg: 858     median: 928 (3%)     max: 977 Points
AS SSD - Access Time Write *
min: 0.033     avg: 0     median: 0 (0%)     max: 0.048 ms
AS SSD - Access Time Read *
min: 0.04     avg: 0.1     median: 0.1 (0%)     max: 0.091 ms
AS SSD - 4K-64 Write
min: 475.7     avg: 660     median: 700 (14%)     max: 737 MB/s
AS SSD - 4K-64 Read
min: 488     avg: 686     median: 764 (23%)     max: 788 MB/s
AS SSD - 4K Write
min: 74.7     avg: 100.8     median: 100.9 (20%)     max: 124.8 MB/s
AS SSD - 4K Read
min: 32.24     avg: 40.4     median: 39.2 (12%)     max: 50.8 MB/s
AS SSD - Sequential Write
min: 510     avg: 697     median: 708 (6%)     max: 1019 MB/s
AS SSD - Sequential Read
min: 494.3     avg: 1323     median: 1412 (11%)     max: 1707 MB/s
CrystalDiskMark 3.0 - 4K QD32 Write
min: 266     avg: 330     median: 296.6 (29%)     max: 490.1 MB/s
CrystalDiskMark 3.0 - 4K QD32 Read
min: 230.7     avg: 352.7     median: 342.2 (27%)     max: 571 MB/s
CrystalDiskMark 3.0 - 4K Write
min: 86.1     avg: 116.2     median: 110 (12%)     max: 149.1 MB/s
CrystalDiskMark 3.0 - 4K Read
min: 35.75     avg: 43.6     median: 43.9 (1%)     max: 48.79 MB/s
CrystalDiskMark 3.0 - 512K Write
min: 410.9     avg: 617     median: 627.5 (14%)     max: 768 MB/s
CrystalDiskMark 3.0 - 512K Read
min: 603     avg: 824     median: 808 (23%)     max: 1140 MB/s
CrystalDiskMark 3.0 - Sequential Write
min: 650     avg: 745     median: 749 (13%)     max: 823 MB/s
CrystalDiskMark 3.0 - Sequential Read
min: 756     avg: 1011     median: 1046.5 (21%)     max: 1166 MB/s
CrystalDiskMark 5.2 / 6 - CDM 5/6 Write 4K
min: 48.38     avg: 95.5     median: 97.4 (9%)     max: 129.5 MB/s
CrystalDiskMark 5.2 / 6 - CDM 5/6 Read 4K
min: 28.98     avg: 38.3     median: 38.7 (1%)     max: 46.88 MB/s
CrystalDiskMark 5.2 / 6 - CDM 5 Write Seq
min: 654     avg: 759     median: 743 (4%)     max: 1044 MB/s
CrystalDiskMark 5.2 / 6 - CDM 5 Read Seq
min: 642     avg: 1022     median: 1039 (13%)     max: 1147 MB/s
CrystalDiskMark 5.2 / 6 - CDM 5/6 Write 4K Q32T1
min: 94.6     avg: 303.2     median: 314.1 (10%)     max: 435.7 MB/s
CrystalDiskMark 5.2 / 6 - CDM 5/6 Read 4K Q32T1
min: 243.1     avg: 317.3     median: 300 (5%)     max: 443.3 MB/s
CrystalDiskMark 5.2 / 6 - CDM 5/6 Write Seq Q32T1
min: 839     avg: 885     median: 870 (6%)     max: 1052 MB/s
CrystalDiskMark 5.2 / 6 - CDM 5/6 Read Seq Q32T1
min: 1557     avg: 1803     median: 1683 (9%)     max: 2171 MB/s
CrystalDiskMark 5.2 / 6 - CDM 6 Write 4K Q8T8
305.7 MB/s (6%)
CrystalDiskMark 5.2 / 6 - CDM 6 Read 4K Q8T8
698 MB/s (10%)
PCMark 8 - PCMark 8 Storage v2
4871 Points (95%)
DiskSpd - DiskSpd 4k_q1t1_write
min: 86.9     avg: 114.1     median: 127.5 (30%)     max: 128 MB/s
DiskSpd - DiskSpd 4k_q1t1_read
min: 37.85     avg: 45.8     median: 49.7 (14%)     max: 49.72 MB/s
DiskSpd - DiskSpd 4k_q32t16_write
min: 273.6     avg: 587     median: 743 (15%)     max: 743 MB/s
DiskSpd - DiskSpd 4k_q32t16_read
min: 520     avg: 578     median: 607 (10%)     max: 607 MB/s
DiskSpd - DiskSpd seq_write
min: 615     avg: 896     median: 1036 (11%)     max: 1036 MB/s
DiskSpd - DiskSpd seq_read
min: 971     avg: 1102     median: 1168 (17%)     max: 1168 MB/s
DiskSpd - DiskSpd seq_q8t1_write
min: 805     avg: 965     median: 1045 (7%)     max: 1045 MB/s
DiskSpd - DiskSpd seq_q8t1_read
min: 2052     avg: 2209     median: 2288 (14%)     max: 2288 MB/s
DiskSpd - DiskSpd Loop seq_q8t1_read
min: 940     avg: 1301     median: 940 (6%)     max: 2022 MB/s
- Range of benchmark values for this graphics card
- Average benchmark values for this graphics card
* Smaller numbers mean a higher performance

Add one or more devices and compare

In the following list you can select (and also search for) devices that should be added to the comparison. You can select more than one device.

restrict list:

show all (including archived), 2024, 2023
v1.26
log 16. 23:32:09

#0 no ids found in url (should be separated by "_") +0s ... 0s

#1 not redirecting to Ajax server +0s ... 0s

#2 did not recreate cache, as it is less than 5 days old! Created at Tue, 12 Mar 2024 16:12:25 +0100 +0.001s ... 0.001s

#3 composed specs +0.001s ... 0.002s

#4 did output specs +0s ... 0.002s

#5 getting avg benchmarks for device 2936 +0.016s ... 0.018s

#6 got single benchmarks 2936 +0.025s ... 0.043s

#7 got avg benchmarks for devices +0s ... 0.043s

#8 min, max, avg, median took s +1.026s ... 1.069s

#9 return log +0.012s ... 1.081s

Notebook reviews with SK Hynix BC501 HFM512GDJTNG

Microsoft Surface Book 3 13.5 Laptop

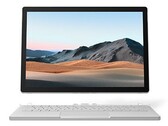
Surface Book 3 13.5 review: Microsoft convertible is slowly getting old

With the latest edition of the Surface Book 3, Microsoft updates its multi-talented device to Intel's Ice Lake generation. We get an overall picture of the i7 v...
Intel Core i7-1065G7 | NVIDIA GeForce GTX 1650 Max-Q | 13.50" | 1.6 kg
Acer Swift 3 SF313-52-52AS

Acer Swift 3 SF313 laptop review: Also a good subnotebook with i5

After the Acer Swift 3 SF313 was able to make a good impression in its full configuration, the Intel Core i5 model now has to show if it can deliver a similarly...
Intel Core i5-1035G4 | Intel Iris Plus Graphics G4 (Ice Lake 48 EU) | 13.50" | 1.2 kg
Acer Swift 7 SF714-52T Review: Slim and light subnotebook for a fat wallet

Acer Swift 7 SF714-52T Review: Slim and light subnotebook for a fat wallet

With the Swift 7, Aces has added a feather-light and ultra-slim 14-inch notebook to its offerings. The device scores with an IPS touchscreen display, 16 GB of w...
Intel Core i7-8500Y | Intel UHD Graphics 615 | 14.00" | 890 g
Dell G5 15 5590

Dell G5 15 5590 Laptop Review: 15-inch gaming notebook with a Max-Q GPU

Quite recently we reviewed a very well-priced version of the Dell G5 15 5590 that had a Core i5-9300H and an Nvidia GeForce GTX 1650. But now we are taking a lo...
Intel Core i7-9750H | NVIDIA GeForce RTX 2070 Max-Q | 15.60" | 2.8 kg
Lenovo ThinkPad E595 laptop review: AMD laptop better than its Intel counterpart?

Lenovo ThinkPad E595 laptop review: AMD laptop better than its Intel counterpart?

Lenovo currently has two variants of the ThinkPad E590 in its product range; both use Intel CPUs, but one has a dedicated AMD graphics card, while the other com...
AMD Ryzen 7 3700U | AMD Radeon RX Vega 10 | 15.60" | 1.9 kg

HP Envy x360 13-ar0601ng: AMD Ryzen 7 3700U AMD Radeon RX Vega 10, 13.30", 1.3 kg
  Review » HP Envy x360 13 Convertible Review: Display highlight with AMD Ryzen support

Acer Swift 5 SF515-51T-76B6: Intel Core i7-8565U Intel UHD Graphics 620, 15.60", 1 kg
  Review » Acer Swift 5 SF515-51T (i7-8565U, SSD, FHD) Laptop Review

Dell Inspiron 13 7386: Intel Core i7-8565U Intel UHD Graphics 620, 13.30", 1.5 kg
  Review » Dell Inspiron 13 7386 2-in-1 Black Edition (i7-8565U, 16 GB RAM, 512 GB SSD) Convertible Review

HP Envy 13-ah0003ng: Intel Core i7-8550U NVIDIA GeForce MX150, 13.30", 1.2 kg
  Review » HP Envy 13t (i7-8550U, MX150, SSD, FHD) Laptop Review

Acer Swift 3 SF313-52-52AS: Intel Core i5-1035G4 Intel Iris Plus Graphics G4 (Ice Lake 48 EU), 13.50", 1.2 kg
  External Review » Acer Swift 3 SF313-52-52AS

Microsoft Surface Book 3 13.5: Intel Core i7-1065G7 NVIDIA GeForce GTX 1650 Max-Q, 13.50", 1.6 kg
  External Review » Microsoft Surface Book 3 13.5

Dell G5 15 5590-P8RVW: Intel Core i7-9750H NVIDIA GeForce RTX 2070 Max-Q, 15.60", 2.8 kg
  External Review » Dell G5 15 5590-P8RVW

Acer Swift 7 SF714-52T-76MR: Intel Core i7-8500Y Intel UHD Graphics 615, 14.00", 0.9 kg
  External Review » Acer Swift 7 SF714-52T-76MR

HP Envy x360 13-ar0601ng: AMD Ryzen 7 3700U AMD Radeon RX Vega 10, 13.30", 1.3 kg
  External Review » HP Envy x360 13-ar0601ng

Acer Swift 5 SF515-51T-76B6: Intel Core i7-8565U Intel UHD Graphics 620, 15.60", 1 kg
  External Review » Acer Swift 5 SF515-51T-70UX

HP Envy 13-ah0003ng: Intel Core i7-8550U NVIDIA GeForce MX150, 13.30", 1.2 kg
  External Review » HP Envy 13-ah0003ng

Microsoft Surface Book 3 13.5: Intel Core i7-1065G7 NVIDIA GeForce GTX 1650 Max-Q, 13.50", 1.6 kg
   » Microsoft Surface Book 3 13.5: Is it worth switching from the previous model?

Acer Swift 3 SF313-52-52AS: Intel Core i5-1035G4 Intel Iris Plus Graphics G4 (Ice Lake 48 EU), 13.50", 1.2 kg
   » Acer Swift 3 SF313-52-52AS: Should buyers rather choose the Core i5?

Please share our article, every link counts!
> Expert Reviews and News on Laptops, Smartphones and Tech Innovations > Benchmarks / Tech > Laptop harddisks (HDD, SSD) benchmarks > SK Hynix BC501 HFM512GDJTNG SSD Benchmarks
Klaus Hinum (Update: 2020-06-22)