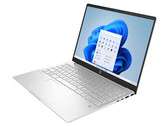
Notebookcheck Logo

SK Hynix BC711 HFM256GD3GX013N

SK Hynix BC711 HFM256GD3GX013N BC711 HFM256GD3GX013N

The SK Hynix BC711 HFM256GD3GX013N NVMe Pyrite is a mid range PCIe M.2 2242 drive that was first found in the Dell Inspiron 15 3000 3511 laptop. It uses a PCIe Gen3 x 4 interface and offers 256 GB of storage. We tested with firmware 41002131.

TypeSSD
SizeM.2 2242
Capacity256 GB
InterfaceNVMe
Announced06.01.2021

Benchmarks

Performance Rating - DiskSpd
21.1 pt (26%)
Seagate ST1000LM014 Solid State Hybrid Drive
0.771 -96%
...
20.2 -4%
20.3 -4%
Foresee VP1000F512G
20.3 -4%
20.4 -3%
Lexar NM610 500GB
20.5 -3%
Adata Legend 710
20.5 -3%
20.8 -1%
20.8 -1%
21 0%
SK Hynix BC711 HFM256GD3GX013N
21.1
21.1 0%
21.1 0%
21.2 0%
21.3 1%
21.3 1%
2x Intel SSD 660p 1TB SSDPEKNW010T8 (RAID 0)
21.4 1%
Samsung SSD PM981a MZVLB256HBHQ
21.6 2%
21.7 3%
21.7 3%
...
80.6 282%
0%
100%
AS SSD - Copy Game
min: 446.1     avg: 462.8     median: 462.8 (8%)     max: 479.5 MB/s
AS SSD - Copy Program
min: 268.65     avg: 305.6     median: 305.6 (11%)     max: 342.6 MB/s
AS SSD - Copy ISO
min: 1199     avg: 1429     median: 1429.5 (13%)     max: 1659.9 MB/s
AS SSD - Score Total
min: 2493     avg: 2711     median: 2710.5 (20%)     max: 2928 Points
AS SSD - Score Write
min: 545     avg: 795     median: 794.5 (11%)     max: 1044 Points
AS SSD - Score Read
min: 1279     avg: 1315     median: 1315 (5%)     max: 1351 Points
AS SSD - Access Time Write *
min: 0.032     avg: 0.1     median: 0.1 (0%)     max: 0.096 ms
AS SSD - Access Time Read *
min: 0.07     avg: 0.1     median: 0.1 (0%)     max: 0.071 ms
AS SSD - 4K-64 Write
min: 280.68     avg: 559     median: 558.8 (9%)     max: 837 MB/s
AS SSD - 4K-64 Read
min: 1026.51     avg: 1027     median: 1026.8 (30%)     max: 1027 MB/s
AS SSD - 4K Write
min: 122.4     avg: 161     median: 161 (31%)     max: 199.59 MB/s
AS SSD - 4K Read
min: 49.68     avg: 50.6     median: 50.6 (16%)     max: 51.48 MB/s
AS SSD - Sequential Write
min: 644.67     avg: 745     median: 744.8 (7%)     max: 845 MB/s
AS SSD - Sequential Read
min: 2023     avg: 2378     median: 2378.3 (19%)     max: 2733.64 MB/s
CrystalDiskMark 5.2 / 6 - CDM 5/6 Write 4K
min: 138.7     avg: 154.9     median: 154.9 (14%)     max: 171.1 MB/s
CrystalDiskMark 5.2 / 6 - CDM 5/6 Read 4K
min: 55.8     avg: 59.1     median: 59.1 (2%)     max: 62.49 MB/s
CrystalDiskMark 5.2 / 6 - CDM 5 Write Seq
min: 790     avg: 873     median: 873.5 (5%)     max: 956.9 MB/s
CrystalDiskMark 5.2 / 6 - CDM 5 Read Seq
min: 1890     avg: 1950     median: 1950 (24%)     max: 2010 MB/s
CrystalDiskMark 5.2 / 6 - CDM 5/6 Write 4K Q32T1
min: 399     avg: 434.1     median: 434.1 (14%)     max: 469.1 MB/s
CrystalDiskMark 5.2 / 6 - CDM 5/6 Read 4K Q32T1
min: 408.1     avg: 494.7     median: 494.7 (8%)     max: 581.2 MB/s
CrystalDiskMark 5.2 / 6 - CDM 5/6 Write Seq Q32T1
min: 869.1     avg: 941     median: 940.6 (6%)     max: 1012 MB/s
CrystalDiskMark 5.2 / 6 - CDM 5/6 Read Seq Q32T1
min: 3304     avg: 3361     median: 3361 (18%)     max: 3418 MB/s
DiskSpd - DiskSpd 4k_q1t1_write
min: 141     avg: 151.8     median: 151.8 (35%)     max: 162.5 MB/s
DiskSpd - DiskSpd 4k_q1t1_read
min: 52.3     avg: 53.2     median: 53.2 (15%)     max: 54 MB/s
DiskSpd - DiskSpd 4k_q32t16_write
min: 411     avg: 460.5     median: 460.5 (9%)     max: 510 MB/s
DiskSpd - DiskSpd 4k_q32t16_read
min: 667     avg: 898     median: 897.5 (15%)     max: 1128 MB/s
DiskSpd - DiskSpd seq_write
min: 1606     avg: 1786     median: 1785.5 (19%)     max: 1965 MB/s
DiskSpd - DiskSpd seq_read
min: 1680     avg: 1835     median: 1834.5 (26%)     max: 1989 MB/s
DiskSpd - DiskSpd seq_q8t1_write
min: 863     avg: 878     median: 878 (6%)     max: 893 MB/s
DiskSpd - DiskSpd seq_q8t1_read
min: 3398     avg: 3411     median: 3411 (21%)     max: 3424 MB/s
DiskSpd - DiskSpd Loop seq_q8t1_read
min: 3302     avg: 3343     median: 3343 (21%)     max: 3384 MB/s
01002003004005006007008009001000110012001300140015001600170018001900200021002200230024002500260027002800290030003100320033003400Tooltip
- Range of benchmark values for this graphics card
- Average benchmark values for this graphics card
* Smaller numbers mean a higher performance

Add one or more devices and compare

In the following list you can select (and also search for) devices that should be added to the comparison. You can select more than one device.

restrict list:

show all (including archived), 2024, 2023
v1.26
log 24. 10:38:15

#0 no ids found in url (should be separated by "_") +0s ... 0s

#1 not redirecting to Ajax server +0s ... 0s

#2 did not recreate cache, as it is less than 5 days old! Created at Sun, 21 Apr 2024 17:34:57 +0200 +0.001s ... 0.001s

#3 composed specs +0.006s ... 0.007s

#4 did output specs +0s ... 0.007s

#5 getting avg benchmarks for device 3779 +0.016s ... 0.023s

#6 got single benchmarks 3779 +0.009s ... 0.032s

#7 got avg benchmarks for devices +0s ... 0.032s

#8 min, max, avg, median took s +1.121s ... 1.153s

#9 return log +0.018s ... 1.172s

Please share our article, every link counts!
> Expert Reviews and News on Laptops, Smartphones and Tech Innovations > Benchmarks / Tech > Laptop harddisks (HDD, SSD) benchmarks > SK Hynix BC711 HFM256GD3GX013N SSD Benchmarks
Klaus Hinum (Update: 2022-01-24)