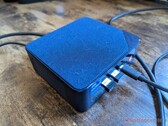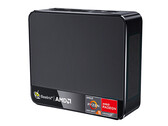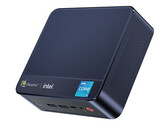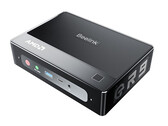
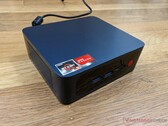
Trigkey S3 mini PC review: Core i3-like performance for the price of a Celeron or Atom
The Trigkey is inexpensive at just under US$300, but it thankfully sidesteps the terribly slow Celeron or Atom solutions for an older but faster AMD Zen+ processor instead. Even light HTPC multi-tasking can benefit from the aging AMD processor.
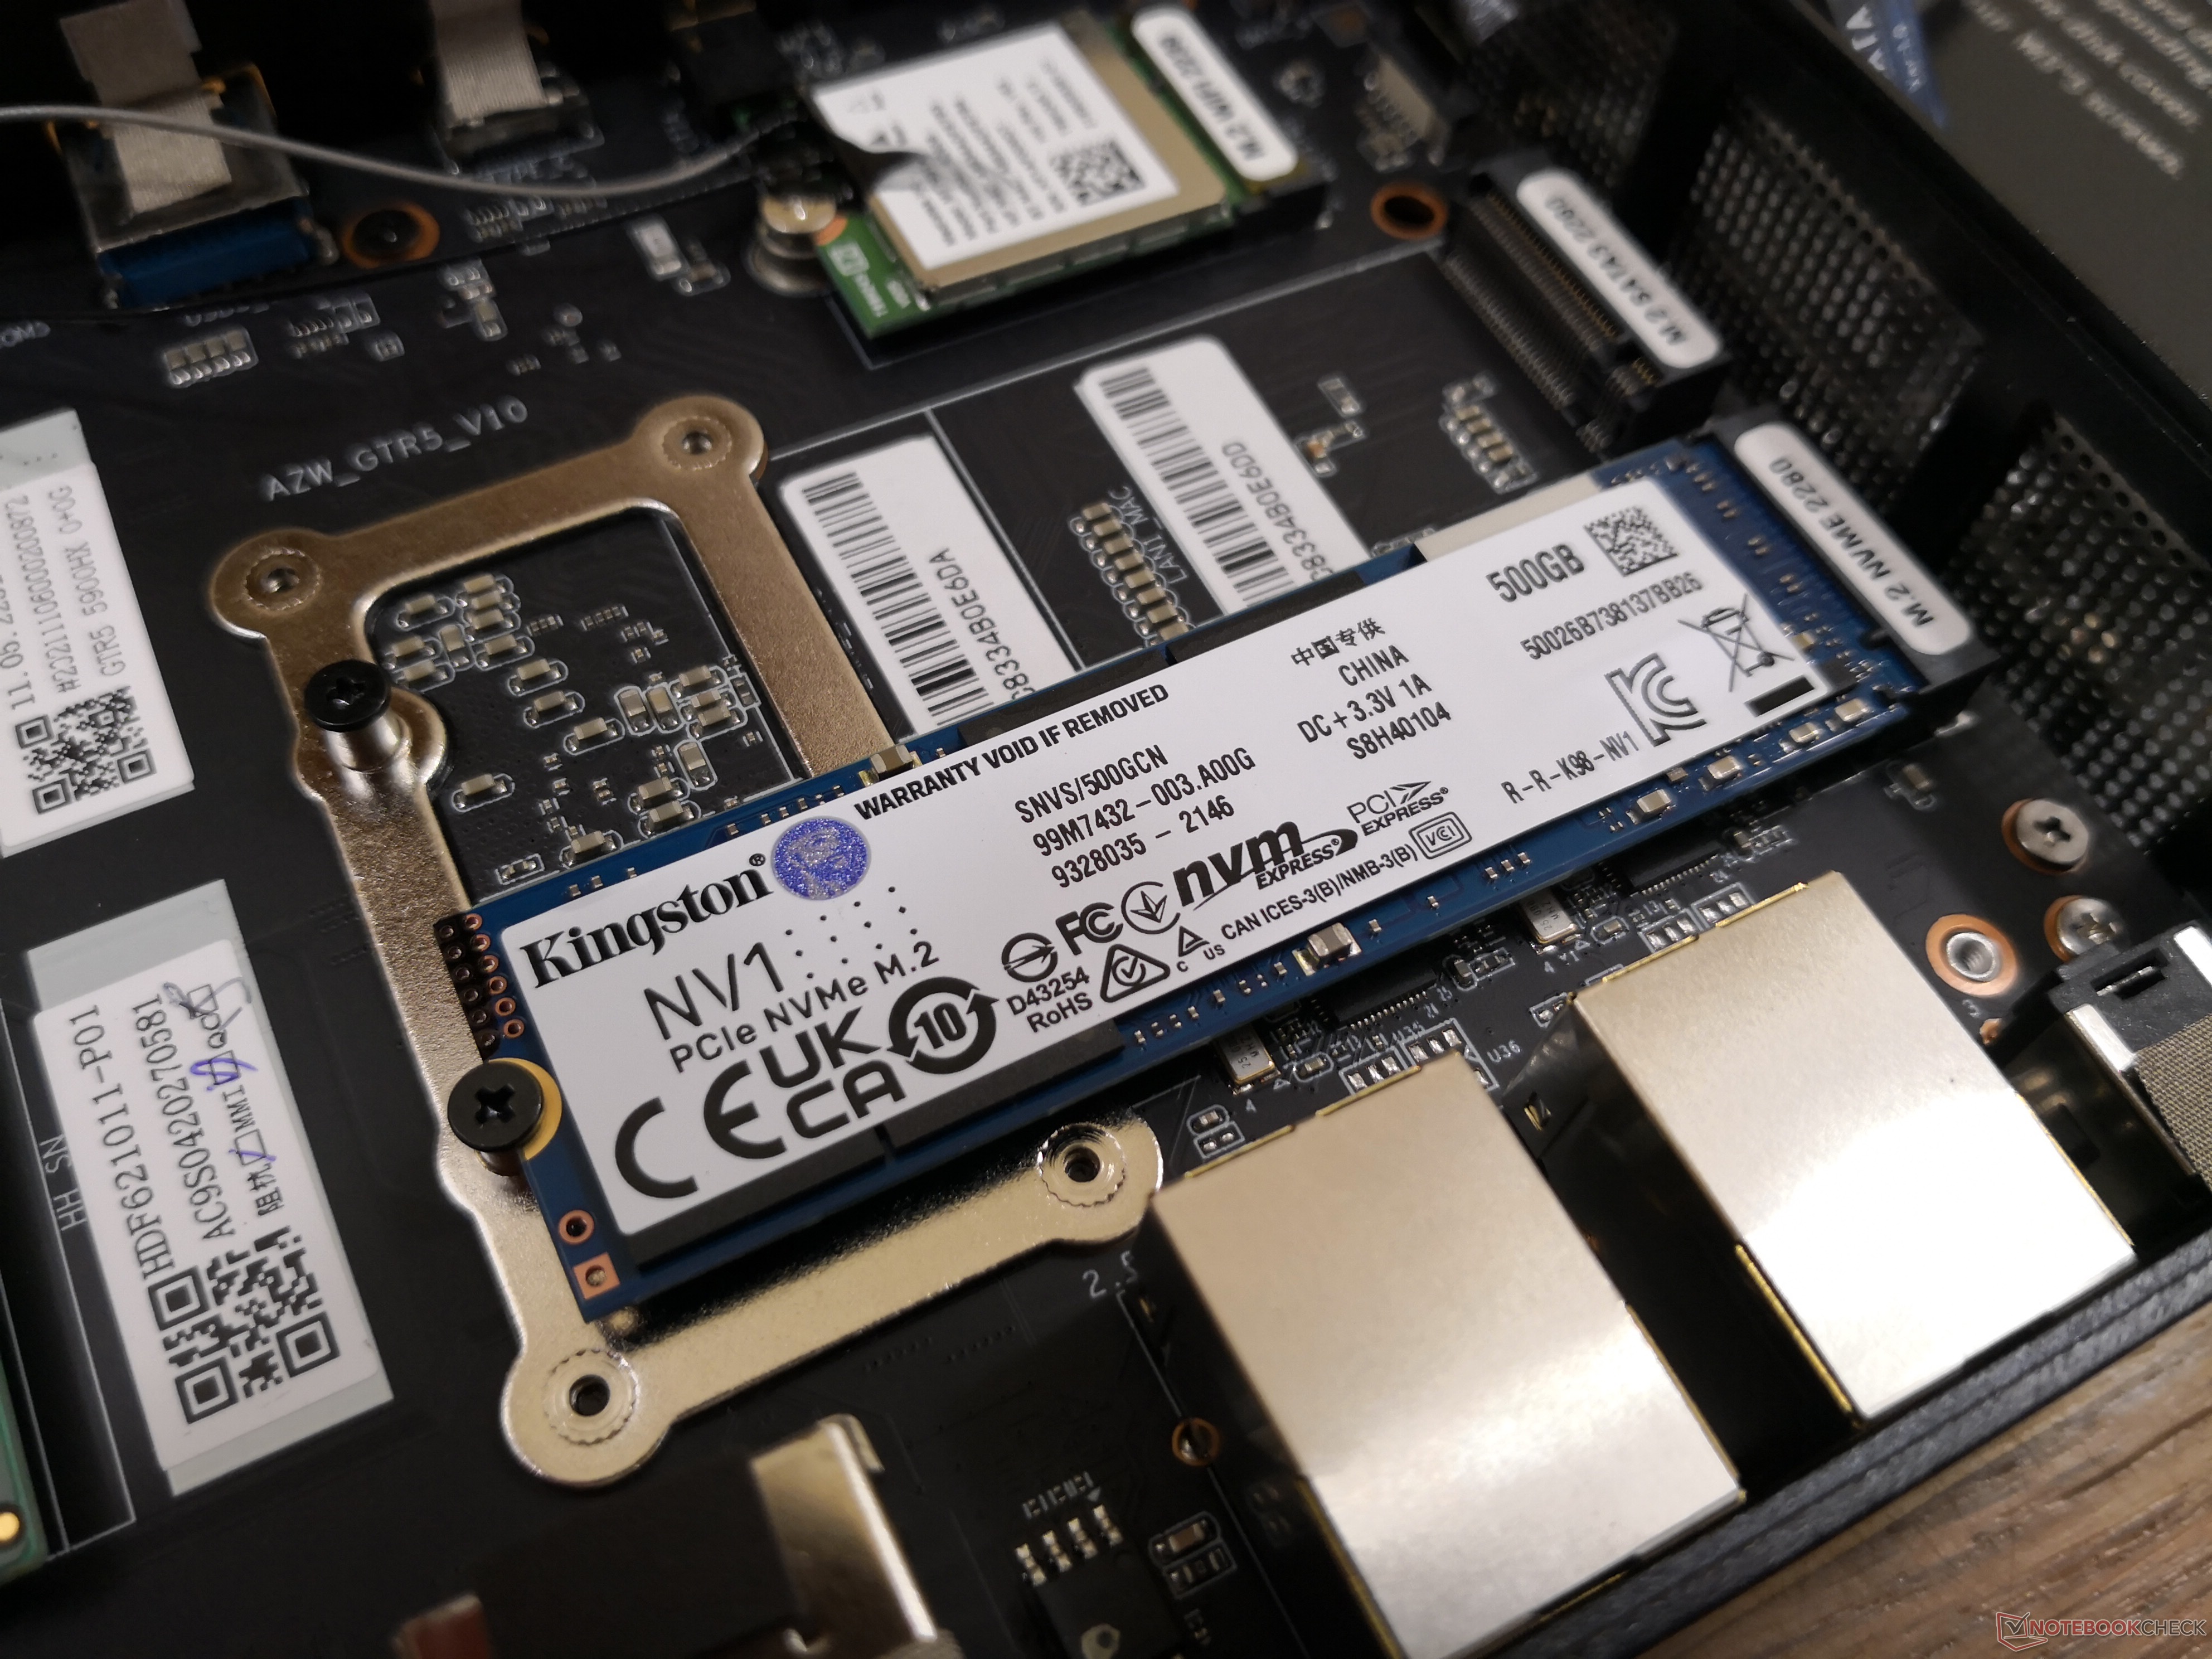
AMD Ryzen 5 3550H, Vega 8, 419 g