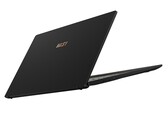
MSI Creator Z16: Creative laptop with AdobeRGB in review
MSI dares to fight for the creative crown of the 16-inch superstars. Creatives are supposed to achieve results in the shortest time with high performance. The idea is essentially successful, but the details are slightly lacking, which makes the Z16 miss the mark of Very Good.
Intel Core i7-11800H, NVIDIA GeForce RTX 3060 Laptop GPU, 16", 2.2 kg