Asus Strix Scar 17 G733QS Laptop Review: Liquid Metal 7 nm AMD Zen 3 Is Stunning
Asus has quickly become one of the biggest supporters of mobile AMD Ryzen by entrusting the series to power some of its most well-known gaming laptops. The latest ROG Strix Scar 17 forgoes Intel entirely for a liquid metal-cooled Ryzen 9 5900HX to be as fast as an Intel Core i9 desktop PC.
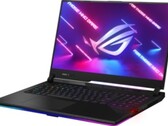
AMD Ryzen 9 5900HX, NVIDIA GeForce RTX 3080 Laptop GPU, 17.3", 2.8 kg