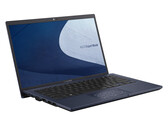
Notebookcheck Logo

WDC PC SN530 SDBPNPZ-265G

WDC PC SN530 SDBPNPZ-265G SN530 SDBPNPZ-265G

The Western Digital PC SN530 NVMe SSD256GB, M.2 2280 (SDBPNPZ-256G) is a mid-range NVMe drive using Toshiba/WD 3D-NAND TLC with 96 Layers (most likely as the 512 GB version does).

TypeSSD
SizeM.2 2242
Capacity256 GB
Announced26.02.2021
LinkWDC PC SN530 SDBPNPZ-265G

Benchmarks

Performance Rating - DiskSpd
18.3 pt (23%)
64 GB eMMC Flash
2.26 -88%
...
17.9 -2%
17.9 -2%
17.9 -2%
18 -2%
Kingston OM8PDP3256B
18 -2%
18 -2%
18.2 -1%
Samsung PM991 MZALQ256HAJD
18.2 -1%
18.3 0%
WDC PC SN530 SDBPNPZ-265G
18.3
Samsung PM991 MZVLQ512HBLU
18.4 1%
BiWin CE480Y2D100-512G
18.5 1%
18.5 1%
18.5 1%
18.6 2%
18.7 2%
Lexar 1024GB LNM6A1X001T-HNNNG
18.7 2%
18.8 3%
18.8 3%
...
80.6 340%
0%
100%
AS SSD - Copy Game
min: 405     avg: 439.8     median: 439.8 (7%)     max: 474.61 MB/s
AS SSD - Copy Program
min: 151.58     avg: 238.1     median: 238.1 (9%)     max: 324.7 MB/s
AS SSD - Copy ISO
min: 901     avg: 902     median: 902.5 (8%)     max: 903.94 MB/s
AS SSD - Score Total
min: 1449     avg: 1525     median: 1525 (11%)     max: 1601 Points
AS SSD - Score Write
min: 474     avg: 521     median: 520.5 (7%)     max: 567 Points
AS SSD - Score Read
min: 621     avg: 701     median: 700.5 (3%)     max: 780 Points
AS SSD - Access Time Write *
min: 0.041     avg: 0.1     median: 0.1 (0%)     max: 0.059 ms
AS SSD - Access Time Read *
min: 0.1     avg: 0.1     median: 0.1 (0%)     max: 0.108 ms
AS SSD - 4K-64 Write
min: 266     avg: 274.7     median: 274.7 (5%)     max: 283.45 MB/s
AS SSD - 4K-64 Read
min: 367.2     avg: 447.3     median: 447.3 (13%)     max: 527.38 MB/s
AS SSD - 4K Write
min: 98.83     avg: 153.9     median: 153.9 (30%)     max: 208.9 MB/s
AS SSD - 4K Read
min: 31.5     avg: 34.3     median: 34.3 (11%)     max: 37.07 MB/s
AS SSD - Sequential Write
min: 919     avg: 920     median: 919.7 (8%)     max: 920.46 MB/s
AS SSD - Sequential Read
min: 2150.46     avg: 2185     median: 2185.2 (17%)     max: 2220 MB/s
CrystalDiskMark 5.2 / 6 - CDM 5/6 Write 4K
min: 119.6     avg: 174.8     median: 174.8 (16%)     max: 230 MB/s
CrystalDiskMark 5.2 / 6 - CDM 5/6 Read 4K
min: 42.72     avg: 50.2     median: 50.2 (1%)     max: 57.7 MB/s
CrystalDiskMark 5.2 / 6 - CDM 5 Write Seq
min: 957     avg: 965     median: 965 (5%)     max: 972.9 MB/s
CrystalDiskMark 5.2 / 6 - CDM 5 Read Seq
min: 1659     avg: 1762     median: 1762 (21%)     max: 1865 MB/s
CrystalDiskMark 5.2 / 6 - CDM 5/6 Write 4K Q32T1
min: 173.9     avg: 262.9     median: 262.9 (9%)     max: 351.8 MB/s
CrystalDiskMark 5.2 / 6 - CDM 5/6 Read 4K Q32T1
min: 318.7     avg: 474.4     median: 474.4 (7%)     max: 630 MB/s
CrystalDiskMark 5.2 / 6 - CDM 5/6 Write Seq Q32T1
min: 966     avg: 968     median: 968 (6%)     max: 970 MB/s
CrystalDiskMark 5.2 / 6 - CDM 5/6 Read Seq Q32T1
min: 2322     avg: 2407     median: 2406.5 (13%)     max: 2491 MB/s
DiskSpd - DiskSpd 4k_q1t1_write
min: 109.1     avg: 176.1     median: 176.1 (41%)     max: 243 MB/s
DiskSpd - DiskSpd 4k_q1t1_read
min: 33     avg: 34.1     median: 34.1 (10%)     max: 35.1 MB/s
DiskSpd - DiskSpd 4k_q32t16_write
min: 538     avg: 576     median: 576 (12%)     max: 614 MB/s
DiskSpd - DiskSpd 4k_q32t16_read
min: 656     avg: 669     median: 669 (11%)     max: 682 MB/s
DiskSpd - DiskSpd seq_write
min: 942     avg: 943     median: 942.5 (10%)     max: 943 MB/s
DiskSpd - DiskSpd seq_read
min: 1649     avg: 1703     median: 1702.5 (24%)     max: 1756 MB/s
DiskSpd - DiskSpd seq_q8t1_write
min: 940     avg: 943     median: 942.5 (6%)     max: 945 MB/s
DiskSpd - DiskSpd seq_q8t1_read
min: 2460     avg: 2461     median: 2461 (15%)     max: 2462 MB/s
DiskSpd - DiskSpd Loop seq_q8t1_read
min: 2465     avg: 2466     median: 2466 (15%)     max: 2467 MB/s
0100200300400500600700800900100011001200130014001500160017001800190020002100220023002400Tooltip
- Range of benchmark values for this graphics card
- Average benchmark values for this graphics card
* Smaller numbers mean a higher performance

Add one or more devices and compare

In the following list you can select (and also search for) devices that should be added to the comparison. You can select more than one device.

restrict list:

show all (including archived), 2024, 2023
v1.26
log 18. 10:26:22

#0 no ids found in url (should be separated by "_") +0s ... 0s

#1 not redirecting to Ajax server +0s ... 0s

#2 did not recreate cache, as it is less than 5 days old! Created at Tue, 16 Apr 2024 17:31:00 +0200 +0.001s ... 0.001s

#3 composed specs +0.005s ... 0.006s

#4 did output specs +0s ... 0.006s

#5 getting avg benchmarks for device 3792 +0.014s ... 0.02s

#6 got single benchmarks 3792 +0.007s ... 0.028s

#7 got avg benchmarks for devices +0s ... 0.028s

#8 min, max, avg, median took s +0.936s ... 0.964s

#9 return log +0.011s ... 0.976s

Please share our article, every link counts!
> Expert Reviews and News on Laptops, Smartphones and Tech Innovations > Benchmarks / Tech > Laptop harddisks (HDD, SSD) benchmarks > WDC PC SN530 SDBPNPZ-265G SSD Benchmarks
Klaus Hinum (Update: 2022-02-16)