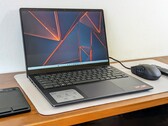
Dell Inspiron 14 7445 2-in-1 convertible review: Transitioning from Ryzen-U to Ryzen-HS
The Inspiron 14 7435 2-in-1 was equipped with Zen 3 Ryzen-U processors and so this year's Inspiron 14 7445 2-in-1 refresh was expected to ship with Zen 4 Ryzen-U options. Instead, Dell has thrown us a curve ball with even faster Zen 4 Ryzen-HS options for larger performance gains.
AMD Ryzen 7 8840HS, Radeon 780M, 14", 1.7 kg