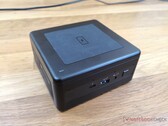
Kaby Lake-G Is History: Intel Phantom Canyon NUC11PHKi7C Review
Instead of developing a second generation Kaby Lake-G, Intel has simply swapped out AMD for Nvidia to essentially put an end to the short-lived Intel-AMD chipset. The results are worthwhile even if the new NUC is a bit thicker and heavier than before.
Intel Core i7-1165G7, NVIDIA GeForce RTX 2060 Mobile, 1.4 kg