100 W Core i7-8809G vs. 28 W Core i7-1165G7: Can Tiger Lake outperform the exotic Intel-AMD chipset?
Intel and AMD made ripples in their industry when they announced a partnership in 2017 to co-develop the Kaby Lake-G platform. It was a one-of-a-kind chipset that married a quad-core Kaby Lake-H CPU with a Radeon RX Vega GPU all wrapped under a 100 W TDP envelope. It didn't last very long in the market, however, due in part to its very limited support from major PC makers.
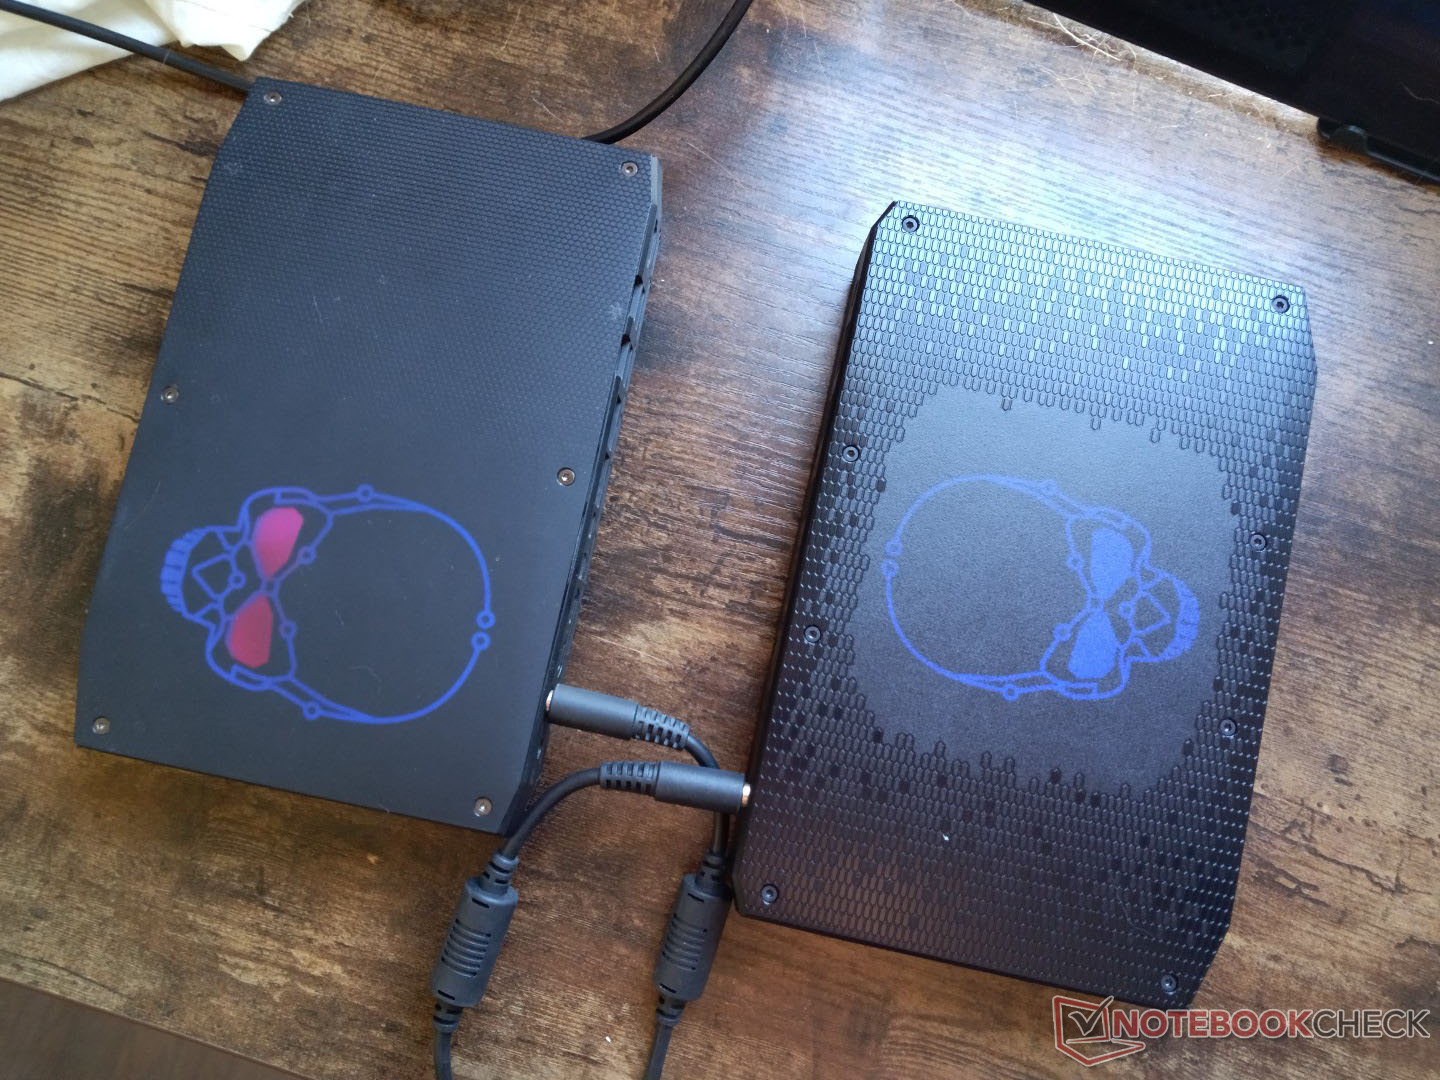
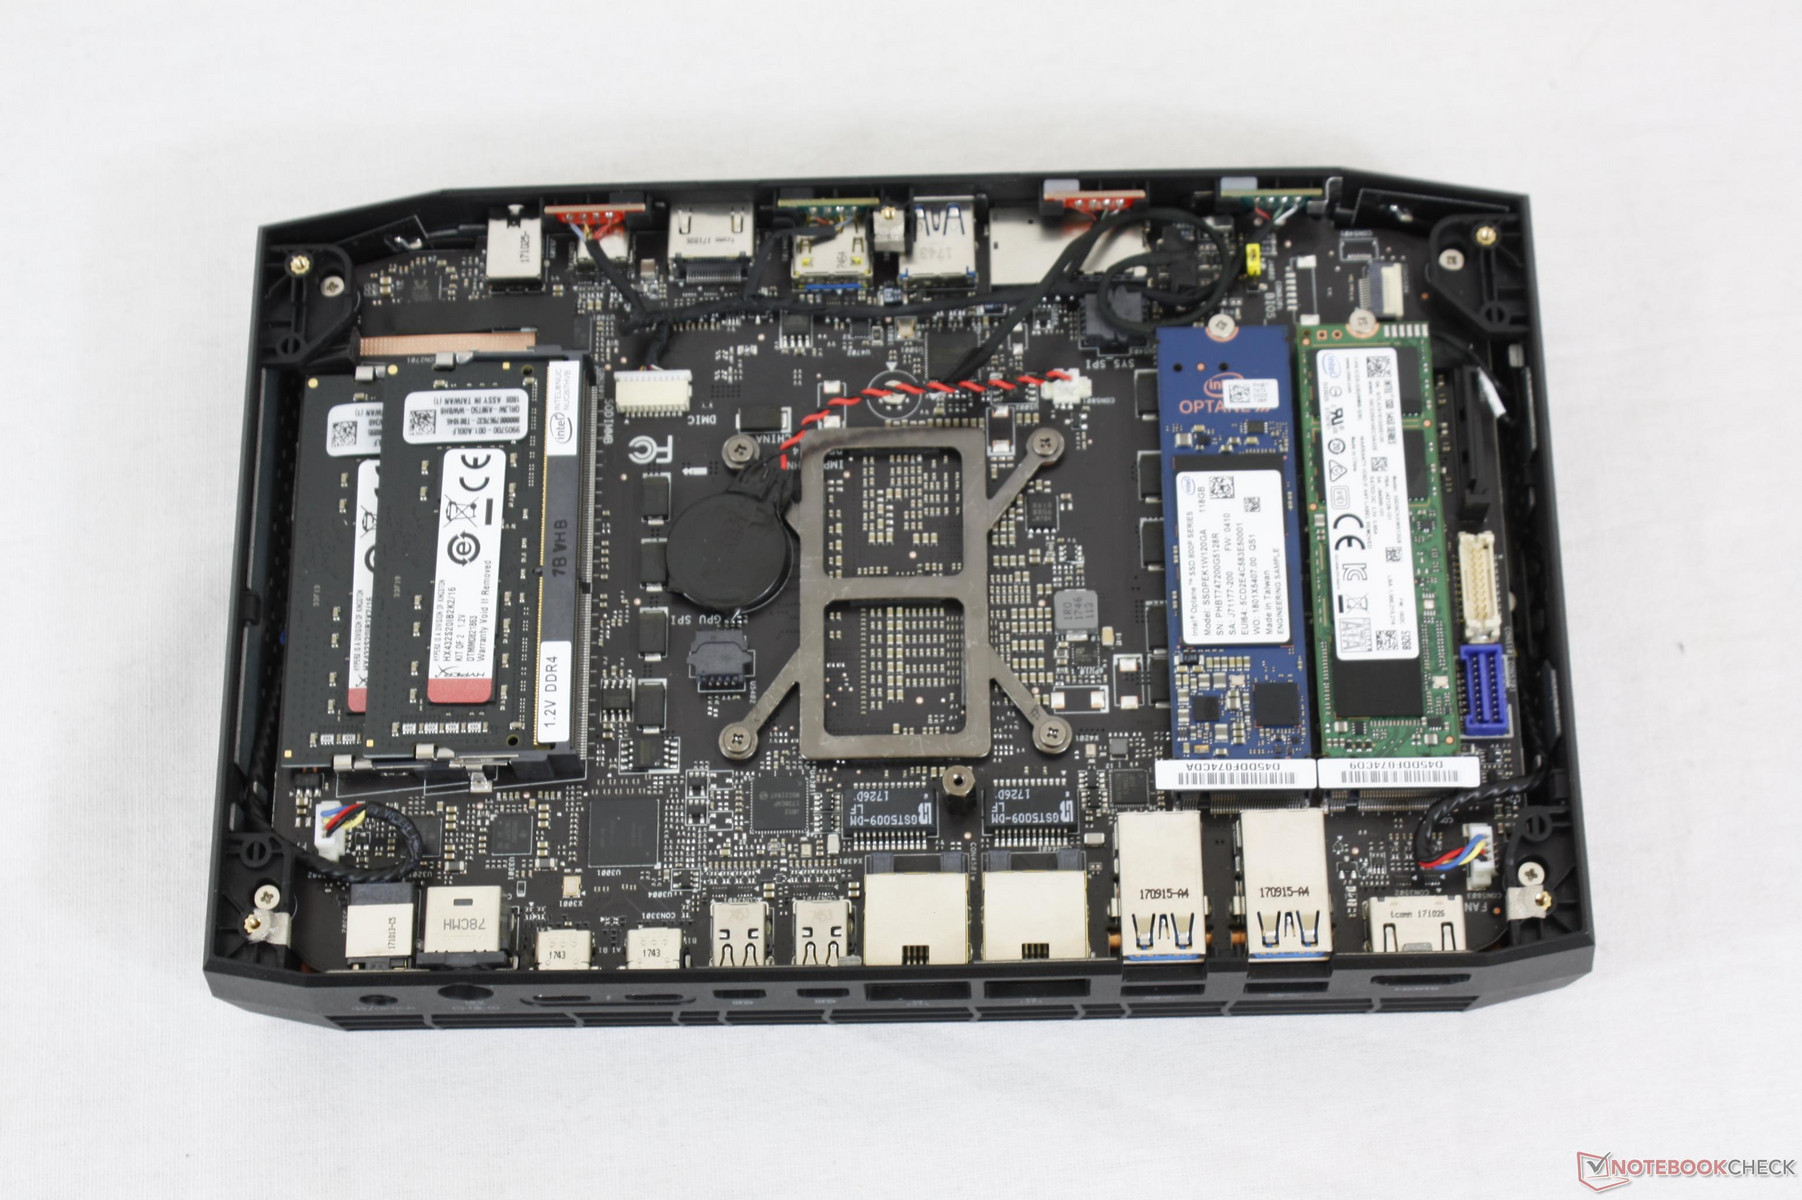
The 2018 Hades Canyon NUC remains the one and only champion of the Kaby Lake-G Core i7-8809G processor. While it would be foolish to expect it to run as fast as the latest solutions of 2021, we're still interested in seeing just how much of a performance gap exists between the rare 100 W Core i7-8809G and the current 28 W Tiger Lake-U platform.
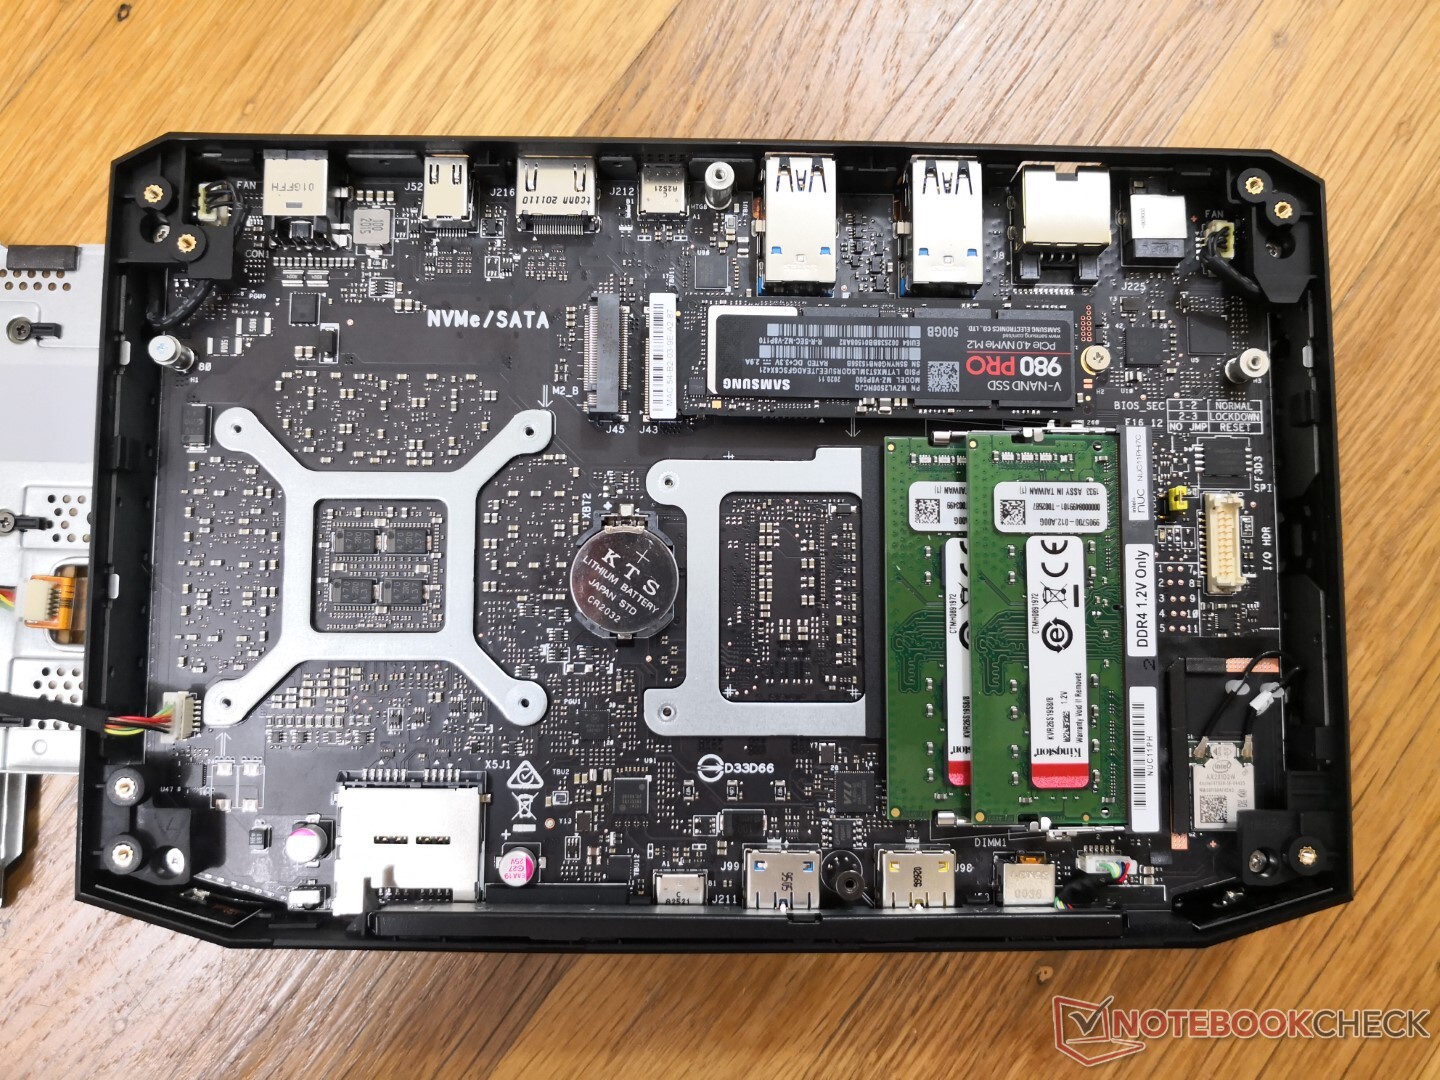
The NUC11 Phantom Canyon directly succeeds the NUC8 Hades Canyon to make it the perfect system for a head-to-head comparison. Multi-thread-heavy benchmarks like CineBench, Blender, and HWBOT x265 show that the Core i7-8809G and Core i7-1165G7 are very close to one another despite their massive differences in TDP levels. However, the newer CPU handily outperforms the Intel-AMD CPU when it comes to single-threaded loads.
When looking at the Radeon RX Vega M GH and mobile GeForce RTX 2060, the latter offers significantly faster frame rates especially when running demanding DX12 titles at higher resolutions where performance becomes more GPU bound.
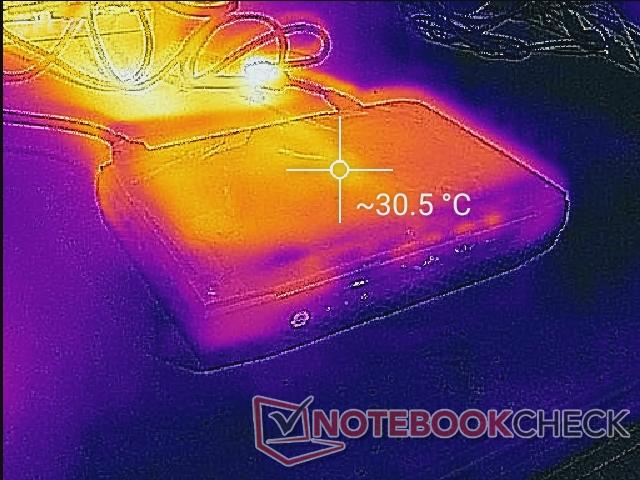
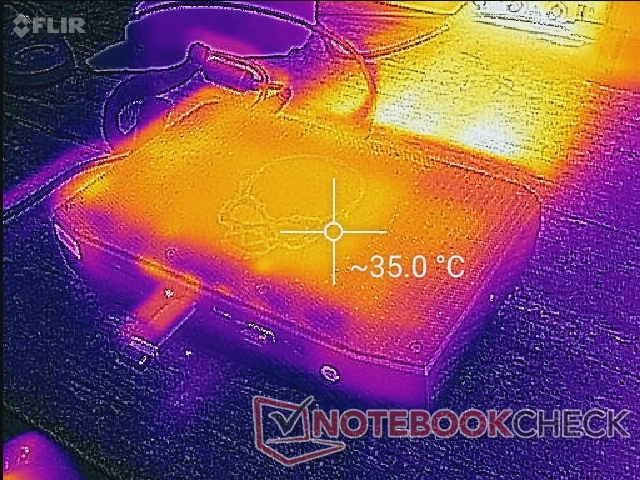
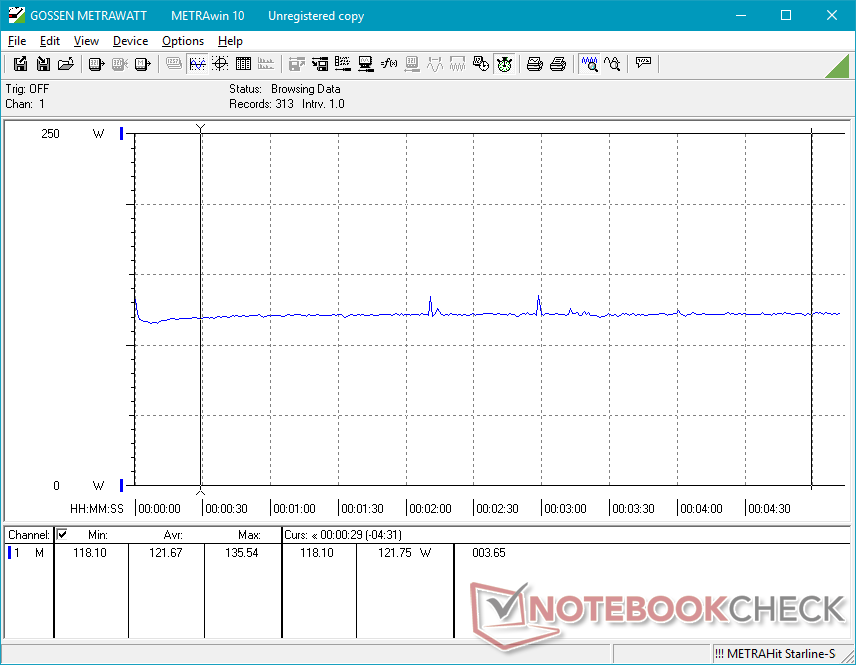
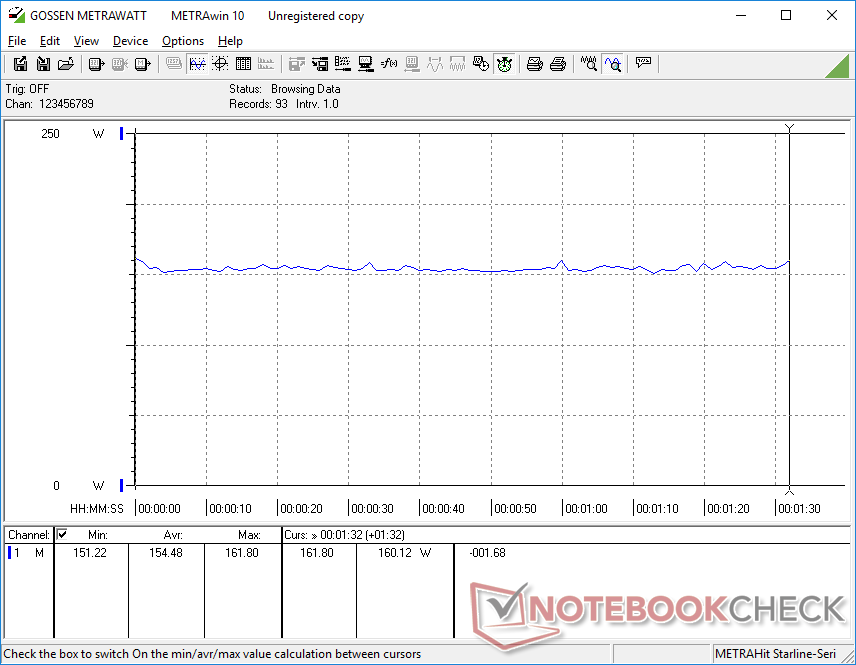
Overall power consumption is higher on Phantom Canyon than on Hades Canyon meaning the performance uptick doesn't come free. However, the rise in consumption is much smaller than the rise in performance percentagewise for higher gen-to-gen performance-per-watt. Additionally, core temperatures and fan noise would remain relatively consistent between the two NUCs despite the large performance gaps. Users are getting more performance without the machine running louder or warmer.
Kaby Lake-G was fun while it lasted, but Phantom Canyon is proof that you don't need an exotic architecture when "stock" CPUs and GPUs can accomplish the same and with better software support.
See our full reviews on the NUC8 Hades Canyon and NUC11 Phantom Canyon to learn more about these gaming NUCs.
| Intel NUC8 Hades Canyon Core Specifications | Intel NUC11 Phantom Canyon Core Specifications |
|---|---|
| 8th gen Intel Core i7-8809G CPU Kaby Lake-G 100 W TDP combined CPU and GPU Discrete Radeon RX Vega M GH GPU 4 GB HBM2 VRAM 2018 launch | 11th gen Intel Core i7-1165G7 CPU Tiger Lake-U 28 W TDP CPU + 80 W to 90 W TGP GPU Discrete GeForce RTX 2060 mobile GPU 6 GB GDDR6 VRAM 2021 launch |
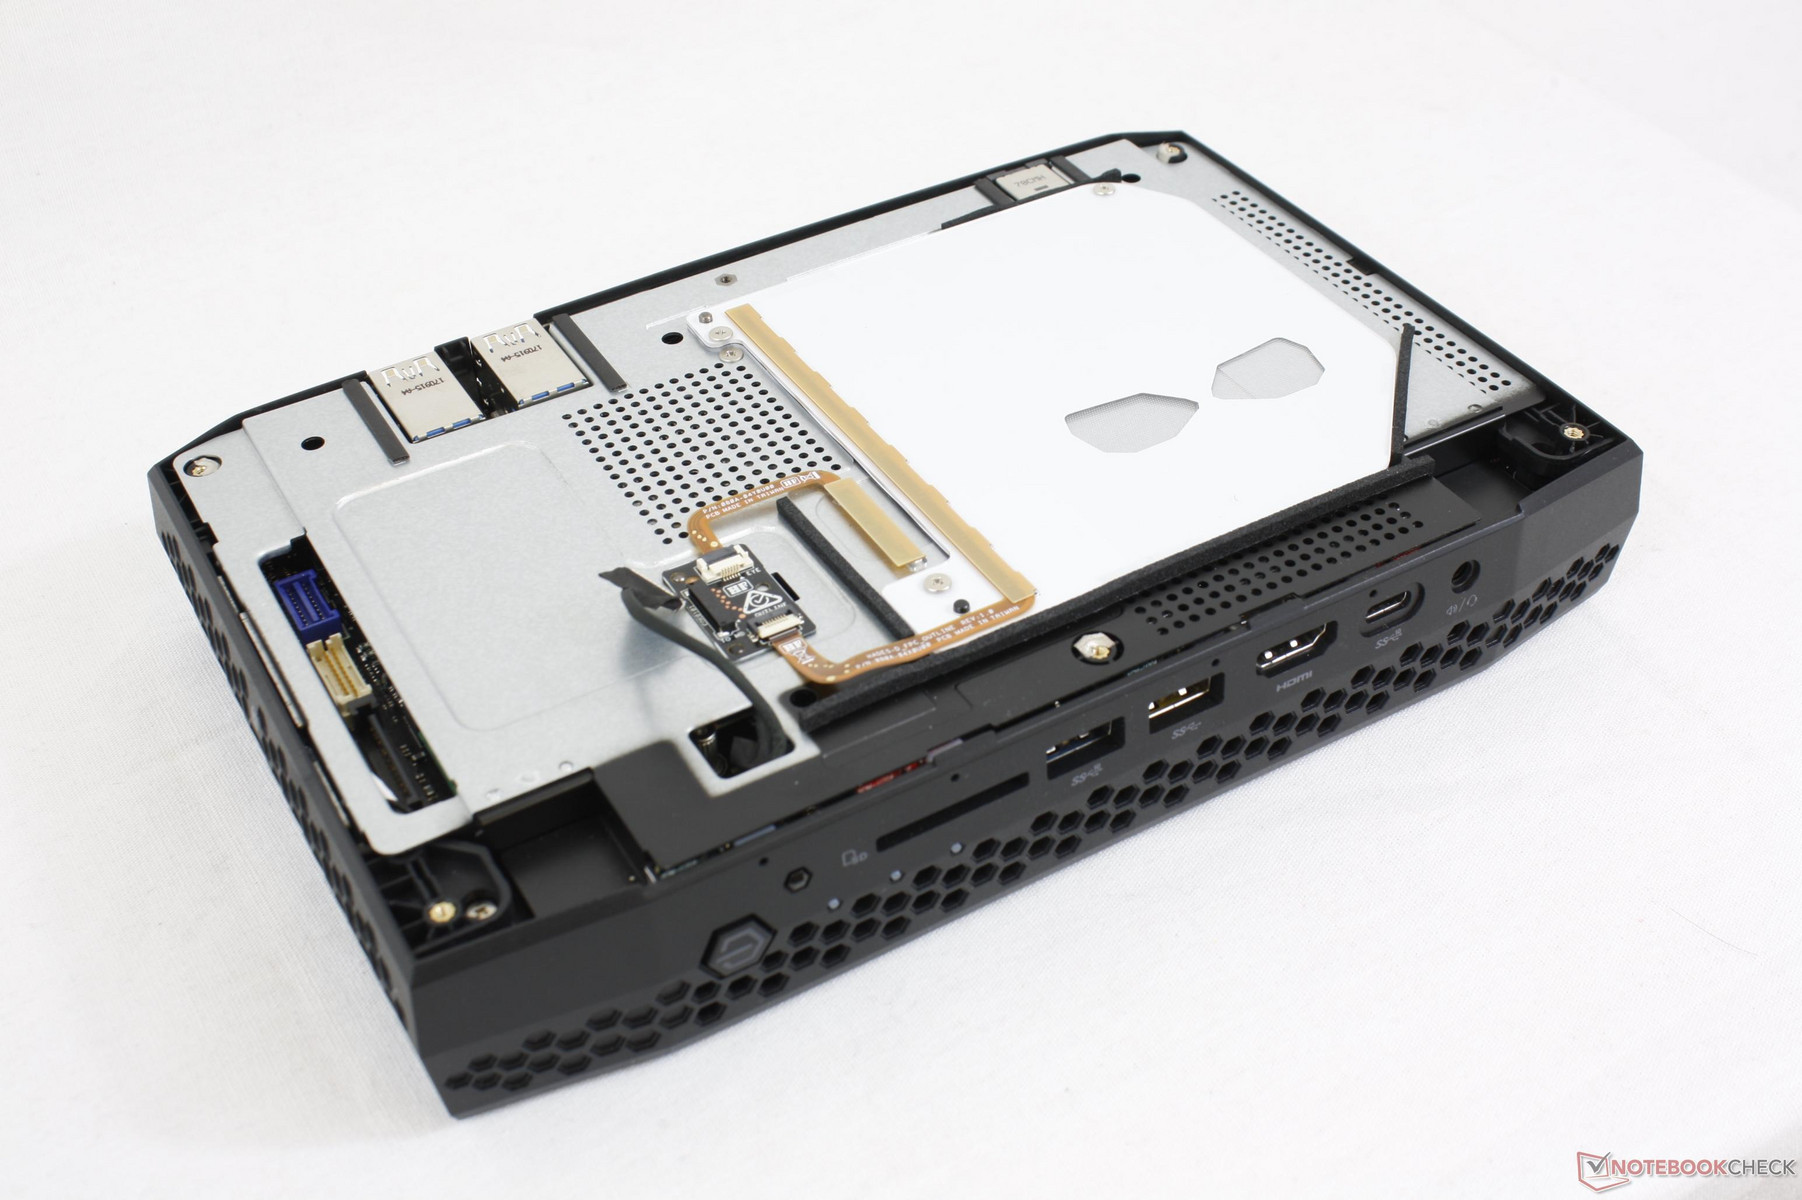
| Intel NUC8 Hades Canyon Ports | Intel NUC11 Phantom Canyon Ports |
|---|---|
| 2x mini-DisplayPort 1.3 2x 1 Gbps RJ-45 6x USB-A 3x USB-C (2x Thunderbolt 3) 2x HDMI 2.0a 1x Optical 1x 3.5 mm audio | 1x mini-DisplayPort 1.4 1x 2.5 Gbps RJ-45 6x USB-A 2x USB-C (2x Thunderbolt 4) 1x HDMI 2.0b 1x Optical 1x 3.5 mm audio |
Cinebench R15: CPU Multi 64Bit | CPU Single 64Bit
Blender: v2.79 BMW27 CPU
7-Zip 18.03: 7z b 4 -mmt1 | 7z b 4
Geekbench 5.5: Single-Core | Multi-Core
HWBOT x265 Benchmark v2.2: 4k Preset
LibreOffice : 20 Documents To PDF
R Benchmark 2.5: Overall mean
| Cinebench R20 / CPU (Multi Core) | |
| Intel Hades Canyon NUC8i7HVK | |
| Intel NUC11PHKi7C | |
| Cinebench R20 / CPU (Single Core) | |
| Intel NUC11PHKi7C | |
| Intel Hades Canyon NUC8i7HVK | |
| Cinebench R15 / CPU Multi 64Bit | |
| Intel NUC11PHKi7C | |
| Intel Hades Canyon NUC8i7HVK | |
| Cinebench R15 / CPU Single 64Bit | |
| Intel NUC11PHKi7C | |
| Intel Hades Canyon NUC8i7HVK | |
| Blender / v2.79 BMW27 CPU | |
| Intel NUC11PHKi7C | |
| Intel Hades Canyon NUC8i7HVK | |
| 7-Zip 18.03 / 7z b 4 -mmt1 | |
| Intel NUC11PHKi7C | |
| Intel Hades Canyon NUC8i7HVK | |
| 7-Zip 18.03 / 7z b 4 | |
| Intel NUC11PHKi7C | |
| Intel Hades Canyon NUC8i7HVK | |
| Geekbench 5.5 / Single-Core | |
| Intel NUC11PHKi7C | |
| Geekbench 5.5 / Multi-Core | |
| Intel NUC11PHKi7C | |
| HWBOT x265 Benchmark v2.2 / 4k Preset | |
| Intel NUC11PHKi7C | |
| Intel Hades Canyon NUC8i7HVK | |
| LibreOffice / 20 Documents To PDF | |
| Intel NUC11PHKi7C | |
| R Benchmark 2.5 / Overall mean | |
| Intel NUC11PHKi7C | |
* ... smaller is better
| 3DMark | |
| 1920x1080 Fire Strike Graphics | |
| Intel NUC11PHKi7C | |
| Intel Hades Canyon NUC8i7HVK | |
| Average Intel Iris Xe Graphics G7 96EUs (2286 - 6624, n=222) | |
| 2560x1440 Time Spy Graphics | |
| Intel NUC11PHKi7C | |
| Intel Hades Canyon NUC8i7HVK | |
| Average Intel Iris Xe Graphics G7 96EUs (707 - 1890, n=218) | |
| 2560x1440 Time Spy Score | |
| Intel NUC11PHKi7C | |
| Intel Hades Canyon NUC8i7HVK | |
| Average Intel Iris Xe Graphics G7 96EUs (789 - 2159, n=215) | |
| 3840x2160 Fire Strike Ultra Graphics | |
| Intel NUC11PHKi7C | |
| Intel Hades Canyon NUC8i7HVK | |
| Average Intel Iris Xe Graphics G7 96EUs (599 - 1458, n=94) | |
| 3DMark 11 | |
| 1280x720 Performance GPU | |
| Intel NUC11PHKi7C | |
| Intel Hades Canyon NUC8i7HVK | |
| Average Intel Iris Xe Graphics G7 96EUs (2867 - 7676, n=209) | |
| 1280x720 Performance Combined | |
| Intel NUC11PHKi7C | |
| Intel Hades Canyon NUC8i7HVK | |
| Average Intel Iris Xe Graphics G7 96EUs (1926 - 7661, n=208) | |
| Final Fantasy XV Benchmark | |
| 1280x720 Lite Quality | |
| Intel NUC11PHKi7C | |
| Intel Hades Canyon NUC8i7HVK | |
| Average Intel Iris Xe Graphics G7 96EUs (14.9 - 56.5, n=189) | |
| 1920x1080 Standard Quality | |
| Intel NUC11PHKi7C | |
| Intel Hades Canyon NUC8i7HVK | |
| Average Intel Iris Xe Graphics G7 96EUs (10.5 - 31.2, n=185) | |
| 1920x1080 High Quality | |
| Intel NUC11PHKi7C | |
| Intel Hades Canyon NUC8i7HVK | |
| Average Intel Iris Xe Graphics G7 96EUs (8.15 - 27.8, n=178) | |
| GTA V | |
| 1024x768 Lowest Settings possible | |
| Intel NUC11PHKi7C | |
| Intel Hades Canyon NUC8i7HVK | |
| Average Intel Iris Xe Graphics G7 96EUs (52 - 166.4, n=168) | |
| 1920x1080 Lowest Settings possible | |
| Intel Hades Canyon NUC8i7HVK | |
| Intel NUC11PHKi7C | |
| Average Intel Iris Xe Graphics G7 96EUs (34.7 - 132.1, n=141) | |
| 1366x768 Normal/Off AF:4x | |
| Intel Hades Canyon NUC8i7HVK | |
| Intel NUC11PHKi7C | |
| Average Intel Iris Xe Graphics G7 96EUs (24.1 - 152.7, n=169) | |
| 1920x1080 Normal/Off AF:4x | |
| Intel Hades Canyon NUC8i7HVK | |
| Intel NUC11PHKi7C | |
| Average Intel Iris Xe Graphics G7 96EUs (20 - 119.3, n=142) | |
| 1920x1080 High/On (Advanced Graphics Off) AA:2xMSAA + FX AF:8x | |
| Intel NUC11PHKi7C | |
| Intel Hades Canyon NUC8i7HVK | |
| Average Intel Iris Xe Graphics G7 96EUs (9.39 - 51.6, n=162) | |
| 1920x1080 Highest AA:4xMSAA + FX AF:16x | |
| Intel NUC11PHKi7C | |
| Intel Hades Canyon NUC8i7HVK | |
| Average Intel Iris Xe Graphics G7 96EUs (4.13 - 22.9, n=156) | |
| Dota 2 Reborn | |
| 1280x720 min (0/3) fastest | |
| Intel NUC11PHKi7C | |
| Intel Hades Canyon NUC8i7HVK | |
| Average Intel Iris Xe Graphics G7 96EUs (36 - 148, n=221) | |
| 1366x768 med (1/3) | |
| Intel NUC11PHKi7C | |
| Intel Hades Canyon NUC8i7HVK | |
| Average Intel Iris Xe Graphics G7 96EUs (31.6 - 108.5, n=221) | |
| 1920x1080 high (2/3) | |
| Intel NUC11PHKi7C | |
| Intel Hades Canyon NUC8i7HVK | |
| Average Intel Iris Xe Graphics G7 96EUs (23.2 - 88.1, n=221) | |
| 1920x1080 ultra (3/3) best looking | |
| Intel NUC11PHKi7C | |
| Intel Hades Canyon NUC8i7HVK | |
| Average Intel Iris Xe Graphics G7 96EUs (20.6 - 78.5, n=221) | |
| The Witcher 3 | |
| 1024x768 Low Graphics & Postprocessing | |
| Intel NUC11PHKi7C | |
| Intel Hades Canyon NUC8i7HVK | |
| Average Intel Iris Xe Graphics G7 96EUs (28.9 - 117.2, n=188) | |
| 1366x768 Medium Graphics & Postprocessing | |
| Intel NUC11PHKi7C | |
| Intel Hades Canyon NUC8i7HVK | |
| Average Intel Iris Xe Graphics G7 96EUs (21.4 - 77.8, n=185) | |
| 1920x1080 High Graphics & Postprocessing (Nvidia HairWorks Off) | |
| Intel NUC11PHKi7C | |
| Intel Hades Canyon NUC8i7HVK | |
| Average Intel Iris Xe Graphics G7 96EUs (10.6 - 45.9, n=191) | |
| 1920x1080 Ultra Graphics & Postprocessing (HBAO+) | |
| Intel NUC11PHKi7C | |
| Intel Hades Canyon NUC8i7HVK | |
| Average Intel Iris Xe Graphics G7 96EUs (8.79 - 20.1, n=181) | |
| X-Plane 11.11 | |
| 1280x720 low (fps_test=1) | |
| Intel NUC11PHKi7C | |
| Intel Hades Canyon NUC8i7HVK | |
| Average Intel Iris Xe Graphics G7 96EUs (13.4 - 88.4, n=213) | |
| 1920x1080 med (fps_test=2) | |
| Intel NUC11PHKi7C | |
| Intel Hades Canyon NUC8i7HVK | |
| Average Intel Iris Xe Graphics G7 96EUs (11.6 - 69.5, n=214) | |
| 1920x1080 high (fps_test=3) | |
| Intel NUC11PHKi7C | |
| Intel Hades Canyon NUC8i7HVK | |
| Average Intel Iris Xe Graphics G7 96EUs (11.1 - 59.8, n=213) | |
| Strange Brigade | |
| 1280x720 lowest AF:1 | |
| Intel NUC11PHKi7C | |
| Intel Hades Canyon NUC8i7HVK | |
| Average Intel Iris Xe Graphics G7 96EUs (48.5 - 115.1, n=172) | |
| 1920x1080 medium AA:medium AF:4 | |
| Intel NUC11PHKi7C | |
| Intel Hades Canyon NUC8i7HVK | |
| Average Intel Iris Xe Graphics G7 96EUs (18.2 - 51.4, n=170) | |
| 1920x1080 high AA:high AF:8 | |
| Intel NUC11PHKi7C | |
| Intel Hades Canyon NUC8i7HVK | |
| Average Intel Iris Xe Graphics G7 96EUs (15.4 - 39.8, n=169) | |
| 1920x1080 ultra AA:ultra AF:16 | |
| Intel NUC11PHKi7C | |
| Intel Hades Canyon NUC8i7HVK | |
| Average Intel Iris Xe Graphics G7 96EUs (13.2 - 31.7, n=167) | |
| Networking | |
| iperf3 transmit AX12 | |
| Intel NUC11PHKi7C | |
| Intel Hades Canyon NUC8i7HVK | |
| iperf3 receive AX12 | |
| Intel NUC11PHKi7C | |
| Intel Hades Canyon NUC8i7HVK | |
| SD Card Reader | |
| average JPG Copy Test (av. of 3 runs) | |
| Intel NUC11PHKi7C (Toshiba Exceria Pro SDXC 64 GB UHS-II) | |
| Intel Hades Canyon NUC8i7HVK (Toshiba Exceria Pro SDXC 64 GB UHS-II) | |
| maximum AS SSD Seq Read Test (1GB) | |
| Intel NUC11PHKi7C (Toshiba Exceria Pro SDXC 64 GB UHS-II) | |
| Intel Hades Canyon NUC8i7HVK (Toshiba Exceria Pro SDXC 64 GB UHS-II) | |
| Intel NUC11PHKi7C GeForce RTX 2060 Mobile, i7-1165G7, Samsung SSD 980 Pro 500GB MZ-V8P500BW | Intel Hades Canyon NUC8i7HVK Vega M GH, i7-8809G, Intel Optane 120 GB SSDPEK1W120GA | |
|---|---|---|
| Noise | -10% | |
| off / environment * (dB) | 24.5 | 28.7 -17% |
| Idle Minimum * (dB) | 25.3 | 29 -15% |
| Idle Average * (dB) | 25.3 | 29 -15% |
| Idle Maximum * (dB) | 25.3 | 29 -15% |
| Load Average * (dB) | 36.4 | 36 1% |
| Witcher 3 ultra * (dB) | 39.7 | 42 -6% |
| Load Maximum * (dB) | 47.9 | 49.4 -3% |
* ... smaller is better
| Intel NUC11PHKi7C i7-1165G7, GeForce RTX 2060 Mobile, Samsung SSD 980 Pro 500GB MZ-V8P500BW, , x, | Intel Hades Canyon NUC8i7HVK i7-8809G, Vega M GH, Intel Optane 120 GB SSDPEK1W120GA, , x, | |
|---|---|---|
| Power Consumption | -40% | |
| Idle Minimum * (Watt) | 5.8 | 15.5 -167% |
| Idle Average * (Watt) | 5.9 | 16.2 -175% |
| Idle Maximum * (Watt) | 20.7 | 16.5 20% |
| Load Average * (Watt) | 130.8 | 83.4 36% |
| Witcher 3 ultra * (Watt) | 154.4 | 121.7 21% |
| Load Maximum * (Watt) | 225.2 | 173.5 23% |
* ... smaller is better

Price comparison
