Intel NUC11TNKi5 Pro Mini Tiger Canyon Review: Smallest Tiger Lake NUC

The NUC 11 family consists of three broad models: the NUC 11 Pro Mini (NUC11TNK), NUC 11 Performance (NUC11PAQ), and the GeForce RTX-powered NUC 11 Enthusiast (NUC11PHK). Each model is visually distinct with the Pro Mini being the smallest of the bunch.
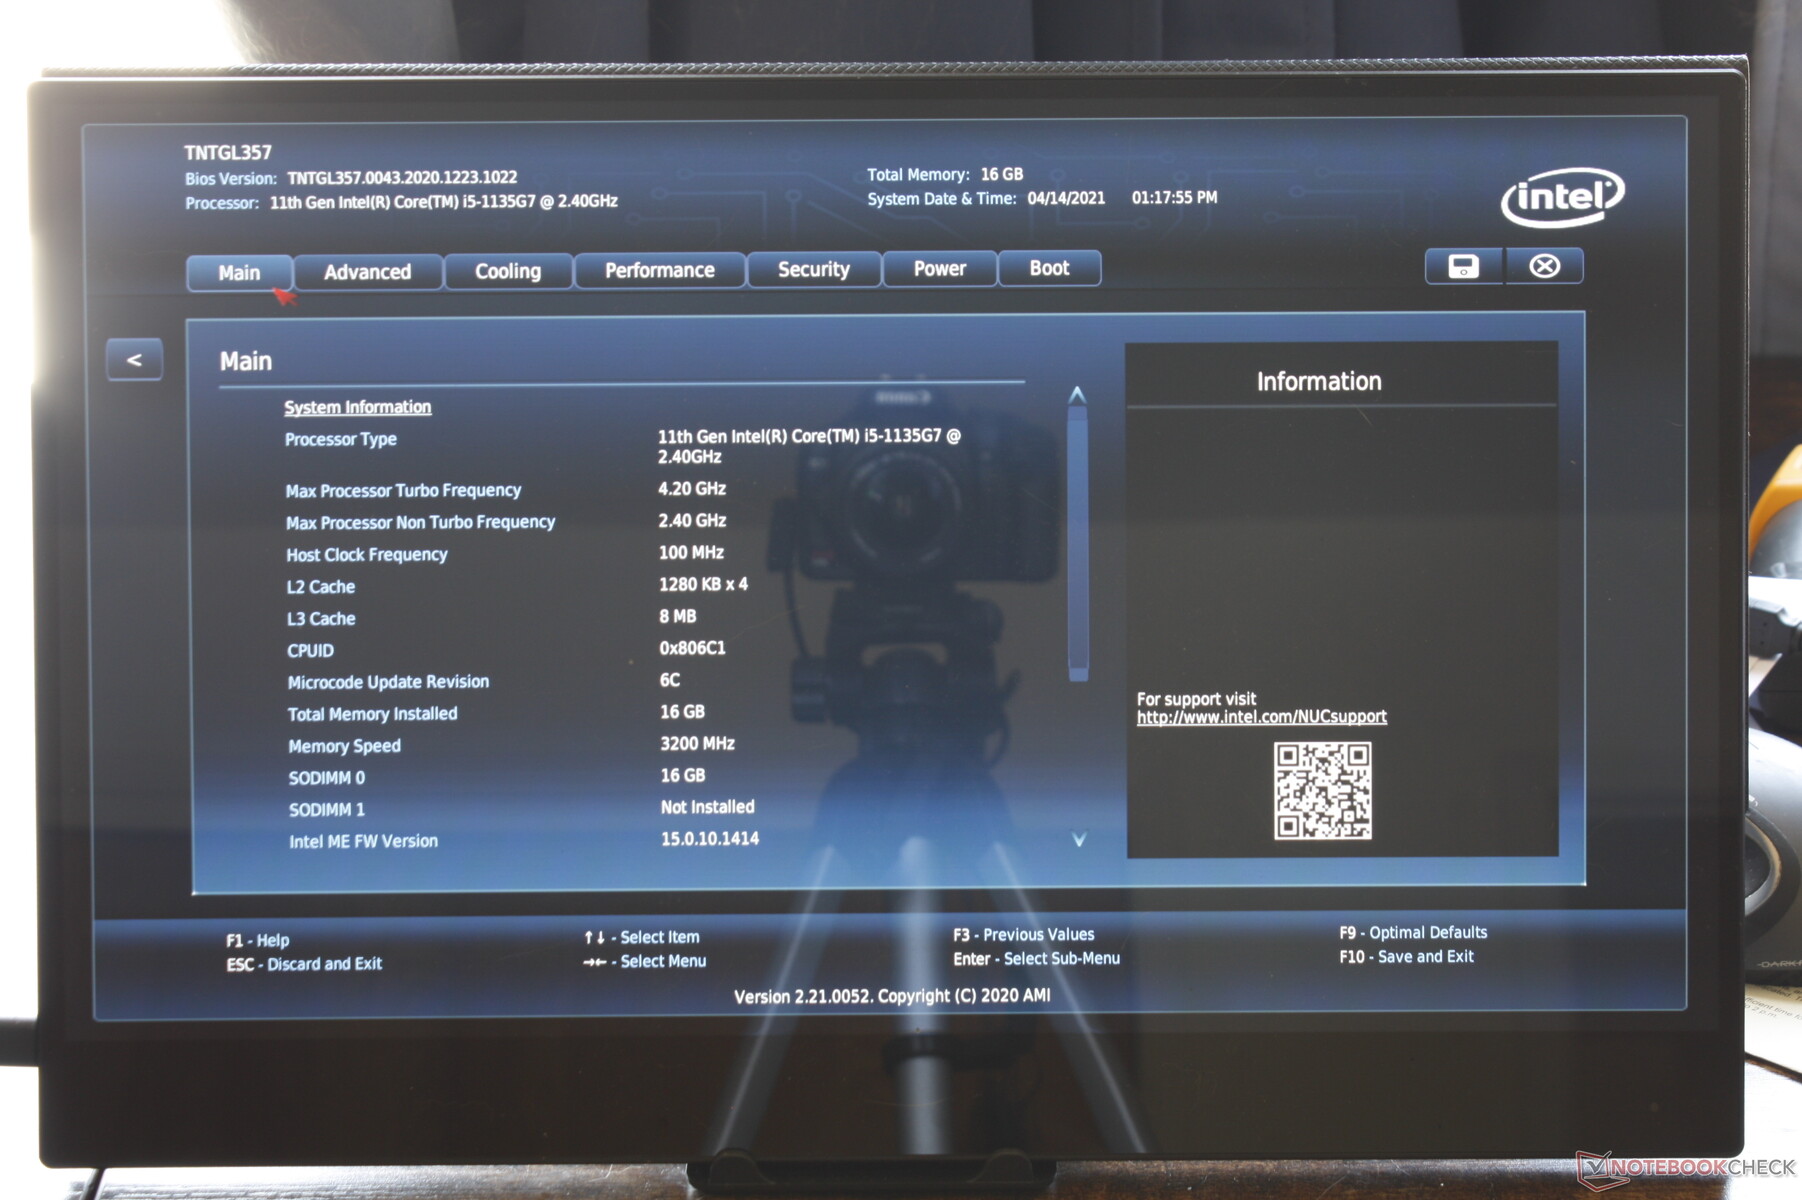
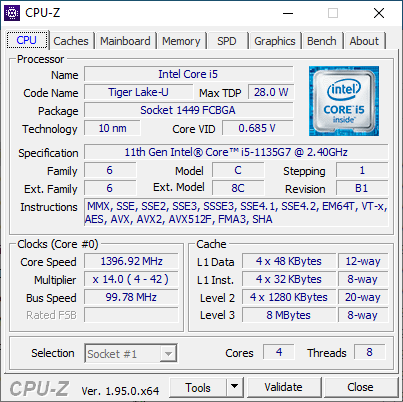
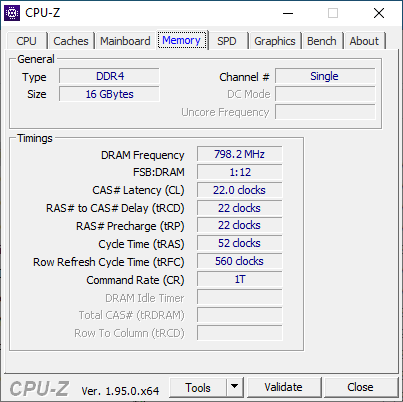
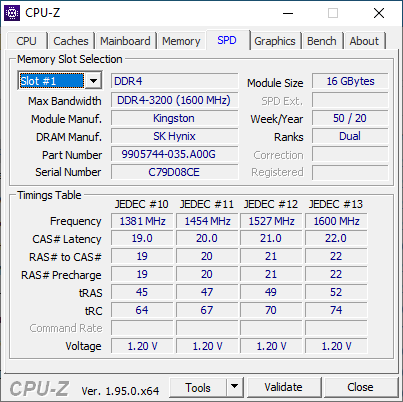
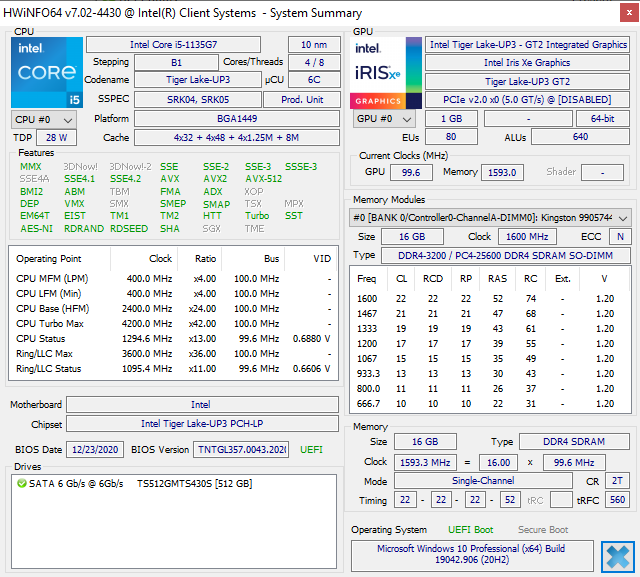
The unit we're testing here is the NUC 11 Pro Mini with our review on the Enthusiast model in the coming weeks. While Core i3, Core i7, dual-channel RAM, and NVMe SSDs options are available, Intel has configured ours with the Core i5-1135G7 CPU, 16 GB of single-channel RAM, and a 512 GB M.2 SATA III SSD.
Competitors to the Intel NUC series have been steadily growing over the years. Alternatives include the Zotac ZBox, Beelink SEi10, GMK NucBox 2, and the Lenovo ThinkCentre Nano.
More Intel NUC reviews:
potential competitors in comparison
Rating | Date | Model | Weight | Height | Size | Resolution | Price |
|---|---|---|---|---|---|---|---|
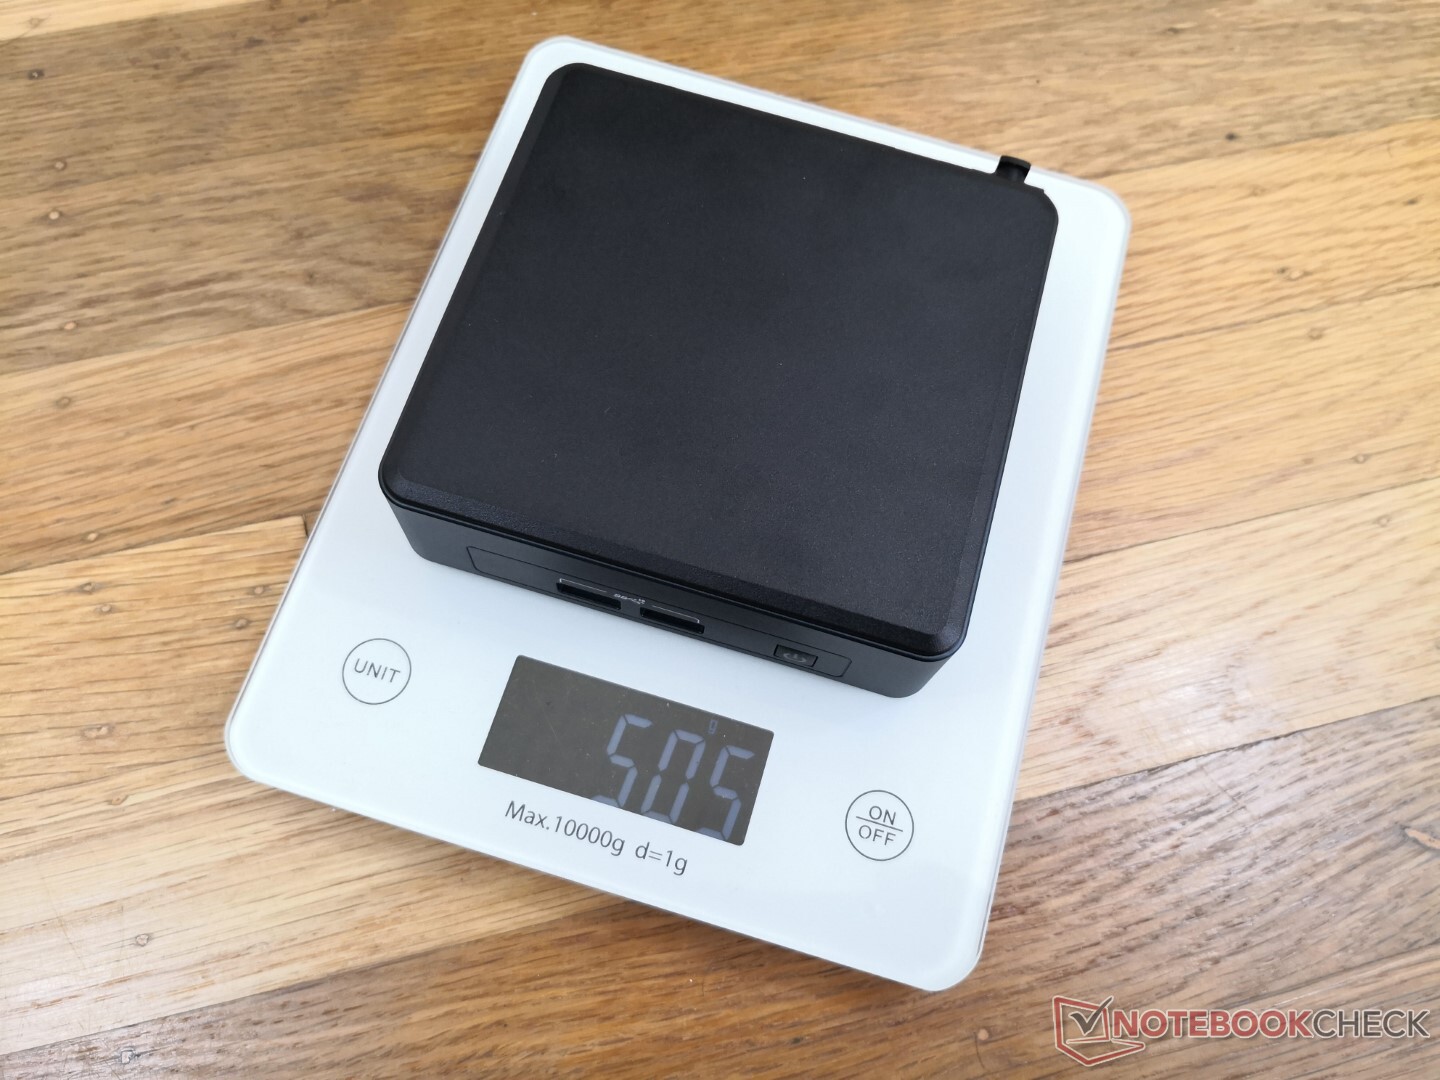
v (old) | 04 / 2021 | Intel NUC11TNKi5 i5-1135G7, Iris Xe G7 80EUs | 504 g | 37 mm | x | ||
v (old) | 03 / 2021 | GMK NucBox 2 i5-8259U, Iris Plus Graphics 655 | 430 g | 50 mm | x | ||
v (old) | 02 / 2021 | Intel NUC11PAQi7 i7-1165G7, Iris Xe G7 96EUs | 647 g | 56 mm | x | ||
v (old) | 02 / 2020 | Intel NUC10i5FNK i5-10210U, UHD Graphics 620 | 493 g | 36 mm | 0.00" | 0x0 | |
v (old) | 12 / 2020 | Beelink SEi10 i3-1005G1, UHD Graphics G1 (Ice Lake 32 EU) | 350 g | 41 mm | x | ||
v (old) | 10 / 2020 | Zotac ZBOX MI642 Nano i5-10210U, UHD Graphics 620 | 472 g | 51 mm | x |
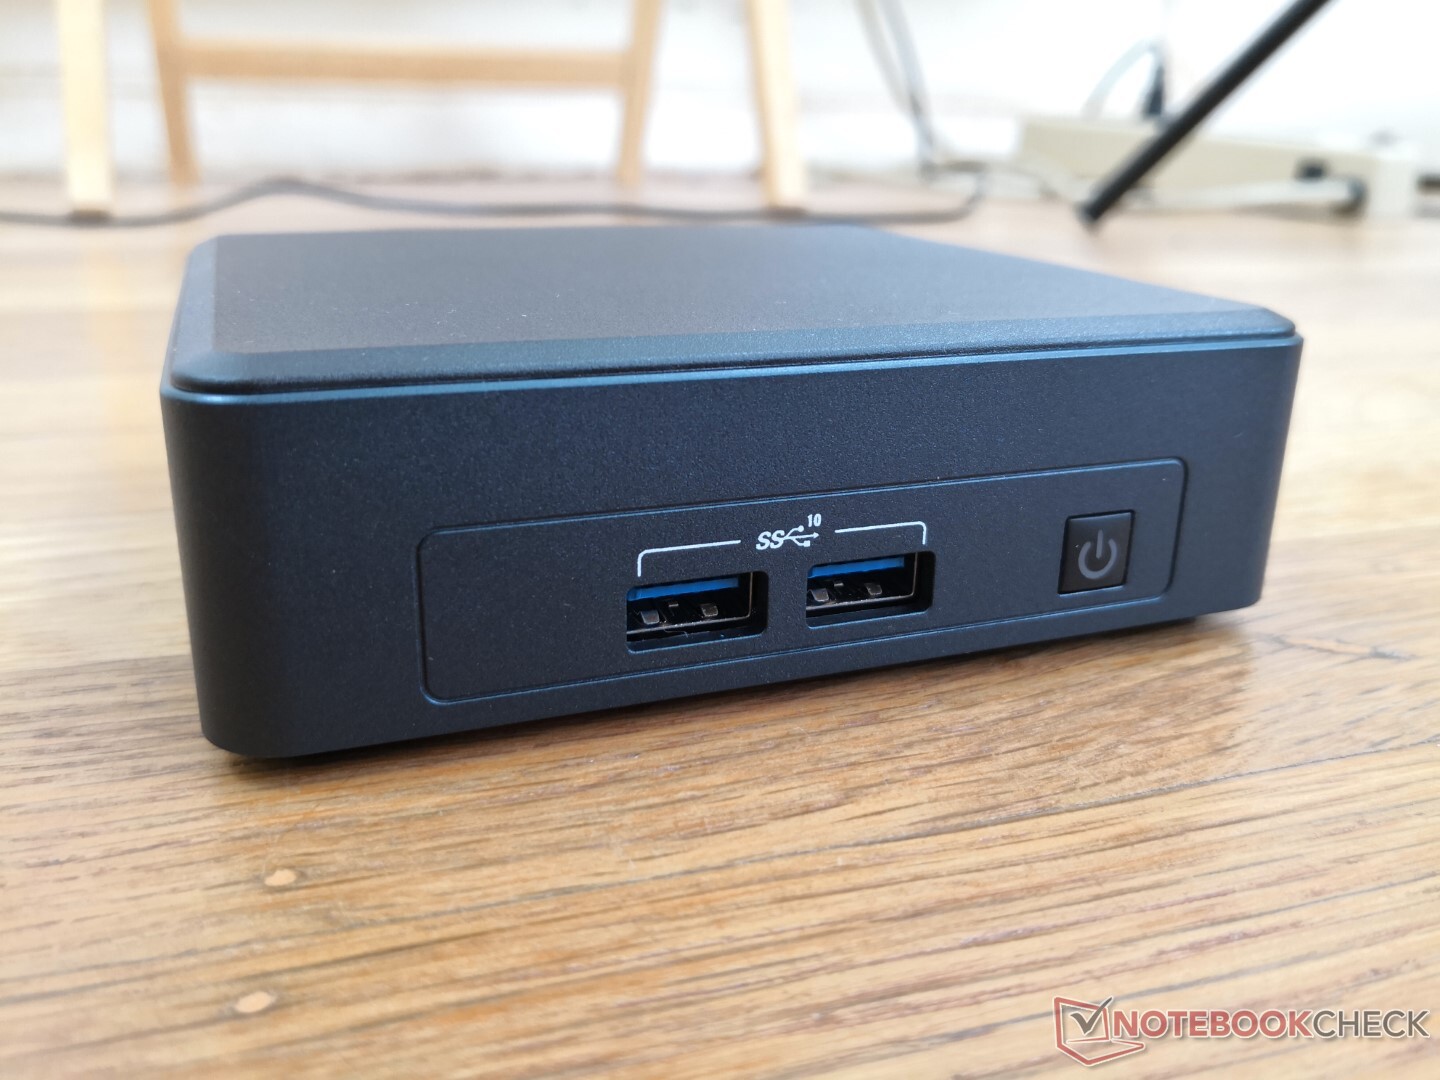
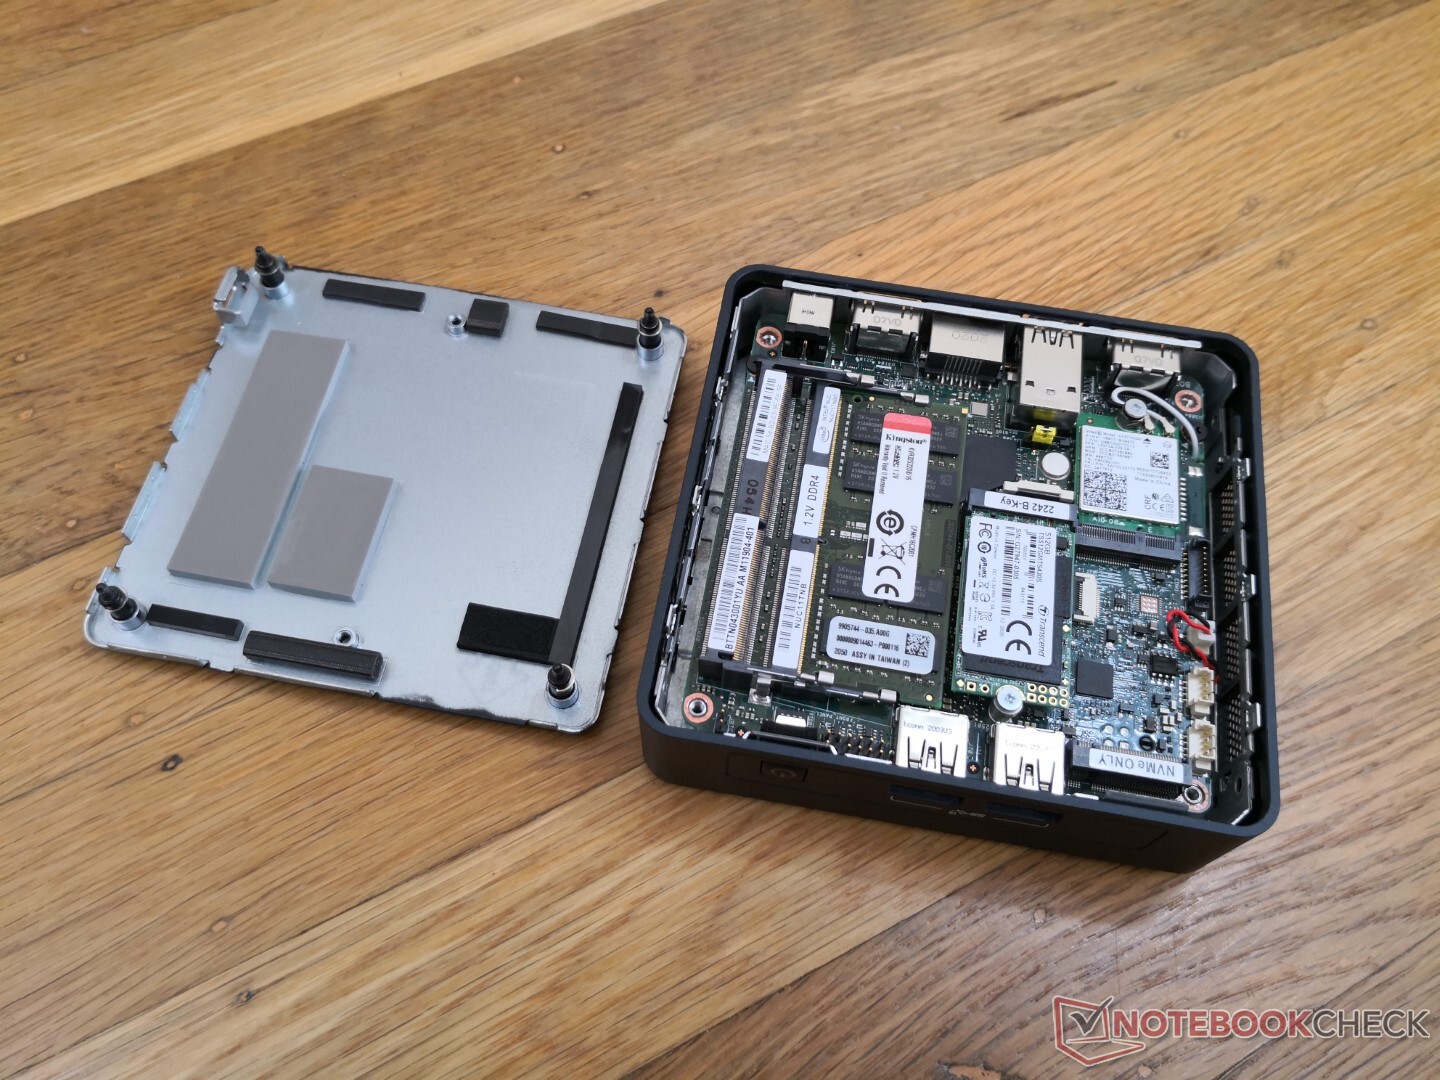
Case
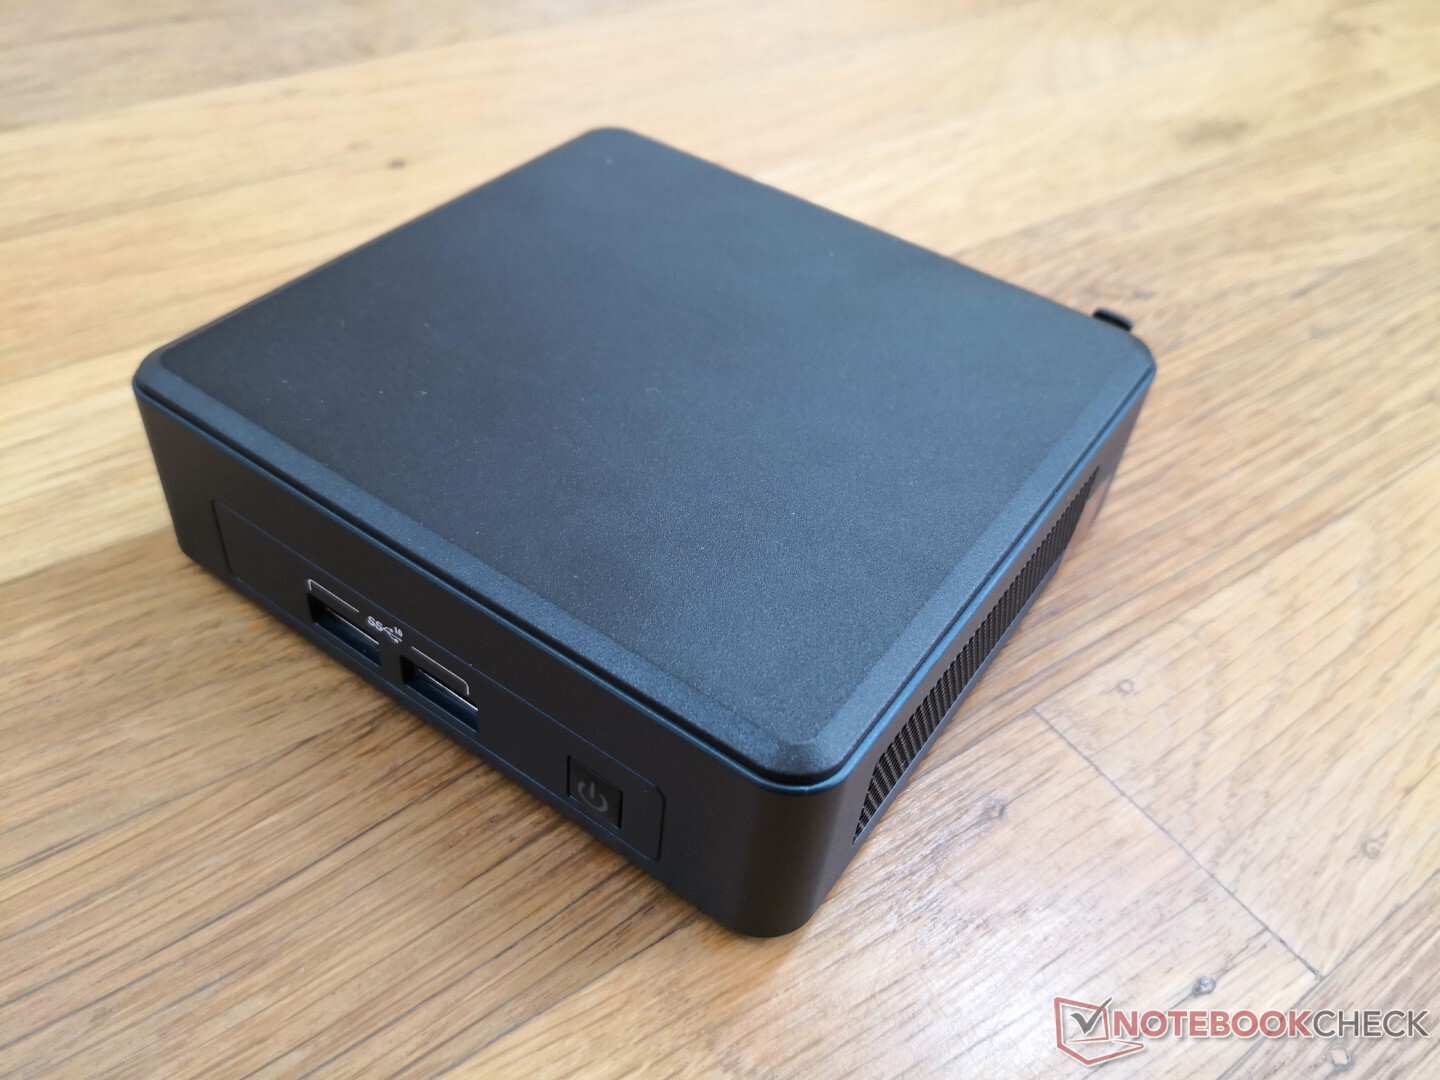
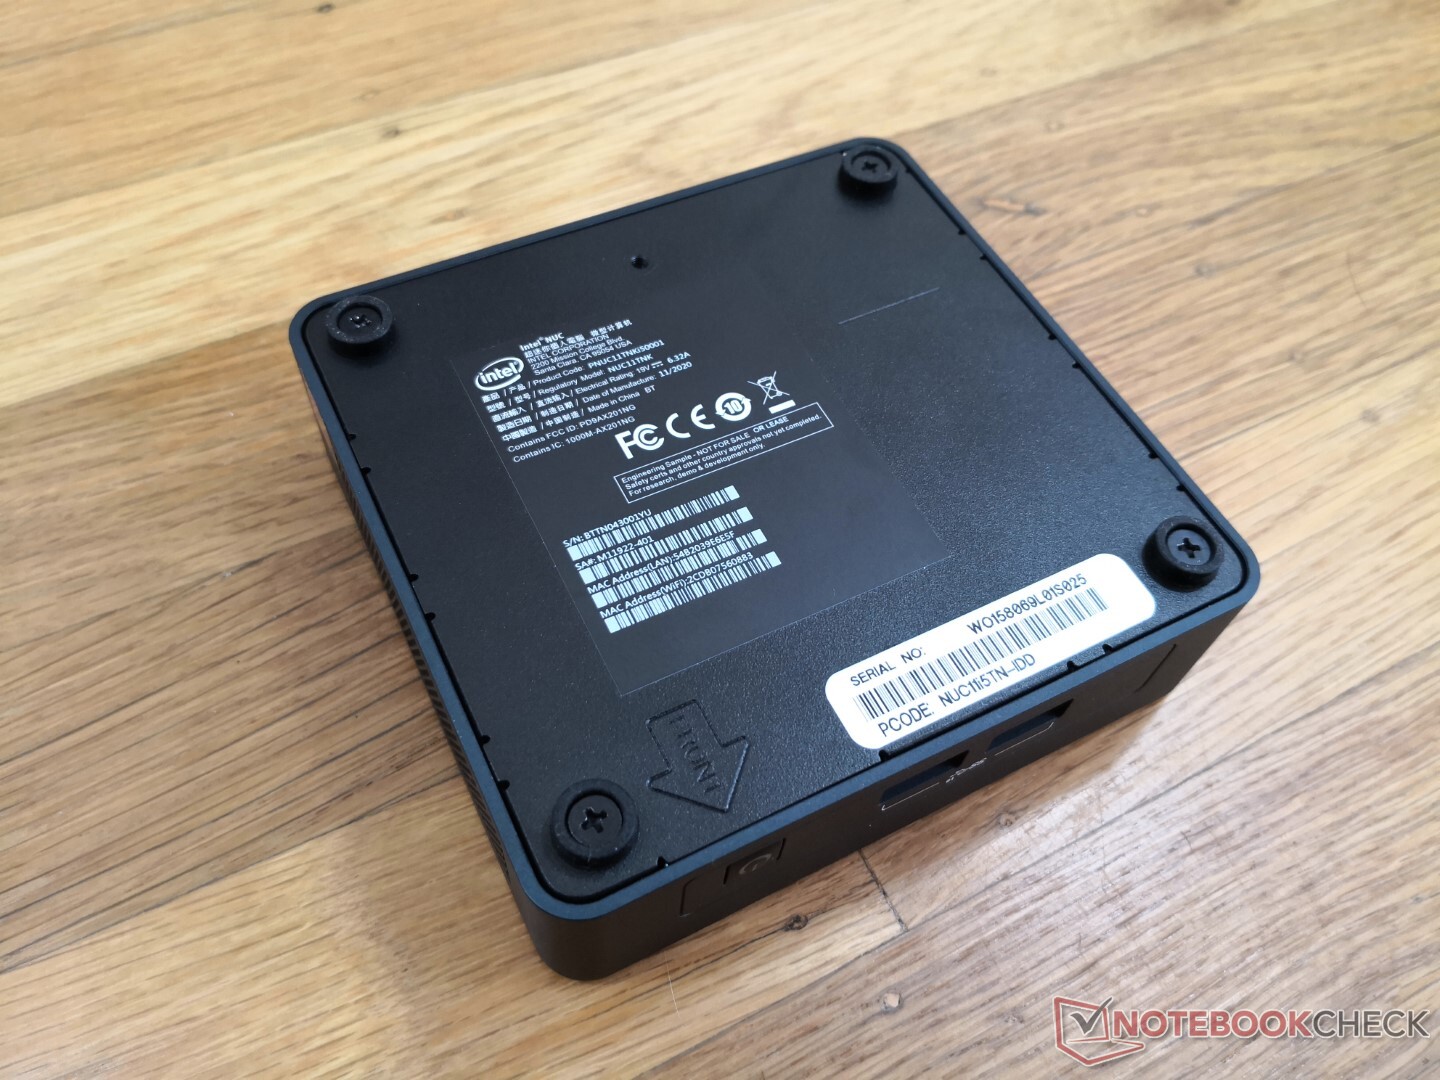
Length and width are identical to the NUC 11 Performance while height is 19 mm shorter. The top plastic plate is now matte and slightly roughened unlike the smooth and glossy plates on older NUCs likely to reduce unsightly fingerprint buildup and scratches.
As with other Intel NUCs, an inner metal rollcage is present for improved rigidity and quality at the cost of added weight. This continues to be a distinguishing feature of the NUC when compared to most other mini PCs.
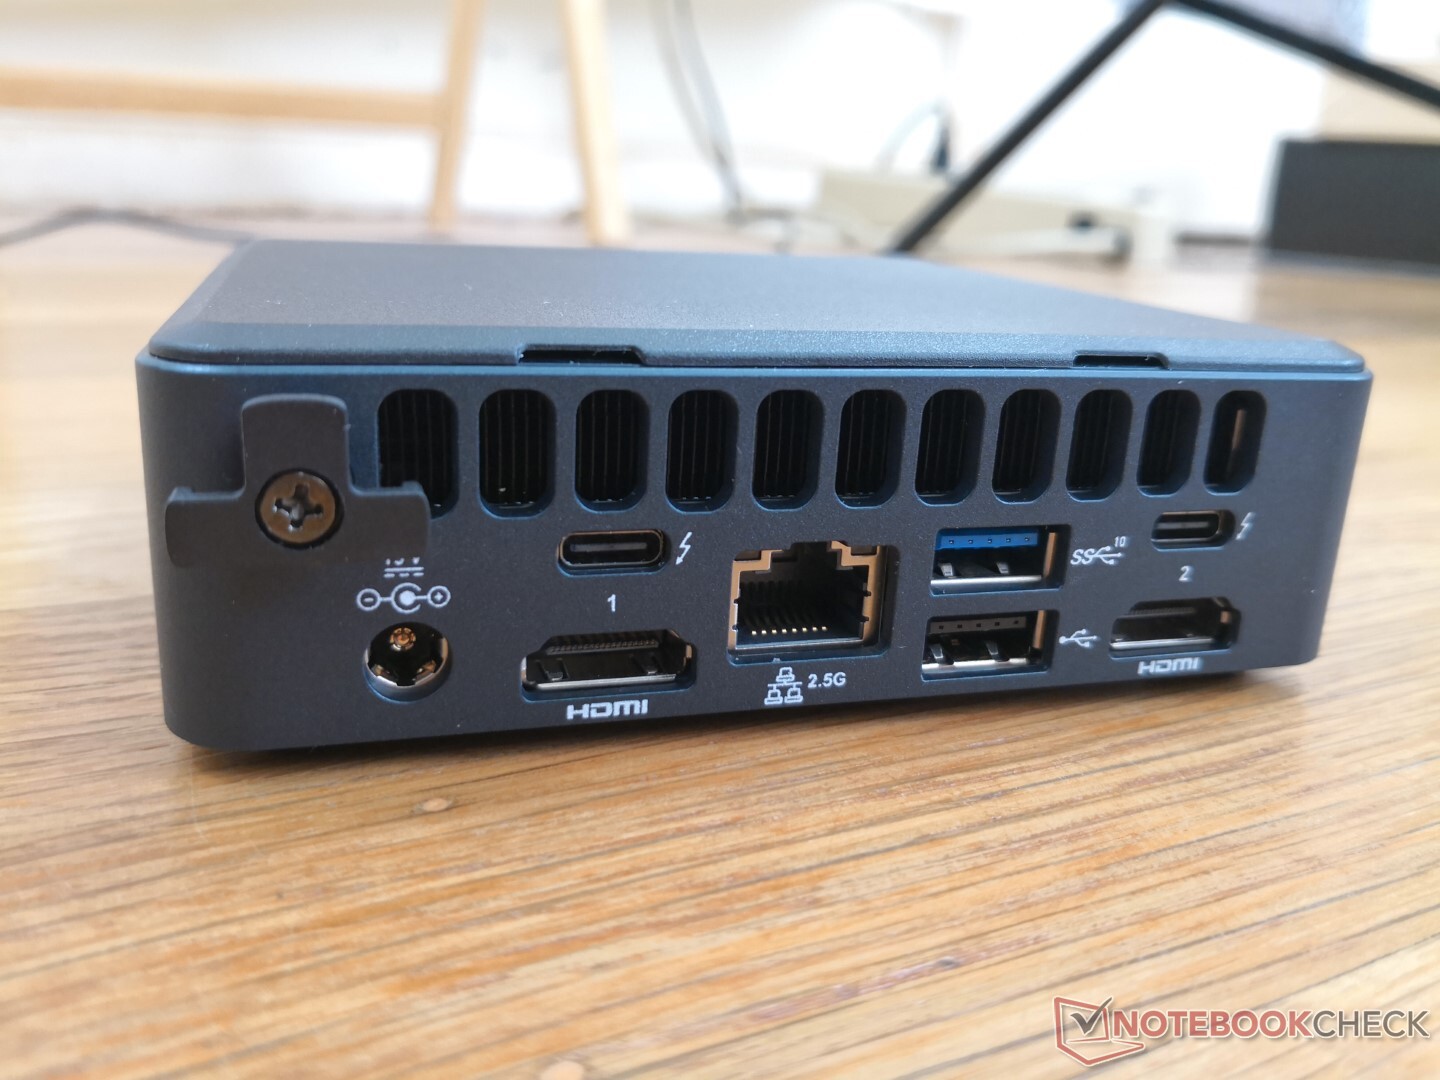
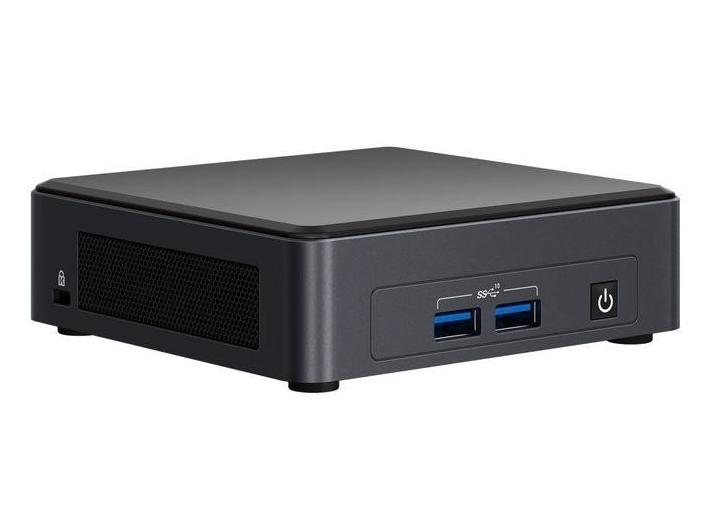
Connectivity
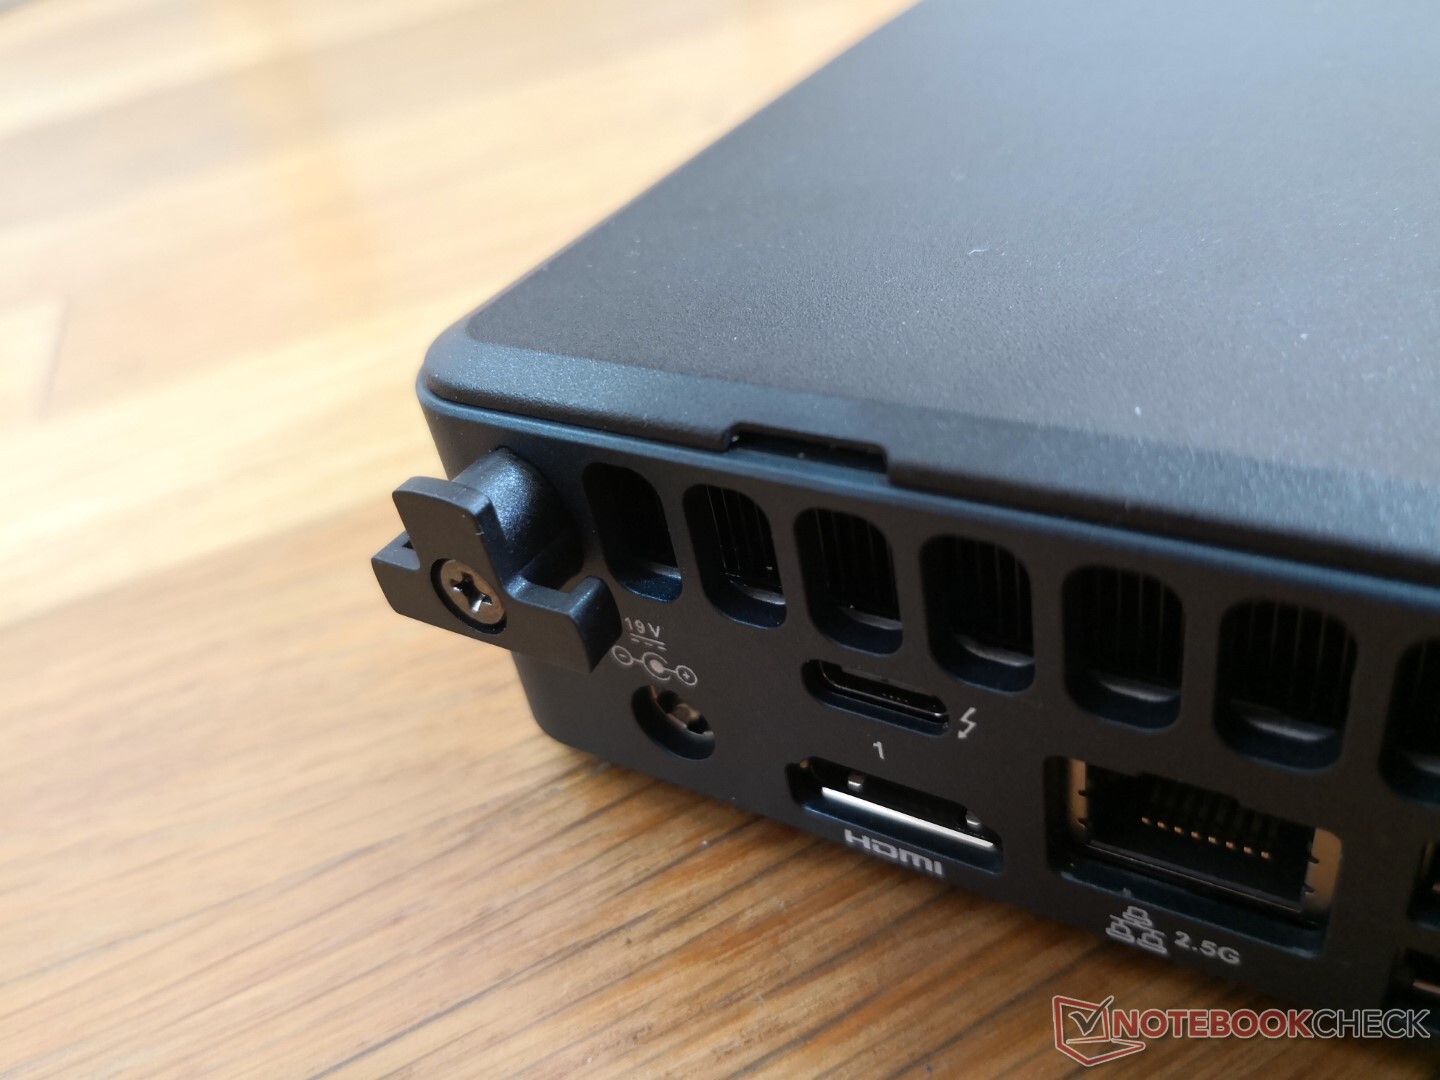
Almost all ports are tightly packed along the rear including the one Thunderbolt 3 port and one Thunderbolt 4 port. Unfortunately, the NUC cannot be powered by USB-C AC adapters and so owners must use the included proprietary AC barrel port.
Communication
| Networking | |
| iperf3 transmit AX12 | |
| Intel NUC11TNKi5 | |
| Beelink SEi10 | |
| Intel NUC11PAQi7 | |
| GMK NucBox 2 | |
| iperf3 receive AX12 | |
| Intel NUC11TNKi5 | |
| Beelink SEi10 | |
| Intel NUC11PAQi7 | |
| GMK NucBox 2 | |
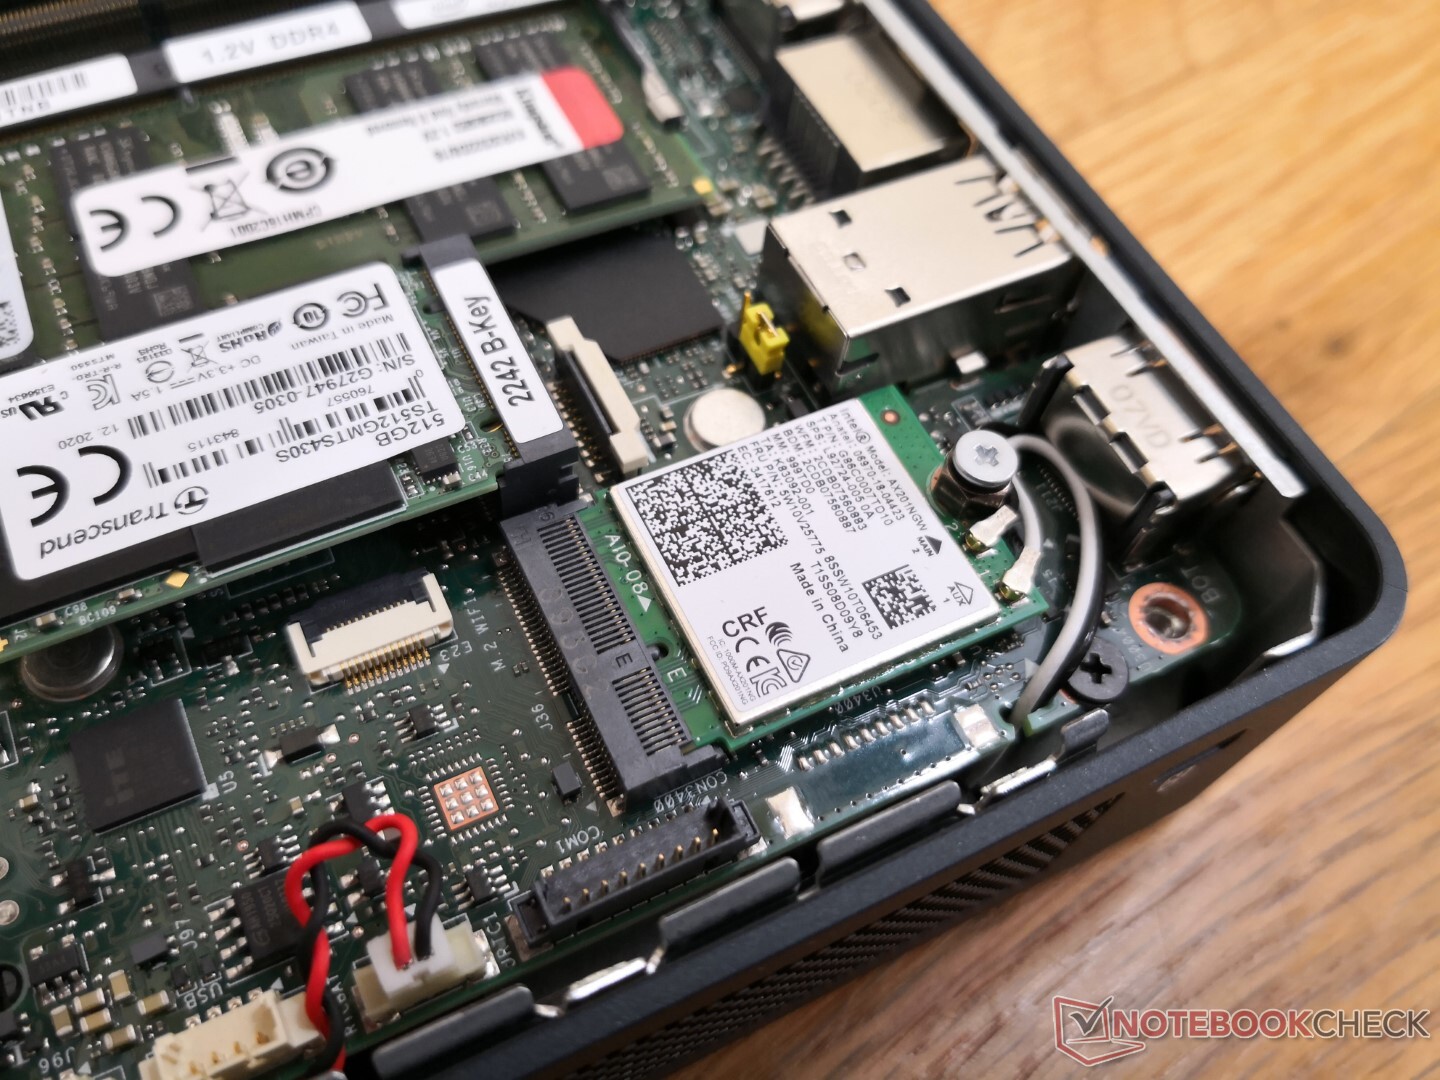
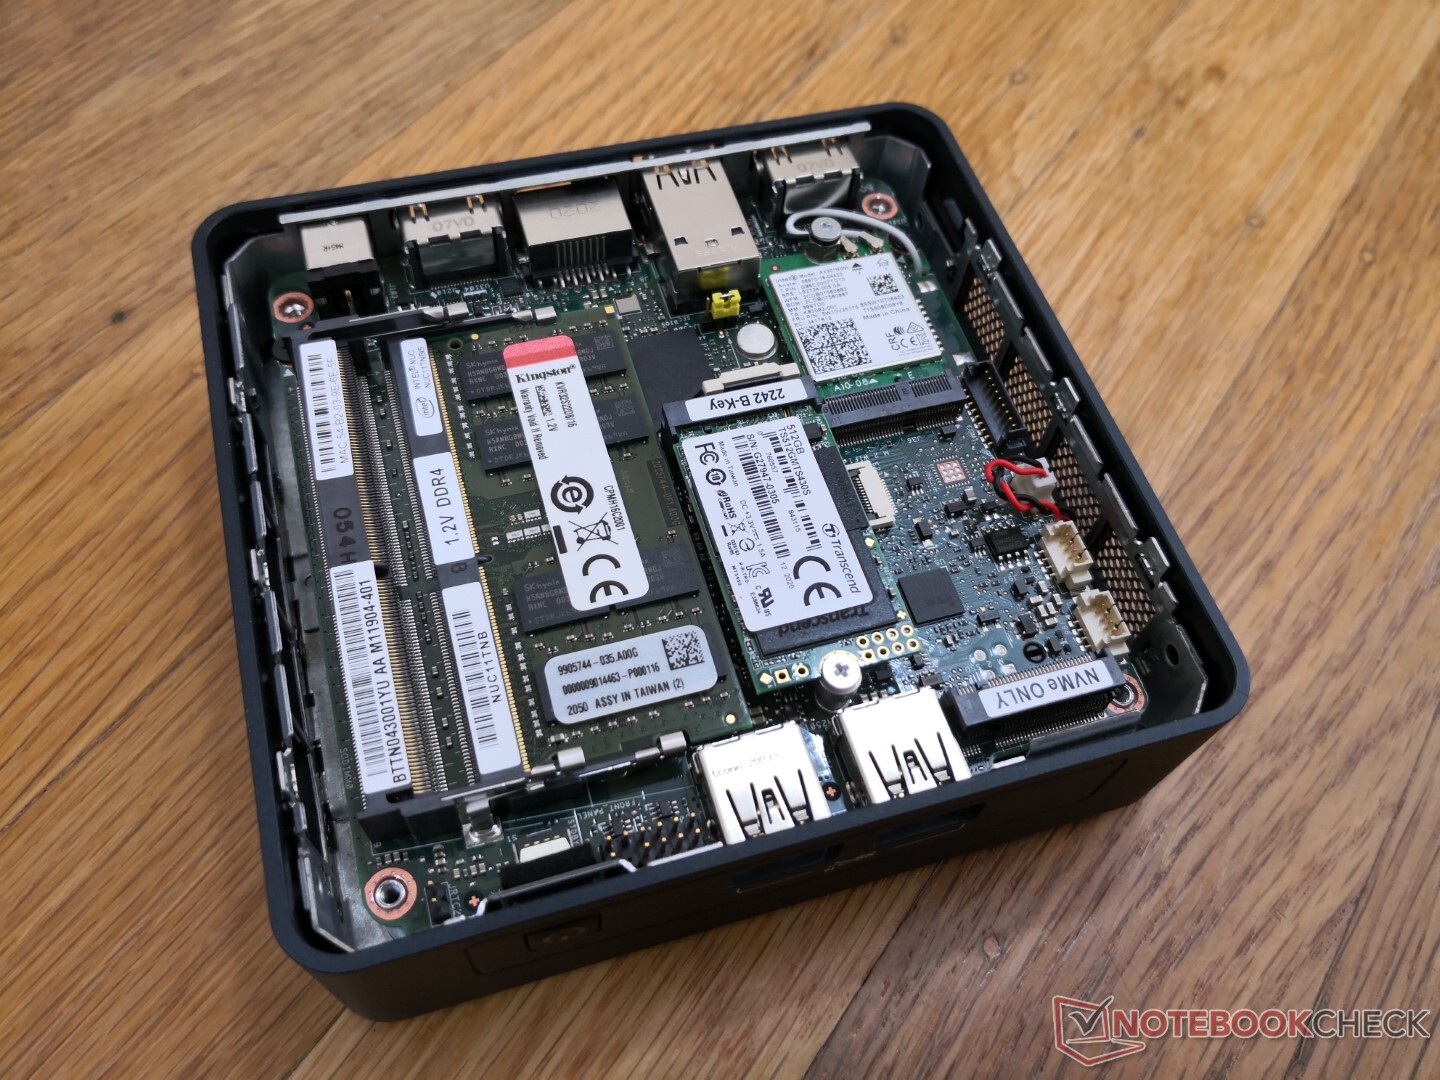
Maintenance
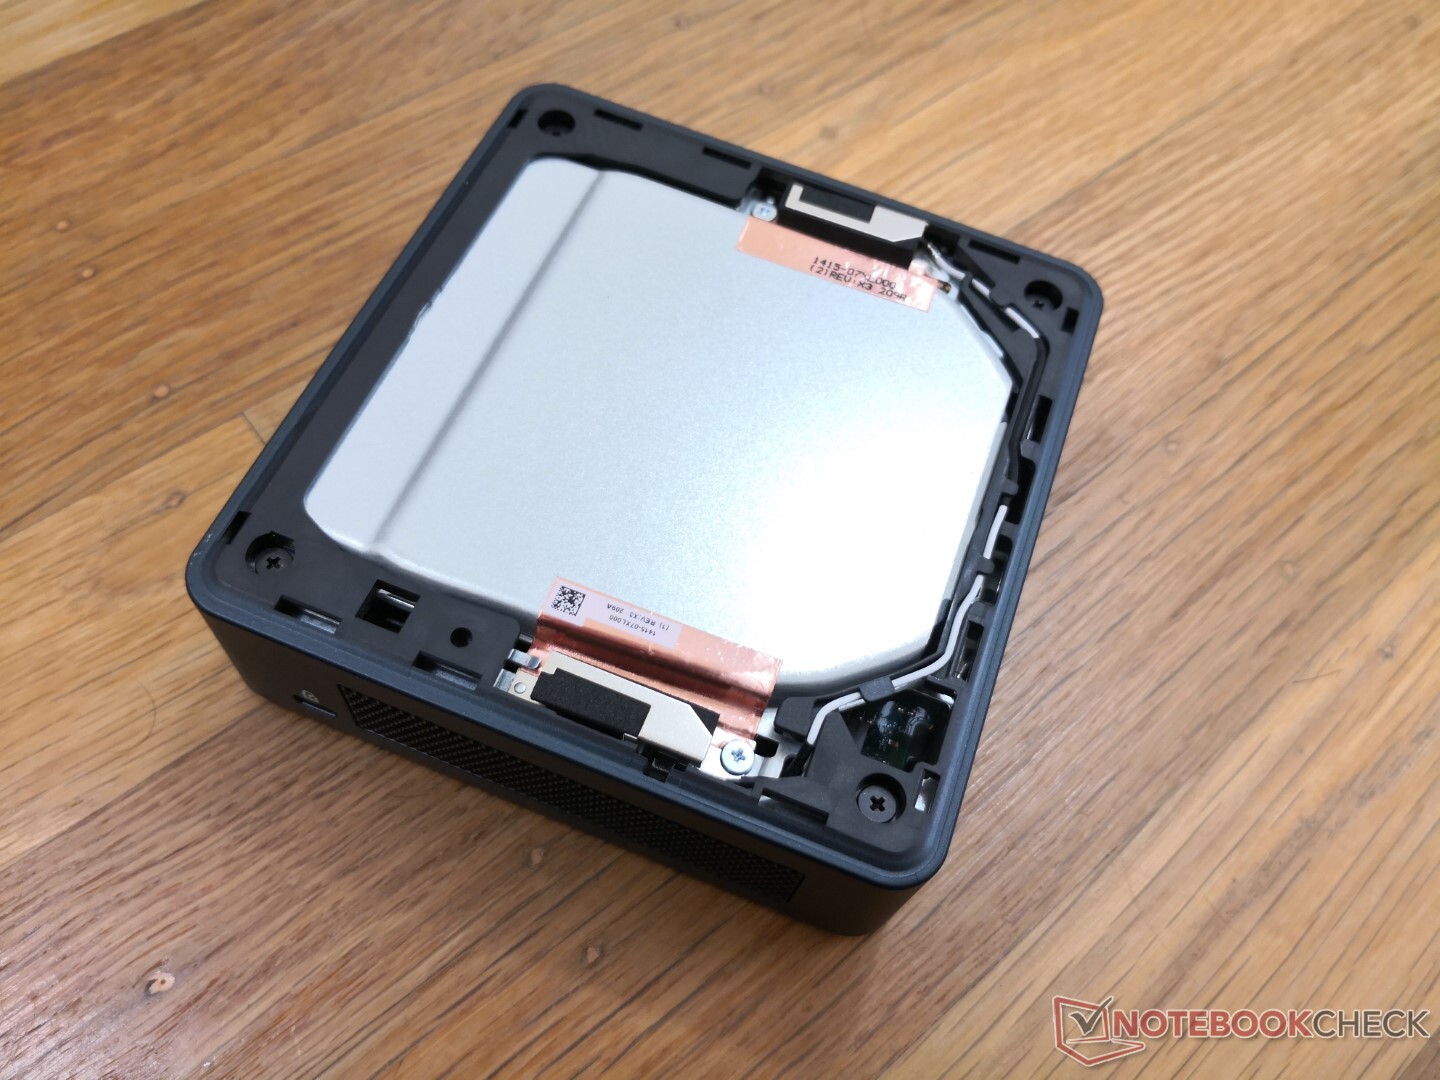
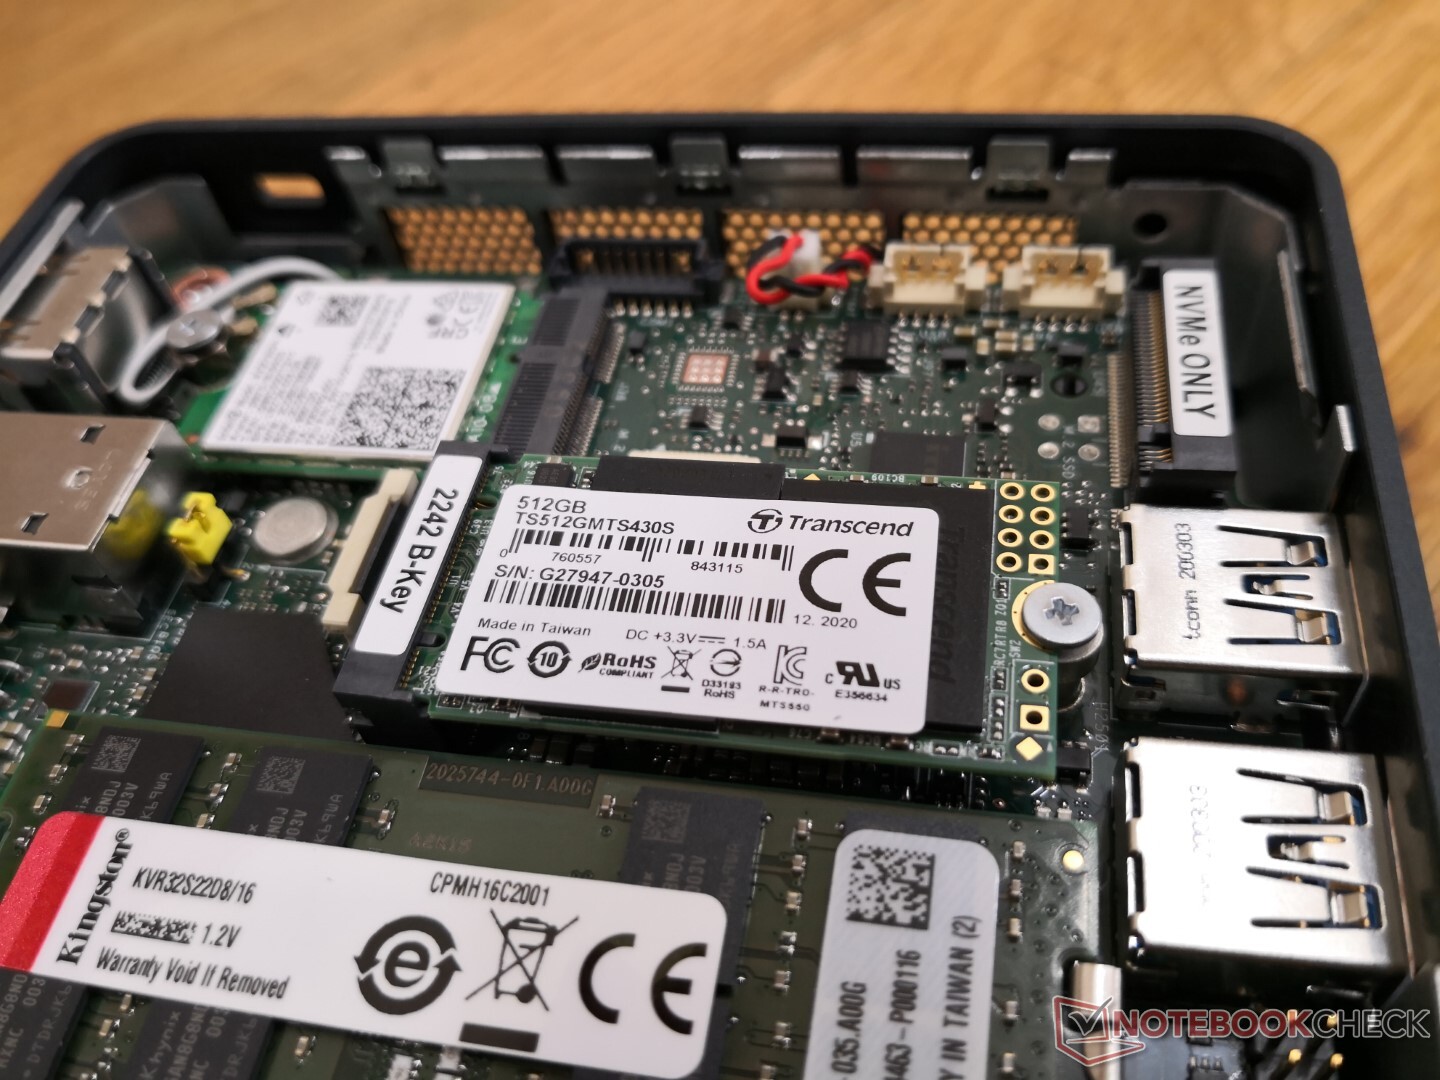
The bottom panel comes off easily to expose upgradeable components: 2x SODIMM, 2x M.2 storage (M.2 2242 SATA III, M.2 2280 PCIe 4), and the removable WLAN module. The longer M.2 2280 SSD would sit on top of the WLAN module.
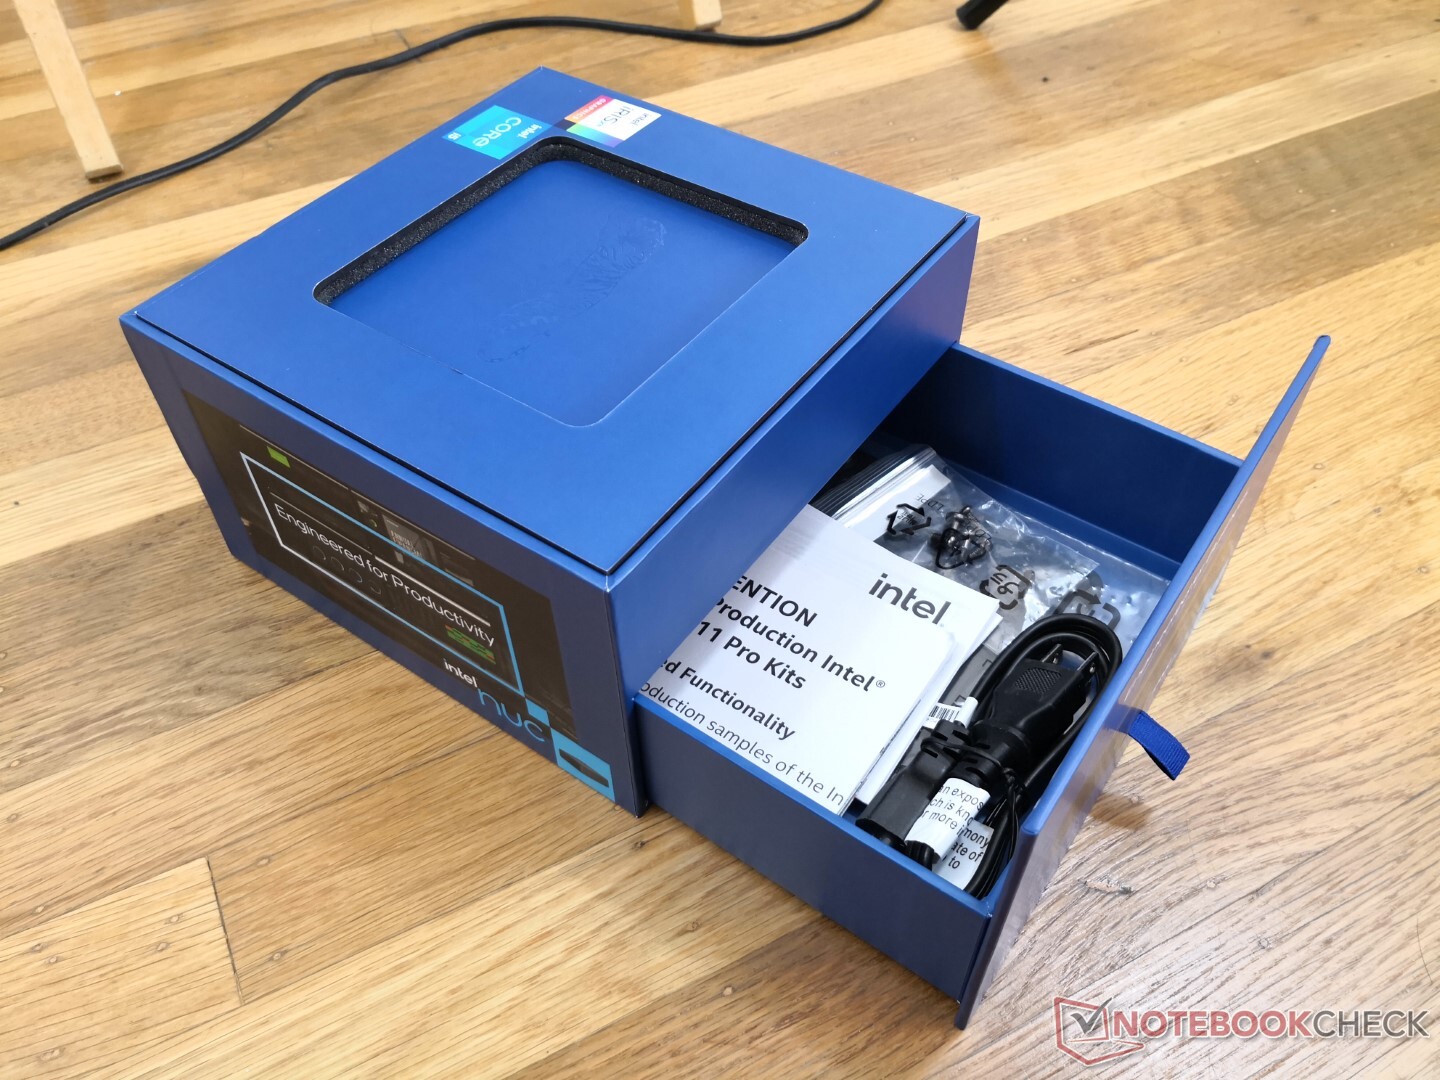
Accessories and Warranty
The retail box includes a removable VESA mounting bracket and additional screws. A three-year limited manufacturer warranty comes standard which is two years longer than most other mini PCs.
Performance
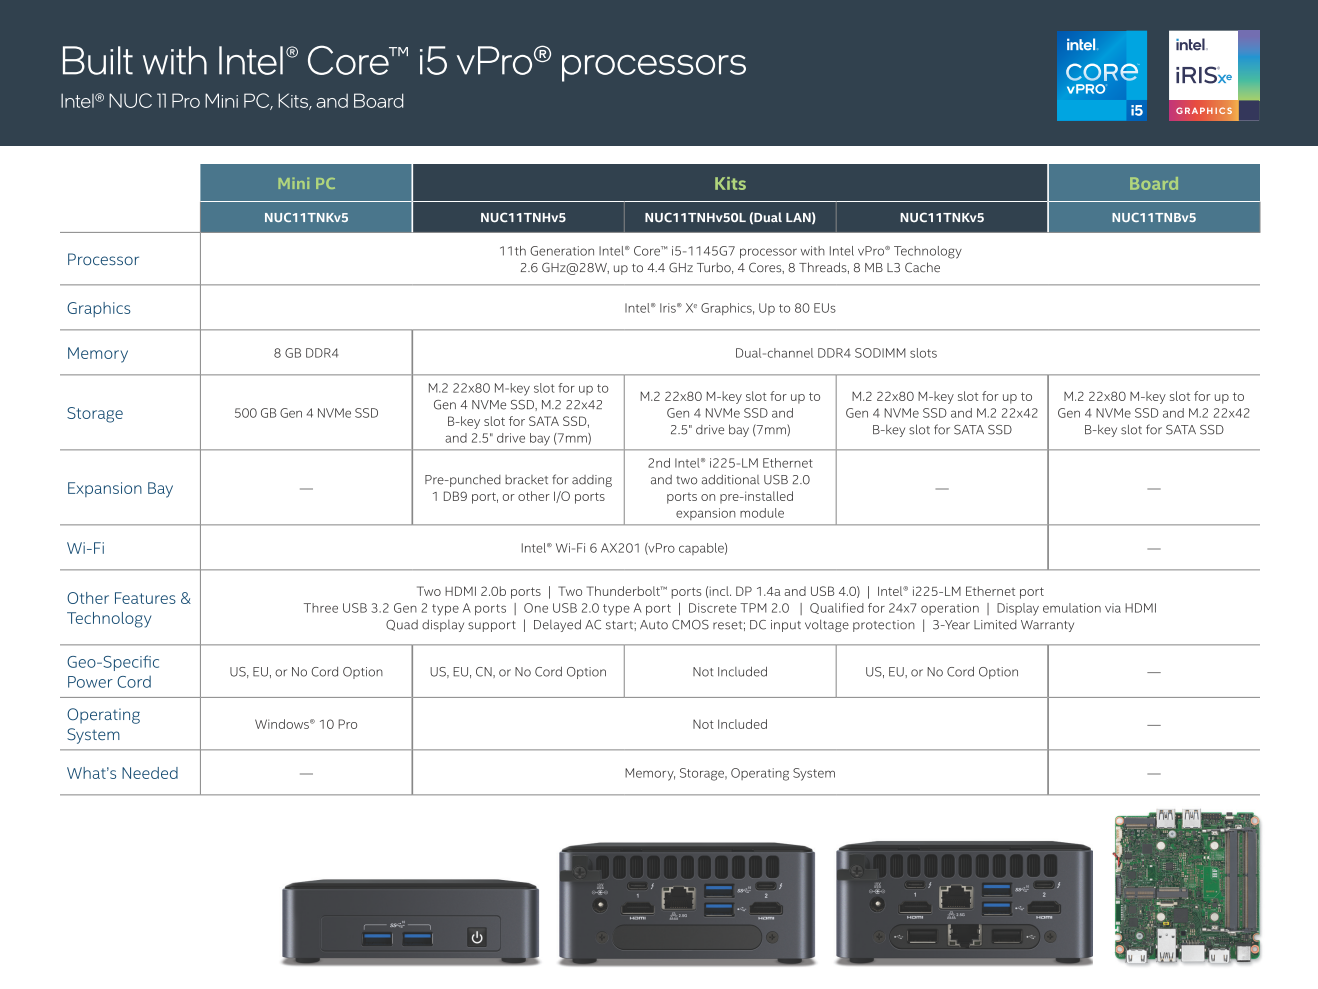
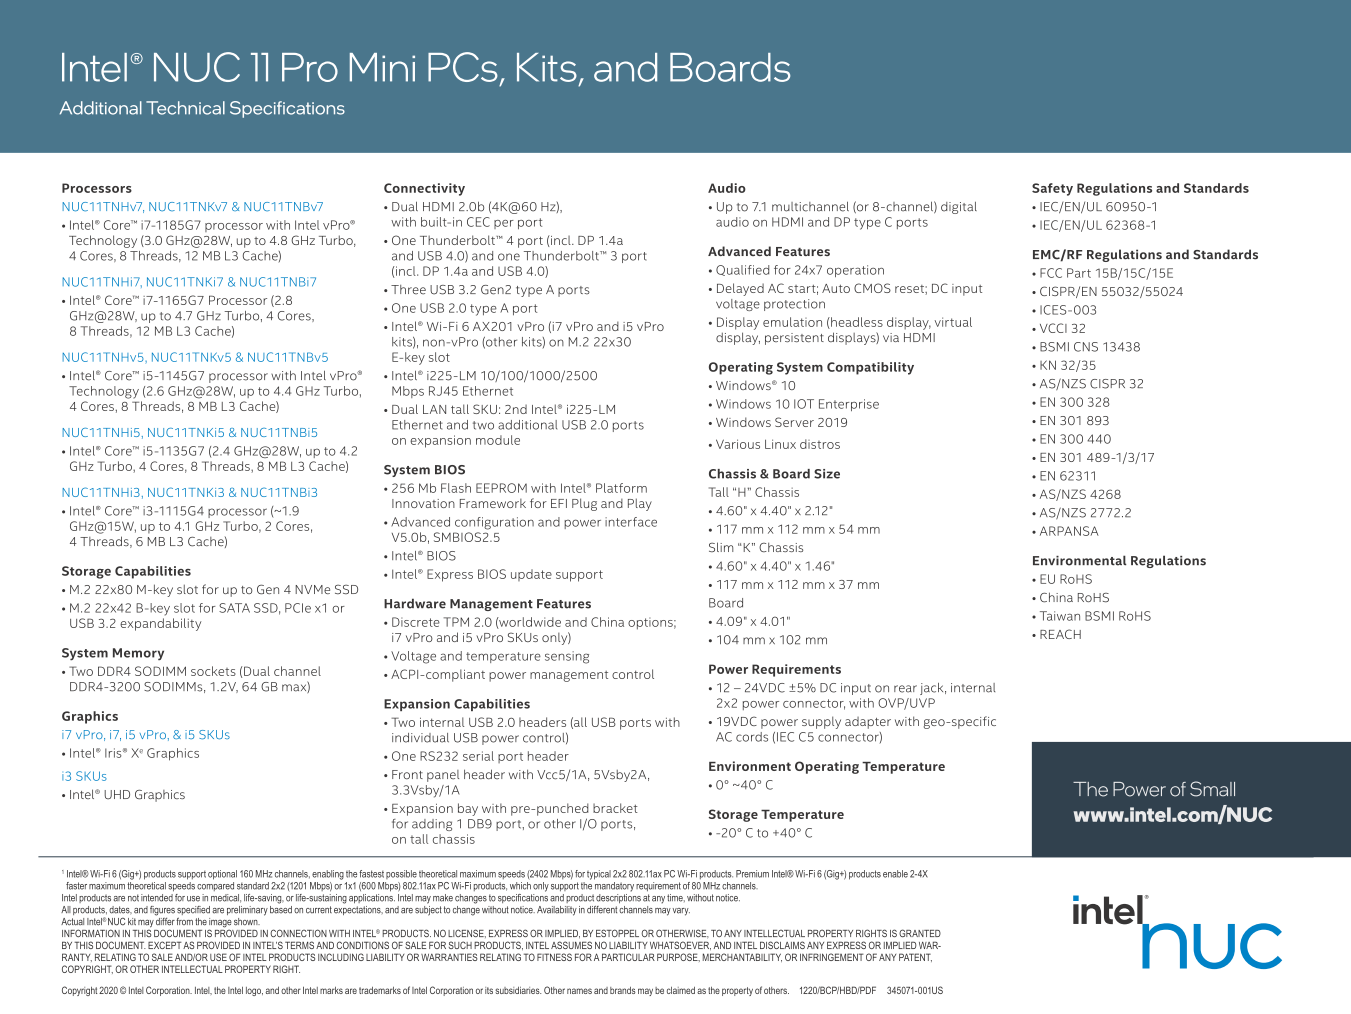
True to its name, each mini PC in the NUC11 series is powered by an 11th gen Tiger Lake processor ranging from the U-series Core i3 up to the Core i7. Intel vPro is available on the Core i5-1145G7 and i7-1185G7 while non-vPro options are the usual i5-1135G7 and i7-1165G7. All come with Iris Xe graphics except for the low-end Core i3-1115G4.
There are no discrete graphics options. Users might want to look at the NUC 11 Enthusiast if graphics performance is of high priority.
Processor
CPU performance is within a few percentage points of the average Core i5-1135G7 CPU in our database. Upgrading to the costlier Core i7-1165G7 can boost multi-thread performance by up to 25 or 35 percent based on our observations with the NUC11PAQi7. It's worth noting that the Core i5-1135G7 is able to outperform the one-off Core i7-8809G in the older Hades Canyon NUC8.
Performance sustainability is better than on the Surface Pro 7 Plus which comes with the exact same CPU. Running CineBench R15 xT in a loop reveals our NUC11 sustaining much higher scores over time when compared to the Microsoft tablet.
Cinebench R15: CPU Multi 64Bit | CPU Single 64Bit
Blender: v2.79 BMW27 CPU
7-Zip 18.03: 7z b 4 -mmt1 | 7z b 4
Geekbench 5.5: Single-Core | Multi-Core
HWBOT x265 Benchmark v2.2: 4k Preset
LibreOffice : 20 Documents To PDF
R Benchmark 2.5: Overall mean
| LibreOffice / 20 Documents To PDF | |
| Lenovo IdeaPad S540-13ARE-82DL000YGE | |
| Zotac ZBOX MI642 Nano | |
| GMK NucBox 2 | |
| Lenovo Yoga Slim 7-14ARE | |
| Microsoft Surface Pro 7 Plus | |
| Asus VivoBook Flip 14 TM420IA | |
| HP Envy 13-ba0001ng | |
| Beelink SEi10 | |
| Average Intel Core i5-1135G7 (44.2 - 62.9, n=60) | |
| Lenovo Yoga 9 14 ITL 4K | |
| Intel NUC11TNKi5 | |
| Intel NUC11PAQi7 | |
Cinebench R15: CPU Multi 64Bit | CPU Single 64Bit
Blender: v2.79 BMW27 CPU
7-Zip 18.03: 7z b 4 -mmt1 | 7z b 4
Geekbench 5.5: Single-Core | Multi-Core
HWBOT x265 Benchmark v2.2: 4k Preset
LibreOffice : 20 Documents To PDF
R Benchmark 2.5: Overall mean
* ... smaller is better
System Performance
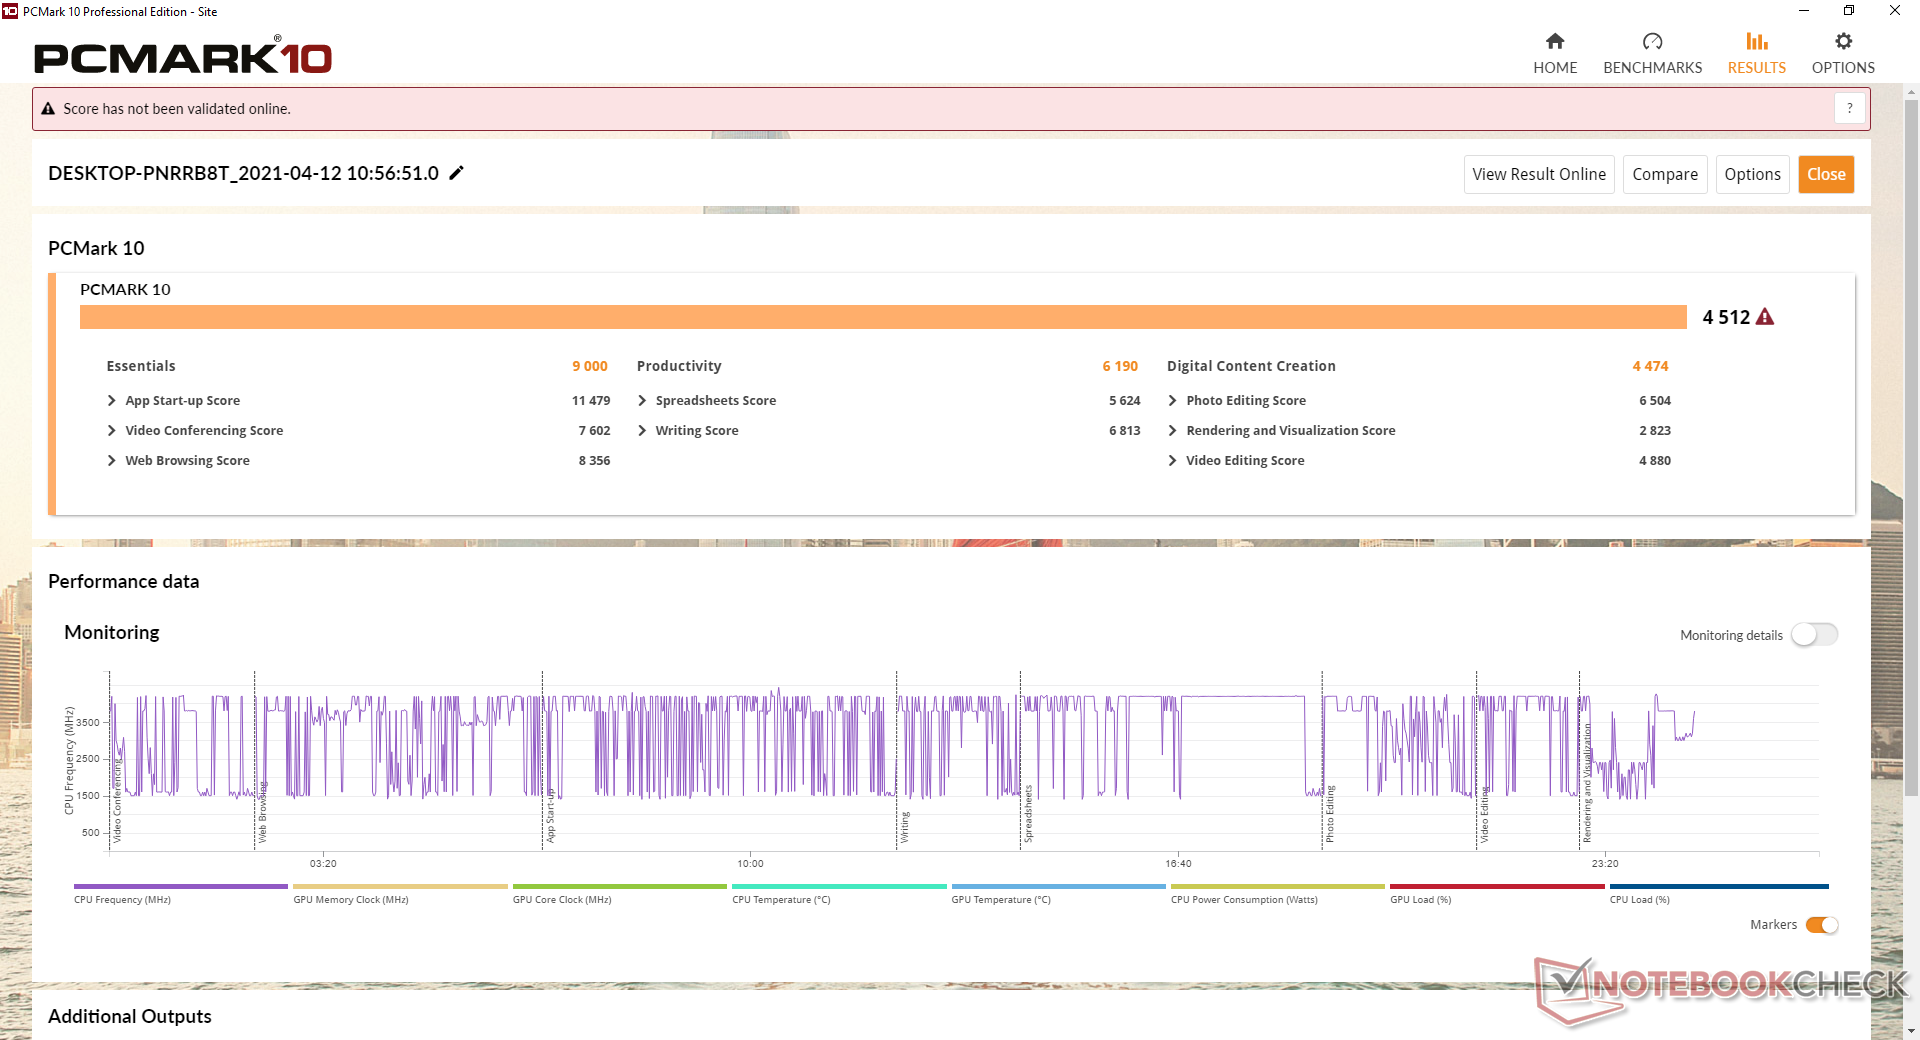
| PCMark 10 Score | 4512 points | |
Help | ||
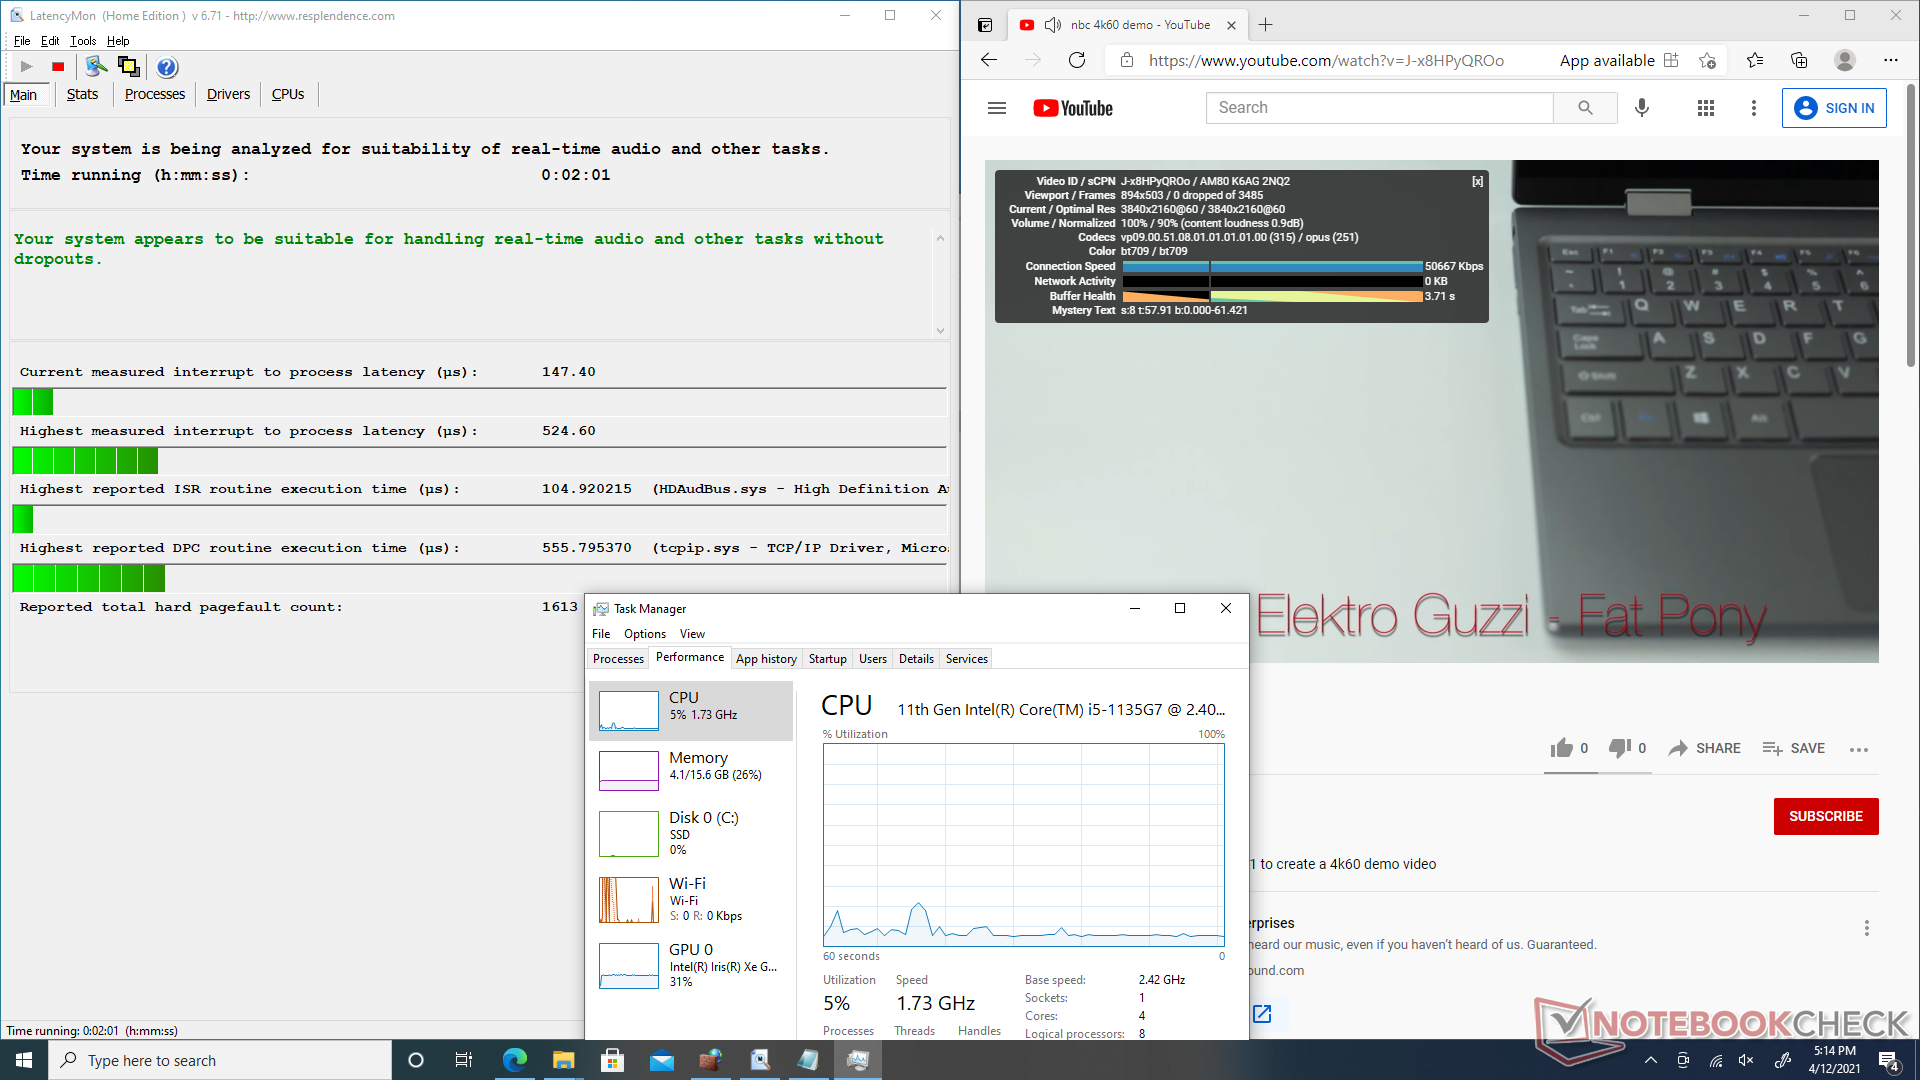
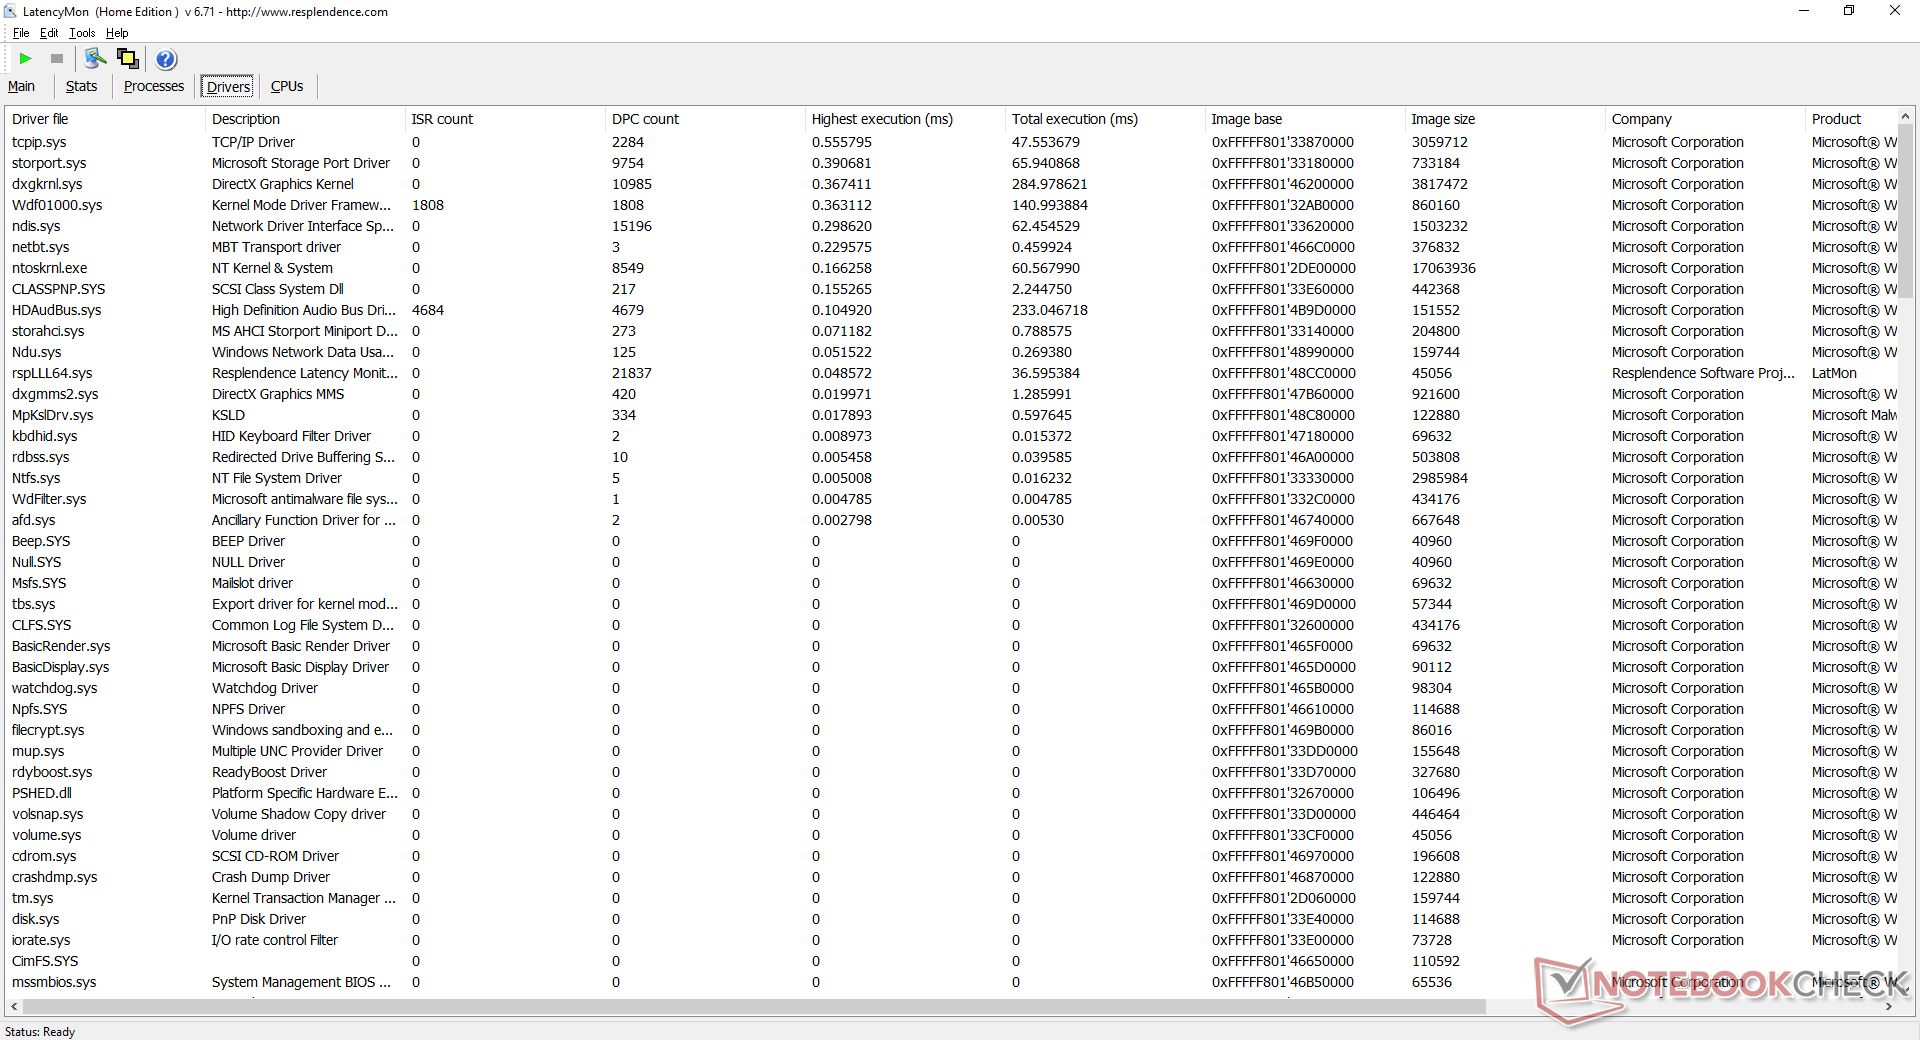
DPC Latency
LatencyMon shows no DPC latency issues when opening multiple tabs on our homepage. 4K video playback at 60 FPS is also smooth and with no dropped frames during our tests.
| DPC Latencies / LatencyMon - interrupt to process latency (max), Web, Youtube, Prime95 | |
| Beelink SEi10 | |
| GMK NucBox 2 | |
| Intel NUC11PAQi7 | |
| Intel NUC11TNKi5 | |
* ... smaller is better
Storage Devices
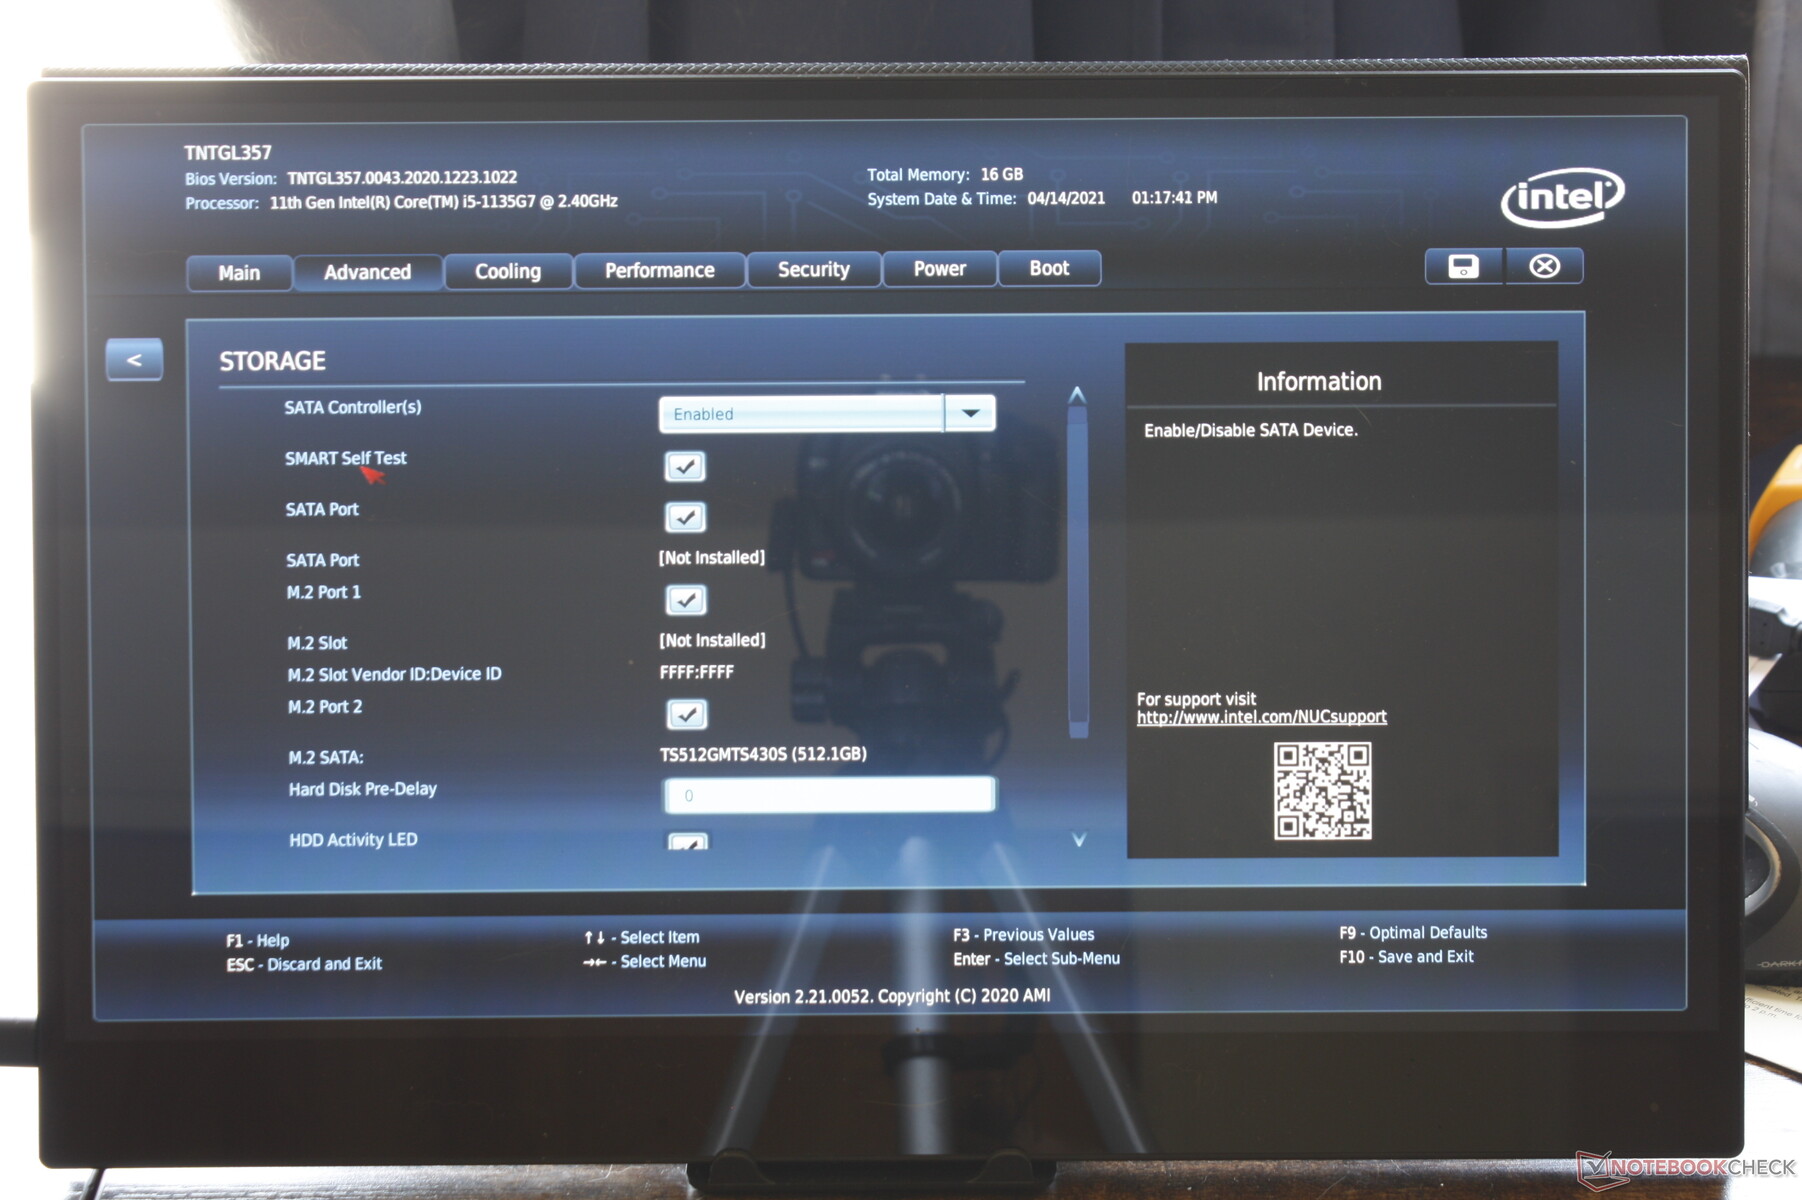
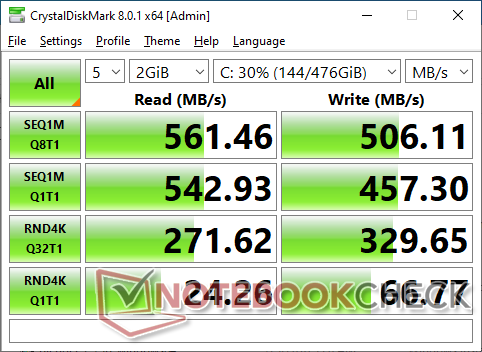
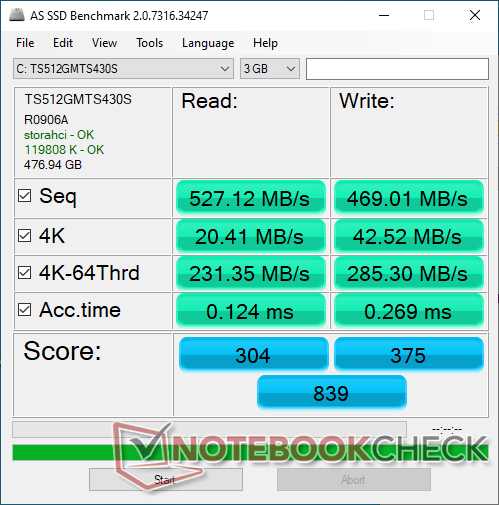
The NUC 11 Pro Mini has a unique storage setup with its two asymmetric M.2 slots. One slot supports 2242 SATA III SSDs only while the second slot supports up to 2280 PCIe 4.0 drives. The SATA III Transcend SSD in our unit doesn't hold a candle to NVMe drives, but owners can easily upgrade if desired.
| Intel NUC11TNKi5 Transcend M.2 SSD 430S TS512GMTS430S | GMK NucBox 2 Netac S930E8/256GPN | Intel NUC11PAQi7 Samsung SSD 980 Pro 500GB MZ-V8P500BW | Beelink SEi10 Silicon Motion AZW 256G M.2280 NVMe 4X 200725 D | Zotac ZBOX MI642 Nano Western Digital WD Blue 3D WDBNCE5000PNC | |
|---|---|---|---|---|---|
| AS SSD | 91% | 434% | 17% | 18% | |
| Seq Read (MB/s) | 527 | 2069 293% | 3257 518% | 1111 111% | 507 -4% |
| Seq Write (MB/s) | 469 | 1203 157% | 3937 739% | 323.5 -31% | 413.8 -12% |
| 4K Read (MB/s) | 20.41 | 41.66 104% | 51.3 151% | 33.1 62% | 36.75 80% |
| 4K Write (MB/s) | 42.52 | 136.9 222% | 75.7 78% | 66.2 56% | 88.5 108% |
| 4K-64 Read (MB/s) | 231.4 | 366.3 58% | 2283 887% | 357.3 54% | 369.4 60% |
| 4K-64 Write (MB/s) | 285.3 | 340.5 19% | 2206 673% | 154.8 -46% | 193.7 -32% |
| Access Time Read * (ms) | 0.124 | 0.064 48% | 0.056 55% | 0.066 47% | 0.103 17% |
| Access Time Write * (ms) | 0.269 | 0.347 -29% | 0.154 43% | 0.616 -129% | 0.095 65% |
| Score Read (Points) | 304 | 615 102% | 2660 775% | 501 65% | 457 50% |
| Score Write (Points) | 375 | 598 59% | 2676 614% | 253 -33% | 324 -14% |
| Score Total (Points) | 839 | 1497 78% | 6725 702% | 983 17% | 1023 22% |
| Copy ISO MB/s (MB/s) | 490.9 | 1186 142% | 2030 314% | 1160 136% | 482.5 -2% |
| Copy Program MB/s (MB/s) | 415.9 | 428.6 3% | 883 112% | 121.1 -71% | 191.9 -54% |
| Copy Game MB/s (MB/s) | 352.3 | 435.7 24% | 1817 416% | 364.4 3% | 248.9 -29% |
| CrystalDiskMark 5.2 / 6 | 149% | 533% | 146% | 23% | |
| Write 4K (MB/s) | 65.9 | 178.4 171% | 244.6 271% | 203 208% | 105.9 61% |
| Read 4K (MB/s) | 24.27 | 61 151% | 80.4 231% | 63.2 160% | 39.15 61% |
| Write Seq (MB/s) | 456.4 | 1040 128% | 4094 797% | 1114 144% | |
| Read Seq (MB/s) | 542 | 1919 254% | 4099 656% | 1765 226% | |
| Write 4K Q32T1 (MB/s) | 331.3 | 417.7 26% | 715 116% | 423.9 28% | 320.5 -3% |
| Read 4K Q32T1 (MB/s) | 295 | 325.6 10% | 783 165% | 389.2 32% | 342.1 16% |
| Write Seq Q32T1 (MB/s) | 506 | 1144 126% | 5065 901% | 1104 118% | 514 2% |
| Read Seq Q32T1 (MB/s) | 562 | 2379 323% | 6884 1125% | 1990 254% | 554 -1% |
| Write 4K Q8T8 (MB/s) | 330.8 | ||||
| Read 4K Q8T8 (MB/s) | 391.8 | ||||
| Total Average (Program / Settings) | 120% /
112% | 484% /
470% | 82% /
64% | 21% /
20% |
* ... smaller is better

Disk Throttling: DiskSpd Read Loop, Queue Depth 8
GPU Performance
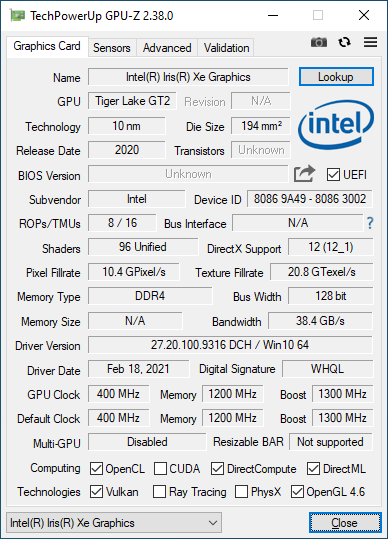
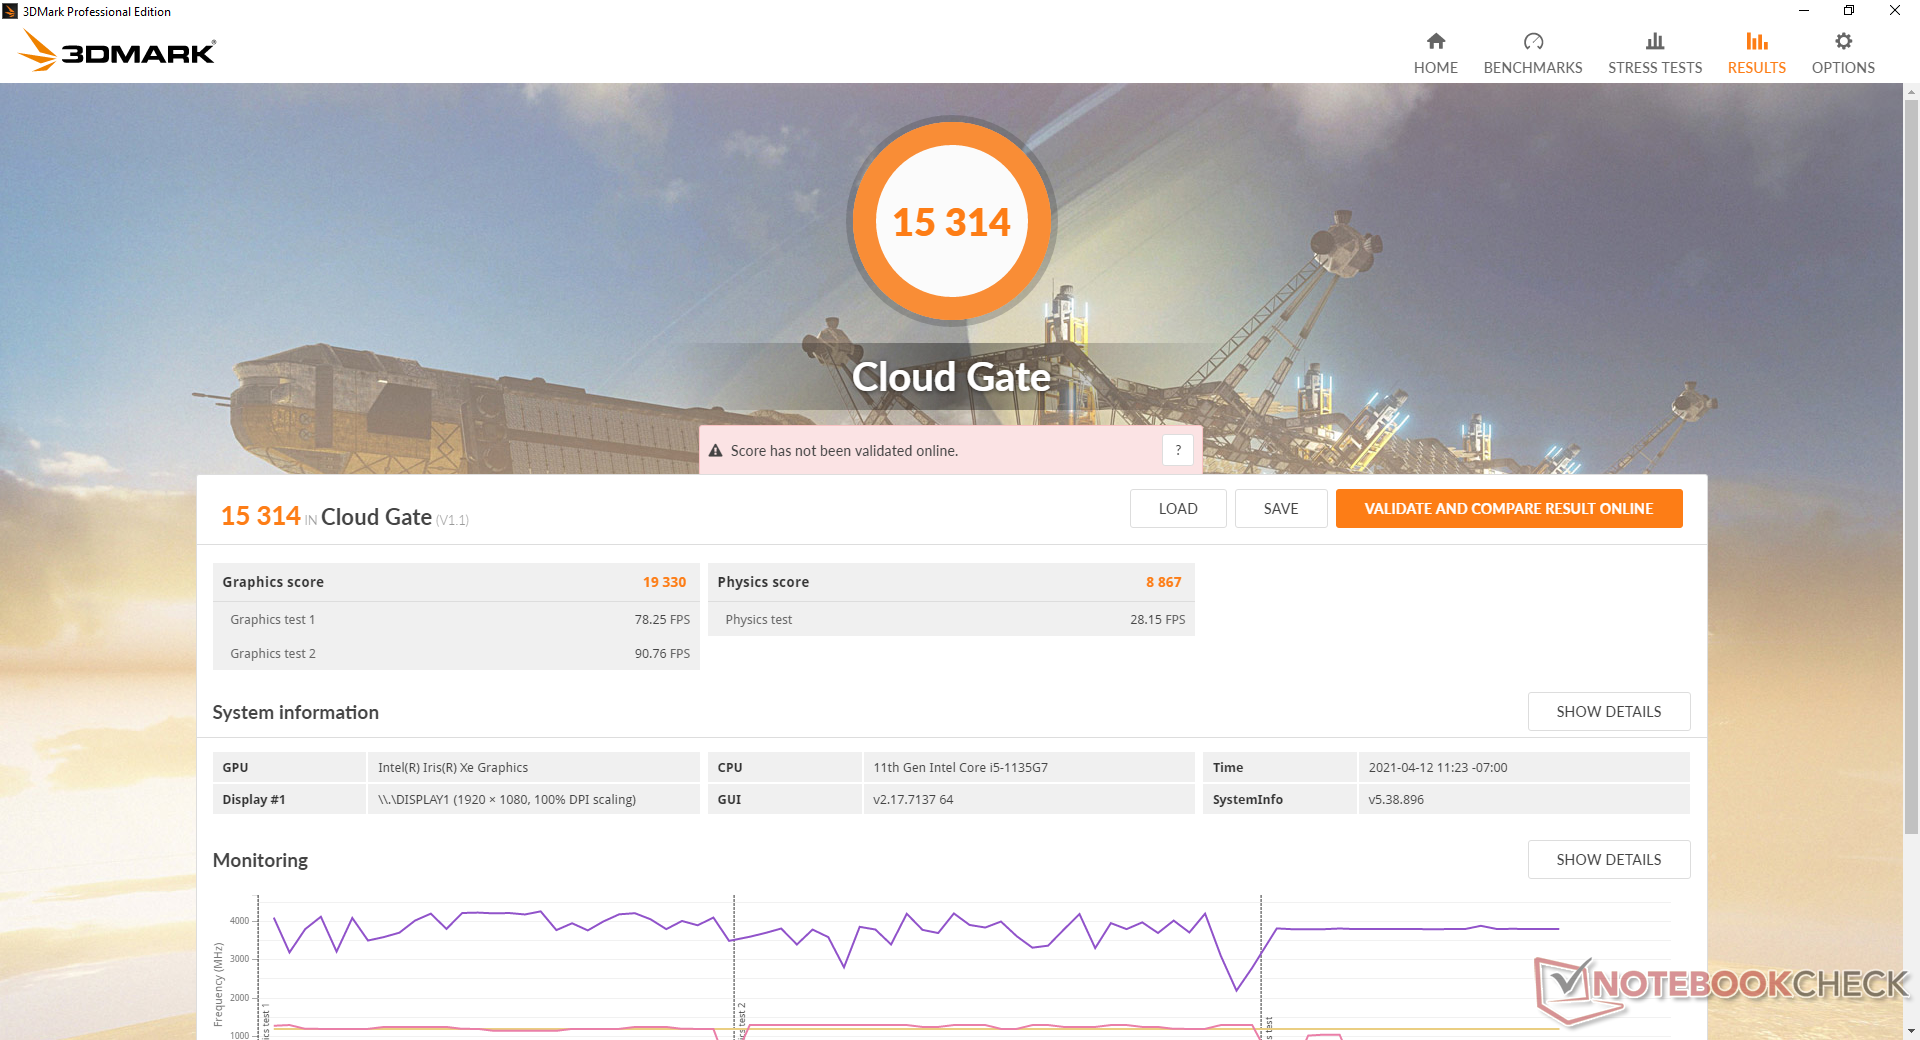
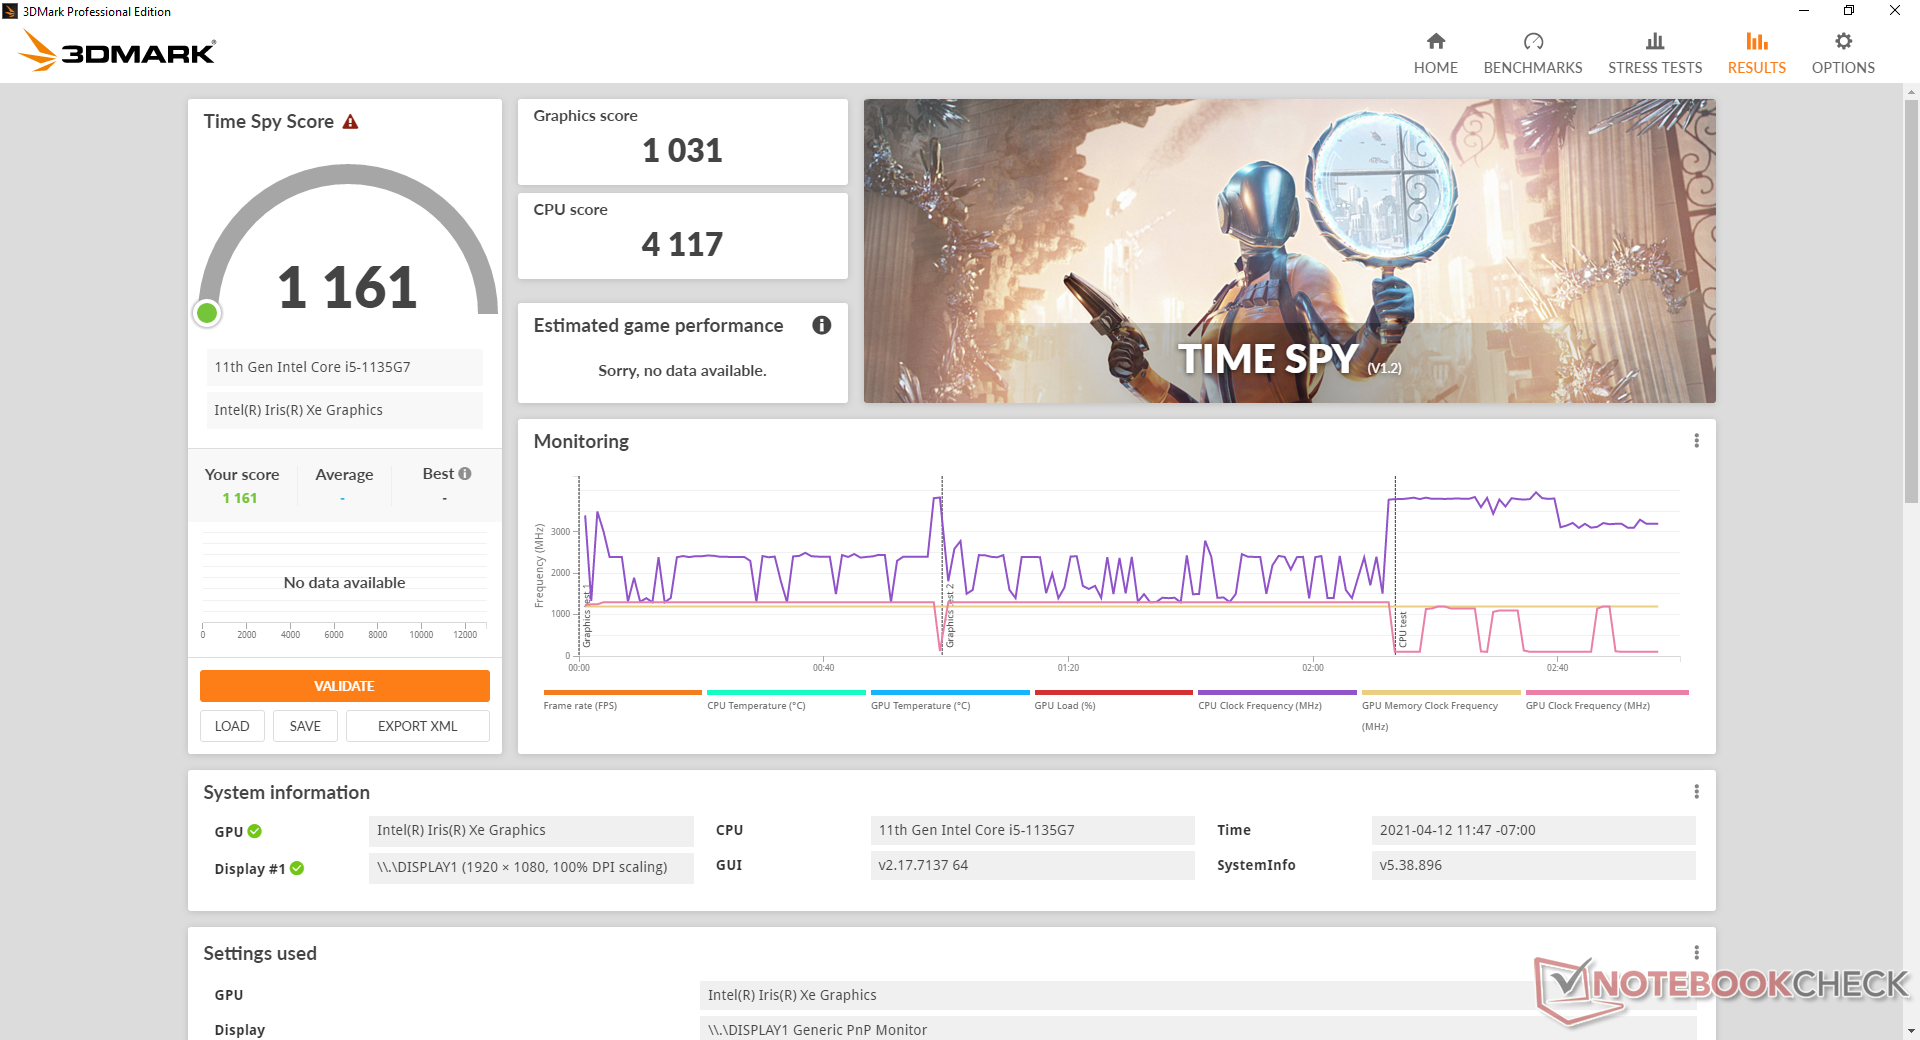
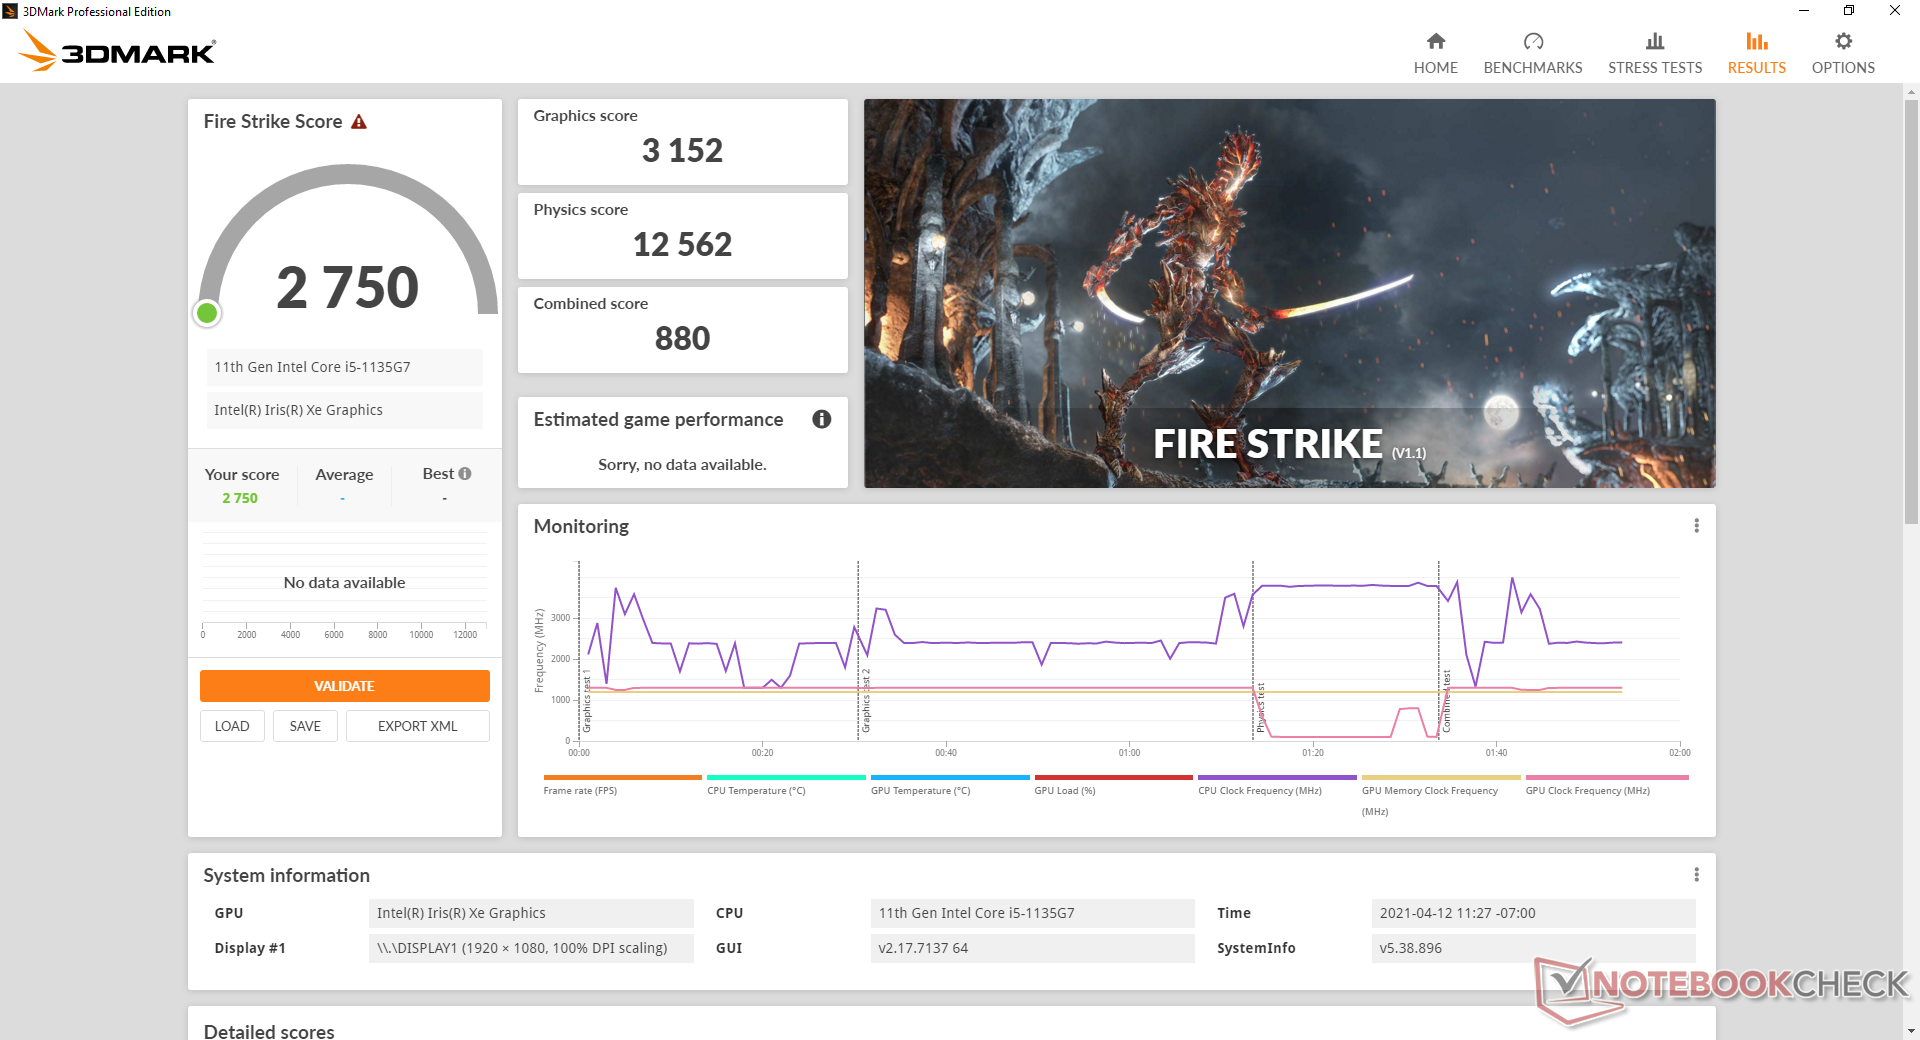
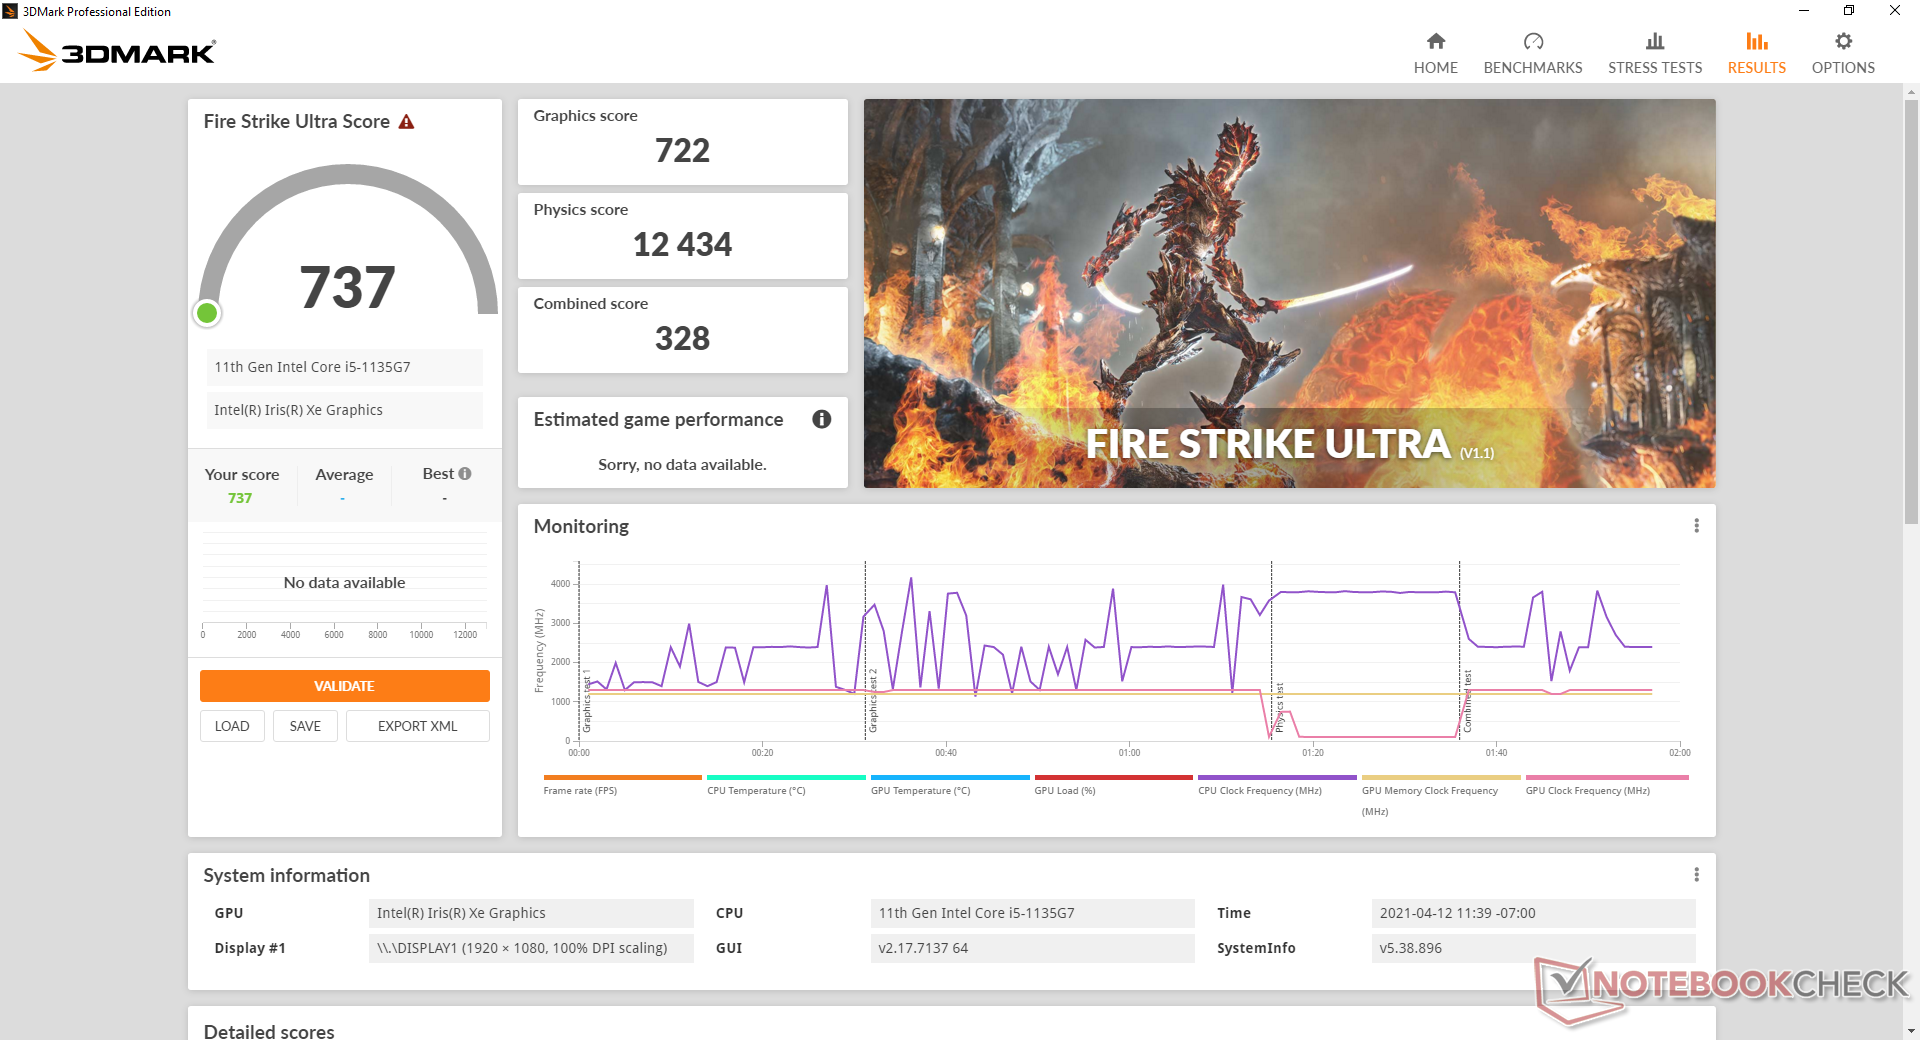
3DMark scores at about 10 percent slower than the average Iris Xe Graphics G7 80EUs in our database likely due to the single-channel RAM setup of our pre-production unit. Upgrading to the Core i7-1165G7 option with the faster Iris Xe 96EUs will boost GPU performance by at least 30 percent.
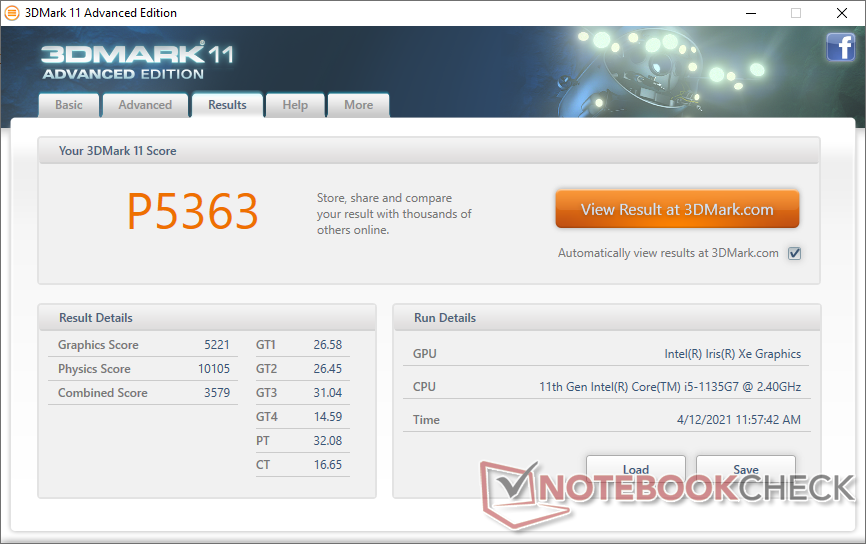
| 3DMark 11 Performance | 5363 points | |
| 3DMark Cloud Gate Standard Score | 15314 points | |
| 3DMark Fire Strike Score | 2750 points | |
| 3DMark Time Spy Score | 1161 points | |
Help | ||
| low | med. | high | ultra | |
|---|---|---|---|---|
| The Witcher 3 (2015) | 59.8 | |||
| Dota 2 Reborn (2015) | 73.8 | 56 | 34.2 | 31.4 |
| Final Fantasy XV Benchmark (2018) | 26.8 | 13.7 | 10.5 | |
| X-Plane 11.11 (2018) | 37.1 | 27.3 | 29.1 |
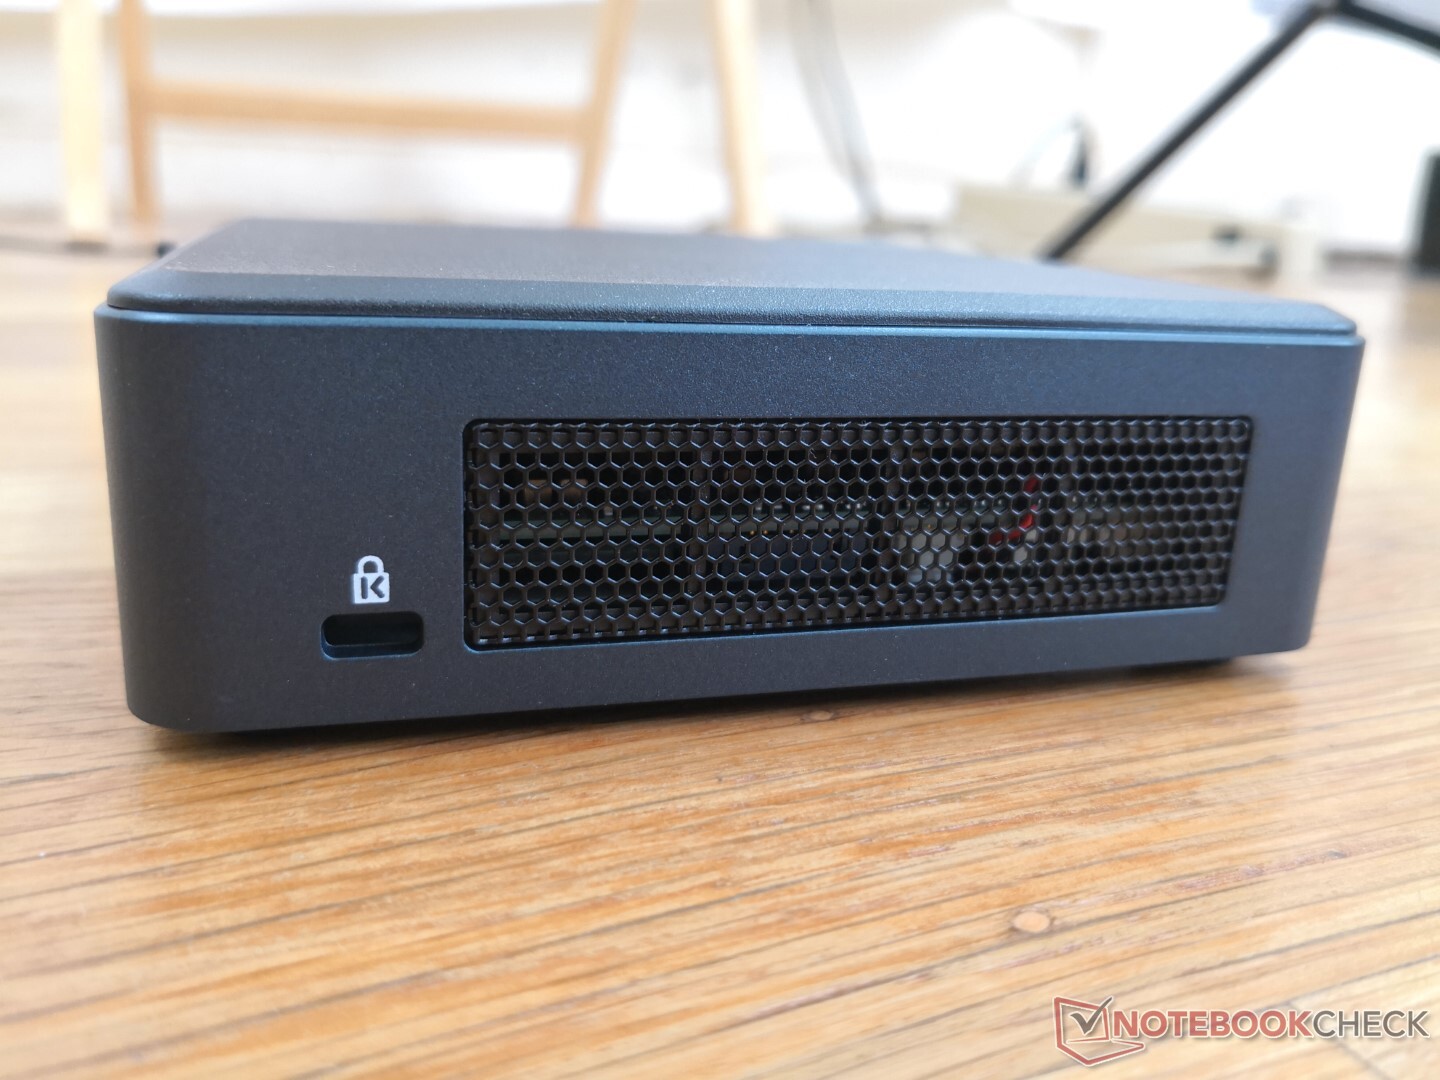
Emissions
System Noise
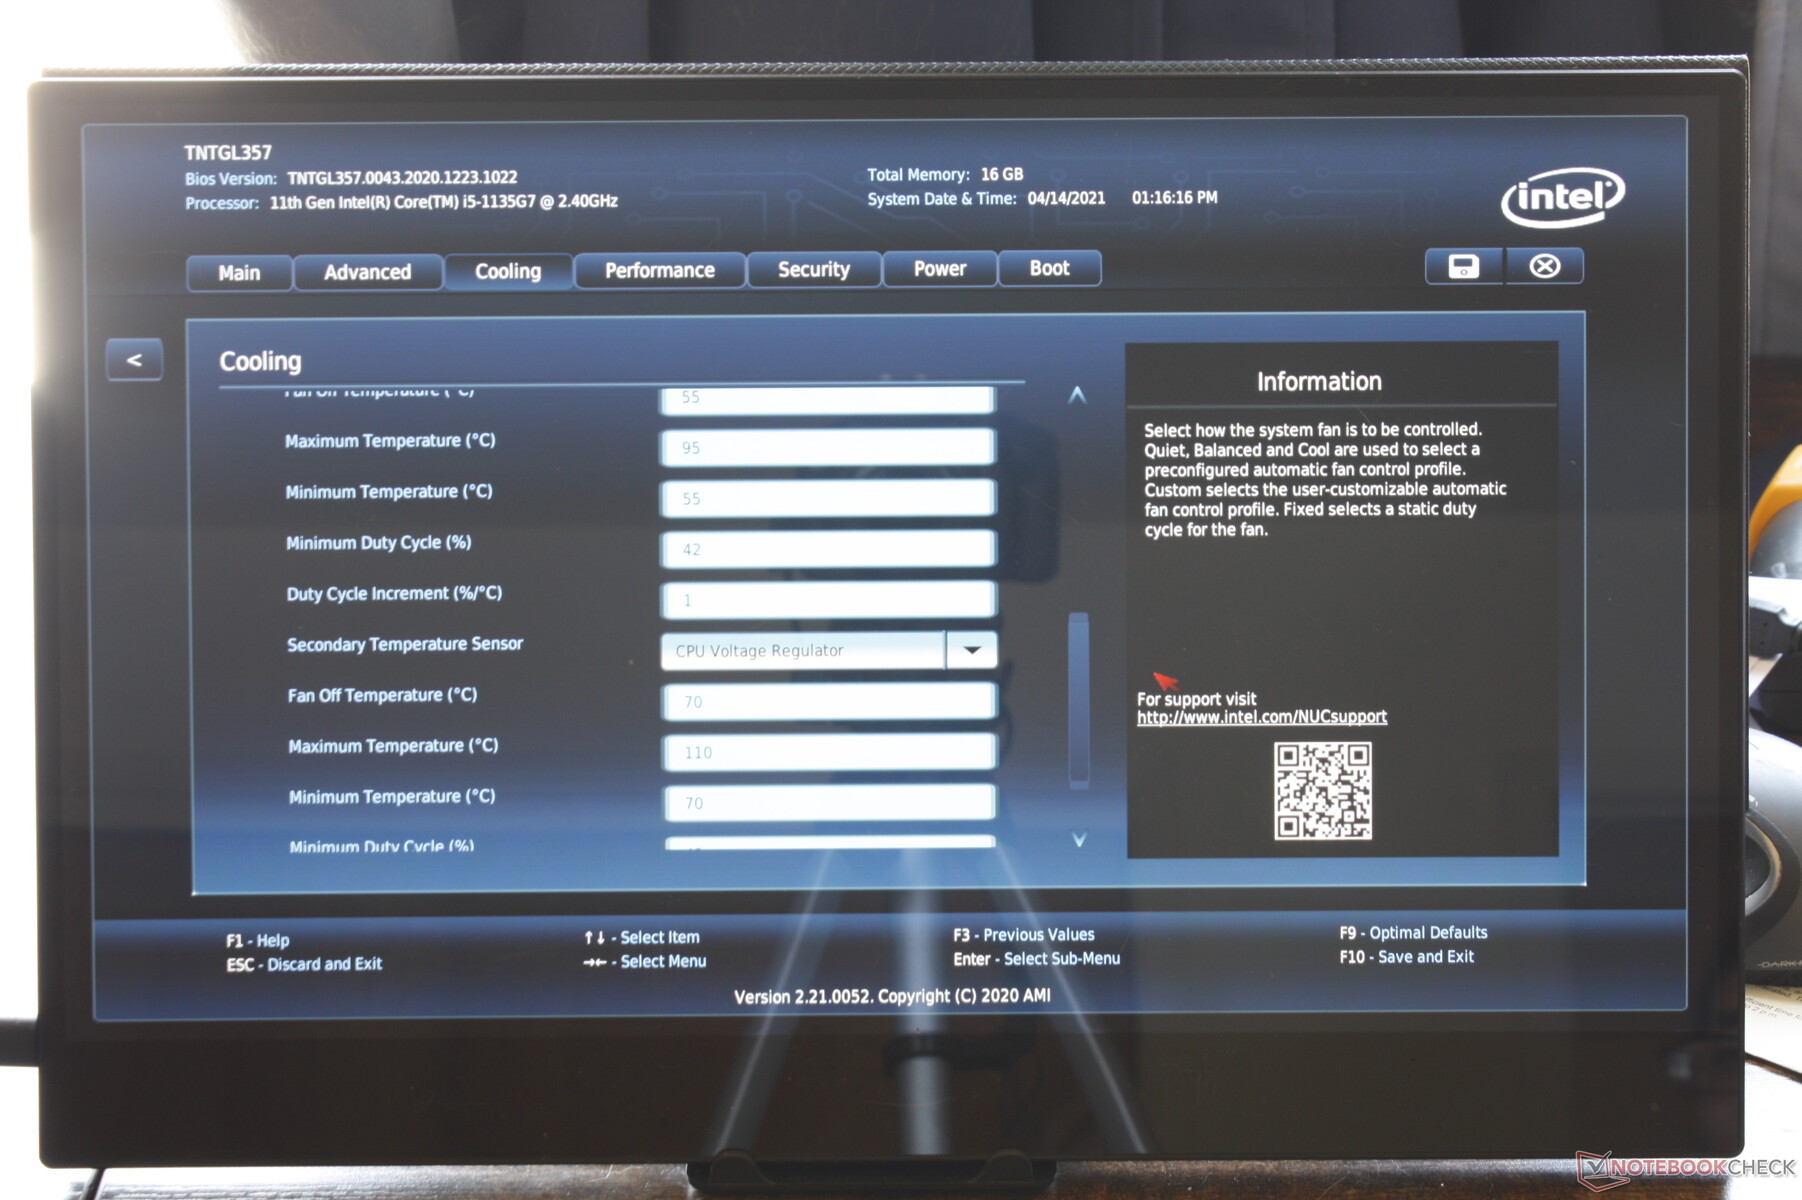
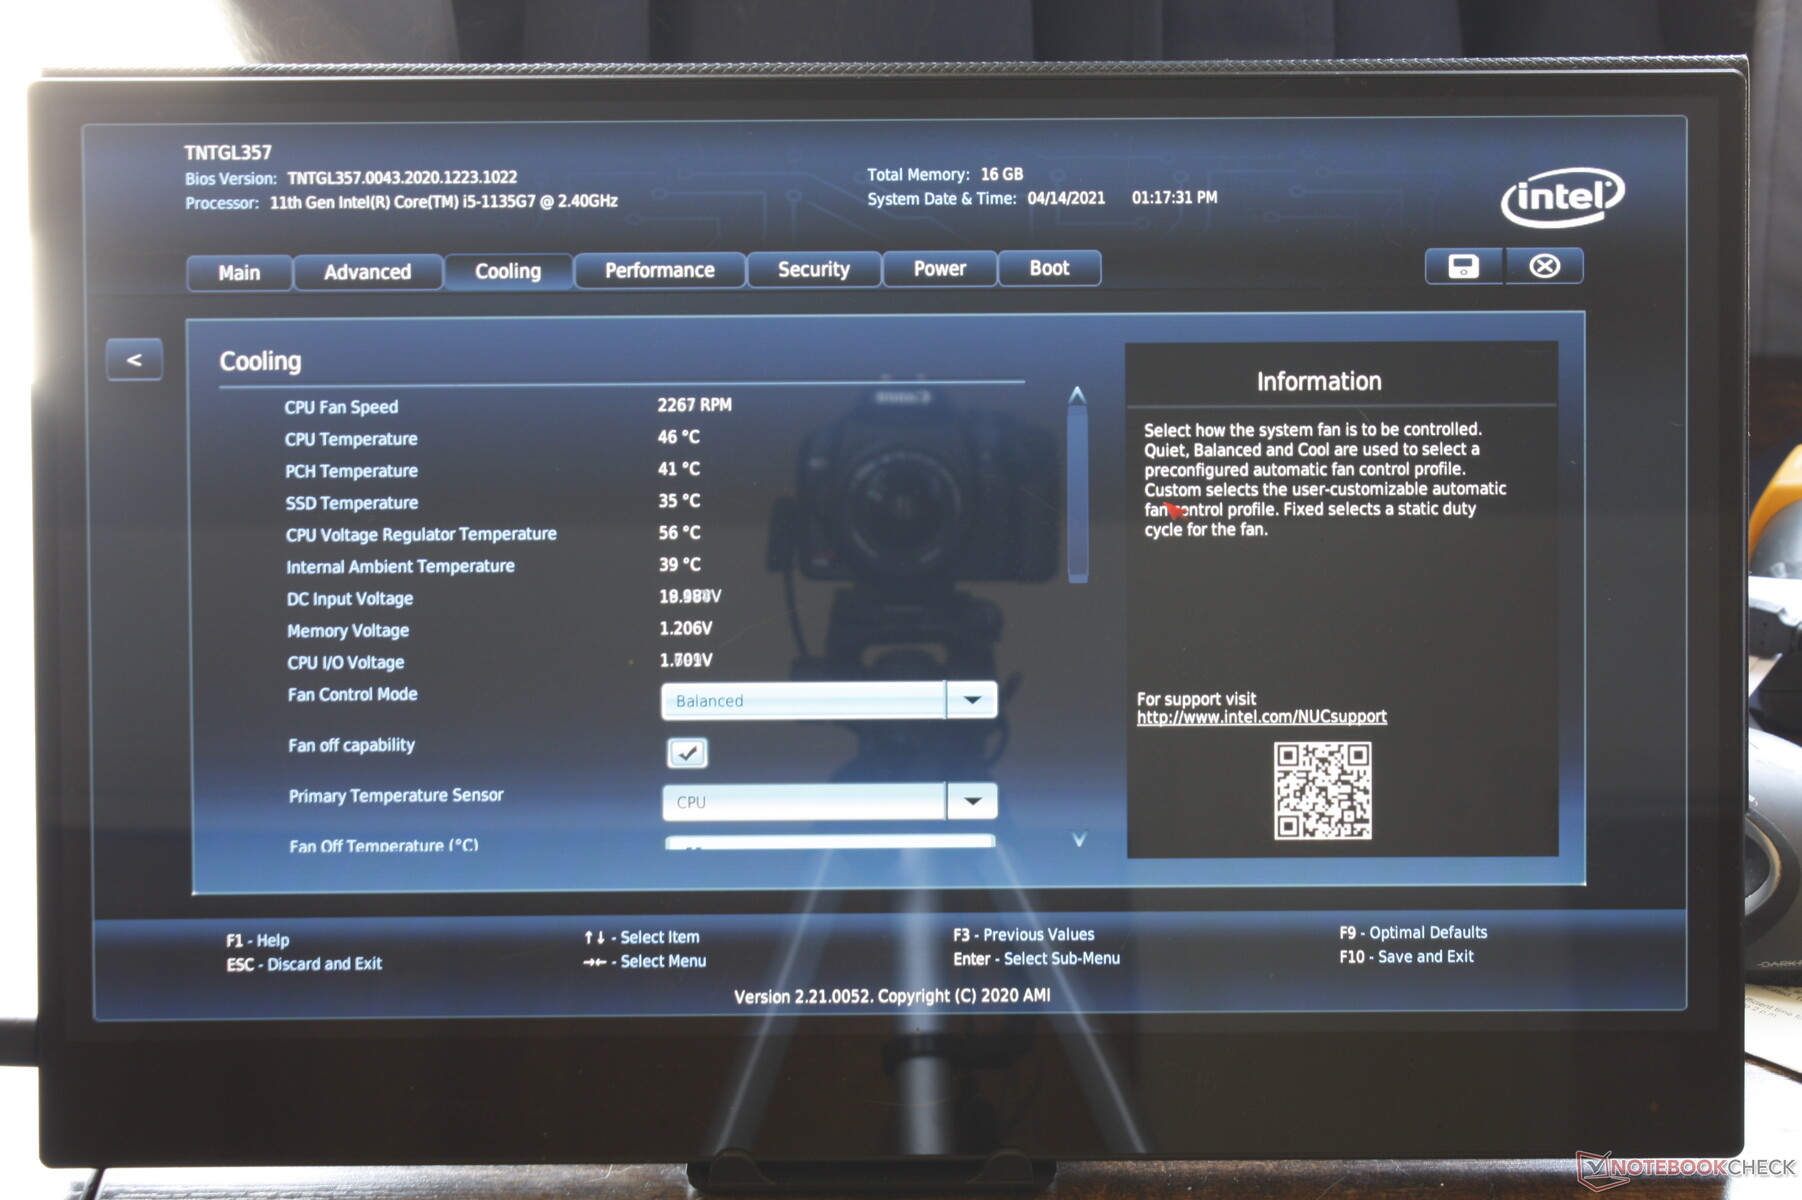
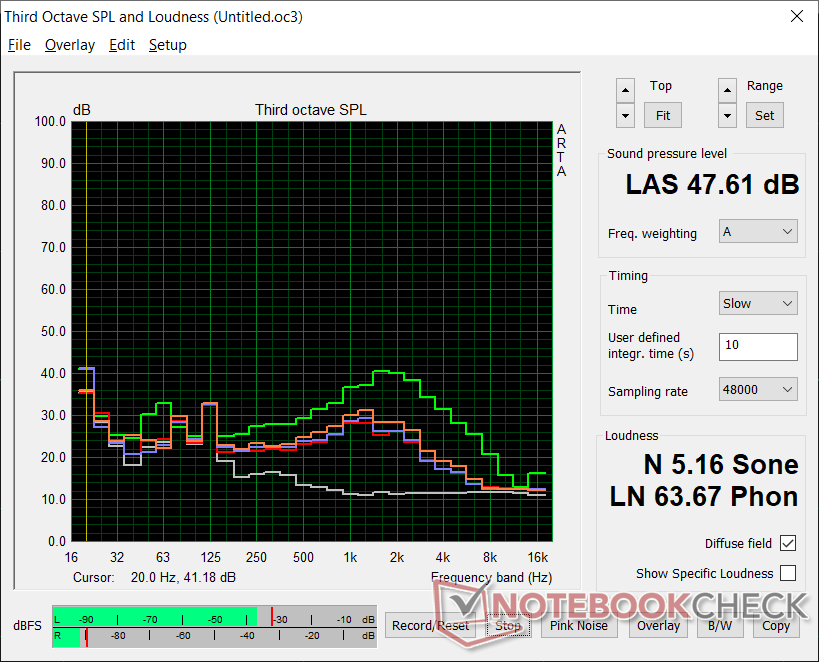
The internal fan rarely idles even when the system is idling on desktop. We're able to record a constant fan noise of 35.6 dB(A) against a silent background of 24.8 dB(A) when web browsing to be louder than most other mini PCs under similar conditions. RPM changes are gradual and so there are no pulsing issues, but users should still expect louder-than-average fan noise when running most loads. The BIOS allows for more specific temperature thresholds for fan noise control.
| Intel NUC11TNKi5 | GMK NucBox 2 | Intel NUC11PAQi7 | Beelink SEi10 | Zotac ZBOX MI642 Nano | Intel NUC8i7BE | |
|---|---|---|---|---|---|---|
| Noise | 18% | 12% | 0% | 1% | 5% | |
| off / environment * (dB) | 24.8 | 25.6 -3% | 25.6 -3% | 27.5 -11% | 27.8 -12% | 28.7 -16% |
| Idle Minimum * (dB) | 35.6 | 25.7 28% | 25.6 28% | 30.9 13% | 27.8 22% | 28.7 19% |
| Idle Average * (dB) | 35.6 | 25.7 28% | 25.6 28% | 33.5 6% | 33.9 5% | 29.3 18% |
| Idle Maximum * (dB) | 35.6 | 25.7 28% | 25.6 28% | 33.5 6% | 33.9 5% | 31.8 11% |
| Load Average * (dB) | 36.2 | 35.3 2% | 33.6 7% | 38.5 -6% | 43.7 -21% | 39 -8% |
| Witcher 3 ultra * (dB) | 38 | 33.6 12% | 39 -3% | |||
| Load Maximum * (dB) | 47.6 | 35.1 26% | 54.5 -14% | 51.6 -8% | 43.7 8% | 41.4 13% |
* ... smaller is better
Noise level
| Idle |
| 35.6 / 35.6 / 35.6 dB(A) |
| Load |
| 36.2 / 47.6 dB(A) |
 | ||
30 dB silent 40 dB(A) audible 50 dB(A) loud |
||
min: | ||
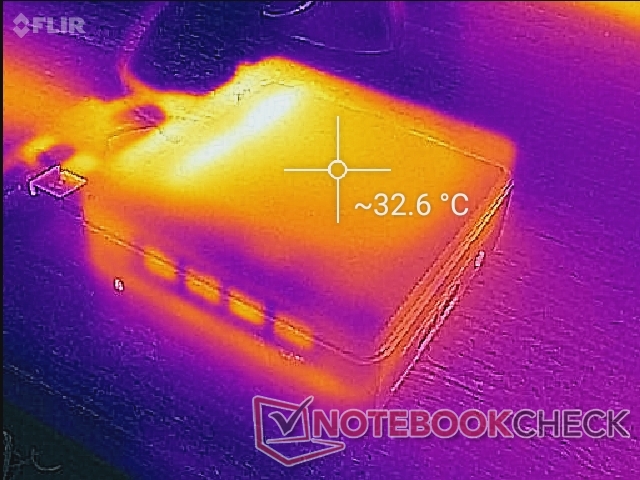
Temperature
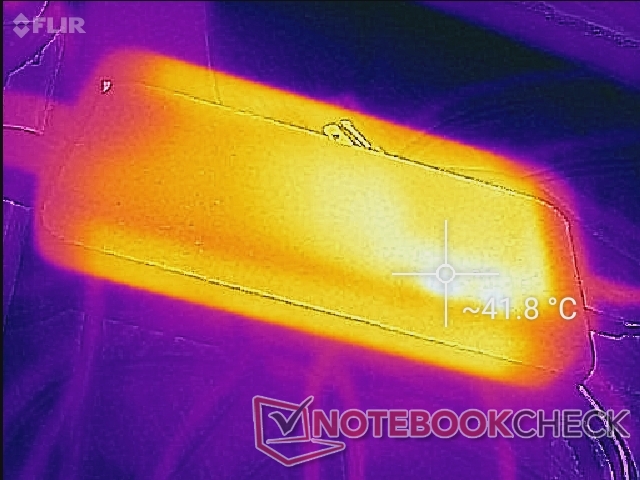
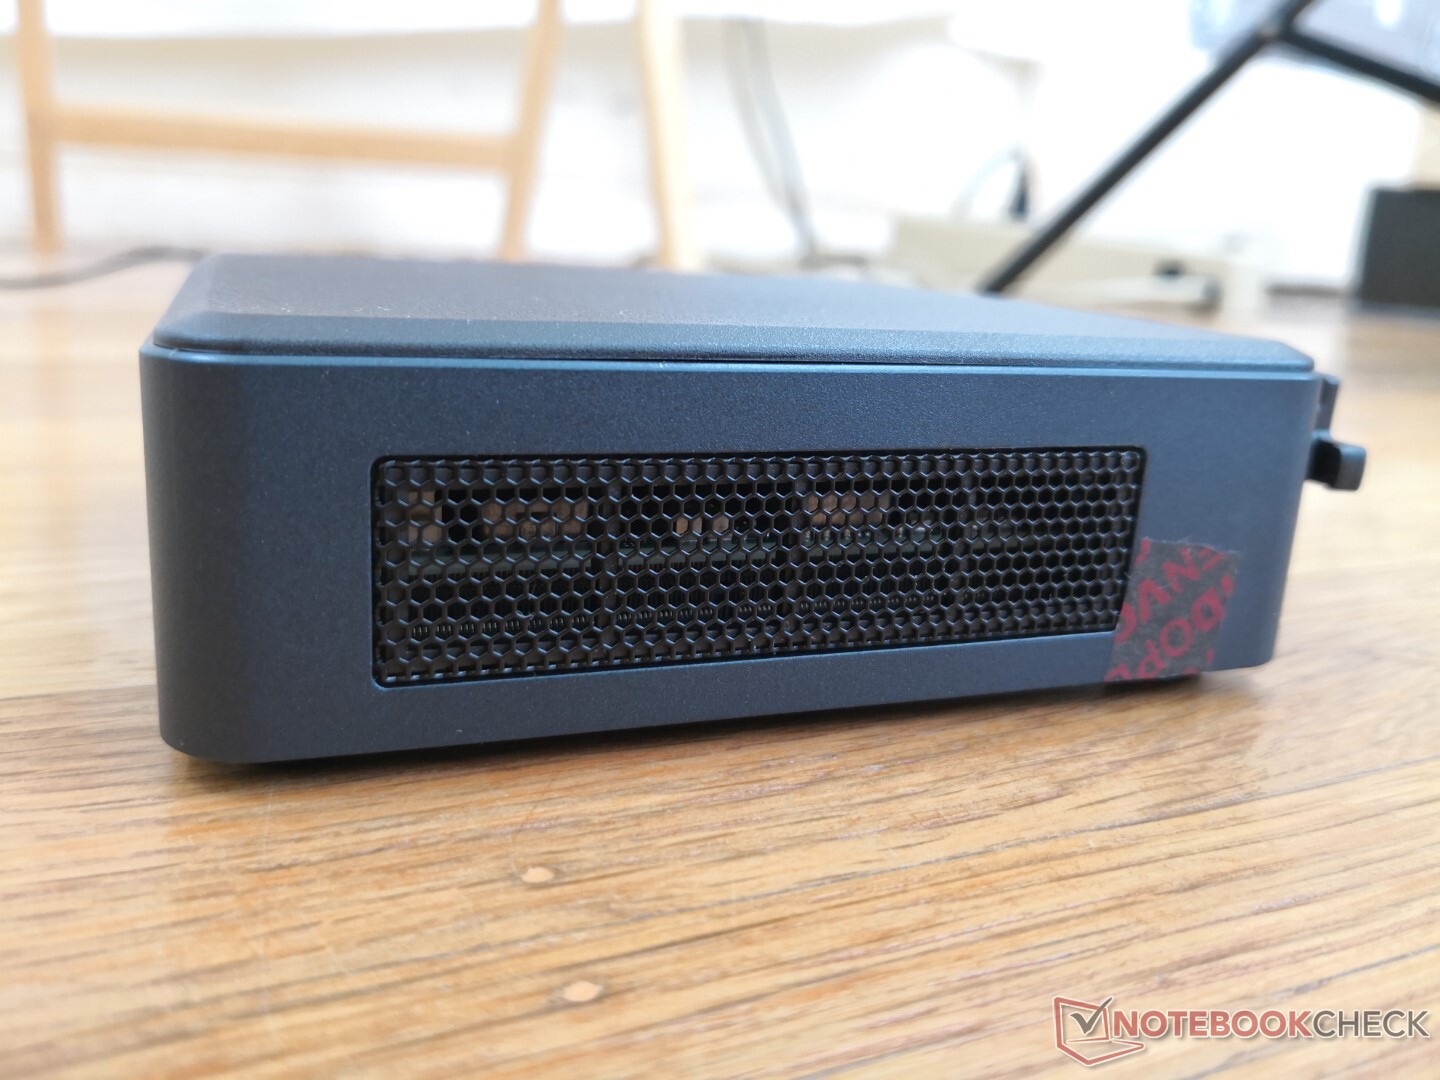
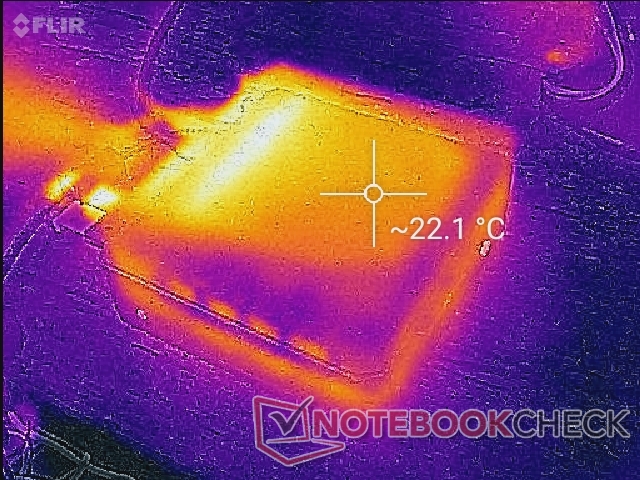
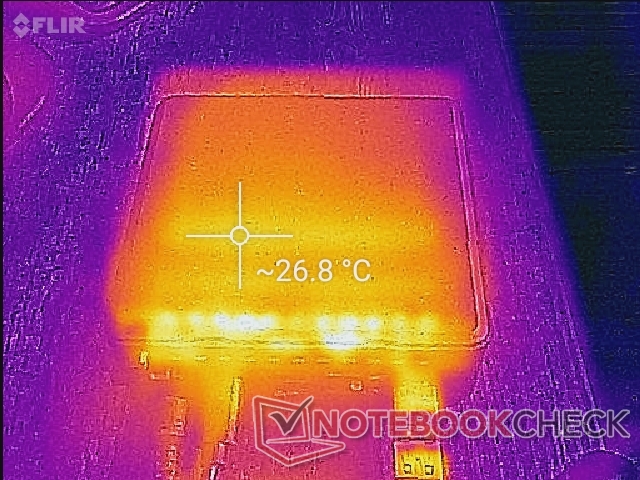
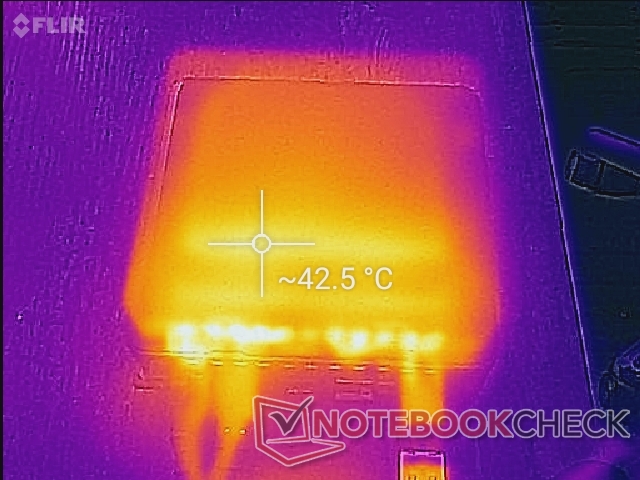
Surface temperature ranges from 22 C to 27 C when idle to 43 C when running extreme processing loads. Fresh air is pulled from the sides meaning ventilation will be partially blocked if the NUC is positioned vertically.
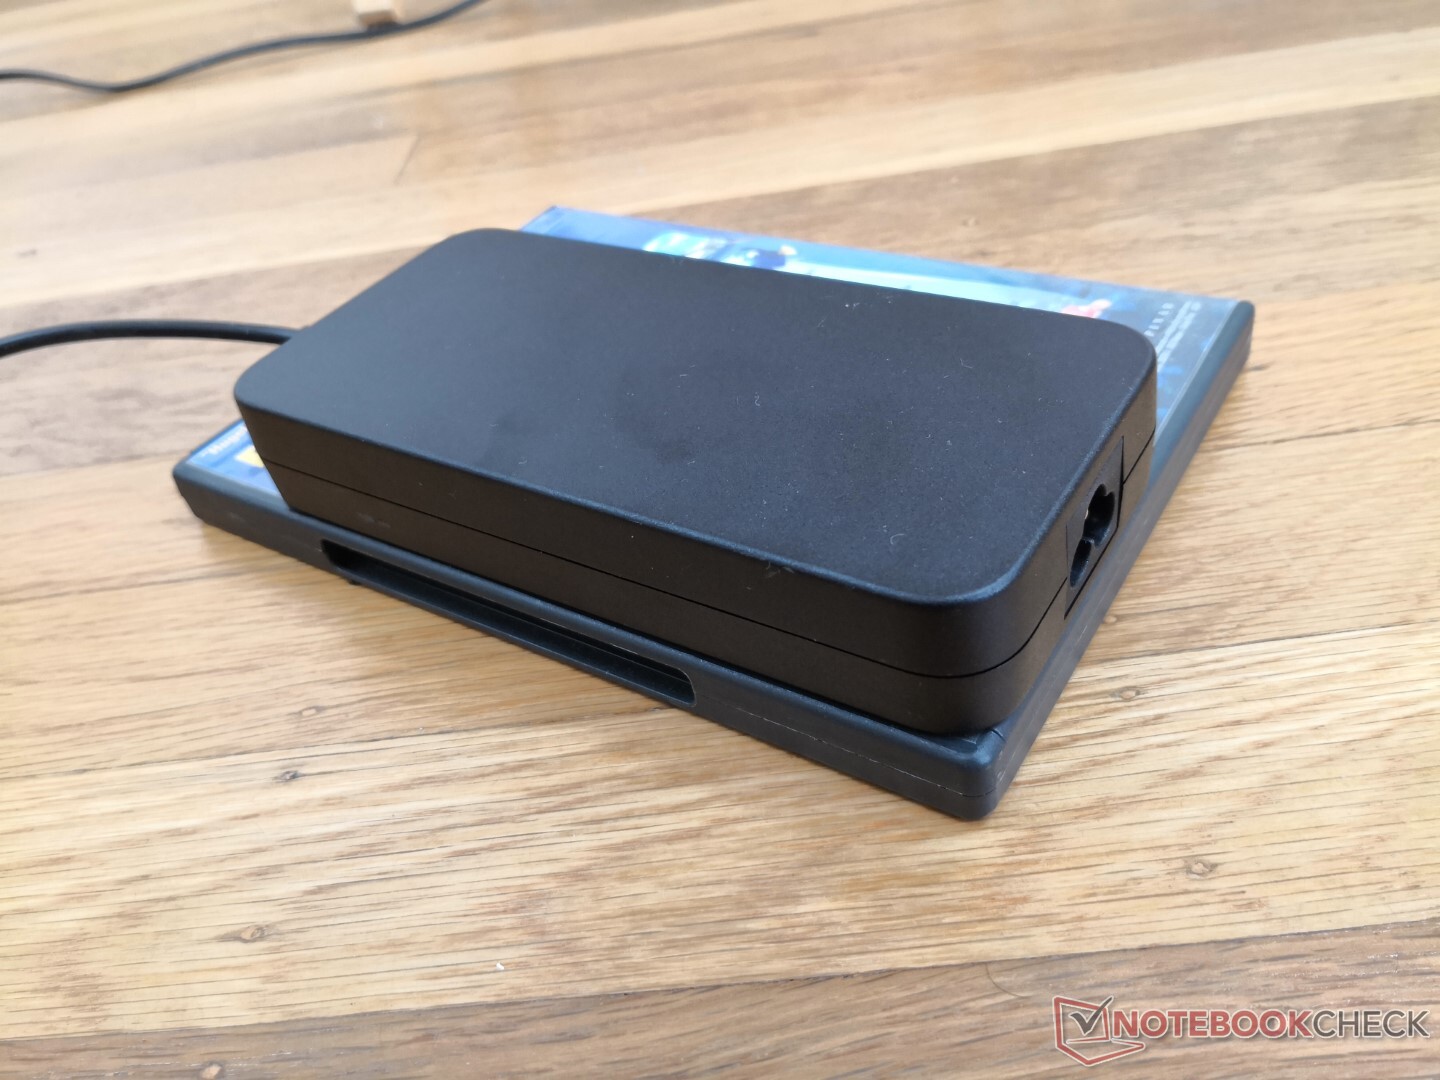
The AC adapter can be just as warm as the mini PC itself at 42 C when under load.
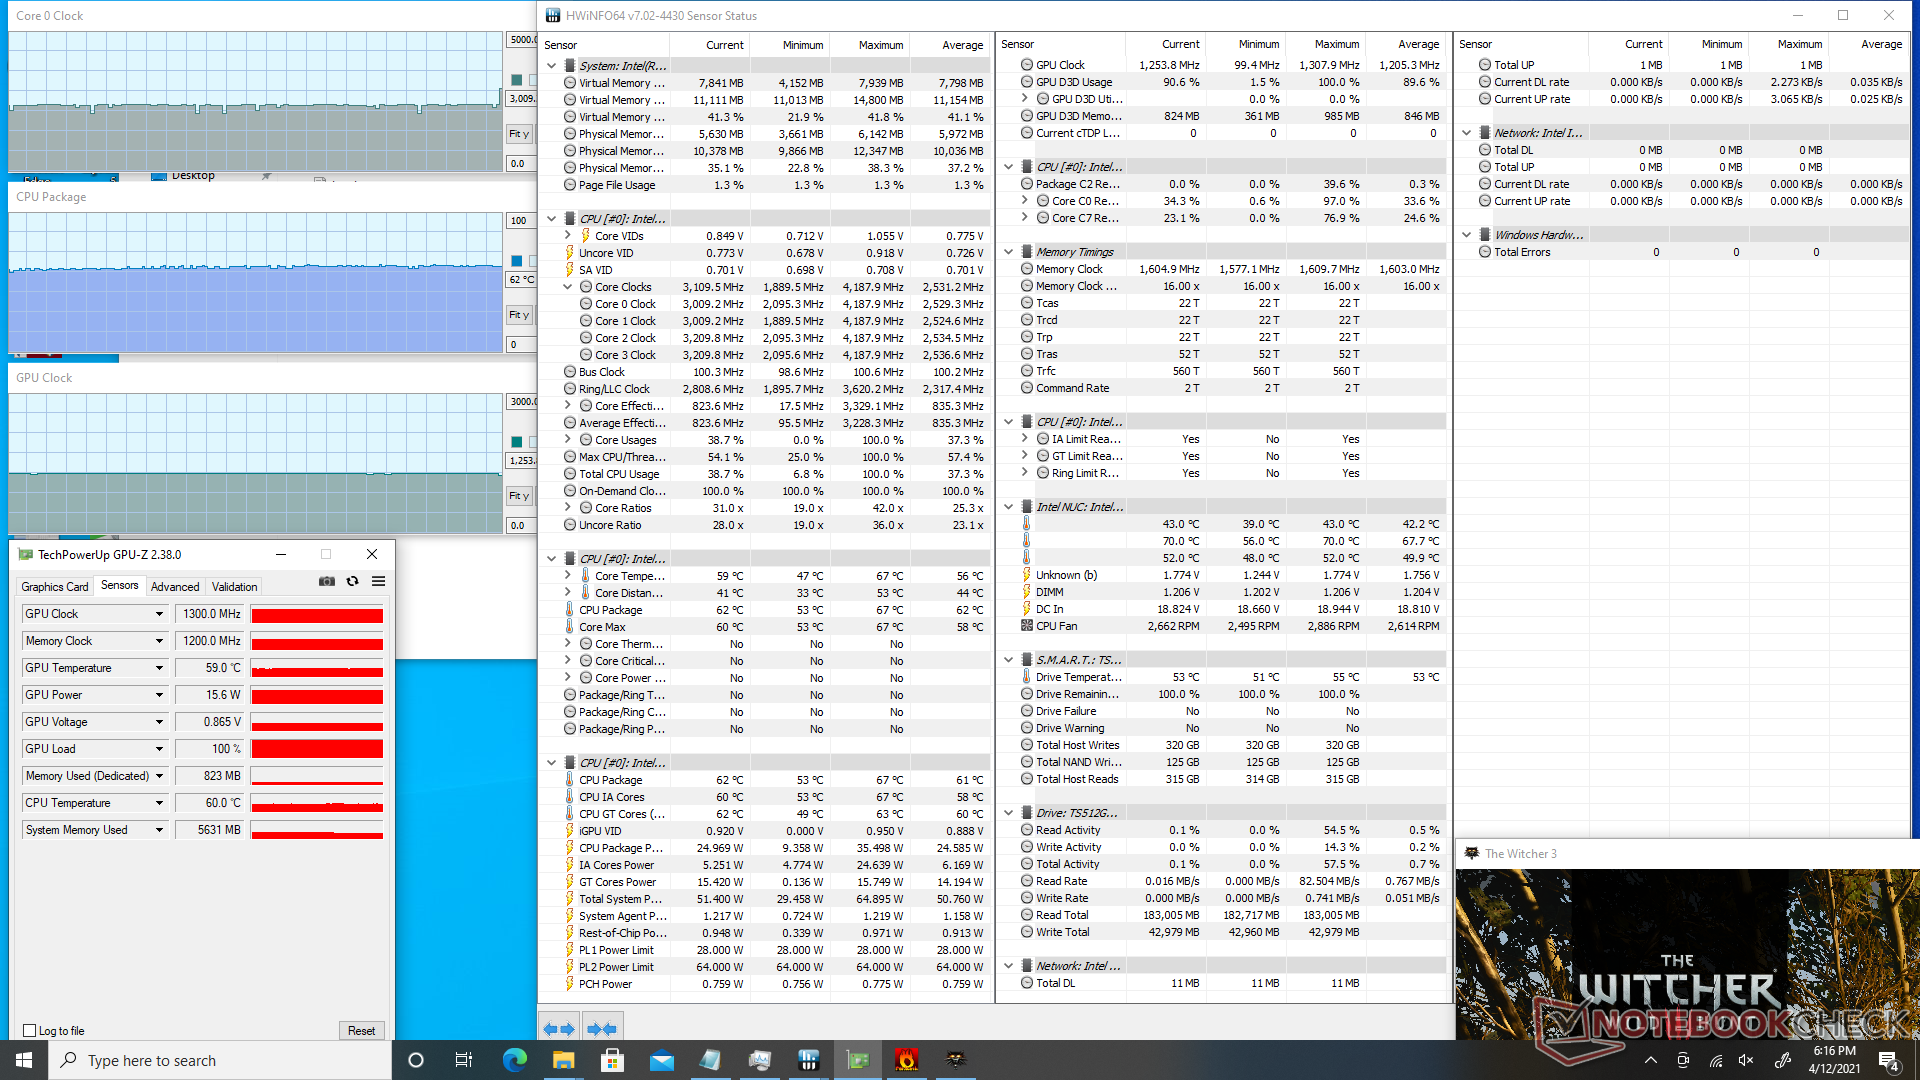
Stress Test
When running Prime95, the CPU would boost to 3.7 GHz for about 30 seconds until hitting a core temperature of 81 C. Thereafter, clock rates would steadily drop and stabilize in the 2.5 to 2.7 GHz range in order to maintain a cooler core temperature of 70 C. Maximum Turbo Boost sustainability is therefore not indefinite, but it is at least longer-lasting than many laptops with the same Core i5-1135G7 CPU. The Lenovo Yoga 7i 14, for example, would reach 3.8 GHz for just a few short seconds before plateauing when under the same Prime95 conditions.
Users can expect core temperatures to hover in the 60 C to 70 C range when running demanding loads.
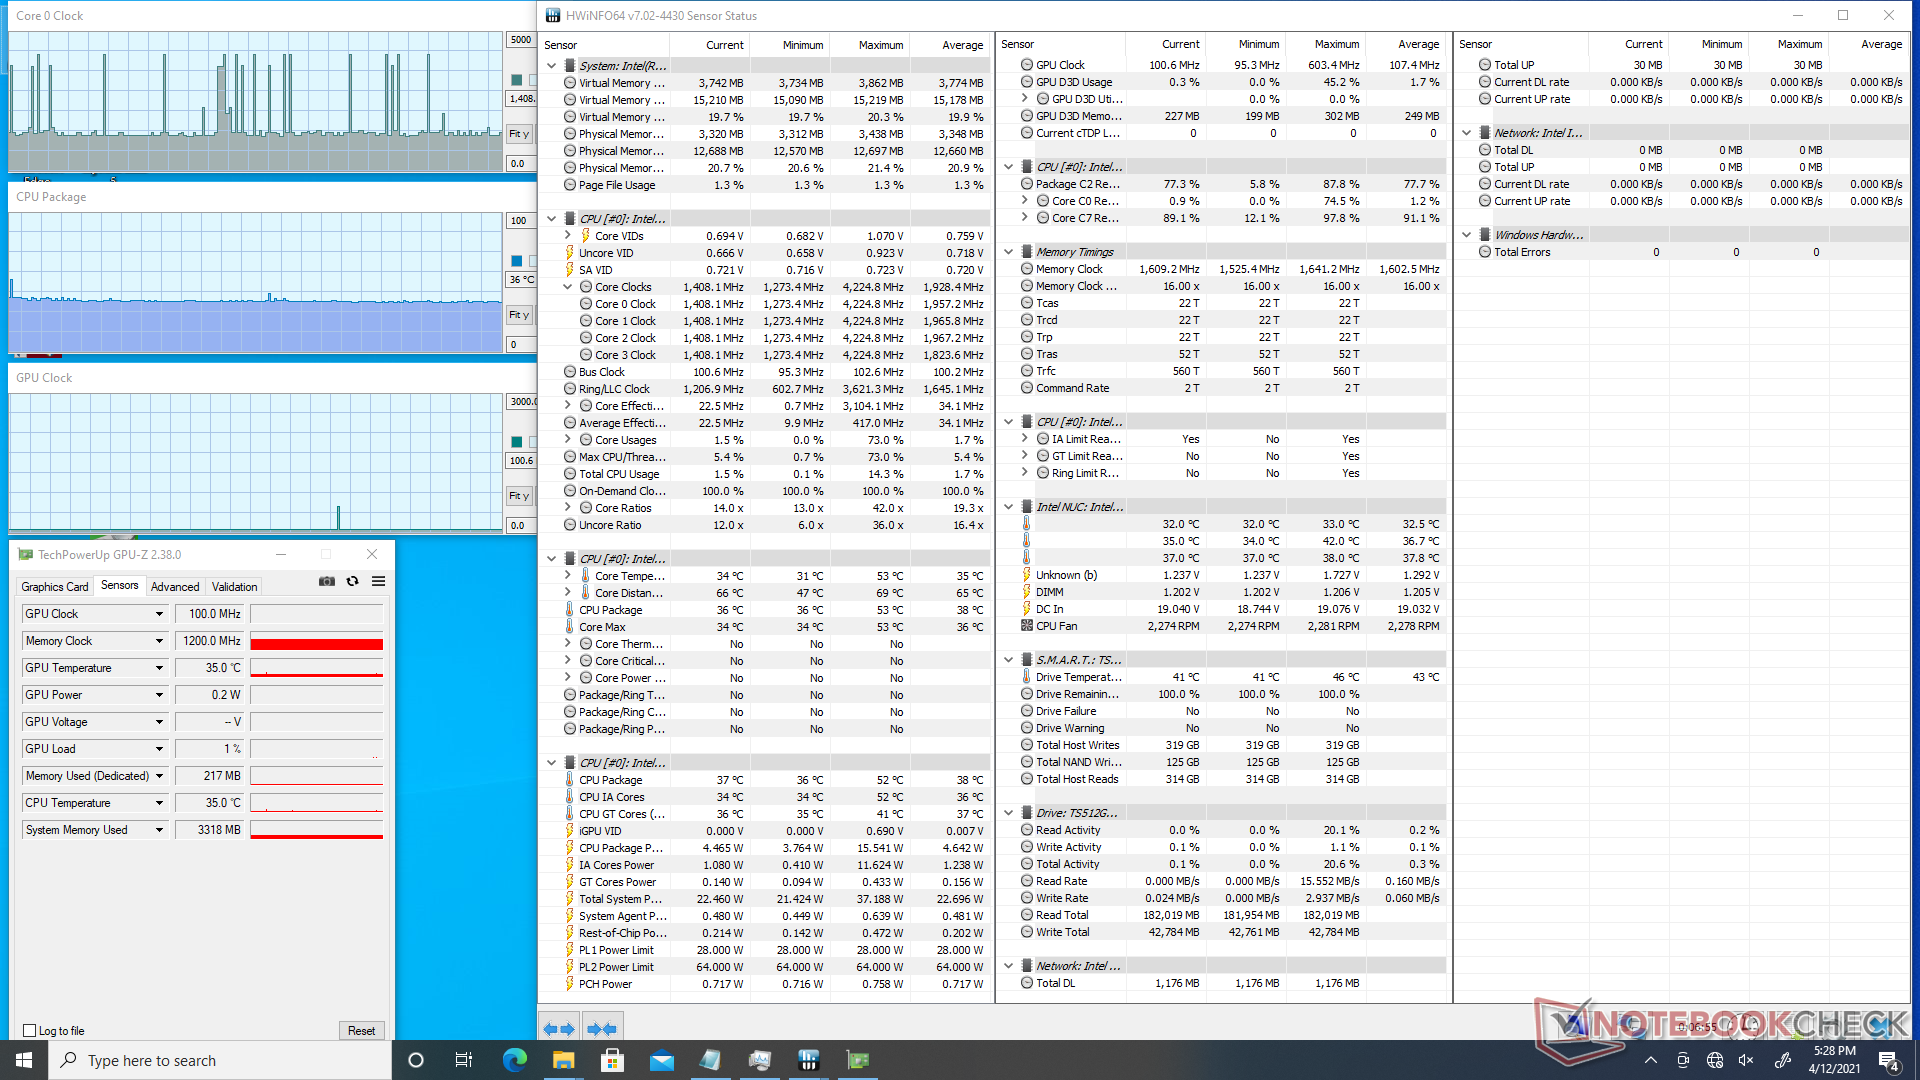
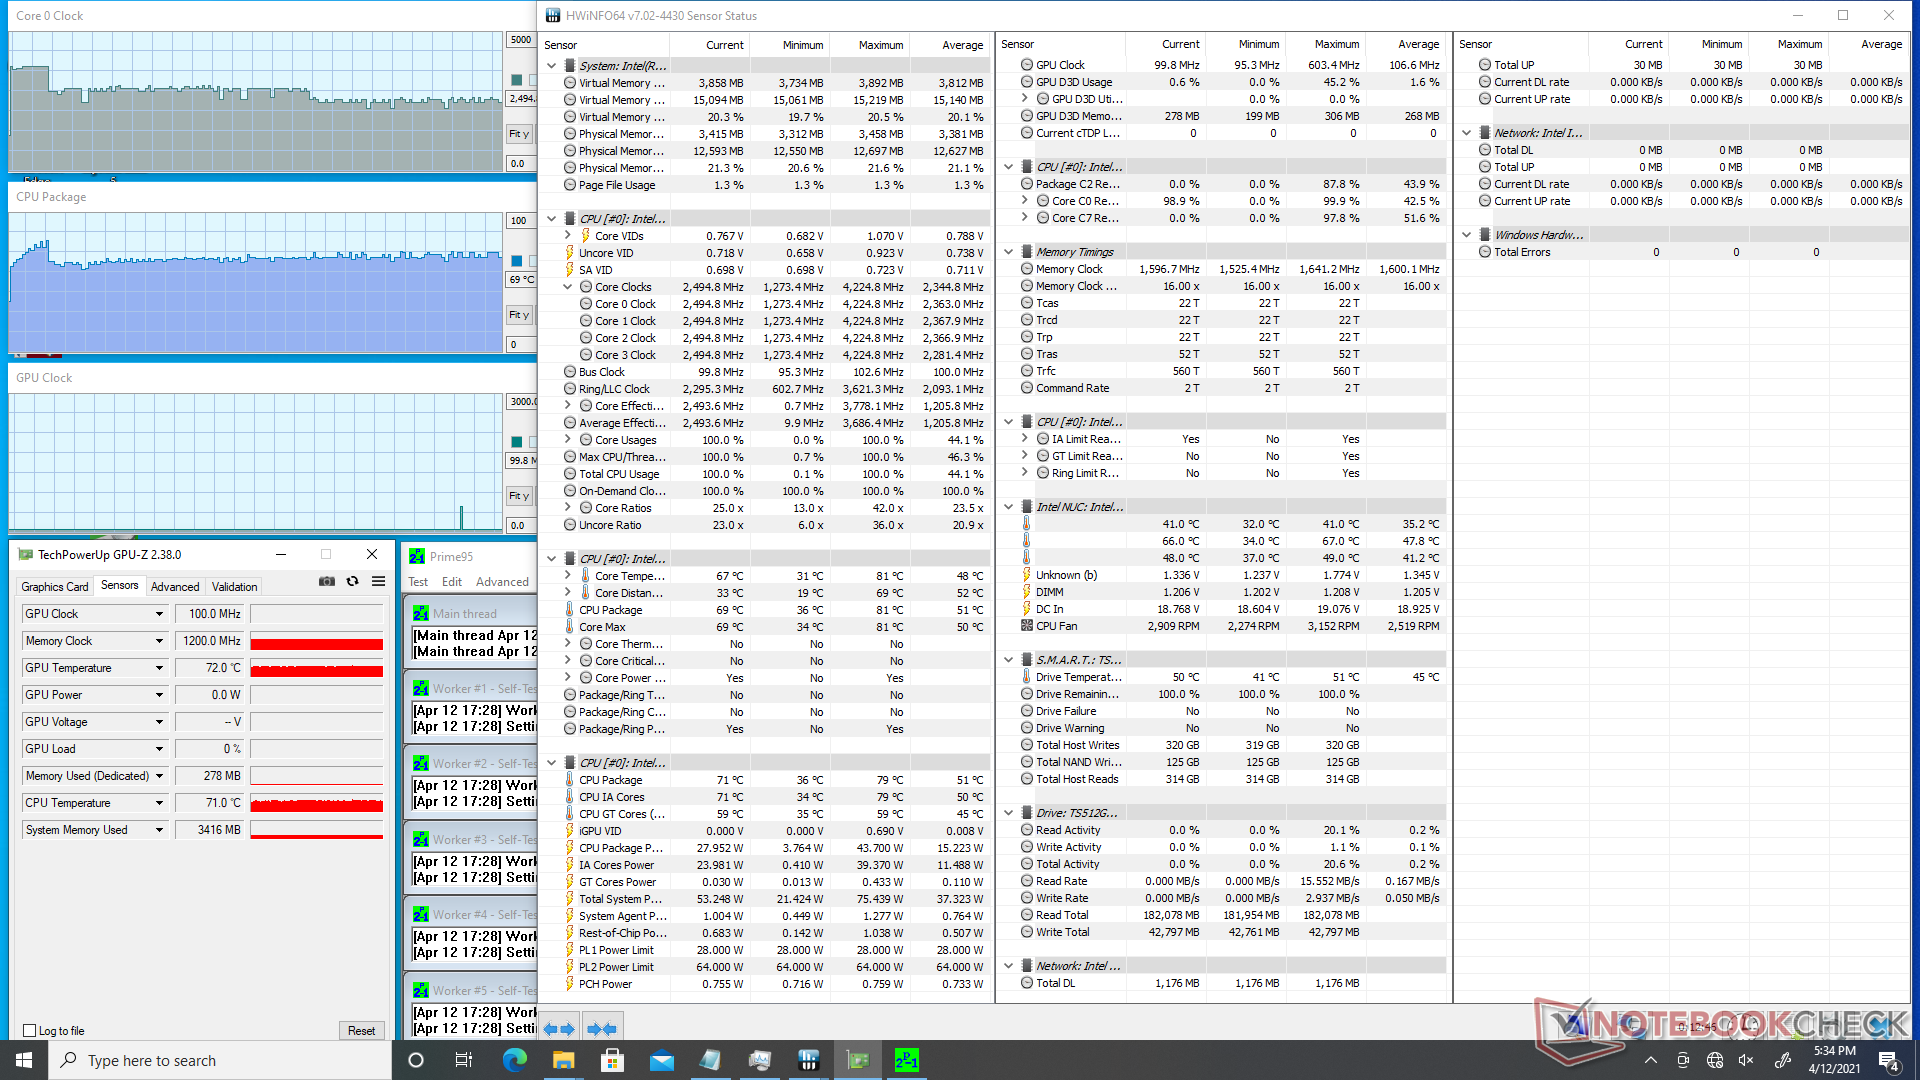
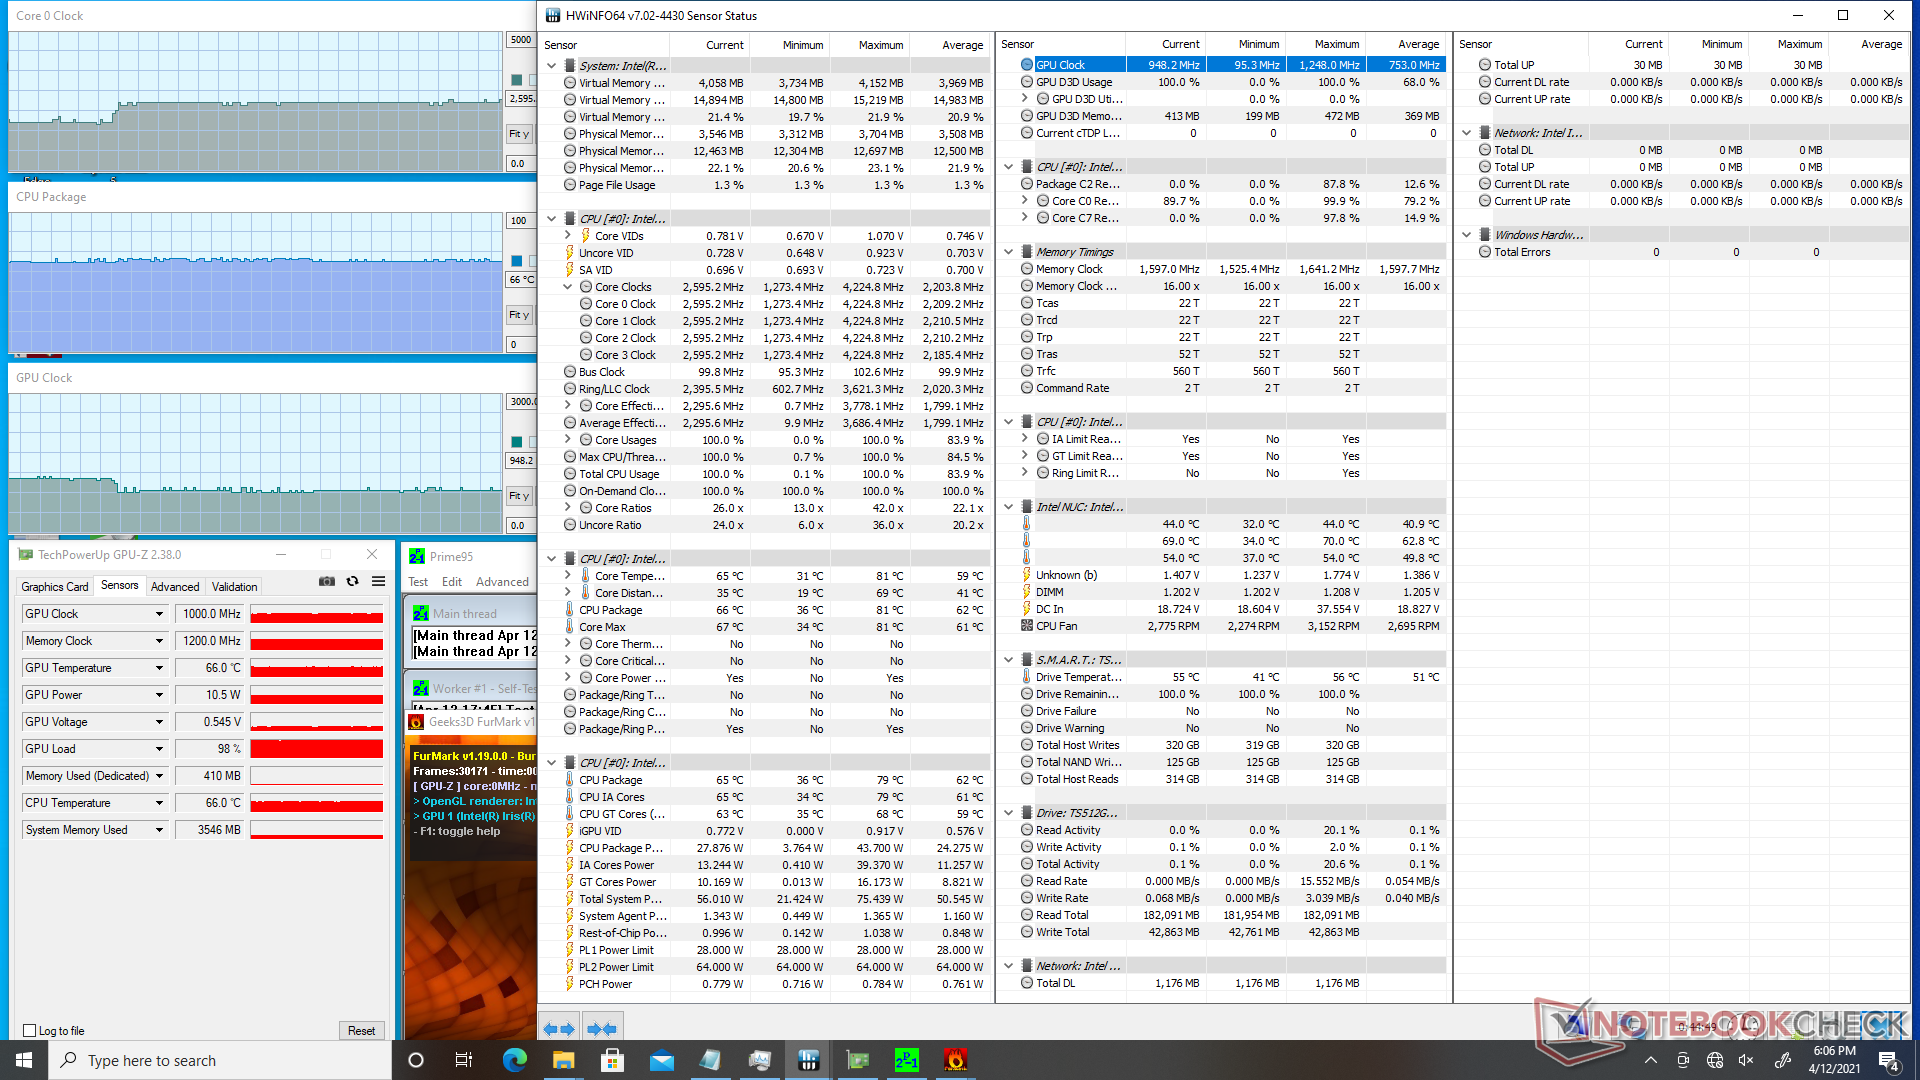
| CPU Clock (GHz) | GPU Clock (MHz) | Average CPU Temperature (°C) | |
| System Idle | -- | -- | 36 |
| Prime95 Stress | 2.4 - 2.7 | -- | 70 |
| Prime95 + FurMark Stress | 1.8 - 2.6 | 950 - 1200 | 66 |
| Witcher 3 Stress | 2.4 | 1300 | 62 |
Energy Management
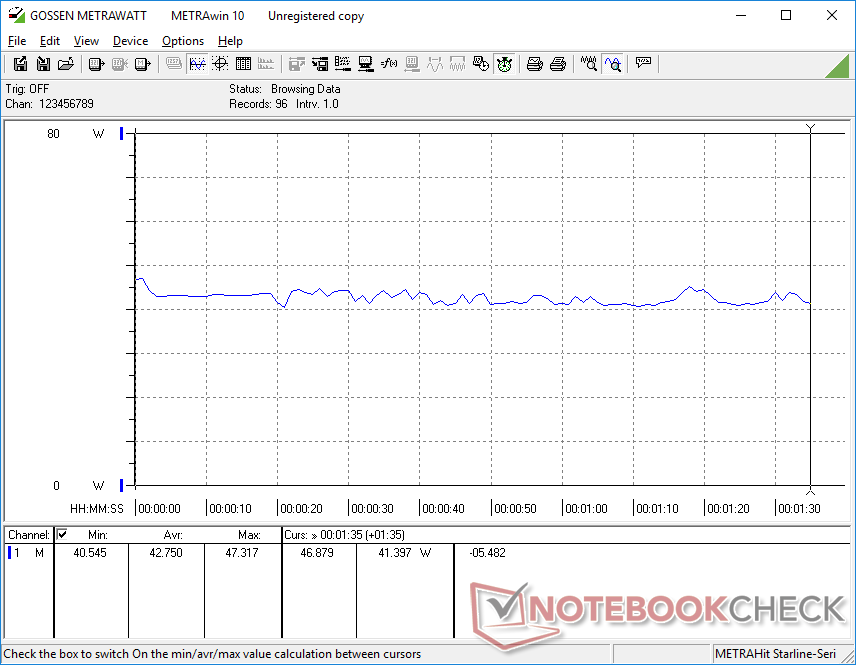
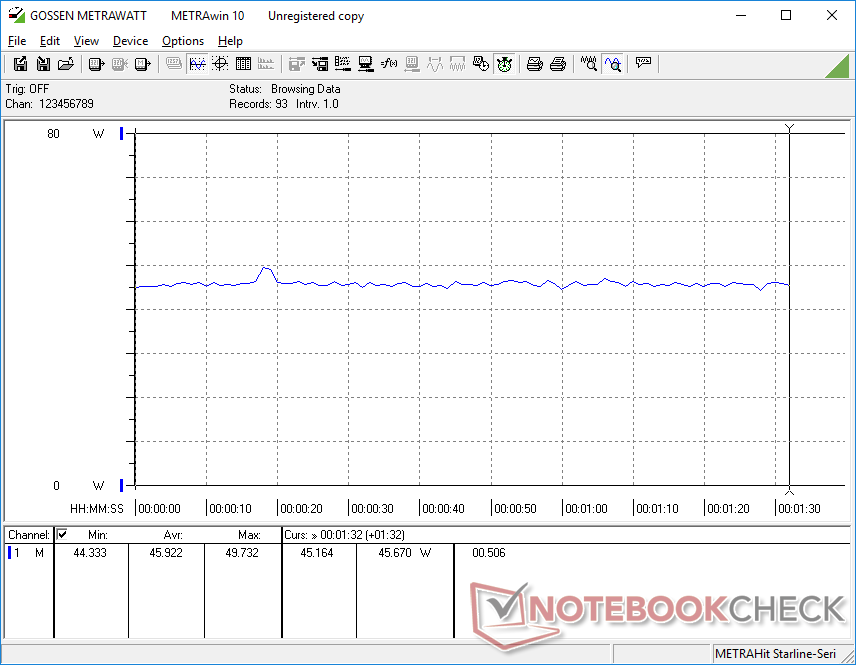
Power Consumption
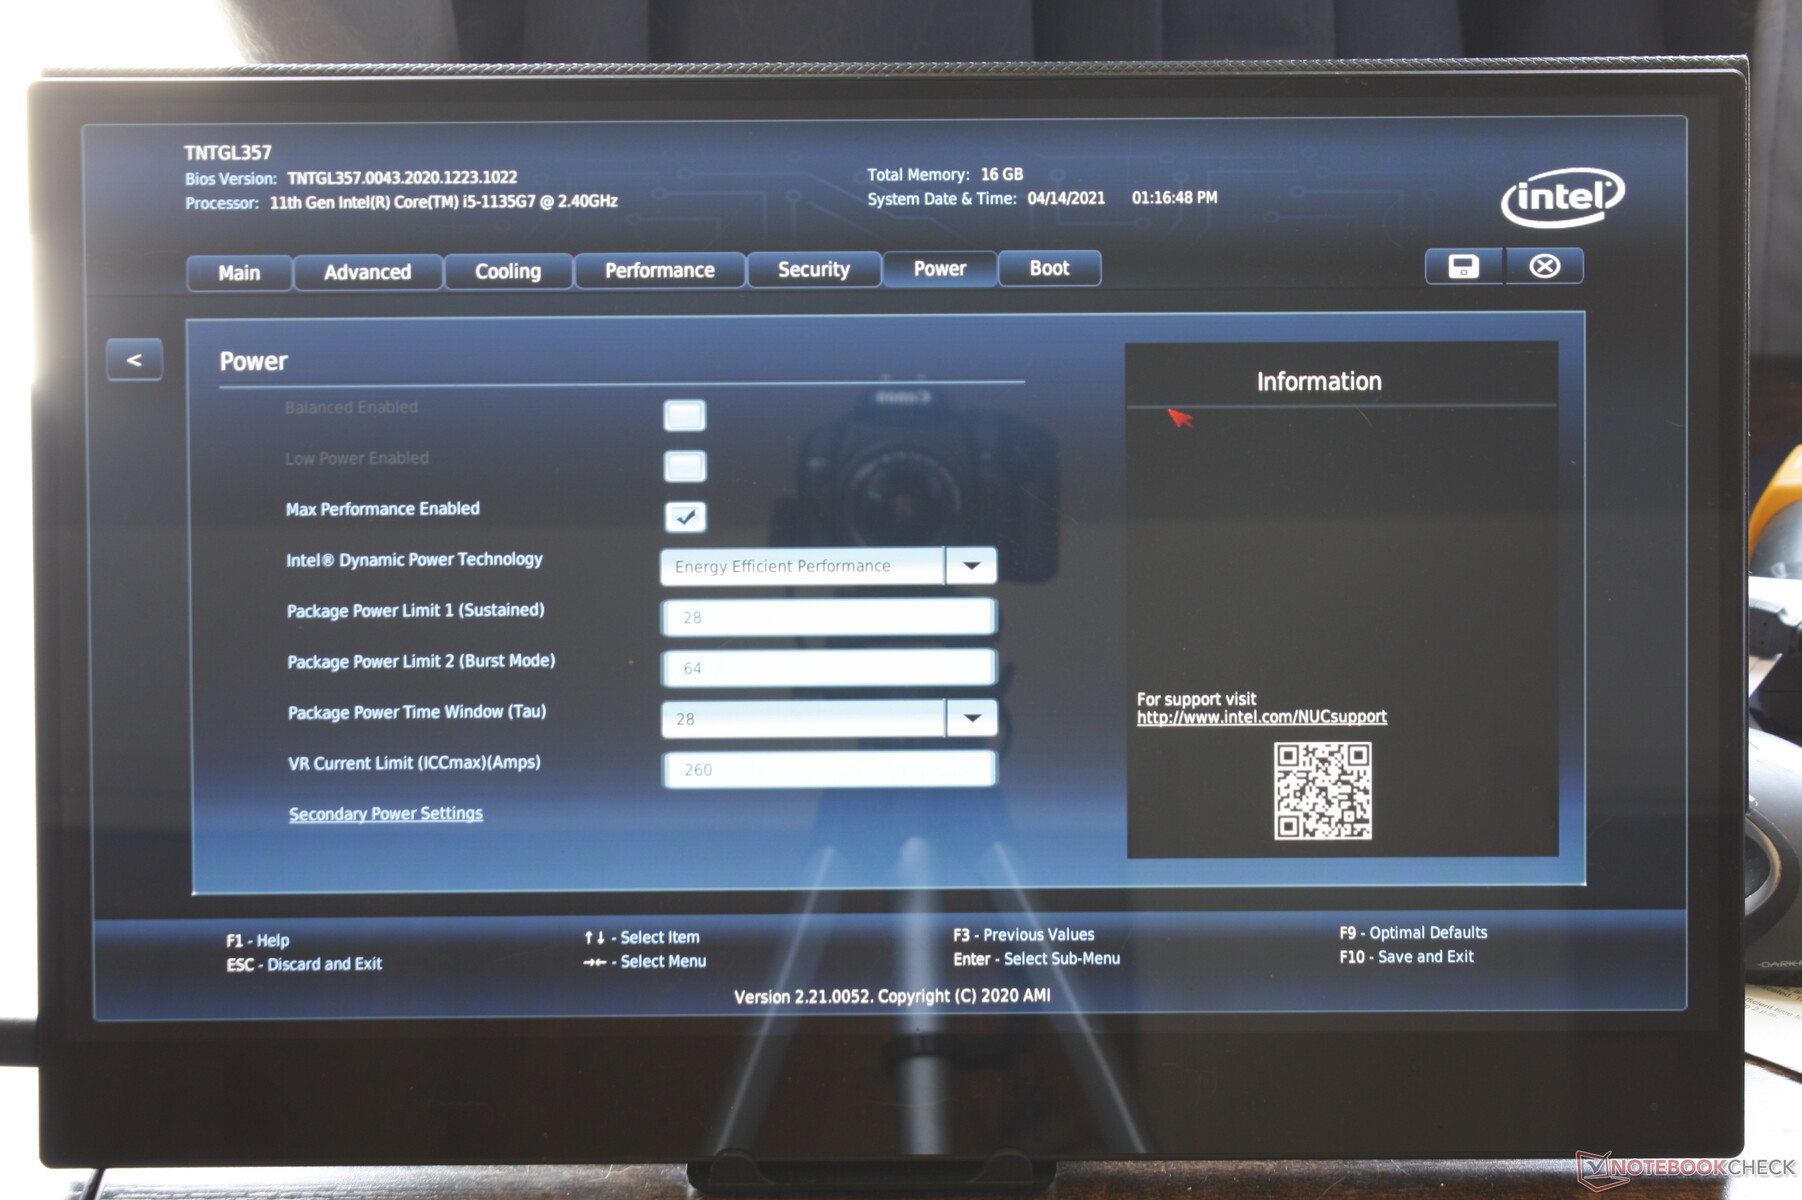
The NUC11TNKi5 is consistently more power-hungry than the NUC11PAQi7 even though the latter is the faster and larger NUC. Gaming loads would consume between 40 W and 44 W compared to 31 W to 39 W on the NUC11PAQi7. Consumption can be as high as 74 W when under extreme processing loads, but this draw is only temporary due to the limited Turbo Boost of the system.
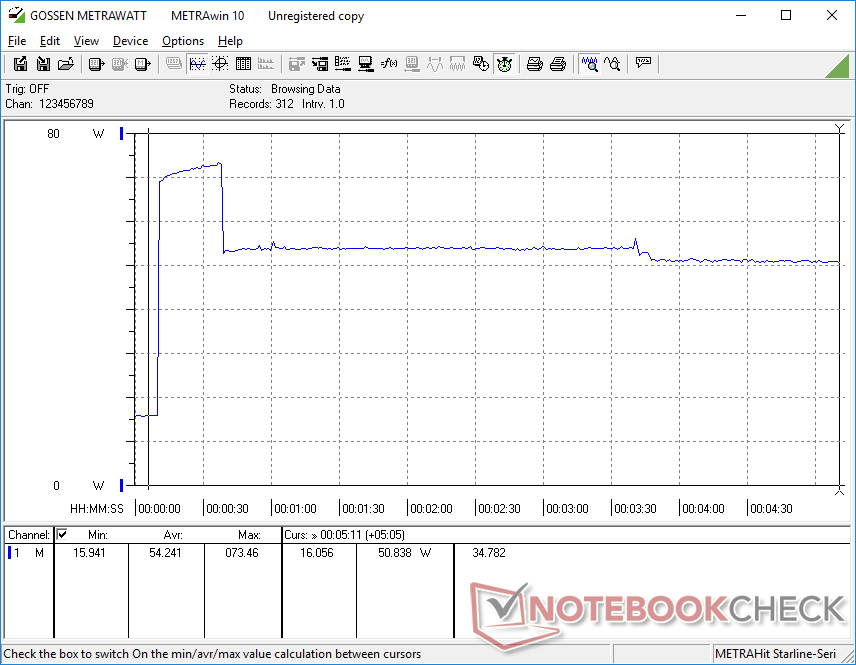
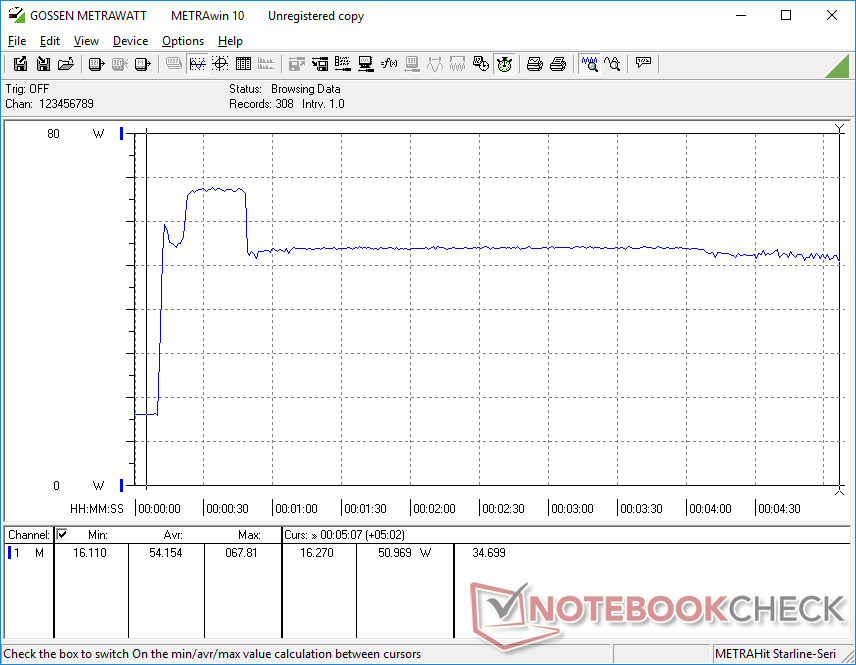
| Off / Standby | |
| Idle | |
| Load |
|
Key:
min: | |
| Intel NUC11TNKi5 | GMK NucBox 2 | Intel NUC11PAQi7 | Intel NUC10i5FNK | Beelink SEi10 | Zotac ZBOX MI642 Nano | |
|---|---|---|---|---|---|---|
| Power Consumption | 30% | 31% | -4% | 42% | 23% | |
| Idle Minimum * (Watt) | 11.5 | 6.1 47% | 5.6 51% | 6.3 45% | 8.9 23% | |
| Idle Average * (Watt) | 12.4 | 6.8 45% | 5.6 55% | 15.7 -27% | 6.6 47% | 9 27% |
| Idle Maximum * (Watt) | 12.9 | 7.3 43% | 6 53% | 6.7 48% | 9.9 23% | |
| Load Average * (Watt) | 40.7 | 46.3 -14% | 31.4 23% | 25.9 36% | 33 19% | |
| Witcher 3 ultra * (Watt) | 43.9 | 39 11% | ||||
| Load Maximum * (Watt) | 73.5 | 50.7 31% | 80.5 -10% | 58.6 20% | 46.7 36% | 58 21% |
* ... smaller is better
Pros
Cons
Verdict
Price has always been an uphill battle for the NUC series. The NUC11TNKi5 with 4 GB of RAM, no OS, and no storage retails for $670 USD compared to $500 USD for the GMK NucBox 2 with 8 GB RAM, Windows 10 OS, and a 256 GB NVMe SSD. The even cheaper Beelink SEi10 costs $400 with 8 GB RAM, 256 GB NVMe SSD, and even Thunderbolt 3 support. To really make the NUC 11 Pro worthwhile, users will have to exploit the relatively high performance of the processor and value both the three-year manufacturer warranty and solid build quality. Otherwise, the aforementioned GMK or Beelink will work just as well for low-power HTPC environments or 4K streaming.
It's not exactly cheap, but users are getting a slim first class mini PC with the latest 11th gen CPU and all its performance benefits.
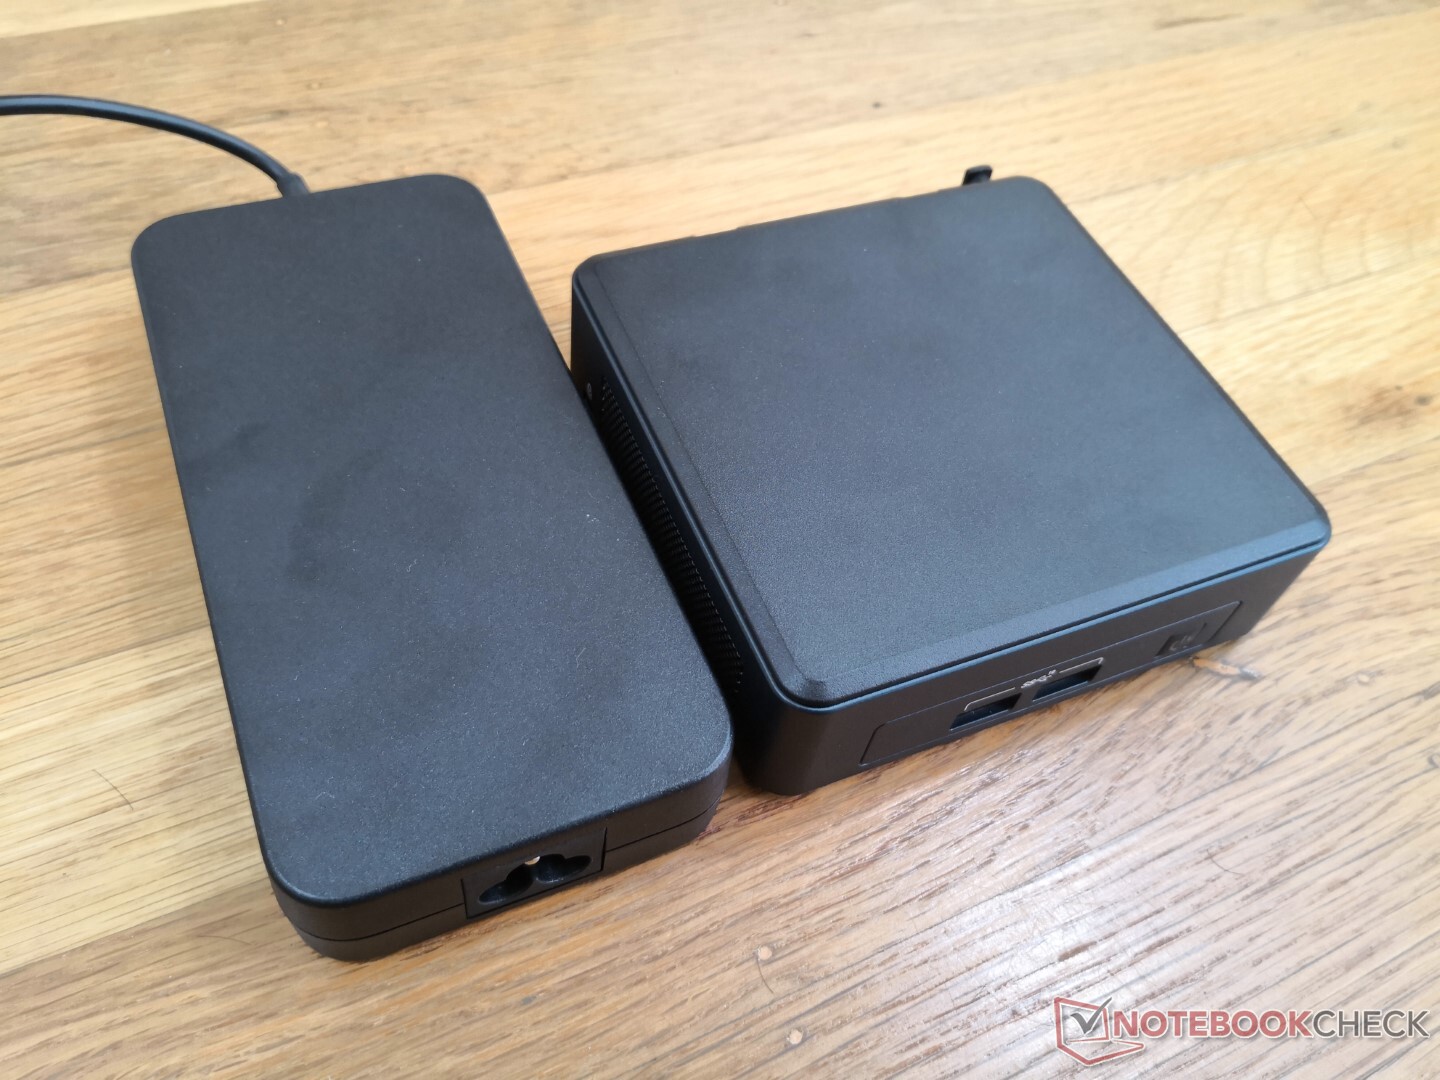
For the inevitable "NUC 12 Pro", we would love to see USB-C Power Delivery and a smaller AC adapter. USB-C PD would allow for third-party USB-C AC adapters to reduce reliance on Intel's proprietary barrel adapters. The oversized 120 W Intel adapter here is as large as the adapter for the MSI GP66 gaming laptop which is absurd for a Core U-powered mini PC.
Price and availability
The Intel NUC 11 Pro will be widely available in the weeks following this review. At least one online retailer is already shipping the Core i7 configuration of the model.
Price comparison
